ALASKA AIR GROUP, INC.
10-Ks and 10-Qs
|
|
|
|
|
|
|
|
|
|
|
|
|
|
|
|
|
|
|
|
|
|
|
|
|
|
|
|
|
|
|
|
|
|
|
|
|
|
|
|
|
|
|
|
|
|
|
|
|
|
|
|
|
UNITED STATES
SECURITIES AND EXCHANGE COMMISSION
WASHINGTON, DC 20549
FORM 10-K
|
x
|
ANNUAL REPORT PURSUANT TO SECTION 13 OR 15(d) OF THE SECURITIES EXCHANGE ACT OF 1934
|
For the fiscal year ended
December 31, 2017
OR
|
¨
|
TRANSITION REPORT PURSUANT TO SECTION 13 OR 15(d) OF THE SECURITIES EXCHANGE ACT OF 1934
|
For the transition period from to
Commission File Number 1-8957
ALASKA AIR GROUP, INC.
|
Delaware
|
91-1292054
|
|
|
(State of Incorporation)
|
(I.R.S. Employer Identification No.)
|
|
|
19300 International Boulevard, Seattle, Washington 98188
|
|
Telephone: (206) 392-5040
|
Securities registered pursuant to Section 12(b) of the Act:
|
Common Stock, $0.01 Par Value
|
New York Stock Exchange
|
Securities registered pursuant to Section 12(g) of the Act:
None
Indicate by check mark if the registrant is a well-known seasoned issuer, as defined in Rule 405 of the Securities Act. Yes
x
No
¨
Indicate by check mark if the registrant is not required to file reports pursuant to Section 13 or Section 15(d) of the Act. Yes
¨
No
x
Indicate by check mark whether the registrant (1) has filed all reports required to be filed by Section 13 or 15(d) of the Securities Exchange Act of 1934 during the preceding 12 months (or for such shorter period that the registrant was required to file such reports), and (2) has been subject to such filing requirements for the past 90 days. Yes
x
No
¨
Indicate by check mark whether the registrant has submitted electronically and posted on its corporate Web site, if any, every Interactive Data File required to be submitted and posted pursuant to Rule 405 of Regulation S-T during the preceding 12 months (or for such shorter period that the registrant was required to submit and post such files). Yes
x
No
¨
Indicate by check mark if disclosure of delinquent filers pursuant to Item 405 of Regulation S-K is not contained herein, and will not be contained, to the best of registrant’s knowledge, in definitive proxy or information statements incorporated by reference in Part III of this Form 10-K or any amendment to this Form 10-K.
x
Indicate by check mark whether the registrant is a large accelerated filer, an accelerated filer, a non-accelerated filer or a smaller reporting company. See definitions of “large accelerated filer”, "accelerated filer" and "smaller reporting company" in Rule 12b-2 of the Exchange Act:
Large accelerated filer
x
Accelerated filer
¨
Non-accelerated filer
¨
Smaller reporting company
¨
Indicate by check mark whether the registrant is a shell company (as defined in Rule 12b-2 of the Exchange Act.): Yes
¨
No
x
As of
January 31, 2018
, shares of common stock outstanding totaled
122,996,587
. The aggregate market value of the shares of common stock of Alaska Air Group, Inc. held by nonaffiliates on
June 30, 2017
, was approximately
$11.1 billion
(based on the closing price of
$89.76
per share on the New York Stock Exchange on that date).
DOCUMENTS INCORPORATED BY REFERENCE
Portions of Definitive Proxy Statement relating to
2018
Annual Meeting of Shareholders are incorporated by reference in Part III.
ALASKA AIR GROUP, INC.
ANNUAL REPORT ON FORM 10-K FOR THE YEAR ENDED
DECEMBER 31, 2017
TABLE OF CONTENTS
As used in this Form 10-K, the terms “Air Group,” the "Company," “our,” “we” and "us," refer to Alaska Air Group, Inc. and its subsidiaries, unless the context indicates otherwise. Alaska Airlines, Inc., Virgin America Inc. and Horizon Air Industries, Inc. are referred to as “Alaska,” "Virgin America" and “Horizon,” respectively, and together as our “airlines.”
CAUTIONARY NOTE REGARDING FORWARD-LOOKING STATEMENTS
In addition to historical information, this Form 10-K contains forward-looking statements within the meaning of Section 27A of the Securities Act of 1933, as amended, Section 21E of the Securities Exchange Act of 1934, as amended, and the Private Securities Litigation Reform Act of 1995. Forward-looking statements are those that predict or describe future events or trends and that do not relate solely to historical matters. You can generally identify forward-looking statements as statements containing the words “believe,” “expect,” “will,” “anticipate,” “intend,” “estimate,” “project,” “assume” or other similar expressions, although not all forward-looking statements contain these identifying words. Forward-looking statements involve risks and uncertainties that could cause actual results to differ materially from historical experience or the Company’s present expectations.
2
You should not place undue reliance on our forward-looking statements because the matters they describe are subject to known and unknown risks, uncertainties and other unpredictable factors, many of which are beyond our control.
Our forward-looking statements are based on the information currently available to us and speak only as of the date on which this report was filed with the SEC. We expressly disclaim any obligation to issue any updates or revisions to our forward-looking statements, even if subsequent events cause our expectations to change regarding the matters discussed in those statements. Over time, our actual results, performance or achievements will likely differ from the anticipated results, performance or achievements that are expressed or implied by our forward-looking statements, and such differences might be significant and materially adverse to our shareholders. For a discussion of these and other risk factors in this Form 10-K, see “Item 1A: Risk Factors.” Please consider our forward-looking statements in light of those risks as you read this report.
3
|
|
Air Group operates three airlines, Alaska, Virgin America and Horizon. McGee Air Services, an aviation services provider, is a wholly-owned subsidiary of Alaska. Together with regional partner airlines, we fly to
118
destinations with 1,200 daily departures through an expansive network across the United States, Mexico, Canada, and Costa Rica. With global airline partners, we provide our guests with a network of more than
900
destinations worldwide. During
2017
, we carried an all-time high
44 million
guests and earned consolidated net income of
$1.0 billion
, which represents a
27%
increase over net income of
$814 million
in
2016
. Our adjusted net income was
$823 million
, which excludes special items and merger-related costs of $
118 million
, and a
$280 million
benefit from new tax laws enacted in 2017.
Our mission is "creating an airline people love." The "ing" is to recognize that we are never done; we are continually working to improve. We believe our success depends on our ability to provide safe air transportation, develop relationships with guests by providing exceptional customer service and low fares, and maintain a low cost structure to compete effectively. It is important to us that we achieve our objective as a socially responsible company that values not just performance, but people, the communities we serve, and environment.
In 2017 we focused much of our energy on integrating Virgin America. We achieved several milestones, including merging most back office functions, kicking off station co-locations and launching technology that enables our front-line employees to be agile between Alaska and Virgin America applications. In January 2018, Alaska and Virgin America obtained a single operating certificate from the Federal Aviation Administration (FAA), our most significant integration milestone to date. These accomplishments will ease our transition to a single Passenger Service System (PSS) in the Spring of 2018, which will help us unlock many of the revenue synergies expected from the acquisition. We remain on track to complete all of our integration milestones on schedule, and continue to be optimistic about the value of our combined company.
With the integration well underway, we remain committed to our strategic focus to become the go-to airline for people on the West Coast. The acquisition of Virgin America positioned us as the fifth largest airline in the U.S., with an unparalleled ability to serve West Coast travelers. To do so, we believe we need to meet our guest's evolving needs through innovation in our onboard offerings and provide unique destinations with better schedules, while retaining the best of both the Alaska and Virgin America brand experiences. We have begun to implement this strategy in a number of ways, including merging our loyalty programs, allowing us to bring the award winning benefits of our Mileage Plan™ program to Virgin America's loyal customer base; rolling out Free Movies and Free Chat to Virgin America's entire fleet; and kicking off the first of several cabin enhancements of Alaska's Boeing aircraft with expressive mood lighting.
While aircraft and technology enable us to provide air transportation, we recognize this is fundamentally a people business. Our employees maintain and strengthen our relationships with guests, and our success depends on our employees working together to successfully execute our strategy. In
2017
, Alaska was once again named one of America's Best Employers by Forbes Magazine for the third year in a row. We know that engaged employees provide excellent service. In that vein, in
2017
, Alaska ranked highest in J.D. Power and Associates annual survey of customer satisfaction among traditional network carriers for the
tenth
year in a row. Virgin America was also recognized for excellent service by Conde Nast Traveler and Travel + Leisure magazine also for the tenth year in a row. Customer service matters, and we believe the combination of Alaska and Virgin America will only enhance the experience for our guests.
Operationally, Alaska held the No. 1 spot in the Wall Street Journal's "Middle Seat" scorecard for U.S. airlines for four consecutive years and the No. 2 spot for 2017. Although we were not the leader in on-time performance in 2017, we led the industry for on-time performance among major airlines for the previous seven years. We are focused on becoming the industry leader in operational performance once again as we fully integrate Alaska and Virgin America operations and we are off to a great start in 2018. For achieving safety, customer service, operational and financial goals, we rewarded our employees with
$135 million
for their service in
2017
.
In support of the communities that we serve, we strive to be an industry leader in environmental and community stewardship. Our combined fleet is one of the youngest, most fuel-efficient fleets in North America and we look forward to further enhancements in this area. As a result of our environmental and corporate sustainability leadership, we ranked higher than any other North American airline in this year's Dow Jones Sustainability Index. We are also proud of our community stewardship - Air Group donated
$14 million
to over 1,300 charitable organizations, and our employees volunteered more than
32,000
hours of community service, focused on youth and education, medical research, and transportation and community outreach in
2017
.
4
One of our leadership principles is to "give back" and we are proud of the efforts and voluntarism of our employees across the system.
We continued to generate strong profits in
2017
, marking our
14th
consecutive annual profit on an adjusted basis. Our liquidity and capital position remain strong, positioning us among those of high-quality industrial companies. Due to our strong financial health and outlook, we are one of only three U.S. airlines with investment grade credit ratings. With the cash generated by our continued success, we have been able to invest in our business to achieve profitable growth and to enhance the guest experience.
As we look to the future, we will build on our success by executing our strategic plan in the following areas:
Be Safe and On time
We have an unwavering commitment to run a safe operation, and we will not compromise this commitment in the pursuit of other initiatives. Alaska and Horizon were the first U.S. major airlines to receive FAA validation and acceptance of our Safety Management System (SMS) in 2016. In 2017, Virgin America adopted SMS, ensuring a consistent safety process across our carriers. Additionally, all Virgin America employees received training for the Alaska Air Group SMS, our "Ready, Safe, Go" principles, and our mobile safety reporting system. Once again, in 2017, 100% of our Alaska and Horizon aircraft technicians completed the requirements for the FAA's "Diamond Certificate of Excellence" award. This is the 16th consecutive year Alaska Airlines has received the award and the 16th time in the last 18 years Horizon has received this award. We also believe that maintaining safe operations, through adherence to well-defined processes, and ensuring every Air Group employee is aware of their individual contribution to our operation, is critical to ensuring on-time performance. The rigor we apply to running a safe operation has resulted in Alaska consistently being one of the top airlines in North America for on-time performance.
Focus on People
Our business is fundamentally a people business, and our success depends on our nearly
23,000
employees. Engaged employees deliver higher productivity, superior execution and better customer service. In merging Alaska Airlines and Virgin America employees and labor groups, we kept a vigilant focus on creating an unbeatable culture. In January 2017, we rolled out "Momentum" training for all Virgin America employees to help bridge the two airlines and blend our cultures. We implemented Culture Champion initiatives to help employees build relationships across airlines, allowing them to share concerns and feedback directly with executive leadership. Similarly, our "QX Factor" program brought new energy to the Horizon employee experience. Our people programs and integration plan are focused on ensuring employees feel valued, informed and engaged in meaningful ways as we build our future.
Aligning our employees' goals with Air Group's goals is important in achieving success. All permanent employees of our airlines participate in our Performance-Based Pay (PBP) and Operational Performance Rewards (OPR) programs, which encourage employees to work together to achieve metrics related to safety, profitability, on-time performance, low costs, customer loyalty, and customer satisfaction. Over the last five years, our incentive programs have paid out on average more than one month's pay, for most employees.
Build a deep emotional connection for our brand
To be the go-to airline for people on the West Coast, we must be recognized for creating an airline that people love. In 2017, we built upon the strong brand connection we have with our guests in our Pacific Northwest markets and the state of Alaska by broadening our focus to include California. We rolled out fresh, modern marketing campaigns showcasing benefits such as our network growth, low fares, our Buy One Get One companion fare credit card promotional offer, and unique onboard experience elements. We are enthusiastic about our plans for continued investment in key products that will provide meaningful improvements to our guests, such as Gogo satellite internet which we will begin installing in early 2018. Additionally, we partnered with key sponsors in the Bay Area, including sports franchises such as the San Francisco Giants and the San Jose Sharks, as well as noted professional athletes including Kevin Durant of the Golden State Warriors.
We continue to invest in key products that will provide meaningful improvements to our guests and further drive an emotional connection to our brand. This includes Free Chat and Free Movies and the launch of Gogo satellite service, already mentioned above. We’ve rolled out new digital products to improve the guest experience, including a new inflight entertainment portal and the beta launch of First Class meal pre-select. We’ve nearly completed retrofits of our Boeing fleet to include Premium Class, while adding larger overhead bins to many of our aircraft. Expanding our airport lounge portfolio, we’ve opened a third lounge at Sea-Tac airport and plan to open a lounge at JFK in 2018. Finally, guests can also look forward to an integrated onboard food and beverage program in 2018, which will emphasize fresh and local West Coast products on our aircraft.
5
Defend and grow our customer base
Competition in our markets is fierce and we know we must defend our customer base as we grow our network presence, by providing our guests with an increased choice of schedule times and fares, and allowing us to effectively compete for new guests. We will continue to introduce guests to our award-winning service, Mileage Plan™ program, and Visa signature credit card as we grow our network. We work hard to ensure our guests have a great experience on our airlines and provide an exceptional product at a low fare.
Win with low costs and low fares
We believe that our low-fare model gives us a competitive advantage by providing value to, and building trust with our guests. We also know that, in order to provide low fares in our growing network, while returning value to our shareholders, it is imperative for us to maintain a competitive cost structure. In
2017
, our unit costs, excluding fuel and special items, remained flat year over year on a consolidated basis. We understand the importance of low costs to the business model and the success of the company and we have a long track record of reducing unit costs. Although our unit costs are expected to rise in 2018 primarily due to pilot wages and maintenance costs, we continue to focus on productivity, cost management, low overhead and leveraging capacity growth. We also manage increasing fuel costs by flying larger, more fuel-efficient aircraft, which have increased our fuel efficiency as measured by available seat miles flown per gallon by
3.5%
over the last five years. As we continue to integrate Virgin America into our operations, we are committed to achieving our stated cost and revenue synergy goals. It is critical that we achieve these goals in order to continue our cost reduction efforts.
During fiscal
2017
, we added
44
new markets to the combined network. For
2018
, we plan to grow our system-wide capacity approximately
7.5%
as compared to
2017
. Approximately 70% of growth in 2018 is attributable to existing routes and locations, with the rest attributable to our plans to fly
13
daily departures from Paine Field-Snohomish County Airport in Everett, Washington to
eight
West Coast markets starting in fall 2018.
AIR GROUP
Alaska Air Group is a Delaware corporation incorporated in 1985 and the holding company of Alaska, Virgin America, Horizon, McGee Air Services, a wholly-owned subsidiary of Alaska, and other business units. Alaska, Virgin America and Horizon operate as airlines however, the business plans, competition and economic risks differ substantially for Horizon in comparison to Alaska and Virgin America. McGee Air Services operates as an aviation services provider, focused on providing ground and ramp handling services to airlines. Alaska Airlines is an Alaska corporation that was organized in 1932 and incorporated in 1937. Virgin America is a Delaware corporation that was incorporated in 2004 and acquired by Air Group on
December 14, 2016
. Horizon is a Washington corporation that began service and was incorporated in 1981. It was acquired by Air Group in 1986. McGee Air Services is a Delaware corporation that was incorporated in 2016. Alaska and Virgin America operate fleets of narrowbody passenger jets. Together, the operations of Alaska and Virgin America are referred to as "mainline" operations. Alaska also contracts with Horizon, SkyWest Airlines, Inc. (SkyWest) and Peninsula Airways, Inc. (PenAir) for regional capacity such that Alaska receives all passenger revenue from those flights. Horizon began operating E175 regional jet aircraft in 2017 in addition to its fleet of turboprop aircraft and sells all of its capacity to Alaska pursuant to a capacity purchase agreement (CPA). The majority of our revenues are generated by transporting passengers. The percentage of revenues by category is as follows:
|
|
2017
|
2016
(a)
|
2015
|
2014
|
2013
|
|||||||||
|
Mainline passenger revenue
|
74
|
%
|
69
|
%
|
70
|
%
|
70
|
%
|
70
|
%
|
||||
|
Regional passenger revenue
|
12
|
%
|
15
|
%
|
15
|
%
|
15
|
%
|
16
|
%
|
||||
|
Other revenue
|
13
|
%
|
14
|
%
|
13
|
%
|
13
|
%
|
12
|
%
|
||||
|
Freight and Mail revenue
|
1
|
%
|
2
|
%
|
2
|
%
|
2
|
%
|
2
|
%
|
||||
|
Total
|
100
|
%
|
100
|
%
|
100
|
%
|
100
|
%
|
|
100
|
%
|
|||
|
(a)
|
Includes information for Virgin America for the period December 14, 2016 through December 31, 2016.
|
We attempt to deploy aircraft into the network in ways that best optimize our revenues and profitability and reduce our seasonality.
6
The percentage of our capacity by region is as follows:
|
|
2017
|
2016
(a)
|
2015
|
2014
|
2013
|
|||||||||
|
West Coast
|
28
|
%
|
34
|
%
|
36
|
%
|
36
|
%
|
34
|
%
|
||||
|
Transcon/midcon
|
43
|
%
|
29
|
%
|
24
|
%
|
22
|
%
|
22
|
%
|
||||
|
Hawaii and Costa Rica
|
13
|
%
|
17
|
%
|
18
|
%
|
18
|
%
|
19
|
%
|
||||
|
Alaska
|
10
|
%
|
14
|
%
|
15
|
%
|
15
|
%
|
16
|
%
|
||||
|
Mexico
|
5
|
%
|
5
|
%
|
6
|
%
|
6
|
%
|
7
|
%
|
||||
|
Canada
|
1
|
%
|
1
|
%
|
1
|
%
|
3
|
%
|
2
|
%
|
||||
|
Total
|
100
|
%
|
100
|
%
|
100
|
%
|
100
|
%
|
100
|
%
|
||||
|
(a)
|
Includes information for Virgin America for the period December 14, 2016 through December 31, 2016.
|
MAINLINE
Our mainline operations include Boeing 737 (B737) and Airbus family (A319, A320, and A321neo) jet service offered by Alaska and Virgin America. We offer extensive passenger service from the western U.S. throughout the contiguous United States, Alaska, Hawaii, Canada, Mexico, and Costa Rica. Our largest concentration of departures are in Seattle, Portland, and the Bay Area. We also offer cargo service throughout our network and have dedicated cargo aircraft that operate primarily to and within the state of Alaska.
In
2017
, we carried
35 million
revenue passengers in our mainline operations. At
December 31, 2017
, our mainline operating fleet consisted of
154
B737 jet aircraft and
67
Airbus A320 family jet aircraft compared to
155
B737 aircraft and
63
Airbus aircraft as of
December 31, 2016
.
The percentage of mainline passenger capacity by region and average stage length is presented below:
|
|
2017
|
2016
(a)
|
2015
|
2014
|
2013
|
|||||||||
|
West Coast
|
24
|
%
|
30
|
%
|
31
|
%
|
31
|
%
|
28
|
%
|
||||
|
Transcon/midcon
|
45
|
%
|
30
|
%
|
27
|
%
|
25
|
%
|
25
|
%
|
||||
|
Hawaii
|
15
|
%
|
19
|
%
|
20
|
%
|
20
|
%
|
21
|
%
|
||||
|
Alaska
|
11
|
%
|
15
|
%
|
16
|
%
|
16
|
%
|
18
|
%
|
||||
|
Mexico
|
5
|
%
|
6
|
%
|
6
|
%
|
7
|
%
|
7
|
%
|
||||
|
Canada
|
—
|
%
|
—
|
%
|
—
|
%
|
1
|
%
|
1
|
%
|
||||
|
Total
|
100
|
%
|
100
|
%
|
100
|
%
|
100
|
%
|
100
|
%
|
||||
|
Average Stage Length
|
1,301
|
|
|
1,225
|
|
1,195
|
|
1,182
|
|
1,177
|
|
|||
|
(a)
|
Includes information for Virgin America for the period December 14, 2016 through December 31, 2016.
|
REGIONAL
Our regional operations consist of flights operated by Horizon, SkyWest and PenAir. In
2017
, our regional operations carried approximately
9 million
revenue passengers, primarily in the states of Washington, Oregon, Idaho and California. Horizon is the largest regional airline in the Pacific Northwest and carries approximately
74%
of Air Group's regional revenue passengers.
Based on
2017
Horizon passenger enplanements on regional aircraft, our most significant concentration of regional activity was in Seattle and Portland. At
December 31, 2017
, Horizon’s operating fleet consisted of
10
Embraer 175 (E175) jet aircraft and
50
Bombardier Q400 turboprop aircraft. The regional fleet operated by SkyWest consisted of
23
E175 aircraft.
7
The percentage of regional passenger capacity by region and average stage length is presented below:
|
|
2017
|
2016
|
2015
|
2014
|
2013
|
|||||||||
|
West Coast
|
59
|
%
|
60
|
%
|
62
|
%
|
66
|
%
|
66
|
%
|
||||
|
Pacific Northwest
|
13
|
%
|
16
|
%
|
19
|
%
|
19
|
%
|
21
|
%
|
||||
|
Canada
|
4
|
%
|
5
|
%
|
7
|
%
|
8
|
%
|
9
|
%
|
||||
|
Alaska
|
3
|
%
|
4
|
%
|
5
|
%
|
4
|
%
|
2
|
%
|
||||
|
Midcon
|
21
|
%
|
15
|
%
|
6
|
%
|
2
|
%
|
1
|
%
|
||||
|
Mexico
|
—
|
%
|
—
|
%
|
1
|
%
|
1
|
%
|
1
|
%
|
||||
|
Total
|
100
|
%
|
100
|
%
|
100
|
%
|
100
|
%
|
100
|
%
|
||||
|
Average Stage Length
|
422
|
|
381
|
|
348
|
|
339
|
|
329
|
|
||||
FREQUENT FLYER PROGRAM
In 2017, we maintained two frequent flyer plans: the Alaska Airlines Mileage Plan™ and Virgin America Elevate®. To provide consistency and clarity to our guests, we merged the two programs throughout the year, and Elevate® was officially sunset in December 2017.
Alaska Airlines Mileage Plan™ provides a comprehensive suite of frequent flyer benefits. Miles can be earned by flying on our airlines or on one of our
18
airline partners, by using the Alaska Airlines credit card, or through other non-airline partners. Alaska's extensive list of airline partners includes carriers associated with each of the three major global alliances, making it easier for our members to earn miles and reach elite status in our frequent flyer program. Through Alaska and our global partners, Mileage Plan™ members have access to a large network of over
900
worldwide travel destinations. Further, members can receive 30,000 bonus miles upon signing up for the Alaska Airlines Visa Signature card and meeting a minimum spend threshold, and earn triple miles on Alaska Airlines and Virgin America purchases. Alaska Airlines Visa Signature cardholders and small business cardholders in the U.S., and Platinum and World Elite Mastercard holders in Canada, also receive an annual companion ticket that allows members to purchase an additional ticket for $99 plus taxes, with no restrictions or black-out dates, and a free first checked bag for up to seven people traveling in the same itinerary. Earned miles can be redeemed for flights on our airlines, or partner airlines, or for upgrades to First Class on Alaska Airlines. We believe all of these benefits give our Mileage Plan™ members more value for their travel.
Mileage Plan™ and Elevate® revenues represented approximately
11%
of Air Group's total revenues in
2017
. Mileage Plan™ helps drive revenue growth by attracting new customers and building customer loyalty through the benefits that we provide.
AGREEMENTS WITH OTHER AIRLINES
Our agreements fall into three different categories: Frequent Flyer, Codeshare and Interline agreements. Frequent Flyer agreements offer mileage credits and redemptions for our Mileage Plan™ members. Alaska offers one of the most comprehensive frequent flyer programs for our Mileage Plan™ members through frequent flyer partnerships with
18
domestic and international carriers.
Codeshare agreements allow one or more marketing carriers to sell seats on a single operating carrier that services passengers under multiple flight numbers. The sale of codeshare seats can vary depending on the sale arrangement. For example, in a free-sale arrangement, the marketing carrier sells the operating carrier's inventory without any restriction; whereas in a block space arrangement, a fixed amount of seats are sold to the marketing carrier by the operating carrier. The interchangeability of the flight code between carriers provides a greater selection of flights for customers, along with increased flexibility for mileage accrual and redemption.
Interline agreements allow airlines to jointly offer a competitive, single-fare itinerary to customers traveling via multiple carriers to a final destination. An interline itinerary offered by one airline may not necessarily be offered by the other, and the fares collected from passengers are prorated and distributed to interline partners according to preexisting agreements between the carriers. Frequent flyer, codeshare and interline agreements help increase our traffic and revenue by providing more route choices to our guests.
Alaska has marketing alliances with a number of airlines that provide frequent flyer and codesharing opportunities. Alliances are an important part of our strategy and enhance our revenues by:
8
|
•
|
offering our guests more travel destinations and better mileage credit/redemption opportunities, including elite qualifying miles on U.S. and international airline partners;
|
|
•
|
giving our frequent flyer program a competitive advantage because of our partnership with carriers from all three of the major global alliances;
|
|
•
|
giving us access to more connecting traffic from other airlines; and
|
|
•
|
providing members of our alliance partners’ frequent flyer programs an opportunity to travel on Alaska, Virgin America and our regional partners while earning mileage credit in our partners’ programs.
|
Most of our codeshare relationships are free-sale codeshares, where the marketing carrier sells seats on the operating carrier’s flights from the operating carrier’s inventory, but takes no inventory risk. Our marketing agreements have various termination dates, and one or more may be in the process of renegotiation at any time.
The comprehensive summary of Alaska's alliances with other airlines is as follows:
|
Codeshare
|
|||||
|
|
Frequent
Flyer
Agreement
|
Alaska Flight # on
Flights Operated by
Other Airline
|
Other Airline Flight #
on Flights Operated by
Air Group
|
||
|
Major U.S. or International Airlines
|
|||||
|
American Airlines
|
Yes
|
Yes
|
Yes
|
||
|
Air France
(b)
|
Yes
|
No
|
Yes
|
||
|
British Airways
|
Yes
|
No
|
Yes
|
||
|
Cathay Pacific Airways
|
Yes
|
No
|
Yes
|
||
|
Condor Airlines
(a)
|
Yes
|
No
|
No
|
||
|
Emirates
|
Yes
|
No
|
Yes
|
||
|
Finnair
|
Yes
|
No
|
No
|
||
|
Icelandair
|
Yes
|
No
|
Yes
|
||
|
Hainan Airlines
|
Yes
|
No
|
No
|
||
|
Japan Airlines
|
Yes
|
No
|
No
|
||
|
KLM
(b)
|
Yes
|
No
|
Yes
|
||
|
Korean Air
|
Yes
|
No
|
Yes
|
||
|
LATAM
|
Yes
|
No
|
Yes
|
||
|
Fiji Airways
(a)
|
Yes
|
No
|
Yes
|
||
|
Qantas
|
Yes
|
No
|
Yes
|
||
|
Singapore Airlines
|
Yes
|
No
|
No
|
||
|
Regional Airlines
|
|
|
|
||
|
Ravn Alaska
(c)
|
Yes
|
Yes
|
No
|
||
|
PenAir
(a)
|
Yes
|
Yes
|
No
|
||
|
China Airlines
(d)
|
No
|
No
|
Yes
|
||
|
China Eastern
(d)
|
No
|
No
|
Yes
|
||
|
China Southern
(d)
|
No
|
No
|
Yes
|
||
|
Virgin Australia
(d)
|
No
|
No
|
Yes
|
||
|
(a)
|
These airlines do not have their own frequent flyer program. However, Alaska's Mileage Plan
TM
members can earn and redeem miles on these airlines' route systems.
|
|
(b)
|
Codeshare agreements with Air France & KLM terminate on March 31, 2018; frequent flyer agreements terminate on April 30, 2018.
|
|
(c)
|
Alaska has temporarily suspended codeshare activity with Ravn (effective July 1, 2017) while Ravn takes steps to address certain operational considerations. The Frequent Flyer Agreement with Ravn has remained in place during this time.
|
|
(d)
|
These codeshare agreements were established with Virgin America on their reservations platform. After the conversion to a single Passenger Service System (PSS) in Q2 2018, these agreements will no longer exist.
|
9
The following is the financial impact of our marketing alliances:
|
2017
|
2016
(a)
|
2015
|
2014
|
2013
|
|||||
|
Air Group Marketed Revenues
|
94%
|
92%
|
90%
|
91%
|
90%
|
||||
|
Codeshare Agreements:
|
|||||||||
|
American Airlines
|
1%
|
3%
|
4%
|
3%
|
2%
|
||||
|
Delta Air Lines
|
1%
|
1%
|
2%
|
2%
|
4%
|
||||
|
Others
|
1%
|
1%
|
1%
|
1%
|
1%
|
||||
|
Interline Agreements:
|
|||||||||
|
Domestic Interline
|
1%
|
2%
|
2%
|
2%
|
2%
|
||||
|
International Interline
|
2%
|
1%
|
1%
|
1%
|
1%
|
||||
|
Total Operating Revenue
|
100%
|
100%
|
100%
|
100%
|
100%
|
||||
|
(a)
|
Includes information for Virgin America for the period December 14, 2016 through December 31, 2016.
|
OTHER REVENUE
Other revenue consists of freight and mail, certain frequent flyer and ancillary revenue. While some of our product features are included in our base pricing, we have unbundled certain ancillary features that our guests separately value. Major ancillary revenue products include checked bag fees, change fees and lounge memberships. We also promote and sell products in-flight to enhance the guest experience, including our Tom Douglas signature meals, snacks, alcoholic beverages, in-flight entertainment and Wi-Fi. Total other revenue, excluding frequent flyer program revenue, represents about
7%
of our total revenues.
GENERAL
The airline industry is highly competitive and subject to various uncertainties, including economic conditions, volatile fuel prices, industry instability, new competition, a largely unionized work force, the need to finance large capital expenditures and the related availability of capital, government regulation—including taxes and fees, and potential aircraft incidents. Airlines have high fixed costs, primarily for wages, aircraft fuel, aircraft ownership and facilities rents. Because expenses of a flight do not vary significantly based on the number of passengers carried, a relatively small change in the number of passengers or in pricing has a disproportionate effect on an airline’s operating and financial results. In other words, a minor shortfall in expected revenue levels could cause a disproportionately negative impact on our operating and financial results. Passenger demand and ticket prices are, in large measure, influenced by the general state of the economy, current global economic and political events, and total available airline seat capacity.
In
2017
, the airline industry's profits declined when compared to the record setting year of 2016, primarily due to rising fuel prices, higher labor costs, and increased competitive fare actions reducing ticket prices. Despite some of these headwinds, the industry continued to report strong profits in 2017. In the current strong industry environment, airlines are making significant investments in airports, in more fuel-efficient planes and in new services to differentiate their customer service offering. Thus, the level of competition is expected to continue to increase.
FUEL
Our business and financial results are highly affected by the price and the availability of aircraft fuel. The cost of aircraft fuel is volatile and outside of our control, and it can have a significant and immediate impact on our operating results. Over the past five years, aircraft fuel expense ranged from
18%
to
34%
of operating expenses. Fuel prices are impacted by changes in both the price of crude oil and refining margins and can vary by region in the U.S.
The prices we have paid for crude oil on an average annual basis for the past five years have ranged from a low of
$43
per barrel in 2016 to a high of
$98
in 2013. For us, a $1 per barrel change in the price of oil equates to approximately
$19 million
of fuel cost annually. Said another way, a one-cent change in our fuel price per gallon will impact our expected annual fuel cost by approximately
$8 million
per year.
Refining margins, which represent the price of refining crude oil into aircraft fuel, are a smaller portion of the overall price of jet fuel but also contributed to the price volatility in recent years. Average annual West Coast refining margin prices have fluctuated between
$13
per barrel and
$36
per barrel in the last five years, and averaged
$18
per barrel in
2017
.
10
Generally, West Coast jet fuel prices are somewhat higher and more volatile than prices in the Gulf Coast or on the East Coast. Our average raw fuel cost per gallon
increased
21%
in
2017
, after decreasing 19% in
2016
and 39% in
2015
.
The percentages of our aircraft fuel expense by crude oil and refining margins, as well as the percentage of our aircraft fuel expense of operating expenses are as follows:
|
|
2017
|
2016
(a)
|
2015
|
2014
|
2013
|
|||||||||
|
Crude oil
|
66
|
%
|
69
|
%
|
62
|
%
|
72
|
%
|
71
|
%
|
||||
|
Refining margins
|
23
|
%
|
20
|
%
|
26
|
%
|
18
|
%
|
19
|
%
|
||||
|
Other
(b)
|
11
|
%
|
11
|
%
|
12
|
%
|
10
|
%
|
10
|
%
|
||||
|
Total
|
100
|
%
|
100
|
%
|
100
|
%
|
100
|
%
|
100
|
%
|
||||
|
Aircraft fuel expense
|
22
|
%
|
18
|
%
|
22
|
%
|
32
|
%
|
34
|
%
|
||||
|
(a)
|
Includes information for Virgin America for the period December 14, 2016 through December 31, 2016.
|
|
(b)
|
Other includes gains and losses on settled fuel hedges, unrealized mark-to-market fuel hedge gains or losses, taxes and other into-plane costs.
|
We use crude oil call options as hedges to decrease our exposure to the volatility of jet fuel prices. Call options effectively cap our pricing for crude oil, limiting our exposure to increasing fuel prices for about half of our planned fuel consumption. With call options, we are hedged against spikes in crude oil prices, and during a period of decline in crude oil prices, we only forfeit cash previously paid for hedge premiums. We begin hedging approximately 18 months in advance of crude oil consumption.
We believe that operating fuel-efficient aircraft is the best hedge against high fuel prices. Alaska operates an all-Boeing 737 fleet, Virgin America operates an all-Airbus A320 family fleet, and Horizon currently operates a fleet including Embraer 175 jet aircraft and Bombardier Q400 turboprop aircraft. Air Group's fuel-efficiency rate expressed in available seat miles flown per gallon (ASMs/g) improved from
75.3
ASMs/g in
2013
to
77.9
ASMs/g in
2017
. These improvements have not only reduced our fuel consumption rate, but also the amount of greenhouse gases and other pollutants that our aircraft emit.
COMPETITION
Competition in the airline industry is intense and unpredictable. Our competitors consist primarily of other airlines and, to a lesser extent, other forms of transportation. Competition can be direct, in the form of another carrier flying the exact non-stop route, or indirect, where a carrier serves the same two cities non-stop from an alternative airport in that city or via an itinerary requiring a connection at another airport. We compete with other domestic airlines and a limited number of international airlines on nearly all of our scheduled routes. Our largest competitor is Delta, who has significantly increased its capacity in Seattle over the past few years. Approximately 75% of our capacity to and from Seattle competes with Delta. As we grow in California and expand our transcontinental route offerings, United Airlines and Southwest Airlines have also become large competitors and have increased their capacity in markets we serve. Our California and transcontinental routes have a higher concentration of competitors when compared to our historical route structure which was predominately concentrated in the Pacific Northwest. Based on schedules filed with the U.S. Department of Transportation, we expect the amount of competitive capacity overlap with all carriers to increase by more than
6%
in the first half of
2018
, weighted based on our network.
We believe that the following principal competitive factors are important to our guests:
|
•
|
Safety record
|
Safety is our top priority and is at the core of everything we do. In 2017, we were ranked by AirlineRatings.com as one of only two U.S. airlines in the Top 20 safest airlines in the world. We also received our 16th Diamond Award of Excellence from the Federal Aviation Administration, recognizing both Alaska and Horizon aircraft technicians for their commitment to training.
|
•
|
Customer service and reputation
|
We compete with other airlines in areas of customer service such as on-time performance, guest amenities—including first class and other premium seating, quality of on-board products, aircraft type and comfort. In
2017
, Alaska Airlines ranked highest in customer satisfaction among traditional network carriers by J.D. Power and Associates for the
tenth
year in a row. We have installed Boeing Space Bins on the majority of our Boeing 737-900ER fleet, providing additional overhead bin space for our guests. In 2017, we launched a Premium Class of service on our B737 aircraft that provides extra
11
legroom, early boarding, premium snacks and a complimentary alcoholic beverage. Additionally, in 2017 we increased the distance between seats in our first class cabins on the Alaska B737-900 and B737-900ER fleet, providing significantly more space for guests flying in the First Class cabin. We expect to fully complete the First Class cabin upgrades on the B737-900 and B737-900ER fleet in early 2018.
Starting in 2018, we will begin reconfiguring the interior and livery of the Airbus fleet. The new livery and interior reconfiguration will provide guests a consistent brand experience across the Mainline fleet. The projects are expected to be complete in late 2019.
Our employees are a key element of our product. We have a highly engaged workforce that strives to provide a high degree of service and hospitality to our guests both at the airport and in flight. We heavily emphasize our service standards with our employees through training and education programs and monetary incentives related to operational performance and guest surveys.
|
•
|
Fares and ancillary services
|
Fare pricing is a significant competitive factor in the airline industry, and the increased availability of fare information on the Internet allows travelers to easily compare fares and identify competitor promotions and discounts. Pricing is driven by a variety of factors including, but not limited to, market-specific capacity, market share per route/geographic area, cost structure, fare vs. ancillary revenue strategies, and demand.
For example, airlines often discount fares to drive traffic in new markets or to stimulate traffic when necessary to improve load factors. In addition, traditional network carriers have been able to reduce their operating costs through bankruptcies and mergers, while low-cost carriers have continued to grow their fleets and expand their networks, potentially enabling them to better control costs per available seat mile (the average cost to fly an aircraft seat one mile), which in turn may enable them to lower their fares. These factors can reduce our pricing power and that of the airline industry as a whole.
Domestic airline capacity is dominated by four large carriers, representing over 80% of total seats. Accordingly, if these carriers discount their fares or enter into our core markets, we must match those fares in order to maintain our load factors, often resulting in year-over-year decreases in our yields. We will defend our core markets and, if necessary, redeploy capacity to better match supply with demand. We believe the restructuring we've completed over the past decade has decreased our costs, enabling us to offer competitive fares while still earning returns for our shareholders.
|
•
|
Routes served, flight schedules, codesharing and interline relationships, and frequent flyer programs
|
We also compete with other airlines based on markets served, the frequency of service to those markets and frequent flyer opportunities. Some airlines have more extensive route structures than we do, and they offer significantly more international routes. In order to expand opportunities for our guests, we enter into codesharing and interline relationships with other airlines that provide reciprocal frequent flyer mileage credit and redemption privileges. These relationships allow us to offer our guests access to more destinations than we can on our own, gain exposure in markets we don't serve and allow our guests more opportunities to earn and redeem frequent flyer miles. The Mileage Plan™ offers some of the most comprehensive benefits to our members with the ability to earn and redeem miles on
18
partner carriers.
In addition to domestic or foreign airlines that we compete with on most of our routes, we compete with ground transportation in our short-haul markets. To some extent, our airlines also compete with technology, such as video conferencing and internet-based meeting tools that have changed the need for, or frequency of, face-to-face business meetings.
TICKET DISTRIBUTION
Our tickets are distributed through three primary channels:
|
•
|
Direct to customer:
It is less expensive for us to sell through our direct channels at alaskaair.com and virginamerica.com. As a result, we continue to take steps to drive more business to our websites. In addition, we believe these channels are preferable from a branding and customer-relationship standpoint in that we can establish ongoing communication with the customer and tailor offers accordingly.
|
|
•
|
Traditional and online travel agencies:
Both traditional and online travel agencies typically use Global Distribution Systems (GDS) to obtain their fare and inventory data from airlines. Bookings made through these agencies result in a fee
|
12
that is charged to the airline. Many of our large corporate customers require us to use these agencies. Some of our competitors do not use this distribution channel and, as a result, have lower ticket distribution costs.
|
•
|
Reservation call centers:
Our call centers are located in Phoenix, AZ, Kent, WA, and Boise, ID. We generally charge a $15 fee for booking reservations through the call centers.
|
Our sales by channel are as follows:
|
|
2017
|
2016
(a)
|
2015
|
2014
|
2013
|
|||||||||
|
Direct to customer
|
62
|
%
|
61
|
%
|
60
|
%
|
57
|
%
|
55
|
%
|
||||
|
Traditional agencies
|
22
|
%
|
23
|
%
|
23
|
%
|
25
|
%
|
27
|
%
|
||||
|
Online travel agencies
|
11
|
%
|
11
|
%
|
11
|
%
|
12
|
%
|
13
|
%
|
||||
|
Reservation call centers
|
5
|
%
|
5
|
%
|
6
|
%
|
6
|
%
|
5
|
%
|
||||
|
Total
|
100
|
%
|
100
|
%
|
100
|
%
|
100
|
%
|
100
|
%
|
||||
|
(a)
|
Includes results for Virgin America for the period December 14, 2016 through December 31, 2016.
|
SEASONALITY AND OTHER FACTORS
Our results of operations for any interim period are not necessarily indicative of those for the entire year because our business is subject to seasonal fluctuations. Our profitability is generally lowest during the first and fourth quarters due principally to fewer departures and passengers. Profitability typically increases in the second quarter and then reaches its highest level during the third quarter as a result of vacation travel, including increased activity in the state of Alaska. However, we have significantly improved the seasonality of our operations by our continued growth from the West Coast to leisure destinations, like Hawaii and Costa Rica, and expansion to leisure and business destinations in the mid-continental and eastern U.S.
In addition to passenger loads, factors that could cause our quarterly operating results to vary include:
|
•
|
pricing initiatives by us or our competitors,
|
• changes in fuel costs,
|
•
|
increases in competition at our primary airports,
|
|
•
|
general economic conditions and resulting changes in passenger demand, and
|
|
•
|
increases or decreases in passenger and volume-driven variable costs.
|
Many of the markets we serve experience inclement weather conditions in the winter, causing increased costs associated with deicing aircraft, canceling flights and accommodating displaced passengers. Due to our geographic area of operations, we can be more susceptible to adverse weather conditions, particularly in the state of Alaska and the Pacific Northwest, than some of our competitors who may be better able to spread weather-related risks over larger route systems. We also are susceptible to Air Traffic Control due to our heavy concentration of departures from Seattle and San Francisco.
No material part of our business, or that of our subsidiaries, is dependent upon a single customer, or upon a few high-volume customers.
EMPLOYEES
Our business is labor intensive. As of
December 31, 2017
, we employed
23,156
(
13,896
at Alaska,
3,538
at Virgin America,
3,943
at Horizon, and
1,779
at McGee Air Services) active full-time and part-time employees. Wages and benefits, including variable incentive pay, represented approximately
39%
of our total non-fuel operating expenses in
2017
and
40%
in
2016
.
Most major airlines, including Alaska, Virgin America, and Horizon, have employee groups that are covered by collective bargaining agreements (CBA). Airlines with unionized work forces generally have higher labor costs than carriers without unionized work forces, and they may not have the ability to adjust labor costs downward quickly enough to respond to new competition or slowing demand.
13
As part of the integration, we have been working to bring represented Alaska Airlines and Virgin America work groups under single collective bargaining agreements. The process for combining workgroups begins with the union filing a petition with the National Mediation Board (NMB), at which point the NMB performs a review to assess a ‘single carrier determination’ for the airlines. Following this single carrier determination, the NMB makes a representation determination depending on size of the pre-merger bargaining units and will either extend the certification if one is significantly larger than the other or require a vote. Once representation is determined, the NMB certifies the union as the bargaining representative for the work group. The parties must also work together to achieve agreed upon single collective bargaining agreements. Integration also requires the pre-merger work groups to agree upon and finalize integrated seniority lists. As of December 31, 2017 we have labor integration agreements with pilots and clerical, office, and passenger services employees, meaning all agreements are completed to define how and when we will combine the Alaska and Virgin America groups into one. The remaining work groups are still in process of completing similar such agreements. The time frame to reach single CBA and full transition to work rules for each group will vary.
At
December 31, 2017
, labor unions represented
84%
of Alaska’s,
84%
of Virgin America's,
44%
of Horizon’s, and
90%
of McGee Air Services' employees.
Our relations with U.S. labor organizations are governed by the Railway Labor Act (RLA). Under the RLA, collective bargaining agreements do not expire but instead become amendable as of a stated date. If either party wishes to modify the terms of any such agreement, it must notify the other party in the manner prescribed by the RLA and/or described in the agreement. After receipt of such notice, the parties must meet for direct negotiations, and if no agreement is reached, either party may request the NMB to initiate a process including mediation, arbitration, and a potential “cooling off” period that must be followed before either party may engage in self-help.
14
Alaska’s union contracts at
December 31, 2017
were as follows:
|
Union
|
Employee Group
|
Number of Employees
|
Contract Status
|
||||
|
Air Line Pilots Association, International (ALPA)
|
Pilots
|
1,970
|
|
Amendable 4/1/2020
|
|||
|
Association of Flight Attendants (AFA)
|
Flight attendants
|
4,392
|
|
Amendable 12/17/2019
|
|||
|
International Association of Machinists and Aerospace Workers (IAM)
|
Ramp service and stock clerks
|
673
|
|
Amendable 7/19/2018
|
|||
|
IAM
|
Clerical, office and passenger service
|
3,733
|
|
Amendable 1/1/2019
|
|||
|
Aircraft Mechanics Fraternal Association (AMFA)
|
Mechanics, inspectors and cleaners
|
706
|
|
Amendable 10/17/2021
|
|||
|
Mexico Workers Association of Air Transport
|
Mexico airport personnel
|
106
|
|
Amendable 2/1/2018
|
|||
|
Transport Workers Union of America (TWU)
|
Dispatchers
|
52
|
|
Amendable 3/24/2019
|
|||
Virgin America's union contracts at
December 31, 2017
were as follows:
|
Union
|
Employee Group
|
Number of Employees
|
Contract Status
|
||||
|
ALPA
|
Pilots
|
858
|
|
Amendable 4/1/2020
|
|||
|
AFA
|
Inflight teammates
|
1,209
|
|
Not completed
|
|||
|
IAM
|
Clerical, office and passenger service
|
865
|
|
Amendable 1/1/2019
|
|||
|
TWU
|
Dispatchers
|
36
|
|
Not completed
|
|||
Horizon’s union contracts at
December 31, 2017
were as follows:
|
Union
|
Employee Group
|
Number of Employees
|
Contract Status
|
||||
|
International Brotherhood of Teamsters (IBT)
|
Pilots
|
729
|
|
Amendable 12/14/2024
|
|||
|
AFA
|
Flight attendants
|
660
|
|
Amendable 7/18/2019
|
|||
|
IBT
|
Mechanics and related classifications
|
283
|
|
Amendable 12/16/2020
|
|||
|
Unifor
|
Station personnel in
Vancouver and Victoria, BC, Canada |
37
|
|
Amendable 2/14/2019
|
|||
|
TWU
|
Dispatchers
|
21
|
|
Amendable 8/26/2018
|
|||
McGee Air Services union contract at
December 31, 2017
was as follows:
|
Union
|
Employee Group
|
Number of Employees
|
Contract Status
|
||||
|
IAM
|
Fleet and ramp
|
1,596
|
|
Amendable 7/19/2023
|
|||
15
EXECUTIVE OFFICERS
The executive officers of Air Group, and executive officers of Alaska, Virgin America and Horizon who have significant decision-making responsibilities, their positions and their respective ages are as follows:
|
Name
|
Position
|
Age
|
Air Group
or Subsidiary
Officer Since
|
|||
|
Bradley D. Tilden
|
Chairman and Chief Executive Officer of Alaska Air Group, Inc., Chairman of Alaska Airlines, Inc. and Virgin America Inc., Chairman of Horizon Air Industries, Inc.
|
57
|
1994
|
|||
|
Benito Minicucci
|
President and Chief Operating Officer of Alaska Airlines, Inc. and Chief Executive Officer of Virgin America Inc.
|
51
|
2004
|
|||
|
Brandon S. Pedersen
|
Executive Vice President/Finance and Chief Financial Officer of Alaska Air Group, Inc. and Alaska Airlines, Inc., and Chief Financial Officer of Virgin America Inc.
|
51
|
2003
|
|||
|
Andrew R. Harrison
|
Executive Vice President and Chief Commercial Officer of Alaska Airlines, Inc.
|
47
|
2008
|
|||
|
Kyle B. Levine
|
Vice President Legal, General Counsel and Corporate Secretary of Alaska Air Group, Inc. and Alaska Airlines, Inc. and Chief Ethics and Compliance Officer of Alaska Air Group, Inc.
|
46
|
2016
|
|||
|
David L. Campbell
|
Former President and Chief Executive Officer of Horizon Air Industries, Inc.
|
56
|
2014
|
|||
|
Gary L. Beck
|
President and Chief Executive Officer of Horizon Air Industries, Inc.
|
70
|
2018
|
|||
|
Peter D. Hunt
|
President and Chief Operating Officer of Virgin America Inc.
|
48
|
2017
|
|||
|
Shane R. Tackett
|
Senior Vice President, Revenue and E-commerce of Alaska Airlines, Inc.
|
39
|
2017
|
|||
|
Andrea L. Schneider
|
Vice President People of Alaska Airlines, Inc.
|
52
|
2017
|
|||
|
Diana Birkett Rakow
|
Vice President External Relations of Alaska Airlines, Inc.
|
40
|
2017
|
|||
Mr. Tilden
joined Alaska Airlines in 1991, became Controller of Alaska Air Group and Alaska Airlines in 1994 and was named Vice President/Finance at Alaska Airlines in January 1999 and at Alaska Air Group in February 2000. He was elected Alaska Airlines Chief Financial Officer in February 2000, Executive Vice President/Finance and Chief Financial Officer of both companies in January 2002 and Executive Vice President/Finance and Planning of Alaska Airlines in April 2007. Mr. Tilden was named President of Alaska Airlines in December 2008 and, in May 2012, he was elected President and CEO of Alaska Air Group and Alaska Airlines and CEO of Horizon Air. He leads Air Group’s Management Executive Committee and was elected to the Air Group Board in 2010 and became Chairman of the Board in January 2014. In December 2017, Mr. Tilden was elected as President and CEO of Horizon Air, effective January 5, 2018, until Mr. Beck was elected effective January 15, 2018.
Mr. Minicucci
joined Alaska Airlines in 2004 as Staff Vice President of Maintenance and Engineering and was promoted to Vice President of Seattle Operations in June 2008. He was elected Executive Vice President/Operations and Chief Operating Officer of Alaska Airlines in December 2008. In May 2016, he was named President of Alaska Airlines and, in December 2016, Chief Executive Officer of Virgin America. He is a member of Air Group’s Management Executive Committee.
Mr. Pedersen
joined Alaska Airlines in 2003 as Staff Vice President/Finance and Controller of Alaska Air Group and Alaska Airlines and was elected Vice President/Finance and Controller for both entities in 2006. He was elected Chief Financial Officer of Alaska Air Group and Alaska Airlines in June 2010 and Executive Vice President/Finance and Chief Financial
16
Officer of both entities in 2014. In December 2016, he was named Chief Financial Officer of Virgin America Inc. He is a member of Air Group's Management Executive Committee.
Mr. Harrison
joined Alaska Airlines in 2003 as the Managing Director of Internal Audit and was elected Vice President of Planning and Revenue Management in 2008. He was elected Senior Vice President of Planning and Revenue Management in 2014. He was elected Executive Vice President and Chief Revenue Officer in February 2015 and named Executive Vice President and Chief Commercial Officer in August 2015. He is a member of Air Group's Management Executive Committee.
Mr. Campbell
resigned as President and CEO of Horizon Air Industries, Inc. effective January 5, 2018. He joined Horizon Air in 2014 as President and Chief Operating Officer and was named President and Chief Executive Officer in May 2016. Prior to joining Horizon Air, Mr. Campbell served more than 25 years in maintenance and flight operations. He was a member of Air Group's Management Executive Committee.
Mr. Levine
was elected Vice President Legal and General Counsel of Alaska Air Group and Alaska Airlines in January 2016 and is a member of Air Group’s Management Executive Committee. He was elected Corporate Secretary of Alaska Air Group and Alaska Airlines in August 2017. Mr. Levine joined Alaska Airlines in February 2006 as a Senior Attorney. He also served as Associate General Counsel and Managing Director Commercial Law and General Litigation from July 2009 to February 2011 and, subsequently, as Deputy General Counsel and Managing Director of Legal at Alaska Airlines from February 2011 to January 2016. He was appointed Assistant Corporate Secretary of Horizon Air in August 2017 and Virgin America in November 2017.
Mr. Beck
was elected President and CEO of Horizon Air effective January 15, 2018 and is a member of Air Group’s Management Executive Committee. Mr. Beck previously served as Vice President, Flight Operations at Alaska Airlines, Inc. until retiring in June 2015. Since then, he has provided consulting services to Alaska Airlines, Inc. in connection with the integration to a single operating certificate with Virgin America Inc.
Mr. Hunt
was elected President and Chief Operating Officer of Virgin America Inc. in December 2016, effective with the merger of Alaska Airlines, Inc. and Virgin America Inc. He became a member of Air Group’s Management Executive Committee in January 2017. Mr. Hunt previously served as Senior Vice President and Chief Financial Officer at Virgin America (2011 - 2016). Prior to joining Virgin America, Mr. Hunt was Vice President and CFO of Pinnacle Airlines Corp. (2004-2011).
Mr. Tackett
was elected Senior Vice President of Revenue and E-commerce in August 2017 and became a member of Air Group’s Management Executive Committee at that time. Mr. Tackett previously served in a number of capacities since joining Alaska Airlines in 2000, including Managing Director Financial Planning and Analysis, (2008-2010), Vice President Labor Relations (2010-2015) and Vice President Revenue Management in 2016.
Ms. Schneider
was elected Vice President of People at Alaska Airlines in August 2017 and became a member of Air Group’s Management Executive Committee at that time. Ms. Schneider was previously Vice President of Inflight Services at Alaska (2011-2017), later also taking responsibility for Call Centers at Alaska (February 2017). She began her career at Alaska as Manager of Financial Accounting in 1989. Since that time, she has held a number of positions, including Senior Vice President of People and Customer Services at Horizon Air Industries (2009-2011).
Ms. Birkett Rakow
was elected Vice President of External Relations at Alaska Airlines in September 2017 and became a member of Air Group’s Management Executive Committee at that time. She was previously Vice President of Public Affairs, Communications and Brand Management for Kaiser Permanente (2017). From 2006-2017, Ms. Birkett Rakow held a number of positions at Group Health Cooperative, including Executive Vice President, Marketing and Public Affairs (2014-2017), Vice President Marketing and Public Affairs (2014) and Vice President Public Affairs (2013-2014). From 2003-2006, Ms. Birkett Rakow was a member of the United States Senate Finance Committee as its Health Policy Advisor.
REGULATION
GENERAL
The airline industry is highly regulated, most notably by the federal government. The Department of Transportation (DOT), the Federal Aviation Administration (FAA) and the Transportation Security Administration (TSA) exercise significant regulatory authority over air carriers.
17
|
•
|
DOT:
In order to provide passenger and cargo air transportation in the U.S., a domestic airline is required to hold a certificate of public convenience and necessity issued by the DOT. Subject to certain individual airport capacity, noise and other restrictions, this certificate permits an air carrier to operate between any two points in the U.S. Certificates do not expire, but may be revoked for failure to comply with federal aviation statutes, regulations, orders or the terms of the certificates. While airlines are permitted to establish their own fares without government regulation,
the DOT has jurisdiction over the approval of international codeshare agreements, marketing alliance agreements between major domestic carriers, international and some domestic route authorities, Essential Air Service market subsidies, carrier liability for personal or property damage, and certain airport rates and charges disputes. International treaties may also contain restrictions or requirements for flying outside of the U.S. and impose different carrier liability limits than those applicable to domestic flights. The DOT has been active in implementing a variety of “consumer protection” regulations, covering subjects such as advertising, passenger communications, denied boarding compensation and tarmac delay response.
Airlines are subject to enforcement actions that are brought by the DOT from time to time for alleged violations of consumer protection and other economic regulations. We are not aware of any enforcement proceedings that could either materially affect our financial position or impact our authority to operate.
|
|
•
|
FAA:
The FAA, through Federal Aviation Regulations (FARs), generally regulates all aspects of airline operations, including establishing personnel, maintenance and flight operation standards. Domestic airlines are required to hold a valid air carrier operating certificate issued by the FAA. Pursuant to these regulations, we have established, and the FAA has approved, our operations specifications and a maintenance program for each type of aircraft we operate. Each maintenance program provides for the ongoing maintenance of the relevant aircraft type, ranging from frequent routine inspections to major overhauls. From time to time, the FAA issues airworthiness directives (ADs) that must be incorporated into our aircraft maintenance program and operations. All airlines are subject to enforcement actions that are brought by the FAA from time to time for alleged violations of FARs or ADs. At this time, we are not aware of any enforcement proceedings that could either materially affect our financial position or impact our authority to operate.
|
|
•
|
TSA:
Airlines serving the U.S. must operate a TSA-approved Aircraft Operator Standard Security Program (AOSSP), and comply with TSA Security Directives (SDs) and regulations. Under TSA authority, we are required to collect a September 11 Security Fee of $5.60 per one-way trip from passengers and remit that sum to the government to fund aviation security me
asures.
Airlines are subject to enforcement actions that are brought by the TSA from time to time for alleged violations of the AOSSP, SDs or security regulations. We are not aware of any enforcement proceedings that could either materially affect our financial position or impact our authority to operate.
|
The Department of Justice and DOT have jurisdiction over airline antitrust matters. The U.S. Postal Service has jurisdiction over certain aspects of the transportation of mail and related services. Labor relations in the air transportation industry are regulated under the Railway Labor Act. To the extent we continue to fly to foreign countries and pursue alliances with international carriers, we may be subject to certain regulations of foreign agencies and international treaties.
ENVIRONMENTAL AND OCCUPATIONAL SAFETY MATTERS
We are subject to various laws and government regulations concerning environmental matters and employee safety and health in the U.S. and other countries. We are also subject to the oversight of the Occupational Safety and Health Administration (OSHA) concerning employee safety and health matters. The U.S. Environmental Protection Agency, OSHA, and other federal agencies have been authorized to create and enforce regulations that have an impact on our operations. In addition to these federal activities, various states have been delegated certain authorities under these federal statutes. Many state and local governments have adopted environmental and employee safety and health laws and regulations. We maintain our safety, health and environmental programs in order to meet or exceed these requirements.
In the future there may be legislation to reduce carbon and other greenhouse gas emissions. Over the course of several years, we have transitioned to more fuel-efficient aircraft fleets and reduced our emissions with the goal of continuing that trend.
The Airport Noise and Capacity Act recognizes the rights of airport operators with noise problems to implement local noise abatement programs so long as they do not interfere unreasonably with interstate or foreign commerce or the national air transportation system. Authorities in several cities have established aircraft noise reduction programs, including the imposition of nighttime curfews. We believe we have sufficient scheduling flexibility to accommodate local noise restrictions.
Although we do not currently anticipate that these regulatory matters, individually or collectively, will have a material effect on our financial condition, results of operations or cash flows, new regulations or compliance issues that we do not currently anticipate could have the potential to harm our financial condition, results of operations or cash flows in future periods.
18
INSURANCE
We carry insurance of types customary in the airline industry and in amounts deemed adequate to protect our interests and property and to comply both with federal regulations and certain credit and lease agreements. The insurance policies principally provide coverage for Airline Hull, Spares and Comprehensive Legal Liability, War and Allied Perils, and Workers’ Compensation. In addition, we currently carry a Cyber Insurance policy in the event of security breaches from malicious parties.
We believe that our emphasis on safety and our state-of-the-art flight deck safety technology help to control the cost of our insurance.
WHERE YOU CAN FIND MORE INFORMATION
Our filings with the Securities and Exchange Commission, including our annual report on Form 10-K, quarterly reports on Form 10-Q, current reports on Form 8-K and amendments to those reports are available on our website at
www.alaskaair.com,
free of charge, as soon as reasonably practicable after the electronic filing of these reports with the Securities and Exchange Commission. The information contained on our website is not a part of this annual report on Form 10-K.
GLOSSARY OF TERMS
Aircraft Utilization
- block hours per day; this represents the average number of hours per day our aircraft are in transit
Aircraft Stage Length
- represents the average miles flown per aircraft departure
ASMs
- available seat miles, or “capacity”; represents total seats available across the fleet multiplied by the number of miles flown
CASM
- operating costs per ASM, or "unit cost"; represents all operating expenses including fuel and special items
CASMex
- operating costs excluding fuel and special items per ASM; this metric is used to help track progress toward reduction of non-fuel operating costs since fuel is largely out of our control
Debt-to-capitalization ratio
- represents adjusted debt (long-term debt plus the present value of future operating lease payments) divided by total equity plus adjusted debt
Diluted Earnings per Share
- represents earnings per share (EPS) using fully diluted shares outstanding
Diluted Shares
- represents the total number of shares that would be outstanding if all possible sources of conversion, such as stock options, were exercised
Economic Fuel
- best estimate of the cash cost of fuel, net of the impact of our fuel-hedging program
Free Cash Flow -
total operating cash flow generated less cash paid for capital expenditures
Load Factor
- RPMs as a percentage of ASMs; represents the number of available seats that were filled with paying passengers
Mainline
- represents flying Boeing 737 and Airbus 320 family jets and all associated revenues and costs
PRASM
- passenger revenue per ASM; commonly called “passenger unit revenue”
Productivity
- number of revenue passengers per full-time equivalent employee
RASM
- operating revenue per ASMs, or "unit revenue"; operating revenue includes all passenger revenue, freight & mail, Mileage Plan™ and other ancillary revenue; represents the average total revenue for flying one seat one mile
Regional
- represents capacity purchased by Alaska from Horizon, SkyWest and PenAir. In this segment, Regional records actual on-board passenger revenue, less costs such as fuel, distribution costs, and payments made to Horizon, SkyWest and PenAir under the respective capacity purchased arrangement (CPAs). Additionally, Regional includes an allocation of corporate overhead such as IT, finance, and other administrative costs incurred by Alaska and on behalf of Horizon.
19
RPMs
- revenue passenger miles, or "traffic"; represents the number of seats that were filled with paying passengers; one passenger traveling one mile is one RPM
Yield
- passenger revenue per RPM; represents the average revenue for flying one passenger one mile
|
|
If any of the following occurs, our business, financial condition and results of operations could suffer. The trading price of our common stock could also decline. We operate in a continually changing business environment. In this environment, new risks may emerge, and already identified risks may vary significantly in terms of impact and likelihood of occurrence. Management cannot predict such developments, nor can it assess the impact, if any, on our business of such new risk factors or of events described in any forward-looking statements.
We have adopted an enterprise-wide risk analysis and oversight program designed to identify the various risks faced by the organization, assign responsibility for managing those risks to individual executives as well as align these risks with Board oversight. These enterprise-wide risks have been aligned to the risk factors discussed below.
SAFETY, COMPLIANCE AND OPERATIONAL EXCELLENCE
Our reputation and financial results could be harmed in the event of an airline accident or incident.
An accident or incident involving one of our aircraft or an aircraft operated by one of our codeshare partners or CPA carriers could involve a significant loss of life and result in a loss of confidence in our Company by the flying public and/or aviation authorities. We could experience significant claims from injured passengers, bystanders and surviving relatives as well as costs for the repair or replacement of a damaged aircraft and temporary or permanent loss from service. We maintain liability insurance in amounts and of the type generally consistent with industry practice, as do our codeshare partners and CPA carriers. However, the amount of such coverage may not be adequate to fully cover all claims, and we may be forced to bear substantial economic losses from such event. Substantial claims resulting from an accident in excess of our related insurance coverage would harm our business and financial results. Moreover, any aircraft accident or incident, even if it is fully insured and does not involve one of our aircraft, could cause a public perception that our airlines or the aircraft we or our partners fly are less safe or reliable than other transportation alternatives. This would harm our business.
Our operations are often affected by factors beyond our control, including delays, cancellations and other conditions, which could harm our business, financial condition and results of operations.
As is the case for all airlines, our operations often are affected by delays, cancellations and other conditions caused by factors largely beyond our control.
Factors that might impact our operations include:
|
•
|
congestion and/or space constraints at airports, specifically in our hub locations of Seattle, Los Angeles, and San Francisco;
|
|
•
|
air traffic control problems;
|
|
•
|
lack of operational approval (e.g. new routes, aircraft deliveries, etc.);
|
|
•
|
adverse weather conditions;
|
|
•
|
increased security measures or breaches in security;
|
|
•
|
contagious illness and fear of contagion;
|
|
•
|
changes in international treaties concerning air rights;
|
|
•
|
international or domestic conflicts or terrorist activity; and
|
20
|
•
|
other changes in business conditions.
|
Due to our concentration of flights along the West Coast and Alaska, we believe a large portion of our operation is more susceptible to air traffic control delays. Additionally, due to our concentration of flights in the Pacific Northwest and Alaska we believe a large portion of our operation is more susceptible to adverse weather conditions. A general reduction in airline passenger traffic as a result of any of the above-mentioned factors could harm our business, financial condition and results of operations.
Changes in government regulation imposing additional requirements and restrictions on our operations could increase our operating costs and result in service delays and disruptions.
Airlines are subject to extensive regulatory and legal requirements, both domestically and internationally, that involve significant compliance costs. In the last several years, Congress has passed laws, and the U.S. DOT, the TSA and the FAA have issued regulations that have required significant expenditures relating to maintenance of aircraft, operation of airlines and broadening of consumer protections.
Similarly, there are a number of legislative and regulatory initiatives and reforms at the federal, state and local levels. These initiatives include increasingly stringent laws to protect the environment, minimum wage requirements, mandatory paid sick or family leave, and health care mandates. They could affect our relationship with our workforce and the vendors that serve our airlines and cause our expenses to increase without an ability to pass through these costs.
Almost all commercial service airports are owned and/or operated by units of local or state governments. Airlines are largely dependent on these governmental entities to provide adequate airport facilities and capacity at an affordable cost. Many airports have increased their rates and charges to air carriers to reflect higher costs of security, updates to infrastructure and other. Additional laws, regulations, taxes, airport rates and airport charges may be occasionally proposed that could significantly increase the cost of airline operations or reduce the demand for air travel. Although lawmakers may impose these additional fees and view them as “pass-through” costs, we believe that a higher total ticket price will influence consumer purchase and travel decisions and may result in an overall decline in passenger traffic, which would harm our business.
The airline industry continues to face potential security concerns and related costs.
Terrorist attacks, the fear of such attacks or other hostilities involving the U.S. could have a significant negative effect on the airline industry, including us, and could:
|
•
|
significantly reduce passenger traffic and yields as a result of a potentially dramatic drop in demand for air travel;
|
|
•
|
significantly increase security and insurance costs;
|
|
•
|
make war risk or other insurance unavailable or extremely expensive;
|
|
•
|
increase fuel costs and the volatility of fuel prices;
|
|
•
|
increase costs from airport shutdowns, flight cancellations and delays resulting from security breaches and perceived safety threats; and
|
|
•
|
result in a grounding of commercial air traffic by the FAA.
|
The occurrence of any of these events would harm our business, financial condition and results of operations.
We rely on third-party vendors for certain critical activities.
We rely on outside vendors for a variety of services and functions critical to our business, including airframe and engine maintenance, regional flying, ground handling, fueling, computer reservation system hosting, telecommunication systems, information technology infrastructure and services, and deicing.
Even though we strive to formalize agreements with these vendors that define expected service levels, our use of outside vendors increases our exposure to several risks. In the event that one or more vendors go into bankruptcy, ceases operation or fails to perform as promised, replacement services may not be readily available at competitive rates, or at all. If one of our vendors fails to perform adequately, we may experience increased costs, delays, maintenance issues, safety issues or negative
21
public perception of our airline. Vendor bankruptcies, unionization, regulatory compliance issues or significant changes in the competitive marketplace among suppliers could adversely affect vendor services or force us to renegotiate existing agreements on less favorable terms. These events could result in disruptions in our operations or increases in our cost structure.
INTEGRATION OF VIRGIN AMERICA
We may be unable to effectively integrate Virgin America’s business and realize the anticipated benefits of the acquisition.
We must devote significant management attention and resources to integrating the business practices and operations of Virgin America. Potential difficulties we may encounter as part of the integration process include the following:
|
•
|
the challenges associated with integrating Virgin America employees into Alaska's workforce, including seniority list integration, and negotiation of transition process agreements, while maintaining our focus on providing consistent, high quality customer service;
|
|
•
|
the inability to successfully attract and retain Virgin America guests upon integration with Alaska;
|
|
•
|
the challenges associated with integrating complex systems, technology, aircraft fleets, networks, facilities and other assets in a seamless manner that minimizes any adverse impact on guests, suppliers, employees and other constituents; and
|
|
•
|
the challenges associated with operating aircraft types new to our operations, specifically the Airbus A319, A320, and A321neo.
|
Any of the foregoing factors could adversely affect our ability to maintain relationships with guests, suppliers, employees and other constituencies or our ability to achieve the anticipated benefits of the acquisition on a timely basis, or at all. These factors could also reduce our earnings or otherwise adversely affect our business and financial results. In addition, integration requirements have caused, and may continue to cause, a delay of other strategic initiatives.
The need to integrate Virgin America’s workforce into collective bargaining agreements with Alaska's workforce presents the potential for delay in achieving expected synergies and other benefits or labor disputes that could adversely affect our operations and costs.
The successful integration of Virgin America and achievement of the anticipated benefits of the acquisition depend significantly on integrating Virgin America’s employees into Alaska and on maintaining productive employee relations. Failure to do so presents the potential for delays in achieving expected synergies and other benefits of integration or labor disputes that could adversely affect our operations and costs. The process for integrating labor groups in an airline merger is governed by a combination of the Railway Labor Act, the McCaskill-Bond Act, and where applicable, the existing provisions of our CBAs, in addition to internal union policies.
As part of the transition agreement with the pilot workgroup, there is a temporary “fence” between Alaska and Virgin America pilots requiring that only Alaska pilots operate Boeing aircraft and only Virgin America pilots operate Airbus aircraft. Through the implementation of the recent Joint Collective Bargaining Agreement that now applies to all pilots from both airlines, this fence will be removed when the two groups are combined into a single scheduling system later in 2018.
In addition, flight attendants, dispatchers, and mechanics cannot be fully integrated until transition agreements have been reached and single seniority lists have been provided to the Company by each workgroup. Achievement of expected synergies and other benefits will be delayed until the time that operational integration is obtained.
We will need to launch certain branding or rebranding initiatives in connection with the integration that may take a significant amount of time and involve substantial costs and that may not be favorably received by our guests.
We may incur substantial costs as a result of rebranding Virgin America’s products and services, including updating the aircraft livery and configuration, and may not be able to achieve or maintain brand name recognition or status that is comparable to the recognition and status previously enjoyed by Virgin America in any of Virgin America’s markets. The failure of any such rebranding initiatives could adversely affect our ability to attract and retain guests, which could cause us not to realize some or all of the anticipated benefits contemplated to result from the acquisition.
22
We are expected to incur substantial expenses related to the integration of Virgin America.
We are expected to continue to incur substantial integration and transition expenses in connection with the acquisition of Virgin America, including the necessary costs associated with integrating the operations of Alaska and Virgin America. There are a large number of processes, policies, procedures, operations, technologies and systems that must be integrated, including ticketing/distribution, maintenance and flight operations. While we have assumed that a certain level of expenses will be incurred, there are many factors beyond our control that could affect the total amount or the timing of the integration expenses. Moreover, many of the expenses that will be incurred are, by their nature, difficult to estimate accurately. These expenses could, particularly in the near term, exceed the financial benefits we expect to achieve from the acquisition, including the elimination of duplicative expenses and the realization of economies of scale and cost savings. These integration expenses likely will continue to result in us taking charges against earnings in future periods, and the amount and timing of such charges are uncertain at present.
The application of the acquisition method of accounting resulted in us recording a significant amount of goodwill, which could result in significant future impairment charges and negatively affect our financial results.
In accordance with applicable acquisition accounting rules, we recorded goodwill on our consolidated balance sheet to the extent the Virgin America acquisition purchase price exceeded the net fair value of Virgin America’s tangible and identifiable intangible assets and liabilities as of the acquisition date. Goodwill is not amortized, but is tested for impairment at least annually. We could record impairment charges in our results of operations as a result of, among other items, extreme fuel price volatility, a significant decline in the fair value of certain tangible or intangible assets, unfavorable trends in forecasted results of operations and cash flows, uncertain economic environment and other uncertainties. We can provide no assurance that a significant impairment charge will not occur in one or more future periods. Any such charges may materially negatively affect our financial results.
We obtain our rights to use the Virgin brand under agreements with certain entities affiliated with the Virgin Group, and we would lose those rights if these agreements are terminated or not renewed.
Virgin America is a party to license agreements with certain entities affiliated with the Virgin Group pursuant to which we obtain rights to use the Virgin brand. The licensor may terminate the agreements upon the occurrence of a number of specified events including if Virgin America commits a material breach of its obligations under the agreements that is uncured for more than 10 business days or if it materially damages the Virgin brand. If we lose our rights to use the Virgin brand, our current plan to discontinue use of the Virgin America trademarks gradually would need to be accelerated, which could have an adverse impact on our financial condition.
The Virgin brand is not under our control, and negative publicity related to the Virgin brand name could materially adversely affect our business.
Virgin America licenses rights to the Virgin brand from certain entities affiliated with the Virgin Group on a non-exclusive basis. The Virgin brand is also licensed to and used by a number of other companies, including two airlines, Virgin Atlantic Airways and Virgin Australia Airlines, operating in other geographies. We rely on the general goodwill of consumers and our employees towards the Virgin brand. Consequently, any adverse publicity in relation to the Virgin brand name, its principals, particularly Sir Richard Branson who is closely associated with the brand, or another Virgin-branded company over which we have no control or influence could have a material adverse effect on our business.
STRATEGY
The airline industry is highly competitive and susceptible to price discounting and changes in capacity, which could have a material adverse effect on our business. If we cannot successfully compete in the marketplace, our business, financial condition, and operating results will be materially adversely affected.
The U.S. airline industry is characterized by substantial price competition. In recent years, the market share held by low-cost carriers and ultra low-cost carriers has increased significantly and is expected to continue to increase. Airlines also compete for market share by increasing or decreasing their capacity, route systems, and the number of markets served. Several of our competitors have increased their capacity in markets we serve, particularly in our key West Coast markets. The resulting increased competition in both domestic and international markets may have a material adverse effect on our results of operations, financial condition, or liquidity.
23
We continue to strive toward maintaining and improving our competitive cost structure by setting aggressive cost-reduction goals. This is an important part of our business strategy of offering the best value to our guests through low fares while achieving acceptable profit margins and return on capital. If we are unable to maintain our cost advantage over the long-term and achieve sustained targeted returns on invested capital, we will likely not be able to grow our business in the future or weather industry downturns. Therefore, our financial results may suffer.
The airline industry may undergo further restructuring, consolidation, or the creation or modification of alliances or joint ventures, any of which could have a material adverse effect on our business, financial condition and results of operations.
We continue to face strong competition from other carriers due to restructuring, consolidation, and the creation and modification of alliances and joint ventures. Since deregulation, both the U.S. and international airline industries have experienced consolidation through a number of mergers and acquisitions. Carriers may also improve their competitive positions through airline alliances, slot swaps/acquisitions and/or joint ventures. Certain airline joint ventures further competition by allowing airlines to coordinate routes, pool revenues and costs, and enjoy other mutual benefits, achieving many of the benefits of consolidation.
Our concentration in certain markets could cause us to be disproportionately impacted by adverse changes in circumstances in those locations.
Our strategy includes being the premier carrier for people living on the West Coast. This results in a high concentration of our business in key West Coast markets. A significant portion of our flights occur to and from our Seattle, Portland, and Bay Area hubs. In
2017
, passengers to and from Seattle, Portland, and the Bay Area accounted for
81%
of our total guests.
We believe that concentrating our service offerings in this way allows us to maximize our investment in personnel, aircraft and ground facilities, as well as to gain greater advantage from sales and marketing efforts in those regions. As a result, we remain highly dependent on our key markets. Our business could be harmed by any circumstances causing a reduction in demand for air transportation in our key markets. An increase in competition in our key markets could also cause us to reduce fares or take other competitive measures that, if sustained, could harm our business, financial condition and results of operations.
We are dependent on a limited number of suppliers for aircraft and parts.
Alaska is dependent on Boeing as its sole supplier for aircraft and many aircraft parts. Virgin America is similarly dependent on Airbus, and Horizon is dependent on Bombardier and Embraer. Additionally, each carrier is dependent on sole suppliers for aircraft engines for each aircraft type. As a result, we are more vulnerable to issues associated with the supply of those aircraft and parts including design defects, mechanical problems, contractual performance by the manufacturers, or adverse perception by the public that would result in customer avoidance or in actions by the FAA. Additionally, further consolidation amongst aircraft and aircraft parts manufacturers could further limit the number of suppliers. This could result in an inability to operate our aircraft or instability in the foreign countries, in which the aircraft and its parts are manufactured.
We rely on partner airlines for codeshare and frequent flyer marketing arrangements.
Our airlines are parties to marketing agreements with a number of domestic and international air carriers, or “partners." These agreements provide that certain flight segments operated by us are held out as partner “codeshare” flights and that certain partner flights are held out for sale as Alaska or Virgin America codeshare flights. In addition, the agreements generally provide that members of Alaska’s Mileage Plan™ program can earn credit on or redeem credit for partner flights and vice versa. We receive revenue from flights sold under codeshare and from interline arrangements. In addition, we believe that the frequent flyer arrangements are an important part of our frequent flyer program. The loss of a significant partner through bankruptcy, consolidation, or otherwise, could have a negative effect on our revenues or the attractiveness of our Mileage Plan™ program, which we believe is a source of competitive advantage.
We routinely engage in analysis and discussions regarding our own strategic position, including alliances, codeshare arrangements, interline arrangements, and frequent flyer program enhancements, and may have future discussions with other airlines regarding similar activities. If other airlines participate in consolidation or reorganization, those airlines may significantly improve their cost structures or revenue generation capabilities, thereby potentially making them stronger competitors of ours and potentially impairing our ability to realize expected benefits from our own strategic relationships.
24
Economic uncertainty, or another recession, would likely impact demand for our product and could harm our financial condition and results of operations.
The airline industry, which is subject to relatively high fixed costs and highly variable and unpredictable demand, is particularly sensitive to changes in economic conditions. We are also highly dependent on U.S. consumer confidence and the health of the U.S. economy. Unfavorable U.S. economic conditions have historically driven changes in travel patterns and have resulted in reduced spending for both leisure and business travel. For some consumers, leisure travel is a discretionary expense, and shorter distance travelers, in particular, have the option to replace air travel with surface travel. Businesses are able to forgo air travel by using communication alternatives such as videoconferencing or may be more likely to purchase less expensive tickets to reduce costs, which can result in a decrease in average revenue per seat. Unfavorable economic conditions also hamper the ability of airlines to raise fares to counteract increased fuel, labor and other costs. Unfavorable or even uncertain economic conditions could negatively affect our financial condition and results of operations.
INFORMATION TECHNOLOGY
We rely heavily on automated systems to operate our business, and a failure to invest in new technology or a disruption of our current systems or their operators could harm our business.
We depend on automated systems to operate our business, including our airline reservation system, our telecommunication systems, our website, our maintenance systems, our check-in kiosks, mobile devices, and other systems. Substantially all of our tickets are issued to our guests as electronic tickets, and the majority of our customers check in using our website, airport kiosks, or our mobile application. We depend on our reservation system to be able to issue, track and accept these electronic tickets. In order for our operations to work efficiently, we must continue to invest in new technology to ensure that our website, reservation system and check-in systems are able to accommodate a high volume of traffic, maintain information security and deliver important flight information. Substantial or repeated website, reservations system or telecommunication systems failures or service disruptions could reduce the attractiveness of our services and cause our guests to do business with another airline. In addition, we rely on other automated systems for crew scheduling, flight dispatch and other operational needs. We also plan to move our primary data center location. Disruptions, failed migration, untimely recovery, or a breach of these systems or the data center could result in the loss of important data, an increase of our expenses, an impact on our operational performance, or a possible temporary cessation of our operations.
If we do not maintain the privacy and security of our information, we could damage our reputation and incur substantial legal and regulatory costs.
We accept, store and transmit information about our guests, our employees, our business partners, and our business. In addition, we frequently rely on third-party hosting sites and data processors, including cloud providers. Our sensitive information relies on secure transmission over public and private networks. A compromise of our systems, the security of our infrastructure or those of other business partners that result in our information being accessed or stolen by unauthorized persons could adversely affect our operations and our reputation.
FINANCIAL CONDITION AND FINANCIAL MARKETS
Our business, financial condition and results of operations are substantially exposed to the volatility of jet fuel prices. Significant increases in jet fuel costs would harm our business.
Fuel costs constitute a significant portion of our total operating expenses. Future increases in the price of jet fuel may harm our business, financial condition and results of operations unless we are able to increase fares and fees or add additional ancillary services to attempt to recover increasing fuel costs.
Our indebtedness and other fixed obligations could lead to liquidity constraints that may restrict our activities.
We incurred a significant amount of new debt to finance our acquisition of Virgin America. We now have, and will continue to have for the foreseeable future, a substantial amount of debt. Due to our high fixed costs, including aircraft lease commitments and debt service, a decrease in revenues would result in a disproportionately greater decrease in earnings.
25
Our outstanding long-term debt and other fixed obligations could have important consequences. For example, they could limit our ability to obtain additional financing to fund our future capital expenditures, working capital or other purposes; require us to dedicate a material portion of our operating cash flow to fund lease payments and interest payments on indebtedness, thereby reducing funds available for other purposes; or limit our ability to withstand competitive pressures and reduce our flexibility in responding to changing business and economic conditions.
Although we have historically been able to generate sufficient cash flow from our operations to pay our debt and other fixed obligations when they become due, we cannot ensure we will be able to do so in the future. If we fail to do so, our business could be harmed.
Our maintenance costs will increase as our fleet ages, and we will periodically incur substantial maintenance costs due to the timing of maintenance events of our aircraft.
As of
December 31, 2017
, the average age of our NextGen aircraft (B737-800, -900, -900ERs) was approximately
7.5
years, the average age of our A319, A320, and A321neo aircraft was approximately
7.3
years, the average age of our Embraer E175 aircraft was approximately
1.2
years, and the average age of our Q400 aircraft was approximately
11
years. Our relatively new aircraft require less maintenance currently than they will in the future. Any significant increase in maintenance expenses could have a material adverse effect on our results of operations.
Our ability to use Virgin America’s net operating loss carryforwards to offset future taxable income for U.S. federal and state income tax purposes may be limited if we are unable to earn adequate taxable income in future periods.
Our ability to use the net operating loss carryforwards (NOLs) will depend on the amount of taxable income generated in future periods. The NOLs may expire before we can generate sufficient taxable income to utilize the NOLs.
BRAND AND REPUTATION
As we evolve our brand to appeal to a changing demographic and grow into new markets, we will engage in strategic initiatives that may not be favorably received by all of our guests.
We continue to focus on strategic initiatives designed to increase our brand appeal to a diverse and evolving demographic of airline travelers. These efforts could include significant enhancements to our in-airport and on-board environments, increasing our direct customer relationships through improvements to our purchasing portals (digital and mobile) and optimization of our customer loyalty programs.
In pursuit of these efforts we may negatively affect our reputation with some of our existing customer base.
LABOR RELATIONS AND LABOR STRATEGY
A significant increase in labor costs, unsuccessful attempts to strengthen our relationships with union employees or loss of key personnel could adversely affect our business and results of operations.
Labor costs are a significant component of our total expenses. Each of Alaska, Horizon, Virgin America, and McGee Air Service's represented employee groups has a separate collective bargaining agreement. In relation to the Virgin America integration, the workgroups that have not yet reached a transition agreement could make demands that would increase our operating expenses and adversely affect our financial performance if we agree to them. The same result could apply if we experience a significant increase in vendor labor costs, including wage rate increases, which could ultimately flow through to us under the applicable services agreement.
Although we have a long track record of fostering good communications, negotiating approaches and developing other strategies to enhance workforce engagement in our long-term vision, future uncertainty around open contracts-including the collective bargaining negotiations for the integration of Alaska's and Virgin America's represented work groups-could be a distraction, affecting employee focus on our business and diverting management’s attention from other projects and issues.
We compete against the major U.S. airlines and other businesses for labor in many highly skilled positions. If we are unable to hire, train and retain qualified employees at a reasonable cost, achieve and sustain employee engagement in our strategic vision, or if we are unsuccessful at implementing succession plans for our key staff, we may be unable to grow or sustain our business.
26
Employees could also engage in job actions such as slow-downs, work-to-rule campaigns, sick-outs or other actions designed to disrupt our normal operations in an attempt to pressure us to acquiesce to wage or other demands during Section 6 negotiations or transition agreement discussions. Although the Railway Labor Act makes such “self-help” unlawful until the National Mediation Board releases the parties following lengthy mediation attempts, such actions could cause significant harm even if we were ultimately successful in seeking injunctive relief or other remedies.
The inability to attract, retain and train regional pilots could result in guest impact and adversely affect our business and results of operations.
In recent years, there have been shortages of pilots for hire in the regional market, and there is an anticipated pilot shortage in hiring in the mainline markets in the next two to three years. Attrition beyond normal levels, or the inability to attract new pilots, could negatively impact our operating results, and our business prospects could be harmed. In addition, the ability to train pilot candidates in a timely manner to support Alaska’s operational needs may continue to be a challenge for Horizon Air. Due to the high volume of turnover, partially driven by the hiring needs of mainline carriers, pilot training may face added stress associated with ensuring initial training, recurrent training and upgrades from first officer to captain are accomplished in a manner timely enough to support Alaska’s operational needs. Any of these outcomes would possibly result in guest impact and harm to our business, financial condition and results of operations.
|
|
None.
|
|
AIRCRAFT
The following table describes the aircraft we operate and their average age at
December 31, 2017
:
|
Aircraft Type
|
Seats
|
Owned
|
Leased
|
Total
|
Average
Age in
Years
|
||||||||
|
B737 Freighters
|
—
|
3
|
|
—
|
|
3
|
|
17.5
|
|
||||
|
B737 NextGen
|
124-181
|
141
|
|
10
|
|
151
|
|
7.5
|
|
||||
|
A319
|
119
|
—
|
|
10
|
|
10
|
|
10.2
|
|
||||
|
A320
|
146-149
|
10
|
|
43
|
|
53
|
|
7.3
|
|
||||
|
A321neo
|
185
|
—
|
|
4
|
|
4
|
|
0.4
|
|
||||
|
Total Mainline Fleet
|
154
|
|
67
|
|
221
|
|
7.6
|
|
|||||
|
Q400
|
76
|
35
|
|
15
|
|
50
|
|
11.0
|
|
||||
|
E175
|
76
|
10
|
|
23
|
|
33
|
|
1.2
|
|
||||
|
Total Regional Fleet
|
45
|
|
38
|
|
83
|
|
7.1
|
|
|||||
|
Total
|
199
|
|
105
|
|
304
|
|
7.4
|
|
|||||
“Management’s Discussion and Analysis of Financial Condition and Results of Operations" discusses future orders and options for additional aircraft. “Liquidity and Capital Resources" provides more information about aircraft that are used to secure long-term debt arrangements or collateralize credit facilities.
Alaska’s leased B737 aircraft have lease expiration dates between
2018
and
2026
. Virgin America's leased A319, A320, and A321neo aircraft have expiration dates between
2019
and
2029
. Horizon’s leased Q400 aircraft have expiration dates between
2018
and
2021
. The leased E175 aircraft are through our capacity purchase agreement with SkyWest. Alaska, Virgin America and Horizon have the option to extend some of the leases for additional periods, or the right to purchase the aircraft at the end of the lease term, usually at the fair-market value of the aircraft.
27
GROUND FACILITIES AND SERVICES
We own terminal buildings in various cities in the state of Alaska and several buildings located at or near Seattle-Tacoma International Airport (Sea-Tac) near Seattle, WA. These include a multi-bay hangar and shops complex (used primarily for line maintenance), a flight operations and training center, an air cargo facility, an information technology office and data center, and various other commercial office buildings. Additionally, in 2017 we entered into a contract to acquire property near our existing headquarters facility for the development of additional office space.
We lease ticket counters, gates, cargo and baggage space, ground equipment, office space and other support areas at the majority of the airports we serve. Airport leases contain provisions for periodic adjustments of lease rates. We are typically responsible for maintenance, insurance and other facility-related expenses and services under these agreements. We also lease operations, training, administrative, and data center facilities in Burlingame, CA; Portland, OR; Quincy, WA; and Spokane, WA as well as line maintenance stations in Boise, ID; Bellingham, WA; Eugene, OR; San Jose, CA; Medford, OR; Redmond, OR; Seattle, WA; Kent, WA; and Spokane, WA. Further, we lease call center facilities in Phoenix, AZ, and Boise, ID.
|
|
We are a party to routine litigation matters incidental to our business. Management believes the ultimate disposition of these matters is not likely to materially affect our financial position or results of operations. This forward-looking statement is based on management’s current understanding of the relevant law and facts, and it is subject to various contingencies, including the potential costs and risks associated with litigation and the actions of judges and juries.
In 2015, three flight attendants filed a class action lawsuit seeking to represent all Virgin America flight attendants for damages based on alleged violations of California and City of San Francisco wage and hour laws. Plaintiffs received class certification in November 2016. Virgin America filed a motion for summary judgment seeking to dismiss all claims on various federal preemption grounds. In January 2017, the Court denied in part and granted in part Virgin America’s motion. The Company believes the claims in this case are without factual and legal merit and intends to defend this lawsuit.
|
|
Not applicable.
|
|
As of
December 31, 2017
, there were
129,903,498
shares of common stock of Alaska Air Group, Inc. issued,
123,060,638
shares outstanding, and
2,044
shareholders of record. In
2017
, we paid quarterly dividends of
$0.300
per share in March, June, September and December. Our common stock is listed on the New York Stock Exchange (symbol: ALK). The following table shows the trading range of Alaska Air Group, Inc. common stock on the New York Stock Exchange:
|
|
2017
|
2016
|
|||||||||||||
|
|
High
|
Low
|
High
|
Low
|
|||||||||||
|
First Quarter
|
$
|
101.43
|
|
$
|
86.22
|
|
$
|
83.05
|
|
$
|
61.58
|
|
|||
|
Second Quarter
|
93.16
|
|
82.03
|
|
83.09
|
|
54.53
|
|
|||||||
|
Third Quarter
|
95.75
|
|
71.17
|
|
71.57
|
|
56.47
|
|
|||||||
|
Fourth Quarter
|
82.68
|
|
61.10
|
|
91.88
|
|
65.60
|
|
|||||||
SALES OF NON-REGISTERED SECURITIES
None.
28
PURCHASES OF EQUITY SECURITIES BY THE ISSUER AND AFFILIATED PURCHASERS
|
Total Number of
Shares Purchased
|
Average Price
Paid per Share
|
Total Number of Shares (or units) Purchased as Part of Publicly Announced Plans or Programs
|
Maximum remaining
dollar value of shares
that can be purchased
under the plan
(in millions)
|
||||||||||
|
October 1, 2017 - October 31, 2017
(a)
|
369,182
|
|
$
|
67.72
|
|
369,182
|
|
||||||
|
November 1, 2017 - November 30, 2017
|
—
|
|
—
|
|
—
|
|
|||||||
|
December 1, 2017 - December 31, 2017
|
—
|
|
—
|
|
—
|
|
|||||||
|
Total
|
369,182
|
|
$
|
67.72
|
|
369,182
|
|
$
|
612
|
|
|||
|
(a)
|
Purchased pursuant to the $1 billion repurchase plan authorized by the Board of Directors in August 2015.
|
29
PERFORMANCE GRAPH
The following graph compares our cumulative total stockholder return since
December 31, 2012
with the S&P 500 Index and the Dow Jones U.S. Airlines Index. The graph assumes that the value of the investment in our common stock and each index (including reinvestment of dividends) was $100 on
December 31, 2012
.
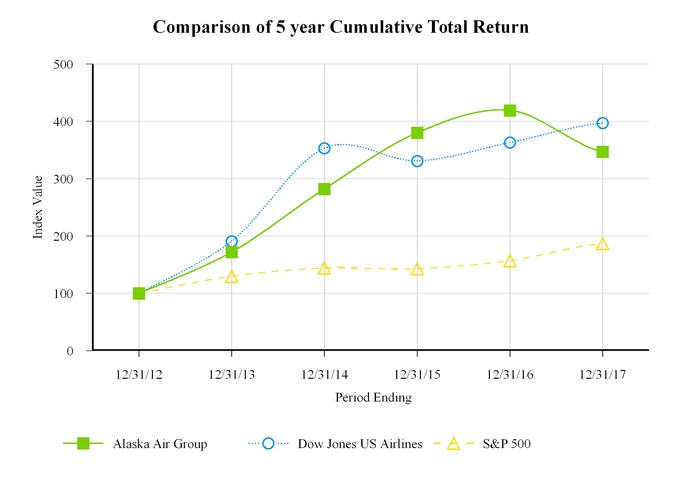
30
|
|
As the acquisition of Virgin America closed on December 14, 2016, results below include Virgin America for the twelve months ended December 31, 2017, but only for the period December 14, 2016 through December 31, 2016 in the twelve months ended December 31, 2016.
31
|
Year Ended December 31 (in millions, except per-share amounts):
|
2017
|
2016
|
2015
|
2014
|
2013
|
||||||||||||||
|
CONSOLIDATED OPERATING RESULTS
(audited)
|
|
|
|
|
|
|
|
|
|
||||||||||
|
Operating Revenues
|
$
|
7,933
|
|
|
$
|
5,931
|
|
|
$
|
5,598
|
|
|
$
|
5,368
|
|
$
|
5,156
|
|
|
|
Operating Expenses
|
6,673
|
|
|
4,582
|
|
|
4,300
|
|
|
4,406
|
|
4,318
|
|
||||||
|
Operating Income
|
1,260
|
|
|
1,349
|
|
|
1,298
|
|
|
962
|
|
838
|
|
||||||
|
Nonoperating income (expense), net of interest capitalized
(a)
|
(53
|
)
|
(4
|
)
|
14
|
|
13
|
|
(22
|
)
|
|||||||||
|
Income before income tax
|
1,207
|
|
|
1,345
|
|
|
1,312
|
|
|
975
|
|
816
|
|
||||||
|
Net Income
|
$
|
1,034
|
|
|
$
|
814
|
|
|
$
|
848
|
|
|
$
|
605
|
|
$
|
508
|
|
|
|
Average basic shares outstanding
|
123.211
|
|
|
123.557
|
|
|
128.373
|
|
|
135.445
|
|
139.910
|
|
||||||
|
Average diluted shares outstanding
|
123.854
|
|
|
124.389
|
|
|
129.372
|
|
|
136.801
|
|
141.878
|
|
||||||
|
Basic earnings per share
|
$
|
8.39
|
|
|
$
|
6.59
|
|
|
$
|
6.61
|
|
|
$
|
4.47
|
|
$
|
3.63
|
|
|
|
Diluted earnings per share
|
$
|
8.35
|
|
|
$
|
6.54
|
|
|
$
|
6.56
|
|
|
$
|
4.42
|
|
$
|
3.58
|
|
|
|
Cash dividends declared per share
|
$
|
1.20
|
|
$
|
1.10
|
|
$
|
0.80
|
|
$
|
0.50
|
|
0.20
|
|
|||||
|
CONSOLIDATED FINANCIAL POSITION
(audited)
|
|
|
|
|
|
|
|
|
|
|
|
|
|
||||||
|
At End of Period (in millions):
|
|
|
|
|
|
|
|
|
|
|
|
|
|
||||||
|
Total assets
|
$
|
10,740
|
|
|
$
|
9,962
|
|
|
$
|
6,530
|
|
|
$
|
6,059
|
|
$
|
5,719
|
|
|
|
Long-term debt, including current portion
|
$
|
2,569
|
|
|
$
|
2,964
|
|
|
$
|
683
|
|
|
$
|
798
|
|
$
|
865
|
|
|
|
Shareholders' equity
|
$
|
3,721
|
|
|
$
|
2,931
|
|
|
$
|
2,411
|
|
|
$
|
2,127
|
|
$
|
2,029
|
|
|
|
OPERATING STATISTICS
(unaudited)
(d)
|
|
|
|
|
|
|
|
|
|
|
|
|
|
|
|||||
|
Consolidated:
(b)
|
|||||||||||||||||||
|
Revenue passengers (000)
|
44,034
|
34,289
|
31,883
|
29,287
|
27,414
|
||||||||||||||
|
RPMs (000,000) "traffic"
|
52,338
|
37,209
|
33,578
|
30,718
|
28,833
|
||||||||||||||
|
ASMs (000,000) "capacity"
|
62,072
|
44,135
|
39,914
|
36,078
|
33,672
|
||||||||||||||
|
Load factor
|
84.3%
|
84.3%
|
84.1%
|
85.1%
|
85.6%
|
||||||||||||||
|
Yield
|
13.03¢
|
13.45¢
|
14.27¢
|
14.91¢
|
14.80¢
|
||||||||||||||
|
PRASM
|
10.98¢
|
11.34¢
|
12.01¢
|
12.69¢
|
12.67¢
|
||||||||||||||
|
RASM
|
12.78¢
|
13.44¢
|
14.03¢
|
14.88¢
|
14.74¢
|
||||||||||||||
|
CASMex
(c)
|
8.23¢
|
8.23¢
|
8.30¢
|
8.36¢
|
8.47¢
|
||||||||||||||
|
Mainline:
|
|||||||||||||||||||
|
Revenue passengers (000)
|
34,539
|
24,838
|
22,869
|
20,972
|
19,737
|
||||||||||||||
|
RPMs (000,000) "traffic"
|
48,238
|
33,489
|
30,340
|
27,778
|
26,172
|
||||||||||||||
|
ASMs (000,000) "capacity"
|
56,945
|
39,473
|
35,912
|
32,430
|
30,411
|
||||||||||||||
|
Load factor
|
84.7%
|
84.8%
|
84.5%
|
85.7%
|
86.1%
|
||||||||||||||
|
Yield
|
12.14¢
|
12.24¢
|
12.98¢
|
13.58¢
|
13.33¢
|
||||||||||||||
|
PRASM
|
10.29¢
|
10.38¢
|
10.97¢
|
11.64¢
|
11.48¢
|
||||||||||||||
|
CASMex
(c)
|
7.47¢
|
7.30¢
|
7.39¢
|
7.45¢
|
7.54¢
|
||||||||||||||
|
Regional
(b)
:
|
|||||||||||||||||||
|
Revenue passengers (000)
|
9,495
|
9,452
|
9,015
|
8,306
|
7,677
|
||||||||||||||
|
RPMs (000,000) "traffic"
|
4,101
|
3,720
|
3,238
|
2,940
|
2,661
|
||||||||||||||
|
ASMs (000,000) "capacity"
|
5,127
|
4,662
|
4,002
|
3,648
|
3,261
|
||||||||||||||
|
Load factor
|
80.0%
|
79.8%
|
80.9%
|
80.6%
|
81.6%
|
||||||||||||||
|
Yield
|
23.41¢
|
24.42¢
|
26.37¢
|
27.40¢
|
29.20¢
|
||||||||||||||
|
PRASM
|
18.72¢
|
19.49¢
|
21.34¢
|
22.08¢
|
23.83¢
|
||||||||||||||
|
(a)
|
Capitalized interest was
$17 million
,
$25 million
,
$34 million
,
$20 million
and
$21 million
for
2017
,
2016
,
2015
,
2014
and
2013
.
|
|
(b)
|
Includes flights under Capacity Purchase Agreements operated by SkyWest and PenAir.
|
|
(c)
|
See reconciliation to the most directly related Generally Accepted Accounting Principles (GAAP) measure in the "Results of Operations" section.
|
|
(d)
|
See "Glossary of Terms" for definitions of the abbreviated terms.
|
32
|
|
OVERVIEW
The following Management’s Discussion and Analysis of Financial Condition and Results of Operations (MD&A) is intended to help the reader understand our company, our operations and our present business environment. MD&A is provided as a supplement to – and should be read in conjunction with – our consolidated financial statements and the accompanying notes. All statements in the following discussion that are not statements of historical information or descriptions of current accounting policy are forward-looking statements. Please consider our forward-looking statements in light of the risks referred to in this report’s introductory cautionary note and the risks mentioned in Part I, “Item 1A. Risk Factors.” This overview summarizes the MD&A, which includes the following sections:
|
•
|
Year in Review
—highlights from
2017
outlining some of the major events that happened during the year and how they affected our financial performance.
|
|
•
|
Results of Operations
—an in-depth analysis of our revenues by segment and our expenses from a consolidated perspective for the three years presented in our consolidated financial statements. To the extent material to the understanding of segment profitability, we more fully describe the segment expenses per financial statement line item. Financial and statistical data is also included here. As Virgin America was acquired on December 14, 2016, its financial and operational results are reflected in the year ended December 31, 2017, but not in the comparative prior period. However, for comparability purposes, we have added "Combined Comparative" information for the prior year, which is more fully described below. This section includes forward-looking statements regarding our view of
2018
. Further information about the acquisition of Virgin America can be found in
Note 2
to the consolidated financial statements.
|
|
•
|
Liquidity and Capital Resources
—an overview of our financial position, analysis of cash flows, sources and uses of cash, contractual obligations and commitments and off-balance sheet arrangements.
|
|
•
|
Critical Accounting Estimates
—a discussion of our accounting estimates that involve significant judgment and uncertainties.
|
YEAR IN REVIEW
In
2017
, we expanded our network at a record pace, adding 44 new markets across the network during the year. Additionally, we devoted a significant amount of energy and resources to integrating Alaska and Virgin America. We achieved many integration milestones, including merging many back-office functions, co-locating many stations, and launching technology for front-line employees to enable them to serve our customers seamlessly between carriers.
In
2017
, we posted our
14th
consecutive annual profit on an adjusted basis. Our pretax income was
$1.2 billion
, compared to
$1.3 billion
in 2016. Our
2017
pretax income on an adjusted basis (a non-GAAP financial measure) was
$1.3 billion
, a
decrease
of
9%
from
2016
. Adjusted pretax income for
2017
excludes
$118 million
of merger-related costs associated with our acquisition of Virgin America and
$7 million
of mark-to-market fuel hedge benefit.
The decrease in adjusted pretax income was driven largely by an increase in operating expenses, excluding fuel and special items, of
$1.5 billion
, and an increase in fuel expense of
$616 million
. The increase in operating expense was primarily due to the full-year impact of Virgin America in our financial results. The increased costs were partially offset by an increase in operating revenues of
$2.0 billion
.
The growth in revenues of
$2.0 billion
was driven by the growth in our business, attributable to the inclusion of Virgin America in our results for the full year, as well as our expansion into 44 new markets entered into during the year. On the regional side of our business, Horizon began flying the new Embraer E175 regional jets in
2017
— the first
10
of 33 aircraft scheduled for delivery over a three year period. We believe we have a strong future ahead of us and look forward to the many new opportunities our combined networks will bring our company.
See “Results of Operations” below for further discussion of changes in revenues and operating expenses and our reconciliation of Non-GAAP measures to the most directly comparable GAAP measure.
33
Accomplishments and Highlights
Recognition and Awards - Alaska
|
•
|
Ranked "Highest in Customer Satisfaction Among Traditional Carriers" in 2017 by J.D. Power for the tenth year in a row.
|
|
•
|
Ranked first in the U.S. News & World Report's list of Best Travel Rewards Programs for the third consecutive year.
|
|
•
|
Won the "Best Rewards Program" for Mileage Plan™ for carriers in the "Americas" region in the sixth annual FlyerTalk Award.
|
|
•
|
Mileage Plan™ ranked Best Airline Elite Status Program in the U.S. by The Points Guy.
|
|
•
|
Ranked among Forbes' 2017 "America's Best Employers" for the third year in a row.
|
|
•
|
Received 16th Diamond Award of Excellence from the Federal Aviation Administration, recognizing both Alaska and Horizon's aircraft technicians for their commitment to training.
|
|
•
|
Ranked by AirlineRatings.com as one of only two U.S. airlines in the Top 20 safest airlines in the world.
|
|
•
|
Rated "Best Airline Staff in North America" and "Best Regional Airline in North America" by Skytrax World Airline Awards.
|
|
•
|
Awarded TripAdvisor's 2017 Travelers' Choice Award for second-best midsize and low-cost airlines in North America and one of the top 10 best airlines in the world.
|
|
•
|
Recognized by the Puget Sound Business Journal as the 2017 Board Diversity Champion, as well as by the Women Corporate Directors Global Institute for diversity among our Directors.
|
|
•
|
Ranked as the top U.S. airline in the Dow Jones Sustainability Index (DJSI), receiving perfect scores for “efficiency” and “reliability.”
|
|
•
|
Recognized as No. 1 in fuel efficiency for U.S. airlines by the International Council on Clean Transportation for the 7th consecutive year.
|
|
•
|
Named one of the overall five-star major regional airlines at the Passenger Choice Awards during the APEX EXPO.
|
|
•
|
Ranked fifth of most engaged companies in the U.S. by Forbes Insights, which measured social media engagement, net promoter scores, and year-over-year sales growth.
|
Recognition and Awards - Virgin America
|
•
|
Rated Best U.S. Airline by Conde Nast Traveler in their "Annual Readers' Choice Awards" for the tenth year in a row.
|
|
•
|
Rated Best Domestic Airline in Travel + Leisure "World's Best Awards" for the tenth year in a row.
|
|
•
|
Received a five-star rating for low-cost carrier, and received a top honor with a Passenger Choice Award for “Best Seat Comfort” during the APEX EXPO.
|
Our People and Communities
|
•
|
Awarded
$135 million
in incentive pay to employees for
2017
.
|
|
•
|
Awarded employees a $1,000 bonus in January 2018 in connection with the passing of the Tax Cuts and Jobs Act, amounting to approximately $25 million.
|
|
•
|
Donated over
$14 million
and contributed more than
32,000
volunteer hours to support nonprofits in our local communities, focusing on youth and education, medical (research/transportation) and community outreach.
|
Shareholder Return
In
2017
, we paid cash dividends of
$148 million
and repurchased approximately
981 thousand
shares of our common stock for
$75 million
under the
$1 billion
share repurchase program authorized by our Board of Directors in
August 2015
. As of
December 31, 2017
, the Company has repurchased approximately
5 million
shares for
$388 million
under this program.
34
Since 2007, we have repurchased
60 million
shares of common stock for
$1.6 billion
for an average price of approximately
$26.72
per share. In
2017
, we increased our quarterly dividend
9%
from
$0.275
per share to
$0.300
per share, and, subsequent to
December 31, 2017
, we announced a
7%
increase to
$0.32
per share for 2018. Overall, we returned
$223 million
to shareholders during
2017
. We expect to continue to return capital to shareholders in
2018
, primarily in the form of dividends.
Outlook
In
2018
and beyond, we are focused on successfully completing the integration of Virgin America with Alaska. In January 2018 Alaska and Virgin America received a Single Operating Certificate (SOC), our most significant integration milestone to date. The integration milestones achieved thus far will help to ease our transition to a single Passenger Service System (PSS) on April 25, 2018. This will allow us to provide one reservation system, one website and one inventory of flights to our guests, which will help unlock many of the revenue synergies expected from the acquisition. In conjunction with PSS, at all gates, ticketing and check-in areas, guests will be greeted with Alaska branding.
We will continue to make investments to enhance our onboard guest experience. Some of the more notable projects underway include adding satellite connectivity to our entire Boeing and Airbus fleets to offer high-speed satellite Wi-Fi, further upgrades to our onboard menu offerings, updating and expanding airport lounges in the JFK and Seattle airports, and investment in our Seattle hub airport to open a state-of-the-art 20-gate North Terminal facility.
In 2018, we expect to continue to experience cost pressure, due in large part to pilot wage increases, which became effective in the fourth quarter of 2017, and a new maintenance cost-per-hour agreement that will result in higher maintenance costs in 2018, but will help to reduce the volatility of maintenance expense over the next several years. We also expect to continue to incur further costs associated with the ongoing integration of Virgin America. For the first quarter of 2018, we expect unit revenues (RASM) to decline
3.5%
-
4.5%
and unit costs, excluding fuel and special items (CASM, ex fuel) to increase approximately
6%
. In addition, we expect the price per gallon of jet fuel to increase approximately
21%
from the prior-year period. Based on these current estimates, we are likely to report a loss in the first quarter although we expect our unit costs and unit revenues to improve throughout 2018.
Our priority throughout the integration process is to run two great airlines and to maintain safe and compliant operations, while providing a great experience for our guests. We are particularly focused on merging the Alaska and Virgin America cultures and brands that our guests respect and trust. We intend to minimize any disruption to our guests during our integration efforts by being transparent about our progress and how the changes may affect them. Employee engagement throughout the integration will remain a top priority as well, ensuring that employees remain engaged, informed and excited about the new Company's future. Additionally, we will remain focused on capturing the value and synergies created by combining these two great airlines.
We expect to grow our combined network capacity in
2018
by approximately
7.5%
, compared to a
7.1%
combined growth in
2017
. Current schedules indicate competitive capacity will be roughly
6
points higher in the first quarter of
2018
. We believe that our product, our operation, our engaged employees, our award-winning service, and our competitive Mileage Plan™, combined with our strong balance sheet, give us the ability to compete vigorously in our markets.
35
RESULTS
OF OPERATIONS
ADJUSTED (NON-GAAP) RESULTS AND
PER-SHARE AMOUNTS
We believe disclosure of earnings excluding the impact of merger-related costs, mark-to-market gains or losses or other individual special revenues or expenses is useful information to investors because:
|
•
|
By excluding fuel expense and certain special items (including merger-related costs) from our unit metrics, we believe that we have better visibility into the results of operations and our non-fuel cost initiatives. Our industry is highly competitive and is characterized by high fixed costs, so even a small reduction in non-fuel operating costs can lead to a significant improvement in operating results. In addition, we believe that all domestic carriers are similarly impacted by changes in jet fuel costs over the long run, so it is important for management (and investors) to understand the impact of (and trends in) company-specific cost drivers, such as labor rates and productivity, airport costs, maintenance costs, etc., which are more controllable by management.
|
|
•
|
Cost per ASM (CASM) excluding fuel and certain special items, such as merger-related costs, is one of the most important measures used by management and by the Air Group Board of Directors in assessing quarterly and annual cost performance.
|
|
•
|
Adjusted income before income tax and CASM excluding fuel (and other items as specified in our plan documents) are important metrics for the employee incentive plan, which covers the majority of Air Group employees.
|
|
•
|
CASM excluding fuel and certain special items is a measure commonly used by industry analysts and we believe it is an important metric by which they compare our airlines to others in the industry. The measure is also the subject of frequent questions from investors.
|
|
•
|
Disclosure of the individual impact of certain noted items provides investors the ability to measure and monitor performance both with and without these special items. We believe that disclosing the impact of certain items, such as merger-related costs and mark-to-market hedging adjustments, is important because it provides information on significant items that are not necessarily indicative of future performance. Industry analysts and investors consistently measure our performance without these items for better comparability between periods and among other airlines.
|
|
•
|
Although we disclose our passenger unit revenues, we do not (nor are we able to) evaluate unit revenues excluding the impact that changes in fuel costs have had on ticket prices. Fuel expense represents a large percentage of our total operating expenses. Fluctuations in fuel prices often drive changes in unit revenues in the mid-to-long term. Although we believe it is useful to evaluate non-fuel unit costs for the reasons noted above, we would caution readers of these financial statements not to place undue reliance on unit costs excluding fuel as a measure or predictor of future profitability because of the significant impact of fuel costs on our business.
|
Although we are presenting these non-GAAP amounts for the reasons above, investors and other readers should not necessarily conclude that these amounts are non-recurring, infrequent, or unusual in nature.
2017
COMPARED WITH
2016
Our consolidated net income for
2017
was
$1 billion
, or
$8.35
per diluted share, compared to net income of
$814 million
, or
$6.54
per diluted share, in
2016
. As the acquisition of Virgin America closed on December 14, 2016, our 2016 financial results include Virgin America for the period of December 14, 2016 through December 31, 2016 and the impact of purchase accounting as of December 14, 2016. Refer to the "Critical Accounting Estimates" section for further information regarding purchase accounting.
Excluding the impact of merger-related costs, mark-to-market fuel hedge adjustments and a special tax benefit as a result of tax reform, our adjusted consolidated net income for
2017
was
$823 million
, or
$6.64
per diluted share, compared to an adjusted consolidated net income of
$911 million
, or
$7.32
per share, in
2016
. The following table reconciles our adjusted net income and earnings per diluted share (EPS) during the full year
2017
and
2016
to amounts as reported in accordance with GAAP.
36
|
|
Twelve Months Ended December 31,
|
||||||||||||||
|
|
2017
|
2016
|
|||||||||||||
|
(in millions, except per-share amounts)
|
Dollars
|
Diluted EPS
|
Dollars
|
Diluted EPS
|
|||||||||||
|
Reported GAAP net income and diluted EPS
|
$
|
1,034
|
|
$
|
8.35
|
|
$
|
814
|
|
$
|
6.54
|
|
|||
|
Mark-to-market fuel hedge (benefit)/expense
|
(7
|
)
|
(0.06
|
)
|
(13
|
)
|
(0.11
|
)
|
|||||||
|
Special items—merger-related costs and other
(a)
|
118
|
|
0.95
|
|
117
|
|
0.94
|
|
|||||||
|
Income tax effect on special items and fuel hedge adjustments
(b)
|
(42
|
)
|
(0.34
|
)
|
(24
|
)
|
(0.19
|
)
|
|||||||
|
Special tax (benefit)/expense
(c)
|
(280
|
)
|
(2.26
|
)
|
17
|
|
0.14
|
|
|||||||
|
Non-GAAP adjusted net income and diluted EPS
|
$
|
823
|
|
$
|
6.64
|
|
$
|
911
|
|
$
|
7.32
|
|
|||
|
(a)
|
Refer to
Note 10
to the consolidated financial statement for the description of special items.
|
|
(b)
|
Certain merger-related costs are non-deductible for tax purposes, resulting in a smaller income tax effect for 2016 adjusting items.
|
|
(c)
|
Special tax (benefit)/expense in 2017 is due to the remeasurement of deferred tax liabilities as a result of the Tax Cuts and Jobs Act signed into law on December 22, 2017, offset by certain state tax law enactments. In 2016 it represents discrete impacts of adjustments to our position on income sourcing in various states.
|
CASM is summarized below:
|
|
Twelve Months Ended December 31,
|
|||||||||
|
|
2017
|
|
2016
|
|
% Change
|
|||||
|
Consolidated:
|
||||||||||
|
Total CASM
|
|
10.75
|
¢
|
|
10.38
|
¢
|
3.6
|
%
|
||
|
Less the following components:
|
|
|
|
|
||||||
|
Aircraft fuel, including hedging gains and losses
|
2.33
|
|
1.88
|
|
23.9
|
%
|
||||
|
Special items—merger-related costs and other
(a)
|
0.19
|
|
0.27
|
|
(29.6
|
)%
|
||||
|
CASM, excluding fuel and special items
|
|
8.23
|
¢
|
|
8.23
|
¢
|
—
|
%
|
||
|
|
|
|||||||||
|
Mainline:
|
||||||||||
|
Total CASM
|
|
9.92
|
¢
|
|
9.39
|
¢
|
5.6
|
%
|
||
|
Less the following components:
|
|
|
|
|
||||||
|
Aircraft fuel, including hedging gains and losses
|
2.24
|
|
1.79
|
|
25.1
|
%
|
||||
|
Special items—merger-related costs and other
(a)
|
0.21
|
|
0.30
|
|
(30.0
|
)%
|
||||
|
CASM, excluding fuel and special items
|
|
7.47
|
¢
|
|
7.30
|
¢
|
2.3
|
%
|
||
|
(a)
|
Refer to
Note 10
to the consolidated financial statement for the description of special items.
|
Impact of Accounting Changes
The following discussion of 2017 compared with 2016 results reflects balances as reported within this 10-K. On January 1, 2018 we will implement ASU 2014-09, "Revenue from Contracts with Customers," and ASU 2017-07, "Compensation- Retirement Benefits." We have elected to apply both standards using the full retrospective approach, which will require us to restate prior period financial information under the new standards. When providing forward looking guidance on line items that will be recast under the new standards, we have included provisional recast amounts herein.
Under the new revenue recognition standard, the primary changes to our financial information relate to Mileage Plan™ accounting, ticket breakage, and ancillary revenue geography.
|
•
|
Mileage Plan™ miles earned through travel have historically been accounted for using the incremental cost approach. Under the new standard, we will allocate a portion of the ticket price to deferred revenue.
|
|
•
|
Ticket breakage was historically recognized at time of expiration. Under the new standard, ticket breakage will be recorded based on an estimate at the original departure date.
|
|
•
|
Ancillary revenues related to passenger travel, which were historically presented as Other revenue, will be reclassified to Passenger Revenue.
|
As a result of the new revenue recognition standard, we expect to restate 2017 and 2016 financial information in our future filings. We expect 2017 reported revenues will be reduced by approximately
$41 million
, and reported non-fuel operating costs will increase by approximately
$13 million
, resulting in a net reduction of
$54 million
to reported adjusted pretax profit. We expect a similar impact in 2018.
37
Although less significant, the new retirement benefits accounting standard is also effective January 1, 2018. Under this new standard, all components of net periodic benefit cost will be presented in Nonoperating income (expense), except service cost, which will remain in Wages and benefits. This change has an impact on CASM.
Management believes it is useful to compare forecasted results with the restated results under the new standards, as noted in the impacted areas below. The implementation of the new standards will impact common industry metrics such as PRASM, RASM, and CASM excluding fuel and special items. We will provide restated metrics in a separate filing.
38
OPERATING STATISTICS SUMMARY (unaudited)
Alaska Air Group, Inc.
Below are operating statistics we use to measure performance. As the acquisition of Virgin America closed on December 14, 2016, Consolidated and Mainline amounts presented below include Virgin America results for the
twelve
months ended
December 31, 2017
, but only for the period December 14, 2016 through December 31, 2016 in the
twelve
months ended
December 31, 2016
results below. We often refer to unit revenues and adjusted unit costs, which is a non-GAAP measure.
|
Twelve Months Ended December 31,
|
|||||||||
|
2017
|
2016
|
Change
|
2015
|
Change
|
|||||
|
Consolidated Operating Statistics:
(a)
|
|||||||||
|
Revenue passengers (000)
|
44,034
|
34,289
|
28.4%
|
31,883
|
7.5%
|
||||
|
RPMs (000,000) "traffic"
|
52,338
|
37,209
|
40.7%
|
33,578
|
10.8%
|
||||
|
ASMs (000,000) "capacity"
|
62,072
|
44,135
|
40.6%
|
39,914
|
10.6%
|
||||
|
Load factor
|
84.3%
|
84.3%
|
—
|
84.1%
|
0.2 pts
|
||||
|
Yield
|
13.03¢
|
13.45¢
|
(3.1)%
|
14.27¢
|
(5.7)%
|
||||
|
PRASM
|
10.98¢
|
11.34¢
|
(3.2)%
|
12.01¢
|
(5.6)%
|
||||
|
RASM
|
12.78¢
|
13.44¢
|
(4.9)%
|
14.03¢
|
(4.2)%
|
||||
|
CASM excluding fuel and special items
(b)
|
8.23¢
|
8.23¢
|
—%
|
8.30¢
|
(0.8)%
|
||||
|
Economic fuel cost per gallon
(b)
|
$1.82
|
$1.52
|
19.7%
|
$1.88
|
(19.1)%
|
||||
|
Fuel gallons (000,000)
|
797
|
554
|
43.9%
|
508
|
9.1%
|
||||
|
ASM's per gallon
|
77.9
|
79.7
|
(2.3)%
|
78.6
|
1.4%
|
||||
|
Average number of full-time equivalent employees (FTEs)
|
20,183
|
14,760
|
36.7%
|
13,858
|
6.5%
|
||||
|
Mainline Operating Statistics:
|
|||||||||
|
Revenue passengers (000)
|
34,539
|
24,838
|
39.1%
|
22,869
|
8.6%
|
||||
|
RPMs (000,000) "traffic"
|
48,238
|
33,489
|
44.0%
|
30,340
|
10.4%
|
||||
|
ASMs (000,000) "capacity"
|
56,945
|
39,473
|
44.3%
|
35,912
|
9.9%
|
||||
|
Load factor
|
84.7%
|
84.8%
|
(0.1) pts
|
84.5%
|
0.3 pts
|
||||
|
Yield
|
12.14¢
|
12.24¢
|
(0.8)%
|
12.98¢
|
(5.7)%
|
||||
|
PRASM
|
10.29¢
|
10.38¢
|
(0.9)%
|
10.97¢
|
(5.4)%
|
||||
|
CASM excluding fuel and special items
(b)
|
7.47¢
|
7.30¢
|
2.3%
|
7.39¢
|
(1.2)%
|
||||
|
Economic fuel cost per gallon
(b)
|
$1.82
|
$1.52
|
19.7%
|
$1.87
|
(18.7)%
|
||||
|
Fuel gallons (000,000)
|
706
|
474
|
48.9%
|
439
|
8.0%
|
||||
|
ASM's per gallon
|
80.7
|
83.3
|
(3.1)%
|
81.8
|
1.8%
|
||||
|
Average number of FTEs
|
15,653
|
11,447
|
36.7%
|
10,750
|
6.5%
|
||||
|
Aircraft utilization
|
11.2
|
10.5
|
6.7%
|
10.8
|
(2.8)%
|
||||
|
Average aircraft stage length
|
1,301
|
1,225
|
6.2%
|
1,195
|
2.5%
|
||||
|
Mainline operating fleet at period-end
|
221 a/c
|
218 a/c
|
3 a/c
|
147 a/c
|
71 a/c
|
||||
|
Regional Operating Statistics:
(c)
|
|||||||||
|
Revenue passengers (000)
|
9,495
|
9,452
|
0.5%
|
9,015
|
4.8%
|
||||
|
RPMs (000,000) "traffic"
|
4,101
|
3,720
|
10.2%
|
3,238
|
14.9%
|
||||
|
ASMs (000,000) "capacity"
|
5,127
|
4,662
|
10.0%
|
4,002
|
16.5%
|
||||
|
Load factor
|
80.0%
|
79.8%
|
0.2 pts
|
80.9%
|
(1.1) pts
|
||||
|
Yield
|
23.41¢
|
24.42¢
|
(4.1)%
|
26.37¢
|
(7.4)%
|
||||
|
PRASM
|
18.72¢
|
19.49¢
|
(4.0)%
|
21.34¢
|
(8.7)%
|
||||
|
(a)
|
Except for FTEs, data includes information related to regional CPA flying with Horizon, SkyWest and PenAir.
|
|
(b)
|
See reconciliation of this measure to the most directly related GAAP measure in the "Results of Operations" section.
|
|
(c)
|
Data presented includes information related to regional CPAs.
|
39
We believe that analysis of specific financial and operational results on a combined basis provides more meaningful year-over-year comparisons. The discussion below includes "Combined Comparative" results for
2016
, determined as the sum
of the historical consolidated results of Air Group and Virgin America. Virgin America's financial information has been conformed to reflect Air Group's historical financial statement presentation. This information does not purport to reflect what our financial and operational results would have been had the acquisition been consummated at the beginning of the periods presented.
COMBINED COMPARATIVE OPERATING STATISTICS
|
Twelve Months Ended December 31,
|
|||||||||
|
2017
|
2016 as Reported
|
2016 Virgin America
|
2016 Combined
|
Change
|
|||||
|
Consolidated:
|
|||||||||
|
Revenue passengers (in 000)
|
44,034
|
34,289
|
7,658
|
41,947
|
5.0%
|
||||
|
RPMs (in 000,000)
|
52,338
|
37,209
|
11,545
|
48,754
|
7.4%
|
||||
|
ASMs (in 000,000)
|
62,072
|
44,135
|
13,818
|
57,953
|
7.1%
|
||||
|
Load Factor
|
84.3%
|
84.3%
|
(a)
|
84.1%
|
0.2 pts
|
||||
|
PRASM
|
10.98¢
|
11.34¢
|
(a)
|
11.08¢
|
(0.9)%
|
||||
|
RASM
|
12.78¢
|
13.44¢
|
(a)
|
12.93¢
|
(1.2)%
|
||||
|
CASMex
|
8.23¢
|
8.23¢
|
(a)
|
8.04¢
|
2.4%
|
||||
|
FTEs
|
20,183
|
14,760
|
2,618
|
17,378
|
16.1%
|
||||
|
Mainline:
|
|||||||||
|
RPMs (in 000,000)
|
48,238
|
33,489
|
11,545
|
45,034
|
7.1%
|
||||
|
ASMs (in 000,000)
|
56,945
|
39,473
|
13,818
|
53,291
|
6.9%
|
||||
|
Load Factor
|
84.7%
|
84.8%
|
(a)
|
84.5%
|
0.2 pts
|
||||
|
PRASM
|
10.29¢
|
10.38¢
|
(a)
|
10.34¢
|
(0.5)%
|
||||
|
(a)
|
2016 Combined operating statistics have been recalculated using the combined results.
|
OPERATING REVENUES
Total operating revenues
increased
$2.0 billion
, or
34%
, during
2017
compared to the same period in
2016
. On a Combined Comparative basis, total operating revenues
increased
$438 million
or
6%
. The changes, including the reconciliation of the impact of Virgin America on the comparative results, are summarized in the following table:
|
|
Twelve Months Ended December 31,
|
Change
|
||||||||||||||||||||
|
(in millions)
|
2017
|
2016 as Reported
|
2016 Pre-Acquisition Virgin America
|
2016 Combined
|
$ Combined
|
% Combined
|
||||||||||||||||
|
Passenger
|
||||||||||||||||||||||
|
Mainline
|
$
|
5,858
|
|
$
|
4,098
|
|
$
|
1,414
|
|
$
|
5,512
|
|
$
|
346
|
|
6.3
|
%
|
|||||
|
Regional
|
960
|
|
908
|
|
—
|
|
908
|
|
52
|
|
5.7
|
%
|
||||||||||
|
Total passenger revenue
|
$
|
6,818
|
|
$
|
5,006
|
|
$
|
1,414
|
|
$
|
6,420
|
|
$
|
398
|
|
6.2
|
%
|
|||||
|
Freight and mail
|
114
|
|
108
|
|
—
|
|
108
|
|
6
|
|
5.6
|
%
|
||||||||||
|
Other—net
|
1,001
|
|
817
|
|
150
|
|
967
|
|
34
|
|
3.5
|
%
|
||||||||||
|
Total operating revenues
|
$
|
7,933
|
|
$
|
5,931
|
|
$
|
1,564
|
|
$
|
7,495
|
|
$
|
438
|
|
5.8
|
%
|
|||||
Passenger Revenue
—
Mainline
On a consolidated basis, Mainline passenger revenue for
2017
increased
by
$1.8 billion
, or
43%
on a
44%
increase
in capacity driven by the acquisition of Virgin America, partially offset by a
1%
decrease
in unit revenues compared to
2016
. On a Combined Comparative basis, Mainline passenger revenue
increased
by
$346 million
or
6%
, due to a
7%
increase in capacity, partially offset by a
1%
decrease in unit revenue compared to the combined Mainline results for 2016. The increase in capacity was driven by our continued network expansion and aircraft added to our fleet in the current year. The decrease in PRASM was
40
driven by a decrease in ticket yields on relatively flat load factors. Lower ticket yields (pricing) were impacted, in large part, by our new market growth and by competitor pricing actions felt more acutely in our California markets.
Passenger Revenue
—
Regional
Regional passenger revenue
increased
by
$52 million
, or
6%
, compared to
2016
due to a
10%
increase
in capacity, partially offset by a
4%
decrease
in PRASM compared to
2016
. The increase in capacity is due to an increase in departures from new E175 deliveries, an increase in average aircraft stage length and the annualization of new routes introduced over the past twelve months. The
decrease
in Regional PRASM was primarily driven by the significant growth in our regional business and competitive pricing actions.
Other
—
Net
Other—net revenue
increased
$184 million
, or
23%
, from
2016
, primarily due to increases in frequent flyer program revenue. Frequent flyer program revenue increased
$53 million
or
12%
, due to an increase in miles sold to our affinity card partner in the the current year. On a Combined Comparative basis, Other—net revenue
increased
$34 million
, or
4%
.
Under the new revenue recognition standard, our 2017 recast revenues will decrease by approximately
$41 million
. We expect competitive pressures on unit revenues to continue into 2018. However, given our projected capacity growth, we expect total revenue will increase in 2018 as we expect to grow our capacity approximately
7.5%
.
OPERATING EXPENSES
Total operating expenses
increased
$2.1 billion
, or
46%
, compared to
2016
. On a Combined Comparative basis, total operating expenses
increased
$749 million
, or
13%
primarily as a result of higher wages and benefits and higher fuel costs, among other increases. We believe it is useful to summarize operating expenses as follows, which is consistent with the way expenses are reported internally and evaluated by management:
|
|
Twelve Months Ended December 31,
|
Change
|
||||||||||||||||||||
|
(in millions)
|
2017
|
2016 as Reported
|
2016 Pre-acquisition Virgin America
|
2016 Combined
|
$ Combined
|
% Combined
|
||||||||||||||||
|
Fuel expense
|
$
|
1,447
|
|
$
|
831
|
|
$
|
293
|
|
$
|
1,124
|
|
$
|
323
|
|
28.7
|
%
|
|||||
|
Non-fuel expenses
|
5,108
|
|
3,634
|
|
1,028
|
|
4,662
|
|
446
|
|
9.6
|
%
|
||||||||||
|
Special items—merger-related costs
|
118
|
|
117
|
|
21
|
|
138
|
|
(20
|
)
|
(14.5
|
)%
|
||||||||||
|
Total Operating Expenses
|
$
|
6,673
|
|
$
|
4,582
|
|
$
|
1,342
|
|
$
|
5,924
|
|
$
|
749
|
|
12.6
|
%
|
|||||
Significant operating expense variances from
2016
are more fully described below.
Aircraft Fuel
Aircraft fuel expense includes both
raw fuel expense
(as defined below) and the effect of mark-to-market adjustments to our fuel hedge portfolio included in our consolidated statement of operations as the value of that portfolio increases and decreases. Aircraft fuel expense can be volatile, even between quarters, because it includes these gains or losses in the value of the underlying instrument as crude oil prices and refining margins increase or decrease.
Raw fuel expense
is defined as the price that we generally pay at the airport, or the “into-plane” price, including taxes and fees. Raw fuel prices are impacted by world oil prices and refining costs, which can vary by region in the U.S.
Raw fuel expense
approximates cash paid to suppliers and does not reflect the effect of our fuel hedges.
41
Aircraft fuel expense
increased
$616 million
, or
74%
compared to
2016
. On a Combined Comparative basis, aircraft fuel expense increased
$323 million
, or
29%
. The elements of the change are illustrated in the following table:
|
Twelve Months Ended December 31,
|
|||||||||||||||||||||||
|
2017
|
|
2016 as Reported
|
2016 Combined
|
||||||||||||||||||||
|
(in millions, except for per gallon amounts)
|
Dollars
|
|
Cost/Gal
|
|
Dollars
|
|
Cost/Gal
|
Dollars
|
Cost/Gal
|
||||||||||||||
|
Raw or "into-plane" fuel cost
|
$
|
1,437
|
|
$
|
1.80
|
|
|
$
|
828
|
|
$
|
1.49
|
|
$
|
1,105
|
|
$
|
1.49
|
|
||||
|
Losses on settled hedges
|
17
|
|
0.02
|
|
|
16
|
|
0.03
|
|
34
|
|
0.05
|
|
||||||||||
|
Consolidated economic fuel expense
|
$
|
1,454
|
|
$
|
1.82
|
|
|
$
|
844
|
|
$
|
1.52
|
|
$
|
1,139
|
|
$
|
1.54
|
|
||||
|
Mark-to-market fuel hedge adjustments
|
(7
|
)
|
—
|
|
|
(13
|
)
|
(0.02
|
)
|
(15
|
)
|
(0.02
|
)
|
||||||||||
|
GAAP fuel expense
|
$
|
1,447
|
|
$
|
1.82
|
|
|
$
|
831
|
|
$
|
1.50
|
|
$
|
1,124
|
|
$
|
1.52
|
|
||||
|
Fuel gallons
|
797
|
|
|
|
554
|
|
|
739
|
|
||||||||||||||
On a Combined Comparative basis, raw fuel expense per gallon
increased
21%
due primarily to higher West Coast jet fuel prices. West Coast jet fuel prices are impacted by both the price of crude oil, as well as the refining margins associated with the conversion of crude oil to jet fuel. The increase in raw fuel price per gallon during
2017
was driven by a
38%
increase in refining margins and a
17%
increase in crude oil prices, compared to the prior year. Fuel gallons consumed
increased
by
58 million
, or
8%
, consistent with the increase in capacity of
7%
on a Combined Comparative basis.
We also evaluate economic fuel expense, which we define as raw fuel expense adjusted for the cash we receive from hedge counterparties for hedges that settle during the period, and for the premium expense that we paid for those contracts. A key difference between aircraft fuel expense and economic fuel expense is the timing of gain or loss recognition on our hedge portfolio. When we refer to economic fuel expense, we include gains and losses only when they are realized for those contracts that were settled during the period based on their original contract terms. We believe this is the best measure of the effect that fuel prices have on our business because it most closely approximates the net cash outflow associated with purchasing fuel for our operations. Accordingly, many industry analysts evaluate our results using this measure, and it is the basis for most internal management reporting and incentive pay plans.
Losses recognized for hedges that settled during the year were
$17 million
in
2017
, compared to losses of
$16 million
in
2016
. These amounts represent cash paid for premium expense, offset by any cash received from those hedges at settlement.
As of the date of this filing we expect our economic fuel price per gallon to increase approximately
21%
in the first quarter of
2018
as compared to the first quarter of
2017
due to higher crude oil prices and refining margins. As both oil prices and refining margins are volatile, we are unable to forecast the full-year cost with any certainty.
42
Non-fuel Expense and Non-special items
The table below provides the reconciliation of the impact of Virgin America on the comparative results for each of our operating expense line items, excluding fuel and special items.
|
|
Twelve Months Ended December 31,
|
Change
|
||||||||||||||||||||
|
(in millions)
|
2017
|
2016 as Reported
|
2016 Pre-acquisition Virgin America
|
2016 Combined
|
$ Combined
|
% Combined
|
||||||||||||||||
|
Wages and benefits
|
$
|
1,924
|
|
$
|
1,382
|
|
284
|
|
1,666
|
|
258
|
|
15.5
|
%
|
||||||||
|
Variable incentive pay
|
135
|
|
127
|
|
32
|
|
159
|
|
(24
|
)
|
(15.1
|
)%
|
||||||||||
|
Aircraft maintenance
|
391
|
|
270
|
|
80
|
|
350
|
|
41
|
|
11.7
|
%
|
||||||||||
|
Aircraft rent
|
274
|
|
114
|
|
170
|
|
284
|
|
(10
|
)
|
(3.5
|
)%
|
||||||||||
|
Landing fees and other rentals
|
460
|
|
320
|
|
107
|
|
427
|
|
33
|
|
7.7
|
%
|
||||||||||
|
Contracted services
|
314
|
|
247
|
|
60
|
|
307
|
|
7
|
|
2.3
|
%
|
||||||||||
|
Selling expenses
|
357
|
|
225
|
|
123
|
|
348
|
|
9
|
|
2.6
|
%
|
||||||||||
|
Depreciation and amortization
|
372
|
|
363
|
|
37
|
|
400
|
|
(28
|
)
|
(7.0
|
)%
|
||||||||||
|
Food and beverage service
|
195
|
|
126
|
|
49
|
|
175
|
|
20
|
|
11.4
|
%
|
||||||||||
|
Third-party regional carrier expense
|
121
|
|
95
|
|
—
|
|
95
|
|
26
|
|
27.4
|
%
|
||||||||||
|
Other
|
565
|
|
365
|
|
86
|
|
451
|
|
114
|
|
25.3
|
%
|
||||||||||
|
Total non-fuel, non-special operating expenses
|
$
|
5,108
|
|
$
|
3,634
|
|
$
|
1,028
|
|
$
|
4,662
|
|
$
|
446
|
|
9.6
|
%
|
|||||
Wages and Benefits
Wages and benefits
increased
during
2017
by
$542 million
, or
39%
, compared to
2016
. On a Combined Comparative basis, total wages and benefits
increased
by
$258 million
or
15%
. The primary components of wages and benefits, including a reconciliation of 2016 on a Combined Comparative basis, are shown in the following table:
|
|
Twelve Months Ended December 31,
|
Change
|
||||||||||||||||||||
|
(in millions)
|
2017
|
2016 as Reported
|
2016 Pre-acquisition Virgin America
|
2016 Combined
|
$ Combined
|
% Combined
|
||||||||||||||||
|
Wages
|
$
|
1,468
|
|
$
|
1,022
|
|
$
|
224
|
|
$
|
1,246
|
|
$
|
222
|
|
17.8
|
%
|
|||||
|
Medical and other benefits
|
216
|
|
192
|
|
23
|
|
215
|
|
1
|
|
0.5
|
%
|
||||||||||
|
Defined contribution plans
|
103
|
|
67
|
|
22
|
|
89
|
|
14
|
|
15.7
|
%
|
||||||||||
|
Pension—Defined benefit plans
|
32
|
|
25
|
|
—
|
|
25
|
|
7
|
|
28.0
|
%
|
||||||||||
|
Payroll taxes
|
105
|
|
76
|
|
15
|
|
91
|
|
14
|
|
15.4
|
%
|
||||||||||
|
Total wages and benefits
|
$
|
1,924
|
|
$
|
1,382
|
|
$
|
284
|
|
$
|
1,666
|
|
$
|
258
|
|
15.5
|
%
|
|||||
On a Combined Comparative basis, wages
increased
$222 million
with a
16%
increase in FTEs. The increase in FTEs is attributable to the growth in our business and the growth in McGee Air Services, which has brought certain airport ground service positions in-house that were previously reflected in Contracted Services expense. Additionally, wage rates for pilots at Alaska and Virgin America increased significantly in November 2017 as a result of new contract rates stemming from a decision reached by a third-party arbitration panel during the fourth quarter of
2017
.
Costs associated with our defined contribution plans
increased
$14 million
, or
16%
, on a Combined Comparative basis, due to FTE growth and increased participation throughout all labor groups. Additionally, due to the arbitration decision reached in the fourth quarter of 2017, pilots at Alaska and Virgin America began receiving contributions at a higher rate.
43
Pension expense
increased
28%
compared to the same period in the prior year. The increase is due to the change in certain assumptions used at December 31, 2016, particularly discount rates which were lowered by 60 to 72 basis points, resulting in higher expense recognition in 2017.
Under the new retirement benefits accounting standard, 2017 recast wages and benefits will increase approximately
$7 million
. On a recast basis, we expect wages and benefits to grow at a greater rate than projected capacity growth in
2018
. Alaska and Virgin America pilot wage increases are the primary drivers of this increase. The remainder is due to the expected growth in FTEs to support our capacity growth, along with higher wage rates, medical costs and higher pension costs. Furthermore, we may reach a new agreement with our mainline flight attendants, which would also result in higher wages.
Variable Incentive Pay
Variable incentive pay expense
increased
to
$135 million
in
2017
from
$127 million
in
2016
. On a Combined Comparative basis, variable incentive pay
decreased
$24 million
, or
15%
, due to lower achievement against performance-based pay metrics as compared to the prior year.
Aircraft Maintenance
Aircraft maintenance costs
increased
by
$121 million
, or
45%
, compared to
2016
. On a Combined Comparative basis, aircraft maintenance costs
increased
$41 million
, or
12%
. Maintenance costs
increased
primarily due to timing of scheduled maintenance events in 2017, as well as a power-by-the-hour maintenance agreement that began during the fourth quarter of 2017.
We expect aircraft maintenance expense to increase, consistent with capacity growth in
2018
. We will have an increase in engine maintenance costs primarily due to the full year impact of the power-by-the-hour engine maintenance arrangement on our B737-800 aircraft as noted above, as well as general maintenance expenditures increases as we continue to add capacity to our network.
Aircraft Rent
Aircraft rent expense
increased
$160 million
, or
140%
, compared to
2016
. On a Combined Comparative basis, aircraft rent expense
decreased
$10 million
, or
4%
, primarily due to the resetting of straight-line aircraft rent resulting from purchase price accounting for leases held by Virgin America, partially offset by the addition of
four
A321neos added to our mainline fleet and
eight
E175s added to our regional fleet.
We expect aircraft rent to increase in
2018
at a greater rate than our forecasted capacity growth due to additional leased A321neo and E175 aircraft scheduled for delivery in
2018
.
Landing Fees and Other Rentals
Landing fees and other rental expenses
increased
$140 million
, or
44%
, compared to
2016
. On a Combined Comparative basis, landing fees and other rental expenses
increased
$33 million
, or
8%
, primarily due to increased flying in
2017
, as we increased capacity by
7%
on a combined basis, and entered into 44 new markets.
We expect landing fees and other rental expense to grow at a slightly greater rate than capacity in
2018
as we continue to add capacity in our network and enter new markets. Additionally, we expect continued rate increases at airports across our network.
Contracted Services
Contracted services
increased
$67 million
, or
27%
, when compared to
2016
. On a Combined Comparative basis, contracted services
increased
$7 million
, or
2%
, primarily due to increased flying at stations where we use vendors to assist us. Additionally, wage rates for our vendor employees have increased due to higher minimum wage laws in many locations we serve. These cost increases were partially offset by insourcing some of the ground services at many airports to McGee Air Services, whose costs are now included in other financial statement line items, particularly wages and benefits.
We expect contracted services to increase in
2018
, consistent with our projected capacity growth. The increases are primarily due to higher wage rates in locations where we use vendor employees, and ongoing information technology and facilities projects that we use outside contractors to assist with.
44
Selling Expenses
Selling expenses
increased
by
$132 million
, or
59%
, compared to
2016
. On a Combined Comparative basis, selling expenses
increased
$9 million
, or
3%
, mostly due to increased promotional and advertising activities, as well as new sponsorships which became effective in the current year.
Under the new revenue recognition standard, our 2017 recast selling expense will increase by approximately
$13 million
. We expect selling expense to
decrease
in 2018 on a recast basis, due primarily to a decrease in advertising spend forecasted as well as decreased Mileage Plan partner airline expense due to the termination of certain partnerships with other airlines.
Depreciation and Amortization
Depreciation and amortization expenses
increased
by
$9 million
, or
2%
, compared to
2016
. On a Combined Comparative basis, depreciation and amortization expense
decreased
$28 million
, or
7%
, primarily due to a change in the estimated useful lives of certain B737 operating aircraft and related parts from 20 years to 25 years, which was effective October 1, 2016, partially offset by the addition of
14
B737-900ERs and
10
E175s to our fleet since
December 31, 2016
.
We expect depreciation and amortization expense to increase in line with capacity growth in
2018
compared to
2017
, primarily due to scheduled B737-900ER and E175 aircraft deliveries in
2018
.
Food and Beverage Service
Food and beverage service expense
increased
by
$69 million
, or
55%
, compared to
2016
. On a Combined Comparative basis, food and beverage service expenses
increased
$20 million
, or
11%
, due to the increased number of passengers, premium class offerings and enhancements to our onboard menu offerings to provide higher quality food and beverage products.
We expect food and beverage expenses to increase in line with capacity growth in 2018 compared to
2017
, primarily due to an expected increase in number of passengers as we continue to grow our network and higher product costs.
Third-party regional carrier expense
Third-party regional carrier expense, which represents payments made to SkyWest and PenAir under our CPA agreements,
increased
$26 million
, or
27%
, in
2017
compared to
2016
. The increase is primarily due to the addition of
eight
E175 aircraft operated by SkyWest in the current year.
We expect third-party regional carrier expense to increase in
2018
as we add E175 aircraft to be operated by SkyWest and continue to expand our regional network.
Other Operating Expenses
Other operating expenses
increased
$200 million
, or
55%
, compared to
2016
. On a Combined Comparative basis, other operating expenses
increased
$114 million
, or
25%
, primarily due to higher costs associated with crew costs such as hotels and per diems, training, higher IT costs, an increase in scrapped parts inventory, and higher property taxes.
We expect other operating expenses to increase consistent with capacity growth in
2018
driven primarily by increased personnel costs such as meals and hotels.
Special Items—Merger-Related Costs and Other
We recorded special items of
$118 million
for merger-related costs associated with our acquisition of Virgin America in
2017
, compared to
$117 million
in
2016
, which reflects the results of Virgin America from December 14, 2016 through December 31, 2016, and
$138 million
on a Combined Comparative basis in
2016
. Costs incurred in
2017
consisted primarily of severance and retention costs, and IT integration costs. We expect to continue to incur merger-related costs through 2019.
Consolidated Nonoperating Income (Expense)
During
2017
we recorded nonoperating expense of
$53 million
, compared to nonoperating expense of
$4 million
in
2016
. On a Combined Comparative basis, nonoperating expense
increased
by
$30 million
, primarily due to interest expense incurred in the current year on the debt issued in 2016 to finance the acquisition of Virgin America.
45
ADDITIONAL SEGMENT INFORMATION
Refer to
Note 12
of the consolidated financial statements for a detailed description of each segment. Below is a summary of each segment's profitability.
Mainline
Mainline adjusted pretax profit was
$1.3 billion
in
2017
compared to
$1.3 billion
in
2016
. On a Combined Comparative basis, Mainline adjusted pretax profit decreased by
$253 million
. The table below provides the reconciliation of the impact of Virgin America on the comparative results for our Mainline segment, excluding merger-related costs and mark-to-market fuel-hedge accounting charges:
|
Twelve Months Ended December 31,
|
Change
|
||||||||||||||||||
|
(in millions)
|
2017
|
2016 as Reported
|
2016 Pre-acquisition Virgin America
|
2016 Combined
|
$ Combined
|
||||||||||||||
|
Mainline
|
|||||||||||||||||||
|
Operating revenues
|
$
|
6,890
|
|
$
|
4,940
|
|
$
|
1,564
|
|
$
|
6,504
|
|
$
|
386
|
|
||||
|
Non-fuel, non-special operating expenses
|
4,257
|
|
2,883
|
|
1,028
|
|
3,911
|
|
346
|
|
|||||||||
|
Economic fuel
|
1,282
|
|
719
|
|
293
|
|
1,012
|
|
270
|
|
|||||||||
|
Operating income
|
1,351
|
|
1,338
|
|
243
|
|
1,581
|
|
(230
|
)
|
|||||||||
|
Nonoperating income (expense)
|
(39
|
)
|
3
|
|
(19
|
)
|
(16
|
)
|
(23
|
)
|
|||||||||
|
Pretax profit
|
$
|
1,312
|
|
$
|
1,341
|
|
$
|
224
|
|
$
|
1,565
|
|
$
|
(253
|
)
|
||||
The
$253 million
decrease in Combined Comparative pretax profit was driven by a
$270 million
increase
in Mainline fuel expense, a
$346 million
increase in Mainline non-fuel operating expenses, and a
$23 million
increase in nonoperating expense. These increases were partially offset by a
$386 million
increase in Mainline passenger revenue. Higher raw fuel prices and an increase in gallons consumed to support additional flying, drove the increase in Mainline fuel expense. Non-fuel operating expenses increased due to higher wages to support our growth, and higher operating expenses as described above. Nonoperating expense increased primarily due to increased interest expense. Mainline revenue increased due to higher capacity from new routes added over the past twelve months.
Regional
Our Regional operations contributed a pretax profit of
$15 million
in
2017
compared to
$93 million
in
2016
. The
$78 million
decrease in pretax profit was attributable to
$82 million
higher non-fuel operating expense due in large part to increased capacity, and higher raw fuel costs, partially offset by a
$51 million
increase in operating revenues as described in Passenger Revenue—Regional.
Horizon
Horizon incurred a pretax loss of
$8 million
in
2017
compared to pretax profit of
$14 million
in
2016
. The change was primarily driven by
$20 million
higher non-fuel expenses. Non-fuel expenses increased primarily due to higher wage and training expense as a result of the increase in FTE’s, increased costs associated with flight cancellations, and a
$9 million
ratification bonus expense in connection with the agreement reached with Horizon's pilots.
46
2016
COMPARED WITH
2015
Our consolidated net income for
2016
was
$814 million
, or
$6.54
per diluted share, compared to net income of
$848 million
, or
$6.56
per diluted share, in
2015
. Our financial results include results of Virgin America for the period from December 14, 2016 through December 31, 2016 and the impact of purchase accounting as of December 14, 2016. Refer to the "Critical Accounting Estimates" section for further information regarding purchase accounting.
Excluding the impact of mark-to-market fuel hedge adjustments and special items, our adjusted consolidated net income for
2016
was
$911 million
, or
$7.32
per diluted share, compared to an adjusted consolidated net income of
$842 million
, or
$6.51
per share, in
2015
. The following tables reconcile our adjusted net income and earnings per diluted share (EPS) during the full year 2016 and 2015 to amounts as reported in accordance with GAAP.
|
|
Twelve Months Ended December 31,
|
||||||||||||||
|
|
2016
|
2015
|
|||||||||||||
|
(in millions, except per-share amounts)
|
Dollars
|
Diluted EPS
|
Dollars
|
Diluted EPS
|
|||||||||||
|
Reported GAAP net income and diluted EPS
|
$
|
814
|
|
$
|
6.54
|
|
$
|
848
|
|
$
|
6.56
|
|
|||
|
Mark-to-market fuel hedge (benefit) expense
|
(13
|
)
|
(0.11
|
)
|
—
|
|
—
|
|
|||||||
|
Special items—merger-related costs and other
(a)
|
117
|
|
0.94
|
|
32
|
|
0.25
|
|
|||||||
|
Income tax effect of special items
(b)
|
(24
|
)
|
(0.19
|
)
|
(12
|
)
|
(0.10
|
)
|
|||||||
|
Special income tax (benefit) expense
(c)
|
17
|
|
0.14
|
|
(26
|
)
|
(0.20
|
)
|
|||||||
|
Non-GAAP adjusted net income and diluted EPS
|
$
|
911
|
|
$
|
7.32
|
|
$
|
842
|
|
$
|
6.51
|
|
|||
|
(a)
|
Refer to Note 10 to the consolidated financial statement for the description of special items.
|
|
(b)
|
Certain merger-related costs are non-deductible for tax purposes, resulting in a smaller income tax effect for adjusting items.
|
|
(c)
|
Special tax benefit represents the discrete impacts of adjustments to our position on income sourcing in various states.
|
CASM is summarized below:
|
|
Twelve Months Ended December 31,
|
|||||||||
|
|
2016
|
|
2015
|
|
% Change
|
|||||
|
Consolidated:
|
||||||||||
|
Total operating expenses per ASM (CASM)
|
|
10.38
|
¢
|
|
10.77
|
¢
|
(3.6
|
)%
|
||
|
Less the following components:
|
|
|
||||||||
|
Aircraft fuel, including hedging gains and losses
|
1.88
|
|
2.39
|
|
(21.3
|
)%
|
||||
|
Special items—merger-related costs and other
(a)
|
0.27
|
|
0.08
|
|
237.5
|
%
|
||||
|
CASM, excluding fuel and special items
|
|
8.23
|
¢
|
|
8.30
|
¢
|
(0.8
|
)%
|
||
|
Mainline:
|
||||||||||
|
Total operating expenses per ASM (CASM)
|
|
9.39
|
¢
|
|
9.77
|
¢
|
(3.9
|
)%
|
||
|
Less the following components:
|
|
|
||||||||
|
Aircraft fuel, including hedging gains and losses
|
1.79
|
|
2.29
|
|
(21.8
|
)%
|
||||
|
Special items—merger-related costs and other
(a)
|
0.30
|
|
0.09
|
|
233.3
|
%
|
||||
|
CASM, excluding fuel and special items
|
|
7.30
|
¢
|
|
7.39
|
¢
|
(1.2
|
)%
|
||
|
(a)
|
Refer to Note 11 to the consolidated financial statement for the description of special items.
|
47
OPERATING REVENUES
Total operating revenues
increased
$333 million
, or
6%
, during
2016
compared to the same period in
2015
. The changes are summarized in the following table:
|
|
Twelve Months Ended December 31,
|
|||||||||
|
(in millions)
|
2016
|
2015
|
% Change
|
|||||||
|
Passenger
|
||||||||||
|
Mainline
|
$
|
4,098
|
|
$
|
3,939
|
|
4.0
|
%
|
||
|
Regional
|
908
|
|
854
|
|
6.3
|
%
|
||||
|
Total passenger revenue
|
$
|
5,006
|
|
$
|
4,793
|
|
4.4
|
%
|
||
|
Freight and mail
|
108
|
|
108
|
|
—
|
%
|
||||
|
Other—net
|
817
|
|
697
|
|
17.2
|
%
|
||||
|
Total operating revenues
|
$
|
5,931
|
|
$
|
5,598
|
|
5.9
|
%
|
||
Passenger Revenue—Mainline
Mainline passenger revenue for
2016
increased
by
4%
due to a
10%
increase in capacity, partially offset by a
5%
decrease in PRASM compared to
2015
. The increase in capacity was driven by new routes and growth in our operating fleet. Virgin America capacity from the acquisition date through December 31, 2016 represented approximately 2 points of capacity increase from 2015. The decrease in PRASM was driven by a
6%
decrease in ticket yield due to competitive pressures and our own growth, offset by a slight increase in load factor. Furthermore, the decline in fuel prices during 2016 contributed to lower ticket prices.
Passenger Revenue—Regional
Regional passenger revenue
increased
by
$54 million
, or
6%
, compared to
2015
due to a
17%
increase in capacity, partially offset by a
9%
decrease in PRASM compared to
2015
. The increase in capacity was due to an increase in departures from new E175 deliveries, an increase in average aircraft stage length and the annualization of new routes introduced over the past twelve months. The decrease in PRASM was due to a
7%
decrease in ticket yield, as well as a decrease in load factor of
1.1 point
s. The decrease in yield was due to an increase in competitive capacity in our regional markets and our own growth, as well as an increase in the average trip length of our regional flights.
Other—Net
Other
—
net revenue
increased
$120 million
, or
17%
, from
2015
, primarily due to increases in Mileage Plan™ revenue. Mileage Plan™ revenue increased $100 million, or 30%, due to increased miles sold and improved compensation terms with our Mileage Plan™ affinity credit card partner as a result of a contract extension effective January 1, 2016. Additionally, Mileage Plan™ revenue earned from our partner airlines increased as compared to the prior year.
OPERATING EXPENSES
Total operating expenses
increased
$282 million
, or
7%
, compared to
2015
, primarily as a result of higher wages and benefits and
$117 million
of merger-related costs, partially offset by lower fuel costs. We believe it is useful to summarize operating expenses as follows, which is consistent with the way expenses are reported internally and evaluated by management:
|
|
Twelve Months Ended December 31,
|
|||||||||
|
(in millions)
|
2016
|
2015
|
% Change
|
|||||||
|
Fuel expense
|
$
|
831
|
|
$
|
954
|
|
(12.9
|
)%
|
||
|
Non-fuel expenses
|
3,634
|
|
3,314
|
|
9.7
|
%
|
||||
|
Special items
|
117
|
|
32
|
|
265.6
|
%
|
||||
|
Total Operating Expenses
|
$
|
4,582
|
|
$
|
4,300
|
|
6.6
|
%
|
||
Significant operating expense variances from
2015
are more fully described below.
48
Wages and Benefits
Wages and benefits
increased
during
2016
by
$128 million
, or
10%
, compared to
2015
. The primary components of wages and benefits are shown in the following table:
|
|
Twelve Months Ended December 31,
|
|||||||||
|
(in millions)
|
2016
|
2015
|
% Change
|
|||||||
|
Wages
|
$
|
1,022
|
|
$
|
945
|
|
8.1
|
%
|
||
|
Medical and other benefits
|
192
|
|
153
|
|
25.5
|
%
|
||||
|
Defined contribution plans
|
67
|
|
60
|
|
11.6
|
%
|
||||
|
Pension—defined benefit plans
|
25
|
|
28
|
|
(10.7
|
)%
|
||||
|
Payroll taxes
|
76
|
|
68
|
|
11.8
|
%
|
||||
|
Total wages and benefits
|
$
|
1,382
|
|
$
|
1,254
|
|
10.2
|
%
|
||
Wages
increased
8%
on a
7%
increase in FTEs. The increase in wages was primarily attributable to FTE growth to support our growth and an increase in the average wages per employee.
Medical and other benefits increased 25% compared to the prior year. The increase was primarily due to an increase in the number of employees and high-cost medical claims.
Defined contribution plans increased
12%
due to FTE growth and increased participation throughout all labor groups.
Pension expense decreased 11%, compared to the same period in the prior year. The decrease was due to a change in several assumptions used at December 31, 2015, including a higher discount rate, updated retirement age assumptions, future salary increase assumptions and others that resulted in lower expense recognition in 2016.
Variable Incentive Pay
Variable incentive pay expense increased to
$127 million
in
2016
from
$120 million
in
2015
. The increase was primarily due to a higher wage base.
Aircraft Fuel
Aircraft fuel expense
decreased
$123 million
, or
13%
, compared to
2015
. The elements of the change are summarized in the following table:
|
Twelve Months Ended December 31,
|
|||||||||||||||
|
2016
|
2015
|
||||||||||||||
|
(in millions, except for per gallon amounts)
|
Dollars
|
|
Cost/Gal
|
|
Dollars
|
|
Cost/Gal
|
||||||||
|
Raw or "into-plane" fuel cost
|
$
|
828
|
|
$
|
1.49
|
|
|
$
|
935
|
|
$
|
1.84
|
|
||
|
Losses on settled hedges
|
16
|
|
0.03
|
|
|
19
|
|
0.04
|
|
||||||
|
Consolidated economic fuel expense
|
$
|
844
|
|
$
|
1.52
|
|
|
$
|
954
|
|
$
|
1.88
|
|
||
|
Mark-to-mark fuel hedge adjustments
|
(13
|
)
|
(0.02
|
)
|
|
—
|
|
—
|
|
||||||
|
GAAP fuel expense
|
$
|
831
|
|
$
|
1.50
|
|
|
$
|
954
|
|
$
|
1.88
|
|
||
|
Fuel gallons
|
554
|
|
|
|
508
|
|
|
||||||||
Fuel gallons consumed increased
9%
in line with the
11%
increase capacity, partially offset by a
1%
improvement in fuel efficiency as measured by ASMs per gallon.
The raw fuel price per gallon decreased 19% as a result of lower West Coast jet fuel prices. West Coast jet fuel prices are impacted by both the price of crude oil and the refining margins associated with the conversion of crude oil to jet fuel. The decrease in raw fuel price per gallon during
2016
was due to a decline in crude oil prices of 11% and a decrease in refining margins of 36%, when compared to the prior year.
49
Losses recognized for hedges that settled during the year were
$16 million
in
2016
, compared to losses of
$19 million
in
2015
. These amounts represent cash paid for premium expense, offset by any cash received from those hedges at settlement.
Aircraft Maintenance
Aircraft maintenance costs
increased
by
$17 million
, or
7%
, compared to
2015
. Maintenance costs increased primarily due to more engine and airframe maintenance events than in 2015. Additionally, in 2015 we received vendor credits, which offset expense, for engine maintenance that had been previously completed on the B737 fleet.
Aircraft Rent
Aircraft rent expense increased by $9 million, or 9%, compared to 2015, primarily due to the addition of rent expense on the 53 Airbus aircraft leased by Virgin America for the period December 14, 2016 to December 31, 2016.
Landing Fees and Other Rentals
Landing fees and other rental expenses
increased
$24 million
, or
8%
, primarily due to increased flying in
2016
as we increased capacity and entered into new markets.
Contracted Services
Contracted services
increased
$33 million
, or
15%
, when compared to
2015
. The increase was primarily due to increased flying at stations where we use vendors to assist us. Additionally, wage rates for our vendor employees have increased due in part to higher minimum wage laws in many locations we serve. We also had several information technology and facilities projects that required contracted support.
Selling Expenses
Selling expenses
increased
by
$14 million
, or
7%
, compared to
2015
, mostly due to increased promotional and advertising activities, as well as new sponsorships which became effective in 2016.
Depreciation and Amortization
Depreciation and amortization expenses
increased
by
$43 million
, or
13%
, compared to
2015
. The increase was primarily due to the addition of 19 B737-900ERs to our fleet since December 31, 2015, partially offset by a change in the estimated useful lives of certain B737 operating aircraft and related parts from 20 years to 25 years, which became effective October 1, 2016.
Food and Beverage Service
Food and beverage service expenses increased by
$13 million
, or
12%
, due to the increased number of passengers and upgrades to our onboard menu, offering higher quality food and beverage products.
Third-Party Regional Carrier Expense
Third-party regional carrier expense, which represents payments made to SkyWest and PenAir under our CPAs,
increased
$23 million
, or
32%
, in
2016
compared to
2015
. The increase was primarily due to the significant increase in regional capacity in 2016 through the introduction of E175 flying.
Other Operating Expenses
Other operating expenses
increased
$9 million
, or
3%
, compared to
2015
. The increase was primarily due to increases in property and other taxes, personnel costs for our flight crews and an increase in fines and penalties.
Special Items—Merger-Related Costs and Other
We recorded special items of
$117 million
for merger-related costs associated with our acquisition of Virgin America. These costs consisted primarily of legal expenses, investment banking fees and severance costs. Our 2015 special items of $32 million consisted of a non-cash pension settlement expense and costs related to ongoing litigation.
50
Consolidated Nonoperating Income (Expense)
During
2016
, we recorded nonoperating expense of
$4 million
, compared to nonoperating income of
$14 million
in
2015
. In
2016
, we incurred more interest expense associated with the financing obtained to fund the acquisition of Virgin America. This expense was partially offset by additional interest income earned during the period we held those funds in advance of the acquisition close date.
ADDITIONAL SEGMENT INFORMATION
Refer to
Note 12
of the consolidated financial statements for a detailed description of each segment. Below is a summary of each segments' profitability.
Mainline
Pretax profit for Mainline was
$1.3 billion
in
2016
compared to
$1.2 billion
in
2015
. This segment includes financial results of Virgin America from the date of acquisition through December 31, 2016. The
$135 million
increase was due to an increase in operating revenues of
$277 million
, offset by an increase in operating expenses of
$126 million
. Revenue growth was primarily driven by the
$159 million
increase in passenger revenues and the $100 million increase in Mileage Plan™ revenue, both described previously. Growth in operating expenses was due to higher wages to support our network growth, higher ramp and passenger handling due to increased flying and higher wage rates at stations where we use vendors to assist us, higher depreciation related to our fleet growth, and selling expenses related to increased advertising. Economic fuel cost, as defined above, decreased due to lower raw fuel costs and increased fuel efficiency, slightly offset by an 8% increase in consumption.
Regional
Pretax profit for Regional was
$93 million
in
2016
compared to
$105 million
in
2015
. The
$12 million
decrease in pretax profit was driven by a
$74 million
increase in non-fuel operating expenses in 2016 to support additional departures, partially offset by a
$56 million
increase in revenue and a
$6 million
decrease in fuel expense when compared to the prior year period.
Horizon
Pretax profit for Horizon was
$14 million
in
2016
compared to
$28 million
in
2015
. CPA Revenues (100% of which are from Alaska and eliminated in consolidation) increased due to additional capacity added in 2016. The
$32 million
increase in Horizon's non-fuel operating expenses was largely driven by higher medical costs due to an increased number of large medical claims, increased volume of engine overhaul and heavy airframe work, employee signing bonuses and overhead restructuring costs.
LIQUIDITY AND CAPITAL RESOURCES
Our primary sources of liquidity are:
|
•
|
Our existing cash and marketable securities balance of
$1.6 billion
, and our expected cash from operations;
|
|
•
|
Our
72
unencumbered aircraft in the operating fleet as of
December 31, 2017
, that could be financed, if necessary; and
|
|
•
|
Our combined bank line-of-credit facilities, with no outstanding borrowings, of
$400 million
. Information about these facilities can be found in Note 5 to the consolidated financial statements.
|
In
2017
, we took delivery of
14
B737-900ER and
10
E175 aircraft and made debt payments totaling
$397 million
. We also continued to return capital to our shareholders by paying dividends totaling
$148 million
and repurchasing
$75 million
of our common stock. Because of our strong balance sheet and financial performance, we are one of only three airlines in the U.S. with investment grade credit ratings.
We believe that our current cash and marketable securities balance combined with future cash flows from operations and other sources of liquidity will be sufficient to fund our operations and meet our debt payment obligations for the foreseeable future.
51
In our cash and marketable securities portfolio, we invest only in securities that meet our primary investment strategy of maintaining and securing investment principal. The portfolio is managed by reputable firms that adhere to our investment policy that sets forth investment objectives, approved and prohibited investments, and duration and credit quality guidelines. Our policy, and the portfolio managers, are continually reviewed to ensure that the investments are aligned with our strategy.
The table below presents the major indicators of financial condition and liquidity:
|
(in millions, except per share and debt-to-capital amounts)
|
December 31, 2017
|
December 31, 2016
|
Change
|
||
|
Cash and marketable securities
|
$1,621
|
$1,580
|
$41
|
||
|
Cash, marketable securities and unused lines of credit as a percentage of trailing twelve months revenue
|
25%
|
31%
|
(6) pts
|
||
|
Long-term debt, net of current portion
|
2,262
|
2,645
|
(383)
|
||
|
Shareholders’ equity
|
3,721
|
2,931
|
790
|
||
|
Long-term debt-to-capital including net present value of aircraft operating lease payments
(a)
|
51%
|
59%
|
(8) pts
|
||
|
(a)
|
Calculated using the present value of remaining aircraft lease payments for aircraft that are in our operating fleet as of the balance sheet date.
|
The following discussion summarizes the primary drivers of the increase in our cash and marketable securities balance and our expectation of future cash requirements.
ANALYSIS OF OUR CASH FLOWS
Cash Provided by Operating Activities
Net cash provided by operating activities was
$1.6 billion
in
2017
compared to
$1.4 billion
in
2016
. The increase of
$204 million
is primarily due to an increase in our net income.
In
2016
, we generated
$1.4 billion
in operating cash flows compared to
$1.6 billion
in
2015
. The decrease of
$200 million
was due to a decline in operating results primarily driven by an increase in non-fuel operating expenses—including
$117 million
million in merger-related costs associated with the acquisition of Virgin America—partially offset by higher revenues and lower fuel costs.
We typically generate positive cash flows from operations, and expect to use that cash flow to buy aircraft and capital equipment, to make debt payments, and to return capital to shareholders. During 2016, we paused our share repurchase program as we prepared for the acquisition of Virgin America. We resumed our share repurchase program in the second quarter of 2017.
Cash Used in Investing Activities
Cash used in investing activities was
$1.1 billion
during
2017
, compared to
$2.6 billion
in
2016
. In
2016
, cash from investing activities included approximately
$2 billion
of cash paid for the acquisition of Virgin America, which drove a decrease in cash used for investing activities in
2017
when compared to the prior year. Our capital expenditures were
$1 billion
, or
$348 million
higher
than in
2016
primarily as a result of the purchase of more aircraft in the current year. During
2017
we took delivery of
14
B737-900ERs and
10
E715 aircraft. This compares to the delivery of
19
B737-900ERs in the prior year. Our future expected capital expenditures are summarized in the Contractual Obligations and Commitments section.
Cash used in investing activities was
$2.6 billion
during
2016
, compared to
$930 million
in
2015
. We used
$2 billion
to acquire Virgin America, representing
$2.6 billion
consideration paid, offset by
$645 million
of cash acquired. Our capital expenditures were
$678 million
in
2016
,
$153 million
lower than in 2015.
52
Cash Provided by Financing Activities
Cash used in financing activities was
$592 million
during
2017
, compared to cash provided by financing activities of
$1.5 billion
in
2016
. During the year, we made debt payments of
$397 million
, repurchased
$75 million
of our common stock and paid cash dividends of
$148 million
. In
2016
, we secured debt proceeds of
$2 billion
for the acquisition of Virgin America, made debt payments of
$249 million
, stock repurchases of
$193 million
and made cash dividend payments of
$136 million
. In
2015
, we made debt payments of
$116 million
, stock repurchases of
$505 million
and cash dividend payments of
$102 million
.
We plan to meet our future capital and operating commitments through our cash and investments on hand, internally generated cash from operations, along with additional debt financing if necessary.
Bank Lines of Credit
We have
three
credit facilities with availability totaling
$475 million
, including one
$250 million
credit facility, one
$150 million
credit facility, and one
$75 million
credit facility. We have secured letters of credit against the
$75 million
facility but have no plans to borrow using either of the
two
remaining facilities.
CONTRACTUAL OBLIGATIONS AND COMMITMENTS
Aircraft Purchase and Lease Commitments
As of
December 31, 2017
, we have firm orders to purchase or lease
85
aircraft. We also have cancelable purchase commitments for
30
Airbus A320neo aircraft with deliveries from
2020
through
2022
. We could incur a loss of pre-delivery payments and credits of up to
$15 million
as a cancellation fee. We also have options to acquire up to
37
additional B737 aircraft with deliveries from
2020
through
2024
and
30
E175 aircraft with deliveries from
2020
to
2022
. In addition to the
23
E175 aircraft currently operated by SkyWest in our regional fleet, we have firm orders to lease
12
E175 aircraft with deliveries in
2018
, and options in future periods to add regional capacity by having SkyWest operate up to
eight
more E175 aircraft.
We expect capital expenditures to be approximately
$1 billion
in
2018
and approximately
$750 million
in
2019
and
2020
. We currently expect delivery of
eight
owned Mainline jet aircraft and
13
owned regional jet aircraft in
2018
.
The following table summarizes our expected fleet count by year, as of
February 14, 2018
:
|
|
Actual Fleet Count
|
Contractual Deliveries
(a)
|
|||||||||||||||
|
Aircraft
|
Dec 31, 2016
|
Dec 31, 2017
|
2018 Changes
|
Dec 31, 2018
|
2019 Changes
|
Dec 31, 2019
|
|||||||||||
|
B737 Freighters
|
6
|
|
3
|
|
—
|
|
3
|
|
—
|
|
3
|
|
|||||
|
B737 Passenger Aircraft
|
149
|
|
151
|
|
8
|
|
159
|
|
13
|
|
172
|
|
|||||
|
Airbus Passenger Aircraft
|
63
|
|
67
|
|
4
|
|
71
|
|
1
|
|
72
|
|
|||||
|
Total Mainline Fleet
|
218
|
|
221
|
|
12
|
|
233
|
|
14
|
|
|
247
|
|
||||
|
Q400
(b)
|
52
|
|
50
|
|
(13
|
)
|
37
|
|
(10
|
)
|
27
|
|
|||||
|
E175
(b)
|
15
|
|
33
|
|
25
|
|
58
|
|
10
|
|
68
|
|
|||||
|
Total Regional Fleet
|
67
|
|
83
|
|
12
|
|
95
|
|
—
|
|
95
|
|
|||||
|
Total
|
285
|
|
304
|
|
24
|
|
328
|
|
14
|
|
342
|
|
|||||
|
(a)
|
The expected fleet counts at
December 31, 2018
and
2019
are subject to change.
We intend to reduce the capital investment spend driven by fleet counts above, specifically in 2018, 2019 and 2020, which may require deferral of certain aircraft deliveries.
|
|
(b)
|
Aircraft are either owned or leased by Horizon or operated under capacity purchase agreement with a third party.
|
For future firm orders and option exercises, we may finance the aircraft through cash from operations, long-term debt, or lease arrangements.
53
Future Fuel Hedge Positions
All of our future oil positions are call options, which are designed to effectively cap the cost of the crude oil component of our jet fuel purchases. With call options, we are hedged against volatile crude oil price increases; and, during a period of decline in crude oil prices, we only forfeit cash previously paid for hedge premiums. Our crude oil positions are as follows:
|
|
Approximate % of Expected Fuel Requirements
|
Weighted-Average Crude Oil Price per Barrel
|
Average Premium Cost per Barrel
|
||
|
First Quarter 2018
|
50%
|
$62
|
$2
|
||
|
Second Quarter 2018
|
50%
|
$63
|
$1
|
||
|
Third Quarter 2018
|
40%
|
$62
|
$2
|
||
|
Fourth Quarter 2018
|
30%
|
$62
|
$2
|
||
|
Full Year 2018
|
42%
|
$62
|
$2
|
||
|
First Quarter 2019
|
20%
|
$64
|
$1
|
||
|
Second Quarter 2019
|
10%
|
$65
|
$2
|
||
|
Full Year 2019
|
7%
|
$65
|
$2
|
||
Contractual Obligations
The following table provides a summary of our obligations as of
December 31, 2017
. For agreements with variable terms, amounts included reflect our minimum obligations.
|
(in millions)
|
2018
|
2019
|
2020
|
2021
|
2022
|
Beyond
|
Total
|
||||||||||||||||||||
|
Current and long-term debt obligations
|
$
|
310
|
|
$
|
393
|
|
$
|
449
|
|
$
|
414
|
|
$
|
247
|
|
$
|
768
|
|
$
|
2,581
|
|
||||||
|
Operating lease commitments
(a)
|
431
|
|
423
|
|
391
|
|
338
|
|
296
|
|
1,163
|
|
3,042
|
|
|||||||||||||
|
Aircraft maintenance deposits
(b)
|
61
|
|
65
|
|
68
|
|
64
|
|
52
|
|
39
|
|
349
|
|
|||||||||||||
|
Aircraft purchase commitments
(c)
|
955
|
|
816
|
|
377
|
|
268
|
|
193
|
|
145
|
|
2,754
|
|
|||||||||||||
|
Interest obligations
(d)
|
89
|
|
81
|
|
64
|
|
47
|
|
35
|
|
69
|
|
385
|
|
|||||||||||||
|
Aircraft maintenance and parts management
|
98
|
|
102
|
|
105
|
|
121
|
|
76
|
|
80
|
|
582
|
|
|||||||||||||
|
Other obligations
|
136
|
|
158
|
|
166
|
|
172
|
|
180
|
|
1,099
|
|
1,911
|
|
|||||||||||||
|
Total
|
$
|
2,080
|
|
$
|
2,038
|
|
$
|
1,620
|
|
$
|
1,424
|
|
$
|
1,079
|
|
$
|
3,363
|
|
$
|
11,604
|
|
||||||
|
(a)
|
Operating lease commitments generally include aircraft operating leases, airport property and hangar leases, office space, and other equipment leases. Included here are E175 aircraft operated by SkyWest under a capacity purchase agreement.
|
|
(b)
|
Aircraft maintenance deposits relate to leased Airbus aircraft, and the power-by-the-hour agreement for the B737-800 fleet.
|
|
(c)
|
Represents non-cancelable contractual payment commitments for aircraft and engines. We intend to reduce the capital investment from these levels, specifically in 2018, 2019 and 2020, which may require deferral of certain aircraft deliveries.
|
|
(d)
|
For variable-rate debt, future obligations are shown above using interest rates forecast as of
December 31, 2017
.
|
Defined Benefit Pensions
The table above excludes contributions to our various pension plans, for which there are no minimum required contributions given the funded status of the plans. The unfunded liability for our qualified defined-benefit pension plans was
$304 million
at
December 31, 2017
, compared to a
$197 million
unfunded position at
December 31, 2016
. This results in an
87%
funded status on a projected benefit obligation basis compared to
90%
funded as of
December 31, 2016
. We contributed approximately
$15 million
in
2017
to the plans.
Credit Card Agreements
We have agreements with a number of credit card companies to process the sale of tickets and other services. Under these agreements, there are material adverse change clauses that, if triggered, could result in the credit card companies holding back a reserve from our credit card receivables. Under one such agreement, we could be required to maintain a reserve if our credit rating is downgraded to or below a rating specified by the agreement or our cash and marketable securities balance fell below $500 million. Under another such agreement, we could be required to maintain a reserve if our cash and marketable securities balance fell below $500 million. We are not currently required to maintain any reserve under these agreements, but if we were, our financial position and liquidity could be materially harmed.
54
Deferred Income Taxes
For federal income tax purposes, the majority of our assets are fully depreciated over a seven-year life using an accelerated depreciation method or bonus depreciation, if available. For financial reporting purposes, the majority of our assets are depreciated over 15 to 25 years to an estimated salvage value using the straight-line basis. This difference has created a significant deferred tax liability. At some point in the future the depreciation basis will reverse, potentially resulting in an increase in income taxes paid.
While it is possible that we could have material cash obligations for this deferred liability at some point in the future, we cannot estimate the timing of long-term cash flows with reasonable accuracy. Taxable income and cash taxes payable in the short-term are impacted by many items, including the amount of book income generated (which can be volatile depending on revenue and fuel prices), usage of net operating losses, whether "bonus depreciation" provisions are available, any future tax reform efforts at the federal level, as well as other legislative changes that are beyond our control.
In
2017
, we made tax payments, net of refunds, totaling
$177 million
, and had an effective tax rate of
14.3%
largely due to the impact of the Tax Cuts and Jobs Act. We expect our effective tax rate to be approximately 24.5% for 2018 and the effective rate of cash paid for income taxes to be approximately 10%-15% of book income, although these estimates are subject to change. We believe that we will have the liquidity available to make our future tax payments.
CRITICAL ACCOUNTING ESTIMATES
The discussion and analysis of our financial position and results of operations in this MD&A are based upon our consolidated financial statements. The preparation of these financial statements requires us to make estimates and judgments that affect our financial position and results of operations. See
Note 1
to the consolidated financial statements for a description of our significant accounting policies.
Critical accounting estimates are defined as those that reflect significant management judgment and uncertainties and that potentially may lead to materially different results under varying assumptions and conditions. Management has identified the following critical accounting estimates and has discussed the development, selection and disclosure of these policies with our audit committee.
FREQUENT FLYER PROGRAMS
Alaska's Mileage Plan™ loyalty program awards miles to members who fly on our airlines and our airline partners. We also sell services, including miles for transportation, to non-airline partners, such as hotels, car rental agencies and a major bank that offers Alaska affinity credit cards. In either case, the outstanding miles may be redeemed for travel on our airlines or any of our airline partners. As long as the Mileage Plan™ is in existence, we have an obligation to provide this future travel.
For miles earned by guests who fly on us or our airline partners, we recognize a liability and a corresponding selling expense representing the incremental cost associated with the obligation to provide travel in the future. For services sold through one of our non-airline partners, the sales proceeds that represent award transportation and certificates for discounted companion travel are deferred and recognized when the transportation is delivered, and the remaining components are recorded as commission in other—net revenue in the period the services are performed. Commission revenue recognized for the years ended
December 31, 2017
,
2016
and
2015
was
$396 million
,
$329 million
and
$280 million
, respectively. The deferred revenue is recognized as passenger revenue when the award travel occurs, or the miles expire, and as other
—
net revenue for awards issued and flown on partner airlines.
At
December 31, 2017
, we had approximately
220 billion
miles and points outstanding, resulting in an aggregate liability and deferred revenue balance of
$1.2 billion
. Both the liability and the deferred revenue are determined based on several assumptions that require significant management judgment to estimate and formulate. There are uncertainties inherent in these estimates. Therefore, different assumptions could affect the amount and/or timing of revenue recognition or expenses. The most significant assumptions in accounting for the Mileage Plan™ are described below.
55
|
1.
|
The rate at which we defer sales proceeds related to services sold through non-airline partners:
|
We use the relative selling price method for the deferral of sales proceeds. For contracts that were modified after the effective date of Accounting Standards Update 2009-13, "Multiple-Deliverable Revenue Arrangements—a consensus of the FASB Emerging Issues Task Force" (ASU 2009-13), we determined our best estimate of selling price by considering multiple inputs and methods including, but not limited to, the estimated selling price of comparable travel, discounted cash flows, brand value, published selling prices, number of miles awarded and the number of miles redeemed. We estimated the selling prices and volumes over the terms of the agreements in order to determine the allocation of proceeds to each of the multiple deliverables. This relative allocation is evaluated annually and updated according to changes in the assumptions of the volume of related deliverables. A 1% shift between the allocation of cash proceeds to travel deliverables from marketing deliverables would defer the timing of revenue recognition by approximately
$9 million
.
|
2.
|
The number of miles that will not be redeemed for travel (breakage):
|
The liability for outstanding Mileage Plan™ mileage credits includes all mileage credits that are expected to be redeemed, including mileage credits earned by members whose mileage account balances have not yet reached the minimum mileage credit level to redeem an award. Our estimate of the number of miles that will not be redeemed (breakage) considers historical activity in our members’ accounts and other factors. Based on statistical analysis of historical data, our current breakage rate is
17.4%
. A hypothetical 1% change in our estimate of breakage has approximately a
$10 million
effect on the liability.
|
3.
|
The number of miles used per award:
|
We estimate how many miles will be used per award. For example, our members may redeem credit for award travel to various locations or choose between a highly restricted award and an unrestricted award. Our estimates are based on the current requirements in our Mileage Plan™ program and historical award redemption patterns.
|
4.
|
The number of awards redeemed for travel on our airlines versus other airlines:
|
The cost for us to carry an award passenger is typically lower than the cost we will pay to our travel partners. We estimate the number of awards that will be redeemed on our airlines versus on our travel partners and accrue the estimated costs based on historical redemption patterns. If the number of awards redeemed on our travel partner is higher or lower than estimated, we may need to adjust our liability and corresponding expense.
|
5.
|
The costs that will be incurred to provide award travel for miles earned by guests who fly on us or our airline partners:
|
When a frequent flyer travels on his or her award ticket on one of our airlines, incremental costs such as food, fuel and insurance are incurred to carry that passenger. We estimate what these costs will be (excluding any contribution to overhead and profit) and accrue a liability. If the guest travels on another airline on an award ticket, we often must pay the other airline for carrying the guest. The other airline costs are based on negotiated agreements and are often substantially higher than the costs we would incur to carry that guest. We estimate how much we will pay to other airlines for future travel awards based on historical redemptions and settlements with other carriers and accrue a liability accordingly. The costs actually incurred by us or paid to other airlines may be higher or lower than the costs that were estimated and accrued, and therefore we may need to adjust our liability and recognize a corresponding expense.
We regularly review significant Mileage Plan™ assumptions and change our assumptions if facts and circumstances indicate that a change is necessary. Any such change in assumptions could have a significant effect on our financial position and results of operations.
See further discussion below for the impact to the accounting of frequent flyer programs due to the new revenue recognition accounting standard.
PENSION PLANS
Our actuarial estimates of pension liability, the related expense and the associated significant assumptions are discussed in
Note 7
to the consolidated financial statements.
The calculation of pension expense and the corresponding liability requires the use of a number of key assumptions, including the expected long-term rate of return on plan assets and the assumed discount rates to be used in the calculation of the projected
56
benefit obligation and the interest and service cost. Changes in these assumptions can result in different expense and liability amounts, and future actual experience can differ from these assumptions.
Pension liability and future pension expense decrease as the discount rate used for the obligation increases. We discounted future pension obligations using rates between
3.69%
and
3.78%
at
December 31, 2017
and between
4.29%
and
4.50%
at
December 31, 2016
. The discount rates were determined using current rates earned on high-quality, long-term bonds with maturities that correspond with the estimated cash distributions from each
one
of the defined-benefit pension plans. The discount rates we use are based on a yield curve that uses a pool of higher-yielding bonds estimated to be more in line with settlement rates, as we have taken steps to ultimately terminate or settle plans that are frozen and move toward freezing benefits in active plans in the future. If the discount rate decreased by
0.5%
, our projected benefit obligation at
December 31, 2017
would increase by approximately
$163 million
.
Pension expense normally increases as the expected rate of return on pension plan assets decreases. As of
December 31, 2017
, we estimate that the pension plan assets will generate long-term rates of return between
4.25%
and
5.50%
, which compares to
5.5%
and
6.00%
at
December 31, 2016
. We regularly review the actual asset allocation and periodically rebalance investments as appropriate. This expected long-term rate of return on plan assets at
December 31, 2017
is based on an allocation of U.S. and non-U.S. equities, U.S. fixed-income securities, and real estate. A decrease in the expected long-term rate of return of
0.5%
would increase our estimated
2018
pension expense by approximately
$10 million
.
All of our defined-benefit pension plans are now closed to new entrants. Additionally, benefits in our non-union defined-benefit plans were frozen January 1, 2014.
Future changes in plan asset returns, assumed discount rates and various other factors related to the participants in our pension plans will impact our future pension expense and liabilities. We cannot predict what these factors will be in the future.
See further discussion below for the impact to the accounting of pension plans due to the new retirement benefits accounting standard.
BUSINESS COMBINATION ACCOUNTING, GOODWILL AND INTANGIBLES
To record the value of assets acquired and liabilities assumed as a result of our acquisition of Virgin America on December 14, 2016, we have performed a purchase price allocation utilizing the best information available to management. The purchase price allocation is final as of December 14, 2017. The fair values of the assets acquired and liabilities assumed were determined using market, income or cost methods. Our consolidated balance sheet reflects goodwill in the amount of $
1.9 billion
at
December 31, 2017
, representing the excess of the purchase price over the fair value of Virgin America’s tangible and identifiable intangible assets and liabilities. Identifiable intangible assets recorded totaled approximately $
141 million
at
December 31, 2017
and consisted of customer relationships, airport slots and gates. With the exception of airport slots, all of the identified intangible assets are finite-lived and are being amortized over their estimated economic useful lives. Goodwill and indefinite-lived intangible assets are not amortized, but will be tested for impairment at least annually (in the fourth quarter), or more frequently if events or circumstances indicate that an impairment may exist.
Our impairment analysis may include a qualitative assessment to determine whether it is more likely than not that a reporting unit or intangible asset group is impaired. If we do not perform a qualitative assessment, or if we determine it is more likely than not that the fair value of the reporting unit or intangible asset group exceeds its carrying amount, we will calculate the estimated fair value of the reporting unit or intangible asset group and an impairment charge would be recorded to reduce the carrying value to the estimated fair value.
Qualitative factors that might indicate a need to perform an impairment analysis outside of the regular annual assessment could include, but are not limited to: 1) reduced passenger demand as a result of domestic or global economic conditions; 2) significantly ongoing higher prices for jet fuel; 3) significant ongoing lower fares or passenger yields as a result of increased competition or lower demand; 4) a significant increase in future capital expenditure commitments; and 5) significant disruptions to our operations as a result of both internal and external events such as terrorist activities, actual or threatened war, labor actions by employees, or further industry regulation.
Our business combination accounting, as well as future impairment analyses, require management to make assumptions and apply judgment. Key assumptions include, but are not limited to, estimating future cash flows, selecting discount rates and selecting valuation methodologies. These estimates and assumptions are highly subjective and our ability to realize the future cash flows used in our fair value calculations may be affected by changes in economic condition, our economic performance or business strategies.
57
ADOPTION OF NEW ACCOUNTING STANDARDS
The new Revenue Recognition standard issued by the Financial Accounting Standards Board (FASB) replaces most existing revenue recognition guidance in U.S. GAAP, and is effective for the Company beginning January 1, 2018.
The most significant change to the financial statements resulting from the new standard is revenue recognition related to the frequent flyer program revenues and liabilities. Historically, we have used the incremental cost approach for miles earned through travel. This approach has been eliminated with the new standard. Instead, we are required to allocate a portion of the ticket price for each ticket flown, or miles earned, through a relative selling price model and defer revenue recognition until a mileage award is redeemed and flown, or unused mileage credits expire. As our Mileage Plan™ program is growing, the Company expects revenue deferred will exceed revenue earned under the new standard for miles earned through travel.
Further, unused ticket revenue that was previously recorded at the time of expiration will now be recorded at the original departure date if that ticket has not been changed or refunded prior to that date, based on estimates of expected expiration using historical patterns. We estimate the change in ticket breakage methodology will not have a significant impact on the statements of operations, but will result in a reduction in air traffic liability compared to previously reported balances.
The new standard also requires us to present ancillary revenues related to passenger travel as Passenger Revenue. Historically, such ancillary revenues have been presented as Other Revenues. Further, some ancillary revenues related to passenger travel will be recognized at the date of travel rather than the date of sale under the new standard.
It is worth noting that the standard impacts the timing of revenue recognition, and is not indicative of a weaker revenue environment. Additionally, the standard does not impact the timing of cash flows.
Although less significant, the new retirement benefits accounting standard is also effective January 1, 2018. Under this new standard, all components of net periodic benefit cost will be presented in Nonoperating income (expense), except service cost, which will remain in Wages and benefits. This change has an impact on CASM excluding fuel and special items. Management believes it is useful to compare forecasted results with the restated results under the new standards.
We have provisionally modeled the impacts of the revenue recognition standard and the pension accounting standard, and expect the following changes to the statements of operations for the years ending December 31, 2016 and December 31, 2017. All adjustments and recast amounts below are subject to finalization upon implementation in 2018.
|
Provisional impact of new accounting standards to the 2016 Statement of Operations:
|
|||||||||||||||
|
FY 2016
|
Adjustments -
|
Adjustments -
|
FY 2016
|
||||||||||||
|
As Reported
|
Revenue Recognition
|
Retirement Benefits
|
As Recast
|
||||||||||||
|
Passenger Revenue
|
$
|
5,006
|
|
$
|
391
|
|
$
|
—
|
|
$
|
5,397
|
|
|||
|
Other Revenue
|
925
|
|
(398
|
)
|
—
|
|
527
|
|
|||||||
|
Total Operating Revenue
|
5,931
|
|
(7
|
)
|
—
|
|
5,924
|
|
|||||||
|
Operating Expense
|
4,582
|
|
24
|
|
12
|
|
4,618
|
|
|||||||
|
Nonoperating Income (Expense)
|
(4
|
)
|
—
|
|
12
|
|
8
|
|
|||||||
|
Income Before Income Tax
|
$
|
1,345
|
|
$
|
(31
|
)
|
$
|
—
|
|
$
|
1,314
|
|
|||
58
|
Provisional impact of new accounting standards to the 2017 Statement of Operations:
|
|||||||||||||||
|
FY 2017
|
Adjustments -
|
Adjustments -
|
FY 2017
|
||||||||||||
|
As Reported
|
Revenue Recognition
|
Retirement Benefits
|
As Recast
|
||||||||||||
|
Passenger Revenue
|
$
|
6,818
|
|
$
|
487
|
|
$
|
—
|
|
$
|
7,305
|
|
|||
|
Other Revenue
|
1,115
|
|
(528
|
)
|
—
|
|
587
|
|
|||||||
|
Total Operating Revenue
|
7,933
|
|
(41
|
)
|
—
|
|
7,892
|
|
|||||||
|
Operating Expense
|
6,673
|
|
13
|
|
7
|
|
6,693
|
|
|||||||
|
Nonoperating Income (Expense)
|
(53
|
)
|
—
|
|
7
|
|
(46
|
)
|
|||||||
|
Income Before Income Tax
|
$
|
1,207
|
|
$
|
(54
|
)
|
$
|
—
|
|
$
|
1,153
|
|
|||
|
|
We have interest-rate risk on our variable-rate debt obligations and our available-for-sale marketable investment portfolio, and commodity-price risk in jet fuel required to operate our aircraft fleet. We purchase the majority of our jet fuel at prevailing market prices and seek to manage market risk through execution of our hedging strategy and other means. We have market-sensitive instruments in the form of fixed-rate debt instruments and financial derivative instruments used to hedge our exposure to jet-fuel price increases and interest-rate increases. We do not purchase or hold any derivative financial instruments for trading purposes.
Aircraft Fuel
Currently, our fuel-hedging portfolio consists of crude oil call options. Call options effectively cap our pricing for the crude oil, limiting our exposure to increasing fuel prices for about half of our planned fuel consumption. With call options, we are hedged against volatile crude oil price increases, and, during a period of decline in crude oil prices, we only forfeit cash previously paid for hedge premiums. We believe there is risk in not hedging against the possibility of fuel price increases. We estimate that a 10% increase or decrease in the forward curve for crude oil prices as of
December 31, 2017
would change the fair value of our crude oil hedge portfolio to approximately
$55 million
or
$6 million
, respectively.
Our portfolio value of fuel hedge contracts was
$22 million
at
December 31, 2017
compared to a portfolio value of
$20 million
at
December 31, 2016
. We do not have any collateral held by counterparties to these agreements as of
December 31, 2017
.
We continue to believe that our fuel hedge program is an important part of our strategy to reduce our exposure to volatile fuel prices. We expect to continue to enter into these types of contracts prospectively, although significant changes in market conditions could affect our decisions. For more discussion, see
Note 3
to our consolidated financial statements.
Interest Rates
We have exposure to market risk associated with changes in interest rates related primarily to our debt obligations and short-term investment portfolio. Our debt obligations include variable-rate instruments, which have exposure to changes in interest rates. In order to mitigate the risk of interest rate fluctuations, we have a number of interest rate swaps that fix the interest rates on certain variable-rate debt agreements. A hypothetical 10% change in the average interest rates incurred on average variable-rate debt held during
2017
would have correspondingly changed our net earnings and cash flows associated with these items by less than
$4 million
. Our variable-rate debt represents approximately
63%
and
61%
of our total long-term debt as of
December 31, 2017
and
December 31, 2016
, respectively.
Our exposure to interest rate variability is further mitigated through our variable-rate investment portfolio. We also have investments in marketable securities, which are exposed to market risk associated with changes in interest rates. If short-term interest rates were to average 1 point more than they did in
2017
, interest income would increase by approximately
$16 million
.
|
|
59
SELECTED QUARTERLY CONSOLIDATED FINANCIAL INFORMATION (unaudited)
|
|
First Quarter
|
Second Quarter
|
Third Quarter
|
Fourth Quarter
|
|||||||||||||||||||||||||||
|
(in millions, except per share)
|
2017
|
2016
|
2017
|
2016
|
2017
|
2016
|
2017
|
2016
|
|||||||||||||||||||||||
|
Operating revenues
|
$
|
1,749
|
|
$
|
1,347
|
|
$
|
2,102
|
|
$
|
1,494
|
|
$
|
2,120
|
|
$
|
1,566
|
|
$
|
1,962
|
|
$
|
1,524
|
|
|||||||
|
Operating income
|
166
|
|
290
|
|
493
|
|
418
|
|
439
|
|
400
|
|
162
|
|
241
|
|
|||||||||||||||
|
Net income
|
99
|
|
184
|
|
296
|
|
260
|
|
266
|
|
256
|
|
373
|
|
114
|
|
|||||||||||||||
|
Basic earnings per share
(a)
|
0.80
|
|
1.47
|
|
2.40
|
|
2.11
|
|
2.15
|
|
2.08
|
|
3.03
|
|
0.92
|
|
|||||||||||||||
|
Diluted earnings per share
(a)
|
0.79
|
|
1.46
|
|
2.38
|
|
2.10
|
|
2.14
|
|
2.07
|
|
3.02
|
|
0.92
|
|
|||||||||||||||
|
(a)
|
For earnings per share, the sum of the quarters may not equal the total for the full year due to rounding.
|
60
REPORT OF INDEPENDENT REGISTERED PUBLIC ACCOUNTING FIRM
To the Stockholders and Board of Directors
Alaska Air Group, Inc.:
Opinion on the Consolidated Financial Statements
We have audited the accompanying consolidated balance sheets of Alaska Air Group, Inc. and subsidiaries (the “Company”) as of December 31, 2017 and 2016, the related consolidated statements of operations, comprehensive operations, shareholders’ equity, and cash flows for each of the years in the three‑year period ended December 31, 2017, and the related notes (collectively, the “consolidated financial statements”). In our opinion, the consolidated financial statements present fairly, in all material respects, the financial position of the Company as of December 31, 2017 and 2016, and the results of its operations and its cash flows for each of the years in the three‑year period ended December 31, 2017, in conformity with U.S. generally accepted accounting principles.
We also have audited, in accordance with the standards of the Public Company Accounting Oversight Board (United States) (“PCAOB”), the Company’s internal control over financial reporting as of December 31, 2017, based on criteria established in
Internal Control - Integrated Framework (2013)
issued by the Committee of Sponsoring Organizations of the Treadway Commission, and our report dated February 14, 2018 expressed an unqualified opinion on the effectiveness of the Company’s internal control over financial reporting.
Basis for Opinion
These consolidated financial statements are the responsibility of the Company’s management. Our responsibility is to express an opinion on these consolidated financial statements based on our audits. We are a public accounting firm registered with the PCAOB and are required to be independent with respect to the Company in accordance with the U.S. federal securities laws and the applicable rules and regulations of the Securities and Exchange Commission and the PCAOB.
We conducted our audits in accordance with the standards of the PCAOB. Those standards require that we plan and perform the audit to obtain reasonable assurance about whether the consolidated financial statements are free of material misstatement, whether due to error or fraud. Our audits included performing procedures to assess the risks of material misstatement of the consolidated financial statements, whether due to error or fraud, and performing procedures that respond to those risks. Such procedures included examining, on a test basis, evidence regarding the amounts and disclosures in the consolidated financial statements. Our audits also included evaluating the accounting principles used and significant estimates made by management, as well as evaluating the overall presentation of the consolidated financial statements. We believe that our audits provide a reasonable basis for our opinion.
KPMG LLP
We have served as the Company’s auditor since 2004.
Seattle
,
Washington
February 14, 2018
61
|
As of December 31
(in millions)
|
2017
|
2016
|
|||||
|
ASSETS
|
|
|
|||||
|
Current Assets
|
|
|
|||||
|
Cash and cash equivalents
|
$
|
194
|
|
$
|
328
|
|
|
|
Marketable securities
|
1,427
|
|
1,252
|
|
|||
|
Total cash and marketable securities
|
1,621
|
|
1,580
|
|
|||
|
Receivables—less allowance for doubtful accounts of $1 and $1
|
341
|
|
302
|
|
|||
|
Inventories and supplies—net
|
57
|
|
47
|
|
|||
|
Prepaid expenses and other current assets
|
127
|
|
121
|
|
|||
|
Total Current Assets
|
2,146
|
|
2,050
|
|
|||
|
Property and Equipment
|
|
|
|
|
|||
|
Aircraft and other flight equipment
|
7,559
|
|
6,947
|
|
|||
|
Other property and equipment
|
1,222
|
|
1,103
|
|
|||
|
Deposits for future flight equipment
|
494
|
|
545
|
|
|||
|
|
9,275
|
|
8,595
|
|
|||
|
Less accumulated depreciation and amortization
|
2,991
|
|
2,929
|
|
|||
|
Total Property and Equipment—Net
|
6,284
|
|
5,666
|
|
|||
|
Other Assets
|
|||||||
|
Goodwill
|
1,943
|
|
1,934
|
|
|||
|
Intangible assets—net
|
133
|
|
143
|
|
|||
|
Other noncurrent assets
|
234
|
|
169
|
|
|||
|
Total Other Assets
|
2,310
|
|
2,246
|
|
|||
|
Total Assets
|
$
|
10,740
|
|
$
|
9,962
|
|
|
See accompanying notes to consolidated financial statements.
62
CONSOLIDATED BALANCE SHEETS
(continued)
|
As of December 31
(in millions except share amounts)
|
2017
|
2016
|
|||||
|
LIABILITIES AND SHAREHOLDERS' EQUITY
|
|
|
|||||
|
Current Liabilities
|
|
|
|||||
|
Accounts payable
|
$
|
120
|
|
$
|
92
|
|
|
|
Accrued wages, vacation and payroll taxes
|
418
|
|
397
|
|
|||
|
Air traffic liability
|
937
|
|
849
|
|
|||
|
Other accrued liabilities
|
918
|
|
878
|
|
|||
|
Current portion of long-term debt
|
307
|
|
319
|
|
|||
|
Total Current Liabilities
|
2,700
|
|
2,535
|
|
|||
|
Long-Term Debt, Net of Current Portion
|
2,262
|
|
2,645
|
|
|||
|
Other Liabilities and Credits
|
|
|
|
|
|||
|
Deferred income taxes
|
454
|
|
463
|
|
|||
|
Deferred revenue
|
699
|
|
640
|
|
|||
|
Obligation for pension and postretirement medical benefits
|
453
|
|
331
|
|
|||
|
Other liabilities
|
451
|
|
417
|
|
|||
|
Total Other Liabilities and Credits
|
2,057
|
|
1,851
|
||||
|
Commitments and Contingencies (Note 8)
|
|
|
|
|
|||
|
Shareholders' Equity
|
|
|
|
|
|||
|
Preferred stock, $0.01 par value, Authorized: 5,000,000 shares, none issued or outstanding
|
—
|
|
—
|
|
|||
|
Common stock, $0.01 par value, Authorized: 400,000,000 shares, Issued: 2017 - 129,903,498 shares; 2016 - 129,189,634 shares, Outstanding: 2017 - 123,060,638 shares; 2016 - 123,328,051 shares
|
1
|
|
1
|
|
|||
|
Capital in excess of par value
|
164
|
|
110
|
|
|||
|
Treasury stock (common), at cost: 2017 - 6,842,860 shares; 2016 - 5,861,583 shares
|
(518
|
)
|
(443)
|
|
|||
|
Accumulated other comprehensive loss
|
(380
|
)
|
(305)
|
|
|||
|
Retained earnings
|
4,454
|
|
3,568
|
|
|||
|
|
3,721
|
|
2,931
|
||||
|
Total Liabilities and Shareholders' Equity
|
$
|
10,740
|
|
$
|
9,962
|
|
|
See accompanying notes to consolidated financial statements.
63
|
Year Ended December 31
(in millions, except per-share amounts)
|
2017
|
2016
|
2015
|
||||||||
|
Operating Revenues
|
|
|
|
||||||||
|
Passenger
|
|||||||||||
|
Mainline
|
$
|
5,858
|
|
$
|
4,098
|
|
$
|
3,939
|
|
||
|
Regional
|
960
|
|
908
|
|
854
|
|
|||||
|
Total passenger revenue
|
6,818
|
|
5,006
|
|
4,793
|
|
|||||
|
Freight and mail
|
114
|
|
108
|
|
108
|
|
|||||
|
Other—net
|
1,001
|
|
817
|
|
697
|
|
|||||
|
Total Operating Revenues
|
7,933
|
|
5,931
|
|
5,598
|
|
|||||
|
Operating Expenses
|
|
|
|
|
|
|
|||||
|
Wages and benefits
|
1,924
|
|
1,382
|
|
1,254
|
|
|||||
|
Variable incentive pay
|
135
|
|
127
|
|
120
|
|
|||||
|
Aircraft fuel, including hedging gains and losses
|
1,447
|
|
831
|
|
954
|
|
|||||
|
Aircraft maintenance
|
391
|
|
270
|
|
253
|
|
|||||
|
Aircraft rent
|
274
|
|
114
|
|
105
|
|
|||||
|
Landing fees and other rentals
|
460
|
|
320
|
|
296
|
|
|||||
|
Contracted services
|
314
|
|
247
|
|
214
|
|
|||||
|
Selling expense
|
357
|
|
225
|
|
211
|
|
|||||
|
Depreciation and amortization
|
372
|
|
363
|
|
320
|
|
|||||
|
Food and beverage service
|
195
|
|
126
|
|
113
|
|
|||||
|
Third-party regional carrier expense
|
121
|
|
95
|
|
72
|
|
|||||
|
Other
|
565
|
|
365
|
|
356
|
|
|||||
|
Special items—merger-related costs and other
|
118
|
|
117
|
|
32
|
|
|||||
|
Total Operating Expenses
|
6,673
|
|
4,582
|
|
4,300
|
|
|||||
|
Operating Income
|
1,260
|
|
1,349
|
|
1,298
|
|
|||||
|
Nonoperating Income (Expense)
|
|
|
|
|
|
|
|||||
|
Interest income
|
34
|
|
27
|
|
21
|
|
|||||
|
Interest expense
|
(103
|
)
|
(55
|
)
|
(42
|
)
|
|||||
|
Interest capitalized
|
17
|
|
25
|
|
34
|
|
|||||
|
Other—net
|
(1
|
)
|
(1
|
)
|
1
|
|
|||||
|
|
(53
|
)
|
(4
|
)
|
14
|
|
|||||
|
Income Before Income Tax
|
1,207
|
|
1,345
|
|
1,312
|
|
|||||
|
Income tax expense
|
453
|
|
514
|
|
490
|
|
|||||
|
Special income tax expense (benefit)
|
(280
|
)
|
17
|
|
(26
|
)
|
|||||
|
Total Income Tax Expense
|
$
|
173
|
|
$
|
531
|
|
$
|
464
|
|
||
|
Net Income
|
$
|
1,034
|
|
$
|
814
|
|
$
|
848
|
|
||
|
Basic Earnings Per Share
|
$
|
8.39
|
|
$
|
6.59
|
|
$
|
6.61
|
|
||
|
Diluted Earnings Per Share
|
$
|
8.35
|
|
$
|
6.54
|
|
$
|
6.56
|
|
||
|
Shares used for computation:
|
|
|
|
|
|||||||
|
Basic
|
123.211
|
|
123.557
|
|
128.373
|
|
|||||
|
Diluted
|
123.854
|
|
124.389
|
|
129.372
|
|
|||||
|
Cash dividend declared per share
|
$
|
1.20
|
|
$
|
1.10
|
|
$
|
0.80
|
|
||
See accompanying notes to consolidated financial statements.
64
CONSOLIDATED STATEMENTS OF COMPREHENSIVE OPERATIONS
|
Year Ended December 31
(in millions)
|
2017
|
2016
|
2015
|
||||||||
|
Net Income
|
$
|
1,034
|
|
$
|
814
|
|
$
|
848
|
|
||
|
Other Comprehensive Income (Loss):
|
|||||||||||
|
Related to marketable securities:
|
|||||||||||
|
Unrealized holding gains (losses) arising during the period
|
(4
|
)
|
1
|
|
(6
|
)
|
|||||
|
Reclassification of (gains) losses into Other-net nonoperating income (expense)
|
1
|
|
(1
|
)
|
1
|
|
|||||
|
Income tax benefit (expense)
|
1
|
|
—
|
|
2
|
|
|||||
|
Total
|
(2
|
)
|
—
|
|
(3
|
)
|
|||||
|
Related to employee benefit plans:
|
|||||||||||
|
Actuarial gains (losses) related to pension and other postretirement benefit plans
|
(123
|
)
|
(43
|
)
|
10
|
|
|||||
|
Reclassification of net pension expense into Wages and benefits
|
22
|
|
20
|
|
14
|
|
|||||
|
Income tax benefit (expense)
|
24
|
|
12
|
|
(14
|
)
|
|||||
|
Total
|
(77
|
)
|
(11
|
)
|
10
|
|
|||||
|
Related to interest rate derivative instruments:
|
|||||||||||
|
Unrealized holding gains (losses) arising during the period
|
1
|
|
8
|
|
(5
|
)
|
|||||
|
Reclassification of losses into Aircraft rent
|
5
|
|
6
|
|
6
|
|
|||||
|
Income tax benefit (expense)
|
(2
|
)
|
(5
|
)
|
(1
|
)
|
|||||
|
Total
|
4
|
|
9
|
|
—
|
|
|||||
|
Other Comprehensive Income (Loss)
|
(75
|
)
|
(2
|
)
|
7
|
|
|||||
|
Comprehensive Income
|
$
|
959
|
|
$
|
812
|
|
$
|
855
|
|
||
See accompanying notes to consolidated financial statements.
65
CONSOLIDATED STATEMENTS OF SHAREHOLDERS' EQUITY
|
(in millions)
|
Common Stock Outstanding
|
Common Stock
|
Capital in Excess of Par Value
|
Treasury Stock
|
Accumulated Other Comprehensive Income (Loss)
|
Retained Earnings
|
Total
|
|||||||||||||||||||
|
Balances at December 31, 2014
|
131.481
|
|
$
|
1
|
|
$
|
296
|
|
$
|
(4
|
)
|
$
|
(310
|
)
|
$
|
2,144
|
|
$
|
2,127
|
|
||||||
|
2015 net income
|
—
|
|
—
|
|
—
|
|
—
|
|
—
|
|
848
|
|
848
|
|
||||||||||||
|
Other comprehensive income (loss)
|
—
|
|
—
|
|
—
|
|
—
|
|
7
|
|
—
|
|
7
|
|
||||||||||||
|
Common stock repurchase
|
(7.208
|
)
|
—
|
|
(259
|
)
|
(246
|
)
|
—
|
|
—
|
|
(505
|
)
|
||||||||||||
|
Stock-based compensation
|
—
|
|
—
|
|
17
|
|
—
|
|
—
|
|
—
|
|
17
|
|
||||||||||||
|
Cash dividend declared
|
—
|
|
—
|
|
—
|
|
—
|
|
—
|
|
(102
|
)
|
(102
|
)
|
||||||||||||
|
Stock issued for employee stock purchase plan
|
0.281
|
|
—
|
|
13
|
|
—
|
|
—
|
|
—
|
|
13
|
|
||||||||||||
|
Stock issued under stock plans
|
0.621
|
|
—
|
|
6
|
|
—
|
|
—
|
|
—
|
|
6
|
|
||||||||||||
|
Balances at December 31, 2015
|
125.175
|
|
1
|
|
73
|
|
(250
|
)
|
(303
|
)
|
2,890
|
|
2,411
|
|
||||||||||||
|
2016 net income
|
—
|
|
—
|
|
—
|
|
—
|
|
—
|
|
814
|
|
814
|
|
||||||||||||
|
Other comprehensive income (loss)
|
—
|
|
—
|
|
—
|
|
—
|
|
(2
|
)
|
—
|
|
(2
|
)
|
||||||||||||
|
Common stock repurchase
|
(2.595
|
)
|
—
|
|
—
|
|
(193
|
)
|
—
|
|
—
|
|
(193
|
)
|
||||||||||||
|
Stock-based compensation
|
—
|
|
—
|
|
19
|
|
—
|
|
—
|
|
—
|
|
19
|
|
||||||||||||
|
Cash dividend declared
|
—
|
|
—
|
|
—
|
|
—
|
|
—
|
|
(136
|
)
|
(136
|
)
|
||||||||||||
|
Stock issued for employee stock purchase plan
|
0.309
|
|
—
|
|
17
|
|
—
|
|
—
|
|
—
|
|
17
|
|
||||||||||||
|
Stock issued under stock plans
|
0.439
|
|
—
|
|
1
|
|
—
|
|
—
|
|
—
|
|
1
|
|
||||||||||||
|
Balances at December 31, 2016
|
123.328
|
|
1
|
|
110
|
|
(443
|
)
|
(305
|
)
|
3,568
|
|
2,931
|
|
||||||||||||
|
2017 net income
|
—
|
|
—
|
|
—
|
|
—
|
|
—
|
|
1,034
|
|
1,034
|
|
||||||||||||
|
Other comprehensive income (loss)
|
—
|
|
—
|
|
—
|
|
—
|
|
(75
|
)
|
—
|
|
(75
|
)
|
||||||||||||
|
Common stock repurchase
|
(0.981
|
)
|
—
|
|
—
|
|
(75
|
)
|
—
|
|
—
|
|
(75
|
)
|
||||||||||||
|
Stock-based compensation
|
—
|
|
—
|
|
34
|
|
—
|
|
—
|
|
—
|
|
34
|
|
||||||||||||
|
Cash dividend declared
|
—
|
|
—
|
|
—
|
|
—
|
|
—
|
|
(148
|
)
|
(148
|
)
|
||||||||||||
|
Stock issued for employee stock purchase plan
|
0.407
|
|
—
|
|
24
|
|
—
|
|
—
|
|
—
|
|
24
|
|
||||||||||||
|
Stock issued under stock plans
|
0.307
|
|
—
|
|
(4
|
)
|
—
|
|
—
|
|
—
|
|
(4
|
)
|
||||||||||||
|
Balances at December 31, 2017
|
123.061
|
|
$
|
1
|
|
$
|
164
|
|
$
|
(518
|
)
|
$
|
(380
|
)
|
$
|
4,454
|
|
$
|
3,721
|
|
||||||
See accompanying notes to consolidated financial statements.
66
|
Year Ended December 31
(in millions)
|
2017
|
2016
|
2015
|
||||||||
|
Cash flows from operating activities:
|
|
|
|
||||||||
|
Net income
|
$
|
1,034
|
|
$
|
814
|
|
$
|
848
|
|
||
|
Adjustments to reconcile net income to net cash provided by operating activities:
|
|
|
|
|
|
|
|||||
|
Depreciation and amortization
|
372
|
|
363
|
|
320
|
|
|||||
|
Stock-based compensation and other
|
55
|
|
26
|
|
25
|
|
|||||
|
Changes in certain assets and liabilities:
|
|||||||||||
|
Changes in deferred tax provision
|
19
|
|
94
|
|
56
|
|
|||||
|
(Increase) decrease in accounts receivable
|
(39
|
)
|
(46
|
)
|
47
|
|
|||||
|
Increase (decrease) in air traffic liability
|
88
|
|
9
|
|
38
|
|
|||||
|
Increase (decrease) in deferred revenue
|
63
|
|
83
|
|
57
|
|
|||||
|
Changes in pension and other postretirement benefits
|
17
|
|
23
|
|
36
|
|
|||||
|
Other—net
|
(19
|
)
|
20
|
|
157
|
|
|||||
|
Net cash provided by operating activities
|
1,590
|
|
1,386
|
|
1,584
|
|
|||||
|
Cash flows from investing activities:
|
|
|
|
|
|
|
|||||
|
Property and equipment additions:
|
|
|
|
|
|
|
|||||
|
Aircraft and aircraft purchase deposits
|
(804
|
)
|
(528
|
)
|
(681
|
)
|
|||||
|
Other flight equipment
|
(96
|
)
|
(53
|
)
|
(79
|
)
|
|||||
|
Other property and equipment
|
(126
|
)
|
(97
|
)
|
(71
|
)
|
|||||
|
Total property and equipment additions
|
(1,026
|
)
|
(678
|
)
|
(831
|
)
|
|||||
|
Acquisition of Virgin America, net of cash acquired
|
—
|
|
(1,951
|
)
|
—
|
|
|||||
|
Purchases of marketable securities
|
(1,569
|
)
|
(960
|
)
|
(1,327
|
)
|
|||||
|
Sales and maturities of marketable securities
|
1,388
|
|
962
|
|
1,175
|
|
|||||
|
Proceeds from disposition of assets and changes in restricted deposits
|
75
|
|
5
|
|
53
|
|
|||||
|
Net cash used in investing activities
|
(1,132
|
)
|
(2,622
|
)
|
(930
|
)
|
|||||
|
Cash flows from financing activities:
|
|
|
|
|
|
|
|||||
|
Proceeds from issuance of long-term debt, net of issuance costs
|
—
|
|
2,044
|
|
—
|
|
|||||
|
Long-term debt payments
|
(397
|
)
|
(249
|
)
|
(116
|
)
|
|||||
|
Common stock repurchases
|
(75
|
)
|
(193
|
)
|
(505
|
)
|
|||||
|
Cash dividend paid
|
(148
|
)
|
(136
|
)
|
(102
|
)
|
|||||
|
Other financing activities
|
28
|
|
25
|
|
35
|
|
|||||
|
Net cash provided by (used in) financing activities
|
(592
|
)
|
1,491
|
|
(688
|
)
|
|||||
|
Net increase (decrease) in cash and cash equivalents
|
(134
|
)
|
255
|
|
(34
|
)
|
|||||
|
Cash and cash equivalents at beginning of year
|
328
|
|
73
|
|
107
|
|
|||||
|
Cash and cash equivalents at end of year
|
$
|
194
|
|
$
|
328
|
|
$
|
73
|
|
||
|
Supplemental disclosure:
|
|
|
|
|
|
|
|||||
|
Cash paid during the year for:
|
|||||||||||
|
Interest, net of amount capitalized
|
$
|
84
|
|
$
|
24
|
|
$
|
8
|
|
||
|
Income taxes, net of refunds received
|
177
|
|
459
|
|
349
|
|
|||||
See accompanying notes to consolidated financial statements.
67
NOTES TO CONSOLIDATED FINANCIAL STATEMENTS
Organization and Basis of Presentation
The consolidated financial statements include the accounts of Air Group, or the Company, and its primary subsidiaries, Alaska, Horizon, and Virgin America. Our consolidated financial statements also include McGee Air Services, a subsidiary of Alaska. The Company conducts substantially all of its operations through these subsidiaries. All significant intercompany balances and transactions have been eliminated. These financial statements have been prepared in conformity with accounting principles generally accepted in the United States of America and their preparation requires the use of management’s estimates. Actual results may differ from these estimates.
Certain reclassifications have been made to prior year financial statements to conform to classifications used in the current year.
Cash and Cash Equivalents
Cash equivalents consist of highly liquid investments with original maturities of three months or less, such as money market funds, commercial paper and certificates of deposit. They are carried at cost, which approximates market value. The Company reduces cash balances when funds are disbursed. Due to the time delay in funds clearing the banks, the Company normally maintains a negative balance in its cash disbursement accounts, which is reported as a current liability. The amount of the negative cash balance was
$10 million
and
$15 million
at
December 31, 2017
and
2016
respectively, and is included in accounts payable, with the change in the balance during the year included in other financing activities in the consolidated statements of cash flows.
The Company's restricted cash balances are primarily used to guarantee various letters of credit, self-insurance programs or other contractual rights. Restricted cash consists of highly liquid securities with original maturities of three months or less. They are carried at cost, which approximates fair value.
Marketable Securities
Investments with original maturities of greater than three months and remaining maturities of less than one year are classified as short-term investments. Investments with maturities beyond one year may be classified as short-term based on their highly liquid nature and because such marketable securities represent the investment of cash that is available for current operations. All cash equivalents and short-term investments are classified as available-for-sale and realized gains and losses are recorded using the specific identification method. Changes in market value, excluding other-than-temporary impairments, are reflected in accumulated other comprehensive loss (AOCL).
Investments are considered to be impaired when a decline in fair value is judged to be other-than-temporary. The Company uses a systematic methodology that considers available quantitative and qualitative evidence in evaluating potential impairment. If the cost of an investment exceeds its fair value, management evaluates, among other factors, general market conditions, credit quality of debt instrument issuers, the duration and extent to which the fair value is less than cost, the Company's intent and ability to hold, or plans to sell, the investment. Once a decline in fair value is determined to be other-than-temporary, an impairment charge is recorded to Other—net in the consolidated statements of operations and a new cost basis in the investment is established.
Inventories and Supplies—net
Expendable aircraft parts, materials and supplies are stated at average cost and are included in inventories and supplies
—
net. An obsolescence allowance for expendable parts is accrued based on estimated lives of the corresponding fleet type and salvage values. The allowance for expendable inventories was $
38 million
and
$36 million
at
December 31, 2017
and
2016
, respectively. Inventory and supplies
—
net also includes fuel inventory of $
23 million
and
$16 million
at
December 31, 2017
and
2016
, respectively. Repairable and rotable aircraft parts inventories are included in flight equipment.
68
Property, Equipment and Depreciation
Property and equipment are recorded at cost and depreciated using the straight-line method over their estimated useful lives less an estimated salvage value, which are as follows:
|
Estimated Useful Life
|
Estimated Salvage Value
|
|
|
Aircraft and other flight equipment:
|
|
|
|
Boeing 737, Airbus A319/320, and E175 aircraft
|
20-25 years
|
10%
|
|
Bombardier Q400 aircraft
|
15 years
|
10%
|
|
Buildings
|
25 - 30 years
|
—%
|
|
Minor building and land improvements
|
10 years
|
—%
|
|
Capitalized leases and leasehold improvements
|
Generally shorter of lease term or
estimated useful life
|
0-10%
|
|
Computer hardware and software
|
3-10 years
|
—%
|
|
Other furniture and equipment
|
5-10 years
|
—%
|
Near the end of an asset's estimated useful life, management updates the salvage value estimates based on current market conditions and expected use of the asset. Repairable and rotable aircraft parts are included in Aircraft and other flight equipment, and are depreciated over the associated fleet life.
In 2016, the Company changed its accounting estimate for the expected useful life of the B737 NextGen aircraft, which includes the B737-700, -800, -900, -900ER aircraft and the related parts, from
20
years to
25
years. The change in estimate was precipitated by management's annual accounting policy review, which considered market studies, asset performance and intended use, as well as industry benchmarking. The change in estimate was applied prospectively effective October 1, 2016.
Capitalized interest, based on the Company’s weighted-average borrowing rate, is added to the cost of the related asset, and is depreciated over the estimated useful life of the asset.
Maintenance and repairs, other than engine maintenance on B737-800 engines, are expensed when incurred. Major modifications that extend the life or improve the usefulness of aircraft are capitalized and depreciated over their estimated period of use. Maintenance on B737-800 engines is covered under a power-by-the-hour agreement with a third party beginning in the fourth quarter of 2017, whereby the Company pays a determinable amount, and transfers risk, to a third party. The Company expenses the contract amounts based on engine usage.
The Company evaluates long-lived assets to be held and used for impairment whenever events or changes in circumstances indicate that the total carrying amount of an asset or asset group may not be recoverable. The Company groups assets for purposes of such reviews at the lowest level, at which identifiable cash flows are largely independent of the cash flows of other groups of assets and liabilities. An impairment loss is considered when estimated future undiscounted cash flows expected to result from the use of the asset or asset group and its eventual disposition are less than its carrying amount. If the asset or asset group is not considered recoverable, a write-down equal to the excess of the carrying amount over the fair value will be recorded.
Goodwill
Goodwill represents the excess of purchase price over the fair value of the related net assets acquired in the Company's acquisition of Virgin America and is not amortized. As of
December 31, 2017
the goodwill balance was
$1.9 billion
, and is associated with the Mainline reporting unit. The Company reviews goodwill for impairment annually in Q4, or more frequently if events or circumstances indicate than an impairment may exist. If fair value of the reporting unit does not exceed the carrying amount, an impairment charge may be recorded. In
2017
, the fair value of the reporting unit with goodwill substantially exceeded its carrying value.
Intangible Assets
Intangible assets recorded in conjunction with the acquisition of Virgin America consist primarily of indefinite-lived airport slots, finite-lived airport gates and finite-lived customer relationships. Finite-lived intangibles are amortized over their estimated useful lives. Indefinite-lived intangibles are not amortized but are tested at least annually for impairment using a similar methodology to property, equipment and goodwill as described above.
69
Deferred Revenue
Deferred revenue results primarily from the sale of Mileage Plan™ miles to third-parties. It also includes Virgin America's Elevate® flown points outstanding at the acquisition date that were recorded at their estimated fair value as part of purchase price accounting. Recognition of this deferred revenue occurs when award transportation is provided or over the term of the applicable agreement.
Operating Leases
The Company leases aircraft, airport and terminal facilities, office space and other equipment under operating leases. Airport and terminal facility leases are variable based on volumes and expensed as incurred. Some of these lease agreements contain rent escalation clauses or rent holidays. For scheduled rent escalation clauses during the lease terms or for rental payments commencing at a date other than the date of initial occupancy, the Company records minimum rental expenses on a straight-line basis over the terms of the leases in the consolidated statements of operations.
Leased Aircraft Return Costs
Cash payments associated with returning leased aircraft are accrued when it is probable that a cash payment will be made and that amount is reasonably estimable, usually no sooner than after the last scheduled maintenance event prior to lease return. Any accrual is based on the time remaining on the lease, planned aircraft usage and the provisions included in the lease agreement, although the actual amount due to any lessor upon return may not be known with certainty until lease termination.
As leased aircraft are returned, any payments are charged against the established accrual. The accrual is part of other current and long-term liabilities and was
not material
as of
December 31, 2017
and
December 31, 2016
. The expense is included in Aircraft maintenance in the consolidated statements of operations.
Revenue Recognition
Passenger revenue is recognized when the passenger travels. Tickets sold but not yet used are reported as air traffic liability until travel or date of expiration. Air traffic liability includes approximately
$106 million
and
$62 million
related to credits for future travel, as of
December 31, 2017
and
December 31, 2016
, respectively. These credits are recognized into revenue either when the passenger travels or at the date of expiration, which is twelve months from issuance. Commissions to travel agents and related fees are expensed when the related revenue is recognized. Passenger traffic commissions and related fees not yet recognized are recorded as a prepaid expense. Taxes collected from passengers, including transportation excise taxes, airport and security fees and other fees, are recorded on a net basis within passenger revenue in the consolidated statements of operations. Due to complex pricing structures, refund and exchange policies, and interline agreements with other airlines, certain amounts are recognized as revenue using estimates regarding both the timing of the revenue recognition and the amount of revenue to be recognized. These estimates are based on the Company’s historical data.
Freight and mail revenues are recognized when the related services are provided.
Other—net revenues are primarily related to the Mileage Plan™ program. They are recognized as described in the “Mileage Plan” paragraph below. Other—net also includes certain ancillary or non-ticket revenues, such as checked-bag fees, reservations fees, ticket change fees, on-board food and beverage sales, and, to a much lesser extent, commissions from car and hotel vendors and sales of travel insurance. These items are recognized as revenue when the related services are provided. Airport lounge memberships are recognized as revenue over the membership period.
Frequent Flyer Programs
Alaska operates the Mileage Plan™ frequent flyer program, and Virgin America operated the Elevate frequent flyer program for the duration of 2017. Both programs provide travel awards to members based on accumulated mileage or points. For miles earned by flying on the Company's airlines, and through airline partners, the estimated cost of providing award travel is recognized as a selling expense and accrued as a liability, as miles are earned and accumulated.
Alaska and Virgin America also sell services, including miles or points for transportation, to non-airline partners, such as hotels, car rental agencies and major banks that offer Alaska's affinity credit card. The Company defers revenue related to air transportation and certificates for discounted companion travel until the transportation is delivered. The deferred proceeds are recognized as passenger revenue for awards redeemed and flown on the Company's airlines and as Other—net revenue for
70
awards redeemed and flown on other airlines (less the cost paid to the other airlines based on contractual agreements). The elements that represent use of the Alaska and Virgin America brands and access to frequent flyer member lists and advertising are recognized as commission income in the period that those elements are sold and included in Other—net revenue in the consolidated statements of operations.
Frequent flyer program deferred revenue and liabilities included in the consolidated balance sheets (in millions):
|
2017
|
2016
|
||||||
|
Current Liabilities:
|
|
|
|||||
|
Other accrued liabilities
|
$
|
519
|
|
$
|
484
|
|
|
|
Other Liabilities and Credits:
|
|
|
|
|
|||
|
Deferred revenue
|
699
|
|
638
|
|
|||
|
Other liabilities
|
26
|
|
21
|
|
|||
|
Total
|
$
|
1,244
|
|
$
|
1,143
|
|
|
The amounts recorded in other accrued liabilities relate primarily to deferred revenue expected to be realized within one year, which includes Mileage Plan™ awards that have been issued but not yet flown for $
47 million
and
$43 million
at
December 31, 2017
and
2016
.
Frequent flyer program revenue included in the consolidated statements of operations (in millions):
|
|
2017
|
2016
|
2015
|
||||||||
|
Passenger revenues
|
$
|
380
|
|
$
|
293
|
|
$
|
267
|
|
||
|
Other
—
net revenues
|
482
|
|
429
|
|
329
|
|
|||||
|
Total frequent flyer program revenues
|
$
|
862
|
|
$
|
722
|
|
$
|
596
|
|
||
Other
—
net revenue includes commission revenues of
$396 million
,
$329 million
, and
$280 million
in
2017
,
2016
, and
2015
.
Selling Expenses
Selling expenses include credit card fees, global distribution systems charges, the estimated cost of frequent flyer travel awards earned through air travel, advertising, promotional costs, commissions and incentives. Advertising production costs are expensed as incurred. Advertising expense was $
91 million
,
$61 million
, and
$55 million
during the years ended
December 31, 2017
,
2016
, and
2015
.
Derivative Financial Instruments
The Company's operations are significantly impacted by changes in aircraft fuel prices and interest rates. In an effort to manage exposure to these risks, the Company periodically enters into fuel and interest rate derivative instruments. These derivative instruments are recognized at fair value on the balance sheet and changes in the fair value are recognized in AOCL or in the consolidated statements of operations, depending on the nature of the instrument.
The Company does not apply hedge accounting to its derivative fuel hedge contracts nor does it hold or issue them for trading purposes. For cash flow hedges related to interest rate swaps, the effective portion of the derivative represents the change in fair value of the hedge that offsets the change in fair value of the hedged item. To the extent the change in the fair value of the hedge does not perfectly offset the change in the fair value of the hedged item, the ineffective portion of the hedge is immediately recognized in interest expense.
Fair Value Measurements
Accounting standards define fair value as the exchange price that would be received for an asset or paid to transfer a liability (an exit price) in the principal or most advantageous market for the asset or liability in an orderly transaction between market participants on the measurement date. The standards also establish a fair value hierarchy, which requires an entity to maximize the use of observable inputs and minimize the use of unobservable inputs when measuring fair value. There are three levels of inputs that may be used to measure fair value:
Level 1
- Quoted prices in active markets for identical assets or liabilities.
71
Level 2
- Observable inputs other than Level 1 prices such as quoted prices for similar assets or liabilities, quoted prices in markets that are not active, or other inputs that are observable or can be corroborated by observable market data for substantially the full term of the assets or liabilities.
Level 3
- Unobservable inputs that are supported by little or no market activity and that are significant to the fair value of the assets or liabilities.
The Company has elected not to use the fair value option provided in the accounting standards for non-financial instruments. Accordingly, those assets and liabilities are carried at amortized cost. For financial instruments, the assets and liabilities are carried at fair value, which is determined based on the market approach or income approach, depending upon the level of inputs used.
Assets and liabilities recognized or disclosed at fair value on a nonrecurring basis include items such as property, plant and equipment, goodwill, intangible assets and certain other assets and liabilities. The Company determines the fair value of these items using Level 3 inputs, as described in
Note 2
and
Note 4
.
Income Taxes
The Company uses the asset and liability approach for accounting for and reporting income taxes. Deferred tax assets and liabilities are recognized for future tax consequences attributable to differences between the financial statement carrying amounts of existing assets and liabilities, and their respective tax bases and for operating loss and tax credit carryforwards. Deferred tax assets and liabilities are measured using enacted tax rates expected to apply to taxable income in the years in which those temporary differences are expected to be recovered or settled. The effect on deferred tax assets and liabilities of a change in tax rates is recognized in the period that includes the enactment date. A valuation allowance would be established, if necessary, for the amount of any tax benefits that, based on available evidence, are not expected to be realized. As of
December 31, 2017
, there is no valuation allowance against net deferred tax assets. The Company accounts for unrecognized tax benefits in accordance with the applicable accounting standards.
Virgin America has substantial federal and state net operating losses (NOLs) for income tax purposes. The Company's ability to utilize Virgin America's NOLs could be limited if Virgin America had an “ownership change,” as defined in Section 382 of the Internal Revenue Code and similar state provisions. In general terms, an ownership change can occur whenever there is a collective shift in the ownership of a company by more than 50% by one or more “5% stockholders” within a three-year period. The occurrence of such a change generally limits the amount of NOL carryforwards a company could utilize in a given year to the aggregate fair market value of the company's common stock immediately prior to the ownership change, multiplied by the long-term tax-exempt interest rate in effect for the month of the ownership change. The acquisition constituted an ownership change and the potential for further limitations following the acquisition. See
Note 6
to the consolidated financial statements for more discussion of the calculation.
Stock-Based Compensation
Accounting standards require companies to recognize as expense the fair value of stock options and other equity-based compensation issued to employees as of the grant date. These standards apply to all stock awards that the Company grants to employees as well as the Company’s Employee Stock Purchase Plan (ESPP), which features a look-back provision and allows employees to purchase stock at a
15%
discount. All stock-based compensation expense is recorded in wages and benefits in the consolidated statements of operations.
Earnings Per Share (EPS)
Diluted EPS is calculated by dividing net income by the average common shares outstanding plus additional common shares that would have been outstanding assuming the exercise of in-the-money stock options and restricted stock units, using the treasury-stock method. In
2017
,
2016
, and
2015
, antidilutive stock options excluded from the calculation of EPS were not material.
Recently Issued Accounting Pronouncements
In May 2014, the Financial Accounting Standards Board (FASB) issued Accounting Standards Update (ASU) 2014-09, "Revenue from Contracts with Customers"(Topic 606), which requires an entity to recognize the amount of revenue to which it expects to be entitled for the transfer of promised goods or services to customers. This comprehensive new standard will
72
replace most existing revenue recognition guidance in U.S. GAAP. In March 2016, the FASB issued ASU 2016-08, "Revenue from Contracts with Customers (Topic 606), Principal versus Agent Considerations" to clarify the guidance on determining whether the Company is considered the principal or the agent in a revenue transaction where a third party is providing goods or services to a customer. Entities are permitted to use either a full retrospective or cumulative effect transition method, and are required to adopt all parts of the new revenue standard using the same transition method. The new standard became effective for the Company on January 1, 2018.
Under the new standard, the Company estimates a net increase to Mileage Plan™ deferred revenues of approximately
$345 million
to
$365 million
as of the beginning of the retroactive reporting period (January 1, 2016) at the time of adoption. Additionally, the Company estimates the change in ticket breakage methodology will not have a significant impact on the statements of operations, but will decrease air traffic liability by approximately
$70 million
to
$80 million
at adoption of the standard. The overall impact to equity as of the beginning of the retroactive reporting period, including these, as well as other less material changes, is expected to be between
$165 million
and
$175 million
.
In January 2016, the FASB issued ASU No. 2016-01, "Financial Instruments—Overall (Subtopic 825-10)." This standard makes several changes, including the elimination of the available-for-sale classification of equity investments, and requires equity investments with readily determinable fair values to be measured at fair value with changes in fair value recognized in net income. It is effective for the Company beginning January 1, 2018. The Company does not expect the adoption of ASU 2016-01 to have a material impact on its consolidated financial statements.
In February 2016, the FASB issued ASU 2016-02, "Leases" (Topic 842), which requires lessees to recognize assets and liabilities for leases currently classified as operating leases. Under the new standard a lessee will recognize a liability on the balance sheet representing the lease payments owed, and a right-of-use-asset representing its right to use the underlying asset for the lease term. For leases with a term of 12 months or less, a lessee is permitted to make an accounting policy election not to recognize lease assets and lease liabilities. At this time, the Company believes the most significant impact to the financial statements will relate to the recording of a right of use asset associated with leased aircraft. Other leases, including airports and real estate, equipment, software and other miscellaneous leases continue to be assessed for impact as it relates to the ASU. The new standard is effective for the Company on January 1, 2019. The Company will not early adopt the standard.
In March 2016, the FASB issued ASU 2016-09, "Compensation—Stock Compensation" (Topic 718), which simplifies several aspects of accounting for employee share-based payment awards, including the accounting for income taxes, forfeitures and statutory tax withholding requirements, as well as classification in the statement of cash flows. The ASU was adopted prospectively as of January 1, 2017. Prior periods have not been adjusted. The adoption of the standard did not have a material impact on the Company's statements of operations or financial position.
In January 2017, the FASB issued ASU 2017-04, "Intangibles—Goodwill and Other" (Topic 350), which eliminates step 2 from the goodwill impairment test. Step 2 measures a goodwill impairment loss by comparing the implied fair value of a reporting unit’s goodwill with the carrying amount of that goodwill. The ASU is effective for the Company beginning January 1, 2019. Early adoption of the standard is permitted. In 2017, the Company performed an impairment test for goodwill arising from its acquisition of Virgin America and adopted the standard effective January 1, 2017.
In March 2017, the FASB issued ASU 2017-07, "Compensation—Retirement Benefits" (Topic 715), which will require the Company to present the service cost component of net periodic benefit cost as Wages and benefits in the statements of operations. All other components of net periodic benefit cost will be required to be presented in Nonoperating income (expense) in the statements of operations. These components will not be eligible for capitalization. The ASU is effective for the Company beginning January 1, 2018. Changes to the statements of operations under the ASU are applicable retrospectively. The adoption of this standard will have no impact on Income before income tax or Net income for the periods subject to retrospective reclassification. See Note 7 for the current components of the Company's net periodic benefit costs.
In August 2017, the FASB issued ASU 2017-12, "Derivatives and Hedging (Topic 815): Targeted Improvements to Accounting for Hedging Activities." The ASU expands the activities that qualify for hedge accounting and simplifies the rules for reporting hedging relationships. The ASU is effective for the Company beginning January 1, 2019. The Company will not early adopt the standard.
73
Virgin America
On
December 14, 2016
, the Company acquired
100%
of the outstanding common shares and voting interest of Virgin America for
$57
per share, or total cash consideration of
$2.6 billion
.
Fair values of the assets acquired and the liabilities assumed
The transaction was accounted for as a business combination using the acquisition method of accounting, which requires, among other things, that assets acquired and liabilities assumed be recognized on the balance sheet at their fair values as of the acquisition date. The fair values of the assets acquired and liabilities assumed were determined using the market, income and cost approaches. There were no significant fair value adjustments made during the
twelve
months ended
December 31, 2017
.
Fair values of the assets acquired and the liabilities assumed as of the acquisition date,
December 14, 2016
, at
December 31, 2017
and
December 31, 2016
were as follows (in millions):
|
December 31, 2017
|
December 31, 2016
|
||||||
|
Cash and cash equivalents
|
$
|
645
|
|
$
|
645
|
|
|
|
Receivables
|
53
|
|
44
|
|
|||
|
Prepaid expenses and other current assets
|
18
|
|
16
|
|
|||
|
Property and equipment
|
571
|
|
560
|
|
|||
|
Intangible assets
|
141
|
|
143
|
|
|||
|
Goodwill
|
1,943
|
|
1,934
|
|
|||
|
Other assets
|
89
|
|
84
|
|
|||
|
Total assets
|
3,460
|
|
3,426
|
|
|||
|
Accounts payable
|
22
|
|
22
|
|
|||
|
Accrued wages, vacation and payroll taxes
|
54
|
|
51
|
|
|||
|
Air traffic liabilities
|
172
|
|
172
|
|
|||
|
Other accrued liabilities
|
198
|
|
196
|
|
|||
|
Current portion of long-term debt
|
125
|
|
125
|
|
|||
|
Long-term debt, net of current portion
|
360
|
|
360
|
|
|||
|
Deferred income taxes
|
(300
|
)
|
(304
|
)
|
|||
|
Deferred revenue
|
126
|
|
126
|
|
|||
|
Other liabilities
|
107
|
|
82
|
|
|||
|
Total liabilities
|
864
|
|
830
|
|
|||
|
Total purchase price
|
$
|
2,596
|
|
$
|
2,596
|
|
|
Intangible Assets
Of the
$141 million
of acquired intangible assets,
$89 million
represents airport slots. Airport slots are rights to take-off or land at a slot-controlled airport during a specific time period and are a means by which the FAA manages airspace/airport congestion. The Company acquired slots at three such airports—John F. Kennedy International, LaGuardia and Ronald Reagan Washington National. These slots either have no expiration dates or are expected to be renewed indefinitely in line with the FAA's past practice. They require no maintenance and do not have an established residual value. As the demand for air travel at these airports has remained very strong, the Company expects to use these slots in perpetuity and has determined these airport slots to be indefinite-lived intangible assets. They will not be amortized but rather tested for impairment annually, or more frequently when events and circumstances indicate that impairment may exist.
Of the remaining
$52 million
,
$37 million
represents customer relationships, subject to amortization on a straight-line basis over the estimated economic life of
seven
years,
$1 million
represents credit card agreements amortized on a straight-line basis over
74
one
year, and
$14 million
represents airport gates to be amortized on a straight-line basis over the remaining lease term of
eleven
years.
The Company considered examples of intangible assets that the FASB believes meet the criteria for recognition apart from goodwill, as well as any other intangible assets common to the airline industry, and did not identify any other such intangible assets acquired in the transaction.
Goodwill
Goodwill of
$1.9 billion
represents the excess of the purchase price over the fair value of the underlying net assets acquired and largely results from expected future synergies from combining operations as well as an assembled workforce, which does not qualify for separate recognition. Goodwill is not amortized to earnings, but instead is reviewed for impairment at least annually, absent any indicators of impairment.
Merger-related costs
The Company incurred pretax merger-related costs of
$118 million
and
$117 million
for the
twelve
months ended
December 31, 2017
and
2016
, respectively. Costs classified as merger-related are directly attributable to merger activities and are recorded as "Special items—merger-related costs" within the Statements of Operations. Refer to
Note 10
for further information on special items. The Company expects to continue to incur merger-related costs in the future as the integration continues.
Pro forma impact of the acquisition
The unaudited pro forma financial information presented below represents a summary of the consolidated results of operations for the Company including Virgin America as if the acquisition of Virgin America had been consummated as of January 1, 2015. The pro forma results do not include any anticipated synergies, or other expected benefits of the acquisition. Accordingly, the unaudited pro forma financial information below is not necessarily indicative of either future results of operations or results that might have been achieved had the acquisition been consummated as of January 1, 2015.
|
(in millions, except per share amounts)
|
Years Ended December 31,
|
||||||
|
2016
|
2015
|
||||||
|
Revenue
|
$
|
7,511
|
|
$
|
7,111
|
|
|
|
Net Income
|
1,008
|
|
914
|
|
|||
Fuel Hedge Contracts
The Company’s operations are inherently dependent upon the price and availability of aircraft fuel. To manage economic risks associated with fluctuations in aircraft fuel prices, the Company periodically enters into call options for crude oil.
As of
December 31, 2017
, the Company had outstanding fuel hedge contracts covering
434 million
gallons of crude oil that will be settled from
January 2018
to
June 2019
.
Interest Rate Swap Agreements
The Company is exposed to market risk from adverse changes in variable interest rates on long term debt and certain aircraft lease agreements. To manage this risk, the Company periodically enters into interest rate swap agreements. As of
December 31, 2017
, the Company has outstanding interest rate swap agreements with a third party designed to hedge the volatility of the underlying variable interest rates on lease agreements for
six
B737-800 aircraft, as well as
two
interest rate swap agreements with third parties designed to hedge the volatility of the underlying variable interest rates on
$265 million
of the debt obtained in 2016. All of the interest rate swap agreements stipulate that the Company pay a fixed interest rate and receive a floating interest rate over the term of the underlying contracts. The interest rate swap agreements expire from
February 2020
through
March 2021
to coincide with the lease termination dates, and
October 2022
through
September 2026
to coincide with the debt maturity dates. All significant terms of the swap agreements match the terms of the underlying hedged items, and have been designated as qualifying hedging instruments, which are accounted for as cash flow hedges.
75
As qualifying cash flow hedges, the interest rate swaps are recognized at fair value on the balance sheet, and changes in the fair value are recognized in accumulated other comprehensive income (loss). The effective portion of the derivative represents the change in fair value of the hedge that offsets the change in fair value of the hedged item. To the extent the change in fair value of the hedge does not perfectly offset the change in the fair value of the hedged item, the ineffective portion of the hedge is recognized in interest expense, if material.
Fair Values of Derivative Instruments
Fair values of derivative instruments on the consolidated balance sheet (in millions):
|
2017
|
2016
|
||||||
|
Fuel hedge contracts (not designated as hedges)
|
|||||||
|
Prepaid expenses and other current assets
|
$
|
19
|
|
$
|
17
|
|
|
|
Other assets
|
3
|
|
3
|
|
|||
|
Interest rate swaps (designated as hedges)
|
|||||||
|
Prepaid expenses and other current assets
|
1
|
|
—
|
|
|||
|
Other noncurrent assets
|
8
|
|
—
|
|
|||
|
Other accrued liabilities
|
(3
|
)
|
(5
|
)
|
|||
|
Other liabilities
|
(5
|
)
|
—
|
|
|||
|
Losses in accumulated other comprehensive loss (AOCL)
|
(2
|
)
|
(5
|
)
|
|||
The net cash paid for new fuel hedge positions and received from settlements was
$12 million
,
$19 million
and
$17 million
during
2017
,
2016
, and
2015
, respectively.
Pretax effect of derivative instruments on earnings and AOCL (in millions):
|
2017
|
2016
|
2015
|
|||||||||
|
Fuel hedge contracts (not designated as hedges)
|
|||||||||||
|
Gains (losses) recognized in Aircraft fuel
|
$
|
(6
|
)
|
$
|
(3
|
)
|
$
|
(19
|
)
|
||
|
Interest rate swaps (designated as hedges)
|
|||||||||||
|
Gains (losses) recognized in Aircraft rent
|
(5
|
)
|
(6
|
)
|
(6
|
)
|
|||||
|
Gains (losses) recognized in other comprehensive income (OCI)
|
1
|
|
8
|
|
(5
|
)
|
|||||
The amounts shown as recognized in aircraft rent for cash flow hedges (interest rate swaps) represent the realized losses transferred out of AOCL to aircraft rent. No gains or losses related to interest rate swaps on variable rate debt have been recognized in interest expense during
2017
. The amounts shown as recognized in OCI are prior to the losses recognized in aircraft rent during the period. The Company expects
$3 million
to be reclassified from OCI to aircraft rent and
$1 million
to interest
income
within the next twelve months.
76
Fair Value of Financial Instruments on a Recurring Basis
As of
December 31, 2017
, the total cost basis for marketable securities was
$1.4 billion
. There were no significant differences between the cost basis and fair value of any individual class of marketable securities.
Fair values of financial instruments on the consolidated balance sheet (in millions):
|
December 31, 2017
|
Level 1
|
Level 2
|
Total
|
||||||||
|
Assets
|
|||||||||||
|
Marketable securities
|
|||||||||||
|
U.S. government and agency securities
|
$
|
328
|
|
$
|
—
|
|
$
|
328
|
|
||
|
Foreign government bonds
|
—
|
|
43
|
|
43
|
|
|||||
|
Asset-backed securities
|
—
|
|
209
|
|
209
|
|
|||||
|
Mortgage-backed securities
|
—
|
|
99
|
|
99
|
|
|||||
|
Corporate notes and bonds
|
—
|
|
726
|
|
726
|
|
|||||
|
Municipal securities
|
—
|
|
22
|
|
22
|
|
|||||
|
Derivative instruments
|
|||||||||||
|
Fuel hedge contracts—call options
|
—
|
|
22
|
|
22
|
|
|||||
|
Interest rate swap agreements
|
—
|
|
9
|
|
9
|
|
|||||
|
Liabilities
|
|||||||||||
|
Derivative instruments
|
|||||||||||
|
Interest rate swap agreements
|
—
|
|
(8
|
)
|
(8
|
)
|
|||||
|
December 31, 2016
|
Level 1
|
Level 2
|
Total
|
||||||||
|
Assets
|
|||||||||||
|
Marketable securities
|
|||||||||||
|
U.S. government and agency securities
|
$
|
287
|
|
$
|
—
|
|
$
|
287
|
|
||
|
Foreign government bonds
|
—
|
|
36
|
|
36
|
|
|||||
|
Asset-backed securities
|
—
|
|
138
|
|
138
|
|
|||||
|
Mortgage-backed securities
|
—
|
|
89
|
|
89
|
|
|||||
|
Corporate notes and bonds
|
—
|
|
691
|
|
691
|
|
|||||
|
Municipal securities
|
—
|
|
11
|
|
11
|
|
|||||
|
Derivative instruments
|
|||||||||||
|
Fuel hedge contracts—call options
|
—
|
|
20
|
|
20
|
|
|||||
|
Liabilities
|
|||||||||||
|
Derivative instruments
|
|||||||||||
|
Interest rate swap agreements
|
—
|
|
(5
|
)
|
(5
|
)
|
|||||
The Company uses the market and income approach to determine the fair value of marketable securities. U.S. government securities are Level 1 as the fair value is based on quoted prices in active markets. Foreign government bonds, asset-backed securities, mortgage-backed securities, corporate notes and bonds, and municipal securities are Level 2 as the fair value is based on standard valuation models that are calculated based on observable inputs such as quoted interest rates, yield curves, credit ratings of the security and other observable market information.
The Company uses the market and income approaches to determine the fair value of derivative instruments. The fair value for fuel hedge call options is determined utilizing an option pricing model based on inputs that are readily available in active markets or can be derived from information available in active markets. In addition, the fair value considers the exposure to
77
credit losses in the event of non-performance by counterparties. Interest rate swap agreements are Level 2 as the fair value of these contracts is determined based on the difference between the fixed interest rate in the agreements and the observable LIBOR-based interest forward rates at period end, multiplied by the total notional value.
The Company has no other financial assets that are measured at fair value on a nonrecurring basis at
December 31, 2017
.
Activity and Maturities for Marketable Securities
Unrealized losses from marketable securities are primarily attributable to changes in interest rates. Management does not believe any remaining losses represent other-than-temporary impairments based on the Company's evaluation of available evidence as of December 31, 2017.
Activity for marketable securities (in millions):
|
2017
|
2016
|
2015
|
|||||||||
|
Proceeds from sales and maturities
|
$
|
1,388
|
|
$
|
962
|
|
$
|
1,175
|
|
||
Maturities for marketable securities (in millions):
|
December 31, 2017
|
Cost Basis
|
Fair Value
|
|||||
|
Due in one year or less
|
$
|
113
|
|
$
|
113
|
|
|
|
Due after one year through five years
|
1,272
|
|
1,264
|
|
|||
|
Due after five years through 10 years
|
50
|
|
50
|
|
|||
|
Total
|
$
|
1,435
|
|
$
|
1,427
|
|
|
Fair Value of Other Financial Instruments
The Company used the following methods and assumptions to determine the fair value of financial instruments that are not recognized at fair value as described below.
Cash and Cash Equivalents
: Carried at amortized costs which approximate fair value.
Debt
: Debt assumed in the acquisition of Virgin America was subject to a non-recurring fair valuation adjustment as part of purchase price accounting. The adjustment is amortized over the life of the associated debt. All other fixed-rate debt is carried at cost. To estimate the fair value of all fixed-rate as of December 31, 2017, the Company uses the income approach by discounting cash flows using borrowing rates for comparable debt over the weighted life of the outstanding debt. The estimated fair value of the fixed-rate debt is Level 3 as certain inputs used are unobservable.
Fixed-rate debt on the consolidated balance sheet and the estimated fair value of long-term fixed-rate debt (in millions):
|
2017
|
2016
|
||||||
|
Fixed rate debt at cost
|
$
|
956
|
|
$
|
1,175
|
|
|
|
Non-recurring purchase price accounting fair value adjustment
|
3
|
|
4
|
|
|||
|
Total fixed rate debt
|
$
|
959
|
|
$
|
1,179
|
|
|
|
December 31, 2017 estimated fair value
|
$
|
959
|
|
$
|
1,199
|
|
|
78
Long-term debt obligations (in millions):
|
|
2017
|
2016
|
|||||
|
Fixed-rate notes payable due through 2028
|
$
|
959
|
|
$
|
1,179
|
|
|
|
Variable-rate notes payable due through 2028
|
1,625
|
|
1,803
|
|
|||
|
Less debt issuance costs
|
(15
|
)
|
(18
|
)
|
|||
|
Total debt
|
2,569
|
|
2,964
|
|
|||
|
Less current portion
|
307
|
|
319
|
|
|||
|
Long-term debt, less current portion
|
$
|
2,262
|
|
$
|
2,645
|
|
|
|
Weighted-average fixed-interest rate
|
4.2
|
%
|
4.4
|
%
|
|||
|
Weighted-average variable-interest rate
|
2.8
|
%
|
2.4
|
%
|
|||
During
2017
, the Company's total debt
decreased
$395 million
, primarily due to payments of
$397 million
in
2017
, including the prepayment of
$74 million
of debt. Approximately
$2.2 billion
of the loans are secured by a total of
113
aircraft and
two
spare engines. An additional
$392 million
is secured by Air Group's interest in certain aircraft purchase deposits.
The Company's variable-rate debt bears interest at a floating rate per annum equal to a margin plus the three or six-month LIBOR in effect at the commencement of each semi-annual or three-month period, as applicable. As of
December 31, 2017
, none of the Company's borrowings were restricted by financial covenants.
Long-term debt principal payments for the next five years and thereafter (in millions):
|
|
Total
|
||
|
2018
|
$
|
310
|
|
|
2019
|
393
|
|
|
|
2020
|
449
|
|
|
|
2021
|
414
|
|
|
|
2022
|
247
|
|
|
|
Thereafter
|
768
|
|
|
|
Total principal payments
|
$
|
2,581
|
|
Bank Line of Credit
The Company has
three
credit facilities with availability totaling
$475 million
. All
three
facilities have variable interest rates based on LIBOR plus a specified margin.
One
credit facility increased from
$100 million
to
$250 million
in
June 2017
. It expires in
June 2021
and is secured by aircraft. A second credit facility increased from
$52 million
to
$75 million
in
September 2017
. It expires in
September 2018
, has a mechanism for annual renewal, and is secured by aircraft. A third credit facility increased from
$100 million
to
$150 million
in
March 2017
. It expires in
March 2022
and is secured by certain accounts receivable, spare engines, spare parts and ground service equipment. The Company has secured letters of credit against the
$75 million
facility, but has no plans to borrow using either of the
two
other facilities. All
three
credit facilities have a requirement to maintain a minimum unrestricted cash and marketable securities balance of
$500 million
. The Company was in compliance with this covenant at
December 31, 2017
.
Deferred Income Taxes
Deferred income taxes reflect the impact of temporary differences between the carrying amounts of assets and liabilities for financial reporting purposes and such amounts for tax purposes. The Company has a net deferred tax liability, primarily due to differences in depreciation rates for federal income tax purposes and for financial reporting purposes.
79
Deferred tax (assets) and liabilities comprise the following (in millions):
|
|
2017
|
2016
|
|||||
|
Excess of tax over book depreciation
|
$
|
964
|
|
$
|
1,282
|
|
|
|
Intangibles—net
|
14
|
|
39
|
|
|||
|
Other—net
|
43
|
|
26
|
|
|||
|
Gross deferred tax liabilities
|
1,021
|
|
1,347
|
|
|||
|
Mileage Plan™
|
(208
|
)
|
(310
|
)
|
|||
|
Inventory obsolescence
|
(16
|
)
|
(23
|
)
|
|||
|
Deferred gains
|
(5
|
)
|
(8
|
)
|
|||
|
Employee benefits
|
(154
|
)
|
(196
|
)
|
|||
|
Acquired net operating losses
|
(127
|
)
|
(289
|
)
|
|||
|
Other—net
|
(57
|
)
|
(62
|
)
|
|||
|
Gross deferred tax assets
|
(567
|
)
|
(888
|
)
|
|||
|
Valuation allowance
|
—
|
|
4
|
|
|||
|
Net deferred tax (assets) liabilities
|
$
|
454
|
|
$
|
463
|
|
|
On December 22, 2017, the Tax Cuts and Jobs Act was signed into law. The Tax Cuts and Jobs Act changed many aspects of the U.S. corporate income taxation, including but not limited to, a reduction in the corporate income tax rate from 35% to 21% and accelerated depreciation that will allow for full expensing of qualified property. ASC 740 requires a company to record the effects of a tax law change in the period of enactment.
The Company evaluated the impact of the Tax Cuts and Jobs Act and other law changes and recorded a discrete adjustment in our 2017 income tax expense of
$280 million
. The Company will continue to evaluate the impact of the new law and future guidance as issued.
At
December 31, 2017
, the Company had federal NOLs of approximately $
525 million
that expire beginning in
2029
and continuing through
2036
, and state NOLs of approximately $
254 million
that expire beginning in
2028
and continuing through
2035
.
Virgin America experienced multiple “ownership changes” as defined in Section 382 of the Internal Revenue Code of 1986, as amended (the “Code”), the most recent being its acquisition by the Company. Section 382 of the Code imposes an annual limitation on the utilization of pre-ownership change NOLs. Any unused annual limitation may, subject to certain limits, be carried over to later years. The combined Company’s ability to use the NOLs will also depend on the amount of taxable income generated in future periods.
Valuation allowances are provided to reduce the related deferred income tax assets to an amount which will, more likely than not, be realized. As a result of the Company’s assessment of the realization of deferred income tax assets, the Company concluded that it is more likely than not that all of its federal and state deferred income tax assets will be realized and thus no valuation allowance is necessary. The change from 2016 to 2017 was due to the reversal of the valuation allowance related to state NOL carryforwards. The Company reassesses the need for a valuation allowance each reporting period.
80
Components of Income Tax Expense
The components of income tax expense were as follows (in millions):
|
|
2017
|
2016
|
2015
|
||||||||
|
Current income tax expense:
|
|
|
|
||||||||
|
Federal
|
$
|
127
|
|
$
|
392
|
|
$
|
397
|
|
||
|
State
|
35
|
|
48
|
|
30
|
|
|||||
|
Total current income tax expense
|
162
|
|
440
|
|
427
|
|
|||||
|
Deferred income tax expense (benefit):
|
|
|
|
|
|
|
|||||
|
Federal
|
(30
|
)
|
77
|
|
60
|
|
|||||
|
State
|
41
|
|
14
|
|
(23
|
)
|
|||||
|
Total deferred income tax expense (benefit)
|
11
|
|
91
|
|
37
|
|
|||||
|
Income tax expense
|
$
|
173
|
|
$
|
531
|
|
$
|
464
|
|
||
Income Tax Rate Reconciliation
Income tax expense reconciles to the amount computed by applying the U.S. federal rate of
35%
to income before income tax and the 2018 US federal rate of
21%
for deferred taxes as follows (in millions):
|
|
2017
|
2016
|
2015
|
||||||||
|
Income before income tax
|
$
|
1,207
|
|
$
|
1,345
|
|
$
|
1,312
|
|
||
|
Expected tax expense
|
422
|
|
471
|
|
459
|
|
|||||
|
Nondeductible expenses
|
5
|
|
20
|
|
4
|
|
|||||
|
State income taxes
|
29
|
|
28
|
|
19
|
|
|||||
|
State income sourcing
|
9
|
|
13
|
|
(15
|
)
|
|||||
|
Tax law changes
|
(280
|
)
|
—
|
|
—
|
|
|||||
|
Other—net
|
(12
|
)
|
(1
|
)
|
(3
|
)
|
|||||
|
Actual tax expense
|
$
|
173
|
|
$
|
531
|
|
$
|
464
|
|
||
|
Effective tax rate
|
14.3
|
%
|
39.5
|
%
|
35.4
|
%
|
|||||
As a result of tax changes signed into law during 2017, the Company recorded a deferred tax benefit of
$280 million
as a result of the reduction in future corporate income tax rate and other state law changes.
The Company incurred
$39 million
of acquisition-related costs that are not deductible under U.S. federal tax law in
2016
. These expenses are included in Special items—merger-related costs and other on the Company’s consolidated statement of operations and are reflected as a permanent unfavorable adjustment for the year ended December 31, 2016, in the table above.
In the fourth quarter of 2015, the Company filed amended state tax returns for the years 2010 through 2013 to change the Company’s position on income sourcing in various states. These positions were also taken on 2014 and subsequent filings, unless guidance or rules changed. In
2017
, adjustments were made to the Company's position on income sourcing in various states due to updated guidance from state taxing authorities. The impact of this guidance is reflected as an increase in income tax expense of approximately
$9 million
for the year ended
December 31, 2017
.
81
Uncertain Tax Positions
The Company has identified its federal tax return and its state tax returns in Alaska, Oregon and California as “major” tax jurisdictions. A summary of the Company's jurisdictions and the periods that are subject to examination are as follows:
|
Jurisdiction
|
Period
|
|
Federal
|
2007 to 2016
(a)(b)
|
|
Alaska
|
2012 to 2016
|
|
California
|
2006 to 2016
(a)
|
|
Oregon
|
2003 to 2016
(a)
|
|
(a)
|
The 2007-2012 Federal and California Virgin America tax returns are subject to examination only to the extent of net operating loss carryforwards from those years that were utilized in 2012 and later years. The 2003, 2004, 2008-2010 and 2011 Oregon tax returns are subject to examination only to the extent of net operating loss carryforwards from those years that were utilized in 2010 and later years.
|
|
(b)
|
Income tax years 2012 and 2013 are currently under exam by the Internal Revenue Service.
|
Changes in the liability for gross unrecognized tax benefits during
2017
,
2016
and
2015
are as follows (in millions):
|
2017
|
2016
|
2015
|
|||||||||
|
Balance at January 1,
|
$
|
40
|
|
$
|
32
|
|
$
|
3
|
|
||
|
Additions related to prior years
|
16
|
|
—
|
|
29
|
|
|||||
|
Releases related to prior years
|
(2
|
)
|
—
|
|
—
|
|
|||||
|
Additions related to current year activity
|
2
|
|
—
|
|
—
|
|
|||||
|
Additions from acquisitions
|
—
|
|
8
|
|
—
|
|
|||||
|
Releases due to settlements
|
(11
|
)
|
—
|
|
—
|
|
|||||
|
Releases due to lapse of statute of limitations
|
(2
|
)
|
—
|
|
—
|
|
|||||
|
Balance at December 31,
|
$
|
43
|
|
$
|
40
|
|
$
|
32
|
|
||
As of
December 31, 2017
, the Company had
$43 million
of accrued tax contingencies, of which
$36 million
, if fully recognized, would decrease the effective tax rate. As of
December 31, 2017
,
2016
and
2015
, the Company has accrued interest and penalties, net of federal income tax benefit, of
$5 million
,
$3 million
, and
zero
. In
2017
,
2016
, and
2015
, the Company recognized an expense of
$2 million
,
$3 million
, and
zero
for interest and penalties, net of federal income tax benefit. At December 31, 2017, the Company has unrecognized tax benefits recorded as a liability and some reducing deferred tax assets. The Company added
$3 million
of reserves for uncertain tax positions in 2017, primarily due to changes in income sourcing for state income taxes. These uncertain tax positions could change as a result of the Company's ongoing audits, settlement of issues, new audits and status of other taxpayer court cases. The Company cannot predict the timing of these actions. Due to the positions being taken in various jurisdictions, the amounts currently accrued are the Company's best estimate as of December 31, 2017.
Four
qualified defined-benefit plans,
one
non-qualified defined-benefit plan, and
seven
defined-contribution retirement plans cover various employee groups of Alaska, Virgin America, McGee Air Services and Horizon.
The defined-benefit plans provide benefits based on an employee’s term of service and average compensation for a specified period of time before retirement. The qualified defined-benefit pension plans are closed to new entrants.
Accounting standards require recognition of the overfunded or underfunded status of an entity’s defined-benefit pension and other postretirement plan as an asset or liability in the consolidated financial statements and requires recognition of the funded status in AOCL.
Qualified Defined-Benefit Pension Plans
The Company’s
four
qualified defined-benefit pension plans are funded as required by the Employee Retirement Income Security Act of 1974. The defined-benefit plan assets consist primarily of marketable equity and fixed-income securities. The work groups covered by qualified defined-benefit pension plans include salaried employees, pilots, clerical, office, and
82
passenger service employees, and mechanics and related craft employees. The Company uses a December 31 measurement date for these plans.
Weighted average assumptions used to determine benefit obligations:
The rates below vary by plan and related work group.
|
|
2017
|
2016
|
|
|
Discount rates
|
3.69% to 3.78%
|
4.29% to 4.50%
|
|
|
Rate of compensation increases
|
2.11% to 3.00%
|
2.12% to 2.59%
|
|
Weighted average assumptions used to determine net periodic benefit cost:
The rates below vary by plan and related work group.
|
|
2017
|
2016
|
2015
|
||
|
Discount rates
|
4.29% to 4.50%
|
4.55% to 4.69%
|
4.20%
|
||
|
Expected return on plan assets
|
5.50% to 6.00%
|
6.00% to 6.50%
|
6.50%
|
||
|
Rate of compensation increases
|
2.12% to 2.59%
|
2.06% to 2.65%
|
2.85% to 3.91%
|
||
The discount rates are determined using current interest rates earned on high-quality, long-term bonds with maturities that correspond with the estimated cash distributions from the pension plans. At
December 31, 2017
, the Company selected discount rates for each of the plans using a pool of higher-yielding bonds estimated to be more reflective of settlement rates, as management has taken steps to ultimately terminate or settle plans that are frozen and move toward freezing benefits in active plans in the future. In determining the expected return on plan assets, the Company assesses the current level of expected returns on risk-free investments (primarily government bonds), the historical level of the risk premium associated with the other asset classes in which the portfolio is invested and the expectations for future returns of each asset class. The expected return for each asset class is then weighted based on the target asset allocation to develop the expected long-term rate of return on assets assumption for the portfolio.
Plan assets are invested in common commingled trust funds invested in equity and fixed income securities and in certain real estate assets. The target and actual asset allocation of the funds in the qualified defined-benefit plans, by asset category, are as follows:
|
|
Target
|
2017
|
2016
|
||||
|
Asset category:
|
|
|
|||||
|
Domestic equity securities
|
5% - 33%
|
25
|
%
|
30
|
%
|
||
|
Non-U.S. equity securities
|
1% - 16%
|
11
|
%
|
12
|
%
|
||
|
Fixed income securities
|
48% - 95%
|
59
|
%
|
53
|
%
|
||
|
Real estate
|
2% - 8%
|
4
|
%
|
5
|
%
|
||
|
Cash equivalents
|
0%
|
1
|
%
|
—
|
%
|
||
|
Plan assets
|
100
|
%
|
100
|
%
|
|||
The Company’s investment policy focuses on achieving maximum returns at a reasonable risk for pension assets over a full market cycle. The Company determines the strategic allocation between equities, fixed income and real estate based on current funded status and other characteristics of the plans. As the funded status improves, the Company increases the fixed income allocation of the portfolio and decreases the equity allocation. Actual asset allocations are reviewed regularly and periodically rebalanced as appropriate.
Plan assets invested in common commingled trust funds are fair valued using the net asset values of these funds to determine fair value as allowed using the practical expediency method outlined in the accounting standards. Fair value estimates for real estate are calculated using the present value of expected future cash flows based on independent appraisals, local market conditions and current and projected operating performance.
83
Plan asset by fund category (in millions):
|
|
2017
|
2016
|
Fair Value Hierarchy
|
||||||
|
Fund type:
|
|
|
|||||||
|
U.S. equity market fund
|
$
|
515
|
|
$
|
545
|
|
1
|
||
|
Non-U.S. equity fund
|
226
|
|
218
|
|
1
|
||||
|
Credit bond index fund
|
1,232
|
|
989
|
|
1
|
||||
|
Plan assets in common commingled trusts
|
$
|
1,973
|
|
$
|
1,752
|
|
|||
|
Real estate
|
97
|
|
91
|
|
(a)
|
||||
|
Cash equivalents
|
13
|
|
3
|
|
1
|
||||
|
Total plan assets
|
$
|
2,083
|
|
$
|
1,846
|
|
|||
|
(a)
|
In accordance with Subtopic 820-10, certain investments that are measured at net asset value per share (or its equivalent) have not been classified in the fair value hierarchy.
|
The following table sets forth the status of the qualified defined-benefit pension plans (in millions):
|
|
2017
|
2016
|
|||||
|
Projected benefit obligation (PBO)
|
|
|
|||||
|
Beginning of year
|
$
|
2,043
|
|
$
|
1,898
|
|
|
|
Service cost
|
39
|
|
37
|
|
|||
|
Interest cost
|
74
|
|
73
|
|
|||
|
Actuarial loss
|
300
|
|
104
|
|
|||
|
Benefits paid
|
(69
|
)
|
(69
|
)
|
|||
|
End of year
|
$
|
2,387
|
|
$
|
2,043
|
|
|
|
Plan assets at fair value
|
|
|
|
|
|||
|
Beginning of year
|
$
|
1,846
|
|
$
|
1,737
|
|
|
|
Actual return on plan assets
|
291
|
|
178
|
|
|||
|
Employer contributions
|
15
|
|
—
|
|
|||
|
Benefits paid
|
(69
|
)
|
(69
|
)
|
|||
|
End of year
|
$
|
2,083
|
|
$
|
1,846
|
|
|
|
Unfunded status
|
$
|
(304
|
)
|
$
|
(197
|
)
|
|
|
Percent funded
|
87
|
%
|
90
|
%
|
|||
The accumulated benefit obligation for the combined qualified defined-benefit pension plans was
$2.2 billion
and
$1.9 billion
at
December 31, 2017
and
2016
.
The amounts recognized in the consolidated balance sheets (in millions):
|
|
2017
|
2016
|
|||||
|
Accrued benefit liability-long term
|
$
|
335
|
|
$
|
225
|
|
|
|
Plan assets-long term (within Other noncurrent assets)
|
(31
|
)
|
(28
|
)
|
|||
|
Total liability recognized
|
$
|
304
|
|
$
|
197
|
|
|
The amounts not yet reflected in net periodic benefit cost and included in AOCL (in millions):
|
|
2017
|
2016
|
|||||
|
Prior service credit
|
$
|
(9
|
)
|
$
|
(10
|
)
|
|
|
Net loss
|
597
|
|
509
|
|
|||
|
Amount recognized in AOCL (pretax)
|
$
|
588
|
|
$
|
499
|
|
|
84
The expected amortization of prior service credit and net loss from AOCL in
2018
is
$1 million
and
$31 million
, respectively, for the qualified defined-benefit pension plans.
Net pension expense for the qualified defined-benefit plans included the following components (in millions):
|
|
2017
|
2016
|
2015
|
||||||||
|
Service cost
|
$
|
39
|
|
$
|
37
|
|
$
|
41
|
|
||
|
Interest cost
|
74
|
|
73
|
|
84
|
|
|||||
|
Expected return on assets
|
(106
|
)
|
(108
|
)
|
(122
|
)
|
|||||
|
Amortization of prior service credit
|
(1
|
)
|
(1
|
)
|
(1
|
)
|
|||||
|
Recognized actuarial loss
|
26
|
|
25
|
|
26
|
|
|||||
|
Settlement expense
(special item)
|
—
|
|
—
|
|
14
|
|
|||||
|
Net pension expense
|
$
|
32
|
|
$
|
26
|
|
$
|
42
|
|
||
In 2015, the Company recognized a settlement charge of
$14 million
related to lump sum settlements offered to terminated, vested plan participants. The result was a reduction in the projected benefit obligation of
$62 million
. The settlement charge reflects the remaining unamortized actuarial loss in AOCL associated with the settled obligation.
There are no current statutory funding requirements for the Company’s plans in
2018
.
Future benefits expected to be paid over the next ten years under the qualified defined-benefit pension plans from the assets of those plans (in millions):
|
Total
|
|||
|
2018
|
$
|
97
|
|
|
2019
|
101
|
|
|
|
2020
|
116
|
|
|
|
2021
|
116
|
|
|
|
2022
|
130
|
|
|
|
2023– 2027
|
723
|
|
|
Nonqualified Defined-Benefit Pension Plan
Alaska also maintains an unfunded, noncontributory defined-benefit plan for certain elected officers. This plan uses a December 31 measurement date. The assumptions used to determine benefit obligations and the net period benefit cost for the nonqualified defined-benefit pension plan are similar to those used to calculate the qualified defined-benefit pension plan. The plan's unfunded status, PBO and accumulated benefit obligation are immaterial. The net pension expense in prior year and expected future expense is also immaterial.
Postretirement Medical Benefits
The Company allows certain retirees to continue their medical, dental and vision benefits by paying all or a portion of the active employee plan premium until eligible for Medicare, currently age 65. This results in a subsidy to retirees, because the premiums received by the Company are less than the actual cost of the retirees’ claims. The accumulated postretirement benefit obligation for this subsidy is unfunded. The accumulated postretirement benefit obligation was
$85 million
and
$76 million
at
December 31, 2017
and
2016
, respectively. The net periodic benefit cost was not material in
2017
or
2016
.
Defined-Contribution Plans
The
seven
defined-contribution plans are deferred compensation plans under section 401(k) of the Internal Revenue Code. All of these plans require Company contributions. Total expense for the defined-contribution plans was
$103 million
,
$67 million
and
$60 million
in
2017
,
2016
, and
2015
, respectively.
85
The Company also has a noncontributory, unfunded defined-contribution plan for certain elected officers of the Company who are ineligible for the nonqualified defined-benefit pension plan. Amounts recorded as liabilities under the plan are not material to the consolidated balance sheets at
December 31, 2017
and
2016
.
Pilot Long-term Disability Benefits
Alaska maintains a long-term disability plan for its pilots. The long-term disability plan does not have a service requirement. Therefore, the liability is calculated based on estimated future benefit payments associated with pilots that were assumed to be disabled on a long-term basis as of
December 31, 2017
and does not include any assumptions for future disability. The liability includes the discounted expected future benefit payments and medical costs. The total liability was
$28 million
and
$25 million
, which was recorded net of a prefunded trust account of
$3 million
and
$3 million
, and included in long-term other liabilities on the consolidated balance sheets as of
December 31, 2017
and
December 31, 2016
, respectively.
Employee Incentive-Pay Plans
The Company has employee incentive plans that pay employees based on certain financial and operational metrics. These metrics are set and approved annually by the Compensation Committee of the Board of Directors. The aggregate expense under these plans in
2017
,
2016
and
2015
was
$135 million
,
$127 million
and
$120 million
. The Air Group plans are summarized below.
|
•
|
Performance-Based Pay
(PBP) is a program that rewards the majority of Air Group employees. The program is based on six separate metrics related to Air Group profitability, safety, loyalty Mileage Plan™ and credit card growth, achievement of unit-cost goals and employee engagement as measured by customer satisfaction.
|
|
•
|
The
Operational Performance Rewards Program
entitles the majority of Air Group employees to quarterly payouts of up to
$300
per person if certain operational and customer service objectives are met.
|
Future minimum payments for commitments as of
December 31, 2017
(in millions):
|
|
Aircraft Leases
|
Facility Leases
|
Aircraft Purchase Commitments
|
Capacity Purchase Agreements
(a)
|
Aircraft Maintenance Deposits
|
Aircraft Maintenance and Parts Management
|
|||||||||||||||||
|
2018
|
$
|
354
|
|
$
|
77
|
|
$
|
955
|
|
$
|
129
|
|
$
|
61
|
|
$
|
98
|
|
|||||
|
2019
|
356
|
|
67
|
|
816
|
|
151
|
|
65
|
|
102
|
|
|||||||||||
|
2020
|
330
|
|
61
|
|
377
|
|
159
|
|
68
|
|
105
|
|
|||||||||||
|
2021
|
285
|
|
53
|
|
268
|
|
165
|
|
64
|
|
121
|
|
|||||||||||
|
2022
|
262
|
|
34
|
|
193
|
|
173
|
|
52
|
|
76
|
|
|||||||||||
|
Thereafter
|
1,021
|
|
142
|
|
145
|
|
1,079
|
|
39
|
|
80
|
|
|||||||||||
|
Total
|
$
|
2,608
|
|
$
|
434
|
|
$
|
2,754
|
|
$
|
1,856
|
|
$
|
349
|
|
$
|
582
|
|
|||||
|
(a)
|
Includes all non-aircraft lease costs associated with capacity purchase agreements.
|
Lease Commitments
Aircraft lease commitments include future obligations for all of the Company's operating airlines—Alaska, Virgin America and Horizon, as well as aircraft leases operated by third parties. At
December 31, 2017
, the Company had lease contracts for
10
B737 (B737) aircraft,
57
Airbus aircraft,
15
Bombardier Q400 aircraft, and
23
Embraer 175 (E175) aircraft with SkyWest Airlines, Inc. (SkyWest). The Company has an additional
six
scheduled lease deliveries of A321neo aircraft through
2018
, as well as
12
scheduled lease deliveries of E175 aircraft through
2018
to be operated by SkyWest. All lease contracts have remaining non-cancelable lease terms ranging from
2018
to
2030
. The Company has the option to increase capacity flown by SkyWest with
eight
additional E175 aircraft with deliveries in
2020
. Options to lease are not reflected in the commitments table above.
Facility lease commitments primarily include airport and terminal facilities and building leases. Total rent expense for aircraft and facility leases was
$552 million
,
$315 million
and
$295 million
, in
2017
,
2016
and
2015
.
86
Aircraft Purchase Commitments
Aircraft purchase commitments include non-cancelable contractual commitments for aircrafts and engines. As of
December 31, 2017
, the Company had commitments to purchase
44
B737 aircraft (
12
B737 NextGen aircraft and
32
B737 MAX aircraft, with deliveries in
2018
through
2023
) and
23
E175 aircraft with deliveries in
2018
through
2019
. The Company also has cancelable purchase commitments for
30
Airbus A320neo aircraft with deliveries from
2020
through
2022
. In addition, the Company has options to purchase
37
B737 aircraft and
30
E175 aircraft. The cancelable purchase commitments and option payments are not reflected in the table above.
The Company expects to defer certain purchase commitments in 2019 and beyond, which is not currently reflected in the contractual aircraft purchase commitments above.
Capacity Purchase Agreements (CPAs)
At
December 31, 2017
, Alaska had CPAs with
three
carriers, including the Company's wholly-owned subsidiary, Horizon. Horizon sells
100%
of its capacity under a CPA with Alaska. In addition, Alaska has CPAs with SkyWest to fly certain routes in the Lower 48 and Canada and with Peninsula Airways, Inc. (PenAir) to fly certain routes in the state of Alaska. Under these agreements, Alaska pays the carriers an amount which is based on a determination of their cost of operating those flights and other factors intended to approximate market rates for those services. Future payments (excluding Horizon) are based on minimum levels of flying by the third-party carriers, which could differ materially due to variable payments based on actual levels of flying and certain costs associated with operating flights such as fuel.
Aircraft Maintenance Deposits
Certain Airbus leases include contractually required maintenance deposit payments to the lessor, which collateralize the lessor for future maintenance events should the Company not perform required maintenance. Most of the lease agreements provide that maintenance deposits are reimbursable upon completion of the major maintenance event in an amount equal to the lesser of (i) the amount qualified for reimbursement from maintenance deposits held by the lessor associated with the specific major maintenance event or (ii) the qualifying costs related to the specific major maintenance event.
Aircraft Maintenance and Parts Management
Through its acquisition of Virgin America, the Company has a separate maintenance-cost-per-hour contract for management and repair of certain rotable parts to support Airbus airframe and engine maintenance and repair. On October 1, 2017, Alaska entered into a similar contract for maintenance on its B737-800 aircraft engines. These agreements require monthly payments based upon utilization, such as flight hours, cycles and age of the aircraft, and, in turn, the agreement transfers certain risks to the third-party service provider. There are minimum payments under both agreements, which are reflected in the table above. Accordingly, payments could differ materially based on actual aircraft utilization.
Contingencies
The Company is a party to routine litigation matters incidental to its business and with respect to which no material liability is expected. Liabilities for litigation related contingencies are recorded when a loss is determined to be probable and estimable.
In 2015, three flight attendants filed a class action lawsuit seeking to represent all Virgin America flight attendants for damages based on alleged violations of California and City of San Francisco wage and hour laws. Plaintiffs received class certification in November 2016. Virgin America filed a motion for summary judgment seeking to dismiss all claims on various federal preemption grounds. In January 2017, the Court denied in part and granted in part Virgin America’s motion. In January 2018, Virgin America filed a motion to decertify the class and Plaintiffs filed a motion for summary judgment seeking the court to rule in their favor on all remaining claims. The Company believes the claims in this case are without factual and legal merit and intends to defend this lawsuit.
Management believes the ultimate disposition of these matters is not likely to materially affect the Company's financial position or results of operations. This forward-looking statement is based on management's current understanding of the relevant law and facts, and it is subject to various contingencies, including the potential costs and risks associated with litigation and the actions of arbitrators, judges and juries.
87
Common Stock Changes
During the second quarter of 2017, shareholders voted to increase the number of authorized shares of common stock from
200 million
to
400 million
.
Dividends
During
2017
, the Board of Directors declared dividends of
$1.20
per share. The Company paid dividends of
$148 million
,
$136 million
and
$102 million
to shareholders of record during
2017
,
2016
and
2015
.
Subsequent to year-end, the Board of Directors declared a quarterly cash dividend of
$0.32
per share to be paid in March 2018 to shareholders of record as of February 20, 2018. This is a
7%
increase from the most recent quarterly dividend of
$0.30
per share.
Common Stock Repurchase
In
May 2014
, the Board of Directors authorized a
$650 million
share repurchase program, which was completed in
October 2015
. In
August 2015
, the Board of Directors authorized a
$1 billion
share repurchase program. As of
December 31, 2017
, the Company has repurchased
5.1 million
shares for
$388 million
under this program.
At
December 31, 2017
, the Company held
6,842,860
shares in treasury. Management does not anticipate retiring common shares held in treasury for the foreseeable future.
Share repurchase activity (in millions, except shares):
|
2017
|
2016
|
2015
|
||||||||||||||||||
|
|
Shares
|
Amount
|
Shares
|
Amount
|
Shares
|
Amount
|
||||||||||||||
|
2015 Repurchase Program – $1 billion
|
981,277
|
|
$
|
75
|
|
2,594,809
|
|
$
|
193
|
|
1,517,277
|
|
$
|
120
|
|
|||||
|
2014 Repurchase Program – $650 million
|
—
|
|
—
|
|
—
|
|
—
|
|
5,691,051
|
|
385
|
|
||||||||
|
Total
|
981,277
|
|
$
|
75
|
|
2,594,809
|
|
$
|
193
|
|
7,208,328
|
|
$
|
505
|
|
|||||
Accumulated Other Comprehensive Loss (AOCL)
AOCL consisted of the following (in millions, net of tax):
|
|
2017
|
2016
|
|||||
|
Related to marketable securities
|
$
|
(5
|
)
|
$
|
(3
|
)
|
|
|
Related to employee benefit plans
|
(376
|
)
|
(299
|
)
|
|||
|
Related to interest rate derivatives
|
1
|
|
(3
|
)
|
|||
|
|
$
|
(380
|
)
|
$
|
(305
|
)
|
|
In relation to the Tax Cuts and Jobs Act, amounts recognized in other comprehensive income subsequent to the December 22, 2017 enactment date, are taxed at the revised federal income tax rates. The Company's actuarial adjustments for employee benefit plans occur annually at December 31, and therefore are tax effected at the new lower rates. Accordingly, the effective tax rate for employee benefit plan amounts recognized in other comprehensive income at December 31, 2017 is lower than it historically has been.
88
In 2017, the Company recognized special items of
$118 million
for merger-related costs associated with its acquisition of Virgin America. Costs classified as merger-related are directly attributable to merger activities. The Company also recognized a special tax benefit of
$280 million
due to the remeasurement of net deferred tax liabilities as a result of the Tax Cuts and Jobs Act signed into law on December 22, 2017, partially offset by certain state tax law enactments.
In 2016, the Company recognized
$117 million
in merger-related costs.
$39 million
of these costs were not deductible under the U.S. federal tax law, as discussed in
Note 6
. The Company recognized a special tax expense of
$17 million
representing the impact of adjustments to the Company's position on income sourcing in various states.
In 2015, the Company recognized special items of
$32 million
in aggregate. The special items included expense of
$14 million
for a lump sum settlements offered to terminated and vested participants in the qualified defined benefit pension plans and a litigation-related matter. See
Note 7
for more information regarding the pension settlement charge. The Company also recognized a special tax benefit of
$26 million
representing the discrete impacts of adjustments to the Company's position on income sourcing in various states.
The following breaks down merger-related costs incurred in 2017 and 2016 (in millions):
|
2017
|
2016
|
||||||
|
Consulting and professional services
|
$
|
52
|
|
$
|
32
|
|
|
|
Severance and retention benefits
|
40
|
|
22
|
|
|||
|
Banking fees
|
—
|
|
36
|
|
|||
|
Legal and accounting fees
|
3
|
|
22
|
|
|||
|
Other merger-related costs
(a)
|
23
|
|
5
|
|
|||
|
Total Merger-related Costs
|
$
|
118
|
|
$
|
117
|
|
|
|
(a)
|
Other merger-related costs consist primarily of costs for marketing and advertising, IT, training and skill development, employee appreciation and company sponsored events, moving expenses, supplies, and other immaterial expenses.
|
The Company has various equity incentive plans under which it may grant stock awards to directors, officers and employees. The Company also has an employee stock purchase plan.
The table below summarizes the components of total stock-based compensation (in millions):
|
2017
|
2016
|
2015
|
|||||||||
|
Stock options
|
$
|
3
|
|
$
|
2
|
|
$
|
2
|
|
||
|
Stock awards
|
24
|
|
11
|
|
11
|
|
|||||
|
Deferred stock awards
|
1
|
|
1
|
|
1
|
|
|||||
|
Employee stock purchase plan
|
6
|
|
5
|
|
3
|
|
|||||
|
Stock-based compensation
|
$
|
34
|
|
$
|
19
|
|
$
|
17
|
|
||
|
Tax benefit related to stock-based compensation
|
$
|
13
|
|
$
|
7
|
|
$
|
7
|
|
||
Unrecognized stock-based compensation for non-vested options and awards and the weighted-average period the expense will be recognized (in millions):
|
Amount
|
Weighted-Average
Period
|
||||
|
Stock options
|
$
|
3
|
|
1.2
|
|
|
Stock awards
|
34
|
|
1.7
|
||
|
Unrecognized stock-based compensation
|
$
|
37
|
|
1.7
|
|
The Company is authorized to issue
17 million
shares of common stock under these plans, of which
10,927,824
shares remain available for future grants of either options or stock awards as of
December 31, 2017
.
89
Stock Options
Stock options to purchase common stock are granted at the fair market value of the stock on the date of grant. The stock options granted have terms of up to ten years.
The fair value of each option grant was estimated on the date of grant using the Black-Scholes option-pricing model with the following weighted-average assumptions used for grants:
|
|
2017
|
2016
|
2015
|
||||||||
|
Expected volatility
|
51
|
%
|
51
|
%
|
53
|
%
|
|||||
|
Expected term
|
6 years
|
|
6 years
|
|
6 years
|
|
|||||
|
Risk-free interest rate
|
2.04
|
%
|
1.23
|
%
|
1.67
|
%
|
|||||
|
Expected dividend yield
|
1.10
|
%
|
1.50
|
%
|
1.25
|
%
|
|||||
|
Weighted-average grant date fair value per share
|
$
|
41.19
|
|
$
|
27.14
|
|
$
|
28.71
|
|
||
|
Estimated fair value of options granted (millions)
|
$
|
4
|
|
$
|
2
|
|
$
|
3
|
|
||
The expected market price volatility and expected term are based on historical results. The risk-free interest rate is based on the U.S. Treasury yield curve in effect at the time of the grant. The expected dividend yield is based on the estimated weighted average dividend yield over the expected term. The expected forfeiture rates are based on historical experience.
The tables below summarize stock option activity for the year ended
December 31, 2017
:
|
|
Shares
|
Weighted-
Average Exercise Price Per Share
|
Weighted-
Average
Contractual Life (Years)
|
Aggregate Intrinsic
Value
(in millions)
|
||||||||
|
Outstanding, December 31, 2016
|
453,674
|
|
$
|
40.02
|
|
6.2
|
$
|
22
|
|
|||
|
Granted
|
88,580
|
|
94.67
|
|
|
|
||||||
|
Exercised
|
(91,013
|
)
|
31.31
|
|
|
|
||||||
|
Canceled
|
—
|
|
—
|
|
||||||||
|
Forfeited or expired
|
(9,774
|
)
|
60.33
|
|
|
|
||||||
|
Outstanding, December 31, 2017
|
441,467
|
|
$
|
52.34
|
|
6.0
|
$
|
11
|
|
|||
|
Exercisable, December 31, 2017
|
229,233
|
|
$
|
32.08
|
|
4.9
|
$
|
9
|
|
|||
|
Vested or expected to vest, December 31, 2017
|
441,467
|
|
$
|
52.34
|
|
6.0
|
$
|
11
|
|
|||
|
(in millions)
|
2017
|
2016
|
2015
|
||||||||
|
Intrinsic value of option exercises
|
$
|
6
|
|
$
|
9
|
|
$
|
14
|
|
||
|
Cash received from stock option exercises
|
3
|
|
3
|
|
4
|
|
|||||
|
Tax benefit related to stock option exercises
|
2
|
|
3
|
|
5
|
|
|||||
|
Fair value of options vested
|
3
|
|
3
|
|
3
|
|
|||||
Stock Awards
Restricted Stock Units (RSUs) are awarded to eligible employees and entitle the grantee to receive shares of common stock at the end of the vest period. The fair value of the RSUs is based on the stock price on the date of grant. Generally, RSUs “cliff vest” after three years, or the period from the date of grant to the employee’s retirement eligibility, and expense is recognized accordingly. Performance Share Units (PSUs) are awarded to certain executives to receive shares of common stock if specific performance goals and market conditions are achieved. There are several tranches of PSUs which vest when performance goals and market conditions are met.
90
The following table summarizes information about outstanding stock awards:
|
|
Number
of Units
|
Weighted-Average Grant Date Fair Value
|
Weighted-
Average
Contractual
Life (Years)
|
Aggregate
Intrinsic
Value (in
millions)
|
||||||||
|
Non-vested, December 31, 2016
|
440,093
|
|
$
|
63.86
|
|
1.4
|
$
|
39
|
|
|||
|
Granted
|
433,340
|
|
88.43
|
|
|
|
|
|||||
|
Vested
|
(286,138
|
)
|
61.47
|
|
|
|
|
|||||
|
Forfeited
|
(62,150
|
)
|
65.06
|
|
|
|
|
|||||
|
Non-vested, December 31, 2017
|
525,145
|
|
$
|
85.47
|
|
1.6
|
$
|
39
|
|
|||
Deferred Stock Awards
Deferred Stock Units (DSUs) are awarded to members of the Board of Directors as part of their retainers. The underlying common shares are issued upon retirement from the Board, but require no future service period. As a result, the entire intrinsic value of the awards is expensed on the date of grant.
Employee Stock Purchase Plan
The ESPP allows employees to purchase common stock at
85%
of the stock price on the first day of the offering period or the specified purchase date, whichever is lower. Employees may contribute up to
10%
of their base earnings during the offering period to purchase stock. Employees purchased
406,628
,
308,920
and
281,058
shares in
2017
,
2016
and
2015
under the ESPP.
Alaska Air Group has three operating airlines—Alaska, Virgin America and Horizon. Each is a regulated airline by the U.S. Department of Transportation’s Federal Aviation Administration. Alaska has CPAs for regional capacity with Horizon, as well as with third-party carriers SkyWest and PenAir, under which Alaska receives all passenger revenues.
Under U.S. General Accepted Accounting Principles, operating segments are defined as components of a business for which there is discrete financial information that is regularly assessed by the Chief Operating Decision Maker (CODM) in making resource allocation decisions. Financial performance for the operating airlines and CPAs is managed and reviewed by the Company's CODM as part of three reportable operating segments:
|
•
|
Mainline
- includes Alaska's and Virgin America’s scheduled air transportation for passengers and cargo throughout the U.S., and in parts of Canada, Mexico, and Latin America.
|
|
•
|
Regional
- includes Horizon's and other third-party carriers’ scheduled air transportation for passengers across a shorter distance network within the U.S. under CPAs. This segment includes the actual revenues and expenses associated with regional flying, as well as an allocation of corporate overhead incurred by Air Group on behalf of the regional operations.
|
|
•
|
Horizon
- includes the capacity sold to Alaska under CPA. Expenses include those typically borne by regional airlines such as crew costs, ownership costs and maintenance costs.
|
The CODM makes resource allocation decisions for these reporting segments based on flight profitability data, aircraft type, route economics and other financial information.
The "Consolidating and Other" column reflects parent company activity, McGee Air Services, consolidating entries and other immaterial business units of the company. The “Air Group Adjusted” column represents a non-GAAP measure that is used by the Company CODM to evaluate performance and allocate resources. Adjustments are further explained below in reconciling to consolidated GAAP results.
91
Operating segment information is as follows (in millions):
|
Year Ended December 31, 2017
|
Mainline
|
Regional
|
Horizon
|
Consolidating & Other
(b)
|
Air Group Adjusted
(c)
|
Special Items
(d)
|
Consolidated
|
||||||||||||||||||||
|
Operating revenues
|
|
|
|
||||||||||||||||||||||||
|
Passenger
|
|||||||||||||||||||||||||||
|
Mainline
|
$
|
5,858
|
|
$
|
—
|
|
$
|
—
|
|
$
|
—
|
|
$
|
5,858
|
|
$
|
—
|
|
$
|
5,858
|
|
||||||
|
Regional
|
—
|
|
960
|
|
—
|
|
—
|
|
960
|
|
—
|
|
960
|
|
|||||||||||||
|
Total passenger revenues
|
5,858
|
|
960
|
|
—
|
|
—
|
|
6,818
|
|
—
|
|
6,818
|
|
|||||||||||||
|
CPA revenues
|
—
|
|
—
|
|
426
|
|
(426
|
)
|
—
|
|
—
|
|
—
|
|
|||||||||||||
|
Freight and mail
|
110
|
|
4
|
|
—
|
|
—
|
|
114
|
|
—
|
|
114
|
|
|||||||||||||
|
Other-net
|
922
|
|
74
|
|
4
|
|
1
|
|
1,001
|
|
—
|
|
1,001
|
|
|||||||||||||
|
Total operating revenues
|
6,890
|
|
1,038
|
|
430
|
|
(425
|
)
|
7,933
|
|
—
|
|
7,933
|
|
|||||||||||||
|
Operating expenses
|
|||||||||||||||||||||||||||
|
Operating expenses, excluding fuel
|
4,257
|
|
851
|
|
427
|
|
(427
|
)
|
5,108
|
|
118
|
|
5,226
|
|
|||||||||||||
|
Fuel expense
|
1,282
|
|
172
|
|
—
|
|
—
|
|
1,454
|
|
(7
|
)
|
1,447
|
|
|||||||||||||
|
Total operating expenses
|
5,539
|
|
1,023
|
|
427
|
|
(427
|
)
|
6,562
|
|
111
|
|
6,673
|
|
|||||||||||||
|
Nonoperating income (expense)
|
|||||||||||||||||||||||||||
|
Interest income
|
39
|
|
—
|
|
—
|
|
(5
|
)
|
34
|
|
—
|
|
34
|
|
|||||||||||||
|
Interest expense
|
(92
|
)
|
—
|
|
(13
|
)
|
2
|
|
(103
|
)
|
—
|
|
(103
|
)
|
|||||||||||||
|
Other
|
14
|
|
—
|
|
2
|
|
—
|
|
16
|
|
—
|
|
16
|
|
|||||||||||||
|
(39
|
)
|
—
|
|
(11
|
)
|
(3
|
)
|
(53
|
)
|
—
|
|
(53
|
)
|
||||||||||||||
|
Income (loss) before income tax
|
$
|
1,312
|
|
$
|
15
|
|
$
|
(8
|
)
|
$
|
(1
|
)
|
$
|
1,318
|
|
$
|
(111
|
)
|
$
|
1,207
|
|
||||||
|
Year Ended December 31, 2016
|
Mainline
(a)
|
Regional
|
Horizon
|
Consolidating & Other
(b)
|
Air Group Adjusted
(c)
|
Special Items
(d)
|
Consolidated
|
||||||||||||||||||||
|
Operating revenues
|
|
|
|
||||||||||||||||||||||||
|
Passenger
|
|||||||||||||||||||||||||||
|
Mainline
|
$
|
4,098
|
|
$
|
—
|
|
$
|
—
|
|
$
|
—
|
|
$
|
4,098
|
|
$
|
—
|
|
$
|
4,098
|
|
||||||
|
Regional
|
—
|
|
908
|
|
—
|
|
—
|
|
908
|
|
—
|
|
908
|
|
|||||||||||||
|
Total passenger revenues
|
4,098
|
|
908
|
|
—
|
|
—
|
|
5,006
|
|
—
|
|
5,006
|
|
|||||||||||||
|
CPA revenues
|
—
|
|
—
|
|
424
|
|
(424
|
)
|
—
|
|
—
|
|
—
|
|
|||||||||||||
|
Freight and mail
|
104
|
|
5
|
|
—
|
|
(1
|
)
|
108
|
|
—
|
|
108
|
|
|||||||||||||
|
Other-net
|
738
|
|
74
|
|
4
|
|
1
|
|
817
|
|
—
|
|
817
|
|
|||||||||||||
|
Total operating revenues
|
4,940
|
|
987
|
|
428
|
|
(424
|
)
|
5,931
|
|
—
|
|
5,931
|
|
|||||||||||||
|
Operating expenses
|
|||||||||||||||||||||||||||
|
Operating expenses, excluding fuel
|
2,883
|
|
769
|
|
407
|
|
(425
|
)
|
3,634
|
|
117
|
|
3,751
|
|
|||||||||||||
|
Fuel expense
|
719
|
|
125
|
|
—
|
|
—
|
|
844
|
|
(13
|
)
|
831
|
|
|||||||||||||
|
Total operating expenses
|
3,602
|
|
894
|
|
407
|
|
(425
|
)
|
4,478
|
|
104
|
|
4,582
|
|
|||||||||||||
|
Nonoperating income (expense)
|
|||||||||||||||||||||||||||
|
Interest income
|
26
|
|
—
|
|
1
|
|
—
|
|
27
|
|
—
|
|
27
|
|
|||||||||||||
|
Interest expense
|
(42
|
)
|
—
|
|
(9
|
)
|
(4
|
)
|
(55
|
)
|
—
|
|
(55
|
)
|
|||||||||||||
|
Other
|
19
|
|
—
|
|
1
|
|
4
|
|
24
|
|
—
|
|
24
|
|
|||||||||||||
|
3
|
|
—
|
|
(7
|
)
|
—
|
|
(4
|
)
|
—
|
|
(4
|
)
|
||||||||||||||
|
Income (loss) before income tax
|
$
|
1,341
|
|
$
|
93
|
|
$
|
14
|
|
$
|
1
|
|
$
|
1,449
|
|
$
|
(104
|
)
|
$
|
1,345
|
|
||||||
92
|
Year Ended December 31, 2015
|
Mainline
|
Regional
|
Horizon
|
Consolidating & Other
(b)
|
Air Group Adjusted
(c)
|
Special Items
(d)
|
Consolidated
|
||||||||||||||||||||
|
Operating revenues
|
|
|
|
||||||||||||||||||||||||
|
Passenger
|
|||||||||||||||||||||||||||
|
Mainline
|
$
|
3,939
|
|
$
|
—
|
|
$
|
—
|
|
$
|
—
|
|
$
|
3,939
|
|
$
|
—
|
|
$
|
3,939
|
|
||||||
|
Regional
|
—
|
|
854
|
|
—
|
|
—
|
|
854
|
|
—
|
|
854
|
|
|||||||||||||
|
Total passenger revenues
|
3,939
|
|
854
|
|
—
|
|
—
|
|
4,793
|
|
—
|
|
4,793
|
|
|||||||||||||
|
CPA revenues
|
—
|
|
—
|
|
408
|
|
(408
|
)
|
—
|
|
—
|
|
—
|
|
|||||||||||||
|
Freight and mail
|
103
|
|
5
|
|
—
|
|
—
|
|
108
|
|
—
|
|
108
|
|
|||||||||||||
|
Other-net
|
621
|
|
72
|
|
4
|
|
—
|
|
697
|
|
—
|
|
697
|
|
|||||||||||||
|
Total operating revenues
|
4,663
|
|
931
|
|
412
|
|
(408
|
)
|
5,598
|
|
—
|
|
5,598
|
|
|||||||||||||
|
Operating expenses
|
|||||||||||||||||||||||||||
|
Operating expenses, excluding fuel
|
2,653
|
|
695
|
|
375
|
|
(409
|
)
|
3,314
|
|
32
|
|
3,346
|
|
|||||||||||||
|
Fuel expense
|
823
|
|
131
|
|
—
|
|
—
|
|
954
|
|
—
|
|
954
|
|
|||||||||||||
|
Total operating expenses
|
3,476
|
|
826
|
|
375
|
|
(409
|
)
|
4,268
|
|
32
|
|
4,300
|
|
|||||||||||||
|
Nonoperating income (expense)
|
|||||||||||||||||||||||||||
|
Interest income
|
19
|
|
—
|
|
—
|
|
2
|
|
21
|
|
—
|
|
21
|
|
|||||||||||||
|
Interest expense
|
(28
|
)
|
—
|
|
(10
|
)
|
(4
|
)
|
(42
|
)
|
—
|
|
(42
|
)
|
|||||||||||||
|
Other
|
28
|
|
—
|
|
1
|
|
6
|
|
35
|
|
—
|
|
35
|
|
|||||||||||||
|
19
|
|
—
|
|
(9
|
)
|
4
|
|
14
|
|
—
|
|
14
|
|
||||||||||||||
|
Income (loss) before income tax
|
$
|
1,206
|
|
$
|
105
|
|
$
|
28
|
|
$
|
5
|
|
$
|
1,344
|
|
$
|
(32
|
)
|
$
|
1,312
|
|
||||||
|
(a)
|
As the acquisition of Virgin America closed on December 14, 2016, Mainline financial results, presented above include Virgin America for the twelve months ended
December 31, 2017
, and not for the prior period. Financial results also reflect the impacts of purchase accounting.
|
|
(b)
|
Includes consolidating entries, Parent Company, McGee Air Services, and other immaterial business units.
|
|
(c)
|
The Air Group Adjusted column excludes certain charges described in
(d)
and represents the financial information that is reviewed by management to assess performance of operations and determine capital allocations.
|
|
(d)
|
Includes accounting adjustments related to mark-to-market fuel hedge accounting charges (all years), merger-related costs (2017 and 2016), pension settlement charge (2015), and a litigation-related matter (2015).
|
|
2017
|
2016
|
2015
|
|||||||||
|
Depreciation and amortization:
|
|||||||||||
|
Mainline
|
$
|
308
|
|
$
|
296
|
|
$
|
268
|
|
||
|
Horizon
|
64
|
|
67
|
|
52
|
|
|||||
|
Consolidated
|
$
|
372
|
|
$
|
363
|
|
$
|
320
|
|
||
|
Capital expenditures:
|
|||||||||||
|
Mainline
|
$
|
734
|
|
$
|
608
|
|
$
|
821
|
|
||
|
Horizon
|
292
|
|
70
|
|
10
|
|
|||||
|
Consolidated
|
$
|
1,026
|
|
$
|
678
|
|
$
|
831
|
|
||
|
Total assets at end of period:
|
|
|
|
|
|
|
|||||
|
Mainline
|
$
|
16,650
|
|
$
|
15,260
|
|
|||||
|
Horizon
|
929
|
|
690
|
|
|||||||
|
Consolidating & Other
|
(6,839
|
)
|
(5,988
|
)
|
|||||||
|
Consolidated
|
$
|
10,740
|
|
$
|
9,962
|
|
|||||
93
|
|
None.
|
|
EVALUATION OF DISCLOSURE CONTROLS AND PROCEDURES
The Company’s management, with the participation of the Principal Executive Officer and Principal Financial Officer, conducted an evaluation of the effectiveness of the Company’s disclosure controls and procedures (as defined in Exchange Act Rule 13a-15(e)) as of the end of the period covered by this report. Based on that evaluation, the Principal Executive Officer and Principal Financial Officer concluded that the Company’s disclosure controls and procedures were effective as of the end of the period covered by this report.
CHANGES IN INTERNAL CONTROL OVER FINANCIAL REPORTING
Except as noted below, there have been no changes in the Company’s internal controls over financial reporting during the quarter ended
December 31, 2017
, that have materially affected, or are reasonably likely to materially affect, the Company’s internal control over financial reporting except as noted below.
On December 14, 2016, the Company completed the acquisition of Virgin America. In 2017 we integrated policies, processes, people, technology and operations for the combined company. Our integration included internal controls over financial reporting. As the integration continues and business processes evolve, management will continue to evaluate the existing internal controls over financial reporting for change.
Also during 2017 the Company implemented internal controls to ensure it has adequately assessed the impact of the new accounting standard related to revenue recognition to prepare for adoption on January 1, 2018. The modified and new controls have been designed to address risks associated with recognizing revenue under the new standard.
There have been no other changes in the Company's internal controls over financial reporting during the quarter ended
December 31, 2017
that have materially affected, or are reasonably likely to materially affect, the Company's internal controls over financial reporting.
94
MANAGEMENT’S REPORT ON INTERNAL CONTROL OVER FINANCIAL REPORTING
Our management is responsible for establishing and maintaining adequate internal control over financial reporting, as such term is defined in Exchange Act Rule 13a-15(f). Under the supervision and with the participation of our management, including our principal executive officer and principal financial officer, we conducted an evaluation of the effectiveness of our internal control over financial reporting based on the 2013 framework in Internal Control – Integrated Framework issued by the Committee of Sponsoring Organizations of the Treadway Commission (the COSO Framework). Based on our evaluation, our management concluded that our internal control over financial reporting was effective as of
December 31, 2017
.
We intend to review and evaluate the design and effectiveness of our disclosure controls and procedures and internal control over financial reporting on an ongoing basis and to improve these controls and procedures over time and to correct any deficiencies that we may discover in the future. While we believe the present design of our disclosure controls and procedures and internal control over financial reporting are effective, future events affecting our business may cause us to modify our controls and procedures.
The Company's independent registered public accounting firm has issued an attestation report regarding its assessment of the effectiveness of the Company's internal control over financial reporting as of
December 31, 2017
.
95
REPORT OF INDEPENDENT REGISTERED PUBLIC ACCOUNTING FIRM
To the Stockholders and Board of Directors
Alaska Air Group, Inc.:
Opinion on Internal Control Over Financial Reporting
We have audited Alaska Air Group, Inc. and subsidiaries’ (the “Company”) internal control over financial reporting as of December 31, 2017, based on criteria established in
Internal Control - Integrated Framework (2013)
issued by the Committee of Sponsoring Organizations of the Treadway Commission. In our opinion, the Company maintained, in all material respects, effective internal control over financial reporting as of December 31, 2017, based on criteria established in
Internal Control - Integrated Framework (2013)
issued by the Committee of Sponsoring Organizations of the Treadway Commission.
We also have audited, in accordance with the standards of the Public Company Accounting Oversight Board (United States) (“PCAOB”), the consolidated balance sheets of the Company as of December 31, 2017 and 2016, the related consolidated statements of operations, comprehensive operations, shareholders’ equity, and cash flows for each of the years in the three-year period ended December 31, 2017, and the related notes (collectively, the “consolidated financial statements”), and our report dated February 14, 2018 expressed an unqualified opinion on those consolidated financial statements.
Basis for Opinion
The Company’s management is responsible for maintaining effective internal control over financial reporting and for its assessment of the effectiveness of internal control over financial reporting, included in the accompanying Management’s Report on Internal Control Over Financial Reporting. Our responsibility is to express an opinion on the Company’s internal control over financial reporting based on our audit. We are a public accounting firm registered with the PCAOB and are required to be independent with respect to the Company in accordance with the U.S. federal securities laws and the applicable rules and regulations of the Securities and Exchange Commission and the PCAOB.
We conducted our audit in accordance with the standards of the PCAOB. Those standards require that we plan and perform the audit to obtain reasonable assurance about whether effective internal control over financial reporting was maintained in all material respects. Our audit of internal control over financial reporting included obtaining an understanding of internal control over financial reporting, assessing the risk that a material weakness exists, and testing and evaluating the design and operating effectiveness of internal control based on the assessed risk. Our audit also included performing such other procedures as we considered necessary in the circumstances. We believe that our audit provides a reasonable basis for our opinion.
Definition and Limitations of Internal Control Over Financial Reporting
A company’s internal control over financial reporting is a process designed to provide reasonable assurance regarding the reliability of financial reporting and the preparation of financial statements for external purposes in accordance with generally accepted accounting principles. A company’s internal control over financial reporting includes those policies and procedures that (1) pertain to the maintenance of records that, in reasonable detail, accurately and fairly reflect the transactions and dispositions of the assets of the company; (2) provide reasonable assurance that transactions are recorded as necessary to permit preparation of financial statements in accordance with generally accepted accounting principles, and that receipts and expenditures of the company are being made only in accordance with authorizations of management and directors of the company; and (3) provide reasonable assurance regarding prevention or timely detection of unauthorized acquisition, use, or disposition of the company’s assets that could have a material effect on the financial statements.
Because of its inherent limitations, internal control over financial reporting may not prevent or detect misstatements. Also, projections of any evaluation of effectiveness to future periods are subject to the risk that controls may become inadequate because of changes in conditions, or that the degree of compliance with the policies or procedures may deteriorate.
KPMG LLP
Seattle, Washington
February 14, 2018
96
|
|
None
|
|
See “Executive Officers” under Item 1, “Our Business,” in Part I of this Form 10-K for information on the executive officers of Air Group and its subsidiaries. Except as provided herein, the remainder of the information required by this item is incorporated herein by reference from the definitive Proxy Statement for Air Group's
2018
Annual Meeting of Stockholders to be filed with the Securities and Exchange Commission within 120 days after the end of the fiscal year ended
December 31, 2017
(hereinafter referred to as our “
2018
Proxy Statement”).
|
|
The information required by this item is incorporated herein by reference from our
2018
Proxy Statement.
|
|
Securities Authorized for Issuance Under Equity Compensation Plans
|
Number of securities to be issued upon exercise of outstanding options, warrants and rights
|
Weighted-average exercise price of outstanding options, warrants and rights
|
Number of securities remaining available for future issuance under equity compensation plans (excluding securities reflected in column (a))
|
|||||
|
Plan category
|
(a)
|
(b)
|
(c)
|
||||
|
Equity compensation plans approved by security holders
|
1,311,899
(1)
|
|
$52.34
(2)
|
10,927,824
|
|
||
|
Equity compensation plans not approved by security holders
|
—
|
|
Not applicable
|
—
|
|
||
|
Total
|
1,311,899
|
|
$52.34
|
10,927,824
|
|
||
|
(1)
|
Of these shares, 354,475 and 86,992 were subject to options then outstanding under the 2008 Plan and 2016 Plan, respectively, 386,869 were subject to outstanding restricted, performance and deferred stock unit awards granted under the 2008 Plan and 483,553 were subject to outstanding restricted, performance and deferred stock unit awards granted under the 2016 Plan. Outstanding performance awards are reflected in the table assuming that the target level of performance will be achieved.
|
|
(2)
|
This number does not reflect the 870,432 shares that were subject to outstanding stock unit awards granted under the 2008 and 2016 Plans.
|
|
(3)
|
Of the aggregate number of shares that remained available for future issuance, no shares were available under the 2008 Plan, 5,129,157 shares were available under the 2016 Plan and 5,798,667 shares were available under the ESPP. Subject to certain express limits of the 2016 Plan, shares available for award purposes under the 2016 Plan generally may be used for any type of award authorized under that plan including options, stock appreciation rights, and other forms of awards granted or denominated in shares of our common stock including, without limitation, stock bonuses, restricted stock, restricted stock units and performance shares. Full-value shares issued under the 2016 Plan are counted against the share limit as 1.7 shares for every one share issued. This table does not give effect to that rule.
|
Other information required by this item is set forth under the heading “Beneficial Ownership of Securities” in our
2018
Proxy Statement and is incorporated by reference.
97
|
|
The information required by this item is incorporated herein by reference from our
2018
Proxy Statement.
|
|
The information required by this item is incorporated herein by reference from our
2018
Proxy Statement.
|
|
The following documents are filed as part of this report:
|
1.
|
Exhibits:
See Exhibit Index.
|
98
SIGNATURES
Pursuant to the requirements of Section 13 or 15(d) of the Securities Exchange Act of 1934, the registrant has duly caused this report to be signed on its behalf by the undersigned, thereunto duly authorized.
|
|
|
|
|
|
|
ALASKA AIR GROUP, INC.
|
|
|||
|
|
|
|
||
|
By:
|
/s/ BRADLEY D. TILDEN
|
|
Date:
|
February 14, 2018
|
|
|
Bradley D. Tilden
|
|
|
|
|
|
Chief Executive Officer
|
|
|
|
Pursuant to the requirements of the Securities Exchange Act of 1934, this report has been signed below by the following persons on
February 14, 2018
on behalf of the registrant and in the capacities indicated.
99
|
/s/ BRADLEY D. TILDEN
|
Chairman and Chief Executive Officer
(Principal Executive Officer)
|
|
|
Bradley D. Tilden
|
||
|
|
|
|
|
/s/ BRANDON S. PEDERSEN
|
Executive Vice President/Finance and Chief Financial Officer
(Principal Financial Officer)
|
|
|
Brandon S. Pedersen
|
||
|
/s/ CHRISTOPHER M. BERRY
|
Vice President Finance and Controller
(Principal Accounting Officer)
|
|
|
Christopher M. Berry
|
||
|
/s/ PATRICIA M. BEDIENT
|
Director
|
|
|
Patricia M. Bedient
|
||
|
|
|
|
|
/s/ JAMES A. BEER
|
Director
|
|
|
James A. Beer
|
||
|
|
|
|
|
/s/ MARION C. BLAKEY
|
Director
|
|
|
Marion C. Blakey
|
||
|
/s/ PHYLLIS J. CAMPBELL
|
Director
|
|
|
Phyllis J. Campbell
|
||
|
|
|
|
|
/s/ RAYMOND L. CONNER
|
Director
|
|
|
Raymond L. Conner
|
||
|
/s/ DHIREN R. FONSECA
|
Director
|
|
|
Dhiren R. Fonseca
|
||
|
|
|
|
|
/s/ DENNIS F. MADSEN
|
Director
|
|
|
Dennis F. Madsen
|
||
|
|
|
|
|
/s/ HELVI K. SANDVIK
|
Director
|
|
|
Helvi K. Sandvik
|
||
|
/s/ J. KENNETH THOMPSON
|
Director
|
|
|
J. Kenneth Thompson
|
||
|
/s/ ERIC K. YEAMAN
|
Director
|
|
|
Eric K. Yeaman
|
||
100
EXHIBIT INDEX
Certain of the following exhibits have been filed with the Securities and Exchange Commission and are incorporated by reference from the documents below. Certain others are filed with this Form 10-K. The exhibits are numbered in accordance with Item 601 of Regulation S-K.
|
Exhibit
Number
|
Exhibit
Description
|
Form
|
Date of
First Filing
|
Exhibit
Number
|
File
Number
|
|
3.1
|
10-Q
|
August 3, 2017
|
3.1
|
||
|
10.1#
|
10-Q
|
August 5, 2005
|
10.1
|
||
|
10.2#
|
10-Q
|
August 5, 2005
|
10.2
|
||
|
10.3#
|
10-Q/A
|
August 2, 2011
|
10.1
|
||
|
10.4#
|
10-K
|
February 14, 2013
|
10.1
|
||
|
10.5#
|
10-K
|
February 14, 2013
|
10.2
|
||
|
10.6#
|
10-Q
|
May 7, 2015
|
10.1
|
||
|
10.7#
|
10-Q
|
May 9, 2016
|
10.1
|
||
|
10.8^
|
S-1/A^
|
October 7, 2014
|
10.15
|
||
|
10.9*
|
10-Q
|
August 4, 2011
|
10.3
|
||
|
10.10*
|
10-Q
|
August 4, 2011
|
10.4
|
||
|
10.11*
|
10-Q
|
August 4, 2011
|
10.5
|
||
|
10.12*
|
10-K
|
February 11, 2016
|
10.10
|
||
|
10.13*
|
8-K
|
May 18, 2016
|
10.1
|
||
|
10.14*
|
10-Q
|
August 2, 2016
|
10.1
|
||
|
10.15*
|
10-Q
|
August 2, 2016
|
10.2
|
||
|
10.16*
|
10-Q
|
August 2, 2016
|
10.3
|
||
|
10.17*
|
10-Q
|
August 2, 2016
|
10.4
|
||
|
10.18*
|
10-K
|
February 28, 2017
|
10.18
|
||
|
10.19*
|
10-K
|
February 11, 2016
|
10.12
|
||
|
10.20*
|
10-Q
|
August 4, 2011
|
10.1
|
||
|
10.21*
|
10-Q
|
August 4, 2011
|
10.2
|
||
|
10.22*
|
10-K
|
February 11, 2016
|
10.15
|
||
|
10.23*
|
10-Q
|
May 5, 2017
|
10.1
|
||
|
10.24*
|
10-Q
|
May 5, 2017
|
10.2
|
||
|
10.25*†
|
|||||
|
10.26*†
|
|||||
|
10.27*†
|
|||||
|
21†
|
|||||
101
|
23.1†
|
|||||
|
31.1†
|
|||||
|
31.2†
|
|||||
|
32.1†
|
|||||
|
32.2†
|
|||||
|
101.INS†
|
XBRL Instance Document
|
||||
|
101.SCH†
|
XBRL Taxonomy Extension Schema Document
|
||||
|
101.CAL†
|
XBRL Taxonomy Extension Calculation Linkbase Document
|
||||
|
101.DEF†
|
XBRL Taxonomy Extension Definition Linkbase Document
|
||||
|
101.LAB†
|
XBRL Taxonomy Extension Label Linkbase Document
|
||||
|
101.PRE†
|
XBRL Taxonomy Extension Presentation Linkbase Document
|
||||
|
†
|
Filed herewith
|
||||
|
*
|
Indicates management contract or compensatory plan or arrangement.
|
||||
|
#
|
Pursuant to 17 CFR 240.24b-2, confidential information has been omitted and filed separately with the Securities and Exchange Commission pursuant to a Confidential Treatment Application filed with the Commission.
|
||||
|
^
|
Filed by Virgin America Inc., File Number 333-197660
|
||||
102
TABLE OF CONTENTS
Part IItem 1. Our BusinessItem 1A. Risk FactorsItem 1B. Unresolved Staff CommentsItem 2. PropertiesItem 3. Legal ProceedingsItem 4. Mine Safety DisclosuresPart IIItem 5. Market For The Registrant S Common Equity, Related Stockholder Matters, and Issuer Purchases Of Equity SecuritiesItem 6. Selected Financial and Operating DataItem 7. Management S Discussion and Analysis Of Financial Condition and Results Of OperationsItem 7A. Quantitative and Qualitative Disclosure About Market RiskItem 8. Consolidated Financial Statements and Supplementary DataNote 1. General and Summary Of Significant Accounting PoliciesNote 2. Acquisition Of Virgin America IncNote 3. Derivative Instruments and Risk ManagementNote 4. Fair Value MeasurementsNote 5. Long-term DebtNote 6. Income TaxesNote 7. Employee Benefit PlansNote 8. Commitments and ContingenciesNote 9. Shareholders' EquityNote 10. Special ItemsNote 11. Stock-based Compensation PlansNote 12. Operating Segment InformationItem 9. Changes in and Disagreements with Accountants on Accounting and Financial DisclosureItem 9A. Controls and ProceduresItem 9B. Other InformationPart IIIItem 10. Directors, Executive Officers and Corporate GovernanceItem 11. Executive CompensationItem 12. Security Ownership Of Certain Beneficial Owners and Management, and Related Stockholder MattersItem 13. Certain Relationships and Related Transactions, and Director IndependenceItem 14. Principal Accountant Fees and ServicesPart IVItem 15. Exhibits