ALLEGION PLC
10-Ks and 10-Qs
|
|
|
|
|
|
|
|
|
|
|
|
|
|
|
|
|
|
|
|
|
|
|
|
|
|
|
|
|
|
|
|
|
|
|
|
|
|
|
|
|
|
|
|
UNITED STATES SECURITIES AND EXCHANGE COMMISSION
Washington, D.C. 20549
FORM 10-K
(Mark One)
|
X
|
ANNUAL REPORT PURSUANT TO SECTION 13 OR 15(d) OF THE SECURITIES EXCHANGE ACT OF 1934
|
For the fiscal year ended
December 31, 2018
or
|
—
|
TRANSITION REPORT PURSUANT TO SECTION 13 OR 15(d) OF THE SECURITIES EXCHANGE ACT OF 1934
|
For the transition period from
to
Commission File No. 001-35971

ALLEGION PUBLIC LIMITED COMPANY
(Exact name of registrant as specified in its charter)
|
Ireland
|
|
98-1108930
|
|
(State or other jurisdiction of incorporation or organization)
|
|
(I.R.S. Employer
Identification No.)
|
Block D
Iveagh Court
Harcourt Road
Dublin 2, Ireland
(Address of principal executive offices)
Registrant’s telephone number, including area code: +(353) (1) 2546200
Securities registered pursuant to Section 12(b) of the Act:
|
Title of each class
|
|
Name of each exchange on which registered
|
|
Ordinary Shares,
|
|
New York Stock Exchange
|
|
Par Value $0.01 per Share
|
|
|
Securities registered pursuant to Section 12(g) of the Act: None
Indicate by check mark if the registrant is a well-known seasoned issuer, as defined in Rule 405 of the Securities Act.
YES
x
NO
¨
Indicate by check mark if the registrant is not required to file reports pursuant to Section 13 or Section 15(d) of the Act.
YES
¨
NO
x
Indicate by check mark whether the registrant (1) has filed all reports required to be filed by Section 13 or 15(d) of the Securities Exchange Act of 1934 during the preceding 12 months (or for such shorter period that the registrant was required to file such reports), and (2) has been subject to such filing requirements for the past 90 days.
YES
x
NO
¨
Indicate by check mark whether the registrant has submitted electronically every Interactive Data File required to be submitted pursuant to Rule 405 of Regulation S-T (§232.405 of this chapter) during the preceding 12 months (or for such shorter period that the registrant was required to submit such files).
YES
x
NO
¨
Indicate by check mark if disclosure of delinquent filers pursuant to Item 405 of Regulation S-K (§229.405 of this chapter) is not contained herein, and will not be contained, to the best of registrant’s knowledge, in definitive proxy or information statements incorporated by reference in Part III of this Form 10-K or any amendment to this Form 10-K.
YES
x
NO
¨
Indicate by check mark whether the registrant is a large accelerated filer, an accelerated filer, a non-accelerated filer, a smaller reporting company, or an emerging growth company. See the definitions of "large accelerated filer," "accelerated filer," "smaller reporting company," and "emerging growth company" in Rule 12b-2 of the Exchange Act.:
|
Large accelerated filer
|
x
|
Accelerated filer
|
¨
|
|
Non-accelerated filer
|
¨
|
Smaller reporting company
|
¨
|
|
Emerging growth company
|
¨
|
||
If an emerging growth company, indicate by check mark if the registrant has elected not to use the extended transition period for complying with any new or revised financial accounting standards provided pursuant to Section 13(a) of the Exchange Act.
¨
Indicate by check mark whether the registrant is a shell company (as defined in Rule 12b-2 of the Act).
YES
¨
NO
x
The aggregate market value of ordinary shares held by non-affiliates on
June 30, 2018
was approximately
$7.3 billion
based on the closing price of such stock on the New York Stock Exchange.
The number of ordinary shares outstanding as of
February 14, 2019
was
94,458,335
.
DOCUMENTS INCORPORATED BY REFERENCE
Portions of the registrant’s definitive proxy statement to be filed within 120 days of the close of the registrant’s fiscal year in connection with the registrant’s Annual General Meeting of Shareholders to be held
June 5, 2019
(the "Proxy Statement") are incorporated by reference into Part II and Part III of this Form 10-K.
ALLEGION PLC
Form 10-K
For the Fiscal Year Ended
December 31, 2018
TABLE OF CONTENTS
|
|
|
|
Page
|
|
Part I
|
Item 1.
|
||
|
Item 1A.
|
|||
|
Item 1B.
|
|||
|
Item 2.
|
|||
|
Item 3.
|
|||
|
Item 4.
|
|||
|
Part II
|
Item 5.
|
||
|
Item 6.
|
|||
|
Item 7.
|
|||
|
Item 7A.
|
|||
|
Item 8.
|
|||
|
Item 9.
|
|||
|
Item 9A.
|
|||
|
Item 9B.
|
|||
|
Part III
|
Item 10.
|
||
|
Item 11.
|
|||
|
Item 12.
|
|||
|
Item 13.
|
|||
|
Item 14.
|
|||
|
Part IV
|
Item 15.
|
||
|
Item 16.
|
|||
CAUTIONARY STATEMENT FOR FORWARD LOOKING STATEMENTS
Certain statements in this report, other than purely historical information, are "forward-looking statements" within the meaning of the Private Securities Litigation Reform Act of 1995, Section 27A of the Securities Act of 1933 and Section 21E of the Securities Exchange Act of 1934. These forward-looking statements generally are identified by the words "believe," "project," "expect," "anticipate," "estimate," "forecast," "outlook," "intend," "strategy," "future", "opportunity", "plan," "may," "should," "will," "would," "will be," "will continue," "will likely result," or the negative thereof or variations thereon or similar expressions generally intended to identify forward-looking statements.
Forward-looking statements may relate to such matters as projections of revenue, margins, expenses, tax provisions, earnings, cash flows, benefit obligations, dividends, share purchases or other financial items; any statements of the plans, strategies and objectives of management for future operations, including those relating to any statements concerning expected development, performance or market share relating to our products and services; any statements regarding future economic conditions or our performance; any statements regarding pending investigations, claims or disputes; any statements of expectation or belief; and any statements of assumptions underlying any of the foregoing. These statements are based on currently available information and our current assumptions, expectations and projections about future events. While we believe that our assumptions, expectations and projections are reasonable in view of the currently available information, you are cautioned not to place undue reliance on our forward-looking statements. You are advised to review any further disclosures we make on related subjects in materials we file with or furnish to the United States Securities and Exchange Commission (SEC). Forward-looking statements speak only as of the date they are made and are not guarantees of future performance. They are subject to future events, risks and uncertainties - many of which are beyond our control - as well as potentially inaccurate assumptions, that could cause actual results to differ materially from our expectations and projections. We do not undertake to update any forward-looking statements.
Factors that might affect our forward-looking statements include, among other things:
|
•
|
economic, political and business conditions in the markets in which we operate;
|
|
•
|
the demand for our products and services, including changes in customer preferences, conditions of the commercial and residential construction and remodeling markets and our ability to maintain beneficial relationships with large customers;
|
|
•
|
competitive factors in the industry in which we compete, including new technical developments;
|
|
•
|
the development, commercialization and acceptance of new products and services;
|
|
•
|
the ability to protect and use intellectual property;
|
|
•
|
fluctuations in currency exchange rates;
|
|
•
|
the ability to complete and integrate any acquisitions;
|
|
•
|
results of investments made to complement our existing businesses and our pursuit of business opportunities that may diverge from our core businesses;
|
|
•
|
our ability to operate efficiently and productively;
|
|
•
|
disruptions in our global supply chain, including product manufacturing and logistical services provided by outsourcing partners;
|
|
•
|
improper conduct by any of our employees, agents or business partners;
|
|
•
|
our ability to manage risks related to our information technology and operational technology systems and cyber-security, including disruption and breaches of our information systems and implementation of new processes that may cause disruptions and be more difficult, costly or time consuming than expected;
|
|
•
|
our reliance on third-party vendors for many of the critical elements of our global information and operational technology infrastructure and their failure to provide effective support for such infrastructure;
|
|
•
|
changes in tax requirements, including tax rate changes, the adoption of new United States (U.S.) or non-U.S. tax legislation or exposure to additional tax liabilities and revised tax law interpretations;
|
|
•
|
changes to trade agreements, sanctions, import and export regulations and custom duties;
|
|
•
|
the outcome of any litigation, governmental investigations or proceedings;
|
|
•
|
interest rate fluctuations and other changes in borrowing costs, in addition to risks associated with our outstanding and future indebtedness;
|
|
•
|
other capital market conditions, including availability of funding sources and currency exchange rate fluctuations;
|
|
•
|
availability of and fluctuations in the prices of key commodities and the impact of higher energy prices;
|
2
|
•
|
potential further impairment of our goodwill, indefinite-lived intangible assets and/or our long-lived assets;
|
|
•
|
ability to recruit and retain a highly qualified and diverse workforce;
|
|
•
|
risks related to our spin-off from Ingersoll Rand plc;
|
|
•
|
the possible effects on us of future legislation or interpretations in the U.S. that may limit or eliminate potential U.S. tax benefits resulting from our incorporation in a non-U.S. jurisdiction, such as Ireland, or deny U.S. government contracts to us based upon our incorporation in such non-U.S. jurisdiction; and
|
|
•
|
the impact our outstanding indebtedness may have on our business and operations.
|
Some of the significant risks and uncertainties that could cause actual results to differ materially from our expectations and projections are described more fully in Item 1A "Risk Factors." You should read that information in conjunction with "Management's Discussion and Analysis of Financial Condition and Results of Operations" in Item 7 of this report and our Consolidated Financial Statements and related notes in Item 8 of this report. We note such information for investors as permitted by the Private Securities Litigation Reform Act of 1995.
3
PART I
Item 1.
BUSINESS
Overview
Allegion plc ("Allegion," "we," "us" or "the Company") is a leading global provider of security products and solutions that keep people safe, secure and productive. We make the world safer as a company of experts, securing the places where people thrive, and we create peace of mind by pioneering safety and security. We offer an extensive and versatile portfolio of mechanical and electronic security products across a range of market-leading brands. Our experts across the globe deliver high-quality security products, services and systems, and we use our deep expertise to serve as trusted partners to end-users who seek customized solutions to their security needs.
|
Allegion Principal Products
|
|
|
Door closers and controls
|
Doors and door systems
|
|
Electronic security products
|
Electronic, biometric and mobile access control systems
|
|
Exit devices
|
Locks, locksets, portable locks, key systems and services
|
|
Time, attendance and workforce productivity systems
|
Other accessories
|
Access control security products and solutions are critical elements in every building and home. Many door openings are configured to maximize a room’s particular form and function while also meeting local and national building and safety code requirements and end-user security needs. Most buildings have multiple door openings, each serving its own purpose and requiring different specific access-control solutions. Each door must fit exactly within its frame, be prepared precisely for its hinges, synchronize with its specific lockset and corresponding latch and align with a specific key to secure the door. Moreover, security products are increasingly linked electronically, integrated into software and popular consumer technology platforms and controlled with mobile applications, creating additional functionality and complexity.
We believe our ability to deliver a wide range of solutions that can be custom-configured to meet end-users’ security needs is a key driver of our success. We accomplish this with:
|
•
|
Our extensive and versatile product portfolio, combined with our deep expertise, which enables us to deliver the right products and solutions to meet diverse security and functional specifications and to successfully and securely integrate into leading technology and systems;
|
|
•
|
Our consultative approach and expertise, which enables us to develop the most efficient and appropriate building security and access-control specifications to fulfill the unique needs of our end-users and their partners, including architects, contractors, home-builders and engineers;
|
|
•
|
Our access to and management of key channels in the market, which is critical to delivering our products in an efficient and consistent manner; and
|
|
•
|
Our enterprise excellence capabilities, including our global manufacturing operations and agile supply chain, which facilitate our ability to deliver specific product and system configurations to end-users and consumers worldwide, quickly and efficiently.
|
We believe that the security products industry is growing and will continue to benefit from several global macroeconomic and long-term demographic trends, including:
|
•
|
the convergence of mechanical and electronic security products;
|
|
•
|
heightened awareness of security requirements;
|
|
•
|
increased global urbanization; and
|
|
•
|
the shift to a digital, interconnected environment.
|
We believe the security products industry will also benefit from continued growth in institutional, commercial and residential end-markets. As end-users adopt newer technologies in their facilities and homes, we also expect growth in the global electronic product categories we serve to outperform growth in mechanical products.
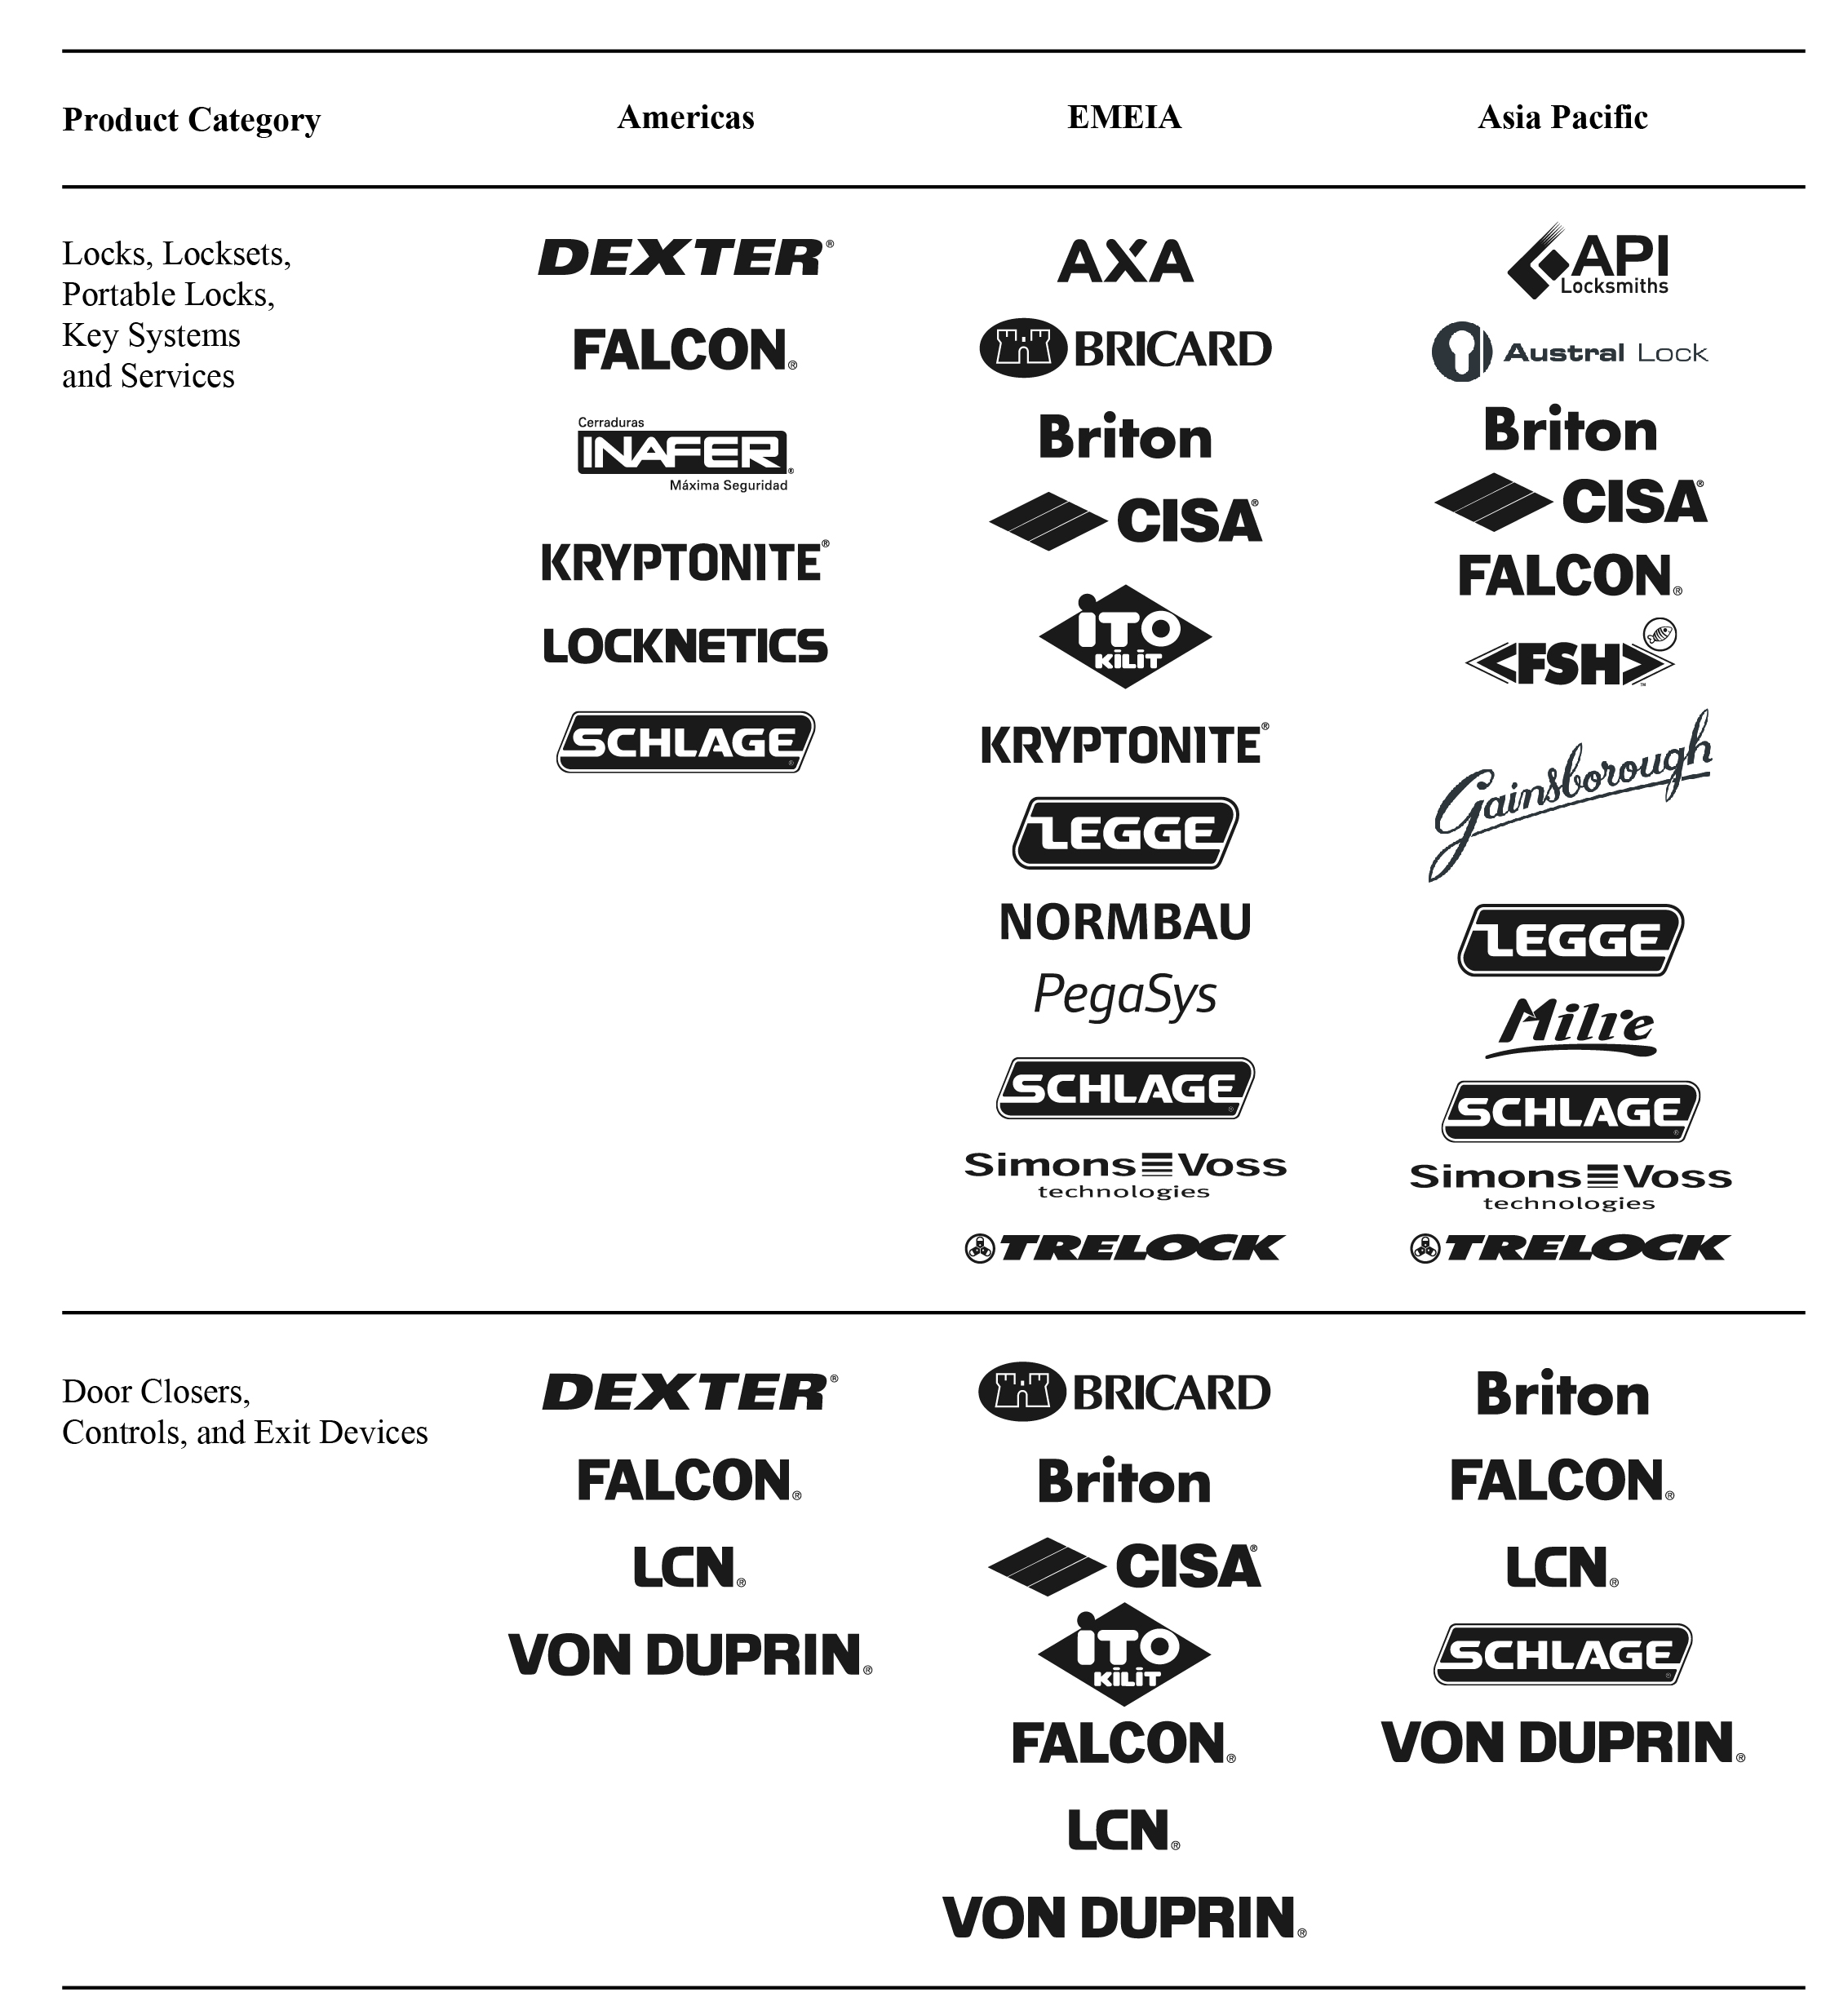
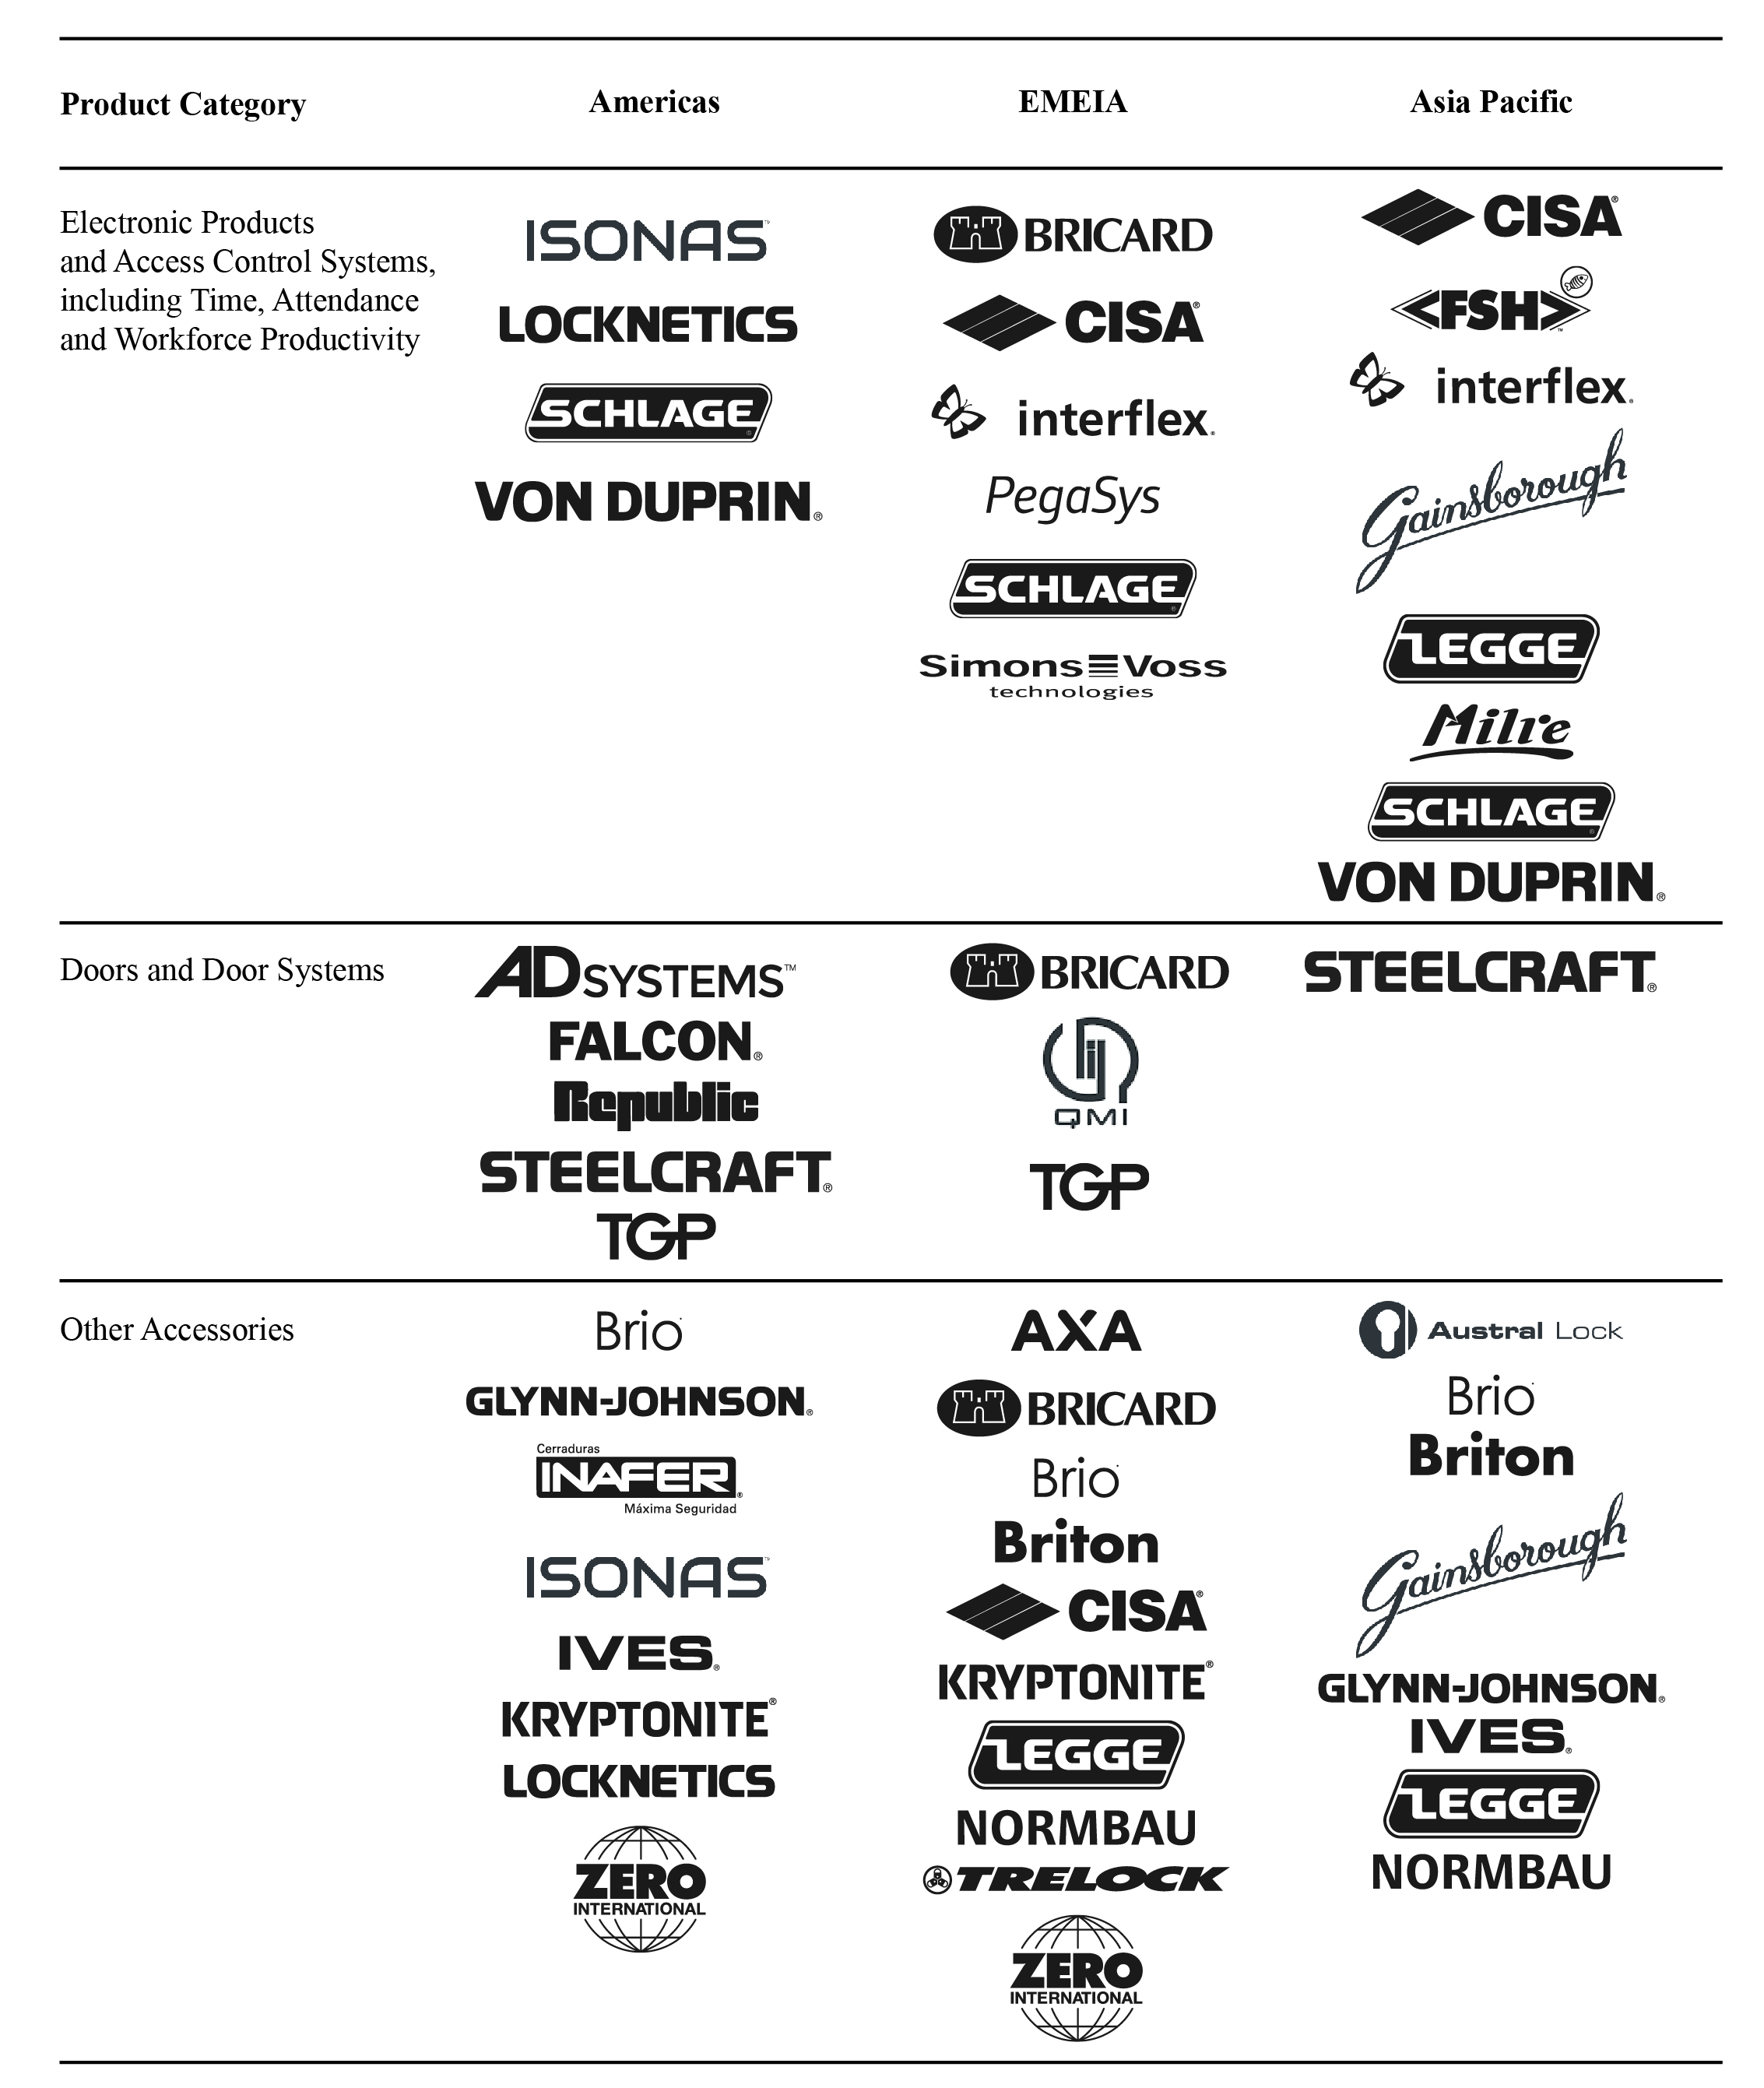
We operate in three geographic regions: Americas; Europe, Middle East, India and Africa ("EMEIA"); and Asia Pacific. We sell our products and solutions under the following brands:
4
|
Allegion Brands
|
|||
|
(listed for each region)
|
|||
|
|||
5
|
|||
We sell a wide range of security products and solutions for end-users in commercial, institutional and residential facilities worldwide, including the education, healthcare, government, hospitality, commercial office and single and multi-family residential markets. Our leading brands include CISA®, Interflex®, LCN®, Schlage®, SimonsVoss® and Von Duprin®. We believe LCN, Schlage and Von Duprin hold the No. 1 position in their primary product categories in North America while CISA, Interflex and SimonsVoss hold the No.1 or No. 2 position in their primary product categories in certain European markets.
6
For the year ended
December 31, 2018
, we generated Net revenues of
$2,731.7 million
and operating income of
$525.8 million
.
History and Developments
We were incorporated in Ireland on May 9, 2013, to hold the commercial and residential security businesses of Ingersoll Rand plc ("Ingersoll Rand"). On December 1, 2013, we became a stand-alone public company after Ingersoll Rand completed the separation of these businesses from the rest of Ingersoll Rand via the transfer of these businesses from Ingersoll Rand to us and the issuance by us of ordinary shares directly to Ingersoll Rand’s shareholders (the "Spin-off"). Our security businesses have long and distinguished operating histories. Several of our brands were established nearly 100 years ago, and many originally created their categories:
|
•
|
Von Duprin, established in 1908, was awarded the first exit device patent;
|
|
•
|
Schlage, established in 1920, was awarded the first patents granted for the cylindrical lock and the push button lock;
|
|
•
|
LCN, established in 1926, created the first door closer;
|
|
•
|
CISA, established in 1926, devised the first electronically controlled lock; and
|
|
•
|
SimonsVoss, established in 1995, created the first keyless digital transponder.
|
We have built upon these founding legacies since our entry into the security products market through the acquisition of Schlage, Von Duprin and LCN in 1974. Today, we continue to develop and introduce innovative and market-leading products. In 2018, product innovation spanned:
|
•
|
Improvements to the user experience, product design and ergonomics;
|
|
•
|
New technology solutions, software, mobile applications and integration with leading platforms; and
|
|
•
|
Improved locks and lights for portable security.
|
Recent examples of successful product launches are illustrated in the table below:
7
|
Product
|
Brands
|
Year
|
Innovation
|
|||
|
Residential Locks, Cylinders and Levers
|
Schlage (Touch, Connect, Sense, Control, Encode, Custom, SEL, Q6, X7), Bricard, Milre
|
2016/2017/ 2018
|
Updates to single and multi-family residential electronic locking platforms that provide for keyless entry (Touch); connected locking (Connect); integration with the Internet of Things (IoT), Apple HomeKit, Amazon Alexa, Google Assistant and Android platforms (Sense); multi-family interconnected locking (Control); next-generation smart lock that is the first-ever WiFi enabled deadbolt to work with Key by Amazon and Ring devices with built-in connectivity (Encode); and 4-in-1 lock with fingerprint sensors, smart card, code access or a physical key (SEL).
Expanded handlesets for Schlage’s new universal functionality solution that allows homeowners to change from a doorknob to a lever and convert a non-locking door to lockable in minutes (Custom) and expanded ranges of cylinders and new aluminum trims for DIY customers (Bricard).
Continual technology upgrades include Z-Wave Plus and Zigbee Certified to improve battery life and range, improve the user experience and enable partnerships with leading providers like Key by Amazon (Connect).
New residential e-locks for Asia Pacific and improved biometric sensors, new designs and push-pull electronic locks with Bluetooth modules (Q6, X7, Milre).
|
|||
|
Commercial Locks, Cylinders, Levers and Electronic Access Platforms
|
Schlage (AD, CO, LE, NDE, S-series), Bricard, Briton, SimonsVoss, CISA
|
2016/2017/ 2018
|
Enhancements to the comprehensive portfolio of globally available mechanical, wired electrified and wireless electronic solutions to give a common aesthetic and consistent user experience throughout a building; wireless locks can be managed with Allegion’s ENGAGE web and mobile apps or with Software Alliance Member systems (AD, CO, LE, NDE).
New rim and mortice locks for Southeast Asia (S-series), expanded cylinders for the European locksmith channel and multipoint mortise locks (Bricard), new stainless-steel trims (Bricard, Briton) and enhancements to the electronic Smart Handle (SimonsVoss).
Firmware releases for the U.S. channel-partner readers to give new functionality and USB communication mode for readers (Schlage). Mobile credentials, new Bluetooth Low Energy and RFID technology and integrations between electronic locks and exit devices (CISA).
|
|||
|
Exit Devices and Closers
|
Von Duprin, Falcon, CISA
|
2018
|
New award-winning and cost-effective retrofit exit device that allows for remote undogging and monitoring with partner software (Von Duprin).
New fire-rated retrofit series (Falcon), quiet exit solutions (Von Duprin) and a new range of asymmetric rack-and-pinion door closers (CISA).
|
|||
|
Bike Lighting and Portable Locking Solutions
|
AXA, Kryptonite, Trelock
|
2017/2018
|
Broad range of innovation in bike safety from each of our Global Portable Security brands (AXA, Kryptonite and Trelock), ranging from compact dynamo lights and e-bike lights to USB, battery powered and rechargeable lights.
New and expanded lines of folding locks, integrated chains and ring locks and applications for bikes and motorcycles (AXA, Kryptonite, Trelock) and expanded track-and-trace services (AXA).
|
|||
|
Software, Mobile and Web Applications
|
Allegion (Overtur, ENGAGE), Interflex
|
2018
|
Introduction of a new cloud-based suite of tools for project teams to collaborate on specifications and the security design of doors and openings, which provides a centralized place to capture and maintain door hardware requirements and decisions with easy options to push information back to the design tools (Overtur).
Multiple enhancements to the user experience include biometric login for the mobile app, simplified account and site set-up and gateway site survey (ENGAGE).
New modules for visitor management, encouraging self-service and Microsoft Outlook functionality (Interflex).
|
|||
In addition, in 2018 we announced the formation of Allegion Ventures, a corporate venture fund that aims to supplement Allegion innovation by investing in innovative technologies and companies.
8
Industry and Competition
The global markets we serve encompass commercial, institutional and residential construction markets throughout North America, EMEIA and Asia Pacific. In recent years, as end-users adopt newer technologies in their facilities and single and multi-family homes, growth in electronic security products and solutions continues to outperform growth in mechanical security products and solutions. We expect the security products industry will benefit from favorable long-term demographic trends such as continued urbanization of the global population, increased concerns about safety and security and technology-driven innovation.
The security products markets are highly competitive and fragmented throughout the world, with a number of large multi-national companies and thousands of smaller regional and local companies. This high fragmentation primarily reflects local regulatory requirements and highly variable end-user needs. We believe our principal global competitors are Assa Abloy AB and dormakaba Group. We also face competition in various markets and product categories throughout the world, including from Spectrum Brands Holdings, Inc. in the North American residential market. As we move into more technologically-advanced product categories, we may also compete against new, more specialized competitors.
Our success depends on a variety of factors, including brand and reputation, product breadth, integration with popular technology platforms, quality and delivery capabilities, price and service capabilities. As many of our businesses sell through wholesale distribution, our success also depends on building and partnering with a strong channel network. Although price often serves as an important customer decision criterion, we also compete based on the breadth and quality of our products and solutions, our ability to custom-configure solutions to meet individual end-user requirements and our global supply chain.
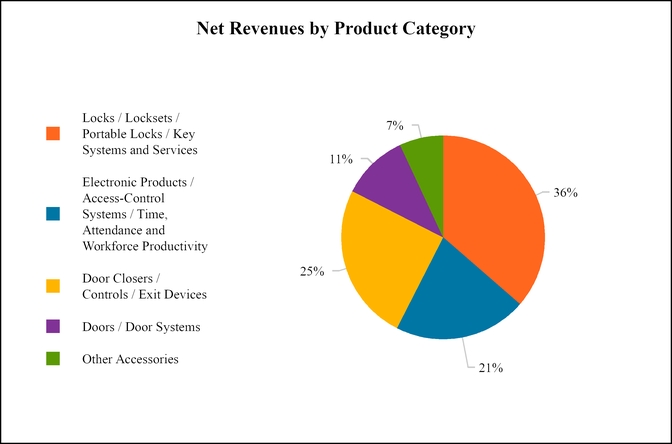
Products and Services
We offer an extensive and versatile portfolio of mechanical and electronic security products across a range of market-leading brands:
|
•
|
Locks, locksets, portable locks and key systems and services
: A broad array of cylindrical and mortise door locksets, security levers and master key systems that are used to protect and control access and a range of portable security products, including bicycle, small vehicle and travel locks. We also offer locksmith services in select locations;
|
|
•
|
Door closers, controls and exit devices
: An extensive portfolio of life-safety products generally installed on fire doors and facility entrances and exits. Door closers are devices that automatically close doors after they are opened. Exit devices are generally horizontal attachments to doors and enable rapid egress;
|
|
•
|
Electronic security products and access control systems
: A broad range of electrified locks, access control systems, key card and reader systems and accessories, including Internet of Things (IoT), Bluetooth Low Energy (BLE), Power over Ethernet and cloud-based solutions;
|
|
•
|
Time, attendance and workforce productivity systems
: Products and services designed to help business customers manage and monitor workforce access control parameters, attendance and employee scheduling. We offer ongoing aftermarket services in addition to design and installation offerings;
|
|
•
|
Doors and door systems
: A portfolio of hollow metal, glass, wood and specialty doors and door systems; and
|
|
•
|
Other accessories
: A variety of additional security and product components, including hinges, door levers, door stops, bike lights, louvers, weather stripping, thresholds and other accessories, as well as certain bathroom fittings and accessibility aids.
|
Customers
We sell most of our products and solutions through distribution and retail channels, including specialty distribution, e-commerce and wholesalers. We have built a network of channel partners that help our customers choose the right solution to meet their security needs and help commercial and institutional end-users fulfill and install orders. We also sell through a variety of retail channels, including large do-it-yourself home improvement centers, multiple on-line and e-commerce platforms, as well as small, specialty showroom outlets. We work with our retail partners on developing marketing and merchandising strategies to maximize their sales per square foot of shelf space. Through our Interflex and API Locksmiths businesses and Global Portable Security brands, we also provide products and solutions directly to end-users.
Our 10 largest customers represented approximately 25% of our total Net revenues in
2018
. No single customer represented 10% or more of our total Net revenues in
2018
.
9
Sales and Marketing
In markets where we sell through commercial and institutional distribution channels, we employ sales professionals around the world who work with a combination of end-users, security professionals, architects, contractors, engineers and distribution partners to develop specific custom-configured solutions for our end-users’ needs. Our field sales professionals are assisted by specification writers who work with architects, engineers and consultants to help design door openings and security systems to meet end-users’ functional, aesthetic and regulatory requirements. Both groups are supported by dedicated customer care and technical sales-support specialists worldwide. We also support our sales efforts with a variety of marketing efforts, including trade-specific advertising, cooperative distributor merchandising, digital marketing and marketing at a variety of industry trade shows.
In markets in which we sell through retail and home-builder distribution channels, we have teams of sales, merchandising and marketing professionals who help drive brand and product awareness through our channel partners and to consumers. We utilize a variety of advertising and marketing strategies, including traditional consumer media, retail merchandising, digital marketing, retail promotions and builder and consumer trade shows, to support these teams.
We also work actively with several industry bodies around the world to help promote effective and consistent safety and security standards. For example, we are members of Builders Hardware Manufacturers Association (BHMA), Security Industry Association, Smart Card Alliance, American Society of Healthcare Engineering, American Institute of Architects, Construction Specification Institute, ASSOFERMA (Italy), BHE (Germany) and UNIQ (France).
Production and Distribution
We manufacture our products in our geographic markets around the world. We operate
34
production and assembly facilities, including 16 in Americas, 12 in EMEIA and 6 in Asia Pacific. We own 17 of these facilities and lease the others. Our strategy is to produce in the region of use, wherever appropriate, to allow us to be closer to the end-user and increase efficiency and timely product delivery. Much of our U.S. based residential portfolio is manufactured in the Baja region of Mexico under a NAFTA Maquiladora. In managing our network of production facilities, we focus on eliminating excess capacity, reducing cycle time through productivity and harmonizing production practices and safety procedures.
We distribute our products through a broad network of channel partners. In addition, third-party manufacturing and logistics providers perform certain manufacturing, storage and distribution services for us to support certain parts of our manufacturing and distribution network.
Raw Materials
We support our region-of-use production strategy with corresponding region-of-use supplier partners, where available. Our global and regional commodity teams work with production leadership, product management and materials management teams to ensure adequate materials are available for production.
We purchase a wide range of raw materials, including steel, zinc, brass and other non-ferrous metals, to support our production facilities. Where appropriate, we may enter into fixed-cost contracts to lower overall costs.
Intellectual Property
Intellectual property, inclusive of certain patents, trademarks, copyrights, know-how, trade secrets and other proprietary rights, is important to our business. We create, protect and enforce our intellectual property investments in a variety of ways. We work actively in the U.S. and internationally to try to ensure the protection and enforcement of our intellectual property rights. We use trademarks on nearly all of our products and believe such distinctive marks are an important factor in creating a market for our goods, in identifying us and in distinguishing our products from others. We consider our CISA, Interflex, LCN, Schlage, SimonsVoss, Von Duprin and other associated trademarks to be among our most valuable assets, and we have registered these trademarks in a number of countries. Although certain proprietary intellectual property rights are important to our success, we do not believe we are materially dependent on any particular patent or license, or any particular group of patents or licenses.
Facilities
We operate through a broad network of sales offices, engineering centers,
34
production and assembly facilities and several distribution centers throughout the world. Our active properties represent approximately
6.9
million square feet, of which approximately
37%
is leased. The following table shows the location of our worldwide production and assembly facilities:
10
|
Production and Assembly Facilities
|
||||
|
Americas
|
EMEIA
|
Asia Pacific
|
||
|
Blue Ash, Ohio
|
Clamecy, France
|
Auckland, New Zealand
|
||
|
Bogota, Colombia
|
Dubai, United Arab Emirates
|
Brooklyn, Australia
|
||
|
Boulder, Colorado
|
Durchhausen, Germany
|
Bucheon, South Korea
|
||
|
Chino, California
|
Duzce, Turkey
|
Jinshan, China
|
||
|
Ensenada, Mexico
|
Faenza, Italy
|
Melbourne, Australia
|
||
|
Everett, Washington
|
Feuquieres, France
|
Sydney, Australia
|
||
|
Indianapolis, Indiana
|
Monsampolo, Italy
|
|||
|
Irving, Texas
|
Muenster, Germany
|
|||
|
McKenzie, Tennessee
|
Osterfeld, Germany
|
|||
|
Mississauga, Ontario
|
Renchen, Germany
|
|||
|
Perrysburg, Ohio
|
Veenendaal, Netherlands
|
|||
|
Princeton, Illinois
|
Zawiercie, Poland
|
|||
|
Security, Colorado
|
||||
|
Snoqualmie, Washington
|
||||
|
Tecate, Mexico
|
||||
|
Tijuana, Mexico
|
||||
Research and Development
We are committed to investing in highly productive research and development capabilities, particularly in electro-mechanical systems. We concentrate on developing technology innovations that will deliver growth through the introduction of new products and solutions, as well as driving continuous improvements in product cost, quality, safety and sustainability.
We manage our R&D team as a global group, with an emphasis on a global collaborative approach, to identify and develop new technologies and worldwide product platforms. We are organized on a regional basis to leverage expertise in local standards and configurations. In addition to regional engineering centers in each geographic region, we also operate a global engineering design center in Bangalore, India.
Seasonality
Our business experiences seasonality that varies by product line. Because more construction and do-it-yourself projects occur during the second and third calendar quarters of each year in the Northern Hemisphere, our security product sales related to those projects are typically higher in those quarters than in the first and fourth calendar quarters. However, certain other businesses typically experience higher sales in the fourth calendar quarter due to project timing. Net revenues by quarter for the years ended
December 31, 2018
,
2017
and
2016
are as follows:
|
|
First Quarter
|
Second Quarter
|
Third Quarter
|
Fourth Quarter
|
|
2018
|
22%
|
26%
|
26%
|
26%
|
|
2017
|
23%
|
26%
|
25%
|
26%
|
|
2016
|
22%
|
26%
|
26%
|
26%
|
Employees
As of December 31, 2018, we had approximately 11,000 employees.
Environmental Regulation
We have a dedicated environmental program that is designed to reduce the utilization and generation of hazardous materials during the manufacturing process as well as to remediate identified environmental concerns. As to the latter, we are currently engaged in site investigations and remediation activities to address environmental cleanup from past operations at current and former production facilities. We regularly evaluate our remediation programs and consider alternative remediation methods that are in addition to, or in replacement of, those we currently utilize based upon enhanced technology and regulatory changes.
11
We are sometimes a party to environmental lawsuits and claims and have received notices of potential violations of environmental laws and regulations from the U.S. Environmental Protection Agency (the "EPA") and similar state authorities. We have also been identified as a potentially responsible party ("PRP") for cleanup costs associated with off-site waste disposal at federal Superfund and state remediation sites. For all such sites, there are other PRPs and, in most instances, our involvement is minimal.
In estimating our liability, we have assumed that we will not bear the entire cost of remediation of any site to the exclusion of other PRPs who may be jointly and severally liable. The ability of other PRPs to participate has been taken into account, based on our understanding of the parties’ financial condition and probable contributions on a per site basis. Additional lawsuits and claims involving environmental matters are likely to arise from time to time in the future.
We incurred $
2.4 million
, $
3.2 million
and
$23.3 million
of expenses during the years ended
December 31, 2018
,
2017
and
2016
, respectively, for environmental remediation at sites presently or formerly owned or leased by us. As of
December 31, 2018
and
2017
, we have recorded reserves for environmental matters of $
22.6 million
and $
28.9 million
, respectively. Of these amounts $
6.3 million
and $
8.9 million
, respectively, relate to remediation of sites previously disposed by us. Given the evolving nature of environmental laws, regulations and technology, the ultimate cost of future compliance is uncertain.
Available Information
We are required to file annual, quarterly and current reports, proxy statements and other documents with the SEC under the Securities Exchange Act of 1934. The SEC maintains an Internet website that contains reports, proxy and information statements and other information regarding issuers that file electronically with the SEC. The public can obtain any documents that are filed by us at http://www.sec.gov.
In addition, this Annual Report on Form 10-K, as well as future quarterly reports on Form 10-Q, current reports on Form 8-K and any amendments to all of the foregoing reports, are made available free of charge on our Internet website
(http://www.allegion.com)
as soon as reasonably practicable after such reports are electronically filed with or furnished to the SEC. The contents of our website are not incorporated by reference in this report.
12
Item 1A.
RISK FACTORS
We discuss our expectations regarding future performance, events and outcomes in this Form 10-K, quarterly and annual reports, press releases and other written and oral communications. All statements except for historical and present factual information are “forward-looking statements” and are based on financial data and business plans available only as of the time the statements are made, which may become outdated or incomplete. Forward-looking statements are inherently uncertain, and investors must recognize that events could significantly differ from our expectations. You should carefully consider the risk factors discussed below, together with all the other information included in this Form 10-K, in evaluating us, our ordinary shares and our senior notes. If any of the risks below actually occurs, our business, financial condition, results of operations and cash flows could be materially and adversely affected. Any such adverse effect may cause the trading price of our ordinary shares to decline, and as a result, you could lose all or part of your investment in us. Our business may also be adversely affected by risks and uncertainties not known to us or risks that we currently believe to be immaterial. We assume no obligation to update any forward-looking statements as a result of new information, future events or other factors.
Risks Related to Our Business
Our global operations subject us to economic risks.
We are incorporated in Ireland and operate in countries worldwide. Our global operations depend on products manufactured, purchased and sold in the U.S. and internationally, including in Australia, China, Colombia, Europe, Korea, Mexico, New Zealand, Turkey and the United Arab Emirates. The political, economic and regulatory environments in which we operate are becoming increasingly volatile and uncertain. Accordingly, we are subject to risks that are inherent in operating globally, including:
|
•
|
changes in laws and regulations or imposition of currency restrictions and other restraints in various jurisdictions;
|
|
•
|
limitation of ownership rights, including expropriation of assets by a local government, and limitation on the ability to repatriate earnings;
|
|
•
|
sovereign debt crises and currency instability in developed and developing countries;
|
|
•
|
changes in applicable tax regulations and interpretations;
|
|
•
|
changes to trade agreements, sanctions, import and export regulations, including imposition of burdensome tariffs and quotas, and customs duties;
|
|
•
|
difficulty in staffing and managing global operations;
|
|
•
|
difficulty in enforcing agreements, collecting receivables and protecting assets through non-U.S. legal systems;
|
|
•
|
political unrest, national and international conflict, including war, civil disturbances and terrorist acts; and
|
|
•
|
economic downturns and social and political instability.
|
These risks could increase our cost of doing business in the U.S. and internationally, increase our counterparty risk, disrupt our operations, disrupt the ability of suppliers and customers to fulfill their obligations, increase our effective tax rate, increase the cost of our products, limit our ability to sell products in certain markets, reduce our operating margin, reduce cash flow and negatively impact our ability to compete.
Our business relies on the institutional, commercial and residential construction and remodeling markets.
We primarily rely on the institutional, commercial and residential construction and remodeling markets, which are marked by cyclicality based on overall economic conditions. Weakness or instability in these markets may cause current and potential customers to delay or choose not to make purchases, which could negatively impact the demand for our products and services.
Increased competition, including from technical developments, could adversely affect our business.
The markets in which we operate include a large number of participants, including multi-national companies, regional companies and small local companies. We primarily compete on the basis of quality, innovation, expertise, effective channels to market, breadth of product offering and price. We may be unable to effectively compete on all these bases. If we are unable to anticipate evolving trends in the market or the timing and scale of our competitors’ activities and initiatives, the demand for our products and services could be negatively impacted.
In addition, we compete in an industry that is experiencing the convergence of mechanical, electronic and digital products. Technology and innovation play significant roles in the competitive landscape. Our success depends, in part, upon the research, development and implementation of new technologies and products including obtaining, maintaining and enforcing necessary intellectual property protections. Securing and maintaining key partnerships and alliances, recruiting and retaining highly skilled and qualified employee talent and having access to technologies, services, intellectual property and solutions developed by others
13
will play a significant role in our ability to effectively compete. The continual development of new technologies by existing and new competitors, including non-traditional competitors with significant resources, could adversely affect our ability to sustain operating margins and desirable levels of sales volumes. To remain competitive, we must develop new products and respond to new technologies in a timely manner.
Our growth is dependent, in part, on the development, commercialization and acceptance of new products and services.
We must develop and commercialize new products and services in order to remain competitive in our current and future markets and in order to continue to grow our business. The speed of development by our competitors and new market entrants is increasing. We cannot provide any assurance that any new product or service will be successfully commercialized in a timely manner, if ever, or, if commercialized, will result in returns greater than our investment. Investment in a product or service could divert our attention and resources from other projects that become more commercially viable in the market. We also cannot provide any assurance that any new product or service will be accepted by the market.
Changes in customer preferences and the inability to maintain beneficial relationships with large customers could adversely affect our business.
We have significant customers, particularly major retailers, although no one customer represented 10% or more of our total Net revenues in any of the past three fiscal years. The loss or material reduction of business, the lack of success of sales initiatives or changes in customer preferences or loyalties for our products related to any such significant customer could have a material adverse impact on our business. In addition, major customers who are volume purchasers are much larger than us and have strong bargaining power with suppliers. This limits our ability to recover cost increases through higher selling prices. Furthermore, unanticipated inventory adjustments by these customers can have a negative impact on sales.
Our brands are important assets of our businesses, and violation of our trademark rights by imitators could negatively impact revenues and brand reputation.
Our brands and trademarks enjoy a reputation for quality and value and are important to our success and competitive position. Unauthorized use of our trademarks may not only erode sales of our products but may also cause significant damage to our brand name and reputation, interfere with relationships with our customers and increase litigation costs. There can be no assurance that our on-going effort to protect our brand and trademark rights will prevent all violations.
Currency exchange rate fluctuations may adversely affect our results.
We are exposed to a variety of market risks, including the effects of changes in currency exchange rates. See "Management’s Discussion and Analysis of Financial Condition and Results of Operations - Quantitative and Qualitative Disclosure About Market Risk."
Approximately 30% of our 2018 Net revenues were derived outside the U.S., and we expect sales to non-U.S. customers to continue to represent a significant portion of our consolidated Net revenues. Although we may enter into currency exchange contracts to reduce our risk related to currency exchange fluctuations, changes in the relative fair values of currencies occur from time to time and may, in some instances, have a material impact on our results of operations. We do not hedge against all of our currency exposure and therefore, our business will continue to be susceptible to currency fluctuations.
We also translate assets, liabilities, revenues and expenses denominated in non-U.S. dollar currencies into U.S. dollars for our Consolidated Financial Statements based on applicable exchange rates. Consequently, fluctuations in the value of the U.S. dollar compared to other currencies may have a material impact on the value of these items in our Consolidated Financial Statements, even if their value has not changed in their original currency.
Our business strategy includes making acquisitions and investments that complement our existing business. These acquisitions and investments could be unsuccessful or consume significant resources, which could adversely affect our operating results.
We will continue to analyze and evaluate the acquisition of strategic businesses or product lines with the potential to strengthen our industry position or enhance our existing set of products and services offerings. We cannot provide assurance that we will identify or successfully complete transactions with suitable acquisition candidates in the future, nor can we provide assurance that completed acquisitions will be successful.
Some of the businesses we may seek to acquire or invest in may be marginally profitable or unprofitable. For these businesses to achieve acceptable levels of profitability, we must improve their management, operations, products and market penetration. We
14
may not be successful in this regard and we may encounter other difficulties in integrating acquired businesses into our existing operations.
Acquisitions and investments may involve significant cash expenditures, debt incurrence, operating losses and expenses. Acquisitions involve numerous other risks, including:
|
•
|
diversion of management time and attention from daily operations;
|
|
•
|
difficulties integrating acquired businesses, technologies and personnel into our business;
|
|
•
|
difficulties completing the transaction in a timely manner;
|
|
•
|
difficulties realizing synergies expected to result from acquisitions;
|
|
•
|
difficulties in obtaining and verifying the financial statements and other business information of acquired businesses;
|
|
•
|
inability to obtain regulatory approvals and/or required financing on favorable terms;
|
|
•
|
potential loss of key employees, key contractual relationships or key customers of acquired companies or of us;
|
|
•
|
difficulties competing in the new markets we enter;
|
|
•
|
assumption of the liabilities and exposure to unforeseen liabilities of acquired companies;
|
|
•
|
dilution of interests of holders of our ordinary shares through the issuance of equity securities or equity-linked securities; and
|
|
•
|
difficulty in integrating financial reporting systems and implementing controls, procedures and policies, including disclosure controls and procedures and internal control over financial reporting, appropriate for public companies of our size at companies that, prior to the acquisition, had lacked such controls, procedures and policies.
|
We continually look to expand our services and products into international markets. As we expand into new international markets, we will have only limited experience in marketing and operating services and products in such markets. In some instances, we may rely on the efforts and abilities of foreign business partners in such markets. Certain international markets may be slower than U.S. markets in adopting our services and products, and our operations in such markets may not develop at a rate that supports our level of investment. In addition to the risks outlined above, expansion into certain international markets may require us to compete with local businesses with greater knowledge of the market, including the tastes and preferences of customers and businesses with dominant market shares. Any acquisitions or investments may ultimately harm our business or financial condition; as such, acquisitions may not be successful and may ultimately result in impairment charges.
We may pursue business opportunities that diverge from core business.
We may pursue business opportunities that diverge from our core business, including expanding our products or service offerings, investing in new and unproven technologies and forming new alliances with companies to distribute our products and services. We can offer no assurance that any such business opportunities will prove to be successful. Among other negative effects, our investment in new business opportunities may exceed the returns we realize. Additionally, any new investments could have higher cost structures than our current business, which could reduce operating margins and require more working capital. In the event that working capital requirements exceed operating cash flow, we may be required to draw on our revolving credit facility or pursue other external financing, which may not be readily available.
Our enterprise excellence efforts may not achieve the improvements we expect.
We utilize a number of tools to improve efficiency and productivity. Implementation of new processes to our operations could cause disruptions and may prove to be more difficult, costly or time consuming than expected. There is no assurance that all of our planned enterprise excellence projects will be fully implemented, or if implemented, will realize the expected improvements.
Our periodic restructuring plans may not be successful.
We have in the past restructured or made other adjustments to our workforce and manufacturing footprint in response to market changes, product changes, performance issues, changes in strategy, acquisitions and other internal and external considerations. Historically, these types of restructuring activities have resulted in increased restructuring costs and temporarily reduced productivity. In addition, we may not achieve or sustain the expected growth or cost savings benefits of these restructurings or do so within the expected timeframe. These effects could recur in connection with future acquisitions and other restructurings and our Net revenues and other results of operations could be negatively affected.
Material adverse legal judgments, fines, penalties or settlements could adversely affect our business.
We are currently and may in the future become involved in legal proceedings and disputes incidental to the operation of our business. Our business may be adversely affected by the outcome of these proceedings and other contingencies (including, without
15
limitation, environmental, product liability, intellectual property, data protection and labor and employment matters) that cannot be predicted with certainty. As required by U.S. generally accepted accounting principles ("GAAP"), we establish reserves based on our assessment of contingencies. Subsequent developments in legal proceedings and other contingencies may affect our assessment and estimates of the loss contingency recorded as a reserve, and we may be required to make additional material payments.
Allegations that we have infringed the intellectual property rights of third parties could negatively affect us.
We may be subject to claims of infringement of intellectual property rights by third parties. In particular, we often compete in areas having extensive intellectual property rights owned by others and we have become subject to claims alleging infringement of intellectual property rights of others. In general, if it is determined that one or more of our technologies, products or services infringes the intellectual property rights owned by others, we may be required to cease marketing those services, to obtain licenses from the holders of the intellectual property at a material cost or to take other actions to avoid infringing such intellectual property rights. The litigation process is costly and subject to inherent uncertainties, and we may not prevail in litigation matters regardless of the merits of our position. Adverse intellectual property litigation or claims of infringement against us may become extremely disruptive if the plaintiffs succeed in blocking the trade of our products and services and may have a material adverse effect on our business.
Our reputation, ability to do business and results of operations could be impaired by improper conduct by any of our employees, agents or business partners.
We are subject to regulation under a variety of U.S. federal and state and non-U.S. laws, regulations and policies including laws related to anti-corruption, export and import compliance, anti-trust and money laundering due to our global operations. We cannot provide assurance that our internal controls will always protect us from the improper conduct of our employees, agents and business partners. Any improper conduct could damage our reputation and subject us to, among other things, civil and criminal penalties, material fines, equitable remedies (including profit disgorgement and injunctions on future conduct), securities litigation and a general loss of investor confidence.
Disruptions in our global supply chain, including product manufacturing and logistical services provided by outsourcing partners, may negatively impact our business.
Our ability to meet our customers' needs and achieve cost targets depends on our ability to maintain key manufacturing and supply arrangements, including execution of supply chain optimizations and certain sole supplier or sole manufacturing arrangements. The loss or disruption of such manufacturing and supply arrangements could interrupt product supply and, if not effectively managed and remedied, have an adverse impact on our business.
We outsource certain manufacturing and logistical services to partners located throughout the world. Our reliance on these third parties reduces our control over the manufacturing and delivery process, exposing us to risks including reduced control over quality assurance, product costs, product supply and delivery delays. If we are unable to effectively manage these relationships, or if these third parties experience delays, disruptions, capacity constraints, regulatory issues or quality control problems in their operations or otherwise fail to meet our future requirements for timely delivery, our ability to ship and deliver certain of our products to our customers could be impaired and our business could be harmed.
We may be subject to risks relating to our information technology and operational technology systems.
We rely extensively on information technology and operational technology systems, networks and services including hardware, software, firmware and technological applications and platforms (collectively, "IT Systems") to manage and operate our business from end-to-end, including ordering and managing materials from suppliers, design and development, manufacturing, marketing, selling and shipping to customers, invoicing and billing, managing our banking and cash liquidity systems, managing our enterprise resource planning and other accounting and financial systems and complying with regulatory, legal and tax requirements. There can be no assurance that our current IT Systems will function properly. We have invested and will continue to invest in improving our IT Systems. Some of these investments are significant and impact many important operational processes and procedures. There is no assurance that any newly implemented IT Systems will improve our current systems, improve our operations or yield the expected returns on the investments. In addition, the implementation of new IT Systems may cause disruptions in our operations and, if not properly implemented and maintained, negatively impact our business. If our IT Systems cease to function properly or if these systems do not provide the anticipated benefits, our ability to manage our operations could be impaired.
16
We currently rely on third-party vendors for many of the critical elements of our global information and operational technology infrastructure and their failure to provide effective support for such infrastructure could negatively impact our business and financial results.
We have outsourced many of the critical elements of our global information and operational technology infrastructure to third-party service providers in order to achieve efficiencies. If such service providers do not perform or do not perform effectively, we may not be able to achieve the expected efficiencies and may have to incur additional costs to address failures in providing service by the service providers. Depending on the function involved, such non-performance, ineffective performance or failures of service may lead to business disruptions, processing inefficiencies or security breaches.
Disruptions or breaches of our information systems could adversely affect us.
Despite our implementation of network security measures which have focused on prevention, mitigation, resilience and recovery, our network and products, including access solutions, may be vulnerable to cybersecurity attacks, computer viruses, malicious codes, malware, ransomware, phishing, social engineering, denial of service, hacking, break-ins and similar disruptions. Cybersecurity attacks and intrusion efforts are continuous and evolving, and in certain cases they have been successful at the most robust institutions. The scope and severity of risks that cyber threats present have increased dramatically and include, but are not limited to, malicious software, attempts to gain unauthorized access to data or premises, exploiting weaknesses related to vendors or other third parties that could be exploited to attack our systems, denials of service and other electronic security breaches that could lead to disruptions in systems, unauthorized release of confidential or otherwise protected information and corruption of data. Any such event could have a material adverse effect on our business, operating results and financial condition, as we face regulatory, reputational and litigation risks resulting from potential cyber incidents, as well as the potential of incurring significant remediation costs.
Our daily business operations also require us to retain sensitive data such as intellectual property, proprietary business information and data related to customers, suppliers and business partners within our networking infrastructure including data from individuals subject to the European Union's General Data Protection Regulation. The loss or breach of such information due to various causes including catastrophic events, natural disasters, power outages, system failures, computer viruses, improper data handling and employee error or malfeasance could result in wide reaching negative impacts to our business, and as such, the ongoing maintenance and security of this information is pertinent to the success of our business operations and our strategic goals.
Our networking infrastructure and related assets may be subject to unauthorized access by hackers, employee error or malfeasance or other unforeseen activities. Such issues could result in the disruption of business processes, network degradation and system downtime, along with the potential that a third party will exploit our critical assets such as intellectual property, proprietary business information and data related to our customers, suppliers and business partners. To the extent that such disruptions occur and our business continuity plans do not effectively address these disruptions in a timely manner, they may cause delays in the manufacture or shipment of our products and the cancellation of customer orders and, as a result, our business operating results and financial condition could be materially and adversely affected, resulting in a possible loss of business or brand reputation.
Commodity shortages, price increases and higher energy prices could negatively affect our financial results.
We rely on suppliers to secure commodities, including steel, zinc, brass and other non-ferrous metals, required for the manufacture of our products. A disruption of deliveries from our suppliers or decreased availability of commodities could have an adverse effect on our ability to meet our commitments to customers or increase our operating costs. We believe that available sources of supply will generally be sufficient for our needs for the foreseeable future. Nonetheless, the unavailability of some commodities could have a material adverse impact on our business.
Volatility in the prices of these commodities could increase the costs of our products and services, and we may not be able to pass on these costs to our customers. We do not currently use financial derivatives to hedge against this volatility; however, we utilize firm purchase commitments to mitigate risk. The pricing of some commodities we use is based on market prices. To mitigate this exposure, we may use annual price contracts to minimize the impact of inflation and to benefit from deflation.
Additionally, we are exposed to fluctuations in energy prices due to the instability of current market prices. Higher energy costs increase our operating costs and the cost of shipping our products and supplying services to our customers around the world. Consequently, sharp price increases, the imposition of taxes or an interruption of supply could cause us to lose the ability to effectively manage the risk of rising energy prices and may have an adverse impact on our results of operations and cash flows.
17
We may be required to recognize impairment charges for our goodwill, indefinite-lived intangible assets and other long-lived assets.
At
December 31, 2018
, the net carrying value of our goodwill and other indefinite-lived intangible assets totaled approximately
$883.0 million
and
$130.6 million
, respectively. Pursuant to GAAP, we are required to annually assess our goodwill, indefinite-lived intangibles and other long-lived assets to determine if they are impaired. In addition, interim assessments must be performed whenever events or changes in circumstances indicate that impairment may have occurred. If the testing performed indicates that impairment has occurred, we are required to record a non-cash impairment charge for the difference between the carrying value of the goodwill or other indefinite-lived intangible assets and the fair value of the goodwill or other indefinite-lived intangible assets in the period the determination is made. Disruptions to our business, end market conditions and protracted economic weakness, unexpected significant declines in operating results of reporting units, divestitures and market capitalization declines may result in additional charges for goodwill and other asset impairments. We have significant intangible assets, including goodwill with an indefinite life, which are susceptible to valuation adjustments as a result of changes in such factors and conditions.
The basis of the fair value for our impairment assessments is determined by projecting future cash flows using assumptions concerning future operating performance and economic conditions that may differ from actual cash flows. Financial and credit market volatility directly impacts our fair value measurement through our weighted-average cost of capital that we use to determine our discount rate and through our stock price that we use to determine our market capitalization. Although our last analysis regarding the fair values of the goodwill and indefinite-lived intangible assets for our reporting units indicates that they exceed their respective carrying values, materially different assumptions regarding the future performance of our businesses or significant declines in our stock price could result in goodwill and intangible asset impairment losses. Specifically, an unanticipated deterioration in Net revenues and operating margins generated by our EMEIA and/or Asia Pacific segments could trigger future impairment in those segments. While we currently believe that our projected results will not result in future impairment, a deterioration in results or other factors could trigger a future impairment.
Our ability to successfully grow and expand our business depends on our ability to recruit and retain a highly qualified and diverse workforce.
Our ability to successfully grow and expand our business depends on the contributions and abilities of our employees and key management, including, for example, the ability of our sales force to adapt to any changes made in the sales organization and achieve adequate customer coverage. We must therefore continue to effectively recruit, retain and motivate key management, sales and other highly qualified and skilled personnel to maintain our current business and support our projected growth. A shortage of these key employees for various reasons, including changes in laws and policies regarding immigration and work authorizations in jurisdictions where we have operations, might jeopardize our ability to grow and expand our business.
Our operations are subject to regulatory risks.
Our U.S. and non-U.S. operations are subject to a number of laws and regulations, including fire and building codes and environmental, health and safety standards. We have incurred, and will be required to continue to incur, significant expenditures to comply with these laws and regulations. Changes to, or changes in interpretations of, current laws and regulations could require us to increase our compliance expenditures, cause us to significantly alter or discontinue offering existing products and services or cause us to develop new products and services. Altering current products and services or developing new products and services to comply with changes in the applicable laws and regulations could require significant research and development investments, increase the cost of providing the products and services and adversely affect the demand for our products and services.
In the event a regulatory authority concludes that we are not or have not at all times been in full compliance with these laws or regulations, we could be fined, criminally charged or otherwise sanctioned.
Certain environmental laws assess liability on current or previous owners of real property or operators of manufacturing facilities for the costs of investigation, removal or remediation of hazardous substances or materials at such properties or at properties at which parties have disposed of hazardous substances. Liability for investigative, removal and remedial costs under certain U.S. federal and state laws and certain non-U.S. laws are retroactive, strict and joint and several. In addition to cleanup actions brought by governmental authorities, private parties could bring personal injury or other claims due to the presence of, or exposure to, hazardous substances. We have received notification from U.S. and non-U.S. governmental agencies, including the EPA and similar state environmental agencies, that conditions at a number of current and formerly owned sites where we and others have disposed of hazardous substances require investigation, cleanup and other possible remedial action. These agencies may require that we reimburse the government for its costs incurred at these sites or otherwise pay for the costs of investigation and cleanup of these sites, including by providing compensation for natural resource damage claims from such sites. For more information, see "Business - Environmental Regulation."
18
While we have planned for future capital and operating expenditures to maintain compliance with environmental laws and have accrued for costs related to current remedial efforts, our costs of compliance, or our liabilities arising from past or future releases of, or exposures to, hazardous substances, may exceed our estimates. We may also be subject to additional environmental claims for personal injury or cost recovery actions for remediation of facilities in the future based on our past, present or future business activities.
The capital and credit markets are important to our business.
Instability in U.S. and global capital and credit markets, including market disruptions, limited liquidity and interest rate volatility or reductions in the credit ratings assigned to us by independent ratings agencies, could reduce our access to capital markets or increase the cost of funding our short and long-term credit requirements. In particular, if we are unable to access capital and credit markets on terms that are acceptable to us, we may not be able to make certain investments or fully execute our business plans and strategy.
Our suppliers and customers are also dependent upon the capital and credit markets. Limitations on the ability of customers, suppliers or financial counterparties to access credit could lead to insolvencies of key suppliers and customers, limit or prevent customers from obtaining credit to finance purchases of our products and services and cause delays in the delivery of key products from suppliers.
As a global business, we have a relatively complex tax structure, and there is a risk that tax authorities will disagree with our tax positions.
Since we conduct operations worldwide through our subsidiaries, we are subject to complex transfer pricing regulations in the countries in which we operate. Transfer pricing regulations generally require that, for tax purposes, transactions between us and our affiliates be priced on a basis that would be comparable to an arm's length transaction and that contemporaneous documentation be maintained to support the tax allocation. Although uniform transfer pricing standards are emerging in many of the countries in which we operate, there is still a relatively high degree of uncertainty and inherent subjectivity in complying with these rules. To the extent that any tax authority disagrees with our transfer pricing policies, we could become subject to significant tax liabilities and penalties. Our tax returns are subject to review by taxing authorities in the jurisdictions in which we operate. Although we believe that we have provided for all tax exposures, the ultimate outcome of a tax review could differ materially from our provisions.
We could be subject to changes in tax rates, the adoption of new U.S. or international tax legislation or exposure to additional tax liabilities.
Our future effective tax rate and cash tax obligations could be adversely affected by shifts in our mix of earnings in countries with varying statutory tax rates, changes in the valuation of our deferred tax assets or liabilities or changes in tax laws, regulations, interpretations or accounting principles, as well as certain discrete items. In addition, we are subject to regular review and audit by both U.S. and non-U.S. tax authorities. As a result, we have received, and may in the future receive, assessments in multiple jurisdictions on various tax-related assertions. Any adverse outcome of such a review or audit could have a negative effect on our operating results and financial condition. In addition, the determination of our worldwide provision for income taxes and other tax liabilities requires significant judgment, and there are many transactions and calculations where the ultimate tax determination is uncertain. Although we believe our estimates are reasonable, the ultimate tax outcome may differ from the amounts recorded in our financial statements and may materially affect our financial results in the period or periods for which such determination is made. Furthermore, due to shifting economic and political conditions, tax policies, laws, interpretations and rates in various jurisdictions may be subject to significant change, which could materially affect our financial position and results of operations. For example, the 2017 Tax Cuts and Jobs Act (the “Tax Reform Act”) enacted in December 2017 in the U.S. had a significant impact on our cash tax obligations and the issuance of additional regulatory guidance related to the Tax Reform Act could materially affect our cash tax obligations and effective tax rate. In addition, many countries in Europe, as well as a number of other countries and organizations, have recently proposed or recommended changes to existing tax laws or have enacted new laws that could significantly increase our effective tax rate or cash tax obligations in many countries where we do business or require us to change the manner in which we operate our business.
There are risks associated with our outstanding and future indebtedness.
We have approximately $1.5 billion of outstanding indebtedness at
December 31, 2018
. In addition, we have a senior unsecured revolving credit facility that permits borrowings of up to an additional
$500 million
. Volatility in the credit markets could adversely impact our ability to obtain favorable financing terms in the future. A substantial portion of our cash flows from operations is
19
dedicated to the payment of principal and interest on our indebtedness and will not be available for other purposes, including our operations, capital expenditures, payment of dividends, share repurchase programs or future business opportunities.
Our ability to make scheduled payments or to refinance our debt obligations depends on our financial and operating performance, which is subject to prevailing economic and competitive conditions and to certain financial, business and other factors beyond our control. If our cash flows and capital resources are insufficient to fund our debt service obligations, we may be forced to reduce or delay capital expenditures, reduce or eliminate the payment of dividends, sell assets, seek additional capital or seek to restructure or refinance our indebtedness. These alternative measures may not be successful and may not permit us to meet our scheduled debt service obligations. In the absence of such operating results and resources, we could face substantial liquidity problems and might be required to sell material assets or operations to attempt to meet our debt service and other obligations.
Additionally, a portion of our borrowings at
December 31, 2018
includes a term loan with a variable rate of interest, which exposes us to interest rate risk. We are exposed to the risk of rising interest rates to the extent that we fund our operations with short-term or variable-rate borrowings. At
December 31, 2018
, our $1.5 billion of aggregate debt outstanding includes $
656 million
of floating-rate term loans and
$800 million
of fixed-rate senior notes. We have the ability to incur up to
$500 million
of additional floating-rate debt under our senior unsecured revolving credit facility. We have entered into interest rate swaps for
$250 million
of our floating-rate term loans to manage our interest rate risk. A 100 basis-point increase in LIBOR would have resulted in incremental
2018
interest expense of approximately
$4.3 million
. If the LIBOR or other applicable base rates under our senior unsecured credit facilities increase in the future, the interest on floating-rate debt could have a material impact on our interest expense.
Risks Relating to the Spin-off
In connection with the Spin-off, Ingersoll Rand indemnified us for certain liabilities and we indemnified Ingersoll Rand for certain liabilities. If we are required to act on these indemnities to Ingersoll Rand, we may need to divert cash to meet those obligations and our financial results could be negatively impacted. The Ingersoll Rand indemnity may not be sufficient to insure us against the full amount of liabilities for which it will be allocated responsibility, and Ingersoll Rand may not be able to satisfy its indemnification obligations in the future.
Pursuant to the Separation and Distribution Agreement, the Employee Matters Agreement and the Tax Matters Agreement with Ingersoll Rand, Ingersoll Rand agreed to indemnify us for certain liabilities, and we agreed to indemnify Ingersoll Rand for certain liabilities, in each case for uncapped amounts. Such indemnities may be significant and could negatively impact our business, particularly indemnities relating to our actions that could impact the tax-free nature of the Spin-off. Third parties could also seek to hold us responsible for any of the liabilities that Ingersoll Rand retained. Further, the indemnity from Ingersoll Rand may not be sufficient to protect us against the full amount of such liabilities, and Ingersoll Rand may not be able to fully satisfy its indemnification obligations. Moreover, even if we ultimately succeed in recovering from Ingersoll Rand any amounts for which we are held liable, we may be temporarily required to bear these losses ourselves.
If the distribution or certain internal transactions undertaken in anticipation of the Spin-off are determined to be taxable for U.S. federal income tax purposes, we, our shareholders that are subject to U.S. federal income tax and/or Ingersoll Rand could incur significant U.S. federal income tax liabilities and, in certain circumstances, we could be required to indemnify Ingersoll Rand for material taxes pursuant to indemnification obligations under the Tax Matters Agreement.
Ingersoll Rand has received an IRS ruling substantially to the effect that, among other things, the distribution of our ordinary shares, together with certain related transactions, qualify under Sections 355 and 368(a) of the Internal Revenue Code ("the Code"), with the result that Ingersoll Rand and Ingersoll Rand’s shareholders will not recognize any taxable income, gain or loss for U.S. federal income tax purposes as a result of the Spin-off, except to the extent of cash received in lieu of fractional shares (the "IRS Ruling"). The IRS Ruling also provided that certain internal transactions undertaken in anticipation of the distribution qualify for favorable treatment under the Code. In addition to obtaining the IRS Ruling, Ingersoll Rand received opinions from the law firm of Simpson Thacher & Bartlett LLP substantially to the effect that certain requirements, including certain requirements that the IRS did not rule on, necessary to obtain tax-free treatment have been satisfied, such that the distribution for U.S. federal income tax purposes and certain other matters relating to the distribution, including certain internal transactions undertaken in anticipation of the distribution, received tax-free treatment under Section 355 of the Code. The receipt and effectiveness of the IRS Ruling and the opinions were conditions to the distribution that were satisfied or waived by Ingersoll Rand. The IRS Ruling and the opinions rely on certain facts and assumptions and certain representations and undertakings from us and Ingersoll Rand regarding the past and future conduct of our respective businesses and other matters. Notwithstanding the IRS Ruling and the opinions, the IRS could determine on audit that the distribution or the internal transactions should be treated as taxable transactions if it determines that any of these facts, assumptions, representations or undertakings is not correct or has been violated, or that the distribution or the internal transactions should be taxable for other reasons, including as a result of significant changes in shares or asset ownership after the distribution. A legal opinion represents the tax adviser’s best legal judgment, is not binding on the IRS or the courts, and
20
the IRS or the courts may not agree with the opinion. In addition, the opinion will be based on then current law, and cannot be relied upon if current law changes with retroactive effect. If the distribution is determined to be taxable, the distribution could be treated as a taxable dividend or capital gain for U.S. federal income tax purposes, and our shareholders could incur significant U.S. federal income tax liabilities. In addition, we or Ingersoll Rand could incur significant U.S. federal income tax liabilities if it is ultimately determined that certain internal transactions undertaken in anticipation of the distribution are taxable.
In addition, under the terms of the Tax Matters Agreement, in the event the distribution or the internal transactions were determined to be taxable as a result of actions taken after the distribution by us or Ingersoll Rand, the party responsible for such failure would be responsible for all taxes imposed on us or Ingersoll Rand as a result thereof. If such failure is not the result of actions taken after the distribution by us or Ingersoll Rand, then we would be responsible for any taxes imposed on us or Ingersoll Rand as a result of such determination. Such tax amounts could be significant.
If the distribution is determined to be taxable for Irish tax purposes, significant Irish tax liabilities may arise.
Ingersoll Rand has received an opinion of the Irish Revenue regarding the Irish tax consequences of the distribution to the effect that certain reliefs and exemptions for corporate reorganizations apply. In addition to obtaining the opinion from Irish Revenue, Ingersoll Rand received an opinion from the law firm of Arthur Cox confirming the applicability of the relevant exemptions and reliefs to the distribution and that certain internal transactions will not trigger tax costs. These opinions rely on certain facts and assumptions and certain representations and undertakings from us and Ingersoll Rand regarding the past and future conduct of our respective businesses and other matters. Notwithstanding the opinions, the Irish Revenue could determine on audit that the distribution or the internal transactions do not qualify for the relevant exemptions or reliefs if it determines that any of these facts, assumptions, representations or undertakings is not correct or has been violated. A legal opinion represents the tax adviser’s best legal judgment, is not binding on the Irish Revenue or the courts and the Irish Revenue or the courts may not agree with the legal opinion. In addition, the legal opinion was based on then current law, and cannot be relied upon if current law changes with retroactive effect. If the distribution ultimately is determined not to fall within certain exemptions or reliefs, the distribution could result in our shareholders having an Irish tax liability as a result of the distribution (if a shareholder is an Irish resident or holds shares in Ingersoll Rand in an Irish branch or agency), or we or Ingersoll Rand could incur Irish tax liabilities.
In addition, under the terms of the Tax Matters Agreement, in the event the distribution does not qualify for certain reliefs or exemptions, then we would be responsible for any taxes imposed on us or Ingersoll Rand as a result of such determination. Such tax amounts could be significant.
Risks Related to Our Incorporation in Ireland
Irish law differs from the laws in effect in the United States and may afford less protection to holders of our securities.
The U.S. currently does not have a treaty with Ireland providing for the reciprocal recognition and enforcement of judgments in civil and commercial matters. As such, there is some uncertainty as to whether the courts of Ireland would recognize or enforce judgments of U.S. courts obtained against us or our directors or officers based on U.S. federal or state civil liability laws, including the civil liability provisions of the U.S. federal or state securities laws, or hear actions against us or those persons based on those laws.
As an Irish company, we are governed by the Companies Act 2014 of Ireland, as amended, which differs in some material respects from laws generally applicable to U.S. corporations and shareholders, including, among others, differences relating to interested director and officer transactions and shareholder lawsuits. Likewise, the duties of directors and officers of an Irish company generally are owed to the company only. Shareholders of Irish companies generally do not have a personal right of action against directors or officers of the company and may exercise such rights of action on behalf of the company only in limited circumstances. Accordingly, holders of our securities may have more difficulty protecting their interests than would holders of securities of a corporation incorporated in a jurisdiction of the U.S.
In addition, Irish law allows shareholders to authorize share capital which then can be issued by a board of directors without shareholder approval. Also, subject to specified exceptions, Irish law grants statutory preemptive rights to existing shareholders to subscribe for new issuances of shares for cash. At our annual meeting of shareholders, our shareholders authorized our Board of Directors to issue up to 33% of our issued ordinary shares and further authorized our Board of Directors to issue up to 5% of such shares for cash without first offering them to our existing shareholders. Both of these authorizations will expire after a certain period unless renewed by our shareholders, and we cannot guarantee that the renewal of these authorizations will always be approved.
21
Changes in tax laws, regulations or treaties, changes in our status under the tax laws of many jurisdictions or adverse determinations by taxing authorities could increase our tax burden or otherwise affect our financial condition or operating results, as well as subject our shareholders to additional taxes.
The realization of any tax benefit related to our incorporation and tax residence in Ireland could be impacted by changes in tax laws, tax treaties or tax regulations or the interpretation or enforcement thereof by the tax authorities of many jurisdictions. From time to time, proposals have been made and/or legislation has been introduced to change the tax laws of various jurisdictions or limit tax treaty benefits that if enacted could materially increase our tax burden and/or our effective tax rate. For instance, pending regulatory guidance on the recently enacted U.S. tax legislation could modify or eliminate the tax deductibility of various currently deductible payments, which could materially and adversely affect our effective tax rate and cash tax position. Moreover, other legislative proposals could have a material adverse impact on us by overriding certain tax treaties and limiting the treaty benefits on certain payments, which could increase our tax liability. We cannot predict the outcome of any specific legislation in any jurisdiction.
While we monitor proposals that would materially impact our tax burden and/or our effective tax rate and investigate our options, we could still be subject to increased taxation on a going forward basis no matter what action we undertake if certain legislative proposals are enacted, certain tax treaties are amended and/or our interpretation of applicable tax law is challenged and determined to be incorrect. In particular, any changes and/or differing interpretations of applicable tax law that have the effect of disregarding our incorporation in Ireland, limiting our ability to take advantage of tax treaties between jurisdictions, modifying or eliminating the deductibility of various currently deductible payments or increasing the tax burden of operating or being resident in a particular country, could subject us to increased taxation.
Dividends received by our shareholders may be subject to Irish dividend withholding tax.
In certain circumstances, we are required to deduct Irish dividend withholding tax (currently at the rate of 20%) from dividends paid to our shareholders. In the majority of cases, shareholders residing in the U.S. will not be subject to Irish withholding tax, and shareholders resident in a number of other countries will not be subject to Irish withholding tax provided that they complete certain Irish dividend withholding tax forms. However, some shareholders may be subject to withholding tax, which could discourage the investment in our stock and adversely impact the price of our shares.
Dividends received by our shareholders could be subject to Irish income tax.
Dividends paid in respect of our shares generally are not subject to Irish income tax where the beneficial owner of these dividends is exempt from Irish dividend withholding tax, unless the beneficial owner of the dividend has some connection with Ireland other than his or her shareholding in Allegion.
Our shareholders who receive their dividends subject to Irish dividend withholding tax will generally have no further liability to Irish income tax on the dividends unless the beneficial owner of the dividend has some connection with Ireland other than his or her shareholding in Allegion.
Certain provisions in our Memorandum and Articles of Association, among other things, could prevent or delay an acquisition of us, which could decrease the trading price of our ordinary shares.
Our Memorandum and Articles of Association contains provisions to deter takeover practices, inadequate takeover bids and unsolicited offers. These provisions include, amongst others:
|
•
|
a provision of our Articles of Association which generally prohibits us from engaging in a business combination with an interested shareholder (being (i) the beneficial owner, directly or indirectly, of 10% or more of our voting shares or (ii) an affiliate or associate of us that has at any time within the last five years been the beneficial owner, directly or indirectly, or 1% or more of our voting shares), subject to certain exceptions;
|
|
•
|
rules regarding how shareholders may present proposals or nominate directors for election at shareholder meetings;
|
|
•
|
the right of our Board of Directors to issue preferred shares without shareholder approval in certain circumstances, subject to applicable law; and
|
|
•
|
the ability of our Board of Directors to set the number of directors and to fill vacancies on our Board of Directors in certain circumstances.
|
We believe these provisions will provide some protection to our shareholders from coercive or otherwise unfair takeover tactics. These provisions are not intended to make us immune from takeovers. However, these provisions will apply even if the offer may be considered beneficial by some shareholders and could delay or prevent an acquisition that our Board of Directors determines
22
is in our best interests and our shareholders' best interests. These provisions may also prevent or discourage attempts to remove and replace incumbent directors.
In addition, several mandatory provisions of Irish law could prevent or delay an acquisition of us. For example, Irish law does not permit shareholders of an Irish public limited company to take action by written consent with less than unanimous consent. We also will be subject to various provisions of Irish law relating to mandatory bids, voluntary bids, requirements to make a cash offer and minimum price requirements, as well as substantial acquisition rules and rules requiring the disclosure of interests in our shares in certain circumstances. Also, Irish companies, including us, may alter their Memorandum of Association and Articles of Association only with the approval of at least 75% of the votes of the company’s shareholders cast in person or by proxy at a general meeting of the company.
The agreements that we entered into with Ingersoll Rand in connection with the Spin-off generally require Ingersoll Rand’s consent to any assignment by us of our rights and obligations under the agreements. The consent and termination rights set forth in these agreements might discourage, delay or prevent a change of control that shareholders may consider favorable.
23
Item 1B.
UNRESOLVED STAFF COMMENTS
None.
Item 2.
PROPERTIES
We operate through a broad network of sales offices, engineering centers,
34
production and assembly facilities and several distribution centers throughout the world. Our active properties represent about
6.9
million square feet, of which approximately
37%
is leased.
The majority of our plant facilities are owned by us with the remainder under long-term lease arrangements. We believe that our plants have been well maintained, are generally in good condition and are suitable for the conduct of our business.
Item 3.
LEGAL PROCEEDINGS
In the normal course of business, we are involved in a variety of lawsuits, claims and legal proceedings, including commercial and contract disputes, employment matters, product liability claims, environmental liabilities, intellectual property disputes and tax-related matters. In our opinion, pending legal matters are not expected to have a material adverse impact on our results of operations, financial condition, liquidity or cash flows.
This item should be read in conjunction with the Company's Risk Factors in Part I, Item 1A for additional information.
Item 4.
MINE SAFETY DISCLOSURES
Not applicable.
EXECUTIVE OFFICERS OF THE REGISTRANT
The following is a list of executive officers of the Company as of
February 19, 2019
.
David D. Petratis
, age 61, has served as our Chairman, President and Chief Executive Officer since 2013.
Patrick S. Shannon
, age 56, has served as our Senior Vice President and Chief Financial Officer since 2013.
Jeffrey N. Braun
, age 59, has served as our Senior Vice President, General Counsel and Chief Compliance Officer since 2014, and Secretary since 2018. Mr. Braun served as our Deputy General Counsel and Chief Compliance Officer from 2013 to 2014.
Timothy P. Eckersley
, age 57, has served as our Senior Vice President and President - Americas since 2013.
Tracy L. Kemp
, age 50, has served as our Senior Vice President and Chief Information Officer since 2015. Ms. Kemp served as our Vice President and Chief Information Officer from 2013 to 2015.
Shelley A. Meador
, age 47, has served as our Senior Vice President and Chief Human Resources Officer since 2016. Ms. Meador served as our Vice President - Tax from 2013 to 2016.
Lucia Veiga Moretti
, age 54, has served as our Senior Vice President and President - EMEIA since 2014. Previously, Ms. Moretti served as Senior Vice President and President, Delphi Product and Service Solutions for Delphi Automotive (a supplier of automotive technologies) from 2011 to 2014.
Chris E. Muhlenkamp,
age 61, has served as our Senior Vice President - Global Operations and Integrated Supply Chain since 2014. Mr. Muhlenkamp served as our Vice President - Global Operations and Integrated Supply Chain from 2013 to 2014.
Douglas P. Ranck
, age 60, has served as our Vice President, Controller and Chief Accounting Officer since 2013.
Vincent Wenos,
age 52, has served as our Vice President - Global Technology and Engineering since 2018. Mr. Wenos served as both our Vice President - Americas Engineering and Vice President - Global Mechanical Products from 2016 to 2018. Mr. Wenos
24
previously served as Vice President - Global Product Development and Technology at Stanley Black & Decker, Inc. (a global diversified consumer and industrial products company).
Jeffrey M. Wood
, age 48, has served as our Senior Vice President and President - Asia Pacific since 2017. Mr. Wood served as our Vice President, Global Supply Management from 2013 to 2017.
All above-listed officers except for Ms. Moretti and Mr. Wenos have been employed by the Company for more than the past five years. No family relationship exists between any of the above-listed executive officers of the Company. All officers are elected to hold office for one year or until their successors are elected and qualified.
25
PART II
Item 5.
MARKET FOR REGISTRANT’S COMMON EQUITY, RELATED STOCKHOLDER MATTERS AND
ISSUER PURCHASES OF EQUITY SECURITIES
Information regarding the principal market for our ordinary shares and related shareholder matters is as follows:
Our ordinary shares are traded on the NYSE under the symbol ALLE. As of
February 14, 2019
, the number of record holders of ordinary shares was
2,648
. Information regarding equity compensation plans required to be disclosed pursuant to this Item is incorporated by reference from our Proxy Statement.
Dividend Policy
Our Board of Directors declared dividends of $0.21 per ordinary share on February 8, 2018, April 5, 2018, September 6, 2018 and December 6, 2018. On February 5, 2019, our Board of Directors declared a dividend of
$0.27
per ordinary share payable
March 29, 2019
. We paid a total of
$79.4 million
in cash for dividends to ordinary shareholders during the year ended
December 31, 2018
. Future dividends on our ordinary shares, if any, will be at the discretion of our Board of Directors and will depend on, among other things, our results of operations, cash requirements and surplus, financial condition, contractual restrictions and other factors that the Board of Directors may deem relevant, as well as our ability to pay dividends in compliance with the Irish Companies Act. Under the Irish Companies Act, dividends and distributions may only be made from distributable reserves. Distributable reserves, broadly, means the accumulated realized profits of Allegion plc (ALLE-Ireland). In addition, no distribution or dividend may be made unless the net assets of ALLE-Ireland are equal to, or in excess of, the aggregate of ALLE-Ireland’s called up share capital plus undistributable reserves and the distribution does not reduce ALLE-Ireland’s net assets below such aggregate.
Issuer Purchases of Equity Securities
In February 2017, our Board of Directors approved a new stock repurchase authorization of up to $500 million of the Company's ordinary shares ("2017 Share Repurchase Authorization"). The 2017 Share Repurchase Authorization does not have a prescribed expiration date. We paid a total of
$67.3 million
to repurchase
0.9 million
ordinary shares during the year ended
December 31, 2018
and
$60.0 million
to repurchase
0.8 million
ordinary shares during the year ended
December 31, 2017
. At
December 31, 2018
, we have approximately $372.7 million available under the 2017 Share Repurchase Authorization.
26
Performance Graph
The annual changes for the period shown December 1, 2013 (when our ordinary shares began trading) to
December 31, 2018
in the graph on this page are based on the assumption that $100 had been invested in Allegion plc ordinary shares, the Standard & Poor’s 500 Stock Index ("S&P 500") and the Standard & Poor's 400 Capital Goods Index ("S&P 400 Capital Goods") on December 1, 2013, and that all quarterly dividends were reinvested. The total cumulative dollar returns shown on the graph represent the value that such investments would have had on
December 31, 2018
.
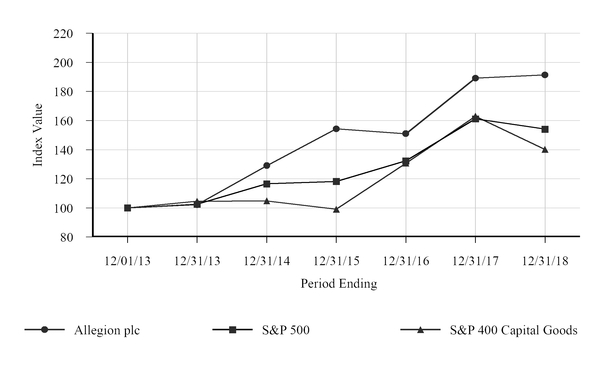
|
December 1, 2013
|
December 31, 2013
|
December 31, 2014
|
December 31, 2015
|
December 31, 2016
|
December 31, 2017
|
December 31, 2018
|
||||||||
|
Allegion plc
|
100.00
|
102.20
|
129.03
|
154.37
|
150.97
|
189.19
|
191.42
|
|||||||
|
S&P 500
|
100.00
|
102.53
|
116.57
|
118.18
|
132.31
|
161.20
|
154.13
|
|||||||
|
S&P 400 Capital Goods
|
100.00
|
104.58
|
104.84
|
99.07
|
130.70
|
162.97
|
140.14
|
|||||||
27
Item 6.
SELECTED FINANCIAL DATA (1)
In millions, except per share amounts:
|
As of and for the years ended December 31,
|
2018
|
2017
|
2016
|
2015
|
2014
|
||||||||||||||||
|
Net revenues
|
$
|
2,731.7
|
|
$
|
2,408.2
|
|
$
|
2,238.0
|
|
$
|
2,068.1
|
|
$
|
2,118.3
|
|
||||||
|
Net earnings (loss) attributable to Allegion plc ordinary shareholders:
|
|||||||||||||||||||||
|
Continuing operations
|
434.9
|
|
(a)
|
273.3
|
|
(b)
|
229.1
|
|
(c)
|
154.3
|
|
(d)
|
186.3
|
|
(e)
|
||||||
|
Discontinued operations
|
—
|
|
—
|
|
—
|
|
(0.4
|
)
|
(11.1
|
)
|
|||||||||||
|
Total assets
|
2,810.2
|
|
2,542.0
|
|
2,247.4
|
|
2,263.0
|
|
2,015.9
|
|
|||||||||||
|
Total debt
|
1,444.8
|
|
1,477.3
|
|
1,463.8
|
|
1,523.1
|
|
1,264.6
|
|
|||||||||||
|
Total Allegion plc shareholders’ equity (deficit)
|
651.0
|
|
401.6
|
|
113.3
|
|
25.6
|
|
(4.8
|
)
|
|||||||||||
|
Earnings (loss) per share attributable to Allegion plc ordinary shareholders:
|
|||||||||||||||||||||
|
Basic:
|
|||||||||||||||||||||
|
Continuing operations
|
$
|
4.58
|
|
$
|
2.87
|
|
$
|
2.39
|
|
$
|
1.61
|
|
$
|
1.94
|
|
||||||
|
Discontinued operations
|
—
|
|
—
|
|
—
|
|
(0.01
|
)
|
(0.12
|
)
|
|||||||||||
|
Diluted:
|
|||||||||||||||||||||
|
Continuing operations
|
$
|
4.54
|
|
$
|
2.85
|
|
$
|
2.36
|
|
$
|
1.59
|
|
$
|
1.92
|
|
||||||
|
Discontinued operations
|
—
|
|
—
|
|
—
|
|
—
|
|
(0.12
|
)
|
|||||||||||
|
Dividends declared per ordinary share
|
$
|
0.84
|
|
$
|
0.64
|
|
$
|
0.48
|
|
$
|
0.40
|
|
$
|
0.32
|
|
||||||
|
(a)
|
Net earnings for the year ended December 31, 2018 includes a $21.9 million tax benefit related to an adjustment to the provisional amounts previously recognized related to the enactment of the U.S. Tax Reform Act.
|
|
(b)
|
Net earnings for the year ended December 31, 2017 includes
$44.7 million
of costs related to the refinancing of our credit facilities and senior notes and a net tax charge of
$53.5 million
related to the U.S. Tax Reform Act.
|
|
(c)
|
Net earnings for the year ended December 31, 2016 includes $84.4 million of losses related to our previously divested Systems Integration business.
|
|
(d)
|
Net earnings from continuing operations for the year ended December 31, 2015 includes $104.2 million of losses related to the divestitures of our Venezuelan operations and our majority stake in our Systems Integration business.
|
|
(e)
|
Net earnings from continuing operations for the year ended December 31, 2014 includes an after-tax, non-cash inventory impairment charge of $18.7 million and a $9.1 million after-tax, non-cash charge related to the devaluation of the Venezuelan bolivar.
|
(1) The Company has not restated 2014 - 2017 for the impact of the adoption of ASC 606 as of January 1, 2018. The Company has also not restated 2015 or 2014 for the impact of the adoption of ASU 2016-09 in the fourth quarter of 2016, nor 2014 for the impact of the adoption of ASU 2015-17 and ASU 2015-03 as of December 31, 2015. The impact of excluding the above standards in prior period presentation is not material.
28
Item 7.
MANAGEMENT’S DISCUSSION AND ANALYSIS OF FINANCIAL CONDITION AND RESULTS OF OPERATIONS
The following Management’s Discussion and Analysis of Financial Condition and Results of Operations contains forward-looking statements that involve risks and uncertainties. Our actual results may differ materially from the results discussed in the forward-looking statements. Factors that might cause a difference include, but are not limited to, those discussed under Item 1A. Risk Factors in this Annual Report on Form 10-K. The following section is qualified in its entirety by the more detailed information, including our consolidated financial statements and the notes thereto, which appears elsewhere in this Annual Report.
Overview
Organization
We are a leading global provider of security products and solutions operating in three geographic regions: Americas, EMEIA and Asia Pacific. We sell a wide range of security products and solutions for end-users in commercial, institutional and residential markets worldwide, including the education, healthcare, government, commercial office and single and multi-family residential markets. Our leading brands include CISA, Interflex, LCN, Schlage, SimonsVoss and Von Duprin.
Trends and Economic Events
The security products industry has benefited from accelerated growth in institutional, commercial and residential end-markets in recent years. We also expect the security products industry will benefit from favorable long-term demographic trends such as continued urbanization of the global population, increased concerns about safety and security and technology-driven innovation.
In recent years, growth in electronic security products and solutions continues to outperform mechanical products, and we expect growth in the global electronic product categories we serve to continue to outperform growth in mechanical products, as end-users adopt newer technologies in their facilities and homes. Our recent acquisitions have been made to capitalize on this trend.
The economic conditions discussed above and a number of other challenges and uncertainties that could affect our business are described under Part I, Item 1A, "Risk Factors."
2018 and 2017 Significant Events
Acquisitions
We completed six business acquisitions in 2018 and one business acquisition in 2017:
|
Business
|
Date
|
|
|
Republic Doors & Frames, LLC ("Republic")
|
January 2017
|
|
|
Technical Glass Products, Inc. ("TGP")
|
January 2018
|
|
|
Hammond Enterprises, Inc. ("Hammond")
|
January 2018
|
|
|
Qatar Metal Industries LLC ("QMI")
|
February 2018
|
|
|
AD Systems, Inc. ("AD Systems")
|
March 2018
|
|
|
Gainsborough Hardware and API Locksmiths ("Door and Access Systems")
|
July 2018
|
|
|
ISONAS Security Systems, Inc. ("ISONAS")
|
July 2018
|
|
Republic provides hollow metal doors and frames throughout the U.S. and in select non-U.S. markets, complementing our Steelcraft® brand and core business in the Americas segment. Republic has been integrated into our Americas segment.
TGP provides fire-rated architectural glass and framing solutions for commercial buildings, as well as non-fire rated architectural glass and framing, including channel glass systems and curtain walls throughout the U.S., Canada and select markets in the Middle East. TGP has been integrated into our Americas and EMEIA segments.
We acquired 100% of the machinery, equipment and intellectual property of a division of Hammond. The assets acquired have been integrated into our existing production facilities and are specific to our Schlage-branded products.
QMI specializes in fire rated and non-fire rated steel and wooden doors, acoustic doors, wooden cabinets and access panels in the Middle East and Africa. QMI has been integrated into our EMEIA segment.
29
AD Systems designs and manufactures high-performance interior and storefront door systems, specializing in sliding and acoustic solutions for the U.S. market. AD Systems' portfolio includes sliding and swinging doors, perimeter frames, door hardware, gasketing, seals and sidelite panels. AD Systems has been integrated into our Americas segment.
Door and Access Systems, based in Australia, includes the brands Gainsborough Hardware, the market-leading residential door hardware brand in Australia, and API Locksmiths, which serves the Australian market with its keying, installation and access control services. Door and Access Systems has been integrated into our Asia Pacific segment.
ISONAS designs and manufactures edge-computing technology that produces Power over Ethernet access control solutions for non-residential end-markets in the U.S. ISONAS has been integrated into our Americas segment.
The incremental impact of the 2018 acquisitions for the
twelve months ended
December 31, 2018
was an increase in Net revenues of approximately
$160.2 million
and an increase to Operating income of approximately $2.8 million. The incremental impact of acquisitions for the
twelve months ended
December 31, 2017
was an increase in Net revenues of approximately $32.3 million and a decrease to Operating income of approximately $0.6 million.
During the years ended
December 31, 2018
and
2017
, we incurred
$10.0 million
and
$4.7 million
of acquisition and integration related expenses, respectively.
2018
Dividends
We paid quarterly dividends of $0.21 per ordinary share to shareholders on record as of March 15,
2018
, June 15,
2018
, September 17,
2018
, and December 17,
2018
. We paid a total of
$79.4 million
in cash for dividends to ordinary shareholders during the year ended
December 31, 2018
.
Restructuring charges
We incurred charges of
$4.9 million
and
$12.3 million
for the years ended
December 31, 2018
and
2017
, respectively, in conjunction with ongoing restructuring actions. We also incurred other non-qualified restructuring charges of
$1.6 million
and $
1.5 million
for the years ended
December 31, 2018
and
2017
, respectively, related to costs directly attributable to restructuring activities but that do not fall into the severance, exit or disposal category.
Financing activities
In 2017, we entered into a new $1.2 billion unsecured credit agreement (the "Credit Agreement"), consisting of a $700.0 million term loan facility (the “Term Facility”) and a $500.0 million revolving credit facility (the “Revolving Facility”, and together with the Term Facility, the “Credit Facilities”), and repaid in full our previously outstanding secured credit facility, the Second Amended and Restated Credit Agreement, dated as of September 30, 2015.
Also in 2017, we issued $400.0 million of 3.200% Senior Notes due 2024 (the “3.200% Senior Notes”) and $400.0 million of 3.550% Senior Notes due 2027 (the “3.550% Senior Notes” and, together with the 3.200% Senior Notes, the “Notes”). We used a portion of the net proceeds from the Notes to redeem in full our previously outstanding $300.0 million Senior Notes due 2021 and $300.0 million Senior Notes due 2023.
30
Results of Operations - For the years ended December 31
|
Dollar amounts in millions, except per share amounts
|
2018
|
% of Net
Revenues |
2017
|
% of Net
Revenues |
2016
|
% of Net
Revenues |
|||||||||||||||
|
Net revenues
|
$
|
2,731.7
|
|
|
$
|
2,408.2
|
|
|
$
|
2,238.0
|
|
|
|||||||||
|
Cost of goods sold
|
1,558.4
|
|
57.0
|
%
|
1,335.3
|
|
55.4
|
%
|
1,248.3
|
|
55.8
|
%
|
|||||||||
|
Selling and administrative expenses
|
647.5
|
|
23.7
|
%
|
580.4
|
|
24.1
|
%
|
555.4
|
|
24.8
|
%
|
|||||||||
|
Operating income
|
525.8
|
|
19.2
|
%
|
492.5
|
|
20.5
|
%
|
434.3
|
|
19.4
|
%
|
|||||||||
|
Interest expense
|
54.0
|
|
|
105.7
|
|
|
64.3
|
|
|
||||||||||||
|
Loss on divestitures
|
—
|
|
—
|
|
84.4
|
|
|||||||||||||||
|
Other income, net
|
(3.4
|
)
|
|
(8.9
|
)
|
|
(9.4
|
)
|
|
||||||||||||
|
Earnings before income taxes
|
475.2
|
|
|
395.7
|
|
|
295.0
|
|
|
||||||||||||
|
Provision for income taxes
|
39.8
|
|
|
119.0
|
|
|
63.8
|
|
|
||||||||||||
|
Net earnings
|
435.4
|
|
|
276.7
|
|
|
231.2
|
|
|
||||||||||||
|
Less: Net earnings attributable to noncontrolling interests
|
0.5
|
|
|
3.4
|
|
|
2.1
|
|
|
||||||||||||
|
Net earnings attributable to Allegion plc
|
$
|
434.9
|
|
|
$
|
273.3
|
|
|
$
|
229.1
|
|
|
|||||||||
|
Diluted net earnings per ordinary share attributable to Allegion plc ordinary shareholders:
|
$
|
4.54
|
|
|
$
|
2.85
|
|
|
$
|
2.36
|
|
|
|||||||||
Net Revenues
Net revenues for the year ended
December 31, 2018
increased by
13.4%
, or $
323.5 million
, compared to the same period in
2017
due to the following:
|
Pricing
|
1.6
|
%
|
|
Volume
|
4.4
|
%
|
|
Acquisitions
|
6.6
|
%
|
|
Currency exchange rates
|
0.8
|
%
|
|
Total
|
13.4
|
%
|
The increase in Net revenues was primarily driven by higher volumes in all segments, improved pricing, incremental Net revenues from the acquisitions discussed above and favorable foreign currency exchange rate movements relative to the U.S. Dollar.
Net revenues for the year ended
December 31, 2017
increased by
7.6%
, or $
170.2 million
, compared to the same period in
2016
due to the following:
|
Pricing
|
1.8
|
%
|
|
Volume
|
3.9
|
%
|
|
Acquisitions
|
1.4
|
%
|
|
Currency exchange rates
|
0.5
|
%
|
|
Total
|
7.6
|
%
|
The increase in Net revenues was primarily driven by higher volumes and improved pricing in all segments, incremental Net revenues from acquisitions and favorable foreign currency exchange rate movements relative to the U.S. Dollar.
Cost of Goods Sold
For the year ended
December 31, 2018
, Cost of goods sold as a percentage of Net revenues increased to
57.0%
from
55.4%
due to the following:
31
|
Inflation in excess of pricing and productivity
|
0.1
|
%
|
|
Volume / product mix
|
(0.1
|
)%
|
|
Acquisitions
|
1.5
|
%
|
|
Investment spending
|
0.3
|
%
|
|
Currency exchange rates
|
(0.1
|
)%
|
|
Restructuring / acquisition costs
|
(0.1
|
)%
|
|
Total
|
1.6
|
%
|
Costs of goods sold as a percentage of Net revenues for the year ended
December 31, 2018
increased primarily due to inflation in excess of pricing and productivity, the impact of acquisitions and increased investment spending. These increases were partially offset by favorable currency exchange rate movements, favorable product mix and volume and decreased restructuring and acquisition costs.
For the year ended
December 31, 2017
, Cost of goods sold as a percentage of Net revenues decreased to
55.4%
from
55.8%
due to the following:
|
Pricing and productivity in excess of inflation
|
(0.4
|
)%
|
|
Volume / product mix
|
0.4
|
%
|
|
Acquisitions
|
0.5
|
%
|
|
Currency exchange rates
|
(0.1
|
)%
|
|
Environmental remediation charge
|
(0.7
|
)%
|
|
Restructuring / acquisition costs
|
(0.1
|
)%
|
|
Total
|
(0.4
|
)%
|
Costs of goods sold as a percentage of Net revenues for the year ended
December 31, 2017
decreased primarily due to pricing and productivity benefits in excess of inflation, favorable foreign currency exchange rate movements, a decrease related to an environmental remediation charge in 2016 and decreased restructuring and acquisition costs. These decreases were partially offset by unfavorable product mix and volume and the impact of acquisitions.
Selling and Administrative Expenses
For the year ended
December 31, 2018
, Selling and administrative expenses as a percentage of Net revenues decreased to
23.7%
from
24.1%
due to the following:
|
Inflation in excess of productivity
|
0.5
|
%
|
|
Volume leverage
|
(0.8
|
)%
|
|
Acquisitions
|
(0.4
|
)%
|
|
Investment spending
|
0.3
|
%
|
|
Total
|
(0.4
|
)%
|
Selling and administrative expenses as a percentage of Net revenues for the year ended
December 31, 2018
decreased primarily due to favorable leverage due to increased volume and the impact of acquisitions. These decreases were partially offset by inflation in excess of productivity benefits and increased investment spending.
For the year ended
December 31, 2017
, Selling and administrative expenses as a percentage of Net revenues decreased to
24.1%
from
24.8%
due to the following:
|
Productivity in excess of inflation
|
(0.6
|
)%
|
|
Volume leverage
|
(0.9
|
)%
|
|
Acquisitions
|
(0.2
|
)%
|
|
Investment spending
|
0.7
|
%
|
|
Restructuring / acquisition costs
|
0.3
|
%
|
|
Total
|
(0.7
|
)%
|
32
Selling and administrative expenses as a percentage of Net revenues for the year ended
December 31, 2017
decreased primarily due to favorable leverage due to increased volume, productivity benefits in excess of inflation and acquisitions. These decreases were partially offset due to increased investment spending and higher restructuring and acquisition costs.
Operating Income/Margin
Operating income for the year ended
December 31, 2018
increased
$33.3 million
from the same period in
2017
and Operating margin decreased to
19.2%
from
20.5%
for the same period in
2017
due to the following:
|
In millions
|
Operating Income
|
Operating Margin
|
||||
|
December 31, 2017
|
$
|
492.5
|
|
20.5
|
%
|
|
|
Inflation in excess of pricing and productivity
|
(6.4
|
)
|
(0.6
|
)%
|
||
|
Volume / product mix
|
45.3
|
|
0.9
|
%
|
||
|
Currency exchange rates
|
3.1
|
|
—
|
%
|
||
|
Investment spending
|
(13.5
|
)
|
(0.5
|
)%
|
||
|
Acquisitions
|
2.8
|
|
(1.2
|
)%
|
||
|
Restructuring / acquisition costs
|
2.0
|
|
0.1
|
%
|
||
|
December 31, 2018
|
$
|
525.8
|
|
19.2
|
%
|
|
Operating income increased due to favorable volume/product mix in all segments, foreign currency exchange rate movements, the impact of acquisitions and lower restructuring and acquisition costs. These increases were partially offset by inflation in excess of pricing and productivity and increased investment spending.
Operating margin decreased primarily due to inflation in excess of pricing and productivity, increased investment spending and lower margins from acquisitions during the current year. These decreases were partially offset by favorable volume/product mix and lower restructuring and acquisition costs.
Operating income for the year ended
December 31, 2017
increased
$58.2 million
and Operating margin increased to
20.5%
from
19.4%
for the same period in
2016
due to the following:
|
In millions
|
Operating Income
|
Operating Margin
|
||||
|
December 31, 2016
|
$
|
434.3
|
|
19.4
|
%
|
|
|
Pricing and productivity in excess of inflation
|
30.7
|
|
1.0
|
%
|
||
|
Volume / product mix
|
29.4
|
|
0.5
|
%
|
||
|
Currency exchange rates
|
4.2
|
|
0.1
|
%
|
||
|
Investment spending
|
(15.4
|
)
|
(0.7
|
)%
|
||
|
Acquisitions
|
(0.6
|
)
|
(0.3
|
)%
|
||
|
Environmental remediation charge
|
15.0
|
|
0.7
|
%
|
||
|
Restructuring / acquisition costs
|
(5.1
|
)
|
(0.2
|
)%
|
||
|
December 31, 2017
|
$
|
492.5
|
|
20.5
|
%
|
|
Operating income and Operating margin both increased due to favorable volume/product mix in all segments, pricing improvements and productivity in excess of inflation,
favorable foreign currency exchange rate movements and lower environmental remediation charges in 2017 due to a charge in 2016 for a change in approach for environmental remediation related to two sites in the Americas. These increases were partially offset by increased investment spending, the impact of acquisitions and higher restructuring and acquisition costs.
Interest Expense
Interest expense for the year ended
December 31, 2018
decreased $
51.7 million
compared to the same period of
2017
primarily due to $44.7 million of costs in the prior year associated with the refinancing of our Credit Facilities, issuance of our 3.200% and 3.550% Senior Notes and redemption of our previously outstanding Senior notes due 2021 and 2023 in the third and fourth quarters of 2017. Lower interest rates on our outstanding indebtedness also contributed to the decrease in Interest expense.
Interest expense for the year ended
December 31, 2017
increased $
41.4 million
compared to the same period of
2016
. Interest expense increased primarily due to
$44.7 million
of costs associated with the refinancing of our Credit Facilities, issuance of our
33
3.200% and 3.550% Senior Notes and redemption of our previously outstanding Senior notes due 2021 and 2023 in the third and fourth quarters of 2017, as discussed above.
Other income, net
The components of Other income, net, for the year ended
December 31
were as follows:
|
In millions
|
2018
|
2017
|
2016
|
|||||||||
|
Interest income
|
$
|
(0.8
|
)
|
$
|
(1.2
|
)
|
$
|
(1.9
|
)
|
|||
|
Foreign currency exchange loss
|
0.3
|
|
0.7
|
|
2.0
|
|
||||||
|
Earnings from and gains on the sale of equity investments
|
(0.4
|
)
|
(5.4
|
)
|
(3.6
|
)
|
||||||
|
Net periodic pension and postretirement benefit (income) cost, less service cost
|
(2.8
|
)
|
4.3
|
|
8.8
|
|
||||||
|
Other
|
0.3
|
|
(7.3
|
)
|
(14.7
|
)
|
||||||
|
Other income, net
|
$
|
(3.4
|
)
|
$
|
(8.9
|
)
|
$
|
(9.4
|
)
|
|||
For the year ended
December 31, 2018
, Other income, net decreased by $
5.5 million
compared to the same period in
2017
, due to a cumulative gain of
$5.4 million
from the sale of iDevices, LLC and gains of
$7.3 million
related to legal entity liquidations in our Asia Pacific region, of which
$2.2 million
was attributed to noncontrolling interests, in 2017, neither of which were recurring in 2018. These decreases were partially offset by Net periodic pension and postretirement benefit income, less service cost of
$2.8 million
in
2018
, compared to Net periodic pension and postretirement benefit cost, less service cost of
$4.3 million
in
2017
.
For the year ended
December 31, 2017
, Other income, net decreased by
$0.5 million
compared with the same period in
2016
. This decrease was due to gains from the sale of marketable securities of
$12.4 million
in
2016
, which did not recur in
2017
. This decrease is partially offset by the cumulative
$5.4 million
gain from the sale of iDevices, LLC and the gains of
$7.3 million
related to legal entity liquidations in our Asia Pacific region discussed above, as well as decreased Net periodic pension and postretirement benefit cost, less service cost in
2017
compared to
2016
.
Provision for Income Taxes
On December 22, 2017, the President of the United States signed comprehensive tax legislation commonly referred to as the Tax Cuts and Jobs Act (the “Tax Reform Act”). The Tax Reform Act makes broad and complex changes to the U.S. tax code which impacted our years ended
December 31, 2018
and
2017
, including, but not limited to (1) reducing the U.S. federal corporate tax rate, (2) requiring a one-time transition tax on certain unrepatriated earnings of foreign subsidiaries, and (3) requiring a review of the future realizability of deferred tax balances.
For the year ended
December 31, 2018
, our effective tax rate was
8.4%
compared to
30.1%
for the year ended
December 31, 2017
. The effective income tax rate for the year ended
December 31, 2018
was positively impacted by a $21.9 million tax benefit related to the Tax Reform Act and the reduction in the US statutory tax rate from 35% to 21%. The effective income tax rate for the year ended December 31, 2017 was negatively impacted by a $53.5 million tax charge related to the Tax Reform Act, which was partially offset by the release of $10.4 million of valuation allowances.
For the year ended
December 31, 2017
, our effective tax rate was
30.1%
compared to
21.6%
for the year ended
December 31, 2016
. The effective income tax rate for the year ended
December 31, 2017
was negatively impacted by a
$53.5 million
tax charge related to the Tax Reform Act, which was partially offset by the release of $10.4 million of valuation allowances. The effective income tax rate for the year ended December 31, 2016 was negatively impacted by $84.4 million (before and after tax) of charges related to the divestiture of our Systems Integration business in China during 2015.
34
Review of Business Segments
We operate in and report financial results for three segments: Americas, EMEIA, and Asia Pacific. These segments represent the level at which our chief operating decision maker reviews company financial performance and makes operating decisions.
Segment operating income is the measure of profit and loss that our chief operating decision maker uses to evaluate the financial performance of the business and as the basis for resource allocation, performance reviews and compensation. For these reasons, we believe that Segment operating income represents the most relevant measure of Segment profit and loss. Our chief operating decision maker may exclude certain charges or gains, such as corporate charges and other special charges, to arrive at a Segment operating income that is a more meaningful measure of profit and loss upon which to base our operating decisions. We define Segment operating margin as Segment operating income as a percentage of the segment's Net revenues.
The segment discussions that follow describe the significant factors contributing to the changes in results for each segment included in Net earnings.
Segment Results of Operations - For the years ended December 31
|
In millions
|
2018
|
2017
|
% Change
|
2017
|
2016
|
% Change
|
|||||||||||||||
|
Net revenues
|
|||||||||||||||||||||
|
Americas
|
$
|
1,988.6
|
|
$
|
1,767.5
|
|
12.5
|
%
|
$
|
1,767.5
|
|
$
|
1,645.7
|
|
7.4
|
%
|
|||||
|
EMEIA
|
589.9
|
|
523.5
|
|
12.7
|
%
|
523.5
|
|
485.9
|
|
7.7
|
%
|
|||||||||
|
Asia Pacific
|
153.2
|
|
117.2
|
|
30.7
|
%
|
117.2
|
|
106.4
|
|
10.2
|
%
|
|||||||||
|
Total
|
$
|
2,731.7
|
|
$
|
2,408.2
|
|
$
|
2,408.2
|
|
$
|
2,238.0
|
|
|||||||||
|
Segment operating income
|
|||||||||||||||||||||
|
Americas
|
$
|
544.5
|
|
$
|
508.5
|
|
7.1
|
%
|
$
|
508.5
|
|
$
|
456.7
|
|
11.3
|
%
|
|||||
|
EMEIA
|
49.3
|
|
44.1
|
|
11.8
|
%
|
44.1
|
|
35.3
|
|
24.9
|
%
|
|||||||||
|
Asia Pacific
|
6.9
|
|
9.5
|
|
(27.4
|
)%
|
9.5
|
|
6.1
|
|
55.7
|
%
|
|||||||||
|
Total
|
$
|
600.7
|
|
$
|
562.1
|
|
$
|
562.1
|
|
$
|
498.1
|
|
|||||||||
|
Segment operating margin
|
|||||||||||||||||||||
|
Americas
|
27.4
|
%
|
28.8
|
%
|
28.8
|
%
|
27.8
|
%
|
|||||||||||||
|
EMEIA
|
8.4
|
%
|
8.4
|
%
|
8.4
|
%
|
7.3
|
%
|
|||||||||||||
|
Asia Pacific
|
4.5
|
%
|
8.1
|
%
|
8.1
|
%
|
5.7
|
%
|
|||||||||||||
Americas
Our Americas segment is a leading provider of security products and solutions in approximately 30 countries throughout North America, Central America, the Caribbean and South America. The segment sells a broad range of products and solutions including, locks, locksets, portable locks, key systems, door closers, exit devices, doors and door systems, electronic products and access control systems to end-users in commercial, institutional and residential facilities, including the education, healthcare, government, commercial office and single and multi-family residential markets. This segment’s primary brands are LCN, Schlage, Steelcraft and Von Duprin.
2018 vs 2017
Net revenues
Net revenues for the year ended
December 31, 2018
increased by
12.5%
, or
$221.1 million
, compared to the same period in
2017
due to the following:
|
Pricing
|
1.7
|
%
|
|
Volume
|
5.1
|
%
|
|
Acquisitions
|
5.7
|
%
|
|
Total
|
12.5
|
%
|
35
The increase in Net revenues is due to higher volumes, improved pricing and acquisitions during the current year. Net revenues from non-residential products for the year ended
December 31, 2018
increased mid-teens compared to the prior year, primarily driven by higher volumes, improved pricing and acquisitions in the current year. Net revenues from residential products for the year ended
December 31, 2018
increased mid-single digits compared to the prior year.
Operating income/margin
Segment operating income for the year ended
December 31, 2018
increased
$36.0 million
and Segment operating margin decreased to
27.4%
from
28.8%
compared to the same period in
2017
due to the following:
|
In millions
|
Operating Income
|
Operating Margin
|
||||
|
December 31, 2017
|
$
|
508.5
|
|
28.8
|
%
|
|
|
Inflation in excess of pricing and productivity
|
(4.2
|
)
|
(0.8
|
)%
|
||
|
Volume / product mix
|
42.1
|
|
0.9
|
%
|
||
|
Currency exchange rates
|
0.7
|
|
0.1
|
%
|
||
|
Investment spending
|
(7.2
|
)
|
(0.4
|
)%
|
||
|
Acquisitions
|
3.3
|
|
(1.3
|
)%
|
||
|
Restructuring / acquisition costs
|
1.3
|
|
0.1
|
%
|
||
|
December 31, 2018
|
$
|
544.5
|
|
27.4
|
%
|
|
Operating income increased primarily due to favorable volume/product mix, favorable foreign currency exchange rate movements, acquisitions during the current year and year-over-year decreases in restructuring and acquisition costs. These increases were partially offset by inflation in excess of pricing and productivity and increased investment spending.
Operating margin decreased primarily due to inflation in excess of pricing and productivity, increased investment spending and lower margins from acquisitions during the current year. These decreases were partially offset by favorable volume/product mix, favorable foreign currency exchange rate movements and year-over-year decreases in restructuring and acquisition costs.
2017 vs 2016
Net revenues
Net revenues for the year ended
December 31, 2017
increased by
7.4%
, or
$121.8 million
, compared to the same period in
2016
due to the following:
|
Pricing
|
2.0
|
%
|
|
Volume
|
3.8
|
%
|
|
Acquisitions
|
1.4
|
%
|
|
Currency exchange rates
|
0.2
|
%
|
|
Total
|
7.4
|
%
|
The increase in Net revenues was due to higher volumes, improved pricing, the impact of an acquisition in January 2017 and favorable foreign currency exchange rate movements. Net revenues from non-residential products for the year ended
December 31, 2017
increased high single digits compared to the prior year due to market growth, product launches, and channel initiatives. Net revenues from residential products for the year ended
December 31, 2017
increased mid-single digits compared to the prior year.
Operating income/margin
Segment operating income for the year ended
December 31, 2017
increased
$51.8 million
and Segment operating margin increased to
28.8%
from
27.8%
compared to the same period in
2016
due to the following:
36
|
In millions
|
Operating Income
|
Operating Margin
|
||||
|
December 31, 2016
|
$
|
456.7
|
|
27.8
|
%
|
|
|
Pricing and productivity in excess of inflation
|
25.9
|
|
1.0
|
%
|
||
|
Volume / product mix
|
22.2
|
|
0.3
|
%
|
||
|
Currency exchange rates
|
2.6
|
|
0.1
|
%
|
||
|
Investment spending
|
(10.7
|
)
|
(0.7
|
)%
|
||
|
Acquisitions
|
0.3
|
|
(0.4
|
)%
|
||
|
Environmental remediation charge
|
15.0
|
|
0.9
|
%
|
||
|
Restructuring / acquisition costs
|
(3.5
|
)
|
(0.2
|
)%
|
||
|
December 31, 2017
|
$
|
508.5
|
|
28.8
|
%
|
|
Operating income increased primarily due to pricing improvements and productivity in excess of inflation, favorable volume/product mix, favorable foreign currency exchange rate movements, lower environmental remediation charges in 2017 due to a 2016 charge for a change in approach for environmental remediation related to two sites in the U.S. and the impact of acquisitions. These increases were partially offset by increased investment spending primarily for new product development and channel development and restructuring and acquisition costs.
Operating margin increased primarily due to pricing improvements and productivity in excess of inflation, favorable volume/product mix, favorable foreign currency exchange rate movements and lower environmental remediation charges in 2017 due to a charge in 2016 for a change in approach for environmental remediation related to two sites in the U.S. These increases were partially offset by increased investment spending primarily for new product development and channel development, restructuring and acquisition costs and the impact of acquisitions.
EMEIA
Our EMEIA segment provides security products and solutions in approximately 85 countries throughout Europe, the Middle East, India and Africa. The segment offers end-users a broad range of products, services and solutions including, locks, locksets, portable locks, key systems, door closers, exit devices, doors and door systems, electronic products and access control systems, as well as time and attendance and workforce productivity solutions. This segment’s primary brands are AXA, Bricard, Briton, CISA, Interflex and SimonsVoss. This segment also resells LCN, Schlage and Von Duprin products, primarily in the Middle East.
2018 vs 2017
Net revenues
Net revenues for the year ended
December 31, 2018
increased by
12.7%
, or
$66.4 million
, compared to the same period in
2017
due to the following:
|
Pricing
|
1.5
|
%
|
|
Volume
|
2.2
|
%
|
|
Acquisitions
|
5.1
|
%
|
|
Currency exchange rates
|
3.9
|
%
|
|
Total
|
12.7
|
%
|
The increase in Net revenues is due to higher volumes, improved pricing, favorable foreign currency exchange rate movements and the impact of acquisitions in the current year.
Operating income/margin
Segment operating income for the year ended
December 31, 2018
increased
$5.2 million
compared to the same period in
2017
, while Segment operating margin remained consistent at
8.4%
in 2018, the same as in
2017
, due to the following:
37
|
In millions
|
Operating Income
|
Operating Margin
|
||||
|
December 31, 2017
|
$
|
44.1
|
|
8.4
|
%
|
|
|
Pricing and productivity in excess of inflation
|
0.2
|
|
(0.1
|
)%
|
||
|
Volume / product mix
|
5.3
|
|
0.8
|
%
|
||
|
Currency exchange rates
|
3.0
|
|
0.3
|
%
|
||
|
Investment spending
|
(4.1
|
)
|
(0.8
|
)%
|
||
|
Acquisitions
|
(2.6
|
)
|
(0.9
|
)%
|
||
|
Restructuring / acquisition costs
|
3.4
|
|
0.7
|
%
|
||
|
December 31, 2018
|
$
|
49.3
|
|
8.4
|
%
|
|
Operating income increased due to favorable volume/product mix, pricing improvements and productivity in excess of inflation, favorable foreign currency exchange rate movements and year-over-year decreases in restructuring and acquisition costs. These increases were partially offset by increased investment spending and the impact of acquisitions in the current year.
Operating margin was unchanged year-over-year at 8.4%. Improvements due to favorable volume/product mix, foreign currency exchange rate movements and year-over-year changes in restructuring and acquisition costs were offset by lower pricing improvements and productivity in excess of inflation, increased investment spending and lower margins from acquisitions during the current year.
2017 vs 2016
Net revenue
Net revenues for the year ended
December 31, 2017
increased by
7.7%
, or
$37.6 million
, compared to the same period in
2016
due to following:
|
Pricing
|
1.6
|
%
|
|
Volume
|
3.1
|
%
|
|
Acquisitions / divestitures
|
1.6
|
%
|
|
Currency exchange rates
|
1.4
|
%
|
|
Total
|
7.7
|
%
|
The increase in Net revenues was due to higher volumes, improved pricing, the impact of an acquisition made in the prior year and favorable foreign currency exchange rate movements.
Operating income/margin
Segment operating income for the year ended
December 31, 2017
increased
$8.8 million
and Segment operating margin increased to
8.4%
from
7.3%
compared to the same period in
2016
due to the following:
|
In millions
|
Operating Income
|
Operating Margin
|
||||
|
December 31, 2016
|
$
|
35.3
|
|
7.3
|
%
|
|
|
Pricing and productivity in excess of inflation
|
4.6
|
|
0.8
|
%
|
||
|
Volume / product mix
|
5.2
|
|
0.8
|
%
|
||
|
Currency exchange rates
|
1.3
|
|
0.1
|
%
|
||
|
Investment spending
|
(2.4
|
)
|
(0.5
|
)%
|
||
|
Acquisitions
|
(0.9
|
)
|
(0.3
|
)%
|
||
|
Restructuring / acquisition costs
|
1.0
|
|
0.2
|
%
|
||
|
December 31, 2017
|
$
|
44.1
|
|
8.4
|
%
|
|
The increases were primarily due to favorable volume/product mix, pricing improvements and productivity in excess of inflation, favorable foreign currency exchange rate movements and year-over-year change in restructuring and acquisition costs. These increases were partially offset by increased investment spending and the impact from an acquisition in 2016.
38
Asia Pacific
Our Asia Pacific segment provides security products, services and solutions in approximately 15 countries throughout the Asia Pacific region. The segment offers end-users a broad range of products, services and solutions including, locks, locksets, portable locks, key systems, door closers, exit devices, electronic products and access control systems. This segment’s primary brands are Brio, Briton, FSH, Gainsborough, Legge, Milre and Schlage.
2018 vs 2017
Net revenues
Net revenues for the year ended
December 31, 2018
increased by
30.7%
, or
$36.0 million
, compared to the same period in
2017
, due to the following:
|
Pricing
|
(0.1
|
)%
|
|
Volume
|
3.2
|
%
|
|
Acquisitions
|
28.6
|
%
|
|
Currency exchange rates
|
(1.0
|
)%
|
|
Total
|
30.7
|
%
|
The increase in Net revenues was primarily due to an acquisition during the current year and higher volumes. These increases were partially offset by unfavorable foreign currency exchange rate movements and slightly lower pricing.
Operating income/margin
Segment operating income for the year ended
December 31, 2018
decreased
$2.6 million
and Segment operating margin decreased to
4.5%
from
8.1%
compared to the same period in
2017
due to the following:
|
In millions
|
Operating Income
|
Operating Margin
|
||||
|
December 31, 2017
|
$
|
9.5
|
|
8.1
|
%
|
|
|
Pricing and productivity in excess of inflation
|
1.3
|
|
1.1
|
%
|
||
|
Volume / product mix
|
(2.1
|
)
|
(2.0
|
)%
|
||
|
Currency exchange rates
|
(0.6
|
)
|
(0.4
|
)%
|
||
|
Investment spending
|
(1.0
|
)
|
(0.8
|
)%
|
||
|
Acquisitions
|
2.1
|
|
(0.4
|
)%
|
||
|
Restructuring / acquisition costs
|
(2.3
|
)
|
(1.1
|
)%
|
||
|
December 31, 2018
|
$
|
6.9
|
|
4.5
|
%
|
|
Operating income decreased due to unfavorable volume/product mix, unfavorable foreign currency exchange rate movements, increased investment spending and year-over-year increases in restructuring and acquisition costs. These decreases were partially offset by pricing and productivity improvements in excess of inflation and an acquisition during the current year.
Operating margin decreased due to unfavorable volume/product mix, unfavorable foreign currency exchange rate movements, increased investment spending, lower margins from an acquisition during the current year and year-over-year increases in restructuring and acquisition expenses. These decreases were partially offset by pricing and productivity improvements in excess of inflation.
2017 vs 2016
Net revenues
Net revenues for the year ended
December 31, 2017
increased by
10.2%
, or
$10.8 million
, compared with the same period in
2016
, due to the following:
39
|
Pricing
|
0.4
|
%
|
|
Volume
|
7.3
|
%
|
|
Acquisitions
|
0.7
|
%
|
|
Currency exchange rates
|
1.8
|
%
|
|
Total
|
10.2
|
%
|
The increase in Net revenues was due to higher volumes, improved pricing, the impact of an acquisition in 2016 and favorable foreign currency exchange rate movements.
Operating income/margin
Segment operating income for the year ended
December 31, 2017
increased
$3.4 million
and Segment operating margin increased to
8.1%
from
5.7%
compared with the same period in
2016
due to the following:
|
In millions
|
Operating Income
|
Operating Margin
|
||||
|
December 31, 2016
|
$
|
6.1
|
|
5.7
|
%
|
|
|
Pricing and productivity in excess of inflation
|
1.5
|
|
1.3
|
%
|
||
|
Volume / product mix
|
2.0
|
|
1.3
|
%
|
||
|
Currency exchange rates
|
0.4
|
|
0.3
|
%
|
||
|
Investment spending
|
(0.4
|
)
|
(0.4
|
)%
|
||
|
Acquisitions
|
(0.1
|
)
|
(0.1
|
)%
|
||
|
December 31, 2017
|
$
|
9.5
|
|
8.1
|
%
|
|
The increases were
primarily related to pricing improvements and productivity in excess of inflation, improved volume/product mix and favorable foreign currency exchange rate movements. These increases were partially offset by increased investment spending and the impact of an acquisition in 2016.
Liquidity and Capital Resources
Sources and uses of liquidity
Our primary source of liquidity is cash provided by operating activities. Cash provided by operating activities is used to invest in new product development, fund capital expenditures and fund working capital requirements and is expected to be adequate to service any future debt, pay any declared dividends and potentially fund acquisitions and share repurchases. Our ability to fund these capital needs depends on our ongoing ability to generate cash from our operating activities and to access our borrowing facilities (including unused availability under our Revolving Facility) and capital markets. We believe that our future cash provided by operating activities, availability under our Revolving Facility and access to funds on hand and capital markets will provide adequate resources to fund our operating and financing needs.
The following table reflects the major categories of cash flows for the years ended December 31. For additional details, please see the Consolidated Statements of Cash Flows in the Consolidated Financial Statements.
|
In millions
|
2018
|
2017
|
2016
|
|||||||||
|
Net cash provided by operating activities
|
$
|
457.8
|
|
$
|
347.2
|
|
$
|
377.5
|
|
|||
|
Net cash used in investing activities
|
(443.8
|
)
|
(50.2
|
)
|
(64.0
|
)
|
||||||
|
Net cash used in financing activities
|
$
|
(183.4
|
)
|
$
|
(150.9
|
)
|
$
|
(196.0
|
)
|
|||
Operating activities
Net cash provided by operating activities for the year ended
December 31, 2018
increased
$110.6 million
compared to
2017
. This increase in Net cash provided by operating activities for
2018
was primarily due to higher Net earnings in the current year and a discretionary $50.0 million contribution to the U.S. qualified defined benefit pension plan in
2017
, partially offset by changes in working capital and an increase in cash paid for taxes.
40
Net cash provided by operating activities for the year ended
December 31, 2017
decreased
$30.3 million
compared to
2016
, reflecting the $50.0 million discretionary contribution to the U.S. qualified defined benefit pension plan discussed above, as well as increased cash paid for taxes, partially offset by higher Net earnings in
2017
compared to
2016
.
Investing activities
Net cash used in investing activities for the year ended
December 31, 2018
increased
$393.6 million
compared to
2017
. The increase in Net cash used in investing activities is primarily due to approximately
$368 million
of cash payments related to acquisitions and approximately
$8 million
of investments in unconsolidated entities during the year ended
December 31, 2018
, compared to
$20.8 million
for an acquisition in
2017
. Additionally contributing to the increase in Net cash used in investing activities was the purchase of
$14.3 million
of investments during the year ended
December 31, 2018
and the sale of an equity investment during
2017
, which resulted in an investing cash inflow of
$15.6 million
that did not recur in
2018
.
Net cash used in investing activities for the year ended
December 31, 2017
decreased
$13.8 million
compared to
2016
. The decrease in Net cash used in investing activities is primarily due to
$15.6 million
in proceeds from the sale of an equity investment during
2017
that did not occur in
2016
and a $10.6 million decrease of cash payments related to acquisitions. These changes were partially offset by
$14.1 million
of cash received from the sale of marketable securities in
2016
that did not recur in
2017
.
Financing activities
Net cash used in financing activities for the year ended
December 31, 2018
increased
$32.5 million
compared to the year ended
December 31, 2017
. The increase in Net cash used in financing activities is primarily due to an increase in dividend payments of
$18.5 million
year-over-year. Additionally, during the year ended
December 31, 2018
, we repurchased
$67.3 million
of common shares, compared to
$60.0 million
during 2017.
Net cash used in financing activities for the year ended
December 31, 2017
decreased
$45.1 million
compared to
2016
. The decrease in Net cash used in financing activities is due to net proceeds from debt issuances over debt repayments of
$10.1 million
in 2017 versus net debt repayments of $64.4 million during 2016. Debt financing activity in
2017
included the redemption of the 2021 and 2023 Senior Notes for a total of
$600.0 million
and the settlement of the previously outstanding Term Loan A Facility of
$856.3 million
, offset by the issuance of the 3.200% and 3.550% Senior Notes in an aggregate amount of
$800.0 million
and a new term loan facility maturing on September 12, 2022 (the "Term Facility") in the amount of
$700.0 million
. Additionally, during the year ended
December 31, 2017
, we repurchased
$60.0 million
of common shares, compared to
$85.1 million
during
2016
. We also made dividend payments to ordinary shareholders of
$60.9 million
in
2017
, compared to
$46.0 million
in
2016
.
Capitalization
Long-term debt at December 31 consisted of the following:
|
In millions
|
2018
|
2017
|
|||||
|
Term Facility
|
$
|
656.3
|
|
$
|
691.3
|
|
|
|
Revolving Facility
|
—
|
|
—
|
|
|||
|
3.200% Senior Notes due 2024
|
400.0
|
|
400.0
|
|
|||
|
3.550% Senior Notes due 2027
|
400.0
|
|
400.0
|
|
|||
|
Other debt
|
1.2
|
|
1.0
|
|
|||
|
Total borrowings outstanding
|
1,457.5
|
|
1,492.3
|
|
|||
|
Less discounts and debt issuance costs, net
|
(12.7
|
)
|
(15.0
|
)
|
|||
|
Total debt
|
1,444.8
|
|
1,477.3
|
|
|||
|
Less current portion of long-term debt
|
35.3
|
|
35.0
|
|
|||
|
Total long-term debt
|
$
|
1,409.5
|
|
$
|
1,442.3
|
|
|
As of
December 31, 2018
, we have an unsecured Credit Agreement in place that provides for up to
$1,200.0 million
in unsecured financing, consisting of a
$700.0 million
term loan facility (the “Term Facility”) and a
$500.0 million
revolving credit facility (the “Revolving Facility” and, together with the Term Facility, the “Credit Facilities”). The Credit Facilities mature on September 12, 2022. The Term Facility amortizes in quarterly installments at the following rates:
1.25%
per quarter starting December 31, 2017 through December 31, 2020,
2.5%
per quarter from March 31, 2021 through June 30, 2022, with the balance due on September 12, 2022. The Revolving Facility provides aggregate commitments of up to
$500.0 million
, which includes up to
$100.0 million
41
for the issuance of letters of credit. At
December 31, 2018
, there were no borrowings outstanding on the Revolving Facility, and we had
$17.1 million
of letters of credit outstanding.
Outstanding borrowings under the Credit Facilities accrue interest at our option of (i) a LIBOR rate plus the applicable margin or (ii) a base rate plus the applicable margin. The applicable margin ranges from
1.125%
to
1.500%
depending on our credit ratings. To manage our exposure to fluctuations in LIBOR rates, we have interest rate swaps to fix the interest rate for
$250.0 million
of the outstanding borrowings (see Note 10 to the Consolidated Financial Statements).
As of
December 31, 2018
, we also have
$400.0 million
outstanding of
3.200%
Senior Notes due 2024 (the “3.200% Senior Notes”) and
$400.0 million
outstanding of
3.550%
Senior Notes due 2027 (the “3.550% Senior Notes” and, together with the 3.200% Senior Notes, the “Notes”). The Notes require semi-annual interest payments on April 1 and October 1 of each year and will mature on October 1, 2024 and October 1, 2027, respectively.
Historically, the majority of our earnings were considered to be permanently reinvested in jurisdictions where we have made, and intend to continue to make, substantial investments to support the ongoing development and growth of our global operations. As a result of the Tax Reform Act transition tax, we analyzed our global working capital requirements and the potential tax liabilities that would be incurred if certain non-U.S. subsidiaries made distributions, which include local country withholding tax and potential U.S. state taxation. Based on this analysis, we made no changes to our permanent reinvestment assertions to reinvest earnings in our non-U.S. subsidiaries outside of the U.S.
Pension Plans
Our investment objective in managing defined benefit plan assets is to ensure that all present and future benefit obligations are met as they come due. We seek to achieve this goal while trying to mitigate volatility in plan funded status, contributions and expense by better matching the characteristics of the plan assets to that of the plan liabilities. Global asset allocation decisions are based on a dynamic approach whereby a plan's allocation to fixed income assets increases as the funded status increases. We monitor plan funded status and asset allocation regularly in addition to investment manager performance.
We monitor the impact of market conditions on our defined benefit plans on a regular basis. In January 2017, we made a discretionary $50.0 million contribution to the U.S. qualified defined benefit pension plan. At
December 31, 2018
, the funded status of our qualified pension plan for U.S. employees decreased to
93.1%
from
93.3%
at
December 31, 2017
. The funded status for our non-U.S. pension plans decreased to
98.7%
at
December 31, 2018
from
100.5%
at
December 31, 2017
. Funded status for all of our pension plans at
December 31, 2018
decreased to
94.1%
from
95.5%
at
December 31, 2017
. For further details on pension plan activity, see Note 11 to the Consolidated Financial Statements.
Contractual Obligations
The following table summarizes our contractual cash obligations by required payment periods:
|
In millions
|
2019
|
2020-2021
|
2022-2023
|
Thereafter
|
Total
|
|||||||||||||||
|
Long-term debt (including current maturities)
|
$
|
35.3
|
|
$
|
105.0
|
|
$
|
516.3
|
|
$
|
800.9
|
|
$
|
1,457.5
|
|
|||||
|
Interest payments on long-term debt
|
49.9
|
|
|
99.6
|
|
69.5
|
|
62.9
|
|
281.9
|
|
|||||||||
|
Purchase obligations
|
402.7
|
|
|
—
|
|
—
|
|
—
|
|
402.7
|
|
|||||||||
|
Operating leases
|
30.3
|
|
|
35.5
|
|
14.8
|
|
17.4
|
|
98.0
|
|
|||||||||
|
Total contractual cash obligations
|
$
|
518.2
|
|
|
$
|
240.1
|
|
$
|
600.6
|
|
$
|
881.2
|
|
$
|
2,240.1
|
|
||||
Future interest payments on variable rate long-term debt are estimated based on the rate in effect as of December 31, 2018. Future expected obligations under our pension and postretirement benefit plans, income taxes, environmental and product liability matters have not been included in the contractual cash obligations table above.
Pensions
At
December 31, 2018
, we had net pension liabilities of
$38.5 million
, which consist of plan assets of
$611.6 million
and benefit obligations of
$650.1 million
. It is our objective to contribute to the pension plans to ensure adequate funds are available in the plans to make benefit payments to plan participants and beneficiaries when required. The funded status for all of our pension plans decreased to
94.1%
at
December 31, 2018
from
95.5%
at
December 31, 2017
. We currently project that an additional approximately
$11.6 million
will be contributed to our plans worldwide in
2019
.
Because the timing and amounts of long-term funding requirements
42
for pension obligations are uncertain, they have been excluded from the preceding table. See Note 11 to the Consolidated Financial Statements for additional information.
Postretirement Benefits Other than Pensions
At
December 31, 2018
, we had postretirement benefit obligations of
$7.6 million
. We fund postretirement benefit costs principally
on a pay-as-you-go basis as medical costs are incurred by covered retiree populations. Benefit payments, which are net of expected plan participant contributions and Medicare Part D subsidies, are not expected to be material in
2019
. Because the timing and amounts of long-term funding requirements for postretirement obligations are uncertain, they have been excluded from the preceding table.
Income Taxes
At
December 31, 2018
, we have total unrecognized tax benefits for uncertain tax positions of $
42.0 million
and $
5.7 million
of related accrued interest and penalties, net of tax. These liabilities have been excluded from the preceding table as we are unable to reasonably estimate the amount and period in which these liabilities might be paid. See Note 17 to the Consolidated Financial Statements for additional information regarding matters relating to income taxes, including unrecognized tax benefits and tax authority disputes.
Contingent Liabilities
We are involved in various litigation, claims and administrative proceedings, including those related to environmental, asbestos-related and product liability matters. We believe that these liabilities are subject to the uncertainties inherent in estimating future costs for contingent liabilities and will likely be resolved over an extended period of time. Because the timing and amounts of potential future cash flows are uncertain, they have been excluded from the preceding table. See Note 20 to the Consolidated Financial Statements for additional information.
Critical Accounting Policies
Management’s Discussion and Analysis of Financial Condition and Results of Operations are based upon our Consolidated Financial Statements, which have been prepared in accordance with GAAP. The preparation of financial statements in conformity with those accounting principles requires management to use judgment in making estimates and assumptions based on the relevant information available at the end of each period. These estimates and assumptions have a significant effect on reported amounts of assets and liabilities, revenues and expenses as well as the disclosure of contingent assets and liabilities because they result primarily from the need to make estimates and assumptions on matters that are inherently uncertain. Actual results may differ from estimates. If updated information or actual amounts are different from previous estimates, the revisions are included in our results for the period in which they become known.
The following is a summary of certain accounting estimates and assumptions made by management that we consider critical:
|
•
|
Goodwill and indefinite-lived intangible assets – We have significant goodwill and indefinite-lived intangible assets on our Consolidated Balance Sheets related to previous business combinations. Our goodwill and other indefinite-lived intangible assets are tested annually during the fourth quarter for impairment or when there is a significant change in events or circumstances that indicate that the fair value of an asset is more likely than not less than the carrying amount of the asset.
|
Recoverability of goodwill is measured at the reporting unit level and starts with a comparison of the carrying amount of the reporting unit to its estimated fair value. If the estimated fair value of a reporting unit exceeds its carrying amount, goodwill of the reporting unit is not impaired. To the extent that the carrying value of the reporting unit exceeds its estimated fair value, a goodwill impairment charge will be recognized for the amount by which the carrying value of the reporting unit exceeds its fair value, not to exceed the carrying amount of goodwill.
As quoted market prices are not available for our reporting units, the calculation of their estimated fair values is based on two valuation techniques, a discounted cash flow model (income approach) and a market adjusted multiple of earnings and revenues (market approach), with each method being weighted in the calculation. The income approach relies on the Company’s estimates of future cash flows and explicitly addresses factors such as timing, growth and margins, with due consideration given to forecasting risk. The market approach reflects the market’s expectations for future growth and risk, with adjustments to account for differences between the guideline publicly-traded companies and the subject reporting units.
43
The estimated fair values for each of our reporting units exceeded their carrying values by more than 15% for the
2018
goodwill impairment test. Additionally, a 1% increase in the discount rate used or a 1% decrease in the terminal growth rate would not result in the carrying value of any reporting unit exceeding its estimated fair value.
Assessing the fair value of our reporting units includes, among other things, making key assumptions for estimating future cash flows and appropriate market multiples. These assumptions are subject to a high degree of judgment and complexity. We make every effort to estimate future cash flows as accurately as possible with the information available at the time the forecast is developed. However, changes in assumptions and estimates may affect the estimated fair value of the reporting unit and could result in impairment charges in future periods. Factors that have the potential to create variances in the estimated fair value of the reporting unit include, but are not limited to, the following:
|
•
|
Decreases in estimated market sizes or market growth rates due to greater-than-expected declines in volumes, pricing pressures or disruptive technology;
|
|
•
|
Declines in our market share and penetration assumptions due to increased competition or an inability to develop or launch new products;
|
|
•
|
The impacts of the market volatility, including greater-than-expected declines in pricing, reductions in volumes or fluctuations in foreign exchange rates;
|
|
•
|
The level of success of on-going and future research and development efforts, including those related to recent acquisitions, and increases in the research and development costs necessary to obtain regulatory approvals and launch new products;
|
|
•
|
Increase in the price or decrease in the availability of key commodities and the impact of higher energy prices; and
|
|
•
|
Increases in our market-participant risk-adjusted weighted-average cost of capital.
|
Other Indefinite-lived intangible assets
- We performed our annual indefinite-lived intangible asset impairment testing in
2018
and determined our indefinite-lived intangible assets were not impaired. Recoverability of intangible assets with indefinite useful lives is determined on a relief from royalty methodology, which is based on the implied royalty paid, at an appropriate discount rate, to license the use of an asset rather than owning the asset. The present value of the after-tax cost savings (i.e. royalty relief) indicates the estimated fair value of the asset. Any excess of the carrying value over the estimated fair value is recognized as an impairment loss equal to that excess.
A significant increase in the discount rate, decrease in the long-term growth rate, decrease in the royalty rate or substantial reductions in our end-markets and volume assumptions could have a negative impact on the estimated fair values of any of our indefinite-lived intangible assets. The estimates of fair value are based on the best information available as of the date of the assessment, which primarily incorporates management assumptions about expected future cash flows.
|
•
|
Long-lived assets and finite-lived intangible assets – Long-lived assets and finite-lived intangible assets are reviewed for impairment whenever events or changes in business circumstances indicate that the carrying amount of an asset may not be fully recoverable. Assets are grouped with other assets and liabilities at the lowest level for which identifiable cash flows can be generated. Impairment in the carrying value of an asset could be recognized whenever anticipated future undiscounted cash flows from an asset are less than its carrying value. The impairment is measured as the amount by which the carrying value exceeds the fair value of the asset as determined by an estimate of discounted cash flows. The estimates of fair value are based on the best information available as of the date of the assessment, and changes in business conditions could potentially require future adjustments to these valuations.
|
|
•
|
Loss contingencies – Liabilities are recorded for various contingencies arising in the normal course of business, including litigation and administrative proceedings, environmental and asbestos matters and product liability, product warranty, worker’s compensation and other claims. We have recorded reserves in the Consolidated Financial Statements related to these matters, which are developed using input derived from actuarial estimates and historical and anticipated experience data depending on the nature of the reserve, and in certain instances with consultation of legal counsel, internal and external consultants and engineers. Subject to the uncertainties inherent in estimating future costs for these types of liabilities, we believe our estimated reserves are reasonable and do not believe the final determination of the liabilities with respect to these matters would have a material effect on our financial condition, results of operations, liquidity or cash flows for any year.
|
|
•
|
Revenue recognition – Net revenues are recognized based on the satisfaction of performance obligations under the terms of a contract. A performance obligation is a promise in a contract to transfer control of a distinct product or to provide a
|
44
service, or a bundle of products or services, to a customer, and is the unit of account under ASC 606. We have two principal revenue streams, tangible product sales and services. Approximately 99% of consolidated Net revenues involve contracts with a single performance obligation, the transfer of control of a product or bundle of products to a customer. Transfer of control typically occurs when goods are shipped from our facilities or at other predetermined control transfer points (for instance, destination terms). Net revenues are measured as the amount of consideration we expect to receive in exchange for transferring control of the products and takes into account variable consideration, such as sales incentive programs, including discounts and volume rebates. The existence of these programs does not preclude revenue recognition but does require our best estimate of the variable consideration to be made based on expected activity, as these items are reserved for as a deduction to Net revenues over time based on our historical rates of providing these incentives and annual forecasted sales volumes.
Our remaining Net revenues involve services, including installation and consulting. Unlike the single performance obligation to ship a product or bundle of products, the service revenue stream delays revenue recognition until the service performance obligations are satisfied. In some instances, customer acceptance provisions are included in sales arrangements to give the buyer the ability to ensure the service meets the criteria established in the order. In these instances, revenue recognition is deferred until the performance obligations are satisfied, which could include acceptance terms specified in the arrangement being fulfilled through customer acceptance or a demonstration that established criteria have been satisfied.
We do not adjust the transaction price for the effects of a significant financing component, as the time period between control transfer of goods and services is less than one year. Sales, value-added and other similar taxes collected by us are excluded from Net revenues. We also have elected to account for shipping and handling activities that occur after control of the related goods transfers as fulfillment activities instead of performance obligations. Our payment terms are generally consistent with the industries in which our businesses operate.
Sales returns and customer disputes involving a question of quantity or price are accounted for as variable consideration, and therefore, as a reduction in revenue and a contra receivable. At
December 31, 2018
and
2017
, we had a customer claim accrual (contra receivable) of
$31.6 million
and
$32.5 million
, respectively. All other incentives or incentive programs where the customer is required to reach a certain level of purchases, remain a customer for a certain period, provide a rebate form or is subject to additional requirements are also considered variable consideration and are accounted for as a reduction of revenue and a liability. At
December 31, 2018
and
2017
, we had a sales incentive accrual of
$33.9 million
and
$31.8 million
, respectively. Variable consideration is estimated based on the most likely amount we expect to receive from customers. Each of these accruals represents the Company’s best estimate of the most likely amount expected to be received from customers based on historical experience. These estimates are reviewed regularly for accuracy. If updated information or actual amounts are different from previous estimates, the revisions are included in the Company’s results for the period in which they become known. Historically, the aggregate differences, if any, between the Company’s estimates and actual amounts in any year have not had a material impact on the Consolidated Financial Statements. We also offer a standard warranty with most product sales, and the value of such warranty is included in the contractual price. The corresponding cost of the warranty obligation is accrued as a liability (see Note 20).
|
•
|
Income taxes – We account for income taxes in accordance with ASC Topic 740. Deferred tax assets and liabilities are determined based on temporary differences between financial reporting and tax bases of assets and liabilities, applying enacted tax rates expected to be in effect for the year in which the differences are expected to reverse. We recognize future tax benefits, such as net operating losses and non-U.S. tax credits, to the extent that realizing these benefits is considered in our judgment to be more likely than not. We regularly review the recoverability of our deferred tax assets considering our historic profitability, projected future taxable income, timing of the reversals of existing temporary differences and the feasibility of our tax planning strategies. Where appropriate, we record a valuation allowance with respect to future tax benefits.
|
The provision for income taxes involves a significant amount of management judgment regarding interpretation of relevant facts and laws in the jurisdictions in which we operate. Future changes in applicable laws, projected levels of taxable income and tax planning could change the effective tax rate and tax balances recorded by us. In addition, tax authorities periodically review income tax returns filed by us and can raise issues regarding our filing positions, timing and amount of income or deductions and the allocation of income among the jurisdictions in which we operate. A significant period of time may elapse between the filing of an income tax return and the ultimate resolution of an issue raised by a revenue authority with respect to that return. We believe that we have adequately provided for any reasonably foreseeable resolution of these matters. We will adjust our estimates if significant events so dictate. To the extent that the ultimate results differ from our original or adjusted estimates, the effect will be recorded in the provision for income taxes in the period that the matter is finally resolved.
The Tax Reform Act constituted a major change to the U.S. tax system. The estimated impact of the Tax Reform Act is based on current interpretations and related assumptions. As discussed further in Note 17 to the Consolidated Financial
45
Statements, where applicable, we included estimates in our Consolidated Financial Statements for impacts of the new Tax Reform Act. The actual impact to us may be materially different from current estimates based on future regulatory developments.
|
•
|
Employee benefit plans – We provide a range of benefits to eligible employees and retirees, including pensions, postretirement and postemployment benefits. Determining the cost associated with such benefits is dependent on various actuarial assumptions including discount rates, expected return on plan assets, compensation increases, employee mortality, turnover rates and healthcare cost trend rates. Actuarial valuations are performed to determine expense in accordance with GAAP. Actual results may differ from the actuarial assumptions and are generally accumulated into Accumulated other comprehensive loss and amortized into earnings over future periods.
|
We review our actuarial assumptions at each measurement date and make modifications to the assumptions based on current rates and trends, if appropriate. The discount rate, the rate of compensation increase and the expected long-term rates of return on plan assets are determined as of each measurement date. Discount rates for all plans are established using hypothetical yield curves based on the yields of corporate bonds rated AA quality. Spot rates are developed from the yield curve and used to discount future benefit payments. The rate of compensation increase is dependent on expected future compensation levels. The expected long-term rate of return on plan assets reflects the average rate of returns expected on the funds invested or to be invested to provide for the benefits included in the projected benefit obligation. The expected long-term rate of return on plan assets is based on what is achievable given the plan’s investment policy, the types of assets held and the target asset allocation. The expected long-term rate of return is determined as of each measurement date.
We believe the assumptions utilized in recording our obligations under our plans are reasonable based on input from our actuaries, outside investment advisors and information as to assumptions used by plan sponsors.
Changes in any of the assumptions can have an impact on the net periodic pension and postretirement benefit cost. Estimated sensitivities to the expected
2018
net periodic pension benefit cost of a 0.25% rate decline in the two basic assumptions are as follows: the decline in the discount rate would increase expense by approximately
$0.8 million
and the decline in the estimated return on assets would increase expense by approximately
$0.6 million
.
|
•
|
Business combinations – The fair value of the consideration paid in a business combination is allocated to tangible assets and identifiable intangible assets, liabilities assumed and goodwill. Acquired intangible assets primarily include indefinite-lived trade names, customer relationships and completed technologies. The accounting for acquisitions involves a considerable amount of judgment and estimation, including the fair value of acquired intangible assets involving projections of future revenues and cash flows that are either discounted at an estimated discount rate or measured at an estimated royalty rate; fair value of other acquired assets and assumed liabilities, including potential contingencies; and the useful lives of the acquired assets. The assumptions used to determine the fair value of acquired intangible assets include projections developed using internal forecasts, available industry and market data, estimates of long-term growth rates, profitability, customer attrition and royalty rates, which are determined at the time of the business combination. The Company uses an income approach or market approach (or both) in accordance with accepted valuation models for each acquired intangible asset to determine the fair value. The impact of prior or future business combinations on our financial condition or results of operations may be materially impacted by the change in or initial selection of assumptions and estimates.
|
Recent Accounting Pronouncements
See Note 2 to our Consolidated Financial Statements included in Item 8
herein for a discussion of recently issued and adopted accounting pronouncements.
46
Item 7A.
QUANTITATIVE AND QUALITATIVE DISCLOSURE ABOUT MARKET RISK
We are exposed to fluctuations in currency exchange rates, interest rates and commodity prices which could impact our results of operations and financial condition.
Foreign Currency Exposures
We have operations throughout the world that manufacture and sell products in various international markets. As a result, we are exposed to movements in exchange rates of various currencies against the U.S. dollar as well as against other currencies throughout the world. We actively manage material currency exposures that are associated with purchases and sales and other assets and liabilities at the legal entity level; however, we do not hedge currency translation risk. We attempt to hedge exposures that cannot be naturally offset to an insignificant amount with foreign currency derivatives. Derivative instruments utilized by us in our hedging activities are viewed as risk management tools, involve little complexity and are not used for trading or speculative purposes. To minimize the risk of counter party non-performance, derivative instrument agreements are made only through major financial institutions with significant experience in such derivative instruments.
We evaluate our exposure to changes in currency exchange rates on our foreign currency derivatives using a sensitivity analysis. The sensitivity analysis is a measurement of the potential loss in fair value based on a percentage change in exchange rates. Based on the firmly committed currency derivative instruments in place at
December 31, 2018
, a hypothetical change in fair value of those derivative instruments assuming a 10% adverse change in exchange rates would result in an additional unrealized loss of approximately $6.8 million. This amount, when realized, would be partially offset by changes in the fair value of the underlying transactions.
Commodity Price Exposures
We are exposed to volatility in the prices of commodities used in some of our products and we use fixed price contracts to manage this exposure. We do not have committed commodity derivative instruments in place at
December 31, 2018
.
Interest Rate Exposure
Outstanding borrowings under the Credit Facilities accrue interest at the option of the Company of (i) a LIBOR rate plus the applicable margin or (ii) a base rate plus the applicable margin. The applicable margin ranges from
1.125%
to
1.500%
depending on the Company's credit ratings. At
December 31, 2018
, the outstanding borrowings under the Term Facility accrue interest at LIBOR plus a margin of
1.250%
. To manage the Company's exposure to fluctuations in LIBOR rates, the Company has interest rate swaps to fix the interest rate for
$250.0 million
of the outstanding borrowings.
These swaps expire in
September 2020
. A 100 basis-point increase in LIBOR would have resulted in incremental
2018
interest expense of approximately
$4.3 million
. If the base interest rate in our credit facilities increases in the future, our floating-rate debt could have a material effect on our interest expense.
47
Item 8.
FINANCIAL STATEMENTS AND SUPPLEMENTARY DATA
|
(a)
|
The following Consolidated Financial Statements and Financial Statement Schedule and the report thereon of PricewaterhouseCoopers LLP dated
February 19, 2019
, are presented following Item 16 of this Annual Report on Form 10-K.
|
Consolidated Financial Statements:
Report of independent registered public accounting firm
Consolidated Statements of Comprehensive Income for the years ended
December 31, 2018
,
2017
and
2016
Consolidated Balance Sheets at
December 31, 2018
and
2017
For the years ended
December 31, 2018
,
2017
and
2016
:
Consolidated Statements of Equity
Consolidated Statements of Cash Flows
Notes to Consolidated Financial Statements
Financial Statement Schedule:
Schedule II – Valuation and Qualifying Accounts for the years ended
December 31, 2018
,
2017
and
2016
|
(b)
|
The unaudited selected quarterly financial data for the two years ended
December 31,
is as follows:
|
|
In millions, except per share amounts
|
2018
|
|||||||||||||||
|
First
Quarter
|
Second
Quarter
|
Third
Quarter
|
Fourth
Quarter
|
|||||||||||||
|
Net revenues
|
$
|
613.1
|
|
$
|
704.7
|
|
$
|
711.5
|
|
$
|
702.4
|
|
||||
|
Cost of goods sold
|
355.3
|
|
399.1
|
|
402.1
|
|
401.9
|
|
||||||||
|
Operating income
|
98.7
|
|
143.4
|
|
142.3
|
|
141.4
|
|
||||||||
|
Net earnings
|
72.4
|
|
114.0
|
|
116.1
|
|
132.9
|
|
||||||||
|
Net earnings attributable to Allegion plc
|
72.2
|
|
113.9
|
|
116.0
|
|
132.8
|
|
||||||||
|
Earnings per share attributable to Allegion plc ordinary shareholders:
|
||||||||||||||||
|
Basic
|
$
|
0.76
|
|
$
|
1.20
|
|
$
|
1.22
|
|
$
|
1.40
|
|
||||
|
Diluted
|
$
|
0.75
|
|
$
|
1.19
|
|
$
|
1.21
|
|
$
|
1.39
|
|
||||
|
2017
|
||||||||||||||||
|
First
Quarter
|
Second
Quarter
|
Third
Quarter
|
Fourth
Quarter
|
|||||||||||||
|
Net revenues
|
$
|
548.8
|
|
$
|
627.0
|
|
$
|
609.4
|
|
$
|
623.0
|
|
||||
|
Cost of goods sold
|
307.6
|
|
345.7
|
|
335.0
|
|
347.0
|
|
||||||||
|
Operating income
|
99.5
|
|
135.0
|
|
127.1
|
|
130.9
|
|
||||||||
|
Net earnings
|
68.7
|
|
105.8
|
|
90.1
|
|
12.1
|
|
||||||||
|
Net earnings attributable to Allegion plc
|
68.4
|
|
105.5
|
|
89.8
|
|
9.6
|
|
||||||||
|
Earnings per share attributable to Allegion plc ordinary shareholders:
|
||||||||||||||||
|
Basic
|
$
|
0.72
|
|
$
|
1.11
|
|
$
|
0.95
|
|
$
|
0.10
|
|
||||
|
Diluted
|
$
|
0.71
|
|
$
|
1.10
|
|
$
|
0.94
|
|
$
|
0.10
|
|
||||
Net earnings from the fourth quarter of 2018 includes a net tax benefit of $18.6 million related to an adjustment to the provisional accounting related to the U.S. Tax Reform Act.
Net earnings from the fourth quarter of 2017 includes a $41.3 million charge related to the refinancing of our senior notes and a net tax charge of
$53.5 million
related to the U.S. Tax Reform Act.
48
Item 9.
CHANGES IN AND DISAGREEMENTS WITH ACCOUNTANTS ON ACCOUNTING AND FINANCIAL
DISCLOSURE
None.
Item 9A.
CONTROLS AND PROCEDURES
|
(a)
|
Evaluation of Disclosure Controls and Procedures
|
The Company's management, including its Chief Executive Officer and Chief Financial Officer, have conducted an evaluation of the effectiveness of the Company's disclosure controls and procedures (as such term is defined in Rules 13a-15(e) and 15d-15(e) under the Securities Exchange Act of 1934, as amended (the Exchange Act)), as of the end of the period covered by this Annual Report on Form 10-K. Based on that evaluation, the Chief Executive Officer and Chief Financial Officer concluded as of
December 31, 2018
, that the Company's disclosure controls and procedures were effective in ensuring that information required to be disclosed by the Company in reports that it files or submits under the Exchange Act has been recorded, processed, summarized and reported, within the time periods specified in the Commission's rules and forms, and that such information has been accumulated and communicated to the Company's management including its Chief Executive Officer and Chief Financial Officer, as appropriate, to allow timely decisions regarding required disclosure.
|
(b)
|
Management's Report on Internal Control Over Financial Reporting
|
Our management is responsible for establishing and maintaining adequate internal control over financial reporting, as defined under Exchange Act Rules 13a-15(f) and 15d-15(f). Our internal control over financial reporting is a process designed to provide reasonable assurance regarding the reliability of financial reporting and the preparation of financial statements for external purposes in accordance with generally accepted accounting principles. Internal control over financial reporting includes those policies and procedures that:
|
•
|
pertain to the maintenance of records that, in reasonable detail, accurately and fairly reflect the transactions and dispositions of the Company’s assets;
|
|
•
|
provide reasonable assurance that transactions are recorded as necessary to permit preparation of financial statements in accordance with generally accepted accounting principles, and that the Company’s receipts and expenditures are being made only in accordance with authorizations of the Company’s management and directors; and
|
|
•
|
provide reasonable assurance regarding prevention or timely detection of unauthorized acquisition, use, or disposition of the Company’s assets that could have a material effect on the financial statements.
|
Because of its inherent limitations, internal control over financial reporting may not prevent or detect misstatements. Also, projections of any evaluation of effectiveness to future periods are subject to the risk that controls may become inadequate because of changes in conditions, or that the degree of compliance with the policies or procedures may deteriorate.
Management assessed the effectiveness of our internal control over financial reporting as of
December 31, 2018
. In making this assessment, management used the criteria set forth by the Committee of Sponsoring Organizations of the Treadway Commission (COSO) in
Internal Control-Integrated Framework (2013)
. We concluded that our internal control over financial reporting was effective as of
December 31, 2018
.
As discussed in Item 7, we have completed six business acquisitions during 2018. Because they were acquired by us in 2018, we have excluded these businesses, AD Systems, Door and Access Systems, Hammond, Isonas, QMI and TGP, from our assessment of internal control over financial reporting as of December 31, 2018. These entities are wholly-owned subsidiaries whose total assets and total revenues represent approximately 3% and 6%, respectively, of the related consolidated financial statement amounts as of and for the year ended December 31, 2018. We are currently integrating these entities into our compliance programs and internal control processes.
The effectiveness of our internal control over financial reporting has been audited by PricewaterhouseCoopers LLP, the independent registered public accounting firm, as stated in their report herein.
|
(c)
|
Changes in Internal Control Over Financial Reporting
|
There were no changes in the Company's internal control over financial reporting that occurred during the quarter ended
December 31, 2018
that have materially affected, or are reasonably likely to materially affect, our internal control over financial reporting.
49
Item 9B.
OTHER INFORMATION
None.
50
PART III
Item 10.
DIRECTORS, EXECUTIVE OFFICERS AND CORPORATE GOVERNANCE
The information regarding our executive officers is included in Part I under the caption "Executive Officers of Registrant."
The other information required by this item is incorporated herein by reference to the information contained under the headings "Item 1. Election of Directors", "Section 16(a) Beneficial Ownership Reporting Compliance" and "Corporate Governance" in our Proxy Statement.
Item 11.
EXECUTIVE COMPENSATION
The other information required by this item is incorporated herein by reference to the information contained under the headings "Compensation Discussion and Analysis", "Executive Compensation" and "Compensation Committee Report" in our Proxy Statement.
Item 12.
SECURITY OWNERSHIP OF CERTAIN BENEFICIAL OWNERS AND MANAGEMENT AND RELATED
STOCKHOLDER MATTERS
The other information required by this item is incorporated herein by reference to the information contained under the headings "Security Ownership of Certain Beneficial Owners and Management" and "Equity Compensation Plan Information" of our Proxy Statement.
Item 13.
CERTAIN RELATIONSHIPS AND RELATED TRANSACTIONS, AND DIRECTOR INDEPENDENCE
The other information required by this item is incorporated herein by reference to the information contained under the headings "Corporate Governance" and "Certain Relationships and Related Person Transactions" of our Proxy Statement.
Item 14.
PRINCIPAL ACCOUNTANT FEES AND SERVICES
The information required by this item is incorporated herein by reference to the information contained under the caption "Fees of the Independent Auditors" in our Proxy Statement.
51
PART IV
Item 15.
EXHIBITS AND FINANCIAL STATEMENT SCHEDULES
|
(a) 1. and 2.
|
Financial statements and financial statement schedule
See Item 8.
|
|
3.
|
Exhibits
|
|
The exhibits listed on the accompanying index to exhibits are filed as part of this Annual Report on Form 10-K.
|
|
52
ALLEGION PLC
INDEX TO EXHIBITS
(Item 15(a))
Description
Pursuant to the rules and regulations of the SEC, we have filed certain agreements as exhibits to this Annual Report on Form 10-K. These agreements may contain representations and warranties by the parties. These representations and warranties have been made solely for the benefit of the other party or parties to such agreements and (i) may have been qualified by disclosures made to such other party or parties, (ii) were made only as of the date of such agreements or such other date(s) as may be specified in such agreements and are subject to more recent developments, which may not be fully reflected in our public disclosure, (iii) may reflect the allocation of risk among the parties to such agreements and (iv) may apply materiality standards different from what may be viewed as material to investors. Accordingly, these representations and warranties may not describe our actual state of affairs at the date hereof and should not be relied upon.
(a) Exhibits
|
Exhibit
Number
|
|
Exhibit Description
|
Method of Filing
|
|
|
|
Separation and Distribution Agreement between Ingersoll-Rand plc and Allegion plc, dated November 29, 2013.
|
Incorporated by reference to Exhibit 2.1 to the Company’s Form 8-K filed with the SEC on December 2, 2013 (File No. 001-35971).
|
||
|
|
Amended and Restated Memorandum and Articles of Association of Allegion plc.
|
Incorporated by reference to Exhibit 3.1 to the Company’s Form 8-K filed with the SEC on June 13, 2016 (File No. 001-35971).
|
||
|
Indenture, dated as of October 2, 2017, among Allegion US Holding Company Inc., Allegion plc and Wells Fargo Bank, National Association.
|
Incorporated by reference to Exhibit 4.1 of Allegion plc's Current Report on Form 8-K filed October 2, 2017.
|
|||
|
First Supplemental Indenture, dated as of October 2, 2017, among Allegion US Holding Company Inc., Allegion plc and Wells Fargo Bank, National Association.
|
Incorporated by reference to Exhibit 4.2 of Allegion plc's Current Report on Form 8-K filed October 2, 2017.
|
|||
|
Form of Global Note representing the 3.200% Senior Notes due 2024.
|
Incorporated by reference to Exhibit 4.3 of Allegion plc's Current Report on Form 8-K filed October 2, 2017 (included in Exhibit 4.2).
|
|||
|
Second Supplemental Indenture, dated as of October 2, 2017, among Allegion US Holding Company Inc., Allegion plc and Wells Fargo Bank, National Association.
|
Incorporated by reference to Exhibit 4.4 of Allegion plc's Current Report on Form 8-K filed October 2, 2017.
|
|||
|
Form of Global Note representing the 3.550% Senior Notes due 2027.
|
Incorporated by reference to Exhibit 4.5 of Allegion plc's Current Report on Form 8-K filed October 2, 2017 (included in Exhibit 4.4).
|
|||
|
Form of Separation Agreement and Release. *
|
Filed herewith.
|
|||
|
|
Tax Matters Agreement between Ingersoll-Rand plc and Allegion plc.
|
Incorporated by reference to Exhibit 10.1 to the Company’s Form 8-K filed with the SEC on December 2, 2013 (File No. 001-35971).
|
||
|
Credit Agreement, dated as of September 12, 2017.
|
Incorporated by reference to Exhibit 10.1 of Allegion plc's Current Report on Form 8-K filed September 15, 2017.
|
|||
53
|
|
Employee Matters Agreement between Ingersoll-Rand plc and Allegion plc.
|
Incorporated by reference to Exhibit 10.2 to the Company’s Form 8-K filed with the SEC on December 2, 2013 (File No. 001-35971).
|
||
|
|
2013 Incentive Stock Plan. *
|
Incorporated by reference to Exhibit 10.5 to the Company’s Registration Statement on Form 10 filed with the SEC on June 17, 2013, as amended (File No. 001-35971).
|
||
|
|
Executive Deferred Compensation Plan. *
|
Incorporated by reference to Exhibit 10.6 to the Company’s Registration Statement on Form 10 filed with the SEC on June 17, 2013, as amended (File No. 001-35971).
|
||
|
Supplemental Employee Savings Plan. *
|
Incorporated by reference to Exhibit 10.7 to the Company’s Registration Statement on Form 10 filed with the SEC on June 17, 2013, as amended (File No. 001-35971).
|
|||
|
Elected Officer Supplemental Program. *
|
Incorporated by reference to Exhibit 10.8 to the Company’s Registration Statement on Form 10 filed with the SEC on June 17, 2013, as amended (File No. 001-35971).
|
|||
|
Key Management Supplemental Program. *
|
Incorporated by reference to Exhibit 10.9 to the Company’s Registration Statement on Form 10 filed with the SEC on June 17, 2013, as amended (File No. 001-35971).
|
|||
|
Supplemental Pension Plan. *
|
Incorporated by reference to Exhibit 10.10 to the Company’s Registration Statement on Form 10 filed with the SEC on June 17, 2013, as amended (File No. 001-35971).
|
|||
|
Senior Executive Performance Plan. *
|
Incorporated by reference to Exhibit 10.11 to the Company’s Registration Statement on Form 10 filed with the SEC on June 17, 2013, as amended (File No. 001-35971).
|
|||
|
David D. Petratis Offer Letter, dated June 19, 2013. *
|
Incorporated by reference to Exhibit 10.14 to the Company’s Registration Statement on Form 10 filed with the SEC on June 17, 2013, as amended (File No. 001-35971).
|
|||
|
Patrick S. Shannon Offer Letter, dated April 9, 2013. *
|
Incorporated by reference to Exhibit 10.15 to the Company’s Registration Statement on Form 10 filed with the SEC on June 17, 2013, as amended (File No. 001-35971).
|
|||
|
Timothy P. Eckersley Offer Letter, dated October 3, 2013. *
|
Incorporated by reference to Exhibit 10.16 to the Company’s Registration Statement on Form 10 filed with the SEC on June 17, 2013, as amended (File No. 001-35971).
|
|||
|
Lucia V. Moretti, Offer Letter, dated February 19, 2014. *
|
Incorporated by reference to Exhibit 10.1 to the Company's Form 10-K filed with the SEC on February 26, 2016 (File No. 001-35971).
|
|||
|
Jeffrey N. Braun Offer Letter, dated June 13, 2014. *
|
Incorporated by reference to Exhibit 10.15 to the Company's Form 10-K filed with the SEC on February 17, 2017 (File No. 001-35971).
|
|||
|
Form of Allegion plc Deed Poll Indemnity.
|
Incorporated by reference to Exhibit 10.21 to the Company’s Registration Statement on Form 10 filed with the SEC on June 17, 2013, as amended (File No. 001-35971).
|
|||
54
|
Form of Allegion US Holding Company, Inc. Deed Poll Indemnity.
|
Incorporated by reference to Exhibit 10.22 to the Company’s Registration Statement on Form 10 filed with the SEC on June 17, 2013, as amended (File No. 001-35971).
|
|||
|
Form of Allegion Irish Holding Company Limited Deed Poll Indemnity.
|
Incorporated by reference to Exhibit 10.23 to the Company’s Registration Statement on Form 10 filed with the SEC on June 17, 2013, as amended (File No. 001-35971).
|
|||
|
Annual Incentive Plan. *
|
Incorporated by reference to Exhibit 10.1 to the Company's Form 10-K filed with the SEC on March 10, 2014 (File No. 001-35971).
|
|||
|
Change in Control Severance Plan. *
|
Incorporated by reference to Exhibit 10.2 to the Company's Form 10-K filed with the SEC on March 10, 2014 (File No. 001-35971).
|
|||
|
Form of Restricted Stock Unit Award Agreement. *
|
Filed herewith.
|
|||
|
Form of Stock Option Award Agreement. *
|
Filed herewith.
|
|||
|
Form of Performance Share Unit Award Agreement. *
|
Filed herewith.
|
|||
|
Form of Special Restricted Stock Unit Award Agreement. *
|
Incorporated by reference to Exhibit 10.4 to the Company's Form 8-K filed with the SEC on February 9, 2016 (File No. 001-35971).
|
|||
|
Form of Non-Employee Director Restricted Stock Unit Award Agreement. *
|
Incorporated by reference to Exhibit 10.1 to the Company's Form 10-Q filed with the SEC on April 30, 2015 (File No. 001-35971).
|
|||
|
Share Purchase Agreement dated June 26, 2015 between SimonsVoss Luxco S.à r.l., SimonsVoss Co-Invest GmbH & Co. KG, Mr Frank Rövekamp and Allegion Luxembourg Holding & Financing S.à r.l.
|
Incorporated by reference to Exhibit 10.1 to the Company's Form 10-Q filed with the SEC on July 30, 2015 (File No. 001-35971).
|
|||
|
|
List of subsidiaries of Allegion plc.
|
Filed herewith.
|
||
|
Consent of Independent Registered Public Accounting Firm.
|
Filed herewith.
|
|||
|
Certification of Chief Executive Officer Pursuant to Rule 13a-14(a) or Rule 15d-14(a), as Adopted Pursuant to Section 302 of the Sarbanes-Oxley Act of 2002.
|
Filed herewith.
|
|||
|
Certification of Chief Financial Officer Pursuant to Rule 13a-14(a) or Rule 15d-14(a), as Adopted Pursuant to Section 302 of the Sarbanes-Oxley Act of 2002.
|
Filed herewith.
|
|||
|
Certifications of Chief Executive Officer and Chief Financial Officer Pursuant to Rule 13a-14(b) or Rule 15d-14(b) and 18U.S.C. Section 1350, as Adopted Pursuant to Section 906 of the Sarbanes-Oxley Act of 2002.
|
Furnished herewith.
|
|||
55
|
101
|
The following materials from the Company’s Annual Report on Form 10-K for the year ended December 31, 2018, formatted in XBRL (Extensible Business Reporting Language): (i) the Consolidated Statements of Comprehensive Income, (ii) the Consolidated Balance Sheets, (iii) the Consolidated Statements of Cash Flows, (iv) the Consolidated Statements of Equity and (v) Notes to Consolidated Financial Statements.
|
Filed herewith.
|
||
* Compensatory plan or arrangement.
56
Item 16.
FORM 10-K SUMMARY
Not applicable.
57
SIGNATURES
Pursuant to the requirements of Section 13 or 15(d) of the Securities Exchange Act of 1934, the registrant has duly caused this report to be signed on its behalf by the undersigned, thereunto duly authorized.
ALLEGION PLC
(Registrant)
|
By:
|
|
/s/ David D. Petratis
|
|
|
David D. Petratis
|
|
|
|
Chief Executive Officer
|
|
|
Date:
|
|
February 19, 2019
|
58
Pursuant to the requirement of the Securities Exchange Act of 1934, this report has been signed by the following persons on behalf of the registrant and in the capacities and on the dates indicated.
|
Signature
|
|
Title
|
|
Date
|
|
/s/ David D. Petratis
|
|
Chairman of the Board, President and Chief Executive Officer (Principal Executive Officer)
|
|
February 19, 2019
|
|
(David D. Petratis)
|
||||
|
/s/ Patrick S. Shannon
|
|
Senior Vice President and Chief Financial Officer (Principal Financial Officer)
|
|
February 19, 2019
|
|
(Patrick S. Shannon)
|
||||
|
/s/ Douglas P. Ranck
|
|
Vice President, Controller and Chief Accounting Officer (Principal Accounting Officer)
|
|
February 19, 2019
|
|
(Douglas P. Ranck)
|
||||
|
/s/ Carla Cico
|
|
Director
|
|
February 19, 2019
|
|
(Carla Cico)
|
||||
|
/s/ Kirk S. Hachigian
|
|
Director
|
|
February 19, 2019
|
|
(Kirk S. Hachigian)
|
||||
|
/s/ Nicole Parent Haughey
|
Director
|
February 19, 2019
|
||
|
(Nicole Parent Haughey)
|
||||
|
/s/ Dean Schaffer
|
Director
|
February 19, 2019
|
||
|
(Dean Schaffer)
|
||||
|
/s/ Charles L. Szews
|
Director
|
February 19, 2019
|
||
|
(Charles L. Szews)
|
||||
|
/s/ Martin E. Welch III
|
|
Director
|
|
February 19, 2019
|
|
(Martin E. Welch III)
|
||||
59
ALLEGION PLC
Index to Consolidated Financial Statements
Report of Independent Registered Public Accounting Firm
To the Shareholders and Board of Directors of Allegion plc:
Opinions on the Financial Statements and Internal Control over Financial Reporting
We have audited the accompanying consolidated
balance sheets of Allegion plc
and its subsidiaries (the “Company”) as of December 31, 2018 and 2017,
and the related consolidated statements of comprehensive income, of equity and of cash flows for each of the three years in the period ended December 31, 2018, including the related notes and financial statement schedule listed in the accompanying index (collectively referred to as the “consolidated
financial statements”).
We also have audited the Company's internal control over financial reporting as of December
31, 2018, based on criteria established in
Internal Control - Integrated Framework
(2013)
issued by the Committee of Sponsoring Organizations of the Treadway Commission (COSO).
In our opinion, the consolidated
financial statements referred to above present fairly, in all material respects, the financial position of the Company as of December
31,
2018
and 2017
,
and the results of its
operations and its
cash flows for each of the three years in the period ended December
31,
2018
in conformity with accounting principles generally accepted in the United States of America. Also in our opinion, the Company maintained, in all material respects, effective internal control over financial reporting as of December 31, 2018, based on criteria established in
Internal Control - Integrated Framework
(2013)
issued by the COSO.
Basis for Opinions
The Company's management is responsible for these consolidated
financial statements, for maintaining effective internal control over financial reporting, and for its assessment of the effectiveness of internal control over financial reporting, included in Management's Report on Internal Control Over Financial Reporting under Item 9A. Our responsibility is to express opinions on the Company’s consolidated
financial statements and on the Company's internal control over financial reporting based on our audits. We are a public accounting firm registered with the Public Company Accounting Oversight Board (United States) (PCAOB) and are required to be independent with respect to the Company in accordance with the U.S. federal securities laws and the applicable rules and regulations of the Securities and Exchange Commission and the PCAOB.
We conducted our audits in accordance with the standards of the PCAOB. Those standards require that we plan and perform the audits to obtain reasonable assurance about whether the consolidated
financial statements are free of material misstatement, whether due to error or fraud, and whether effective internal control over financial reporting was maintained in all material respects.
Our audits of the consolidated
financial statements included performing procedures to assess the risks of material misstatement of the consolidated
financial statements, whether due to error or fraud, and performing procedures that respond to those risks. Such procedures included examining, on a test basis, evidence regarding the amounts and disclosures in the consolidated
financial statements. Our audits also included evaluating the accounting principles used and significant estimates made by management, as well as evaluating the overall presentation of the consolidated
financial statements. Our audit of internal control over financial reporting included obtaining an understanding of internal control over financial reporting, assessing the risk that a material weakness exists, and testing and evaluating the design and operating effectiveness of internal control based on the assessed risk. Our audits also included performing such other procedures as we considered necessary in the circumstances. We believe that our audits provide a reasonable basis for our opinions.
As described in Management’s Report on Internal Control Over Financial Reporting, management has excluded Technical Glass Products, Inc., Hammond Enterprises, Inc., Qatar Metal Industries LLC, AD Systems, Inc., Gainsborough Hardware and API Locksmiths, and ISONAS Security Systems, Inc. from its assessment of internal control over financial reporting as of December 31, 2018 because they were acquired by the Company in purchase business combinations in 2018. We have also excluded Technical Glass Products, Inc., Hammond Enterprises, Inc., Qatar Metal Industries LLC, AD Systems, Inc., Gainsborough Hardware and API Locksmiths, and ISONAS Security Systems, Inc. from our audit of internal control over financial reporting. Technical Glass Products, Inc., Hammond Enterprises, Inc., Qatar Metal Industries LLC, AD Systems, Inc., Gainsborough Hardware and API Locksmiths, and ISONAS Security Systems, Inc. are wholly owned subsidiaries whose total assets and total revenues excluded from management’s assessment and our audit of internal control over financial reporting represent approximately 3% and 6%, respectively, of the related consolidated financial statement amounts as of and for the year ended December 31, 2018.
Definition and Limitations of Internal Control over Financial Reporting
A company’s internal control over financial reporting is a process designed to provide reasonable assurance regarding the reliability of financial reporting and the preparation of financial statements for external purposes in accordance with generally accepted
F-2
accounting principles. A company’s internal control over financial reporting includes those policies and procedures that (i) pertain to the maintenance of records that, in reasonable detail, accurately and fairly reflect the transactions and dispositions of the assets of the company; (ii) provide reasonable assurance that transactions are recorded as necessary to permit preparation of financial statements in accordance with generally accepted accounting principles, and that receipts and expenditures of the company are being made only in accordance with authorizations of management and directors of the company; and (iii) provide reasonable assurance regarding prevention or timely detection of unauthorized acquisition, use, or disposition of the company’s assets that could have a material effect on the financial statements.
Because of its inherent limitations, internal control over financial reporting may not prevent or detect misstatements. Also, projections of any evaluation of effectiveness to future periods are subject to the risk that controls may become inadequate because of changes in conditions, or that the degree of compliance with the policies or procedures may deteriorate.
/s/ PricewaterhouseCoopers LLP
Indianapolis, Indiana
February 19, 2019
We have served as the Company’s auditor since 2013.
F-3
|
Allegion plc
Consolidated Statements of Comprehensive Income
In millions, except per share amounts
|
||||||||||||
|
For the years ended December 31,
|
2018
|
2017
|
2016
|
|||||||||
|
Net revenues
|
$
|
2,731.7
|
|
$
|
2,408.2
|
|
$
|
2,238.0
|
|
|||
|
Cost of goods sold
|
1,558.4
|
|
1,335.3
|
|
1,248.3
|
|
||||||
|
Selling and administrative expenses
|
647.5
|
|
580.4
|
|
555.4
|
|
||||||
|
Operating income
|
525.8
|
|
492.5
|
|
434.3
|
|
||||||
|
Interest expense
|
54.0
|
|
105.7
|
|
64.3
|
|
||||||
|
Loss on divestitures
|
—
|
|
|
—
|
|
84.4
|
|
|||||
|
Other income, net
|
(3.4
|
)
|
(8.9
|
)
|
(9.4
|
)
|
||||||
|
Earnings before income taxes
|
475.2
|
|
395.7
|
|
295.0
|
|
||||||
|
Provision for income taxes
|
39.8
|
|
119.0
|
|
63.8
|
|
||||||
|
Net earnings
|
435.4
|
|
276.7
|
|
231.2
|
|
||||||
|
Less: Net earnings attributable to noncontrolling interests
|
0.5
|
|
3.4
|
|
2.1
|
|
||||||
|
Net earnings attributable to Allegion plc
|
$
|
434.9
|
|
$
|
273.3
|
|
$
|
229.1
|
|
|||
|
Amounts attributable to Allegion plc ordinary shareholders:
|
|
|
||||||||||
|
Earnings per share attributable to Allegion plc ordinary shareholders:
|
||||||||||||
|
Basic net earnings:
|
$
|
4.58
|
|
$
|
2.87
|
|
$
|
2.39
|
|
|||
|
Diluted net earnings:
|
$
|
4.54
|
|
$
|
2.85
|
|
$
|
2.36
|
|
|||
|
Dividends declared per ordinary share
|
$
|
0.84
|
|
$
|
0.64
|
|
$
|
0.48
|
|
|||
|
Net earnings
|
$
|
435.4
|
|
$
|
276.7
|
|
$
|
231.2
|
|
|||
|
Other comprehensive income (loss), net of tax
|
||||||||||||
|
Currency translation
|
(56.9
|
)
|
97.5
|
|
(40.7
|
)
|
||||||
|
Cash flow hedges and marketable securities:
|
||||||||||||
|
Unrealized net gains arising during period
|
4.6
|
|
5.2
|
|
9.7
|
|
||||||
|
Net gains reclassified into earnings
|
(2.3
|
)
|
(4.7
|
)
|
(19.0
|
)
|
||||||
|
Tax expense
|
(0.5
|
)
|
(0.1
|
)
|
(1.3
|
)
|
||||||
|
Total cash flow hedges and marketable securities, net of tax
|
1.8
|
|
0.4
|
|
(10.6
|
)
|
||||||
|
Pension and OPEB adjustments:
|
||||||||||||
|
Net actuarial (losses) gains for the period
|
(16.6
|
)
|
25.5
|
|
3.1
|
|
||||||
|
Amortization reclassified into earnings
|
4.5
|
|
5.2
|
|
6.0
|
|
||||||
|
Settlements/curtailments reclassified to earnings
|
—
|
|
0.1
|
|
0.3
|
|
||||||
|
Currency translation and other
|
5.1
|
|
0.7
|
|
14.4
|
|
||||||
|
Tax benefit (expense)
|
1.6
|
|
(12.2
|
)
|
(5.0
|
)
|
||||||
|
Total pension and OPEB adjustments, net of tax
|
(5.4
|
)
|
19.3
|
|
18.8
|
|
||||||
|
Other comprehensive (loss) income, net of tax
|
(60.5
|
)
|
117.2
|
|
(32.5
|
)
|
||||||
|
Total comprehensive income, net of tax
|
374.9
|
|
393.9
|
|
198.7
|
|
||||||
|
Less: Total comprehensive income attributable to noncontrolling interests
|
0.9
|
|
2.8
|
|
1.7
|
|
||||||
|
Total comprehensive income attributable to Allegion plc
|
$
|
374.0
|
|
$
|
391.1
|
|
$
|
197.0
|
|
|||
See accompanying notes to consolidated financial statements.
F-4
Allegion plc
Consolidated Balance Sheets
In millions, except share amounts
|
As of December 31,
|
2018
|
2017
|
||||||
|
ASSETS
|
||||||||
|
Current assets:
|
||||||||
|
Cash and cash equivalents
|
$
|
283.8
|
|
$
|
466.2
|
|
||
|
Restricted cash
|
6.8
|
|
—
|
|
||||
|
Accounts and notes receivable, net
|
324.9
|
|
296.6
|
|
||||
|
Inventories
|
280.3
|
|
239.8
|
|
||||
|
Current tax receivable
|
15.4
|
|
12.2
|
|
||||
|
Other current assets
|
19.6
|
|
17.0
|
|
||||
|
Assets held for sale
|
0.8
|
|
0.9
|
|
||||
|
Total current assets
|
931.6
|
|
1,032.7
|
|
||||
|
Property, plant and equipment, net
|
276.7
|
|
252.2
|
|
||||
|
Goodwill
|
883.0
|
|
761.2
|
|
||||
|
Intangible assets, net
|
547.1
|
|
394.3
|
|
||||
|
Deferred and noncurrent income taxes
|
84.6
|
|
35.4
|
|
||||
|
Other noncurrent assets
|
87.2
|
|
66.2
|
|
||||
|
Total assets
|
$
|
2,810.2
|
|
$
|
2,542.0
|
|
||
|
LIABILITIES AND EQUITY
|
||||||||
|
Current liabilities:
|
||||||||
|
Accounts payable
|
$
|
235.0
|
|
$
|
188.3
|
|
||
|
Accrued compensation and benefits
|
95.3
|
|
84.7
|
|
||||
|
Accrued expenses and other current liabilities
|
135.0
|
|
134.6
|
|
||||
|
Current tax payable
|
20.2
|
|
18.2
|
|
||||
|
Short-term borrowings and current maturities of long-term debt
|
35.3
|
|
35.0
|
|
||||
|
Total current liabilities
|
520.8
|
|
460.8
|
|
||||
|
Long-term debt
|
1,409.5
|
|
1,442.3
|
|
||||
|
Postemployment and other benefit liabilities
|
81.2
|
|
85.9
|
|
||||
|
Deferred and noncurrent income taxes
|
115.9
|
|
123.6
|
|
||||
|
Other noncurrent liabilities
|
28.8
|
|
23.9
|
|
||||
|
Total liabilities
|
2,156.2
|
|
2,136.5
|
|
||||
|
Equity:
|
||||||||
|
Allegion plc shareholders’ equity
|
||||||||
|
Ordinary shares, $0.01 par value (94,637,450 and 95,062,385 shares issued and outstanding at December 31, 2018 and 2017, respectively)
|
0.9
|
|
1.0
|
|
||||
|
Capital in excess of par value
|
—
|
|
9.1
|
|
||||
|
Retained earnings
|
873.6
|
|
544.4
|
|
||||
|
Accumulated other comprehensive loss
|
(223.5
|
)
|
(152.9
|
)
|
||||
|
Total Allegion plc shareholders’ equity
|
651.0
|
|
401.6
|
|
||||
|
Noncontrolling interest
|
3.0
|
|
3.9
|
|
||||
|
Total equity
|
654.0
|
|
405.5
|
|
||||
|
Total liabilities and equity
|
$
|
2,810.2
|
|
$
|
2,542.0
|
|
||
See accompanying notes to consolidated financial statements.
F-5
|
Allegion plc
Consolidated Statements of Equity
|
|||||||||||||||||||||||||||
|
Allegion plc Shareholders' equity
|
|||||||||||||||||||||||||||
|
In millions
|
Total
equity
|
Ordinary Shares
|
Capital in excess of par value
|
Retained earnings
|
Accumulated
other
comprehensive loss
|
Non-controlling Interest
|
|||||||||||||||||||||
|
Amount
|
Shares
|
||||||||||||||||||||||||||
|
Balance at December 31, 2015
|
$
|
29.7
|
|
$
|
1.0
|
|
96.0
|
|
$
|
24.4
|
|
$
|
232.4
|
|
$
|
(232.2
|
)
|
$
|
4.1
|
|
|||||||
|
Net earnings
|
231.2
|
|
—
|
|
—
|
|
—
|
|
229.1
|
|
—
|
|
2.1
|
|
|||||||||||||
|
Other comprehensive loss
|
(32.5
|
)
|
—
|
|
—
|
|
—
|
|
—
|
|
(32.1
|
)
|
(0.4
|
)
|
|||||||||||||
|
Shares issued under incentive stock plans
|
5.8
|
|
—
|
|
—
|
|
5.8
|
|
—
|
|
—
|
|
—
|
|
|||||||||||||
|
Repurchase of ordinary shares
|
(85.1
|
)
|
—
|
|
(1.3
|
)
|
(46.4
|
)
|
(38.7
|
)
|
—
|
|
—
|
|
|||||||||||||
|
Share-based compensation
|
16.6
|
|
—
|
|
0.6
|
|
16.6
|
|
—
|
|
—
|
|
—
|
|
|||||||||||||
|
Acquisition/divestiture of noncontrolling interest
|
(0.4
|
)
|
—
|
|
—
|
|
(0.4
|
)
|
—
|
|
—
|
|
—
|
|
|||||||||||||
|
Dividends declared to noncontrolling interest
|
(2.7
|
)
|
—
|
|
—
|
|
—
|
|
—
|
|
—
|
|
(2.7
|
)
|
|||||||||||||
|
Cash dividends declared ($0.48 per share)
|
(46.0
|
)
|
—
|
|
—
|
|
—
|
|
(46.0
|
)
|
—
|
|
—
|
|
|||||||||||||
|
Other
|
(0.2
|
)
|
—
|
|
—
|
|
—
|
|
(0.2
|
)
|
—
|
|
—
|
|
|||||||||||||
|
Balance at December 31, 2016
|
116.4
|
|
1.0
|
|
95.3
|
|
—
|
|
376.6
|
|
(264.3
|
)
|
3.1
|
|
|||||||||||||
|
Cumulative effect of change in accounting principle
|
(5.0
|
)
|
—
|
|
—
|
|
—
|
|
(5.0
|
)
|
—
|
|
—
|
|
|||||||||||||
|
Net earnings
|
276.7
|
|
—
|
|
—
|
|
—
|
|
273.3
|
|
—
|
|
3.4
|
|
|||||||||||||
|
Other comprehensive income (loss)
|
117.2
|
|
—
|
|
—
|
|
—
|
|
—
|
|
117.8
|
|
(0.6
|
)
|
|||||||||||||
|
Shares issued under incentive stock plans
|
7.2
|
|
—
|
|
—
|
|
7.2
|
|
—
|
|
—
|
|
—
|
|
|||||||||||||
|
Repurchase of ordinary shares
|
(60.0
|
)
|
—
|
|
(0.8
|
)
|
(13.9
|
)
|
(46.1
|
)
|
—
|
|
—
|
|
|||||||||||||
|
Share-based compensation
|
15.8
|
|
—
|
|
0.6
|
|
15.8
|
|
—
|
|
—
|
|
—
|
|
|||||||||||||
|
Dividends declared to noncontrolling interest
|
(1.8
|
)
|
—
|
|
—
|
|
—
|
|
—
|
|
—
|
|
(1.8
|
)
|
|||||||||||||
|
Cash dividends declared ($0.64 per share)
|
(60.9
|
)
|
—
|
|
—
|
|
—
|
|
(60.9
|
)
|
—
|
|
—
|
|
|||||||||||||
|
Other (see Note 13)
|
(0.1
|
)
|
—
|
|
—
|
|
—
|
|
6.5
|
|
(6.4
|
)
|
(0.2
|
)
|
|||||||||||||
|
Balance at December 31, 2017
|
405.5
|
|
1.0
|
|
95.1
|
|
9.1
|
|
544.4
|
|
(152.9
|
)
|
3.9
|
|
|||||||||||||
|
Net earnings
|
435.4
|
|
—
|
|
—
|
|
—
|
|
434.9
|
|
—
|
|
0.5
|
|
|||||||||||||
|
Other comprehensive (loss) income
|
(60.5
|
)
|
—
|
|
—
|
|
—
|
|
—
|
|
(60.9
|
)
|
0.4
|
|
|||||||||||||
|
Shares issued under incentive stock plans
|
3.2
|
|
—
|
|
—
|
|
3.2
|
|
—
|
|
—
|
|
—
|
|
|||||||||||||
|
Repurchase of ordinary shares
|
(67.3
|
)
|
(0.1
|
)
|
(0.9
|
)
|
(31.5
|
)
|
(35.7
|
)
|
—
|
|
—
|
|
|||||||||||||
|
Share-based compensation
|
19.2
|
|
—
|
|
0.4
|
|
19.2
|
|
—
|
|
—
|
|
—
|
|
|||||||||||||
|
Dividends declared to noncontrolling interest
|
(1.8
|
)
|
—
|
|
—
|
|
—
|
|
—
|
|
—
|
|
(1.8
|
)
|
|||||||||||||
|
Cash dividends declared ($0.84 per share)
|
(79.7
|
)
|
—
|
|
—
|
|
—
|
|
(79.7
|
)
|
—
|
|
—
|
|
|||||||||||||
|
Reclassification due to adoption of ASU 2018-02 (see Note 2)
|
—
|
|
—
|
|
—
|
|
—
|
|
9.7
|
|
(9.7
|
)
|
—
|
|
|||||||||||||
|
Balance at December 31, 2018
|
$
|
654.0
|
|
$
|
0.9
|
|
94.6
|
|
$
|
—
|
|
$
|
873.6
|
|
$
|
(223.5
|
)
|
$
|
3.0
|
|
|||||||
See accompanying notes to consolidated financial statements.
F-6
|
Allegion plc
Consolidated Statements of Cash Flows
In millions
|
||||||||||||
|
For the years ended December 31,
|
2018
|
2017
|
2016
|
|||||||||
|
Cash flows from operating activities:
|
||||||||||||
|
Net earnings
|
$
|
435.4
|
|
$
|
276.7
|
|
$
|
231.2
|
|
|||
|
Adjustments to arrive at net cash provided by operating activities:
|
||||||||||||
|
Debt extinguishment costs
|
—
|
|
43.1
|
|
—
|
|
||||||
|
Depreciation and amortization
|
86.2
|
|
66.9
|
|
66.9
|
|
||||||
|
Share-based compensation
|
19.6
|
|
16.2
|
|
16.6
|
|
||||||
|
Loss on divestitures
|
—
|
|
—
|
|
84.4
|
|
||||||
|
Gain on sale of marketable securities
|
—
|
|
—
|
|
(12.4
|
)
|
||||||
|
Loss (gain) on sale of property, plant and equipment
|
0.4
|
|
(0.1
|
)
|
1.3
|
|
||||||
|
Equity earnings, net of dividends
|
(0.1
|
)
|
(5.3
|
)
|
(3.2
|
)
|
||||||
|
Discretionary pension plan contribution
|
—
|
|
(50.0
|
)
|
—
|
|
||||||
|
Deferred income taxes
|
(64.4
|
)
|
24.9
|
|
6.3
|
|
||||||
|
Other items
|
(8.3
|
)
|
3.0
|
|
(7.7
|
)
|
||||||
|
Changes in other assets and liabilities
|
||||||||||||
|
Accounts and notes receivable
|
(8.6
|
)
|
(22.7
|
)
|
(19.8
|
)
|
||||||
|
Inventories
|
(19.7
|
)
|
(4.4
|
)
|
(15.6
|
)
|
||||||
|
Other current and noncurrent assets
|
(3.3
|
)
|
3.5
|
|
62.0
|
|
||||||
|
Accounts payable
|
33.9
|
|
0.4
|
|
3.4
|
|
||||||
|
Other current and noncurrent liabilities
|
(13.3
|
)
|
(5.0
|
)
|
(35.9
|
)
|
||||||
|
Net cash provided by operating activities
|
457.8
|
|
347.2
|
|
377.5
|
|
||||||
|
Cash flows from investing activities:
|
||||||||||||
|
Capital expenditures
|
(49.1
|
)
|
(49.3
|
)
|
(42.5
|
)
|
||||||
|
Acquisition of and equity investments in businesses, net of cash acquired
|
(376.1
|
)
|
(20.8
|
)
|
(31.4
|
)
|
||||||
|
Proceeds from sale of property, plant and equipment
|
0.2
|
|
3.1
|
|
0.1
|
|
||||||
|
Proceeds from sale of equity investment
|
—
|
|
15.6
|
|
—
|
|
||||||
|
Proceeds (payments) related to business dispositions
|
—
|
|
1.2
|
|
(4.3
|
)
|
||||||
|
Purchase of investments
|
(14.3
|
)
|
—
|
|
—
|
|
||||||
|
Proceeds from sale of marketable securities
|
—
|
|
—
|
|
14.1
|
|
||||||
|
Other investing activities, net
|
(4.5
|
)
|
—
|
|
—
|
|
||||||
|
Net cash used in investing activities
|
$
|
(443.8
|
)
|
$
|
(50.2
|
)
|
$
|
(64.0
|
)
|
|||
F-7
|
Allegion plc
Consolidated Statements of Cash Flows - (Continued)
In millions
|
||||||||||||
|
For the years ended December 31,
|
2018
|
2017
|
2016
|
|||||||||
|
Cash flows from financing activities:
|
||||||||||||
|
Short-term borrowings, net
|
$
|
(0.6
|
)
|
$
|
(1.3
|
)
|
$
|
(17.4
|
)
|
|||
|
Proceeds from revolving facility
|
115.0
|
|
165.0
|
|
—
|
|
||||||
|
Repayments of revolving facility
|
(115.0
|
)
|
(165.0
|
)
|
—
|
|
||||||
|
Issuance of term facility
|
—
|
|
700.0
|
|
—
|
|
||||||
|
Settlement of second amended credit facility
|
—
|
|
(856.3
|
)
|
—
|
|
||||||
|
Proceeds from issuance of senior notes
|
—
|
|
800.0
|
|
—
|
|
||||||
|
Redemption of senior notes
|
—
|
|
(600.0
|
)
|
—
|
|
||||||
|
Payments of long-term debt
|
(35.5
|
)
|
(32.3
|
)
|
(47.0
|
)
|
||||||
|
Net (repayments of) proceeds from debt
|
(36.1
|
)
|
10.1
|
|
(64.4
|
)
|
||||||
|
Debt issuance costs
|
—
|
|
(9.5
|
)
|
(0.3
|
)
|
||||||
|
Redemption premium
|
—
|
|
(33.2
|
)
|
—
|
|
||||||
|
Dividends paid to ordinary shareholders
|
(79.4
|
)
|
(60.9
|
)
|
(46.0
|
)
|
||||||
|
Repurchase of ordinary shares
|
(67.3
|
)
|
(60.0
|
)
|
(85.1
|
)
|
||||||
|
Proceeds from shares issued under incentive plans
|
3.2
|
|
7.2
|
|
5.8
|
|
||||||
|
Other financing activities, net
|
(3.8
|
)
|
(4.6
|
)
|
(6.0
|
)
|
||||||
|
Net cash used in financing activities
|
(183.4
|
)
|
(150.9
|
)
|
(196.0
|
)
|
||||||
|
Effect of exchange rate changes on cash, cash equivalents and restricted cash
|
(6.2
|
)
|
7.7
|
|
(4.8
|
)
|
||||||
|
Net (decrease) increase in cash, cash equivalents and restricted cash
|
(175.6
|
)
|
153.8
|
|
112.7
|
|
||||||
|
Cash, cash equivalents and restricted cash – beginning of period
|
466.2
|
|
312.4
|
|
199.7
|
|
||||||
|
Cash, cash equivalents and restricted cash – end of period
|
$
|
290.6
|
|
$
|
466.2
|
|
$
|
312.4
|
|
|||
See accompanying notes to consolidated financial statements.
F-8
NOTES TO CONSOLIDATED FINANCIAL STATEMENTS
NOTE 1 – DESCRIPTION OF COMPANY AND BASIS OF PRESENTATION
Allegion plc, an Irish public limited company, and its consolidated subsidiaries ("Allegion" or "the Company") are a leading global company that provides security products and solutions that keep people safe, secure and productive. The Company makes the world safer as a company of experts, securing the places where people thrive. Allegion creates peace of mind by pioneering safety and security. The Company offers an extensive and versatile portfolio of mechanical and electronic security products across a range of market-leading brands including CISA®, Interflex®, LCN®, Schlage®, SimonsVoss® and Von Duprin®.
Basis of presentation:
The Consolidated Financial Statements were prepared in accordance with generally accepted accounting principles in the United States of America ("GAAP") as defined by the Financial Accounting Standards Board ("FASB") within the FASB Accounting Standards Codification ("ASC").
NOTE 2 – SUMMARY OF SIGNIFICANT ACCOUNTING POLICIES
A summary of significant accounting policies used in the preparation of the accompanying Consolidated Financial Statements follows:
Principles of Consolidation:
The Consolidated Financial Statements include all majority-owned subsidiaries of the Company. A noncontrolling interest in a subsidiary is considered an ownership interest in a majority-owned subsidiary that is not attributable to the parent. The Company includes noncontrolling interest as a component of Total equity in the Consolidated Balance Sheets and the Net earnings attributable to noncontrolling interests are presented as an adjustment from Net earnings used to arrive at Net earnings attributable to Allegion plc in the Consolidated Statements of Comprehensive Income.
Partially-owned equity affiliates generally represent 20-50% ownership interests in investments and where the Company demonstrates significant influence in investments but does not have a controlling financial interest. Partially-owned equity affiliates are accounted for under the equity method. The Company is also required to consolidate variable interest entities in which it bears a majority of the risk to the entities’ potential losses or stands to gain from a majority of the entities’ expected returns. Transactions between the Company and Ingersoll Rand and its affiliates are herein referred to as "related party" or "affiliated" transactions.
Use of Estimates:
The preparation of financial statements in conformity with GAAP requires management to make estimates and assumptions that affect the reported amounts of assets and liabilities and the disclosures of contingent assets and liabilities at the date of the financial statements as well as the reported amounts of revenues and expenses during the reporting period. Estimates are based on several factors including the facts and circumstances available at the time the estimates are made, historical experience, risk of loss, general economic conditions and trends and the assessment of the probable future outcome. Some of the more significant estimates include useful lives of property, plant and equipment and intangible assets, purchase price allocations of acquired businesses, valuation of assets including goodwill and other intangible assets, product warranties, sales allowances, pension plans, postretirement benefits other than pensions, taxes, environmental costs, product liability and other contingencies. Actual results could differ from those estimates. Estimates and assumptions are reviewed periodically, and the effects of changes, if any, are reflected in the Consolidated Statements of Comprehensive Income in the period that they are determined.
Currency Translation:
Assets and liabilities where the functional currency is not the U.S. dollar, have been translated at year-end exchange rates, and income and expense accounts have been translated using average exchange rates throughout the year. Adjustments resulting from the process of translating an entity’s financial statements into the U.S. dollar have been recorded in the Equity section of the Consolidated Balance Sheets within Accumulated other comprehensive loss.
Cash and Cash Equivalents:
Cash and cash equivalents include cash on hand, demand deposits and all highly liquid investments with original maturities at the time of purchase of three months or less.
Inventories
: Inventories are stated at the lower of cost and net realizable value using the first-in, first-out (FIFO) method.
Allowance for Doubtful Accounts
: The Company has provided for an allowance for doubtful accounts receivable, which represents the best estimate of probable loss inherent in the Company’s accounts receivable portfolio. Changes in the financial condition of customers or other unanticipated events, which may affect their ability to make payments, could result in charges for additional allowances exceeding the Company's estimates. The Company's estimates are influenced by the following considerations: a continuing credit evaluation of customers’ financial condition; trade accounts receivable aging; and historical loss experience. The Company has reserved $
3.3 million
and $
2.8 million
for doubtful accounts as of
December 31, 2018
and
2017
, respectively.
F-9
Property, Plant and Equipment:
Property, plant and equipment are stated at cost, less accumulated depreciation. Assets placed in service are recorded at cost and depreciated using the straight-line method over the estimated useful life of the asset except for leasehold improvements, which are depreciated over the shorter of their economic useful life or their lease term. The range of useful lives used to depreciate property, plant and equipment is as follows:
|
Buildings
|
10
|
to
|
50
|
years
|
|
Machinery and equipment
|
2
|
to
|
12
|
years
|
|
Software
|
2
|
to
|
7
|
years
|
Repair and maintenance costs that do not extend the useful life of the asset are charged against earnings as incurred. Major replacements and significant improvements that increase asset values and extend useful lives are capitalized.
The Company assesses the recoverability of the carrying value of its property, plant and equipment whenever events or changes in circumstances indicate that the carrying amount of the asset may not be recoverable. Recoverability is measured by a comparison of the carrying amount of an asset to the future net undiscounted cash flows expected to be generated by the asset. If the undiscounted cash flows are less than the carrying amount of the asset, an impairment loss is recognized for the amount by which the carrying value of the asset exceeds the fair value of the assets.
Goodwill and Intangible Assets:
The Company records as goodwill the excess of the purchase price of an acquired business over the fair value of the net assets acquired.
In accordance with GAAP, goodwill and other indefinite-lived intangible assets are tested and reviewed annually for impairment during the fourth quarter or whenever there is a significant change in events or circumstances that indicate that the fair value of the reporting unit or indefinite-lived intangible asset is more likely than not less than the carrying amount of the reporting unit or indefinite-lived intangible asset.
Recoverability of goodwill is measured at the reporting unit level. The carrying amount of the reporting unit is compared to its estimated fair value. If the estimated fair value of a reporting unit exceeds its carrying amount, goodwill of the reporting unit is not impaired. To the extent that the carrying value of the reporting unit exceeds its estimated fair value, a goodwill impairment charge will be recognized for the amount by which the carrying value of the reporting unit exceeds its fair value, not to exceed the carrying amount of goodwill. Estimated fair value of the Company's reporting units is based on two valuation techniques, a discounted cash flow model (income approach) and a market adjusted multiple of earnings and revenues (market approach), with each method being weighted in the calculation.
Recoverability of other intangible assets with indefinite useful lives (i.e. Trade names) is determined on a relief from royalty methodology, which is based on the implied royalty paid, at an appropriate discount rate, to license the use of an asset rather than owning the asset. The present value of the after-tax cost savings (i.e. royalty relief) indicates the estimated fair value of the asset. Any excess of the carrying value over the estimated fair value is recognized as an impairment loss equal to that excess.
Intangible assets such as patents, customer-related intangible assets and other intangible assets with finite useful lives are amortized on a straight-line basis over their estimated economic lives. The weighted-average useful lives approximate the following:
|
Customer relationships
|
20
|
years
|
|
Trade names (finite-lived)
|
25
|
years
|
|
Completed technology/patents
|
10
|
years
|
|
Other
|
25
|
years
|
Recoverability of intangible assets with finite useful lives is assessed in the same manner as property, plant and equipment as described above.
Income Taxes:
The calculation of the Company’s income taxes involves considerable judgment and the use of both estimates and allocations. Deferred tax assets and liabilities are determined based on temporary differences between financial reporting and tax bases of assets and liabilities, applying enacted tax rates expected to be in effect for the year in which the differences are expected to reverse. The Company recognizes future tax benefits, such as net operating losses and tax credits, to the extent that realizing these benefits is considered in its judgment to be more likely than not. The Company regularly reviews the recoverability of its deferred tax assets considering its historic profitability, projected future taxable income, timing of the reversals of existing temporary
F-10
differences and the feasibility of its tax planning strategies. Where appropriate, the Company records a valuation allowance with respect to future tax benefits.
Cash paid for income taxes, net of refunds, for the twelve months ended
December 31, 2018
and
2017
was
$101.7 million
and
$86.7 million
, respectively.
On December 22, 2017, the President of the United States signed comprehensive tax legislation commonly referred to as the Tax Cuts and Jobs Act (the “Tax Reform Act”), which is discussed in greater detail in Note 17. The Tax Reform Act includes a provision termed the global intangible low-taxed income ("GILTI"). The GILTI provisions will require the Company to include in its U.S. income tax return foreign subsidiary earnings in excess of an allowable return on the non-U.S. subsidiary's tangible assets. The Company has elected to account for GILTI tax in the period in which it is incurred.
Product Warranties:
Standard product warranty accruals are recorded at the time of sale and are estimated based upon product warranty terms and historical experience. The Company assesses the adequacy of its liabilities and will make adjustments as necessary based on known or anticipated warranty claims, or as new information becomes available. Refer to Note 20 for further details of product warranties.
Revenue Recognition:
Net revenues are recognized based on the satisfaction of performance obligations under the terms of a contract. A performance obligation is a promise in a contract to transfer control of a distinct product or to provide a service, or a bundle of products or services, to a customer, and is the unit of account under ASC 606. The Company has two principal revenue streams, tangible product sales and services. Approximately 99% of consolidated Net revenues involve contracts with a single performance obligation, which is the transfer of control of a product or bundle of products to a customer. Transfer of control typically occurs when goods are shipped from the Company's facilities or at other predetermined control transfer points (for instance, destination terms). Net revenues are measured as the amount of consideration the Company expects to receive in exchange for transferring control of the products and takes into account variable consideration, such as sales incentive programs, including discounts and volume rebates. The existence of these programs does not preclude revenue recognition but does require the Company's best estimate of the variable consideration to be made based on expected activity, as these items are reserved for as a deduction to Net revenues over time based on historical rates of providing these incentives and annual forecasted sales volumes.
The Company's remaining Net revenues involve services, including installation and consulting. Unlike the single performance obligation to ship a product or bundle of products, the service revenue stream delays revenue recognition until the service performance obligations are satisfied. In some instances, customer acceptance provisions are included in sales arrangements to give the buyer the ability to ensure the service meets the criteria established in the order. In these instances, revenue recognition is deferred until the performance obligations are satisfied, which could include acceptance terms specified in the arrangement being fulfilled through customer acceptance or a demonstration that established criteria have been satisfied.
The Company does not adjust the transaction price for the effects of a significant financing component, as the time period between control transfer of goods and services is less than one year. Sales, value-added and other similar taxes collected by the Company are excluded from Net revenues. The Company has also elected to account for shipping and handling activities that occur after control of the related goods transfers as fulfillment activities instead of performance obligations. The Company's payment terms are generally consistent with the industries in which their businesses operate.
Sales returns and customer disputes involving a question of quantity or price are accounted for as variable consideration, and therefore, as a reduction in revenue and a contra receivable. At
December 31, 2018
and
2017
, the Company had a customer claim accrual (contra receivable) of
$31.6 million
and
$32.5 million
, respectively. All other incentives or incentive programs where the customer is required to reach a certain level of purchases, remain a customer for a certain period, provide a rebate form or is subject to additional requirements are also considered variable consideration and are accounted for as a reduction of revenue and a liability. At
December 31, 2018
and
2017
, the Company had a sales incentive accrual of
$33.9 million
and
$31.8 million
, respectively. Variable consideration is estimated based on the most likely amount expected to be received from customers. Each of these accruals represents the Company’s best estimate of the most likely amount expected to be received from customers based on historical experience. These estimates are reviewed regularly for accuracy. If updated information or actual amounts are different from previous estimates, the revisions are included in the Company’s results for the period in which they become known. Historically, the aggregate differences, if any, between the Company’s estimates and actual amounts in any year have not had a material impact on the Consolidated Financial Statements. The Company also offers a standard warranty with most product sales, and the value of such warranty is included in the contractual price. The corresponding cost of the warranty obligation is accrued as a liability (see Note 20).
Environmental Costs:
The Company is subject to laws and regulations relating to protecting the environment. Environmental expenditures relating to current operations are expensed or capitalized as appropriate. Expenditures relating to existing conditions
F-11
caused by past operations, which do not contribute to current or future revenues, are expensed. Liabilities for remediation costs are recorded when they are probable and can be reasonably estimated, generally no later than the completion of feasibility studies or the Company’s commitment to a plan of action. The assessment of this liability, which is calculated based on existing technology, does not reflect any offset for possible recoveries from insurance companies and is not discounted. Refer to Note 20 for further details of environmental matters.
Research and Development Costs:
The Company conducts research and development activities for the purpose of developing and improving new products and services. These expenditures are expensed when incurred. For the years ended
December 31, 2018
,
2017
and
2016
, these expenditures amounted to approximately $
54.4 million
, $
48.3 million
and $
47.3 million
, respectively, and consist of salaries, wages, benefits, building costs and other overhead expenses.
Software Costs:
The Company capitalizes certain qualified internal-use software costs during the application development stage and subsequently amortizes those costs over the software's useful life, which ranges from
2
to
7
years.
Employee Benefit Plans
: The Company provides a range of benefits, including pensions, postretirement and postemployment benefits to eligible current and former employees. Determining the cost associated with such benefits is dependent on various actuarial assumptions, including discount rates, expected return on plan assets, compensation increases, employee mortality, turnover rates and healthcare cost trend rates. Actuaries perform the required calculations to determine expense in accordance with GAAP. Actual results may differ from the actuarial assumptions and are generally accumulated into Accumulated other comprehensive loss and amortized into Net earnings over future periods. The Company reviews its actuarial assumptions at each measurement date and makes modifications to the assumptions based on current rates and trends, if appropriate. Refer to Note 11
for further details on employee benefit plans.
Loss Contingencies:
Liabilities are recorded for various contingencies arising in the normal course of business, including litigation and administrative proceedings, environmental matters, product liability, product warranty, worker’s compensation and other claims. The Company has recorded reserves in the financial statements related to these matters, which are developed using inputs derived from actuarial estimates and historical and anticipated experience data depending on the nature of the reserve and, in certain instances, with consultation of legal counsel, internal and external consultants and engineers. Subject to the uncertainties inherent in estimating future costs for these types of liabilities, the Company believes its estimated reserves are reasonable and does not believe the final determination of the liabilities with respect to these matters would have a material effect on the financial condition, results of operations, liquidity or cash flows of the Company for any year. Refer to Note 20
for further details on loss contingencies.
Derivative Instruments:
The Company periodically enters into cash flow and other derivative transactions to specifically hedge exposure to various risks related to currency and interest rates. The Company recognizes all derivatives on the Consolidated Balance Sheets at their fair value as either assets or liabilities. For designated cash flow hedges, the changes in fair value of the derivative contract is recorded in Other comprehensive (loss) income, net of tax, and in Net earnings at the time earnings are affected by the hedged transaction. For other derivative transactions, the changes in the fair value of the derivative contract are immediately recognized in Net earnings. Refer to Note 10 for further details on derivative instruments.
Recent Accounting Pronouncements
Recently Adopted Accounting Pronouncements:
In May 2014, the FASB issued ASU 2014-09, "Revenue from Contracts with Customers" (ASC 606). ASC 606 is a single, comprehensive revenue recognition model for all contracts with customers. The model is based on changes in contract assets (rights to receive consideration) and liabilities (obligations to provide a good or perform a service). Revenue is recognized based on the satisfaction of performance obligations, which occurs when control of a good or service transfers to a customer. ASC 606 contains expanded disclosure requirements relating to the nature, amount, timing and uncertainty of revenue and cash flows arising from contracts with customers. ASC 606 allows entities to adopt the standard on either a full retrospective approach or report the cumulative effect as of the date of adoption ("modified retrospective method"). The FASB has also issued the following standards which clarify ASU 2014-09: ASU 2017-14, Revenue Recognition, Revenue from Contracts with Customers: Amendments to SEC Paragraphs Pursuant to Staff Accounting Bulletin No. 116 and SEC Release No. 33-10403, ASU 2017-13, Revenue Recognition, Revenue from Contracts with Customers: Amendments to SEC Paragraphs Pursuant to the Staff Announcement at the July 20, 2017 EITF Meeting and Rescission of Prior SEC Staff Announcements and Observer Comments, ASU 2016-20, Revenue from Contracts with Customers: Technical Corrections and Improvements, ASU 2016-12, Revenue from Contracts with Customers: Narrow-Scope Improvements and Practical Expedients and ASU 2016-10, Revenue from Contracts with Customers: Identifying Performance Obligations and Licensing. The Company adopted each of these standards (collectively, "ASC 606") on January 1, 2018 on a modified retrospective basis, which was applied to all contracts not completed as of January 1, 2018. The impact of
F-12
adopting ASC 606 was not material to the Company’s Consolidated Financial Statements at January 1, 2018, or for the year ended December 31, 2018, and no cumulative effect adjustment was recorded to opening Retained earnings. Expanded disclosure as required by the new standards is presented within Note 19.
In January 2016, the FASB issued ASU 2016-01, “Financial Instruments—Overall (Subtopic 825-10): Recognition and Measurement of Financial Assets and Liabilities.” The new guidance revises the accounting related to unconsolidated equity investments, other than those accounted for under the equity method. The new guidance requires the fair value measurement of investments in unconsolidated equity securities that are not accounted for under the equity method through the statement of comprehensive income. Entities will no longer be able to apply the cost method of accounting for equity securities that do not have readily determinable fair values. Instead, for these types of equity investments, entities may measure the investment at cost less impairment plus or minus observable price changes (in orderly transactions). This ASU was effective for the Company on January 1, 2018. The adoption of ASU 2016-01 did not have a material impact on the Consolidated Financial Statements.
In August 2016, the FASB issued ASU 2016-15, "Statement of Cash Flows (Topic 230): Clarification of Certain Cash Receipts and Cash Payments." ASU 2016-15 eliminates the diversity in practice related to the classification of certain cash receipts and payments in the statement of cash flows by adding or clarifying guidance on eight specific cash flow issues. The ASU is effective for annual and interim reporting periods beginning after December 15, 2017, and as such, the Company adopted ASU 2016-15 on January 1, 2018. The amendments in this update are required to be applied retrospectively to all periods presented. The adoption of ASU 2016-15 did not have a material impact on the Consolidated Financial Statements.
In November 2016, the FASB issued ASU 2016-18, "Statement of Cash Flows (Topic 230): Restricted Cash." ASU 2016-18 requires that a statement of cash flows explain the change during the period in the total of cash, cash equivalents and amounts generally described as restricted cash or restricted cash equivalents. Therefore, amounts generally described as restricted cash and restricted cash equivalents should be included with cash and cash equivalents when reconciling the beginning of period and end of period total amounts shown on the statement of cash flows. ASU 2016-18 is effective for annual and interim reporting periods beginning after December 15, 2017, and as such, the Company adopted ASU 2016-18 on January 1, 2018. The adoption of ASU 2016-18 did not have a material impact on the Consolidated Financial Statements.
In January 2017, the FASB issued ASU 2017-01, "Business Combinations (Topic 805): Clarifying the Definition of a Business." This update provides guidance to assist companies in evaluating whether transactions should be accounted for as acquisitions (or disposals) of assets or businesses. The update provides a more robust framework to use in determining when a set of transferred assets and activities is a business. This ASU is effective for annual and interim reporting periods beginning after December 15, 2017, and requires prospective adoption. The Company adopted ASU 2017-01 on January 1, 2018. The adoption of ASU 2017-01 did not have a material impact on the Consolidated Financial Statements.
In March 2017, the FASB issued ASU 2017-07, "Compensation—Retirement Benefits (Topic 715): Improving the Presentation of Net Periodic Pension Cost and Net Periodic Postretirement Benefit Cost." ASU 2017-07 requires that an employer report the service cost component in the same line item or items as other compensation costs arising from services rendered by the pertinent employees during the period. The other components of net benefit cost are required to be presented in the statement of comprehensive income separately from the service cost component and outside a subtotal of operating income. ASU 2017-07 also allows only the service cost component to be eligible for capitalization when applicable (for example, as a cost of internally manufactured inventory or a self-constructed asset). The ASU is effective for annual periods beginning after December 15, 2017, and as such, the Company adopted ASU 2017-07 on January 1, 2018. The Company has applied ASU 2017-07 retrospectively for the presentation of the service cost component and the other components of net periodic pension cost and net periodic postretirement benefit cost in the Consolidated Statements of Comprehensive Income and prospectively for the capitalization of the service cost component of net periodic pension cost and net periodic postretirement benefit in the Consolidated Balance Sheets. Accordingly, for all periods presented in the Consolidated Financial Statements, the service cost component of net periodic pension benefit cost (income) is recorded in Cost of goods sold and Selling and administrative expenses within the Consolidated Statements of Comprehensive Income. The remaining components of net periodic pension benefit cost (income) are recorded within Other income, net. The adoption of ASU 2017-07 did not have a material impact on the Consolidated Financial Statements.
In August 2017, the FASB issued ASU 2017-12, "Derivatives and Hedging (Topic 815): Targeted Improvements to Accounting for Hedging Activities." ASU 2017-12 addresses previous limitations on how an entity can designate the hedged risk in certain cash flow and fair value hedging relationships by expanding and refining hedge accounting for both nonfinancial and financial risk components and aligning the recognition and presentation of the effects of the hedging instrument and the hedged item in the financial statements. The ASU is effective for annual periods beginning after December 15, 2018, with early adoption permitted. The Company elected to early adopt the provisions of ASU 2017-12 on January 1, 2018. The amendments in this update have been applied to hedging relationships existing on the date of adoption. In October 2018, the FASB issued ASU 2018-16, "Derivatives and Hedging (Topic 815): Inclusion of the Secured Overnight Financing Rate (SOFR) Overnight Index Swap (OIS) Rate as a
F-13
Benchmark Interest Rate for Hedge Accounting Purposes." ASU 2018-16 slightly amended ASU 2017-12 to allow for the use of the SOFR OIS as a benchmark interest rate for hedge accounting purposes, in addition to the previously allowable benchmark interest rates. As the Company had previously adopted ASU 2017-12, ASU 2018-16 was effective for the Company upon release by the FASB. The adoptions of both ASU 2017-12 and ASU 2018-16 did not have a material impact on the Consolidated Financial Statements.
In February 2018, the FASB issued ASU 2018-02, "Income Statement-Reporting Comprehensive Income (Topic 220): Reclassification of Certain Tax Effects from Accumulated Other Comprehensive Income." The new guidance permits entities to reclassify tax effects stranded in accumulated other comprehensive income (AOCI) as a result of the Tax Reform Act. ASU 2018-02 provides this option not only for the impact to deferred tax assets and liabilities due to the reduction in the U.S. tax rate, but also for tax effects stranded in AOCI for other reasons specific to the Tax Reform Act, such as state taxes or transitioning to a territorial tax system. Tax effects that are stranded in AOCI for reasons not relating to the Tax Reform Act may not be reclassified under ASU 2018-02. This ASU is effective for fiscal years beginning after December 15, 2018, and interim periods within those fiscal years. Early adoption is permitted. Entities that adopt the ASU in an annual or interim period after the period of enactment are able to choose whether to apply the amendments retrospectively to each period in which the effect of the Tax Reform Act is recognized or to apply the amendments in the period of adoption. The Company has elected to early adopt ASU 2018-02 on December 31, 2018, and to apply the amendments in the year ended December 31, 2018. The impact of adoption resulted in a reclassification of
$9.7 million
of tax effects stranded in AOCI into Retained earnings.
In August 2018, the FASB issued ASU 2018-13, "Fair Value Measurement (Topic 820): Disclosure Framework—Changes to the Disclosure Requirements for Fair Value Measurement." The new guidance modifies the disclosure requirements related to fair value measurements in Topic 820, Fair Value Measurement, including removing certain previous disclosure requirements, adding certain new disclosure requirements and modifying certain other disclosure requirements. The ASU will be effective for fiscal years beginning after December 15, 2019, including interim periods within those fiscal years. Early adoption is permitted. The Company elected to early adopt ASU 2018-13 on October 1, 2018. The adoption of ASU 2018-13 did not have a material impact on the Consolidated Financial Statements.
In August 2018, the FASB issued ASU 2018-14, "Compensation—Retirement Benefits—Defined Benefit Plans—General (Subtopic 715-20): Disclosure Framework—Changes to the Disclosure Requirements for Defined Benefit Plans." The new guidance modifies the disclosure requirements for employers that sponsor defined benefit pension or other postretirement plans, including removing certain previous disclosure requirements, adding certain new disclosure requirements, and clarifying certain other disclosure requirements. The ASU will be effective for fiscal years beginning after December 15, 2020, including interim periods within those fiscal years. Early adoption is permitted. The Company elected to early adopt ASU 2018-14 on October 1, 2018. The adoption of ASU 2018-14 did not have a material impact on the Consolidated Financial Statements.
Recently Issued Accounting Pronouncements:
In February 2016, the FASB issued ASU 2016-02, "Leases (Topic 842)." ASU 2016-02 requires the identification of arrangements that should be accounted for as leases. In general, for lease arrangements exceeding a twelve-month term, these arrangements will be recognized as assets and liabilities on the balance sheet of the lessee. Under ASU 2016-02, a right-of-use asset and lease obligation will be recorded for all leases, whether operating or financing, while the income statement will reflect lease expense for operating leases and amortization/interest expense for financing leases. In July 2018, the FASB issued ASU 2018-10, "Codification Improvements to Topic 842 (Leases)", which provides narrow amendments to clarify how to apply certain aspects of ASU 2016-02, and ASU 2018-11, "Leases (Topic 842): Targeted Improvements", which provides an additional transition method by allowing entities to initially apply ASU 2016-02, and subsequent related standards, at the adoption date and recognize a cumulative-effect adjustment to the opening balance of retained earnings in the period of adoption. These ASUs (collectively “ASC 842”) are effective for annual periods beginning after December 15, 2018, and interim periods within those annual periods. The Company adopted ASC 842 on January 1, 2019 utilizing the transition method allowed per ASU 2018-11, and accordingly, comparative period financial information will not be adjusted for the effects of adopting ASC 842. No cumulative-effect adjustment was required to the opening balance of retained earnings on the adoption date. The Company has substantially completed an assessment of the new standard’s impact and determined the new standards will not have a material impact on the Company's Consolidated Statements of Comprehensive Income or Cash Flows; however, the estimated impact of adopting ASC 842 will result in a right-of-use (ROU) asset and lease liability being recorded on the Consolidated Balance Sheets subsequent to December 31, 2018 in the range of approximately
$80
-
90
million, based on the lease portfolio existing as of this date. While the ROU asset will be classified as a noncurrent asset, approximately one-third of the lease liability amount is expected to be classified as a current liability, with the remainder being classified as noncurrent.
The Company has also made updates to its systems, policies, and internal controls over financial reporting in preparation of adopting these standards on January 1, 2019.
F-14
Upon adoption of ASC 842, the Company utilized the following elections and practical expedients:
|
•
|
The Company has elected to not separate non-lease components from lease components and instead to account for each separate lease component and the non-lease components associated with that lease component as a single lease component.
|
|
•
|
If at the lease commencement date, a lease has a lease term of 12 months or less and does not include a purchase option that is reasonably certain to exercise, the Company will elect not to apply ASC 842 recognition requirements. Nonetheless, the Company intends to include leases of less than 12 months within the updated footnote disclosures, if material.
|
|
•
|
If the Company enters into a large number of leases in the same month with the same terms and conditions, these will be looked at as a group (portfolio) assuming the lease model under this approach will not materially differ from applying to each individual lease.
|
|
•
|
As the Company has applied the new transition method allowed per ASU 2018-11, the Company has elected to not reassess arrangements entered into prior than January 1, 2019 for whether an arrangement is or contains a lease, the lease classification applied or to separate initial direct costs.
|
|
•
|
The Company has elected to use hindsight in determining the lease term for lease contracts that have historically been renewed or amended.
|
The Company has no significant lease agreements in place for which the Company is a lessor, and substantially all of the Company’s leases for which the Company is a lessee are classified as operating leases under the existing guidance in ASC 840 as of December 31, 2018. As such, due to the practical expedient election to not reassess lease classification, substantially all the Company's leases will continue to be classified as operating leases under ASC 842. When available, the Company will utilize the rate implicit in the lease as the discount rate to determine the lease liability in accordance with ASC 842. However, if this rate is not available, the Company will use its incremental borrowing rate as the discount rate, which is the rate, at inception of the lease, the Company would incur to borrow over a similar term the funds needed to purchase the leased asset. As a lessee, the Company categorizes its leases into two general categories: real estate leases and equipment leases.
The Company’s real estate lease portfolio includes leased production and assembly facilities, warehouses and distribution centers, office space and to a lesser degree, employee housing. The terms and conditions of real estate leases can vary significantly from lease to lease. The Company has assessed the specific terms and conditions of each real estate lease to determine the amount of the lease payments and the length of the lease term, which includes the minimum period over which lease payments are required plus any renewal options that are both within the Company's control to exercise and reasonably certain of being exercised upon lease commencement. In determining whether or not a renewal option is reasonably certain of being exercised, the Company assesses all relevant factors to determine if sufficient incentives exist as of lease commencement to conclude renewal is reasonably certain. There are no material residual value guarantees provided by the Company, nor any restrictions or covenants imposed by the real estate leases to which the Company is a party. In determining the lease liability, the Company utilizes its incremental borrowing rate to discount the future lease payments over the lease term to present value. As of December 31, 2018, the weighted-average remaining term of the Company’s real estate lease portfolio was approximately
7.1
years.
The Company’s equipment leases include vehicles, material handling equipment, other machinery and equipment utilized in the Company's production and assembly facilities, warehouses and distribution centers, laptops and other IT equipment, as well as other miscellaneous leased equipment. Most of the equipment leases are for terms ranging from two to five years, although terms and conditions can vary from lease to lease. The Company has applied similar estimates and judgments to its equipment lease portfolio as it has to its real estate lease portfolio in adopting ASC 842. There are no material residual value guarantees provided by the Company, nor any restrictions or covenants imposed by the equipment leases to which the Company is a party. In determining the lease liability, the Company utilizes its incremental borrowing rate to discount the future lease payments over the lease term to present value. As of December 31, 2018, the weighted-average remaining term of the Company’s equipment lease portfolio was approximately
2.3
years.
In June 2016, the FASB issued ASU 2016-13, "Financial Instruments—Credit Losses (Topic 326): Measurement of Credit Losses on Financial Instruments." In November 2018, the FASB issued ASU 2018-19, "Codification Improvements to Topic 326, Financial Instruments—Credit Losses". The new guidance introduces an approach based on expected losses to estimate credit losses on certain types of financial instruments. These ASUs will be effective for fiscal years beginning after December 15, 2019, including interim periods within those fiscal years. Early adoption is permitted. The Company is assessing what impact ASU 2016-13 will have on the Consolidated Financial Statements.
In August 2018, the FASB issued ASU 2018-15, "Intangibles—Goodwill and Other—Internal-Use Software (Subtopic 350-40): Customer's Accounting for Implementation Costs Incurred in a Cloud Computing Arrangement That Is a Service Contract." The
F-15
new guidance aligns the requirements for capitalizing implementation costs incurred in a cloud-based hosting arrangement that is a service contract with the requirements for capitalizing implementation costs incurred to develop or obtain internal-use software (and hosting arrangements that include an internal-use software license). The ASU will be effective for fiscal years beginning after December 15, 2019, including interim periods within those fiscal years. Early adoption is permitted. The Company is assessing what impact ASU 2018-15 will have on the Consolidated Financial Statements.
NOTE 3 – INVENTORIES
Inventories are stated at the lower of cost and net realizable value using the first-in, first-out (FIFO) method.
At December 31, the major classes of inventory were as follows:
|
In millions
|
2018
|
2017
|
||||||
|
Raw materials
|
$
|
117.2
|
|
$
|
66.6
|
|
||
|
Work-in-process
|
34.4
|
|
29.8
|
|
||||
|
Finished goods
|
128.7
|
|
143.4
|
|
||||
|
Total
|
$
|
280.3
|
|
$
|
239.8
|
|
||
NOTE 4 – PROPERTY, PLANT AND EQUIPMENT
At December 31, the major classes of property, plant and equipment were as follows:
|
In millions
|
2018
|
2017
|
||||||
|
Land
|
$
|
15.6
|
|
$
|
16.0
|
|
||
|
Buildings
|
148.4
|
|
142.2
|
|
||||
|
Machinery and equipment
|
407.7
|
|
383.9
|
|
||||
|
Software
|
146.0
|
|
141.4
|
|
||||
|
Construction in progress
|
31.1
|
|
24.4
|
|
||||
|
748.8
|
|
707.9
|
|
|||||
|
Accumulated depreciation
|
(472.1
|
)
|
(455.7
|
)
|
||||
|
Total
|
$
|
276.7
|
|
$
|
252.2
|
|
||
Depreciation expense for the years ended
December 31, 2018
,
2017
and
2016
was
$46.2 million
,
$40.0 million
and
$40.9 million
, which includes amounts for software amortization of
$15.4 million
,
$14.3 million
and
$16.6 million
, respectively.
NOTE 5 – GOODWILL
The Company records as goodwill the excess of the purchase price over the fair value of the net assets acquired. Once the final valuation has been performed for each acquisition, adjustments may be recorded. The changes in the carrying amount of Goodwill are as follows:
|
In millions
|
Americas
|
EMEIA
|
Asia Pacific
|
Total
|
||||||||||||
|
December 31, 2016 (gross)
|
$
|
372.9
|
|
$
|
736.1
|
|
$
|
93.3
|
|
$
|
1,202.3
|
|
||||
|
Accumulated impairment *
|
—
|
|
(478.6
|
)
|
(6.9
|
)
|
(485.5
|
)
|
||||||||
|
December 31, 2016 (net)
|
372.9
|
|
257.5
|
|
86.4
|
|
716.8
|
|
||||||||
|
Acquisitions and settlements
|
2.3
|
|
(1.6
|
)
|
1.3
|
|
2.0
|
|
||||||||
|
Currency translation
|
—
|
|
35.3
|
|
7.1
|
|
42.4
|
|
||||||||
|
December 31, 2017 (net)
|
375.2
|
|
291.2
|
|
94.8
|
|
761.2
|
|
||||||||
|
Acquisitions and settlements
|
111.1
|
|
10.2
|
|
20.5
|
|
141.8
|
|
||||||||
|
Currency translation
|
(0.2
|
)
|
(12.9
|
)
|
(6.9
|
)
|
(20.0
|
)
|
||||||||
|
December 31, 2018 (net)
|
$
|
486.1
|
|
$
|
288.5
|
|
$
|
108.4
|
|
$
|
883.0
|
|
||||
* Accumulated impairment consists of charges of
$137.6 million
(EMEIA),
$341.0 million
(EMEIA) and
$6.9 million
(Asia Pacific).
F-16
NOTE 6 – INTANGIBLE ASSETS
The following table sets forth the gross amount and related accumulated amortization of the Company’s intangible assets at December 31:
|
2018
|
2017
|
|||||||||||||||||||||||
|
In millions
|
Gross carrying amount
|
Accumulated amortization
|
Net carrying amount
|
Gross carrying amount
|
Accumulated amortization
|
Net carrying amount
|
||||||||||||||||||
|
Completed technologies/patents
|
$
|
59.4
|
|
$
|
(14.2
|
)
|
$
|
45.2
|
|
$
|
32.6
|
|
$
|
(10.0
|
)
|
$
|
22.6
|
|
||||||
|
Customer relationships
|
419.3
|
|
(88.5
|
)
|
330.8
|
|
324.5
|
|
(74.1
|
)
|
250.4
|
|
||||||||||||
|
Trade names (finite-lived)
|
84.9
|
|
(47.4
|
)
|
37.5
|
|
89.0
|
|
(46.1
|
)
|
42.9
|
|
||||||||||||
|
Other
|
9.5
|
|
(6.5
|
)
|
3.0
|
|
7.9
|
|
(4.9
|
)
|
3.0
|
|
||||||||||||
|
Total finite-lived intangible assets
|
573.1
|
|
$
|
(156.6
|
)
|
416.5
|
|
454.0
|
|
$
|
(135.1
|
)
|
318.9
|
|
||||||||||
|
Trade names (indefinite-lived)
|
130.6
|
|
130.6
|
|
75.4
|
|
75.4
|
|
||||||||||||||||
|
Total
|
$
|
703.7
|
|
$
|
547.1
|
|
$
|
529.4
|
|
$
|
394.3
|
|
||||||||||||
The Company amortizes intangible assets with finite useful lives on a straight-line basis over their estimated economic lives in accordance with GAAP. Indefinite-lived intangible assets are not subject to amortization, but instead are tested for impairment at least annually (more frequently if certain indicators are present).
Intangible asset amortization expense for
2018
,
2017
and
2016
was $
36.3 million
, $
22.1 million
and $
20.5 million
, respectively. As discussed further in Note 7, intangible asset amortization expense for
2018
included the amortization of approximately
$6 million
of backlog revenue that was acquired during a business combination in the first quarter of
2018
. This acquired backlog revenue was fully amortized as of June 30, 2018. Future estimated amortization expense on existing intangible assets in each of the next five years amounts to approximately $
28.4 million
for 2019, $
28.4 million
for 2020, $
28.4 million
for 2021, $
28.4 million
for 2022 and $
28.2 million
for 2023.
In accordance with the Company’s indefinite-lived intangible asset impairment testing policy outlined in Note 2, the Company performs its annual impairment test in the fourth quarter of each year. In each of the past three years, the Company determined the fair value of all indefinite-lived intangible assets exceeded their respective carrying values. Therefore, no impairment charges were recorded during
2018
,
2017
or
2016
.
NOTE 7 - ACQUISITIONS
2018
During the year ended
December 31, 2018
, the Company completed six acquisitions:
|
Business
|
Date
|
|
|
Technical Glass Products, Inc. ("TGP")
|
January 2018
|
|
|
Hammond Enterprises, Inc. ("Hammond")
|
January 2018
|
|
|
Qatar Metal Industries LLC ("QMI")
|
February 2018
|
|
|
AD Systems, Inc. ("AD Systems")
|
March 2018
|
|
|
Gainsborough Hardware and API Locksmiths ("Door and Access Systems")
|
July 2018
|
|
|
ISONAS Security Systems, Inc. ("ISONAS")
|
July 2018
|
|
In January 2018, the Company acquired 100% of TGP through one of its subsidiaries. TGP provides fire-rated architectural glass and framing solutions for commercial buildings, as well as non-fire rated architectural glass and framing, including channel glass systems and curtain walls throughout the U.S., Canada and select markets in the Middle East. TGP has been integrated into the Company's Americas and EMEIA segments.
In January 2018, the Company acquired 100% of the machinery, equipment and intellectual property of a division of Hammond through one of its subsidiaries. The assets acquired have been integrated into the Company's existing production facilities and are specific to the Company's Schlage-branded products.
F-17
In February 2018, the Company acquired 100% of QMI through one of its subsidiaries. QMI specializes in fire rated and non-fire rated steel and wooden doors, acoustic doors, wooden cabinets and access panels in the Middle East and Africa. QMI has been integrated into the Company's EMEIA segment.
In March 2018, the Company acquired 100% of AD Systems through one of its subsidiaries. AD Systems designs and manufactures high-performance interior and storefront door systems, specializing in sliding and acoustic solutions. AD Systems' portfolio includes sliding and swinging doors, perimeter frames, door hardware, gasketing, seals and sidelite panels. AD Systems has been integrated into the Company's Americas segment.
In July 2018, the Company acquired Door and Access Systems, based in Australia, through one of its subsidiaries. This business includes the brands Gainsborough Hardware, the market-leading residential door hardware brand in Australia, and API Locksmiths, which serves the Australian market with its keying, installation and access control services. Door and Access Systems has been integrated into the Company's Asia Pacific segment.
In July 2018, the Company acquired 100% of ISONAS through one of its subsidiaries. ISONAS designs and manufactures edge-computing technology that produces Power over Ethernet access control solutions for non-residential end-markets. ISONAS has been integrated into the Company's Americas segment.
Total consideration paid for these six acquisitions to date was approximately
$368 million
(net of cash acquired). The Company estimates the fair value of future consideration to be paid, including contingent consideration, to be approximately
$6 million
. Cash on hand and
$75 million
of borrowings on the Revolving Facility, which has since been repaid, were utilized to fund these acquisitions. The allocation of the aggregate purchase price to assets acquired and liabilities assumed is complete as of
December 31, 2018
, for the Company's acquisitions of TGP, Hammond, QMI and AD Systems; however, such allocation is still preliminary as of
December 31, 2018
, for the acquisitions of Door and Access Systems and ISONAS pending completion of final valuations.
The preliminary allocation of the aggregate purchase price to assets acquired and liabilities assumed for all six acquisitions described above is as follows:
|
In millions
|
|||
|
Accounts receivable, net
|
$
|
28.9
|
|
|
Inventories
|
28.5
|
|
|
|
Other current assets
|
1.3
|
|
|
|
Property, plant and equipment, net
|
27.6
|
|
|
|
Goodwill
|
141.8
|
|
|
|
Intangible assets, net
|
204.3
|
|
|
|
Other noncurrent assets
|
—
|
|
|
|
Accounts payable
|
(11.1
|
)
|
|
|
Accrued expenses and other current liabilities
|
(35.7
|
)
|
|
|
Other noncurrent liabilities
|
(11.1
|
)
|
|
|
Total consideration
|
$
|
374.5
|
|
Intangible assets are primarily comprised of approximately
$59 million
of indefinite-lived trade names,
$112 million
of customer relationships and
$33 million
of completed technologies and other intangibles, which includes approximately
$6 million
of acquired backlog revenue. The customer relationships have a 17-year weighted-average useful life, while the completed technologies and other intangibles, excluding the backlog revenue, have a 16-year weighted-average useful life. The backlog revenue was fully amortized as of June 30, 2018.
Goodwill results from several factors including Allegion-specific synergies that were excluded from the cash flow projections used in the valuation of intangible assets and intangible assets that do not qualify for separate recognition, for example, assembled workforce. The majority of the goodwill is expected to be deductible for tax purposes. All of the six acquisitions discussed above are accounted for as business combinations.
The following unaudited pro forma financial information for the years ended
December 31, 2018
and
2017
reflects the consolidated results of operations of the Company as if these acquisitions had taken place on January 1, 2017:
F-18
|
In millions, except per share amounts
|
2018
|
2017
|
||||||
|
Net revenues
|
$
|
2,774.2
|
|
$
|
2,612.1
|
|
||
|
Net earnings attributable to Allegion plc
|
$
|
446.8
|
|
$
|
256.9
|
|
||
|
Basic net earnings per share
|
$
|
4.70
|
|
$
|
2.70
|
|
||
|
Diluted net earnings per share
|
$
|
4.67
|
|
$
|
2.68
|
|
||
The unaudited pro forma financial information is presented for informational purposes only and does not purport to be indicative of results of operations that would have occurred had the pro forma events taken place on the date indicated or the future consolidated results of operations of the combined company. The unaudited pro forma financial information has been calculated after applying the Company's accounting policies and adjusting the historical financial results to reflect additional items directly attributable to the acquisitions that would have been incurred assuming the acquisitions had occurred on January 1, 2017. Adjustments to historical financial information include additional amortization of approximately
$9.7 million
(net of tax) included in the year ended December 31, 2017, in the pro forma table above. Approximately
$3.9 million
(net of tax) of this additional amortization relates to backlog revenue acquired by the Company, which was recorded in Cost of goods sold.
The following financial information reflects Net revenues and Loss before income taxes of the acquisitions for the year ended December 31, 2018 since their respective acquisition dates included in the Consolidated Statement of Comprehensive Income:
|
In millions
|
2018
|
|||
|
Net revenues
|
$
|
160.2
|
|
|
|
Loss before income taxes
|
$
|
(3.2
|
)
|
|
During the year ended
December 31, 2018
, the Company incurred
$10.0 million
of acquisition and integration related expenses, which are included in Selling and administrative expenses in the Consolidated Statement of Comprehensive Income.
During the year ended
December 31, 2018
, the Company also made
$8 million
of equity method investments in three entities, Yonomi Inc., a U.S. based mobile application and cloud platform provider for connected living, Nuki GmbH, a European retrofit residential smart lock innovator, and Conneqtech, a European based IoT platform developer specializing in connected mobility and tracking features for bicycles and healthcare.
2017
In January 2017, the Company acquired Republic Doors & Frames, LLC ("Republic") through one of its subsidiaries. During the year ended December 31, 2017 the Company incurred
$4.7 million
of acquisition and integration related costs, which are included in Selling and administrative expenses in the Consolidated Statement of Comprehensive Income.
2016
In June 2016, the Company acquired 100% of Trelock GmbH, a portable safety and security provider, and certain affiliated companies. Acquisition and integration related costs were not material to the 2016 Consolidated Statement of Comprehensive Income.
NOTE 8 - DIVESTITURES
As previously disclosed, the Company sold a majority stake of Bocom Wincent Technologies Co., Ltd. ("Systems Integration") in the fourth quarter of 2015. Under the terms of the transaction, the Company was to receive consideration of up to
$75.0 million
based on the future cash collection performance of Systems Integration and additional payments of approximately
$8.3 million
related to working capital transferred with the sale. During the third quarter of 2016 the receivable was considered impaired, as it was determined that certain unfavorable events occurred related to the Systems Integration business requiring an impairment of the original consideration and working capital transfer amounts that were recorded at the time of the sale. A charge of
$81.4 million
(net of tax) was recorded. The total charge of
$84.4 million
was recorded within Loss on divestitures within the Consolidated Statement of Comprehensive Income for the twelve months ended December 31, 2016.
F-19
NOTE 9 – DEBT AND CREDIT FACILITIES
At December 31, long-term debt and other borrowings consisted of the following:
|
In millions
|
2018
|
2017
|
|||||
|
Term Facility
|
$
|
656.3
|
|
$
|
691.3
|
|
|
|
Revolving Facility
|
—
|
|
—
|
|
|||
|
3.200% Senior Notes due 2024
|
400.0
|
|
400.0
|
|
|||
|
3.550% Senior Notes due 2027
|
400.0
|
|
400.0
|
|
|||
|
Other debt
|
1.2
|
|
1.0
|
|
|||
|
Total borrowings outstanding
|
1,457.5
|
|
1,492.3
|
|
|||
|
Less discounts and debt issuance costs, net
|
(12.7
|
)
|
(15.0
|
)
|
|||
|
Total debt
|
1,444.8
|
|
1,477.3
|
|
|||
|
Less current portion of long-term debt
|
35.3
|
|
35.0
|
|
|||
|
Total long-term debt
|
$
|
1,409.5
|
|
$
|
1,442.3
|
|
|
Unsecured Credit Facilities
As of
December 31, 2018
, the Company has an unsecured Credit Agreement in place that provides for up to
$1,200.0 million
in unsecured financing, consisting of a
$700.0 million
term loan facility (the “Term Facility”) and a
$500.0 million
revolving credit facility (the “Revolving Facility” and, together with the Term Facility, the “Credit Facilities”). The Credit Facilities mature on September 12, 2022 and are unconditionally guaranteed jointly and severally on an unsecured basis by the Company and Allegion US Holding Company Inc. ("Allegion US Hold Co"), the Company's wholly-owned subsidiary.
The Term Facility amortizes in quarterly installments at the following rates:
1.25%
per quarter starting December 31, 2017 through December 31, 2020,
2.5%
per quarter from March 31, 2021 through June 30, 2022, with the balance due on September 12, 2022. The Company may voluntarily prepay outstanding amounts under the Term Facility at any time without premium or penalty, subject to customary breakage costs. Amounts borrowed under the Term Facility that are repaid may not be reborrowed. The Company repaid
$35.0 million
of principal on its Term Facility during 2018.
The Revolving Facility provides aggregate commitments of up to
$500.0 million
, which includes up to
$100.0 million
for the issuance of letters of credit. At
December 31, 2018
, there were no borrowings outstanding on the Revolving Facility and the Company had
$17.1 million
of letters of credit outstanding. Commitments under the Revolving Facility may be reduced at any time without premium or penalty, and amounts repaid may be reborrowed. The Company pays certain fees with respect to the Revolving Facility, including an unused commitment fee on the undrawn portion of the Revolving Facility of between
0.125%
and
0.200%
per year, depending on the Company's credit rating, as well as certain other fees.
Outstanding borrowings under the Credit Facilities accrue interest at the option of the Company of (i) a LIBOR rate plus the applicable margin or (ii) a base rate plus the applicable margin. The applicable margin ranges from
1.125%
to
1.500%
depending on the Company's credit ratings. At
December 31, 2018
, the outstanding borrowings under the Term Facility accrue interest at LIBOR plus a margin of
1.250%
. To manage the Company's exposure to fluctuations in LIBOR rates, the Company has interest rate swaps to fix the interest rate for
$250.0 million
of the outstanding borrowings (see Note 10).
The Credit Facilities contain negative and affirmative covenants and events of default that, among other things, limit or restrict the Company's ability to enter into certain transactions. In addition, the Credit Facilities require the Company to comply with a maximum leverage ratio and a minimum interest expense coverage ratio, as defined within the agreement. As of
December 31, 2018
, the Company was in compliance with all covenants.
Senior Notes
As of
December 31, 2018
, Allegion US Hold Co has
$400.0 million
outstanding of its
3.200%
Senior Notes due 2024 (the “3.200% Senior Notes”) and
$400.0 million
outstanding of its
3.550%
Senior Notes due 2027 (the “3.550% Senior Notes” and, together with the 3.200% Senior Notes, the “Notes”), both of which were issued on October 2, 2017. The Notes require semi-annual interest payments on April 1 and October 1 of each year and will mature on October 1, 2024 and October 1, 2027, respectively.
F-20
The Notes are senior unsecured obligations of Allegion US Hold Co and rank equally with all of Allegion US Hold Co’s existing and future senior unsecured and unsubordinated indebtedness. The guarantee of the Notes is the senior unsecured obligation of the Company and ranks equally with all of the Company's existing and future senior unsecured and unsubordinated indebtedness.
2017 Refinancing
The Company entered into the Credit Agreement on September 12, 2017. The initial proceeds of
$700.0 million
from the Term Facility, along with initial borrowings of
$165.0 million
under the Revolving Facility, were used primarily to repay in full the outstanding borrowing under the Company’s previously outstanding secured credit facility, the Second Amended and Restated Credit Agreement, dated as of September 30, 2015. All obligations under the Second Amended and Restated Credit Agreement were satisfied, all commitments thereunder were terminated, and all guarantees and security interests that had been granted in connection therewith were released.
On October 3, 2017, Allegion US Hold Co used the net proceeds from the Notes to redeem in full the previously outstanding
$300.0 million
Senior Notes due 2021 and
$300.0 million
Senior Notes due 2023, as well as to repay in full the borrowings under the Revolving Facility and other costs associated with the refinancing.
Related to the 2017 refinancing activities, the Company recorded a
$33.2 million
charge for the redemption premiums associated with the Senior Notes due 2021 and 2023, non-cash charges of
$9.9 million
related to the write-off of previously deferred financing costs and
$1.6 million
of third party costs. These charges were all recorded within Interest expense in the Consolidated Statement of Comprehensive Income for the year ended December 31, 2107. The Company also incurred and deferred
$10.8 million
of discounts and financing costs associated with the new debt, which is being amortized to Interest expense over the terms of the respective debt.
Future Repayments
Scheduled principal repayments on indebtedness as of
December 31, 2018
are as follows:
|
In millions
|
|
||
|
2019
|
$
|
35.3
|
|
|
2020
|
35.0
|
|
|
|
2021
|
70.0
|
|
|
|
2022
|
516.3
|
|
|
|
2023
|
—
|
|
|
|
Thereafter
|
800.9
|
|
|
|
Total
|
$
|
1,457.5
|
|
At
December 31, 2018
, the weighted-average interest rate for borrowings was
3.50%
under the Term Facility (including the effect of interest rate swaps),
3.200%
under the 3.200% Senior Notes and
3.550%
under the 3.550% Senior Notes. Cash paid for interest for the years ended
December 31, 2018
,
2017
and
2016
was
$52.0
million,
$58.4 million
and
$56.0 million
, respectively.
NOTE 10 – FINANCIAL INSTRUMENTS
In the normal course of business, the Company uses various financial instruments, including derivative instruments, to manage the risks associated with interest and currency rate exposures. These financial instruments are not used for trading or speculative purposes.
When a derivative contract is entered into, the Company designates the derivative instrument as a cash flow hedge of a forecasted transaction, a cash flow hedge of a recognized asset or liability or as an undesignated derivative. The Company formally documents its hedge relationships, including identification of the derivative instruments and the hedged items, as well as its risk management objectives and strategies for undertaking the hedge transaction. This process includes linking derivative instruments that are designated as hedges to specific assets, liabilities or forecasted transactions.
The fair market value of derivative instruments is determined through market-based valuations and may not be representative of the actual gains or losses that will be recorded when these instruments mature due to future fluctuations in the markets in which they are traded.
F-21
The Company assesses at inception and at least quarterly thereafter, whether the derivatives used in cash flow hedging transactions are effective in offsetting the changes in the cash flows of the hedged item. To the extent the derivative is deemed to be an effective hedge, the fair market value changes of the instrument are recorded to Accumulated other comprehensive income (AOCI), while changes in the fair market value of derivatives not deemed to be an effective hedge are recorded in Net earnings in the period of change. If the hedging relationship ceases to be effective subsequent to inception, or it becomes probable that a forecasted transaction is no longer expected to occur, the hedging relationship will be undesignated and any future gains or losses on the derivative instrument will be recorded in Net earnings.
Currency Hedging Instruments
The gross notional amount of the Company’s currency derivatives was $
81.8 million
and $
57.7 million
at
December 31, 2018
and
2017
, respectively. At
December 31, 2018
and
2017
, gains of $
1.8 million
and $
0.3 million
, net of tax, were included in Accumulated other comprehensive loss related to the fair value of the Company’s currency derivatives designated as cash flow hedges. The amount expected to be reclassified into Net earnings over the next twelve months is a gain of $
1.8 million
. The actual amounts that will be reclassified to Net earnings may vary from this amount as a result of changes in market conditions. Gains and losses associated with the Company’s currency derivatives not designated as hedges are recorded in Net earnings as changes in fair value occur. At
December 31, 2018
, the maximum term of the Company’s currency derivatives was less than one year.
Interest Rate Swaps
The Company has interest rate swaps to fix the interest rate paid during the contract period for
$250.0 million
of the Company's variable rate Term Facility. These interest rate swaps expire in
September 2020
and met the criteria to be accounted for as cash flow hedges of variable rate interest payments. Consequently, the changes in fair value of the interest rate swaps are recognized in Accumulated other comprehensive loss. At
December 31, 2018
and
2017
,
$4.3 million
and
$3.5 million
of gains, net of tax, were recorded in Accumulated other comprehensive loss related to these interest rate swaps. The approximate amount expected to be reclassified into Net earnings over the next twelve months is a gain of approximately
$3 million
. The actual amounts that will be reclassified to Net earnings may vary from this amount as a result of changes in market conditions.
The fair values of derivative instruments included within the Consolidated Balance Sheets as of
December 31
were as follows:
|
|
Asset derivatives
|
Liability derivatives
|
||||||||||||||
|
In millions
|
2018
|
2017
|
2018
|
2017
|
||||||||||||
|
Derivatives designated as hedges:
|
||||||||||||||||
|
Currency derivatives
|
$
|
1.7
|
|
$
|
0.2
|
|
$
|
—
|
|
$
|
0.3
|
|
||||
|
Interest rate swaps
|
5.7
|
|
5.3
|
|
—
|
|
—
|
|
||||||||
|
Derivatives not designated as hedges:
|
||||||||||||||||
|
Currency derivatives
|
0.4
|
|
—
|
|
0.1
|
|
0.4
|
|
||||||||
|
Total derivatives
|
$
|
7.8
|
|
$
|
5.5
|
|
$
|
0.1
|
|
$
|
0.7
|
|
||||
Asset and liability currency derivatives included in the table above are recorded within Other current assets and Accrued expenses and other current liabilities, respectively. Interest rate swap derivatives included in the table above are recorded within Other noncurrent assets.
The amounts associated with derivatives designated as hedges affecting Net earnings and Accumulated other comprehensive loss for the years ended
December 31
were as follows:
|
|
Amount of gain recognized in Accumulated other comprehensive loss
|
Location of gain (loss) recognized in Net earnings
|
Amount of gain (loss) reclassified from Accumulated other comprehensive loss and recognized into Net earnings
|
|||||||||||||||||||||||
|
In millions
|
2018
|
2017
|
2016
|
2018
|
2017
|
2016
|
||||||||||||||||||||
|
Currency derivatives
|
$
|
4.3
|
|
$
|
4.0
|
|
$
|
4.2
|
|
Cost of goods sold
|
$
|
2.3
|
|
$
|
4.7
|
|
$
|
5.4
|
|
|||||||
|
Interest rate swaps
|
2.5
|
|
1.2
|
|
5.4
|
|
Interest expense
|
2.2
|
|
(0.3
|
)
|
—
|
|
|||||||||||||
|
Total
|
$
|
6.8
|
|
$
|
5.2
|
|
$
|
9.6
|
|
$
|
4.5
|
|
$
|
4.4
|
|
$
|
5.4
|
|
||||||||
The gains and losses associated with the Company's non-designated currency derivatives, which are offset by changes in the fair value of the underlying transactions, are included within Other income, net in the Consolidated Statements of Comprehensive Income.
F-22
Concentration of Credit Risk
The counterparties to the Company’s forward contracts and swaps consist of a number of investment grade major international financial institutions. The Company could be exposed to losses in the event of nonperformance by the counterparties. However, the credit ratings and the concentration of risk in these financial institutions are monitored on a continuous basis and present no significant credit risk to the Company.
NOTE 11 – PENSIONS AND POSTRETIREMENT BENEFITS OTHER THAN PENSIONS
The Company sponsors several U.S. defined benefit and defined contribution plans covering substantially all U.S. employees. Additionally, the Company has non-U.S. defined benefit and defined contribution plans covering eligible non-U.S. employees. Postretirement benefits, other than pensions, provide healthcare benefits, and in some instances, life insurance benefits for certain eligible employees.
Pension Plans
The noncontributory defined benefit pension plans covering non-collectively bargained U.S. employees provide benefits on an average pay formula while most plans for collectively bargained U.S. employees provide benefits on a flat dollar benefit formula. The non-U.S. pension plans generally provide benefits based on earnings and years of service. The Company also maintains additional other supplemental plans for officers and other key employees.
F-23
The following table details information regarding the Company’s pension plans at December 31:
|
U.S.
|
NON-U.S.
|
|||||||||||||||
|
In millions
|
2018
|
2017
|
2018
|
2017
|
||||||||||||
|
Change in benefit obligations:
|
||||||||||||||||
|
Benefit obligation at beginning of year
|
$
|
317.5
|
|
$
|
286.9
|
|
$
|
396.3
|
|
$
|
380.5
|
|
||||
|
Service cost
|
8.6
|
|
8.7
|
|
3.3
|
|
3.3
|
|
||||||||
|
Interest cost
|
10.4
|
|
10.5
|
|
8.4
|
|
8.9
|
|
||||||||
|
Employee contributions
|
—
|
|
—
|
|
0.3
|
|
0.3
|
|
||||||||
|
Amendments
|
—
|
|
—
|
|
5.0
|
|
—
|
|
||||||||
|
Actuarial (gains) losses
|
(25.4
|
)
|
17.5
|
|
(14.9
|
)
|
(15.4
|
)
|
||||||||
|
Benefits paid
|
(16.5
|
)
|
(12.4
|
)
|
(19.4
|
)
|
(13.7
|
)
|
||||||||
|
Foreign exchange rate changes
|
—
|
|
—
|
|
(21.1
|
)
|
34.3
|
|
||||||||
|
Curtailments and settlements
|
—
|
|
—
|
|
(0.2
|
)
|
(0.9
|
)
|
||||||||
|
Acquisitions
|
—
|
|
7.3
|
|
0.5
|
|
—
|
|
||||||||
|
Other, including expenses paid
|
(1.3
|
)
|
(1.0
|
)
|
(1.4
|
)
|
(1.0
|
)
|
||||||||
|
Benefit obligation at end of year
|
$
|
293.3
|
|
$
|
317.5
|
|
$
|
356.8
|
|
$
|
396.3
|
|
||||
|
Change in plan assets:
|
|
|
||||||||||||||
|
Fair value at beginning of year
|
$
|
283.2
|
|
$
|
202.4
|
|
$
|
398.4
|
|
$
|
353.4
|
|
||||
|
Actual return on plan assets
|
(12.1
|
)
|
31.9
|
|
(9.8
|
)
|
22.3
|
|
||||||||
|
Company contributions
|
6.1
|
|
55.7
|
|
5.4
|
|
5.2
|
|
||||||||
|
Employee contributions
|
—
|
|
—
|
|
0.3
|
|
0.3
|
|
||||||||
|
Benefits paid
|
(16.5
|
)
|
(12.4
|
)
|
(19.4
|
)
|
(13.7
|
)
|
||||||||
|
Foreign exchange rate changes
|
—
|
|
—
|
|
(20.8
|
)
|
33.7
|
|
||||||||
|
Settlements
|
—
|
|
—
|
|
(0.2
|
)
|
(0.9
|
)
|
||||||||
|
Acquisitions
|
—
|
|
6.5
|
|
—
|
|
—
|
|
||||||||
|
Other, including expenses paid
|
(1.3
|
)
|
(0.9
|
)
|
(1.7
|
)
|
(1.9
|
)
|
||||||||
|
Fair value of assets at end of year
|
$
|
259.4
|
|
$
|
283.2
|
|
$
|
352.2
|
|
$
|
398.4
|
|
||||
|
Funded status:
|
|
|
||||||||||||||
|
Plan assets (less than) over benefit obligations
|
$
|
(33.9
|
)
|
$
|
(34.3
|
)
|
$
|
(4.6
|
)
|
$
|
2.1
|
|
||||
|
Amounts included in the balance sheet:
|
|
|
||||||||||||||
|
Other noncurrent assets
|
$
|
—
|
|
$
|
—
|
|
$
|
21.1
|
|
$
|
28.5
|
|
||||
|
Accrued compensation and benefits
|
(0.3
|
)
|
(0.2
|
)
|
(1.1
|
)
|
(1.3
|
)
|
||||||||
|
Postemployment and other benefit liabilities
|
(33.6
|
)
|
(34.1
|
)
|
(24.6
|
)
|
(25.1
|
)
|
||||||||
|
Net amount recognized
|
$
|
(33.9
|
)
|
$
|
(34.3
|
)
|
$
|
(4.6
|
)
|
$
|
2.1
|
|
||||
It is the Company’s objective to contribute to the pension plans to ensure adequate funds are available in the plans to make benefit payments to plan participants and beneficiaries when required. However, certain plans are not funded due to either legal, accounting or tax requirements in certain jurisdictions. As of
December 31, 2018
, approximately
5%
of the Company's projected benefit obligation relates to plans that are not funded, of which the majority are non-U.S. plans.
F-24
The pretax amounts recognized in Accumulated other comprehensive loss were as follows:
|
U.S.
|
||||||||||||
|
In millions
|
Prior service cost
|
Net actuarial losses
|
Total
|
|||||||||
|
December 31, 2016
|
$
|
(2.1
|
)
|
$
|
(79.7
|
)
|
$
|
(81.8
|
)
|
|||
|
Current year changes recorded to Accumulated other comprehensive loss
|
—
|
|
2.4
|
|
2.4
|
|
||||||
|
Amortization reclassified to earnings
|
0.3
|
|
4.8
|
|
5.1
|
|
||||||
|
December 31, 2017
|
$
|
(1.8
|
)
|
$
|
(72.5
|
)
|
$
|
(74.3
|
)
|
|||
|
Current year changes recorded to Accumulated other comprehensive loss
|
—
|
|
(1.1
|
)
|
(1.1
|
)
|
||||||
|
Amortization reclassified to earnings
|
0.3
|
|
4.0
|
|
4.3
|
|
||||||
|
December 31, 2018
|
$
|
(1.5
|
)
|
$
|
(69.6
|
)
|
$
|
(71.1
|
)
|
|||
|
NON-U.S.
|
||||||||||||
|
In millions
|
Prior service cost
|
Net actuarial losses
|
Total
|
|||||||||
|
December 31, 2016
|
$
|
—
|
|
$
|
(79.6
|
)
|
$
|
(79.6
|
)
|
|||
|
Current year changes recorded to Accumulated other comprehensive loss
|
—
|
|
23.3
|
|
23.3
|
|
||||||
|
Amortization reclassified to earnings
|
—
|
|
1.8
|
|
1.8
|
|
||||||
|
Settlements/curtailments reclassified to earnings
|
—
|
|
0.1
|
|
0.1
|
|
||||||
|
Currency translation and other
|
0.1
|
|
(6.2
|
)
|
(6.1
|
)
|
||||||
|
December 31, 2017
|
$
|
0.1
|
|
$
|
(60.6
|
)
|
$
|
(60.5
|
)
|
|||
|
Current year changes recorded to Accumulated other comprehensive loss
|
(5.0
|
)
|
(10.4
|
)
|
(15.4
|
)
|
||||||
|
Amortization reclassified to earnings
|
—
|
|
0.9
|
|
0.9
|
|
||||||
|
Currency translation and other
|
0.2
|
|
3.9
|
|
4.1
|
|
||||||
|
December 31, 2018
|
$
|
(4.7
|
)
|
$
|
(66.2
|
)
|
$
|
(70.9
|
)
|
|||
Weighted-average assumptions used:
|
Benefit obligations at December 31,
|
2018
|
2017
|
||||
|
Discount rate:
|
||||||
|
U.S. plans
|
4.3
|
%
|
3.6
|
%
|
||
|
Non-U.S. plans
|
2.8
|
%
|
2.5
|
%
|
||
|
Rate of compensation increase:
|
||||||
|
U.S. plans
|
3.0
|
%
|
3.0
|
%
|
||
|
Non-U.S. plans
|
3.3
|
%
|
3.2
|
%
|
||
The accumulated benefit obligation for all U.S. defined benefit pension plans was $
284.8 million
and $
304.9 million
at
December 31, 2018
and
2017
, respectively. The accumulated benefit obligation for all non-U.S. defined benefit pension plans was $
349.1 million
and $
388.3 million
at
December 31, 2018
and
2017
, respectively.
The Company estimates the service and interest cost components of net periodic benefit cost utilizing a full yield-curve approach. Under this approach, the Company applies discounting using the applicable spot rates derived from the yield curve to discount the cash flows used to measure the benefit obligation. These spot rates align to each of the projected benefit obligations and service cost cash flows.
Information regarding pension plans with accumulated benefit obligations more than plan assets were:
F-25
|
U.S.
|
NON-U.S.
|
|||||||||||||||
|
In millions
|
2018
|
2017
|
2018
|
2017
|
||||||||||||
|
Projected benefit obligation
|
$
|
293.3
|
|
$
|
317.5
|
|
$
|
34.5
|
|
$
|
34.4
|
|
||||
|
Accumulated benefit obligation
|
284.8
|
|
304.9
|
|
29.6
|
|
29.5
|
|
||||||||
|
Fair value of plan assets
|
$
|
259.4
|
|
$
|
283.2
|
|
$
|
8.8
|
|
$
|
7.9
|
|
||||
Future pension benefit payments are expected to be paid as follows:
|
In millions
|
U.S.
|
NON-U.S.
|
|||||
|
2019
|
$
|
17.0
|
|
$
|
16.9
|
|
|
|
2020
|
24.2
|
|
17.4
|
|
|||
|
2021
|
17.8
|
|
18.3
|
|
|||
|
2022
|
18.4
|
|
19.1
|
|
|||
|
2023
|
20.3
|
|
19.6
|
|
|||
|
2024 - 2028
|
$
|
103.2
|
|
$
|
110.4
|
|
|
The components of the Company’s net periodic pension benefit costs for the years ended December 31 include the following:
|
U.S.
|
||||||||||||
|
In millions
|
2018
|
2017
|
2016
|
|||||||||
|
Service cost
|
$
|
6.8
|
|
$
|
7.1
|
|
$
|
6.8
|
|
|||
|
Interest cost
|
10.5
|
|
10.5
|
|
9.8
|
|
||||||
|
Expected return on plan assets
|
(14.4
|
)
|
(12.0
|
)
|
(10.2
|
)
|
||||||
|
Administrative costs and other
|
1.6
|
|
1.6
|
|
2.6
|
|
||||||
|
Net amortization of:
|
||||||||||||
|
Prior service costs
|
0.3
|
|
0.3
|
|
0.7
|
|
||||||
|
Plan net actuarial losses
|
4.1
|
|
4.8
|
|
4.7
|
|
||||||
|
Net periodic pension benefit cost
|
$
|
8.9
|
|
$
|
12.3
|
|
$
|
14.4
|
|
|||
|
NON-U.S.
|
||||||||||||
|
In millions
|
2018
|
2017
|
2016
|
|||||||||
|
Service cost
|
$
|
1.7
|
|
$
|
1.5
|
|
$
|
1.4
|
|
|||
|
Interest cost
|
8.4
|
|
8.9
|
|
10.7
|
|
||||||
|
Expected return on plan assets
|
(15.4
|
)
|
(14.3
|
)
|
(13.7
|
)
|
||||||
|
Administrative costs and other
|
1.8
|
|
2.5
|
|
1.7
|
|
||||||
|
Net amortization of:
|
|
|
|
|||||||||
|
Plan net actuarial losses
|
0.9
|
|
1.9
|
|
2.2
|
|
||||||
|
Net periodic pension benefit (income) cost
|
(2.6
|
)
|
0.5
|
|
2.3
|
|
||||||
|
Net curtailment and settlement losses
|
—
|
|
0.1
|
|
0.3
|
|
||||||
|
Net periodic pension benefit (income) cost after net curtailment and settlement losses
|
$
|
(2.6
|
)
|
$
|
0.6
|
|
$
|
2.6
|
|
|||
The Service cost component of Net periodic pension benefit cost (income) is recorded in Cost of goods sold and Selling and administrative expenses within the Consolidated Statements of Comprehensive Income. The remaining components of Net periodic pension benefit cost (income), including Administrative costs and other, are recorded within Other income, net within the Consolidated Statements of Comprehensive Income.
Pension expense for
2019
is projected to be approximately
$11.4 million
, utilizing the assumptions for calculating the pension benefit obligations at the end of
2018
.
F-26
Weighted-average assumptions used:
|
Net periodic pension cost for the year ended December 31,
|
2018
|
2017
|
2016
|
||||||
|
Discount rate:
|
|||||||||
|
U.S. plans
|
3.6
|
%
|
4.1
|
%
|
4.3
|
%
|
|||
|
Non-U.S. plans
|
2.5
|
%
|
2.6
|
%
|
3.7
|
%
|
|||
|
Rate of compensation increase:
|
|||||||||
|
U.S. plans
|
3.0
|
%
|
3.5
|
%
|
3.5
|
%
|
|||
|
Non-U.S. plans
|
3.3
|
%
|
3.2
|
%
|
3.0
|
%
|
|||
|
Expected return on plan assets:
|
|||||||||
|
U.S. plans
|
5.3
|
%
|
4.8
|
%
|
5.5
|
%
|
|||
|
Non-U.S. plans
|
4.0
|
%
|
4.0
|
%
|
4.5
|
%
|
|||
The expected long-term rate of return on plan assets reflects the average rate of returns expected on the funds invested or to be invested to provide for the benefits included in the projected benefit obligation. The expected long-term rate of return on plan assets is based on what is achievable given the plan’s investment policy, the types of assets held and target asset allocations. The expected long-term rate of return is determined as of the measurement date. Each plan is reviewed, along with its historical returns and target asset allocations, to determine the appropriate expected long-term rate of return on plan assets to be used.
The Company's overall objective in managing defined benefit plan assets is to ensure that all present and future benefit obligations are met as they come due. The goal is to achieve this while trying to mitigate volatility in plan funded status, contributions and expense by better matching the characteristics of the plan assets to that of the plan liabilities. Each plan’s funded status and asset allocation is monitored regularly in addition to investment manager performance.
The fair values of the Company’s U.S. pension plan assets at
December 31, 2018
, by asset category are as follows:
|
|
Fair value measurements
|
Total
fair value
|
||||||||||||||||||
|
In millions
|
Level 1
|
Level 2
|
Level 3
|
Assets measured at NAV
|
||||||||||||||||
|
Cash, cash equivalents and short-term investments
|
$
|
—
|
|
$
|
3.1
|
|
$
|
—
|
|
$
|
—
|
|
$
|
3.1
|
|
|||||
|
Equity mutual funds
|
—
|
|
—
|
|
—
|
|
53.7
|
|
53.7
|
|
||||||||||
|
Fixed income investments:
|
||||||||||||||||||||
|
U.S. government and agency obligations
|
—
|
|
—
|
|
—
|
|
94.0
|
|
94.0
|
|
||||||||||
|
Corporate and non-U.S. bonds
(a)
|
—
|
|
—
|
|
—
|
|
89.9
|
|
89.9
|
|
||||||||||
|
—
|
|
—
|
|
—
|
|
183.9
|
|
183.9
|
|
|||||||||||
|
Other
(b)
|
—
|
|
—
|
|
—
|
|
18.7
|
|
18.7
|
|
||||||||||
|
Total assets at fair value
|
$
|
—
|
|
$
|
3.1
|
|
$
|
—
|
|
$
|
256.3
|
|
$
|
259.4
|
|
|||||
|
(a)
|
Includes state and municipal bonds.
|
|
(b)
|
Includes group trust diversified credit fund.
|
No material transfers in or out of Level 3 occurred during the year ended
December 31, 2018
.
The fair values of the Company’s U.S. pension plan assets at
December 31, 2017
, by asset category are as follows:
F-27
|
|
Fair value measurements
|
Total
fair value
|
||||||||||||||||||
|
In millions
|
Level 1
|
Level 2
|
Level 3
|
Assets measured at NAV
|
||||||||||||||||
|
Cash, cash equivalents and short-term investments
|
$
|
—
|
|
$
|
3.2
|
|
$
|
—
|
|
$
|
—
|
|
$
|
3.2
|
|
|||||
|
Equity mutual funds
|
—
|
|
—
|
|
—
|
|
70.9
|
|
70.9
|
|
||||||||||
|
Fixed income investments:
|
||||||||||||||||||||
|
U.S. government and agency obligations
|
—
|
|
83.6
|
|
—
|
|
—
|
|
83.6
|
|
||||||||||
|
Corporate and non-U.S. bonds
(a)
|
—
|
|
111.3
|
|
—
|
|
12.8
|
|
124.1
|
|
||||||||||
|
—
|
|
194.9
|
|
—
|
|
12.8
|
|
207.7
|
|
|||||||||||
|
Total assets at fair value
|
$
|
—
|
|
$
|
198.1
|
|
$
|
—
|
|
$
|
83.7
|
|
$
|
281.8
|
|
|||||
|
Receivables and payables, net
|
1.4
|
|
||||||||||||||||||
|
Net assets available for benefits
|
|
|
|
$
|
283.2
|
|
||||||||||||||
|
(a)
|
Includes state and municipal bonds.
|
No material transfers in or out of Level 3 occurred during the year ended
December 31, 2017
.
The Company determines the fair value of its U.S. plan assets using the following methodologies:
|
•
|
Cash, cash equivalents and short-term investments
– Short-term investments are valued at the closing price or amount held on deposit by the custodian bank or at fair value by discounting the related cash flows based on current yields of similar instruments with comparable durations considering the credit-worthiness of the issuer. As these investments are not traded on active markets, they are classified as Level 2.
|
|
•
|
Equity mutual funds
– Equity mutual funds are valued at their daily net asset value (NAV) per share or the equivalent. NAV per share or the equivalent is used for fair value purposes as a practical expedient. NAV is calculated by the investment manager or sponsor of the fund.
|
|
•
|
U.S. government and agency obligations
– Quoted market prices are not available for these securities. Fair values are either estimated using pricing models and/or quoted prices of securities with similar characteristics or discounted cash flows, in which instances such securities are classified as Level 2, or valued at their net asset value (NAV) per share or the equivalent. NAV per share or the equivalent is used for fair value purposes as a practical expedient and are calculated by the investment manager or sponsor of the fund.
|
|
•
|
Corporate and non-U.S. bonds
– Quoted market prices are not available for these securities. Fair values are either estimated using pricing models and/or quoted prices of securities with similar characteristics or discounted cash flows, in which instances such securities are classified as Level 2 or valued at their net asset value (NAV) per share or the equivalent. NAV per share or the equivalent is used for fair value purposes as a practical expedient and are calculated by the investment manager or sponsor of the fund.
|
The fair values of the Company’s non-U.S. pension plan assets at
December 31, 2018
, by asset category are as follows:
|
|
Fair value measurements
|
Total
fair value
|
||||||||||||||||||
|
In millions
|
Level 1
|
Level 2
|
Level 3
|
Assets measured at NAV
|
||||||||||||||||
|
Cash, cash equivalents and short-term investments
|
$
|
1.3
|
|
$
|
36.1
|
|
$
|
—
|
|
—
|
|
$
|
37.4
|
|
||||||
|
Equity mutual funds
|
—
|
|
2.6
|
|
—
|
|
88.7
|
|
91.3
|
|
||||||||||
|
Corporate and non-U.S. bonds
|
—
|
|
109.4
|
|
—
|
|
31.7
|
|
141.1
|
|
||||||||||
|
Other
(a)
|
—
|
|
41.3
|
|
3.2
|
|
37.9
|
|
82.4
|
|
||||||||||
|
Total assets at fair value
|
$
|
1.3
|
|
$
|
189.4
|
|
$
|
3.2
|
|
$
|
158.3
|
|
$
|
352.2
|
|
|||||
(a) Primarily includes insurance contracts, mortgage-backed securities, real estate and derivative contracts.
No material transfers in or out of Level 3 occurred during the year ended
December 31, 2018
.
F-28
The fair values of the Company’s non-U.S. pension plan assets at
December 31, 2017
, by asset category are as follows:
|
|
Fair value measurements
|
Total
fair value
|
||||||||||||||||||
|
In millions
|
Level 1
|
Level 2
|
Level 3
|
Assets measured at NAV
|
||||||||||||||||
|
Cash and cash equivalents
|
$
|
36.7
|
|
$
|
—
|
|
$
|
—
|
|
$
|
—
|
|
$
|
36.7
|
|
|||||
|
Equity mutual funds
|
—
|
|
2.0
|
|
—
|
|
103.1
|
|
105.1
|
|
||||||||||
|
Corporate and non-U.S. bonds
|
—
|
|
176.9
|
|
—
|
|
—
|
|
176.9
|
|
||||||||||
|
Real estate
|
—
|
|
—
|
|
0.8
|
|
—
|
|
0.8
|
|
||||||||||
|
Other
(a)
|
—
|
|
46.7
|
|
2.3
|
|
29.9
|
|
78.9
|
|
||||||||||
|
Total assets at fair value
|
$
|
36.7
|
|
$
|
225.6
|
|
$
|
3.1
|
|
$
|
133.0
|
|
$
|
398.4
|
|
|||||
(a) Primarily includes insurance contracts, mortgage-backed securities and derivative contracts.
No material transfers in or out of Level 3 occurred during the year ended
December 31, 2017
.
The Company determines the fair value of its non-U.S. plan assets using the following methodologies:
|
•
|
Cash, cash equivalents and short-term investments
– Cash equivalents are valued using a market approach with inputs including quoted market prices for either identical or similar instruments. Short-term investments are valued at the closing price or amount held on deposit by the custodian bank or at fair value by discounting the related cash flows based on current yields of similar instruments with comparable durations considering the credit-worthiness of the issuer. As these investments are not traded on active markets, these investments are classified as Level 2.
|
|
•
|
Equity mutual funds
– Equity mutual funds are primarily valued at their daily net asset value (NAV) per share or the equivalent. NAV per share or the equivalent is used for fair value purposes as a practical expedient. NAV is calculated by the investment manager or sponsor of the fund.
|
|
•
|
Corporate and non-U.S. bonds
– Quoted market prices are not available for these securities. Fair values are either estimated using pricing models and/or quoted prices of securities with similar characteristics or discounted cash flows, in which instances such securities are classified as Level 2 or valued at their net asset value (NAV) per share or the equivalent. NAV per share or the equivalent is used for fair value purposes as a practical expedient and are calculated by the investment manager or sponsor of the fund.
|
The Company made employer contributions of
$6.1 million
to the U.S. pension plans in
2018
,
$55.7 million
in
2017
(of which
$50.0 million
was discretionary) and
$7.9 million
in
2016
. The Company made required and discretionary contributions to its non-U.S. pension plans of
$5.4 million
in
2018
,
$5.2 million
in
2017
and
$6.0 million
in
2016
.
The Company currently projects that approximately
$11.6 million
will be contributed to its U.S and non-U.S. plans in
2019
. The Company’s policy allows it to fund an amount, which could be in excess of or less than the pension cost expensed, subject to the limitations imposed by current tax regulations. The Company anticipates funding the plans in
2019
in accordance with contributions required by funding regulations or the laws of each jurisdiction.
Most of the Company’s U.S. employees are covered by defined contribution plans. Employer contributions are determined based on criteria specific to the individual plans and amounted to approximately
$14.4 million
,
$14.0 million
and
$13.3 million
in
2018
,
2017
and
2016
, respectively. The Company’s contributions relating to non-U.S. defined contribution plans and other non-U.S. benefit plans were
$8.0 million
,
$7.0 million
and
$5.6 million
in
2018
,
2017
and
2016
, respectively.
Deferred Compensation Plan
The Company maintains an Executive Deferred Compensation Plan ("EDCP"), which is an unfunded, nonqualified plan that permits certain employees to defer receipt of up to 50% of their annual salary and up to 100% of their annual bonus awards, performance share plan awards and restricted stock units received upon commencement of employment. As of
December 31, 2018
, the deferred compensation liability balance was
$15.1 million
, which was recorded within Postemployment and other benefit liabilities in the Consolidated Balance Sheet.
F-29
Postretirement Benefits Other Than Pensions
The Company sponsors a postretirement ("OPEB") plan that provides for healthcare benefits, and in some instances, life insurance benefits, that cover certain eligible retired employees. The Company funds postretirement benefit obligations principally on a pay-as-you- go basis. Generally, postretirement health benefits are contributory with contributions adjusted annually. Life insurance plans for retirees are primarily noncontributory. Net periodic postretirement benefit income is included within Other income, net within the Consolidated Statements of Comprehensive Income.
The benefit obligation related to the Company's postretirement plans as of
December 31, 2018
and
2017
was
$7.6 million
and
$9.3 million
, respectively, and is classified as Accrued compensation and benefits and Postemployment and other benefit liabilities within the Consolidated Balance Sheets. Net periodic postretirement benefit income was
$0.5 million
,
$1.4 million
and
$1.1 million
, for the years ended
December 31, 2018
,
2017
and
2016
, respectively. Net period postretirement benefit income (expense) for
2019
is not projected to be material. Benefit payments for postretirement benefits, which are net of expected plan participant contributions and Medicare Part D subsidies, are expected to be less than
$1 million
per year for the foreseeable future.
NOTE 12 – FAIR VALUE MEASUREMENTS
Fair value is defined as the exchange price that would be received to sell an asset or paid to transfer a liability (an exit price) in the principal or most advantageous market for the asset or liability in an orderly transaction between market participants on the measurement date. Fair value measurements are based on a framework that utilizes the inputs market participants use to determine the fair value of an asset or liability and establishes a fair value hierarchy to prioritize those inputs. The fair value hierarchy is comprised of the three levels described below:
|
•
|
Level 1 – Inputs based on quoted prices in active markets for identical assets or liabilities.
|
|
•
|
Level 2 – Inputs other than Level 1 quoted prices, such as quoted prices for similar assets or liabilities; quoted prices in markets that are not active; or other inputs that are observable or can be corroborated by observable market data for substantially the full term of the asset or liability.
|
|
•
|
Level 3 – Unobservable inputs based on little or no market activity and that are significant to the fair value of the assets and liabilities.
|
The fair value hierarchy requires an entity to maximize the use of observable inputs and minimize the use of unobservable inputs when measuring fair value. Observable inputs are obtained from independent sources and can be validated by a third party, whereas unobservable inputs reflect assumptions regarding what a third party would use in pricing an asset or liability based on the best information available under the circumstances. A financial instrument’s categorization within the fair value hierarchy is based upon the lowest level of input that is significant to the fair value measurement.
Assets and liabilities measured at fair value at
December 31, 2018
are as follows:
F-30
|
|
|||||||||||||||
|
|
Fair value measurements
|
Total
fair value |
|||||||||||||
|
In millions
|
Quoted prices in active markets for identical assets (Level 1)
|
Significant other observable inputs (Level 2)
|
Significant unobservable inputs (Level 3)
|
||||||||||||
|
Recurring fair value measurements
|
|||||||||||||||
|
Assets:
|
|||||||||||||||
|
Investments
|
$
|
—
|
|
$
|
14.3
|
|
$
|
—
|
|
$
|
14.3
|
|
|||
|
Interest rate swaps
|
—
|
|
5.7
|
|
—
|
|
5.7
|
|
|||||||
|
Foreign currency contracts
|
—
|
|
2.1
|
|
—
|
|
2.1
|
|
|||||||
|
Total asset recurring fair value measurements
|
$
|
—
|
|
$
|
22.1
|
|
$
|
—
|
|
$
|
22.1
|
|
|||
|
Liabilities:
|
|||||||||||||||
|
Foreign currency contracts
|
$
|
—
|
|
$
|
0.1
|
|
$
|
—
|
|
$
|
0.1
|
|
|||
|
Deferred compensation and other retirement plans
|
—
|
|
19.1
|
|
—
|
|
19.1
|
|
|||||||
|
Total liability recurring fair value measurements
|
$
|
—
|
|
$
|
19.2
|
|
$
|
—
|
|
$
|
19.2
|
|
|||
|
Financial instruments not carried at fair value:
|
|||||||||||||||
|
Total debt
|
$
|
—
|
|
$
|
1,403.2
|
|
$
|
—
|
|
$
|
1,403.2
|
|
|||
|
Total financial instruments not carried at fair value
|
$
|
—
|
|
$
|
1,403.2
|
|
$
|
—
|
|
$
|
1,403.2
|
|
|||
Assets and liabilities measured at fair value at
December 31, 2017
are as follows:
|
|
|||||||||||||||
|
|
Fair value measurements
|
Total
fair value |
|||||||||||||
|
In millions
|
Quoted prices in active markets for identical assets (Level 1)
|
Significant other observable inputs (Level 2)
|
Significant unobservable inputs (Level 3)
|
||||||||||||
|
Recurring fair value measurements
|
|||||||||||||||
|
Assets:
|
|||||||||||||||
|
Interest rate swaps
|
$
|
—
|
|
$
|
5.3
|
|
$
|
—
|
|
$
|
5.3
|
|
|||
|
Foreign currency contracts
|
—
|
|
0.2
|
|
—
|
|
0.2
|
|
|||||||
|
Total asset recurring fair value measurements
|
$
|
—
|
|
$
|
5.5
|
|
$
|
—
|
|
$
|
5.5
|
|
|||
|
Liabilities:
|
|||||||||||||||
|
Foreign currency contracts
|
$
|
—
|
|
$
|
0.7
|
|
$
|
—
|
|
$
|
0.7
|
|
|||
|
Deferred compensation and other retirement plans
|
—
|
|
20.9
|
|
—
|
|
20.9
|
|
|||||||
|
Total liability recurring fair value measurements
|
$
|
—
|
|
$
|
21.6
|
|
$
|
—
|
|
$
|
21.6
|
|
|||
|
Financial instruments not carried at fair value:
|
|||||||||||||||
|
Total debt
|
$
|
—
|
|
$
|
1,485.2
|
|
$
|
—
|
|
$
|
1,485.2
|
|
|||
|
Total financial instruments not carried at fair value
|
$
|
—
|
|
$
|
1,485.2
|
|
$
|
—
|
|
$
|
1,485.2
|
|
|||
The Company determines the fair value of its financial assets and liabilities using the following methodologies:
|
•
|
Investments
– These instruments include equity mutual funds and corporate bond funds. The fair value is obtained based on observable market prices quoted on public exchanges for similar instruments.
|
|
•
|
Interest rate swaps
– These instruments include forward-starting interest rate swap contracts for
$250.0 million
of the Company's variable rate debt. The fair value of the derivative instruments is determined based on quoted prices for the Company's swaps, which are not considered an active market.
|
|
•
|
Foreign currency contracts
– These instruments include foreign currency contracts for non-functional currency balance sheet exposures. The fair value of the foreign currency contracts is determined based on a pricing model that uses spot rates and forward prices from actively quoted currency markets that are readily accessible and observable.
|
F-31
|
•
|
Deferred compensation and other retirement plans
- These include obligations related to deferred compensation and other retirement plans adjusted for market performance. The fair value is obtained based on observable market prices quoted on public exchanges for similar instruments.
|
|
•
|
Debt
– These instruments are recorded at cost and include senior notes maturing through 2027. The fair value of the long-term debt instruments is obtained based on observable market prices quoted on public exchanges for similar instruments.
|
The carrying values of Cash and cash equivalents, Restricted cash, Accounts receivable, Accounts payable, Accrued expenses and other current liabilities are a reasonable estimate of their fair value due to the short-term nature of these instruments.
The methodology used by the Company to determine the fair value of its financial assets and liabilities at
December 31, 2018
are the same as those used at
December 31, 2017
.
NOTE 13 – EQUITY
Ordinary Shares
The reconciliation of Ordinary shares is as follows:
|
In millions
|
Total
|
|
|
December 31, 2017
|
95.1
|
|
|
Shares issued under incentive plans
|
0.4
|
|
|
Repurchase of ordinary shares
|
(0.9
|
)
|
|
December 31, 2018
|
94.6
|
|
Allegion had
400.0 million
ordinary shares authorized and
10.0 million
$0.001
par value preferred shares authorized (with none outstanding) at
December 31, 2018
.
On February 2, 2017, the Company's Board of Directors approved a new stock repurchase authorization of up to
$500 million
of the Company's ordinary shares. This stock repurchase authorization replaced the authorization previously established in 2014. During the year ended
December 31, 2018
, the Company paid
$67.3 million
to repurchase
0.9 million
ordinary shares on the open market under this new repurchase authorization.
Other Comprehensive Income (Loss)
The changes in Accumulated other comprehensive loss are as follows:
|
In millions
|
Cash flow hedges and marketable securities
|
Pension and OPEB items
|
Foreign currency items
|
Total
|
||||||||||||
|
December 31, 2015
|
$
|
14.0
|
|
$
|
(139.3
|
)
|
$
|
(106.9
|
)
|
$
|
(232.2
|
)
|
||||
|
Other comprehensive (loss) income, net of tax
|
(10.6
|
)
|
18.8
|
|
(40.3
|
)
|
(32.1
|
)
|
||||||||
|
December 31, 2016
|
3.4
|
|
(120.5
|
)
|
(147.2
|
)
|
(264.3
|
)
|
||||||||
|
Other comprehensive income, net of tax
|
0.4
|
|
19.3
|
|
98.1
|
|
117.8
|
|
||||||||
|
Other
(a)
|
—
|
|
(6.4
|
)
|
—
|
|
(6.4
|
)
|
||||||||
|
December 31, 2017
|
3.8
|
|
(107.6
|
)
|
(49.1
|
)
|
(152.9
|
)
|
||||||||
|
Other comprehensive income (loss), net of tax
|
1.8
|
|
(5.4
|
)
|
(57.3
|
)
|
(60.9
|
)
|
||||||||
|
Reclassification to Retained earnings upon adoption of ASU 2018-02 (see Note 2)
|
0.5
|
|
(10.2
|
)
|
—
|
|
(9.7
|
)
|
||||||||
|
December 31, 2018
|
$
|
6.1
|
|
$
|
(123.2
|
)
|
$
|
(106.4
|
)
|
$
|
(223.5
|
)
|
||||
|
(a)
|
During 2017, the Company reclassified
$6.4 million
between Accumulated other comprehensive loss and Retained earnings to correct a prior period classification error of Pension and OPEB items. The Company does not believe this reclassification is material to 2017 or to any of its previously issued annual or interim financial statements.
|
All amounts of Other comprehensive income (loss) attributable to noncontrolling interests on the Consolidated Statements of Equity relate to foreign currency items.
F-32
NOTE 14 – SHARE-BASED COMPENSATION
The Company records share-based compensation awards using a fair value method and recognizes compensation expense for an amount equal to the fair value of the share-based payment issued in its financial statements. The Company’s share-based compensation plans include programs for stock options, restricted stock units ("RSUs"), performance share units ("PSUs") and deferred compensation.
Under the Company's incentive stock plan, the total number of ordinary shares authorized by the shareholders is
8.0 million
, of which
3.4 million
remain available as of
December 31, 2018
for future incentive awards.
Compensation Expense
Share-based compensation expense is included in Cost of goods sold and Selling and administrative expenses within the Consolidated Statements of Comprehensive Income. The following table summarizes the expenses recognized for the years ended December 31:
|
In millions
|
2018
|
2017
|
2016
|
|||||||||
|
Stock options
|
$
|
4.3
|
|
$
|
3.3
|
|
$
|
4.1
|
|
|||
|
RSUs
|
9.6
|
|
7.0
|
|
7.7
|
|
||||||
|
PSUs
|
5.7
|
|
5.8
|
|
4.8
|
|
||||||
|
Deferred compensation
|
(0.8
|
)
|
2.8
|
|
0.8
|
|
||||||
|
Pre-tax expense
|
18.8
|
|
18.9
|
|
17.4
|
|
||||||
|
Tax benefit
|
(1.9
|
)
|
(6.4
|
)
|
(5.6
|
)
|
||||||
|
Total
|
$
|
16.9
|
|
$
|
12.5
|
|
$
|
11.8
|
|
|||
Stock Options / RSUs
Eligible participants may receive (i) stock options, (ii) RSUs or (iii) a combination of both stock options and RSUs. The fair value of each of the Company’s stock option and RSU awards is expensed on a straight-line basis over the required service period, which is generally the 3-year vesting period. However, for stock options and RSUs granted to retirement eligible employees, the Company recognizes expense for the fair value at the grant date.
The average fair value of the stock options granted for the year ended
December 31, 2018
,
2017
and 2016 was estimated to be $
21.29
, $
18.22
and
$15.86
per share, respectively, using the Black-Scholes option-pricing model. The weighted-average assumptions used were the following:
|
2018
|
2017
|
2016
|
|||||||
|
Dividend yield
|
0.97
|
%
|
0.89
|
%
|
0.83
|
%
|
|||
|
Volatility
|
22.38
|
%
|
24.93
|
%
|
28.85
|
%
|
|||
|
Risk-free rate of return
|
2.75
|
%
|
2.08
|
%
|
1.38
|
%
|
|||
|
Expected life
|
6.0 years
|
|
6.0 years
|
|
6.0 years
|
|
|||
Expected volatility is based on the weighted-average of the implied volatility of a group of the Company’s peers. The risk-free rate of return is based on the yield curve of a zero-coupon U.S. Treasury bond on the date the award is granted with a maturity equal to the expected term of the award. Historical peer data is used to estimate forfeitures within the Company’s valuation model. The expected life of the Company’s stock option awards granted post separation is derived from the simplified approach based on the weighted-average time to vest and the remaining contractual term and represents the period of time that awards are expected to be outstanding.
F-33
Changes in options outstanding under the plans for the years ended December 31,
2018
,
2017
and
2016
are as follows:
|
Shares
subject
to option
|
Weighted-
average
exercise price
(a)
|
Aggregate
intrinsic
value (millions)
|
Weighted-
average
remaining life (years)
|
||||||||||
|
December 31, 2015
|
1,592,167
|
|
$
|
33.91
|
|
||||||||
|
Granted
|
231,521
|
|
57.91
|
|
|||||||||
|
Exercised
|
(447,019
|
)
|
26.04
|
|
|||||||||
|
Canceled
|
(63,599
|
)
|
53.40
|
|
|
|
|||||||
|
December 31, 2016
|
1,313,070
|
|
39.87
|
|
|||||||||
|
Granted
|
165,113
|
|
71.84
|
|
|||||||||
|
Exercised
|
(410,397
|
)
|
31.54
|
|
|||||||||
|
Canceled
|
(15,906
|
)
|
60.84
|
|
|
|
|||||||
|
December 31, 2017
|
1,051,880
|
|
47.80
|
|
|||||||||
|
Granted
|
160,849
|
|
86.92
|
|
|||||||||
|
Exercised
|
(239,427
|
)
|
36.50
|
|
|||||||||
|
Canceled
|
(16,104
|
)
|
74.23
|
|
|
|
|||||||
|
Outstanding December 31, 2018
|
957,198
|
|
$
|
56.71
|
|
$
|
23.1
|
|
6.1
|
||||
|
Exercisable December 31, 2018
|
638,441
|
|
$
|
46.94
|
|
$
|
20.9
|
|
5.0
|
||||
|
(a)
|
The weighted-average exercise price of awards represents the exercise price of the awards on the grant date converted to ordinary shares of the Company.
|
The following table summarizes information concerning currently outstanding and exercisable options:
|
|
Options outstanding
|
Options exercisable
|
||||||||||||||||||||||||
|
Range of
exercise price
|
Number
outstanding at December 31, 2018 |
Weighted-
average
remaining
life (years)
|
Weighted-
average
exercise
price
|
Number
exercisable at December 31, 2018 |
Weighted-
average
remaining
life (years)
|
Weighted-
average
exercise
price
|
||||||||||||||||||||
|
$
|
10.01
|
|
—
|
$
|
20.00
|
|
43,401
|
|
0.7
|
$
|
16.18
|
|
43,401
|
|
0.7
|
$
|
16.18
|
|
||||||||
|
20.01
|
|
—
|
30.00
|
|
84,921
|
|
2.6
|
26.73
|
|
84,921
|
|
2.6
|
26.73
|
|
||||||||||||
|
30.01
|
|
—
|
40.00
|
|
51,823
|
|
4.0
|
32.33
|
|
51,823
|
|
4.0
|
32.33
|
|
||||||||||||
|
40.01
|
|
—
|
50.00
|
|
102,403
|
|
5.0
|
43.37
|
|
102,403
|
|
5.0
|
43.37
|
|
||||||||||||
|
50.01
|
|
—
|
60.00
|
|
373,873
|
|
6.2
|
56.90
|
|
309,915
|
|
6.0
|
56.70
|
|
||||||||||||
|
60.01
|
|
—
|
70.00
|
|
421
|
|
7.8
|
63.93
|
|
210
|
|
7.8
|
63.93
|
|
||||||||||||
|
70.01
|
|
—
|
80.00
|
|
146,698
|
|
8.0
|
71.84
|
|
45,514
|
|
8.0
|
71.84
|
|
||||||||||||
|
$
|
80.01
|
|
—
|
$
|
90.00
|
|
153,658
|
|
9.1
|
86.92
|
|
254
|
|
2.9
|
86.93
|
|
||||||||||
|
|
|
|
|
|
957,198
|
|
6.1
|
$
|
56.71
|
|
638,441
|
|
5.0
|
$
|
46.94
|
|
||||||||||
At
December 31, 2018
, there was $
1.4 million
of total unrecognized compensation cost from stock option arrangements granted under the plan, which is primarily related to unvested shares of non-retirement eligible employees. The aggregate intrinsic value of the Company's options exercised during the year ended
December 31, 2018
and
2017
, was $
11.5 million
and $
17.5 million
, respectively. Generally, stock options expire ten years from their date of grant.
F-34
The following table summarizes RSU activity for the years ended December 31,
2018
,
2017
and
2016
:
|
RSUs
|
Weighted-
average grant
date fair value
(a)
|
||||||
|
Outstanding and unvested at December 31, 2015
|
344,930
|
|
$
|
49.59
|
|
||
|
Granted
|
123,299
|
|
59.49
|
|
|||
|
Vested
|
(220,854
|
)
|
45.83
|
|
|||
|
Canceled
|
(41,741
|
)
|
|
52.40
|
|
||
|
Outstanding and unvested at December 31, 2016
|
205,634
|
|
58.99
|
|
|||
|
Granted
|
124,933
|
|
73.76
|
|
|||
|
Vested
|
(90,523
|
)
|
58.78
|
|
|||
|
Canceled
|
(10,038
|
)
|
60.47
|
|
|||
|
Outstanding and unvested at December 31, 2017
|
230,006
|
|
66.83
|
|
|||
|
Granted
|
132,865
|
|
84.65
|
|
|||
|
Vested
|
(104,065
|
)
|
65.42
|
|
|||
|
Canceled
|
(14,459
|
)
|
76.25
|
|
|||
|
Outstanding and unvested at December 31, 2018
|
244,347
|
|
$
|
76.51
|
|
||
|
(a)
|
The weighted-average grant date fair value represents the fair value of the awards on the grant date converted to ordinary shares of the Company.
|
At
December 31, 2018
, there was $
7.0 million
of total unrecognized compensation cost from RSU arrangements granted under the plan, which is related to unvested shares of non-retirement eligible employees.
Performance Shares
The Company has a Performance Share Program ("PSP") for key employees which provides awards in the form of PSUs based on performance against pre-established objectives. The annual target award level is expressed as a number of the Company's ordinary shares. All PSUs are settled in the form of ordinary shares unless deferred.
In February 2016, 2017 and 2018, the Company's Compensation Committee granted PSUs that were earned based 50% upon a performance condition, measured at each reporting period by earnings per share ("EPS") performance in relation to pre-established targets set by the Compensation Committee, and 50% upon a market condition, measured by the Company’s relative total shareholder return ("TSR") against the S&P 400 Capital Goods Index over a three-year performance period. The fair values of the market conditions are estimated using a Monte Carlo simulation approach in a risk-neutral framework to model future stock price movements based upon historical volatility, risk-free rates of return and correlation matrix.
F-35
The following table summarizes PSU activity for the maximum number of shares that may be issued for the years ended December 31,
2018
,
2017
and
2016
:
|
PSUs
|
Weighted-average grant date fair value
(a)
|
||||||
|
Outstanding and unvested at December 31, 2015
|
202,043
|
|
$
|
64.92
|
|
||
|
Granted
|
94,201
|
|
64.83
|
|
|||
|
Vested
|
(64,979
|
)
|
72.69
|
|
|||
|
Forfeited
|
(21,661
|
)
|
57.07
|
|
|||
|
Outstanding and unvested at December 31, 2016
|
209,604
|
|
56.02
|
|
|||
|
Granted
|
99,832
|
|
78.13
|
|
|||
|
Vested
|
(146,830
|
)
|
72.01
|
|
|||
|
Forfeited
|
(1,783
|
)
|
67.10
|
|
|||
|
Outstanding and unvested at December 31, 2017
|
160,823
|
|
55.02
|
|
|||
|
Granted
|
93,018
|
|
86.46
|
|
|||
|
Vested
|
(90,967
|
)
|
68.05
|
|
|||
|
Forfeited
|
(6,833
|
)
|
79.93
|
|
|||
|
Outstanding and unvested at December 31, 2018
|
156,041
|
|
$
|
65.07
|
|
||
|
(a)
|
The weighted-average grant date fair value represents the fair value of the awards on the grant date converted to ordinary shares of the Company.
|
At
December 31, 2018
, there was $
4.9 million
of total unrecognized compensation cost from the PSP based on current performance, which is related to unvested shares. This compensation will be recognized over the required service period, which is generally the three-year vesting period.
Deferred Compensation
The Company allows key employees to defer a portion of their eligible compensation into a number of investment choices, including its ordinary share equivalents. Any amounts invested in ordinary share equivalents will be settled in ordinary shares of the Company at the time of distribution.
NOTE 15 – RESTRUCTURING ACTIVITIES
During
2018
,
2017
, and
2016
, the Company recorded
$4.9 million
,
$12.3 million
and $
3.1 million
, respectively, of expenses associated with restructuring activities. These expenses are included within Cost of goods sold and Selling and administrative expenses within the Consolidated Statements of Comprehensive Income.
The changes in the restructuring reserve during the years ended
December 31, 2018
and
2017
, were as follows:
|
In millions
|
Total
|
|||
|
December 31, 2016
|
$
|
3.5
|
|
|
|
Additions
|
12.3
|
|
||
|
Cash and non-cash uses
|
(11.8
|
)
|
||
|
Currency translation
|
0.2
|
|
||
|
December 31, 2017
|
4.2
|
|
||
|
Additions
|
4.9
|
|
||
|
Cash and non-cash uses
|
(6.9
|
)
|
||
|
Currency translation
|
(0.1
|
)
|
||
|
December 31, 2018
|
$
|
2.1
|
|
|
The majority of the costs accrued as of
December 31, 2018
, will be paid within one year.
F-36
The Company also incurred other non-qualified restructuring charges of
$1.6 million
, $
1.5 million
and $
6.4 million
during the years ended
December 31, 2018
,
2017
and
2016
, respectively, in conjunction with the other restructuring plans, which represent costs that are directly attributable to restructuring activities, but that do not fall into the severance, exit or disposal category.
NOTE 16 – OTHER INCOME, NET
At December 31, the components of Other income, net were as follows:
|
In millions
|
2018
|
2017
|
2016
|
|||||||||
|
Interest income
|
$
|
(0.8
|
)
|
$
|
(1.2
|
)
|
$
|
(1.9
|
)
|
|||
|
Foreign currency exchange loss
|
0.3
|
|
0.7
|
|
2.0
|
|
||||||
|
Earnings from and gains on the sale of equity investments
|
(0.4
|
)
|
(5.4
|
)
|
(3.6
|
)
|
||||||
|
Net periodic pension and postretirement benefit (income) cost, less service cost
|
(2.8
|
)
|
4.3
|
|
8.8
|
|
||||||
|
Other
|
0.3
|
|
(7.3
|
)
|
(14.7
|
)
|
||||||
|
Other income, net
|
$
|
(3.4
|
)
|
$
|
(8.9
|
)
|
$
|
(9.4
|
)
|
|||
Other income, net for the year ended
December 31, 2018
, was primarily related to Net periodic pension and postretirement benefit income, less service cost.
Other income, net for the year ended
December 31, 2017
, included a gain of
$5.4 million
from the sale of iDevices, LLC, which is included within the Earnings from and gains on the sale of equity investments in the table above. Other income, net for the year ended
December 31, 2017
, also included gains of
$7.3 million
related to legal entity liquidations in the Asia Pacific segment, of which
$2.2 million
was attributed to noncontrolling interests. These gains are included within Other in the table above. These gains were partially offset by Net periodic pension and postretirement benefit cost, less service cost.
During the year ended
December 31, 2016
, the Company recorded gains from the sale of marketable securities of
$12.4 million
, which is included within Other in the table above. These gains were partially offset by Net periodic pension and postretirement benefit cost, less service cost.
NOTE 17 – INCOME TAXES
Earnings before income taxes for the years ended December 31 were taxed within the following jurisdictions:
|
In millions
|
2018
|
2017
|
2016
|
|||||||||
|
U.S.
|
$
|
151.4
|
|
$
|
166.5
|
|
$
|
129.9
|
|
|||
|
Non-U.S.
|
323.8
|
|
229.2
|
|
165.1
|
|
||||||
|
Total
|
$
|
475.2
|
|
$
|
395.7
|
|
$
|
295.0
|
|
|||
The components of the Provision for income taxes for the years ended December 31 were as follows:
|
In millions
|
2018
|
2017
|
2016
|
|||||||||
|
Current tax expense:
|
||||||||||||
|
U.S.
|
$
|
86.4
|
|
$
|
78.8
|
|
$
|
43.8
|
|
|||
|
Non-U.S.
|
18.1
|
|
15.0
|
|
13.8
|
|
||||||
|
Total:
|
104.5
|
|
93.8
|
|
57.6
|
|
||||||
|
Deferred tax (benefit) expense:
|
||||||||||||
|
U.S.
|
(56.1
|
)
|
41.2
|
|
14.4
|
|
||||||
|
Non-U.S.
|
(8.6
|
)
|
(16.0
|
)
|
(8.2
|
)
|
||||||
|
Total:
|
(64.7
|
)
|
25.2
|
|
6.2
|
|
||||||
|
Total tax expense (benefit):
|
||||||||||||
|
U.S.
|
30.3
|
|
120.0
|
|
58.2
|
|
||||||
|
Non-U.S.
|
9.5
|
|
(1.0
|
)
|
5.6
|
|
||||||
|
Total
|
$
|
39.8
|
|
$
|
119.0
|
|
$
|
63.8
|
|
|||
F-37
The Provision for income taxes differs from the amount of income taxes determined by applying the applicable U.S. statutory income tax rate to pretax income, as a result of the following differences:
|
|
Percent of pretax income
|
||||||||
|
|
2018
|
2017
|
2016
|
||||||
|
Statutory U.S. rate
|
21.0
|
%
|
35.0
|
%
|
35.0
|
%
|
|||
|
Increase (decrease) in rates resulting from:
|
|||||||||
|
Non-U.S. tax rate differential (1)
|
(11.9
|
)
|
(20.0
|
)
|
(17.4
|
)
|
|||
|
State and local income taxes (1)
|
2.1
|
|
1.8
|
|
2.0
|
|
|||
|
Reserves for uncertain tax positions
|
2.1
|
|
0.8
|
|
2.0
|
|
|||
|
Tax on unremitted earnings
|
(1.2
|
)
|
0.8
|
|
1.2
|
|
|||
|
Tax Reform Act
|
(4.6
|
)
|
13.5
|
|
—
|
|
|||
|
Trade incentives
|
0.6
|
|
—
|
|
—
|
|
|||
|
Production incentives
|
—
|
|
(0.9
|
)
|
(0.6
|
)
|
|||
|
Other adjustments
|
0.3
|
|
(0.9
|
)
|
(0.6
|
)
|
|||
|
Effective tax rate
|
8.4
|
%
|
30.1
|
%
|
21.6
|
%
|
|||
|
(1)
|
Net of changes in valuation allowances
|
On December 22, 2017, the Tax Reform Act became law, resulting in broad and complex changes to the U.S. tax code. The impact to the Company's Consolidated Financial Statements during the year ended December 31, 2017, included, but were not limited to, a (1) reduced U.S. federal corporate tax rate from 35.0% to 21.0%, effective January 1, 2018, (2) required a one-time transition tax on certain unrepatriated earnings of non-U.S. subsidiaries and (3) required review of the future realizability of deferred tax balances.
The Tax Reform Act also put in place new tax laws which include, but are not limited to, a (1) Base Erosion Anti-abuse Tax (BEAT), which is a new minimum tax, (2) general elimination of U.S. federal income taxes on dividends from foreign subsidiaries, (3) provision designed to tax currently global intangible low taxed income (GILTI), (4) provision that may limit the amount of currently deductible interest expense, (5) repeal of certain domestic production incentives, (6) limitation on the deductibility of certain executive compensation and (7) limitation on the utilization of foreign tax credits to reduce the U.S. income tax liability.
Shortly after the Tax Reform Act was enacted, the SEC staff issued Staff Accounting Bulletin No. 118, Income Tax Accounting Implications of the Tax Cuts and Jobs Act (SAB 118) which provided guidance on accounting for the Tax Reform Act’s impact. SAB 118 provided a measurement period, which in no case was to extend beyond one year from the Tax Reform Act enactment date, during which a company acting in good faith could complete the accounting for the impacts of the Tax Reform Act under ASC Topic 740. In accordance with SAB 118, the Company must reflect the income tax effects of the Tax Reform Act in the reporting period in which the accounting under ASC 740 is complete. The Company recorded a provisional discrete net tax charge of
$53.5 million
related to the Tax Reform Act during the year ended December 31, 2017. This net charge primarily consists of a net charge of
$24.5 million
due to the remeasurement of deferred tax accounts to reflect the corporate rate reduction impact to the Company's net deferred tax balances, a net charge of
$22.8 million
due to the future realizability of certain deferred tax balances and a net charge for the transition tax of
$5.0 million
.
In accordance with the expiration of the one-year SAB 118 measurement period, the Company completed the assessment of the income tax effects of the Tax Reform Act in the fourth quarter of 2018. In finalizing the net tax charge resulting from the Tax Reform Act, the Company reversed
$22.8 million
of previous charges and recorded an additional
$0.9 million
of transition tax, each of which is described more fully below.
During 2018, the U.S. Internal Revenue Service and Treasury Department released interpretative guidance and accordingly, the Company reversed the
$22.8 million
of valuation allowance during the year ended December 31, 2018, primarily related to the deductibility of interest limitation carryforward balances and certain executive compensation.
Also during 2018, U.S. Internal Revenue Service and Treasury Department released interpretive guidance and draft regulations which resulted in the
$0.9 million
increase in the transition tax charge. The Company elected to pay the full liability for the deemed repatriation of foreign earnings during the year ended December 31, 2018. On January 15, 2019, the U.S. Internal Revenue Service and Treasury Department released final regulations related to the Transition Tax that clarifies the required treatment of certain
F-38
items. The Company is in the process of evaluating the impact of these regulations on its related tax positions but does not believe such final regulations will materially impact the transition tax recorded.
The majority of the Company's earnings are considered permanently reinvested. The transition tax resulted in certain previously untaxed non-U.S. earnings being included in the U.S. federal and state 2017 taxable income. As a result of the Tax Reform Act, the Company analyzed its global working capital requirements and the potential tax liabilities that would be incurred if certain non-U.S. subsidiaries made distributions, which include local country withholding tax and potential U.S. state taxation. Based on this analysis, the Company made no changes to its permanent reinvestment assertions to reinvest the earnings in its non-U.S. subsidiaries outside of the U.S. Thus, the Company has not recorded any incremental withholding or income tax liabilities on its investment in its non-U.S. subsidiaries.
At December 31, a summary of the deferred tax accounts was as follows:
|
In millions
|
2018
|
2017
|
||||||
|
Deferred tax assets:
|
||||||||
|
Inventory and accounts receivable
|
$
|
15.3
|
|
$
|
17.0
|
|
||
|
Fixed assets and intangibles
|
2.2
|
|
2.6
|
|
||||
|
Postemployment and other benefit liabilities
|
29.1
|
|
29.9
|
|
||||
|
Other reserves and accruals
|
12.8
|
|
12.5
|
|
||||
|
Net operating losses, tax credits and other carryforwards
|
419.9
|
|
309.5
|
|
||||
|
Other
|
0.7
|
|
4.2
|
|
||||
|
Gross deferred tax assets
|
480.0
|
|
375.7
|
|
||||
|
Less: deferred tax valuation allowances
|
(357.1
|
)
|
(312.9
|
)
|
||||
|
Deferred tax assets net of valuation allowances
|
$
|
122.9
|
|
$
|
62.8
|
|
||
|
Deferred tax liabilities:
|
||||||||
|
Fixed assets and intangibles
|
$
|
(104.9
|
)
|
$
|
(101.7
|
)
|
||
|
Postemployment and other benefit liabilities
|
(3.5
|
)
|
(4.7
|
)
|
||||
|
Unremitted earnings of foreign subsidiaries
|
(0.5
|
)
|
(6.0
|
)
|
||||
|
Other
|
(6.3
|
)
|
(7.4
|
)
|
||||
|
Gross deferred tax liabilities
|
(115.2
|
)
|
(119.8
|
)
|
||||
|
Net deferred tax assets (liabilities)
|
$
|
7.7
|
|
$
|
(57.0
|
)
|
||
At
December 31, 2018
,
$0.5 million
of deferred tax was recorded for certain undistributed earnings of non-U.S. subsidiaries. Historically, no deferred taxes have been provided for any portion of the remaining undistributed earnings of the Company's subsidiaries since these earnings have been, and will continue to be, permanently reinvested in these subsidiaries. For many reasons, including the number of legal entities and jurisdictions involved, the complexity of the Company's legal entity structure, the complexity of tax laws in the relevant jurisdictions and the impact of projections of income for future years to any calculations, the Company believes it is not practicable to estimate, within any reasonable range, the amount of additional taxes which may be payable upon the distribution of earnings.
At
December 31, 2018
, the Company had the following tax losses and tax credit carryforwards available to offset taxable income in prior and future years:
|
In millions
|
Amount
|
Expiration
Period
|
||||
|
U.S. Federal tax loss carryforwards
|
$
|
20.4
|
|
2027-2037
|
||
|
U.S. Federal and State credit carryforwards
|
22.0
|
|
2020-2027
|
|||
|
U.S. State tax loss carryforwards
|
25.5
|
|
2019-2037
|
|||
|
Non-U.S. tax loss carryforwards
|
$
|
1,286.6
|
|
2019-Unlimited
|
||
The U.S. state loss carryforwards were incurred in various jurisdictions. The non-U.S. loss carryforwards were incurred in various jurisdictions, predominantly in China, Ireland, Italy, Luxembourg and the United Kingdom.
The Company evaluates its deferred income tax assets to determine if valuation allowances are required or should be adjusted. U.S. GAAP requires that companies assess whether valuation allowances should be established against their deferred tax assets
F-39
based on consideration of all available evidence, both positive and negative, using a "more likely than not" standard. This assessment considers the nature, frequency and amount of recent losses, the duration of statutory carryforward periods and tax planning strategies. In making such judgments, significant weight is given to evidence that can be objectively verified.
Activity associated with the Company’s valuation allowance is as follows:
|
In millions
|
2018
|
2017
|
2016
|
|||||||||
|
Beginning balance
|
$
|
312.9
|
|
$
|
225.5
|
|
$
|
133.3
|
|
|||
|
Increase to valuation allowance
|
70.9
|
|
96.9
|
|
109.0
|
|
||||||
|
Decrease to valuation allowance
|
(25.0
|
)
|
(11.9
|
)
|
(13.9
|
)
|
||||||
|
Foreign exchange translation
|
(1.7
|
)
|
2.4
|
|
(3.3
|
)
|
||||||
|
Accumulated other comprehensive income
|
—
|
|
—
|
|
0.4
|
|
||||||
|
Ending balance
|
$
|
357.1
|
|
$
|
312.9
|
|
$
|
225.5
|
|
|||
During the year ended December 31,
2018
, the valuation allowance increased by
$44.2 million
. This increase is the result of changes in jurisdictional profitability, country specific tax laws and changes in judgment and facts regarding the realizability of deferred tax assets.
The Company has total unrecognized tax benefits of $
42.0 million
and $
29.0 million
as of
December 31, 2018
and
2017
, respectively. The amount of unrecognized tax benefits that, if recognized, would affect the effective tax rate is
$38.5 million
as of
December 31, 2018
. A reconciliation of the beginning and ending amount of unrecognized tax benefits is as follows:
|
In millions
|
2018
|
2017
|
2016
|
|||||||||
|
Beginning balance
|
$
|
29.0
|
|
$
|
32.0
|
|
$
|
23.8
|
|
|||
|
Additions based on tax positions related to the current year
|
9.5
|
|
6.4
|
|
9.1
|
|
||||||
|
Additions based on tax positions related to prior years
|
8.2
|
|
1.6
|
|
7.1
|
|
||||||
|
Reductions based on tax positions related to prior years
|
(1.4
|
)
|
(5.0
|
)
|
(5.5
|
)
|
||||||
|
Reductions related to settlements with tax authorities
|
(1.5
|
)
|
(7.1
|
)
|
(0.6
|
)
|
||||||
|
Reductions related to lapses of statute of limitations
|
(1.1
|
)
|
(1.2
|
)
|
(0.9
|
)
|
||||||
|
Translation (gain)/loss
|
(0.7
|
)
|
2.3
|
|
(1.0
|
)
|
||||||
|
Ending balance
|
$
|
42.0
|
|
$
|
29.0
|
|
$
|
32.0
|
|
|||
The Company records interest and penalties associated with the uncertain tax positions within its provision for income taxes. The Company had reserves associated with interest and penalties, net of tax, of $
5.7 million
and $
4.9 million
at
December 31, 2018
and
2017
, respectively. For the years ended
December 31, 2018
and
2017
, the Company recognized
$0.8 million
and
$0.0 million
in net interest and penalties, net of tax, related to these uncertain tax positions.
The total amount of unrecognized tax benefits relating to the Company's tax positions is subject to change based on future events including, but not limited to, the settlements of ongoing audits and/or the expiration of applicable statutes of limitations. Although the outcomes and timing of such events are highly uncertain, it is reasonably possible that the balance of gross unrecognized tax benefits, excluding interest and penalties, could potentially be reduced by up to approximately $
11.5 million
during the next 12 months.
The provision for income taxes involves a significant amount of management judgment regarding interpretation of relevant facts and laws in the jurisdictions in which the Company operates. Future changes in applicable laws, projected levels of taxable income and tax planning could change the effective tax rate and tax balances recorded by the Company. In addition, tax authorities periodically review income tax returns filed by the Company and can raise issues regarding its filing positions, timing and amount of income or deductions and the allocation of income among the jurisdictions in which the Company operates. A significant period of time may elapse between the filing of an income tax return and the ultimate resolution of an issue raised by a tax authority with respect to that return. In the normal course of business, the Company is subject to examination by taxing authorities throughout the world, including such major jurisdictions as Australia, Canada, France, Germany, Italy, Mexico, the Netherlands and the U.S. In general, the examination of the material tax returns of subsidiaries of the Company is complete for the years prior to 2003, with certain matters being resolved through appeals and litigation.
The Company had indemnity receivables in the amount of
$5.4 million
and
$5.7 million
included in Other noncurrent assets at
December 31, 2018
and
2017
, respectively, primarily related to additional competent authority relief filings.
F-40
NOTE 18 – EARNINGS PER SHARE (EPS)
Basic EPS is calculated by dividing Net earnings attributable to Allegion plc by the weighted-average number of ordinary shares outstanding for the applicable period. Diluted EPS is calculated after adjusting the denominator of the basic EPS calculation for the effect of all potentially dilutive ordinary shares, which in the Company’s case, includes shares issuable under share-based compensation plans.
The following table summarizes the weighted-average number of ordinary shares outstanding for basic and diluted earnings per share calculations:
|
In millions
|
2018
|
2017
|
2016
|
||||||
|
Weighted-average number of basic shares
|
95.0
|
|
95.1
|
|
95.8
|
|
|||
|
Shares issuable under incentive stock plans
|
0.7
|
|
0.9
|
|
1.1
|
|
|||
|
Weighted-average number of diluted shares
|
95.7
|
|
96.0
|
|
96.9
|
|
|||
At
December 31, 2018
,
0.1 million
stock options were excluded from the computation of weighted-average diluted shares outstanding because the effect of including these shares would have been anti-dilutive.
NOTE 19 – NET REVENUES
Net revenues are recognized based on the satisfaction of performance obligations under the terms of a contract. A performance obligation is a promise in a contract to transfer control of a distinct product or to provide a service, or a bundle of products or services, to a customer, and is the unit of account under ASC 606. The Company has two principal revenue streams, tangible product sales and services. Approximately 99% of consolidated Net revenues involve contracts with a single performance obligation, which is the transfer of control of a product or bundle of products to a customer. Transfer of control typically occurs when goods are shipped from the Company's facilities or at other predetermined control transfer points (for instance, destination terms). Net revenues are measured as the amount of consideration expected to be received in exchange for transferring control of the products and takes into account variable consideration, such as sales incentive programs including discounts and volume rebates. The existence of these programs does not preclude revenue recognition but does require the Company's best estimate of the variable consideration to be made based on expected activity, as these items are reserved for as a deduction to Net revenues over time based on the Company's historical rates of providing these incentives and annual forecasted sales volumes. The Company also offers a standard warranty with most product sales and the value of such warranty is included in the contractual price. The corresponding cost of the warranty obligation is accrued as a liability (see Note 20).
The Company's remaining Net revenues involve services, including installation and consulting. Unlike the single performance obligation to ship a product or bundle of products, the service revenue stream delays revenue recognition until the service performance obligations are satisfied. In some instances, customer acceptance provisions are included in sales arrangements to give the buyer the ability to ensure the service meets the criteria established in the order. In these instances, revenue recognition is deferred until the performance obligations are satisfied, which could include acceptance terms specified in the arrangement being fulfilled through customer acceptance or a demonstration that established criteria have been satisfied. During the year ended
December 31, 2018
, no adjustments related to performance obligations satisfied in previous periods were recorded.
Upon adoption of ASC 606, the Company used the practical expedients to omit the disclosure of remaining performance obligations for contracts with an original expected duration of one year or less and for contracts where the Company has the right to invoice for performance completed to date. The transaction price is not adjusted for the effects of a significant financing component, as the time period between control transfer of goods and services is less than one year. Sales, value-added and other similar taxes collected by the Company are excluded from Net revenues. The Company has also elected to account for shipping and handling activities that occur after control of the related goods transfers as fulfillment activities instead of performance obligations. These activities are included in Cost of goods sold in the Consolidated Statements of Comprehensive Income. The Company’s payment terms are generally consistent with the industries in which their businesses operate.
The following table shows the Company's Net revenues for the years ended December 31, based on the two principal revenue streams, tangible product sales and services, disaggregated by business segment. Net revenues are shown by tangible product sales and services, as contract terms, conditions and economic factors affecting the nature, amount, timing and uncertainty around revenue recognition and cash flows are substantially similar within each of the two principal revenue streams:
F-41
|
2018
|
|||||||||||||||
|
in millions
|
Americas
|
EMEIA
|
Asia Pacific
|
Consolidated
|
|||||||||||
|
Net revenues
|
|||||||||||||||
|
Products
|
$
|
1,988.6
|
|
$
|
567.8
|
|
$
|
148.9
|
|
$
|
2,705.3
|
|
|||
|
Services
|
—
|
|
22.1
|
|
4.3
|
|
26.4
|
|
|||||||
|
Total Net revenues
|
$
|
1,988.6
|
|
$
|
589.9
|
|
$
|
153.2
|
|
$
|
2,731.7
|
|
|||
|
2017
(a)
|
|||||||||||||||
|
in millions
|
Americas
|
EMEIA
|
Asia Pacific
|
Consolidated
|
|||||||||||
|
Net revenues
|
|||||||||||||||
|
Products
|
$
|
1,767.5
|
|
$
|
501.9
|
|
$
|
117.2
|
|
$
|
2,386.6
|
|
|||
|
Services
|
—
|
|
21.6
|
|
—
|
|
21.6
|
|
|||||||
|
Total Net revenues
|
$
|
1,767.5
|
|
$
|
523.5
|
|
$
|
117.2
|
|
$
|
2,408.2
|
|
|||
|
2016
(a)
|
|||||||||||||||
|
in millions
|
Americas
|
EMEIA
|
Asia Pacific
|
Consolidated
|
|||||||||||
|
Net revenues
|
|||||||||||||||
|
Products
|
$
|
1,645.7
|
|
$
|
464.9
|
|
$
|
106.4
|
|
$
|
2,217.0
|
|
|||
|
Services
|
—
|
|
21.0
|
|
—
|
|
21.0
|
|
|||||||
|
Total Net revenues
|
$
|
1,645.7
|
|
$
|
485.9
|
|
$
|
106.4
|
|
$
|
2,238.0
|
|
|||
|
(a)
|
The Company adopted ASU 2014-09 and related updates as of January 1, 2018, on a modified retrospective basis, and as such, amounts presented for years ended December 31, 2017 and 2016, are based on ASC 605.
|
As of
December 31, 2018
, neither the contract assets related to the Company's right to consideration for work completed but not billed nor the contract liabilities associated with contract revenue are material. As a practical expedient, the Company recognizes incremental costs of obtaining a contract, if any, as an expense when incurred if the amortization period of the asset would have been one year or less. The Company does not have any costs to obtain or fulfill a contract that are capitalized under ASC 606.
NOTE 20 – COMMITMENTS AND CONTINGENCIES
The Company is involved in various litigation, claims and administrative proceedings, including those related to environmental and product warranty matters. Amounts recorded for identified contingent liabilities are estimates, which are reviewed periodically and adjusted to reflect additional information when it becomes available. Subject to the uncertainties inherent in estimating future costs for contingent liabilities, except as expressly set forth in this note, management believes that any liability which may result from these legal matters would not have a material adverse effect on the financial condition, results of operations, liquidity or cash flows of the Company.
Environmental Matters
The Company is dedicated to an environmental program to reduce the utilization and generation of hazardous materials during the manufacturing process and to remediate identified environmental concerns. As to the latter, the Company is currently engaged in site investigations and remediation activities to address environmental cleanup from past operations at current and former production facilities. The Company regularly evaluates its remediation programs and considers alternative remediation methods that are in addition to, or in replacement of, those currently utilized by the Company based upon enhanced technology and regulatory changes. Changes to the Company's remediation programs may result in increased expenses and increased environmental reserves.
The Company is sometimes a party to environmental lawsuits and claims and has received notices of potential violations of environmental laws and regulations from the U.S. Environmental Protection Agency and similar state authorities. It has also been identified as a potentially responsible party ("PRP") for cleanup costs associated with off-site waste disposal at federal Superfund and state remediation sites. For all such sites, there are other PRPs and, in most instances, the Company’s involvement is minimal.
In estimating its liability, the Company has assumed it will not bear the entire cost of remediation of any site to the exclusion of other PRPs who may be jointly and severally liable. The ability of other PRPs to participate has been taken into account, based
F-42
on the Company's understanding of the parties’ financial condition and probable contributions on a per site basis. Additional lawsuits and claims involving environmental matters are likely to arise from time to time in the future.
The Company incurred $
2.4 million
, $
3.2 million
and $
23.3 million
of expenses during the years ended
December 31, 2018
,
2017
and
2016
, respectively, for environmental remediation at sites presently or formerly owned or leased by the Company. In the fourth-quarter of 2016, with the collaboration and approval of state regulators, the Company launched a proactive, alternative approach to remediate two sites in the U.S. This approach allowed the Company to more aggressively address environmental conditions at these sites and reduce the impact of potential changes in regulatory requirements. As a result, the Company recorded a
$15 million
charge for environmental remediation in 2016. Environmental remediation costs are recorded in Costs of goods sold within the Consolidated Statements of Comprehensive Income.
As of
December 31, 2018
and
2017
, the Company has recorded reserves for environmental matters of $
22.6 million
and $
28.9 million
, respectively. The total reserve at
December 31, 2018
and
2017
, included $
6.3 million
and
$8.9 million
, respectively, related to remediation of sites previously disposed by the Company. Environmental reserves are classified as Accrued expenses and other current liabilities or Other noncurrent liabilities within the Consolidated Balance Sheets based on their expected term. The Company's total current environmental reserve at
December 31, 2018
and
2017
, was $
5.6 million
and $
12.6 million
, respectively, and the remainder is classified as noncurrent. Given the evolving nature of environmental laws, regulations and technology, the ultimate cost of future compliance is uncertain.
Warranty Liability
Standard product warranty accruals are recorded at the time of sale and are estimated based upon product warranty terms and historical experience. The Company assesses the adequacy of its liabilities and will make adjustments as necessary based on known or anticipated warranty claims, or as new information becomes available.
The changes in the standard product warranty liability for the year ended
December 31,
were as follows:
|
In millions
|
2018
|
2017
|
2016
|
||||||||
|
Balance at beginning of period
|
$
|
14.1
|
|
$
|
13.3
|
|
$
|
11.7
|
|
||
|
Reductions for payments
|
(7.9
|
)
|
(7.8
|
)
|
(6.5
|
)
|
|||||
|
Accruals for warranties issued during the current period
|
7.8
|
|
9.0
|
|
8.1
|
|
|||||
|
Changes to accruals related to preexisting warranties
|
0.2
|
|
(0.8
|
)
|
0.2
|
|
|||||
|
Acquisitions
|
0.5
|
|
—
|
|
—
|
|
|||||
|
Translation
|
(0.2
|
)
|
0.4
|
|
(0.2
|
)
|
|||||
|
Balance at end of period
|
$
|
14.5
|
|
$
|
14.1
|
|
$
|
13.3
|
|
||
Standard product warranty liabilities are classified as Accrued expenses and other current liabilities within the Consolidated Balance Sheets.
Other Commitments and Contingencies
Certain office and warehouse facilities, transportation vehicles and data processing equipment are leased by the Company. Total rental expense was $
42.5 million
in
2018
, $
35.5 million
in
2017
and $
32.5 million
in
2016
. Minimum lease payments required under non-cancellable operating leases with terms in excess of one year for the next five years are as follows: $
30.3 million
in 2019, $
21.5 million
in 2020, $
14.1 million
in 2021, $
9.3 million
in 2022 and $
5.5 million
in 2023.
NOTE 21 – BUSINESS SEGMENT INFORMATION
The Company classifies its business into the following three reportable segments based on industry and market focus: Americas, EMEIA and Asia Pacific.
The Company largely evaluates performance based on Segment operating income and Segment operating margins. Segment operating income is the measure of profit and loss that the Company’s chief operating decision maker uses to evaluate the financial performance of the business and as the basis for resource allocation, performance reviews and compensation. For these reasons, the Company believes that Segment operating income represents the most relevant measure of segment profit and loss. The Company’s chief operating decision maker may exclude certain charges or gains, such as corporate charges and other special charges, from Operating income to arrive at a Segment operating income that is a more meaningful measure of profit and loss upon which to base operating decisions. The Company defines Segment operating margin as Segment operating income as a percentage of the segment's Net revenues.
F-43
A summary of operations and balance sheet information by reportable segments as of and for the years ended December 31 were as follows:
|
Dollar amounts in millions
|
2018
|
2017
|
2016
|
|||||||||
|
Americas
|
||||||||||||
|
Net revenues
|
$
|
1,988.6
|
|
$
|
1,767.5
|
|
$
|
1,645.7
|
|
|||
|
Segment operating income
|
544.5
|
|
508.5
|
|
456.7
|
|
||||||
|
Segment operating margin
|
27.4
|
%
|
28.8
|
%
|
27.8
|
%
|
||||||
|
Depreciation and amortization
|
42.2
|
|
26.4
|
|
26.4
|
|
||||||
|
Capital expenditures
|
22.5
|
|
26.1
|
|
21.5
|
|
||||||
|
Total segment assets
|
1,175.8
|
|
872.4
|
|
852.7
|
|
||||||
|
EMEIA
|
||||||||||||
|
Net revenues
|
589.9
|
|
523.5
|
|
485.9
|
|
||||||
|
Segment operating income
|
49.3
|
|
44.1
|
|
35.3
|
|
||||||
|
Segment operating margin
|
8.4
|
%
|
8.4
|
%
|
7.3
|
%
|
||||||
|
Depreciation and amortization
|
32.0
|
|
28.6
|
|
27.6
|
|
||||||
|
Capital expenditures
|
16.2
|
|
17.1
|
|
13.6
|
|
||||||
|
Total segment assets
|
1,052.1
|
|
1,027.7
|
|
886.2
|
|
||||||
|
Asia Pacific
|
||||||||||||
|
Net revenues
|
153.2
|
|
117.2
|
|
106.4
|
|
||||||
|
Segment operating income
|
6.9
|
|
9.5
|
|
6.1
|
|
||||||
|
Segment operating margin
|
4.5
|
%
|
8.1
|
%
|
5.7
|
%
|
||||||
|
Depreciation and amortization
|
3.9
|
|
2.5
|
|
2.4
|
|
||||||
|
Capital expenditures
|
4.2
|
|
1.5
|
|
1.1
|
|
||||||
|
Total segment assets
|
286.6
|
|
196.3
|
|
177.4
|
|
||||||
|
Total Net revenues
|
$
|
2,731.7
|
|
$
|
2,408.2
|
|
$
|
2,238.0
|
|
|||
|
Reconciliation to earnings before income taxes
|
||||||||||||
|
Segment operating income from reportable segments
|
$
|
600.7
|
|
$
|
562.1
|
|
$
|
498.1
|
|
|||
|
Unallocated corporate expense
|
74.9
|
|
69.6
|
|
63.8
|
|
||||||
|
Interest expense
|
54.0
|
|
105.7
|
|
64.3
|
|
||||||
|
Loss on divestitures
|
—
|
|
—
|
|
84.4
|
|
||||||
|
Other income, net
|
(3.4
|
)
|
(8.9
|
)
|
(9.4
|
)
|
||||||
|
Total earnings before income taxes
|
$
|
475.2
|
|
$
|
395.7
|
|
$
|
295.0
|
|
|||
|
Depreciation and amortization from reportable segments
|
$
|
78.1
|
|
$
|
57.5
|
|
$
|
56.4
|
|
|||
|
Unallocated depreciation and amortization
|
4.2
|
|
4.1
|
|
5.0
|
|
||||||
|
Total depreciation and amortization
|
$
|
82.3
|
|
|
$
|
61.6
|
|
|
$
|
61.4
|
|
|
|
Capital expenditures from reportable segments
|
$
|
42.9
|
|
$
|
44.7
|
|
$
|
36.2
|
|
|||
|
Corporate capital expenditures
|
6.2
|
|
4.6
|
|
6.3
|
|
||||||
|
Total capital expenditures
|
$
|
49.1
|
|
$
|
49.3
|
|
$
|
42.5
|
|
|||
|
Assets from reportable segments
|
$
|
2,514.5
|
|
$
|
2,096.4
|
|
$
|
1,916.3
|
|
|||
|
Unallocated assets
(a)
|
295.7
|
|
445.6
|
|
331.1
|
|
||||||
|
Total assets
|
$
|
2,810.2
|
|
$
|
2,542.0
|
|
$
|
2,247.4
|
|
|||
|
(a)
|
Unallocated assets consist of investments in unconsolidated affiliates, fixed assets, deferred income taxes and cash.
|
F-44
Net revenues by destination and product as well as long-lived assets by geographic area for the years ended December 31 were as follows:
|
In millions
|
2018
|
2017
|
2016
|
|||||||||
|
Net revenues
|
||||||||||||
|
U.S.
|
$
|
1,852.8
|
|
$
|
1,645.6
|
|
$
|
1,531.2
|
|
|||
|
Non-U.S.
|
878.9
|
|
762.6
|
|
706.8
|
|
||||||
|
Total
|
$
|
2,731.7
|
|
$
|
2,408.2
|
|
$
|
2,238.0
|
|
|||
|
In millions
|
2018
|
2017
|
2016
|
|||||||||
|
Net revenues
|
||||||||||||
|
Mechanical products
|
$
|
2,155.2
|
|
$
|
1,906.4
|
|
$
|
1,793.1
|
|
|||
|
All other
|
576.5
|
|
501.8
|
|
444.9
|
|
||||||
|
Total
|
$
|
2,731.7
|
|
$
|
2,408.2
|
|
$
|
2,238.0
|
|
|||
In fiscal year 2018, 2017 and 2016, no customer exceeded 10% of consolidated Net revenues.
At December 31, long-lived assets by geographic area were as follows:
|
In millions
|
2018
|
2017
|
||||||
|
Long-lived assets
|
||||||||
|
U.S.
|
$
|
245.1
|
|
$
|
131.0
|
|
||
|
Non-U.S.
|
448.1
|
|
440.1
|
|
||||
|
Total
|
$
|
693.2
|
|
$
|
571.1
|
|
||
NOTE 22 – SUBSEQUENT EVENTS
On February 5, 2019, the Company's Board of Directors declared a quarterly dividend of
$0.27
cents per ordinary share. The dividend is payable
March 29, 2019
to shareholders of record on March 15, 2019.
F-45
NOTE 23 – GUARANTOR FINANCIAL INFORMATION
Allegion US Hold Co is the issuer of the 3.200% and 3.550% Senior Notes. Allegion plc is the guarantor of the 3.200% and 3.550% Senior Notes. The following condensed and consolidated financial information of Allegion plc, Allegion US Hold Co and the other Allegion subsidiaries that are not guarantors (the "Other Subsidiaries") on a combined basis as of
December 31, 2018
and 2017, and for the years ended
December 31, 2018
,
2017
and
2016
, is being presented in order to meet the reporting requirements under the Senior Notes indenture and Rule 3-10 of Regulation S-X. In accordance with Rule 3-10(d) of Regulation S-X, separate financial statements for the Issuer, Allegion plc, whom is the guarantor, are not required to be filed with the SEC as the subsidiary debt issuer is directly or indirectly 100% owned by the Parent, whom is the guarantor, and the guarantees are full and unconditional and joint and several.
During the twelve months ended December 31, 2018, an entity previously presented in the "Other Subsidiaries" column merged with Allegion US Hold Co. The entity merged with Allegion US Hold Co primarily includes intercompany investments and related equity; there is no material statement of comprehensive income or cash flow activity related to this entity. As a result, the following condensed and consolidated financial information presented below as of December 31, 2017 and 2016 has been updated to reflect this new structure.
Condensed and Consolidated Statement of Comprehensive Income
For the year ended
December 31, 2018
|
In millions
|
Allegion plc
|
Allegion US Holding
|
Other
Subsidiaries
|
Consolidating
Adjustments
|
Total
|
||||||||||||||
|
Net revenues
|
$
|
—
|
|
$
|
—
|
|
$
|
2,731.7
|
|
$
|
—
|
|
$
|
2,731.7
|
|
||||
|
Cost of goods sold
|
—
|
|
—
|
|
1,558.4
|
|
—
|
|
1,558.4
|
|
|||||||||
|
Selling and administrative expenses
|
6.3
|
|
0.1
|
|
641.1
|
|
—
|
|
647.5
|
|
|||||||||
|
Operating income (loss)
|
(6.3
|
)
|
(0.1
|
)
|
532.2
|
|
—
|
|
525.8
|
|
|||||||||
|
Equity earnings (loss) in affiliates, net of tax
|
468.2
|
|
228.7
|
|
—
|
|
(696.9
|
)
|
—
|
|
|||||||||
|
Interest expense
|
27.4
|
|
25.8
|
|
0.8
|
|
—
|
|
54.0
|
|
|||||||||
|
Intercompany interest and fees
|
(0.4
|
)
|
107.3
|
|
(106.9
|
)
|
—
|
|
—
|
|
|||||||||
|
Other income, net
|
—
|
|
—
|
|
(3.4
|
)
|
—
|
|
(3.4
|
)
|
|||||||||
|
Earnings (loss) before income taxes
|
434.9
|
|
95.5
|
|
641.7
|
|
(696.9
|
)
|
475.2
|
|
|||||||||
|
Provision (benefit) for income taxes
|
—
|
|
(28.2
|
)
|
68.0
|
|
—
|
|
39.8
|
|
|||||||||
|
Net earnings (loss)
|
434.9
|
|
123.7
|
|
573.7
|
|
(696.9
|
)
|
435.4
|
|
|||||||||
|
Less: Net earnings attributable to noncontrolling interests
|
—
|
|
—
|
|
0.5
|
|
—
|
|
0.5
|
|
|||||||||
|
Net earnings (loss) attributable to Allegion plc
|
$
|
434.9
|
|
$
|
123.7
|
|
$
|
573.2
|
|
$
|
(696.9
|
)
|
$
|
434.9
|
|
||||
|
Total comprehensive income (loss)
|
$
|
374.0
|
|
$
|
133.6
|
|
$
|
501.9
|
|
$
|
(634.6
|
)
|
$
|
374.9
|
|
||||
|
Less: Total comprehensive income attributable to noncontrolling interests
|
—
|
|
—
|
|
0.9
|
|
—
|
|
0.9
|
|
|||||||||
|
Total comprehensive income (loss) attributable to Allegion plc
|
$
|
374.0
|
|
$
|
133.6
|
|
$
|
501.0
|
|
$
|
(634.6
|
)
|
$
|
374.0
|
|
||||
F-46
Condensed and Consolidated Statement of Comprehensive Income
For the year ended
December 31, 2017
|
In millions
|
Allegion plc
|
Allegion US Holding
|
Other
Subsidiaries |
Consolidating
Adjustments |
Total
|
||||||||||||||
|
Net revenues
|
$
|
—
|
|
$
|
—
|
|
$
|
2,408.2
|
|
$
|
—
|
|
$
|
2,408.2
|
|
||||
|
Cost of goods sold
|
—
|
|
—
|
|
1,335.3
|
|
—
|
|
1,335.3
|
|
|||||||||
|
Selling and administrative expenses
|
5.3
|
|
0.2
|
|
574.9
|
|
—
|
|
580.4
|
|
|||||||||
|
Operating income (loss)
|
(5.3
|
)
|
(0.2
|
)
|
498.0
|
|
—
|
|
492.5
|
|
|||||||||
|
Equity earnings (loss) in affiliates, net of tax
|
348.3
|
|
154.3
|
|
—
|
|
(502.6
|
)
|
—
|
|
|||||||||
|
Interest expense
|
70.6
|
|
34.8
|
|
0.3
|
|
—
|
|
105.7
|
|
|||||||||
|
Intercompany interest and fees
|
(0.9
|
)
|
111.1
|
|
(110.2
|
)
|
—
|
|
—
|
|
|||||||||
|
Other income, net
|
—
|
|
—
|
|
(8.9
|
)
|
—
|
|
(8.9
|
)
|
|||||||||
|
Earnings (loss) before income taxes
|
273.3
|
|
8.2
|
|
616.8
|
|
(502.6
|
)
|
395.7
|
|
|||||||||
|
Provision (benefit) for income taxes
|
—
|
|
(30.4
|
)
|
149.4
|
|
—
|
|
119.0
|
|
|||||||||
|
Net earnings (loss)
|
273.3
|
|
38.6
|
|
467.4
|
|
(502.6
|
)
|
276.7
|
|
|||||||||
|
Less: Net earnings attributable to noncontrolling interests
|
—
|
|
—
|
|
3.4
|
|
—
|
|
3.4
|
|
|||||||||
|
Net earnings (loss) attributable to Allegion plc
|
$
|
273.3
|
|
$
|
38.6
|
|
$
|
464.0
|
|
$
|
(502.6
|
)
|
$
|
273.3
|
|
||||
|
Total comprehensive income (loss)
|
$
|
391.1
|
|
$
|
39.3
|
|
$
|
584.1
|
|
$
|
(620.6
|
)
|
$
|
393.9
|
|
||||
|
Less: Total comprehensive income attributable to noncontrolling interests
|
—
|
|
—
|
|
2.8
|
|
—
|
|
2.8
|
|
|||||||||
|
Total comprehensive income (loss) attributable to Allegion plc
|
$
|
391.1
|
|
$
|
39.3
|
|
$
|
581.3
|
|
$
|
(620.6
|
)
|
$
|
391.1
|
|
||||
F-47
Condensed and Consolidated Statement of Comprehensive Income
For the year ended
December 31, 2016
|
In millions
|
Allegion plc
|
Allegion US Holding
|
Other
Subsidiaries |
Consolidating
Adjustments |
Total
|
||||||||||||||
|
Net revenues
|
$
|
—
|
|
$
|
—
|
|
$
|
2,238.0
|
|
$
|
—
|
|
$
|
2,238.0
|
|
||||
|
Cost of goods sold
|
—
|
|
—
|
|
1,248.3
|
|
—
|
|
1,248.3
|
|
|||||||||
|
Selling and administrative expenses
|
4.7
|
|
—
|
|
550.7
|
|
—
|
|
555.4
|
|
|||||||||
|
Operating income (loss)
|
(4.7
|
)
|
—
|
|
439.0
|
|
—
|
|
434.3
|
|
|||||||||
|
Equity earnings (loss) in affiliates, net of tax
|
277.3
|
|
155.5
|
|
—
|
|
(432.8
|
)
|
—
|
|
|||||||||
|
Interest expense
|
43.5
|
|
20.2
|
|
0.6
|
|
—
|
|
64.3
|
|
|||||||||
|
Intercompany interest and fees
|
(0.5
|
)
|
109.4
|
|
(108.9
|
)
|
—
|
|
—
|
|
|||||||||
|
Other expense, net
|
—
|
|
—
|
|
75.0
|
|
—
|
|
75.0
|
|
|||||||||
|
Earnings (loss) before income taxes
|
229.6
|
|
25.9
|
|
472.3
|
|
(432.8
|
)
|
295.0
|
|
|||||||||
|
Provision (benefit) for income taxes
|
0.5
|
|
(49.9
|
)
|
113.2
|
|
—
|
|
63.8
|
|
|||||||||
|
Net earnings (loss)
|
229.1
|
|
75.8
|
|
359.1
|
|
(432.8
|
)
|
231.2
|
|
|||||||||
|
Less: Net earnings attributable to noncontrolling interests
|
—
|
|
—
|
|
2.1
|
|
—
|
|
2.1
|
|
|||||||||
|
Net earnings (loss) attributable to Allegion plc
|
$
|
229.1
|
|
$
|
75.8
|
|
$
|
357.0
|
|
$
|
(432.8
|
)
|
$
|
229.1
|
|
||||
|
Total comprehensive income (loss)
|
$
|
197.0
|
|
$
|
79.6
|
|
$
|
320.8
|
|
$
|
(398.7
|
)
|
$
|
198.7
|
|
||||
|
Less: Total comprehensive income attributable to noncontrolling interests
|
—
|
|
—
|
|
1.7
|
|
—
|
|
1.7
|
|
|||||||||
|
Total comprehensive income (loss) attributable to Allegion plc
|
$
|
197.0
|
|
$
|
79.6
|
|
$
|
319.1
|
|
$
|
(398.7
|
)
|
$
|
197.0
|
|
||||
F-48
Condensed and Consolidated Balance Sheet
December 31, 2018
|
In millions
|
Allegion plc
|
Allegion US Holding
|
Other
Subsidiaries |
Consolidating
Adjustments |
Total
|
||||||||||||||
|
Current assets:
|
|||||||||||||||||||
|
Cash and cash equivalents
|
$
|
4.2
|
|
$
|
1.0
|
|
$
|
278.6
|
|
$
|
—
|
|
$
|
283.8
|
|
||||
|
Restricted cash
|
—
|
|
—
|
|
6.8
|
|
—
|
|
6.8
|
|
|||||||||
|
Accounts and notes receivable, net
|
—
|
|
—
|
|
324.9
|
|
—
|
|
324.9
|
|
|||||||||
|
Inventories
|
—
|
|
—
|
|
280.3
|
|
—
|
|
280.3
|
|
|||||||||
|
Other current assets
|
0.5
|
|
33.7
|
|
19.1
|
|
(18.3
|
)
|
35.0
|
|
|||||||||
|
Assets held for sale
|
—
|
|
—
|
|
0.8
|
|
—
|
|
0.8
|
|
|||||||||
|
Accounts and notes receivable affiliates
|
—
|
|
816.2
|
|
369.8
|
|
(1,186.0
|
)
|
—
|
|
|||||||||
|
Total current assets
|
4.7
|
|
850.9
|
|
1,280.3
|
|
(1,204.3
|
)
|
931.6
|
|
|||||||||
|
Investment in affiliates
|
1,265.8
|
|
718.2
|
|
—
|
|
(1,984.0
|
)
|
—
|
|
|||||||||
|
Property, plant and equipment, net
|
—
|
|
—
|
|
276.7
|
|
—
|
|
276.7
|
|
|||||||||
|
Intangible assets, net
|
—
|
|
—
|
|
1,430.1
|
|
—
|
|
1,430.1
|
|
|||||||||
|
Notes receivable affiliates
|
30.8
|
|
1,061.2
|
|
2,553.4
|
|
(3,645.4
|
)
|
—
|
|
|||||||||
|
Other noncurrent assets
|
4.0
|
|
61.2
|
|
106.6
|
|
—
|
|
171.8
|
|
|||||||||
|
Total assets
|
$
|
1,305.3
|
|
$
|
2,691.5
|
|
$
|
5,647.1
|
|
$
|
(6,833.7
|
)
|
$
|
2,810.2
|
|
||||
|
Current liabilities:
|
|||||||||||||||||||
|
Accounts payable and accruals
|
$
|
2.0
|
|
$
|
6.8
|
|
$
|
495.0
|
|
$
|
(18.3
|
)
|
$
|
485.5
|
|
||||
|
Short-term borrowings and current maturities of long-term debt
|
35.0
|
|
—
|
|
0.3
|
|
—
|
|
35.3
|
|
|||||||||
|
Accounts and note payable affiliates
|
0.3
|
|
369.5
|
|
816.2
|
|
(1,186.0
|
)
|
—
|
|
|||||||||
|
Total current liabilities
|
37.3
|
|
376.3
|
|
1,311.5
|
|
(1,204.3
|
)
|
520.8
|
|
|||||||||
|
Long-term debt
|
615.8
|
|
792.8
|
|
0.9
|
|
—
|
|
1,409.5
|
|
|||||||||
|
Notes payable affiliates
|
—
|
|
2,553.4
|
|
1,092.0
|
|
(3,645.4
|
)
|
—
|
|
|||||||||
|
Other noncurrent liabilities
|
1.2
|
|
5.5
|
|
219.2
|
|
—
|
|
225.9
|
|
|||||||||
|
Total liabilities
|
654.3
|
|
3,728.0
|
|
2,623.6
|
|
(4,849.7
|
)
|
2,156.2
|
|
|||||||||
|
Equity:
|
|||||||||||||||||||
|
Total shareholders’ equity (deficit)
|
651.0
|
|
(1,036.5
|
)
|
3,020.5
|
|
(1,984.0
|
)
|
651.0
|
|
|||||||||
|
Noncontrolling interests
|
—
|
|
—
|
|
3.0
|
|
—
|
|
3.0
|
|
|||||||||
|
Total equity (deficit)
|
651.0
|
|
(1,036.5
|
)
|
3,023.5
|
|
(1,984.0
|
)
|
654.0
|
|
|||||||||
|
Total liabilities and equity
|
$
|
1,305.3
|
|
$
|
2,691.5
|
|
$
|
5,647.1
|
|
$
|
(6,833.7
|
)
|
$
|
2,810.2
|
|
||||
F-49
Condensed and Consolidated Balance Sheet
December 31, 2017
|
In millions
|
Allegion plc
|
Allegion US Holding
|
Other
Subsidiaries |
Consolidating
Adjustments |
Total
|
||||||||||||||
|
Current assets:
|
|||||||||||||||||||
|
Cash and cash equivalents
|
$
|
0.7
|
|
$
|
0.3
|
|
$
|
465.2
|
|
$
|
—
|
|
$
|
466.2
|
|
||||
|
Accounts and notes receivable, net
|
—
|
|
—
|
|
296.6
|
|
—
|
|
296.6
|
|
|||||||||
|
Inventories
|
—
|
|
—
|
|
239.8
|
|
—
|
|
239.8
|
|
|||||||||
|
Other current assets
|
0.3
|
|
56.3
|
|
16.7
|
|
(44.1
|
)
|
29.2
|
|
|||||||||
|
Assets held for sale
|
—
|
|
—
|
|
0.9
|
|
—
|
|
0.9
|
|
|||||||||
|
Accounts and notes receivable affiliates
|
—
|
|
430.0
|
|
305.3
|
|
(735.3
|
)
|
—
|
|
|||||||||
|
Total current assets
|
1.0
|
|
486.6
|
|
1,324.5
|
|
(779.4
|
)
|
1,032.7
|
|
|||||||||
|
Investment in affiliates
|
1,079.6
|
|
240.8
|
|
—
|
|
(1,320.4
|
)
|
—
|
|
|||||||||
|
Property, plant and equipment, net
|
—
|
|
—
|
|
252.2
|
|
—
|
|
252.2
|
|
|||||||||
|
Intangible assets, net
|
—
|
|
—
|
|
1,155.5
|
|
—
|
|
1,155.5
|
|
|||||||||
|
Notes receivable affiliates
|
3.5
|
|
1,580.3
|
|
2,381.0
|
|
(3,964.8
|
)
|
—
|
|
|||||||||
|
Other noncurrent assets
|
5.1
|
|
5.5
|
|
91.0
|
|
—
|
|
101.6
|
|
|||||||||
|
Total assets
|
$
|
1,089.2
|
|
$
|
2,313.2
|
|
$
|
5,204.2
|
|
$
|
(6,064.6
|
)
|
$
|
2,542.0
|
|
||||
|
Current liabilities:
|
|||||||||||||||||||
|
Accounts payable and accruals
|
$
|
1.9
|
|
$
|
7.0
|
|
$
|
461.0
|
|
$
|
(44.1
|
)
|
$
|
425.8
|
|
||||
|
Short-term borrowings and current maturities of long-term debt
|
35.0
|
|
—
|
|
—
|
|
—
|
|
35.0
|
|
|||||||||
|
Accounts and note payable affiliates
|
0.2
|
|
304.9
|
|
430.2
|
|
(735.3
|
)
|
—
|
|
|||||||||
|
Total current liabilities
|
37.1
|
|
311.9
|
|
891.2
|
|
(779.4
|
)
|
460.8
|
|
|||||||||
|
Long-term debt
|
649.3
|
|
792.0
|
|
1.0
|
|
—
|
|
1,442.3
|
|
|||||||||
|
Notes payable affiliates
|
—
|
|
2,381.0
|
|
1,583.8
|
|
(3,964.8
|
)
|
—
|
|
|||||||||
|
Other noncurrent liabilities
|
1.2
|
|
4.2
|
|
228.0
|
|
—
|
|
233.4
|
|
|||||||||
|
Total liabilities
|
687.6
|
|
3,489.1
|
|
2,704.0
|
|
(4,744.2
|
)
|
2,136.5
|
|
|||||||||
|
Equity:
|
|||||||||||||||||||
|
Total shareholders’ equity (deficit)
|
401.6
|
|
(1,175.9
|
)
|
2,496.3
|
|
(1,320.4
|
)
|
401.6
|
|
|||||||||
|
Noncontrolling interests
|
—
|
|
—
|
|
3.9
|
|
—
|
|
3.9
|
|
|||||||||
|
Total equity (deficit)
|
401.6
|
|
(1,175.9
|
)
|
2,500.2
|
|
(1,320.4
|
)
|
405.5
|
|
|||||||||
|
Total liabilities and equity
|
$
|
1,089.2
|
|
$
|
2,313.2
|
|
$
|
5,204.2
|
|
$
|
(6,064.6
|
)
|
$
|
2,542.0
|
|
||||
F-50
Condensed and Consolidated Statement of Cash Flows
For the year ended
December 31, 2018
|
In millions
|
Allegion plc
|
Allegion US Holding
|
Other
Subsidiaries |
Consolidating
Adjustments |
Total
|
||||||||||||||
|
Net cash provided by (used in) operating activities
|
$
|
209.3
|
|
$
|
(59.5
|
)
|
$
|
631.7
|
|
$
|
(323.7
|
)
|
$
|
457.8
|
|
||||
|
Cash flows from investing activities:
|
|||||||||||||||||||
|
Capital expenditures
|
—
|
|
—
|
|
(49.1
|
)
|
—
|
|
(49.1
|
)
|
|||||||||
|
Acquisition of and equity investments in businesses, net of cash acquired
|
—
|
|
(248.5
|
)
|
(127.6
|
)
|
—
|
|
(376.1
|
)
|
|||||||||
|
Purchase of investments
|
—
|
|
—
|
|
(14.3
|
)
|
—
|
|
(14.3
|
)
|
|||||||||
|
Other investing activities, net
|
—
|
|
(1.0
|
)
|
(4.3
|
)
|
1.0
|
|
(4.3
|
)
|
|||||||||
|
Net cash (used in) provided by investing activities
|
—
|
|
(249.5
|
)
|
(195.3
|
)
|
1.0
|
|
(443.8
|
)
|
|||||||||
|
Cash flows from financing activities:
|
|||||||||||||||||||
|
Debt repayments, net
|
(35.0
|
)
|
—
|
|
(1.1
|
)
|
—
|
|
(36.1
|
)
|
|||||||||
|
Net inter-company proceeds (payments)
|
(27.3
|
)
|
309.7
|
|
(282.4
|
)
|
—
|
|
—
|
|
|||||||||
|
Dividends paid to shareholders
|
(79.4
|
)
|
—
|
|
—
|
|
—
|
|
(79.4
|
)
|
|||||||||
|
Dividends paid
|
—
|
|
—
|
|
(323.7
|
)
|
323.7
|
|
—
|
|
|||||||||
|
Proceeds from shares issued under incentive plans
|
3.2
|
|
—
|
|
—
|
|
—
|
|
3.2
|
|
|||||||||
|
Repurchase of ordinary shares
|
(67.3
|
)
|
—
|
|
—
|
|
—
|
|
(67.3
|
)
|
|||||||||
|
Other financing activities, net
|
—
|
|
—
|
|
(2.8
|
)
|
(1.0
|
)
|
(3.8
|
)
|
|||||||||
|
Net cash (used in) provided by financing activities
|
(205.8
|
)
|
309.7
|
|
(610.0
|
)
|
322.7
|
|
(183.4
|
)
|
|||||||||
|
Effect of exchange rate changes on cash and cash equivalents
|
—
|
|
—
|
|
(6.2
|
)
|
—
|
|
(6.2
|
)
|
|||||||||
|
Net increase (decrease) in cash, cash equivalents and restricted cash
|
3.5
|
|
0.7
|
|
(179.8
|
)
|
—
|
|
(175.6
|
)
|
|||||||||
|
Cash, cash equivalents and restricted cash – beginning of period
|
0.7
|
|
0.3
|
|
465.2
|
|
—
|
|
466.2
|
|
|||||||||
|
Cash, cash equivalents and restricted cash – end of period
|
$
|
4.2
|
|
$
|
1.0
|
|
$
|
285.4
|
|
$
|
—
|
|
$
|
290.6
|
|
||||
F-51
Condensed and Consolidated Statement of Cash Flows
For the year ended
December 31, 2017
|
In millions
|
Allegion plc
|
Allegion US Holding
|
Other
Subsidiaries |
Consolidating
Adjustments |
Total
|
||||||||||||||
|
Net cash provided by (used in) operating activities
|
$
|
581.3
|
|
$
|
63.3
|
|
$
|
565.0
|
|
$
|
(862.4
|
)
|
$
|
347.2
|
|
||||
|
Cash flows from investing activities:
|
|||||||||||||||||||
|
Capital expenditures
|
—
|
|
—
|
|
(49.3
|
)
|
—
|
|
(49.3
|
)
|
|||||||||
|
Acquisition of businesses, net of cash acquired
|
—
|
|
—
|
|
(20.8
|
)
|
—
|
|
(20.8
|
)
|
|||||||||
|
Proceeds from sale of property, plant and equipment
|
—
|
|
—
|
|
3.1
|
|
—
|
|
3.1
|
|
|||||||||
|
Proceeds from sale of equity investment
|
—
|
|
—
|
|
15.6
|
|
—
|
|
15.6
|
|
|||||||||
|
Proceeds (payments) related to business dispositions
|
—
|
|
—
|
|
1.2
|
|
—
|
|
1.2
|
|
|||||||||
|
Net cash used in investing activities
|
—
|
|
—
|
|
(50.2
|
)
|
—
|
|
(50.2
|
)
|
|||||||||
|
Cash flows from financing activities:
|
|||||||||||||||||||
|
Debt repayments, net
|
(488.5
|
)
|
500.0
|
|
(1.4
|
)
|
—
|
|
10.1
|
|
|||||||||
|
Debt issuance costs
|
(4.0
|
)
|
(5.5
|
)
|
—
|
|
—
|
|
(9.5
|
)
|
|||||||||
|
Net inter-company proceeds (payments)
|
49.7
|
|
(546.3
|
)
|
496.6
|
|
—
|
|
—
|
|
|||||||||
|
Redemption premium
|
(24.6
|
)
|
(8.6
|
)
|
—
|
|
—
|
|
(33.2
|
)
|
|||||||||
|
Dividends paid to shareholders
|
(60.9
|
)
|
—
|
|
—
|
|
—
|
|
(60.9
|
)
|
|||||||||
|
Dividends paid
|
—
|
|
—
|
|
(862.4
|
)
|
862.4
|
|
—
|
|
|||||||||
|
Proceeds from shares issued under incentive plans
|
7.2
|
|
—
|
|
—
|
|
—
|
|
7.2
|
|
|||||||||
|
Repurchase of ordinary shares
|
(60.0
|
)
|
—
|
|
—
|
|
—
|
|
(60.0
|
)
|
|||||||||
|
Other financing activities, net
|
—
|
|
(2.8
|
)
|
(1.8
|
)
|
—
|
|
(4.6
|
)
|
|||||||||
|
Net cash (used in) provided by financing activities
|
(581.1
|
)
|
(63.2
|
)
|
(369.0
|
)
|
862.4
|
|
(150.9
|
)
|
|||||||||
|
Effect of exchange rate changes on cash and cash equivalents
|
—
|
|
—
|
|
7.7
|
|
—
|
|
7.7
|
|
|||||||||
|
Net increase in cash and cash equivalents
|
0.2
|
|
0.1
|
|
153.5
|
|
—
|
|
153.8
|
|
|||||||||
|
Cash and cash equivalents - beginning of period
|
0.5
|
|
0.2
|
|
311.7
|
|
—
|
|
312.4
|
|
|||||||||
|
Cash and cash equivalents - end of period
|
$
|
0.7
|
|
$
|
0.3
|
|
$
|
465.2
|
|
$
|
—
|
|
$
|
466.2
|
|
||||
F-52
Condensed and Consolidated Statement of Cash Flows
For the year ended
December 31, 2016
|
In millions
|
Allegion plc
|
Allegion US Holding
|
Other
Subsidiaries |
Consolidating
Adjustments |
Total
|
||||||||||||||
|
Net cash (used in) provided by operating activities
|
$
|
(25.6
|
)
|
$
|
156.6
|
|
$
|
542.2
|
|
$
|
(295.7
|
)
|
$
|
377.5
|
|
||||
|
Cash flows from investing activities:
|
|||||||||||||||||||
|
Capital expenditures
|
—
|
|
—
|
|
(42.5
|
)
|
—
|
|
(42.5
|
)
|
|||||||||
|
Acquisition of businesses, net of cash acquired
|
—
|
|
—
|
|
(31.4
|
)
|
—
|
|
(31.4
|
)
|
|||||||||
|
Proceeds from sales and maturities of marketable securities
|
—
|
|
—
|
|
14.1
|
|
—
|
|
14.1
|
|
|||||||||
|
Proceeds (payments) related to business disposition
|
—
|
|
—
|
|
(4.3
|
)
|
—
|
|
(4.3
|
)
|
|||||||||
|
Other investing activities, net
|
—
|
|
—
|
|
0.1
|
|
—
|
|
0.1
|
|
|||||||||
|
Net cash used in investing activities
|
—
|
|
—
|
|
(64.0
|
)
|
—
|
|
(64.0
|
)
|
|||||||||
|
Cash flows from financing activities:
|
|||||||||||||||||||
|
Debt repayments, net
|
(47.0
|
)
|
—
|
|
(17.4
|
)
|
—
|
|
(64.4
|
)
|
|||||||||
|
Debt issuance costs
|
(0.3
|
)
|
—
|
|
—
|
|
—
|
|
(0.3
|
)
|
|||||||||
|
Net inter-company proceeds (payments)
|
195.4
|
|
(157.4
|
)
|
(38.0
|
)
|
—
|
|
—
|
|
|||||||||
|
Dividends paid to shareholders
|
(46.0
|
)
|
—
|
|
—
|
|
—
|
|
(46.0
|
)
|
|||||||||
|
Dividends paid to noncontrolling interests
|
—
|
|
—
|
|
(2.7
|
)
|
—
|
|
(2.7
|
)
|
|||||||||
|
Dividends paid
|
—
|
|
—
|
|
(295.7
|
)
|
295.7
|
|
—
|
|
|||||||||
|
Acquisition of noncontrolling interest
|
—
|
|
—
|
|
(3.3
|
)
|
—
|
|
(3.3
|
)
|
|||||||||
|
Proceeds from shares issued under incentive plans
|
5.8
|
|
—
|
|
—
|
|
—
|
|
5.8
|
|
|||||||||
|
Repurchase of ordinary shares
|
(85.1
|
)
|
—
|
|
—
|
|
—
|
|
(85.1
|
)
|
|||||||||
|
Net cash provided by (used in) financing activities
|
22.8
|
|
(157.4
|
)
|
(357.1
|
)
|
295.7
|
|
(196.0
|
)
|
|||||||||
|
Effect of exchange rate changes on cash and cash equivalents
|
—
|
|
—
|
|
(4.8
|
)
|
—
|
|
(4.8
|
)
|
|||||||||
|
Net (decrease) increase in cash and cash equivalents
|
(2.8
|
)
|
(0.8
|
)
|
116.3
|
|
—
|
|
112.7
|
|
|||||||||
|
Cash and cash equivalents - beginning of period
|
3.3
|
|
1.0
|
|
195.4
|
|
—
|
|
199.7
|
|
|||||||||
|
Cash and cash equivalents - end of period
|
$
|
0.5
|
|
$
|
0.2
|
|
$
|
311.7
|
|
$
|
—
|
|
$
|
312.4
|
|
||||
F-53
SCHEDULE II
ALLEGION PLC
VALUATION AND QUALIFYING ACCOUNTS
FOR THE YEARS ENDED
DECEMBER 31, 2018
,
2017
AND
2016
(Amounts in millions)
|
Allowances for Doubtful Accounts:
|
|
||
|
Balance December 31, 2015
|
$
|
3.8
|
|
|
Additions charged to costs and expenses
|
0.1
|
|
|
|
Deductions*
|
(1.1
|
)
|
|
|
Currency translation
|
(0.1
|
)
|
|
|
Balance December 31, 2016
|
2.7
|
|
|
|
Additions charged to costs and expenses
|
0.8
|
|
|
|
Deductions*
|
(0.9
|
)
|
|
|
Currency translation
|
0.2
|
|
|
|
Balance December 31, 2017
|
2.8
|
|
|
|
Additions charged to costs and expenses
|
1.6
|
|
|
|
Deductions*
|
(1.0
|
)
|
|
|
Currency translation
|
(0.1
|
)
|
|
|
Balance December 31, 2018
|
$
|
3.3
|
|
|
*
|
"Deductions" include accounts and advances written off, less recoveries.
|
F-54
TABLE OF CONTENTS
Part IItem 1. BusinessItem 1A. Risk FactorsItem 1B. Unresolved Staff CommentsItem 2. PropertiesItem 3. Legal ProceedingsItem 4. Mine Safety DisclosuresPart IIItem 5. Market For Registrant S Common Equity, Related Stockholder Matters andItem 6. Selected Financial Data (1)Item 7. Management S Discussion and Analysis Of Financial Condition and Results Of OperationsItem 7A. Quantitative and Qualitative Disclosure About Market RiskItem 8. Financial Statements and Supplementary DataItem 9. Changes in and Disagreements with Accountants on Accounting and FinancialItem 9A. Controls and ProceduresItem 9B. Other InformationPart IIIItem 10. Directors, Executive Officers and Corporate GovernanceItem 11. Executive CompensationItem 12. Security Ownership Of Certain Beneficial Owners and Management and RelatedItem 13. Certain Relationships and Related Transactions, and Director IndependenceItem 14. Principal Accountant Fees and ServicesPart IVItem 15. Exhibits and Financial Statement SchedulesItem 16. Form 10-k SummaryNote 1 Description Of Company and Basis Of PresentationNote 2 Summary Of Significant Accounting PoliciesNote 3 InventoriesNote 4 Property, Plant and EquipmentNote 5 GoodwillNote 6 Intangible AssetsNote 7 - AcquisitionsNote 8 - DivestituresNote 9 Debt and Credit FacilitiesNote 10 Financial InstrumentsNote 11 Pensions and Postretirement Benefits Other Than PensionsNote 12 Fair Value MeasurementsNote 13 EquityNote 14 Share-based CompensationNote 15 Restructuring ActivitiesNote 16 Other Income, NetNote 17 Income TaxesNote 18 Earnings Per Share (eps)Note 19 Net RevenuesNote 20 Commitments and ContingenciesNote 21 Business Segment InformationNote 22 Subsequent EventsNote 23 Guarantor Financial Information