ALLISON TRANSMISSION HOLDINGS INC
10-Ks and 10-Qs
|
|
|
|
|
|
|
|
|
|
|
|
|
|
|
|
|
|
|
|
|
|
|
|
|
|
|
|
|
|
|
|
|
|
|
|
|
|
|
|
|
|
|
|
|
|
|
UNITED STATES
SECURITIES AND EXCHANGE COMMISSION
WASHINGTON, D.C. 20549
____________________________________________
FORM 10-K
____________________________________________
|
x
|
ANNUAL REPORT PURSUANT TO SECTION 13 OR 15(d) OF THE SECURITIES EXCHANGE ACT OF 1934
|
For the Fiscal Year Ended
December 31, 2018
OR
|
o
|
TRANSITION REPORT PURSUANT TO SECTION 13 OR 15(d) OF THE SECURITIES EXCHANGE ACT OF 1934
|
Commission File No. 001-35456
____________________________________________
ALLISON TRANSMISSION HOLDINGS, INC.
(Exact Name of Registrant as Specified in Its Charter)
____________________________________________
|
Delaware
|
|
26-0414014
|
|
(State of Incorporation)
|
|
(I.R.S. Employer
Identification Number)
|

One Allison Way
Indianapolis, IN 46222
(Address of Principal Executive Offices and Zip Code)
(317) 242-5000
(Registrant’s Telephone Number, Including Area Code)
Securities registered pursuant to Section 12(b) of the Act:
|
Title of each class
|
|
Name of each exchange on which registered
|
|
Common Stock, $0.01 par value
|
|
New York Stock Exchange
|
Securities registered pursuant to Section 12(g) of the Act: None
Indicate by check mark if the registrant is a well-known seasoned issuer, as defined in Rule 405 of the Securities Act.
Yes
x
No
☐
Indicate by check mark if the registrant is not required to file reports pursuant to Section 13 or Section 15(d) of the Act. Yes
☐
No
x
Indicate by check mark whether the registrant (1) has filed all reports required to be filed by Section 13 or 15(d) of the Securities Exchange Act of 1934 during the preceding 12 months (or for such shorter period that the registrant was required to file such reports), and (2) has been subject to such filing requirements for the past 90 days. Yes
x
No
☐
Indicate by check mark whether the registrant has submitted electronically every Interactive Data File required to be submitted pursuant to Rule 405 of Regulation S-T (§232.405 of this chapter) during the preceding 12 months (or for such shorter period that the registrant was required to submit such files). Yes
x
No
☐
Indicate by check mark if disclosure of delinquent filers pursuant to Item 405 of Regulation S-K (§229.405 of this chapter) is not contained herein, and will not be contained, to the best of registrant’s knowledge, in definitive proxy or information statements incorporated by reference in Part III of this Form 10-K or any amendment to this Form 10-K.
x
Indicate by check mark whether the registrant is a large accelerated filer, an accelerated filer, a non-accelerated filer, a smaller reporting company or an emerging growth company. See the definitions of “large accelerated filer,” “accelerated filer,” “smaller reporting company” and “emerging growth company” in Rule 12b-2 of the Exchange Act.
|
Large accelerated filer
|
|
x
|
|
Accelerated filer
|
|
☐
|
|
Non-accelerated filer
|
|
☐
|
|
Smaller reporting company
|
|
☐
|
|
Emerging growth company
|
|
☐
|
|
|
||
If an emerging growth company, indicate by check mark if the registrant has elected not to use the extended transition period for complying with any new or revised financial accounting standards provided pursuant to Section 13(a) of the Exchange Act.
☐
Indicate by check mark whether the registrant is a shell company (as defined in Rule 12b-2 of the Exchange Act). Yes
☐
No
x
The aggregate market value of the voting and non-voting stock held by non-affiliates was approximately $5,282 million as of June 29, 2018.
As of February 11, 2019, there were 126,129,727 shares of Common Stock outstanding.
Documents Incorporated by Reference
Portions of the Registrant’s definitive Proxy Statement for its
2019
annual meeting of stockholders will be incorporated by reference in Part III of this Annual Report on Form 10-K.
INDEX
|
|
|
Page
|
|
Item 1.
|
3-16
|
|
|
Item 1A.
|
17-29
|
|
|
Item 1B.
|
30
|
|
|
Item 2.
|
30
|
|
|
Item 3.
|
30
|
|
|
Item 4.
|
30
|
|
|
Item 5.
|
31-32
|
|
|
Item 6.
|
33
|
|
|
Item 7.
|
34-49
|
|
|
Item 7A.
|
50
|
|
|
Item 8.
|
51-97
|
|
|
Item 9.
|
98
|
|
|
Item 9A.
|
98
|
|
|
Item 9B.
|
98
|
|
|
Item 10.
|
99
|
|
|
Item 11.
|
99
|
|
|
Item 12.
|
99
|
|
|
Item 13.
|
99
|
|
|
Item 14.
|
99
|
|
|
Item 15.
|
100-104
|
|
|
Item 16.
|
105
|
|
1
Cautionary Note Regarding Forward-Looking Statements
This Annual Report on Form 10-K contains forward-looking statements. The words “believe,” “expect,” “anticipate,” “intend,” “estimate” and other expressions that are predictions of or indicate future events and trends and that do not relate to historical matters identify forward-looking statements. You should not place undue reliance on these forward-looking statements. Although forward-looking statements reflect management’s good faith beliefs, reliance should not be placed on forward-looking statements because they involve known and unknown risks, uncertainties and other factors, which may cause the actual results, performance or achievements to differ materially from anticipated future results, performance or achievements expressed or implied by such forward-looking statements. Forward-looking statements speak only as of the date the statements are made. We undertake no obligation to publicly update or revise any forward-looking statement, whether as a result of new information, future events, changed circumstances or otherwise. These forward-looking statements are subject to numerous risks and uncertainties, including, but not limited to: our participation in markets that are competitive; the highly cyclical industries in which certain of our end users operate; uncertainty in the global regulatory and business environments in which we operate; our ability to prepare for, respond to and successfully achieve our objectives relating to technological and market developments, competitive threats and changing customer needs; the concentration of our net sales in our top five customers and the loss of any one of these; the failure of markets outside North America to increase adoption of fully-automatic transmissions; U.S. and foreign defense spending; general economic and industry conditions; increases in cost, disruption of supply or shortage of raw materials or components used in our product; the discovery of defects in our products, resulting in delays in new model launches, recall campaigns and/or increased warranty costs and reduction in future sales or damage to our brand and reputation; risks associated with our international operations, including increased trade protectionism; labor strikes, work stoppages or similar labor disputes, which could significantly disrupt our operations or those of our principal customers; risks related to our substantial indebtedness; and our intention to pay dividends and repurchase shares of our common stock.
Important factors that could cause actual results to differ materially from our expectations are disclosed under Part I, Item 1A, “Risk Factors” in this Annual Report on Form 10-K. All written and oral forward-looking statements attributable to us, or persons acting on our behalf, are expressly qualified in their entirety by the cautionary statements as well as other cautionary statements that are made from time to time in our other Securities and Exchange Commission filings or public communications. You should evaluate all forward-looking statements made in this Annual Report on Form 10-K in the context of these risks and uncertainties.
Certain Trademarks
This Annual Report on Form 10-K includes trademarks, such as Allison Transmission and ReTran, which are protected under applicable intellectual property laws and are our property and/or the property of our subsidiaries. This report also contains trademarks, service marks, copyrights and trade names of other companies, which are the property of their respective owners. We do not intend our use or display of other companies’ trademarks, service marks, copyrights or trade names to imply a relationship with, or endorsement or sponsorship of us by, any other companies. Solely for convenience, our trademarks and trade names referred to in this report may appear without the
®
or
TM
symbols, but such references are not intended to indicate, in any way, that we will not assert, to the fullest extent under applicable law, our rights or the right of the applicable licensor to these trademarks and trade names.
2
|
PART I.
|
ITEM 1. Business
Overview
Allison Transmission Holdings, Inc. and its subsidiaries (“Allison,” the “Company” or “we”) design and manufacture commercial and defense fully-automatic transmissions. The business was founded in 1915 and has been headquartered in Indianapolis, Indiana since inception. Allison was an operating unit of General Motors Corporation from 1929 until 2007, when Allison once again became a stand-alone company. In March 2012, Allison began trading on the New York Stock Exchange under the symbol “ALSN”.
We have approximately
2,900
employees and
12
different transmission product lines. Although approximately
77%
of revenues were generated in North America in
2018
, we have a global presence by serving customers in Europe, Asia, South America and Africa. We serve customers through an independent network of approximately
1,400
independent distributor and dealer locations worldwide.
Our Business
We are the world’s largest manufacturer of fully-automatic transmissions for medium- and heavy-duty commercial vehicles and medium- and heavy-tactical U.S. defense vehicles. Allison transmissions are used in a wide variety of applications, including on-highway trucks (distribution, refuse, construction, fire and emergency), buses (primarily school, transit and electric hybrid-transit), motorhomes, off-highway vehicles and equipment (primarily energy, mining and construction) and defense vehicles (wheeled and tracked). We estimate that globally, in
2018
, we sold approximately 60% of all fully-automatic transmissions for medium- and heavy-duty on-highway commercial vehicle applications. We believe the Allison brand is one of the most recognized in our industry as a result of the performance, reliability and fuel efficiency of our transmissions and is associated with high quality, durability, vocational value, technological leadership and superior customer service.
We introduced the world’s first fully-automatic transmission for commercial vehicles over 60 years ago. Since that time, we have driven the trend in North America and Western Europe towards increasing automaticity by targeting a diverse range of commercial vehicle vocations. Allison transmissions are optimized for the unique performance requirements of end users, which typically vary by vocation. Our products are highly engineered, requiring advanced manufacturing processes, and employ complex software algorithms for our transmission controls to maximize end user performance. We have developed over 100 different models that are used in more than 2,500 different vehicle configurations and are compatible with more than 500 combinations of engine brands, models and ratings (including diesel, gasoline, natural gas and other alternative fuels). Additionally, we have created thousands of unique Allison-developed calibrations available to be used with our transmission control modules.
Our Industry
Commercial vehicles typically employ one of three transmission types: manual, automated manual or fully-automatic. Manual and automated manual transmissions ("AMT") are the most prevalent transmission type used in Class 8 tractors in North America. Manual transmissions are the most prevalent in medium- and heavy-duty commercial vehicles, generally, outside North America. Manual transmissions utilize a disconnect clutch causing power to be interrupted during each gear shift resulting in energy loss-related inefficiencies and less work being accomplished for a given amount of fuel consumed. In long-distance trucking, this power interruption is not a significant factor, as the manual transmission provides its highest degree of fuel economy during steady-state cruising. However, steady-state cruising is only one part of the duty cycle. When the duty cycle requires a high degree of “start and stop” activity or speed transients, as is common in many vocations as well as in urban environments, we believe manual transmissions result in reduced performance, lower fuel efficiency, lower average speed for a given amount of fuel consumed and inferior ride quality. Moreover, the clutches must be replaced regularly, resulting in increased maintenance expense and vehicle downtime. Manual transmissions also require a skilled driver to operate the disconnect clutch when launching the vehicle and shifting gears. AMTs are manual transmissions that feature automated operation of the disconnect clutch. Fully-automatic transmissions utilize technology that smoothly shifts gears instead of a disconnect clutch, thereby delivering uninterrupted power to the wheels during gear shifts and requiring minimal driver input. These transmissions deliver superior acceleration, higher productivity, increased fuel efficiency, reduced operating costs, less driveline shock and smoother shifting relative to both manual transmissions and AMTs in vocations with a high degree of “start and stop” activity, as well as in urban environments.
Emerging technologies in commercial-duty transmissions and powertrains include dual clutch transmissions (“DCT”) and electric drive powertrains. DCTs are variants of manual transmissions and AMTs that incorporate a “dual clutch” mechanism to facilitate shifting the manual transmission gearbox. Electric drive powertrains are also emerging in certain end markets, such as transit buses, and are in part driven by efforts to reduce fuel consumption and greenhouse gas emissions. Electric drive powertrains differ from “electric hybrid” powertrains because they only propel the vehicle with an electric motor; while “electric hybrids” generally utilize both a conventional internal combustion power source and powertrain as well as the means to propel the vehicle electrically. While both emerging technologies are gaining use in niche automotive markets, they are just beginning to evolve and become proven in commercial vehicle markets.
Fuel efficiency, reduction in fuel consumption and reduced emissions are important considerations for commercial vehicles everywhere and they tend to go together. We believe fuel efficiency, the measure of work performed for a given amount of fuel consumed, is the best method to assess fuel consumption of commercial vehicles as compared to the more commonly-used fuel economy metric of miles-per-gallon (“MPG”). MPG is inadequate for commercial vehicles because it does not encompass two key elements of efficiency that we believe are important to vehicle owners and operators: payload and transport time. For example, if more work can be completed or more payload hauled using the same amount of fuel and/or over a shorter period of time, then we believe the vehicle is more fuel efficient. Since fuel economy only accounts for distance traveled and fuel consumed, ignoring time and work performed, we believe it is therefore an inferior metric to fuel efficiency when it comes to assessing commercial vehicles. Markets, regulations, policies and technology continue to evolve with respect to these topics.
4
Our Served Markets
We sell our transmissions globally for use in medium- and heavy-duty on-highway commercial vehicles, off-highway vehicles and equipment and defense vehicles. In addition to the sale of transmissions, we also sell branded replacement parts, support equipment and other products necessary to service the installed base of vehicles utilizing our transmissions. The following table provides a summary of our business by end market, for the fiscal year ended
December 31, 2018
.
|
END MARKET
|
NORTH AMERICA
|
OUTSIDE NORTH
AMERICA
|
DEFENSE
|
SERVICE PARTS, SUPPORT EQUIPMENT
& OTHER
|
||
|
ON-
HIGHWAY
|
OFF-
HIGHWAY
|
ON-
HIGHWAY
|
OFF-
HIGHWAY
|
|||
|
2018 NET SALES
(IN MILLIONS)
|
$1,317
|
$93
|
$383
|
$129
|
$158
|
$633
|
|
% OF TOTAL
|
49%
|
3%
|
14%
|
5%
|
6%
|
23%
|
|
MARKET POSITION
|
• #1 supplier of fully-automatic transmissions
|
• A leading independent supplier
|
• #1 supplier of fully-automatic transmissions in China
• Established presence in Western Europe
|
• A leading independent supplier
|
• #1 supplier of transmissions for the U.S. Department of Defense
|
• Approximately 1,400 dealers and distributors worldwide
|
|
VOCATIONS OR END USE
|
• Construction
• Distribution
• Electric hybrid transit and shuttle bus
• Emergency
• Metro Tractors
• Motorhome
• Refuse
• School, transit, shuttle and coach buses
• Utility
|
• Construction
• Energy
• Mining
• Specialty vehicle
|
• Construction
• Distribution
• Emergency
• Refuse
• Transit, shuttle and coach buses
• Utility
|
• Construction
• Energy
• Mining
• Specialty vehicle
|
• Medium- and heavy-tactical wheeled platforms
• Tracked combat platforms
|
• Fluids
• Parts
• Remanufactured transmissions
• Support equipment
|
Refer to NOTE 18, “Concentration of Risk” in Part II, Item 8, of this Annual Report on Form 10-K for additional information on our significant original equipment manufacturer (“OEM”) customers.
5
North America
On-Highway.
We are the largest manufacturer of fully-automatic transmissions for the on-highway medium- and heavy-duty commercial vehicle market in North America. The following is a summary of our on-highway net sales by vehicle class in North America.
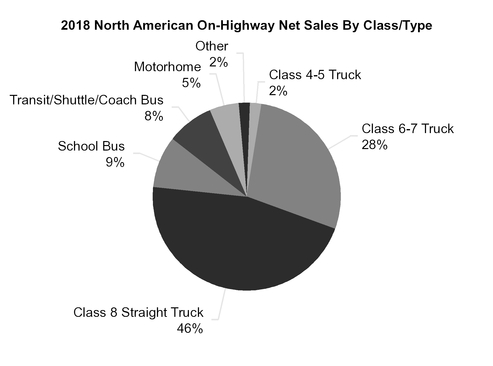
Our core North American on-highway market includes Class 4-5, Class 6-7 and Class 8 straight trucks, conventional transit, shuttle and coach buses, school buses and motorhomes. Class 8 trucks are subdivided into two markets: straight and tractor. Class 8 straight trucks are those with a unified body (e.g., refuse, construction, and dump trucks), while tractors have a vehicle chassis that is separable from the trailer they pull. We have been supplying transmissions for Class 8 straight trucks for decades, and it is a core end market for us. Today, we have very limited exposure to the Class 8 line-haul tractor market because lower priced manual transmissions and AMTs generally meet the needs of these vehicles which are primarily used in long distance hauling.
We also provide electric hybrid-propulsion systems for transit buses within the North American on-highway market. The interest in conserving fuel and reducing greenhouse gas emissions is driving demand for more fuel efficient commercial vehicles. Our customers are typically city, state and federal governmental entities. We compete primarily with BAE Systems plc and manufacturers of electric drive systems in this market.
We sell substantially all of our transmissions in the North American on-highway market to OEMs. These OEMs, in turn, install our transmissions in vehicles in which our transmission is either the exclusive transmission available or is specifically requested by end users. In
2018
, OEM customers representing over 95% of our North American on-highway unit volume participated in long-term supply agreements (“LTSA”) with us. Generally, these LTSAs offer the OEM customer defined levels of mutual commitment with respect to growing Allison’s presence in the OEMs’ products and promotional efforts, pricing and sharing of commodity cost risk. The length of our LTSAs is typically between three and five years. We often compete in this market against independent manufacturers of manual transmissions, AMTs, DCTs, electric drive systems, fully-automatic transmissions manufactured by Ford Motor Company (“Ford”), ZF Friedrichshafen AG (“ZF”) and Voith GmbH, and against vertically integrated OEMs in certain weight classes that use their own internally manufactured transmissions in certain vehicles.
6
The following table presents a summary of our competitive position by vehicle class in the North America On-Highway end market.
|
CLASS 4-5
TRUCKS
|
CLASS 6-7
TRUCKS
|
CLASS 8 STRAIGHT
TRUCKS
|
SCHOOL BUSES
|
MOTORHOMES
|
|
|
2018 S
HARE
|
7%
|
74%
|
70%
|
88%
|
39%
|
|
P
RIMARY
C
OMPETITION
|
• Ford
|
• Manual Transmissions
• AMTs
• Ford
|
• Manual Transmissions
• AMTs
|
• Ford
|
• Ford
|
Off-Highway.
We have provided products used in vehicles and equipment that serve energy, mining and construction applications in North America for over 60 years. Off-highway energy applications include hydraulic fracturing equipment, well-stimulation equipment, pumping equipment, and well-servicing rigs, which often use a fully-automatic transmission to propel the vehicle and drive auxiliary equipment. We maintain a leadership position in this end market, with nearly all producers of well-stimulation and well-servicing equipment utilizing our heavy duty off-highway transmissions. Competition includes Caterpillar Inc. (“Caterpillar”) and Twin Disc, Inc. (“Twin Disc”).
We also provide heavy-duty transmissions used in mining trucks, specialty vehicles and construction vehicles. Mining applications include trucks used to haul various commodities and other products, including rigid dump trucks, underground trucks and long-haul tractor trailer trucks with load capacities between 40 to 110 tons. Our major competitors in this end market are Caterpillar and Komatsu Ltd. (“Komatsu”), both of which are vertically integrated and manufacture fully-automatic transmissions for their own vehicles. Specialty vehicles using our heavy-duty transmissions include airport rescue and firefighting vehicles and heavy-equipment transporters. Our major competitor in this end market is Twin Disc. Construction applications include articulated dump trucks, with Caterpillar, Volvo Group (“Volvo”) and ZF as competitors.
7
Outside North America
Outside North America we serve several different markets, including: Europe, Middle East, Africa (collectively, “EMEA”), Asia-Pacific and South America.
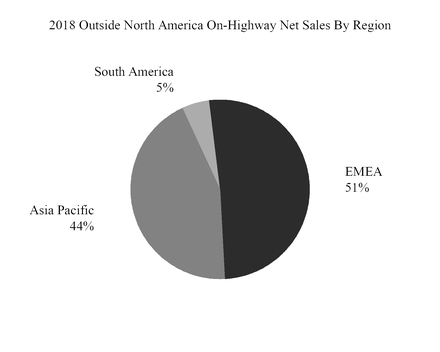
On-Highway.
We are the largest manufacturer of fully-automatic transmissions for the commercial vehicle market outside of North America. While the use of fully-automatic transmissions in the medium- and heavy-duty commercial vehicle market has been widely accepted in North America, markets outside North America continue to be dominated by manual transmissions. In
2018
, fully-automatic transmission-equipped medium- and heavy-duty commercial vehicles represented less than 5% of the vehicles in markets outside North America and are concentrated in certain vocational end markets. The following is a summary of our on-highway net sales by region outside of North America.
Europe, Middle East, Africa
. EMEA is composed of several different markets, each of which differs from our core North American market by the degree of market maturity, sophistication and acceptance of fully-automatic transmission technology. Within Europe, we serve Western European developed markets, as well as Russian and Eastern European emerging markets, principally in the refuse, emergency, bus, coach, distribution and utility markets. Competition in Western Europe is most notably characterized by a high level of vertical powertrain integration with OEMs often utilizing their own manual transmissions and AMTs in their vehicles. The Middle East and Africa regions are generally characterized by very limited local vehicle production, with imports from the U.S., South America, Turkey, China, India and Europe accounting for the majority of vehicles.
Asia-Pacific.
Our key Asia-Pacific markets include China, Japan, India, and South Korea; however, we actively participate in several other important Asia-Pacific countries including Australia, Taiwan, Indonesia, Malaysia and Thailand, which are primarily importers of commercial vehicles. Within Asia-Pacific, our sales efforts are principally focused on the transit bus and vocational truck markets. Currently, manual transmissions are the predominant transmissions used in commercial vehicles in the Asia-Pacific region.
South America
. The South American region is characterized by a high level of OEM integration, with captive manual transmission and AMT manufacturing. Currently, manual transmissions are the predominant transmissions used in commercial vehicles in South America.
8
Off-Highway.
The following is a summary of our off-highway net sales by region outside of North America.

Europe, Middle East, Africa.
Our off-highway markets in EMEA are mining and construction. Our major off-highway competitors are Caterpillar and Komatsu, both of which are vertically integrated manufacturers of off-highway mining vehicles, including the specific fully-automatic transmission used in their mining trucks. A typical construction application is the articulated dump truck, with competition from Caterpillar, Volvo and ZF transmissions.
Asia-Pacific
. Off-highway markets in Asia are shared by energy, mining and construction applications. Our primary competitors are Caterpillar, Danyang Winstar Auto Parts Co., Ltd. and Twin Disc in energy applications; Caterpillar, Komatsu and Danyang Winstar Auto Parts Co., Ltd. in mining applications; and Caterpillar, Volvo and ZF in construction applications.
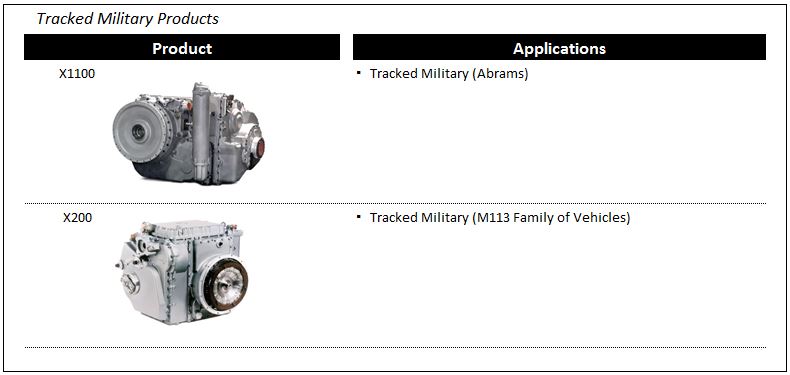
Defense
We have a long-standing relationship with the U.S. Department of Defense (“DOD”) dating back to 1946, when we began developing our first-generation tank transmission. Today, we sell substantially all of the transmissions for medium- and heavy-tactical wheeled vehicle platforms including the Family of Medium Tactical Vehicles, Armored Security Vehicles, Heavy Expanded Mobility Tactical Trucks, Heavy Equipment Transporters, Palletized Loading Systems, M915 Series Trucks, Medium Tactical Vehicle Replacements and the Logistic Vehicle System Replacement. Additionally, we supplied transmissions for the majority of Mine-Resistant Ambush Protected (“MRAP”) Vehicles, the MRAP All-Terrain Vehicle and the Joint Light Tactical Vehicle, which is the replacement vehicle for Humvee personnel transport. Transmissions for our wheeled vehicle platforms are typically sold to OEMs.
We are also the supplier on two of the three key tracked vehicle platforms, the Abrams tank and the M113 family of vehicles, which are sold directly to the DOD. Additionally, we sell parts kits to licensees for the production of transmissions for tracked vehicles manufactured outside North America. See Part I, Item 1A, “Risk Factors” of this Annual Report on Form 10-K for a discussion of risks associated with our contracts with the DOD.
Globally, we face competition for the supply of our transmissions in tracked defense vehicles primarily from L3 Technologies, Inc., Renk AG and ZF. Additionally, we face limited competition from Caterpillar and ZF in certain defense wheeled vehicle platforms.
9
Service Parts, Support Equipment and Other
The aftermarket provides us with a relatively stable source of revenues as the installed base of vehicles and equipment utilizing our transmissions continues to grow. The need for replacement parts is driven by normal vehicle and equipment maintenance requirements. Uninterrupted operation is generally critical for end users’ profitability. End users focus on getting the vehicle or equipment back in service, which in some cases results in the aftermarket purchase decision being less price-sensitive.
The sale of Allison-branded parts and fluids, remanufactured transmissions and support equipment is fundamental to our brand promise. We have assembled a worldwide network of approximately
1,400
independent distributor and dealer locations to sell, service and support our transmissions. As part of our brand strategy, our distributors and dealers are required to sell genuine Allison-branded parts. Within the aftermarket, we offer remanufactured transmissions under our ReTran brand, which provides a cost-effective alternative for transmission repairs and replacements. We also provide support equipment to our OEMs to assist in installing new Allison transmissions into vehicles, and, therefore, sales of support equipment are dependent upon sales of new transmissions. The competition for service parts and ReTran transmissions comes from a variety of smaller-scale companies sourcing non-genuine “will-fit” parts from unauthorized manufacturers. These “will-fit” parts often do not meet our product specifications, and therefore may be of lesser quality than genuine Allison parts.
10
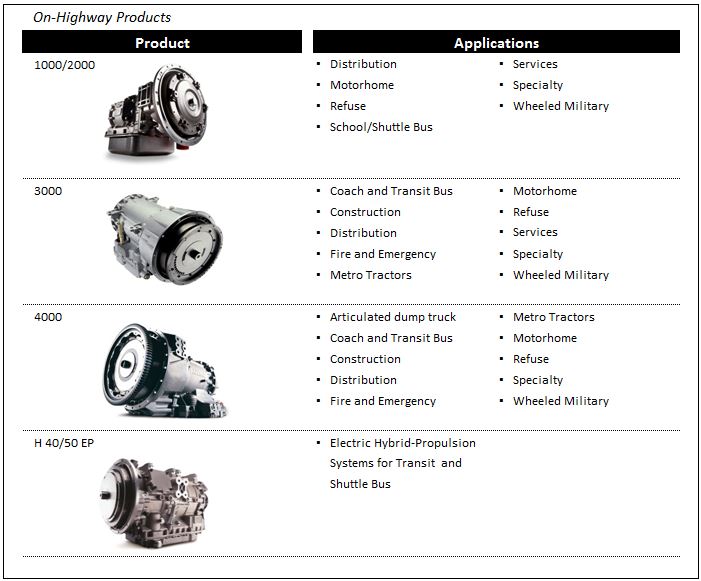
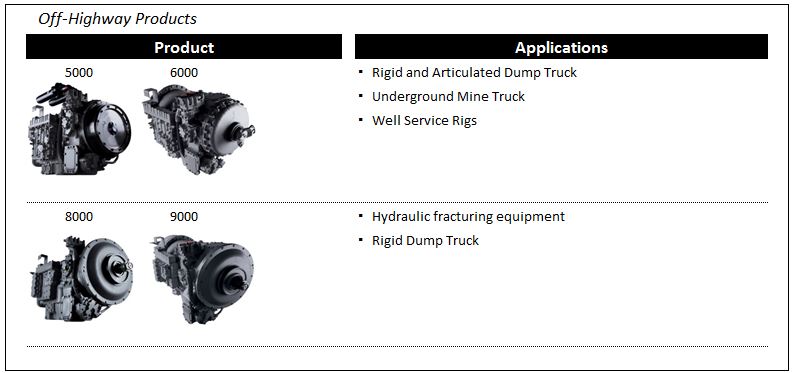
Our Product Offerings
Allison transmissions are sold under the Allison Transmission brand name and remanufactured transmissions are sold under the ReTran brand name. The following is a summary of our
12
transmission product lines.
11
Product Development and Engineering
We maintain product development and engineering capability dedicated to the design, development, refinement and support of our fully-automatic transmissions and electric hybrid-propulsion systems. We believe our customers expect our products to provide unparalleled performance and value defined in various ways, including delivering maximum cargo in minimum time, using the least amount of fuel possible while employing the fewest vehicles possible and experiencing maximum vehicle uptime. In response to those needs and the evolving customer focus on fuel efficiency, we provide vehicle specification guidelines, transmission control software and mechanical components to optimize fuel economy while delivering desired vehicle performance. Further, we are developing new technology to improve fuel efficiency and fuel economy by allowing engines to operate more efficiently and at lower speeds to avoid consuming fuel without compromising performance. Building on our engineering capabilities, we pioneered electric hybrid-propulsion in commercial vehicles and are developing new alternative technologies for use in our global commercial vehicle markets. From time to time, we also acquire certain licenses to provide us with technology to complement our portfolio of products and product initiatives.
12
Sales and Marketing Organization
Our sales and marketing effort is organized along geographic and customer lines and is comprised of marketing, sales and service professionals, supported by application engineers worldwide. In North America, selling efforts in the on-highway end market are organized by distributor area responsibility, OEM sales and, for our large end users, national accounts. Outside North America, we manage our sales, marketing, service and application engineering professionals through regional areas of responsibility. These regional management teams distribute OEM service and application engineering resources globally. We manage our defense products sales, marketing, service and application engineering through professionals based in Indianapolis, Indiana and Detroit, Michigan.
We have developed a marketing strategy to reach OEM customers as well as end users. We target our end users primarily through marketing activities by our sales staff, who directly call on end users and attend local trade shows, targeting specific vocations globally and through our plant tour programs, where end users may test our products on the Indianapolis test track and our enhanced customer experience demonstration track at our Hungary facility.
While our marketing management uses the term “customer” interchangeably for OEMs and end users, the primary objective of our marketing strategy is to create demand for fully-automatic transmissions through:
|
•
|
OEM promotion of our products and incorporation of fully-automatic transmissions in their commercial vehicle product offerings;
|
|
•
|
Allison representative and/or Allison distributor contact with identified, major end users; and
|
|
•
|
Our network of independent dealers who contact other end users.
|
The process is interactive, as Allison representatives, Allison distributors, OEMs and dealers educate customers and respond to the specific applications, requirements and needs of numerous specialty markets.
Similarly, we work with customers, dealers and OEMs to educate, improve and simplify how they specify vehicles and vehicle systems in order to optimize vehicle performance and fuel consumption. Our field organization also works closely with distributors who, in turn, work with dealers to provide end users with education, parts, service and warranty support. The defense marketing group follows a defined plan that identifies country, vehicle and specific OEMs and then approaches the ultimate end user through a variety of channels.
Manufacturing
Our manufacturing strategy provides for distributed capability in manufacturing and assembly of our products for the global commercial vehicle market. Our primary manufacturing facilities, located in Indianapolis, Indiana, consist of approximately 2.3 million square feet of usable manufacturing space in five plants. We also have established customization and parts distribution in the United States, The Netherlands, Brazil, China, Hungary, India and Japan, and plants in Chennai, India and Szentgotthard, Hungary. Our high volume on-highway products are produced in multiple global locations while off-highway, electric hybrid-propulsion and defense tracked products are produced in Indianapolis.
Suppliers and Raw Materials
A significant amount of the part numbers that make up our transmissions are purchased from outside suppliers, and during
2018
, we purchased approximately $849 million of direct materials and components from outside suppliers. The largest elements of our direct spending are aluminum and steel castings and forgings that are formed by our suppliers into our larger components and assemblies for use in our transmissions. However, our spending on aluminum and steel raw materials directly and indirectly through our purchase of these components constituted approximately 13% of our direct material and component costs in
2018
. The balance of our direct and indirect materials and components costs are primarily composed of value-added services and conversion costs. Our supply contracts, along with an intensive supplier selection and performance monitoring process, have enabled us to establish and maintain close relationships with suppliers and have contributed to our overall operating efficiency and quality.
13
Intellectual Property
Patents and other proprietary rights are important to the continued success of our business. We also rely upon trade secrets, know-how, continuing technological innovation and licensing opportunities to develop and maintain our competitive position. We protect our proprietary rights through a variety of methods, including confidentiality agreements and proprietary information agreements with suppliers, employees, consultants and others who may have access to proprietary information. We own over 450 issued patents worldwide related to the design and production of transmissions for our core end markets. In addition, we own over 300 issued patents worldwide related to developing other transmission technologies. We also have licensing arrangements with respect to more than 400 additional patents and patent applications. We have more than 450 pending patent applications throughout the world that relate to aspects of the technology incorporated in many of our products.
We have an irrevocable, royalty-free, worldwide license of more than 250 U.S. and foreign patents and patent applications, as well as certain unpatented technology and know-how, owned by General Motors Company (“GM”) to manufacture, use and sell fully-automatic transmissions and certain electric hybrid-propulsion systems for use in vocational and defense vehicles and off-highway products. Such licenses are subject to certain limitations. See Part I, Item 1A, “Risk Factors” of this Annual Report on Form 10-K for a discussion of these risks and limitations. We also acquired from GM an irrevocable, royalty-free, worldwide license under computer software programs that we use to run our business, including product design. In addition, GM has a license to use certain Allison trademarks.
Seasonality
Overall, the demand for our products is relatively consistent over the year. However, in typical market conditions, the North American truck market experiences a higher level of production in the first half of the year due to fewer holidays and the practice of plant shutdowns in July and December. Working capital levels do not fluctuate significantly in the normal course for our business.
Employees
As of
December 31, 2018
, we had approximately
2,900
employees, with approximately
90%
of those employees in the U.S. Approximately
59%
of our U.S. employees are represented by the International Union, United Automobile, Aerospace and Agricultural Implement Workers of America (“UAW”) and are subject to a collective bargaining agreement. In December 2017, we entered into a six year collective bargaining agreement with UAW Local 933 that expires in November 2023. As approximately 30% of our represented employees are currently retirement eligible, we anticipate a continuing shift toward increasing the number of multi-tier employees over the coming years. There have been no strikes or work stoppages due to Allison-specific issues in over 30 years.
14
Environmental Compliance
We are subject to a variety of federal, state, local and foreign environmental laws and regulations, including those governing the discharge of pollutants into the air or water, the management and disposal of hazardous substances or wastes, and the cleanup of contaminated sites. Some of our operations require environmental permits and controls to prevent and reduce air and water pollution. These permits are subject to modification, renewal and revocation by issuing authorities. In addition, certain of our products and our customer’s products are subject to certification requirements by a variety of regulatory bodies. We believe we are in substantial compliance with all material environmental laws and regulations applicable to our plants and operations. Historically, our annual costs of achieving and maintaining compliance with environmental, health and safety requirements have not been material to our financial results.
Increasing global efforts to control emissions of carbon dioxide, methane, ozone, nitrogen oxide and other greenhouse gases and pollutants, as well as the shifting focus of regulatory efforts towards total emissions output, have the potential to impact our facilities, costs, products and customers. The U.S. Environmental Protection Agency (“EPA”) has taken action to control greenhouse gases from certain stationary and mobile sources. In addition, several states have taken steps, such as adoption of cap and trade programs or other regulatory systems, to address greenhouse gases. There have also been international efforts seeking legally binding reductions in emissions of greenhouse gases. These developments and further actions that may be taken in the U.S. and in other countries, states or provinces could affect our operations both positively and negatively (e.g., by affecting the demand for or suitability of some of our products).
We also may be subject to liability as a potentially responsible party under the Comprehensive Environmental Response, Compensation and Liability Act and similar state or foreign laws for contaminated properties that we currently own, lease or operate or that we or our predecessors have previously owned, leased or operated, and sites to which we or our predecessors sent hazardous substances. Such liability may be joint and several so that we may be liable for more than our share of any contamination, and any such liability may be determined without regard to causation or knowledge of contamination. We or our predecessors have been named potentially responsible parties at contaminated sites from time to time. We do not anticipate our liabilities relating to contaminated sites will be material to our financial results.
In January 2016, we assumed all responsibility for operating, monitoring and maintaining the ongoing activities at our Indianapolis, Indiana manufacturing facilities relating to historical soil and ground water contamination. We entered into an administrative order of consent with the EPA that requires us to provide financial assurance to complete the operation, monitoring and maintenance in the event we fail to do so. We currently have a letter of credit with the EPA in the amount of $15 million.
Competition
We compete on the basis of product performance, quality, price, distribution capability and service in addition to other factors. We face competition from numerous manufacturers of various types of transmissions for commercial vehicles. We also face competition from manufacturers in our international operations and from international manufacturers entering our domestic market. Furthermore, we face an increasing amount of competition from vertical integration, as some of our customers are OEMs that manufacture transmissions for their own products, and from powertrains that do not require a transmission. Despite their transmission manufacturing capabilities, we believe that our existing OEM customers have chosen to purchase certain transmissions from us due to the quality, reliability and strong brand of our transmissions and in order to limit fixed costs, minimize production risks and maintain company focus on commercial vehicle design, production and marketing.
15
Corporate Information
Allison Transmission Holdings, Inc. was incorporated in Delaware on June 22, 2007. Our principal executive offices are located at One Allison Way, Indianapolis, IN 46222 and our telephone number is (317) 242-5000. Our internet address is www.allisontransmission.com. We file annual, quarterly and current reports, proxy statements and other documents with the United States Securities and Exchange Commission (“SEC”), under the Securities Exchange Act of 1934, as amended (“Exchange Act”). These periodic and current reports and all amendments to those reports are available free of charge on the investor relations page of our website at http://ir.allisontransmission.com as soon as reasonably practicable after we electronically file them with, or furnish them to, the SEC. We have included our website address throughout this filing as textual references only. The information contained on, or accessible through, our website is not incorporated into this Annual Report on Form 10-K. The SEC also maintains an Internet site that contains reports, proxy and information statements, and other information regarding issuers that file electronically with the SEC at http://www.sec.gov.
16
ITEM 1A. Risk Factors
The following is a cautionary discussion of risks, uncertainties and assumptions that we believe are significant to our business. In addition to the factors discussed elsewhere in this Annual Report on Form 10-K, the following are the important factors that, individually or in the aggregate, we believe could make our actual results differ materially from those described in any forward-looking statements.
Risks Related to Our Business
We participate in markets that are competitive, and our competitors’ actions could have a material adverse effect on our business, results of operations and financial condition.
Our business operates in competitive markets. We compete against other existing or new global manufacturers of transmissions for commercial vehicles on the basis of product performance, quality, price, distribution capability and service in addition to other factors. In addition, we compete with manufacturers developing alternative technologies, including electric drivetrains, that may or may not require a transmission. In addition, subsidies offered by governmental entities continue to drive the development and adoption of various alternative technologies. Actions by our competitors could lead to downward pressure on prices and/or a decline in our market share, either or both of which could adversely affect our results.
In addition, some of our customers or future customers are OEMs that manufacture or could in the future manufacture transmissions or alternate technologies, including electric drive powertrains, for their own products. Despite their transmission manufacturing capabilities, our existing OEM customers have chosen to purchase certain transmissions from us due to customer demand, resulting from the quality of our transmission products and in order to reduce fixed costs, eliminate production risks and maintain company focus. However, we cannot be certain these customers will continue to purchase our products in the future. Increased levels of production insourcing by these customers could result from a number of factors, such as shifts in our customers’ business strategies, acquisition by a customer of another transmission manufacturer, the inability of third-party suppliers to meet specifications and the emergence of low-cost production opportunities in foreign countries. As a result, these OEMs may use transmissions produced internally or by another manufacturer and no longer choose to purchase transmissions from us. A significant reduction in the level of external sourcing of transmission production by our OEM customers could significantly impact our net sales and cash flows and, accordingly, have a material adverse effect on our business, results of operations and financial condition.
Certain of our end users operate in highly cyclical industries, which can result in uncertainty and significantly impact the demand for our products, which could have a material adverse effect on our business, results of operations and financial condition.
Some of the markets in which we operate, including energy, mining, construction, distribution and motorhomes, exhibit a high degree of cyclicality. Decisions to purchase our transmissions are largely a result of the performance of these and other industries we serve. If demand for output in these industries decreases, the demand for our products will likely decrease. Demand in these industries is impacted by numerous factors including prices of commodities, rates of infrastructure spending, housing starts, real estate equity values, interest rates, consumer spending, fuel costs, energy demands, municipal spending and commercial construction, among others. Increases or decreases in these variables globally may significantly impact the demand for our products, which could have a material adverse effect on our business, results of operations and financial condition. If we are unable to accurately predict demand, we may be unable to meet our customers’ needs, resulting in the loss of potential sales, or we may manufacture excess products, resulting in increased inventories and overcapacity in our production facilities, increasing our unit production cost and decreasing our operating margins.
17
Volatility in and disruption to the global economic environment and changes in the regulatory and business environments in which we operate may have a material adverse effect on our business, results of operations and financial condition.
The commercial vehicle industry as a whole has been more adversely affected by volatile economic conditions than many other industries, as the purchase or replacement of commercial vehicles, which are durable items, can be deferred for many reasons, including reduced spending by end users. Future changes in the regulatory and business environments in which we operate may adversely affect our ability to sell our products or source materials needed to manufacture our products. Furthermore, financial instability or bankruptcy at any of our suppliers or customers could disrupt our ability to manufacture our products and impair our ability to collect receivables, any or all of which may have a material adverse effect on our business, results of operations and financial condition. In addition, some of our customers and suppliers may experience serious cash flow problems and, thus, may find it difficult to obtain financing, if financing is available at all. As a result, our customers’ need for and ability to purchase our products or services may decrease, and our suppliers may increase their prices, reduce their output or change their terms of sale. Any inability of customers to pay us for our products and services, or any demands by suppliers for different payment terms, may materially and adversely affect our results of operations and financial condition. Furthermore, our suppliers may not be successful in generating sufficient sales or securing alternate financing arrangements, and therefore may no longer be able to supply goods and services to us. In that event, we would need to find alternate sources for these goods and services, and there is no assurance we would be able to find such alternate sources on favorable terms, if at all. Any such disruption in our supply chain could adversely affect our ability to manufacture and deliver our products on a timely basis, and thereby affect our results of operations.
We may not be successful in introducing our new products and technologies and responding to customer needs.
We currently have new products and technologies under development. The development of new products and technologies is difficult and the timetable for commercial release is uncertain. Not all new product launches have been successful, and we may not be successful in the future in introducing other new products and responding to customer needs. In addition, it often takes significant time, in some cases multiple fleet buy cycles, before customers gain experience with new products and technologies and those new products and technologies become widely-accepted by the market, if at all. If we do not adequately anticipate the changing needs of our customers by developing and introducing new and effective products and technologies on a timely basis, our competitive position and prospects could be harmed. If our competitors are able to respond to changing market demands and adopt new technologies more quickly than we do, demand for our products could decline, our competitive position could be harmed, our future research and development activities may be constrained due to intellectual property rights of others and we will not be able to recoup a return on our development investments. Moreover, changing customer demands as well as evolving regulatory, safety and environmental standards could require us to adapt our products and technologies to address such changes. As a result, in the future we may experience delays in the introduction of some or all of our new products or modifications or enhancements of existing products. Furthermore, there may be production delays due to unanticipated technological setbacks, which may, in turn, delay the release of new products to our end users. If we experience significant delays or increased costs in the production, launch or acceptance of our products and technologies, our net sales and results of operations may be materially adversely affected.
Our sales are concentrated among our top five OEM customers and the loss or consolidation of any one of these customers or the discontinuation of particular vehicle models for which we are a significant supplier could reduce our net sales and have a material adverse effect on our results of operations and financial condition.
We have in the past and may in the future derive a significant portion of our net sales from a relatively limited number of OEM customers. For the years ended
December 31, 2018
,
2017
and
2016
, our top five OEM customers accounted for approximately 49%, 49% and 52% of our net sales, respectively. Our top two customers, Daimler AG and PACCAR Inc. accounted for approximately 18% and 10%, respectively, of our net sales during
2018
. The loss of, or consolidation of, any one of these customers, or a significant decrease in business from, one or more of these customers could harm our business. In addition, the discontinuation of particular vehicle models for which we are a significant supplier could reduce our net sales and have a material adverse effect on our results of operations.
18
Our success depends on continued research and development efforts, the outcome of which is uncertain.
Our success depends on our ability to improve the efficiency and performance of our transmissions, and we invest significant resources in research and development in order to do so. Nevertheless, the research and development process is time-consuming and costly, and offers uncertain results. We may not be able through our research and development efforts to keep pace with improvements and changes in transmission-related or vehicle propulsion technology of our competitors, and licenses for technologies that would enable us to keep pace with our competitors may not be available on commercially reasonable terms if at all. Finally, our research and development efforts, and generally our ability to introduce improved or new products in the marketplace, may be constrained by the patents and other intellectual property rights of competitors and others.
We may not be able to identify or consummate acquisitions or achieve expected benefits from or effectively integrate acquisitions, which could harm our growth.
From time to time we evaluate selective acquisitions and strategic investments to obtain additional technologies, complementary product lines and supply channels. Acquisitions involve many risks that could have an adverse effect on our business, financial condition or results of operations, including:
|
•
|
our ability to identify suitable acquisition candidates, prevail against competing potential acquirers and negotiate and consummate acquisitions on terms attractive to us;
|
|
•
|
difficulties in integrating personnel and sales forces, operations, manufacturing, logistics, research and development, information technology, communications, purchasing, accounting, marketing, administration and other systems and processes and otherwise assimilating the operations of the acquired company;
|
|
•
|
the diversion of resources, including diverting management’s attention from our current operations;
|
|
•
|
risks of entering new geographic or product markets in which we have limited or no direct prior experience;
|
|
•
|
the potential loss of key customers, employees or suppliers of the acquired company or adverse effects on our existing business relationships with our suppliers and customers;
|
|
•
|
the potential incurrence of indebtedness to fund the acquisition;
|
|
•
|
the acquired business not achieving anticipated revenues, earnings, cash flow or market share;
|
|
•
|
excess capacity;
|
|
•
|
failure to achieve the expected synergies or cost savings resulting from the acquisition;
|
|
•
|
the need for additional investments post-acquisition that could be greater than anticipated;
|
|
•
|
the impact of U.S. and foreign competition laws and regulations on our ability to make certain acquisitions;
|
|
•
|
inaccurate assessment of undisclosed, contingent or other liabilities or problems and unanticipated costs associated with the acquisition;
|
|
•
|
incorrect estimates made in accounting for acquisitions, incurrence of non-recurring charges and write-off of significant amounts of goodwill that could adversely affect our financial results; and
|
|
•
|
dilution of earnings.
|
We may also face liability with respect to acquired businesses for violations of environmental or other laws occurring prior to the date of our acquisition, and some or all of these liabilities may not be covered by environmental or other insurance secured to mitigate the risk or by indemnification from the sellers from which we acquired these businesses. We could also incur significant costs, including, but not limited to, remediation costs, natural resources damages, civil or criminal fines and sanctions and third-party claims, as a result of past or future violations of, or liabilities associated with, environmental or other laws.
We cannot offer any assurance that we will be able to consummate any future acquisitions, strategic investments or other business combinations. If we are unable to identify suitable acquisition candidates or to consummate and successfully integrate strategic acquisitions, our business and results of operations may be adversely affected as a result.
Increases in cost, disruption of supply or shortage of raw materials or components used in our products could harm our business and profitability.
Our products contain various raw materials, including corrosion-resistant steel, non-ferrous metals such as aluminum and nickel, and precious metals such as platinum and palladium. We use raw materials directly in manufacturing and in transmission components that we purchase from our suppliers. We generally purchase components with significant raw material content on the open market. The prices for these raw materials fluctuate depending on market conditions. Volatility in the prices of raw materials such as steel, aluminum and nickel could increase the cost of manufacturing our products. We may not be able to pass on these costs to our customers, and
19
this could have a material adverse effect on our business, results of operations and financial condition. Even in the event that increased costs can be passed through to customers, our gross margin percentages would decline. Additionally, our suppliers are also subject to fluctuations in the prices of raw materials and may attempt to pass all or a portion of such increases on to us. In the event they are successful in doing so, our margins would decline.
In
2018
, approximately 75% of our total spending on components was sourced from approximately 35 suppliers, some of which are the single source for such components. All of the suppliers from which we purchase materials and components used in our business are fully validated suppliers, meaning the suppliers’ manufacturing processes and inputs have been validated under a production part approval process (“PPAP”). Furthermore, there are only a limited number of suppliers for certain of the materials used in our business, such as corrosion-resistant steel. As a result, our business is subject to the risk of additional price fluctuations and periodic delays in the delivery of our materials or components if supplies from a validated supplier are interrupted and a new supplier, if one is available, must be validated or materials and components must be purchased from a supplier without a completed PPAP, which could increase our risk of purchasing non-conforming components. Any such price fluctuations or delays, if significant, could harm our profitability or operations. In addition, the loss of a supplier could result in significant material cost increases or reduce our production capacity. We also cannot guarantee we will be able to maintain favorable arrangements and relationships with these suppliers. An increase in the cost or a sustained interruption in the supply or shortage of some of these raw materials or components that may be caused by a deterioration of our relationships with suppliers or by events such as natural disasters, power outages, labor strikes, or the like could negatively impact our business, results of operations and financial condition. Although we have agreements with many of our customers that we will pass such price increases through to them, such contracts may be canceled by our customers and/or we may not be able to recoup the costs of such price increases. Additionally, if we are unable to continue to purchase our required quantities of raw materials on commercially reasonable terms, or at all, if we are unable to maintain or enter into purchasing contracts for commodities, or if delivery of materials from suppliers is delayed or non-conforming, our operations could be disrupted or our profitability could be adversely impacted.
We could be materially adversely affected by any failure to maintain cost controls.
We rely on our cost structure and operating discipline to achieve strong operating margins. There are many factors that could affect our ability to realize expected cost savings or achieve future cost savings that we are not able to control, including the need for unexpected significant capital expenditures; unexpected changes in commodity or component pricing, including an increase in export or import tariffs, that we are unable to pass on to our suppliers or customers; labor costs, including wages, benefits and healthcare; cost inflation; and our inability to maintain efficiencies gained from our workforce optimization initiatives. Additionally, we have substantial indebtedness of approximately
$2,548
million as of
December 31, 2018
. Our inability to maintain our cost controls could adversely impact our operating margins.
Our long-term growth prospects and results of operations may be impaired if the rate of adoption of fully-automatic transmissions in commercial vehicles outside North America does not increase.
Our long-term growth strategy depends in part on an increased rate of automaticity outside North America. As part of that strategy, we have established manufacturing facilities in India and Hungary. We have also dedicated significant human resources to serve markets where we anticipate increased adoption of automaticity, including China, India, Brazil and Russia. However, manual transmissions remain the market leader outside North America and there can be no assurance that adoption of automatic transmissions will increase. Factors potentially impacting adoption of automatic transmissions outside of North America include the large existing installed base of manual transmissions, customer preferences for manual transmissions, commercial vehicle OEM vertical integration into manual transmission and AMT manufacturing, increased competition from AMTs, DCTs, electric driving systems, and other alternative transmission technologies and failure to further develop the Allison brand. If the rate of adoption of fully-automatic transmissions does not increase as we have anticipated, our long-term growth prospects and results of operations may be impaired.
20
Our sales to the Defense end market are to government entities and contractors for the U.S. and foreign governments, and the loss of a significant number of our contracts, or budgetary declines or future reductions or changes in spending by the U.S. or foreign governments could have a material adverse effect on our results of operations and financial condition.
Our net sales to the Defense end market are derived from contracts (revenue arrangements) with agencies of, and prime system contractors for, the U.S. government and foreign governments. If a significant number of our Defense contracts and subcontracts are simultaneously delayed or cancelled for budgetary, performance or other reasons, it would have a material adverse effect on our results of operations and financial condition. Approximately 6%, or $
158
million, of our net sales for the year ended
December 31, 2018
were from our Defense end market.
Our future financial results may be adversely affected by:
|
•
|
declines in, or uncertainty regarding, U.S. or foreign government defense budgets;
|
|
•
|
curtailment of the U.S. government’s use of technology or other services and product providers, including curtailment due to government budget reductions, future government shutdowns and related fiscal matters;
|
|
•
|
geopolitical developments that affect demand for our products and services; and
|
|
•
|
technological developments that impact purchasing decisions or our competitive position.
|
Our international operations, in particular our emerging markets, are subject to various risks which could have a material adverse effect on our business, results of operations and financial condition.
Our business is subject to certain risks associated with doing business internationally, particularly in emerging markets. Outside-North America net sales represented approximately 23% of our net sales for
2018
. Most of our operations are in the U.S., but we also have manufacturing and customization facilities in India and Hungary with a services agreement with Opel Szentgotthard Automotive Manufacturing Ltd., formerly GM-PTH, and customization capability in Brazil, The Netherlands, China and Japan. Further, we intend to continue to pursue growth opportunities for our business in a variety of business environments outside the U.S., which could exacerbate the risks set forth below. Our international operations are subject to, without limitation, the following risks:
|
•
|
the burden of complying with multiple and possibly conflicting laws and any unexpected changes in regulatory requirements;
|
|
•
|
foreign currency exchange controls, sanctions, import and export restrictions and tariffs, including restrictions promulgated by the Office of Foreign Assets Control of the U.S. Department of the Treasury, and other trade protection regulations and measures;
|
|
•
|
political risks, including increased trade protectionism and risks of loss due to civil disturbances, acts of terrorism, acts of war, guerilla activities and insurrection;
|
|
•
|
unstable economic, financial and market conditions and increased expenses as a result of inflation or higher interest rates;
|
|
•
|
difficulties in enforcement of third-party contractual obligations and intellectual property rights and collecting receivables through foreign legal systems;
|
|
•
|
difficulty in staffing and managing international operations and the application of foreign labor regulations;
|
|
•
|
differing local product preferences and product requirements;
|
|
•
|
fluctuations in currency exchange rates to the extent that our assets or liabilities are denominated in a currency other than the functional currency of the country where we operate;
|
|
•
|
potentially adverse tax consequences from changes in tax laws, requirements relating to withholding taxes on remittances and other payments by subsidiaries and restrictions on our ability to repatriate dividends from our subsidiaries; and
|
|
•
|
exposure to liabilities under anti-corruption and anti-money laundering laws, including the U.S. Foreign Corrupt Practices Act (“FCPA”) and similar laws and regulations in other jurisdictions.
|
Any one of these factors could materially adversely affect our sales of products or services to international customers or harm our reputation, which could have a material adverse effect on our business, results of operations and financial condition.
21
Our international operations require us to comply with anti-corruption laws and regulations of the U.S. government and various international jurisdictions.
Doing business on a worldwide basis requires us and our subsidiaries to comply with the laws and regulations of the U.S. government and various international jurisdictions, and our failure to comply with these rules and regulations may expose us to liabilities. These laws and regulations may apply to companies, individual directors, officers, employees and agents, and may restrict our operations, trade practices investment decisions and partnering activities. In particular, our international operations are subject to U.S. and foreign anti-corruption laws and regulations, such as the FCPA. The FCPA prohibits U.S. companies and their officers, directors, employees and agents acting on their behalf from corruptly offering, promising, authorizing or providing anything of value to foreign officials for the purposes of influencing official decisions or obtaining or retaining business or otherwise obtaining favorable treatment. The FCPA also requires companies to make and keep books, records and accounts that accurately and fairly reflect transactions and dispositions of assets and to maintain a system of adequate internal accounting controls. As part of our business, we deal with state-owned business enterprises, the employees and representatives of which may be considered foreign officials for purposes of the FCPA. In addition, some of the international locations in which we operate lack a developed legal system and have elevated levels of corruption. As a result of the above activities, we are exposed to the risk of violating anti-corruption laws. Violations of these legal requirements are punishable by criminal fines and imprisonment, civil penalties, disgorgement of profits, injunctions, debarment from government contracts as well as other remedial measures. We have established policies and procedures designed to assist us and our personnel in complying with applicable U.S. and international laws and regulations. However, our employees, subcontractors and agents could take actions that violate these legal requirements, which could adversely affect our reputation, business, financial condition and results of operations.
Any events that impact our brand name, including if the products we manufacture or distribute are found to be defective, could have an adverse effect on our reputation, cause us to incur significant costs and negatively impact our business, results of operations and financial condition.
We face exposure to product liability claims in the event that the use of our products has, or is alleged to have, resulted in injury, death or other adverse effects. We currently maintain product liability insurance coverage, but we cannot be assured that we will be able to obtain such insurance on acceptable terms in the future, if at all, or that any such insurance will provide adequate coverage against potential claims. Product liability claims can be expensive to defend and can divert the attention of management and other personnel for long periods of time, regardless of the ultimate outcome. An unsuccessful product liability defense could have a material adverse effect on our business, results of operation, financial condition or prospects. If one of our products is determined to be defective, we may face substantial warranty costs and may be responsible for significant costs associated with a product recall or a redesign. We have had defect and warranty issues associated with certain of our products in the past, and we cannot give assurance similar product defects will not occur in the future. See NOTE 10 “Product Warranty Liabilities” of Notes to Consolidated Financial Statements included in Part II, Item 8 of this Annual Report on Form 10-K for additional details regarding these warranty issues.
Furthermore, our business depends on the strong brand reputation we believe we have developed. In addition to the risk of defective products, we also face significant risks in our efforts to penetrate new markets, where we have limited brand recognition. We also rely on our reputation with end users of our transmissions to specify our transmissions when purchasing new vehicles from our OEM customers. In the event we are not able to maintain or enhance our brand in these new markets or our reputation is damaged in our existing markets as a result of product defects or recalls, we may face difficulty in maintaining our pricing positions with respect to some of our products or experience reduced demand for our products, which could negatively impact our business, results of operations and financial condition.
Additionally, we license the “Allison Transmission” name and certain related trademarks to third parties. If any third party uses the trade name “Allison Transmission” in ways that adversely affect such trade name or trademark, our reputation could suffer damage, which in turn could have a material adverse effect on our business, results of operations and financial condition.
22
Our brand and reputation are dependent on the continued participation and level of service of our numerous independent distributors and dealers.
We work with a network of approximately
1,400
independent distributors and dealers that provide post-sale service and parts and support equipment. Because we depend on the pull-through demand generated by end users for our products, any actions by the independent distributors or dealers, which are not in our control, may harm our reputation and damage the brand loyalty among our customer base. In the event that we are not able to maintain our brand reputation because of the actions of our independent distributors and dealers, we may face difficulty in maintaining our pricing positions with respect to some of our products or have reduced demand for our products, which could negatively impact our business, results of operations and financial condition. In addition, if a significant number of independent dealers were to terminate their contracts, it could adversely impact our business, results of operations and financial condition.
We are subject to cybersecurity risks to operational systems, security systems, or infrastructure owned by Allison or third-party vendors or suppliers.
We are at risk for interruptions, outages, and breaches of: (i) operational systems, including business, financial, accounting, product development, data processing, or manufacturing processes, owned by us or our third-party vendors or suppliers; (ii) facility security systems, owned by us or our third-party vendors or suppliers; and/or (iii) transmission control modules or other in-product technology, owned by us or our third-party vendors or suppliers. Such cyber incidents could materially disrupt operational systems; result in loss of intellectual property, trade secrets or other proprietary or competitively sensitive information; compromise personally identifiable information of employees, customers, suppliers, or others; jeopardize the security of our facilities; and/or affect the performance of transmission control modules or other in-product technology. A cyber incident could be caused by malicious third parties using sophisticated, targeted methods to circumvent firewalls, encryption, and other security defenses, including hacking, fraud, trickery, or other forms of deception. The techniques used by third parties change frequently and may be difficult to detect for long periods of time. A significant cyber incident could impact production capability, harm our reputation and/or subject us to regulatory actions or litigation, any of which could materially affect our business, results of operations and financial condition. While we utilize a number of measures to prevent, detect and mitigate these threats, including employee education, monitoring of networks and systems, and maintenance of backup and protective systems, there is no guarantee such efforts will be successful in preventing a cyber incident.
In the event of a catastrophic loss of our key manufacturing facility, our business would be adversely affected.
While we manufacture our products in several facilities and maintain insurance covering our facilities, including business interruption insurance, a catastrophic loss of the use of all or a portion of one of our manufacturing facilities due to accident, labor issues, weather conditions, acts of war, political unrest, terrorist activity, natural disaster or otherwise, whether short- or long-term, would have a material adverse effect on our business, results of operations and financial condition. Our most significant concentration of manufacturing is around our corporate headquarters in Indianapolis, Indiana, where we produce approximately 90% of our transmissions. In addition to our Indianapolis manufacturing facilities, we currently operate manufacturing facilities in both Szentgotthard, Hungary and Chennai, India. In the event of a disruption at the Indianapolis facilities, our other facilities may not be adequately equipped to operate at a level sufficient to compensate for the volume of production at the Indianapolis facility due to their size and the fact that they have not yet been tested for such significant increases in production volume.
Many of the key patents and unpatented technology we use in our business are licensed to us, not owned by us, and our ability to use and enforce such patents and technology is restricted by the terms of the license.
Protecting our intellectual property rights is critical to our ability to compete and succeed as a company. GM has granted us an irrevocable, perpetual, royalty-free, worldwide license under a large number of U.S. and foreign patents and patent applications, as well as certain unpatented technology and know-how, to design, develop, manufacture, use and sell fully-automatic transmissions and H 40/50 EP electric hybrid-propulsion transit bus systems for use in certain vocational vehicles, defense vehicles and off-road products. With respect to the bulk of the intellectual property licensed to us, our license is exclusive with respect to the design, development, manufacture, use and sale of fully-automatic transmissions and H 40/50 EP electric hybrid-propulsion transit bus systems in vocational vehicles above certain weight rating thresholds, certain defense vehicles and certain off-road
23
products. It is non-exclusive with respect to certain other products that are within the scope of the licensed patents or to which the licensed technology can be applied. We consider the patents and technology licensed under such license agreement, as a whole, to be critical to preserving our competitive position in the market. However, GM continues to own such patents and technology, and GM has the right, in the first instance, to control the maintenance, enforcement and defense of such patents and the prosecution of the licensed patent applications. In addition, our ability to sublicense our rights is limited.
We rely on unpatented technology, which exposes us to certain risks.
We currently do, and may continue in the future to, rely on unpatented proprietary technology. In such regard, we cannot be assured that any of our applications for protection of our intellectual property rights will be approved or that others will not infringe or challenge our intellectual property rights. It is possible our competitors will independently develop the same or similar technology or otherwise obtain access to our unpatented technology.
Although we believe the loss or expiration of any single patent would not have a material effect on our business, results of operations or financial position, there can be no assurance that any one, or more, of the patents licensed from GM, or any other intellectual property owned by or licensed to us, will not be challenged, invalidated or circumvented by third parties. In fact, a number of the patents licensed to us by GM are set to expire in the next few years. When a patent expires, the inventions it discloses can be used freely by others. Thus, the competitive advantage that we gain from the patents licensed to us from GM will decrease over time, and a greater burden will be placed on our own research and development and licensing efforts to develop and otherwise acquire technologies to keep pace with improvements of transmission-related technology in the marketplace. We enter into confidentiality and invention assignment agreements with employees, and into non-disclosure agreements with suppliers and appropriate customers so as to limit access to and disclosure of our proprietary information. We cannot be assured that these measures will provide meaningful protection for our trade secrets, know-how or other proprietary information in the event of any unauthorized use, misappropriation or disclosure. If we are unable to maintain the proprietary nature of our technologies, our ability to sustain margins on some or all of our products may be affected, which could reduce our sales and profitability. Moreover, the protection provided for our intellectual property by the laws and courts of foreign nations may not be as advantageous to us as the protection available under U.S. law.
Labor unrest could have a material adverse effect on our business, results of operations and financial condition.
As of
December 31, 2018
, approximately
59%
of our U.S. employees, representing over 50% of our total employees, were represented by the UAW and are subject to a collective bargaining agreement. Our current collective bargaining agreement with UAW Local 933 is effective through November 2023.
In addition to our unionized work force, many of our direct and indirect customers and vendors have unionized work forces. Strikes, work stoppages or slowdowns experienced by these customers or vendors or their other suppliers could result in slowdowns or closings of assembly plants that use our products or supply materials for use in the production of our products. Organizations responsible for shipping our products may also be impacted by strikes. Any interruption in the delivery of our products could reduce demand for our products and could have a material adverse effect on us.
In general, we consider our labor relations with all of our employees to be good. However, in the future we may be subject to labor unrest. If strikes, work stoppages or lock-outs at our facilities or at the facilities of our vendors or customers occur or continue for a long period of time, our business, results of operations and financial condition may be materially adversely affected.
24
Our pension and other post-retirement benefits funding obligations could increase as a result of a variety of factors.
Our earnings may be positively or negatively impacted by the amount of income or expense recorded for our defined benefit pension plans and other post-retirement benefits (“OPEB”). Accounting principles generally accepted in the United States of America (“GAAP”) require that income or expense for defined benefit pension plans be calculated at the annual measurement date using actuarial assumptions and calculations. These calculations reflect certain assumptions, the most significant of which relate to the capital markets, interest rates, health care inflation rates and other economic conditions. Changes in key economic indicators can change these assumptions. These assumptions, along with the actual value of assets at the measurement date, will impact the calculation of pension expense for the year. Although GAAP pension expense and pension contributions are not directly related, the key economic indicators that affect GAAP pension expense also affect the amount of cash that we would contribute to our defined benefit pension plans. Because the values of these defined benefit pension plans’ assets have fluctuated and will fluctuate in response to changing market conditions, the amount of gains or losses that will be recognized in subsequent periods, the impact on the funded status of the defined benefit pension plans and the future minimum required contributions, if any, could have a material adverse effect on our business, results of operations and financial condition. The magnitude of such impact cannot be determined with certainty at this time. However, the effect of a one percentage point decrease in the assumed discount rate would result in an increase in the
December 31, 2018
defined benefit pension plans obligation of approximately $20 million. Likewise, a one percentage point decrease in the effective interest rate for determining defined benefit pension plans contributions would result in an increase in the minimum required contributions for
2019
of approximately $4 million. Similarly, a one percentage point decrease in the assumed discount rate would result in an increase in the
December 31, 2018
OPEB obligation of approximately $13 million. As of
December 31, 2018
, the funded status of our defined benefit pension plans was
$19
million and the unfunded status of our OPEB plan was
$93
million.
Environmental, health and safety laws and regulations may impose significant compliance costs and liabilities on us.
We are subject to many environmental, health and safety laws and regulations governing emissions to air, discharges to water, the generation, handling and disposal of waste and the cleanup of contaminated properties. Compliance with these laws and regulations is costly. We have incurred and expect to continue to incur significant costs to maintain or achieve compliance with applicable environmental, health and safety laws and regulations. Moreover, if these environmental, health and safety laws and regulations become more stringent or expand to include a larger portion of our products or our customer’s products in the future, we could incur additional costs in order to ensure that our business and products comply with such regulations. In addition, we may not be successful in complying with, or the vehicle or customer OEMs to which we sell our products may choose not to comply with, such laws and regulations, which could impact our ability to sell our products in certain locations. Furthermore, if our products that are already placed in service are found to be non-compliant with certain laws, regulations and certifications, we may incur additional costs and fines. We cannot assure we are in full compliance with all environmental, health and safety laws and regulations. Our failure to comply with applicable environmental, health and safety laws and regulations and permit requirements could result in civil or criminal fines, penalties or enforcement actions, third-party claims for property damage and personal injury, requirements to clean up property or to pay for the costs of cleanup or regulatory or judicial orders enjoining or curtailing operations or requiring corrective measures, including the installation of pollution control equipment or remedial actions. Our failure to comply could also result in our failure to secure adequate insurance for our business, resulting in significant exposure, diminished ability to hedge our risks and material modifications of our business operations.
We may be subject to liability as a potentially responsible party under the Comprehensive Environmental Response, Compensation and Liability Act and similar state or foreign laws for contaminated properties that we currently own, lease or operate or that we or our predecessors have previously owned, leased or operated, and sites to which we or our predecessors sent hazardous substances. Such liability may be joint and several so that we may be liable for more than our share of any contamination, and any such liability may be determined without regard to causation or knowledge of contamination. We or our predecessors have been named potentially responsible parties at contaminated sites from time to time.
25
We manage the remediation of historical soil and groundwater contamination at our Indianapolis, Indiana facilities under an Agreed Order of Consent ("AOC") with the EPA. We recorded approximately $14 million in 2015 for the estimated undiscounted environmental liabilities to be paid out over 30 years, which will be adjusted periodically as remediation efforts progress or as additional technical, regulatory or legal information becomes available. In 2016, we satisfied the financial assurance requirement under the AOC by securing a letter of credit in the amount of $15 million. See Part I, Item 1, “Business — Environmental Compliance” and Part II, Item 8, NOTE 17, “Commitments and Contingencies” of this Annual Report on Form 10-K. There can be no assurances that future environmental remediation obligations will not have a material adverse effect on our results of operations and financial condition. In addition, we occasionally evaluate alternatives with respect to our facilities, including possible dispositions or closings. Investigations undertaken in connection with these activities may lead to discoveries of contamination that must be remediated, and closings of facilities may trigger remediation requirements that are not applicable to operating facilities. We may also face lawsuits brought by third parties that either allege property damage or personal injury as a result of, or seek reimbursement for costs associated with, such contamination.
Our business and financial results may be adversely affected by U.S. government contracting risks.
We are subject to various laws and regulations applicable to parties doing business with the U.S. government, including laws and regulations governing performance of U.S. government contracts, the use and treatment of U.S. government furnished property and the nature of materials used in our products. We may be unilaterally suspended or barred from conducting business with the U.S. government, or become subject to fines or other sanctions if we are found to have violated such laws or regulations. As a result of the need to comply with these laws and regulations, we are subject to increased risks of governmental investigations, civil fraud actions, criminal prosecutions, whistleblower law suits and other enforcement actions. The laws and regulations to which we are subject include, but are not limited to, Export Administration Regulations, the Federal Acquisition Regulation, International Traffic in Arms Regulations and regulations from the Bureau of Alcohol, Tobacco and Firearms and the FCPA.
U.S. government contracts are subject to modification, curtailment or termination by the U.S. government without prior written notice, either for convenience or for default as a result of our failure to perform under the applicable contract. If terminated by the U.S. government as a result of our default, we could be liable for additional costs the U.S. government incurs in acquiring undelivered goods or services from another source and any other damages it suffers. Additionally, we cannot assign prime U.S. government contracts without the prior consent of the U.S. government contracting officer, and we are required to register with the Central Contractor Registration Database. Furthermore, the U.S. government periodically audits our governmental contract costs, which could result in fines, penalties or adjustment of costs and prices under the contracts. The result of, or expiration of the statute of limitations for, such audits could have an impact on reported net income and cash flow from operations.
Exchange rate fluctuations could adversely affect our results of operations and financial position.
As a result of the expansion of our international operations, currency exchange rate fluctuations could affect our results of operations and financial position. We expect to generate an increasing portion of our net sales and expenses in such foreign currencies as the Japanese Yen, Euro, Indian Rupee, Brazilian Real, Chinese Yuan Renminbi, Canadian Dollar and Hungarian Forint. Although we may enter into foreign exchange agreements with financial institutions in order to reduce our exposure to fluctuations in the value of these and other foreign currencies, these transactions, if entered into, will not eliminate that risk entirely. To the extent that we are unable to match net sales received in foreign currencies with expenses paid in the same currency, exchange rate fluctuations could have a negative impact on our results of operations and financial condition. Additionally, because our consolidated financial results are reported in U.S. Dollars, if we generate net sales or earnings in other currencies, the conversion of such amounts into U.S. Dollars can result in an increase or decrease in the amount of our net sales or earnings. Furthermore, we sell certain of our products in our non-North American markets denominated in the U.S. Dollar. To the extent that certain of the local currencies in our non-North American markets are relatively weaker than the U.S. Dollar, whether as a result of foreign governments’ influence or otherwise, we could become less price competitive, which could have a material adverse effect on the results of our operations.
26
An impairment in the carrying value of goodwill, other intangible assets or long-lived assets could negatively affect our consolidated results of operations and net worth.
Pursuant to GAAP, we are required to assess our goodwill and indefinite-lived intangible assets to determine if they are impaired on an annual basis, or more often if events or changes in circumstances indicate that impairment may have occurred. Intangible assets with finite lives are amortized over the useful life and are reviewed for impairment on triggering events such as events or changes in circumstances indicating that an impairment may have occurred. If the testing performed indicates that impairment has occurred, we are required to record a non-cash impairment charge for the difference between the carrying value of the goodwill and the implied fair value of the goodwill or the carrying value of the intangible assets and the fair value of the intangible assets in the period the determination is made. Disruptions to our business, end market conditions, protracted economic weakness and unexpected significant declines in operating results may result in charges for goodwill and other asset impairments. See NOTE 2 “Summary of Significant Accounting Policies” and NOTE 6 “Goodwill and Other Intangible Assets” of Notes to Consolidated Financial Statements included in Part II, Item 8 of this Annual Report on Form 10-K for additional details.
The carrying value of long-lived assets is evaluated whenever events or circumstances indicate that the carrying value of a long-lived asset may not be recoverable. Events or circumstances that would result in an impairment review primarily include a significant change in the use of an asset, a significant change in the projected future cash flows generated by an asset or the planned sale or disposal of an asset. The asset would be considered impaired when there is no future use planned for the asset or the future net undiscounted cash flows generated by the asset or asset group are less than its carrying value. An impairment loss would be recognized based on the amount by which the carrying value exceeds fair value and could have a material adverse effect on the results of our operations. See NOTE 2 “Summary of Significant Accounting Policies” and NOTE 5 “Property, Plant and Equipment” of Notes to Consolidated Financial Statements included in Part II, Item 8 of this Annual Report on Form 10-K for additional details.
Provisions of our amended and restated certificate of incorporation and amended and restated bylaws and Delaware law might discourage, delay or prevent a change of control of our company or changes in our management and, as a result, depress the trading price of our common stock.
Our amended and restated certificate of incorporation and amended and restated bylaws contain provisions that could discourage, delay or prevent a change in control of our company or changes in our management that the stockholders of our company may deem advantageous. These provisions:
|
•
|
authorize the issuance of blank check preferred stock that our Board of Directors could issue to increase the number of outstanding shares and to discourage a takeover attempt;
|
|
•
|
limit the ability of stockholders to remove directors only “for cause”;
|
|
•
|
prohibit our stockholders from calling a special meeting of stockholders;
|
|
•
|
prohibit stockholder action by written consent, which requires all stockholder actions to be taken at a meeting of our stockholders;
|
|
•
|
provide that the Board of Directors is expressly authorized to adopt, or to alter or repeal our bylaws;
|
|
•
|
establish advance notice requirements for nominations for election to our Board of Directors or for proposing matters that can be acted upon by stockholders at stockholder meetings; and
|
|
•
|
require the approval of holders of at least two-thirds of the outstanding shares of common stock to amend the bylaws and certain provisions of the certificate of incorporation.
|
These anti-takeover defenses could discourage, delay or prevent a transaction involving a change in control of our company that our stockholders may believe to be in their best interests. These provisions could also discourage proxy contests and make it more difficult for our stockholders to elect directors of their choosing and cause us to take corporate actions other than those they desire.
27
Risks Related to Our Indebtedness
Our substantial indebtedness could adversely affect our financial health, restrict our activities and affect our ability to meet our obligations.
We have a significant amount of indebtedness. As of
December 31, 2018
, we had total indebtedness of
$2,548
million and we would have been able to borrow an additional
$533
million, net of
$17
million of outstanding letters of credit, under the revolving portion of Allison Transmission Inc.’s (“ATI”), the Company’s wholly-owned subsidiary, Senior Secured Credit Facility due 2021 (“Revolving Credit Facility”). As of
December 31, 2018
, we had no outstanding borrowings against the Revolving Credit Facility. At
December 31, 2018
,
$1,148
million of our total indebtedness was associated with ATI’s Senior Secured Credit Facility Term B-3 Loan due 2022 (“Term B-3 Loan”, and together with the Revolving Credit Facility, the “Senior Secured Credit Facility”),
$1,000
million of our total indebtedness was associated with ATI’s 5.0% Senior Notes due September 2024 (“5.0% Senior Notes”) and
$400
million of our total indebtedness was associated with ATI’s 4.75% Senior Notes due October 2027 (“4.75% Senior Notes”). For a complete description of the terms of the Senior Secured Credit Facility, the 5.0% Senior Notes and the 4.75% Senior Notes, please see Part II, Item 7, “Management’s Discussion and Analysis of Financial Condition and Results of Operations – Liquidity and Capital Resources” of this Annual Report on Form 10-K.
Our substantial indebtedness could have important consequences. For example, it could:
|
•
|
make it more difficult for us to satisfy our obligations under our indebtedness;
|
|
•
|
require us to further dedicate a substantial portion of our cash flow from operations to payments of principal and interest on our indebtedness, thereby reducing the availability of our cash flow to fund acquisitions, working capital, capital expenditures, research and development efforts and other general corporate purposes;
|
|
•
|
increase our vulnerability to and limit our flexibility in planning for, or reacting to, downturns or changes in our business and the industry in which we operate;
|
|
•
|
restrict us from making strategic acquisitions or cause us to make non-strategic divestitures;
|
|
•
|
expose us to the risk of increased interest rates as borrowings under the Senior Secured Credit Facility are subject to variable rates of interest;
|
|
•
|
place us at a competitive disadvantage compared to our competitors that have less debt; and
|
|
•
|
limit our ability to borrow additional funds.
|
In addition, the Revolving Credit Facility contains a maximum total senior secured leverage ratio. The Senior Secured Credit Facility, the indenture governing the 5.0% Senior Notes and the indenture governing the 4.75% Senior Notes also contain other negative and affirmative covenants that will limit our ability to engage in activities that may be in our long-term best interests. Our failure to comply with any of the covenants could result in an event of default which, if not cured or waived, could result in the acceleration of all of our indebtedness.
Further, the Term B-3 Loan bears interest at fluctuating interest rates, primarily based on London Interbank Offered Rate ("LIBOR"). In July 2017, the Financial Conduct Authority, a regulator of financial services firms in the United Kingdom, announced that it intends to stop persuading or compelling banks to submit LIBOR rates after 2021. We are unable to predict the effect of any changes, any establishment of alternative reference rates or any other reforms to LIBOR or any replacement of LIBOR that may be enacted in the United Kingdom or elsewhere. Such changes, reforms or replacements relating to LIBOR could have an adverse impact on the market for or value of any LIBOR-linked securities, loans, derivatives and other financial obligations or extensions of credit held by us or on our overall financial condition or results of operations.
28
Our ability to pay regular dividends on our common stock is subject to the discretion of our Board of Directors and may be limited by our structure and statutory restrictions and restrictions imposed by the Senior Secured Credit Facility, the indenture governing the 5.0% Senior Notes and the indenture governing the 4.75% Senior Notes as well as any future agreements.
Our Board of Directors has maintained a quarterly dividend of $0.15 per share of common stock since the fourth quarter of 2014. However, the payment of future dividends will be at the discretion of our Board of Directors and will depend on, among other things, our earnings, financial condition, capital requirements, level of indebtedness, statutory and contractual restrictions applying to the payment of dividends and other considerations that our Board of Directors deems relevant. The Senior Secured Credit Facility, the indenture governing the 5.0% Senior Notes and the indenture governing the 4.75% Senior Notes also effectively limit our ability to pay dividends. As a consequence of these limitations and restrictions, we may not be able to make, or may have to reduce or eliminate, the payment of dividends on our common stock. Accordingly, our stockholders may have to sell some or all of their common stock after price appreciation in order to generate cash flow from their investment. Our stockholders may not receive a gain on their investment when they sell their common stock and they may lose the entire amount of the investment. Additionally, any change in the level of our dividends or the suspension of the payment thereof could adversely affect the market price of our common stock.
To service our indebtedness, we will require a significant amount of cash, and our ability to generate cash depends on many factors beyond our control.
Our ability to make cash payments on our indebtedness and to fund planned capital expenditures will depend on our ability to generate significant operating cash flow in the future. This, to a significant extent, is subject to general economic, financial, competitive, legislative, regulatory and other factors that are beyond our control.
We cannot ensure that our business will generate sufficient cash flow from operations or that future borrowings will be available to us under the Senior Secured Credit Facility in an amount sufficient to enable us to pay our indebtedness or to fund our other liquidity needs. In such circumstances, we may need to refinance all or a portion of our indebtedness on or before maturity. We cannot ensure that we will be able to refinance any of our indebtedness on commercially reasonable terms or at all. If we cannot service our indebtedness, we may have to take actions such as selling assets, seeking additional equity or reducing or delaying capital expenditures, strategic acquisitions, investments and alliances. We cannot ensure that any such actions, if necessary, could be effected on commercially reasonable terms or at all.
If we fail to pay principal, premium, if any, and interest on our indebtedness or to otherwise comply with the covenants in the instruments governing our indebtedness, we may be forced into bankruptcy or liquidation by our lenders.
If we are unable to generate sufficient cash flow or are otherwise unable to obtain funds necessary to meet required payments of principal, premium, if any, and interest on our indebtedness, or if we otherwise fail to comply with the various covenants in the instruments governing our indebtedness, we could be in default under the terms of the agreements governing such indebtedness. In the event of such default, the holders of such indebtedness could elect to declare all the funds borrowed thereunder to be due and payable, together with accrued and unpaid interest, the lenders under the Senior Secured Credit Facility could elect to terminate their commitments thereunder, cease making further loans and institute foreclosure proceedings against our assets, and we could be forced into bankruptcy or liquidation. If our operating performance declines, we may in the future need to obtain waivers from the required lenders under the Senior Secured Credit Facility to avoid being in default. If we or any of our subsidiaries breach the covenants under the Senior Secured Credit Facility and seek a waiver, we may not be able to obtain a waiver from the required lenders. If this occurs, we would be in default under the Senior Secured Credit Facility, the lenders could exercise their rights, as described above, and we could be forced into bankruptcy or liquidation.
Despite current indebtedness levels, we and our subsidiaries may still be able to incur additional indebtedness, which could further exacerbate the risks associated with our substantial financial leverage.
We and our subsidiaries may be able to incur additional indebtedness in the future because the terms of our indebtedness do not fully prohibit us or our subsidiaries from doing so. Subject to covenant compliance and certain conditions, our indebtedness permits additional borrowing, including total borrowing up to
$533
million under the Revolving Credit Facility. If new debt is added to our current debt levels and our subsidiaries’ current debt levels, the related risks that we and they now face could intensify.
29
ITEM 1B. UNRESOLVED STAFF COMMENTS
None.
ITEM 2. PROPERTIES
Our world headquarters, which we own, is located at One Allison Way, Indianapolis, Indiana 46222. As of
December 31, 2018
, we have a total of 16 manufacturing and certain other facilities in seven countries. The following table sets forth certain information regarding these facilities.
|
Plant
|
Location
|
Approximate
Size (ft
2
)
|
Owned /
Leased
|
Description
|
||||
|
Plant #3
|
Indianapolis
|
927,000
|
|
Own
|
Engineering, Operational Support
|
|||
|
Plant #4
|
Indianapolis
|
425,900
|
|
Own
|
Manufacturing
|
|||
|
Plant #6
|
Indianapolis
|
431,500
|
|
Own
|
Manufacturing
|
|||
|
Plant #12
|
Indianapolis
|
534,900
|
|
Own
|
Manufacturing
|
|||
|
Plant #14
|
Indianapolis
|
481,100
|
|
Own
|
Manufacturing
|
|||
|
Plant #16
|
Indianapolis
|
391,700
|
|
Own
|
Manufacturing
|
|||
|
Plant #17
|
Indianapolis
|
389,000
|
|
Own
|
Parts Distribution Center
|
|||
|
Plant #20 Tech. Center
|
Indianapolis
|
59,000
|
|
Own
|
Engineering & Testing
|
|||
|
Plant #21 Tech. Center
|
Indianapolis
|
10,000
|
|
Own
|
Engineering & Testing
|
|||
|
Szentgotthard
|
Hungary
|
149,000
|
|
Own
|
Manufacturing & Customization
|
|||
|
Szentgotthard
|
Hungary
|
3,900
|
|
Own
|
Sales & Marketing Support
|
|||
|
Shanghai
|
China
|
38,000
|
|
Lease
|
Customization & Distribution
|
|||
|
Santo Amaro/Sorocabo
|
Brazil
|
31,400
|
|
Own
|
Customization & Distribution
|
|||
|
Chennai
|
India
|
258,500
|
|
Own
|
Manufacturing
|
|||
|
Dubai
|
United Arab Emirates
|
16,500
|
|
Lease
|
Distribution
|
|||
|
Sliedrecht
|
The Netherlands
|
37,000
|
|
Lease
|
Customization & Distribution
|
|||
We believe all our facilities are suitable for their intended purpose, are being efficiently utilized and provide adequate capacity to meet demand for the next several years. The table above does not include sales offices located in various countries.
ITEM 3. LEGAL PROCEEDINGS
We are subject to various contingencies, including routine legal proceedings and claims arising out of the normal course of business. These proceedings primarily involve commercial claims, product liability claims, personal injury claims and workers’ compensation claims. The outcome of these lawsuits, legal proceedings and claims cannot be predicted with certainty. Nevertheless, we believe the outcome of any of these currently existing proceedings, even if determined adversely, would not have a material adverse effect on our financial condition or results of operations. See also NOTE 17, “Commitments and Contingencies” in Part II, Item 8, of this Annual Report on Form 10-K.
ITEM 4. MINE SAFETY DISCLOSURES
Not applicable.
30
|
PART II.
|
ITEM 5. Market for Registrant’s Common Equity, Related Stockholder Matters and Issuer Purchases of Equity Securities
Market Information
Our common stock is listed on the NYSE under the symbol “ALSN.”
Holders
As of February 11, 2019, there were approximately 68,300 stockholders of record of our common stock, which includes the actual number of holders registered on the books of the Company and holders of shares in “street name” or persons, partnerships, associations, corporations or other entities identified in security position listings maintained by depositories.
Unregistered Sales of Equity Securities
During the period covered by this Annual Report on Form 10-K, we did not offer or sell any equity securities that were not registered under the Securities Act of 1933, as amended (the “Securities Act”).
Issuer Purchases of Equity Securities
On November 14, 2016, our Board of Directors authorized us to repurchase up to $1,000 million of our common stock pursuant to a stock repurchase program (“Repurchase Program”). The Board of Directors approved increases of $500 million on each of November 8, 2017 and July 30, 2018 bringing the authorized total repurchases under the Repurchase Program to $2,000 million. The terms of the Repurchase Program provide that we may repurchase shares of our common stock, from time to time depending on market conditions and corporate needs, in the open market or through privately negotiated transactions in accordance with Rule 10b-18 of the Exchange Act. The Repurchase Program does not have an expiration date.
The following table sets forth information related to our repurchase of our common stock on a monthly basis in the three months ended
December 31, 2018
:
|
Total Number
of Shares
Purchased
|
Average Price
Paid per Share
|
Total Number of
Shares Purchased
as Part of
Publicly
Announced
Programs
(1)
|
Approximate
Dollar Value of
Shares that May
Yet Be Purchased
Under Programs
(1)
|
||||||||||
|
October 1 – October 31, 2018
|
972,033
|
|
$
|
45.05
|
|
972,033
|
|
$
|
553,926,433
|
|
|||
|
November 1 – November 30, 2018
|
783,969
|
|
$
|
46.33
|
|
783,969
|
|
$
|
517,604,485
|
|
|||
|
December 1 – December 31, 2018
|
1,672,871
|
|
$
|
43.38
|
|
1,672,871
|
|
$
|
445,031,067
|
|
|||
|
Total
|
3,428,873
|
|
3,428,873
|
|
|||||||||
|
(1)
|
These values reflect repurchases made under the Repurchase Program.
|
Issuances Under Equity Compensation Plans
For information regarding the securities authorized for issuance under our equity compensation plans, see Part III, Item 12 of this Annual Report on Form 10-K.
31
Comparative Stock Performance Graph
The information included under the heading “Comparative Stock Performance Graph” in this Item 5 of Part II of this Annual Report on Form 10-K shall not be deemed to be “soliciting material” or subject to Regulation 14A or 14C, shall not be deemed “filed” for purposes of Section 18 of the Exchange Act, or otherwise subject to the liabilities of that section, nor shall it be deemed incorporated by reference in any filing under the Securities Act or the Exchange Act.
Set forth below is a graph comparing the total cumulative returns of ALSN, the S&P 500 Index and an index of peer companies selected by us. Our peer group includes Donaldson Company, Inc., Graco Inc., Roper Technologies, Inc., Gentex Corporation, Rockwell Automation, Inc. and Sensata Technologies Holding N.V. The graph assumes $100 was invested on December 31, 2013 in our common stock and each of the indices and that all dividends, if any, are reinvested.
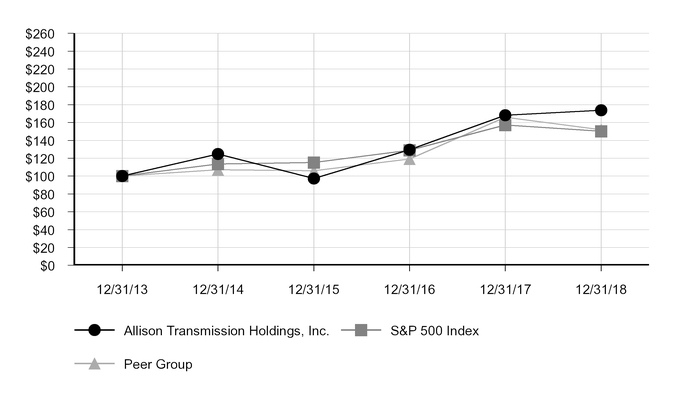
|
As of
December 31,
2013
|
As of
December 31,
2014
|
As of
December 31,
2015
|
As of
December 31,
2016
|
As of
December 31,
2017
|
As of
December 31,
2018
|
||||||||||||||||||
|
Allison Transmission Holdings, Inc.
|
$
|
100.00
|
|
$
|
124.83
|
|
$
|
97.27
|
|
$
|
129.44
|
|
$
|
168.21
|
|
$
|
173.83
|
|
|||||
|
S&P 500 Index
|
100.00
|
|
113.69
|
|
115.26
|
|
129.05
|
|
157.22
|
|
150.33
|
|
|||||||||||
|
Peer Group
|
100.00
|
|
107.07
|
|
105.94
|
|
119.10
|
|
165.84
|
|
151.86
|
|
|||||||||||
32
ITEM 6. Selected Financial Data
The following table sets forth certain financial information for the most recent five years. The following table should be read in conjunction with Part II, Item 7, “Management’s Discussion and Analysis of Financial Condition and Results of Operations” and Part II, Item 8, “Financial Statements and Supplementary Data” of this Annual Report on Form 10-K.
|
(in millions, except per share data)
|
December 31, 2018
|
December 31, 2017
|
December 31, 2016
|
December 31, 2015
|
December 31, 2014
|
||||||||||||||
|
Consolidated Statements of Operations:
|
|||||||||||||||||||
|
Net sales
|
$
|
2,713
|
|
$
|
2,262
|
|
$
|
1,840
|
|
$
|
1,986
|
|
$
|
2,127
|
|
||||
|
Gross profit
|
1,422
|
|
1,131
|
|
864
|
|
934
|
|
976
|
|
|||||||||
|
Operating expenses:
|
|||||||||||||||||||
|
Selling, general and administrative
|
364
|
|
342
|
|
324
|
|
317
|
|
345
|
|
|||||||||
|
Engineering — research and development
|
131
|
|
105
|
|
88
|
|
93
|
|
104
|
|
|||||||||
|
Loss associated with impairment of long-lived assets
|
4
|
|
32
|
|
—
|
|
1
|
|
15
|
|
|||||||||
|
Trade name impairment
|
—
|
|
—
|
|
—
|
|
80
|
|
—
|
|
|||||||||
|
Environmental remediation
|
—
|
|
—
|
|
—
|
|
14
|
|
—
|
|
|||||||||
|
Total operating expenses
|
499
|
|
479
|
|
412
|
|
505
|
|
464
|
|
|||||||||
|
Operating income
|
923
|
|
652
|
|
452
|
|
429
|
|
512
|
|
|||||||||
|
Other income (expense), net:
|
|||||||||||||||||||
|
Interest expense, net
|
(121
|
)
|
(103
|
)
|
(101
|
)
|
(114
|
)
|
(138
|
)
|
|||||||||
|
Expenses related to long-term debt refinancing
|
—
|
|
—
|
|
(12
|
)
|
(26
|
)
|
—
|
|
|||||||||
|
Other income (expense), net
|
3
|
|
(22
|
)
|
2
|
|
—
|
|
(6
|
)
|
|||||||||
|
Total other expense, net
|
(118
|
)
|
(125
|
)
|
(111
|
)
|
(140
|
)
|
(144
|
)
|
|||||||||
|
Income before income taxes
|
805
|
|
527
|
|
341
|
|
289
|
|
368
|
|
|||||||||
|
Income tax expense
|
(166
|
)
|
(23
|
)
|
(126
|
)
|
(107
|
)
|
(139
|
)
|
|||||||||
|
Net income
|
$
|
639
|
|
$
|
504
|
|
$
|
215
|
|
$
|
182
|
|
$
|
229
|
|
||||
|
Earnings Per Share Data:
|
|||||||||||||||||||
|
Basic earnings per share
|
$
|
4.81
|
|
$
|
3.38
|
|
$
|
1.28
|
|
$
|
1.03
|
|
$
|
1.27
|
|
||||
|
Weighted-average shares outstanding
|
133
|
|
149
|
|
168
|
|
176
|
|
180
|
|
|||||||||
|
Diluted earnings per share
|
$
|
4.78
|
|
$
|
3.36
|
|
$
|
1.27
|
|
$
|
1.03
|
|
$
|
1.25
|
|
||||
|
Diluted weighted-average shares outstanding
|
134
|
|
150
|
|
169
|
|
177
|
|
182
|
|
|||||||||
|
Dividends declared per common share
|
$
|
0.60
|
|
$
|
0.60
|
|
$
|
0.60
|
|
$
|
0.60
|
|
$
|
0.51
|
|
||||
|
Consolidated Balance Sheet Data:
|
|||||||||||||||||||
|
Cash and cash equivalents
|
$
|
231
|
|
$
|
199
|
|
$
|
205
|
|
$
|
252
|
|
$
|
263
|
|
||||
|
Total assets
|
4,237
|
|
4,205
|
|
4,219
|
|
4,408
|
|
4,656
|
|
|||||||||
|
Total debt
|
2,523
|
|
2,546
|
|
2,159
|
|
2,377
|
|
2,491
|
|
|||||||||
|
Stockholders’ equity
|
659
|
|
689
|
|
1,081
|
|
1,189
|
|
1,398
|
|
|||||||||
33
ITEM 7. Management’s Discussion and Analysis of Financial Condition and Results of Operations
The following discussion contains forward-looking statements regarding industry trends, our expectations regarding our future performance, liquidity and capital resources and other non-historical statements that involve risks and uncertainties. Our actual results may differ materially from those discussed in or implied by the forward looking statements as a result of various factors, including, without limitation, those set forth under Part I, Item 1A, “Risk Factors,” and other matters included elsewhere in this Annual Report on Form 10-K. The following discussion and analysis of our financial condition and results of operations should be read in conjunction with our consolidated financial statements and the notes thereto included elsewhere in this Annual Report on Form 10-K, as well as the information presented under Part II, Item 6 of this Annual Report on Form 10-K.
Overview
We design and manufacture commercial and defense fully-automatic transmissions. The business was founded in 1915 and has been headquartered in Indianapolis, Indiana since inception. Allison was an operating unit of General Motors Corporation from 1929 until 2007, when Allison once again became a stand-alone company. In March 2012, Allison began trading on the New York Stock Exchange under the symbol, “ALSN”.
We have approximately
2,900
employees and
12
different transmission product lines. Although approximately
77%
of revenues were generated in North America in
2018
, we have a global presence by serving customers in Europe, Asia, South America and Africa. We serve customers through an independent network of approximately
1,400
independent distributor and dealer locations worldwide.
Trends Impacting Our Business
Our net sales are driven by commercial vehicle production, which tends to be highly correlated to macroeconomic conditions. During
2019
, we expect lower demand in the North America Off-Highway and Service Parts, Support Equipment and Other end markets, partially offset by increased demand in the North America On-Highway end market, price increases on certain products and continued execution of our growth initiatives.
Full Year
2018
and
2017
Net Sales by End Market (in millions)
|
End Market
|
2018
Net Sales
|
2017
Net Sales
|
% Variance
|
||||||||
|
North America On-Highway
|
$
|
1,317
|
|
$
|
1,177
|
|
12
|
%
|
|||
|
North America Off-Highway
|
93
|
|
51
|
|
82
|
%
|
|||||
|
Defense
|
158
|
|
117
|
|
35
|
%
|
|||||
|
Outside North America On-Highway
|
383
|
|
344
|
|
11
|
%
|
|||||
|
Outside North America Off-Highway
|
129
|
|
41
|
|
215
|
%
|
|||||
|
Service Parts, Support Equipment and Other
|
633
|
|
532
|
|
19
|
%
|
|||||
|
Total Net Sales
|
$
|
2,713
|
|
$
|
2,262
|
|
20
|
%
|
|||
* North America On-Highway end market net sales are inclusive of net sales for North America Electric Hybrid-Propulsion Systems for Transit Bus
North America On-Highway end market net sales were up
12%
for the year ended
December 31, 2018
compared to the year ended
December 31, 2017
, principally driven by higher demand for Rugged Duty Series and Highway Series models.
North America Off-Highway end market net sales were up $42 million for the year ended
December 31, 2018
compared to the year ended
December 31, 2017
, principally driven by higher demand from hydraulic fracturing applications.
Defense end market net sales were up
35%
for the year ended
December 31, 2018
compared to the year ended
December 31, 2017
, principally driven by higher Tracked and Wheeled demand.
Outside North America On-Highway end market net sales were up
11%
for the year ended
December 31, 2018
compared to the year ended
December 31, 2017
, principally driven by higher demand in Asia and Europe.
34
Outside North America Off-Highway end market net sales were up $88 million for the year ended
December 31, 2018
compared to the year ended
December 31, 2017
, principally driven by higher demand in the energy, mining and construction sectors.
Service Parts, Support Equipment and Other end market net sales were up
19%
for the year ended
December 31, 2018
compared to the year ended
December 31, 2017
, principally driven by higher demand for global service parts and support equipment.
Key Components of our Results of Operations
Net sales
We generate our net sales primarily from the sale of transmissions, transmission parts, support equipment, defense kits, engineering services, royalties and extended transmission coverage to a wide array of OEMs, distributors and the U.S. government. Sales are recorded net of provisions for customer allowances and other rebates. Engineering services are recorded as net sales in accordance with the terms of the contract. The associated costs are recorded in cost of sales. We also have royalty agreements with third parties that provide net sales as a result of joint efforts in developing marketable products.
Cost of sales
Our primary components of cost of sales are purchased parts, the overhead expense related to our manufacturing operations and direct labor associated with the manufacture and assembly of transmissions and parts. For the year ended
December 31, 2018
, direct material costs were approximately 71%, overhead costs were approximately 23% and direct labor costs were approximately 6% of total cost of sales. We are subject to changes in our cost of sales caused by movements in underlying commodity prices. We seek to hedge against this risk by using long-term supply agreements ("LTSAs"). See Part II, Item 7A, “Quantitative and Qualitative Disclosures about Market Risk—Commodity Price Risk” included in this Annual Report on Form 10-K.
Selling, general and administrative
The principal components of our selling, general and administrative expenses are salaries and benefits for our office personnel, advertising and promotional expenses, product warranty expense, expenses relating to certain information technology systems and amortization of our intangibles.
Engineering — research and development
We incur costs in connection with research and development programs that are expected to contribute to future earnings. Such costs are expensed as incurred.
35
Non-GAAP Financial Measures
We use Adjusted Earnings before Interest, Taxes, Depreciation, and Amortization (“EBITDA”) and Adjusted EBITDA as a percent of net sales to measure our operating profitability. We believe that Adjusted EBITDA and Adjusted EBITDA as a percent of net sales provide management, investors and creditors with useful measures of the operational results of our business and increase the period-to-period comparability of our operating profitability and comparability with other companies. Adjusted EBITDA as a percent of net sales is also used in the calculation of management’s incentive compensation program. The most directly comparable U.S. generally accepted accounting principles (“GAAP”) measure to Adjusted EBITDA and Adjusted EBITDA as a percent of net sales is Net income and Net income as a percent of net sales, respectively. Adjusted EBITDA is calculated as earnings before interest expense, income tax expense, amortization of intangible assets, depreciation of property, plant and equipment and other adjustments as defined by Allison Transmission, Inc.’s (“ATI”), our wholly-owned subsidiary, Term B-3 Loan due 2022 ("Term B-3 Loan"). Adjusted EBITDA as a percent of net sales is calculated as Adjusted EBITDA divided by net sales.
We use Adjusted free cash flow to evaluate the amount of cash generated by our business that, after the capital investment needed to maintain and grow our business and certain mandatory debt service requirements, can be used for repayment of debt, stockholder distributions and strategic opportunities, including investing in our business. We believe that Adjusted free cash flow enhances the understanding of the cash flows of our business for management, investors and creditors. Adjusted free cash flow is also used in the calculation of management’s incentive compensation program. The most directly comparable GAAP measure to Adjusted free cash flow is Net cash provided by operating activities. Adjusted free cash flow is calculated as Net cash provided by operating activities after additions of long-lived assets.
36
The following is a reconciliation of Net income and Net income as a percent of net sales to Adjusted EBITDA and Adjusted EBITDA as a percent of net sales and a reconciliation of Net cash provided by operating activities to Adjusted free cash flow:
|
|
For the years ended December 31,
|
||||||||||
|
(unaudited, in millions)
|
2018
|
2017
|
2016
|
||||||||
|
Net income (GAAP)
|
$
|
639
|
|
$
|
504
|
|
$
|
215
|
|
||
|
plus:
|
|||||||||||
|
Income tax expense
|
166
|
|
23
|
|
126
|
|
|||||
|
Interest expense, net
|
121
|
|
103
|
|
101
|
|
|||||
|
Amortization of intangible assets
|
87
|
|
90
|
|
92
|
|
|||||
|
Depreciation of property, plant and equipment
|
77
|
|
80
|
|
84
|
|
|||||
|
UAW Local 933 retirement incentive (a)
|
15
|
|
—
|
|
—
|
|
|||||
|
Stock-based compensation expense (b)
|
13
|
|
12
|
|
9
|
|
|||||
|
Loss associated with impairment of long-lived assets (c)
|
4
|
|
32
|
|
—
|
|
|||||
|
Technology-related investment expense (d)
|
3
|
|
16
|
|
1
|
|
|||||
|
Unrealized loss on foreign exchange (e)
|
3
|
|
—
|
|
1
|
|
|||||
|
UAW Local 933 contract signing bonus (f)
|
—
|
|
10
|
|
—
|
|
|||||
|
Dual power inverter module units extended coverage (g)
|
—
|
|
(2
|
)
|
1
|
|
|||||
|
Expenses related to long-term debt refinancing (h)
|
—
|
|
—
|
|
12
|
|
|||||
|
Stockholder activism expenses (i)
|
—
|
|
—
|
|
4
|
|
|||||
|
Unrealized gain on commodity hedge contracts (j)
|
—
|
|
—
|
|
(2
|
)
|
|||||
|
Adjusted EBITDA (Non-GAAP)
|
$
|
1,128
|
|
$
|
868
|
|
$
|
644
|
|
||
|
Net sales (GAAP)
|
$
|
2,713
|
|
$
|
2,262
|
|
$
|
1,840
|
|
||
|
Net income as a percent of net sales (GAAP)
|
23.6
|
%
|
22.3
|
%
|
11.7
|
%
|
|||||
|
Adjusted EBITDA as a percent of net sales (Non-GAAP)
|
41.6
|
%
|
38.4
|
%
|
35.0
|
%
|
|||||
|
Net cash provided by operating activities (GAAP)
|
$
|
837
|
|
$
|
658
|
|
$
|
591
|
|
||
|
(Deductions) or additions to reconcile to Adjusted free cash flow:
|
|||||||||||
|
Additions of long-lived assets
|
(100
|
)
|
(91
|
)
|
(71
|
)
|
|||||
|
Excess tax benefit from stock-based compensation (k)
|
—
|
|
—
|
|
6
|
|
|||||
|
Stockholder activism expenses (i)
|
—
|
|
—
|
|
4
|
|
|||||
|
Adjusted free cash flow (Non-GAAP)
|
$
|
737
|
|
$
|
567
|
|
$
|
530
|
|
||
|
(a)
|
Represents a charge (recorded in Cost of sales) related to a retirement incentive program for certain employees represented by the International Union, United Automobile, Aerospace and Agricultural Implement Workers of America ("UAW") pursuant to the UAW Local 933 collective bargaining agreement effective through November 2023.
|
|
(b)
|
Represents employee stock compensation expense (recorded in Cost of sales, Selling, general and administrative, and Engineering – research and development).
|
|
(c)
|
Represents a charge associated with the impairment of long-lived assets related to the production of the TC10 transmission.
|
|
(d)
|
Represents a charge (recorded in Other income (expense), net) for investments in co-development agreements to expand our position in transmission technologies.
|
|
(e)
|
Represents losses (recorded in Other income (expense), net) on intercompany financing transactions related to investments in plant assets for our India facility.
|
|
(f)
|
Represents a bonus (recorded in Cost of sales, Selling, general and administrative, and Engineering – research and development) to eligible employees recorded in the fourth quarter of 2017 as a result of UAW Local 933 represented employees ratifying a six-year collective bargaining agreement effective through November 2023.
|
|
(g)
|
Represents an adjustment (recorded in Selling, general and administrative) associated with the Dual Power Inverter Module (“DPIM”) extended coverage program liability. The DPIM liability will continue to be reviewed for any changes in estimates as additional claims data and field information become available.
|
|
(h)
|
Represents expenses related to the refinancing of the Senior Secured Credit Facility in the third quarter of 2016.
|
37
|
(i)
|
Represents expenses (recorded in Selling, general and administrative) directly associated with stockholder activism activity including the notice, and subsequent withdrawal, of director nomination and governance proposals by Ashe Capital Management, LP.
|
|
(j)
|
Represents unrealized gains (recorded in Other income (expense), net) on the mark-to-market of our commodity hedge contracts.
|
|
(k)
|
Represents the amount of tax benefit (recorded in Income tax expense) related to stock-based compensation expense adjusted from cash flows from operating activities to cash flows from financing activities.
|
38
Results of Operations
The following tables set forth certain financial information for the years ended
December 31, 2018
and
2017
and for the years ended
December 31, 2017
and
2016
. The following tables and discussion should be read in conjunction with the information contained in our consolidated financial statements and the notes thereto included in Part II, Item 8 of this Annual Report on Form 10-K.
Comparison of years ended
December 31, 2018
and
2017
|
|
Years ended December 31,
|
||||||||||||
|
(dollars in millions)
|
2018
|
%
of net sales
|
2017
|
%
of net sales
|
|||||||||
|
Net sales
|
$
|
2,713
|
|
100
|
%
|
$
|
2,262
|
|
100
|
%
|
|||
|
Cost of sales
|
1,291
|
|
48
|
|
1,131
|
|
50
|
|
|||||
|
Gross profit
|
1,422
|
|
52
|
|
1,131
|
|
50
|
|
|||||
|
Operating expenses:
|
|||||||||||||
|
Selling, general and administrative
|
364
|
|
13
|
|
342
|
|
15
|
|
|||||
|
Engineering — research and development
|
131
|
|
5
|
|
105
|
|
5
|
|
|||||
|
Loss associated with impairment of long-lived assets
|
4
|
|
—
|
|
32
|
|
1
|
|
|||||
|
Total operating expenses
|
499
|
|
18
|
|
479
|
|
21
|
|
|||||
|
Operating income
|
923
|
|
34
|
|
652
|
|
29
|
|
|||||
|
Other expense, net:
|
|||||||||||||
|
Interest expense, net
|
(121
|
)
|
(4
|
)
|
(103
|
)
|
(5
|
)
|
|||||
|
Other income (expense), net
|
3
|
|
—
|
|
(22
|
)
|
(1
|
)
|
|||||
|
Total other expense, net
|
(118
|
)
|
(4
|
)
|
(125
|
)
|
(6
|
)
|
|||||
|
Income before income taxes
|
805
|
|
30
|
|
527
|
|
23
|
|
|||||
|
Income tax expense
|
(166
|
)
|
(6
|
)
|
(23
|
)
|
(1
|
)
|
|||||
|
Net income
|
$
|
639
|
|
24
|
%
|
$
|
504
|
|
22
|
%
|
|||
Net sales
Net sales for the year ended
December 31, 2018
were
$2,713 million
compared to
$2,262 million
for the year ended
December 31, 2017
, an increase of 20%. The increase was principally driven by a $140 million, or 12%, increase in net sales in the North America On-Highway end market principally driven by higher demand for Rugged Duty Series and Highway Series models, a $101 million, or 19%, increase in net sales in the Service Parts, Support Equipment and Other end market principally driven by higher demand for global service parts and support equipment, an $88 million increase in net sales in the Outside North America Off-Highway end market principally driven by higher demand in the energy, mining and construction sectors, a $42 million increase in net sales in the North America Off-Highway end market principally driven by higher demand from hydraulic fracturing applications, a $41 million, or 35%, increase in net sales in the Defense end market principally driven by higher Tracked and Wheeled demand, and a $39 million, or 11%, increase in net sales in the Outside North America On-Highway end market principally driven by higher demand in Asia and Europe. See “Trends Impacting Our Business” above for additional information on net sales by end market.
Cost of sales
Cost of sales for the year ended
December 31, 2018
was $
1,291 million
compared to $
1,131 million
for the year ended
December 31, 2017
, an increase of 14%. The increase was principally driven by increased direct material and manufacturing expenses commensurate with increased net sales, $15 million of expenses related to a retirement incentive program for certain UAW Local 933 employees and unfavorable material costs, partially offset by expenses of $9 million associated with the ratification of a new collective bargaining agreement with UAW Local 933 in 2017 that did not recur in 2018.
39
Gross profit
Gross profit for the year ended
December 31, 2018
was $
1,422 million
compared to $
1,131 million
for the year ended
December 31, 2017
, an increase of 26%. The increase was principally driven by $282 million related to increased net sales, $32 million of price increases on certain products and expenses of $9 million associated with the ratification of a new collective bargaining agreement with UAW Local 933 in 2017 that did not recur in 2018, partially offset by $16 million of higher manufacturing expenses commensurate with increased net sales, $15 million of expenses related to a retirement incentive program for certain UAW Local 933 employees and $2 million of unfavorable material costs. Gross profit as a percent of net sales for the year ended December 31, 2018 increased 240 basis points compared to the same period in 2017 principally driven by increased net sales, price increases on certain products and expenses associated with the ratification of the new collective bargaining agreement in 2017 that did not recur in 2018, partially offset by expenses related to the retirement incentive program and unfavorable material costs.
Selling, general and administrative
Selling, general and administrative expenses for the year ended
December 31, 2018
were $
364 million
compared to $
342 million
for the year ended
December 31, 2017
, an increase of 6%. The increase was principally driven by $20 million of higher product warranty expense commensurate with increased net sales and increased commercial activities spending.
Engineering — research and development
Engineering expenses for the year ended
December 31, 2018
were $
131 million
compared to $
105 million
for the year ended
December 31, 2017
, an increase of 25%. The increase was principally driven by increased product initiatives spending.
Loss associated with impairment of long-lived assets
During the fourth quarter of 2018 and 2017, we recorded approximately
$4 million
and $
32 million
, respectively, of losses associated with the impairment of certain of our long-lived assets related to the production of the TC10 transmission. See NOTE 2 “Summary of Significant Accounting Policies” of Notes to Consolidated Financial Statements included in Part II, Item 8 of this Annual Report on Form 10-K for additional details.
Interest expense, net
Interest expense, net for the year ended
December 31, 2018
was $
121 million
compared to $
103 million
for the year ended
December 31, 2017
, an increase of 17%. The increase was principally driven by $14 million of higher interest expense for ATI's 4.75% Senior Notes due October 2027 ("4.75% Senior Notes") issued in September 2017 and $6 million of higher interest expense on ATI's Term B-3 Loan principally driven by higher interest rates, partially offset by interest expense on revolving loan balances in 2017 that did not recur in 2018.
Other income (expense), net
Other income (expense), net for the year ended
December 31, 2018
was $
3 million
compared to $
(22) million
for the year ended
December 31, 2017
. The change was principally driven by $13 million of lower technology-related investments expense for investments in co-development agreements to expand our position in transmission technologies, $12 million of credits related to post-retirement benefit plan amendments and $4 million of favorable foreign exchange, partially offset by a $3 million decrease in foreign exchange losses on intercompany financing.
Income tax expense
Income tax expense for the year ended
December 31, 2018
was $
166 million
resulting in an effective tax rate of 21%, compared to $
23 million
of income tax expense and an effective tax rate of 4% for the year ended
December 31, 2017
. The change in the effective tax rate was a result of the U.S. Tax Cuts and Jobs Act enacted into law in 2017 and was principally driven by a one time $157 million tax benefit resulting from a decrease in deferred tax liabilities in 2017, partially offset by $5 million of tax expense related to the deemed repatriation of accumulated foreign earnings and profits in 2017 as a result of the U.S. Tax Cuts and Jobs Act.
40
Comparison of years ended
December 31, 2017
and
2016
|
|
Years ended December 31,
|
||||||||||||
|
(dollars in millions)
|
2017
|
%
of net sales
|
2016
|
%
of net sales
|
|||||||||
|
Net sales
|
$
|
2,262
|
|
100
|
%
|
$
|
1,840
|
|
100
|
%
|
|||
|
Cost of sales
|
1,131
|
|
50
|
|
976
|
|
53
|
|
|||||
|
Gross profit
|
1,131
|
|
50
|
|
864
|
|
47
|
|
|||||
|
Operating expenses:
|
|||||||||||||
|
Selling, general and administrative
|
342
|
|
15
|
|
324
|
|
17
|
|
|||||
|
Engineering — research and development
|
105
|
|
5
|
|
88
|
|
5
|
|
|||||
|
Loss associated with impairment of long-lived assets
|
32
|
|
1
|
|
—
|
|
—
|
|
|||||
|
Total operating expenses
|
479
|
|
21
|
|
412
|
|
22
|
|
|||||
|
Operating income
|
652
|
|
29
|
|
452
|
|
25
|
|
|||||
|
Other expense, net:
|
|||||||||||||
|
Interest expense, net
|
(103
|
)
|
(5
|
)
|
(101
|
)
|
(5
|
)
|
|||||
|
Expenses related to long-term debt refinancing
|
—
|
|
—
|
|
(12
|
)
|
(1
|
)
|
|||||
|
Other income (expense), net
|
(22
|
)
|
(1
|
)
|
2
|
|
—
|
|
|||||
|
Total other expense, net
|
(125
|
)
|
(6
|
)
|
(111
|
)
|
(6
|
)
|
|||||
|
Income before income taxes
|
527
|
|
23
|
|
341
|
|
19
|
|
|||||
|
Income tax expense
|
(23
|
)
|
(1
|
)
|
(126
|
)
|
(7
|
)
|
|||||
|
Net income
|
$
|
504
|
|
22
|
%
|
$
|
215
|
|
12
|
%
|
|||
Net sales
Net sales for the year ended December 31, 2017 were $2,262 million compared to $1,840 million for the year ended December 31, 2016, an increase of 23%. The increase was principally driven by a $154 million, or 41%, increase in net sales in the Service Parts, Support Equipment and Other end market principally driven by higher demand for North America service parts and global support equipment, a $154 million, or 15%, increase in net sales in the North America On-Highway end market principally driven by higher demand for Rugged Duty Series models, a $44 million increase in net sales in the North America Off-Highway end market principally driven by higher demand from hydraulic fracturing applications, a $39 million, or 13%, increase in net sales in the Outside North America On-Highway end market principally driven by higher demand in Asia, Europe and South America, a $29 million increase in net sales in the Outside North America Off-Highway end market principally driven by improved demand in the mining and energy sectors and a $2 million, or 2%, increase in net sales in the Defense end market principally driven by higher demand.
Cost of sales
Cost of sales for the year ended December 31, 2017 were $1,131 million compared to $976 million for the year ended December 31, 2016, an increase of 16%. The increase was principally driven by increased material cost and manufacturing expenses commensurate with increased net sales, $9 million associated with the ratification of a new collective bargaining agreement with UAW Local 933 and $6 million of higher incentive compensation expense.
Gross profit
Gross profit for the year ended December 31, 2017 was $1,131 million compared to $864 million for the year ended December 31, 2016, an increase of 31%. The increase was principally driven by $260 million related to increased net sales and $38 million of price increases on certain products, partially offset by $9 million of expenses associated with the ratification of a new collective bargaining agreement with UAW Local 933, $9 million of higher manufacturing expense commensurate with increased net sales, $6 million of higher incentive compensation expense and $7 million of unfavorable material cost. Gross profit as a percent of net sales for the year ended December 31, 2017 increased 3% compared to the same period in 2016 principally driven by favorable sales volume and price increases on certain products, partially offset by expense associated with the ratification of a new collective bargaining agreement, higher incentive compensation expense and unfavorable material cost.
41
Selling, general and administrative
Selling, general and administrative expenses for the year ended December 31, 2017 were $342 million compared to $324 million for the year ended December 31, 2016, an increase of 6%. The increase was principally driven by increased commercial activities spending, $6 million of higher incentive compensation expense, $5 million of unfavorable product warranty adjustments and $2 million of higher stock-based compensation expense, partially offset by $4 million of stockholder activism expenses in 2016 that did not recur in 2017 and $4 million of favorable DPIM adjustments.
Engineering — research and development
Engineering expenses for the year ended December 31, 2017 were $105 million compared to $88 million for the year ended December 31, 2016, an increase of 19%. The increase was principally driven by increased product initiatives spending and $3 million of higher incentive compensation expense.
Loss associated with impairment of long-lived assets
During the fourth quarter of 2017, we recorded approximately $32 million of losses associated with impairment of certain of our long-lived assets related to the production of the TC10 transmission. See NOTE 5 “Property, Plant and Equipment” of Notes to Consolidated Financial Statements included in Part II, Item 8 of this Annual Report on Form 10-K for additional details.
Interest expense, net
Interest expense, net for the year ended December 31, 2017 was $103 million compared to $101 million for the year ended December 31, 2016, an increase of 2%. The increase was principally driven by $36 million of higher interest expense on ATI’s 5.0% Senior Notes due September 2024 ("5.0% Senior Notes") issued in September 2016, $8 million of higher interest expense for our interest rate derivatives that became effective in August 2016, $5 million of interest expense on ATI’s 4.75% Senior Notes issued in September 2017 and $4 million of interest expense on revolving loan balances in 2017, partially offset by $35 million lower interest expense on ATI’s Term B-3 Loan principally due to repayment of $1,200 million of principal in the third quarter of 2016 and $16 million of favorable mark-to-market adjustments for our interest rate derivatives.
Expenses related to long-term debt refinancing
In September 2016, we refinanced our Senior Secured Credit Facility, resulting in expenses of $12 million for the year ended December 31, 2016.
Other (expense) income, net
Other expense, net for the year ended December 31, 2017 was $22 million compared to other income, net of $2 million for the year ended December 31, 2016. The change was principally driven by a $15 million increase in technology-related investments expense, $5 million of unfavorable vendor settlements in 2017 and $4 million of higher foreign exchange losses on intercompany financing.
Income tax expense
Income tax expense for the year ended December 31, 2017 was $23 million compared to $126 million for the year ended December 31, 2016, resulting in an effective tax rate of 4% and 37% for years ended December 31, 2017 and December 31, 2016, respectively. The decrease was a result of the U.S. Tax Cuts and Jobs Act enacted into law in 2017 and was principally driven by a $157 million decrease in net deferred tax liabilities to reflect the decrease in the corporate income tax rate from 35% to 21%, partially offset by a $5 million increase in tax liabilities related to the deemed repatriation of accumulated foreign earnings and profits as a result of the U.S. Tax Cuts and Jobs Act.
42
Liquidity and Capital Resources
We generate cash primarily from operations to fund our operating, investing and financing activities. Our principal uses of cash are capital expenditures, debt service, dividends on common stock, operating expenses, stock repurchases, strategic growth initiatives, including acquisitions, and working capital needs. We had total available cash and cash equivalents of
$231 million
and
$199 million
as of
December 31, 2018
and
2017
, respectively. Of the available cash and cash equivalents, approximately $120 million and $149 million were deposited in operating accounts while approximately $111 million and $50 million were invested in U.S. government backed securities as of
December 31, 2018
and
2017
, respectively.
As of
December 31, 2018
, the total of cash and cash equivalents held by foreign subsidiaries was $59 million, the majority of which was located in China and Europe. We manage our worldwide cash requirements considering available funds among the subsidiaries through which we conduct our business and the cost effectiveness with which those funds can be accessed. As a result, we do not anticipate that local liquidity restrictions will preclude us from funding our targeted expectations or operating needs with local resources.
We have not recognized any deferred tax liabilities associated with earnings in foreign subsidiaries, except for our subsidiaries located in China and Hong Kong, as they are intended to be permanently reinvested and used to support foreign operations. We have recorded a deferred tax liability of $2 million for the tax liability associated with the remittance of previously taxed income and unremitted earnings for our subsidiaries located in China and Hong Kong. The U.S. Tax Cuts and Jobs Act requirement of a one-time repatriation tax on foreign earnings and profits resulted in us recording a $6 million liability for the deemed repatriation to be paid to the U.S. Government in 2017. In the future, the U.S. Tax Cuts and Jobs Act provides for tax free repatriations of earnings and profits generated by foreign subsidiaries through a 100% dividends received deduction. The remaining deferred tax liabilities, if recorded, related to unremitted earnings that are indefinitely reinvested are not material.
Our liquidity requirements are significant, primarily due to our debt service requirements. As of
December 31, 2018
, we had
$1,148 million
of indebtedness associated with ATI’s Term B-3 Loan,
$1,000 million
of indebtedness associated with ATI’s 5.0% Senior Notes and
$400 million
of indebtedness associated with ATI’s 4.75% Senior Notes. The minimum required quarterly principal payment on ATI’s Term B-3 Loan through its maturity date of September 2022 is $3 million; however, we made voluntary prepayments of the required quarterly principal payments of $25 million in May 2018. There are no required quarterly principal payments on ATI’s 5.0% Senior Notes and 4.75% Senior Notes.
Our ability to make payments on and to refinance our indebtedness and to fund planned capital expenditures and growth initiatives, including acquisitions, will depend on our ability to generate cash in the future. This is subject to general economic, financial, competitive, legislative, regulatory and other factors that may be beyond our control. We made net principal payments of
$28 million
, $427 million and $215 million on our Senior Secured Credit Facility during the years ended
December 31, 2018
,
2017
and
2016
, respectively.
The Senior Secured Credit Facility provides for a $550 million Revolving Credit Facility, net of an allowance for up to $75 million in outstanding letters of credit commitments. As of
December 31, 2018
, we had
$533 million
available under the Revolving Credit Facility, net of
$17 million
in letters of credit. As of
December 31, 2018
, we had no amounts outstanding under the Revolving Credit Facility. If we have commitments outstanding on the Revolving Credit Facility at the end of a fiscal quarter, the Senior Secured Credit Facility requires us to maintain a specified maximum total senior secured leverage ratio of 5.50x. Additionally, within the terms of the Senior Secured Credit Facility, a senior secured leverage ratio at or below 4.00x results in the elimination of excess cash flow payments on the Senior Secured Credit Facility for the applicable year. As of
December 31, 2018
, our senior secured leverage ratio was
0.81
x. The Senior Secured Credit Facility also provides certain financial incentives based on our total leverage ratio. A total leverage ratio at or below 4.00x results in a 25 basis point reduction to the applicable margin on our Revolving Credit Facility, and a total leverage ratio at or below 3.50x results in a 12.5 basis point reduction to the Revolving Credit Facility commitment fee and an additional 25 basis point reduction to the applicable margin on our Revolving Credit Facility. These reductions remain in effect as long as we achieve a total leverage ratio at or below the related threshold. As of
December 31, 2018
, our total leverage ratio was
2.05
x.
43
In addition, the Senior Secured Credit Facility includes, among other things, customary restrictions (subject to certain exceptions) on our ability to incur certain indebtedness, grant certain liens, make certain investments, declare or pay certain dividends, and repurchase shares of our common stock. The indentures governing the 5.0% Senior Notes and 4.75% Senior Notes contain negative covenants restricting or limiting our ability to, among other things, incur or guarantee additional indebtedness, incur liens, pay dividends on, redeem or repurchase our capital stock, make certain investments, permit payment or dividend restrictions on certain of our subsidiaries, sell assets, engage in certain transactions with affiliates, and consolidate or merge or sell all or substantially all of our assets. As of
December 31, 2018
, we are in compliance with all covenants under the Senior Secured Credit Facility and indentures governing the 5.0% Senior Notes and 4.75% Senior Notes.
Our credit ratings are reviewed by Moody’s Investors Service (“Moody’s”) and Fitch Ratings (“Fitch”). Moody’s rates our corporate credit at ‘Ba2’, Term B-3 Loan at ‘Baa3’, 5.0% Senior Notes at ‘Ba3’ and 4.75% Senior Notes at ‘Ba3’. Fitch rates our corporate credit at ‘BB’, Term B-3 Loan at ‘BB+’, 5.0% Senior Notes at ‘BB’ and 4.75% Senior Notes at ‘BB’.
On November 14, 2016, our Board of Directors authorized us to repurchase up to $1,000 million of our common stock pursuant to a stock repurchase program (the "Repurchase Program"). On November 8, 2017, our Board of Directors increased the authorization by $500 million and on July 30, 2018 our Board of Directors further increased the authorization by $500 million, bringing the total amount authorized under the Repurchase Program to $2,000 million. During
2018
, we repurchased approximately
$609 million
of our common stock under the Repurchase Program. All of the repurchase transactions during
2018
were settled in cash during the same period. As of
December 31, 2018
, we had approximately
$445 million
available under the Repurchase Program.
The following table shows our sources and uses of funds for the years ended
December 31, 2018
,
2017
and
2016
(in millions):
|
|
Years ended December 31,
|
||||||||||
|
Statement of Cash Flows Data
|
2018
|
2017
|
2016
|
||||||||
|
Cash flows provided by operating activities
|
$
|
837
|
|
$
|
658
|
|
$
|
591
|
|
||
|
Cash flows used for investing activities
|
(103
|
)
|
(94
|
)
|
(72
|
)
|
|||||
|
Cash flows used for financing activities
|
(700
|
)
|
(574
|
)
|
(564
|
)
|
|||||
Generally, cash provided by operating activities has been adequate to fund our operations. Due to fluctuations in our cash flows and the growth in our operations, it may be necessary from time to time in the future to borrow under the Senior Secured Credit Facility to meet cash demands. We anticipate cash provided by operating activities, cash and cash equivalents and borrowing capacity under the Senior Secured Credit Facility will be sufficient to meet our cash requirements for the next twelve months.
Cash provided by operating activities
Operating activities for the year ended
December 31, 2018
generated
$837 million
of cash compared to
$658 million
for the year ended
December 31, 2017
. The increase was principally driven by increased gross profit, decreased defined benefit pension plans funding payments and decreased cash interest expense, partially offset by higher operating working capital requirements, increased product initiatives spending, increased incentive compensation payments and increased cash income taxes.
Operating activities for the year ended
December 31, 2017
generated
$658 million
of cash compared to
$591 million
for the year ended
December 31, 2016
. The increase was principally driven by increased gross profit, higher sales allowances and higher deferred revenue, partially offset by increased cash income taxes, higher inventories, increased cash interest expense, increased pension funding payments and increased incentive compensation payments.
Cash used for investing activities
Investing activities for the year ended
December 31, 2018
used
$103 million
of cash compared to
$94 million
for the year ended
December 31, 2017
. The increase was principally driven by an increase of $9 million in capital expenditures primarily due to spending related to investments in productivity and replacement programs.
44
Investing activities for the year ended
December 31, 2017
used
$94 million
of cash compared to
$72 million
for the year ended
December 31, 2016
. The increase was principally driven by an increase of $20 million in capital expenditures and an increase of $2 million in technology-related initiatives. The increase in capital expenditures was principally driven by spending related to investments in productivity and replacement programs and higher product initiatives spending.
Cash used for financing activities
Financing activities for the year ended
December 31, 2018
used
$700 million
of cash compared to
$574 million
for the year ended
December 31, 2017
. The increase was principally driven by $400 million of net debt borrowings in 2017 that did not recur in 2018 and $16 million of increased payments on long-term debt, partially offset by $276 million of decreased stock repurchases, $9 million of decreased dividend payments and $5 million of lower debt financing fees.
Financing activities for the year ended
December 31, 2017
used
$574 million
of cash compared to
$564 million
for the year ended
December 31, 2016
. The increase was principally driven by $629 million of increased repurchases of common stock, $6 million of 2016 excess tax benefit from stock-based compensation and $5 million of decreased proceeds from common stock issuance in connection with stock option exercises, partially offset by $603 million of increased net debt borrowings, $15 million of lower debt financing fees and $11 million of decreased dividend payments.
Contractual Obligations, Contingent Liabilities and Commitments
The following table summarizes our contractual obligations as of
December 31, 2018
(dollars in millions):
|
|
Payments due by period
|
||||||||||||||||||
|
|
Total
|
Less than
1 year
|
1-3
years
|
3-5
years
|
More than
5 years
|
||||||||||||||
|
Senior Secured Credit Facility(1)
|
$
|
1,330
|
|
$
|
49
|
|
$
|
117
|
|
$
|
1,164
|
|
$
|
—
|
|
||||
|
5.0% Senior Notes(2)
|
1,287
|
|
50
|
|
100
|
|
100
|
|
1,037
|
|
|||||||||
|
4.75% Senior Notes(3)
|
568
|
|
19
|
|
38
|
|
38
|
|
473
|
|
|||||||||
|
Operating leases
|
11
|
|
4
|
|
5
|
|
2
|
|
—
|
|
|||||||||
|
Pension & OPEB liabilities(4)
|
21
|
|
3
|
|
8
|
|
10
|
|
see (4) below
|
|
|||||||||
|
Total(5)
|
$
|
3,217
|
|
$
|
125
|
|
$
|
268
|
|
$
|
1,314
|
|
$
|
1,510
|
|
||||
|
(1)
|
Senior Secured Credit Facility includes principal payments and estimated interest payments. Interest on the Term B-3 Loan is equal to the London Interbank Offered Rate (“LIBOR”) plus 1.75%. For the purposes of this table the rate has been calculated using LIBOR as of
December 31, 2018
, resulting in an applied rate of
4.26%
. Actual payments will vary.
|
|
(2)
|
5.0% Senior Notes include principal and interest payments based on a fixed interest rate of 5.00%.
|
|
(3)
|
4.75% Senior Notes include principal and interest payments based on a fixed interest rate of 4.75%.
|
|
(4)
|
Estimated pension funding and post-retirement benefit payments are based on an increasing discount rate and effective interest rate for funding purposes between 4.0% - 4.8%. Pension funding and post-retirement benefit payments are excluded from the table beyond year 5, though we expect funding and payments to continue beyond year 5. See NOTE 14, “Employee Benefit Plans” of Notes to Consolidated Financial Statements included in Part II, Item 8, of this Annual Report on Form 10-K for the funding status of our pension plans and other post-retirement benefit plan as of
December 31, 2018
.
|
|
(5)
|
Defense price reduction reserve, estimated warranty obligations and sales allowance programs, which total $56 million, $66 million and $39 million, respectively, as of
December 31, 2018
have been excluded from this table as timing of any payments are uncertain.
|
45
Critical Accounting Policies and Significant Accounting Estimates
The preparation of the consolidated financial statements in accordance with GAAP requires management to make estimates and assumptions that affect the reported amounts of some assets and liabilities and, in some instances, the reported amounts of net sales and expenses during the applicable reporting period. Differences between actual amounts and estimates are recorded in the period identified. Estimates can require a significant amount of judgment, and a different set of judgments could result in changes to our reported results. A summary of our critical accounting estimates is included below.
Revenue Recognition
Revenue recognition contains uncertainties because it requires management to make assumptions and to apply judgment to estimate the amount of sales incentives and provision for government price reductions. Distributor and customer sales incentives, consisting of allowances and other rebates, are estimated at the time of sale based upon history and experience and are recorded as a reduction to net sales. Incentive programs are generally product specific or region specific. Some factors used in estimating the cost of incentives include the number of transmissions that will be affected by the incentive program and the rate of acceptance of any incentive program. If the actual number of affected transmissions differs from this estimate, or if a different mix of incentives is actually paid, the impact on net sales would be recorded in the period that the change was identified. Assuming our current mix of sales incentives, a 10% change in sales incentives would have affected our earnings by approximately $6 million to $8 million per year for each of the prior three fiscal years.
Under terms of certain previous U.S. government contracts, there were price reduction clauses and provisions for potential price reductions which are estimated at the time of sale based upon history and experience, and finalized after completion of U.S. government audits. Potential reductions may be attributed to a change in projected sales volumes or plant efficiencies which impact overall costs. Given our current price reduction reserve for government contracts, a 10% adjustment in our price reduction reserve would have affected our earnings by approximately $6 million per year for each of the prior three fiscal years. Beginning in 2014, all of our contracts with the U.S. government are firm fixed price contracts, which do not contain price reduction clauses and provisions.
Further information is provided in NOTE 2 “Summary of Significant Accounting Policies” of Notes to Consolidated Financial Statements included in Part II, Item 8, of this Annual Report on Form 10-K.
Goodwill and Other Intangible Assets
Goodwill is tested for impairment at the reporting unit level, which is the same as our one operating and reportable segment. We do not aggregate any components into our reporting unit. We have elected to perform our annual impairment test on October 31 of every year. A multi-step impairment test is performed on goodwill. In Step 0, we have the option to evaluate various qualitative factors to determine the likelihood of impairment. If we determine that the fair value is more likely than not less than the carrying value, then we are required to perform Step 1. If we do not elect to perform Step 0, we can voluntarily proceed directly to Step 1. In Step 1, we perform a quantitative analysis to compare the fair value of our reporting unit to our carrying value including goodwill. If the fair value of the reporting unit exceeds the carrying value of the net assets assigned to that unit, goodwill is not considered impaired, and we are not required to perform further testing. If the carrying value of a reporting unit’s goodwill exceeds its carrying value of net assets, then we would record an impairment loss equal to the difference.
A qualitative assessment contains uncertainties because it requires management to make assumptions and to apply judgment to assess business changes, economic outlook, financial trends and forecasts, growth rates, credit ratings, equity ratings, discount rates, industry data and other relevant qualitative factors.
A quantitative analysis contains uncertainties because it is performed utilizing a discounted cash flow model which includes key assumptions, such as net sales growth derived from market information, industry reports, marketing programs and future new product introductions; operating margin improvements derived from cost reduction programs and fixed cost leverage driven by higher sales volumes; and a risk-adjusted discount rate.
Events or circumstances that could unfavorably impact the key assumptions include lower net sales driven by market conditions, our inability to execute on marketing programs and/or a delay in the introduction of new products, lower gross margins as a result of market conditions or failure to obtain forecasted cost reductions, or a higher discount rate as a result of market conditions.
46
Goodwill impairment testing for
2018
was performed using the Step 0 analysis by assessing certain qualitative trends and factors. These trends and factors were compared to, and based on, the assumptions used in prior years. After reviewing the various qualitative factors mentioned above, our
2018
annual goodwill impairment test indicated that the fair value of the reporting unit more likely than not exceeded its carrying value, indicating no impairment.
Other intangible assets have both indefinite and finite useful lives. Intangible assets with indefinite useful lives are not amortized but are tested annually for impairment. We have elected to perform our annual trade name impairment test on October 31 of every year and follow a similar multi-step impairment test that is performed on goodwill. While unpredictable and inherently uncertain, we believe the forecast estimates are reasonable and incorporate those assumptions that similar market participants would use in their estimates of fair value. After reviewing the various qualitative factors mentioned above, our annual
2018
trade name impairment test, as of October 31,
2018
, indicated that the fair value of our trade name more likely than not exceeded the respective carrying value, indicating no impairment.
Intangible assets with finite lives are amortized over their estimated useful lives and reviewed for impairment when circumstances change that would create a triggering event. Assumptions and estimates about future values and remaining useful lives of our intangible and other long-lived assets are complex and subjective. They can be affected by a variety of factors, including external factors such as industry and economic trends, and internal factors, such as changes in our business strategy and internal forecasts. Although management believes the historical assumptions and estimates are reasonable and appropriate, different assumptions and estimates could materially impact our reported financial results. Further information is provided in NOTE 2 “Summary of Significant Accounting Policies” and NOTE 6 “Goodwill and Other Intangible Assets” of Notes to Consolidated Financial Statements included in Part II, Item 8, of this Annual Report on Form 10-K.
Impairment of Long-Lived Assets
The carrying value of long-lived assets is evaluated whenever events or circumstances indicate that the carrying value of a long-lived asset may not be recoverable. Events or circumstances that would result in an impairment review primarily include a significant change in the use of an asset, or the planned sale or disposal of an asset. The asset would be considered impaired when there is no future use planned for the asset or the future net undiscounted cash flows generated by the asset or asset group are less than its carrying value. An impairment loss would be recognized based on the amount by which the carrying value exceeds fair value.
Assumptions and estimates used to determine cash flows in the evaluation of impairment and the fair values used to determine the impairment are subject to a degree of judgment and complexity. Any changes to the assumptions and estimates resulting from changes in actual results or market conditions from those anticipated may affect the carrying value of long-lived assets and could result in an impairment charge.
As a result of events and circumstances related to weak demand conditions for the TC10 product in the fourth quarter of 2017 and the decision to cease production of the TC10 product in the fourth quarter of 2018, we recorded a
$4 million
and $
32 million
impairment loss associated with the production of TC10 for the years ended
December 31, 2018
and
2017
, respectively.
There were no impairment charges for the year ended
December 31, 2016
.
47
Warranty
Provisions for estimated expenses related to product warranties are made at the time products are sold. Warranty claims arise when a transmission fails while in service during the relevant warranty period. The warranty reserve is adjusted in Selling, general and administrative based on our current and historical warranty claims paid and associated repair costs. These estimates are established using historical information including the nature, frequency, and average cost of warranty claims and are adjusted as actual information becomes available. From time to time, we may initiate a specific field action program. As a result of the uncertainty surrounding the nature and frequency of specific field action programs, the liability for such programs is recorded when we commit to an action. We review and assess the liability for these programs on a quarterly basis. We also assess our ability to recover certain costs from our suppliers and record a receivable from the supplier when we believe a recovery is probable. Warranty costs may differ from those estimated if actual claim rates are higher or lower than our historical rates. Further information is provided in NOTE 10, “Product Warranty Liabilities” of Notes to Consolidated Financial Statements included in Part II, Item 8, of this Annual Report on Form 10-K which contains a summary of the activity in our warranty liability account for
2018
,
2017
and
2016
including adjustments to pre-existing warranties.
Pension and Post-retirement Benefit Plans
Pension and OPEB costs are based upon various actuarial assumptions and methodologies as prescribed by authoritative accounting guidance. These assumptions include discount rates, expected return on plan assets, health care cost trend rates, inflation, rate of compensation increases, population demographics, mortality rates and other factors. We review all actuarial assumptions on an annual basis.
A change in the discount rate can have a significant impact on determining our benefit obligations. Our current discount rate is determined by matching the plans’ projected cash flows to a yield curve based on long-term, fixed income debt instruments available as of the measurement date of
December 31, 2018
. The effect of a one percentage point decrease in the assumed discount rate would result in an increase in the
December 31, 2018
defined benefit pension plans obligation of approximately $20 million. Similarly, a one percentage point decrease in the assumed discount rate would result in an increase in the
December 31, 2018
OPEB obligation of approximately $13 million.
Further information is provided in NOTE 14 “Employee Benefit Plans” of Notes to Consolidated Financial Statements included in Part II, Item 8, of this Annual Report on Form 10-K, which contains our review on various actuarial assumptions.
Income Taxes
Income taxes are accounted for under the asset and liability method. Deferred tax assets and liabilities are recognized for the expected future tax consequences attributable to temporary differences between the financial statement carrying amounts of existing assets and liabilities and their respective tax bases. The future tax benefits associated with operating loss and tax credit carryforwards are recognized as deferred tax assets. Deferred tax assets and liabilities are measured using enacted tax rates expected to apply to taxable income in the years in which those temporary differences are expected to be recovered or settled.
On December 22, 2017, the U.S Tax Cuts and Jobs Act was enacted into law. The U.S Tax Cuts and Jobs Act makes broad and complex changes to the U.S. tax code that impact us, most notably a reduction of the U.S. corporate income tax rate from 35% to 21% for tax years beginning after December 31, 2017. It also made other changes including, but not limited to, the acceleration of depreciation for certain assets placed into service after September 27, 2017 as well as a one-time deemed repatriation tax on undistributed foreign earnings and profits. Beginning in 2018, the U.S Tax Cuts and Jobs Act made other changes impacting us such as additional limitations on executive compensation, the repeal of the domestic manufacturing deduction and qualifications around certain research and development expenditures.
As of
December 31, 2018
, our U.S. federal income tax deductions related to our intangible assets were approximately $315 million annually through 2021 and approximately $185 million in 2022. Excluding our intangible asset deductions, our expected tax payments would have increased by approximately $70 million for the year ended
December 31, 2018
.
48
The need to establish a valuation allowance against the deferred tax assets is assessed periodically based on a more-likely-than-not realization threshold, in accordance with the Financial Accounting Standard Board’s (“FASB”) authoritative accounting guidance on income taxes. Appropriate consideration is given to all positive and negative evidence related to that realization. This assessment considers, among other matters, the nature, frequency and severity of recent losses, forecasts of future profitability, the duration of statutory carryforward periods, and experience with tax attributes expiring unused and tax planning alternatives. The weight given to these considerations depends upon the degree to which they can be objectively verified.
Further information on income taxes is provided in NOTE 15, “Income Taxes” of Notes to Consolidated Financial Statements included in Part II, Item 8, of this Annual Report on Form 10-K.
Off-Balance Sheet Arrangements
We are not a party to any off-balance sheet arrangements.
Recently Adopted Accounting Pronouncements
Refer to NOTE 2, “Summary of Significant Accounting Policies” in Part II, Item 8, of this Annual Report on Form 10-K.
49
ITEM 7A. Quantitative and Qualitative Disclosures About Market Risk
Our exposure to market risk consists of changes in interest rates, foreign currency rate fluctuations and movements in commodity prices.
Interest Rate Risk
We are subject to interest rate market risk in connection with a portion of our long-term debt. Our principal interest rate exposure relates to outstanding amounts under our Senior Secured Credit Facility. Our Senior Secured Credit Facility provides for variable rate borrowings of up to $1,681 million including
$533 million
under our Revolving Credit Facility, net of
$17 million
of letters of credit. A one-eighth percent increase or decrease in assumed interest rates for the Senior Secured Credit Facility, if fully drawn as of
December 31, 2018
, would have an impact of approximately $2 million on interest expense. As of
December 31, 2018
, we had no outstanding borrowings against the Revolving Credit Facility.
From time to time, we enter into interest rate swap agreements to hedge our variable interest rate debt. As of
December 31, 2018
, we held interest rate swaps effective from September
2019
to September
2022
with notional values totaling
$250 million
and a weighted average LIBOR fixed rate of
3.01%
and interest rate swaps effective from September
2019
to September
2025
with notional values totaling
$250 million
and a weighted average LIBOR fixed rate of
3.04%
.
During December 2017, we terminated interest rate swap contracts with notional values totaling $800 million. The transaction resulted in $13 million of interest expense.
Refer to NOTE 8, “Debt” and NOTE 9, “Derivatives” of Notes to Consolidated Financial Statements included in Part II, Item 8, of this Annual Report on Form 10-K.
Exchange Rate Risk
While our net sales and costs are denominated primarily in U.S. Dollars, net sales, costs, assets and liabilities are generated in other currencies including Japanese Yen, Euro, Indian Rupee, Brazilian Real, Chinese Yuan Renminbi, Canadian Dollar and Hungarian Forint. The expansion of our business outside North America may further increase the risk that cash flows resulting from these activities may be adversely affected by changes in currency exchange rates.
Assuming current levels of foreign currency transactions, a 10% aggregate increase or decrease in the Japanese Yen, Euro, Indian Rupee and Chinese Yuan Renminbi would correspondingly change our earnings, net of tax, by an estimated $7 million per year. We believe other exposure to foreign currencies is immaterial.
Commodity Price Risk
We are subject to changes in our cost of sales caused by movements in underlying commodity prices. Approximately 70% of our cost of sales consists of purchased components with significant raw material content. A substantial portion of the purchased parts are made of aluminum and steel. The cost of aluminum parts includes an adjustment factor on future purchases for fluctuations in aluminum prices based on accepted industry indices. In addition, a substantial amount of steel-based contracts also include an index-based component. As our costs change, we are able to pass through a portion of the changes in commodity prices to certain of our customers according to our LTSAs. We historically have not entered into long-term purchase contracts related to the purchase of aluminum and steel.
Assuming current levels of commodity purchases, a 10% variation in the price of aluminum and steel would correspondingly change our earnings by approximately $3 million and $7 million per year, respectively.
Many of our LTSAs have incorporated a cost-sharing arrangement related to potential future commodity price fluctuations. For purposes of the sensitivity analysis above, the impact of these cost sharing arrangements has not been included.
50
ITEM 8. Financial Statements and Supplementary Data
INDEX TO CONSOLIDATED FINANCIAL STATEMENTS
51
Report of Independent Registered Public Accounting Firm
To the
Board of Directors and Stockholders of Allison Transmission Holdings, Inc.
Opinions on the Financial Statements and Internal Control over Financial Reporting
We have audited the accompanying consolidated balance sheets of Allison Transmission Holdings, Inc. and its subsidiaries (the “Company”) as of December 31, 2018 and 2017, and the related consolidated statements of comprehensive income, stockholders’ equity and cash flows for each of the three years in the period ended December 31, 2018, including the related notes and financial statement schedule listed in the index appearing under Item 15(a)(2) (collectively referred to as the “consolidated financial statements”). We also have audited the Company's internal control over financial reporting as of December 31, 2018, based on criteria established in
Internal Control - Integrated Framework
(2013) issued by the Committee of Sponsoring Organizations of the Treadway Commission (COSO).
In our opinion, the consolidated financial statements referred to above present fairly, in all material respects, the financial position of the Company as of December 31, 2018 and 2017, and the results of its operations and its cash flows for each of the three years in the period ended December 31, 2018 in conformity with accounting principles generally accepted in the United States of America. Also in our opinion, the Company maintained, in all material respects, effective internal control over financial reporting as of December 31, 2018, based on criteria established in
Internal Control - Integrated Framework
(2013)
issued by the COSO.
Basis for Opinions
The Company's management is responsible for these consolidated financial statements, for maintaining effective internal control over financial reporting, and for its assessment of the effectiveness of internal control over financial reporting, included in
Management's Report on Internal Control over Financial Reporting appearing under Item 9A. Our responsibility is to express opinions on the Company’s consolidated
financial statements and on the Company's internal control over financial reporting based on our audits. We are a public accounting firm registered with the Public Company Accounting Oversight Board (United States) (PCAOB) and are required to be independent with respect to the Company in accordance with the U.S. federal securities laws and the applicable rules and regulations of the Securities and Exchange Commission and the PCAOB.
We conducted our audits in accordance with the standards of the PCAOB. Those standards require that we plan and perform the audits to obtain reasonable assurance about whether the consolidated
financial statements are free of material misstatement, whether due to error or fraud, and whether effective internal control over financial reporting was maintained in all material respects.
Our audits of the consolidated
financial statements included performing procedures to assess the risks of material misstatement of the consolidated
financial statements, whether due to error or fraud, and performing procedures that respond to those risks. Such procedures included examining, on a test basis, evidence regarding the amounts and disclosures in the consolidated
financial statements. Our audits also included evaluating the accounting principles used and significant estimates made by management, as well as evaluating the overall presentation of the consolidated
financial statements. Our audit of internal control over financial reporting included obtaining an understanding of internal control over financial reporting, assessing the risk that a material weakness exists, and testing and evaluating the design and operating effectiveness of internal control based on the assessed risk. Our audits also included performing such other procedures as we considered necessary in the circumstances. We believe that our audits provide a reasonable basis for our opinions.
Definition and Limitations of Internal Control over Financial Reporting
A company’s internal control over financial reporting is a process designed to provide reasonable assurance regarding the reliability of financial reporting and the preparation of financial statements for external purposes in accordance with generally accepted accounting principles. A company’s internal control over financial reporting includes those policies and procedures that (i) pertain to the maintenance of records that, in reasonable detail, accurately and fairly reflect the transactions and dispositions of the assets of the company; (ii) provide reasonable assurance that transactions are recorded as necessary to permit preparation of financial statements in accordance with generally accepted accounting principles, and that receipts and expenditures of the company are being made only in accordance with authorizations of management and directors of the company; and (iii) provide reasonable assurance regarding prevention or timely detection of unauthorized acquisition, use, or disposition of the company’s assets that could have a material effect on the financial statements.
Because of its inherent limitations, internal control over financial reporting may not prevent or detect misstatements. Also, projections of any evaluation of effectiveness to future periods are subject to the risk that controls may become inadequate because of changes in conditions, or that the degree of compliance with the policies or procedures may deteriorate.
\s\PricewaterhouseCoopers LLP
Indianapolis, Indiana
February 26, 2019
We have served as the Company’s auditor since 2008.
52
Allison Transmission Holdings, Inc.
Consolidated Balance Sheets
(dollars in millions, except share data)
|
December 31, 2018
|
December 31, 2017
|
||||||
|
ASSETS
|
|||||||
|
Current Assets
|
|||||||
|
Cash and cash equivalents
|
$
|
231
|
|
$
|
199
|
|
|
|
Accounts receivable - net of allowance for doubtful accounts of $1 and $0, respectively
|
279
|
|
221
|
|
|||
|
Inventories
|
170
|
|
154
|
|
|||
|
Income taxes receivable
|
16
|
|
33
|
|
|||
|
Other current assets
|
29
|
|
25
|
|
|||
|
Total Current Assets
|
725
|
|
632
|
|
|||
|
Property, plant and equipment, net
|
466
|
|
448
|
|
|||
|
Intangible assets, net
|
1,066
|
|
1,153
|
|
|||
|
Goodwill
|
1,941
|
|
1,941
|
|
|||
|
Other non-current assets
|
39
|
|
31
|
|
|||
|
TOTAL ASSETS
|
$
|
4,237
|
|
$
|
4,205
|
|
|
|
LIABILITIES
|
|||||||
|
Current Liabilities
|
|||||||
|
Accounts payable
|
$
|
169
|
|
$
|
159
|
|
|
|
Product warranty liability
|
26
|
|
22
|
|
|||
|
Current portion of long-term debt
|
—
|
|
12
|
|
|||
|
Deferred revenue
|
34
|
|
41
|
|
|||
|
Other current liabilities
|
197
|
|
183
|
|
|||
|
Total Current Liabilities
|
426
|
|
417
|
|
|||
|
Product warranty liability
|
40
|
|
33
|
|
|||
|
Deferred revenue
|
88
|
|
75
|
|
|||
|
Long-term debt
|
2,523
|
|
2,534
|
|
|||
|
Deferred income taxes
|
329
|
|
276
|
|
|||
|
Other non-current liabilities
|
172
|
|
181
|
|
|||
|
TOTAL LIABILITIES
|
3,578
|
|
3,516
|
|
|||
|
Commitments and Contingencies (see NOTE 17)
|
|
|
|||||
|
STOCKHOLDERS’ EQUITY
|
|||||||
|
Common stock, $0.01 par value, 1,880,000,000 shares authorized, 126,251,266 shares issued and outstanding and 139,990,865 shares issued and outstanding, respectively
|
1
|
|
1
|
|
|||
|
Non-voting common stock, $0.01 par value, 20,000,000 shares authorized, none issued and outstanding
|
—
|
|
—
|
|
|||
|
Preferred stock, $0.01 par value, 100,000,000 shares authorized, none issued and outstanding
|
—
|
|
—
|
|
|||
|
Paid in capital
|
1,788
|
|
1,758
|
|
|||
|
Accumulated deficit
|
(1,100
|
)
|
(1,055
|
)
|
|||
|
Accumulated other comprehensive loss, net of tax
|
(30
|
)
|
(15
|
)
|
|||
|
TOTAL STOCKHOLDERS’ EQUITY
|
659
|
|
689
|
|
|||
|
TOTAL LIABILITIES & STOCKHOLDERS’ EQUITY
|
$
|
4,237
|
|
$
|
4,205
|
|
|
The accompanying notes are an integral part of the consolidated financial statements.
53
Allison Transmission Holdings, Inc.
Consolidated Statements of Comprehensive Income
(dollars in millions, except per share data)
|
|
Years ended December 31,
|
||||||||||
|
|
2018
|
2017
|
2016
|
||||||||
|
Net sales
|
$
|
2,713
|
|
$
|
2,262
|
|
$
|
1,840
|
|
||
|
Cost of sales
|
1,291
|
|
1,131
|
|
976
|
|
|||||
|
Gross profit
|
1,422
|
|
1,131
|
|
864
|
|
|||||
|
Selling, general and administrative
|
364
|
|
342
|
|
324
|
|
|||||
|
Engineering — research and development
|
131
|
|
105
|
|
88
|
|
|||||
|
Loss associated with impairment of long-lived assets
|
4
|
|
32
|
|
—
|
|
|||||
|
Operating income
|
923
|
|
652
|
|
452
|
|
|||||
|
Interest expense, net
|
(121
|
)
|
(103
|
)
|
(101
|
)
|
|||||
|
Expenses related to long-term debt refinancing
|
—
|
|
—
|
|
(12
|
)
|
|||||
|
Other income (expense), net
|
3
|
|
(22
|
)
|
2
|
|
|||||
|
Income before income taxes
|
805
|
|
527
|
|
341
|
|
|||||
|
Income tax expense
|
(166
|
)
|
(23
|
)
|
(126
|
)
|
|||||
|
Net income
|
$
|
639
|
|
$
|
504
|
|
$
|
215
|
|
||
|
Basic earnings per share attributable to common stockholders
|
$
|
4.81
|
|
$
|
3.38
|
|
$
|
1.28
|
|
||
|
Diluted earnings per share attributable to common stockholders
|
$
|
4.78
|
|
$
|
3.36
|
|
$
|
1.27
|
|
||
|
Dividends declared per common share
|
$
|
0.60
|
|
$
|
0.60
|
|
$
|
0.60
|
|
||
|
Other comprehensive (loss) income, net of tax:
|
|||||||||||
|
Foreign currency translation
|
(9
|
)
|
15
|
|
(6
|
)
|
|||||
|
Pension and OPEB liability adjustment
|
1
|
|
26
|
|
3
|
|
|||||
|
Available-for-sale securities and interest rate swaps
|
(7
|
)
|
7
|
|
(1
|
)
|
|||||
|
Total other comprehensive (loss) income, net of tax
|
(15
|
)
|
48
|
|
(4
|
)
|
|||||
|
Comprehensive income
|
$
|
624
|
|
$
|
552
|
|
$
|
211
|
|
||
The accompanying notes are an integral part of the consolidated financial statements.
54
Allison Transmission Holdings, Inc.
Consolidated Statements of Cash Flows
(dollars in millions)
|
|
Years ended December 31,
|
||||||||||
|
|
2018
|
2017
|
2016
|
||||||||
|
CASH FLOWS FROM OPERATING ACTIVITIES:
|
|||||||||||
|
Net income
|
$
|
639
|
|
$
|
504
|
|
$
|
215
|
|
||
|
Adjustments to reconcile net income to net cash provided by operating activities:
|
|||||||||||
|
Amortization of intangible assets
|
87
|
|
90
|
|
92
|
|
|||||
|
Depreciation of property, plant and equipment
|
77
|
|
80
|
|
84
|
|
|||||
|
Deferred income taxes
|
52
|
|
(50
|
)
|
114
|
|
|||||
|
Stock-based compensation
|
13
|
|
12
|
|
9
|
|
|||||
|
Amortization of deferred financing costs
|
6
|
|
6
|
|
7
|
|
|||||
|
Loss associated with impairment of long-lived assets
|
4
|
|
32
|
|
—
|
|
|||||
|
Impairment loss on investments in technology-related initiatives
|
3
|
|
16
|
|
1
|
|
|||||
|
Unrealized gain on derivatives
|
—
|
|
(29
|
)
|
(1
|
)
|
|||||
|
Expenses related to long-term debt refinancing
|
—
|
|
—
|
|
11
|
|
|||||
|
Excess tax benefit from stock-based compensation
|
—
|
|
—
|
|
(6
|
)
|
|||||
|
Other
|
4
|
|
—
|
|
1
|
|
|||||
|
Changes in assets and liabilities:
|
|||||||||||
|
Accounts receivable
|
(61
|
)
|
(19
|
)
|
(3
|
)
|
|||||
|
Inventories
|
(18
|
)
|
(25
|
)
|
15
|
|
|||||
|
Accounts payable
|
9
|
|
30
|
|
2
|
|
|||||
|
Other assets and liabilities
|
22
|
|
11
|
|
50
|
|
|||||
|
Net cash provided by operating activities
|
837
|
|
658
|
|
591
|
|
|||||
|
CASH FLOWS FROM INVESTING ACTIVITIES:
|
|||||||||||
|
Additions of long-lived assets
|
(100
|
)
|
(91
|
)
|
(71
|
)
|
|||||
|
Investments in technology-related initiatives
|
(3
|
)
|
(3
|
)
|
(1
|
)
|
|||||
|
Net cash used for investing activities
|
(103
|
)
|
(94
|
)
|
(72
|
)
|
|||||
|
CASH FLOWS FROM FINANCING ACTIVITIES:
|
|||||||||||
|
Repurchases of common stock
|
(609
|
)
|
(885
|
)
|
(256
|
)
|
|||||
|
Dividend payments
|
(80
|
)
|
(89
|
)
|
(100
|
)
|
|||||
|
Payments on long-term debt
|
(28
|
)
|
(12
|
)
|
(1,215
|
)
|
|||||
|
Proceeds from exercise of stock options
|
22
|
|
19
|
|
24
|
|
|||||
|
Taxes paid related to net share settlement of equity awards
|
(4
|
)
|
(1
|
)
|
(2
|
)
|
|||||
|
Debt financing fees
|
(1
|
)
|
(6
|
)
|
(21
|
)
|
|||||
|
Borrowings on revolving credit facility
|
—
|
|
415
|
|
—
|
|
|||||
|
Repayments on revolving credit facility
|
—
|
|
(415
|
)
|
—
|
|
|||||
|
Issuance of long-term debt
|
—
|
|
400
|
|
1,000
|
|
|||||
|
Excess tax benefit from stock-based compensation
|
—
|
|
—
|
|
6
|
|
|||||
|
Net cash used for financing activities
|
(700
|
)
|
(574
|
)
|
(564
|
)
|
|||||
|
Effect of exchange rate changes on cash
|
(2
|
)
|
4
|
|
(2
|
)
|
|||||
|
Net increase (decrease) in cash and cash equivalents
|
32
|
|
(6
|
)
|
(47
|
)
|
|||||
|
Cash and cash equivalents at beginning of period
|
199
|
|
205
|
|
252
|
|
|||||
|
Cash and cash equivalents at end of period
|
$
|
231
|
|
$
|
199
|
|
$
|
205
|
|
||
|
Supplemental disclosures:
|
|||||||||||
|
Interest paid
|
$
|
115
|
|
$
|
124
|
|
$
|
78
|
|
||
|
Income taxes paid
|
$
|
101
|
|
$
|
96
|
|
$
|
13
|
|
||
The accompanying notes are an integral part of the consolidated financial statements.
55
Allison Transmission Holdings, Inc.
Consolidated Statements of Stockholders’ Equity
(dollars in millions)
|
Common
Stock
|
Non-voting
Common
Stock
|
Preferred
Stock
|
Paid-in
Capital
|
Accumulated
Deficit
|
Accumulated
Other
Comprehensive
Loss, net of tax
|
Stockholders’
Equity
|
|||||||||||||||||||||
|
Balance at December 31, 2015
|
$
|
2
|
|
$
|
—
|
|
$
|
—
|
|
$
|
1,690
|
|
$
|
(445
|
)
|
$
|
(59
|
)
|
$
|
1,188
|
|
||||||
|
Stock-based compensation
|
—
|
|
—
|
|
—
|
|
9
|
|
—
|
|
—
|
|
9
|
|
|||||||||||||
|
Pension and OPEB liability adjustment
|
—
|
|
—
|
|
—
|
|
—
|
|
—
|
|
3
|
|
3
|
|
|||||||||||||
|
Foreign currency translation adjustment
|
—
|
|
—
|
|
—
|
|
—
|
|
—
|
|
(6
|
)
|
(6
|
)
|
|||||||||||||
|
Available-for-sale securities
|
—
|
|
—
|
|
—
|
|
—
|
|
—
|
|
(1
|
)
|
(1
|
)
|
|||||||||||||
|
Issuance of common stock
|
—
|
|
—
|
|
—
|
|
23
|
|
—
|
|
—
|
|
23
|
|
|||||||||||||
|
Repurchase of common stock
|
—
|
|
—
|
|
—
|
|
—
|
|
(256
|
)
|
—
|
|
(256
|
)
|
|||||||||||||
|
Dividends on common stock
|
—
|
|
—
|
|
—
|
|
—
|
|
(100
|
)
|
—
|
|
(100
|
)
|
|||||||||||||
|
Excess tax benefit from stock-based compensation
|
—
|
|
—
|
|
—
|
|
6
|
|
—
|
|
—
|
|
6
|
|
|||||||||||||
|
Net income
|
—
|
|
—
|
|
—
|
|
—
|
|
215
|
|
—
|
|
215
|
|
|||||||||||||
|
Balance at December 31, 2016
|
$
|
2
|
|
$
|
—
|
|
$
|
—
|
|
$
|
1,728
|
|
$
|
(586
|
)
|
$
|
(63
|
)
|
$
|
1,081
|
|
||||||
|
Stock-based compensation
|
—
|
|
—
|
|
—
|
|
12
|
|
—
|
|
—
|
|
12
|
|
|||||||||||||
|
Pension and OPEB liability adjustment
|
—
|
|
—
|
|
—
|
|
—
|
|
—
|
|
26
|
|
26
|
|
|||||||||||||
|
Foreign currency translation adjustment
|
—
|
|
—
|
|
—
|
|
—
|
|
—
|
|
15
|
|
15
|
|
|||||||||||||
|
Available-for-sale securities
|
—
|
|
—
|
|
—
|
|
—
|
|
—
|
|
7
|
|
7
|
|
|||||||||||||
|
Issuance of common stock
|
—
|
|
—
|
|
—
|
|
18
|
|
—
|
|
—
|
|
18
|
|
|||||||||||||
|
Repurchase of common stock
|
(1
|
)
|
—
|
|
—
|
|
—
|
|
(884
|
)
|
—
|
|
(885
|
)
|
|||||||||||||
|
Dividends on common stock
|
—
|
|
—
|
|
—
|
|
—
|
|
(89
|
)
|
—
|
|
(89
|
)
|
|||||||||||||
|
Net income
|
—
|
|
—
|
|
—
|
|
—
|
|
504
|
|
—
|
|
504
|
|
|||||||||||||
|
Balance at December 31, 2017
|
$
|
1
|
|
$
|
—
|
|
$
|
—
|
|
$
|
1,758
|
|
$
|
(1,055
|
)
|
$
|
(15
|
)
|
$
|
689
|
|
||||||
|
Stock-based compensation
|
—
|
|
—
|
|
—
|
|
13
|
|
—
|
|
—
|
|
13
|
|
|||||||||||||
|
Pension and OPEB liability adjustment
|
—
|
|
—
|
|
—
|
|
—
|
|
—
|
|
1
|
|
1
|
|
|||||||||||||
|
Foreign currency translation adjustment
|
—
|
|
—
|
|
—
|
|
—
|
|
—
|
|
(9
|
)
|
(9
|
)
|
|||||||||||||
|
Available-for-sale securities and interest rate swaps
|
—
|
|
—
|
|
—
|
|
—
|
|
—
|
|
(7
|
)
|
(7
|
)
|
|||||||||||||
|
Issuance of common stock
|
—
|
|
—
|
|
—
|
|
17
|
|
—
|
|
—
|
|
17
|
|
|||||||||||||
|
Repurchase of common stock
|
—
|
|
—
|
|
—
|
|
—
|
|
(609
|
)
|
—
|
|
(609
|
)
|
|||||||||||||
|
Dividends on common stock
|
—
|
|
—
|
|
—
|
|
—
|
|
(80
|
)
|
—
|
|
(80
|
)
|
|||||||||||||
|
Impact of adopting accounting standards
|
—
|
|
—
|
|
—
|
|
—
|
|
5
|
|
—
|
|
5
|
|
|||||||||||||
|
Net income
|
—
|
|
—
|
|
—
|
|
—
|
|
639
|
|
—
|
|
639
|
|
|||||||||||||
|
Balance at December 31, 2018
|
$
|
1
|
|
$
|
—
|
|
$
|
—
|
|
$
|
1,788
|
|
$
|
(1,100
|
)
|
$
|
(30
|
)
|
$
|
659
|
|
||||||
The accompanying notes are an integral part of the consolidated financial statements.
56
Allison Transmission Holdings, Inc.
Notes to Consolidated Financial Statements
NOTE 1. OVERVIEW
Overview
Allison Transmission Holdings, Inc. and its subsidiaries (“Allison” or the “Company”) design and manufacture commercial and defense fully-automatic transmissions. The business was founded in 1915 and has been headquartered in Indianapolis, Indiana since inception. Allison was an operating unit of General Motors Corporation from 1929 until 2007, when Allison once again became a stand-alone company. In March 2012, Allison began trading on the New York Stock Exchange under the symbol, “ALSN”.
The Company has approximately
2,900
employees and
12
different transmission product lines. Although approximately
77%
of revenues were generated in North America in
2018
, the Company has a global presence by serving customers in Europe, Asia, South America and Africa. The Company serves customers through an independent network of approximately
1,400
independent distributor and dealer locations worldwide.
NOTE 2. SUMMARY OF SIGNIFICANT ACCOUNTING POLICIES
Basis of Presentation and Principles of Consolidation
The consolidated financial statements have been prepared in accordance with accounting principles generally accepted in the United States of America (“GAAP”). The information herein reflects all normal recurring material adjustments, which are, in the opinion of management, necessary for a fair statement of the results for the periods presented. The consolidated financial statements herein consist of all wholly-owned domestic and foreign subsidiaries with all significant intercompany transactions eliminated.
These consolidated financial statements present the financial position, results of comprehensive income, cash flows and statements of equity.
Use of Estimates
The preparation of financial statements in conformity with GAAP requires management to make estimates and assumptions that affect the reported amounts of assets and liabilities, disclosure of contingent assets and liabilities and the reported amounts of revenue and expenses. Estimates include, but are not limited to, sales allowances, government price adjustments, fair market values and future cash flows associated with goodwill, indefinite life intangibles, long-lived asset impairment tests, useful lives for depreciation and amortization, warranty liabilities, environmental liabilities, determination of discount and other assumptions for pension and other postretirement benefit expense, income taxes and deferred tax valuation allowances, derivative valuation, and contingencies. The Company’s accounting policies involve the application of judgments and assumptions made by management that include inherent risks and uncertainties. Actual results could differ materially from these estimates. Changes in estimates are recorded in results of operations in the period that the events or circumstances giving rise to such changes occur.
Segment Reporting
In accordance with the Financial Accounting Standards Board’s (“FASB”) authoritative accounting guidance on segment reporting, the Company has
one
operating segment and reportable segment. The Company is in
one
line of business, which is the manufacture and distribution of fully-automatic transmissions.
Cash and Cash Equivalents
Cash equivalents are defined as short-term, highly-liquid investments with original maturities of 90 days or less. Under the Company’s cash management system, checks issued but not presented to banks may result in book overdraft balances for accounting purposes and are classified within Accounts payable in the Consolidated Balance Sheets. The change in book overdrafts is reported as a component of operating cash flows for Accounts payable.
57
Marketable Securities
The Company determines the appropriate classification of all marketable securities as “held-to-maturity,” “available-for-sale” or “trading” at the time of purchase, and re-evaluates such classifications as of each balance sheet date. As of
December 31, 2018
, and
2017
, the Company’s marketable securities were classified as trading.
Trading securities are carried at fair value with the unrealized gain or loss recognized in Other income (expense), net. The fair value of the Company’s investment securities is determined by currently available market prices. See NOTE 7 “Fair Value of Financial Instruments” for more details.
Inventories
Inventories are stated at the lower of cost and net realizable value. The Company determines cost using the first-in, first-out method. The Company analyzes inventory on a quarterly basis to determine whether it is excess or obsolete inventory. Any decline in carrying value of estimated excess or obsolete inventory is recorded as a reduction of inventory and as an expense included in Cost of sales in the period it is identified.
Property, Plant and Equipment
Property, plant and equipment are recorded at cost less accumulated depreciation. Depreciation expense is recorded using the straight-line method over the following estimated lives:
|
|
Range in Years
|
|
Land improvements
|
5 – 30
|
|
Buildings and building improvements
|
10 – 40
|
|
Machinery and equipment
|
2 – 20
|
|
Software
|
2 – 5
|
|
Special tools
|
2 – 10
|
Software represents the costs of software developed or obtained for internal use. Software costs are amortized on a straight-line basis over their estimated useful lives. Software assets are reviewed for impairment when events or circumstances indicate that the carrying value may not be recoverable over the remaining lives of the assets. Upgrades and enhancements are capitalized if they result in added functionality, which enables the software to perform tasks it was previously incapable of performing. Software maintenance, training, data conversion and business process reengineering costs are expensed in the period in which they are incurred.
Special tooling represents the costs to design and develop tools, dies, jigs and other items owned by the Company and used in the manufacture of components by suppliers under long-term supply agreements. Special tooling is depreciated over the tool’s expected life. Special tooling used in the development of new technology is expensed as incurred. Engineering, testing and other costs incurred in the design and development of production parts are expensed as incurred.
Impairment of Long-Lived Assets
The carrying value of long-lived assets is evaluated whenever events or circumstances indicate that the carrying value of an asset may not be recoverable. Events or circumstances that would result in an impairment review primarily include a significant change in the use of an asset or the planned sale or disposal of an asset. The asset would be considered impaired when there is no future use planned for the asset or the future net undiscounted cash flows generated by the asset or asset group are less than its carrying value. An impairment loss would be recognized based on the amount by which the carrying value exceeds fair value.
Assumptions and estimates used to determine cash flows in the evaluation of impairment and the fair values used to determine the impairment are subject to a degree of judgment and complexity. Any changes to the assumptions and estimates resulting from changes in actual results or market conditions from those anticipated may affect the carrying value of long-lived assets and could result in an impairment charge.
58
As a result of events and circumstances related to weak demand conditions for the TC10 product in the fourth quarter of 2017 and the decision to cease production of the TC10 product in the fourth quarter of 2018, the Company recorded a
$4 million
and $
32 million
impairment loss associated with the production of TC10 for the years ended
December 31, 2018
and
2017
, respectively.
There were
no
impairment charges for the year ended December 31, 2016.
Goodwill and Other Intangible Assets
Goodwill represents the excess of purchase price paid over the fair value of net assets acquired. In accordance with the FASB’s authoritative accounting guidance on goodwill, the Company does not amortize goodwill but rather evaluates it for impairment on an annual basis, or more often if events or circumstances change that could cause goodwill to become impaired. Goodwill is tested for impairment at the reporting unit level, which is the same as the Company’s one operating and reportable segment. The Company does not aggregate any components into its reporting unit. The Company has elected to perform its annual goodwill impairment test on October 31 of every year using a multi-step impairment test. In Step 0, the Company has the option to evaluate various qualitative factors to determine the likelihood of impairment. If determined that the fair value is more likely than not less than the carrying value, then the Company is required to perform Step 1. If the Company does not elect to perform Step 0, it can voluntarily proceed directly to Step 1. In Step 1, the Company performs a quantitative analysis to compare the fair value of its reporting unit to its carrying value including goodwill. If the fair value of the reporting unit exceeds the carrying value of the net assets assigned to that unit, goodwill is not considered impaired, and the Company is not required to perform further testing. If the carrying value of a reporting unit’s goodwill exceeds its carrying value of net assets, then the Company would record an impairment loss equal to the difference.
Goodwill impairment testing for
2018
was performed using the Step 0 analysis of certain trends and factors. The Company’s qualitative assessment included an assessment of business changes, economic outlook, financial trends and forecasts, growth rates, credit ratings, equity ratings, discount rates, industry data and other relevant qualitative factors. Events or circumstances that could unfavorably impact the key assumptions include lower net sales driven by market conditions, our inability to execute on marketing programs and/or growth initiatives, lower gross margins as a result of market conditions or failure to obtain forecasted cost reductions, or a higher discount rate as a result of market conditions. While unpredictable and inherently uncertain, the Company believes the forecast estimates were reasonable and incorporate assumptions that similar market participants would use in their estimates of fair value. These trends and factors were compared to, and based on, the assumptions used in prior years. After reviewing various qualitative factors, the Company’s
2018
annual goodwill impairment test indicated that the fair value of the reporting unit more likely than not exceeded its carrying value, indicating no impairment. Refer to NOTE 6, “Goodwill and Other Intangible Assets” for further information.
Other intangible assets have both indefinite and finite useful lives. Intangible assets with indefinite useful lives, such as the Company’s trade name, are not amortized but are tested annually for impairment. The Company has elected to perform its annual trade name impairment test on October 31 of every year and follow a similar multi-step impairment test to that performed on goodwill. Events or circumstances that could unfavorably impact the key assumptions include lower net sales driven by market conditions, the Company's inability to execute on marketing programs and/or delay in introduction of new products, and higher discount rate as a result of market conditions. While unpredictable and inherently uncertain, the Company believes the forecast estimates are reasonable and incorporate those assumptions that similar market participants would use in their estimates of fair value. After reviewing various qualitative factors, the Company’s annual
2018
trade name impairment test indicated that the fair value of the trade name more likely than not exceeded its carrying value, indicating no impairment. Refer to NOTE 6, “Goodwill and Other Intangible Assets” for further information.
59
Intangible assets with finite lives are amortized over their estimated useful lives and reviewed for impairment when circumstances change that would create a triggering event. Customer relationships are amortized over the life in which expected benefits are to be consumed. The other remaining finite life intangibles are amortized on a straight-line basis over their useful lives. The Company evaluates the remaining useful life of the other intangible assets on a periodic basis to determine whether events or circumstances warrant a revision to the remaining useful life. Assumptions and estimates about future values and remaining useful lives of the Company’s intangible and other long-lived assets are complex and subjective. They can be affected by a variety of factors, including external factors such as industry and economic trends, and internal factors, such as changes in the Company’s business strategy and internal forecasts. Although management believes the historical assumptions and estimates are reasonable and appropriate, different assumptions and estimates could materially impact the Company’s reported financial results. NOTE 6 “Goodwill and Other Intangible Assets” provides further information.
Deferred Financing Costs
The debt issuance costs related to line-of-credit arrangements is presented as a component of other non-current assets. The debt issuance costs related to other types of debt instruments such as notes and loans are presented as a component of long-term debt. Deferred financing costs continue to be amortized over the life of the related debt using the effective interest method. Amortization of deferred financing costs is recorded as part of interest expense and totaled
$6 million
,
$6 million
and
$7 million
for the years ended
December 31, 2018
,
2017
and
2016
, respectively.
Financial Instruments
The Company’s cash equivalents are invested in U.S. government backed securities and recorded at fair value in the Consolidated Balance Sheets. The carrying values of accounts receivable and accounts payable approximate fair value due to their short-term nature. The Company’s financial derivative instruments, including interest rate swaps, are carried at fair value on the Consolidated Balance Sheets. Refer to NOTE 7, “Fair Value of Financial Instruments” for more detail. The Company’s long-term debt obligations are carried at historical amounts with the Company providing fair value disclosure in NOTE 8, “Debt”.
Insurable Liabilities
The Company records liabilities for its medical, workers’ compensation, long-term disability, product, general and auto liabilities. The determination of these liabilities and related expenses is dependent on claims experience. For most of these liabilities, claims incurred but not yet reported are estimated based upon historical claims experience.
Revenue Recognition
The Company records sales as each distinct performance obligation within a contract is satisfied. The Company sells extended transmission coverage (“ETC”) for which sales are deferred. ETC sales are recognized ratably over the period of coverage, which typically ranges from
two
to
five years
after initial sale. Costs associated with ETC programs are recorded as incurred during the extended period. Distributor and customer sales incentives, consisting of allowances and other rebates, are recorded as a reduction to Net sales when it is determined that the adjustment is not likely to reverse, historically on a quarterly basis. Incentive programs are generally product specific or region specific. Some factors used in estimating when an adjustment is not likely to reverse are the number of transmissions that will be affected by the incentive program and rate of acceptance of any incentive program. Consideration given to commercial customers recorded as a reduction of Net sales in the Consolidated Statements of Comprehensive Income included
$80 million
,
$66 million
, and
$58 million
for the years ended
December 31, 2018
,
2017
and
2016
, respectively.
Sales under U.S. government production contracts are recognized at the point in time when control passes to the customer, or when the U.S. government accepts the transmission and is able to direct its use in certain bill-and-hold arrangements. Deferred revenue arises from cash received in advance of the culmination of the earnings process and is recognized as revenue in future periods when the applicable revenue recognition criteria have been met. Under the terms of previous U.S. government contracts, there were certain price reduction clauses and provisions for potential price reductions which were estimated at the time of sale based upon the Company’s history and experience and were recorded as a reduction to Net sales. Potential reductions may be attributed to a change in projected sales volumes or plant efficiencies which impact overall costs. As of each of
December 31, 2018
and
2017
, the Company had
$56 million
recorded in the price reduction reserve account.
60
The Company engages in licensing agreements with certain third parties for the use of the Company’s intellectual property. Deferred revenue arises from cash received in advance of the period of use of the intellectual property. Revenue is recognized over the license period as it is earned.
The Company classifies shipping and handling billed to customers in Net sales and shipping and handling costs in Cost of sales, in accordance with authoritative accounting guidance.
The Company contracts with various third parties to provide engineering services. These services are recorded as Net sales in accordance with the terms of the contract. The saleable engineering recorded was
$3 million
for each of the years ended
December 31, 2018
,
2017
and
2016
. The associated costs are recorded in Cost of sales.
Warranty
Provisions for estimated expenses related to product warranties are made at the time products are sold. Warranty claims arise when a transmission fails while in service during the relevant warranty period. The warranty reserve is adjusted in Selling, general and administrative based on the Company’s current and historical warranty claims paid and associated repair costs. These estimates are established using historical information including the nature, frequency, and average cost of warranty claims and are adjusted as actual information becomes available. From time to time, the Company may initiate a specific field action program. As a result of the uncertainty surrounding the nature and frequency of specific field action programs, the liability for such programs is recorded when the Company commits to an action. The Company reviews and assesses the liability for these programs on a quarterly basis. The Company also assesses its ability to recover certain costs from its suppliers and records a receivable from the supplier when it believes a recovery is probable. Warranty costs may differ from those estimated if actual claim rates are higher or lower than the Company's historical rates.
Research and Development
The Company incurs costs in connection with research and development programs that are expected to contribute to future earnings. Such costs are charged to Engineering — research and development as incurred.
Environmental
The Company accrues costs related to environmental matters when it is probable that the Company has incurred a liability related to a contaminated site and the costs can be reasonably estimated. For additional information, see NOTE 17, “Commitments and Contingencies”.
Foreign Currency Translation
Most of the subsidiaries outside the United States prepare financial statements in currencies other than the U.S. Dollar. The functional currency for all of these subsidiaries is the local currency, except for the Company’s Hong Kong and Middle East subsidiaries which currently use the U.S. Dollar as their functional currency. Balances are translated at period-end exchange rates for assets and liabilities and monthly weighted-average exchange rates for revenues and expenses. The translation gains and losses are stated as a component of Accumulated Other Comprehensive Loss (“AOCL”) as disclosed in NOTE 16, “Accumulated Other Comprehensive Loss”.
Derivative Instruments
In the normal course of business, the Company is exposed to fluctuations in interest rates, foreign currency exchange rates, and commodity prices. The risk is managed through the use of financial derivative instruments, when appropriate. The Company has qualified for and elected hedge accounting treatment on interest rate swap contracts. As necessary, the Company adjusts the values of the derivative instruments for counter-party or credit risk. NOTE 9, “Derivatives” provides further information on the accounting treatment of the Company’s derivative instruments.
61
Income Taxes
Income taxes are accounted for under the asset and liability method. Deferred tax assets and liabilities are recognized for the expected future tax consequences attributable to temporary differences between the financial statement carrying amounts of existing assets and liabilities and their respective tax bases. The future tax benefits associated with operating loss and tax credit carryforwards are recognized as deferred tax assets. Deferred tax assets and liabilities are measured using enacted tax rates expected to apply to taxable income in the years in which those temporary differences are expected to be recovered or settled.
The need to establish a valuation allowance against the deferred tax assets is assessed periodically based on a more-likely-than-not realization threshold, in accordance with the FASB’s authoritative accounting guidance on income taxes. Appropriate consideration is given to all positive and negative evidence related to that realization. This assessment considers, among other matters, the nature, frequency and severity of recent losses, forecasts of future profitability, the duration of statutory carryforward periods, and experience with tax attributes expiring unused and tax planning alternatives. The weight given to these considerations depends upon the degree to which they can be objectively verified.
Stock-Based Compensation
In March 2015, the Company’s Board of Directors adopted and, in May 2015, the Company’s stockholders approved the Allison Transmission Holdings, Inc. 2015 Equity Incentive Award Plan (“2015 Plan”), which became effective on May 14, 2015. Under the 2015 Plan, certain employees (including executive officers), consultants and directors are eligible to receive equity-based compensation, including non-qualified stock options, incentive stock options, restricted stock, dividend equivalents, stock payments, restricted stock units (“RSUs”), performance awards, stock appreciation rights and other equity-based awards, or any combination thereof. The 2015 Plan limits the aggregate number of shares of common stock available for issue to
15.3 million
and will expire on, and no option or other equity award may be granted pursuant to the 2015 Plan after, the tenth anniversary of the date the 2015 Plan was approved by the Board of Directors.
Prior to the adoption of the 2015 Plan, the Company’s equity-based awards were granted under the Allison Transmission Holdings, Inc. 2011 Equity Incentive Award Plan (“2011 Plan”) and the Equity Incentive Plan of Allison Transmission Holdings, Inc. (“Equity Plan” and, together with the 2011 Plan, the “Prior Plans”). As of the effective date of the 2015 Plan, no new awards will be granted under the Prior Plans, but the Prior Plans will continue to govern the equity awards issued under the Prior Plans.
RSU grants are recorded at fair market value at the date of grant and vest upon continued performance of services by the RSU holders over
one
to
three years
. Performance unit grants are recorded at fair value based on a Monte-Carlo pricing model and the restrictions lapse on the date the Compensation Committee of the Board of Directors determines the number of shares that shall vest based on the related performance or market condition achievement. Non-qualified stock option grants are recorded at fair value using a Black-Scholes option pricing model and vest upon the continued performance of services by the option holder on the third anniversary of the grant date for awards under the 2015 Plan.
The Company has made a policy election under applicable accounting guidance to account for forfeitures as a reduction of stock-based compensation expense when the forfeiture actually occurs.
RSUs were granted to certain employees and directors at fair market value on the date of grant. The restrictions lapse upon continued performance by the RSU holder on the vest date which generally occurs over
one
,
two
or
three years
. RSU incentive compensation expense recorded was
$5 million
,
$7 million
and
$2 million
for the years ended
December 31, 2018
,
2017
and
2016
, respectively.
Performance-based awards, including performance units, were granted to certain employees at fair value at the date of grant. The Company records the fair value of each performance-based award based on a Monte-Carlo pricing model. Performance-based award incentive compensation expense recorded was
$6 million
,
$3 million
and
$1 million
for the years ended
December 31, 2018
,
2017
and
2016
, respectively.
Stock options were granted to certain employees at fair value on the date of grant using a Black-Scholes option pricing model. Stock option incentive compensation expense recorded was
$2 million
,
$2 million
and
$3 million
for the years ended
December 31, 2018
,
2017
and
2016
, respectively.
62
Pension and Post-retirement Benefit Plans
For pension and other post-retirement benefits (“OPEB”) plans in which employees participate, costs are determined within the FASB’s authoritative accounting guidance set forth in employers’ defined benefit pensions including accounting for settlements and curtailments of defined benefit pension plans, termination of benefits and accounting for post-retirement benefits other than pensions. In accordance with the authoritative accounting guidance, the Company recognizes the funded status of its defined benefit pension plans and OPEB plan in its Consolidated Balance Sheets with a corresponding adjustment to AOCL, net of tax.
Post-retirement benefit costs consist of service cost and interest cost on accrued obligations. Actuarial gains and losses on liabilities, together with any prior service costs, are charged (or credited) to income over the average remaining service lives of employees.
The benefit cost components shown in the Consolidated Statements of Comprehensive Income are based upon various actuarial assumptions and methodologies as prescribed by authoritative accounting guidance. These assumptions include discount rates, expected return on plan assets, health care cost trend rates, inflation, rate of compensation increases, population demographics, mortality rates and other factors. The Company reviews all actuarial assumptions on an annual basis. Changes in key economic indicators can change these assumptions. These assumptions, along with the actual value of assets at the measurement date, will impact the calculation of pension expenses for the year.
Recently Adopted Accounting Pronouncements
In May 2014, the FASB issued authoritative accounting guidance on a company’s accounting for revenue from contracts with customers, which guidance was subsequently amended. The guidance applies to all companies that enter into contracts with customers to transfer goods, services or nonfinancial assets. The guidance requires these companies to recognize revenue to depict the transfer of promised goods or services to customers in an amount that reflects the consideration to which the entity expects to be entitled in exchange for those goods or services. The guidance also requires disclosures regarding the nature, timing, amount and uncertainty of revenue that is recognized. The guidance was adopted by the Company effective January 1, 2018 on a modified retrospective basis. See NOTE 3, “Revenue” for information regarding the impact of the adoption of this guidance.
In February 2016, the FASB issued authoritative accounting guidance on lease accounting, which guidance was subsequently amended. The guidance requires lessees to present right-of-use assets and lease liabilities on the balance sheet for all leases not considered short-term leases. Short-term leases are leases with a lease term of 12 months or less as long as the leases do not include options to purchase the underlying assets that the lessee is reasonably certain to exercise. The guidance also introduces new disclosure requirements for leasing arrangements. In July 2018, the FASB issued additional authoritative guidance on this topic giving lessees an optional adoption approach under which the impact of the adoption of the guidance would be shown as of the date of adoption. Management has elected to adopt the guidance using this modified retrospective approach. The guidance was adopted by the Company effective January 1, 2019. The Company will record a non-monetary right-of-use asset and current and non-current lease liabilities of less than
$15 million
on its Consolidated Balance Sheets as of January 1, 2019. The adoption of this guidance did not have a material impact on the Company's Consolidated Statements of Comprehensive Income.
In August 2016, the FASB issued authoritative accounting guidance on the presentation and classification of certain cash receipts and cash payments on the statement of cash flows. The guidance specifically addresses cash flow issues with the objective of reducing the diversity in practice. The guidance was adopted by the Company effective January 1, 2018 and did not have a material impact on the Company’s consolidated financial statements.
In March 2017, the FASB issued authoritative accounting guidance on the presentation of net periodic pension costs and net periodic post-retirement benefit costs. The guidance clarifies the presentation of component costs within an employer’s financial statements and restricts component costs eligible for capitalization to the service cost component. The guidance was adopted by the Company effective January 1, 2018 and did not have a material impact on the Company’s consolidated financial statements.
In May 2017, the FASB issued authoritative accounting guidance on accounting for modifications to the terms of employee stock compensation. The guidance clarifies which changes to terms or conditions of share-based payment awards require the entity to apply modification accounting. The guidance was adopted by the Company effective January 1, 2018 and did not have a material impact on the Company’s consolidated financial statements.
63
In August 2017, the FASB issued authoritative accounting guidance on accounting for derivative and hedge instruments. Among other things, the guidance allows the initial hedge effectiveness assessment to be performed by the end of the quarter in which the hedge is designated, permits a qualitative assessment for certain hedges if an expectation of high effectiveness can be supported throughout the term of the hedge, and removes the requirement to record ineffectiveness on cash flow hedges immediately through earnings when the hedge is highly effective. The guidance was early adopted by the Company effective April 1, 2018 and applied upon entering into interest rate swaps designated as cash flow hedges during the second quarter of 2018. When adopted in an interim period, the guidance is required to be reflected as of the beginning of the year of adoption. The Company has not previously designated any derivative instruments as hedging instruments, and thus, the adoption of this guidance did not have a material impact on the Company’s consolidated financial statements.
In February 2018, the FASB issued authoritative accounting guidance on transfers of stranded balances in accumulated other comprehensive loss to retained earnings. The passage of the U.S. Tax Cuts and Jobs Act by the U.S. federal government in December 2017 and existing GAAP requirements to adjust deferred tax assets and liabilities for changes in tax laws or rates created stranded balances in accumulated other comprehensive loss on deferred tax assets and liabilities previously recorded as a component to accumulated other comprehensive loss. The guidance applies to companies affected by these stranded balances and allows a reclassification of these balances to retained earnings. The guidance was adopted by the Company effective January 1, 2019. The adoption of this guidance did not have a material impact on the Company's consolidated financial statements.
In June 2018, the FASB issued authoritative accounting guidance on accounting for nonemployee awards for goods or services received by a company. The guidance was adopted by the Company effective January 1, 2019. The adoption of this guidance did not have a material impact on the Company's consolidated financial statements.
Recently Issued Accounting Pronouncements
In June 2016, the FASB issued authoritative accounting guidance on the presentation of financial assets at the net amount expected to be collected. The guidance also requires the disclosure of financing receivables disaggregated by the year of origination. The guidance will be effective for the Company in fiscal year 2020, and the Company does not plan to early adopt. Management is evaluating the impact of this guidance on the Company's consolidated financial statements.
In August 2018, the FASB issued authoritative accounting guidance amending disclosure requirements for certain assets subject to fair value measurement. The guidance allows the Company to reduce the amount of disclosure on transfers between Level 1 and Level 2 assets. The guidance will be effective for the Company in fiscal year 2020, and the Company does not plan to early adopt. Management does not expect the adoption of this guidance to have a material impact on the Company's consolidated financial statements.
In August 2018, the FASB issued authoritative accounting guidance amending disclosure requirements for the Company's defined benefit pension plans and other post-retirement benefit plan. The guidance will be effective for the Company in fiscal year 2021, but early adoption is permitted. Management is currently evaluating the impact of this guidance on the Company's consolidated financial statements.
In August 2018, the FASB issued authoritative accounting guidance on accounting for implementation costs in hosting arrangements to align these costs with existing guidance for internally developed software. The stage of implementation must be assessed to determine if costs should be capitalized or expensed, and capitalized costs should be expensed during the noncancellable term of the agreement. The guidance will be effective for the Company in fiscal year 2020, and the Company does not plan to early adopt. Management is currently evaluating the impact of this guidance on the Company's consolidated financial statements.
64
NOTE 3. REVENUE
Adoption of New Revenue Guidance
New authoritative accounting guidance for revenue was adopted by the Company effective January 1, 2018 using the modified retrospective approach. Current period results are presented in conformity with the new authoritative accounting guidance, while prior period results are presented in conformity with prior accounting guidance.
In accordance with the modified retrospective approach, the Company recorded a one-time adjustment related to sales of ETC contracts open as of the date of adoption, which increased opening retained earnings by
$5 million
, net of tax, and decreased current deferred revenue by
$2 million
and non-current deferred revenue by
$4 million
as of January 1, 2018.
During the year ended
December 31, 2018
, the Company increased net sales by
$2 million
, and decreased non-current deferred revenue by
$2 million
, compared to prior accounting guidance, as a result of how the Company allocates revenue to the ETC performance obligation in certain contracts under the new authoritative accounting guidance for revenue.
Under the new authoritative accounting guidance, revenue is recognized as each distinct performance obligation within a contract with a customer is satisfied. A performance obligation is a promise in a contract to transfer a distinct good or service to the customer. The Company enters into long-term supply agreements (“LTSAs”) and distributor agreements with certain customers. The LTSAs and distributor agreements do not include committed volumes until underlying purchase orders are issued; therefore, the Company determined that purchase orders are the contract with a customer. A contract’s transaction price is allocated to each distinct performance obligation and recognized as revenue when the performance obligation is satisfied, as there is no right of return.
Many of the Company’s contracts have a single performance obligation, as the promise to transfer the individual good or service is not separately identifiable from other promises in the contracts and is, therefore, not distinct. Some of the Company's contracts have multiple performance obligations, most commonly the sale of both a transmission and ETC. For contracts with multiple performance obligations, the Company allocates the contract’s transaction price to each performance obligation using a ratable allocation based on the standalone selling price of each distinct good or service in the contract.
The Company may also use volume based discounts and rebates as marketing incentives in the sales of both transmissions and service parts, which are accounted for as variable consideration. The Company records the impact of the incentives as a reduction to revenue when it is determined that the adjustment is not likely to reverse, historically on a quarterly basis. Due to the typically short duration of purchase orders and minimal number of open contracts with variable consideration at any point in time, the impact of variable consideration is immaterial. If it were to become material, the Company would explain the methods, assumptions and estimates used to determine the consideration allocated to each performance obligation. The Company estimates the impact of all other incentives based on the related sales and market conditions in the end market vocation.
Net sales are made on credit terms, generally
30
days, based on an assessment of the customer’s creditworthiness. For certain goods or services, the Company receives consideration prior to satisfying the related performance obligation. Such consideration is recorded as a contract liability in current and non-current deferred revenue as of
December 31, 2018
and
December 31, 2017
. See NOTE 11, “Deferred Revenue” for more information including the amount of revenue earned during the year ended
December 31, 2018
that had been previously deferred. The Company does not have contract assets.
65
Disaggregated Revenue
The Company has
one
operating segment and reportable segment. The Company is in one line of business, which is the manufacture and distribution of fully automatic transmissions. The following presents disaggregated revenue by categories that best depict how the nature, amount, timing and uncertainty of revenue and cash flows are affected by economic factors (dollars in millions):
|
Year ended December 31, 2018
|
|||
|
North America On-Highway
|
$
|
1,317
|
|
|
North America Off-Highway
|
93
|
|
|
|
Defense
|
158
|
|
|
|
Outside North America On-Highway
|
383
|
|
|
|
Outside North America Off-Highway
|
129
|
|
|
|
Service Parts, Support Equipment and Other
|
633
|
|
|
|
Total Net Sales
|
$
|
2,713
|
|
Disaggregated revenue by end market is further described as follows:
North America On-Highway
Revenue from the North America On-Highway end market is driven by the sale of transmissions to original equipment manufacturers (“OEMs”), distributors and dealers that install the transmission into Class 4-5, Class 6-7 and Class 8 straight trucks, conventional transit, shuttle and coach buses, school buses and motorhome applications. Revenue from the North America On-Highway end market also includes the sale of electric hybrid-propulsion systems for transit bus. Revenue is recognized at the point in time when control passes to the customer, which is based on shipping terms when the order is fulfilled by the Company.
North America Off-Highway
Revenue from the North America Off-Highway end market is driven by sales of transmissions to OEMs and distributors that serve end users who operate vehicles and auxiliary equipment in energy, mining and construction applications. Revenue is recognized at the point in time when control passes to the customer, which is based on shipping terms when the order is fulfilled by the Company.
Defense
Revenue from the Defense end market is driven by sales of transmissions to the U.S. Government or its contractors and sales to certain government contractors outside of the U.S. for use in both wheeled and tracked defense vehicle applications. Revenue is recognized at the point in time when control passes to the customer, which is based on shipping terms when the order is fulfilled by the Company.
Periodically, the Company and the U.S. Government will enter into a bill-and-hold arrangement where a completed transmission physically remains at the Company’s facility at the request of the U.S. Government. Revenue is recognized at the point in time when it is determined that the U.S. Government accepts the transmission and is able to direct its use.
Outside North America On-Highway
Revenue from the Outside North America On-Highway end market is driven by the sale of transmissions to OEMs and distributors that produce vehicles for commercial users in medium and heavy duty applications. Revenue is recognized at the point in time when control passes to the customer, which is based on shipping terms when the order is fulfilled by the Company.
66
Outside North America Off-Highway
Revenue from the Outside North America Off-Highway end market is driven by sales of transmissions to OEMs and distributors serving end users who operate vehicles and auxiliary equipment in energy, mining and construction applications. Revenue is recognized at the point in time when control passes to the customer, which is based on shipping terms when the order is fulfilled by the Company.
Service Parts, Support Equipment and Other
Revenue from the Service Parts, Support Equipment and Other end market is primarily derived from the sale of transmission parts and fluid purchased for the normal maintenance and repair needs of products in service and the sale of ETC contracts which extend the warranty coverages of transmissions beyond the standard warranty period.
Revenue is recognized on sales of service parts and support equipment at the point in time when control passes to the customer, which is based on shipping terms when the order is fulfilled by the Company.
Revenue from the sale of ETC contracts is recognized ratably over the time period that corresponds with the period of coverage, as the Company has determined this method best depicts the progress towards satisfaction of its performance obligation. ETC contracts are sold in
one
to
five
year durations within the North America On-Highway, Outside North America On-Highway, North America Off-Highway and Outside North America Off-Highway end markets. The ETC contract period begins when the standard warranty coverage period ends. All consideration allocated to an ETC performance obligation is initially deferred until the coverage period begins.
NOTE 4. INVENTORIES
Inventories consisted of the following components (dollars in millions):
|
December 31, 2018
|
December 31, 2017
|
||||||
|
Purchased parts and raw materials
|
$
|
82
|
|
$
|
79
|
|
|
|
Work in progress
|
8
|
|
6
|
|
|||
|
Service parts
|
48
|
|
46
|
|
|||
|
Finished goods
|
32
|
|
23
|
|
|||
|
Total inventories
|
$
|
170
|
|
$
|
154
|
|
|
Inventory components shipped to third parties, primarily cores, parts to re-manufacturers, and parts to contract manufacturers, which the Company has an obligation to buy back, are included in purchased parts and raw materials, with an offsetting liability in other current liabilities. See NOTE 13, “Other Current Liabilities” for more information.
67
NOTE 5. PROPERTY, PLANT AND EQUIPMENT
The cost and accumulated depreciation of property, plant and equipment are as follows (dollars in millions):
|
December 31, 2018
|
December 31, 2017
|
||||||
|
Land and land improvements
|
$
|
24
|
|
$
|
24
|
|
|
|
Buildings and building improvements
|
336
|
|
322
|
|
|||
|
Machinery and equipment
|
643
|
|
601
|
|
|||
|
Software
|
143
|
|
136
|
|
|||
|
Special tools
|
201
|
|
169
|
|
|||
|
Construction in progress
|
52
|
|
46
|
|
|||
|
Total property, plant and equipment
|
1,399
|
|
1,298
|
|
|||
|
Accumulated depreciation
|
(933
|
)
|
(850
|
)
|
|||
|
Property, plant and equipment, net
|
$
|
466
|
|
$
|
448
|
|
|
Depreciation of property, plant and equipment was
$77 million
,
$80 million
and
$84 million
for the years ended
December 31, 2018
,
2017
and
2016
, respectively.
As a result of events and circumstances related to weak demand conditions for the TC10 product in the fourth quarter of 2017 and the decision to cease production of the TC10 product in the fourth quarter of 2018, the Company reviewed certain of its long-lived assets related to the production of the TC10 product, resulting in losses of
$1 million
and
$32 million
for the years ended
December 31, 2018
and
2017
. See NOTE 2 “Summary of Significant Accounting Policies”, Impairment of Long-Lived Assets for more information.
68
NOTE 6. GOODWILL AND OTHER INTANGIBLE ASSETS
As of both
December 31, 2018
and
2017
, the carrying amount of the Company’s Goodwill was
$1,941 million
.
The following presents a summary of other intangible assets (dollars in millions):
|
|
December 31, 2018
|
December 31, 2017
|
|||||||||||||||||||||
|
|
Intangible
assets, gross
|
Accumulated
amortization
|
Intangible
assets, net
|
Intangible
assets, gross
|
Accumulated
amortization
|
Intangible
assets, net
|
|||||||||||||||||
|
Other intangible assets:
|
|||||||||||||||||||||||
|
Trade name
|
$
|
790
|
|
$
|
—
|
|
$
|
790
|
|
$
|
790
|
|
$
|
—
|
|
$
|
790
|
|
|||||
|
Customer relationships – commercial
|
832
|
|
(619
|
)
|
213
|
|
832
|
|
(573
|
)
|
259
|
|
|||||||||||
|
Proprietary technology
|
476
|
|
(434
|
)
|
42
|
|
476
|
|
(396
|
)
|
80
|
|
|||||||||||
|
Customer relationships – defense
|
62
|
|
(41
|
)
|
21
|
|
62
|
|
(38
|
)
|
24
|
|
|||||||||||
|
Patented technology – defense
|
28
|
|
(28
|
)
|
—
|
|
28
|
|
(28
|
)
|
—
|
|
|||||||||||
|
Non-compete agreement
|
17
|
|
(17
|
)
|
—
|
|
17
|
|
(17
|
)
|
—
|
|
|||||||||||
|
Tooling rights
|
5
|
|
(5
|
)
|
—
|
|
5
|
|
(5
|
)
|
—
|
|
|||||||||||
|
Total
|
$
|
2,210
|
|
$
|
(1,144
|
)
|
$
|
1,066
|
|
$
|
2,210
|
|
$
|
(1,057
|
)
|
$
|
1,153
|
|
|||||
Amortization of intangible assets was
$87 million
,
$90 million
and
$92 million
for the years ended
December 31, 2018
,
2017
and
2016
, respectively.
As of
December 31, 2018
and
2017
, the net carrying value of the Company’s Goodwill and Other intangible assets, net was
$3,007 million
and
$3,094 million
, respectively. The Company’s 2018 annual goodwill impairment test indicated that the fair value of the reporting unit more likely than not exceeded its carrying value, indicating
no
impairment. The Company's 2018 annual trade name impairment test indicated that the fair value of the trade name more likely than not exceeded its carrying value, indicating no impairment.
Amortization expense related to other intangible assets for the next five years is expected to be (dollars in millions):
|
2019
|
2020
|
2021
|
2022
|
2023
|
|||||||||||||||
|
Amortization expense
|
$
|
86
|
|
$
|
50
|
|
$
|
45
|
|
$
|
43
|
|
$
|
42
|
|
||||
;
69
NOTE 7. FAIR VALUE OF FINANCIAL INSTRUMENTS
In accordance with the FASB’s authoritative accounting guidance on fair value measurements, fair value is the price (exit price) that would be received to sell an asset or paid to transfer a liability in an orderly transaction between market participants at the measurement date. The Company utilizes market data or assumptions that market participants would use in pricing the asset or liability, including assumptions about risk and the risks inherent in the inputs to the valuation technique. These inputs can be readily observable, market corroborated, or generally unobservable. The Company primarily applies the market approach for recurring fair value measurements and utilizes the best available information that maximizes the use of observable inputs and minimizes the use of unobservable inputs. The Company is able to classify fair value balances based on the observability of those inputs. The accounting guidance establishes a fair value hierarchy that prioritizes the inputs used to measure fair value. The hierarchy gives the highest priority to unadjusted quoted prices in active markets for identical assets or liabilities (Level 1 measurement) and the lowest priority to unobservable inputs (Level 3 measurement). The three levels of the fair value hierarchy defined by the relevant guidance are as follows:
Level 1 — Quoted prices are available in active markets for identical assets or liabilities as of the reporting date. Active markets are those in which transactions for the asset or liability occur in sufficient frequency and volume to provide pricing information on an ongoing basis. Level 1 primarily consists of financial instruments such as exchange-traded derivatives, listed equities and publicly traded bonds.
Level 2 — Pricing inputs are other than quoted prices in active markets included in Level 1, which are either directly or indirectly observable as of the reported date. Level 2 includes financial instruments that are valued using quoted prices in markets that are not active and those financial instruments that are valued using models or other valuation methodologies. These models are primarily industry standard models that consider various assumptions, including quoted forward prices for commodities, time value, volatility factors, and current market and contractual prices for the underlying instruments, as well as other relevant economic measures. Substantially all of these assumptions are observable in the marketplace throughout the full term of the instrument, can be derived from observable data or are supported by observable levels at which transactions are executed in the marketplace.
Level 3 — Pricing inputs include significant inputs that are generally less observable from objective sources. These inputs may be used with internally developed methodologies that result in management’s best estimate of fair value. At each balance sheet date, the Company performs an analysis of all instruments subject to authoritative accounting guidance and includes, in Level 3, all of those whose fair value is based on significant unobservable inputs. As of
December 31, 2018
and
December 31, 2017
, the Company did
no
t have any Level 3 financial assets or liabilities.
The Company’s assets and liabilities that are measured at fair value include cash equivalents, derivative instruments, assets held in a rabbi trust and a deferred compensation obligation. The Company’s cash equivalents consist of short-term U.S. government backed securities. The Company’s derivative instruments consist of interest rate swaps. The Company’s assets held in the rabbi trust consist principally of publicly available mutual funds and target date retirement funds. The Company’s deferred compensation obligation is directly related to the fair value of assets held in the rabbi trust.
The Company’s valuation techniques used to calculate the fair value of cash and cash equivalents, assets held in the rabbi trust and the deferred compensation obligation represent a market approach in active markets for identical assets that qualify as Level 1 in the fair value hierarchy. The Company’s valuation techniques used to calculate the fair value of derivative instruments represent a market approach with observable inputs that qualify as Level 2 in the fair value hierarchy.
The Company uses valuations from the issuing financial institutions for the fair value measurement of interest rate swaps. The floating-to-fixed interest rate swaps are based on the London Interbank Offered Rate (“LIBOR”) which is observable at commonly quoted intervals. The fair values are included in other current and non-current assets and liabilities in the Consolidated Balance Sheets.
70
The following table summarizes the fair value of the Company’s financial assets and (liabilities) as of
December 31, 2018
and
2017
(dollars in millions):
|
|
Fair Value Measurements Using
|
||||||||||||||||||||||
|
|
Quoted Prices in Active
Markets for Identical
Assets (Level 1)
|
Significant Other
Observable Inputs (Level 2)
|
TOTAL
|
||||||||||||||||||||
|
|
2018
|
2017
|
2018
|
2017
|
2018
|
2017
|
|||||||||||||||||
|
Cash equivalents
|
$
|
111
|
|
$
|
50
|
|
$
|
—
|
|
$
|
—
|
|
$
|
111
|
|
$
|
50
|
|
|||||
|
Rabbi trust assets
|
9
|
|
8
|
|
—
|
|
—
|
|
9
|
|
8
|
|
|||||||||||
|
Deferred compensation obligation
|
(9
|
)
|
(8
|
)
|
—
|
|
—
|
|
(9
|
)
|
(8
|
)
|
|||||||||||
|
Derivative liabilities, net
|
—
|
|
—
|
|
(9
|
)
|
—
|
|
(9
|
)
|
—
|
|
|||||||||||
|
Total
|
$
|
111
|
|
$
|
50
|
|
$
|
(9
|
)
|
$
|
—
|
|
$
|
102
|
|
$
|
50
|
|
|||||
NOTE 8. DEBT
Long-term debt and maturities are as follows (dollars in millions):
|
December 31, 2018
|
December 31, 2017
|
||||||
|
Long-term debt:
|
|||||||
|
Senior Secured Credit Facility Term B-3 Loan, variable, due 2022
|
$
|
1,148
|
|
$
|
1,176
|
|
|
|
Senior Notes, fixed 5.0%, due 2024
|
1,000
|
|
1,000
|
|
|||
|
Senior Notes, fixed 4.75%, due 2027
|
400
|
|
400
|
|
|||
|
Total long-term debt
|
$
|
2,548
|
|
$
|
2,576
|
|
|
|
Less: current maturities of long-term debt
|
—
|
|
12
|
|
|||
|
deferred financing costs, net (see NOTE 2)
|
25
|
|
30
|
|
|||
|
Total long-term debt, net
|
$
|
2,523
|
|
$
|
2,534
|
|
|
Principal payments required on long-term debt during the next five years are as follows:
|
(dollars in millions)
|
2019
|
2020
|
2021
|
2022
|
2023
|
||||||||||||||
|
Payments
|
$
|
—
|
|
$
|
8
|
|
$
|
12
|
|
$
|
1,128
|
|
$
|
—
|
|
||||
As of
December 31, 2018
, the Company had
$2,548 million
of indebtedness associated with Allison Transmission, Inc.’s (“ATI”), the Company’s wholly-owned subsidiary,
5.0%
Senior Notes due September 2024 (“
5.0%
Senior Notes”), ATI’s
4.75%
Senior Notes due October 2027 (“
4.75%
Senior Notes”) and ATI’s Senior Secured Credit Facility (“Senior Secured Credit Facility”), which consists of the Senior Secured Credit Facility Term B-3 Loan due 2022 (“Term B-3 Loan”) and the Senior Secured Credit Facility revolving credit facility due 2021 (“Revolving Credit Facility”).
The fair value of the Company’s long-term debt obligations as of
December 31, 2018
was
$2,446 million
. The fair value is based on quoted Level 2 market prices of the Company’s debt as of
December 31, 2018
. It is not expected that the Company would be able to repurchase a significant amount of its debt at these levels. The difference between the fair value and carrying value of the long-term debt is driven primarily by trends in the financial markets.
71
Senior Secured Credit Facility
In March 2017, ATI entered into an amendment with the term loan lenders under its Senior Secured Credit Facility to lower the applicable margins on the Term B-3 Loan by
0.5%
. The amendment also eliminated the minimum LIBOR floor and reduced the minimum floor applicable to the base rate from
1.75%
to
1.00%
on the Term B-3 Loan. The March 2017 amendment was treated as a modification to the Senior Secured Credit Facility under GAAP, and thus the Company recorded
$1 million
as new deferred financing fees.
In September 2017, ATI entered into a joinder agreement with the lenders under its Senior Secured Credit Facility to increase the available commitments under the Revolving Credit Facility from
$450 million
to
$550 million
. The joinder agreement was treated as a modification to the Revolving Credit Facility under GAAP.
In March 2018, ATI entered into an amendment with the term loan lenders under its Senior Secured Credit Facility to lower the applicable margins on the Term B-3 Loan by
0.25%
. The March 2018 amendment was treated as a modification to the Senior Secured Credit Facility under GAAP, and thus the Company recorded
$1 million
as new deferred financing fees.
The Senior Secured Credit Facility is collateralized by a lien on substantially all assets of the Company including all of ATI’s capital stock and all of the capital stock or other equity interest held by the Company, ATI and each of the Company’s existing and future U.S. subsidiary guarantors (subject to certain limitations for equity interests of foreign subsidiaries and other exceptions set forth in the terms of the Senior Secured Credit Facility). Interest on the Term B-3 Loan, as of
December 31, 2018
, is either (a)
1.75%
over the LIBOR or (b)
0.75%
over the greater of the prime lending rate as quoted by the administrative agent and the federal funds effective rate published by the Federal Reserve Bank of New York plus
0.50%
, provided that neither is below
1.00%
. As of
December 31, 2018
, the Company elected to pay the lowest all-in rate of LIBOR plus the applicable margin, or
4.26%
, on the Term B-3 Loan. The Senior Secured Credit Facility requires minimum quarterly principal payments on the Term B-3 Loan as well as prepayments from certain net cash proceeds of non-ordinary course asset sales and casualty and condemnation events and from a percentage of excess cash flow, if applicable. The minimum required quarterly principal payment on the Term B-3 Loan through its maturity date of September 2022 is
$3 million
; however, the Company made voluntary prepayments of the required quarterly principal payments of
$25 million
in May 2018. As of
December 31, 2018
, there had been no payments required for certain net cash proceeds of non-ordinary course asset sales and casualty and condemnation events. The remaining principal balance is due upon maturity.
The Senior Secured Credit Facility also provides a Revolving Credit Facility, net of an allowance for up to
$75 million
in outstanding letters of credit commitments. As of
December 31, 2018
, the Company had
$533 million
available under the Revolving Credit Facility, net of
$17 million
in letters of credit. Revolving Credit Facility borrowings bear interest at a variable base rate plus an applicable margin based on the Company’s total leverage ratio. Interest on the Revolving Credit Facility is either (a)
1.75%
over the LIBOR or (b)
0.75%
over the greater of the prime lending rate in effect on such day and the federal funds effective rate published by the Federal Reserve Bank of New York plus
0.50%
, provided that neither is below
1.75%
. In addition, there is an annual commitment fee, based on the Company’s total leverage ratio, on the average unused revolving credit borrowings available under the Revolving Credit Facility. Revolving Credit Facility borrowings are payable at the option of the Company throughout the term of the Senior Secured Credit Facility with the balance due in September 2021.
The Senior Secured Credit Facility requires the Company to maintain a specified maximum total senior secured leverage ratio of
5.50x
when revolving loan commitments remain outstanding on the Revolving Credit Facility at the end of a fiscal quarter. As of
December 31, 2018
, the Company had
no
amounts outstanding under the Revolving Credit Facility; however the Company would have been in compliance with the maximum total senior secured leverage ratio, achieving a
0.81x
ratio. Additionally, within the terms of the Senior Secured Credit Facility, a senior secured leverage ratio at or below
4.00x
results in the elimination of excess cash flow payments on the Senior Secured Credit Facility for the applicable year. The Senior Secured Credit Facility also provides certain financial incentives based on the Company's total leverage ratio. A total leverage ratio at or below
4.00x
results in a 25 basis point reduction to the applicable margin on the Revolving Credit Facility, and a total leverage ratio at or below
3.50x
results in a 12.5 basis point reduction to the Revolving Credit Facility commitment fee and an additional 25 basis point reduction to the applicable margin on the Revolving Credit Facility. These reductions remain in effect as long as the Company achieves a total leverage ratio at or below the related threshold. As of
December 31, 2018
, the Company’s total leverage ratio was
2.05x
.
72
In addition, the Senior Secured Credit Facility, among other things, includes customary restrictions (subject to certain exceptions) on the Company’s ability to incur certain indebtedness, grant certain liens, make certain investments, declare or pay certain dividends, or repurchase shares of the Company’s common stock. As of
December 31, 2018
, the Company was in compliance with all covenants under the Senior Secured Credit Facility.
5.0% Senior Notes
ATI may from time to time seek to retire the
5.0%
Senior Notes through cash purchases and/or exchanges for equity securities, in open market purchases, privately negotiated transactions, contractual redemptions or otherwise. Such repurchases or exchanges, if any, will depend on prevailing market conditions, liquidity requirements, contractual restrictions and other factors. The amounts involved may be material. Prior to October 1, 2019, ATI may redeem up to
40%
of the
5.0%
Senior Notes by paying a price equal to
100%
of the principal amount being redeemed plus the applicable “make-whole” premium. At any time on or after October 1, 2019, ATI may redeem some or all of the
5.0%
Senior Notes at specified redemption prices in the governing indenture.
The
5.0%
Senior Notes are unsecured and are guaranteed by each of ATI’s domestic subsidiaries that is a borrower under or guarantees the Senior Secured Credit Facility and are unconditionally guaranteed, jointly and severally, by any of ATI’s future domestic subsidiaries that are borrowers under or guarantee the Senior Secured Credit Facility. None of ATI’s domestic subsidiaries currently guarantee its obligations under the Senior Secured Credit Facility, and therefore none of ATI’s domestic subsidiaries currently guarantee the
5.0%
Senior Notes. The indenture governing the
5.0%
Senior Notes contains negative covenants restricting or limiting the Company’s ability to, among other things: incur or guarantee additional indebtedness, incur liens, pay dividends on, redeem or repurchase the Company’s capital stock, make certain investments, permit payment or dividend restrictions on certain of the Company’s subsidiaries, sell assets, engage in certain transactions with affiliates, and consolidate or merge or sell all or substantially all of the Company’s assets. As of
December 31, 2018
, the Company was in compliance with all covenants under the indenture governing the
5.0%
Senior Notes.
4.75% Senior Notes
In September 2017, ATI completed an offering of
$400 million
of
4.75%
Senior Notes. The
4.75%
Senior Notes were offered in a private placement exempt from registration under the Securities Act of 1933, as amended. The proceeds from the offering were used for general corporate purposes and to pay related transaction fees and expenses. As a result of the offering, the Company recorded approximately
$5 million
as deferred financing fees in the Consolidated Balance Sheets.
ATI may from time to time seek to retire the
4.75%
Senior Notes through cash purchases and/or exchanges for equity securities, in open market purchases, privately negotiated transactions, contractual redemptions or otherwise. Such repurchases or exchanges, if any, will depend on prevailing market conditions, liquidity requirements, contractual restrictions and other factors. The amounts involved may be material. Prior to October 1, 2020, ATI may redeem up to
40%
of the
4.75%
Senior Notes by paying a price equal to
104.75%
of the principal amount being redeemed. Prior to October 1, 2022, ATI may redeem some or all of the
4.75%
Senior Notes by paying a price equal to
100.00%
of the principal amount being redeemed, plus a “make-whole” premium. At any time on or after October 1, 2022, ATI may redeem some or all of the
4.75%
Senior Notes at specified redemption prices in the governing indenture.
The
4.75%
Senior Notes are unsecured and are guaranteed by each of ATI’s domestic subsidiaries that is a borrower under or guarantees the Senior Secured Credit Facility and are unconditionally guaranteed, jointly and severally, by any of ATI’s future domestic subsidiaries that are borrowers under or guarantee the Senior Secured Credit Facility. None of ATI’s domestic subsidiaries currently guarantee its obligations under the Senior Secured Credit Facility, and therefore none of ATI’s domestic subsidiaries currently guarantee the
4.75%
Senior Notes. The indenture governing the
4.75%
Senior Notes contains negative covenants restricting or limiting the Company’s ability to, among other things: incur or guarantee additional indebtedness, incur liens, pay dividends on, redeem or repurchase the Company’s capital stock, make certain investments, permit payment or dividend restrictions on certain of the Company’s subsidiaries, sell assets, engage in certain transactions with affiliates, and consolidate or merge or sell all or substantially all of the Company’s assets. As of
December 31, 2018
, the Company was in compliance with all covenants under the indenture governing the
4.75%
Senior Notes.
73
NOTE 9. DERIVATIVES
The Company is subject to interest rate risk related to the Senior Secured Credit Facility and enters into interest rate swaps that are based on the LIBOR to manage a portion of this exposure. The interest rate swaps are designated as cash flow hedges that qualify for hedge accounting under the hypothetical derivative method. Fair value adjustments are recorded as a component of AOCL in the Consolidated Balance Sheets. Balances in AOCL are reclassified to earnings when transactions related to the underlying risk are settled. As of
December 31, 2018
, the Company held interest rate swaps effective from September
2019
to September
2022
with notional values totaling
$250 million
and a weighted average LIBOR fixed rate of
3.01%
and interest rate swaps effective from September
2019
to September
2025
with notional values totaling
$250 million
and a weighted average LIBOR fixed rate of
3.04%
. See NOTE 7 “Fair Value of Financial Instruments” for information regarding the fair value of the Company’s interest rate swaps.
The following tabular disclosures further describe the Company’s interest rate derivatives qualifying and designated for hedge accounting and their impact on the financial condition of the Company (dollars in millions):
|
|
December 31, 2018
|
December 31, 2017
|
|||||||||
|
|
Balance Sheet Location
|
Fair Value
|
Balance Sheet Location
|
Fair Value
|
|||||||
|
Derivatives designated as hedging instruments:
|
|||||||||||
|
Interest rate swaps
|
Other current liabilities
|
$
|
(1
|
)
|
Other current liabilities
|
$
|
—
|
|
|||
|
Other non-current liabilities
|
(8
|
)
|
Other non-current liabilities
|
—
|
|
||||||
|
Total derivatives designated as hedging instruments
|
$
|
(9
|
)
|
$
|
—
|
|
|||||
The balance of derivative losses recorded in AOCL as of
December 31, 2018
and
2017
was
$9 million
and
zero
, respectively. See NOTE 16 “Accumulated Other Comprehensive Loss” for information regarding activity recorded as a component of AOCL during the year ended
December 31, 2018
. The Company had
no
derivative losses recorded in AOCL expected to be reclassified to earnings within the next twelve months as of
December 31, 2018
.
74
NOTE 10. PRODUCT WARRANTY LIABILITIES
As of
December 31, 2018
, the current and non-current product warranty liabilities were
$26 million
and
$40 million
, respectively. As of
December 31, 2017
, the current and non-current product warranty liabilities were
$22 million
and
$33 million
, respectively. Product warranty liability activities consist of the following (dollars in millions):
|
Year ended December 31, 2018
|
Year ended December 31, 2017
|
Year ended December 31, 2016
|
|||||||||
|
Beginning balance
|
$
|
55
|
|
$
|
63
|
|
$
|
79
|
|
||
|
Payments
|
(32
|
)
|
(30
|
)
|
(35
|
)
|
|||||
|
Increase in liability (warranty issued during period)
|
38
|
|
18
|
|
16
|
|
|||||
|
Net adjustments to liability
|
5
|
|
4
|
|
3
|
|
|||||
|
Ending balance
|
$
|
66
|
|
$
|
55
|
|
$
|
63
|
|
||
The adjustments to the total liability in
2018
,
2017
and
2016
, excluding the Dual Power Inverter Module (“DPIM”) as discussed below, were the result of general changes in estimates for various products and specific field action programs as additional claims data and field information became available.
Dual Power Inverter Module
During June 2007, General Motors Corporation recognized the estimated cost of replacing the DPIM used on H 40/50 EP electric hybrid systems. Certain units were falling short of their expected service life and the Company’s predecessor, Allison Transmission, an operating unit of General Motors Corporation, decided to cover repair or replacement for an extended period. The Company is responsible for the first
$12 million
of qualified cost while General Motors Company (“GM”) is responsible for the next
$34 million
of costs, with any amount over
$46 million
being shared one-third by the Company and two-thirds by GM for shipments through June 30, 2009. As of
December 31, 2018
and
2017
, the Company’s remaining DPIM liability was
$1 million
and
$4 million
, respectively, and the related receivable owed by GM to the Company was
$1 million
and
$3 million
, respectively.
NOTE 11. DEFERRED REVENUE
As of
December 31, 2018
, the current and non-current deferred revenue were
$34 million
and
$88 million
, respectively. As of
December 31, 2017
, the current and non-current deferred revenue were
$41 million
and
$75 million
, respectively. Deferred revenue activity consists of the following (dollars in millions):
|
Year ended December 31, 2018
|
Year ended December 31, 2017
|
Year ended December 31, 2016
|
|||||||||
|
Beginning balance
|
$
|
110
|
|
$
|
93
|
|
$
|
79
|
|
||
|
Increases
|
52
|
|
52
|
|
37
|
|
|||||
|
Revenue earned
|
(40
|
)
|
(29
|
)
|
(23
|
)
|
|||||
|
Ending balance
|
$
|
122
|
|
$
|
116
|
|
$
|
93
|
|
||
New authoritative accounting guidance for revenue was adopted by the Company effective January 1, 2018. The Company recorded a one-time adjustment related to sales of ETC contracts open as of the date of adoption, which decreased deferred revenue by
$6 million
as of January 1, 2018. See NOTE 3, "Revenue" for information regarding the impact of the adoption of this guidance.
Deferred revenue recorded in current and non-current liabilities related to ETC as of
December 31, 2018
were
$30 million
and
$73 million
, respectively. Deferred revenue recorded in current and non-current liabilities related to ETC as of
December 31, 2017
were
$30 million
and
$72 million
, respectively.
75
NOTE 12. OTHER INCOME (EXPENSE), NET
Other income (expense), net consists of the following (dollars in millions):
|
|
Years ended December 31,
|
||||||||||
|
|
2018
|
2017
|
2016
|
||||||||
|
Post-retirement benefit plan amendment credits
|
$
|
12
|
|
$
|
—
|
|
$
|
—
|
|
||
|
Vendor settlements
|
(4
|
)
|
(5
|
)
|
1
|
|
|||||
|
Technology-related investment expense
|
(3
|
)
|
(16
|
)
|
(1
|
)
|
|||||
|
Other
|
(2
|
)
|
(1
|
)
|
2
|
|
|||||
|
Total
|
$
|
3
|
|
$
|
(22
|
)
|
$
|
2
|
|
||
NOTE 13. OTHER CURRENT LIABILITIES
Other current liabilities consist of the following (dollars in millions):
|
As of December 31, 2018
|
As of December 31, 2017
|
||||||
|
Payroll and related costs
|
$
|
81
|
|
$
|
73
|
|
|
|
Sales allowances
|
39
|
|
34
|
|
|||
|
Accrued interest payable
|
19
|
|
19
|
|
|||
|
Vendor buyback obligation
|
15
|
|
14
|
|
|||
|
Taxes payable
|
10
|
|
10
|
|
|||
|
Defense price reduction reserve
|
9
|
|
9
|
|
|||
|
Non-trade payables
|
3
|
|
8
|
|
|||
|
Derivative liabilities
|
1
|
|
—
|
|
|||
|
Other accruals
|
20
|
|
16
|
|
|||
|
Total
|
$
|
197
|
|
$
|
183
|
|
|
76
NOTE 14. EMPLOYEE BENEFIT PLANS
The Company’s hourly defined benefit pension plan generally provides benefits of negotiated, stated amounts for each year of service as well as significant supplemental benefits for employees who retire with
30 years
of service before normal retirement age. Any difference between actual and expected returns on assets during a year and actuarial gains and losses on liabilities together with any prior service costs are charged (or credited) to income over the average remaining service lives of employees. The benefit cost components shown in the Consolidated Statements of Comprehensive Income are based upon certain data specific to the Company, actuarial assumptions that were used for accounting disclosures, and certain allocation methodologies such as population demographics.
For all hourly employees hired after May 18, 2008, the defined benefit pension plan was replaced with a defined contribution pension plan, and the company-sponsored retiree healthcare was also eliminated for those hired after May 18, 2008. The charge to expense for the hourly defined contribution pension plan was
$2 million
for each of the years ended
December 31, 2018
,
2017
and
2016
.
The Company’s salaried defined benefit plan covering salaried employees with a service date prior to January 1, 2001 is generally based on years of service and compensation history. Any difference between actual and expected returns on assets during a year and actuarial gains and losses on liabilities together with any prior service costs are charged (or credited) to income over the average remaining service lives of employees. The benefit cost components shown in the Consolidated Statements of Comprehensive Income are based upon certain data specific to the Company, actuarial assumptions that were used for accounting disclosures, and certain allocation methodologies such as population demographics.
The Company’s salaried defined contribution retirement savings plan requires the Company to match employee contributions up to certain predefined limits based upon eligible base salary. In addition to the matching contribution, the Company is required to make a contribution equal to
1%
of eligible base salary for salaried employees with a service date on or after January 1, 1993 to cover certain benefits in retirement that are different from salaried employees with a service date prior to January 1, 1993. In addition, for salaried employees with a service date on or after January 1, 2001, the Company is required to contribute to its defined contribution retirement savings plan an amount equal to
4%
of eligible base salary under the program. The charge to expense for the salaried defined contribution retirement savings plan was
$7 million
for the year ended
December 31, 2018
, and
$6 million
for each of the years ended
December 31, 2017
and
2016
.
The Company is also responsible for OPEB costs (medical, dental, vision, and life insurance) for hourly employees hired prior to May 19, 2008, excluding those employees eligible to retire at the time of the sale of the Company. Post-retirement benefit costs consist of service cost and interest cost on accrued obligations. Actuarial gains and losses on liabilities and any prior service costs are charged (or credited) to income over the average remaining service lives of employees. The benefit cost components shown in the Consolidated Statements of Comprehensive Income are based upon certain data specific to the Company, actuarial assumptions that were used for OPEB accounting disclosures, and certain allocation methodologies such as population demographics. The plan is unfunded and any future payments will be funded by the Company’s operating cash flows. As of
December 31, 2018
and
2017
, the Company had an estimated OPEB liability for hourly employees hired prior to May 19, 2008, excluding those employees eligible to retire at the time of the sale of the Company, of
$93 million
and
$102 million
, respectively.
As part of the Affordable Care Act enacted in 2010, the Company has evaluated the impact on “High-cost Health Plans” in which employers offering health plan coverage exceeding certain thresholds must pay an excise tax equal to
40%
of the value of the plan that exceeds the threshold amount. As a result of the excise tax, the Company has recorded
$2 million
in its OPEB liability as of both
December 31, 2018
and
2017
with a corresponding adjustment to AOCL, net of tax.
The Company provides contributions to certain international benefit plans; however, these contributions are not material for the periods presented.
For all pension and OPEB plans in which employees participate, costs are determined within the FASB’s authoritative accounting guidance set forth on employers’ defined benefit pensions including accounting for settlements and curtailments of defined benefit pension plans, termination of benefits and accounting for post-retirement benefits other than pensions. In accordance with the authoritative accounting guidance, the Company recognizes the funded status of its defined benefit pension plans and OPEB plan in its Consolidated Balance Sheets with a corresponding adjustment to AOCL, net of tax.
77
Information about the net periodic benefit cost (credit) and other changes recognized in AOCL for the pension and post-retirement benefit plans is as follows (dollars in millions):
|
|
Pension Plans
|
Post-retirement Benefits
|
|||||||||||||||||||||
|
|
Year ended December 31, 2018
|
Year ended December 31, 2017
|
Year ended December 31, 2016
|
Year ended December 31, 2018
|
Year ended December 31, 2017
|
Year ended December 31, 2016
|
|||||||||||||||||
|
Net Periodic Benefit Cost (Credit):
|
|||||||||||||||||||||||
|
Service cost
|
$
|
12
|
|
$
|
12
|
|
$
|
13
|
|
$
|
1
|
|
$
|
2
|
|
$
|
2
|
|
|||||
|
Interest cost
|
6
|
|
6
|
|
6
|
|
4
|
|
6
|
|
7
|
|
|||||||||||
|
Expected return on assets
|
(8
|
)
|
(7
|
)
|
(7
|
)
|
—
|
|
—
|
|
—
|
|
|||||||||||
|
Prior service credit
|
—
|
|
—
|
|
—
|
|
(13
|
)
|
(4
|
)
|
(4
|
)
|
|||||||||||
|
Net Periodic Benefit Cost (Credit)
|
$
|
10
|
|
$
|
11
|
|
$
|
12
|
|
$
|
(8
|
)
|
$
|
4
|
|
$
|
5
|
|
|||||
|
Other changes recognized in other comprehensive income:
|
|||||||||||||||||||||||
|
Prior service cost (credit)
|
$
|
—
|
|
$
|
1
|
|
$
|
(5
|
)
|
$
|
—
|
|
$
|
(73
|
)
|
$
|
—
|
|
|||||
|
Net (gain) loss
|
(2
|
)
|
8
|
|
8
|
|
(12
|
)
|
24
|
|
(11
|
)
|
|||||||||||
|
Amortizations
|
—
|
|
—
|
|
—
|
|
13
|
|
4
|
|
4
|
|
|||||||||||
|
Total recognized – other comprehensive income
|
$
|
(2
|
)
|
$
|
9
|
|
$
|
3
|
|
$
|
1
|
|
$
|
(45
|
)
|
$
|
(7
|
)
|
|||||
The components of net periodic benefit costs other than the service cost component are included in Other income (expense), net in the Consolidated Statements of Comprehensive Income.
The table below provides the weighted-average actuarial assumptions used to determine the net periodic benefit cost (credit).
|
|
Pension Plans
|
Post-retirement Benefits
|
|||||||||||||||
|
|
Year ended December 31, 2018
|
Year ended December 31, 2017
|
Year ended December 31, 2016
|
Year ended December 31, 2018
|
Year ended December 31, 2017
|
Year ended December 31, 2016
|
|||||||||||
|
Discount rate
|
3.50
|
%
|
4.10
|
%
|
4.40
|
%
|
3.60
|
%
|
4.30
|
%
|
4.60
|
%
|
|||||
|
Rate of compensation increase (salaried)
|
3.00
|
%
|
3.00
|
%
|
3.00
|
%
|
N/A
|
|
N/A
|
|
N/A
|
|
|||||
|
Expected return on assets
|
4.50
|
%
|
4.70
|
%
|
4.70
|
%
|
N/A
|
|
N/A
|
|
N/A
|
|
|||||
The table below provides the weighted-average actuarial assumptions used to determine the benefit obligations of the Company’s plans.
|
|
Pension Plans
|
Post-retirement Benefits
|
|||||||||
|
|
As of December 31,
|
||||||||||
|
|
2018
|
2017
|
2018
|
2017
|
|||||||
|
Discount rate
|
4.20
|
%
|
3.50
|
%
|
4.20
|
%
|
3.60
|
%
|
|||
|
Rate of compensation increase (salaried)
|
3.00
|
%
|
3.00
|
%
|
N/A
|
|
N/A
|
|
|||
78
The Company’s pension and OPEB costs are calculated using various actuarial assumptions and methodologies as prescribed by authoritative accounting guidance. These assumptions include discount rates, expected return on plan assets, health care cost trend rates, inflation, rate of compensation increases, mortality rates and other factors. The Company reviews all actuarial assumptions on an annual basis.
The discount rate is used to determine the present value of the Company’s benefit obligations. The Company’s discount rate is determined by matching the plans’ projected cash flows to a yield curve based on long-term, fixed income debt instruments available as of the measurement date of
December 31, 2018
.
The overall expected rate of return on plan assets is based upon historical and expected future returns consistent with the expected benefit duration of the plan for each asset group adjusted for investment and administrative fees.
Health care cost trends are used to project future post-retirement benefits payable from the Company’s plans. For the Company’s
December 31, 2018
obligations, future post-retirement medical care costs and prescription drug costs were forecasted assuming an initial annual increase of
5.20%
, decreasing to
4.50%
by the year
2036
.
As health care costs trends have a significant effect on the amounts reported, an increase and decrease of one-percentage-point would have the following effects in the year ended
December 31, 2018
(dollars in millions):
|
1% Increase
|
1% Decrease
|
||||||
|
Effect on total of service and interest cost
|
$
|
1
|
|
$
|
(1
|
)
|
|
|
Effect on post-retirement benefit obligation
|
$
|
13
|
|
$
|
(11
|
)
|
|
79
The following table provides a reconciliation of the changes in the net benefit obligations and fair value of plan assets for the years ended
December 31, 2018
,
2017
and
2016
(dollars in millions):
|
|
Pension Plans
|
Post-retirement Benefits
|
|||||||||||||||||||||
|
|
Year ended December 31, 2018
|
Year ended December 31, 2017
|
Year ended December 31, 2016
|
Year ended December 31, 2018
|
Year ended December 31, 2017
|
Year ended December 31, 2016
|
|||||||||||||||||
|
Benefit Obligations:
|
|||||||||||||||||||||||
|
Net benefit obligation at beginning of year
|
$
|
181
|
|
$
|
155
|
|
$
|
140
|
|
$
|
102
|
|
$
|
144
|
|
$
|
147
|
|
|||||
|
Service cost
|
12
|
|
12
|
|
13
|
|
1
|
|
2
|
|
2
|
|
|||||||||||
|
Interest cost
|
6
|
|
6
|
|
6
|
|
4
|
|
6
|
|
7
|
|
|||||||||||
|
Plan Amendments
|
—
|
|
1
|
|
(5
|
)
|
—
|
|
(73
|
)
|
—
|
|
|||||||||||
|
Benefits paid
|
(6
|
)
|
(7
|
)
|
(7
|
)
|
(2
|
)
|
(2
|
)
|
(1
|
)
|
|||||||||||
|
Actuarial (gain) loss
|
(16
|
)
|
14
|
|
8
|
|
(12
|
)
|
25
|
|
(11
|
)
|
|||||||||||
|
Net benefit obligation at end of year
|
$
|
177
|
|
$
|
181
|
|
$
|
155
|
|
$
|
93
|
|
$
|
102
|
|
$
|
144
|
|
|||||
|
Fair Value of Plan Assets:
|
|||||||||||||||||||||||
|
Fair value of plan assets at beginning of year
|
$
|
188
|
|
$
|
150
|
|
$
|
140
|
|
$
|
—
|
|
$
|
—
|
|
$
|
—
|
|
|||||
|
Actual return on plan assets
|
(6
|
)
|
14
|
|
6
|
|
—
|
|
—
|
|
—
|
|
|||||||||||
|
Employer contributions
|
20
|
|
31
|
|
11
|
|
2
|
|
2
|
|
1
|
|
|||||||||||
|
Benefits paid
|
(6
|
)
|
(7
|
)
|
(7
|
)
|
(2
|
)
|
(2
|
)
|
(1
|
)
|
|||||||||||
|
Fair value of plan assets at end of year
|
$
|
196
|
|
$
|
188
|
|
$
|
150
|
|
$
|
—
|
|
$
|
—
|
|
$
|
—
|
|
|||||
|
Net Funded Status
|
$
|
19
|
|
$
|
7
|
|
$
|
(5
|
)
|
$
|
(93
|
)
|
$
|
(102
|
)
|
$
|
(144
|
)
|
|||||
The Company’s OPEB plan was amended to reflect certain limitations on participants’ annual benefits that were included in the new collective bargaining agreement ratified by International Union, United Automobile, Aerospace and Agricultural Implement Workers of America (“UAW”) Local 933 in December 2017.
The Company’s pension plan assets mostly consist of diversified equity securities and diversified debt securities. The fair values of plan assets for the Company’s pension plans as of
December 31, 2018
and
2017
are as follows (dollars in millions):
|
|
Fair Value Measurements Using
|
||||||||||||||||||||||
|
|
Quoted Prices in Active
Markets for Identical
Assets (Level 1)
|
Significant Other
Observable Inputs (Level 2)
|
TOTAL
|
||||||||||||||||||||
|
|
2018
|
2017
|
2018
|
2017
|
2018
|
2017
|
|||||||||||||||||
|
Diversified debt securities
|
$
|
9
|
|
$
|
26
|
|
$
|
156
|
|
$
|
128
|
|
$
|
165
|
|
$
|
154
|
|
|||||
|
Diversified equity securities
|
20
|
|
20
|
|
8
|
|
8
|
|
28
|
|
28
|
|
|||||||||||
|
Cash equivalents
|
3
|
|
6
|
|
—
|
|
—
|
|
3
|
|
6
|
|
|||||||||||
|
Total
|
$
|
32
|
|
$
|
52
|
|
$
|
164
|
|
$
|
136
|
|
$
|
196
|
|
$
|
188
|
|
|||||
80
The Company’s investment strategy with respect to pension plan assets is to invest the assets in accordance with laws and regulations. The long-term primary objectives for the Company’s pension assets are to provide results that meet or exceed the plans’ actuarially assumed long-term rate of return without subjecting the funds to undue risk. To achieve these objectives the Company has established the following targets:
|
|
Target
|
|||||
|
Asset Category
|
Hourly
|
Salary
|
||||
|
Cash equivalents
|
2
|
%
|
2
|
%
|
||
|
Diversified equity securities
|
15
|
|
15
|
|
||
|
Diversified debt securities
|
83
|
|
83
|
|
||
|
Total
|
100
|
%
|
100
|
%
|
||
Through
2018
, the Company’s investment committee has continued to evaluate the investments and take steps toward the established targets.
The following table discloses the amounts recognized in the balance sheet and in AOCL at
December 31, 2018
and
2017
, on a pre-tax basis (dollars in millions):
|
|
Pension Plans
|
Post-retirement Benefits
|
|||||||||||||
|
|
As of December 31,
|
||||||||||||||
|
|
2018
|
2017
|
2018
|
2017
|
|||||||||||
|
Amounts Recognized in Balance Sheet:
|
|||||||||||||||
|
Noncurrent assets
|
$
|
19
|
|
$
|
7
|
|
$
|
—
|
|
$
|
—
|
|
|||
|
Current liabilities
|
—
|
|
—
|
|
(3
|
)
|
(3
|
)
|
|||||||
|
Noncurrent liabilities
|
—
|
|
—
|
|
(90
|
)
|
(99
|
)
|
|||||||
|
Total asset (liability)
|
$
|
19
|
|
$
|
7
|
|
$
|
(93
|
)
|
$
|
(102
|
)
|
|||
|
Accumulated Other Comprehensive Loss:
|
|||||||||||||||
|
Prior service credit
|
$
|
3
|
|
$
|
4
|
|
$
|
71
|
|
$
|
84
|
|
|||
|
Actuarial (loss) gain
|
(8
|
)
|
(11
|
)
|
2
|
|
(10
|
)
|
|||||||
|
Total
|
$
|
(5
|
)
|
$
|
(7
|
)
|
$
|
73
|
|
$
|
74
|
|
|||
The amounts in AOCL expected to be amortized and recognized as a component of net periodic benefit cost in
2019
are as follows (dollars in millions):
|
|
2019
|
||||||
|
|
Pension
Plans
|
Post-retirement
Benefits
|
|||||
|
Prior service credit
|
$
|
1
|
|
$
|
13
|
|
|
|
Actuarial loss
|
(1
|
)
|
—
|
|
|||
|
Total
|
$
|
—
|
|
$
|
13
|
|
|
The accumulated benefit obligation for the Company’s pension plans as of
December 31, 2018
and
2017
was
$173 million
and
$177 million
, respectively.
As of
December 31, 2018
and
2017
, the hourly defined benefit pension plan had plan assets greater than the projected benefit obligation and the accumulated benefit obligation. As of December 31, 2018 and 2017, the salary defined benefit pension plan had plan assets greater than the projected benefit obligation and accumulated benefit obligation.
81
Information about expected cash flows for the Company’s pension and post-retirement benefit plans is as follows (dollars in millions):
|
Pension
Plans
|
Post-retirement
Benefits
|
||||||
|
Employer Contributions:
|
|||||||
|
2019 expected contributions
|
$
|
—
|
|
$
|
3
|
|
|
|
Expected Benefit Payments:
|
|||||||
|
2019
|
8
|
|
3
|
|
|||
|
2020
|
10
|
|
4
|
|
|||
|
2021
|
11
|
|
4
|
|
|||
|
2022
|
12
|
|
5
|
|
|||
|
2023
|
13
|
|
5
|
|
|||
|
2024-2028
|
67
|
|
26
|
|
|||
Expected benefit payments for pension and post-retirement benefits will be paid from plan trusts or corporate assets. The Company’s funding policy is to contribute amounts annually that are at least equal to the amounts required by applicable laws and regulations or to directly fund payments to plan participants. Additional discretionary contributions will be made when deemed appropriate to meet the Company’s long-term obligation to the plans.
In June 2012, the Company established a non-qualified deferred compensation plan (“Deferred Compensation Plan”) for a select group of management. Under the terms of the plan, the Company has utilized a rabbi trust to accumulate assets to fund its promise to pay benefits under the Deferred Compensation Plan. The rabbi trust is an irrevocable trust, which restricts any use of funds (operational or otherwise) by the Company other than to pay benefits under the Deferred Compensation Plan, and prevents immediate taxation of contributed amounts. Funds are accumulated through both employee deferrals and a Company match. Funds can be invested by the employee into a diversified group of investment options, which have been selected by the Company’s investment committee, that are all categorized as Level 1 in the fair value hierarchy. The Company match resulted in
no
charge to the Consolidated Statements of Comprehensive Income for each of the years ended
December 31, 2018
,
2017
and
2016
, and the fair value of the rabbi trust plan assets and deferred compensation obligation was
$9 million
and
$8 million
as of
December 31, 2018
and
2017
, respectively.
82
NOTE 15. INCOME TAXES
Income before income taxes included the following (dollars in millions):
|
|
Years ended December 31,
|
||||||||||
|
|
2018
|
2017
|
2016
|
||||||||
|
U.S. income
|
$
|
755
|
|
$
|
491
|
|
$
|
309
|
|
||
|
Foreign income
|
50
|
|
36
|
|
32
|
|
|||||
|
Total
|
$
|
805
|
|
$
|
527
|
|
$
|
341
|
|
||
The provision for income tax expense was estimated as follows (dollars in millions):
|
|
Years ended December 31,
|
||||||||||
|
|
2018
|
2017
|
2016
|
||||||||
|
Estimated current income taxes:
|
|||||||||||
|
U.S. federal
|
$
|
94
|
|
$
|
61
|
|
$
|
2
|
|
||
|
Foreign
|
9
|
|
7
|
|
8
|
|
|||||
|
U.S. state and local
|
11
|
|
5
|
|
2
|
|
|||||
|
Total Current
|
114
|
|
73
|
|
12
|
|
|||||
|
Deferred income tax expense (credit), net:
|
|||||||||||
|
U.S. federal
|
45
|
|
(44
|
)
|
107
|
|
|||||
|
Foreign
|
—
|
|
1
|
|
—
|
|
|||||
|
U.S. state and local
|
7
|
|
(7
|
)
|
7
|
|
|||||
|
Total Deferred
|
52
|
|
(50
|
)
|
114
|
|
|||||
|
Total income tax expense
|
$
|
166
|
|
$
|
23
|
|
$
|
126
|
|
||
On December 22, 2017, the U.S. Tax Cuts and Jobs Act was enacted into law. The U.S. Tax Cuts and Jobs Act made broad and complex changes to the U.S. tax code that impact the Company, most notably a reduction of the U.S. corporate income tax rate from 35% to 21% for tax years beginning after December 31, 2017. It also included a one-time deemed repatriation tax on undistributed foreign earnings and profits.
On December 22, 2017, the United States Securities and Exchange Commission (“SEC”) issued Staff Accounting Bulletin No. 118 (“SAB 118”), which provided guidance on accounting for the tax effects of the U.S. Tax Cuts and Jobs Act. The Company recognized the income tax effects of the U.S. Tax Cuts and Jobs Act for the year ended December 31, 2017, the reporting period in which it was signed into law, in accordance with SAB 118. As of December 31, 2018, the Company has completed its accounting for the tax effects of the U.S. Tax Cuts and Jobs Act.
In accordance with SAB 118, the Company recorded a deferred tax benefit of
$157 million
related to the re-measurement of certain deferred tax assets and liabilities and
$5 million
of tax expense recorded in connection with the transition tax on the mandatory deemed repatriation of foreign earnings and profits for the year ended December 31, 2017. The total net benefit of
$152 million
was deemed a reasonable estimate of the impact of the U.S. Tax Cuts and Jobs Act for the Company as of December 31, 2017.
During the year ended December 31, 2018, the Company finalized its accounting for the enactment of the U.S. Tax Cuts and Jobs Act which resulted in a deferred tax benefit of
$160 million
related to the re-measurement of certain deferred tax assets and liabilities and
$6 million
of tax expense in connection with the transition tax on the mandatory deemed repatriation of foreign earnings and profits for a total net benefit of
$154 million
. The change in total net benefit of
$2 million
is incorporated into the Company’s income tax expense for the year ended December 31, 2018. The Company concluded that no material adjustments were required from the previous reasonable estimate related to the U.S. Tax Cuts and Jobs Act.
83
A reconciliation of the provision for income tax expense compared with the amounts at the U.S. federal statutory rate is as follows (dollars in millions):
|
|
Years ended December 31,
|
||||||||||
|
|
2018
|
2017
|
2016
|
||||||||
|
Tax at U.S. statutory income tax rate
|
$
|
169
|
|
$
|
185
|
|
$
|
120
|
|
||
|
State tax expense
|
15
|
|
10
|
|
6
|
|
|||||
|
Non-deductible expenses
|
(9
|
)
|
7
|
|
5
|
|
|||||
|
Foreign rate differential
|
(4
|
)
|
(5
|
)
|
(5
|
)
|
|||||
|
Effect of tax rate changes
|
(4
|
)
|
—
|
|
—
|
|
|||||
|
Tax credits
|
(3
|
)
|
(21
|
)
|
—
|
|
|||||
|
Valuation allowance
|
2
|
|
3
|
|
1
|
|
|||||
|
Impact related to U.S. Tax Cuts and Jobs Act
|
—
|
|
(155
|
)
|
—
|
|
|||||
|
Other adjustments
|
—
|
|
(1
|
)
|
(1
|
)
|
|||||
|
Total income tax expense
|
$
|
166
|
|
$
|
23
|
|
$
|
126
|
|
||
The effective tax rate for the year ended December 31, 2018 was
21%
, as compared with
4%
in 2017. The higher rate is principally due to the one-time tax benefit recorded in 2017 in connection with the U.S. Tax Cuts and Jobs Act.
Deferred income tax assets and liabilities as of December 31, 2018 and 2017 reflect the effect of temporary differences between amounts of assets, liabilities and equity for financial reporting purposes and the bases of such assets, liabilities and equity as measured by tax laws, as well as tax loss and tax credit carry forwards. Net deferred tax assets and liabilities are classified as non-current in the consolidated statements of financial position. As described above, the deferred tax assets and liabilities are measured based on the enacted tax rates that will apply in the years in which the temporary differences are expected to be recovered or paid.
The Company has not recognized any deferred tax liabilities associated with earnings in foreign subsidiaries, except for its subsidiaries located in China and Hong Kong, as they are intended to be permanently reinvested and used to support foreign operations. The Company has recorded a deferred tax liability of
$2 million
for the tax liability associated with the remittance of previously taxed income and unremitted earnings for its subsidiaries located in China and Hong Kong. The U.S. Tax Cuts and Jobs Act requirement of a one-time repatriation tax on foreign earnings and profits resulted in the Company recording a
$6 million
liability for the deemed repatriation to be paid to the U.S. Government. In the future, the U.S. Tax Cuts and Jobs Act provides for tax free repatriations of earnings and profits generated by foreign subsidiaries through a
100%
dividends received deduction. The remaining deferred tax liabilities, if recorded, related to unremitted earnings that are indefinitely reinvested are not material.
84
Temporary differences and carryforwards that gave rise to deferred tax assets and liabilities included the following (dollars in millions):
|
As of December 31, 2018
|
As of December 31, 2017
|
||||||
|
Deferred tax assets:
|
|||||||
|
Intangibles
|
$
|
29
|
|
$
|
35
|
|
|
|
Deferred revenue
|
24
|
|
25
|
|
|||
|
Other accrued liabilities
|
20
|
|
18
|
|
|||
|
Warranty accrual
|
14
|
|
11
|
|
|||
|
Operating loss carryforwards
|
10
|
|
12
|
|
|||
|
Sales allowances and rebates
|
8
|
|
6
|
|
|||
|
Stock-based compensation
|
5
|
|
6
|
|
|||
|
Technology-related investments
|
5
|
|
4
|
|
|||
|
Inventories
|
4
|
|
5
|
|
|||
|
Capital loss carryforwards
|
3
|
|
3
|
|
|||
|
Environmental remediation
|
3
|
|
3
|
|
|||
|
Unrealized loss on interest rate derivatives
|
1
|
|
1
|
|
|||
|
Tax credits
|
1
|
|
—
|
|
|||
|
Other
|
2
|
|
4
|
|
|||
|
Total Deferred tax assets
|
129
|
|
133
|
|
|||
|
Valuation allowances
|
(10
|
)
|
(9
|
)
|
|||
|
Deferred tax liabilities:
|
|||||||
|
Goodwill
|
(311
|
)
|
(287
|
)
|
|||
|
Trade name
|
(114
|
)
|
(96
|
)
|
|||
|
Property, plant and equipment
|
(10
|
)
|
(7
|
)
|
|||
|
Post-retirement
|
(9
|
)
|
(4
|
)
|
|||
|
Other
|
(2
|
)
|
(3
|
)
|
|||
|
Total Deferred tax liabilities
|
(446
|
)
|
(397
|
)
|
|||
|
Net Deferred tax liability
|
$
|
(327
|
)
|
$
|
(273
|
)
|
|
The estimated net operating loss carryforwards as of December 31, 2018 relate solely to U.S. state net operating loss carryforwards. Substantially all state operating loss carryforwards will not expire until 2028-2031.
Management has determined, based on an evaluation of available objective and subjective evidence, that it is more likely than not that certain foreign deferred tax assets and an anticipated capital loss carryforward will not be realized; therefore these deferred tax assets are offset with a valuation allowance of
$10 million
and
$9 million
as of December 31, 2018 and 2017, respectively.
85
In accordance with the FASB’s authoritative accounting guidance on accounting for income taxes, the Company records uncertain tax positions on the basis of a two-step process whereby (1) it is determined whether it is more likely than not that the tax position will be sustained based on the technical merits of the position and (2) for those tax positions that meet the more-likely-than-not recognition threshold, we recognize the largest amount of tax benefit that is greater than 50% likely to be realized upon ultimate settlement with the related tax authority. Based upon this process, the Company has recognized a liability for uncertain tax benefits as of December 31, 2018 and 2017. Management does not anticipate any material changes in the balance in 2019. The change in the liability for unrecognized tax benefits are as follows (dollars in millions):
|
December 31, 2016
|
$
|
2
|
|
|
Increases in unrecognized tax benefits as a result of current year activity
|
—
|
|
|
|
December 31, 2017
|
$
|
2
|
|
|
Increases in unrecognized tax benefits as a result of current year activity
|
—
|
|
|
|
December 31, 2018
|
$
|
2
|
|
|
|
|||
For the years ended December 31, 2018, 2017 and 2016, the Company recognized
no
interest and penalties in the Consolidated Statements of Comprehensive Income because either no uncertain tax positions were identified or the penalties and interest anticipated were not material in all the periods presented. The Company follows a policy of recording any interest or penalties in Income tax expense.
Management does not anticipate any significant changes in unrecognized tax benefits in 2019. There was
$2 million
as of both December 31, 2018 and 2017 of unrecognized tax benefits that, if recognized, would affect the annual effective tax rate. All of the Company's returns, once filed, will remain subject to examination by the various taxing authorities for the duration of the applicable statute of limitations (generally three years from the earlier of the date of filing or the due date of the return).
86
NOTE 16. ACCUMULATED OTHER COMPREHENSIVE LOSS
The changes in components of AOCL consisted of the following (dollars in millions):
|
Before Tax
|
Tax (Expense)
Benefit
|
After Tax
|
|||||||||
|
Balance at December 31, 2015
|
$
|
(17
|
)
|
$
|
(42
|
)
|
$
|
(59
|
)
|
||
|
Foreign currency translation
|
(6
|
)
|
—
|
|
(6
|
)
|
|||||
|
Pension and OPEB liability adjustment
|
4
|
|
(2
|
)
|
2
|
|
|||||
|
Available-for-sale securities
|
(1
|
)
|
1
|
|
—
|
|
|||||
|
Net current period other comprehensive loss
|
$
|
(3
|
)
|
$
|
(1
|
)
|
$
|
(4
|
)
|
||
|
Balance at December 31, 2016
|
$
|
(20
|
)
|
$
|
(43
|
)
|
$
|
(63
|
)
|
||
|
Foreign currency translation
|
15
|
|
—
|
|
15
|
|
|||||
|
Pension and OPEB liability adjustment
|
34
|
|
(8
|
)
|
26
|
|
|||||
|
Available-for-sale securities
|
11
|
|
(4
|
)
|
7
|
|
|||||
|
Net current period other comprehensive income
|
$
|
60
|
|
$
|
(12
|
)
|
$
|
48
|
|
||
|
Balance at December 31, 2017
|
$
|
40
|
|
$
|
(55
|
)
|
$
|
(15
|
)
|
||
|
Foreign currency translation
|
(9
|
)
|
—
|
|
(9
|
)
|
|||||
|
Pension and OPEB liability adjustment
|
1
|
|
—
|
|
1
|
|
|||||
|
Available-for-sale securities and interest rate swaps
|
(9
|
)
|
2
|
|
(7
|
)
|
|||||
|
Net current period other comprehensive loss
|
$
|
(17
|
)
|
$
|
2
|
|
$
|
(15
|
)
|
||
|
Balance at December 31, 2018
|
$
|
23
|
|
$
|
(53
|
)
|
$
|
(30
|
)
|
||
The following table shows the location in the Consolidated Statements of Comprehensive Income affected by reclassifications from AOCL (dollars in millions):
|
|
For the year ended December 31, 2016
|
||||
|
AOCL Components
|
Amount
reclassified from
AOCL
|
Affected line item in the consolidated
statements of comprehensive income
|
|||
|
Amortization of OPEB items:
|
|||||
|
Prior service credit
|
$
|
3
|
|
Cost of sales
|
|
|
Actuarial gain
|
1
|
|
Cost of sales
|
||
|
Total reclassifications, before tax
|
4
|
|
Income before income
taxes
|
||
|
Income tax expense
|
(2
|
)
|
Income tax expense
|
||
|
Total reclassifications
|
$
|
2
|
|
Net of tax
|
|
|
|
For the year ended December 31, 2017
|
||||
|
AOCL Components
|
Amount
reclassified from
AOCL
|
Affected line item in the consolidated
statements of comprehensive income
|
|||
|
Amortization of OPEB items:
|
|||||
|
Prior service credit
|
$
|
3
|
|
Cost of sales
|
|
|
1
|
|
Selling, general and
administrative
|
|||
|
Total reclassifications, before tax
|
4
|
|
Income before income
taxes
|
||
|
Income tax expense
|
(1
|
)
|
Income tax expense
|
||
|
Total reclassifications
|
$
|
3
|
|
Net of tax
|
|
87
|
|
For the year ended December 31, 2018
|
||||
|
AOCL Components
|
Amount
reclassified from
AOCL
|
Affected line item in the consolidated
statements of comprehensive income
|
|||
|
Amortization of OPEB items:
|
|||||
|
Prior service credit
|
$
|
13
|
|
Other income (expense), net
|
|
|
Total reclassifications, before tax
|
13
|
|
Income before income
taxes
|
||
|
Income tax expense
|
(3
|
)
|
Income tax expense
|
||
|
Total reclassifications
|
$
|
10
|
|
Net of tax
|
|
Prior service cost and actuarial loss are included in the computation of the Company’s net periodic benefit cost. Please see NOTE 14 “Employee Benefit Plans” for additional details.
NOTE 17. COMMITMENTS AND CONTINGENCIES
Operating Leases
The Company leases certain facilities and equipment under various operating leases. Rent expense under the non-cancelable operating leases was
$5 million
for each of the years ended
December 31, 2018
,
2017
and
2016
. Certain leases contain renewal options.
As of
December 31, 2018
, future payments under non-cancelable operating leases are as follows over each of the next five years and thereafter (dollars in millions):
|
2019
|
$
|
4
|
|
|
2020
|
3
|
|
|
|
2021
|
2
|
|
|
|
2022
|
1
|
|
|
|
2023
|
1
|
|
|
|
Thereafter
|
—
|
|
|
|
Total
|
$
|
11
|
|
Environmental Matters
The Company has an agreement with the Environmental Protection Agency to perform remedial activities at the Company’s Indianapolis, Indiana manufacturing facilities related to historical soil and groundwater contamination. As of
December 31, 2018
, the Company had a liability recorded in the amount of
$12 million
.
Claims, Disputes, and Litigation
The Company is party to various legal actions and administrative proceedings and subject to various claims arising in the ordinary course of business. These proceedings primarily involve commercial claims, product liability claims, personal injury claims and workers’ compensation claims. The Company believes that the ultimate liability, if any, in excess of amounts already provided for in the consolidated financial statements or covered by insurance on the disposition of these matters will not have a material adverse effect on the financial position, results of operations or cash flows of the Company.
88
NOTE 18. CONCENTRATION OF RISK
As of
December 31, 2018
and
2017
, the Company employed approximately
2,900
and
2,700
employees, respectively, with
90%
and
89%
, respectively, of those employees in the U.S. Approximately
59%
of the Company’s U.S. employees were represented by unions and subject to a collective bargaining agreement as of both
December 31, 2018
and
2017
. In addition, many of the hourly employees outside the U.S. are represented by various unions. The Company is currently operating under a collective bargaining agreement with UAW Local 933 that expires in November 2023.
Two
customers accounted for greater than 10% of net sales within the last three years presented.
|
|
Years ended December 31,
|
|||||||
|
% of net sales
|
2018
|
2017
|
2016
|
|||||
|
Daimler AG
|
18
|
%
|
20
|
%
|
21
|
%
|
||
|
PACCAR Inc.
|
10
|
%
|
9
|
%
|
9
|
%
|
||
No other customers accounted for more than 10% of net sales of the Company during the years ended
December 31, 2018
,
2017
or
2016
.
Three
customers accounted for greater than 10% of outstanding accounts receivable within the last two years presented.
|
% of accounts receivable
|
As of December 31, 2018
|
As of December 31, 2017
|
|||
|
Daimler AG
|
18
|
%
|
7
|
%
|
|
|
Volvo Group
|
11
|
%
|
11
|
%
|
|
|
Kirby Corporation
|
9
|
%
|
15
|
%
|
|
No other customers accounted for more than 10% of the outstanding accounts receivable as of
December 31, 2018
or
December 31, 2017
.
No supplier accounted for greater than 10% of materials purchased during the years ended
December 31, 2018
,
2017
or
2016
.
NOTE 19. CERTAIN RELATIONSHIPS AND RELATED PARTY TRANSACTIONS
Repurchase of Common Stock held by ValueAct Capital Master Fund
On February 3, 2017, the Company entered into a stock repurchase agreement with ValueAct Capital Master Fund, L.P., a related party, to repurchase
10,525,204
shares of the Company’s common stock for approximately
$363 million
. The shares were repurchased under the stock repurchase program approved by the Board of Directors in November 2016. The purchase closed on
February 8, 2017
and was funded with cash on hand and borrowings under the Revolving Credit Facility. The shares were subsequently retired.
NOTE 20. COMMON STOCK
The Company’s current stock repurchase program ("Repurchase Program") was announced on November 14, 2016 when the Board of Directors authorized the Company to repurchase up to
$1,000
million of its common stock on the open market or through privately negotiated transactions. On November 8, 2017, the Board of Directors authorized the Company to repurchase an additional
$500
million of its common stock, and on July 30, 2018, the Board of Directors authorized the Company to repurchase an additional
$500
million of its common stock, bringing the total amount authorized under the Repurchase Program to
$2,000
million. Also on July 30, 2018, the Board of Directors removed the termination date of the Repurchase Program. The timing and amount of stock purchases are subject to market conditions and corporate needs. The Repurchase Program may be modified, suspended or discontinued at any time at the Company’s discretion.
During
2018
, the Company repurchased approximately
$609 million
of its common stock under the Repurchase Program. All transactions during
2018
were settled in cash during the same period.
89
NOTE 21. EARNINGS PER SHARE
The Company presents both basic and diluted earnings per share (“EPS”) amounts. Basic EPS is calculated by dividing net income by the weighted average number of common shares outstanding during the reporting period. Diluted EPS is calculated by dividing net income by the weighted average number of common shares and common equivalent shares outstanding during the reporting period that are calculated using the treasury stock method for stock-based awards. The treasury stock method assumes that the Company uses the proceeds from the exercise of awards to repurchase common stock at the average market price during the period. The assumed proceeds under the treasury stock method include the purchase price that the grantee will pay in the future and compensation cost for future service that the Company has not yet recognized. During the years ended
December 31, 2018
,
2017
and
2016
, there were
no
outstanding stock options excluded from the diluted EPS calculation because they were anti-dilutive. Basic and diluted EPS for the full-year is calculated using the weighted average shares of common stock outstanding during the year while quarterly basic and diluted EPS is calculated using the weighted average shares of common stock outstanding during the quarter; therefore, the sum of the four quarters’ EPS may not equal full-year EPS.
The following table reconciles the numerators and denominators used to calculate basic EPS and diluted EPS (in millions, except per share data):
|
|
Years ended December 31,
|
||||||||||
|
|
2018
|
2017
|
2016
|
||||||||
|
Net income
|
$
|
639
|
|
$
|
504
|
|
$
|
215
|
|
||
|
Weighted average shares of common stock outstanding
|
133
|
|
149
|
|
168
|
|
|||||
|
Dilutive effect stock-based awards
|
1
|
|
1
|
|
1
|
|
|||||
|
Diluted weighted average shares of common stock outstanding
|
134
|
|
150
|
|
169
|
|
|||||
|
Basic earnings per share attributable to common stockholders
|
$
|
4.81
|
|
$
|
3.38
|
|
$
|
1.28
|
|
||
|
Diluted earnings per share attributable to common stockholders
|
$
|
4.78
|
|
$
|
3.36
|
|
$
|
1.27
|
|
||
90
NOTE 22. GEOGRAPHIC INFORMATION
The Company had the following net sales by country (dollars in millions):
|
|
Years ended December 31,
|
||||||||||
|
|
2018
|
2017
|
2016
|
||||||||
|
United States
|
$
|
1,922
|
|
$
|
1,614
|
|
$
|
1,277
|
|
||
|
China
|
127
|
|
62
|
|
50
|
|
|||||
|
Canada
|
104
|
|
125
|
|
115
|
|
|||||
|
Japan
|
101
|
|
75
|
|
70
|
|
|||||
|
Mexico
|
57
|
|
39
|
|
41
|
|
|||||
|
Germany
|
55
|
|
45
|
|
53
|
|
|||||
|
United Kingdom
|
55
|
|
36
|
|
28
|
|
|||||
|
France
|
40
|
|
21
|
|
16
|
|
|||||
|
Sweden
|
30
|
|
13
|
|
8
|
|
|||||
|
Netherlands
|
25
|
|
30
|
|
27
|
|
|||||
|
Other
|
197
|
|
202
|
|
155
|
|
|||||
|
Total
|
$
|
2,713
|
|
$
|
2,262
|
|
$
|
1,840
|
|
||
The Company had the following net long-lived assets by country (dollars in millions):
|
|
Years ended December 31,
|
||||||||||
|
|
2018
|
2017
|
2016
|
||||||||
|
United States
|
$
|
427
|
|
$
|
400
|
|
$
|
412
|
|
||
|
India
|
24
|
|
32
|
|
36
|
|
|||||
|
Hungary
|
11
|
|
12
|
|
11
|
|
|||||
|
Other
|
4
|
|
4
|
|
5
|
|
|||||
|
Total
|
$
|
466
|
|
$
|
448
|
|
$
|
464
|
|
||
91
NOTE 23. QUARTERLY FINANCIAL INFORMATION
The following is a summary of the unaudited quarterly results of operations. The Company believes that all adjustments considered necessary for a fair presentation in accordance with GAAP have been included (unaudited, in millions, except per share data).
|
|
Quarters ended,
|
||||||||||||||
|
|
March 31
|
June 30
|
September 30
|
December 31
|
|||||||||||
|
2018
|
|||||||||||||||
|
Net sales
|
$
|
663
|
|
$
|
711
|
|
$
|
692
|
|
$
|
647
|
|
|||
|
Gross profit
|
342
|
|
374
|
|
368
|
|
338
|
|
|||||||
|
Operating income
|
222
|
|
248
|
|
246
|
|
207
|
|
|||||||
|
Income before income taxes
|
191
|
|
222
|
|
218
|
|
174
|
|
|||||||
|
Net income
|
151
|
|
174
|
|
167
|
|
147
|
|
|||||||
|
Basic earnings per share
|
$
|
1.09
|
|
$
|
1.30
|
|
$
|
1.28
|
|
$
|
1.15
|
|
|||
|
Diluted earnings per share
|
$
|
1.08
|
|
$
|
1.29
|
|
$
|
1.27
|
|
$
|
1.14
|
|
|||
|
2017
|
|||||||||||||||
|
Net sales
|
$
|
499
|
|
$
|
580
|
|
$
|
595
|
|
$
|
588
|
|
|||
|
Gross profit
|
251
|
|
290
|
|
302
|
|
288
|
|
|||||||
|
Operating income
|
149
|
|
177
|
|
198
|
|
128
|
|
|||||||
|
Income before income taxes
|
127
|
|
146
|
|
170
|
|
84
|
|
|||||||
|
Net income
|
83
|
|
95
|
|
111
|
|
215
|
|
|||||||
|
Basic earnings per share
|
$
|
0.53
|
|
$
|
0.63
|
|
$
|
0.75
|
|
$
|
1.52
|
|
|||
|
Diluted earnings per share
|
$
|
0.52
|
|
$
|
0.63
|
|
$
|
0.75
|
|
$
|
1.51
|
|
|||
92
Allison Transmission Holdings, Inc.
Schedule I—Parent Company only Balance Sheets
(dollars in millions)
|
December 31, 2018
|
December 31, 2017
|
||||||
|
ASSETS
|
|||||||
|
Current Assets:
|
|||||||
|
Cash
|
$
|
—
|
|
$
|
—
|
|
|
|
Total Current Assets
|
—
|
|
—
|
|
|||
|
Investments in and advances to subsidiaries
|
659
|
|
689
|
|
|||
|
TOTAL ASSETS
|
$
|
659
|
|
$
|
689
|
|
|
|
LIABILITIES AND STOCKHOLDERS’ EQUITY
|
|||||||
|
Current Liabilities:
|
|||||||
|
Accounts payable
|
$
|
—
|
|
$
|
—
|
|
|
|
Total Current Liabilities
|
—
|
|
—
|
|
|||
|
Capital stock
|
1
|
|
1
|
|
|||
|
Paid in capital
|
1,788
|
|
1,758
|
|
|||
|
Treasury stock
|
—
|
|
—
|
|
|||
|
Accumulated deficit
|
(1,100
|
)
|
(1,055
|
)
|
|||
|
Accumulated other comprehensive loss, net of tax
|
(30
|
)
|
(15
|
)
|
|||
|
TOTAL LIABILITIES AND STOCKHOLDERS’ EQUITY
|
$
|
659
|
|
$
|
689
|
|
|
The accompanying note is an integral part of the Parent Company only financial statements.
93
Allison Transmission Holdings, Inc.
Schedule I—Parent Company only Statements of Comprehensive Income
(dollars in millions)
|
|
Years ended December 31,
|
||||||||||
|
|
2018
|
2017
|
2016
|
||||||||
|
Net sales
|
$
|
—
|
|
$
|
—
|
|
$
|
—
|
|
||
|
General and administrative fees
|
—
|
|
—
|
|
—
|
|
|||||
|
Total operating income
|
—
|
|
—
|
|
—
|
|
|||||
|
Other income:
|
|||||||||||
|
Equity earnings of consolidated subsidiary
|
639
|
|
504
|
|
215
|
|
|||||
|
Income before income taxes
|
639
|
|
504
|
|
215
|
|
|||||
|
Income tax expense
|
—
|
|
—
|
|
—
|
|
|||||
|
Net income
|
$
|
639
|
|
$
|
504
|
|
$
|
215
|
|
||
|
Comprehensive income
|
$
|
624
|
|
$
|
552
|
|
$
|
211
|
|
||
The accompanying note is an integral part of the Parent Company only financial statements.
94
Allison Transmission Holdings, Inc.
Schedule I—Parent Company only Statements of Cash Flows
(dollars in millions)
|
|
Years ended December 31,
|
||||||||||
|
|
2018
|
2017
|
2016
|
||||||||
|
CASH FLOWS FROM OPERATING ACTIVITIES:
|
|||||||||||
|
Net income
|
$
|
639
|
|
$
|
504
|
|
$
|
215
|
|
||
|
Deduct items included in net income not providing cash:
|
|||||||||||
|
Equity in earnings in consolidated subsidiary
|
(639
|
)
|
(504
|
)
|
(215
|
)
|
|||||
|
Net cash provided by operating activities
|
—
|
|
—
|
|
—
|
|
|||||
|
CASH FLOWS FROM INVESTING ACTIVITIES:
|
|||||||||||
|
Investments in subsidiaries
|
(22
|
)
|
(19
|
)
|
(24
|
)
|
|||||
|
Dividends
|
80
|
|
89
|
|
100
|
|
|||||
|
Net cash provided by investing activities
|
58
|
|
70
|
|
76
|
|
|||||
|
CASH FLOWS FROM FINANCING ACTIVITIES:
|
|||||||||||
|
Capital contributions
|
22
|
|
19
|
|
24
|
|
|||||
|
Dividends
|
(80
|
)
|
(89
|
)
|
(100
|
)
|
|||||
|
Net cash used in financing activities
|
(58
|
)
|
(70
|
)
|
(76
|
)
|
|||||
|
Net increase (decrease) during period
|
—
|
|
—
|
|
—
|
|
|||||
|
Cash and cash equivalents at beginning of period
|
—
|
|
—
|
|
—
|
|
|||||
|
Cash and cash equivalents at end of period
|
$
|
—
|
|
$
|
—
|
|
$
|
—
|
|
||
The accompanying note is an integral part of the Parent Company only financial statements.
95
Allison Transmission Holdings, Inc.
Schedule I—Parent Company only Footnote
NOTE 1—BASIS OF PRESENTATION
Allison Transmission Holdings, Inc. (the “Parent Company”) is a holding company that conducts all of its business operations through its subsidiaries. There are restrictions on the Parent Company’s ability to obtain funds from its subsidiaries through dividends (refer to NOTE 8 “Debt” of Notes to Consolidated Financial Statements). The entire amount of our consolidated net assets was subject to restrictions on payment of dividends at the end of
December 31, 2018
,
2017
and
2016
. Accordingly, these financial statements have been presented on a “parent-only” basis. Under a parent-only presentation, the Parent Company’s investments in its consolidated subsidiaries are presented under the equity method of accounting. These parent-only financial statements should be read in conjunction with Allison Transmission Holdings, Inc.’s audited Consolidated Financial Statements included elsewhere herein.
96
ITEM 9. Changes in and Disagreements with Accountants on Accounting and Financial Disclosure
None.
ITEM 9A. Controls and Procedures
Evaluation of Disclosure Controls and Procedures
Our management, with the participation of our Chief Executive Officer and Chief Financial Officer, evaluated the effectiveness of our disclosure controls and procedures (as defined in Rules 13a-15(e) and 15d-15(e) under the Exchange Act), as of
December 31, 2018
. In designing and evaluating the disclosure controls and procedures, management recognized that any controls and procedures, no matter how well designed and operated, can provide only reasonable assurance of achieving the desired control objectives. In addition, the design of disclosure controls and procedures must reflect the fact that there are resource constraints and that management is required to apply its judgment in evaluating the benefits of possible controls and procedures relative to their costs.
Based on the evaluation, our Chief Executive Officer and Chief Financial Officer concluded that our disclosure controls and procedures as of
December 31, 2018
, the end of the period covered by this Annual Report on Form 10-K, were effective to provide reasonable assurance that information we are required to disclose in reports that we file or submit under the Exchange Act is recorded, processed, summarized and reported within the time periods specified in the SEC rules and forms, and that such information is accumulated and communicated to our management, including our Chief Executive Officer and Chief Financial Officer, as appropriate, to allow timely decisions regarding required disclosure.
Management’s Report on Internal Control Over Financial Reporting
Our management is responsible for establishing and maintaining adequate internal control over financial reporting (as defined in Rules 13a-15(f) and 15d-15(f) under the Exchange Act). Our internal control over financial reporting is a process designed to provide reasonable assurance regarding the reliability of financial reporting and the preparation of financial statements for external purposes in accordance with generally accepted accounting principles.
Because of its inherent limitations, internal control over financial reporting may not prevent or detect misstatements. Also, projections of any evaluation of effectiveness to future periods are subject to the risk that controls may become inadequate because of changes in conditions, or that the degree of compliance with the policies or procedures may deteriorate.
Under the supervision and with the participation of our management, including our Chief Executive Officer and Chief Financial Officer, we conducted an assessment of the effectiveness of our internal control over financial reporting as of
December 31, 2018
. In making this assessment, our management used the criteria set forth by the Committee of Sponsoring Organizations of the Treadway Commission in Internal Control—Integrated Framework (2013). Based on this assessment, management concluded that our internal control over financial reporting was effective as of
December 31, 2018
. PricewaterhouseCoopers LLP, our independent registered public accounting firm, has audited the effectiveness of our internal control over financial reporting as of
December 31, 2018
. Their report is included in Part II, Item 8, “Financial Statements and Supplementary Data” in this Annual Report on Form 10-K.
Changes in Internal Control over Financial Reporting
There were no changes in our internal control over financial reporting (as defined in Rules 13a-15(f) and 15d-15(f) under the Exchange Act) during the quarter ended
December 31, 2018
that have materially affected, or are reasonably likely to materially affect, our internal control over financial reporting.
ITEM 9B. Other Information
None.
97
|
PART III.
|
ITEM 10. Directors, Executive Officers and Corporate Governance
The information required by this Item concerning our executive officers, directors and nominees for director, Audit Committee members and financial expert(s) and disclosure of delinquent filers under Section 16(a) of the Exchange Act is incorporated herein by reference from our definitive Proxy Statement for our
2019
annual meeting of stockholders which will be filed with the SEC pursuant to Regulation 14A within 120 days after the end of our last fiscal year.
Code of Business Conduct
We have adopted the Allison Code of Business Conduct that applies to all of our directors and officers and other employees, including our principal executive officer, principal financial officer and principal accounting officer. This code is publicly available through the Investor Relations section of our website at www.allisontransmission.com. We will post on the Investor Relations section of our website any amendment to the Allison Code of Business Conduct, or any grant of a waiver from a provision of the Allison Code of Business Conduct.
ITEM 11. Executive Compensation
The information required by this Item concerning remuneration of our executive officers and directors, material transactions involving such executive officers and directors and Compensation Committee interlocks, as well as the Compensation Committee Report and pay ratio disclosure, are incorporated herein by reference to our definitive Proxy Statement for our
2019
annual meeting of stockholders which will be filed with the SEC pursuant to Regulation 14A within 120 days after the end of our last fiscal year.
ITEM 12. Security Ownership of Certain Beneficial Owners and Management and Related Stockholder Matters
The information required by this Item concerning the stock ownership of management, five percent beneficial owners and securities authorized for issuance under equity compensation plans is incorporated herein by reference to our definitive Proxy Statement for our
2019
annual meeting of stockholders which will be filed with the SEC pursuant to Regulation 14A within 120 days after the end of our last fiscal year.
ITEM 13. Certain Relationships and Related Transactions, and Director Independence
The information required by this Item concerning certain relationships and related person transactions, and director independence is incorporated herein by reference to our definitive Proxy Statement for our
2019
annual meeting of stockholders which will be filed with the SEC pursuant to Regulation 14A within 120 days after the end of our last fiscal year.
ITEM 14. Principal Accounting Fees and Services
The information required by this Item concerning the fees and services of our independent registered public accounting firm and our Audit Committee actions with respect thereto is incorporated herein by reference to our definitive Proxy Statement for our
2019
annual meeting of stockholders which will be filed with the SEC pursuant to Regulation 14A within 120 days after the end of our last fiscal year.
98
|
PART IV.
|
ITEM 15. Exhibits, Financial Statement Schedules
(a)(1) Financial Statements.
The response to this item is included in Part II, Item 8 of this Annual Report on Form 10-K.
(a)(2) Financial Statement Schedules.
Schedule I – Parent Company only Balance Sheets as of the years ended
December 31, 2018
and
2017
, Schedule I – Parent Company only Statements of Comprehensive Income for the years ended
December 31, 2018
,
2017
and
2016
, Schedule I – Parent Company only Statements of Cash Flows for the years ended
December 31, 2018
,
2017
and
2016
and Schedule I – Parent Company only Footnote are included in Part II, Item 8 of this Annual Report on Form 10-K. All other schedules have been omitted because they are not required or because the information required is included in the consolidated financial statements and notes thereto.
(a)(3) Exhibits
See the response to Item 15(b) below.
99
(b) Exhibits
The following exhibits are filed as part of, or are incorporated by reference into, this Annual Report on Form 10-K:
|
Exhibit
No.
|
|
DESCRIPTION OF EXHIBIT
|
|
3.1
|
|
|
|
3.2
|
|
|
|
3.3
|
|
|
|
4.1
|
|
|
|
4.2
|
|
|
|
4.3
|
|
|
|
10.1
|
|
|
|
10.2
|
|
|
|
10.3
|
|
|
|
10.4
|
|
|
|
10.5
|
|
|
100
|
10.6
|
|
|
|
10.7
|
|
|
|
10.8
|
|
|
|
10.9*
|
|
|
|
10.10*
|
|
|
|
10.11*
|
|
|
|
10.12*
|
|
|
|
10.13*
|
|
|
|
10.14*
|
|
|
|
10.15*
|
|
|
|
10.16*
|
|
|
|
10.17*
|
|
|
101
|
10.18*
|
|
|
|
10.19*
|
|
|
|
10.20*
|
|
|
|
10.21*
|
||
|
10.22*
|
||
|
10.23*
|
|
|
|
10.24*
|
|
|
|
10.25*
|
|
|
|
10.26*
|
|
|
|
10.27*
|
|
|
|
10.28*
|
|
|
|
10.29*
|
|
|
|
14.1
|
|
|
|
21.1
|
|
|
|
23.1
|
|
|
102
|
31.1
|
|
|
|
31.2
|
|
|
|
32.1
|
|
|
|
101.INS
|
|
XBRL Instance Document
|
|
101.SCH
|
|
XBRL Taxonomy Extension Schema Document
|
|
101.CAL
|
|
XBRL Taxonomy Extension Calculation Linkbase Document
|
|
101.DEF
|
|
XBRL Taxonomy Extension Definition Linkbase Document
|
|
101.LAB
|
|
XBRL Taxonomy Extension Label Linkbase Document
|
|
101.PRE
|
|
XBRL Taxonomy Extension Presentation Linkbase Document
|
|
*
|
Indicates a management contract or compensatory plan or arrangement
|
103
ITEM 16. Form 10-K Summary
Intentionally left blank.
104
SIGNATURES
Pursuant to the requirements of Section 13 or 15(d) of the Securities Exchange Act of 1934, the registrant has duly caused this report to be signed on its behalf by the undersigned, thereunto duly authorized.
|
|
|
|
Allison Transmission Holdings, Inc.
|
|||
|
|
|
|
(Registrant)
|
|||
|
Date: February 26, 2019
|
|
|
By:
|
|
/s/ David S. Graziosi
|
|
|
|
|
|
David S. Graziosi
|
|||
|
|
|
|
President and Chief Executive Officer (Principal Executive Officer)
|
|||
Pursuant to the requirements of the Securities Exchange Act of 1934, this report has been signed below by the following persons on behalf of the registrant and in the capacities and on the dates indicated.
|
SIGNATURES
|
|
CAPACITY
|
DATE
|
|
/s/ David S. Graziosi
David S. Graziosi
|
|
Director, President and Chief Executive Officer (Principal Executive Officer)
|
February 26, 2019
|
|
/s/ G. Frederick Bohley
G. Frederick Bohley
|
|
Vice President, Chief Financial Officer and Treasurer (Principal Financial Officer and Principal Accounting Officer)
|
February 26, 2019
|
|
/s/ Lawrence E. Dewey
Lawrence E. Dewey
|
|
Chairman of the Board
|
February 26, 2019
|
|
/s/ Judy Altmaier
Judy Altmaier
|
|
Director
|
February 26, 2019
|
|
/s/ Stan A. Askren
Stan A. Askren
|
|
Director
|
February 26, 2019
|
|
/s/ David C. Everitt
David C. Everitt
|
|
Director
|
February 26, 2019
|
|
/s/ Alvaro Garcia-Tunon
Alvaro Garcia-Tunon
|
|
Director
|
February 26, 2019
|
|
/s/ William R. Harker
William R. Harker
|
|
Director
|
February 26, 2019
|
|
/s/ Carolann I. Haznedar
Carolann I. Haznedar
|
|
Director
|
February 26, 2019
|
|
/s/ Richard P. Lavin
Richard P. Lavin
|
|
Director
|
February 26, 2019
|
|
/s/ Thomas W. Rabaut
Thomas W. Rabaut
|
|
Director
|
February 26, 2019
|
|
/s/ Richard V. Reynolds
Richard V. Reynolds
|
|
Director
|
February 26, 2019
|
105
TABLE OF CONTENTS
Part IItem 1. BusinessItem 1A. Risk FactorsItem 1B. Unresolved Staff CommentsItem 2. PropertiesItem 3. Legal ProceedingsItem 4. Mine Safety DisclosuresPart IIItem 5. Market For Registrant S Common Equity, Related Stockholder Matters and Issuer Purchases Of Equity SecuritiesItem 6. Selected Financial DataItem 7. Management S Discussion and Analysis Of Financial Condition and Results Of OperationsItem 7A. Quantitative and Qualitative Disclosures About Market RiskItem 8. Financial Statements and Supplementary DataNote 1. OverviewNote 2. Summary Of Significant Accounting PoliciesNote 3. RevenueNote 4. InventoriesNote 5. Property, Plant and EquipmentNote 6. Goodwill and Other Intangible AssetsNote 7. Fair Value Of Financial InstrumentsNote 8. DebtNote 9. DerivativesNote 10. Product Warranty LiabilitiesNote 11. Deferred RevenueNote 12. Other Income (expense), NetNote 13. Other Current LiabilitiesNote 14. Employee Benefit PlansNote 15. Income TaxesNote 16. Accumulated Other Comprehensive LossNote 17. Commitments and ContingenciesNote 18. Concentration Of RiskNote 19. Certain Relationships and Related Party TransactionsNote 20. Common StockNote 21. Earnings Per ShareNote 22. Geographic InformationNote 23. Quarterly Financial InformationNote 1 Basis Of PresentationItem 9. Changes in and Disagreements with Accountants on Accounting and Financial DisclosureItem 9A. Controls and ProceduresItem 9B. Other InformationPart IIIItem 10. Directors, Executive Officers and Corporate GovernanceItem 11. Executive CompensationItem 12. Security Ownership Of Certain Beneficial Owners and Management and Related Stockholder MattersItem 13. Certain Relationships and Related Transactions, and Director IndependenceItem 14. Principal Accounting Fees and ServicesPart IVItem 15. Exhibits, Financial Statement SchedulesItem 16. Form 10-k Summary