AMBAC FINANCIAL GROUP INC
10-Ks and 10-Qs
|
|
|
|
|
|
|
|
|
|
|
|
|
|
|
|
|
|
|
|
|
|
|
|
|
|
|
|
|
|
|
|
|
|
|
|
|
|
|
|
|
|
|
|
|
|
|
|
|
|
|
|
|
|
|
|
UNITED STATES
SECURITIES AND EXCHANGE COMMISSION
Washington, D.C. 20549
|
FORM 10-K
|
|
x
|
ANNUAL REPORT PURSUANT TO SECTION 13 OR 15(d) OF THE SECURITIES
|
|
EXCHANGE ACT OF 1934
|
|
For the Fiscal Year Ended December 31, 2014
|
¨
|
TRANSITION REPORT PURSUANT TO SECTION 13 OR 15(d) OF THE SECURITIES
|
|
EXCHANGE ACT OF 1934
|
|
For the transition period from to
Commission File Number: 1-10777
|
Ambac Financial Group, Inc.
|
|
(Exact name of Registrant as specified in its charter)
|
|
Delaware
|
13-3621676
|
|
|
(State of incorporation)
|
(I.R.S. employer identification no.)
|
|
|
One State Street Plaza, New York, New York
|
10004
|
|
|
(Address of principal executive offices)
|
(Zip code)
|
|
|
212-658-7470
|
|
(Registrant’s telephone number, including area code)
|
Securities registered pursuant to Section 12(b) of the Act: None
Securities registered pursuant to Section 12(g) of the Act: None
Indicate by check mark if the registrant is a well-known seasoned issuer, as defined in Rule 405 of the Securities Act. Yes
x
No
¨
Indicate by check mark if the registrant is not required to file reports pursuant to Section 13 or 15(d) of the Act. Yes
¨
No
x
Indicate by check mark whether the Registrant: (1) has filed all reports required to be filed by Section 13 or 15(d) of the Securities Exchange Act of 1934 during the preceding 12 months (or for such shorter period that the Registrant was required to file such reports), and (2) has been subject to such filing requirements for the past 90 days. Yes
x
No
¨
Indicate by check mark whether the registrant has submitted electronically and posted on its corporate Website, if any, every Interactive Data File required to be submitted and posted pursuant to Rule 405 of Regulation S-T (§232.405 of this chapter) during the preceding 12 months (or for such shorter period that the registrant was required to submit and post such files). Yes
x
No
¨
Indicate by check mark if disclosure of delinquent filers pursuant to Item 405 of Regulation S-K is not contained herein, and will not be contained, to the best of Registrant’s knowledge, in definitive proxy or information statements incorporated by reference in Part III in this Form 10-K or any amendment to this Form 10-K.
x
Indicate by check mark whether the registrant is a large accelerated filer, an accelerated filer, a non-accelerated filer or a smaller reporting company. See definition of “accelerated filer and large accelerated filer” in Rule 12b-2 of the Exchange Act. (Check one):
|
Large accelerated filer
|
x
|
Accelerated filer
|
¨
|
Non-accelerated filer
|
¨
|
Smaller reporting company
|
¨
|
Indicate by check mark whether the registrant is a shell company (as defined in Rule 12b-2 of the Act). Yes
¨
No
x
Indicate by check mark whether the registrant has filed all documents and reports required to be filed by Section 12, 13, or 15(d) of the Securities Exchange Act of 1934 subsequent to the distribution of securities under a plan confirmed by a court. Yes
x
No
¨
The aggregate market value of voting stock held by non-affiliates of the Registrant as of the close of business on June 30, 2014 was
$1,229,020,323
. As of
February 25, 2015
, there were
45,003,598
shares of Common Stock, par value $0.01 per share, were outstanding.
Documents Incorporated By Reference
Portions of the Registrant’s proxy statement for its
2015
annual meeting of stockholders are incorporated by reference in this Form 10-K in response to Part III Items 10, 11, 12, 13, and 14.
AMBAC FINANCIAL GROUP, INC. AND SUBSIDIARIES
TABLE OF CONTENTS
|
PAGE
|
|||
|
Cautionary Statement Pursuant to the Private Securities Litigation Reform Act of 1995
|
|||
|
PART I
|
|||
|
Item 1.
|
Business
|
||
|
Introduction
|
|||
|
Financial Guaranty Segment
|
|||
|
Financial Services Segment
|
|||
|
Investments and Investment Policy
|
|||
|
Employees
|
|||
|
Item 1A.
|
Risk Factors
|
||
|
Item 1B.
|
Unresolved Staff Comments
|
||
|
Item 2.
|
Properties
|
||
|
Item 3.
|
Legal Proceedings
|
||
|
Item 4.
|
Mine Safety Disclosures
|
||
|
PART II
|
|||
|
Item 5.
|
Market for Registrant’s Common Equity, Related Stockholder Matters and Issuer Purchases of Equity Securities
|
||
|
Item 6.
|
Selected Financial Data
|
||
|
Item 7.
|
Management’s Discussion and Analysis of Financial Condition and Results of Operations
|
||
|
Company Overview
|
|||
|
Critical Accounting Policies and Estimates
|
|||
|
Results of Operations
|
|||
|
Liquidity and Capital Resources
|
|||
|
Balance Sheet
|
|||
|
Special Purpose Entities Including Variable Interest Entities
|
|||
|
Accounting Standards
|
|||
|
Ambac Assurance Statutory Basis Financial Results
|
|||
|
Ambac Assurance UK Limited Financial Results Under UK Accounting Principles
|
|||
|
Non-GAAP Financial Measures
|
|||
|
Item 7A.
|
Quantitative and Qualitative Disclosures About Market Risk
|
||
|
Item 8.
|
Financial Statements and Supplementary Data
|
||
|
Item 9.
|
Changes in and Disagreements With Accountants on Accounting and Financial Disclosure
|
||
|
Item 9A.
|
Controls and Procedures
|
||
|
Item 9B.
|
Other Information
|
||
|
PART III
|
|||
|
Item 10.
|
Directors, Executive Officers and Corporate Governance
|
||
|
Item 11.
|
Executive Compensation
|
||
|
Item 12.
|
Security Ownership of Certain Beneficial Owners and Management and Related Stockholder Matters
|
||
|
Item 13.
|
Certain Relationships and Related Transactions, and Director Independence
|
||
|
Item 14.
|
Principal Accountant Fees and Services
|
||
|
PART IV
|
|||
|
Item 15.
|
Exhibits, Financial Statement Schedules
|
||
|
Schedule I—Summary of Investments Other Than Investments in Related Parties
|
|||
|
Schedule II—Condensed Financial Information of Registrant (Parent Company Only)
|
|||
|
Schedule IV—Reinsurance
|
|||
|
SIGNATURES
|
|||
CAUTIONARY STATEMENT PURSUANT TO THE PRIVATE SECURITIES LITIGATION REFORM ACT OF 1995
In this Annual Report, we have included statements that may constitute “forward-looking statements” within the meaning of the safe harbor provisions of the Private Securities Litigation Reform Act of 1995. Words such as “estimate,” “project,” “plan,” “believe,” “anticipate,” “intend,” “planned,” “potential” and similar expressions, or future or conditional verbs such as “will,” “should,” “would,” “could,” and “may,” or the negative of those expressions or verbs, identify forward-looking statements. We caution readers that these statements are not guarantees of future performance. Forward-looking statements are not historical facts but instead represent only our beliefs regarding future events, which, may by their nature be inherently uncertain and some of which may be outside our control. These statements may relate to plans and objectives with respect to the future, among other things which may change. We are alerting you to the possibility that our actual results may differ, possibly materially, from the expected objectives or anticipated results that may be suggested, expressed or implied by these forward-looking statements. Important factors that could cause our results to differ, possibly materially, from those indicated in the forward-looking statements include, among others, those discussed under “Risk Factors” in Part I, Item 1A of this Annual Report on Form 10-K.
Any or all of management’s forward-looking statements here or in other publications may turn out to be incorrect and are based on management’s current belief or opinions. Ambac’s actual results may vary materially, and there are no guarantees about the performance of Ambac’s securities. Among events, risks, uncertainties or factors that could cause actual results to differ materially are: (1) volatility in the price of Ambac’s common stock; (2) uncertainty concerning our ability to achieve value for holders of Ambac securities, whether from Ambac Assurance Corporation (“Ambac Assurance”) or from new business opportunities; (3) dilution of current shareholder value or adverse effects on our share price resulting from the issuance of additional shares of common stock; (4) adverse effects on our share price resulting from future offerings of debt or equity securities that rank senior to our common stock; (5) potential of rehabilitation proceedings against Ambac Assurance; (6) decisions made by the rehabilitator of the Segregated Account of Ambac Assurance Corporation (the “Segregated Account”) for the benefit of policyholders that may result in material adverse consequences for Ambac’s security holders; (7) our inability to realize the expected recoveries included in our financial statements; (8) intercompany disputes or disputes with the rehabilitator of the Segregated Account; (9) our inability to monetize assets or restructure or exchange outstanding debt and insurance obligations, or the failure of any such monetization, restructuring or exchange to deliver anticipated results; (10) our results of operation may be adversely affected by events or circumstances that result in the accelerated amortization of our insurance intangible asset or impairments to goodwill; (11) increased fiscal stress experienced by issuers of public finance obligations or an increased incidence of Chapter 9 filings by municipal issuers; (12) adverse tax consequences or other costs resulting from the Segregated Account rehabilitation plan, from rules and procedures governing the payment of permitted policy claims, or from the characterization of our surplus notes as equity; (13) credit risk throughout our business, including but not limited to credit risk related to residential mortgage-backed securities, student loan and other asset securitizations, collateralized loan obligations, public finance obligations and exposures to reinsurers; (14) risks attendant to the change in composition of securities in our investment portfolio; (15) inadequacy of reserves established for losses and loss expenses; (16) the risk that our risk management policies and practices do not anticipate certain risks and/or the magnitude of potential for loss as a result of unforeseen risks; (17) changes in prevailing interest rates; (18) factors that may influence the amount of installment premiums paid to Ambac, including the Segregated Account rehabilitation proceedings; (19) default by one or more of Ambac Assurance’s portfolio investments, insured issuers or counterparties; (20) market risks impacting assets in our investment portfolio or the value of our assets posted as collateral in respect of investment agreements and interest rate swap transactions; (21) risks relating to determinations of amounts of impairments taken on investments; (22) the risk of litigation and regulatory inquiries or investigations, and the risk of adverse outcomes in connection therewith, which could have a material adverse effect on our business, operations, financial position, profitability or cash flows; (23) our inability to realize value from Ambac Assurance UK Limited; (24) system security risks; (25) market spreads and pricing on derivative products insured or issued by Ambac or its subsidiaries; (26) the risk of volatility in income and earnings, including volatility due to the application of fair value accounting; (27) changes in accounting principles or practices that may impact Ambac’s reported financial results; (28) legislative and regulatory developments; (29) operational risks, including with respect to internal processes, risk models, systems and employees, and failures in services or products provided by third parties; (30) Ambac’s financial position and the Segregated Account rehabilitation proceedings that may prompt departures of key employees and may impact our ability to attract qualified executives and employees; and (31) other risks and uncertainties that have not been identified at this time.
1
INTRODUCTION
Ambac Financial Group, Inc. (“Ambac” or the “Company”), headquartered in New York City, is a financial services holding company incorporated in the State of Delaware on April 29, 1991. On May 1, 2013 (the “Effective Date”), Ambac emerged from Chapter 11 bankruptcy protection when the Second Modified Fifth Amended Plan of Reorganization of Ambac Financial Group, Inc. (the “Reorganization Plan”) became effective. On December 26, 2013, the United States Bankruptcy Court for the Southern District of New York (the “Bankruptcy Court”) entered an order of final decree closing Ambac’s Chapter 11 case. Ambac filed a voluntary petition for relief under Chapter 11 of the United States Bankruptcy Code in the Bankruptcy Court on November 8, 2010 as a result of losses incurred since the beginning of the financial crisis in 2007. Refer to Note 1. Background and Business Description to the Consolidated Financial Statements included in Part II, Item 8 in this Form 10-K for further discussion of Ambac’s bankruptcy.
Ambac’s primary goal is to maximize shareholder value through executing the following key strategies:
|
•
|
Increasing the value of its investment in Ambac Assurance Corporation ("Ambac Assurance") by actively managing its assets and liabilities with a focus on maximizing risk-adjusted investment portfolio returns and mitigating or remediating losses on poorly performing insured transactions through executing policy commutations, repurchasing liabilities at a discount, pursuing recoveries of losses through litigation and the exercise of contractual and legal rights, restructuring transactions, and other means; and
|
|
•
|
Selectively exploring opportunities to grow and diversify Ambac, which may include the development or acquisition of financial services businesses such as advisory, asset servicing, asset management, and/or insurance.
|
As part of its asset/liability management strategy, Ambac Assurance is considering the possibility of entering into transactions whereby it would monetize certain assets and/or restructure or exchange its outstanding debt and insurance obligations.
Opportunities for remediating losses on poorly performing insured transactions depend on market conditions, including the perception of Ambac Assurance’s creditworthiness, the structure of the underlying risk and associated policy, as well as other factors. Ambac Assurance's ability to commute policies or purchase liabilities may be limited by available liquidity or other factors, including regulatory restrictions.
Although we are exploring new business opportunities for Ambac, no assurance can be given that we will be able to identify or execute acquisitions or develop any new business. In addition, there can be no assurance that we will be able to generate or obtain the financial and other resources that may be required to finance the acquisition or development of any new business. Due to these factors, as well as uncertainties relating to the ability of Ambac Assurance to deliver value to Ambac, the value of our securities is speculative. For additional risks and uncertainties concerning Ambac, please refer to Part I, Item 1A in this Form 10-K.
Ambac has two reportable business segments: Financial Guarantee and Financial Services.
Ambac’s Financial Guarantee business segment is conducted through its primary operating subsidiary, Ambac Assurance and its wholly owned subsidiary Ambac Assurance UK Limited (“Ambac UK”), both of which have been in runoff since 2008. Insurance policies insured by Ambac Assurance and Ambac UK generally guarantee payment when due of the principal and interest on the obligation guaranteed. Ambac Assurance also has another wholly-owned financial guarantee subsidiary, Everspan Financial Guarantee Corp. (“Everspan”), which has been in runoff since its acquisition in 1997. The deterioration of Ambac Assurance’s financial condition resulting from losses in its insured portfolio since 2007 has prevented Ambac Assurance and Ambac UK from being able to write new business. An inability to write new business has and will continue to negatively impact Ambac’s future operations and financial results. Ambac Assurance’s ability to pay dividends and, as a result, Ambac’s liquidity, have been significantly restricted by the deterioration of Ambac Assurance’s financial condition, by the rehabilitation of the Segregated Account (defined below) and by the terms of the Settlement Agreement, dated as of June 7, 2010 (the "Settlement Agreement"), by and among Ambac Assurance, Ambac Credit Products LLC (“ACP”), Ambac and certain counterparties to credit default swaps with ACP that were guaranteed by Ambac Assurance. Ambac Assurance is also restricted in its ability to pay dividends pursuant to the terms of its Auction Market Preferred Shares. It is highly unlikely that Ambac Assurance will be able to make dividend payments to Ambac for the foreseeable future. Refer to "Dividend Restrictions, Including Contractual Restrictions" below and Note 9 . Insurance Regulatory Restrictions to the Consolidated Financial Statements included in Part II, Item 8 in this Form 10-K, for more information on dividend payment restrictions.
In March 2010, Ambac Assurance established a segregated account pursuant to Wisconsin Stat. §611.24(2) (the “Segregated Account”) to segregate certain segments of Ambac Assurance’s liabilities. The Office of the Commissioner of Insurance for the State of Wisconsin (“OCI” (which term shall be understood to refer to such office as regulator of Ambac Assurance and to refer to the Commissioner of Insurance for the State of Wisconsin as rehabilitator of the Segregated Account (the “Rehabilitator”), as the context requires)) commenced rehabilitation proceedings in the Wisconsin Circuit Court for Dane County (the “Rehabilitation Court”) with respect to the Segregated Account (the “Segregated Account Rehabilitation Proceedings”) in order to permit the OCI to facilitate an orderly run-off and/or settlement of the liabilities allocated to the Segregated Account pursuant to the provisions of the Wisconsin Insurers Rehabilitation and Liquidation Act. Ambac Assurance is not, itself, in rehabilitation proceedings. The execution of Ambac’s strategy to increase the value of its investment in Ambac Assurance is subject to the authority of the Rehabilitator to control the management of the Segregated Account. In exercising such authority, the Rehabilitator will act for the benefit of policyholders, and will not take into account the interests of Ambac. Similarly, by operation of the contracts executed in connection
2
with the establishment, and subsequent rehabilitation, of the Segregated Account, the Rehabilitator retains rights to oversee and approve certain actions taken by or in respect of Ambac Assurance. Refer to Note 1. Background and Business Description to the Consolidated Financial Statements included in Part II, Item 8 in this Form 10-K, for more information on the Segregated Account.
Ambac’s Financial Services business segment is operated by subsidiaries of Ambac Assurance. This segment provides financial and investment products, including investment agreements, funding conduits and interest rate swaps, principally to the clients of its financial guarantee business. Ambac Assurance insured all of the obligations of its financial services subsidiaries. The financial services businesses are in active runoff, which is being effectuated by means including transaction terminations, settlements, assignments and scheduled amortization of contracts. The Financial Services business also maintains interest rate derivatives to mitigate exposure to floating rate insured obligations in the Financial Guarantee segment.
Our Internet address is www.ambac.com. We make available free of charge, through the investor relations section of our web site, annual reports on Form 10-K, quarterly reports on Form 10-Q and current reports on Form 8-K, and any amendments to those reports, filed or furnished pursuant to Section 13(a) or 15(d) of the Securities Exchange Act of 1934, as amended, as well as proxy statements, as soon as reasonably practicable after we electronically file such material with, or furnish it to, the U.S. Securities and Exchange Commission. Our Investor Relations Department can be contacted at Ambac Financial Group, Inc., One State Street Plaza, New York, New York 10004, Attn: Investor Relations, telephone: 212-208-3222. The reference to our website address does not constitute inclusion or incorporation by reference of the information contained on our website in this Form 10-K or other filings with the SEC, and the information contained on our website is not part of this document.
Financial information concerning our business segments for each of
2014
,
2013
and
2012
is set forth in “Management’s Discussion and Analysis of Financial Condition and Results of Operations,” “Quantitative and Qualitative Disclosures About Market Risk,” and the Consolidated Financial Statements and the Notes thereto, included elsewhere in this Form 10-K.
FINANCIAL GUARANTEE SEGMENT
The Financial Guarantee segment includes insurance policies and credit derivative contracts. Generally, financial guarantees provide an unconditional and irrevocable guarantee which protects the holder of a debt obligation against non-payment when due. Pursuant to such guarantees, Ambac Assurance and its subsidiaries make payments if the obligor responsible for making payments fails to do so when scheduled. Credit derivatives permit certain counterparties to assert mark-to-market termination claims; however, the assertion of such mark-to-market claims has been enjoined by the Rehabilitation Court. See discussion of “Ambac Assurance Liquidity” in Part II, Item 7 included in this Form 10-K for further information.
Ambac’s financial guarantee insurance policies and credit derivative contracts expose the Company to the direct credit risk of the assets and/or obligor supporting the guaranteed obligation. In addition, insured transactions expose Ambac to indirect risks that may increase our overall risk, such as credit risk separate from, but correlated with, our direct credit risk, market, model , economic, natural disaster, and mortality or other non-credit type risks.
Ambac Assurance derives financial guarantee revenues from: (i) premiums earned from insurance contracts, net of reinsurance; (ii) net investment income; (iii) revenue from credit derivative transactions; (iv) net realized gains and losses from sales of investment securities; and (v) amendment and consent fees. Financial guarantee expenditures include (i) loss and commutation payments for credit exposures that have experienced significant credit deterioration and/or default, net of reinsurance; (ii) loss-related expenses, including those relating to the remediation of problem credits, and (iii) operating expenses. See “Management’s Discussion and Analysis of Financial Condition and Results of Operations” included in Part II, Item 7 in this Form 10-K for further information. Premiums for financial guarantees were received either upfront (typical of public finance obligations) or on an installment basis from the cash flows generated by the underlying assets (typical of structured finance obligations). Despite not underwriting new business, Ambac continues to collect premiums on its existing portfolio of guarantees that pay premiums on an installment basis.
Risk Management
Ambac’s Asset Liability Management Committee (“ALCO”) is a multidisciplinary committee with the objective to implement and foster an enterprise wide culture and approach to liquidity management, asset valuation, hedging, and risk remediation. Members of ALCO include the Chief Executive Officer, Chief Financial Officer and senior managers from investment management, capital markets and risk management. ALCO has scheduled monthly meetings and will also meet on an ad hoc basis to consider, for example, the commutation of distressed financial guarantee exposures.
The Risk Management group is primarily responsible for the development, implementation and oversight of loss mitigation strategies, surveillance and remediation of the insured financial guarantee portfolio (including through the pursuit of recoveries in respect of paid claims and commutations of policies). These activities are integral to Ambac’s strategy of mitigating losses on poorly performing transactions. As a consequence of the Segregated Account Rehabilitation Proceedings, the Rehabilitator retains operational control and decision-making authority with respect to all matters related to the Segregated Account, including surveillance, remediation and loss mitigation. The Rehabilitator operates the Segregated Account through a management services contract executed between Ambac Assurance and the Segregated Account pursuant to which the Risk Management group and other personnel provide surveillance, remediation and loss mitigation services to the Segregated Account. Furthermore, by virtue of the contracts executed between Ambac Assurance and the Segregated Account, the Rehabilitator retains the discretion to oversee and approve certain actions taken by Ambac Assurance in respect of assets and liabilities that have not been allocated to the Segregated Account.
3
Refer to Note 1. Background and Business Description to the Consolidated Financial Statements included in Part II, Item 8 in this Form 10-K, for more information on the contracts between Ambac Assurance and the Segregated Account. As such, the following discussion of Ambac’s risk management practices is qualified by reference to the Rehabilitator’s exercise of its discretion to alter or eliminate any of these risk management practices.
Ambac’s Risk Management group has an organizational structure designed around the two major areas of focus: Portfolio Risk Management and Analysis and Credit Risk Management. As a result of the recent credit and economic environment, Ambac heightened its surveillance efforts on all exposures, focusing on the identification of credits and asset types across the portfolio that were likely to experience increased stress or potential for losses. The senior managers within the risk management groups report directly to Ambac Assurance's Chief Executive Officer and regularly inform and update the Audit Committees of the Board of Directors of Ambac and Ambac Assurance with respect to risk-related topics in the insured portfolio.
Portfolio Risk Management and Analysis ("PRM")
This group’s focus is on remediation, loss mitigation, risk reduction and surveillance. Proactive credit remediation can help to reduce exposure and/or reduce risk in the insured portfolio by securing rights and remedies, both of which help to mitigate losses in the event of default. The emphasis on reducing risk is centered on reducing enterprise-wide exposure on a prioritized basis.
PRM personnel perform periodic surveillance reviews of exposures according to a schedule based on the risk profile of the guaranteed obligations or as necessitated by specific credit events or other macro-economic variables. Risk-adjusted surveillance strategies have been developed for each bond type with review periods and scope of review based upon each bond type’s risk profile. The risk profile is assessed regularly in response to our own experience and judgments or external factors such as the economic environment and industry trends. Monitoring activities are designed to detect deterioration in credit quality or changes in the economic, regulatory or political environment which could adversely impact the portfolio. Active surveillance enables PRM to track single credit migration and industry credit trends. The focus of the surveillance review is to assess performance, identify credit trends and recommend appropriate credit classifications, ratings and changes to a transaction or bond type’s review period. If a problem is detected, the group focuses on loss mitigation by recommending appropriate action and working with the issuer, trustee, bond counsel, servicer and other interested parties in an attempt to remediate the problem and minimize Ambac Assurance’s exposure to potential loss. Those credits that are either in default or have developed problems that eventually may lead to a default or claim payment are tracked closely by the appropriate surveillance team, senior risk managers and discussed at regularly scheduled meetings with Credit Risk Management (see discussion following in “Credit Risk Management”). In some cases, PRM will engage workout experts or attorneys and other consultants with appropriate expertise in the targeted loss mitigation area to assist management in examining the underlying contracts or collateral, providing industry specific advice and/or executing strategies.
In structured transactions, including structured public finance transactions, Ambac Assurance often is the control party as a result of insuring the transaction’s senior class or tranche. The control party may direct specified parties, usually the trustee, to take or not take certain actions following contractual defaults or trigger events. Control rights and the scope of direction and remedies vary considerably among our insured transactions. Because Ambac Assurance is party to and/or has certain rights in documents supporting transactions in the insured portfolio, Ambac Assurance frequently receives requests for amendments, waivers and consents (“AWCs”). As discussed below under “Credit Risk Management,” Ambac Assurance’s risk management personnel review, analyze and process all requests for AWCs. As a part of the Segregated Account Rehabilitation Proceedings, the Rehabilitation Court enjoined certain actions by other parties to preserve Ambac Assurance’s control rights that could otherwise have lapsed or been compromised.
Surveillance for collateral dependent transactions, including, but not limited to, residential mortgage-backed securities (“RMBS”), asset-backed securities (“ABS”) and student loan transactions, focuses on review of the underlying asset cash flows and, if applicable, the performance of servicers or collateral managers. Ambac Assurance generally receives periodic reporting of transaction performance from issuers or trustees. Risk analysts review these reports to monitor performance and, if necessary, seek legal or accounting advice to assure that reporting and application of cash flows comply with transaction requirements.
Cross-functional teams have been established by senior risk managers in PRM to promote the active mitigation and/or targeted remediation of the insured portfolio. Examples of such teams include teams of professionals focused on (i) the review and enforcement of contractual representations and warranties in RMBS policies, (ii) RMBS servicing oversight and (iii) the analysis and prioritization of policies to target and execute risk reduction and commutation strategies. The establishment and purview of cross-functional teams is targeted to address our highest risk exposures. Members of such teams work with both internal and external experts in the pursuit of risk reduction on all fronts.
The RMBS servicing oversight team focuses on servicer oversight and remediation. Analysts monitor the performance of servicers through a combination of (i) regular reviews of servicer performance; (ii) compliance certificates received from servicer management; (iii) independent rating agency information; (iv) a review of servicer financial information; and (v) onsite servicing diligence. Servicer performance reviews typically include a review of collateral performance, including comparisons against benchmarks, as well as the processes of collection, default management, and loss mitigation. Ambac Assurance may require a back-up servicer or require “term-to-term” servicing which provides for limited, renewable servicing terms in order to provide greater flexibility regarding the servicing arrangements of a particular transaction.
In some transactions, Ambac Assurance has the right to direct a transfer of servicing to an alternative servicer, subject to certain conditions. The decision to exercise this right is made based on various factors, including an assessment of the performance of the existing servicer as outlined above, and an assessment of whether a transfer of servicing may improve the performance of the collateral and reduce risk to Ambac Assurance.
4
Ambac Assurance assesses potential transferee servicers through on-site servicer reviews and reviews of servicer financial information. Accordingly, Ambac Assurance has developed relationships with preferred servicers in the residential mortgage backed sector. Preferred servicers are selected through a formalized servicer review process that determines, among other key factors, the servicer’s ability and willingness to actively manage intense and proven loss mitigation activities on RMBS. Ambac Assurance may decide to exercise its rights to direct the transfer of servicing to a preferred servicer where such rights are available. The transfer of servicing is done with the objectives of (i) minimizing losses and distress levels by deploying targeted and enhanced loss mitigation programs; (ii) increasing visibility to Ambac Assurance of all servicing activities that impact overall deal performance; (iii) better aligning the servicer’s financial interest to the performance of the underlying deal through the utilization of performance based incentives; and (iv) reducing the risk of servicer underperformance due to servicer financial difficulty.
. Ambac Assurance believes that the improved loss mitigation activities, alignment of interests and close monitoring of servicers constitute credible means of minimizing risks and losses related to insured RMBS.
A team of professionals has also been established to focus on recoveries from sponsors where Ambac Assurance believes that a material breach of representations and warranties has occurred with respect to certain RMBS policies. The team monitors monthly performance of the RMBS insured portfolio and uses criteria to determine which transactions to pursue with regard to such recoveries. The team engages experienced consultants to perform the re-underwriting of loan files and consult with internal and external legal counsel with regard to loan putbacks as well as settlement and litigation strategies (refer to Note 8. Financial Guarantee Insurance Contracts to the Consolidated Financial Statements included in Part II, Item 8 in this Form 10-K for further discussion on this topic).
The risk restructuring group focuses on the analysis, implementation and execution of commutation and related claims reduction or defeasance strategies primarily for policies allocated to the Segregated Account. Analysts evaluate the estimated timing and severity of projected policy claims as well as the potential impact of other loss mitigation strategies in order to target and prioritize policies, or portions thereof, for commutation, refinancing or other claims reduction or defeasance strategies. For targeted policies, analysts will engage with bondholders, issuers and other economic stakeholders to negotiate, structure, and execute such strategies.
Credit Risk Management ("CRM")
CRM manages the decision process for all material matters that affect credit exposures within the insured portfolio. While PRM is responsible for the credit analysis and the recommendation and execution of credit remediation strategies, CRM provides a forum for independent assessments and sign-offs and drives consistency and timeliness. The scope of credit matters under the purview of CRM includes material amendments, waivers and consents, remediation plans, credit review scheduling, adverse credit classification and below investment grade rating designations, adversely classified credit reviews, sector reviews, and overall portfolio review. The decision process may involve a review of structural, legal, political and credit issues and also includes determining the proper level of approval, which varies based on the nature and materiality of the matter. Decisions that also have material asset, liability, and liquidity implications, such as commutations and buybacks also require ALCO approval of such asset, liability and liquidity implications. Please refer to Note 2. Basis of Presentation and Significant Accounting Policies to the Consolidated Financial Statements included in Part II, Item 8 in this Form 10-K for further discussion of the various credit classifications.
Adversely Classified Credit Review
Credits that are either in default or have developed problems that eventually may lead to a default are tracked closely by the appropriate PRM surveillance team and discussed at meetings with CRM. Adversely classified credit meetings include members of CRM, PRM and legal, as necessary. As part of the review, relevant information, along with the plan for corrective actions and a reassessment of the credit’s rating and credit classification is considered. Internal and/or external counsel generally review the documents underlying any problem credit and, if applicable, an analysis is prepared outlining Ambac Assurance’s rights and potential remedies, the duties of all parties involved and recommendations for corrective actions. Ambac Assurance also meets with relevant parties to the transaction as necessary. The review schedule for adversely classified credits is tailored to the remediation plan to track and prompt timely action and proper internal and external resourcing. A summary of developments regarding adversely classified credits and credit trends is also provided to Ambac’s and Ambac Assurance’s Board of Directors no less than on a quarterly basis.
The insured portfolio contains exposures that are correlated and/or concentrated. Ambac’s surveillance includes identifying these types of exposures and identifying the risks that would or could trigger credit deterioration across the related exposures. When such risks occur, adverse credit classification may be warranted across many of the correlated and/or concentrated exposures. This is the case with student loans and RMBS, for example. In the past, our not for profit healthcare and our leveraged lease exposures experienced periods of stress arising from their concentrated and/or correlated risks. In the future, Ambac’s portfolio may be subject to similar credit deterioration arising from concentrated and/or correlated risks. Examples of other such risks that could impact our portfolio, and that our surveillance is designed to monitor include the impact of potential municipal bankruptcy contagion or large scale domestic military cutbacks on our military housing portfolio or event risk such as natural disasters or other regional stresses. Most such risks cannot be predicted, and may materialize unexpectedly or develop rapidly. Although our surveillance allows us to connect the event and stress to the related exposures and assign an adverse credit classification and estimate losses across the affected credits, when necessary, we may not have adequate resources or contractual rights and remedies to mitigate loss arising from such risks.
5
Amendment, Waiver and Consent Review / Approval
The decision to approve or reject AWCs is based upon certain credit factors, such as the issuer’s ability to repay the bonds and the bond’s security features and structure. Members of Ambac Assurance’s PRM group review, analyze and process all requests for AWCs. All AWCs are initially screened for materiality in the surveillance groups. Non-material AWCs require the approval of at least a PRM surveillance analyst and a portfolio risk manager. Material AWCs are within the purview of CRM, as noted above. For material AWCs, CRM has established minimum requirements that may be modified to require more or varied approvals depending upon the matter’s complexity, size or other characteristics.
Ambac Assurance assigns internal credit ratings to individual exposures as part of the AWC process and at surveillance reviews. These internal credit ratings, which represent Ambac Assurance’s independent judgments, are based upon underlying credit parameters consistent with the exposure type.
Financial Guarantees in Force
Financial guarantee products were sold in three principal markets: U.S. public finance, U.S. structured finance and international finance. The following table provides a breakdown of guaranteed net par outstanding by market sector at
December 31, 2014 and 2013
. Net par exposures within the U.S. public finance market include capital appreciation bonds which are reported at the par amount at the time of issuance of the insurance policy. Guaranteed net par outstanding includes the exposures of policies that insure variable interest entities (“VIEs”) consolidated in accordance with ASC Topic 810,
Consolidation.
Guaranteed net par outstanding excludes the exposures of policies that insure bonds which have been refunded or pre-refunded:
|
December 31,
|
|||||||
|
($ in millions)
|
2014
|
2013
|
|||||
|
Public Finance
|
$
|
93,448
|
|
$
|
116,062
|
|
|
|
Structured Finance
|
26,334
|
|
31,412
|
|
|||
|
International Finance
|
24,952
|
|
31,618
|
|
|||
|
Total net par outstanding
|
$
|
144,734
|
|
$
|
179,092
|
|
|
Included in the above net par exposures at
December 31, 2014 and 2013
are
$1,530
and
$2,776
, respectively, of exposures that were executed in the form of credit derivatives, primarily collateralized loan exposures. See Part II, Item 7, “Management’s Discussion and Analysis of Financial Condition and Results of Operations” and Item 8, “Financial Statements and Supplementary Data” for further discussion of credit derivative exposures.
U.S. Public Finance Insured Portfolio
Ambac’s portfolio of U.S. public finance exposures is
$93,448 million
, representing
65%
of Ambac’s net par outstanding as of
December 31, 2014
and a
19%
reduction
from the amount outstanding at
December 31, 2013
. This
reduction
in exposure was mainly due to normal exposure runoff in addition to early terminations, primarily related to lease and tax-backed exposures. While Ambac’s U.S. public finance portfolio consists predominantly of municipal bonds such as general and revenue obligations and lease and tax-backed obligations of state and local government entities, the portfolio also comprises a wide array of non-municipal types of bonds, including financings for not-for-profit entities and transactions with public and private elements, which generally finance infrastructure, housing and other public interests. See Note 7. Financial Guarantees in-Force to the Consolidated Financial Statements, included in Part II, Item 8 in this Form 10-K for exposures by bond type.
Municipal bonds are generally supported directly or indirectly by the issuer’s taxing authority or by public sector fees and assessments which may or may not be specifically pledged. Risk factors in these transactions derive from the municipal issuer, including its fiscal management, politics, and economic position, as well as its ability and willingness to continue to pay their debt service while undergoing severe stress. Municipal bankruptcy, while still uncommon, has increased, exposing Ambac to the risk of liquidity claims and ultimate losses if issuers cannot successfully adjust their liabilities without impairing debt creditors.
Not-for-profit transactions are generally supported by the not-for-profit entities’ net revenues and may also include specific pledges, liens and/or mortgages. The entity typically serves a well-defined market and promulgates a public purpose mission. These transactions may afford Ambac contractual protections such as financial covenants and control rights in the event of issuer breaches and defaults. Risk factors in these transactions derive from the creditworthiness of the issuer, including but not limited to its financial condition, leverage, management, business mix, competitive position, industry and socioeconomic trends, government programs, etc. Examples of these types of transactions include not-for-profit hospitals, universities, charities, associations and museums.
Public/private transactions are generally structured to achieve their targeted public interest objective without direct support from the public sector. Some examples of this type of financing include affordable housing, private education, and privatized military and student housing. Protections within these financings provided to Ambac usually include the strength of the financed asset’s essentiality and public purpose, financial covenants, collateral and control rights. Risk factors include financial underperformance, event risk and a shift in the asset’s mission or essentiality. One example of this type of financing is U.S. military housing. Ambac insures approximately $6.1 billion of privatized military housing debt. The debt was issued to finance the construction and/or renovation of housing units for military personnel and their families on domestic U.S. military bases. Debt service is not directly paid or guaranteed by the U.S. Government. Rather, the bonds are serviced from the cash flow generated by
6
rental payments deposited by the military directly into lockbox accounts as part of each service personnel’s Basic Allowance for Housing (BAH). Collateral for these transactions includes the BAH payments as well as an interest in the ground lease. Risk factors affecting these transactions include the ongoing base essentiality, military deployments, the U.S. government’s commitment to fund the BAH, the marketability/attractiveness of the on-base housing units versus off base housing, construction completion, environmental remediation, utility and other operating costs, and housing management.
Certain issuers in our public finance portfolio have issued floating rate debt, which may introduce interest rate risk to Ambac Assurance. Refer to Auction Rate Securities and Variable Rate Demand Obligation Exposures below for further discussion.
The table below shows Ambac’s ten largest U.S. public finance exposures, by repayment source, as a percentage of total financial guarantee net par outstanding at
December 31, 2014
:
|
($ in millions)
|
Ambac
Ratings
(1)
|
Net Par
Outstanding
|
% of Total
Net Par
Outstanding
|
|||||
|
California State - GO
|
A
|
$
|
2,090
|
|
1.4
|
%
|
||
|
New Jersey Transportation Trust Fund Authority-Transportation System
|
A-
|
1,868
|
|
1.3
|
%
|
|||
|
Massachusetts School Building Authority, MA, Sales Tax Revenue
|
AA
|
1,224
|
|
0.8
|
%
|
|||
|
Massachusetts Commonwealth-GO
|
AA
|
1,182
|
|
0.8
|
%
|
|||
|
NYS Thruway Authority, Highway & Bridge Revenue
|
AA-
|
1,112
|
|
0.8
|
%
|
|||
|
Puerto Rico Sales Tax Financing Corporation
(2)
|
BIG
|
805
|
|
0.6
|
%
|
|||
|
Washington State - GO
|
AA
|
764
|
|
0.5
|
%
|
|||
|
Puerto Rico Highways & Transportation Authority, Transportation Revenue
(2)
|
BIG
|
712
|
|
0.5
|
%
|
|||
|
New York Convention Center Development Corporation, Hotel Fee Revenue
|
A-
|
650
|
|
0.4
|
%
|
|||
|
Chicago, IL - GO
|
BBB+
|
642
|
|
0.4
|
%
|
|||
|
Total
|
$
|
11,049
|
|
7.6
|
%
|
|||
|
(1)
|
Internal credit ratings are provided solely to indicate the underlying credit quality of guaranteed obligations based on the view of Ambac Assurance. In cases where Ambac Assurance has insured multiple tranches of an issue with varying internal ratings, or more than one obligation of an issuer with varying internal ratings, a weighted average rating is used. Ambac Assurance credit ratings are subject to revision at any time and do not constitute investment advice. Ambac Assurance, or one of its affiliates, has guaranteed the obligations listed and may also provide other products or services to the issuers of these obligations for which Ambac Assurance may have received premiums or fees. “BIG” denotes credits deemed below investment grade.
|
|
(2)
|
Ambac Assurance has total net par outstanding to various Puerto Rico exposures with a total par of
$2,437
. Puerto Rico net par outstanding includes capital appreciation bonds which are reported at the par amount at the time of issuance of the related insurance policy.
|
U.S. Structured Finance Portfolio
Ambac’s portfolio of U.S. structured finance exposures is
$26,334 million
, representing
18%
of Ambac’s net par outstanding as of
December 31, 2014
and a
16%
reduction
from the amount outstanding at
December 31, 2013
. This reduction in exposure was the result of normal exposure runoff, primarily related to residential mortgage-backed policies, in addition to terminations of student loan and asset backed policies. Insured exposures include securitizations of mortgage loans, home equity loans, student loans, leases, operating assets, collateralized debt obligations ("CDO"), collateralized loan obligations (“CLO”), and other asset-backed financings, in each case where the majority of the underlying collateral risk is situated in the United States. Additionally, Ambac’s structured finance insured portfolio encompasses both secured and unsecured debt issued by investor-owned utilities. Included within the operating asset sector are securitizations of aircraft, shipping containers, rail car fleets and other assets. See Note 7. Financial Guarantees in-Force to the Consolidated Financial Statements, included in Part II, Item 8 included in this Form 10-K, for exposures by bond type as of
December 31, 2014
.
Structured finance exposures generally entail three forms of risks: (i) asset risk, which relates to the amount and quality of the underlying assets; (ii) structural risk, which relates to the extent to which the transaction’s legal structure and credit support provide protection from loss; and (iii) servicer risk, which is the risk that poor performance at the servicer or manager level contributes to a decline in cash flow available to the transaction. Ambac Assurance seeks to mitigate and manage these risks through its risk management practices.
Structured securities are usually designed to help protect the investors and, therefore, the guarantor from the bankruptcy or insolvency of the entity that originated the underlying assets as well as from the bankruptcy or insolvency of the servicer of those assets. The servicer of the assets is typically responsible for collecting cash payments on the underlying assets and forwarding such payments, net of servicing fees, to a trustee for the benefit of the issuer. One potential issue is whether the sale of the assets by the originator to the issuer would be upheld in the event of the bankruptcy or insolvency of the originator and whether the servicer of the assets may be permitted or stayed from remitting to investors cash collections held by it or received by it after the servicer or the originator becomes subject to bankruptcy or insolvency proceedings. Another potential issue is whether the originator sold ineligible assets to the securitization transaction that subsequently deteriorated, and, if so, whether the originator has the willingness or financial wherewithal to meet its contractual obligations to repurchase those assets out of the transaction. Structural protection in a transaction, such as control rights that are typically held by the senior note holders, or guarantor in insured transactions, will determine the extent to which underlying asset performance can be influenced upon non-performance to improve the revenues available to cover debt service.
7
The following table presents the top five servicers by net par outstanding at
December 31, 2014
for U.S. structured finance exposures:
|
Servicer
($ in millions)
|
Bond Type
|
Net Par
Outstanding
|
% of Total
Net Par
Outstanding
|
|||||
|
Bank of America N.A.
|
Mortgage-backed
|
$
|
3,205
|
|
2.2
|
%
|
||
|
Specialized Loan Servicing, LLC
|
Mortgage-backed
|
3,011
|
|
2.1
|
%
|
|||
|
Pennsylvania Higher Education Assistance Agency
|
Student Loan
|
2,251
|
|
1.6
|
%
|
|||
|
Ocwen Loan Servicing, LLC
|
Mortgage-backed
|
1,826
|
|
1.3
|
%
|
|||
|
Wells Fargo Bank
|
Mortgage-backed
|
1,586
|
|
1.1
|
%
|
|||
The table below shows Ambac’s ten largest structured finance transactions, as a percentage of total financial guarantee net par outstanding at
December 31, 2014
:
|
($ in millions)
|
Bond Type
|
Ambac
Rating
(1)
|
Net Par
Outstanding
|
% of Total
Net Par
Outstanding
|
||||||
|
Ballantyne Re Plc
(2)
|
Structured Insurance
|
BIG
|
$
|
900
|
|
0.6
|
%
|
|||
|
Wachovia Asset Securitization Issuance II, LLC 2007-HE2
(3)
|
Home Equity Loan
|
BIG
|
853
|
|
0.6
|
%
|
||||
|
The National Collegiate Student Loan Trust 2007-4
(3)
|
Student Loan
|
BIG
|
714
|
|
0.5
|
%
|
||||
|
Timberlake Financial, LLC
|
Structured Insurance
|
BBB-
|
608
|
|
0.4
|
%
|
||||
|
Wachovia Asset Securitization Issuance II, LLC 2007-HE1
(3)
|
Home Equity Loan
|
BIG
|
602
|
|
0.4
|
%
|
||||
|
Progress Energy Carolinas, Inc
|
Investor Owned Utility
|
A-
|
558
|
|
0.4
|
%
|
||||
|
Local Insight Media Finance LLC
|
Asset Securitizations
|
BIG
|
489
|
|
0.3
|
%
|
||||
|
Niagara Mohawk Power Corporation
|
Investor Owned Utility
|
A
|
414
|
|
0.3
|
%
|
||||
|
Option One Mortgage Loan Trust 2007-FXD1
(3)
|
Home Equity Loan
|
BIG
|
397
|
|
0.3
|
%
|
||||
|
CenterPoint Energy, Inc.
|
Investor Owned Utility
|
BBB+
|
376
|
|
0.3
|
%
|
||||
|
Total
|
$
|
5,911
|
|
4.1
|
%
|
|||||
|
(1)
|
Internal credit ratings are provided solely to indicate the underlying credit quality of guaranteed obligations based on the view of Ambac Assurance, and for Ambac UK related transactions, based on the view of Ambac UK. Ambac UK rates their transactions using the same rating definitions as Ambac Assurance. In cases where Ambac Assurance or Ambac UK has insured multiple tranches of an issue with varying internal ratings, or more than one obligation of an issuer with varying internal ratings, a weighted average rating is used. Ambac Assurance and Ambac UK credit ratings are subject to revision at any time and do not constitute investment advice. Ambac Assurance, or one of its affiliates, has guaranteed the obligations listed and may also provide other products or services to the issuers of these obligations for which Ambac may have received premiums or fees. “BIG” denotes credits deemed below investment grade.
|
|
(2)
|
Insurance policy issued by Ambac UK.
|
|
(3)
|
Ambac Assurance has allocated this transaction to the Segregated Account.
|
International Finance Insured Portfolio
Ambac’s portfolio of international finance insured exposures is
$24,952 million
, representing
17%
of Ambac’s net par outstanding as of
December 31, 2014
and a
21%
reduction
from the amount outstanding at
December 31, 2013
. This reduction in exposure was primarily the result of terminations of asset-backed and transportation policies, exposure runoff and the impact of the strengthening of the US dollar. Ambac’s international finance insured exposures include a wide array of obligations in the international markets, including infrastructure financings, asset-securitizations, CDOs, utility obligations, and whole business securitizations (e.g. securitizations of substantially all of the operating assets of a corporation). Ambac has minimal insured exposure remaining related to emerging markets. See Note 7. Financial Guarantees in-Force to the Consolidated Financial Statements, included in Part II, Item 8 included in this Form 10-K, for exposures by bond type as of
December 31, 2014
.
When underwriting transactions in the international markets, Ambac considered the specific risks related to the particular country and region that could impact the credit of the issuer. These risks include the legal and political environment, capital markets dynamics, foreign exchange issues and the degree of governmental support. Ambac continues to assess these risks through its ongoing risk management.
Ambac UK, which is regulated in the United Kingdom (“UK”), had been Ambac Assurance’s primary vehicle for directly issuing financial guarantee policies in the UK and the European Union with $21,015 million net par outstanding at
December 31, 2014
. Geographically, Ambac UK’s exposures are principally in the UK and continental Europe. The portfolio of insured exposures underwritten by Ambac UK is financially supported exclusively by the assets of Ambac UK and no capital support arrangements are in place with any other Ambac affiliate. See
Additional Insured Portfolio Information - European Union
for further details of non-UK exposures.
8
The table below shows our ten largest international finance transactions as a percentage of total financial guarantee net par outstanding at
December 31, 2014
. Except where noted, all international finance transactions included in the table below are insured by Ambac UK:
|
($ in millions)
|
Country-Bond Type
|
Ambac
Rating
(1)
|
Net Par
Outstanding
|
% of Total
Net Par
Outstanding
|
||||||
|
Mitchells & Butlers Finance plc-UK Pub Securitisation
|
UK-Asset Securitizations
|
A+
|
$
|
1,868
|
|
1.3
|
%
|
|||
|
National Grid Electricity Transmission
|
UK-Utility
|
A-
|
1,221
|
|
0.8
|
%
|
||||
|
Aspire Defense Finance plc
|
UK-Infrastructure
|
BBB+
|
1,132
|
|
0.8
|
%
|
||||
|
Capital Hospitals plc
(2)
|
UK-Infrastructure
|
BBB
|
1,035
|
|
0.7
|
%
|
||||
|
Telereal Securitisation plc
|
UK-Asset Securitizations
|
AA
|
1,026
|
|
0.7
|
%
|
||||
|
Channel Link Enterprises
|
UK-Infrastructure
|
BBB-
|
929
|
|
0.6
|
%
|
||||
|
Posillipo Finance II S.r.l.
|
Italy-Sub-Sovereign
|
BBB
|
899
|
|
0.6
|
%
|
||||
|
Anglian Water
|
UK-Utility
|
A-
|
852
|
|
0.6
|
%
|
||||
|
Ostregion Investmentgesellschaft NR 1 SA
(2)
|
Austria-Infrastructure
|
BIG
|
841
|
|
0.6
|
%
|
||||
|
National Grid Gas
|
UK-Utility
|
A-
|
787
|
|
0.5
|
%
|
||||
|
Total
|
$
|
10,590
|
|
7.3
|
%
|
|||||
|
(1)
|
Internal credit ratings are provided solely to indicate the underlying credit quality of guaranteed obligations based on the view of Ambac Assurance, and for Ambac UK related transactions, based on the view of Ambac UK. Ambac UK rates their transactions using the same rating definitions as Ambac Assurance. In cases where Ambac Assurance or Ambac UK has insured multiple tranches of an issue with varying internal ratings, or more than one obligation of an issuer with varying internal ratings, a weighted average rating is used. Ambac Assurance and Ambac UK credit ratings are subject to revision at any time and do not constitute investment advice. Ambac Assurance, or one of its affiliates, has guaranteed the obligations listed and may also provide other products or services to the issuers of these obligations for which Ambac may have received premiums or fees. “BIG” denotes credits deemed below investment grade.
|
|
(2)
|
A portion of this transaction is insured by an insurance policy issued by Ambac Assurance.
|
Additional Insured Portfolio Information
CDO and CLO
CDO and CLO transactions involve the securitization of a portfolio of corporate bonds, corporate loan obligations and/or asset-backed securities. These transactions are included in either the US structured finance market or the international finance market dependent upon the geographic characteristics of the risk. The majority of these exposures are executed through credit derivatives. Ambac’s outstanding CDO and CLO exposures are comprised of the following types as of
December 31, 2014 and 2013
:
|
December 31,
|
|||||||||||||
|
Business Mix by Net Par
($ in billions)
|
2014
|
2013
|
|||||||||||
|
Net Par
|
Percentage
|
Net Par
|
Percentage
|
||||||||||
|
High yield corporate
|
$
|
550
|
|
63
|
%
|
$
|
1,356
|
|
79
|
%
|
|||
|
Market value CDOs
|
113
|
|
13
|
%
|
64
|
|
4
|
%
|
|||||
|
Other
|
207
|
|
24
|
%
|
299
|
|
17
|
%
|
|||||
|
Total
|
$
|
870
|
|
100
|
%
|
$
|
1,719
|
|
100
|
%
|
|||
Average Life of Insured Portfolio
Ambac Assurance underwrote and priced financial guarantees based on the assumption that the guarantees would remain in force until the maturity of the underlying bonds. Ambac Assurance estimates that the average life of its guarantees on par in force at
December 31, 2014
is approximately 11 years. The average life is determined by applying a weighted average calculation, using the remaining years to expected maturity of each guaranteed bond, and weighting them on the basis of the remaining net par guaranteed. Except for RMBS policies, no assumptions are made for non-contractual reductions, refundings or terminations of insured issues. RMBS policies incorporate assumptions on expected voluntary and involuntary prepayments over the remaining life of the insured obligation.
9
Issue Size
Ambac Assurance’s financial guarantee exposure in the U.S. public finance market reflects the historical participation across the whole range of deal sizes including those with an original par amount of less than $50 million. U.S. structured finance and international finance transactions generally involved larger transaction sizes. The following table sets forth the distribution of Ambac’s guaranteed portfolio as of
December 31, 2014
with respect to the current size of each guaranteed issue:
|
Net Par Amount
as of December 31, 2014 |
||||||||||||
|
Current Par Amount
($ in millions)
|
Number of
Issues
|
% of Total
Number of Issues
|
Amount
Outstanding
|
% of Total
|
||||||||
|
Less than $10 million
|
4,488
|
|
67
|
%
|
$
|
12,716
|
|
9
|
%
|
|||
|
$10—less than $50 million
|
1,572
|
|
23
|
%
|
34,788
|
|
24
|
%
|
||||
|
$50—$250 million
|
548
|
|
8
|
%
|
52,914
|
|
36
|
%
|
||||
|
Greater than $250 million
|
107
|
|
2
|
%
|
44,316
|
|
31
|
%
|
||||
|
Total
|
6,715
|
|
100
|
%
|
$
|
144,734
|
|
100
|
%
|
|||
Geographic Area
The following table sets forth the geographic distribution of Ambac Assurance’s insured exposure as of
December 31, 2014
:
|
Geographic Area
($ in millions)
|
Net Par
Amount
Outstanding
|
% of Total Net
Par Amount
Outstanding
|
||||
|
Domestic:
|
||||||
|
California
|
$
|
20,744
|
|
14.3
|
%
|
|
|
New York
|
9,245
|
|
6.4
|
%
|
||
|
Florida
|
6,805
|
|
4.7
|
%
|
||
|
Texas
|
6,095
|
|
4.2
|
%
|
||
|
New Jersey
|
5,464
|
|
3.8
|
%
|
||
|
Illinois
|
4,326
|
|
3.0
|
%
|
||
|
Massachusetts
|
4,154
|
|
2.9
|
%
|
||
|
Colorado
|
3,574
|
|
2.5
|
%
|
||
|
Pennsylvania
|
3,082
|
|
2.1
|
%
|
||
|
Puerto Rico
(1)
|
2,437
|
|
1.7
|
%
|
||
|
Mortgage and asset-backed
(2)
|
15,021
|
|
10.4
|
%
|
||
|
Other domestic
|
38,835
|
|
26.8
|
%
|
||
|
Total Domestic
|
119,782
|
|
82.8
|
%
|
||
|
International:
|
||||||
|
United Kingdom
|
17,998
|
|
12.4
|
%
|
||
|
Australia
|
2,168
|
|
1.5
|
%
|
||
|
Italy
|
1,415
|
|
1.0
|
%
|
||
|
Austria
|
841
|
|
0.6
|
%
|
||
|
New Zealand
|
459
|
|
0.3
|
%
|
||
|
Internationally diversified
(3)
|
1,225
|
|
0.8
|
%
|
||
|
Other international
|
846
|
|
0.6
|
%
|
||
|
Total International
|
24,952
|
|
17.2
|
%
|
||
|
Total
|
$
|
144,734
|
|
100.0
|
%
|
|
|
(1)
|
Puerto Rico net par outstanding includes capital appreciation bonds which are reported at the par amount at the time of issuance of the related insurance policy.
|
|
(2)
|
Mortgage and asset-backed obligations includes guarantees with multiple locations of risk within the United States and is primarily comprised of residential mortgage and commercial asset-backed securitizations.
|
|
(3)
|
Internationally diversified may include components of U.S. exposure.
|
Other European Union Exposures (“EU”)
Ambac's international exposures are principally in the United Kingdom; however, we also have exposures with credit risk based in various other EU member states, including Austria, France, Germany, Ireland, Italy and Spain. The company also has limited indirect exposures to these countries through its CDO and CLO debt obligations. These obligations were structured to limit exposures to any given obligor and any given non-US country or region. Several of these countries have experienced significant economic, fiscal and/or political strains such that the likelihood
10
of default on such obligations is higher than when the policies were underwritten. The Company’s exposures, net of reinsurance, to these countries are shown in the following table:
|
($ in Millions)
|
Austria
|
France
|
Germany
|
Ireland
|
Italy
|
Spain & Portugal
|
Total
|
|||||||||||||||||||||
|
Sub-sovereign
|
$
|
—
|
|
$
|
37
|
|
$
|
—
|
|
$
|
—
|
|
$
|
899
|
|
$
|
—
|
|
$
|
936
|
|
|||||||
|
Infrastructure / operating ABS
|
841
|
|
50
|
|
—
|
|
—
|
|
516
|
|
—
|
|
1,407
|
|
||||||||||||||
|
Structured insurance
|
—
|
|
—
|
|
—
|
|
128
|
|
—
|
|
—
|
|
128
|
|
||||||||||||||
|
Investor-owned utility
|
—
|
|
—
|
|
64
|
|
—
|
|
—
|
|
51
|
|
115
|
|
||||||||||||||
|
Total
|
$
|
841
|
|
$
|
87
|
|
$
|
64
|
|
$
|
128
|
|
$
|
1,415
|
|
$
|
51
|
|
$
|
2,586
|
|
|||||||
|
Total below investment grade
|
$
|
841
|
|
$
|
—
|
|
$
|
64
|
|
$
|
—
|
|
$
|
—
|
|
$
|
51
|
|
$
|
956
|
|
|||||||
Ambac does not guarantee any sovereign bonds of the above EU countries. However, the exposures classified as sub sovereign may be impacted should there be continued adverse financial developments in the EU. Those exposures classified as infrastructure/operating asset backed are concession based where the underlying assets independently generate cash flow without operational reliance on the sovereign. Of the three below investment grade exposures, two are investor-owned utilities, one wind farm and one mini hydro-electric plant both of which are undergoing restructuring processes designed to address their performance issues. The other below investment grade exposure is a road transaction, where performance has been poorer than anticipated due to lower than forecast traffic volumes, however performance is improving. Below investment grade is defined as those exposures with a credit rating below BBB-.
Ambac UK also has exposure to Channel Link Enterprises, which is an infrastructure transaction connecting the United Kingdom with France; such exposure is classified within the United Kingdom in the
Geographic Area
section above.
Exposure Currency
The table below shows the distribution by currency of Ambac Assurance’s insured exposure as of
December 31, 2014
:
|
Currency
($ in millions)
|
Net Par Amount
Outstanding in
Base Currency
|
Net Par Amount
Outstanding in
U.S. Dollars
|
|||||
|
U.S. Dollars
|
$
|
122,022
|
|
$
|
122,022
|
|
|
|
British Pounds
|
£
|
11,350
|
|
17,687
|
|
||
|
Euros
|
€
|
2,149
|
|
2,600
|
|
||
|
Australian Dollars
|
A$
|
2,405
|
|
1,966
|
|
||
|
New Zealand Dollars
|
NZ$
|
589
|
|
459
|
|
||
|
Total
|
$
|
144,734
|
|
||||
Ratings Distribution
The following tables provide a rating distribution of guaranteed total net par outstanding based upon internal Ambac Assurance credit ratings at
December 31, 2014 and 2013
and a distribution by bond type of Ambac Assurance’s below investment grade net par exposures at
December 31, 2014 and 2013
. Below investment grade is defined as those exposures with an internal credit rating below BBB-:
|
December 31,
|
|||||
|
Ambac Rating
(1)
|
2014
|
2013
|
|||
|
AAA
|
<1%
|
|
<1%
|
|
|
|
AA
|
19
|
|
20
|
|
|
|
A
|
42
|
|
43
|
|
|
|
BBB
|
22
|
|
20
|
|
|
|
Below investment grade
|
17
|
|
17
|
|
|
|
Total
|
100
|
%
|
100
|
%
|
|
|
(1)
|
Internal credit ratings are provided solely to indicate the underlying credit quality of guaranteed obligations based on the view of Ambac Assurance, and for Ambac UK related transactions, based on the view of Ambac UK. In cases where Ambac Assurance or Ambac UK has insured multiple tranches of an issue with varying internal ratings, or more than one obligation of an issuer with varying internal ratings, a weighted average rating is used. Ambac Assurance and Ambac UK credit ratings are subject to revision at any time and do not constitute investment advice.
|
11
Summary of Below Investment Grade Exposure:
|
Bond Type
|
Net Par Outstanding - December 31,
|
||||||
|
($ in millions)
|
2014
|
2013
|
|||||
|
Public Finance:
|
|||||||
|
Tax-backed
(1)
|
$
|
2,512
|
|
$
|
1,887
|
|
|
|
Housing
(2)
|
841
|
|
732
|
|
|||
|
General obligation
(1)
|
564
|
|
363
|
|
|||
|
Transportation
|
453
|
|
519
|
|
|||
|
Health care
|
27
|
|
30
|
|
|||
|
Other
|
1,293
|
|
1,291
|
|
|||
|
Total Public Finance
|
5,690
|
|
4,822
|
|
|||
|
Structured Finance:
|
|||||||
|
Residential mortgage-backed and home equity—first lien
|
7,003
|
|
8,092
|
|
|||
|
Residential mortgage-backed and home equity—second lien
|
5,466
|
|
6,440
|
|
|||
|
Student loans
|
3,092
|
|
4,223
|
|
|||
|
Structured Insurance
|
1,037
|
|
1,648
|
|
|||
|
Mortgage-backed and home equity—other
|
299
|
|
346
|
|
|||
|
Other
|
536
|
|
547
|
|
|||
|
Total Structured Finance
|
17,433
|
|
21,296
|
|
|||
|
International Finance:
|
|||||||
|
Other
|
2,214
|
|
3,702
|
|
|||
|
Total International Finance
|
2,214
|
|
3,702
|
|
|||
|
Total
|
$
|
25,337
|
|
$
|
29,820
|
|
|
|
(1)
|
Tax-backed includes $2,187 and $1,430 of Puerto Rico net par at
December 31, 2014 and 2013
, respectively. General obligation includes $250 and $0 of Puerto Rico net par at
December 31, 2014 and 2013
, respectively. Puerto Rico net par outstanding includes capital appreciation bonds which are reported at the par amount at the time of issuance of the related insurance policy.
|
|
(2)
|
Includes $609 and $486 of military housing net par at
December 31, 2014 and 2013
, respectively.
|
The decrease in below investment grade exposures are primarily due to (i) reductions to residential mortgage-backed securities during the year as a result of both prepayments by issuers and claims presented to Ambac Assurance, (ii) improvements on a structured insurance transaction resulting in an upgrade to investment grade, (iii) issuer principal payments on student loans and (iv) a refinancing of an international asset securitization, partially offset by an increase due to deterioration in Puerto Rico and military housing exposures.
U.S. residential mortgage-backed securities exposure
Ambac has exposure to the U.S. mortgage market primarily through direct financial guarantees of RMBS, including transactions that contain risks to first and second liens. Ambac classifies its insured first-lien RMBS exposure principally into two broad credit risk classes: mid-prime (including Alt-A, interest only, and negative amortization) and sub-prime. Mid-prime loans were typically made to borrowers who had stronger credit profiles relative to sub-prime loans, but weaker than prime loans. Compared with mid-prime loans, sub-prime loans typically had higher loan-to-value ratios, reflecting the greater difficulty that sub-prime borrowers have in making down payments and the propensity of these borrowers to extract equity during refinancing. The mid-prime category includes:
|
•
|
Loans with specific payment features that afforded borrowers the option to have lower payments in the early years with potential resets after several years. For example, so-called interest only loans have monthly payments comprised of interest but no principal. So called negative amortization loans permit borrowers to defer interest and principal in the early years and then make higher payments in the period after the reset. Both types may also have lower interest rates in the early years. Increases in monthly payments, commonly called payment shock, raise the probability of delinquencies and defaults given the decline in house prices that has caused many borrowers’ loan balances to exceed their homes’ market value.
|
|
•
|
Loans backed by borrowers who typically did not meet standard agency guidelines for documentation requirement, property type or loan-to-value ratio. These are typically higher-balance loans made to individuals who might have past credit problems that were not severe enough to warrant “sub-prime” classification, or borrowers who chose not to obtain a prime mortgage due to documentation requirements.
|
Ambac's second lien insured RMBS transactions are collateralized predominantly by second-lien mortgage loans such as closed-end seconds and home equity lines of credit. A second-lien mortgage loan is a type of loan in which the borrower uses the equity in their home as collateral and the second-lien loan is subordinate to the first-lien loan outstanding on the home. The borrower is obligated to make monthly payments on both their first and second-lien loans. If the borrower defaults on the payments due under these loans and the property is subsequently liquidated, the liquidation proceeds are first utilized to pay off the first-lien loan (as well as costs due the servicer) and any remaining funds are applied to pay off the second-lien loan. As a result of this subordinate position to the first-lien loan, second-lien loans carry a significantly higher severity in the event of a loss, typically at or above 100% in the current housing market.
12
The following tables provide, by vintage and type current net par outstanding of Ambac’s U.S. RMBS book of business:
|
Total Net Par Outstanding - December 31, 2014
|
|||||||||||||||
|
Year of Issue
($ in millions)
|
Second Lien
|
First-lien
Sub-prime
|
First-lien
Mid-prime
|
Other
(1)
|
|||||||||||
|
1998-2001
|
$
|
23
|
|
$
|
450
|
|
$
|
2
|
|
$
|
293
|
|
|||
|
2002
|
14
|
|
391
|
|
39
|
|
8
|
|
|||||||
|
2003
|
13
|
|
565
|
|
227
|
|
127
|
|
|||||||
|
2004
|
625
|
|
329
|
|
408
|
|
15
|
|
|||||||
|
2005
|
724
|
|
767
|
|
1,394
|
|
49
|
|
|||||||
|
2006
|
2,042
|
|
518
|
|
700
|
|
75
|
|
|||||||
|
2007
|
2,070
|
|
398
|
|
1,252
|
|
168
|
|
|||||||
|
Total
|
$
|
5,511
|
|
$
|
3,418
|
|
$
|
4,022
|
|
$
|
735
|
|
|||
|
% of Total RMBS Portfolio
|
40.2
|
%
|
25.0
|
%
|
29.4
|
%
|
5.4
|
%
|
|||||||
|
% of Related Par Outstanding rated below investment grade
(2)
|
99.2
|
%
|
91.7
|
%
|
95.6
|
%
|
43.9
|
%
|
|||||||
|
Total Net Par Outstanding - December 31, 2013
|
|||||||||||||||
|
Year of Issue
($ in millions)
|
Second Lien
|
First-lien
Sub-prime
|
First-lien
Mid-prime
|
Other
(1)
|
|||||||||||
|
1998-2001
|
$
|
42
|
|
$
|
509
|
|
$
|
3
|
|
$
|
354
|
|
|||
|
2002
|
23
|
|
445
|
|
45
|
|
12
|
|
|||||||
|
2003
|
19
|
|
653
|
|
269
|
|
146
|
|
|||||||
|
2004
|
833
|
|
365
|
|
488
|
|
23
|
|
|||||||
|
2005
|
876
|
|
870
|
|
1,608
|
|
53
|
|
|||||||
|
2006
|
2,305
|
|
588
|
|
827
|
|
87
|
|
|||||||
|
2007
|
2,429
|
|
441
|
|
1,518
|
|
194
|
|
|||||||
|
Total
|
$
|
6,527
|
|
$
|
3,871
|
|
$
|
4,758
|
|
$
|
869
|
|
|||
|
% of Total RMBS Portfolio
|
40.7
|
%
|
24.2
|
%
|
29.7
|
%
|
5.4
|
%
|
|||||||
|
% of Related Par Outstanding rated below investment grade
(2)
|
98.7
|
%
|
91.9
|
%
|
94.8
|
%
|
43.0
|
%
|
|||||||
|
(1)
|
Other primarily includes manufactured housing and lot loan exposures
|
|
(2)
|
Ambac’s below investment grade internal ratings reflect bonds which are of speculative grade credit quality with the adequacy of future margin levels for payment of interest and repayment of principal potentially adversely affected by major ongoing uncertainties or exposure to adverse conditions. Ambac Assurance’s below investment grade category includes transactions on which claims have been submitted.
|
Student Loans
Ambac Assurance’s student loan portfolio consists of credits collateralized by (i) federally guaranteed loans under the Federal Family Education Loan Program (“FFELP”) and (ii) private student loans. Whereas FFELP loans are guaranteed for a minimum of 97% of defaulted principal and interest, private loans have no government guarantee and, therefore, are subject to credit risk as with other types of unguaranteed credits. Default data has shown a significant deterioration in the performance of private student loans underlying some of our transactions. Additionally, due to the failure of the auction rate markets, the interest rates on some student loan securities have increased significantly to punitive levels pursuant to the transaction terms. Such increases have caused the collateralization ratio in these transactions to deteriorate on an accelerated basis due to negative excess spread and/or the use of principal receipts to pay current interest. The combined increase in defaults and the penalty rate on the auction rate securities continue to erode the collateralization levels in many of the trusts we insure. This impact has been offset modestly by the current low interest rate environment. Student loan net par outstanding on Ambac insured obligations are as follows:
|
December 31,
|
|||||||||||||
|
Issuer type
|
2014
|
2013
|
|||||||||||
|
($ in millions)
|
Net Par
|
% of Net Par
|
Net Par
|
% of Net Par
|
|||||||||
|
For-Profit Issuers
|
$
|
2,624
|
|
77
|
%
|
$
|
2,660
|
|
61
|
%
|
|||
|
Not-For-Profit Issuers
|
766
|
|
23
|
%
|
1,697
|
|
39
|
%
|
|||||
|
Total
|
$
|
3,390
|
|
100
|
%
|
$
|
4,357
|
|
100
|
%
|
|||
13
Collateral for the For-Profit Issuers consists of private loans which do not have any federal guarantee as to defaulted principal and interest. Collateral for the Not-For-Profit Issuers consists of both FFELP and private student loans. For the Not-For-Profit student loan portfolio, approximately 96% of the collateral backing student loan trusts consists of private loans while the remaining 4% consists of FFELP loans.
New private student loan capital market transactions require a significant amount of equity which makes the refinancing of Ambac insured transactions backed by private loans difficult for issuers. As such, we do not expect that our private loan exposure, particularly For-Profit Issuers, will be significantly reduced via refinancing in the near term. The following table represents the student loan net par outstanding by underlying debt-type on Ambac insured obligations:
|
December 31,
|
|||||||||||||
|
Debit Type
|
2014
|
2013
|
|||||||||||
|
($ in millions)
|
Net Par
|
% of Net Par
|
Net Par
|
% of Net Par
|
|||||||||
|
Auction Rate
|
$
|
1,022
|
|
30
|
%
|
$
|
1,814
|
|
42
|
%
|
|||
|
Fixed Rate
|
181
|
|
5
|
%
|
229
|
|
5
|
%
|
|||||
|
Floating Rate Notes
|
2,163
|
|
64
|
%
|
2,218
|
|
51
|
%
|
|||||
|
Debt Service Reserve
|
24
|
|
1
|
%
|
96
|
|
2
|
%
|
|||||
|
Total
|
$
|
3,390
|
|
100
|
%
|
$
|
4,357
|
|
100
|
%
|
|||
All of the Auction Rate debt is paying interest at the maximum auction rate or the “penalty rate” pursuant to the transaction documents, reflecting both the failure of the auction rate market as well as the below investment grade credit ratings of the deals.
Auction Rate Securities (“ARS”) and Variable Rate Demand Obligations (“VRDO”):
Debt securities issued in the bond market include fixed and variable rate bonds. Included within the variable rate bond category are ARS and VRDO issued in the United States. The following table sets forth Ambac Assurance’s financial guarantee net par exposure outstanding, by bond type, relating to such variable rate securities at
December 31, 2014 and 2013
:
|
December 31,
|
|||||||
|
($ in millions)
|
2014
|
2013
|
|||||
|
Investor-owned utilities
|
$
|
2,403
|
|
$
|
2,465
|
|
|
|
Student Loans
|
1,022
|
|
1,814
|
|
|||
|
Healthcare
|
825
|
|
1,040
|
|
|||
|
Lease and Tax-backed
|
570
|
|
708
|
|
|||
|
Transportation
|
403
|
|
513
|
|
|||
|
Utility
|
304
|
|
305
|
|
|||
|
General Obligation
|
107
|
|
110
|
|
|||
|
Other
|
403
|
|
537
|
|
|||
|
Total
|
$
|
6,037
|
|
$
|
7,492
|
|
|
ARS are sold through a Dutch auction, which is a competitive bidding process used to determine rates on each auction date. VRDO are long-term bonds that bear a floating interest rate and that provide investors the option to tender or put securities back to the issuer or the liquidity provider at any time with appropriate notice. Additionally, there are certain mandatory events that require all bondholders to tender their VRDO to the issuer or liquidity provider. The interest rate resets daily or weekly, depending upon the security.
VRDO are typically supported by a liquidity facility in the form of a standby bond purchase agreement (“Standby Bond Purchase Agreement”), usually provided by a commercial bank (“Liquidity Provider”). If the remarketing agent is unable to remarket all tendered VRDO, the Liquidity Provider is required to purchase such VRDO at the purchase price, subject to limited conditions precedent, thus providing liquidity to investors. While held by the Liquidity Provider, VRDO bear interest at a rate determined under the Standby Bond Purchase Agreement, often based on the Prime Rate or LIBOR plus a spread (the “Bank Rate”). During such time, the remarketing agent remains obligated to continue to try to remarket the VRDO held by the Liquidity Provider. Many Standby Bond Purchase Agreements provide that, after the Liquidity Provider has held the VRDO for a specified time period, the issuer or other obligor is required to cause such VRDO to be redeemed prior to maturity, either: in periodic installments over a predetermined number of years, typically from three to five (the “Term-Out”); or with available funds as defined in the transaction documents; or in a single lump sum at the end of three to five years. Other Standby Bond Purchase Agreements do not contain a Term-Out. For VRDO insured by Ambac Assurance, Ambac Assurance typically endorsed its insurance policy to cover interest at the Bank Rate. For VRDO insured by Ambac Assurance that contain a Term-Out, Ambac often endorsed its insurance policy to cover the required redemptions in accordance with the Term-Out schedule (though not any acceleration of the VRDO maturity ahead of the Term-Out schedule).
Issuers have been working toward reducing their debt service costs for ARS and VRDO transactions. The most prevalent ways have been; (i) refunding or refinancing the obligations and issuing new bonds or other debt structures; (ii) entering into interest rate swaps to synthetically
14
fix their interest rates; (iii) purchasing direct-pay letters of credit from other financial institutions; (iv) amending their liquidity facilities to address investor liquidity concerns; or (v) converting the bonds to fixed rate (to maturity or for a shorter period of time).
For Ambac Assurance insured ARS and VRDO transactions that have been unable to refinance, the higher debt service costs have resulted in decreased debt service coverage ratios and/or the erosion of first loss and/or other credit enhancements that are subordinate to Ambac Assurance’s risk position (such as excess spread). Ambac continues to actively review the credit implications of this additional issuer stress and its impact to our internal credit ratings and loss reserves as necessary.
Reinsurance
Ceded Reinsurance:
Ambac Assurance has reinsurance in place pursuant to surplus share treaty and facultative agreements. As a primary financial guarantor, Ambac Assurance is required to honor its obligations to its policyholders whether or not its reinsurers perform their obligations under these reinsurance agreements. For exposures reinsured, Ambac Assurance withholds a ceding commission to defray its underwriting and operating expenses. To minimize its exposure to losses from reinsurers, Ambac Assurance (i) monitors the financial condition of its reinsurers; (ii) is entitled to receive collateral from its reinsurance counterparties in certain reinsurance contracts; and (iii) has certain cancellation rights that can be exercised by Ambac Assurance in the event of rating agency downgrades of a reinsurer (among other events and circumstances). Ambac Assurance held letters of credit and collateral amounting to
$141.3 million
from its reinsurers at
December 31, 2014
. As of
December 31, 2014
, the aggregate amount of insured par ceded by Ambac Assurance to reinsurers under reinsurance agreements was
$14,954 million
, with the largest reinsurer accounting for
$13,366 million
or
8.4%
of gross par outstanding at
December 31, 2014
. The following table represents the percentage ceded to reinsurers and reinsurance recoverable at
December 31, 2014
and the reinsurers’ rating levels as of
February 25, 2015
:
|
Reinsurers
|
Moody’s
Rating
|
Moody’s
Outlook
|
Percentage
ceded Par
|
Net unsecured
reinsurance
recoverable
(1)
|
|||||
|
($ in millions)
|
|||||||||
|
Assured Guaranty Re Ltd
|
Baa1
|
Negative
|
89.4%
|
$
|
37.6
|
|
|||
|
Sompo Japan Nipponkoa Holdings, Inc.
|
A1
|
Stable
|
6.1%
|
—
|
|
||||
|
Assured Guaranty Corporation
|
A3
|
Negative
|
4.5%
|
4.4
|
|
||||
|
Total
|
100%
|
$
|
42.0
|
|
|||||
|
(1)
|
Represents reinsurance recoverables on paid and unpaid losses and deferred ceded premiums, net of ceded premium payables due to reinsurers, letters of credit, and collateral posted for the benefit of Ambac Assurance.
|
15
The following table shows the distribution, by bond type, of Ambac Assurance’s ceded guaranteed portfolio at
December 31, 2014
:
|
Bond Type
($ in millions)
|
Ceded Par
Amount
Outstanding
|
% of Gross
Par Ceded
|
||||
|
Public Finance:
|
||||||
|
Lease and tax-backed revenue
|
$
|
3,692
|
|
10
|
%
|
|
|
General obligation
|
2,888
|
|
11
|
%
|
||
|
Utility revenue
|
1,735
|
|
13
|
%
|
||
|
Transportation revenue
|
1,545
|
|
17
|
%
|
||
|
Housing revenue
|
1,023
|
|
13
|
%
|
||
|
Higher education
|
928
|
|
13
|
%
|
||
|
Health care revenue
|
366
|
|
11
|
%
|
||
|
Other
|
108
|
|
8
|
%
|
||
|
Total Public Finance
|
12,285
|
|
12
|
%
|
||
|
Structured Finance:
|
||||||
|
Student loan
|
809
|
|
19
|
%
|
||
|
Investor-owned utilities
|
607
|
|
10
|
%
|
||
|
Mortgage-backed and home equity
|
174
|
|
1
|
%
|
||
|
Asset-backed
|
76
|
|
5
|
%
|
||
|
Other
|
259
|
|
9
|
%
|
||
|
Total Structured Finance
|
1,925
|
|
7
|
%
|
||
|
Total Domestic
|
14,210
|
|
11
|
%
|
||
|
International Finance:
|
||||||
|
Investor-owned and public utilities
|
504
|
|
6
|
%
|
||
|
Asset-backed
|
117
|
|
3
|
%
|
||
|
Transportation
|
84
|
|
2
|
%
|
||
|
CDOs
|
39
|
|
14
|
%
|
||
|
Total International Finance
|
744
|
|
3
|
%
|
||
|
Total
|
$
|
14,954
|
|
9
|
%
|
|
Assumed Reinsurance:
At
December 31, 2014
, assumed par outstanding was
$245.9 million
. On March 24, 2010, all assumed reinsurance agreements with third parties were allocated to the Segregated Account, which will not allow for cancellations without the approval of the Rehabilitator.
Rating Agencies
Ambac Assurance’s financial strength ratings had been downgraded and subsequently withdrawn by Moody’s and S&P. Ambac Assurance requested such withdrawals upon a review of the value of such ratings relative to the cost.
Insurance Regulatory Matters
United States
Ambac Assurance and Everspan are domiciled in the State of Wisconsin and, as such, are subject to the insurance laws and regulations of the State of Wisconsin (the “Wisconsin Insurance Laws”) and are regulated by the OCI. In addition, Ambac Assurance and Everspan are subject to the insurance laws and regulations of the other jurisdictions in which they are licensed. Ambac Assurance is licensed in all other 49 states, the District of Columbia, the Commonwealth of Puerto Rico, and the U.S. Virgin Islands. Everspan is licensed in all the same jurisdictions as Ambac Assurance other than Virginia, the District of Columbia and the Commonwealth of Puerto Rico. Under Wisconsin insurance law, the Segregated Account is a separate insurer for purposes of the Segregated Account Rehabilitation Proceedings. The Segregated Account is separately licensed in the State of Wisconsin but not elsewhere, and is under the control of, and is overseen by, the Rehabilitator.
Insurance laws and regulations applicable to financial guarantee insurers vary by jurisdiction. The laws and regulations generally require financial guarantors to maintain minimum standards of business conduct and solvency; to meet certain financial tests; and to file policy forms, premium rate schedules and certain reports with regulatory authorities, including information concerning capital structure, ownership and financial condition. Regulated insurance companies are also required to file quarterly and annual statutory financial statements with the National Association of Insurance Commissioners (“NAIC”), and in each jurisdiction in which they are licensed. The level of supervisory authority that may be exercised by non-domiciliary insurance regulators varies by jurisdiction. Generally, however, non-domiciliary regulators are authorized to suspend or revoke insurance licenses and to impose license restrictions in the event that laws or regulations are breached by a regulated insurance company
16
or in the event that continued or unrestricted licensure of the regulated insurance company constitutes a “hazardous condition” in the opinion of the regulator. As a result of losses from its insured portfolio, Ambac Assurance is no longer able to write new business. In addition, Ambac Assurance’s authority to write new business in Alabama, Connecticut, Louisiana, Mississippi, North Carolina, North Dakota, Ohio, Tennessee, Utah and Virginia has been restricted by regulatory action or by agreement with the relevant insurance department.
As the principal, or domiciliary, regulator of Ambac Assurance, the Segregated Account and Everspan, OCI has primary regulatory authority, including with respect to the initiation and administration of rehabilitation or liquidation proceedings. Additionally, the accounts and operations of Ambac Assurance and Everspan are subject to periodic comprehensive examinations by the OCI. Wisconsin Insurance Laws require regulated insurance companies to maintain minimum standards of business conduct, maintain minimum surplus to policyholders, meet certain financial tests, and file certain reports, including information concerning their capital structure, ownership and financial condition. Ambac Assurance, the Segregated Account, and Everspan are not subject to risk-based capital requirements, since they are financial guarantee insurers. Ambac Assurance, the Segregated Account and Everspan are in compliance with minimum surplus levels. Wisconsin Insurance Laws also require prior approval by OCI of certain transactions between Ambac Assurance or Everspan and their respective affiliates. As described in Note 1. Background and Business Description to the Consolidated Financial Statements included in Part II, Item 8 in this Form 10-K, the Rehabilitator of the Segregated Account has imposed certain constraints upon Ambac Assurance through the covenants made for the benefit of the Segregated Account and has assumed the authority to control the management of the Segregated Account.
In addition, pursuant to the terms of the Settlement Agreement, Ambac Assurance must seek prior approval by OCI of certain corporate actions. The Settlement Agreement includes covenants which generally restrict the operations of Ambac Assurance and remain in force until the surplus notes that were issued to the counterparties by Ambac Assurance pursuant to the Settlement Agreement have been redeemed, repurchased or repaid in full. Certain of these restrictions may be waived with the approval of a majority of Unaffiliated Qualified Directors (described below) and/or the OCI. Pursuant to the Settlement Agreement, Ambac Assurance amended its articles of incorporation to require that at least one-third (and, in any event, not less than three members) of the board of directors of Ambac Assurance must be Unaffiliated Qualified Directors (as defined in the Settlement Agreement). If at any time Ambac Assurance does not have the requisite number of Unaffiliated Qualified Directors to authorize an action that is otherwise restricted by the Settlement Agreement, it will need to seek the approval of OCI to take such action.
New York’s comprehensive financial guarantee insurance law defines the scope of permitted financial guarantee insurance and governs the conduct of business of all financial guarantors licensed to do business in New York, including Ambac Assurance and Everspan. The New York financial guarantee insurance law also establishes single risk and aggregate limits with respect to insured obligations insured by financial guarantee insurers. Such single risk limits are specific to the type of insured obligation (for example, municipal or asset-backed). Under the aggregate limits, policyholders’ surplus and contingency reserves must at least equal a percentage of aggregate net liability that is equal to the sum of various percentages of aggregate net liability for various categories of specified obligations. Wisconsin laws and regulations applicable to financial guarantors, as well as the laws of several other states, are less comprehensive than New York law and relate primarily to single and aggregate risk limits. As a result of decreased statutory capital resulting from the significant losses experienced by Ambac Assurance, Ambac Assurance is not in compliance with applicable single and aggregate risk limits. Through run-off of the portfolio, Ambac Assurance will seek to reduce its exposure to no more than the permitted amounts, but may not be able to do so. Everspan is in compliance with all of such limits.
United Kingdom
The Prudential Regulatory Authority ("PRA") and Financial Conduct Authority ("FCA") (and their predecessor regulator the Financial Services Authority (“FSA”)) have exercised significant oversight of Ambac UK since 2008, after Ambac, Ambac Assurance and Ambac UK began experiencing financial stress. In 2009, Ambac UK’s license to write new business was curtailed by the FSA and the insurance license was limited to undertaking only run-off related activity. As such, Ambac UK is authorized to run-off its insurance portfolio in the United Kingdom, and to do the same through a branch in Milan, Italy, and a number of other EU countries. EU legislation has allowed Ambac UK to conduct business in EU states other than the United Kingdom through a “passporting” arrangement, which eliminates the necessity of additional licensing or authorization in those other EU jurisdictions.
Ambac UK remains subject to regulation by the PRA and FCA in the conduct of its business. The PRA and FCA are the dual statutory regulators responsible for regulating the financial services industry in the United Kingdom, with the purpose of maintaining confidence in the U.K. financial system, providing public understanding of the system, securing the proper degree of protection for consumers and helping to reduce financial crime. In addition, the regulatory regime in the United Kingdom must comply with certain EU legislation binding on all EU member states.
The PRA requires that non-life insurance companies such as Ambac UK maintain a margin of solvency at all times in respect of the liabilities of the insurance company, the calculation of which depends on the type and amount of insurance business a company writes. These solvency requirements will be amended in order to implement the European Union’s “Solvency II” directive on risk-based capital. The requirements of the Solvency II directive will become effective on January 1, 2016 and, during the course of 2015, Ambac UK will be required to make certain transitional Solvency II-compliant regulatory filings with the PRA.
Notwithstanding the foregoing, Ambac UK is deficient in terms of compliance with currently applicable regulatory capital requirements, and is expected to remain deficient in applicable regulatory requirements once the Solvency II directive becomes effective. The PRA and FCA are aware of the same, and dialogue between Ambac UK management and its regulators remains ongoing with respect to options for addressing the shortcoming, although such options remain few.
17
Regulations over change in control
Under Wisconsin law applicable to insurance holding companies, any acquisition of control of Ambac, and any other direct or indirect control of Ambac Assurance and Everspan, requires the prior approval of the OCI. “Control” is defined as the direct or indirect power to direct or cause the direction of the management and policies of a person. Any purchaser of more than 10% of the outstanding voting stock of a corporation is presumed to have acquired control of that corporation and its subsidiaries unless the OCI, upon application, determines otherwise. For purposes of this test, Ambac believes that a holder of common stock having the right to cast more than 10% of the votes which may be cast by the holders of all shares of common stock of Ambac would be deemed to have control of Ambac Assurance and Everspan within the meaning of the Wisconsin Insurance Laws. The United Kingdom has similar requirements applicable in respect of Ambac, as the ultimate holding company of Ambac UK.
Dividend Restrictions, Including Contractual Restrictions
Due to losses experienced by Ambac Assurance, Ambac Assurance has been unable to pay common dividends to Ambac since 2008 and will be unable to pay common dividends in 2015 without the prior consent of the OCI, which is unlikely. See Note 9. Insurance Regulatory Restrictions to the Consolidated Financial Statements included in Part II, Item 8 in this Form 10-K for further information on dividends.
Ambac Assurance’s ability to pay dividends is further restricted by the Settlement Agreement and by certain covenants made for the benefit of the Segregated Account. See Note 1. Background and Business Description to the Consolidated Financial Statements included in Part II, Item 8 in this Form 10-K for further information.
As a result of these restrictions, Ambac Assurance is not expected to pay dividends to Ambac for the foreseeable future.
Subject to the foregoing, pursuant to the Wisconsin Insurance Laws, Ambac Assurance and Everspan may declare dividends, subject to restrictions in their respective articles of incorporation, provided that, after giving effect to the distribution, such dividends would not violate certain statutory equity, solvency, income and asset tests. Board action authorizing a shareholder distribution by Ambac Assurance or Everspan (other than stock dividends) must be reported to the OCI at least 30 days prior to payment. Additionally, no quarterly dividend may exceed the dividend paid in the corresponding quarter of the preceding year by more than 15% without notifying the OCI 30 days in advance of payment. Extraordinary dividends must be reported prior to payment and are subject to disapproval by the OCI. An extraordinary dividend is defined as a dividend or distribution, the fair market value of which, together with all dividends from the preceding 12 months, exceeds the lesser of: (a) 10% of policyholders’ surplus as of the preceding December 31 or (b) the greater of: (i) statutory net income for the calendar year preceding the date of the dividend or distribution, minus realized capital gains for that calendar year; or (ii) the aggregate of statutory net income for the three calendar years preceding the date of the dividend or distribution, minus realized capital gains for those calendar years and minus dividends paid or credited and distributions made within the first two of the preceding three calendar years. Additionally, in connection with the termination of certain reinsurance contracts, OCI requires adjustments to the dividend calculations for any surplus or net income gains recognized.
Ambac UK is not expected to pay any dividends to Ambac Assurance for the foreseeable future. UK law prohibits Ambac UK from declaring a dividend to its shareholders unless it has “profits available for distribution.” The determination of whether a company has profits available for distribution is based on its accumulated realized profits less its accumulated realized losses. While the UK insurance regulatory laws impose no statutory restrictions on a general insurer’s ability to declare a dividend, the PRA’s and FCA’s capital requirements in practice act as a restriction on the payment of dividends. Further, the FSA amended Ambac UK’s license in 2010 such that the PRA must specifically approve (“non-objection”) any transfer of value and/or assets from Ambac UK to Ambac Assurance or any other Ambac group company, other than in respect of certain disclosed contracts between the two parties (such as in respect of a management services agreement between Ambac Assurance and Ambac UK).
Pursuant to the Settlement Agreement Ambac Assurance may not make any “Restricted Payment” (which includes dividends from Ambac Assurance to Ambac) in excess of $5 million in the aggregate per annum, other than Restricted Payments from Ambac Assurance to Ambac in an amount up to $7.5 million per annum solely to pay operating expenses of Ambac. Concurrent with making any such Restricted Payment, a pro rata amount of the surplus notes issued by Ambac Assurance under the Settlement Agreement would also need to be redeemed at par.
Under the terms of Ambac Assurance’s Auction Market Preferred Shares (“AMPS”), dividends may not be paid on the common stock of Ambac Assurance unless all accrued and unpaid dividends on the AMPS for the then current dividend period have been paid, provided, that dividends on the common stock may be made at all times for the purpose of, and only in such amounts as are necessary for, enabling Ambac (i) to service its indebtedness for borrowed money as such payments become due or (ii) to pay its operating expenses. If dividends are paid on the common stock as provided in the prior sentence, dividends on the AMPS become cumulative until the date that all accumulated and unpaid dividends have been paid on the AMPS.
FINANCIAL SERVICES SEGMENT
Ambac’s Financial Services business segment is conducted through subsidiaries of Ambac Assurance, which provide financial and investment products, including investment agreements, funding conduits and interest rate swaps, principally to the clients of its financial guarantee business. Ambac Assurance insures all of the obligations of its financial services subsidiaries. These businesses are in active runoff, which is being effectuated by transaction terminations, settlements, and scheduled amortization of contracts. The Financial Services business also maintains interest rate derivatives to mitigate exposure to floating rate insured obligations in the Financial Guarantee segment.
18
The principal factors that may affect the Financial Services Segment results include: (1) availability of counterparties for hedging transactions; (2) investment returns; (3) the value of future contract terminations or settlements which may differ from carrying value of the those contracts; (4) collateral posting requirements; (5) the availability of liquidity from Ambac Assurance; (6) changes in the fair value of the derivatives portfolio resulting from interest rate fluctuations; (7) timing of investment agreement withdrawals; and (8) restrictions imposed upon Ambac Assurance by the contracts executed with the Segregated Account and the Settlement Agreement, and, to the extent that policies allocated to the Segregated Account are implicated, the authority of the Rehabilitator of the Segregated Account to control the management of the Segregated Account.
Investment Agreements
Ambac’s remaining investment agreements issued to structured finance and municipal issuers were issued through its wholly-owned subsidiary, Ambac Capital Funding. Investment agreements were customized for each investor to provide guaranteed interest and return of principal in accordance with their requirements. Each investment agreement was insured by Ambac Assurance through a financial guarantee insurance policy.
Liquidity risk exists in the business due to contract provisions which require collateral posting and allow for early termination of investment agreements. As of
December 31, 2014
, 91% of investment agreement principal and accrued interest outstanding of $148.9 million was collateralized. Funding for the collateral and previous early terminations was supported in part through loans between Ambac Capital Funding and Ambac Assurance. At
December 31, 2014
, Ambac Capital Funding was indebted to Ambac Assurance in the amount of $177.9 million.
See “Liquidity and Capital Resources” of the Management’s Discussion and Analysis of Financial Condition and Results of Operations” included in Part II, Item 7 and Note 15. Obligations Under Invstment Agreements to the Consolidated Financial Statements included in Part II, Item 8 in this Form 10-K for further information on investment agreements.
Derivative Products
The primary activities in the derivative products business are to manage the runoff of derivatives with financial guarantee clients and to facilitate the mitigation of interest rate exposure for the Financial Guarantee segment via swaps and exchange traded U.S. treasury futures. Derivative transactions are executed through Ambac Financial Services (“AFS”), a wholly-owned subsidiary of Ambac Assurance. The derivative products portfolio is positioned to benefit from rising rates as an economic hedge against interest rate exposure in the financial guarantee insurance portfolio. This hedge position may have a significant impact on the results of the Financial Services segment. Under the agreements governing the derivative positions, AFS generally must post collateral or margin in excess of the market value of the swaps and futures contracts. In addition, most of AFS’s counterparties currently possess the right to terminate their transactions with AFS and in the event of a full rehabilitation of Ambac Assurance, some of AFS’s swaps could automatically terminate. A sudden termination of AFS’s derivatives, whether voluntarily or automatically, could result in losses. AFS has borrowed cash and securities from Ambac Assurance, to help support its incremental collateral and margin posting requirements, previous termination payments and other cash needs. At
December 31, 2014
, AFS was indebted to Ambac Assurance in the amounts of $638.2 million in cash loans and $64.4 million in borrowed securities.
Credit risks relating to derivative positions primarily concern the default of a counterparty. Counterparty default exposure is mitigated through the use of industry standard collateral posting agreements. For counterparties subject to such collateral posting agreements, collateral is posted when a derivative counterparty’s credit exposure exceeds contractual limits. Derivative contracts entered into with financial guarantee customers are not subject to collateral posting agreements. Credit risk associated with such customer derivatives, including credit derivatives, is managed through the financial guarantee portfolio risk management processes described in the Financial Guarantee Segment noted above. In some cases, derivatives between Ambac and financial guarantee customers are placed through a third party financial intermediary and similarly do not require collateral posting.
AFS manages a variety of market risks inherent in its businesses, including credit, market, liquidity, operational and legal. These risks are identified, measured, and monitored through a variety of control mechanisms, which are in place at different levels throughout the organization. See “Quantitative and Qualitative Disclosures About Market Risk” included in Part II, Item 7A in this Form 10-K for further information.
Funding Conduits
A subsidiary of Ambac has previously transferred financial assets to two special purpose entities. The business purpose of these entities was to provide certain financial guarantee clients with funding for their debt obligations. The activities of the special purpose entities are contractually limited to purchasing assets from Ambac, issuing medium-term notes (“MTNs”) to fund such purchases, executing derivative hedges and obtaining financial guarantee policies with respect to indebtedness incurred. As of
December 31, 2014
, Ambac Assurance had financial guarantee insurance policies issued for all assets, MTNs and derivative contracts owned and outstanding by the entities. Ambac does not consolidate these entities under the relevant accounting guidance for consolidation of variable interest entities. See Note 2. Basis of Presentation and Significant Accounting Policies and Note 4. Special Purpose Entities, including Variable Interest Entities to the Consolidated Financial Statements included in Part II, Item 8 in this Form 10-K for further information.
INVESTMENTS AND INVESTMENT POLICY
As of
December 31, 2014
, the consolidated non-VIE investments of Ambac had an aggregate fair value of approximately
$5.5 billion
and an aggregate amortized cost of approximately
$5.3 billion
. Investments are managed internally by officers of Ambac, who are experienced investment managers, and by external investment managers. All investments are made in accordance with the general objectives and guidelines for investments
19
reviewed or overseen by Ambac Assurance and Ambac UK’s respective Boards of Directors. These guidelines include liquidity, credit quality, diversification and duration objectives, and are periodically reviewed and revised as appropriate. Additionally, senior credit personnel monitor the portfolio on a continuous basis. Credit monitoring of the investment portfolio includes procedures on residential mortgage-backed securities consistent with those utilized to assess the risk of our insured RMBS exposures.
As of
December 31, 2014
, the Ambac Assurance and Everspan non-VIE investment portfolio had an aggregate fair value of approximately $4.6 billion and an aggregate amortized cost of approximately $4.4 billion. Ambac Assurance’s and Everspan’s investment objectives are to achieve the highest risk-adjusted after-tax return on a diversified portfolio consistent with Ambac Assurance’s and Everspan’s risk tolerance while employing active asset/liability management practices to satisfy all operating and strategic liquidity needs. Ambac Assurance’s investment portfolio is subject to internal investment guidelines and is subject to limits on types and quality of investments imposed by applicable insurance laws and regulations. Ambac Assurance purchases Ambac Assurance insured securities given their relative risk/reward characteristics. Ambac Assurance financial guarantee policies related to most of these securities have been allocated to the Segregated Account. As described in Note 1. Background and Business Description to the Consolidated Financial Statements included in Part II, Item 8 in this Form 10-K, Ambac Assurance’s investment policies are subject to certain covenants made for the benefit of the Segregated Account and, therefore, such policies may be subject to restrictions outside the control of management. Such covenants could adversely impact the performance of the investment portfolio.
As of
December 31, 2014
, the non-VIE Ambac UK investment portfolio had an aggregate fair value of approximately $0.5 billion and an aggregate amortized cost of approximately $0.5 billion. Ambac UK’s investment policy is designed with the primary objective of ensuring that Ambac UK is able to meet its financial obligations as they fall due, in particular with respect to policy holders and meeting their claims. Ambac UK’s investment portfolio is subject to internal investment guidelines and may be subject to limits on types and quality of investments imposed by the PRA as regulator of Ambac UK. The Board of Directors of Ambac UK approves any changes or exceptions to Ambac UK’s investment policy.
As of
December 31, 2014
, the non-VIE Financial Services investment portfolio had an aggregate fair value of approximately $0.1 billion and an aggregate amortized cost of approximately $0.1 billion. The primary investment objective is to invest in a diversified portfolio of high-grade securities that produce sufficient cash flow to satisfy all investment agreement liabilities while meeting the related collateral requirements. The investment portfolio is subject to internal investment guidelines. Such guidelines set forth minimum credit rating requirements and credit risk concentration limits.
As of
December 31, 2014
, the non-VIE Corporate investment portfolio had an aggregate fair value of approximately $0.3 billion and an aggregate amortized cost of approximately $0.3 billion. The primary investment objective is to preserve capital for strategic uses while maximizing income. The investment portfolio is subject to internal investment guidelines. Such guidelines set forth minimum credit rating requirements and credit risk concentration limits.
The following tables provide certain information concerning the investments of Ambac:
|
Summary of Investments - December 31,
|
|||||||||||||
|
2014
|
2013
|
||||||||||||
|
Investment Category
($ in thousands)
|
Carrying
Value
(1)
|
Weighted
Average
Yield
(2)
|
Carrying
Value (1) |
Weighted
Average
Yield
(2)
|
|||||||||
|
Long-term investments:
|
|||||||||||||
|
Taxable bonds
|
$
|
4,666,727
|
|
5.27
|
%
|
$
|
5,099,503
|
|
3.76
|
%
|
|||
|
Tax-exempt bonds
|
123,226
|
|
4.15
|
%
|
912,036
|
|
3.95
|
%
|
|||||
|
Total long-term investments
|
4,789,953
|
|
5.24
|
%
|
6,011,539
|
|
3.79
|
%
|
|||||
|
Short-term investments
|
360,065
|
|
0.04
|
%
|
271,119
|
|
0.10
|
%
|
|||||
|
Other investments
|
357,016
|
|
—
|
|
241,069
|
|
—
|
|
|||||
|
Total
|
$
|
5,507,034
|
|
4.86
|
%
|
$
|
6,523,727
|
|
3.63
|
%
|
|||
|
(1)
|
Includes investments guaranteed by Ambac Assurance and Ambac UK. Refer to Note 11. Investments of the Consolidated Financial Statements included in Part II, Item 8 in this Form 10-K for further discussion of Ambac insured securities held in the investment portfolio.
|
|
(2)
|
Yields are stated on a pre-tax basis, based on average amortized cost.
|
20
|
Investments by Security Type - December 31,
|
|||||||||||||
|
2014
|
2013
|
||||||||||||
|
Investment Category
($ in thousands)
|
Carrying
Value
(1)
|
Weighted
Average
Yield
(2)
|
Carrying
Value
(1)
|
Weighted
Average
Yield
(2)
|
|||||||||
|
Municipal obligations
(3)
|
$
|
525,792
|
|
3.65
|
%
|
$
|
1,377,723
|
|
3.70
|
%
|
|||
|
Corporate securities
|
1,385,594
|
|
2.54
|
%
|
1,489,369
|
|
2.28
|
%
|
|||||
|
Foreign obligations
|
127,757
|
|
1.86
|
%
|
124,877
|
|
1.29
|
%
|
|||||
|
U.S. government obligations
|
107,246
|
|
1.14
|
%
|
252,471
|
|
0.36
|
%
|
|||||
|
U.S. agency obligations
|
29,486
|
|
0.30
|
%
|
32,154
|
|
0.31
|
%
|
|||||
|
Residential mortgage-backed securities
|
1,710,955
|
|
9.70
|
%
|
1,558,625
|
|
7.04
|
%
|
|||||
|
Asset-backed securities
|
903,123
|
|
3.65
|
%
|
1,176,320
|
|
2.79
|
%
|
|||||
|
Total long-term investments
|
4,789,953
|
|
5.24
|
%
|
6,011,539
|
|
3.79
|
%
|
|||||
|
Short-term investments
(3)
|
360,065
|
|
0.04
|
%
|
271,119
|
|
0.10
|
%
|
|||||
|
Other investments
|
357,016
|
|
—
|
|
241,069
|
|
—
|
|
|||||
|
Total
|
$
|
5,507,034
|
|
4.86
|
%
|
$
|
6,523,727
|
|
3.63
|
%
|
|||
|
(1)
|
Includes investments guaranteed by Ambac Assurance and Ambac UK. Refer to Note 11. Investments of the Consolidated Financial Statements included in Part II, Item 8 in this Form 10-K for further discussion of Ambac insured securities held in the investment portfolio.
|
|
(2)
|
Yields are stated on a pre-tax basis, based on average amortized cost.
|
|
(3)
|
Includes taxable and tax-exempt investments.
|
Ambac has RMBS exposure in its investment portfolios. Please refer to the tables in Part II, Item 7 “Management’s Discussion and Analysis of Financial Condition and Results of Operations - Balance Sheet” section below for a discussion of the fair value of mortgage and asset-backed securities by classification.
EMPLOYEES
As of
December 31, 2014
, Ambac had 175 employees in the United States and 13 employees in the UK. Ambac considers its employee relations to be satisfactory.
References in the risk factors to “Ambac” are to Ambac Financial Group, Inc. References to “we,” “our,” “us” and “Company” are to Ambac and its subsidiaries, as the context requires. Capitalized terms used but not defined in this section shall have the meanings ascribed thereto in Part I, Item 1 in this Form 10-K or in Note 1. Background and Business Description to the Consolidated Financial Statements included in Part II, Item 8 in this Form 10-K unless otherwise indicated.
The price per share of our common stock may be subject to a high degree of volatility, including significant price declines.
Our shares of common stock, which were issued pursuant to our Reorganization Plan, began trading on the NASDAQ Global Market on May 1, 2013. Although our common stock is listed on NASDAQ, there can be no assurance as to the liquidity of the trading market for our shares of common stock or the price at which such shares can be sold. The initial market price of our shares was determined by investors based upon the number of shares that were issued. The price of the shares may decline substantially in response to a number of events or circumstances, including but not limited to:
|
•
|
changes in investors’ or analysts’ valuation measures for our stock;
|
|
•
|
market trends unrelated to our stock;
|
|
•
|
market and industry perception of our success, or lack thereof, in pursuing our business strategy;
|
|
•
|
results and actions of other participants in our industry; and
|
|
•
|
adverse developments in our financial condition or results of operation.
|
In addition, the price of our shares will be affected by the additional risks described below, including risks associated with Ambac Assurance’s ability to deliver value to Ambac.
Ambac may not be able to realize value from Ambac Assurance.
Because Ambac is a holding company, the value of our stock is dependent upon the residual value of our main operating subsidiary, Ambac Assurance, the receipt of payments to be made by Ambac Assurance pursuant to the Amended TSA and the Cost Allocation Agreement, the receipt of payments on the Owner Trust Certificate issued to Ambac by Corolla Trust (the "Owner Trust Certificate"), and the receipt of dividends from Ambac Assurance. There can be no assurance that we will be able to realize residual value in Ambac Assurance, which is in run-off. In addition, the Segregated Account of Ambac Assurance Corporation is subject to rehabilitation proceedings and under the control of the Rehabilitator, as further described below. It is unclear whether Ambac Assurance and the Segregated Account will be able to satisfy all of their
21
respective obligations to policyholders, holders of their respective surplus notes and holders of Ambac Assurance’s preferred stock, even if Ambac Assurance and the Segregated Account are successful in achieving recoveries and mitigating losses. Our ability to achieve recoveries and mitigate losses is subject to significant risks and uncertainties, including perceptions of the value of Ambac’s guarantees and securities.
Due to the above considerations, as well as applicable legal and contractual restrictions described elsewhere herein, it is highly unlikely that Ambac Assurance will be able to pay Ambac any dividends for the foreseeable future. Furthermore, the payments to be made to Ambac under the Amended TSA and the Cost Allocation Agreement are subject to contingencies that are difficult to predict, making the amount and timing, if any, of such payments uncertain. Payments to be made under the Amended TSA, in particular, depend on the generation of taxable income by Ambac Assurance above certain thresholds. Ambac Assurance’s ability to generate taxable income above such thresholds is uncertain. Due to these factors, there can be no assurance as to the amounts, if any, that Ambac will receive from Ambac Assurance under the Amended TSA.
It is also uncertain whether and to what extent Ambac will realize value from the Owner Trust Certificate. The Owner Trust Certificate is subordinated to $299.2 million of senior secured notes issued by Corolla Trust. Such notes and the Owner Trust Certificate are collateralized by and payable solely from a $350.0 million face amount Segregated Account junior surplus note plus accrued and unpaid interest thereon. No payment of interest on or principal of a Segregated Account junior surplus note may be made until all existing and future indebtedness of the Segregated Account, including Segregated Account surplus notes, policy claims and claims having statutory priority, and all existing and future senior ranking surplus notes, contribution notes or similar obligations of Ambac Assurance, have been paid in full. All payments of principal and interest on Segregated Account junior surplus notes are subject to the prior approval of the OCI. If the OCI does not approve the payment of interest on Segregated Account junior surplus notes, such interest will accrue and compound annually until paid. Payments on the senior secured notes issued by Corolla Trust will be only made when and to the extent that the Segregated Account makes payments on the junior surplus note held by Corolla Trust. The senior secured notes must be paid in full before any payments will be made on the Owner Trust Certificate. If Corolla Trust has failed to pay all interest and principal outstanding on the senior secured notes within three business days of August 28, 2039, the senior secured noteholders may also take possession of and sell the junior surplus note. If such a sale were to occur, it is uncertain whether and to what extent there would be any value for the Owner Trust Certificate after satisfaction of the senior secured notes.
The value of our common stock may also depend upon the ability of Ambac to generate earnings apart from Ambac Assurance. As noted below, we are exploring new business opportunities, but there are no assurances regarding our ability to enter new businesses or the prospects of any such new businesses.
We are exploring new business opportunities which may not be consummated, or if consummated, may not create value and may negatively impact our financial results.
We are exploring new business opportunities for the Company, which may involve the acquisition of assets or existing businesses or the development of businesses through new or existing subsidiaries. It is not possible at this time to predict the future prospects or other characteristics of any such new business. Our efforts to pursue new business opportunities may be unsuccessful or require significant financial or other resources, which could have a negative impact on our financial condition. No assurance can be given that we will be able to complete the acquisition or development of any business or, if acquired or developed, generate any earnings or be able to successfully integrate such business into our current operating structure.
Moreover, Ambac’s ability to enter new businesses, including new businesses apart from Ambac Assurance, is also subject to significant doubt, given the condition and circumstances of Ambac Assurance, the difficulty of leveraging or monetizing its other assets, and the uncertainty of its ability to raise capital. Due to these factors, as well as those relating to Ambac Assurance as described above, the value of our securities is highly speculative.
The issuance of new common stock may dilute current shareholder value or have adverse effects on the market price of our common stock.
If we raise capital through the issuance of additional shares of common stock, whether for a new business, general corporate purposes, or in exchange for other securities, the value of our current shareholders’ interests may be diluted as we are not required to offer any such shares to existing stockholders on a preemptive basis.
We cannot predict the effect, if any, of future sales of our common stock, or the availability of shares for future sales, on the market price of our common stock. Sales of substantial amounts of common stock or the perception that such sales could occur may adversely affect the prevailing market price for our common stock.
Future offerings of debt or equity securities that rank senior to our common stock may adversely affect the market price of our common stock.
If we decide to issue debt or additional equity securities in the future that rank senior to our common stock, it is likely that they will be governed by an indenture or other instrument containing covenants restricting our operating flexibility. Additionally, any convertible or exchangeable securities that we issue in the future may have rights, preferences and privileges more favorable than those of our common stock and may result in dilution to owners of our common stock. Because our decision to issue debt or equity securities in any future offering will depend on market conditions and other factors beyond our control, we cannot predict or estimate the amount, timing or nature of our future offerings. Holders of our common stock bear the risk of our future offerings reducing the market price of our common stock and diluting the value of their stock holdings in us.
22
The occurrence of certain events could result in the initiation of rehabilitation proceedings against Ambac Assurance, with resulting adverse consequences to holders of Ambac securities.
Increased loss development in the General Account of Ambac Assurance or significant losses resulting from litigation against Ambac Assurance may prompt OCI to determine that it is in the best interests of policyholders to initiate rehabilitation proceedings with respect to Ambac Assurance, either preemptively or in response to any such event.
If, as a result of the occurrence of any such event(s), OCI decides to initiate rehabilitation proceedings with respect to Ambac Assurance, adverse consequences may result, including, without limitation, the assertion of damages by counterparties (including mark-to-market claims with respect to insured transactions executed in ISDA format) and the acceleration of losses based on early termination triggers and the loss of control rights in insured transactions, thereby reducing the residual value of Ambac Assurance. Additionally, the Rehabilitator would assume control of all of Ambac Assurance’s assets and management of Ambac Assurance. In exercising control, the Rehabilitator will act for the benefit of policyholders, and will not take into account the interests of securityholders of Ambac. Such actions may result in material adverse consequences for Ambac’s securityholders.
Actions of the Rehabilitator could adversely affect Ambac, including impacting our ability to realize our remediation recoveries.
As a consequence of the Segregated Account Rehabilitation Proceedings, the Rehabilitator retains operational control and decision-making authority with respect to all matters related to the Segregated Account, including surveillance, remediation, loss mitigation and efforts to recover losses in the Segregated Account, including recovery efforts in respect of breaches of representations and warranties by sponsors of Ambac-insured RMBS. Similarly, by virtue of the contracts executed between Ambac Assurance and the Segregated Account in connection with the establishment, and subsequent rehabilitation, of the Segregated Account, the Rehabilitator retains the discretion to oversee and approve certain actions taken by Ambac Assurance in respect of assets and liabilities that remain in Ambac Assurance. Moreover, the Rehabilitator retains the sole discretion to adjust claim payments, to make payments on Deferred Amounts and, with regulatory approval, to make payments on or redeem Segregated Account surplus notes (which would require Ambac Assurance to make proportionate payments on or proportionately redeem its surplus notes). As a result, certain efforts to remediate losses, and certain other actions taken by Ambac Assurance, are subject to the approval of the Rehabilitator, as are decisions about the timing of payments of significant liabilities of the Segregated Account
.
In exercising such authority, the Rehabilitator will act for the benefit of policyholders, and will not take into account the interests of securityholders of Ambac. Decisions made by the Rehabilitator for the benefit of policyholders may result in material adverse consequences for Ambac’s securityholders. In addition, we are not able to predict the impact such decisions will have on the remediation of losses, and, in particular, on our efforts to recover losses attributable to breaches of representations and warranties by sponsors of Ambac-insured RMBS, our ability to commute outstanding policies and repurchase insured bonds or surplus notes
,
or how vigorously the Rehabilitator will pursue such remediations. We are similarly unable to predict the decisions of the Rehabilitator as to claims payments or payments on Deferred Amounts or, with regulatory approval, payments on or redemptions of Segregated Account surplus notes, the timing and impact of which may negatively affect our financial condition or results of operations. Furthermore, any negative consequences resulting from payments on or redemptions of Segregated Account surplus notes would be magnified due to the fact that the Rehabilitator’s decision to make such payments would require Ambac Assurance to make proportionate payments on its surplus notes.
Our inability to realize the expected recoveries included in our financial statements could adversely impact our liquidity and financial condition.
As of
December 31, 2014
, we have estimated representation and warranty subrogation recoveries of
$2,496.5 million
(net of reinsurance), which is included in our financial statements. These recoveries are based on contractual claims arising from RMBS transactions that we have insured, and represent a probability-weighted estimate of amounts we expect to recover under various possible scenarios, and do not reflect the best or the worst possible outcomes with respect to any particular transaction or group of transactions. Our ability to recover these amounts is subject to significant uncertainty, including risks inherent in litigation, collectability of such amounts from counterparties and/or their respective parents and affiliates, timing of receipt of any such recoveries, intervention by OCI or the Rehabilitator which could impede our ability to take the actions required to realize such recoveries, and uncertainties inherent in the assumptions used in estimating such recoveries. The amount of these subrogation recoveries is significant and if we were unable to recover any amounts our stockholders’ equity as of
December 31, 2014
would decrease from
$1,673.7 million
to a deficit of
$822.8 million
.
We expect to recover material amounts of claims payments through remediation measures other than the litigation described above as well as through cash flows in the securitization structures of transactions that we insure. Realization of such expected recoveries is subject to various risks and uncertainties, including the rights and defenses of other parties with interests that conflict with our interests, the performance of the collateral and assets backing the obligations that we insure, the performance of servicers involved in securitizations in which we participate as insurer, and the effect on our rights of the Segregated Account Rehabilitation Plan and orders of the Rehabilitation Court. Additionally, the Segregated Account Rehabilitation Proceedings may result in the loss of future recoveries in insured transactions. Adverse developments with respect to such variables may cause our recoveries to fall below expectations.
Intercompany disputes or disputes with OCI may arise, which may have material adverse effects on the Company.
The Segregated Account, Ambac Assurance, Ambac and other affiliates have entered into agreements that govern certain activities of such entities. OCI has certain enforcement rights with respect to such agreements and, as regulator of Ambac Assurance and as Rehabilitator of the Segregated Account, has further authority over the activities of Ambac Assurance and the Segregated Account. Disputes may arise over the interpretation of such agreements, the exercise or purported exercise of rights thereunder, or the performance of or failure or purported failure to perform obligations thereunder. Disputes may also arise over certain actions taken or proposed to be taken by OCI in reliance on its contractual or legal rights or in reaction to actions taken or to be taken by the Company. In taking such actions or reacting to actions or decisions of the Company, the Rehabilitator will act for the benefit of policyholders, and will not take into account the interests of securityholders of Ambac.
23
Any such dispute could have material adverse effects on the Company, whether through litigation, failure to execute transactions sought by management, interference with corporate strategies, objectives or prerogatives, inefficient decision-making or execution, forced realignment of resources, increased costs, distractions to management, strained working relationships or otherwise. Such effects would also increase the risk that OCI would seek to initiate rehabilitation proceedings against Ambac Assurance.
We may not be able to successfully monetize assets or restructure or exchange outstanding debt and insurance obligations.
Ambac Assurance is considering the possibility of entering into transactions whereby it would monetize certain assets and/or restructure or exchange its outstanding debt and insurance obligations. Transactions of this nature may not be feasible or economically viable. Moreover, Ambac Assurance may be unable to secure the approval of the Rehabilitator or OCI to consummate such a transaction. Even if such a transaction is consummated, it may ultimately prove to be unsuccessful in creating value.
The insurance intangible and goodwill assets, which resulted from the application of fresh start accounting, could adversely affect our results of operations.
Upon emergence from bankruptcy, we applied fresh start accounting pursuant to which an insurance intangible and goodwill asset were recorded. The insurance intangible asset represented the difference between the fair value and aggregate carrying value of the financial guarantee insurance and reinsurance assets and liabilities. The insurance intangible asset is amortized using a level yield method based on actual and projected par exposure of the related financial guarantee insurance and reinsurance contracts. Significant declines in actual or projected par exposure could accelerate the insurance intangible amortization and adversely affect our results of operations.
The excess reorganization value over the fair value of identified tangible and intangibles assets was reported as goodwill at the fresh start reporting date. The determination of reorganization value and fair value of assets and liabilities was dependent on various estimates and assumptions, including financial projections and the realization of certain events. All goodwill was assigned to the financial guarantee reporting unit, which primarily represents Ambac Assurance Corporation and its subsidiaries. We test goodwill for impairment annually or whenever events occur or circumstances change that would more likely than not reduce the fair value of the financial guarantee reporting unit below its carrying amount. Impairments could occur in the future if the expected future cash flows of the financial guarantee reporting unit decline for reasons addressed in other risk factors, adverse actions are taken by the Rehabilitator, or if carrying values change materially compared with changes in their respective fair values.
Some issuers of public finance obligations we insure are experiencing fiscal stress that could result in increased losses on those obligations or increased liquidity claims, including losses or claims resulting from payment defaults, Chapter 9 bankruptcy proceedings or loss of market access.
We have historically experienced low levels of defaults in our public finance insured portfolio, including during the financial crisis that began in mid-2007. However, some issuers of public finance obligations we insure have reported budget shortfalls and significantly underfunded pensions that will require them to significantly raise taxes and/or cut spending in order to satisfy their obligations. Government entities may also take other actions that may impact their own creditworthiness or the creditworthiness of related issuers. Some issuers of obligations we insure have either defaulted or filed for bankruptcy, raising concerns about their ultimate ability to service the debt we insure or recover claims paid in the future. If the issuers of the obligations in our public finance portfolio are unable to raise taxes, cut spending, or receive federal assistance, or if such issuers default or file for bankruptcy under Chapter 9, we may experience liquidity claims and/or ultimate losses on those obligations, which could adversely affect our business, financial condition and results of operations.
We insure obligations of several issuers that have filed for bankruptcy protection under Chapter 9. The consequences of such proceedings for creditors remain uncertain. For example, the treatment of General Obligation debt in relation to other obligations remains in flux, with Detroit's recent precedent unfavorable for debt creditors. If issuers succeed in materially adjusting their obligations to bondholders and financial guarantors, other issuers may be encouraged to default or file for Chapter 9 protection and seek similar adjustments to their debt. These events could materially increase losses in Ambac’s insured portfolio of municipal credits.
Loss of market access is a risk embedded in our municipal exposures. From time to time the municipal bond market evidences heightened investor concerns overall or for select sectors or issuers, as has recently been the case with Puerto Rico. Such adverse market conditions may trigger a loss of market liquidity for affected issuers, which in turn may significantly raise their cost of alternative financing or cause a liquidity crisis and potential for default on debt service payments we guarantee.
Certain surplus notes or other obligations issued by either Ambac Assurance or the Segregated Account may be characterized as equity of Ambac Assurance and as a result, Ambac Assurance may no longer be a member of the U.S. federal income tax consolidated group of which Ambac is the common parent.
It is possible that certain surplus notes or other obligations issued by either Ambac Assurance or the Segregated Account may be characterized as equity of Ambac Assurance for U.S. federal income tax purposes. If such surplus notes or other obligations are characterized as equity of Ambac Assurance and it is determined that such “equity” represented more than twenty percent of the total value of the stock of Ambac Assurance, Ambac Assurance may no longer be characterized as an includable corporation that is affiliated with Ambac. As a result, Ambac Assurance may no longer be characterized as a member of the U.S. federal income tax consolidated group of which Ambac is the common parent (the “Ambac Consolidated Group”) and Ambac Assurance would be required to file a separate consolidated tax return as the common parent of a new U.S. federal income tax consolidated group including Ambac Assurance as the new common parent and Ambac Assurance’s affiliated subsidiaries (the “Ambac Assurance Consolidated Tax Group”).
24
To the extent Ambac Assurance is no longer a member of the Ambac Consolidated Group, Ambac Assurance’s NOLs (and certain other available tax attributes of Ambac Assurance and the other members of the Ambac Assurance Consolidated Tax Group) may no longer be available for use by the Ambac Assurance Consolidated Tax Group or any of the remaining members of the Ambac Assurance Consolidated Tax Group to reduce the U.S. federal income tax liabilities of the Ambac Assurance Consolidated Tax Group. Ambac, Ambac Assurance and their affiliates entered into a tax sharing agreement that would require Ambac to make certain tax elections that could mitigate the loss of NOLs and other tax attributes resulting from a deconsolidation of Ambac Assurance from the Ambac Consolidated Group. However, in the event of a deconsolidation, certain other benefits resulting from U.S. federal income tax consolidation may no longer be available to the Ambac Consolidated Group including certain favorable rules relating to transactions occurring between members of the Ambac Consolidated Group and members of the Ambac Assurance Consolidated Tax Group.
If surplus notes or other obligations are characterized as equity of Ambac Assurance, the Ambac Assurance NOLs (and certain other tax attributes or tax benefits of the Ambac Consolidated Group) may be subject to limitation under Section 382 of the Tax Code.
It is possible that certain surplus notes or other obligations may be characterized as equity of Ambac Assurance for U.S. federal income tax purposes. Such characterization could result in an “ownership change” of Ambac Assurance for purposes of Section 382 of the Tax Code. If such an ownership change were to occur, the value and amount of the Ambac Assurance NOLs would be substantially impaired, increasing the U.S. federal income tax liability of Ambac Assurance and materially reducing cash available to dividend to Ambac, as well as reducing the value of Ambac Assurance’s stock owned by Ambac.
Deductions with respect to interest accruing on certain surplus notes may be eliminated or deferred until payment.
To the extent certain surplus notes are characterized as equity for U.S. federal income tax purposes, accrued interest will not be deductible by Ambac Assurance. In addition, even if such surplus notes are characterized as debt for U.S. federal income tax purposes, the deduction of interest accruing on such surplus notes may be deferred until paid or eliminated in part depending upon (i) the terms of any deferral and payment provisions provided in such surplus notes, (ii) whether such surplus notes have “significant original issue discount,” and (iii) the yield to maturity of surplus notes. To the extent deductions with respect to interest are eliminated or deferred, the U.S. federal income tax of the members of the Ambac Consolidated Group or the members of the Ambac Assurance Consolidated Tax Group as the case maybe, could be increased reducing the amount of cash available to pay its obligations.
We are subject to credit risk and other risks related to RMBS and securities backed by student loans.
We have insured RMBS transactions, as well as securities backed by student loans, and are thus exposed to risk associated with those asset classes. Performance of these transactions, as well as others, can be adversely affected by general economic conditions, such as recession, rising unemployment rates, underemployment, home prices that decline or do not increase in the patterns assumed in our models, increasing foreclosure rates and unavailability of consumer credit, mortgage product attributes, such as interest rate adjustments and balloon payment obligations, borrower and/or originator fraud, mortgage and student loan servicer performance, including underperformance and financial difficulty.
While further deterioration in the performance of consumer assets, including mortgage-related assets and student loans, may occur, the timing, extent and duration of any future deterioration of the credit markets is unknown, as is the impact, if any, on potential claim payments and ultimate losses of the securities within Ambac Assurance’s portfolio. In addition, there can be no assurance that any governmental or private sector initiatives designed to address such credit deterioration in the markets will be successful or inure to the benefit of the transactions insured by Ambac. For example, borrower protection for student loan debt in bankruptcy may adversely affect our portfolio. Similarly, servicer settlements with governmental authorities regarding foreclosure irregularities are generally designed to protect homeowners and may increase losses on securities insured by Ambac.
In addition, there can be no assurance that we would be successful, or that we would not be delayed, in enforcing the subordination provisions, credit enhancements or other contractual provisions of the RMBS that Ambac Assurance insures in the event of litigation or the bankruptcy of other transaction parties.
The change in composition of the securities in our investment portfolio exposes us to greater risk.
Ambac Assurance maintains a portion of its investment portfolio in lower-rated securities in order to increase the risk-adjusted return on its portfolio. Investments in lower-rated securities and “alternative assets” could expose Ambac to increased losses and decreased liquidity in the investment portfolio.
Loss reserves may not be adequate to cover potential losses; changes in loss reserves may result in further volatility of net income and comprehensive earnings.
Loss reserves are established when management has observed credit deterioration, in most cases, when the underlying credit is considered below investment grade. Loss reserves established with respect to our non-derivative financial guarantee insurance policies are based upon estimates and judgments by management, including estimates and judgments with respect to the probability of default, the severity of loss upon default, management’s ability to execute policy commutations, and estimated remediation recoveries for, among other things, breaches by RMBS issuers of representations and warranties. Furthermore, the objective of establishing loss reserve estimates is not to reflect the worst possible outcome. As a result of the inherent uncertainties in the estimates and judgments made to determine loss reserves, there can be no assurance that either the actual losses in our financial guarantee insurance portfolio will not exceed such reserves or that our reserves will not increase or decrease materially over time as circumstances, our assumptions, or our models change.
25
Additionally, inherent in our estimates of loss severities and remediation recoveries is the assumption that we will retain control rights in respect of our insured portfolio. However, according to the terms of relevant transaction documents, we are subject to the loss of control rights in many insured transactions in the event that we are the subject of delinquency proceedings and/or other regulatory actions which could result from our deteriorated financial position. In the event that we lose control rights, our ability to mitigate loss severities and realize remediation recoveries will be compromised, and actual ultimate losses in our insured portfolio could exceed our loss reserves. The Rehabilitation Court issued an injunction against certain actions by holders of policies in the Segregated Account and other counterparties, including actions resulting in, or based on, the loss of control rights. If this injunction does not successfully preclude such actions, Ambac Assurance could lose its control rights with respect to policies in the Segregated Account.
We also rely on internally and externally developed complex financial models, including licensed default models related to RMBS and waterfall modeling provided by a nationally recognized vendor for RMBS and student loan exposures, to project performance of our insured obligations. Differences in the models that we employ, and/or flaws in these financial models and/or faulty assumptions inherent in these financial models and those determined by management, could lead to material changes in projected outcomes, and could include increased losses and loss reserves. Uncertainty with respect to the ultimate performance of certain of our insured exposures may result in substantial changes in loss reserves and/or actual losses. Moreover, modeled estimates of transaction performance depend in part on our interpretations of contracts and other bases of our legal rights. Such interpretations may prove to be incorrect or different interpretations may be employed by bond trustees and other transaction participants, which could lead to increased losses and loss reserves.
Our credit risk management policies and practices may not adequately identify significant risks.
As described in Part I, Item 1, “Business-Risk Management” in this Form 10-K, we have established risk management policies and practices which seek to mitigate our exposure to credit risk in our insured portfolio. Ongoing surveillance of credit risks in our insured portfolio is an important component of our risk management. These policies and practices in the past have not insulated us from risks that were unforeseen and which had unanticipated loss severity, and such policies and practices may not do so in the future. There can be no assurance that these policies and practices will be adequate to avoid future losses. If we are not able to identify significant risks, we may not be able to and/or timely remediate such risks, thereby increasing the amount of losses to which we are exposed. An inability to identify significant risks could also result in the failure to establish loss reserves that are sufficient in relation to such risks.
Changes in prevailing interest rate levels and market conditions could adversely impact our business results and prospects.
Increases in prevailing interest rate levels can adversely affect the value of our investment portfolio and, therefore, our financial strength. In the event that investments must be sold in order to pay claims, to pay Deferred Amounts, to redeem surplus notes, or to meet Financial Services liquidity needs due to contract terminations or collateral posting requirements, such investments would likely be sold at discounted prices. Additionally, increasing interest rates would have an adverse impact on our insured portfolio. For example, increasing interest rates could result in higher claim payments in respect of defaulted obligations that bear interest at floating rates of interest. Higher interest rates can also lead to increased credit stress on consumer asset-backed transactions in our insured portfolio (as the securitized assets supporting a portion of these exposures are floating rate consumer obligations), slower prepayment speeds and resulting “extension risk” relative to such consumer asset-backed transactions in our insured portfolio and in our investment portfolio and decreased refinancing activity.
Decreasing interest rates could result in early terminations of financial guarantee insurance policies in respect of which we are paid on an installment basis and do not receive a termination premium, thus reducing premium earned in respect of these transactions. Decreases in prevailing interest rates may also limit growth of or reduce investment income and may adversely impact the result of our interest rate swap portfolio.
Our investment portfolio may also be adversely affected by credit rating downgrades, ABS and RMBS prepayment speeds, foreign exchange movements, spread volatility, and credit losses.
Revenues and cash flow would be adversely impacted due to a decline in realization of installment premiums.
Due to the installment nature of a significant percentage of its premium income, Ambac Assurance has an embedded future revenue stream. The amount of installment premiums actually realized by Ambac Assurance could be reduced in the future due to factors such as early termination of insurance contracts, accelerated prepayments of underlying obligations or insufficiency of cash flows (by the premium paying entity). Additionally, the Segregated Account Rehabilitation Proceedings may result in the loss of installment premium income from such insured transactions if orders of the Rehabilitation Court are not effective. Such reductions would result in lower revenues.
We are subject to credit risk throughout our businesses, including large single risks, risk concentrations, correlated risks and reinsurance counterparty credit risk.
We are exposed to the risk that issuers of debt which we have insured (or with respect to which we have written credit derivatives), issuers of debt which we hold in our investment portfolio, reinsurers and other contract counterparties (including derivative counterparties) may default in their financial obligations, whether as the result of insolvency, lack of liquidity, operational failure, fraud or other reasons. These credit risks could cause increased losses and loss reserves, estimates of credit impairments and mark-to-market losses with respect to credit derivatives in our financial guarantee business; and we could experience losses and decreases in the value of our investment portfolio and, therefore, our financial strength. Such credit risks may be in the form of large single risk exposures to particular issuers, reinsurers or counterparties; losses caused by catastrophic events (including terrorist acts and natural disasters); losses caused by increases in municipal defaults; or losses in respect of different, but correlated, credit exposures.
26
Market risks could adversely impact our assets posted as collateral in respect of investment agreements and interest rate swap transactions.
We are required to post collateral with respect to certain investment agreements and interest rate swap transactions. See Part II, Item 7, “Management’s Discussion and Analysis of Financial Condition and Results of Operations-Liquidity and Capital Resources-Credit Ratings and Collateral” in this Form 10-K. We will be required to post additional collateral if the market value of the assets used to collateralize our obligations declines or if there are changes in the collateral posting obligations under these agreements and transactions.
These collateral-posting obligations could have a material adverse effect on our liquidity. At present, these collateral-posting requirements are being partially satisfied by loans from Ambac Assurance to the Financial Services businesses. As required by Wisconsin law, these transactions were approved by the OCI. To the extent that collateral-posting requirements increase as a result of changes in market conditions, as described above, it is likely that Ambac Assurance would need to provide increased lending capacity to the Financial Services businesses in order to satisfy these collateral-posting obligations. Any such increases to lending capacity would be subject to the prior consent of the OCI; there can be no assurance that we would obtain such consent. We believe that the OCI would consider several factors in determining whether to grant such consent, including its view of Ambac Assurance’s financial condition at the time of such loan or contribution.
If the Financial Services businesses fail to post collateral as required, counterparties may be entitled to terminate the transactions. Upon such terminations, we may be forced to liquidate securities with unrealized mark-to-market losses which could have a material adverse effect on our liquidity. See Part II, Item 7, “Management’s Discussion and Analysis of Financial Condition and Results of Operations-Liquidity and Capital Resources-Credit Ratings and Collateral” in this Form 10-K. The termination of such transactions, if unpaid by our Financial Services businesses, would trigger Ambac Assurance’s obligations to make payments under the financial guarantee insurance policies it previously issued. To the extent that the OCI determines that the payment by Ambac Assurance under such policies could place Ambac Assurance in a hazardous condition, the OCI could initiate rehabilitation proceedings with respect to Ambac Assurance.
The determination of the amount of other-than temporary impairments taken on our investments is highly subjective and could materially impact our results of operations or financial position.
The determination of the amount of impairments on our investments varies by investment type and is based upon our periodic evaluation and assessment of known and inherent risks associated with the respective asset class. Such evaluations and assessments are revised as conditions change and new information becomes available. Management updates its evaluations regularly and reflects changes in impairments as such evaluations are revised. There can be no assurance that our management has accurately assessed the level of impairments taken in our financial statements. Furthermore, additional impairments may need to be taken in the future. Historical trends may not be indicative of future impairments. We use externally developed financial models to project impairments with respect to RMBS held in our investment portfolio, including Ambac Assurance guaranteed RMBS. Differences in the models we employ and/or flaws in these models and/or faulty assumptions inherent in these models and those determined by management, could lead to increased impairments with respect to RMBS in our investment portfolio.
We are subject to the risk of litigation and regulatory inquiries or investigations, and the outcome of proceedings we are or may become involved in could have a material adverse effect on our business, operations, financial position, profitability or cash flows.
Ambac Assurance is defending various lawsuits relating to its financial guarantee business. In addition, the Company has received various regulatory inquiries and requests for information. Please see Note 18. Commitments and Contingencies to the Consolidated Financial Statements included in Part II, Item 8 in this Form 10-K for information on these various proceedings.
It is not possible to predict whether additional suits will be filed or whether additional inquiries or requests for information will be made, and it is also not possible to predict the outcome of litigation, inquiries or requests for information. It is possible that there could be unfavorable outcomes in these or other proceedings. Management is unable to make a meaningful estimate of the amount or range of loss that could result from unfavorable outcomes or of the expenses that will be incurred in defending these lawsuits. Under some circumstances, adverse results in any such proceedings and/or the incurrence of significant litigation expenses could be material to our business, operations, financial position, profitability or cash flows.
We may not be able to realize the value of our investment in Ambac Assurance UK Limited.
Our wholly-owned subsidiary, Ambac UK, has been subject to significant regulatory oversight due to its financial condition and material losses suffered in connection with the financial crisis that began in 2007. Ambac UK's license to write new business was curtailed by their insurance regulator. Additionally, Ambac UK's license was amended such that the PRA must specifically approve any transfer of value from Ambac UK to any other Ambac group company. Accordingly, we do not expect Ambac UK to pay dividends to Ambac Assurance for the foreseeable future. Due to these and other factors, we may not be able to realize value from our ownership interest in Ambac UK.
System security risks, data protection breaches and cyber-attacks could adversely affect our business and results of operations.
We rely on our information technology systems for many enterprise-critical functions and a prolonged failure or interruption of these systems for any reason could cause significant disruption to our operations and have a material adverse effect on our business, financial condition and operating results. Our information technology and application systems may be vulnerable to threats from computer viruses, natural disasters, unauthorized access, cyber attack and other similar disruptions. Computer hackers may be able to penetrate our network’s system security and misappropriate or compromise confidential information, create system disruptions or cause shutdowns. In addition to our own confidential information, we sometimes receive and are required to protect confidential information from third parties. To the extent any disruption or security breach results in a loss or damage to our data, or inappropriate disclosure of our confidential information or that of others, it could cause significant financial losses that are either not insured against or not fully covered by insurance, damage to our reputation, affect our relationships with third parties, lead to claims against us, result in regulatory action, or otherwise have a material adverse effect on our business or results of operations.
27
In addition, we may be required to incur significant costs to mitigate the damage caused by any security breach, or to protect against future damage. Moreover, although we have disaster recovery and business continuity plans in place, we may not be able to adequately execute these plans in a timely fashion in the event of a disruption to our information technology and application systems.
We may incur losses resulting from operational risk due to inadequate or failed internal processes, breakdown of settlement or communication systems, inadequate execution of strategy or from external events leading to disruption of our business. Events subject to operational risk include:
|
•
|
Internal Fraud-misappropriation of assets, intentional mismarking of positions
|
|
•
|
External Fraud-theft of information, third-party theft and forgery
|
|
•
|
Clients, Products, & Business Practice-improper trade, fiduciary breaches
|
|
•
|
Damage to Physical Assets-vandalism
|
|
•
|
Business Disruption & System Failures-software failures, hardware failures; and
|
|
•
|
Execution, Delivery, & Process Management-data entry errors, accounting errors, failed mandatory reporting, settlement errors, and negligence.
|
We may be adversely affected by failures in services or products provided by third parties.
We have outsourced and may continue to outsource certain segments of our operations and business, and rely upon third-party vendors for other essential services and information, such as the provision of data used in setting loss reserves and the provision of risk management information and services. A material failure by an external service or information provider or a material defect in the products, services or information provided thereby could adversely affect our financial condition and results of operations.
Our inability to attract and retain qualified executives and employees or the loss of any of these personnel could negatively impact our business.
Our ability to execute on our business strategies depend on the retention and recruitment of qualified executives and other professionals. We rely substantially upon the services of our current executive team. In addition to these officers, we require key staff with risk mitigation, structured finance, insurance, credit, investment, accounting, finance, legal and technical skills. As a result of Ambac’s financial situation and the rehabilitation proceedings for the Segregated Account, there is a higher risk that executive officers and other key staff will leave the Company and replacements may not be incented to join the Company. The loss of the services of members of our senior management team or our inability to hire and retain other talented personnel could delay or prevent us from succeeding in executing our strategies, which could further negatively impact our business.
None.
The executive office of Ambac is located at One State Street Plaza, New York, New York 10004, which consists of approximately 103,500 square feet of office space, under a lease agreement that expires in December 2015. The lease has a provision where Ambac Assurance can remain at One State Street Plaza through September 2019 (requires consent of both parties) with the potential for a reduced amount of space. In February 2015, both parties committed to extending the lease term with the rental cost still to be determined. This office houses operations for all reportable business segments. Ambac leases additional space outside of New York for its data center at a secure facility under a lease agreement that expires in May 2019.
Ambac UK maintains offices in London, England, which consist of approximately 3,500 square feet of office space, under a lease agreement that expires in October 2020, with an earlier termination option at Ambac UK’s discretion; and in Milan, Italy, under a lease agreement that expires in December 2015.
Additionally, Ambac maintains a disaster recovery site as part of its Disaster Recovery Plan, which is located approximately 100 miles from One State Street Plaza under a lease that expires in December 2015. This remote warm-back-up facility is complete with user work stations, phone system, data center, internet connectivity and a power generator, capable of serving the needs of the disaster recovery team to support all business segment operations. The plan, facility and systems are revised and upgraded where necessary, and user tested annually to confirm their readiness.
Please refer to Notes to the Consolidated Financial Statements—Note 18. Commitments and Contingencies included included in Part II, Item 8 in this Form 10-K for a discussion on legal proceedings against Ambac and its subsidiaries.
28
Not applicable.
|
Item 5.
|
Market for Registrant's Common Equity, Related Stockholder Matters and Issuer Purchases of Equity Securities
|
Market Information
On May 1, 2013 (the “Effective Date”), all of the outstanding common stock and all other equity securities, including stock options and restricted stock units of the Predecessor Company, were cancelled pursuant to the terms of the Reorganization Plan. Prior to the Effective Date, Ambac’s common stock traded on the OTCQB, the middle tier of the OTC marketplace reserved for fully reporting issuers, under the symbol “ABKFQ”. The common stock of the Successor Company began trading on NASDAQ under the symbol “AMBC” on the Effective Date. The Successor Company authorized capital stock consists of 130 million shares of common stock and 20 million shares of preferred stock. Under the Reorganization Plan, Ambac also distributed warrants to holders of allowed general unsecured claims and subordinated debt securities, which entitle such holders to acquire additional shares of new common stock of the Company at an exercise price of $16.67 per share at any time on or prior to April 30, 2023 (
5,039,877
warrants remain outstanding at December 31, 2014).
The following table sets forth the high and low bid quotations of Ambac’s Common Stock as reported by Bloomberg Financial Services, Inc. for the periods presented.
|
High
|
Low
|
Dividends
|
|||||||||
|
2014:
|
|||||||||||
|
Fourth quarter
|
$
|
26.74
|
|
$
|
18.60
|
|
$
|
—
|
|
||
|
Third quarter
|
$
|
27.54
|
|
$
|
21.86
|
|
$
|
—
|
|
||
|
Second quarter
|
$
|
32.20
|
|
$
|
26.37
|
|
$
|
—
|
|
||
|
First quarter
|
$
|
35.61
|
|
$
|
22.00
|
|
$
|
—
|
|
||
|
2013:
|
|||||||||||
|
Fourth quarter
|
$
|
25.16
|
|
$
|
15.03
|
|
$
|
—
|
|
||
|
Third quarter
|
$
|
25.70
|
|
$
|
17.64
|
|
$
|
—
|
|
||
|
Second quarter (beginning May 1)
|
$
|
27.25
|
|
$
|
18.00
|
|
$
|
—
|
|
||
Holders
On
February 25, 2015
, there were
34
stockholders of record of Ambac’s common stock.
Dividends
Information concerning payments and restrictions on the payment of dividends is set forth in Item 1 above under the caption “Insurance Regulatory Matters" Note 9. Insurance Regulatory Restrictions to the Consolidated Financial Statements included in Part II, Item 8 in this Form 10-K.
Purchases of Equity Securities By the Issuer and Affiliated Purchasers
The following table summarizes Ambac’s activity of share purchases during the fourth quarter of
2014
. When restricted stock unit awards issued by Ambac become taxable compensation to employees, shares may be withheld to cover the employee’s withholding taxes. In December
2014
, Ambac purchased shares from employees that settled restricted stock units to meet the required tax withholdings.
|
Total Shares
Purchased
|
Average Price
Paid Per Share
|
Total Number of
Shares Purchased
as Part of Publicly
Announced Plan
|
Maximum
Number of Shares
That May Yet Be
Purchased Under
the Plan
|
|||||||||
|
October 2014
|
—
|
|
$
|
—
|
|
—
|
|
—
|
|
|||
|
November 2014
|
—
|
|
—
|
|
—
|
|
—
|
|
||||
|
December 2014
|
1,522
|
|
24.04
|
|
—
|
|
—
|
|
||||
|
Fourth Quarter 2014
|
1,522
|
|
$
|
24.04
|
|
—
|
|
—
|
|
|||
29
There were no other repurchases of equity securities made during the three months ended
December 31, 2014
. Ambac does not have a stock repurchase program.
30
Stock Performance Graph
The following graph compares the performance of an investment in our common stock from the close of business on May 1, 2013, the date we emerged from bankruptcy through December 31, 2014, with the Russell 2000 Index and the S&P 500 Financials Index. The graph assumes $100 was invested on May 1, 2013 in our common Stock at the closing price of $20 per share and at the closing price for the Russell 2000 Index and the S&P 500 Financials Index. It also assumes that dividends (if any) were reinvested on the date of payment without payment of any commissions. The performance shown in the graph represents past performance and should not be considered an indication of future performance.
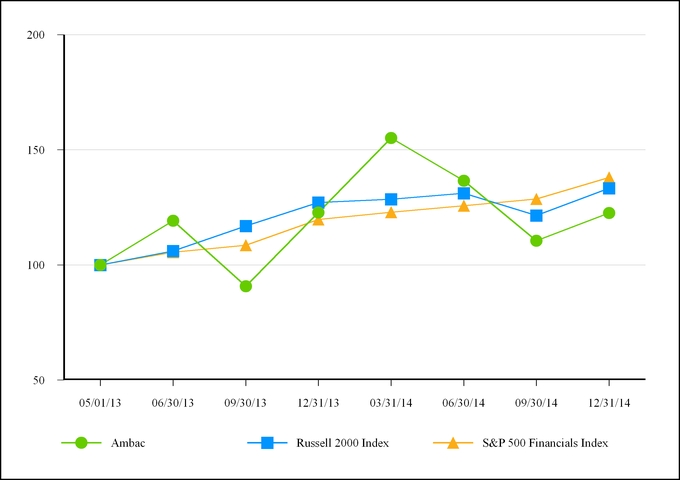
|
05/01/13
|
06/30/13
|
09/30/13
|
12/31/13
|
03/31/14
|
06/30/14
|
09/30/14
|
12/31/14
|
|||||||||
|
Ambac
|
$100.00
|
$119.15
|
$90.70
|
$122.80
|
$155.15
|
$136.55
|
$110.50
|
$122.50
|
||||||||
|
Russell 2000 Index
|
$100.00
|
$106.06
|
$116.89
|
$127.08
|
$128.50
|
$131.13
|
$121.48
|
$133.30
|
||||||||
|
S&P 500 Index
|
$100.00
|
$105.48
|
$108.51
|
$119.72
|
$122.85
|
$125.67
|
$128.60
|
$137.92
|
||||||||
Source: S&P Capital IQ
31
|
Item 6.
|
Selected Financial Data
|
The following financial information for the five years ended
December 31, 2014
, has been derived from Ambac’s Consolidated Financial Statements. Following the Company’s emergence from bankruptcy on May 1, 2013, the consolidated financial statements reflect the application of fresh start reporting (“Fresh Start”), incorporating, among other things, the discharge of debt obligations, issuance of new common stock and fair value adjustments. The effects of the reorganization and Fresh Start adjustments are recorded in Predecessor Ambac’s Consolidated Statement of Total Comprehensive Income for the period ended April 30, 2013. The financial results of the Company for the periods from May 1, 2013 are referred to as “Successor” and the financial results for the periods through April 30, 2013 are referred to as “Predecessor”. The 2013 Successor Period and the 2013 Predecessor Period are distinct reporting periods. As a result of the implementation of Fresh Start, results and balances are not comparable between Successor Ambac and Predecessor Ambac. This information should be read in conjunction with the Consolidated Financial Statements and related notes located in Part II, Item 8 in this Form 10-K.
|
Successor Ambac
|
Predecessor Ambac
|
|||||||||||||||||||||||
|
Period from
|
Period from
|
|||||||||||||||||||||||
|
Year Ended
|
May 1 through
|
Jan. 1 through
|
Year Ended December 31,
|
|||||||||||||||||||||
|
($ in millions, except per share data)
|
December 31,
2014
|
December 31,
2013
|
April 30,
2013
|
2012
|
2011
|
2010
|
||||||||||||||||||
|
|
||||||||||||||||||||||||
|
Gross premiums written
|
$
|
(288.3
|
)
|
$
|
(80.3
|
)
|
$
|
(14.1
|
)
|
$
|
(277.5
|
)
|
(179.0
|
)
|
(476.1
|
)
|
||||||||
|
Net premiums earned
|
246.4
|
|
213.5
|
|
130.0
|
|
414.6
|
|
406.0
|
|
546.0
|
|
||||||||||||
|
Net investment income
|
300.9
|
|
146.4
|
|
116.7
|
|
382.9
|
|
354.8
|
|
358.6
|
|
||||||||||||
|
Other than temporary impairment losses
|
(25.8
|
)
|
(46.8
|
)
|
(0.5
|
)
|
(6.0
|
)
|
(63.8
|
)
|
(59.8
|
)
|
||||||||||||
|
Net realized investment gains
|
58.8
|
|
4.5
|
|
53.3
|
|
72.1
|
|
17.3
|
|
159.5
|
|
||||||||||||
|
Net change in fair value of credit derivatives
|
23.9
|
|
192.9
|
|
(60.4
|
)
|
(9.2
|
)
|
48.0
|
|
60.2
|
|
||||||||||||
|
Derivative products revenue
|
(181.1
|
)
|
114.8
|
|
(33.7
|
)
|
(125.0
|
)
|
(280.8
|
)
|
(106.6
|
)
|
||||||||||||
|
Net realized (losses) gains on extinguishment of debt
|
(74.7
|
)
|
—
|
|
—
|
|
(177.6
|
)
|
3.1
|
|
—
|
|
||||||||||||
|
Income (loss) on Variable Interest Entities ("VIEs")
|
(32.2
|
)
|
(48.6
|
)
|
426.6
|
|
27.8
|
|
(214.4
|
)
|
(616.7
|
)
|
||||||||||||
|
Loss and loss expenses (benefit)
(1)
|
(545.6
|
)
|
(185.1
|
)
|
(38.1
|
)
|
683.6
|
|
1,859.5
|
|
719.4
|
|
||||||||||||
|
Interest and underwriting and operating expenses
|
229.0
|
|
153.7
|
|
75.6
|
|
251.3
|
|
269.4
|
|
435.8
|
|
||||||||||||
|
Insurance intangible amortization
|
151.8
|
|
99.7
|
|
—
|
|
—
|
|
—
|
|
—
|
|
||||||||||||
|
Reorganization items
|
0.2
|
|
0.5
|
|
(2,745.2
|
)
|
7.2
|
|
49.9
|
|
32.0
|
|
||||||||||||
|
Pre-tax income (loss) from continuing operations
|
493.3
|
|
512.3
|
|
3,348.0
|
|
(256.5
|
)
|
(1,882.9
|
)
|
(753.0
|
)
|
||||||||||||
|
Net income (loss) attributable to Common Shareholders
|
484.1
|
|
505.2
|
|
3,349.0
|
|
(256.7
|
)
|
(1,960.4
|
)
|
(753.2
|
)
|
||||||||||||
|
Total comprehensive income attributable to Ambac Financial Group, Inc.
|
692.7
|
|
516.9
|
|
3,523.9
|
|
(94.6
|
)
|
(1,788.9
|
)
|
(439.6
|
)
|
||||||||||||
|
Net income (loss) per share:
|
||||||||||||||||||||||||
|
Basic
|
$
|
10.73
|
|
$
|
11.23
|
|
$
|
11.07
|
|
$
|
(0.85
|
)
|
$
|
(6.48
|
)
|
$
|
(2.56
|
)
|
||||||
|
Diluted
|
$
|
10.31
|
|
$
|
10.91
|
|
$
|
11.07
|
|
$
|
(0.85
|
)
|
$
|
(6.48
|
)
|
$
|
(2.56
|
)
|
||||||
|
(1)
|
Ambac records the impact of estimated recoveries related to securitized loans in RMBS transactions that breached certain representations and warranties within loss and loss expenses (benefit). The expense (benefit) associated with changes to our estimated recoveries for the year ended December 31, 2014, the eight months ended December 31, 2013, the four months ended April 30, 2013 and the years ended December 31, 2012, 2011 and 2010 were $(481.6) million, $199.4 million, $(61.6) million, $195.2 million, $(301.1) million and $(365.0) million, respectively.
|
32
|
Successor Ambac
|
Predecessor Ambac
|
|||||||||||||||||||
|
December 31,
|
December 31,
|
|||||||||||||||||||
|
($ in millions)
|
2014
|
2013
|
2012
|
2011
|
2010
|
|||||||||||||||
|
|
||||||||||||||||||||
|
Total non-variable interest entity investments
|
$
|
5,507.0
|
|
$
|
6,523.7
|
|
$
|
6,329.9
|
|
$
|
6,877.0
|
|
$
|
6,853.3
|
|
|||||
|
Cash
|
73.9
|
|
77.4
|
|
43.8
|
|
16.0
|
|
9.5
|
|
||||||||||
|
Premium receivable
|
1,000.6
|
|
1,453.0
|
|
1,620.6
|
|
2,028.5
|
|
2,422.6
|
|
||||||||||
|
Insurance intangible asset
|
1,410.9
|
|
1,598.0
|
|
—
|
|
—
|
|
—
|
|
||||||||||
|
Goodwill
|
514.5
|
|
514.5
|
|
—
|
|
—
|
|
—
|
|
||||||||||
|
Subrogation recoverable
(1)
|
953.3
|
|
498.5
|
|
497.3
|
|
659.8
|
|
714.3
|
|
||||||||||
|
Deferred ceded premium
|
123.3
|
|
145.5
|
|
177.9
|
|
221.3
|
|
264.9
|
|
||||||||||
|
Total VIE assets
|
15,126.1
|
|
15,988.7
|
|
17,841.9
|
|
16,543.2
|
|
17,930.8
|
|
||||||||||
|
Total assets
|
25,159.9
|
|
27,092.5
|
|
27,085.3
|
|
27,113.7
|
|
29,047.1
|
|
||||||||||
|
Liabilities subject to compromise
|
—
|
|
—
|
|
1,704.9
|
|
1,707.4
|
|
1,695.2
|
|
||||||||||
|
Unearned premiums
|
1,673.8
|
|
2,255.7
|
|
2,778.4
|
|
3,457.2
|
|
4,007.9
|
|
||||||||||
|
Losses and loss expense reserve
(1)
|
4,752.0
|
|
5,968.7
|
|
6,619.5
|
|
7,044.1
|
|
5,288.7
|
|
||||||||||
|
Obligations under investment and repurchase agreements
|
160.1
|
|
359.1
|
|
362.0
|
|
546.5
|
|
805.6
|
|
||||||||||
|
Long-term debt
(2)
|
971.1
|
|
963.2
|
|
150.2
|
|
223.6
|
|
208.3
|
|
||||||||||
|
Derivative liabilities
|
406.9
|
|
253.9
|
|
531.3
|
|
414.5
|
|
348.8
|
|
||||||||||
|
Total VIE liabilities
|
15,085.7
|
|
15,872.8
|
|
17,661.7
|
|
16,379.4
|
|
17,696.4
|
|
||||||||||
|
Total liabilities
|
23,486.1
|
|
26,114.1
|
|
30,332.2
|
|
30,263.2
|
|
30,401.3
|
|
||||||||||
|
Total stockholders’ equity (deficit)
|
1,673.7
|
|
978.4
|
|
(3,247.0
|
)
|
(3,149.5
|
)
|
(1,354.2
|
)
|
||||||||||
|
Total liabilities and stockholders' equity
|
$
|
25,159.9
|
|
$
|
27,092.5
|
|
$
|
27,085.3
|
|
$
|
27,113.7
|
|
$
|
20,047.1
|
|
|||||
|
(1)
|
Ambac records as a component of its loss reserves and subrogation recoverable, estimated recoveries related to securitized loans in RMBS transactions that breached certain representations and warranties. Ambac has recorded estimated recoveries of $2,523.5 million, $2,206.6 million, $2,523.2 million, $2,720.3 million and $2,417.1 million at December 31, 2014, 2013, 2012, 2011 and 2010, respectively.
|
|
(2)
|
Long-term debt represents surplus notes issued to third parties by Ambac Assurance and the Segregated Account. In 2014, Ambac sold a $350.0 million junior surplus note issued to it by the Segregated Account to a newly formed Trust in exchange for cash of $224.3 million and a subordinated owner trust certificate issued by the Trust. Long-term debt for all years excludes the portion of long-term debt associated with variable interest entities. Long-term debt associated with Ambac is included under liabilities subject to compromise in Predecessor Ambac.
|
|
Item 7.
|
Management’s Discussion and Analysis of Financial Condition and Results of Operations
|
This Management’s Discussion and Analysis of Financial Condition and Results of Operations (“MD&A”) contains certain financial measures, in particular the presentation of Operating Earnings (Losses) and Adjusted Book Value, which are not presented in accordance with accounting principles generally accepted in the United States (“GAAP”). We are presenting these non-GAAP financial measures because they provide greater transparency and enhanced visibility into the underlying drivers of our business. We do not intend for these non-GAAP financial measures to be a substitute for any GAAP financial measures and they may differ from similar reporting provided by other companies. Readers of this Form 10-K should use these non-GAAP financial measures only in conjunction with the comparable GAAP financial measures. Operating Earnings (Losses) and Adjusted Book Value are non-GAAP financial measures that adjust for the impact of certain non-recurring or non-economic GAAP accounting requirements and include the addition of certain items that the Company has or expects to realize in the future, but that are not reported under GAAP. We also provide reconciliations to the most directly comparable GAAP measures; Operating Earnings (Losses) to Net income (loss) attributable to common stockholders and Adjusted Book Value to Total Ambac Financial Group, Inc. stockholders’ equity.
COMPANY OVERVIEW
Ambac Financial Group, Inc. (“Ambac” or the “Company”), headquartered in New York City, is a financial services holding company incorporated in the state of Delaware. On May 1, 2013, the Second Modified Fifth Amended Plan of Reorganization of Ambac Financial Group, Inc. (the “Reorganization Plan”) became effective and Ambac emerged from bankruptcy. On December 26, 2013, the United States Bankruptcy Court for the Southern District of New York (the “Bankruptcy Court”) entered an order of final decree closing Ambac’s Chapter 11 case. Ambac filed a voluntary petition for relief under Chapter 11 of the United States Bankruptcy Code in the Bankruptcy Court on November 8, 2010 as a result of losses incurred since the beginning of the financial crisis in 2007. Ambac has two reportable business segments: Financial Guarantee and Financial Services.
Ambac’s primary goal is to maximize shareholder value through executing the following key strategies:
|
•
|
Increasing the value of its investment in Ambac Assurance Corporation ("Ambac Assurance") by actively managing its assets and liabilities with a focus on maximizing risk-adjusted investment portfolio returns and mitigating or remediating losses on poorly performing insured
|
33
transactions through executing policy commutations, repurchasing liabilities at a discount, pursuing recoveries of losses through litigation and the exercise of contractual and legal rights, restructuring transactions, and other means; and
|
•
|
Selectively exploring opportunities to grow and diversify Ambac, which may include developing or acquiring financial services businesses such as advisory, asset servicing, asset management, and/or insurance.
|
As part of its asset/liability management strategy, Ambac Assurance is considering the possibility of entering into transactions whereby it would monetize certain assets and/or restructure or exchange its outstanding debt and insurance obligations.
The execution of Ambac’s strategy to increase the value of its investment in Ambac Assurance is subject to the authority of the Rehabilitator to control the management of the Segregated Account. In exercising such authority, the Rehabilitator will act for the benefit of policyholders, and will not take into account the interests of Ambac. Similarly, by operation of the contracts executed in connection with the establishment, and subsequent rehabilitation, of the Segregated Account, the Rehabilitator retains rights to oversee and approve certain actions taken by or in respect of Ambac Assurance. This oversight by the Rehabilitator could impair Ambac’s ability to execute certain of its strategies. Refer to Note 1. Background and Business Description to the Consolidated Financial Statements included in Part II, Item 8 in this Form 10-K, for more information on the contracts between Ambac Assurance and the Segregated Account.
Although we are exploring new business opportunities for Ambac, no assurance can be given that we will be able to identify or execute the acquisition or development of any new business. In addition, there can be no assurance that we will be able to generate or obtain the financial and other resources that may be required to finance the acquisition or development of any new business. Due to these factors, as well as uncertainties relating to the ability of Ambac Assurance to deliver value to Ambac, the value of our securities is speculative. For additional risks and uncertainties concerning Ambac, please refer to Part I, Item 1A in this Form 10-K.
There are substantial restrictions on the ability to transfer Ambac’s common stock set forth in Article XII of Ambac’s Amended and Restated Certificate of Incorporation. In order to preserve certain tax benefits, subject to limited exceptions, any attempted transfer of common stock shall be prohibited and void to the extent that, as a result of such transfer (or any series of transfers of which such transfer is a part), either (i) any person or group of persons shall become a holder of 5% or more of the Company’s common stock or (ii) the percentage stock ownership interest in Ambac of any holder of 5% or more of the Company’s common stock shall be increased (a “Prohibited Transfer”). These restrictions shall not apply to an attempted transfer if the transferor or the transferee obtains the written approval of Ambac’s Board of Directors to such transfer. A purported transferee of a Prohibited Transfer shall not be recognized as a stockholder of Ambac for any purpose whatsoever in respect of the securities which are the subject of the Prohibited Transfer (the “Excess Securities”). Until the Excess Securities are acquired by another person in a transfer that is not a Prohibited Transfer, the purported transferee of a Prohibited Transfer shall not be entitled with respect to such Excess Securities to any rights of stockholders of Ambac, including, without limitation, the right to vote such Excess Securities and to receive dividends or distributions, whether liquidating or otherwise, in respect thereof, if any. Once the Excess Securities have been acquired in a transfer that is not a Prohibited Transfer, the securities shall cease to be Excess Securities. If the Board determines that a transfer of securities constitutes a Prohibited Transfer then, upon written demand by Ambac, the purported transferee shall transfer or cause to be transferred any certificate or other evidence of ownership of the Excess Securities within the purported transferee’s possession or control, together with any distributions paid by Ambac with respect to such Excess Securities, to an agent designated by Ambac. Such agent shall thereafter sell such Excess Securities and the proceeds of such sale shall be distributed as set forth in the Amended and Restated Certificate of Incorporation. If the purported transferee of a Prohibited Transfer has resold the Excess Securities before receiving such demand, such person shall be deemed to have sold the Excess Securities for Ambac’s agent and shall be required to transfer to such agent the proceeds of such sale, which shall be distributed as set forth in the Amended and Restated Certificate of Incorporation.
CRITICAL ACCOUNTING POLICIES AND ESTIMATES
The discussion and analysis of our financial condition and results of operations is based upon our Consolidated Financial Statements, which have been prepared in accordance with GAAP. An appreciation of our critical accounting policies is necessary to understand our financial results. These policies require management to make difficult and subjective judgments regarding uncertainties, and as a result, such estimates may significantly impact our financial results. The precision of these estimates and the likelihood of future changes depend on a number of underlying variables and a range of possible outcomes. As a result, actual results may differ from these estimates. We applied our critical accounting policies and estimation methods consistently in all material respects, and for all periods presented. Management has identified (i) the accounting for loss and loss expenses of non-derivative financial guarantees, (ii) the valuation of financial instruments, including the determination of whether an investment impairment is other-than-temporary, (iii) valuation allowance on deferred tax assets, and (iv) goodwill as critical accounting policies. This discussion should be read in conjunction with the Consolidated Financial Statements and notes thereon included elsewhere in this report. We have discussed with the Audit Committee management’s assessment of such critical accounting policies, the reasons why they are considered critical, and how current and anticipated future events impact those determinations. The Company’s critical accounting policies and estimates are as follows:
Losses and Loss Expenses of Non-derivative Financial Guarantees:
The loss and loss expense reserves for financial guarantee insurance discussed herein relates only to Ambac’s non-derivative insurance business for insurance policies issued to beneficiaries, including VIEs, for which we do not consolidate the VIE. Losses and loss expenses are based upon estimates of the ultimate aggregate losses inherent in the non-derivative financial guarantee portfolio as of the reporting date. The evaluation process for determining the level of reserves is subject to certain estimates and judgments based on our assumptions regarding the probability
34
of default by the issuer of the insured security, probability of settlement outcomes (which may include commutation settlements, refinancings and/or other settlement outcomes) and expected loss severity of credits for each insurance contract.
The Financial Services-Insurance Topic of the ASC provides accounting guidance for financial guarantee insurance contracts issued by insurance enterprises, including the recognition and measurement of claim liabilities (i.e. loss reserves). Loss reserve components of an insurance policy include unpaid claims plus the present value ("PV") of expected net cash flows, further described below:
|
•
|
Unpaid claims represent the sum of (i) claims presented and not yet paid for policies allocated to the Segregated Account, including Deferred Amounts and (ii) accrued interest on Deferred Amounts (generally at an effective rate of
5.1%
) as required by the amended Segregated Account Rehabilitation Plan that became effective on June 12, 2014. Refer to Note 1. Background and Business Description to the Consolidated Financial Statements located in Part II Item 8 of this Form 10-K for further discussion of Deferred Amounts and the amended Segregated Account Rehabilitation Plan. In accordance ASC Topic 944, unpaid claims are measured based on the estimated cost of settling the claims, which is principal plus accrued interest.
|
|
•
|
The PV of expected net cash flows represents the PV of expected cash outflows less the PV of expected cash inflows. Expected cash
outflows
represent future claims to be paid under an insurance contract, including commutation payments and the impact of potential settlement outcomes upon future installment premiums. Expected cash
inflows
represent potential future recoveries. In accordance with the financial guarantee insurance accounting guidance of ASC Topic 944, the approaches used to estimate expected future claims and expected future recoveries considers the likelihood of all possible outcomes.
|
Net cash
outflow
policies represent contracts where the sum of unpaid claims plus the PV of expected cash outflows are greater than the PV of expected cash inflows. For such policies, a “Loss and loss expense reserves” liability is recorded for the sum of: a) unpaid claims plus b) the excess of the PV of expected net cash outflows over the unearned premium reserve. Net cash
inflow
policies represent contracts where losses have been paid, but not yet recovered, such that the PV of expected cash inflows are greater than the sum of unpaid claims plus the PV of expected cash outflows. For such policies, a “Subrogation recoverable” asset is recorded for the difference between a) the PV of expected net cash inflows and b) unpaid claims. Changes to the loss reserve estimate in subsequent periods are recorded as a loss and loss expense on the income statement.
Ambac’s loss reserves are based on management’s on-going review of the non-derivative financial guarantee insurance portfolio. Active surveillance of the insured portfolio enables Ambac’s Portfolio Risk Management (“PRM”) group to track credit migration of insured obligations from period to period and update internal credit ratings for each transaction. Non-adversely classified credits are assigned a Class I or Survey List (“SL”) risk classification, while adversely classified credits are assigned a risk classification of Class IA through Class V. The criteria for an exposure to be assigned an adversely classified credit rating includes the deterioration of an issuer’s financial condition, under-performance of the underlying collateral (for collateral dependent transactions such as mortgage-backed or student loan securitizations), poor performance by the servicer of the underlying collateral and other adverse economic events or trends. The servicer of the underlying collateral of an insured securitization transaction is a consideration in assessing credit quality because the servicer’s performance can directly impact the performance of the related issue. For example, a servicer of a mortgage-backed securitization that does not remain current in its collection and loss mitigation efforts could cause an increase in delinquencies and potential defaults of the underlying obligations. Similarly, loss severities increase when a servicer does not effectively handle loss mitigation activities such as (i) the advancing of delinquent principal and interest and default-related expenses which are deemed to be recoverable by the servicer, (ii) pursuit of loan charge-offs which maximize cash flows from the mortgage loan pool and (iii) foreclosure and real estate owned disposition strategies and timelines.
The population of credits evaluated in Ambac’s loss reserve process are (i) all adversely classified credits and (ii) non-adversely classified credits which have a lower internal Ambac credit rating than the rating at the time of the transaction’s inception. One of two approaches is then utilized to estimate expected losses to ultimately determine if a loss reserve should be established. The first approach is a statistical expected loss approach, which considers the likelihood of all possible outcomes. The “base case” statistical expected loss is the product of: (i) the par outstanding on the credit; (ii) internally developed historical default information (taking into consideration internal ratings and average life of an obligation); (iii) internally developed loss severities; and (iv) a discount factor. The loss severities and default information are based on rating agency information, are specific to each bond type and were established and approved by senior officers of the PRM group. For certain credit exposures, Ambac’s additional monitoring, loss remediation efforts and probabilities of potential settlement outcomes may provide information relevant to adjust this estimate of “base case” statistical expected losses. Analysts may accept the “base case” statistical expected loss as the best estimate of expected loss or assign multiple probability weighted scenarios to determine an adjusted statistical expected loss that better reflects management’s view of a given transaction’s expected losses, as well as the potential for additional remediation activities (i.e. commutations).
The second approach entails the use of more precise estimates of expected losses (future claim payments, net of potential recoveries, expected to be paid to the holder of the insured financial obligation). Ambac’s surveillance group will consider the likelihood of all possible outcomes and develop appropriate cash flow scenarios. This approach can include the utilization of internal or third party models to project future losses and resultant claim payment estimates. We utilize cash flow models for residential mortgage-backed, student loan and other exposures. In general, these models use historical performance of the collateral pools in order to then assume or derive future performance characteristics, such as default and voluntary prepayment rates, which in turn determine projected future claim payments. In this approach a probability-weighted expected loss estimate is developed based on assigning probabilities to multiple claim payment scenarios and applying an appropriate discount factor. Additionally, we assign a probability to the issuer’s ability to refinance an insured issue and/or Ambac’s ability to execute a potential settlement (i.e. commutation) of the insurance policy, including the impact on future installment premiums. The commutation scenarios and the related probabilities of occurrence vary by transaction, depending on our view of the likelihood of negotiating such a transaction with issuers and/or investors. The methodology used to estimate the most substantial amount of the potential recovery component of expected losses is further
35
described in the “RMBS Representation and Warranty Subrogation Recovery” section below and in Note 2. Basis of Presentation and Significant Accounting Policies to the Consolidated Financial Statements, included in Part II, Item 8 in this Form 10-K.
The discount factor applied to the statistical expected loss approach is based on a risk-free discount rate corresponding to the remaining expected weighted-average life of the exposure and the exposure currency. For the cash flow scenario approach, discount factors are applied based on a risk-free discount rate term structure and correspond to the date of each respective cash flow payment or recovery and the exposure currency. Discount factors are updated for the current risk-free rate each reporting period.
Ambac establishes loss expense reserves based on our estimate of expected net cash outflows for loss expenses, such as legal and consulting costs.
As the probability of default for an individual credit increases and/or the severity of loss given a default increases, our loss reserve for that insured obligation will also increase. Political, economic, credit or other unforeseen events could have an adverse impact on default probabilities and loss severities. The loss reserves for many transactions (such as many public finance exposures) are derived from the issuer’s creditworthiness. The loss reserves for other transactions which have no direct issuer support, such as most structured finance exposures, including RMBS, are derived from the default activity and loss given default of collateral supporting the transactions. Many transactions have a combination of issuer/entity and collateral support. Loss reserves reflect our assessment of the transaction’s overall structure, support and expected performance. Loss reserve volatility will be a direct result of the credit performance of our insured portfolio, including the number, size, bond types and quality of credits included in our loss reserves as well as our ability to execute commutations. The number and severity of credits included in our loss reserves depend to a large extent on transaction specific attributes, but will generally increase during periods of economic stress and decline during periods of economic stability. Reinsurance contracts mitigate our loss reserve. Since Ambac has little exposure ceded to reinsurers, it is unlikely to have a significant effect on loss reserve volatility.
The table below indicates the gross par outstanding and gross loss reserves (including loss expenses) related to policies in Ambac’s loss and loss expense reserves at
December 31, 2014 and 2013
:
|
December 31,
|
|||||||||||||||
|
2014
|
2013
|
||||||||||||||
|
($ in millions)
|
Gross par
outstanding
(1)
|
Gross Loss and Loss Expense
Reserves
(1)(2)(3)
|
Gross par
outstanding
(1)
|
Gross Loss and Loss Expense
Reserves
(1)(2)(3)
|
|||||||||||
|
RMBS
|
$
|
9,713
|
|
$
|
1,915
|
|
$
|
11,683
|
|
$
|
3,312
|
|
|||
|
Student Loans
|
1,764
|
|
879
|
|
2,352
|
|
982
|
|
|||||||
|
Domestic Public Finance
|
4,796
|
|
354
|
|
5,019
|
|
338
|
|
|||||||
|
Ambac UK
|
951
|
|
|
542
|
|
|
1,844
|
|
|
633
|
|
||||
|
All other credits
|
1,099
|
|
15
|
|
1,309
|
|
94
|
|
|||||||
|
Loss expenses
|
—
|
|
94
|
|
—
|
|
111
|
|
|||||||
|
Totals
|
$
|
18,323
|
|
$
|
3,799
|
|
$
|
22,207
|
|
$
|
5,470
|
|
|||
|
(1)
|
Ceded par outstanding and ceded loss and loss expense reserves at
December 31, 2014 and 2013
, are $915 and $100 and $901 and $122, respectively. Ceded loss and loss expense reserves are included in Reinsurance recoverable on paid and unpaid losses.
|
|
(2)
|
Loss and Loss Expense reserves at
December 31, 2014
of
$3,799
are included in the balance sheet in the following line items: Loss and loss expense reserves:
$4,752
and Subrogation recoverable:
$953
. Loss and Loss Expense reserves at
December 31, 2013
of
$5,470
are included in the balance sheet in the following line items: Loss and loss expense reserves: $
5,968
and Subrogation recoverable: $
498
.
|
|
(3)
|
Included in Gross Loss and Loss Expense Reserves are unpaid claims of
$3,274
and
$3,904
at
December 31, 2014 and 2013
, respectively, related to policies allocated to the Segregated Account, inclusive of accrued interest payable on Deferred Amounts of $329 and $0, respectively.
|
RMBS
Ambac insures RMBS transactions collateralized by first-lien mortgages. Ambac classifies its insured first-lien RMBS exposure principally into two broad credit risk classes: mid-prime (including Alt-A, interest only, and negative amortization) and sub-prime. Mid-prime loans were typically made to borrowers who had stronger credit profiles relative to sub-prime loans, but weaker than prime loans. Compared with mid-prime loans, sub-prime loans typically had higher loan-to-value ratios, reflecting the greater difficulty that sub-prime borrowers have in making down payments and the propensity of these borrowers to extract equity during refinancing.
Ambac has also insured RMBS transactions collateralized predominantly by second-lien mortgage loans such as closed-end seconds and home equity lines of credit. A second-lien mortgage loan is a type of loan in which the borrower uses the equity in their home as collateral and the second-lien loan is subordinate to the first-lien loan outstanding on the home. Borrowers are obligated to make monthly payments on both their first and second-lien loans. If the borrower defaults on the payments due under these loans and the property is subsequently liquidated, the liquidation proceeds are first utilized to pay off the first-lien loan (as well as costs due the servicer) and any remaining funds are applied to pay off the second-lien loan. As a result of this subordinate position to the first-lien loan, second-lien loans carry a significantly higher severity in the event of a loss, typically at or above 100% in the current housing market.
36
Method for Estimating Expected Losses in our RMBS Portfolio
Ambac primarily utilizes a licensed third-party cash flow model (“regression model”) to develop estimates of projected losses for both our first and second lien transactions. The regression model projects losses utilizing: (i) the RMBS transaction’s collateral characteristics and status, (ii) the RMBS transaction’s payment waterfall structure, including the application of interest and principal payments and recoveries, (iii) projected home price appreciation (“HPA”), and (iv) projected interest rates. We provide the regression model vendor with HPA projections from a recognized source and interest rate projections we develop from market sources. We generally utilize waterfall structures from a market accepted vendor of securitization deal structures. In some cases, we may utilize an internally developed waterfall structure when our legal and commercial analysis of the transaction’s payment structure differs from the vendor’s waterfall structure. We compare monthly claims submitted against the trustees’ reports, third-party provided waterfall models and our understanding of the transactions’ structures to identify and resolve discrepancies. We also review the vendor’s published waterfall revisions to further identify material discrepancies. Resolving discrepancies is challenging and may take place over an extended period of time. Moreover, transaction documents are subject to interpretation, and our interpretation or that of the vendor and as reflected in our loss reserves may prove to be incorrect and/or not consistent with trustees directing cash flows in the future.
The regression model is subject to ongoing refinements resulting from industry research as well as performance analysis that may better inform model assumptions, improvements to model capabilities and other factors.
In our experience, market performance and model characteristics change and are updated through time and a regular review of models and the overall approach to loss estimation is beneficial. Our ability to drive change in the models we license is limited and subject to the expertise and views of the independent developer/vendor. On the other hand, our ability to estimate losses without such models is difficult and challenging for a large portfolio across multiple RMBS exposure types.
Summarized below is our approach to projecting claims and ultimate losses in our RMBS portfolio.
Second-Lien
The regression model estimates mortgage loan collateral performance, the effect of such collateral cash flows within the transaction waterfall and the liability structure we insure. Collateral performance is frequently modeled at the deal level given the paucity of mortgage loan level data for second-lien transactions. In the absence of specific loan-level information, the deal-level approach processes a loan pool as if it were a single loan, selecting certain aggregated deal-level characteristics to then perform a statistical analysis using a multinomial logistic regression model. We use three HPA projection scenarios to develop a base case as well as stress and upside cases. The highest probability is assigned to the base case, with lower probabilities to the stress and upside cases. This deal-level approach of the regression model takes a relatively complicated monthly cash flow and simplifies it into two parts: a borrower-behavior-dependent stage and a servicer-behavior-dependent stage. The borrower stage is designed to forecast the probability of a loan’s present delinquency status transitioning to any of eight future statuses. The deal-level approach calculates defaults using a roll-rate that evaluates the possible future state of a loan based on its current status and three variables: average FICO (credit score), average current consolidated loan to value ratio (“CLTV”) and an overall quality indicator. The servicer-behavior-dependent stage governs a loan’s life cycle after it reaches 180 or more days delinquent. This stage evaluates the servicer’s propensity to foreclose or pursue a short sale, the speed of the foreclosure process, and the speed of the post-foreclosure distressed property liquidation. The transition probabilities between advanced delinquency and foreclosure, foreclosure and REO, and finally REO and ultimate liquidation are assumed by the model to depend upon how long a loan has already been in a particular status, as well as on the servicer and on state-specific liquidation timeline factors.
First-Lien
For most first-lien transactions, the regression model utilizes mortgage loan level data from recognized market sources to calculate each loan’s probability of default and prepayment based on the characteristics of the loan. The loan-level approach of the regression model uses the results of a regression analysis to project prepayment and default vectors on a monthly basis based on its embedded risks. For first-lien transactions that do not have loan-level data available, we use the deal-level approach of the regression model that is described in the Second-Lien section above.
There are three transitional stages with the loan-level approach of the regression model: current, prepayment or default. The model then looks beyond the stages to assess a set of loans based on a number of individual characteristics that are distinct to that set of loans. The model then estimates the rate at which a loan will prepay or default reducing the balance of each loan monthly during the projection period based on the borrower’s given probability of defaulting or prepaying for that month. Servicer behavior is a variable in the loan-level approach of the regression model used to calculate the impact of servicer performance on expected prepayments and defaults. Consistent with the second-lien modeling, we consider three HPA scenarios in the regression model to develop a base case as well as stress and upside cases. The highest probability is assigned to the base case, with lower probabilities to the stress and upside cases.
Additional RMBS factors for first and second-lien transactions
Additional factors that may impact ultimate RMBS losses include, but may not be limited to, mortgage insurance and servicer intervention. These factors, and the impact on our loss reserve estimate, are further discussed below:
37
Mortgage insurance
:
Four of our mortgage-backed transactions have pool-level mortgage insurance remaining. Pool mortgage insurance is a master policy issued to the mortgage securitization trust, which indemnifies the trust either on a first loss or mezzanine basis in the event that covered mortgage loans in the trust default. The mortgage insurance master policy specifies the particular characteristics and conditions of each individual loan within the mortgage trust that is subject to coverage. The policy also includes various conditions such as exclusions, conditions for notification of loans in default and claims settlement. We have noted with regard to these transactions that payment by mortgage insurers of claims presented by the mortgage trusts has been inconsistent, resulting in higher claims presented under Ambac Assurance’s financial guarantee policies. As a result, the impact of mortgage insurance on our loss reserve estimate is negligible.
Servicer Intervention
:
We include in our modeling the steps which Ambac is taking to address shortcomings in servicing performance including transfers of servicing where such transfers have taken place. Ambac has initiated programs with special servicers that we believe will mitigate losses on such transactions through intervention strategies such as loan modifications, improved liquidation timelines and short sales. Ambac believes these are the principal controllable factors that will result in reduced losses over time. Given the uncertainty in initiating additional programs of this nature, we give credit in our models only on exposures that have already transferred servicing or entered into special servicing agreements.
Third party settlements
:
To the extent that we are aware of settlements between issuers and investors or trustees which may provide for recoveries within certain insured RMBS trusts, we have incorporated in our modeling of collateral losses in such trusts scenarios reflecting our estimate of the probable amount and timing of these settlements.
RMBS Representation and Warranty Subrogation Recoveries
Ambac records as a component of its loss reserve estimate, subrogation recoveries related to securitized loans in RMBS transactions that breached certain representations and warranties described herein. Generally, the sponsor of an RMBS transaction provided representations and warranties with respect to the securitized loans, including representations with respect to the loan characteristics, the absence of borrower fraud in the underlying loan pools or other misconduct in the origination process and attesting to the compliance of loans with the prevailing underwriting policies. In such cases, the sponsor of the transaction is contractually obligated to repurchase, cure or substitute collateral for any loan that breaches the representations and warranties. Ambac or its counsel engaged consultants with significant mortgage underwriting experience to review the underwriting documentation for mortgage loans underlying certain insured RMBS transactions. Transactions which exhibited exceptionally poor performance were chosen for further examination of the underwriting documentation supporting the underlying loans. Factors which Ambac believes to be indicative of poor performance include (i) high levels of early payment defaults, (ii) significant number of loan liquidations or charge-offs and resulting high levels of losses, and (iii) rapid elimination of credit protections inherent in the transactions’ structures. Clause (ii), “loan liquidations,” refers to loans for which the servicer has liquidated the related collateral and the securitization has realized losses on the loan; “charge-offs” refers to loans which have been written off as uncollectible by the servicer, thereby generating no recoveries to the securitization, and may also refer to the unrecovered balance of liquidated loans. In either case, the servicer has taken actions to recover against the collateral and the securitization has incurred losses to the extent such actions did not result in full repayment of the borrower’s obligations. Ambac does not include potential recoveries attributed solely to fraudulent inducement claims in our litigations in our estimate of representation and warranty subrogation recoveries. Refer to Note 2. Reorganization Under Chapter and Note 8. Financial Guarantee Insurance Contracts to the Consolidated Financial Statements included in Part II, Item 8 in this Form 10-K for more information regarding the estimation process for representation and warranty subrogation recoveries.
STUDENT LOANS
Our student loan portfolio consists of credits collateralized by (i) federally guaranteed loans under the Federal Family Education Loan Program (“FFELP”) and (ii) private student loans.
Method for Projecting Expected Losses
The calculation of loss reserves for our student loan portfolio involves evaluating numerous factors that can impact ultimate losses. The factor which contributes the greatest degree of uncertainty in ascertaining appropriate loss reserves is the long time horizon associated with the final legal maturity date of the bonds. Most of the student loan bonds which we insure were issued with original terms of 20 to 40 years until final maturity. Since our policy covers timely interest and ultimate principal payment, our loss projections must make assumptions for many factors covering a long time horizon. Key assumptions that will impact ultimate losses include but are not limited to the following: collateral performance (which is highly correlated to the economic environment), interest rates, operating risks associated with the issuer, servicers, administrators, issuers’ willingness and ability to refinance, investor appetite for tendering auction rate securities at a discount and, as applicable, Ambac’s ability and willingness to commute policies.
In evaluating our student loan portfolio, the majority of our losses were projected using a cash flow approach; for the remainder we use a statistical expected loss approach. As more fully described in Note 2. Basis of Presentation and Significant Accounting Policies to the Consolidated Financial Statements included in Part II, Item 8 in this Form 10-K, the statistical methodology uses probability of default and loss given default (“LGD”) metrics under various scenarios to derive a weighted average loss expectation. The scenarios used under the statistical expected loss approach evaluate each transaction under base case and stress case scenarios. The main drivers in assigning appropriate probabilities to LGDs for each policy includes an analysis of the collateral mix; debt type and interest rates; parity level; enhancement levels and remediation opportunities. We utilize the statistical expected loss approach for certain deals in our student loan portfolio, including transactions (i) where
38
detailed collateral data is unavailable (and thus cash flow models, as more fully discussed below, could not be used), and (ii) which are not expected to generate meaningful losses.
In order to project collateral performance under the cash flow approach, we use an internally developed default projection tool. This tool constructs lifetime cohort default curves based on loan and deal-level historical performance data. The cohort default curves are then used to extrapolate future default behavior. In addition, we use a regression based recovery forecast tool to derive the ultimate losses on the transactions. This regression based recovery forecast is grounded in deal-level performance data. Losses for a small portion of deals are forecast using internal loss estimations to project transaction-level assumptions such as defaults, recoveries and prepayments based on analysis of historical experience adjusted for current economic conditions and changes to collateral composition since origination. In both approaches, the transaction losses are incorporated into a third party liability/waterfall model to develop loss estimates for our exposures. This liability/waterfall model allows us to capture the impact of each transaction’s specific structure (e.g. the waterfall priority of payments, triggers, redemption priority) to generate our specific projected claims profile in various base, upside and downside scenarios.
We develop and assign probabilities to multiple cash flow scenarios based on each transaction’s unique characteristics. Probabilities assigned are based on available data related to the credit, information from contact with the issuer (if applicable), and any economic or market information that may impact the outcomes of the various scenarios being evaluated. Our base case usually projects deal performance out to maturity using expected loss assumptions and interest rates utilizing the projected forward interest rate curve at the reporting date. As appropriate, we also develop other cases that incorporate various upside and downside scenarios that may include changes to defaults, recoveries and interest rates.
In estimating loss reserves, we also incorporate scenarios which represent remediation strategies. Remediation scenarios may include the following; (i) a potential refinancing of the transaction by the issuer; (ii) the issuer’s ability to redeem outstanding securities at a discount, thereby increasing the structure’s ability to absorb future losses; and (iii) our ability to terminate the policy in whole or in part (e.g. commutation). The remediation scenarios and the related probabilities of occurrence vary by policy depending on on-going discussions and negotiations that are underway with issuers and/or investors. In addition to commutation negotiations that are underway with various counterparties in various forms, our reserve estimates may also include scenarios which incorporate our ability to commute additional exposure with other counterparties.
REASONABLY POSSIBLE ADDITIONAL NET CASH FLOWS
Ambac’s management believes that the reserves for loss and loss expenses and unearned premium reserves are adequate to cover claims presented, but reserves for loss and loss expenses are based on estimates and there can be no assurance that the ultimate liability will not exceed such estimates. As discussed above and in Note 8. Financial Guarantee Insurance Contracts to the Consolidated Financial Statements included in Part II, Item 8 in this Form 10-K, reserves for loss and loss expenses include unpaid claims for insurance policies allocated to the Segregated Account. These unpaid claims are measured based on the estimated cost of settling the claims, which is principal plus accrued interest. The following reasonably possible additional net cash flows exclude changes to such amounts since they are unrelated to the likelihood of issuer default and potential recoveries and they will only be settled at the sole and absolute discretion of the Rehabilitator.
It is possible that our loss estimate assumptions for insurance policies discussed above could be understated. We have attempted to identify reasonably possible cash flows using more stressful assumptions. The reasonably possible net cash flows consider the highest stress scenario that was utilized in the development of our probability-weighted expected loss at
December 31, 2014
and assumes an inability to execute commutation transactions with issuers and/or investors. Such stress scenarios are developed based on management’s view about all possible outcomes. In arriving at such view, management makes considerable judgments about the possibility of various future events. Such judgments may not conform to outcomes considered possible by others. Although we do not believe it is reasonably possible to have worst case outcomes in all cases, it is reasonably possible we could have worst case outcomes in some or even many cases. Similarly, it is also reasonably possible we will achieve better outcomes than our recorded probability weighted loss reserve.
RMBS
Changes to assumptions that could make our reserves under-estimated include deterioration in housing prices, poor servicing, the effects of a weakened economy marked by growing unemployment and wage pressures, and/or illiquidity of the mortgage market. Additionally, our actual subrogation recoveries could be significantly lower than our estimate of $2.5 billion as of
December 31, 2014
if the sponsors of these transactions: (i) fail to honor their obligations to repurchase the mortgage loans, (ii) successfully dispute our breach findings, or (iii) no longer have the financial means to fully satisfy their obligations under the transaction documents.
In the case of both first and second-lien exposures, the reasonably possible stress case assumes a harsher HPA projection, which in turn drives higher defaults and severities. Using this approach, the reasonably possible increase in loss reserves for RMBS credits for which we have an estimate of expected loss at
December 31, 2014
could be approximately $106 million.
Student Loans
Changes to assumptions that could make our reserves under-estimated include, but are not limited to, an increase interest rates, an increase in default rates and loss severities on the collateral due to economic factors, as well as a failure of issuers to refinance insured bonds which have a failed debt structure, such as auction rate securities. For student loan credits for which we have an estimate of expected loss at
December 31, 2014
, the reasonably possible increase in loss reserves could be approximately $487 million.
39
Public Finance
It is possible our loss reserves for public finance credits may be under-estimated because most credits and the portfolio as a whole have possible outcomes more adverse than our recorded loss reserves. For public finance credits with loss reserves at
December 31, 2014
, the reasonably possible increase in loss reserves could be approximately $1,788 million greater than the current probability weighted loss reserve, reflecting the sum of all losses in the highest stress case used in our current loss reserving process.
In our past experience, losses in the public finance portfolio have been contained, with most of our adversely classified credits resolving without loss to Ambac. For example, we have entered into settlements with two municipalities that went through bankruptcy that do not require us to suffer permanent losses, unless the municipalities re-default. We have a small exposure to another city in bankruptcy and have not yet resolved the treatment of our exposure in their plan. While an unfavorable outcome in this case would not be material financially, all adverse precedents are concerning to the extent they may influence the behavior of other stressed municipalities.
Our recent experience with the city of Detroit in its bankruptcy proceeding has not been favorable and renders future outcomes with other issuers even more difficult to predict and may increase the risk that we may suffer losses that could be sizable. We agreed to settlements regarding our insured Detroit general obligation bonds that provide better treatment of our exposures than the city planned to include in its plan, but nevertheless require us to incur a loss for a significant portion of our par exposure. An additional troubling precedent in the Detroit case is the preferential treatment of certain creditor classes, especially the city pensions. The cost of pensions is often a key driver of municipal stress and less severe treatment of pension obligations in bankruptcy may lead to worse outcomes for traditional debt creditors. In addition, cities may be more inclined to use bankruptcy to resolve their financial stresses if they believe preferred outcomes for various creditor groups can be achieved.
We currently consider high severity outcomes to be outlying and therefore implicitly assign low or remote probabilities to such outcomes in our current loss reserves unless the situation develops adversely. We expect municipal bankruptcies and defaults to continue to be challenging to project given their complexity, long duration, and relative infrequency as well as the uniqueness of each case, particularly with regard to policy and political issues. Another potentially adverse development that could cause the loss reserves on our public finance credits to be underestimated is deterioration in the municipal bond market that deprives issuers' access to funding necessary to avoid defaulting on their obligations. While our loss reserves consider our judgment regarding issuers’ financial flexibility to adapt to adverse markets, they may not adequately capture sudden, unexpected or protracted market volatility that closes markets.
Our exposures to the Commonwealth of Puerto Rico are under stress arising from the Commonwealth’s poor financial condition, low ratings and limited access to capital. The Commonwealth’s announced plans to improve its financial position and prospects include the restructuring of debt obligations, and while terms are unknown, and the targets of their restructuring may change, we believe there is a possibility of incurring a loss that could be higher than our current reserves. Our loss reserves include scenarios designed to cover a range of possible outcomes, but the possible outcomes could shift quickly and materially as this volatile situation unfolds.
Other Credits, including Ambac UK
It is possible our loss reserves on other types of credits, including those insured by Ambac UK, may be under-estimated because most credits have possible outcomes more adverse than the recorded loss reserve. For all other credits, including Ambac UK, for which we have an expected loss, the sum of all the highest stress case loss scenarios is $540 million greater than the current loss reserve at
December 31, 2014
.
Valuation of Financial Instruments:
Ambac’s financial instruments that are reported on the Consolidated Balance Sheets at fair value and subject to valuation estimates primarily include investments in fixed income securities, equity interests in pooled investment funds, VIE assets and liabilities and derivatives comprising credit default and interest rate swap transactions. Surplus notes issued by Ambac Assurance or the Segregated Account of Ambac Assurance were recorded at fair value at the date of issuance and at the Fresh Start reporting date and are subsequently reported at their principal value less unamortized discount within Long-term debt on the Consolidated Balance Sheets.
The fair market values of financial instruments held are determined by using independent market sources when available and valuation models when market quotes are not available or cannot be reasonably corroborated. The Fair Value Measurement Topic of the ASC requires the categorization of these assets and liabilities according to a fair value valuation hierarchy. Approximately
81%
of our assets and approximately
66%
of our liabilities are carried at fair value and categorized in either Level 2 of the valuation hierarchy (meaning that their fair value was determined by reference to quoted prices for similar instruments in active markets, quoted prices for identical or similar instruments in inactive markets and other observable inputs) or Level 3 (meaning that their fair value was determined by reference to significant inputs that are unobservable in the market and therefore require a greater degree of management judgment). The determination of fair value for financial instruments categorized in Level 2 or 3 involves significant judgment due to the complexity of factors contributing to the valuation. Third-party sources from which we obtain independent market quotes also use assumptions, judgments and estimates in determining financial instrument values and different third parties may use different methodologies or provide different prices for securities. In addition, the use of internal valuation models for certain highly structured instruments, such as credit default swaps, require assumptions about markets in which there has been a negligible amount of trading activity for several years. As a result of these factors, the actual trade value of a financial instrument in the market, or exit value of a financial instrument owned by Ambac, may be significantly different from its recorded fair value. Refer to Note 10. Fair Value Measurements to the Consolidated Financial Statements included in Part II, Item 8 in this Form 10-K for discussion related to the transfers in and/or out of Level 1, 2 and 3 fair value categories.
40
Investment in Fixed Income Securities
Investments in fixed income securities are accounted for in accordance with the Investments-Debt and Equity Securities Topic of the ASC. This guidance requires that all debt instruments and certain equity instruments be classified in Ambac’s Consolidated Balance Sheets according to their purpose and, depending on that classification, be carried at either cost or fair market value. The fair values of fixed income investments held in the investment portfolios of Ambac and its operating subsidiaries are based primarily on quoted market prices received from dealer quotes or alternative pricing sources with reasonable levels of price transparency. For those fixed income investments where quotes were not available or cannot be reasonably corroborated, fair values are based on internal valuation models. Refer to Note 10. Fair Value Measurements to the Consolidated Financial Statements included in Part II, Item 8 in this Form 10-K for further discussion of the valuation methods, inputs and assumptions for fixed income securities. Ambac performs various review and validation procedures to quoted and modeled prices for fixed income securities, including price variance analyses, missing and static price reviews, overall valuation analyses by senior traders and finance managers and reviews associated with our ongoing impairment analysis. Unusual prices identified through these procedures will be evaluated further against alternative third party quotes (if available) and/or internally modeled prices, and the pricing source values will be challenged as necessary. Price challenges generally result in the use of the pricing source’s quote as originally provided or as revised by the source following their internal diligence process. A price challenge may result in a determination by either the pricing source or Ambac management that the pricing source cannot provide a reasonable value for a security or cannot adequately support a quote, in which case Ambac would resort to using either other quotes or internal models. Results of price challenges are reviewed by senior traders and finance managers. Valuation results, particularly those derived from valuation models and quotes on certain mortgage and asset-backed securities, could differ materially from amounts that would actually be realized in the market.
Ambac’s investments in fixed income securities (excluding VIE investments) classified as “available-for-sale” are carried at fair value, with the after-tax difference from amortized cost reflected in stockholders’ equity as a component of Accumulated Other Comprehensive Income (“AOCI”). One of the significant estimates related to available-for-sale securities is the evaluation of investments for other-than-temporary impairments. Under GAAP, if management assesses that it either (i) has the intent to sell its investment in a debt security or (ii) more likely than not will be required to sell the debt security before the anticipated recovery of its amortized cost basis less any current period credit loss, then an other-than-temporary impairment charge must be recognized in earnings, with the amortized cost of the security being written-down to fair value. If these conditions are not met, but it is determined that a credit loss exists, the impairment is separated into the amount related to the credit loss, which is recognized in earnings, and the amount related to all other factors, which is recognized in other comprehensive income. To determine whether a credit loss has occurred, management considers certain factors, including the length of time and extent to which the fair value of the security has been less than its amortized cost and downgrades of the security’s credit rating. If such factors indicate that a potential credit loss exists, management will compare the present value of estimated cash flows from the security to the amortized cost basis to assess whether the entire amortized cost basis will be recovered. When it is determined that all or a portion of the amortized cost basis will not be recovered, a credit impairment charge is recorded in earnings in the amount of the difference between the present value of cash flows and the amortized cost at the balance sheet date, with the amortized cost basis of the impaired security written-down to the present value of cash flows. Ambac estimates expected future cash flows from residential mortgage-backed securities using models and assumptions consistent with those used to project losses in the financial guarantee RMBS portfolio described above under “Critical Accounting Policies-Losses and Loss Expenses of Non-derivative Financial Guarantees.” Estimated cash flows are discounted at the effective interest rate implicit in the security at the date of acquisition or, for debt securities that are beneficial interests in securitized financial assets, at a rate equal to the current yield used to accrete the beneficial interest. For floating rate securities, estimated cash flows are projected using the relevant index rate forward curve and the discount rate is adjusted for changes in that curve. For debt securities for which other-than-temporary impairments were recognized in earnings, the difference between the new amortized cost basis and the cash flows expected to be collected are accreted as interest income over the expected remaining life of the security.
The evaluation of securities for impairment is a quantitative and qualitative process, which is subject to risks and uncertainties and is intended to determine whether, and to what extent, declines in the fair value of investments should be recognized in current period earnings. The risks and uncertainties include changes in general economic conditions, the issuer’s or guarantor’s financial condition and/or future prospects, the effects of regulatory actions on the investment portfolio, the performance of the underlying collateral, the effects of changes in interest rates or credit spreads and the expected recovery period. With respect to Ambac-wrapped securities guaranteed under policies that have been allocated to the Segregated Account, future cash flows used to measure credit impairment represents the sum of (i) the bond’s intrinsic cash flows and (ii) the estimated Ambac Assurance claim payments, including interest on Deferred Amounts. Ambac estimates the timing of such claim payment receipts but the actual timing of such amounts are at the sole discretion of the Rehabilitator. Further modifications to the Segregated Account Rehabilitation Plan or to the rules and guidelines promulgated thereunder, orders from the Rehabilitation Court or actions by the Rehabilitator with respect to the form, amount and timing of satisfying permitted policy claims, or making payments on Deferred Amounts or surplus notes, may have a material effect on the fair value of Ambac-wrapped securities and future recognition of other-than-temporary impairments. Refer to Note 1. Background and Business Description to the Consolidated Financial Statements in Part II, Item 8 of this Form 10-K for information relating to the amended Segregated Account Rehabilitation Plan.
Ambac’s assessment of a decline in value reflects management’s current judgment regarding facts and circumstances specific to a security and the factors noted above. There is also significant judgment in determining whether Ambac intends to sell securities or will continue to have the ability to hold temporarily impaired securities until recovery. Future events could occur that were not reasonably foreseen at the time management rendered its judgment on the Company’s intent to sell or ability to hold securities until recovery. Examples of such events include, but are not limited to, the deterioration in the issuer’s or guarantor’s creditworthiness, a change in regulatory requirements or a restructure or exchange of Ambac Assurance's outstanding debt and insurance obligations. If management’s judgment with respect to these factors changes, Ambac may ultimately record a charge for other-than-temporary impairment in future periods.
41
VIE Assets and Liabilities
The financial assets and liabilities of VIEs consolidated under the Consolidation Topic of the ASC consist primarily of fixed income securities, loans receivable, derivative instruments and debt instruments and are generally carried at fair value with changes in fair value recognized in Income (loss) on variable interest entities of the Consolidated Statements of Total Comprehensive Income (Loss). These consolidated VIEs are primarily securitization entities which have liabilities and/or assets guaranteed by Ambac Assurance or Ambac UK. The fair values of VIE debt instruments are determined using the same methodologies used to value Ambac’s fixed income securities in its investment portfolio as described above.
VIE derivative instrument fair values are determined using valuation models. When specific derivative contractual terms are available and may be valued primarily by reference to interest rates, exchange rates and yield curves that are observable and regularly quoted, the derivatives are valued using vendor-developed models. Other derivatives within the VIEs that include significant unobservable valuation inputs are valued using internally developed models.
The fair value of VIE assets are obtained from market quotes when available. Typically the asset fair values are not readily available from market quotes and are estimated internally. The consolidated VIEs are securitization entities in which net cash flows from assets and derivatives (after adjusting for financial guarantor cash flows and other expenses) will be paid out to note holders or equity interests. Our valuation of VIE assets (fixed income securities or loans), therefore, are derived from the fair value of notes and derivatives, as described above, adjusted for the fair value of cash flows from Ambac’s financial guarantee. The fair value of financial guarantee cash flows include: (i) estimated future premiums discounted at a rate consistent with that implicit in the fair value of the VIE’s liabilities and (ii) internal estimates of future loss payments by Ambac discounted at a rate that includes Ambac’s own credit risk.
Derivatives
Ambac’s operating subsidiaries’ exposure to derivative instruments is created primarily through interest rate swaps, US Treasury futures contracts and credit default swaps. These contracts are accounted for at fair value under the Derivatives and Hedging Topic of the ASC. Valuation models are used for the derivatives portfolios, using market data from a variety of third-party data sources. Several of the more significant types of market data that influence fair value include interest rates, credit spreads, default probabilities, recovery rates, pricing and credit ratings of referenced obligations for credit derivatives. The valuation of certain interest rate swaps, as well as all credit derivative contracts, also require the use of data inputs and assumptions that are determined by management and are not readily observable in the market, including the amount that Ambac’s own credit risk impacts the fair value of derivative liabilities. Refer to Note 10. Fair Value Measurements to the Consolidated Financial Statements included in Part II, Item 8 in this Form 10-K for further discussion of the models, model inputs and assumptions used to value derivative instruments. Due to the inherent uncertainties of the assumptions used in the valuation models to determine the fair value of derivative instruments, actual value realized in a market transaction may differ significantly from the estimates reflected in our financial statements.
Ambac’s credit derivative valuation model, like any financial model, has certain strengths and weaknesses. We believe our model’s primary strength is that it maximizes the use of market-driven inputs. Most importantly, the model uses market-based discount rates and fair values of the underlying reference obligations. Ambac employs a three-level hierarchy for obtaining reference obligation fair values used in the model as follows: (i) broker quotes on the reference obligation, (ii) prices and spreads from other transactions in the portfolio with similar asset, structure and credit attributes, and (iii) internal models comparable to those used for invested assets when quotes are unavailable. We believe using this type of approach is preferable to other models, which may emphasize modeled expected losses or which rely more heavily on the use of market indices that may not be reflective of the underlying reference obligation. Another strength is that our model is relatively easy to understand, which increases its transparency.
A potential weakness of our valuation model is our reliance on broker quotes obtained from dealers which originated the underlying transactions, who in certain cases may also be the counterparty to our CDS transaction. All of the transactions falling into this category are illiquid and it is usually difficult to obtain alternative quotes.
Ambac employs various procedures to corroborate the reasonableness of quotes received; including comparing to other quotes received on similarly structured transactions, observed spreads on structured products with comparable underlying assets and, on a selective basis when possible, values derived through internal estimates of discounted future cash flows. Each quarter, the portfolio of CDS transactions is reviewed to ensure every reference obligation price has been updated. Period to period valuations are compared for each CDS and by underlying bond type. For each CDS, this analysis includes comparisons of key valuation inputs to the prior period and against other CDS within the bond type. No adjustments were made to the broker quotes we received when determining fair value of CDS contracts as of December 31, 2014. Another potential weakness of our valuation model is the lack of new CDS transactions executed by financial guarantors, which makes it difficult to validate the percentage of the reference obligation spread which would be captured as a CDS fee at the valuation date (i.e. the relative change ratio). Changes to the relative change ratio based on internal ratings assigned are another potential weakness as internal ratings could differ from actual ratings provided by rating agencies. However, we believe our internal ratings are updated at least as frequently as the external ratings. We believe the approach we have developed to increase the relative change ratio as the underlying reference obligation experiences credit deterioration is consistent with a market-based approach to valuation. Ultimately, our approach exhibits the same weakness as other modeling approaches, as it is unclear if we could execute at these values.
42
Valuation of Deferred Tax Assets:
Our provision for taxes is based on our income, statutory tax rates and tax planning opportunities available to us in the jurisdictions in which we operate. Tax laws are complex and subject to different interpretations by the taxpayer and respective governmental taxing authorities. Significant judgment is required in determining our tax expense and in evaluating our tax positions. We review our tax positions quarterly and adjust the balances as new information becomes available. Deferred tax assets arise because of temporary differences between the financial reporting and tax bases of assets and liabilities, as well as from net operating loss and tax credit carry forwards. More specifically, deferred tax assets represent a future tax benefit (or receivable) that results from losses recorded under GAAP in a current period which are only deductible for tax purposes in future periods and net operating loss carry forwards. In accordance with the Income Taxes Topic of the ASC, we evaluate our deferred income taxes quarterly to determine if valuation allowances are required. This guidance requires that companies assess whether valuation allowances should be established against their deferred tax assets based on the consideration of all available evidence using a “more likely than not” standard. All available evidence, both positive and negative, needs to be identified and considered in making the determination with significant weight given to evidence that can be objectively verified. The level of deferred tax asset recognition is influenced by management’s assessment of future expected taxable income, which depends on the existence of sufficient taxable income of the appropriate character (ordinary vs. capital) within the carry back or carry forward periods available under the tax law. In the event that we determine that we would not be able to realize all or a portion of our deferred tax assets, we would record a valuation allowance against the deferred tax assets that we estimate will not ultimately be recoverable in the period in which that determination is made.
Goodwill:
At the Fresh Start Reporting Date, we revalued our assets and liabilities to current estimated fair value. The excess reorganization value which could not be attributed to the fair value of specific identified tangible and intangible assets was recorded as goodwill. Goodwill is subject to annual impairment testing. We test goodwill for impairment as of October 1
st
of each year. Goodwill is also tested more frequently if indicators of impairment exist for each reporting unit. The Company has an option to first assess qualitative factors, in their totality, to determine whether it is more likely than not that the fair value of a reporting unit is less than its carrying amount as a basis for determining whether it is necessary to perform a goodwill impairment test. If the Company determines that it is more likely than not that the fair value of a reporting unit is less than its carrying amount, then the Company is required to perform the goodwill impairment test. Factors we consider for determining whether an impairment test is necessary may include: i) macroeconomic conditions, ii) industry conditions, iii) operating cost factors, iv) company financial performance, v) changes in management, key personnel or strategy, vi) events affecting the composition or carrying amounts of net assets, and vii) a sustained decrease in Ambac’s share price. Alternatively, we may bypass this qualitative assessment and perform step one of the goodwill impairment test described below.
Goodwill impairment is determined using a two-step approach. In step one of the goodwill impairment test, the fair value of a reporting unit is compared with its carrying amount, including goodwill. If the fair value is in excess of the carrying amount, including goodwill, the reporting unit’s goodwill is considered not to be impaired. If the carrying amount, including goodwill, of a reporting unit exceeds its fair value, the second step of the goodwill impairment test is performed to measure the amount of impairment loss, if any. In step two of the goodwill impairment test, the implied fair value of a reporting unit’s goodwill is compared with the carrying amount of that goodwill. The implied fair value of goodwill is determined in the same manner as the amount of goodwill recognized in a business combination and is defined as the excess of the fair value of a reporting unit over the fair value of the net assets of a reporting unit. If the carrying amount of goodwill exceeds its implied fair value, an impairment loss is recognized for the excess. If the carrying amount of goodwill is less than its implied fair value, no goodwill impairment is recognized.
Goodwill impairment testing is performed at the reporting unit level. We have identified two reporting units of Ambac: (1) Financial Guarantee, which provides financial guarantees (including credit derivatives) for public finance, structured finance and other obligations; and (2) Financial Services, which provide investment agreements, funding conduits, and interest rate swaps, principally to clients of the financial guarantee business. These reporting units are also the sole operating segments which make up the Financial Guarantee and Financial Services reportable segments, respectively, that are disclosed in Note 19. Segment Information to the Consolidated Financial Statements included in Part II, Item 8 in this Form 10-K. We have assigned assets and liabilities to each reporting unit based on specific identification. In evaluating which reporting units should be assigned goodwill, we considered the sources of Ambac’s estimated enterprise value at the Fresh Start Reporting Date as further described in Note 3. Fresh Start Financial Statement Reporting to the Consolidated Financial Statements included in Part II, Item 8 in this Form 10-K. Based on that analysis, we have assigned all goodwill recorded at the Fresh Start Reporting Date to the Financial Guarantee reporting unit.
For the
2014
annual assessment, we performed step one of the goodwill impairment test for the Financial Guarantee reporting unit. We estimated the fair value of the Financial Guarantee reporting unit using a market approach, which incorporated Ambac’s market capitalization, fair value estimates of noncontrolling interests and an estimated control premium. After completing our annual impairment review for
2014
, we concluded that goodwill is not impaired.
Additionally, as of
December 31, 2014
, the estimated fair value of the Financial Guarantee reporting unit exceeded its carrying value at the date of testing and thus was not at risk of failing step one of the goodwill impairment test. We applied a hypothetical 10 percent decrease to the estimated fair value of the Financial Guarantee reporting unit which would not have triggered additional impairment testing and analysis.
43
RESULTS OF OPERATIONS
We followed the accounting prescribed by the Reorganizations Topic of the ASC while Ambac was in reorganization proceedings under Chapter 11 of the U.S. Bankruptcy Code. On April 30, 2013, Ambac executed a closing agreement with the United States Internal Revenue Service (the “IRS”) to conclude the settlement of a dispute (“IRS Settlement"). On May 1, 2013, the Reorganization Plan became effective and Ambac emerged from bankruptcy. The IRS Settlement represented the final material contingency under the Reorganization Plan required for the adoption of fresh start financial statement reporting under the Reorganizations Topic of the ASC. As such, fresh start financial statement reporting ("Fresh Start") was adopted by the Company on April 30, 2013 (“Fresh Start Reporting Date”), incorporating, among other things, the discharge of debt obligations, issuance of new common stock, and fair value adjustments. Adopting Fresh Start resulted in a new reporting entity with no beginning retained earnings or accumulated deficit. The financial results of the Company for the periods from May 1, 2013 are referred to as “Successor Ambac” and the financial results for the periods through April 30, 2013 are referred to as “Predecessor Ambac.” The effects of the reorganization and Fresh Start adjustments were recorded in Predecessor Ambac’s Consolidated Statement of Total Comprehensive Income on the Fresh Start Reporting Date. The effects of emergence and Fresh Start had a material impact on the comparability of our results of operations between these periods, as discussed below. The significant Fresh Start items that were recorded in the four months ended April 30, 2013 which impact comparability are as follows:
Investment Income.
As required under Fresh Start, the amortized cost basis of Ambac’s fixed income securities were adjusted to fair value as of the Fresh Start Reporting Date. This resulted in an overall increase in the amortized cost of fixed income securities and offsetting decrease in Accumulated Other Comprehensive Income of $826.6 million. Premiums and discounts are amortized or accreted over the remaining term of the securities using the effective interest method. As a result of Fresh Start, the net unamortized discount in the portfolio decreased on the Fresh Start Reporting Date by the amount of the increase to amortized cost described above, which impacts the amount of premium amortization and discount accretion reflected in net investment income of Successor Ambac.
Interest Expense.
As required under Fresh Start, surplus notes issued by Ambac Assurance and the Segregated Account and the related accrued interest on such notes were adjusted to fair value as of the Fresh Start Reporting Date. This resulted in an overall increase in the carrying value of debt and accrued interest by $767.9 million. Discounts to the face value of debt are accreted through interest expense based on the projected cash flows of the instruments using the effective interest method. As a result of Fresh Start, the unamortized discounts on surplus notes have decreased and the future cash flows have been re-projected, both of which impacts the amount of discount accretion recognized in interest expense for Successor Ambac.
Operating Expenses—Deferred Acquisition Costs.
As required under Fresh Start, deferred acquisition costs have been written off as of the Fresh Start Reporting Date and accordingly amortization of such costs will not be reflected in Successor Ambac’s net income.
Insurance Intangible Amortization.
At the Fresh Start Reporting Date, an insurance intangible asset was recorded which represented the difference between the fair value and aggregate carrying value of the financial guarantee insurance and reinsurance assets and liabilities. The carrying value of our financial guarantee insurance and reinsurance contracts will continue to be reported and measured in accordance with existing accounting policies; these line items primarily comprise premiums receivable, reinsurance recoverable on paid and unpaid losses, unearned premiums, deferred ceded premium, subrogation recoverable, loss and loss expense reserves and ceded premiums payable. Subsequent to the Fresh Start Reporting Date, the insurance intangible asset shall be amortized into expense on a basis consistent with the satisfaction of financial guarantee insurance or reinsurance obligations.
Goodwill.
Represents the excess of the reorganization value over the fair value of identified tangible and intangible assets of Successor Ambac. Goodwill will be assessed for impairment on an annual basis, and more frequently if certain indicators of impairment exist. Refer Note 2. Basis of Presentation and Significant Accounting Policies and Note 3. Fresh Start Financial Statement Reporting to the Consolidated Financial Statements, included in Part II, Item 8 in this Form 10-K for the year ended
December 31, 2014
for a discussion on how goodwill was determined and for the factors that are considered in the impairment assessment process.
44
A summary of our financial results is shown below:
|
Successor Ambac
|
Predecessor Ambac
|
|||||||||||||||
|
|
Period from May 1
|
Period from January 1
|
||||||||||||||
|
Year Ended
|
through
|
through
|
Year Ended
|
|||||||||||||
|
($ in millions)
|
December 31, 2014
|
December 31, 2013
|
April 30, 2013
|
December 31, 2012
|
||||||||||||
|
Revenues:
|
||||||||||||||||
|
Net premiums earned
|
$
|
246.4
|
|
$
|
213.5
|
|
$
|
130.0
|
|
$
|
414.6
|
|
||||
|
Net investment income
|
300.9
|
|
146.4
|
|
116.7
|
|
382.9
|
|
||||||||
|
Net other-than-temporary impairment losses
|
(25.8
|
)
|
(46.8
|
)
|
(0.5
|
)
|
(6.0
|
)
|
||||||||
|
Net realized investment gains
|
58.8
|
|
4.5
|
|
53.3
|
|
72.1
|
|
||||||||
|
Change in fair value of credit derivatives
|
23.9
|
|
192.9
|
|
(60.4
|
)
|
(9.2
|
)
|
||||||||
|
Derivative product revenues
|
(181.1
|
)
|
114.8
|
|
(33.7
|
)
|
(125.0
|
)
|
||||||||
|
Other income
|
12.5
|
|
4.4
|
|
8.4
|
|
106.1
|
|
||||||||
|
Income (loss) on variable interest entities
|
(32.2
|
)
|
(48.6
|
)
|
426.6
|
|
27.8
|
|
||||||||
|
Expenses:
|
||||||||||||||||
|
Loss and loss expenses (benefit)
|
(545.6
|
)
|
(185.1
|
)
|
(38.1
|
)
|
683.6
|
|
||||||||
|
Insurance intangible amortization
|
151.8
|
|
99.7
|
|
—
|
|
—
|
|
||||||||
|
Underwriting and operating expenses
|
101.5
|
|
68.8
|
|
44.6
|
|
139.0
|
|
||||||||
|
Interest expense
|
127.5
|
|
85.0
|
|
31.0
|
|
112.3
|
|
||||||||
|
Reorganization items
|
0.2
|
|
0.5
|
|
(2,745.2
|
)
|
7.2
|
|
||||||||
|
Provision for income taxes
|
9.6
|
|
7.5
|
|
0.8
|
|
2.8
|
|
||||||||
|
Less: Net income attributable to the noncontrolling interest
|
(0.4
|
)
|
(0.4
|
)
|
(1.8
|
)
|
(2.7
|
)
|
||||||||
|
Net income (loss) (attributable to common shareholders)
|
$
|
484.1
|
|
$
|
505.2
|
|
$
|
3,349.0
|
|
$
|
(256.7
|
)
|
||||
The following paragraphs describe the consolidated results of operations of Ambac and subsidiaries for
2014
,
2013
and
2012
and its financial condition as of
December 31, 2014 and 2013
.
Net Premiums Earned
.
Net premiums earned primarily represent the amortization into income of collected insurance premiums. We present accelerated premiums, which result from calls and other accelerations of insured obligations separate from normal net premiums earned. When an insured bond has been retired, any remaining unearned premium revenue ("UPR") is recognized at that time to the extent the financial guarantee contract is legally extinguished, causing accelerated premium revenue. For installment premium paying transactions, we offset the recognition of any remaining UPR by the reduction of the related premium receivable to zero (as it will not be collected as a result of the retirement), which may cause negative accelerated premium revenue. Normal net premiums earned have been negatively impacted by the runoff of the insured portfolio occurring through transaction terminations, calls, pre-refundings and scheduled maturities.
As noted above, as a result of Fresh Start, insurance and reinsurance assets and liabilities are measured using the same accounting policies for both Successor and Predecessor periods. Net premiums earned for the year ended
December 31, 2014
decreased
by
$97.1 million
or
28.3%
as compared to net premiums earned for the year ended
December 31, 2013
. Net premiums earned for the year ended
December 31, 2013
decreased
by
$71.1 million
or
17.1%
as compared to net premiums earned for the year ended
December 31, 2012
. Net premiums earned were affected by changes in the collectability of certain premium receivables, primarily within Structured Finance. These changes resulted in a decrease in net premiums earned of $2.2 million, $13.9 million, $0.6 million, and $25.9 million for the year ended December 31, 2014, the eight months ended December 31, 2013, the four months ended April 30, 2013 and the year ended December 31, 2012.
Normal net premiums earned and accelerated premiums are reconciled to total net premiums earned in the table below and are included in the Financial Guarantee segment. The following table provides a breakdown of net premiums earned by market:
|
Successor Ambac
|
Predecessor Ambac
|
|||||||||||||||
|
|
Period from May 1
|
Period from January 1
|
||||||||||||||
|
Year Ended
|
through
|
through
|
Year Ended
|
|||||||||||||
|
($ in millions)
|
December 31, 2014
|
December 31, 2013
|
April 30, 2013
|
December 31, 2012
|
||||||||||||
|
Public Finance
|
$
|
104.8
|
|
$
|
86.6
|
|
$
|
47.9
|
|
$
|
153.0
|
|
||||
|
Structured Finance
|
39.7
|
|
20.0
|
|
20.3
|
|
49.9
|
|
||||||||
|
International Finance
|
71.9
|
|
50.4
|
|
25.4
|
|
84.1
|
|
||||||||
|
Total normal premiums earned
|
216.4
|
|
157.0
|
|
93.6
|
|
287.0
|
|
||||||||
|
Accelerated earnings
|
30.0
|
|
56.5
|
|
36.4
|
|
127.6
|
|
||||||||
|
Total net premiums earned
|
$
|
246.4
|
|
$
|
213.5
|
|
$
|
130.0
|
|
$
|
414.6
|
|
||||
45
The following table provides a breakdown of accelerated earnings by market sector:
|
Successor Ambac
|
Predecessor Ambac
|
|||||||||||||||
|
|
Period from May 1
|
Period from January 1
|
||||||||||||||
|
Year Ended
|
through
|
through
|
Year Ended
|
|||||||||||||
|
($ in millions)
|
December 31, 2014
|
December 31, 2013
|
April 30, 2013
|
December 31, 2012
|
||||||||||||
|
Public Finance
|
$
|
57.5
|
|
$
|
54.7
|
|
$
|
32.6
|
|
$
|
116.6
|
|
||||
|
Structured Finance
|
(4.9
|
)
|
3.8
|
|
3.8
|
|
(4.2
|
)
|
||||||||
|
International Finance
|
(22.6
|
)
|
(2.0
|
)
|
—
|
|
15.2
|
|
||||||||
|
Total accelerated earnings
|
$
|
30.0
|
|
$
|
56.5
|
|
$
|
36.4
|
|
$
|
127.6
|
|
||||
Included within accelerated earnings, were negative accelerations of $47.4 million, $6.0 million, $1.5 million and $10.5 million for the year ended
December 31, 2014
, the eight months ended December 31, 2013, the four months ended April 30, 2013 and the year ended December 31,
2012
.
Net Investment Income.
As noted above, as a result of Fresh Start, the amount of premium amortization and discount accretion reflected in net investment income for Successor Ambac have been impacted by the resetting of the amortized cost basis for fixed income securities to fair value at the Fresh Start Reporting Date. Fresh Start adjustments increased the overall amortized cost basis and decreased the effective yield of the portfolio for Successor Ambac. The following table provides details of net investment income by segment for the periods presented:
|
Successor Ambac
|
Predecessor Ambac
|
|||||||||||||||
|
|
Period from May 1
|
Period from January 1
|
||||||||||||||
|
Year Ended
|
through
|
through
|
Year Ended
|
|||||||||||||
|
($ in millions)
|
December 31, 2014
|
December 31, 2013
|
April 30, 2013
|
December 31, 2012
|
||||||||||||
|
Financial Guarantee
|
$
|
298.0
|
|
$
|
145.2
|
|
$
|
115.1
|
|
$
|
365.9
|
|
||||
|
Financial Services
|
1.1
|
|
1.1
|
|
1.6
|
|
16.8
|
|
||||||||
|
Corporate
|
1.8
|
|
0.1
|
|
—
|
|
0.2
|
|
||||||||
|
Total net investment income
|
$
|
300.9
|
|
$
|
146.4
|
|
$
|
116.7
|
|
$
|
382.9
|
|
||||
Portfolio yields for Predecessor Ambac in 2013 and 2012 benefited from investments in high yielding Ambac-wrapped securities during periods of generally higher market spreads than were prevalent at the Fresh Start Reporting Date. Given the lower credit spreads on these securities at the Fresh Start Reporting Date and on subsequent new purchases of Ambac-wrapped securities, yields on Ambac-wrapped securities reflected in investment income for Successor Ambac in 2013 and 2014 are lower than for Predecessor Ambac.
Financial Guarantee net investment income was
$298.0 million
for the year ended December 31, 2014, an increase of $37.7 million from the year ended December 31, 2013. The
increase
in Financial Guarantee net investment income for the year ended
December 31, 2014
primarily reflects higher investment allocations to Ambac-wrapped securities as well as increased yields on such holdings resulting from the impact of the amended Segregated Account Rehabilitation Plan on projected cash flows, partially offset by the impact of tighter market credit spreads on such securities subsequent to the Fresh Start Reporting Date. Increases in net investment income attributable to Ambac-wrapped holdings were partially offset by sales and maturities of other asset classes to fund the partial redemption of surplus notes in November 2014 and the equalizing payment of Deferred Amounts of the Segregated Account in December 2014. Refer to Note 1. Background and Business Description to the Consolidated Financial Statements, included in Part II, Item 8 in this Form 10-K for further discussion of the partial surplus note redemptions of Ambac Assurance and the Segregated Account and the equalizing payments of Deferred Amounts. Included in Financial Guarantee net investment income are mark-to-market gains on other invested assets classified as trading of $6.7 million in the year ended
December 31, 2014
, an increase of $2.8 million from the year ended
December 31, 2013
.
Financial Services investment income continues to decline, driven primarily by a smaller portfolio of investments in the investment agreement business. The investment portfolio continues to decrease as investment agreements runoff, or when intercompany loans from Ambac Assurance are repaid.
Corporate investment income relates to Ambac’s investment portfolio, which increased for the year ended
December 31, 2014
as a result of the equity interest in unconsolidated subsidiaries and the investment of proceeds from Ambac's sale of its Segregated Account junior surplus note in August 2014.
Net Other-Than-Temporary Impairment Losses.
Net other-than-temporary impairment losses recorded in earnings include only credit related impairment amounts on securities to the extent management does not intend to sell and it is not more likely than not that the Company will be required to sell before recovery of the amortized cost basis. Non-credit related impairment amounts are recorded in other comprehensive income. Alternatively, non-credit related impairment is reported through earnings as part of net other-than-temporary impairment losses if management intends to sell securities or it is more likely than not that the Company will be required to sell before recovery of amortized cost less any current period credit impairment.
46
Successor Ambac's net other-than-temporary impairments relate primarily to the company’s intent to sell certain securities that were in an unrealized loss position as of the impairment evaluation dates. Additionally, other-than-temporary impairments for the year ended
December 31, 2014
include credit losses on certain Ambac-wrapped securities. Since commencement of the Segregated Account Rehabilitation Proceedings, changes in the estimated timing of claim payments have resulted in adverse changes in projected cash flows on certain impaired Ambac-wrapped securities. Ambac estimates the timing of such claim payment receipts, but the actual timing of such payments are at the sole discretion of the Rehabilitator. Further modifications to the Segregated Account Rehabilitation Plan or to the rules and guidelines promulgated thereunder, orders from the Rehabilitation Court or actions by the Rehabilitator with respect to the form, amount and timing of satisfying permitted policy claims, or making payments on Deferred Amounts or surplus notes, may have a material effect on the fair value of Ambac-wrapped securities and future recognition of other-than-temporary impairments. Refer to Note 1. Background and Business Description to the Consolidated Financial Statements for information relating to the amended Segregated Account Rehabilitation Plan. Ambac’s assessment about whether a decline in value is other-than-temporary reflects management’s current judgment regarding facts and circumstances specific to a security and the factors noted above, including Ambac's intention to sell securities and ability to hold temporarily impaired securities until recovery. If that judgment changes, Ambac may ultimately record a charge for other-than-temporary impairment in future periods.
Net Realized Investment Gains.
The following table provides a breakdown of net realized gains, by business segment, for the periods presented:
|
($ in millions)
|
Financial
Guarantee
|
Financial
Services
|
Corporate
|
Total
|
|||||||||||
|
Successor Ambac - Year Ended December 31, 2014
|
|||||||||||||||
|
Net gains on securities sold or called
|
$
|
53.3
|
|
$
|
0.3
|
|
$
|
—
|
|
$
|
53.6
|
|
|||
|
Foreign exchange gains
|
5.2
|
|
—
|
|
—
|
|
5.2
|
|
|||||||
|
Total net realized gains
|
$
|
58.5
|
|
$
|
0.3
|
|
$
|
—
|
|
$
|
58.8
|
|
|||
|
Successor Ambac—Period from May 1 through December 31, 2013
|
|||||||||||||||
|
Net gains on securities sold or called
|
$
|
10.9
|
|
$
|
1.7
|
|
$
|
—
|
|
$
|
12.6
|
|
|||
|
Foreign exchange (losses)
|
(8.1
|
)
|
—
|
|
—
|
|
(8.1
|
)
|
|||||||
|
Total net realized gains
|
$
|
2.8
|
|
$
|
1.7
|
|
$
|
—
|
|
$
|
4.5
|
|
|||
|
Predecessor Ambac—Period from January 1 through April 30, 2013
|
|||||||||||||||
|
Net gains on securities sold or called
|
$
|
7.2
|
|
$
|
39.9
|
|
$
|
—
|
|
$
|
47.1
|
|
|||
|
Foreign exchange gains
|
6.2
|
|
—
|
|
—
|
|
6.2
|
|
|||||||
|
Total net realized gains
|
$
|
13.4
|
|
$
|
39.9
|
|
$
|
—
|
|
$
|
53.3
|
|
|||
|
Predecessor Ambac—Year Ended December 31, 2012
|
|||||||||||||||
|
Net gains on securities sold or called
|
$
|
45.1
|
|
$
|
27.1
|
|
$
|
—
|
|
$
|
72.2
|
|
|||
|
Foreign exchange (losses)
|
(0.1
|
)
|
—
|
|
—
|
|
(0.1
|
)
|
|||||||
|
Total net realized gains
|
$
|
45.0
|
|
$
|
27.1
|
|
$
|
—
|
|
$
|
72.1
|
|
|||
Net gains during the year ended
December 31, 2014
arose primarily from the sale of assets received pursuant to Ambac's remediation activities and net gains on securities sold in connection with the reallocation of the investment portfolio and to raise liquidity for the anticipated payment of Deferred Amounts and surplus notes in the fourth quarter of 2014, partially offset by net foreign exchange losses. The net gains during the eight months ended December 31, 2013 were primarily the result of asset sales in connection with the planned repositioning of the portfolio. The net gains during the four months ended April 30, 2013 were primarily the result of recoveries from the settlement of litigation associated with investment securities that were written-off in 2002 and 2003. No significant future recoveries on these securities are expected. Net gains during the year ended December 31, 2012 arose primarily from securities sold to raise liquidity in connection with the initial resumption of partial claim payments for policies allocated to the Segregated Account, commutations of certain financial guarantee exposures and repurchases of surplus notes.
Change in Fair Value of Credit Derivatives.
The valuation of credit derivative liabilities is impacted by the market’s view of Ambac Assurance’s credit quality. We reflect Ambac’s own credit quality in the fair value of such liabilities by including a credit valuation adjustment (“CVA”) in the determination of fair value. The gain from change in fair value of credit derivatives for the year ended
December 31, 2014
was $23.9 million, a decrease of $108.6 million as compared to the year ended
December 31, 2013
. For the year ended December 31, 2013, the gain from change in fair value of credit derivatives increased by $141.7 million compared to the loss reported for the year ended December 31, 2012 of $9.2 million. The change in fair value of credit derivatives for each of the periods presented included improvements in reference obligation prices, gains associated with runoff of the portfolio and credit derivative fees earned, net of the impact of incorporating the Ambac CVA. The net gain of $23.9 million in 2014 resulted from gains from runoff and reference obligation price improvements, partially offset by declining Ambac CVA discount rates, especially in the first half of the year. The net gain of $192.9 million for the eight months ended December 31, 2013 primarily reflected significant contract terminations resulting in the reversal of unrealized mark-to-market losses. The discount rates used to determine the Ambac CVA did not change significantly during that period. The net losses of $60.4 million for the four months ended April 30, 2013 and $9.2 million for the year ended December 31, 2012 were the result of substantial declines in Ambac CVA discount rates during the periods which more than offset underlying gains from reference obligation runoff and price improvements. The CVA changes each period are based on observed
47
changes in the fair value of Ambac Assurance’s direct and guaranteed obligations. Reductions to the CVA resulted in losses within the overall change in fair value of credit derivative liabilities of $23.1 million for the year ended
December 31, 2014
compared to $61.4 million, $160.9 million and $311.3 million for the eight months ended December 31, 2013, four months ended April 30, 2013 and year ended December 31, 2012 respectively.
Realized gains and other settlements on credit derivative contracts represent premiums received and accrued on such contracts. Realized gains and other settlements were $3.0 million for the year ended
December 31, 2014
, a decrease of $10.2 million from the year ended
December 31, 2013
. Realized gains and other settlements for the year ended December 31, 2013 declined by $0.5 million compared to gains of $13.7 million for the year ended December 31, 2012. The declines over time are due to reduced premium receipts resulting from continued runoff of the credit derivative portfolio. Included in realized gains and other settlements on credit derivatives were fees received in connection with transaction terminations of $0.5 million, $5.6 million, $0.0 million and $1.2 million for the years ended December 31, 2014, eight months ended December 31, 2013, four months ended April 30, 2013 and the year ended December 31, 2012 respectively. There were no loss or settlement payments in the periods presented.
Unrealized gains (losses) on credit derivative contracts reflect the impact of all other factors on the overall change in fair value of credit derivatives noted above. See Note 10. Fair Value Measurements to the Consolidated Financial Statements included in Part II, Item 8 in this Form 10-K for a further description of Ambac’s methodology for determining the fair value of credit derivatives. The table below indicates the impact of incorporating Ambac’s own credit risk into the fair value of credit derivatives as of
December 31, 2014 and 2013
:
|
December 31,
|
|||||||
|
($ in millions)
|
2014
|
2013
|
|||||
|
Mark-to-market liability of credit derivatives, excluding CVA
|
$
|
89.4
|
|
$
|
133.3
|
|
|
|
CVA on credit derivatives
|
(15.9
|
)
|
(39.0
|
)
|
|||
|
Net credit derivative liability at fair value
|
$
|
73.5
|
|
$
|
94.3
|
|
|
Derivative Product Revenues.
The derivative products portfolio is positioned to benefit from rising rates as an economic hedge against interest rate exposure in the financial guarantee portfolio. Net losses reported in derivative product revenues for the year ended
December 31, 2014
were
$(181.1) million
, reflecting
a decline
of
$262.2 million
as compared to the
net gains
for the year ended
December 31, 2013
. Derivative product revenues for the year ended
December 31, 2013
increased by
$206.0 million
compared to
net losses
reported for the year ended December 31, 2012 of
$125.0 million
. Results in derivative product revenues were primarily driven by mark-to-market (losses) gains in the portfolio caused by (falling) rising interest rates during the periods, net of the impact of the Ambac CVA as discussed below. Additionally, 2012 included a realized loss related to the negotiated termination of a derivative asset.
The fair value of derivatives includes a valuation adjustment to reflect Ambac’s own credit risk when appropriate. Within the financial services derivatives portfolio, an Ambac CVA is generally applicable for uncollateralized derivative liabilities that may not be offset by derivative assets under a master netting agreement. Inclusion of an Ambac CVA in the valuation of financial services derivatives resulted in gains (losses) within derivative products revenues of
$16.1 million
, $(46.8) million, $(26.7) million and $(44.9) million for the year ended
December 31, 2014
, eight months ended December 31, 2013, four months ended April 30, 2013 and year ended December 31, 2012, respectively. The impact of changes to the CVA reflects the market’s view of Ambac Assurance’s credit quality as well as the amount of underlying liabilities, which generally decline as interest rates increase. The market's view of Ambac Assurance's credit quality generally improved during 2013 and 2014. The table below indicates the impact of incorporating Ambac’s own credit risk into the fair value of the derivative products portfolio (excluding credit derivatives) as of
December 31, 2014 and 2013
:
|
December 31,
|
|||||||
|
($ in millions)
|
2014
|
2013
|
|||||
|
Derivative products mark-to-market liability, excluding CVA
|
$
|
289.0
|
|
$
|
130.3
|
|
|
|
CVA on derivative products portfolio
|
(64.5
|
)
|
(48.4
|
)
|
|||
|
Net derivative products portfolio liability at fair value
|
$
|
224.5
|
|
$
|
81.9
|
|
|
Net Realized Losses on Extinguishment of Debt
.
As described in Note 1. Background and Business Description to the Consolidated Financial Statements included in Part II, Item 8 in this Form 10-K, the Rehabilitator redeemed certain Segregated Account surplus notes (excluding junior surplus notes) on November 20, 2014 at a redemption price that included an amount equal to accrued interest on such redeemed surplus notes. Such redemption also triggered similar proportionate redemption payments on Ambac Assurance's surplus notes. The redemption of all surplus notes resulted in a charge representing the accelerated recognition of the unamortized discount on the redeemed surplus notes, which amounted to
$74.7 million
.
During June 2012, Ambac Assurance exercised options to repurchase surplus notes with an aggregate par value of
$789.2 million
for an aggregate cash payment of
$188.4 million
. Certain of these options were free-standing derivatives for accounting purposes. The carrying value of the repurchased surplus notes and accrued interest less the fair value of the free-standing derivatives were below the call option exercise prices and, accordingly, for the year ended
December 31, 2012
, Ambac recognized a realized loss of
$177.7 million
.
Other Income
.
Other income is primarily comprised of foreign exchange gains and losses unrelated to investments or loss reserves, and deal structuring, commitment, consent and waiver fees. Other income for the years ended
December 31, 2014
was
$12.5 million
, a decrease of $0.2
48
million as compared to the income for the year ended December 31, 2013. Other income for the year ended December 31, 2012 was
$106.1 million
. Other income for the year ended
December 31, 2014 and 2013
primarily resulted from deal-related fees offset by foreign exchange losses. Other income for the year ended December 31, 2012 primarily resulted from: mark-to-market gains of $100.7 million related to Ambac’s option to call $500 million par of surplus notes which were free-standing derivatives for accounting purposes. Such options were exercised in June 2012. Changes in fair value of these options through the date of exercise are reported within Other income.
Income (loss) on Variable Interest Entities
.
Included within Income (loss) on variable interest entities are income statement amounts relating to VIEs consolidated under the Consolidation Topic of the ASC, including gains or losses attributable to consolidating or deconsolidating VIEs during the periods reported. Generally, the Company’s consolidated VIEs are entities for which Ambac has provided financial guarantees on its assets or liabilities. In consolidation, most assets and liabilities of the VIEs are reported at fair value and the related insurance assets and liabilities are eliminated. However, the amount of VIE net assets (liabilities) that remain in consolidation generally result from the net positive (negative) present value of projected cash flows from (to) the VIEs which are attributable to Ambac’s insurance subsidiaries in the form of financial guarantee insurance premiums, fees and losses. In the case of VIEs with net negative projected cash flows, the net liability is generally to be funded by Ambac’s insurance subsidiaries through insurance claim payments. Differences between the net carrying value of the insurance accounts under the Financial Services—Insurance Topic of the ASC and the carrying value of the consolidated VIE’s net assets or liabilities are recorded through income at the time of consolidation or deconsolidation.
Income (loss) on variable interest entities were
$(32.2) million
,
$(48.6) million
,
$426.6 million
and
$27.8 million
for the year ended
December 31, 2014
, eight months ended
December 31, 2013
, four months ended
April 30, 2013
and the year ended
December 31, 2012
, respectively. The loss for the year ended
December 31, 2014
reflects a decrease in the fair value of net assets primarily due to a decrease in the CVA applied to certain VIE note liabilities that include significant projected financial guarantee claims. Results for the
2013
periods are driven primarily by the consolidation and subsequent results from a VIE related to an adversely classified financial guarantee transaction. Ambac Assurance guarantees certain note liabilities of the VIE and had established loss reserves associated with those guarantees prior to the event of default which triggered consolidation of the entity on
April 30, 2013
. The VIE contained primarily non-financial intangible assets which were carried at amortized cost subsequent to the consolidation date, while its note liabilities were carried at fair value with changes in value reported through earnings. Income on variable interest entities for the four months ended
April 30, 2013
includes the consolidation gain of
$385.3 million
of this VIE, representing the difference between net assets of the VIE at fair value as of the consolidation date and the previous carrying value of Ambac’s net insurance liabilities. Additionally, the four months ended
April 30, 2013
included gains associated with longer estimated lives of certain transactions and the resultant increase in projected positive net cash flows from the VIEs to Ambac in the form of financial guarantee premiums. The loss for the eight months ended
December 31, 2013
primarily reflects the
$83.4 million
write-down of certain intangible assets held by the VIE discussed above, partially offset by gains from the reduction to fair value of its note liabilities. The eight months ended
December 31, 2013
also includes a loss of
$15.3 million
associated with the deconsolidation of a separate VIE. Income on variable interest entities for
2012
resulted from positive changes to the fair value of net assets primarily attributable to accretion of the present value discount of net VIE assets into income. Refer to Note 4. Special Purpose Entities, including Variable Interest Entities to the Consolidated Financial Statements included in Part II, Item 8 in this Form 10-K for further information on the accounting for VIEs.
Losses and Loss Expenses.
Losses and loss expenses are based upon estimates of the aggregate losses inherent in the non-derivative financial guarantee portfolio for insurance policies issued to beneficiaries, including unconsolidated VIEs. Losses and loss expenses include interest on Deferred Amounts pursuant to the amended Segregated Account Rehabilitation Plan, which became effective June 12, 2014. The amendments to the Segregated Account Rehabilitation Plan primarily modified the mechanism for handling claims under the Segregated Account Rehabilitation Plan. Instead of the combination of cash payments and interest-bearing surplus notes originally contemplated by the Segregated Account Rehabilitation Plan, holders of permitted policy claims have received and will receive an initial interim cash payment for a portion of such policy claim (“Interim Payment”), together with the right to receive a deferred payment equal to the balance of the unpaid policy claim (“Deferred Amount”). The amended Segregated Account Rehabilitation Plan requires that Deferred Amounts generally accrue and compound interest at an annual effective rate of 5.1%. In the case of permitted policy claims relating to transactions that pay monthly, interest will begin to accrue on Deferred Amounts from the first distribution date (under the transaction documents for the relevant bond) after the date on which the Interim Payment in respect of such permitted policy claim was made. For permitted policy claims relating to transactions that do not pay monthly, interest will begin to accrue on Deferred Amounts from the first Payment Date (as defined in the Segregated Account Rehabilitation Plan, as amended) to occur after the date on which the Interim Payment in respect of such permitted policy claim was made. Losses and loss expenses for the
year ended December 31, 2014
include interest accruals from the beginning of the accrual periods through
December 31, 2014
.
Ambac records as a component of its loss reserve estimate, subrogation recoveries related to securitized loans in RMBS transactions that breached certain representations and warranties described herein. Ambac does not include potential recoveries attributed solely to fraudulent inducement claims in our litigations in our estimate of representation and warranty subrogation recoveries. Generally, the sponsor of an RMBS transaction provided representations and warranties with respect to the securitized loans, including representations with respect to the loan characteristics, the absence of borrower fraud in the underlying loan pools or other misconduct in the origination process and attesting to the compliance of loans with the prevailing underwriting policies. Ambac has recorded RMBS subrogation recoveries of $2.5 billion and $2.2 billion at
December 31, 2014 and 2013
, respectively. Refer to Note 2. Basis of Presentation and Significant Accounting Policies to the Consolidated Financial Statements included in Part II, Item 8 in this Form 10-K for more information regarding the estimation process for representation and warranty subrogation recoveries.
Losses and loss expenses for the
year ended December 31, 2014
were a benefit of $545.6 million, an increased benefit of $322.4 million compared to the
year ended December 31, 2013
. The
year ended December 31, 2014
benefit included $475.7 million net positive loss reserve development, $481.6 million from increases in our estimate of representations and warranty subrogation recoveries as a result of continuous efforts and ongoing assessments of the value of our claims; partially offset by $411.7 million of interest expense on Deferred Amounts. Losses and loss expenses
49
for the year ended December 31, 2013 decreased $906.8 million from an incurred amount of $683.6 million for the year ended December 31, 2012. The following provides details, by bond type, for losses and loss expenses (benefit) incurred for the periods presented:
|
Successor Ambac
|
Predecessor Ambac
|
|||||||||||||||
|
|
Period from May 1
|
Period from January 1
|
||||||||||||||
|
Year Ended
|
through
|
through
|
Year Ended
|
|||||||||||||
|
($ in millions)
|
December 31, 2014
|
December 31, 2013
|
April 30, 2013
|
December 31, 2012
|
||||||||||||
|
RMBS
(1)
|
$
|
(874.3
|
)
|
$
|
(127.5
|
)
|
$
|
(241.1
|
)
|
$
|
6.5
|
|
||||
|
Student Loans
|
(89.9
|
)
|
(90.8
|
)
|
35.4
|
|
(65.9
|
)
|
||||||||
|
Domestic Public Finance
|
64.4
|
|
100.4
|
|
45.6
|
|
185.5
|
|
||||||||
|
Ambac UK
|
(22.3
|
)
|
(83.4
|
)
|
88.8
|
|
154.7
|
|
||||||||
|
All other credits
|
(79.8
|
)
|
8.7
|
|
23.1
|
|
319.7
|
|
||||||||
|
Interest on Deferred Amounts
|
411.7
|
|
—
|
|
—
|
|
—
|
|
||||||||
|
Loss expenses
|
44.6
|
|
7.5
|
|
10.1
|
|
83.1
|
|
||||||||
|
Totals
|
$
|
(545.6
|
)
|
$
|
(185.1
|
)
|
$
|
(38.1
|
)
|
$
|
683.6
|
|
||||
|
(1)
|
Ambac records the impact of estimated recoveries related to securitized loans in RMBS transactions that breached certain representations and warranties within loss and loss expenses (benefit). The loss and loss expense (benefit) for the year ended December 31, 2014, the eight months ended December 31, 2013, the four months ended April 30, 2013 and the year ended December 31, 2012 was $(481.6), $199.4, $(61.6), and $195.2, respectively.
|
The following table provides details of net claims recorded, net of reinsurance for the affected periods:
|
Successor Ambac
|
Predecessor Ambac
|
|||||||||||||||
|
|
Period from May 1
|
Period from January 1
|
||||||||||||||
|
Year Ended
|
through
|
through
|
Year Ended
|
|||||||||||||
|
($ in millions)
|
December 31, 2014
|
December 31, 2013
|
April 30, 2013
|
December 31, 2012
|
||||||||||||
|
Claims recorded
(1)
|
$
|
463.7
|
|
$
|
441.5
|
|
$
|
403.4
|
|
$
|
1,774.6
|
|
||||
|
Subrogation received
|
(500.5
|
)
|
(292.0
|
)
|
(160.4
|
)
|
(222.2
|
)
|
||||||||
|
Net Claims Recorded
|
$
|
(36.8
|
)
|
$
|
149.5
|
|
$
|
243.0
|
|
$
|
1,552.4
|
|
||||
|
(1)
|
Claims recorded include (i) claims paid and (ii) changes to claims presented and not yet presented through the balance sheet date for policies which were allocated to the Segregated Account. Item (ii) includes permitted policy claims for policies allocated to the Segregated Account that were presented and approved by the Rehabilitator of the Segregated Account but not paid through to the balance sheet date in accordance with the amended Segregated Account Rehabilitation Plan and associated rules and guidelines as discussed in Note 1. Background and Business Description to the Consolidated Financial Statements included in Part II, Item 8 in this Form 10-K. Amounts recorded for claims not yet presented and/or permitted are based on management’s judgment. Claims recorded exclude interest accrued on Deferred Amounts.
|
Underwriting and Operating Expenses.
Underwriting and operating expenses consist of gross operating expenses plus reinsurance commissions and the amortization of previously deferred insurance acquisition costs. Reinsurance commissions and the amortization of previously deferred underwriting expenses are included in Financial Guarantee segment results. As discussed above, all deferred acquisition costs were written off in Fresh Start and accordingly no amortization is reported in Successor Ambac. The following table provides details of underwriting and operating expenses for the periods presented:
|
Successor Ambac
|
Predecessor Ambac
|
|||||||||||||||
|
|
Period from May 1
|
Period from January 1
|
||||||||||||||
|
Year Ended
|
through
|
through
|
Year Ended
|
|||||||||||||
|
($ in millions)
|
December 31, 2014
|
December 31, 2013
|
April 30, 2013
|
December 31, 2012
|
||||||||||||
|
Gross operating expenses
|
$
|
100.1
|
|
$
|
67.3
|
|
$
|
37.8
|
|
$
|
108.9
|
|
||||
|
Reinsurance commissions, net
|
1.4
|
|
1.5
|
|
0.3
|
|
4.6
|
|
||||||||
|
Amortization of deferred acquisition costs
|
—
|
|
—
|
|
6.5
|
|
25.5
|
|
||||||||
|
Total
|
$
|
101.5
|
|
$
|
68.8
|
|
$
|
44.6
|
|
$
|
139.0
|
|
||||
Gross operating expenses for the
year ended December 31, 2014
are
$100.1 million
, a decrease of
$5.0 million
from gross operating expenses for the
year ended December 31, 2013
. The decrease was primarily due to lower compensation, legal and insurance expenses, partially offset by higher directors' fees and premium taxes. Higher directors' fees are primarily related to the expensing of equity awards which were granted in December 2013 and April 2014. Gross operating expenses for the year ended December 31, 2013 decreased $3.8 million compared to gross operating expenses reported for the year ended December 31, 2012 of $108.9 million. The decrease was primarily due to lower consulting, legal and insurance expenses, partially offset by higher premium taxes and compensation.
As a consequence of the Segregated Account Rehabilitation Proceedings, the Rehabilitator retains operational control and decision-making authority with respect to all matters related to the Segregated Account, including the hiring of advisers. Legal and consulting services provided
50
for the benefit of OCI amounted to $6.5 million during the
year ended December 31, 2014
, a decrease of $2.5 million from the
year ended December 31, 2013
. Legal and consulting services provided for the benefit of OCI amounted to $11.8 million during the year ended December 31, 2012. Future expenses may include advisory costs for the benefit of OCI that are outside the control of Ambac’s management.
Interest Expense.
Interest expense includes accrued interest on investment agreements, a secured borrowing transaction and surplus notes issued by Ambac Assurance and the Segregated Account. Additionally, interest expense includes discount accretion on surplus notes as their carrying value is at a discount to par. As described in Note 14. Long-term Debt to the Consolidated Financial Statements included in Part II, Item 8 in this Form 10-K, a junior surplus note with a par value of
$350.0 million
originally issued to Ambac by the Segregated Account, together with accrued interest thereon, was sold to a newly formed trust in August 2014 in connection with a secured borrowing transaction. Subsequent to the sale, the junior surplus note is reflected as debt on Ambac's balance sheet along with other surplus notes and junior surplus notes held by third parties.
As a result of Fresh Start, the unamortized discounts on surplus notes have decreased by resetting the carrying value to fair value at the Fresh Start Reporting Date and future cash flows on the surplus notes have been re-projected. Both of these items impacted the amount of discount accretion recognized in interest expense for Successor Ambac. Accretion of surplus note discounts included within overall interest expense was
$42.7 million
for the
year ended December 31, 2014
, an increase of
$4.7 million
and
$29.3 million
from the
2013
and
2012
periods, respectively. Interest expense on the junior surplus note sold in August 2014 was
$7.0 million
for the
year ended December 31, 2014
.
The following table provides details by type of obligation for the periods presented
:
|
Successor Ambac
|
Predecessor Ambac
|
|||||||||||||||
|
|
Period from May 1
|
Period from January 1
|
||||||||||||||
|
Year Ended
|
through
|
through
|
Year Ended
|
|||||||||||||
|
($ in millions)
|
December 31, 2014
|
December 31, 2013
|
April 30, 2013
|
December 31, 2012
|
||||||||||||
|
Interest expense:
|
|
|
|
|||||||||||||
|
Surplus notes
|
$
|
125.9
|
|
$
|
83.5
|
|
$
|
29.5
|
|
$
|
103.6
|
|
||||
|
Investment agreements
|
1.6
|
|
1.4
|
|
1.3
|
|
6.3
|
|
||||||||
|
Secured borrowing
|
—
|
|
0.1
|
|
0.2
|
|
2.4
|
|
||||||||
|
Total
|
$
|
127.5
|
|
$
|
85.0
|
|
$
|
31.0
|
|
$
|
112.3
|
|
||||
Surplus note principal and interest payments require the approval of OCI. Annually from 2011 through 2014, OCI issued its disapproval of the requests of Ambac Assurance and the Rehabilitator of the Segregated Account, acting for and on behalf of the Segregated Account, to pay interest on outstanding surplus notes issued by Ambac and the Segregated Account on the annual scheduled interest payment date of June 7th. Neither Ambac Assurance nor the Rehabilitator of the Segregated Account, acting for and on behalf of the Segregated Account, have requested to pay interest on any junior surplus notes since their issuance. The interest of the outstanding surplus notes and junior surplus notes were accrued for and Ambac is accruing interest on the interest amounts following each scheduled interest payment date.
As described in Note 1. Background and Business Description to the Consolidated Financial Statements included in Part II, Item 8 in this Form 10-K, the Rehabilitator redeemed certain Segregated Account surplus notes (other than junior surplus notes) on November 20, 2014. Such redemption also triggered similar proportionate redemption payments on Ambac Assurance's surplus notes. The redemption of surplus notes resulted in a charge representing the accelerated recognition of the unamortized discount on the redeemed surplus notes of
$74.7 million
in Net realized losses on extinguishment of debt of the Consolidated Statements of Total Comprehensive Income (Loss). Net of the amounts paid in connection with the November 2014 redemption, total accrued interest for surplus notes and junior surplus notes outstanding to third parties were
$237.8 million
and
$35.9 million
, respectively, at December 31, 2014.
Additionally, if OCI approves interest payments on surplus notes in the future, Ambac Assurance will also be required to pay interest accrued on certain repurchased surplus notes through the call option exercise dates. The amount of such unpaid interest on repurchased surplus notes is
$38.5 million
at December 31, 2014.
Reorganization Items.
Reorganization items are primarily expenses directly attributed to our Chapter 11 reorganization process.
51
The following table presents reorganization fees for all periods presented:
|
Successor Ambac
|
Predecessor Ambac
|
|||||||||||||||
|
|
Period from May 1
|
Period from January 1
|
||||||||||||||
|
Year Ended
|
through
|
through
|
Year Ended
|
|||||||||||||
|
($ in millions)
|
December 31, 2014
|
December 31, 2013
|
April 30, 2013
|
December 31, 2012
|
||||||||||||
|
Reorganization items:
|
||||||||||||||||
|
Professional advisory fees
|
$
|
0.2
|
|
$
|
0.5
|
|
$
|
4.4
|
|
$
|
7.5
|
|
||||
|
Gain from cancellation and satisfaction of Predecessor Ambac debt
|
—
|
|
—
|
|
(1,521.4
|
)
|
—
|
|
||||||||
|
Fresh Start reporting adjustments
|
—
|
|
—
|
|
(1,228.2
|
)
|
(0.3
|
)
|
||||||||
|
Total
|
$
|
0.2
|
|
$
|
0.5
|
|
$
|
(2,745.2
|
)
|
$
|
7.2
|
|
||||
Provision for Income Taxes
.
The provision for income taxes for the
year ended December 31, 2014
was
$9.6 million
an increase
of
$1.3 million
compared to the provision for income taxes reported for 2013 (
$7.5 million
and
$0.8 million
for the eight months ended December 31, 2013 and four months ended April 30, 2013, respectively). The provision for income taxes for the year ended December 31, 2012 was
$2.8 million
. All periods include a provision for pre-tax profits in Ambac UK’s Italian branch, which cannot be offset by losses in other jurisdictions. The income tax for the years ended
December 31, 2014 and 2013
includes a provision for federal AMT taxes. The income tax for the eight months ended
December 31, 2013
and the four months ended April 30, 2013 also includes a provision for New York State alternative minimum taxes.
At
December 31, 2014
the Company had
$5.0 billion
of U.S. Federal net ordinary operating loss carryforwards, including
$1.4 billion
at Ambac Financial Group and
$3.6 billion
at Ambac Assurance.
LIQUIDITY AND CAPITAL RESOURCES
Ambac Financial Group, Inc. Liquidity
.
Ambac’s liquidity is dependent on its current cash and investments of
$257.4 million
as of December 31, 2014 and expense sharing and other arrangements with Ambac Assurance as described below. Pursuant to the Mediation Agreement, Amended TSA and Cost Allocation Agreement (as each such term is defined in Note 1. Background and Business Description to the Consolidated Financial Statements included in Part II, Item 8 in this Form 10-K), Ambac Assurance is required, under certain circumstances, to make payments to Ambac with respect to the utilization of net operating loss carry-forwards (“NOLs”) and to reimburse certain operating costs and expenses. Any expected receipts with regard to the utilization of NOLs will only occur after Ambac Assurance utilizes NOLs generated after September 30, 2011.Ambac Assurance has utilized all of those NOLs through December 31, 2014 and its cumulative net taxable income was $43.7 million. Future taxable income of Ambac Assurance will be subject to payments under its NOL tolling agreement with Ambac, after certain credits. See Note 1. Background and Business Description and Note 16. Income Taxes to the Consolidated Financial Statements included in Part II, Item 8 in this Form 10-K for descriptions of the Mediation Agreement, the Amended TSA and the Cost Allocation Agreement.
On August 28, 2014, Ambac deposited
$350.0 million
face amount of a junior surplus note issued to it by the Segregated Account, plus accrued but unpaid interest thereon, into a statutory trust (the "Trust") in exchange for net proceeds of
$224.3 million
and a subordinated owner trust certificate (the “Owner Trust Certificate”) issued by the Trust in the face amount of
$74.8 million
. Proceeds from the transaction are expected to be used to fund Ambac's growth and diversification initiatives, including potential acquisitions and development opportunities, select Ambac Assurance liability management activities and for general corporate purposes. The Trust funded the cash portion of its purchase of the junior surplus note with proceeds of the private placement of
$299.2 million
face amount of senior secured notes (the "Notes") to third party investors. The Notes have a final maturity of August 28, 2039. Interest on the Notes accrues at 5.1% per annum and compounds annually on June 7th of each year up to and including the maturity date. Payments on the Notes will be made when and to the extent that the Segregated Account makes payments on the junior surplus note. The Notes must be paid in full before any payments will be made on the Owner Trust Certificate. The Notes and Owner Trust Certificate are non-recourse to Ambac, Ambac Assurance and the Segregated Account, but are collateralized by the junior surplus note. It is uncertain whether and to what extent Ambac will realize value from the Owner Trust Certificate.
It is highly unlikely that Ambac Assurance will be able to make dividend payments to Ambac for the foreseeable future and therefore current cash and investments and payments under the Cost Allocation Agreement will be Ambac’s principal source of liquidity in the near term. Refer to Part I, Item 1, “Insurance Regulatory Matters - Dividend Restrictions, Including Contractual Restrictions” and Note 9. Insurance regulatory Restrictions to the Consolidated Financial Statements included in Part II, Item 8, in this Form 10-K for more information on dividend payment restrictions. The principal use of liquidity is the payment of operating expenses, including costs to explore opportunities to grow and diversify Ambac. Contingencies could cause material liquidity strains.
52
The following table includes aggregated information about contractual obligations for Ambac and its subsidiaries, excluding variable interest entities consolidated as a result of Ambac Assurance’s financial guarantee contracts. These obligations include payments due under specified contractual obligations, aggregated by type of contractual obligation, including claim payments, principal and interest payments under Ambac Assurance’s and the Segregated Account’s surplus notes, investment agreement obligations, and payments due under operating leases. The table and commentary below reflect scheduled payments and maturities based on the original payment terms specified in the underlying agreements and contracts, or expected required payment dates if earlier.
|
Contractual Obligations by Year
|
|||||||||||||||||||||||
|
($ in millions)
|
2015
|
|
2016
|
|
2017
|
|
2018
|
|
2019
|
|
Thereafter
|
||||||||||||
|
Surplus note obligations
(1)
|
$
|
301.4
|
|
$
|
47.6
|
|
$
|
47.6
|
|
$
|
47.6
|
|
$
|
47.6
|
|
$
|
1,522.2
|
|
|||||
|
Investment agreement obligations
(2)
|
51.0
|
|
6.8
|
|
107.8
|
|
—
|
|
—
|
|
—
|
|
|||||||||||
|
Operating lease obligations
(3)
|
5.7
|
|
0.5
|
|
0.5
|
|
0.5
|
|
0.4
|
|
0.3
|
|
|||||||||||
|
Purchase obligations
(4)
|
3.8
|
|
1.6
|
|
0.4
|
|
—
|
|
—
|
|
—
|
|
|||||||||||
|
Postretirement benefits
(5)
|
0.3
|
|
0.3
|
|
0.3
|
|
0.4
|
|
0.4
|
|
2.2
|
|
|||||||||||
|
Loss and loss expenses
(6)
|
3,727.1
|
|
414.4
|
|
284.8
|
|
168.9
|
|
105.5
|
|
3,603.2
|
|
|||||||||||
|
Income Taxes
|
—
|
|
—
|
|
—
|
|
—
|
|
—
|
|
—
|
|
|||||||||||
|
Total
|
$
|
4,089.3
|
|
$
|
471.2
|
|
$
|
441.4
|
|
$
|
217.4
|
|
$
|
153.9
|
|
$
|
5,127.9
|
|
|||||
|
(1)
|
Includes principal of and interest on surplus notes when due. All payments of principal and interest on surplus notes are subject to the prior approval of the OCI. If the OCI does not approve the payment of interest on the surplus notes, such interest will accrue and compound annually until paid. OCI disapproved scheduled interest payments for June 7, 2011, 2012, 2013 and 2014. Amounts in the table assume approval by OCI for all principal and interest payments in the future, including payment of previously deferred interest totaling $243.4 million on the next scheduled payment date of June 7, 2015.
|
|
(2)
|
Includes principal of and interest on obligations using current rates for floating rate obligations. Certain investment agreements have contractual provisions that allow our counterparty the flexibility to withdraw funds prior to legal maturity date. Amounts included in the table are based on the expected withdrawal date.
|
|
(3)
|
Amount represents future lease payments on lease agreements existing as of
December 31, 2014
. Ambac Assurance's lease with One State Street Plaza has a provision where Ambac Assurance can remain at One State Street Plaza through September 2019 (requires consent of both parties) with the potential for a reduced amount of space. In February 2015, both parties committed to extending the lease term with the rental cost still to be determined. The above table does not reflect payments after December 31, 2015. Contractual rent for this lease is approximately $4.9 million for 2015.
|
|
(4)
|
Purchase obligations represent future expenditures for contractually scheduled fixed terms and amounts due for various technology-related maintenance agreements and other outside services.
|
|
(5)
|
Amount represents future payments relating to the Ambac Assurance postretirement benefit plan for current retirees over the next 10 years.
|
|
(6)
|
The timing of expected claim payments is based on deal specific cash flows, excluding expected recoveries. These deal specific cash flows are based on the expected cash flows of the underlying transactions (e.g. for RMBS credits we model estimated future claim payments). The timing of expected claim payments for credits with reserves that were established using our statistical loss reserve method is determined based on the weighted average expected life of the exposure. Refer to the Loss Reserves section in Note 2. Basis of Presentation and Significant Accounting Policies to the Consolidated Financial Statements included in Part II, Item 8 in this Form 10-K for further discussion of our statistical loss reserve method. The timing of these payments may vary significantly from the amounts shown above, especially for credits that are based on our statistical loss reserve method. As further described in Note 1. Background and Business Description to the Consolidated Financial Statements included in Part II, Item 8 in this Form 10-K, following the effective date of the Segregated Account Rehabilitation Plan, as amended, the percentage of the initial cash Interim Payment for permitted policy claims increased from
25%
to
45%
with effect from July 21, 2014. The Segregated Account will continue to make cash payments of 45% of each policy claim submitted and permitted in accordance with the Segregated Account Rehabilitation Plan, as amended (plus, in certain cases, Supplemental Payments or Special Policy Payments), subject to any further orders of the Rehabilitation Court. As with previously permitted policy claims, the remaining portion of the unpaid permitted policy claims (in this case,
55%
) will remain outstanding as Deferred Amounts and, subject to the adjustment for Undercollateralized Bonds, will accrue interest at
5.1%
per annum. These Deferred Amounts, together with interest thereon, may be paid from time to time in the future at the sole discretion of the Rehabilitator. Unpaid claims include deferred policy claims of $2,945.0 and accrued interest on Deferred Amounts of $329.2 at
December 31, 2014
. We have included such unpaid amounts as obligations due in 2015. Additionally, all future claim payments are included in their respective year at the estimated permitted claim amount.
|
Ambac Assurance Liquidity
.
Ambac Assurance’s liquidity is dependent on the balance of liquid investments and, over time, the net impact of sources and uses of funds. The principal sources of Ambac Assurance’s liquidity are gross installment premiums on insurance and credit default swap contracts, principal and interest payments from investments, sales of investments, proceeds from repayment of affiliate loans, recoveries on claim payments and reinsurance recoveries. Termination of installment premium policies on an accelerated basis may adversely impact Ambac Assurance’s liquidity. The principal uses of Ambac Assurance’s liquidity are the payment of operating expenses, claim and commutation payments on both insurance and credit derivative contracts, ceded reinsurance premiums, surplus note principal and interest payments and additional loans to affiliates. Interest and principal payments on surplus notes are subject to the approval of OCI, which has full discretion over payments regardless of the liquidity position of Ambac Assurance. The level of claims paid by the Segregated Account is subject to the sole discretion of the Rehabilitator, subject to any required approval of the Rehabilitation Court.
Ambac Assurance manages its liquidity risk by maintaining a comprehensive analysis of projected cash flows and maintenance of a specified level of cash and short-term investments at all times.
Pursuant to the injunctions issued by the Rehabilitation Court, claims on policies allocated to the Segregated Account are not permitted to be paid during the Segregated Account Rehabilitation Proceedings until approved by the Rehabilitator. As further described in Note 1. Background and Business Description to the Consolidated Financial Statements included in Part II, Item 8 in this Form 10-K, on or about September 20, 2012, the Segregated Account was permitted to pay, and commenced paying, 25% of each permitted policy claim that arose since the
53
commencement of the Segregated Account Rehabilitation Proceedings. As further described in Note 1. Background and Business Description to the Consolidated Financial Statements included in Part II, Item 8 in this Form 10-K, the Segregated Account is, and was, obliged to make Interim Payments of 45% of each permitted policy claim to be paid on or after July 21, 2014 in accordance with the amended Segregated Account Rehabilitation Plan and associated rules and guidelines.
In addition, as described in Note 1. Background and Business Description to the Consolidated Financial Statements included in Part II, Item 8 in this Form 10-K, the Rehabilitator has sought and received approval from the Rehabilitation Court to make Supplemental Payments and Special Policy Payments with respect to certain insured securities. During the year ended December 31, 2014, the Segregated Account made Supplemental Payments and Special Policy Payments of $133.7 million in respect of permitted policy claims. Permitted policy claims, including Deferred Amounts together with interest thereon, will be material uses of future liquidity.
As described in Note 1. Background and Business Description to the Consolidated Financial Statements included in Part II, Item 8 in this Form 10-K, under the Segregated Account Rehabilitation Plan the unpaid balance of permitted policy claims ("Deferred Amounts") will accrue interest (i) in the case of permitted policy claims relating to transactions that pay monthly, from the first distribution date (under the transaction documents for the relevant bond) after the date on which the Interim Payment in respect of such permitted policy claim was made until such outstanding policy obligations are paid in full or (ii) for permitted policy claims relating to transactions that do not pay monthly, from the first Payment Date (as defined in the Segregated Account Rehabilitation Plan, as amended) to occur after the date on which the Interim Payment in respect of such permitted policy claim was made until such outstanding policy obligations are paid in full. Interest on the Deferred Amounts will accrue generally at an effective rate of 5.1%, compounded annually. In the case of insured bonds whose outstanding principal balance is not reduced by the unpaid portion of permitted policy claims (such bonds, “Undercollateralized Bonds”), the 5.1% effective annual interest rate on the Deferred Amount will be reduced by the bond interest rate applicable to such Undercollateralized Bonds. The Segregated Account is responsible for unpaid accrued interest of $329.2 million through
December 31, 2014
. Furthermore, as more fully described in Note 1. Background and Business Description to the Consolidated Financial Statements included in Part II, Item 8 in this Form 10-K, on November 20, 2014 the Rehabilitator early redeemed a portion of the surplus notes issued by the Segregated Account, together with interest thereon, which resulted in a proportionate redemption by Ambac Assurance of its surplus notes. Additionally, on December 22, 2014, the Segregated Account made equalizing payments of Deferred Amounts, together with interest thereon. The aggregate amount of payments for the partial redemption of Segregated Account and Ambac Assurance surplus notes owned by third parties, including accrued interest, was
$413.6 million
in the aggregate and the equalizing payments of Deferred Amounts was $1,137.5 million.
In addition, as described in Note 1. Background and Business Description to the Consolidated Financial Statements included in Part II, Item 8 in this Form 10-K, the Segregated Account will establish Junior Deferred Amounts in respect of general claims, instead of issuing junior surplus notes as originally contemplated. Junior Deferred Amounts will generally accrue and compound interest at an annual effective rate of 5.1% and will be payable, as and when determined by the Rehabilitator, in his sole discretion. If approved by the Rehabilitator, payment of these Junior Deferred Amounts, together with interest thereon, will be a use of future liquidity.
Ambac Assurance is limited in its ability to pay dividends pursuant to the terms of its Auction Market Preferred Shares (“AMPS”), which state that dividends may not be paid on the common stock of Ambac Assurance unless all accrued and unpaid dividends on the AMPS for the then current dividend period have been paid, provided that dividends on the common stock may be made at all times for the purpose of, and only in such amounts as are necessary for enabling Ambac (i) to service its indebtedness for borrowed money as such payments become due or (ii) to pay its operating expenses. If dividends are paid on the common stock for such purposes, dividends on the AMPS become cumulative until the date that all accumulated and unpaid dividends have been paid on the AMPS. Ambac Assurance has not paid dividends on the AMPS since 2010. Refer to Part I, Item 1,
“Insurance Regulatory Matters - Dividend Restrictions, Including Contractual Restrictions”
and Note 9. Insurance Regulatory Restrictions to the Consolidated Financial Statements included in Part II, Item 8, in this Form 10-K for more information on dividend payment restrictions.
Our ability to recover RMBS representation and warranty recoveries and other subrogation recoveries is subject to significant uncertainty, including risks inherent in litigation, collectability of such amounts from counterparties (and/or their respective parents and affiliates), timing of receipt of any such recoveries, intervention by the Rehabilitator or OCI which could impede our ability to take actions required to realize such recoveries, and uncertainty inherent in the assumptions used in estimating such recoveries. The amount of these subrogation recoveries is significant and if we are unable to recover any amounts our future available liquidity to pay claims would be reduced materially. Ambac Assurance received subrogation, net of reinsurance of $500.5 million during the
year ended December 31, 2014
.
A wholly-owned subsidiary of Ambac Assurance is a party to credit default swaps (“CDS”) with various commercial counterparties. Ambac Assurance guarantees its subsidiary’s payment obligations under such CDS. The terms of such CDS include events of default or termination events based on the occurrence of certain events, or the existence of certain circumstances, relating to the financial condition of Ambac Assurance, including the commencement of an insolvency, rehabilitation or like proceeding. If such an event of default or termination event were to occur, the CDS counterparties could claim the contractual right to terminate the CDS and require Ambac Assurance, as financial guarantor, to make termination payments. Ambac Assurance estimates that such potential termination payments amount to $114.2 million as of
December 31, 2014
. However, the Rehabilitation Court has issued an injunction barring the early termination of contracts based on the occurrence of events or the existence of circumstances like those described above. As a result, Ambac Assurance does not expect to make early termination payments in respect of CDS where such amounts are claimed based on the occurrence of events, or the existence of circumstances, relating to the financial condition of Ambac Assurance.
54
Financial Services Liquidity
.
The principal uses of liquidity by Financial Services subsidiaries are payments on investment agreement obligations, payments on intercompany loans, payments under derivative contracts (primarily interest rate swaps and US Treasury futures), collateral posting and operating expenses. Management believes that its Financial Services’ short and long-term liquidity needs can be funded from net investment coupon receipts; the maturity of invested assets; sales of invested assets; intercompany loans from Ambac Assurance; and receipts from derivative contracts.
While meaningful progress has been made in unwinding the Financial Services businesses, multiple sources of risk continue to exist. These include additional unexpected draws on outstanding investment agreements, potential swap terminations and the inability to replace or establish new hedge positions and interest rate volatility.
Investment agreements subject Ambac to liquidity risk associated with unanticipated withdrawals of principal as allowed by the terms of contingent withdrawal provisions within all remaining outstanding investment agreements. Investment agreements outstanding as of
December 31, 2014
were issued in connection with either municipal bonds or structured credit-linked notes (“CLNs”). The investment agreements contain contingent withdrawal risk in the event of either an early redemption of the related bond issue or certain credit events pertaining to the underlying borrower. As of
December 31, 2014
, Ambac had
$114.4 million
of contingent withdrawal investment agreements related to CLNs and
$47.1 million
related to municipal bonds. The investment agreement business manages liquidity risk by closely matching the maturity schedules of its invested assets with the maturity schedules of its investment agreement liabilities. Additionally, management performs regular surveillance of the related transactions. This surveillance process is customized for each investment agreement transaction and includes a review of past activity, recently issued trustee reports, reference name performance characteristics and third party tools to analyze early withdrawal risk.
Liquidity risk also exists in the derivative contract and investment agreement portfolios due to contract provisions which may require collateral posting or early termination of contracts. Both the investment agreement and swap businesses borrow cash and securities from Ambac Assurance to meet liquidity needs when such borrowing is determined to be most economically beneficial to Ambac Assurance. Intercompany loans are made under established lending agreements with defined borrowing limits that have received non-disapproval from OCI.
Cash Flow Statement Discussion
.
The following table summarizes the net cash flows for the periods presented.
|
Successor Ambac
|
Predecessor Ambac
|
|||||||||||||||
|
Period from May 1
|
Period from January 1
|
|||||||||||||||
|
Year Ended
|
through
|
through
|
Year Ended
|
|||||||||||||
|
($ in million)
|
December 31, 2014
|
December 31, 2013
|
April 30, 2013
|
December 31, 2012
|
||||||||||||
|
Cash provided by (used in):
|
||||||||||||||||
|
Operating activities
|
$
|
(971.5
|
)
|
$
|
186.9
|
|
$
|
(0.7
|
)
|
$
|
(613.9
|
)
|
||||
|
Investing activities
|
1,275.2
|
|
(247.5
|
)
|
115.3
|
|
1,038.0
|
|
||||||||
|
Financing activities
|
(307.1
|
)
|
(15.0
|
)
|
(5.5
|
)
|
(396.2
|
)
|
||||||||
|
Net cash flow
|
$
|
(3.5
|
)
|
$
|
(75.6
|
)
|
$
|
109.1
|
|
$
|
27.8
|
|
||||
Operating activities
The principal sources of Ambac's operating cash flows are gross installment premiums on insurance contracts and fees on credit default swap contracts, investment coupon receipts, claim and reinsurance recoveries and RMBS subrogation recoveries. The principal uses of Ambac's liquidity are the payment of operating expenses, claim and commutation payments on both insurance and credit derivative contracts, ceded reinsurance premiums and tax payments. During the
year ended December 31, 2014
, Ambac had net loss and loss expense payments of $1,067.3 million, inclusive of interest payments of $82.5 million. Ambac had net loss and loss expense payments of $2.5 million in the eight months ended
December 31, 2013
, net loss and loss expense recoveries of $20.4 million in the four months ended
April 30, 2013
and net loss and loss expense payments of $938 million for the year ended December 31, 2012. In addition, during the
year ended December 31, 2014
gross premium collection and credit derivative receipts by Ambac were $129.1 million. Gross premium collection and credit derivative receipts for the eight months ended
December 31, 2013
and four months ended
April 30, 2013
were $87.2 million and $52.2 million, respectively. Gross premium collection and credit derivative receipts for the year ended December 31, 2012 were $168.7 million. In connection with the IRS Settlement Agreement, Ambac paid $101.9 million to the US Treasury in April 2013.
Future operating cash flows will primarily be impacted by the level of premium collections, investment coupon receipts and claim payments (including further payments of Deferred Amounts and interest thereon) and payments under credit default swap contracts. As discussed above in
Ambac Assurance Liquidity
, the Segregated Account Rehabilitation Plan, as amended, will have adverse consequences to Ambac's future cash flows resulting from the increase from 25% to 45% as of July 21, 2014 in the the percentage of the initial cash Interim Payments for permitted policy claims. Additional increases to Interim Payments will have further adverse effects on Ambac's future cash flows.
Investing Activities
The net cash provided by investing activities for the year ended December 31, 2014 resulted primarily from sales and maturities of securities to fund the payments for the partial redemption of surplus notes in November 2014 and for the equalizing payments of Deferred Amounts in December 2014. Similarly, net cash provided by investing activities for the year ended December 31, 2012 resulted from the liquidation of
55
securities to fund partial claim payments on Segregated Account policies, payments to commute certain financial guarantee exposures and the repurchase of certain surplus notes during the year.
Financing Activities
Financing activities for the
year ended December 31, 2014
included redemption payments on surplus notes of
$331.4 million
and repayments of investment agreements of
$200.0 million
, partially offset by proceeds from Ambac's sale of its Segregated Account junior surplus note in the amount of
$224.3 million
. Financing activities for the eight months ended
December 31, 2013
, the four months ended
April 30, 2013
and the year ended December 31, 2012, included paydowns on a variable interest entity secured borrowing of
$9.1 million
,
$5.5 million
and
$21.0 million
, respectively. Financing activities for the year ended December 31, 2012 included repayments of investment agreements of $186.8 million and a payment of $188.4 million, whereby Ambac Assurance exercised options to repurchase surplus notes with an aggregate par value of $789.2 million.
Credit Ratings and Collateral
.
Ambac Assurance is no longer rated by Moody’s and S&P, which resulted in the triggering of required cure provisions in nearly all of the investment agreements issued. In many cases, Ambac chose to terminate investment agreements, particularly when it was able to do so at levels that resulted in meaningful discounts to book value. In addition, at
December 31, 2014
Ambac posted collateral of $156.9 million in connection with its outstanding investment agreements.
Ambac Financial Services, LLC (“AFS”) provided interest rate and currency swaps for states, municipalities, asset-backed issuers and other entities in connection with their financings. AFS hedges its interest rate risk of these instruments, as well as a portion of the interest rate risk in the financial guarantee portfolio, with standardized derivative contracts, including financial futures contracts, which contain collateral or margin requirements. Under these hedge agreements, AFS is required to post collateral or margin to its counterparties and futures commission merchants to cover unrealized losses. In addition, AFS is required to post collateral or margin in excess of the amounts needed to cover unrealized losses. All AFS derivative contracts containing ratings-based downgrade triggers that could result in collateral or margin posting or a termination have been triggered. If terminations were to occur, AFS would be required to make termination payments but would also receive a return of collateral or margin in the form of cash, U.S. Treasury or U.S. government agency obligations with market values equal to or in excess of market values of the swaps and futures contracts. In most cases, AFS will look to re-establish hedge positions that are terminated early. This may result in additional collateral or margin obligations. The amount of additional collateral or margin posted on derivatives contracts will depend on several variables including the degree to which counterparties exercise their termination rights (or agreements terminate automatically) and the terms on which hedges can be replaced. All collateral and margin obligations are currently met. Collateral and margin posted by AFS totaled a net amount of $222.5 million, including independent amounts, under these contracts at
December 31, 2014
.
Ambac Credit Products (“ACP”) entered into credit derivative contracts. ACP is not required to post collateral under any of its contracts.
BALANCE SHEET
Total assets
decreased
by approximately
$1,933 million
from
December 31, 2013
to
$25.2 billion
at
December 31, 2014
, primarily due to (i) partial redemptions of Ambac Assurance / Segregated Account surplus notes and equalizing payments on Deferred Amounts of $1,551 million, (ii) declines in VIE assets as a result of deconsolidations during the year, and (iii) lower premium receivables from the runoff, including early terminations, of the insured portfolio, partially offset by higher subrogation recoveries and the monetization of the Segregated Account junior surplus note held by Ambac after it deposited the junior surplus note plus accrued but unpaid interest thereon, into a newly formed Trust in exchange for cash of $224.3 million and a subordinated owner trust certificate issued by the Trust; refer to Note 1. Background and Business Description
to the Consolidated Financial Statements, included in Part II, Item 8 in this Form 10-K, for additional information.
Total liabilities
decreased
by approximately
$2,628 million
from
December 31, 2013
to
$23.5 billion
as of
December 31, 2014
, primarily as a result of (i) lower loss and loss expense reserves primarily due to equalizing payments on Deferred Amounts and positive development on existing loss reserves; (ii) lower variable interest entity liabilities; (iii) lower unearned premium reserves; and (iv) lower investment agreement liabilities; partially offset by higher derivative liabilities.
As of
December 31, 2014
total stockholders’ equity was
$1,674 million
, compared with total stockholders’ equity of
$978 million
at
December 31, 2013
. This increase was primarily due to net income and Other Comprehensive Income earned during the period, which includes appreciation of non-VIE investment fair values.
Investment Portfolio
.
Ambac Assurance’s non-VIE investment objective is to achieve the highest after-tax return on a diversified portfolio of primarily fixed income investments while employing asset/liability management practices to satisfy all operating and strategic liquidity needs. Ambac Assurance’s investment portfolio is subject to internal investment guidelines and is subject to limits on types and quality of investments imposed by the insurance laws and regulations of the States of Wisconsin and New York. Such guidelines set forth minimum credit rating requirements and credit risk concentration limits. Within these guidelines, Ambac Assurance opportunistically purchases Ambac Assurance insured securities in the open market given their relative risk/reward characteristics. Ambac Assurance’s investment policies are subject to oversight by the Rehabilitator of the Segregated Account pursuant to contracts entered into between Ambac Assurance and the Segregated Account. The Board of Directors of Ambac Assurance approves any changes to Ambac Assurance's investment policy.
Ambac UK’s non-VIE investment policy is designed with the primary objective of ensuring that Ambac UK is able to meet its financial obligations as they fall due, in particular with respect to policyholder claims. Ambac UK’s investment portfolio is primarily fixed income investments and
56
pooled investment funds with diversified holdings. The portfolio is subject to internal investment guidelines and may be subject to limits on types and quality of investments imposed by the PRA as regulator of Ambac UK. Ambac UK’s investment policy sets forth minimum credit rating requirements and concentration limits, among other restrictions. The Board of Directors of Ambac UK approves any changes or exceptions to Ambac UK’s investment policy.
The Financial Services non-VIE investment portfolio consists primarily of assets funded with proceeds from the issuance of investment agreement liabilities. The primary investment objective is to invest in a diversified portfolio of high-grade securities that produce sufficient cash flow to satisfy all investment agreement liabilities and their collateral requirements. The investment portfolio is subject to internal investment guidelines. Such guidelines set forth minimum credit rating requirements and credit risk concentration limits.
The Corporate non-VIE investment portfolio's primary objective is to preserve capital for strategic uses while maximizing income. The investment portfolio is subject to internal investment guidelines. Such guidelines set forth minimum credit rating requirements and credit risk concentration limits.
57
The following table summarizes the composition of Ambac’s investment portfolio, excluding VIE investments, at fair value by segment at
December 31, 2014 and 2013
:
|
($ in millions)
|
Financial
Guarantee
|
Financial
Services
|
Corporate
|
Total
|
|||||||||||
|
December 31, 2014:
|
|||||||||||||||
|
Fixed income securities:
|
|||||||||||||||
|
Municipal obligations
(1)
|
$
|
525.8
|
|
$
|
—
|
|
$
|
—
|
|
$
|
525.8
|
|
|||
|
Corporate obligations
|
1,385.6
|
|
—
|
|
—
|
|
1,385.6
|
|
|||||||
|
Foreign obligations
|
127.8
|
|
—
|
|
—
|
|
127.8
|
|
|||||||
|
U.S. government obligations
|
42.9
|
|
—
|
|
—
|
|
42.9
|
|
|||||||
|
U.S. agency obligations
|
29.5
|
|
—
|
|
—
|
|
29.5
|
|
|||||||
|
Residential mortgage-backed securities
(2)
|
1,710.9
|
|
—
|
|
—
|
|
1,710.9
|
|
|||||||
|
Collateralized debt obligations
|
4.4
|
|
—
|
|
16.7
|
|
21.1
|
|
|||||||
|
Other asset-backed securities
|
555.2
|
|
109.2
|
|
217.6
|
|
882.0
|
|
|||||||
|
4,382.1
|
|
109.2
|
|
234.3
|
|
4,725.6
|
|
||||||||
|
Short-term
(1)
|
337.0
|
|
0.2
|
|
22.9
|
|
360.1
|
|
|||||||
|
Other investments
|
336.0
|
|
—
|
|
21.0
|
|
357.0
|
|
|||||||
|
5,055.1
|
|
109.4
|
|
278.2
|
|
5,442.7
|
|
||||||||
|
Fixed income securities pledged as collateral:
|
|||||||||||||||
|
U.S. government obligations
|
64.3
|
|
—
|
|
—
|
|
64.3
|
|
|||||||
|
64.3
|
|
—
|
|
—
|
|
64.3
|
|
||||||||
|
Total investments
|
$
|
5,119.4
|
|
$
|
109.4
|
|
$
|
278.2
|
|
$
|
5,507.0
|
|
|||
|
Percent total
|
93.0
|
%
|
2.0
|
%
|
5.0
|
%
|
100
|
%
|
|||||||
|
December 31, 2013:
|
|||||||||||||||
|
Fixed income securities:
|
|||||||||||||||
|
Municipal obligations
(1)
|
$
|
1,377.7
|
|
$
|
—
|
|
$
|
—
|
|
$
|
1,377.7
|
|
|||
|
Corporate obligations
|
1,489.4
|
|
—
|
|
—
|
|
1,489.4
|
|
|||||||
|
Foreign obligations
|
124.9
|
|
—
|
|
—
|
|
124.9
|
|
|||||||
|
U.S. government obligations
|
89.1
|
|
37.2
|
|
—
|
|
126.3
|
|
|||||||
|
U.S. agency obligations
|
32.1
|
|
—
|
|
—
|
|
32.1
|
|
|||||||
|
Residential mortgage-backed securities
(2)
|
1,547.8
|
|
10.8
|
|
—
|
|
1,558.6
|
|
|||||||
|
Collateralized debt obligations
|
176.2
|
|
7.7
|
|
—
|
|
183.9
|
|
|||||||
|
Other asset-backed securities
|
649.9
|
|
314.4
|
|
28.1
|
|
992.4
|
|
|||||||
|
5,487.1
|
|
370.1
|
|
28.1
|
|
5,885.3
|
|
||||||||
|
Short-term
(1)
|
262.3
|
|
—
|
|
8.8
|
|
271.1
|
|
|||||||
|
Other investments
|
241.1
|
|
—
|
|
—
|
|
241.1
|
|
|||||||
|
5,990.5
|
|
370.1
|
|
36.9
|
|
6,397.5
|
|
||||||||
|
Fixed income securities pledged as collateral:
|
|||||||||||||||
|
U.S. government obligations
|
126.2
|
|
—
|
|
—
|
|
126.2
|
|
|||||||
|
126.2
|
|
—
|
|
—
|
|
126.2
|
|
||||||||
|
Total investments
|
$
|
6,116.7
|
|
$
|
370.1
|
|
$
|
36.9
|
|
$
|
6,523.7
|
|
|||
|
Percent total
|
93.7
|
%
|
5.7
|
%
|
0.6
|
%
|
100
|
%
|
|||||||
|
(1)
|
Includes taxable and tax exempt securities.
|
|
(2)
|
Includes RMBS insured by Ambac Assurance.
|
The decrease in total investments since December 31, 2013 is primarily due to the partial redemptions of Ambac Assurance and Segregated Account surplus notes and the equalizing payments on Deferred Amounts.
58
The following table represents the fair value of mortgage and asset-backed securities at
December 31, 2014 and 2013
by classification:
|
($ in millions)
|
Financial
Guarantee
|
Financial
Services
|
Corporate
|
Total
|
|||||||||||
|
December 31, 2014:
|
|||||||||||||||
|
Residential mortgage-backed securities:
|
|||||||||||||||
|
RMBS—Second Lien
|
$
|
875.9
|
|
$
|
—
|
|
$
|
—
|
|
$
|
875.9
|
|
|||
|
RMBS—First-lien—Alt-A
|
440.3
|
|
—
|
|
—
|
|
440.3
|
|
|||||||
|
RMBS—First Lien—Sub Prime
|
271.9
|
|
—
|
|
—
|
|
271.9
|
|
|||||||
|
RMBS—First Lien—Prime
|
122.8
|
|
—
|
|
—
|
|
122.8
|
|
|||||||
|
U.S. Government Sponsored Enterprise Mortgages
|
—
|
|
—
|
|
—
|
|
—
|
|
|||||||
|
Government National Mortgage Association
|
—
|
|
—
|
|
—
|
|
—
|
|
|||||||
|
Total residential mortgage-backed securities
|
1,710.9
|
|
—
|
|
—
|
|
1,710.9
|
|
|||||||
|
Other asset-backed securities
|
|||||||||||||||
|
Student Loans
|
231.7
|
|
—
|
|
—
|
|
231.7
|
|
|||||||
|
Military Housing
|
228.8
|
|
—
|
|
—
|
|
228.8
|
|
|||||||
|
Credit Cards
|
9.6
|
|
104.7
|
|
60.5
|
|
174.8
|
|
|||||||
|
Auto
|
31.0
|
|
4.5
|
|
125.1
|
|
160.6
|
|
|||||||
|
Structured Insurance
|
51.4
|
|
—
|
|
—
|
|
51.4
|
|
|||||||
|
Other
|
2.7
|
|
—
|
|
32.0
|
|
34.7
|
|
|||||||
|
Total other asset-backed securities
|
555.2
|
|
109.2
|
|
217.6
|
|
882.0
|
|
|||||||
|
Total
|
$
|
2,266.1
|
|
$
|
109.2
|
|
$
|
217.6
|
|
$
|
2,592.9
|
|
|||
|
December 31, 2013:
|
|||||||||||||||
|
Residential mortgage-backed securities:
|
|||||||||||||||
|
RMBS—Second Lien
|
$
|
702.1
|
|
$
|
—
|
|
$
|
—
|
|
$
|
702.1
|
|
|||
|
RMBS—First-lien—Alt-A
|
468.8
|
|
—
|
|
—
|
|
468.8
|
|
|||||||
|
RMBS—First Lien—Sub Prime
|
246.0
|
|
—
|
|
—
|
|
246.0
|
|
|||||||
|
RMBS—First Lien—Prime
|
86.7
|
|
—
|
|
—
|
|
86.7
|
|
|||||||
|
U.S. Government Sponsored Enterprise Mortgages
|
42.9
|
|
10.8
|
|
—
|
|
53.7
|
|
|||||||
|
Government National Mortgage Association
|
1.3
|
|
—
|
|
—
|
|
1.3
|
|
|||||||
|
Total residential mortgage-backed securities
|
1,547.8
|
|
10.8
|
|
—
|
|
1,558.6
|
|
|||||||
|
Other asset-backed securities
|
|||||||||||||||
|
Student Loans
|
14.0
|
|
—
|
|
—
|
|
14.0
|
|
|||||||
|
Military Housing
|
344.1
|
|
—
|
|
—
|
|
344.1
|
|
|||||||
|
Credit Cards
|
20.7
|
|
235.3
|
|
8.0
|
|
264.0
|
|
|||||||
|
Auto
|
122.5
|
|
79.1
|
|
17.8
|
|
219.4
|
|
|||||||
|
Structured Insurance
|
50.9
|
|
—
|
|
—
|
|
50.9
|
|
|||||||
|
Other
|
97.7
|
|
—
|
|
2.3
|
|
100.0
|
|
|||||||
|
Total other asset-backed securities
|
649.9
|
|
314.4
|
|
28.1
|
|
992.4
|
|
|||||||
|
Total
|
$
|
2,197.7
|
|
$
|
325.2
|
|
$
|
28.1
|
|
$
|
2,551.0
|
|
|||
The weighted average rating, which is based on the lower of Standard & Poor’s or Moody’s ratings, of the mortgage and asset-backed securities is CC and BB as of
December 31, 2014
, and CCC- and BBB+ as of
December 31, 2013
, respectively.
Ambac’s fixed income portfolio includes securities covered by guarantees issued by Ambac Assurance and other financial guarantors (“insured securities”). The published rating agency ratings on these securities reflect the higher of the financial strength rating of the financial guarantor or the rating of the underlying issuer. Rating agencies do not always publish separate underlying ratings (those ratings excluding the insurance by the financial guarantor) because the insurance cannot be legally separated from the underlying security by the insurer. In the event these underlying ratings are not available from the rating agencies, Ambac will assign an internal rating. Refer to Note 11. Investments to the Consolidated Financial Statements included in Part II, Item 8 in this Form 10-K for further details on securities insured by Ambac Assurance.
59
The following table provides the ratings
(1)
distribution of the fixed income investment portfolio based on fair value at
December 31, 2014 and 2013
by segment:
|
Financial
Guarantee
(2)
|
Financial
Services
|
Corporate
|
Combined
|
||||||||
|
December 31, 2014
|
|||||||||||
|
AAA
|
14
|
%
|
100
|
%
|
100
|
%
|
20
|
%
|
|||
|
AA
|
12
|
|
—
|
|
—
|
|
11
|
|
|||
|
A
|
15
|
|
—
|
|
—
|
|
14
|
|
|||
|
BBB
|
13
|
|
—
|
|
—
|
|
13
|
|
|||
|
Below investment grade
|
41
|
|
—
|
|
—
|
|
38
|
|
|||
|
Not rated
|
5
|
|
—
|
|
—
|
|
4
|
|
|||
|
Total
|
100
|
%
|
100
|
%
|
100
|
%
|
100
|
%
|
|||
|
December 31, 2013
|
|||||||||||
|
AAA
|
12
|
%
|
87
|
%
|
100
|
%
|
16
|
%
|
|||
|
AA
|
24
|
|
13
|
|
—
|
|
23
|
|
|||
|
A
|
19
|
|
—
|
|
—
|
|
18
|
|
|||
|
BBB
|
14
|
|
—
|
|
—
|
|
13
|
|
|||
|
Below investment grade
|
26
|
|
—
|
|
—
|
|
25
|
|
|||
|
Not rated
|
5
|
|
—
|
|
—
|
|
5
|
|
|||
|
Total
|
100
|
%
|
100
|
%
|
100
|
%
|
100
|
%
|
|||
|
(1)
|
Ratings are based on the lower of Moody’s or S&P ratings. If ratings are unavailable from Moody's or S&P, Fitch ratings are used. If guaranteed, rating represents the higher of the underlying or guarantor’s financial strength rating.
|
|
(2)
|
Below investment grade bonds insured by Ambac represent 39% and 22% of the
2014
and
2013
Financial Guarantee portfolio, respectively.
|
The increase in the percentage of below investment grade holdings since
December 31, 2013
is driven by additional purchases of and increased prices on Ambac Assurance insured bonds.
60
The following table summarizes, for all available-for-sale securities in an unrealized loss position as of
December 31, 2014 and 2013
, the aggregate fair value and gross unrealized loss by length of time those securities have been continuously in an unrealized loss position:
|
December 31, 2014
|
December 31, 2013
(2)
|
||||||||||||||
|
($ in millions)
|
Estimated
Fair Value
(1)
|
Gross
Unrealized Losses
|
Estimated
Fair Value
(1)
|
Gross
Unrealized Losses
|
|||||||||||
|
Municipal obligations in continuous unrealized loss for:
|
|||||||||||||||
|
Less than 12 months
|
$
|
77.8
|
|
$
|
1.2
|
|
$
|
437.7
|
|
$
|
28.4
|
|
|||
|
Greater than 12 months
|
135.1
|
|
5.8
|
|
—
|
|
—
|
|
|||||||
|
212.9
|
|
7.0
|
|
437.7
|
|
28.4
|
|
||||||||
|
Corporate obligations in continuous unrealized loss for:
|
|||||||||||||||
|
Less than 12 months
|
453.5
|
|
5.0
|
|
877.4
|
|
23.9
|
|
|||||||
|
Greater than 12 months
|
172.0
|
|
4.4
|
|
—
|
|
—
|
|
|||||||
|
625.5
|
|
9.4
|
|
877.4
|
|
23.9
|
|
||||||||
|
Foreign government obligations in continuous unrealized loss for:
|
|||||||||||||||
|
Less than 12 months
|
20.8
|
|
0.7
|
|
117.9
|
|
6.9
|
|
|||||||
|
Greater than 12 months
|
14.3
|
|
0.6
|
|
—
|
|
—
|
|
|||||||
|
35.1
|
|
1.3
|
|
117.9
|
|
6.9
|
|
||||||||
|
U.S. government obligations in continuous unrealized loss for:
|
|||||||||||||||
|
Less than 12 months
|
71.5
|
|
0.3
|
|
70.0
|
|
2.2
|
|
|||||||
|
Greater than 12 months
|
14.7
|
|
0.3
|
|
—
|
|
—
|
|
|||||||
|
86.2
|
|
0.6
|
|
70.0
|
|
2.2
|
|
||||||||
|
U.S. agency obligations in continuous unrealized loss for:
|
|||||||||||||||
|
Less than 12 months
|
25.0
|
|
—
|
|
5.8
|
|
0.1
|
|
|||||||
|
Greater than 12 months
|
4.4
|
|
—
|
|
—
|
|
—
|
|
|||||||
|
29.4
|
|
—
|
|
5.8
|
|
0.1
|
|
||||||||
|
Residential mortgage-backed securities in continuous unrealized loss for:
|
|||||||||||||||
|
Less than 12 months
|
413.2
|
|
12.4
|
|
644.5
|
|
18.1
|
|
|||||||
|
Greater than 12 months
|
10.1
|
|
1.1
|
|
—
|
|
—
|
|
|||||||
|
423.3
|
|
13.5
|
|
644.5
|
|
18.1
|
|
||||||||
|
Collateralized debt obligations in continuous unrealized loss for:
|
|||||||||||||||
|
Less than 12 months
|
5.0
|
|
0.3
|
|
137.7
|
|
0.4
|
|
|||||||
|
Greater than 12 months
|
—
|
|
—
|
|
—
|
|
—
|
|
|||||||
|
5.0
|
|
0.3
|
|
137.7
|
|
0.4
|
|
||||||||
|
Other asset-backed securities in continuous unrealized loss for:
|
|||||||||||||||
|
Less than 12 months
|
248.8
|
|
0.2
|
|
630.0
|
|
36.6
|
|
|||||||
|
Greater than 12 months
|
0.1
|
|
—
|
|
—
|
|
—
|
|
|||||||
|
248.9
|
|
0.2
|
|
630.0
|
|
36.6
|
|
||||||||
|
Short term securities in continuous unrealized loss for:
|
|||||||||||||||
|
Less than 12 months
|
8.8
|
|
—
|
|
—
|
|
—
|
|
|||||||
|
Greater than 12 months
|
—
|
|
—
|
|
—
|
|
—
|
|
|||||||
|
8.8
|
|
—
|
|
—
|
|
—
|
|
||||||||
|
Total
|
$
|
1,675.1
|
|
$
|
32.3
|
|
$
|
2,921.0
|
|
$
|
116.6
|
|
|||
|
(1)
|
Since the table is presented in millions, securities with market values and unrealized losses that are less than $0.1 will be shown as zero.
|
|
(2)
|
As a result of the implementation of Fresh Start, amortized cost for available for sale securities was set to equal fair value on April 30, 2013. Accordingly, at December 31, 2013, Ambac does not have any gross unrealized losses that have been in a continuous unrealized loss position for greater than 12 months.
|
Management has determined that the unrealized losses in available-for-sale securities are primarily driven by increases in interest rates and shifts in market risk and liquidity premiums demanded by fixed income investors between the Fresh Start Reporting Date of April 30, 2013 and
December 31, 2014
. Ambac has concluded that unrealized losses reflected in the table above are temporary in nature based upon (a) there being no unexpected principal and interest payment defaults on these securities; (b) an analysis of the creditworthiness of the issuer and financial guarantor, as applicable, and analysis of projected defaults on the underlying collateral; (c) management having no intent to sell these securities; and (d) it being not more likely than not that Ambac will be required to sell these debt securities before the anticipated recovery of its amortized cost basis.
61
The following table summarizes amortized cost and fair value for all available-for-sale securities in an unrealized loss position as of
December 31, 2014 and 2013
, by contractual maturity date:
|
December 31, 2014
|
December 31, 2013
|
||||||||||||||
|
($ in millions)
|
Amortized
Cost |
Estimated
Fair Value |
Amortized
Cost |
Estimated
Fair Value |
|||||||||||
|
Municipal obligations:
|
|||||||||||||||
|
Due in one year or less
|
$
|
—
|
|
$
|
—
|
|
$
|
—
|
|
$
|
—
|
|
|||
|
Due after one year through five years
|
11.8
|
|
11.7
|
|
74.8
|
|
73.1
|
|
|||||||
|
Due after five years through ten years
|
151.6
|
|
147.6
|
|
313.7
|
|
294.1
|
|
|||||||
|
Due after ten years
|
56.5
|
|
53.6
|
|
77.6
|
|
70.5
|
|
|||||||
|
219.9
|
|
212.9
|
|
466.1
|
|
437.7
|
|
||||||||
|
Corporate obligations:
|
|||||||||||||||
|
Due in one year or less
|
56.1
|
|
56.1
|
|
25.5
|
|
25.5
|
|
|||||||
|
Due after one year through five years
|
337.7
|
|
334.7
|
|
357.5
|
|
353.7
|
|
|||||||
|
Due after five years through ten years
|
228.1
|
|
221.8
|
|
475.9
|
|
457.8
|
|
|||||||
|
Due after ten years
|
13.0
|
|
12.9
|
|
42.4
|
|
40.4
|
|
|||||||
|
634.9
|
|
625.5
|
|
901.3
|
|
877.4
|
|
||||||||
|
Foreign government obligations:
|
|||||||||||||||
|
Due in one year or less
|
3.6
|
|
3.3
|
|
—
|
|
—
|
|
|||||||
|
Due after one year through five years
|
11.7
|
|
11.4
|
|
51.7
|
|
50.4
|
|
|||||||
|
Due after five years through ten years
|
19.2
|
|
18.5
|
|
67.6
|
|
62.8
|
|
|||||||
|
Due after ten years
|
1.9
|
|
1.9
|
|
5.5
|
|
4.7
|
|
|||||||
|
36.4
|
|
35.1
|
|
124.8
|
|
117.9
|
|
||||||||
|
U.S. government obligations:
|
|||||||||||||||
|
Due in one year or less
|
1.8
|
|
1.8
|
|
0.4
|
|
0.4
|
|
|||||||
|
Due after one year through five years
|
79.9
|
|
79.5
|
|
51.3
|
|
50.3
|
|
|||||||
|
Due after five years through ten years
|
3.9
|
|
3.8
|
|
17.8
|
|
16.7
|
|
|||||||
|
Due after ten years
|
1.2
|
|
1.1
|
|
2.7
|
|
2.6
|
|
|||||||
|
86.8
|
|
86.2
|
|
72.2
|
|
70.0
|
|
||||||||
|
U.S. agency obligations:
|
|||||||||||||||
|
Due in one year or less
|
25.0
|
|
25.0
|
|
1.3
|
|
1.3
|
|
|||||||
|
Due after one year through five years
|
4.4
|
|
4.4
|
|
4.6
|
|
4.5
|
|
|||||||
|
Due after five years through ten years
|
—
|
|
—
|
|
—
|
|
—
|
|
|||||||
|
Due after ten years
|
—
|
|
—
|
|
—
|
|
—
|
|
|||||||
|
29.4
|
|
29.4
|
|
5.9
|
|
5.8
|
|
||||||||
|
Residential mortgage-backed securities
|
436.8
|
|
423.3
|
|
662.6
|
|
644.5
|
|
|||||||
|
Collateralized debt obligations
|
5.3
|
|
5.0
|
|
138.1
|
|
137.7
|
|
|||||||
|
Other asset-backed securities
|
249.1
|
|
248.9
|
|
666.6
|
|
630.0
|
|
|||||||
|
Short term securities
|
8.8
|
|
8.8
|
|
—
|
|
—
|
|
|||||||
|
Total
|
$
|
1,707.4
|
|
$
|
1,675.1
|
|
$
|
3,037.6
|
|
$
|
2,921.0
|
|
|||
62
The following table summarizes, for all securities sold at a loss during
2014
,
2013
and
2012
, the aggregate fair value and realized loss by length of time those securities were continuously in an unrealized loss position prior to the sale date:
|
Successor Ambac
|
Predecessor Ambac
|
|||||||||||||||||||||||||||||||
|
Period from May 1
|
Period from January 1
|
|||||||||||||||||||||||||||||||
|
Year Ended
|
through
|
through
|
Year Ended
|
|||||||||||||||||||||||||||||
|
December 31, 2014
|
December 31, 2013
(1)
|
April 30, 2013
|
December 31, 2012
|
|||||||||||||||||||||||||||||
|
($ in millions)
|
Fair
Value
|
Gross
Realized
Losses
|
Fair
Value
|
Gross
Realized
Losses
|
Fair
Value
|
Gross
Realized
Losses
|
Fair
Value
|
Gross
Realized
Losses
|
||||||||||||||||||||||||
|
Municipal obligations in continuous unrealized loss for:
|
||||||||||||||||||||||||||||||||
|
Less than 12 months
|
$
|
49.1
|
|
$
|
0.4
|
|
$
|
173.1
|
|
$
|
5.0
|
|
$
|
—
|
|
$
|
—
|
|
$
|
—
|
|
$
|
—
|
|
||||||||
|
Greater than 12 months
|
—
|
|
—
|
|
—
|
|
—
|
|
—
|
|
—
|
|
—
|
|
—
|
|
||||||||||||||||
|
49.1
|
|
0.4
|
|
173.1
|
|
5.0
|
|
—
|
|
—
|
|
—
|
|
—
|
|
|||||||||||||||||
|
Corporate obligations in continuous unrealized loss for:
|
||||||||||||||||||||||||||||||||
|
Less than 12 months
|
119.4
|
|
1.5
|
|
36.0
|
|
0.7
|
|
—
|
|
—
|
|
—
|
|
—
|
|
||||||||||||||||
|
Greater than 12 months
|
32.5
|
|
0.7
|
|
—
|
|
—
|
|
—
|
|
—
|
|
50.4
|
|
0.6
|
|
||||||||||||||||
|
151.9
|
|
2.2
|
|
36.0
|
|
0.7
|
|
—
|
|
—
|
|
50.4
|
|
0.6
|
|
|||||||||||||||||
|
Foreign government obligations in continuous unrealized loss for:
|
||||||||||||||||||||||||||||||||
|
Less than 12 months
|
32.6
|
|
0.6
|
|
35.2
|
|
1.2
|
|
—
|
|
—
|
|
—
|
|
—
|
|
||||||||||||||||
|
Greater than 12 months
|
32.3
|
|
1.6
|
|
—
|
|
—
|
|
—
|
|
—
|
|
—
|
|
—
|
|
||||||||||||||||
|
64.9
|
|
2.2
|
|
35.2
|
|
1.2
|
|
—
|
|
—
|
|
—
|
|
—
|
|
|||||||||||||||||
|
U.S. government obligations in continuous unrealized loss for:
|
||||||||||||||||||||||||||||||||
|
Less than 12 months
|
16.0
|
|
—
|
|
18.8
|
|
0.4
|
|
—
|
|
—
|
|
—
|
|
—
|
|
||||||||||||||||
|
Greater than 12 months
|
1.1
|
|
—
|
|
—
|
|
—
|
|
—
|
|
—
|
|
—
|
|
—
|
|
||||||||||||||||
|
17.1
|
|
—
|
|
18.8
|
|
0.4
|
|
—
|
|
—
|
|
—
|
|
—
|
|
|||||||||||||||||
|
U.S. agency obligations in continuous unrealized loss for:
|
||||||||||||||||||||||||||||||||
|
Less than 12 months
|
—
|
|
—
|
|
—
|
|
—
|
|
—
|
|
—
|
|
—
|
|
—
|
|
||||||||||||||||
|
Greater than 12 months
|
—
|
|
—
|
|
—
|
|
—
|
|
—
|
|
—
|
|
—
|
|
—
|
|
||||||||||||||||
|
—
|
|
—
|
|
—
|
|
—
|
|
—
|
|
—
|
|
—
|
|
—
|
|
|||||||||||||||||
|
Residential mortgage-backed securities in continuous unrealized loss for:
|
||||||||||||||||||||||||||||||||
|
Less than 12 months
|
84.7
|
|
0.2
|
|
28.5
|
|
0.9
|
|
0.5
|
|
0.1
|
|
4.1
|
|
0.2
|
|
||||||||||||||||
|
Greater than 12 months
|
—
|
|
—
|
|
—
|
|
—
|
|
—
|
|
—
|
|
—
|
|
—
|
|
||||||||||||||||
|
84.7
|
|
0.2
|
|
28.5
|
|
0.9
|
|
0.5
|
|
0.1
|
|
4.1
|
|
0.2
|
|
|||||||||||||||||
|
Collateralized debt obligations in continuous unrealized loss for:
|
||||||||||||||||||||||||||||||||
|
Less than 12 months
|
—
|
|
—
|
|
—
|
|
—
|
|
—
|
|
—
|
|
—
|
|
—
|
|
||||||||||||||||
|
Greater than 12 months
|
—
|
|
—
|
|
—
|
|
—
|
|
—
|
|
—
|
|
—
|
|
—
|
|
||||||||||||||||
|
—
|
|
—
|
|
—
|
|
—
|
|
—
|
|
—
|
|
—
|
|
—
|
|
|||||||||||||||||
|
Other asset-backed securities in continuous unrealized loss for:
|
||||||||||||||||||||||||||||||||
|
Less than 12 months
|
202.1
|
|
2.0
|
|
13.8
|
|
0.3
|
|
—
|
|
—
|
|
11.1
|
|
—
|
|
||||||||||||||||
|
Greater than 12 months
|
—
|
|
—
|
|
—
|
|
—
|
|
38.4
|
|
—
|
|
—
|
|
—
|
|
||||||||||||||||
|
202.1
|
|
2.0
|
|
13.8
|
|
0.3
|
|
38.4
|
|
—
|
|
11.1
|
|
—
|
|
|||||||||||||||||
|
Short term securities in continuous unrealized loss for:
|
||||||||||||||||||||||||||||||||
|
Less than 12 months
|
25.9
|
|
—
|
|
71.1
|
|
—
|
|
25.9
|
|
—
|
|
91.5
|
|
—
|
|
||||||||||||||||
|
Greater than 12 months
|
—
|
|
—
|
|
—
|
|
—
|
|
—
|
|
—
|
|
—
|
|
—
|
|
||||||||||||||||
|
25.9
|
|
—
|
|
71.1
|
|
—
|
|
25.9
|
|
—
|
|
91.5
|
|
—
|
|
|||||||||||||||||
|
Total
|
$
|
595.7
|
|
$
|
7.0
|
|
$
|
376.5
|
|
$
|
8.5
|
|
$
|
64.8
|
|
$
|
0.1
|
|
$
|
157.1
|
|
$
|
0.8
|
|
||||||||
|
(1)
|
As a result of the implementation of Fresh Start, amortized cost for available for sale securities were set to fair value on April 30, 2013. Accordingly, Successor Ambac does not have any realized losses on securities that were in a continuous unrealized loss position for greater than 12 months.
|
63
Insurance Intangible Asset
.
At the Fresh Start Reporting Date, an insurance intangible asset was recorded which represented the difference between the fair value and aggregate carrying value of the financial guarantee insurance and reinsurance assets and liabilities. For the
year ended
December 31, 2014
and the eight months ending
December 31, 2013
, the insurance intangible amortization expense was
$152 million
and
$100 million
, respectively. As of
December 31, 2014 and 2013
, the gross carrying value of the insurance intangible asset was
$1,660 million
and $
1,699 million
, respectively. Accumulated amortization of the insurance intangible asset was
$249 million
and
$101 million
, as of December 31, 2014 and 2013, respectively, resulting in a net insurance intangible asset of
$1,411 million
and
$1,598 million
, respectively.
Goodwill
.
At the Fresh Start Reporting Date, goodwill of $515 million was recorded which represented the excess reorganization value which could not be attributed to the fair value of specific identified tangible and intangible assets. As of
December 31, 2014
we concluded goodwill was not impaired and the asset remains at $515 million.
Derivative Liabilities.
The interest rate derivative products portfolio is positioned to benefit from rising rates as an economic hedge against interest rate exposure in the financial guarantee portfolio. Derivative liabilities increased from $254 million to $407 million primarily due to decreases in interest rates during 2014. The valuation of derivative liabilities (credit derivatives and interest rate swaps) is impacted by the market’s view of Ambac Assurance’s credit quality. We reflect Ambac’s credit quality in the fair value of such liabilities by including a CVA in the determination of fair value, whereas a lower (higher) CVA, in isolation, would result in an increase (decrease) in the liability. Ambac reduced its derivative liabilities by $80.4 million at
December 31, 2014
and $87.4 million at
December 31, 2013
to incorporate the market’s view of Ambac’s credit quality. The lower CVA as of
December 31, 2014
is a function of (i) changes to the underlying derivative liabilities before considering Ambac credit quality and (ii) the market’s view that Ambac’s credit quality improved during the
year ended December 31, 2014
.
Loss and Loss Expense Reserves
.
Loss and loss expense reserves are based upon estimates of the ultimate aggregate losses inherent in the non-derivative financial guarantee portfolio for insurance policies issued to beneficiaries, including unconsolidated VIEs. Loss and loss expense reserves include the unpaid portion of interest accrued on Deferred Amounts pursuant to the amended Segregated Account Rehabilitation Plan. The loss and loss expense reserves for financial guarantee insurance discussed herein relates only to Ambac’s non-derivative insurance business for insurance policies for which we do not consolidate the VIE. The evaluation process for determining the level of reserves is subject to certain estimates and judgments.
The loss and loss expense reserves, before reinsurance as of
December 31, 2014 and 2013
were
$3,799 million
and
$5,470 million
, respectively. As of
December 31, 2014 and 2013
, respectively,
$3,274 million
and
$3,904 million
of Segregated Account claims remain unpaid, including unpaid accrued interest on Deferred Amounts of
$329 million
and
$0
, respectively.
Loss and loss expense reserves are included in the Consolidated Balance Sheets as follows:
|
Unpaid Claims
|
Present Value of Expected
Net Cash Flows |
||||||||||||||||||||||
|
($ in millions)
Balance Sheet Line Item |
Claims
|
Accrued Interest
|
Claims and
Loss Expenses |
Recoveries
(1)
|
Unearned
Premium Revenue |
Gross Loss
and Loss Expense Reserves |
|||||||||||||||||
|
December 31, 2014:
|
|||||||||||||||||||||||
|
Loss and loss expense reserves
|
$
|
2,172
|
|
$
|
235
|
|
$
|
3,792
|
|
$
|
(1,206
|
)
|
$
|
(241
|
)
|
$
|
4,752
|
|
|||||
|
Subrogation recoverable
|
773
|
|
94
|
|
198
|
|
(2,018
|
)
|
—
|
|
(953
|
)
|
|||||||||||
|
Totals
|
$
|
2,945
|
|
$
|
329
|
|
$
|
3,990
|
|
$
|
(3,224
|
)
|
$
|
(241
|
)
|
$
|
3,799
|
|
|||||
|
December 31, 2013:
|
|||||||||||||||||||||||
|
Loss and loss expense reserves
|
$
|
3,374
|
|
$
|
—
|
|
$
|
4,895
|
|
$
|
(1,798
|
)
|
$
|
(503
|
)
|
$
|
5,968
|
|
|||||
|
Subrogation recoverable
|
530
|
|
—
|
|
136
|
|
(1,164
|
)
|
—
|
|
(498
|
)
|
|||||||||||
|
Totals
|
$
|
3,904
|
|
$
|
—
|
|
$
|
5,031
|
|
$
|
(2,962
|
)
|
$
|
(503
|
)
|
$
|
5,470
|
|
|||||
|
(1)
|
Present value of future recoveries include RMBS representation and warranty recoveries of $2,523 and $2,207 at
December 31, 2014 and 2013
, respectively.
|
Please refer to the "Critical Accounting Policies and Estimates" and “Results of Operations” sections of this Management’s Discussion and Analysis of Financial Condition and Results of Operations in addition to Basis of Presentation and Significant Accounting Policies and Loss Reserves sections included in Note 2. Basis of Presentation and Significant Accounting Policies and Note 8. Financial Guarantee Insurance Contracts, respectively of the Consolidated Financial Statements included in Part II, Item 8 in this Form 10-K for further information on loss and loss expenses.
Ambac has exposure to various bond types issued in the debt capital markets. Our experience has shown that, for the majority of bond types, we have not experienced significant claims. The bond types that have experienced significant claims and loss reserves are residential mortgage-backed securities (“RMBS”) and student loan securities. These two bond types represent 92% of our ever-to-date insurance claims recorded with RMBS comprising 89% of our ever-to-date claims payments. We have observed that, with respect to certain bond types, it is reasonably possible that a material change in actual loss severities and defaults could occur over time. In the future, our experience may differ with respect to the
64
types of guaranteed bonds affected or the magnitude of the effect. Refer to the "Critical Accounting Policies and Estimates" section of this Management’s Discussion and Analysis of Financial Condition and Results of Operations for further discussion of reasonably possible additional cash flows on policies with loss reserves.
The table below indicates gross par outstanding and the components of gross loss and loss expense reserves related to policies in Ambac’s loss reserves at
December 31, 2014 and 2013
:
|
Unpaid Claims
|
Present Value of Expected
Net Cash Flows |
||||||||||||||||||||||||||
|
($ in millions)
|
Gross par
outstanding (1) |
Claims
|
Accrued
Interest |
Claims and
Loss Expenses |
Recoveries
|
Unearned
Premium Revenue |
Gross Loss
and Loss Expense Reserves (1)(2) |
||||||||||||||||||||
|
December 31, 2014:
|
|||||||||||||||||||||||||||
|
RMBS
|
$
|
9,713
|
|
$
|
2,934
|
|
$
|
328
|
|
$
|
1,766
|
|
$
|
(3,077
|
)
|
$
|
(36
|
)
|
$
|
1,915
|
|
||||||
|
Student Loans
|
1,764
|
|
—
|
|
—
|
|
969
|
|
(34
|
)
|
(56
|
)
|
879
|
|
|||||||||||||
|
Domestic Public Finance
|
4,796
|
|
11
|
|
1
|
|
520
|
|
(109
|
)
|
(69
|
)
|
354
|
|
|||||||||||||
|
Ambac UK
|
951
|
|
—
|
|
—
|
|
577
|
|
(4
|
)
|
(31
|
)
|
542
|
|
|||||||||||||
|
All other credits
|
1,099
|
|
—
|
|
—
|
|
64
|
|
—
|
|
(49
|
)
|
15
|
|
|||||||||||||
|
Loss expenses
|
—
|
|
—
|
|
—
|
|
94
|
|
—
|
|
—
|
|
94
|
|
|||||||||||||
|
Totals
|
$
|
18,323
|
|
$
|
2,945
|
|
$
|
329
|
|
$
|
3,990
|
|
$
|
(3,224
|
)
|
$
|
(241
|
)
|
$
|
3,799
|
|
||||||
|
December 31, 2013:
|
|||||||||||||||||||||||||||
|
RMBS
|
$
|
11,683
|
|
$
|
3,891
|
|
$
|
—
|
|
$
|
2,312
|
|
$
|
(2,821
|
)
|
$
|
(70
|
)
|
$
|
3,312
|
|
||||||
|
Student Loans
|
2,352
|
|
—
|
|
—
|
|
1,078
|
|
(37
|
)
|
(59
|
)
|
982
|
|
|||||||||||||
|
Domestic Public Finance
|
5,019
|
|
13
|
|
—
|
|
500
|
|
(97
|
)
|
(78
|
)
|
338
|
|
|||||||||||||
|
Ambac UK
|
1,844
|
|
—
|
|
—
|
|
882
|
|
(7
|
)
|
(242
|
)
|
633
|
|
|||||||||||||
|
All other credits
|
1,309
|
|
—
|
|
—
|
|
148
|
|
—
|
|
(54
|
)
|
94
|
|
|||||||||||||
|
Loss expenses
|
—
|
|
—
|
|
—
|
|
111
|
|
—
|
|
—
|
|
111
|
|
|||||||||||||
|
Totals
|
$
|
22,207
|
|
$
|
3,904
|
|
$
|
—
|
|
$
|
5,031
|
|
$
|
(2,962
|
)
|
$
|
(503
|
)
|
$
|
5,470
|
|
||||||
|
(1)
|
Ceded par outstanding and ceded loss and loss expense reserves at
December 31, 2014 and 2013
, are $915 and $100 and $901 and $122, respectively. Ceded loss and loss expense reserves are included in Reinsurance recoverable on paid and unpaid losses.
|
|
(2)
|
Loss reserves are included in the balance sheet as Loss and loss expense reserves or Subrogation recoverable dependent on if a policy is in a net liability or net recoverable position.
|
RMBS
Ambac has exposure to the U.S. mortgage market primarily through direct financial guarantees of RMBS, including transactions collateralized by first and/or second liens. We established a representation and warranty subrogation recovery as further discussed in "Critical Accounting Policies and Estimates" section of this Management’s Discussion and Analysis of Financial Condition and Results of Operations in addition to the Basis of Presentation and Significant Accounting Policies and Loss Reserves sections included in Note 2. Basis of Presentation and Significant Accounting Policies and Note 8. Financial Guarantee Insurance Contracts, respectively, of the Consolidated Financial Statements included in Part II, Item 8 in this Form 10-K.
65
The table below distinguishes between RMBS credits for which we have not established a representation and warranty subrogation recovery and those for which we have, providing in both cases the gross par outstanding, gross loss reserves before subrogation recoveries, and gross loss reserves net of subrogation for all RMBS exposures for which Ambac established reserves at
December 31, 2014 and 2013
:
|
($ in millions)
|
Gross par
outstanding |
Gross loss
reserves before representation and warranty subrogation recoveries |
Representation
and warranty subrogation recoveries |
Gross loss
reserves net of representation and warranty subrogation recoveries |
||||||||||||
|
December 31, 2014:
|
||||||||||||||||
|
Second-lien
|
$
|
1,553
|
|
$
|
492
|
|
$
|
—
|
|
$
|
492
|
|
||||
|
First-lien Mid-prime
|
3,105
|
|
1,603
|
|
—
|
|
1,603
|
|
||||||||
|
First-lien Sub-prime
|
1,611
|
|
307
|
|
—
|
|
307
|
|
||||||||
|
Other
|
227
|
|
139
|
|
—
|
|
139
|
|
||||||||
|
Total Credits Without Subrogation
|
6,496
|
|
2,541
|
|
—
|
|
2,541
|
|
||||||||
|
Second-lien
|
1,923
|
|
931
|
|
(1,838
|
)
|
(907
|
)
|
||||||||
|
First-lien Mid-prime
|
136
|
|
415
|
|
(225
|
)
|
190
|
|
||||||||
|
First-lien Sub-prime
|
1,158
|
|
551
|
|
(460
|
)
|
91
|
|
||||||||
|
Total Credits With Subrogation
|
3,217
|
|
1,897
|
|
(2,523
|
)
|
(626
|
)
|
||||||||
|
Total
|
$
|
9,713
|
|
$
|
4,438
|
|
$
|
(2,523
|
)
|
$
|
1,915
|
|
||||
|
December 31, 2013:
|
||||||||||||||||
|
Second-lien
|
$
|
2,127
|
|
$
|
502
|
|
$
|
—
|
|
$
|
502
|
|
||||
|
First-lien-Mid-prime
|
2,590
|
|
1,523
|
|
—
|
|
1,523
|
|
||||||||
|
First-lien-Sub-prime
|
1,386
|
|
181
|
|
—
|
|
181
|
|
||||||||
|
Other
|
262
|
|
149
|
|
—
|
|
149
|
|
||||||||
|
Total Credits Without Subrogation
|
6,365
|
|
2,355
|
|
—
|
|
2,355
|
|
||||||||
|
Second-lien
|
2,408
|
|
1,291
|
|
(1,411
|
)
|
(120
|
)
|
||||||||
|
First-lien Mid-prime
|
1,139
|
|
1,026
|
|
(430
|
)
|
596
|
|
||||||||
|
First-lien Sub-prime
|
1,771
|
|
847
|
|
(366
|
)
|
481
|
|
||||||||
|
Total Credits With Subrogation
|
5,318
|
|
3,164
|
|
(2,207
|
)
|
957
|
|
||||||||
|
Total
|
$
|
11,683
|
|
$
|
5,519
|
|
$
|
(2,207
|
)
|
$
|
3,312
|
|
||||
For policies which have estimated representation and warranty subrogation recoveries as of
December 31, 2014
, Ambac has estimated ultimate losses of $4,102 million, which includes net paid claims of $2,205 million and gross loss reserves of $1,897 million before estimated representation and warranty subrogation recoveries. Gross loss reserves include Deferred Amounts and accrued interest on Deferred Amounts of $1,268 million and $144 million, respectively. These estimated ultimate losses exclude estimated ultimate losses of $999 million (including interest on Deferred Amounts) associated with policies that are the subject of litigation filed in December 2014 against transaction sponsors asserting claims only for fraudulent inducement. Ambac's estimated representation and warranty subrogation recoveries do not include potential recoveries attributed solely to the fraudulent inducement claims in its litigations.
Student Loans
Our student loan portfolio consists of credits collateralized by (i) federally guaranteed loans under the Federal Family Education Loan Program (“FFELP”) and (ii) private student loans. Collateral for the For-Profit Issuers consists of private loans which do not have any federal guarantee as to defaulted principal and interest. Collateral for the Not-For-Profit Issuers consists of both FFELP and private student loans. Total student loan gross loss reserves and related gross par outstanding on Ambac insured obligations were as follows:
|
December 31,
|
|||||||||||||||
|
2014
|
2013
|
||||||||||||||
|
Issuer Type
($ in millions) |
Gross Par
Outstanding |
Gross Loss
Reserves |
Gross Par
Outstanding |
Gross Loss
Reserves |
|||||||||||
|
For-Profit Issuers
|
$
|
1,509
|
|
$
|
816
|
|
$
|
1,951
|
|
$
|
921
|
|
|||
|
Not-For-Profit Issuers
|
255
|
|
63
|
|
401
|
|
61
|
|
|||||||
|
Total
|
$
|
1,764
|
|
$
|
879
|
|
$
|
2,352
|
|
$
|
982
|
|
|||
66
SPECIAL PURPOSE AND VARIABLE INTEREST ENTITIES
Please refer to Note 2. Basis of Presentation and Significant Accounting Policies and Note 4. Special Purpose Entities, Including Variable Interest Entities to the Consolidated Financial Statements, included in Part II, Item 8 in this Form 10-K, for information regarding special purpose and variable interest entities. Ambac does not have any other off-balance sheet arrangements.
ACCOUNTING STANDARDS
Please refer to Note 2. Basis of Presentation and Significant Accounting Policies to the Consolidated Financial Statements, included in Part II, Item 8 in this Form 10-K, for a discussion of the impact of recent accounting pronouncements on Ambac’s financial condition and results of operations.
AMBAC ASSURANCE STATUTORY BASIS FINANCIAL RESULTS
Ambac Assurance, Everspan and the Segregated Account’s statutory financial statements are prepared on the basis of accounting practices prescribed or permitted by the OCI. OCI recognizes only statutory accounting practices prescribed or permitted by the State of Wisconsin (“SAP”) for determining and reporting the financial condition and results of operations of an insurance company for determining its solvency under Wisconsin Insurance Law. The National Association of Insurance Commissioners (“NAIC”) Accounting Practices and Procedures manual (“NAIC SAP”) has been adopted as a component of prescribed practices by the State of Wisconsin. OCI has prescribed or permitted additional accounting practices for Ambac Assurance, Everspan and the Segregated Account which are described in Note 9. Insurance Regulatory Restrictions to the Consolidated Financial Statements included in Part II, Item 8 in this Form 10-K. As a result of these prescribed and permitted practices, Ambac Assurance’s policyholder surplus at
December 31, 2014 and 2013
was higher by $168.1 million and lower by $227.3 million, respectively, than if Ambac Assurance and the Segregated Account had reported such amounts in accordance with NAIC SAP.
Under Wisconsin insurance law, the Segregated Account is a separate insurer from Ambac Assurance and accordingly is subject to all of the filing and statutory reporting requirements of Wisconsin domiciled insurers. The total assets, total liabilities, and total surplus of the Segregated Account are reported as discrete components of Ambac Assurance’s assets, liabilities, and surplus in Ambac Assurance’s statutory basis financial statements. Accordingly, Ambac Assurance’s statutory financial statements include the results of Ambac Assurance’s general account and, to the extent allowable under a prescribed accounting practice by OCI, the Segregated Account. Pursuant to this prescribed practice, the results of the Segregated Account are not fully included in Ambac Assurance’s statutory financial statements if Ambac Assurance’s surplus is (or would be) less than $100 million (“Minimum Surplus Amount”). Maintaining the Minimum Surplus Amount could result in a reduction in the liabilities assumed by Ambac Assurance from the Segregated Account. Please refer to Note 1. Background and Business Description of the Consolidated Financial Statements in Part II, Item 8 of this Form 10-K for additional information on the establishment of the Segregated Account as well as the operative documents between Ambac Assurance and the Segregated Account.
Ambac Assurance’s statutory policyholder surplus and qualified statutory capital (defined as the sum of policyholders surplus and mandatory contingency reserves) were
$100.0 million
and
$268.4 million
at
December 31, 2014
, respectively, as compared to
$840.3 million
and
$905.1 million
at
December 31, 2013
, respectively. The Segregated Account’s statutory policyholder surplus amount was
$239.3 million
and
$442.6 million
as of
December 31, 2014 and 2013
, respectively. At
December 31, 2014
, Ambac Assurance’s surplus as regards to policyholders is at the Minimum Surplus Amount and therefore
$149.5 million
of the Segregated Account’s insurance liabilities were not assumed by Ambac Assurance under the Reinsurance Agreement. In the event that Ambac Assurance does not generate future surplus in the amount of insurance liabilities not assumed under the Reinsurance Agreement because of the applicability of the Minimum Surplus Amount, the Segregated Account would experience a shortfall in funds available to pay its liabilities to the extent that such liabilities exceed amounts available under the Reinsurance Agreement and Cooperation Agreement (each as defined in Note 1. Background and Business Description to the Consolidated Financial Statements included in Part II, Item 8 in this Form 10-K). Any such shortfall would be a consideration for the Rehabilitator in the determination of whether any changes to the Segregated Account Rehabilitation Plan and/or the amount of partial policy claim payments are necessary or appropriate or whether to institute general rehabilitation proceedings against Ambac Assurance.
Beginning with the
December 31, 2014
statutory financial statements, Ambac Assurance and the Segregated Account reclassified surplus notes, excluding junior surplus notes, from policyholder surplus to a liability. In November 2014, Ambac Assurance and the Segregated Account were required by OCI and in accordance with the Segregated Account Rehabilitation Plan to partially redeem surplus notes to ensure that they are treated pari passu with payments of Deferred Amounts. Given such treatment, surplus notes, excluding junior surplus notes, will now be presented as a liability in accordance with statutory accounting principles.
Ambac Assurance’s decrease in policyholder surplus was primarily due to the partial redemption and reclassification of all remaining surplus notes (other than junior surplus notes) of both Ambac Assurance and the Segregated Account from policyholder surplus to a liability (totaling $1,263.8 million). Additionally, decreases resulted from unrealized losses from its subsidiaries and contributions to contingency reserves, partially offset by statutory net income. Statutory net income was primarily due to positive loss developments, premium earnings and investment income which was partially offset by the accrual of interest on Deferred Amounts pursuant to the amended Segregated Account Rehabilitation and the recognition of interest paid on the partial redemption of surplus notes in November 2014.
The Segregated Account’s decrease in policyholder surplus was primarily due to the partial redemption and reclassification of all remaining surplus notes (other than junior surplus notes) from policyholder surplus to a liability (totaling $53 million) as well as statutory net loss resulting
67
from a reduction to insurance liabilities assumed by Ambac Assurance since Ambac Assurance's policyholder surplus is at the Minimum Surplus Amount.
Ambac Assurance’s statutory policyholder surplus includes $378.0 million of junior surplus notes issued by the Segregated Account, including
$350.0 million
that Ambac deposited into a statutory trust (as further discussed within Liquidity and Capital Resources in this Management's Discussion and Analysis). These junior surplus notes, as well as preferred stock issued by Ambac Assurance, are obligations that have claims on the resources of Ambac Assurance and the Segregated Account which impact Ambac's ability to realize residual value from its equity in Ambac Assurance.
Ambac Assurance’s statutory surplus is sensitive to multiple factors, including: (i) loss reserve development (inclusive of Segregated Account reserves and interest on Deferred Amounts), (ii) approval by OCI of interest payments on existing surplus notes issued by Ambac Assurance or the Segregated Account, (iii) approval by OCI of principal payments on existing junior surplus notes issued by the Segregated Account, (iv) deterioration in the financial position of Ambac Assurance subsidiaries that have their obligations guaranteed by Ambac Assurance, (v) first time payment defaults of insured obligations, which increase statutory loss reserves, (vi) commutations of insurance policies or credit derivative contracts at amounts that differ from the amount of liabilities recorded, (vii) reinsurance contract terminations at amounts that differ from net assets recorded, (viii) changes to the fair value of investments carried at fair value, (ix) settlements of representation and warranty breach claims at amounts that differ from amounts recorded, including failures to collect such amounts, (x) realized gains and losses, including losses arising from other than temporary impairments of investment securities, and (xi) future changes to prescribed SAP practices by the OCI.
As described in Note 1. Background and Business Description to the Consolidated Financial Statements included in Part II, Item 8 in this Form 10-K, the Rehabilitator redeemed certain Segregated Account surplus notes (other than junior surplus notes) on November 20, 2014 at a redemption price that includes an amount equal to accrued interest on such redeemed surplus notes. Such redemption also triggered similar proportionate redemption payments on Ambac Assurance's surplus notes. After the redemption in November 2014, total unpaid interest, which will require OCI approval for payment, for surplus notes outstanding to third parties and junior surplus notes was
$237.8 million
and
$35.9 million
, respectively at the scheduled interest payment date of June 7, 2014. Additionally, if OCI approves interest payments on current Ambac Assurance surplus notes in the future, Ambac Assurance will be required to pay interest on certain repurchased surplus notes through their call option exercise dates. The amount of such unpaid interest on repurchased surplus notes is
$38.5 million
at December 31, 2014. Under SAP, these amounts will be recorded as a liability once approval for payment has been granted by OCI.
The significant differences between GAAP and SAP are that under SAP:
|
•
|
Loss reserves are only established for losses on guaranteed obligations that have defaulted in an amount that is sufficient to cover the present value of the anticipated defaulted debt service payments over the expected period of default, less estimated recoveries under subrogation rights (currently discounted at 5.1% as prescribed by OCI). Under GAAP, in addition to the establishment of loss reserves for defaulted obligations, loss reserves are established (net of GAAP basis unearned premium reserves) for obligations that have experienced credit deterioration, but have not yet defaulted using a weighted-average risk-free discount rate, currently at 2.3%.
|
|
•
|
Mandatory contingency reserves are required based upon the type of obligation insured, whereas GAAP does not require such a reserve. Releases of the contingency reserves are generally subject to OCI approval and relate to a determination that the held reserves are deemed excessive.
|
|
•
|
Investment grade fixed income investments are stated at amortized cost and certain below investment grade fixed income investments are reported at the lower of amortized cost or fair value. Under GAAP, all bonds are reported at fair value.
|
|
•
|
Wholly owned subsidiaries are not consolidated; rather, the equity basis of accounting is utilized and the carrying values of these investments are subject to an admissibility test. When Ambac Assurance’s share of the subsidiaries’ losses exceeds the related carrying amounts of the wholly owned subsidiary, Ambac Assurance discontinues applying the equity method and the investment is reduced to zero. For those subsidiaries that have insufficient claims paying resources and whose obligations are guaranteed by Ambac Assurance, Ambac Assurance records an estimated impairment for probable losses which are in excess of the subsidiaries’ claims paying resources.
|
|
•
|
Variable interest entities are not required to be assessed for consolidation. Under GAAP, a reporting entity that has both the following characteristics is required to consolidate the VIE: a) the power to direct the activities of the VIE that most significantly impact the VIE’s economic performance; and b) the obligation to absorb losses of the VIE or the right to receive benefits from the VIE that could potentially be significant to the VIE. Ambac generally has the obligation to absorb losses of VIEs that could potentially be significant to the VIE as the result of its guarantee of insured obligations issued by VIEs. For certain VIEs Ambac Assurance has the power to direct the most significant activities of the VIE and accordingly consolidates the related VIEs under GAAP.
|
|
•
|
All payments of principal and interest on the surplus notes are subject to the approval of the OCI. Unpaid interest due on the surplus notes is expensed when the approval for payment of interest has been granted by the OCI. Under GAAP, surplus notes are included in long-term debt obligations recorded at their estimated fair value at date of issuance and accrete up to face value via the effective interest method. Additionally, under GAAP, interest on surplus notes is accrued regardless of OCI approval.
|
|
•
|
Upfront premiums written are earned on a basis proportionate to the remaining scheduled debt service to the original total principal and interest insured. Installment premiums are reflected in income pro-rata over the period covered by the premium payment. Under GAAP, premium revenues for both upfront and installment premiums are earned over the life of the financial guarantee contract in proportion to the insured principal amount outstanding at each reporting date.
|
68
AMBAC UK FINANCIAL RESULTS UNDER UK ACCOUNTING PRINCIPLES
Ambac UK is required to prepare financial statements under the provisions of The Large and Medium-sized Companies and Groups (Accounts and Reports) Regulations 2008 relating to insurance companies, and in accordance with the Statement of Recommended Practice on Accounting for Insurance Business issued by the Association of British Insurers dated December 2005 (as amended in December 2006) (collectively referred to as “UK GAAP”). Ambac UK is also required to prepare financial statements pursuant to the Accounts and Statements Rules set out in Part I and Part IV of Chapter 9 to IPRU(INS) the Interim Prudential Sourcebook for Insurers, GENPRU the General Prudential Sourcebook and INSPRU the Insurance Prudential Sourcebook (“the Rules”) made by the Prudential Regulatory Authority under section 138 of the Financial Services and Markets Act 2000 (“UK Regulatory”). Refer to Management's Discussion and Analysis of Financial Condition and Results of Operations in this Form 10-K for additional information on the significant differences between these accounting bases and U.S. GAAP.
The deficit in Ambac UK’s shareholder funds under UK GAAP was
£103.2 million
at
December 31, 2014
as compared to a deficit of
£165.4 million
at December 31, 2013. Ambac UK’s improvement in shareholders’ funds was primarily due to net income. Notwithstanding the deficit in shareholders’ funds, the directors remain satisfied that Ambac UK has adequate resources to meet its obligations as they fall due and that Ambac UK remains a going concern. At
December 31, 2014
, the carrying value of cash and investments was
£337.6 million
,
an increase
from
£297.2 million
at December 31, 2013. The increase in cash and investments is due to the continued receipt of premium income and investment coupons from Ambac UK's investment portfolio.
The significant differences between U.S. GAAP and UK GAAP are that under UK GAAP:
|
•
|
Loss reserves are only established for losses on guaranteed obligations when, in the judgment of management, a monetary default in the timely payment of debt service is likely to occur, which would result in Ambac UK incurring a loss. A loss provision is established in an amount that is sufficient to cover the present value (currently using a discount rate of 2.49%) of the anticipated defaulted debt service payments over the expected period of default, less estimated recoveries under subrogation rights. The discount rate is equal to the lower of the rate of return on invested assets for either the current year or the period covering the current year plus the four previous years. Under U.S. GAAP, loss reserves are established (net of U.S. GAAP basis unearned premium revenue) for obligations that have experienced credit deterioration, but have not yet defaulted using a weighted-average risk-free discount rate, currently at 2.2% for Ambac UK related transactions.
|
|
•
|
Investments in fixed income securities are stated at amortized cost, subject to an other-than-temporary impairment evaluation. Under U.S. GAAP, all bonds are reported at fair value.
|
|
•
|
Variable interest entities (“VIE”) are not required to be assessed for consolidation. Under U.S. GAAP, a reporting entity that has both the following characteristics is required to consolidate the VIE: a) the power to direct the activities of the VIE that most significantly impact the VIE’s economic performance; and b) the obligation to absorb losses of the VIE or the right to receive benefits from the VIE that could potentially be significant to the VIE. Ambac generally has the obligation to absorb losses of VIEs that could potentially be significant to the VIE as the result of its guarantee of insured obligations issued by VIEs. For certain VIEs Ambac UK has the power to direct the most significant activities of the VIE and accordingly consolidates the related VIEs under U.S. GAAP.
|
|
•
|
Upfront premiums written are earned on a basis proportionate to the remaining scheduled debt service to the original total principal and interest insured. Installment premiums are reflected in income pro-rata over the period covered by the premium payment. Under U.S. GAAP, premium revenues for both upfront and installment premiums are earned over the life of the financial guarantee contract in proportion to the insured principal amount outstanding at each reporting date.
|
Ambac UK is also required to prepare financial statements pursuant to the Accounts and Statements Rules set out in Part I and Part IV of Chapter 9 to IPRU (INS) the Interim Prudential Sourcebook for Insurers, GENPRU the General Prudential Sourcebook and INSPRU the Insurance Prudential Sourcebook (“the Rules”) made by the Prudential Regulatory Authority under section 138 of the Financial Services and Markets Act 2000 (“UK Regulatory”). The deficit in Ambac UK’s shareholder funds under UK Regulatory was
£416.5 million
at
December 31, 2014
as compared to a deficit of
£458.1 million
at December 31, 2013, an improvement primarily due to net income offset by an increase in inadmissible assets. The deficit at
December 31, 2014 and 2013
are in comparison to a regulatory capital requirement of
£20.6 million
and
£21.6 million
, respectively, whereby Ambac UK is deficient in terms of compliance with applicable regulatory capital requirements by
£437.1 million
and
£479.7 million
at
December 31, 2014 and 2013
, respectively. The regulators are aware of this deficiency and dialogue between Ambac UK management and its regulators remains ongoing with respect to options for addressing the shortcoming, although such options remain few.
The significant differences between UK GAAP and UK Regulatory accounting policies are that under UK Regulatory:
|
•
|
No discount is applied in the calculation of the loss provision whereas under UK GAAP such payments are discounted.
|
|
•
|
Under UK Regulatory all investments are stated at fair value and are subject to certain counterparty admissibility tests. As of December 31, 2014 the total UK Regulatory deduction for investments in excess of counterparty exposure limits was £90.2 million. Under UK GAAP fixed income investments are stated at amortized cost, subject to an other-than-temporary impairment evaluation with other investments being held at current value.
|
69
NON-GAAP FINANCIAL MEASURES
In addition to reporting the Company’s quarterly financial results in accordance with GAAP, the Company reports two non-GAAP financial measures: Operating Earnings (Losses) and Adjusted Book Value. A non-GAAP financial measure is a numerical measure of financial performance or financial position that excludes (or includes) amounts that are included in (or excluded from) the most directly comparable measure calculated and presented in accordance with GAAP. We are presenting these non-GAAP financial measures because they provide greater transparency and enhanced visibility into the underlying drivers of our business and the impact of certain items that the Company believes will reverse from GAAP book value over time through the GAAP statements of comprehensive income. Operating Earnings (Losses) and Adjusted Book Value are not substitutes for the Company’s GAAP reporting, should not be viewed in isolation and may differ from similar reporting provided by other companies, which may define non-GAAP measures differently.
Ambac has a significant tax net operating loss (“NOL”) that is offset by a full valuation allowance in the GAAP consolidated financial statements. As a result, for purposes of non-GAAP measures, we utilized a 0% effective tax rate. We maintain a full valuation allowance against our deferred tax asset and recognition of the value of the NOL would be reflected in Adjusted Book Value considering all the facts and circumstances as of the relevant reporting date.
The following paragraphs define each non-GAAP financial measure and describe why it is useful. A reconciliation of the non-GAAP financial measure and the most directly comparable GAAP financial measure is also presented below.
Operating Earnings (Losses).
Operating Earnings (Losses) eliminates the impact of certain GAAP accounting requirements and includes certain items that the Company has realized or expects to realize in the future, but that are not reported under GAAP. Operating Earnings (Losses) is defined as net income attributable to common shareholders, as reported under GAAP, adjusted on an after-tax basis for the following:
|
•
|
Elimination of the non-credit impairment fair value gains (losses) on credit derivatives, which is the amount in excess of the present value of the expected estimated credit losses. Such fair value adjustments are heavily affected by, and in part fluctuate with, changes in market factors such as interest rates and credit spreads, including the market’s perception of Ambac’s credit risk (“Ambac CVA”), and are not expected to result in an economic gain or loss. These adjustments allow for all financial guarantee segment contracts to be accounted for consistent with the Financial Services – Insurance Topic of ASC, whether or not they are subject to derivative accounting rules.
|
|
•
|
Elimination of the effects of VIEs that were consolidated as a result of being insured by Ambac. These adjustments eliminate the VIE consolidation and ensure that all financial guarantee segment contracts are accounted for consistent with the provisions of the Financial Services – Insurance Topic of the ASC, whether or not they are subject to consolidation accounting rules.
|
|
•
|
Elimination of the amortization of the financial guarantee insurance intangible asset and impairment of goodwill that arose as a result of Ambac’s emergence from bankruptcy and the implementation of Fresh Start reporting. The amount reported in net income attributable to common shareholders represents the amortization of Fresh Start adjustments relating to financial guarantee contracts. These adjustments ensure that all financial guarantee segment contracts are accounted for consistent with the provisions of the Financial Services – Insurance Topic of the ASC.
|
|
•
|
Elimination of the foreign exchange gains (losses) on re-measurement of net premium receivables and loss and loss expense reserves. Long-duration receivables constitute a significant portion of the net premium receivable balance and represent the present value of future contractual or expected collections. Therefore, the current period’s foreign exchange re-measurement gains (losses) are not necessarily indicative of the total foreign exchange gains (losses) that Ambac will ultimately recognize.
|
|
•
|
Elimination of the gains (losses) relating to Ambac’s CVA on derivative contracts other than credit derivatives. Similar to credit derivatives, fair values include the market’s perception of Ambac’s credit risk and this adjustment only allows for such gain or loss when realized.
|
|
•
|
Elimination of the gains (losses) on call options on certain surplus notes of Ambac Assurance. Under GAAP accounting, Ambac recorded only a portion of its call options as derivatives. This adjustment allows for all such call options to be accounted for consistently. All call options were either exercised or expired in June 2012. Gains (losses) on call option exercises are not being adjusted for within Operating Earnings (Losses), consistent with other gains and losses.
|
|
•
|
Elimination of non-recurring GAAP Fresh Start reporting adjustments.
|
70
The following table reconciles net income attributable to common shareholders to the non-GAAP measure, Operating Earnings (Losses), for all periods presented:
|
Successor Ambac
|
Predecessor Ambac
|
|||||||||||||||
|
|
Period from May 1
|
Period from January 1
|
||||||||||||||
|
Year Ended
|
through
|
through
|
Year Ended
|
|||||||||||||
|
($ in Millions)
|
December 31, 2014
|
December 31, 2013
|
April 30, 2013
|
December 31, 2012
|
||||||||||||
|
Net income (loss) attributable to common shareholders
|
$
|
484.1
|
|
$
|
505.2
|
|
$
|
3,349.0
|
|
$
|
(256.7
|
)
|
||||
|
Adjustments:
|
||||||||||||||||
|
Non-credit impairment fair value (gain) loss on credit derivatives
|
(17.1
|
)
|
(165.9
|
)
|
71.6
|
|
13.4
|
|
||||||||
|
Effect of consolidating financial guarantee VIEs
|
45.0
|
|
223.7
|
|
(413.7
|
)
|
25.5
|
|
||||||||
|
Insurance intangible amortization
|
151.8
|
|
99.7
|
|
—
|
|
—
|
|
||||||||
|
Foreign exchange (gain) loss from re-measurement of premium receivables and loss and loss expense reserves
|
34.9
|
|
(21.0
|
)
|
11.3
|
|
(13.3
|
)
|
||||||||
|
Fair value (gain) loss on derivative products from Ambac CVA
|
(16.1
|
)
|
46.8
|
|
26.7
|
|
44.9
|
|
||||||||
|
Mark-to-market gain on stand alone derivative surplus note calls
|
—
|
|
—
|
|
—
|
|
(100.7
|
)
|
||||||||
|
Fresh Start accounting adjustments
|
—
|
|
—
|
|
(2,749.7
|
)
|
—
|
|
||||||||
|
Operating earnings (losses)
|
$
|
682.6
|
|
$
|
688.5
|
|
$
|
295.2
|
|
$
|
(286.9
|
)
|
||||
The effects of Ambac’s emergence from bankruptcy and Fresh Start had a material impact on the comparability of Operating Earnings (Losses) between the periods presented. Refer above for discussion of the significant Fresh Start items impacting comparability.
Adjusted Book Value.
Adjusted Book Value eliminates the impact of certain GAAP accounting requirements and includes the addition of certain items that the Company has realized or expects to realize in the future, but that are not reported under GAAP. Adjusted Book Value is defined as Total Ambac Financial Group, Inc. stockholders’ equity as reported under GAAP, adjusted for after-tax impact of the following:
|
•
|
Elimination of the non-credit impairment fair value loss on credit derivatives, which is the amount in excess of the present value of the expected estimated economic credit loss. GAAP Fair values are heavily affected by, and in part fluctuate with, changes in market factors such as interest rates, credit spreads, including Ambac’s CVA that are not expected to result in an economic gain or loss. These adjustments allow for all financial guarantee segment contracts to be accounted for within Adjusted Book Value consistent with the provisions of the Financial Services—Insurance Topic of the ASC, whether or not they are subject to derivative accounting rules.
|
|
•
|
Elimination of the effects of VIEs that were consolidated as a result of being insured by Ambac. These adjustments eliminate VIE consolidation and ensure that all financial guarantee segment contracts are accounted for within Adjusted Book Value consistent with the provisions of the Financial Services—Insurance Topic of the ASC, whether or not they are subject to consolidation accounting rules.
|
|
•
|
Elimination of the financial guarantee insurance intangible asset and goodwill that arose as a result of Ambac’s emergence from bankruptcy and the implementation of Fresh Start reporting. These adjustments ensure that all financial guarantee segment contracts are accounted for within Adjusted Book Value consistent with the provisions of the Financial Services—Insurance Topic of the ASC.
|
|
•
|
Elimination of the gain relating to Ambac’s CVA embedded in the fair value of derivative contracts other than credit derivatives. Similar to credit derivatives, fair values include the market’s perception of Ambac’s credit risk and this adjustment only allows for such gain when realized.
|
|
•
|
Addition of the value of the unearned premium revenue on financial guarantee contracts and fees on credit derivative contracts, adjusted for management's expected future net premiums and credit derivative receipts, in excess of expected losses, net of reinsurance.
|
|
•
|
Elimination of the unrealized gains and losses on the Company’s investments that are recorded as a component of accumulated other comprehensive income (“AOCI”). The AOCI component of the fair value adjustment on the investment portfolio will differ materially from realized gains and losses ultimately recognized by the Company based on the Company’s investment strategy. This adjustment only allows for such gains and losses in Adjusted Book Value when realized.
|
71
The following table reconciles Total Ambac Financial Group, Inc. stockholders’ equity to the non-GAAP measure Adjusted Book Value for all periods presented:
|
December 31,
|
|||||||||||
|
($ in Millions)
|
2014
|
2013
|
2013
|
||||||||
|
Revised
|
Reported
|
||||||||||
|
Total Ambac Financial Group, Inc. stockholders’ equity
|
$
|
1,399.1
|
|
$
|
703.0
|
|
$
|
703.0
|
|
||
|
Adjustments:
|
|||||||||||
|
Non-credit impairment fair value losses on credit derivatives
|
55.7
|
|
72.8
|
|
72.8
|
|
|||||
|
Effect of consolidating financial guarantee variable interest entities
|
(319.1
|
)
|
(372.7
|
)
|
(372.7
|
)
|
|||||
|
Insurance intangible asset and goodwill
|
(1,925.4
|
)
|
(2,112.5
|
)
|
(2,112.5
|
)
|
|||||
|
Ambac CVA on derivative product liabilities (excluding credit derivatives)
|
(64.5
|
)
|
(48.4
|
)
|
(48.4
|
)
|
|||||
|
Net unearned premiums and fees in excess of expected losses
|
1,402.3
|
|
1,666.0
|
|
1,435.2
|
|
|||||
|
Net unrealized investment (gains) losses in Accumulated Other Comprehensive Income
|
(210.7
|
)
|
41.9
|
|
41.9
|
|
|||||
|
Adjusted book value
|
$
|
337.4
|
|
$
|
(49.9
|
)
|
$
|
(280.7
|
)
|
||
Adjusted Book Value as of
December 31, 2013
reflects a $230.8 million revision to correct the previously reported amount of ($280.7) million. This revision relates to a correction in the net unearned premiums and fees in excess of expected losses adjustment. The revision eliminates the impact of forgone future installment premiums related to one Ambac UK exposure that was already recorded in Ambac's stockholders' equity.
Factors that impact changes to Adjusted Book Value include many of the same factors that impact Operating Earnings (Losses), including the majority of revenues and expenses but exclude components of premium earnings since they are embedded in prior period's Adjusted Book Value through the net unearned premiums and fees in excess of expected losses adjustment. Net unearned premiums and fees in excess of expected losses will affect Adjusted Book Value for (i) changes to future premium assumptions (e.g. expected term, interest rates, foreign exchange rates, time passage) and (ii) changes to expected losses for policies which do not exceed their related unearned premiums. The Adjusted Book Value
increase
from
December 31, 2013
to
December 31, 2014
of
$387.3 million
was primarily driven by an increase in Ambac's total stockholders equity primarily related to a benefit in loss and loss expenses.
Market risk represents the potential for losses that may result from changes in the value of a financial instrument as a result of changes in market conditions. The primary market risks that would impact the value of Ambac’s financial instruments are interest rate risk, spread risk, and foreign currency exchange risk. Below we discuss each of these risks and the specific types of financial instruments impacted. Senior managers are responsible for developing and applying methods to measure risk. The estimation of potential losses arising from adverse changes in market conditions is a key element in managing market risk. Ambac utilizes various systems, models and sensitivity scenarios to monitor and manage market risk. This process includes frequent analysis of both parallel and non-parallel shifts in benchmark interest rates and “Value-at-Risk” (“VaR”) measures. These models include estimates, made by management, which utilize current and historical market information. The valuation results from these models could differ materially from amounts that would actually be realized in the market. Financial instruments of VIEs that are consolidated as a result of Ambac's financial guarantees are excluded from the market risk measures below.
Interest Rate Risk:
Financial instruments for which fair value may be affected by changes in interest rates consist primarily of fixed income investment securities, loans, investment agreements, long-term debt and interest rate derivatives. Fixed income investment securities that are guaranteed by Ambac neutralize interest rate risk associated with future financial guarantee claim payments. Accordingly, such securities are excluded from the company's interest rate sensitivity measures. The following table summarizes the estimated change in fair value (based primarily on the valuation methodology discussed in Note 10. Fair Value Measurements to the Consolidated Financial Statements included in Part II, Item 8 in this Form 10-K) on these financial instruments, assuming immediate changes in interest rates at specified levels at
December 31, 2014
:
|
Change in Interest Rates
($ in millions) |
Estimated
Change in Net Fair Value |
Estimated
Net Fair Value |
|||||
|
300 basis point rise
|
$
|
183
|
|
$
|
2,057
|
|
|
|
200 basis point rise
|
143
|
|
2,017
|
|
|||
|
100 basis point rise
|
83
|
|
1,957
|
|
|||
|
Base scenario
|
—
|
|
1,874
|
|
|||
|
100 basis point decline
(1)
|
(110
|
)
|
1,764
|
|
|||
|
200 basis point decline
(1)
|
(248
|
)
|
1,626
|
|
|||
|
(1)
|
Incorporates an interest rate floor of 0%
|
72
Due to the low interest rate environment as of
December 31, 2014
, stress scenarios involving interest rate declines greater than 200 basis points are not meaningful to Ambac's portfolios.
Changes in fair value resulting from changes in interest rates are driven primarily by the impact of interest rate shifts on the investment portfolio (which declines in value as rates increase) and the interest rate swap portfolio (which is generally positioned to increase in value as rates increase). Interest rate increases would also have a negative economic impact on expected future claim payments on the financial guarantee portfolio.
The interest rate derivatives portfolio is managed with the goal of retaining some interest rate sensitivity as an economic hedge against the effects of rising interest rates elsewhere in the Company, including on Ambac’s financial guarantee exposures (the “macro-hedge”). The interest rate sensitivity of the interest rate swap portfolio attributable to the macro-hedge position would produce mark-to-market gains or losses of approximately $0.7 million for a 1 basis point parallel shift in USD swap rates up or down at
December 31, 2014
. The impact of the macro-hedge is included in the interest rate sensitivity table above.
The estimation of potential losses arising from adverse changes in market relationships, known as VaR, is a consideration in management’s monitoring of interest rate risk for the interest rate swap portfolio. Ambac has developed a VaR methodology to estimate potential losses using a one day time horizon and a 99% confidence level. This means that Ambac would expect to incur losses due to changes in interest rates greater than that predicted by VaR estimates only once in every 100 trading days, or about 2.5 times a year. Ambac’s methodology estimates VaR using a 300-day historical “look back” period. This means that changes in market values are simulated using market inputs from the past 300 days. For the
year ended December 31, 2014
, Ambac’s interest rate derivative portfolio VaR averaged approximately $14.8 million, and ranged from a high of $15.5 million to a low of $13.4 million. These VaR measures are intended to focus on the impact of observable market rates and therefore exclude fair value adjustments made by management to incorporate Ambac or counterparty credit risk. Ambac supplements its VaR methodology, which it believes is a good risk management tool in normal markets, by performing scenario testing to measure the potential for losses in volatile markets. These scenario tests include parallel and non-parallel shifts in the benchmark interest rate curve.
Credit Spread Risk:
Financial instruments that may be adversely affected by changes in spreads include Ambac’s outstanding credit derivative contracts, certain interest rate swap contracts and investment assets. Changes in spreads are generally caused by changes in the market’s perception of the credit quality of the underlying obligor. Market liquidity and prevailing risk premiums demanded by market participants are also reflected in spreads and impact valuations.
The following table summarizes the estimated change in fair values on Successor Ambac’s credit derivative contracts assuming immediate parallel shifts in reference obligation credit spreads at
December 31, 2014
. It is more likely that actual changes in credit spreads will vary by security:
|
Change in Reference Obligation Spreads
($ in millions) |
Estimated
Change in Fair Value |
Estimated
Fair Value |
|||||
|
250 basis point widening
|
$
|
(21
|
)
|
$
|
(94
|
)
|
|
|
50 basis point widening
|
(4
|
)
|
(77
|
)
|
|||
|
Base scenario
|
—
|
|
(73
|
)
|
|||
|
50 basis point narrowing
|
4
|
|
(69
|
)
|
|||
|
250 basis point narrowing
|
13
|
|
(60
|
)
|
|||
Also included in the fair value of credit derivative liabilities is the effect of Ambac’s creditworthiness, which reflects market perception of Ambac’s ability to meet its obligations. Incorporating estimates of Ambac’s credit valuation adjustment into the determination of fair value has resulted in a $15.9 million reduction to the credit derivatives liability as of
December 31, 2014
. At
December 31, 2014
the credit valuation adjustment resulted in a 17.8% reduction of the credit derivative liability as measured before considering Ambac credit risk. Refer to Note 10. Fair Value Measurements to the Consolidated Financial Statements included in Part II, Item 8 in this Form 10-K for further information on measurement of the credit valuation adjustment.
The fair value of interest rate swaps may be affected by changes to the credit valuation adjustment attributable to the risk of counterparty or Ambac non-performance. Generally, the need for a counterparty (or Ambac) credit valuation adjustment is mitigated by the existence of collateral posting agreements under which adequate collateral has been posted. Derivative contracts entered into with financial guarantee customers are not typically subject to collateral posting agreements. Valuation adjustments for counterparty credit risk were not significant as of
December 31, 2014
. Estimates of Ambac’s credit valuation adjustment included in the fair value of interest rate swaps reduced the derivative liability fair value by $64.5 million as of
December 31, 2014
.
The following table summarizes the estimated change in fair values on Successor Ambac's credit derivative and interest rate swap net liabilities assuming immediate shifts in Ambac credit spreads used to determine the CVA at
December 31, 2014
:
73
|
Change in Ambac Credit Spreads
($ in millions) |
Estimated
Change in Fair Value |
Estimated
Fair Value |
|||||
|
250 basis point widening
|
$
|
27
|
|
$
|
(270
|
)
|
|
|
50 basis point widening
|
6
|
|
(291
|
)
|
|||
|
Base scenario
|
—
|
|
(297
|
)
|
|||
|
50 basis point narrowing
|
(7
|
)
|
(304
|
)
|
|||
|
250 basis point narrowing
|
(36
|
)
|
(333
|
)
|
|||
Ambac’s fixed income investment portfolio contains securities with different sensitivities to and volatility of spreads. Fixed income securities that are guaranteed by Ambac and were purchased in Ambac's investment portfolio neutralize exposure to future financial guarantee claim payments. Accordingly, such securities are excluded from the company's spread sensitivity measures. The following table summarizes the estimated change in fair values of Successor Ambac’s fixed income investment portfolio assuming immediate shifts in credit spreads across all holdings at
December 31, 2014
. It is more likely that actual changes in credit spreads will vary be security:
|
Change in Spreads
($ in millions) |
Estimated
Change in Fair Value |
Estimated
Fair Value |
|||||
|
250 basis point widening
|
$
|
(256
|
)
|
$
|
3,028
|
|
|
|
50 basis point widening
|
(51
|
)
|
3,233
|
|
|||
|
Base scenario
|
—
|
|
3,284
|
|
|||
|
50 basis point narrowing
|
51
|
|
3,335
|
|
|||
|
250 basis point narrowing
|
256
|
|
3,540
|
|
|||
Foreign Exchange Risk:
Ambac has financial instruments denominated in currencies other than the U.S. dollar, primarily pounds sterling and euros. These financial instruments are primarily invested assets, and assets and liabilities of Ambac UK. The following table summarizes the estimated net change in fair value of these financial instruments assuming immediate shifts in foreign exchange rates as of
December 31, 2014
.
|
Change in Foreign Exchange Rates Against U.S. Dollar
|
|||||||||||||||
|
($ in millions)
|
20% Decrease
|
10% Decrease
|
10% Increase
|
20% Increase
|
|||||||||||
|
Estimated change in fair value
|
$
|
(52.4
|
)
|
$
|
(26.2
|
)
|
$
|
26.2
|
|
$
|
52.4
|
|
|||
74
Report of Independent Registered Public Accounting Firm
The Board of Directors and Stockholders
Ambac Financial Group, Inc.
We have audited Ambac Financial Group, Inc.’s (the “Company” or “Ambac”) internal control over financial reporting as of December 31, 2014, based on criteria established in
Internal Control - Integrated Framework (1992)
issued by the Committee of Sponsoring Organizations of the Treadway Commission (COSO). The Company’s management is responsible for maintaining effective internal control over financial reporting and for its assessment of the effectiveness of internal control over financial reporting, included in the accompanying
Management’s Report on Internal Control over Financial Reporting
. Our responsibility is to express an opinion on the Company’s internal control over financial reporting based on our audit.
We conducted our audit in accordance with the standards of the Public Company Accounting Oversight Board (United States). Those standards require that we plan and perform the audit to obtain reasonable assurance about whether effective internal control over financial reporting was maintained in all material respects. Our audit included obtaining an understanding of internal control over financial reporting, assessing the risk that a material weakness exists, and testing and evaluating the design and operating effectiveness of internal control based on the assessed risk. Our audit also included performing such other procedures as we considered necessary in the circumstances. We believe that our audit provides a reasonable basis for our opinion.
A company’s internal control over financial reporting is a process designed to provide reasonable assurance regarding the reliability of financial reporting and the preparation of financial statements for external purposes in accordance with generally accepted accounting principles. A company’s internal control over financial reporting includes those policies and procedures that (1) pertain to the maintenance of records that, in reasonable detail, accurately and fairly reflect the transactions and dispositions of the assets of the company; (2) provide reasonable assurance that transactions are recorded as necessary to permit preparation of financial statements in accordance with generally accepted accounting principles, and that receipts and expenditures of the company are being made only in accordance with authorizations of management and directors of the company; and (3) provide reasonable assurance regarding prevention or timely detection of unauthorized acquisition, use, or disposition of the company’s assets that could have a material effect on the financial statements.
Because of its inherent limitations, internal control over financial reporting may not prevent or detect misstatements. Also, projections of any evaluation of effectiveness to future periods are subject to the risk that controls may become inadequate because of changes in conditions, or that the degree of compliance with the policies or procedures may deteriorate.
In our opinion, Ambac maintained, in all material respects, effective internal control over financial reporting as of December 31, 2014, based on criteria established in
Internal Control - Integrated Framework
(1992)
issued by the Committee of Sponsoring Organizations of the Treadway Commission (COSO).
We also have audited, in accordance with the standards of the Public Company Accounting Oversight Board (United States), the consolidated balance sheets of Ambac as of December 31, 2014 and December 31, 2013, and the related consolidated statements of operations, comprehensive income (loss), stockholders’ equity (deficit), and cash flows for the year ended December 31, 2014, and eight month period ended December 31, 2013 (Successor Company), four month period ended April 30, 2013 (Predecessor Company) and the year ended December 31, 2012 (Predecessor Company), and our report dated March 2, 2015, expressed an unqualified opinion on those consolidated financial statements. The opinion refers to Note 1, which describes factors that raise substantial doubt about Ambac’s ability to continue as a going concern. Management’s plans in regard to these matters are also described in Note 1. The consolidated financial statements do not include any adjustments that might result from the outcome of this uncertainty.
/s/ KPMG LLP
New York, New York
March 2, 2015
75
Report of Independent Registered Public Accounting Firm
The Board of Directors and Stockholders
Ambac Financial Group, Inc.
We have audited the accompanying consolidated balance sheets of Ambac Financial Group, Inc. and subsidiaries (the “Company”) as of December 31, 2014 and December 31, 2013, and the related consolidated statements of comprehensive income (loss), stockholders’ equity (deficit) and cash flows for the year ended December 31, 2014, eight month period ended December 31, 2013 (Successor Company), four month period ended April 30, 2013 (Predecessor Company) and the year ended December 31, 2012 (Predecessor Company). In connection with our audits of the consolidated financial statements, we also have audited the related financial statement schedules in this Form 10-K. These consolidated financial statements and financial statement schedules are the responsibility of the Company’s management. Our responsibility is to express an opinion on these consolidated financial statements and financial statement schedules based on our audits.
We conducted our audits in accordance with the standards of the Public Company Accounting Oversight Board (United States). Those standards require that we plan and perform the audit to obtain reasonable assurance about whether the financial statements are free of material misstatement. An audit includes examining, on a test basis, evidence supporting the amounts and disclosures in the financial statements. An audit also includes assessing the accounting principles used and significant estimates made by management, as well as evaluating the overall financial statement presentation. We believe that our audits provide a reasonable basis for our opinion.
In our opinion, the consolidated financial statements referred to above present fairly, in all material respects, the financial position of Ambac Financial Group, Inc. and subsidiaries as of December 31, 2014 and December 31, 2013, and the results of their operations and their cash flows for the year ended December 31, 2014, eight-month period ended December 31, 2013 (Successor Company), four-month period ended April 30, 2013 (Predecessor Company) and year ended December 31, 2012 (Predecessor Company), in conformity with U.S. generally accepted accounting principles. Also in our opinion, the related financial statement schedules, when considered in relation to the consolidated financial statements taken as a whole, present fairly, in all material respects, the information set forth therein.
The accompanying consolidated financial statements and financial statement schedules have been prepared assuming that the Company will continue as a going concern. As discussed in Note 1 to the consolidated financial statements, the significant deterioration of the guaranteed portfolio has adversely impacted the financial condition of the Company’s operating subsidiary, Ambac Assurance Corporation resulting in significant regulatory oversight by the Office of the Commissioner of Insurance of the State of Wisconsin, including the rehabilitation of a segregated account of Ambac Assurance Corporation. This raises substantial doubt about the Company’s ability to continue as a going concern. Management’s plans in regard to these matters are also described in Note 1. The consolidated financial statements and financial statement schedules do not include any adjustments that might result from the outcome of these uncertainties.
As discussed in Note 1 to the consolidated financial statements, the Company filed for relief under Chapter 11 of the United States Bankruptcy Code on November 8, 2010. The Company’s plan of reorganization became effective and the Company emerged from bankruptcy protection on April 30, 2013. In connection with their emergence from bankruptcy, the Successor Company, Ambac Financial Group, Inc. adopted fresh-start reporting in conformity with ASC Topic 852, “
Reorganizations
”, effective April 30, 2013. The 2013 Successor Period and the 2013 Predecessor Period are distinct reporting periods and accordingly; the Successor Company’s consolidated financial statements are not comparable to the Predecessor Company’s consolidated financial statements.
We also have audited, in accordance with the standards of the Public Company Accounting Oversight Board (United States), the Company's internal control over financial reporting as of December 31, 2014, based on criteria established in
Internal Control - Integrated Framework (1992)
issued by the Committee of Sponsoring Organizations of the Treadway Commission (COSO), and our report dated March 2, 2015 expressed an unqualified opinion on the effectiveness of the Company's internal control over financial reporting.
/s/ KPMG LLP
New York, New York
March 2, 2015
76
AMBAC FINANCIAL GROUP, INC. AND SUBSIDIARIES
Consolidated Balance Sheets
|
December 31,
|
|||||||
|
(Dollars in thousands, except share data)
|
2014
|
2013
|
|||||
|
Assets:
|
|||||||
|
Investments:
|
|||||||
|
Fixed income securities, at fair value (amortized cost of $4,514,878 in 2014 and $5,927,254 in 2013)
|
$
|
4,725,686
|
|
$
|
5,885,316
|
|
|
|
Fixed income securities pledged as collateral, at fair value (amortized cost of $64,378 in 2014 and $126,196 in 2013)
|
64,267
|
|
126,223
|
|
|||
|
Short-term investments, at fair value (amortized cost of $360,069 in 2014 and $271,118 in 2013)
|
360,065
|
|
271,119
|
|
|||
|
Other investments (includes $336,013 at fair value in 2014 and $240,969 at fair value in 2013)
|
357,016
|
|
241,069
|
|
|||
|
Total investments
|
5,507,034
|
|
6,523,727
|
|
|||
|
Cash and cash equivalents
|
73,903
|
|
77,370
|
|
|||
|
Receivable for securities
|
23,660
|
|
14,450
|
|
|||
|
Investment income due and accrued
|
25,015
|
|
37,663
|
|
|||
|
Premium receivables
|
1,000,607
|
|
1,453,021
|
|
|||
|
Reinsurance recoverable on paid and unpaid losses
|
99,838
|
|
121,249
|
|
|||
|
Deferred ceded premium
|
123,276
|
|
145,529
|
|
|||
|
Subrogation recoverable
|
953,274
|
|
498,478
|
|
|||
|
Loans
|
5,714
|
|
6,179
|
|
|||
|
Derivative assets
|
109,017
|
|
77,711
|
|
|||
|
Insurance intangible asset
|
1,410,920
|
|
1,597,965
|
|
|||
|
Goodwill
|
514,511
|
|
514,511
|
|
|||
|
Other assets
|
186,985
|
|
35,927
|
|
|||
|
Variable interest entity assets:
|
|||||||
|
Fixed income securities, at fair value
|
2,743,050
|
|
2,475,182
|
|
|||
|
Restricted cash
|
7,708
|
|
17,498
|
|
|||
|
Investment income due and accrued
|
1,284
|
|
1,365
|
|
|||
|
Loans, at fair value
|
12,371,177
|
|
13,398,895
|
|
|||
|
Intangible assets
|
—
|
|
76,140
|
|
|||
|
Other assets
|
2,891
|
|
19,617
|
|
|||
|
Total assets
|
$
|
25,159,864
|
|
$
|
27,092,477
|
|
|
|
Liabilities and Stockholders’ Equity:
|
|||||||
|
Liabilities:
|
|||||||
|
Unearned premiums
|
$
|
1,673,785
|
|
$
|
2,255,680
|
|
|
|
Loss and loss expense reserves
|
4,752,007
|
|
5,968,712
|
|
|||
|
Ceded premiums payable
|
60,436
|
|
70,962
|
|
|||
|
Obligations under investment agreements
|
160,079
|
|
359,070
|
|
|||
|
Deferred taxes
|
2,079
|
|
2,199
|
|
|||
|
Current taxes
|
5,701
|
|
738
|
|
|||
|
Long-term debt
|
971,116
|
|
963,178
|
|
|||
|
Accrued interest payable
|
304,139
|
|
294,817
|
|
|||
|
Derivative liabilities
|
406,944
|
|
253,898
|
|
|||
|
Other liabilities
|
63,396
|
|
67,377
|
|
|||
|
Payable for securities purchased
|
762
|
|
4,654
|
|
|||
|
Variable interest entity liabilities:
|
|||||||
|
Accrued interest payable
|
3,268
|
|
722
|
|
|||
|
Long-term debt, at fair value
|
12,882,076
|
|
14,091,753
|
|
|||
|
Derivative liabilities
|
2,200,163
|
|
1,772,306
|
|
|||
|
Other liabilities
|
178
|
|
7,989
|
|
|||
|
Total liabilities
|
23,486,129
|
|
26,114,055
|
|
|||
|
Commitments and contingencies (see Note 18)
|
|||||||
|
Stockholders’ equity:
|
|
|
|||||
|
Preferred stock, par value $0.01 per share; authorized shares—20,000,000; issued and outstanding shares—none
|
—
|
|
—
|
|
|||
|
Common stock, par value $0.01 per share; authorized shares—130,000,000; issued and outstanding shares—45,005,932 at December 31, 2014 and 45,003,461 at December 31, 2013
|
450
|
|
450
|
|
|||
|
Additional paid-in capital
|
189,138
|
|
185,672
|
|
|||
|
Accumulated other comprehensive income
|
220,283
|
|
11,661
|
|
|||
|
Accumulated earnings
|
989,290
|
|
505,219
|
|
|||
|
Common stock held in treasury at cost, 2,459 shares at December 31, 2014 and 937 shares at December 31, 2013
|
(56
|
)
|
(19
|
)
|
|||
|
Total Ambac Financial Group, Inc. stockholders’ equity
|
1,399,105
|
|
702,983
|
|
|||
|
Noncontrolling interest
|
274,630
|
|
275,439
|
|
|||
|
Total stockholders’ equity
|
1,673,735
|
|
978,422
|
|
|||
|
Total liabilities and stockholders’ equity
|
$
|
25,159,864
|
|
$
|
27,092,477
|
|
|
See accompanying Notes to Consolidated Financial Statements
77
AMBAC FINANCIAL GROUP, INC. AND SUBSIDIARIES
Consolidated Statements of Total Comprehensive Income (Loss)
|
Successor Ambac
|
Predecessor Ambac
|
|||||||||||||||
|
Period from May 1
|
Period from January 1
|
|||||||||||||||
|
Year Ended
|
through
|
through
|
Year Ended
|
|||||||||||||
|
(Dollars in thousands, except share data)
|
December 31, 2014
|
December 31, 2013
|
April 30, 2013
|
December 31, 2012
|
||||||||||||
|
Revenues:
|
||||||||||||||||
|
Net premiums earned
|
$
|
246,360
|
|
$
|
213,518
|
|
$
|
130,000
|
|
414,604
|
|
|||||
|
Net investment income:
|
||||||||||||||||
|
Securities available-for-sale and short-term
|
292,838
|
|
142,866
|
|
116,371
|
|
382,902
|
|
||||||||
|
Other investments
|
8,108
|
|
3,580
|
|
369
|
|
—
|
|
||||||||
|
Total net investment income
|
300,946
|
|
146,446
|
|
116,740
|
|
382,902
|
|
||||||||
|
Other-than-temporary impairment losses:
|
||||||||||||||||
|
Total other-than-temporary impairment losses
|
(26,632
|
)
|
(47,418
|
)
|
(467
|
)
|
(15,659
|
)
|
||||||||
|
Portion of other -than-temporary impairment recognized in other comprehensive income
|
838
|
|
654
|
|
—
|
|
9,669
|
|
||||||||
|
Net other-than-temporary impairment losses recognized in earnings
|
(25,794
|
)
|
(46,764
|
)
|
(467
|
)
|
(5,990
|
)
|
||||||||
|
Net realized investment gains
|
58,777
|
|
4,467
|
|
53,305
|
|
72,101
|
|
||||||||
|
Change in fair value of credit derivatives:
|
||||||||||||||||
|
Realized gains and other settlements
|
3,043
|
|
9,778
|
|
3,444
|
|
13,713
|
|
||||||||
|
Unrealized gains (losses)
|
20,863
|
|
183,091
|
|
(63,828
|
)
|
(22,932
|
)
|
||||||||
|
Net change in fair value of credit derivatives
|
23,906
|
|
192,869
|
|
(60,384
|
)
|
(9,219
|
)
|
||||||||
|
Derivative products
|
(181,087
|
)
|
114,771
|
|
(33,735
|
)
|
(125,004
|
)
|
||||||||
|
Net realized losses on extinguishment of debt
|
(74,724
|
)
|
—
|
|
—
|
|
(177,580
|
)
|
||||||||
|
Other income
|
12,498
|
|
4,364
|
|
8,363
|
|
106,098
|
|
||||||||
|
Income (loss) on variable interest entities
|
(32,212
|
)
|
(48,623
|
)
|
426,566
|
|
27,777
|
|
||||||||
|
Total revenues before expenses and reorganization items
|
328,670
|
|
581,048
|
|
640,388
|
|
685,689
|
|
||||||||
|
Expenses:
|
||||||||||||||||
|
Losses and loss expenses (benefit)
|
(545,574
|
)
|
(185,138
|
)
|
(38,056
|
)
|
683,630
|
|
||||||||
|
Insurance intangible amortization
|
151,830
|
|
99,658
|
|
—
|
|
—
|
|
||||||||
|
Underwriting and operating expenses
|
101,474
|
|
68,769
|
|
44,566
|
|
139,029
|
|
||||||||
|
Interest expense
|
127,476
|
|
84,950
|
|
31,025
|
|
112,320
|
|
||||||||
|
Total expenses before reorganization items
|
(164,794
|
)
|
68,239
|
|
37,535
|
|
934,979
|
|
||||||||
|
Pre-tax (loss) income from continuing operations before reorganization items
|
493,464
|
|
512,809
|
|
602,853
|
|
(249,290
|
)
|
||||||||
|
Reorganization items
|
211
|
|
493
|
|
(2,745,180
|
)
|
7,215
|
|
||||||||
|
Pre-tax (loss) income from continuing operations
|
493,253
|
|
512,316
|
|
3,348,033
|
|
(256,505
|
)
|
||||||||
|
Provision for income taxes
|
9,557
|
|
7,514
|
|
755
|
|
2,849
|
|
||||||||
|
Net (loss) income
|
483,696
|
|
504,802
|
|
3,347,278
|
|
(259,354
|
)
|
||||||||
|
Less: net (gain) loss attributable to noncontrolling interest
|
(375
|
)
|
(417
|
)
|
(1,771
|
)
|
(2,676
|
)
|
||||||||
|
Net income (loss) attributable to common shareholders
|
$
|
484,071
|
|
$
|
505,219
|
|
$
|
3,349,049
|
|
$
|
(256,678
|
)
|
||||
|
Other comprehensive income (loss), after tax:
|
||||||||||||||||
|
Net income (loss)
|
$
|
483,696
|
|
$
|
504,802
|
|
$
|
3,347,278
|
|
$
|
(259,354
|
)
|
||||
|
Unrealized gains (losses) on securities, net of deferred income taxes of $0
|
252,603
|
|
(41,910
|
)
|
175,347
|
|
166,252
|
|
||||||||
|
Gains (losses) on foreign currency translation, net of deferred income taxes of $0
|
(43,599
|
)
|
43,165
|
|
(428
|
)
|
(540
|
)
|
||||||||
|
Changes to postretirement benefit, net of tax of $0
|
(816
|
)
|
10,847
|
|
185
|
|
(3,792
|
)
|
||||||||
|
Total other comprehensive income, net of tax
|
208,188
|
|
12,102
|
|
175,104
|
|
161,920
|
|
||||||||
|
Total comprehensive income (loss)
|
691,884
|
|
516,904
|
|
3,522,382
|
|
(97,434
|
)
|
||||||||
|
Less: comprehensive (loss) gain attributable to the noncontrolling interest:
|
||||||||||||||||
|
Net (gain) loss
|
(375
|
)
|
(417
|
)
|
(1,771
|
)
|
(2,676
|
)
|
||||||||
|
Currency translation adjustments
|
(434
|
)
|
441
|
|
229
|
|
(206
|
)
|
||||||||
|
Total comprehensive income (loss) attributable to Ambac Financial Group, Inc.
|
$
|
692,693
|
|
$
|
516,880
|
|
$
|
3,523,924
|
|
$
|
(94,552
|
)
|
||||
|
Net income (loss) per share attributable to Ambac Financial Group, Inc. common shareholders
|
$
|
10.73
|
|
$
|
11.23
|
|
$
|
11.07
|
|
$
|
(0.85
|
)
|
||||
|
Net income (loss) per diluted share attributable to Ambac Financial Group, Inc. common shareholders
|
$
|
10.31
|
|
$
|
10.91
|
|
$
|
11.07
|
|
$
|
(0.85
|
)
|
||||
See accompanying Notes to Consolidated Financial Statements
78
AMBAC FINANCIAL GROUP, INC. AND SUBSIDIARIES
Consolidated Statements of Stockholders’ Equity (Deficit)
|
Ambac Financial Group, Inc.
|
|||||||||||||||||||||||||||||||
|
(Dollars in thousands)
|
Total
|
Retained
Earnings |
Accumulated
Other Comprehensive Income |
Preferred
Stock |
Common
Stock |
Additional Paid-in
Capital |
Common
Stock Held in Treasury, at Cost |
Noncontrolling
Interest |
|||||||||||||||||||||||
|
Successor Ambac
|
|||||||||||||||||||||||||||||||
|
Balance at January 1, 2014
|
$
|
978,422
|
|
$
|
505,219
|
|
$
|
11,661
|
|
$
|
—
|
|
$
|
450
|
|
$
|
185,672
|
|
$
|
(19
|
)
|
$
|
275,439
|
|
|||||||
|
Total comprehensive income
|
691,884
|
|
484,071
|
|
208,622
|
|
—
|
|
—
|
|
—
|
|
—
|
|
(809
|
)
|
|||||||||||||||
|
Stock-based compensation
|
3,450
|
|
—
|
|
—
|
|
—
|
|
—
|
|
3,450
|
|
—
|
|
—
|
|
|||||||||||||||
|
Cost of shares acquired
|
(37
|
)
|
—
|
|
—
|
|
—
|
|
—
|
|
—
|
|
(37
|
)
|
—
|
|
|||||||||||||||
|
Warrants exercised
|
16
|
|
—
|
|
—
|
|
—
|
|
—
|
|
16
|
|
—
|
|
—
|
|
|||||||||||||||
|
Balance at December 31, 2014
|
$
|
1,673,735
|
|
$
|
989,290
|
|
$
|
220,283
|
|
$
|
—
|
|
$
|
450
|
|
$
|
189,138
|
|
$
|
(56
|
)
|
$
|
274,630
|
|
|||||||
|
Successor Ambac
|
|||||||||||||||||||||||||||||||
|
Balance at May 1, 2013
|
$
|
275,415
|
|
$
|
—
|
|
$
|
—
|
|
$
|
—
|
|
$
|
—
|
|
$
|
—
|
|
$
|
—
|
|
$
|
275,415
|
|
|||||||
|
Issuance of new equity in connection with emergence from Chapter 11
|
185,000
|
|
—
|
|
—
|
|
—
|
|
450
|
|
184,550
|
|
—
|
|
—
|
|
|||||||||||||||
|
Balance at May 1, 2013
|
460,415
|
|
—
|
|
—
|
|
—
|
|
450
|
|
184,550
|
|
—
|
|
275,415
|
|
|||||||||||||||
|
Total comprehensive income
|
516,904
|
|
505,219
|
|
11,661
|
|
—
|
|
—
|
|
—
|
|
—
|
|
24
|
|
|||||||||||||||
|
Stock-based compensation
|
1,106
|
|
—
|
|
—
|
|
—
|
|
—
|
|
1,106
|
|
—
|
|
—
|
|
|||||||||||||||
|
Cost of shares acquired
|
(19
|
)
|
—
|
|
—
|
|
—
|
|
—
|
|
—
|
|
(19
|
)
|
—
|
|
|||||||||||||||
|
Warrants exercised
|
16
|
|
—
|
|
—
|
|
—
|
|
—
|
|
16
|
|
—
|
|
—
|
|
|||||||||||||||
|
Balance at December 31, 2013
|
$
|
978,422
|
|
$
|
505,219
|
|
$
|
11,661
|
|
$
|
—
|
|
$
|
450
|
|
$
|
185,672
|
|
$
|
(19
|
)
|
$
|
275,439
|
|
|||||||
|
Predecessor Ambac
|
|||||||||||||||||||||||||||||||
|
Balance at January 1, 2013
|
$
|
(3,246,967
|
)
|
$
|
(6,297,264
|
)
|
$
|
625,385
|
|
$
|
—
|
|
$
|
3,080
|
|
$
|
2,172,027
|
|
$
|
(410,755
|
)
|
$
|
660,560
|
|
|||||||
|
Total comprehensive income
|
3,522,382
|
|
3,349,049
|
|
174,875
|
|
—
|
|
—
|
|
—
|
|
—
|
|
(1,542
|
)
|
|||||||||||||||
|
Stock-based compensation
|
(60
|
)
|
(60
|
)
|
—
|
|
—
|
|
—
|
|
—
|
|
—
|
|
—
|
|
|||||||||||||||
|
Shares issued under equity plans
|
60
|
|
—
|
|
—
|
|
—
|
|
—
|
|
—
|
|
60
|
|
—
|
|
|||||||||||||||
|
Elimination of Predecessor Ambac Shareholder equity accounts and noncontrolling interest adjustment
|
—
|
|
2,948,275
|
|
(800,260
|
)
|
—
|
|
(3,080
|
)
|
(2,172,027
|
)
|
410,695
|
|
(383,603
|
)
|
|||||||||||||||
|
Balance at April 30, 2013
|
$
|
275,415
|
|
$
|
—
|
|
$
|
—
|
|
$
|
—
|
|
$
|
—
|
|
$
|
—
|
|
$
|
—
|
|
$
|
275,415
|
|
|||||||
|
Predecessor Ambac
|
|||||||||||||||||||||||||||||||
|
Balance at January 1, 2012
|
$
|
(3,149,533
|
)
|
$
|
(6,039,922
|
)
|
$
|
463,259
|
|
$
|
—
|
|
$
|
3,080
|
|
$
|
2,172,027
|
|
$
|
(411,419
|
)
|
$
|
663,442
|
|
|||||||
|
Total comprehensive income
|
(97,434
|
)
|
(256,678
|
)
|
162,126
|
|
—
|
|
—
|
|
—
|
|
—
|
|
(2,882
|
)
|
|||||||||||||||
|
Stock-based compensation
|
(664
|
)
|
(664
|
)
|
—
|
|
—
|
|
—
|
|
—
|
|
—
|
|
—
|
|
|||||||||||||||
|
Shares issued under equity plans
|
664
|
|
—
|
|
—
|
|
—
|
|
—
|
|
—
|
|
664
|
|
—
|
|
|||||||||||||||
|
Balance at December 31, 2012
|
$
|
(3,246,967
|
)
|
$
|
(6,297,264
|
)
|
$
|
625,385
|
|
$
|
—
|
|
$
|
3,080
|
|
$
|
2,172,027
|
|
$
|
(410,755
|
)
|
$
|
660,560
|
|
|||||||
See accompanying Notes to Consolidated Financial Statements
79
AMBAC FINANCIAL GROUP, INC. AND SUBSIDIARIES
|
Successor Ambac
|
Predecessor Ambac
|
|||||||||||||||
|
Period from May 1
|
Period from January 1
|
|||||||||||||||
|
Year Ended
|
through
|
through
|
Year Ended
|
|||||||||||||
|
(Dollars in thousands)
|
December 31, 2014
|
December 31, 2013
|
April 30, 2013
|
December 31, 2012
|
||||||||||||
|
Cash flows from operating activities:
|
||||||||||||||||
|
Net income (loss) attributable to common shareholders
|
$
|
484,071
|
|
$
|
505,219
|
|
$
|
3,349,049
|
|
$
|
(256,678
|
)
|
||||
|
Noncontrolling interest in subsidiaries’ earnings
|
(375
|
)
|
(417
|
)
|
(1,771
|
)
|
(2,676
|
)
|
||||||||
|
Net income (loss)
|
483,696
|
|
504,802
|
|
3,347,278
|
|
(259,354
|
)
|
||||||||
|
Adjustments to reconcile net income to net cash used in operating activities:
|
||||||||||||||||
|
Depreciation and amortization
|
3,582
|
|
1,980
|
|
974
|
|
3,066
|
|
||||||||
|
Amortization of bond premium and discount
|
(79,183
|
)
|
(34,698
|
)
|
(60,146
|
)
|
(189,402
|
)
|
||||||||
|
Reorganization items
|
211
|
|
493
|
|
(2,745,180
|
)
|
7,215
|
|
||||||||
|
Share-based compensation
|
3,450
|
|
1,106
|
|
—
|
|
—
|
|
||||||||
|
Deferred income taxes
|
(120
|
)
|
619
|
|
(6
|
)
|
1,586
|
|
||||||||
|
Current income taxes
|
4,963
|
|
5,148
|
|
(101,188
|
)
|
1,069
|
|
||||||||
|
Deferred acquisition costs
|
—
|
|
—
|
|
14,207
|
|
24,350
|
|
||||||||
|
Unearned premiums, net
|
(559,642
|
)
|
(205,951
|
)
|
(172,549
|
)
|
(635,346
|
)
|
||||||||
|
Losses and loss expenses, net
|
(1,650,090
|
)
|
(86,838
|
)
|
(43,284
|
)
|
(261,304
|
)
|
||||||||
|
Ceded premiums payable
|
(10,526
|
)
|
(7,044
|
)
|
(2,059
|
)
|
(21,028
|
)
|
||||||||
|
Investment income due and accrued
|
12,648
|
|
298
|
|
1,781
|
|
5,586
|
|
||||||||
|
Premium receivables
|
452,414
|
|
78,610
|
|
88,990
|
|
407,858
|
|
||||||||
|
Accrued interest payable
|
9,322
|
|
58,046
|
|
23,953
|
|
89,276
|
|
||||||||
|
Amortization of insurance intangible assets
|
151,830
|
|
99,658
|
|
—
|
|
—
|
|
||||||||
|
Net mark-to-market (gains) losses
|
(20,863
|
)
|
(183,091
|
)
|
63,828
|
|
22,932
|
|
||||||||
|
Net realized investment gains
|
(58,777
|
)
|
(4,467
|
)
|
(53,305
|
)
|
(72,101
|
)
|
||||||||
|
Gains on extinguishment of debt
|
74,724
|
|
—
|
|
—
|
|
177,580
|
|
||||||||
|
Other-than-temporary impairment charges
|
25,794
|
|
46,764
|
|
467
|
|
5,990
|
|
||||||||
|
Variable interest entity activities
|
32,212
|
|
48,623
|
|
(426,566
|
)
|
(27,777
|
)
|
||||||||
|
Other, net
|
152,846
|
|
(137,150
|
)
|
62,122
|
|
105,906
|
|
||||||||
|
Net cash (used in) provided by operating activities
|
(971,509
|
)
|
186,908
|
|
(683
|
)
|
(613,898
|
)
|
||||||||
|
Cash flows from investing activities:
|
||||||||||||||||
|
Proceeds from sales of bonds
|
3,125,864
|
|
942,943
|
|
310,916
|
|
592,672
|
|
||||||||
|
Proceeds from matured bonds
|
1,402,904
|
|
613,345
|
|
307,472
|
|
1,109,468
|
|
||||||||
|
Purchases of bonds
|
(2,937,782
|
)
|
(2,213,116
|
)
|
(286,633
|
)
|
(798,740
|
)
|
||||||||
|
Proceeds from sales of other invested assets
|
49,739
|
|
90,067
|
|
—
|
|
—
|
|
||||||||
|
Purchases of other invested assets
|
(133,928
|
)
|
(136,986
|
)
|
(164,368
|
)
|
—
|
|
||||||||
|
Change in short-term investments
|
(88,946
|
)
|
455,495
|
|
(64,956
|
)
|
121,413
|
|
||||||||
|
Loans, net
|
465
|
|
1,103
|
|
1,920
|
|
9,793
|
|
||||||||
|
Change in swap collateral receivable
|
(153,853
|
)
|
7,849
|
|
(8,863
|
)
|
43,635
|
|
||||||||
|
Other, net
|
10,690
|
|
(8,210
|
)
|
19,828
|
|
(40,261
|
)
|
||||||||
|
Net cash provided by (used in) investing activities
|
1,275,153
|
|
(247,510
|
)
|
|
115,316
|
|
1,037,980
|
|
|||||||
|
Cash flows from financing activities:
|
||||||||||||||||
|
Proceeds from the sale of Junior Surplus Notes of the Segregated Account
|
224,262
|
|
—
|
|
—
|
|
—
|
|
||||||||
|
Paydowns of variable interest entity secured borrowing
|
—
|
|
(9,069
|
)
|
(5,519
|
)
|
(21,012
|
)
|
||||||||
|
Proceeds from warrant exercise
|
16
|
|
16
|
|
—
|
|
—
|
|
||||||||
|
Payments for investment agreement draws
|
(199,970
|
)
|
(5,926
|
)
|
—
|
|
(186,786
|
)
|
||||||||
|
Payments for extinguishment of long-term debt
|
(331,419
|
)
|
—
|
|
—
|
|
(188,446
|
)
|
||||||||
|
Net cash (used in) financing activities
|
(307,111
|
)
|
(14,979
|
)
|
(5,519
|
)
|
(396,244
|
)
|
||||||||
|
Net cash flow
|
(3,467
|
)
|
(75,581
|
)
|
109,114
|
|
27,838
|
|
||||||||
|
Cash and cash equivalents at beginning of period
|
77,370
|
|
152,951
|
|
43,837
|
|
15,999
|
|
||||||||
|
Cash and cash equivalents end of period
|
$
|
73,903
|
|
$
|
77,370
|
|
$
|
152,951
|
|
$
|
43,837
|
|
||||
|
Supplemental disclosure of cash flow information:
|
||||||||||||||||
|
Cash paid during the period for:
|
||||||||||||||||
|
Income taxes
|
$
|
4,400
|
|
$
|
1,656
|
|
$
|
102,129
|
|
$
|
1,493
|
|
||||
|
Interest on variable interest entity secured borrowing
|
—
|
|
170
|
|
276
|
|
1,572
|
|
||||||||
|
Interest on investment agreements
|
518
|
|
832
|
|
444
|
|
4,824
|
|
||||||||
|
Interest on surplus notes
|
82,168
|
|
—
|
|
—
|
|
—
|
|
||||||||
|
Cash payments related to reorganization items:
|
||||||||||||||||
|
Professional fees paid for services rendered in connection with the
Chapter 11 proceeding
|
272
|
|
15,546
|
|
3,860
|
|
9,141
|
|
||||||||
See accompanying Notes to Consolidated Financial Statements
80
AMBAC FINANCIAL GROUP, INC. AND SUBSIDIARIES
Notes to Consolidated Financial Statements
(Dollar Amounts in Thousands, Except Share Amounts)
1. BACKGROUND AND BUSINESS DESCRIPTION
Ambac Financial Group, Inc. (“Ambac” or the “Company”), headquartered in New York City, is a financial services holding company incorporated in the state of Delaware on
April 29, 1991
. On May 1, 2013 (the “Effective Date”), Ambac emerged from Chapter 11 bankruptcy protection when the Second Modified Fifth Amended Plan of Reorganization of Ambac Financial Group, Inc. (the “Reorganization Plan”) became effective. On December 26, 2013, the United States Bankruptcy Court for the Southern District of New York (the “Bankruptcy Court”) entered an order of final decree closing Ambac’s Chapter 11 case. Ambac filed a voluntary petition for relief under Chapter 11 of the United States Bankruptcy Code (the “Bankruptcy Code”) in the Bankruptcy Court on November 8, 2010 as a result of losses incurred since the beginning of the financial crisis in 2007.
Ambac has
two
reportable business segments: Financial Guarantee and Financial Services.
Ambac’s financial guarantee business segment is conducted through its primary operating subsidiary, Ambac Assurance Corporation (“Ambac Assurance”), and its wholly owned subsidiary, Ambac Assurance UK Limited (“Ambac UK”). Insurance policies issued by Ambac Assurance and Ambac UK generally guarantee payment when due of the principal and interest on the obligations guaranteed. Ambac Assurance also has another wholly-owned financial guarantee subsidiary, Everspan Financial Guarantee Corp. (“Everspan”), which has been in runoff since its acquisition in 1997. The deterioration of Ambac Assurance’s financial condition resulting from losses in its insured portfolio since 2007 has prevented Ambac Assurance from being able to write new business. An inability to write new business has and will continue to negatively impact Ambac’s future operations and financial results. Ambac Assurance’s ability to pay dividends and, as a result, Ambac’s liquidity, have been significantly restricted by the deterioration of Ambac Assurance’s financial condition, by the rehabilitation of the Segregated Account and by the terms of the Settlement Agreement, dated as of June 7, 2010 (the "Settlement Agreement"), by and among Ambac Assurance, Ambac Credit Products LLC (“ACP”), Ambac and certain counterparties to credit default swaps with ACP that were guaranteed by Ambac Assurance. Ambac Assurance is also restricted in its ability to pay dividends pursuant to regulatory restrictions, the terms of its Auction Market Preferred Shares, and the terms of agreements entered into with the Segregated Account. It is highly unlikely that Ambac Assurance will be able to make dividend payments to Ambac for the foreseeable future.
Ambac’s financial services business segment is conducted through subsidiaries of Ambac Assurance, which provide financial and investment products, including investment agreements, funding conduits and interest rate swaps, principally to the clients of its financial guarantee business. Ambac Assurance insured all of the obligations of its financial services subsidiaries. These businesses are in active runoff, which is being effectuated by transaction terminations, settlements, and scheduled amortization of contracts. The Financial Services business also maintains interest rate derivatives to mitigate exposure to floating rate insured obligations in the Financial Guarantee segment.
Following emergence from bankruptcy, Ambac’s primary goal is to maximize shareholder value through executing the following key strategies:
|
•
|
Increasing the value of its investment in Ambac Assurance by actively managing its assets and liabilities with a focus on maximizing risk-adjusted investment portfolio returns and mitigating or remediating losses on poorly performing insured transactions through executing policy commutations, repurchasing liabilities at a discount, pursuing recoveries of losses through litigation and the exercise of contractual and legal rights, restructuring transactions, and other means; and
|
|
•
|
Selectively exploring opportunities to grow and diversify Ambac, which may include the development or acquisition of financial services businesses such as advisory, asset servicing, asset management and/or insurance.
|
As part of its asset/liability management strategy, Ambac Assurance is considering the possibility of entering into transactions whereby it would monetize certain assets and/or restructure or exchange its outstanding debt and insurance obligations.
Although we are exploring new business opportunities for Ambac, no assurance can be given that we will be able to identify or execute the acquisition or development of any new business. In addition, there can be no assurance that we will be able to generate or obtain the financial and other resources that may be required to finance the acquisition or development of any new business. Due to these factors, as well as uncertainties relating to the ability of Ambac Assurance to deliver value to Ambac, the value of our securities is speculative.
The execution of Ambac’s strategy to increase the value of its investment in Ambac Assurance is subject to the authority of the Rehabilitator (as defined below) to control the management of the Segregated Account (as defined below). In exercising such authority, the Rehabilitator will act for the benefit of policyholders, and will not take into account the interests of Ambac. Similarly, by operation of the contracts executed in connection with the establishment, and subsequent rehabilitation, of the Segregated Account, the Rehabilitator retains rights to oversee and approve certain actions taken by or in respect of Ambac Assurance. This oversight by the Rehabilitator could impair Ambac’s ability to execute certain of its strategies. Ambac Assurance's ability to commute policies or purchase liabilities may also be limited by available liquidity.
81
As a result of uncertainties associated with the aforementioned oversight by the Rehabilitator of the Segregated Account, management has concluded that there is substantial doubt about Ambac's ability to continue as a going concern. Ambac’s financial statements as of and for the periods ending
December 31, 2014 and 2013
, respectively, are prepared assuming Ambac continues as a going concern and do not include any adjustment that might result from its inability to continue as a going concern.
Chapter 11 Reorganization of Ambac:
The Reorganization Plan reflects a resolution of certain issues (the “Amended Plan Settlement”) among the Company, the statutory committee of creditors appointed by the United States Trustee on November 17, 2010 (the “Creditors’ Committee”), Ambac Assurance, the Segregated Account and OCI related to (i) the net operating loss carry forwards (“NOLs”) of the consolidated tax group of which the Company is the parent and Ambac Assurance is a member (the “Ambac Consolidated Group”), (ii) certain tax refunds received in respect thereof and (iii) the sharing of expenses between the Company and Ambac Assurance. The terms of the Amended Plan Settlement are memorialized in that certain Mediation Agreement dated September 21, 2011 (the “Mediation Agreement”) among such parties. In accordance with the Amended Plan Settlement, the Company shall use its best efforts to preserve the use of NOLs as contemplated by the Amended Plan Settlement.
Pursuant to the Amended Plan Settlement, (i) the Company, Ambac Assurance and certain affiliates entered into an amended and restated tax sharing agreement (the “Amended TSA”), (ii) the Company, Ambac Assurance and certain affiliates entered into an expense sharing and cost allocation agreement (the “Cost Allocation Agreement”) and (iii) the Company, Ambac Assurance, the Segregated Account and OCI entered into an amendment of the Cooperation Agreement (as defined below) (the “Cooperation Agreement Amendment”).
The Amended TSA addresses certain intercompany tax issues including, but not limited to, the allocation and use of NOLs by the Company, Ambac Assurance and their respective subsidiaries. Refer to
Note 16.
Income Taxes
for further discussion of the Amended TSA.
The Cost Allocation Agreement provides for the allocation of costs and expenses among the Company, Ambac Assurance and certain affiliates. Additionally, the Cost Allocation Agreement requires Ambac Assurance to reimburse reasonable operating expenses incurred by the Company, subject to an annual
$5,000
limit until March 2017. From March 2017 such expense reimbursement provision can be extended in the sole discretion of the rehabilitator subject to a
$4,000
per year limit.
The Cooperation Agreement Amendment provides for the Rehabilitator to have certain rights as described below.
As provided for in the Reorganization Plan, Ambac’s Amended and Restated Certificate of Incorporation and revised Bylaws became effective on the Effective Date. On February 28, 2014, Ambac’s Bylaws were amended, primarily to (i) revise the advance notice provisions for stockholders proposing business or nominating directors; (ii) add procedural and disclosure requirements for stockholders proposing business or nominating directors, calling special meetings or taking action by written consent; (iii) add a forum selection clause specifying state or federal courts located in the State of Delaware as the sole and exclusive forum for proceedings which, among other things, (A) are brought on behalf of Ambac, (B)claim breaches of fiduciary duty, (C) involve claims arising under Ambac’s governing documents or the Delaware General Corporation Law, or (D) are governed by the internal affairs doctrine; and (iv) update other bylaw provisions, including revisions related to the use of electronic communication technologies. Pursuant to the Amended and Restated Certificate of Incorporation of Ambac, Ambac is authorized to issue
150,000,000
shares of capital stock, consisting of
130,000,000
shares of common stock, par value
$0.01
per share and
20,000,000
shares of preferred stock, par value
$0.01
per share. Pursuant to the Reorganization Plan, Ambac distributed
45,000,000
shares of new common stock on May 1, 2013 and distributed warrants to holders of allowed general unsecured claims and subordinated debt securities, which as of the Effective Date entitled such holders to acquire an additional
5,047,138
shares of new common stock of the Company at an exercise price of
$16.67
per share at any time on or prior to
April 30, 2023
. The new common stock and warrants are listed on NASDAQ and trade under the symbols “AMBC” and “AMBCW,” respectively. All such common stock and warrants were issued without registration under the Securities Act of 1933, as amended or state securities laws, in reliance on Section 1145 of the United States Bankruptcy Code. The common stock of the Company in existence prior to the Effective Date was cancelled on the Effective Date.
Pursuant to the Mediation Agreement, Ambac Assurance transferred
$30,000
(plus accrued interest) from an escrow account to Ambac on the Effective Date. Additionally, the Segregated Account issued a junior surplus note in the amount of
$350,000
to Ambac on the Effective Date in accordance with the Mediation Agreement. On August 28, 2014, Ambac deposited this junior surplus note plus accrued but unpaid interest thereon, into a newly formed Trust in exchange for cash of
$224,262
and a subordinated owner trust certificate (the "Owner Trust Certificate") issued by the Trust in the face amount of
$74,794
. The Trust funded the cash portion of its purchase of the junior surplus note with proceeds of the private placement of
$299,175
face amount of notes to third party investors ("Notes"), which amount equates to approximately
80%
of par plus accrued and unpaid interest on the junior surplus note. The Notes have a final maturity of
August 28, 2039
. Interest on the Notes will accrue at
5.1%
per annum and compound annually on June 7th of each year up to and including the maturity date. Payments on the Notes will be made when and to the extent that the Segregated Account makes payments on the junior surplus note. The Notes must be paid in full before any payments will be made on the Owner Trust Certificate. The Notes and Owner Trust Certificate are non-recourse to Ambac, Ambac Assurance and the Segregated Account, but are collateralized by the junior surplus note. Ambac records the Owner Trust Certificate as an equity investment and will reflect the activities of the non-consolidated Trust within Net investment income on the Consolidated Statements of Total Comprehensive Income (Loss). Refer to
Note 14. Long-term Debt
for the key terms of the junior surplus note.
Ambac’s Amended and Restated Certificate of Incorporation limits voting and transfer rights of stockholders in significant ways. Article IV contains voting restrictions applicable to any person owning at least
10%
of Ambac’s common stock so that such person (including any group consisting of such person and any other person with whom such person or any affiliate or associate of such person has any agreement, contract,
82
arrangement or understanding with respect to acquiring, voting, holding or disposing of Ambac’s common stock) shall not be entitled to cast votes in excess of one vote less than
10%
of the votes entitled to be cast by all common stock holders, except as otherwise approved by OCI.
There are substantial restrictions on the ability to transfer Ambac’s common stock set forth in Article XII of Ambac’s Amended and Restated Certificate of Incorporation. In order to preserve certain tax benefits, subject to limited exceptions, any attempted transfer of common stock shall be prohibited and void to the extent that, as a result of such transfer (or any series of transfers of which such transfer is a part), either (i) any person or group of persons shall become a holder of
5%
or more of the Company’s common stock or (ii) the percentage stock ownership interest in Ambac of any holder of
5%
or more of the Company’s common stock shall be increased (a “Prohibited Transfer”). These restrictions shall not apply to an attempted transfer if the transferor or the transferee obtains the written approval of Ambac’s Board of Directors to such transfer. A purported transferee of a Prohibited Transfer shall not be recognized as a stockholder of Ambac for any purpose whatsoever in respect of the securities which are the subject of the Prohibited Transfer (the “Excess Securities”). Until the Excess Securities are acquired by another person in a transfer that is not a Prohibited Transfer, the purported transferee of a Prohibited Transfer shall not be entitled with respect to such Excess Securities to any rights of stockholders of Ambac, including, without limitation, the right to vote such Excess Securities and to receive dividends or distributions, whether liquidating or otherwise, in respect thereof, if any. Once the Excess Securities have been acquired in a transfer that is not a Prohibited Transfer, the securities shall cease to be Excess Securities. If the Board determines that a transfer of securities constitutes a Prohibited Transfer then, upon written demand by Ambac, the purported transferee shall transfer or cause to be transferred any certificate or other evidence of ownership of the Excess Securities within the purported transferee’s possession or control, together with any distributions paid by Ambac with respect to such Excess Securities, to an agent designated by Ambac. Such agent shall thereafter sell such Excess Securities and the proceeds of such sale shall be distributed as set forth in the Amended and Restated Certificate of Incorporation. If the purported transferee of a Prohibited Transfer has resold the Excess Securities before receiving such demand, such person shall be deemed to have sold the Excess Securities for Ambac’s agent and shall be required to transfer to such agent the proceeds of such sale, which shall be distributed as set forth in the Amended and Restated Certificate of Incorporation.
As of the Effective Date, the Company was generally discharged and released from all pre-Effective Date debts, liabilities, claims, causes of action and interests in accordance with the provisions of the Reorganization Plan. Holders of claims and equity interests are also generally barred from commencing or continuing any action or proceeding relating to such claims, causes of action or interests. The Reorganization Plan also provides for broad exculpation and releases of the Company, Ambac Assurance, the Segregated Account, OCI, the Rehabilitator, the board of directors and board committees of the Company and Ambac Assurance, all individual directors, officers and employees of the Company and Ambac Assurance, the Creditors’ Committee and the individual members thereof, and each of the respective representatives of such parties, for actions or omissions that occurred on or prior to the Effective Date.
Segregated Account of Ambac Assurance Corporation
In March 2010, Ambac Assurance established a Segregated Account pursuant to Wisc. Stat. §611.24 (2) (the “Segregated Account”) to segregate certain segments of Ambac Assurance’s liabilities, and the Office of the Commissioner of Insurance for the State of Wisconsin (“OCI” (which term shall be understood to refer to such office as regulator of Ambac Assurance and to refer to the Commissioner of Insurance for the State of Wisconsin as rehabilitator of the Segregated Account (the “Rehabilitator”), as the context requires)) commenced rehabilitation proceedings in the Dane County, Wisconsin Circuit Court (the “Rehabilitation Court”) with respect to the Segregated Account (the “Segregated Account Rehabilitation Proceedings”) in order to permit OCI to facilitate an orderly run-off and/or settlement of the liabilities allocated to the Segregated Account pursuant to the provisions of the Wisconsin Insurers Rehabilitation and Liquidation Act. Net par exposure as of
December 31, 2014
for policies allocated to the Segregated Account was
$18,808,470
.
The Segregated Account is operated in accordance with a plan of operation (the “Plan of Operation”) and certain operative documents relating thereto (which include the Secured Note (defined below), the Reinsurance Agreement (defined below), the Management Services Agreement, dated as of March 24, 2010, by and between the Segregated Account and Ambac Assurance (the “Management Services Agreement”), the Cost Allocation Agreement and the Cooperation Agreement, dated as of March 24, 2010, by and between the Segregated Account and Ambac Assurance, as amended pursuant to the Cooperation Agreement Amendment (the “Cooperation Agreement”). Pursuant to such operative documents, Ambac Assurance entered into certain covenants for the benefit of the Segregated Account as described below.
Pursuant to the Plan of Operation, Ambac Assurance allocated to the Segregated Account (1) certain policies insuring or relating to credit default swaps; (2) residential mortgage-backed securities (“RMBS”) policies; (3) certain policies insuring debt obligations backed by student loans; and (4) other policies insuring obligations with substantial projected impairments or relating to transactions which have contractual triggers based upon Ambac Assurance’s financial condition or the commencement of rehabilitation, which triggers are potentially damaging (collectively, the “Segregated Account Policies”). The policies described in (4) above include (a) certain types of securitizations, including commercial asset-backed transactions, consumer asset-backed transactions and other types of structured transactions; (b) the policies relating to Las Vegas Monorail Company; (c) policies relating to debt securities purchased by, and the debt securities issued by, Juneau Investments, LLC (“Juneau”), which is a finance company owned by Ambac Assurance; (d) policies relating to leveraged lease transactions; and (e) certain policies relating to interest rate, basis, and/or currency swap or other swap transactions. Ambac Assurance also allocated the following to the Segregated Account: (i) all remediation claims, defenses, offsets, and/or credits (except with respect to recoveries arising from remediation efforts or reimbursement or collection rights), if any, in respect of the Segregated Account Policies, (ii) Ambac Assurance’s limited liability interests in ACP, Ambac Conduit Funding LLC, Aleutian Investments, LLC and Juneau and (iii) all of Ambac Assurance’s liabilities as reinsurer under reinsurance agreements (except for reinsurance assumed from Everspan).
Policy obligations not allocated to the Segregated Account remain in the General Account, and such policies in the General Account are not subject to and, therefore, will not be directly impacted by the Segregated Account Rehabilitation Plan (as defined below).
83
In 2010, Ambac Assurance issued a
$2,000,000
secured note due in
2050
(the “Secured Note”) to the Segregated Account. Interest on the Secured Note accrued at the rate of
4.5%
per annum, and accrued interest was capitalized and added to outstanding principal quarterly. The Segregated Account had the ability to demand payment under the Secured Note from time to time to pay claims and other liabilities. In 2014, the Secured Note, including capitalized interest since the date of issuance, was fully drawn, resulting in a balance of
$0
. Following the exhaustion of the Secured Note, the Segregated Account has the ability to demand payment from time to time under an aggregate excess of loss reinsurance agreement provided by Ambac Assurance (the “Reinsurance Agreement”) to pay claims and other liabilities. In addition, certain operating and administrative costs and expenses of the Segregated Account are now reimbursable by Ambac Assurance pursuant to the Cooperation Agreement. Ambac Assurance secured its obligations under the Secured Note and the Reinsurance Agreement by granting to the Segregated Account a security interest in all of Ambac Assurance’s right, title and interest in (i) installment premiums received in respect of the Segregated Account Policies; (ii) reinsurance premiums received in respect of assumed reinsurance agreements with respect to which the liabilities of Ambac Assurance have been allocated to the Segregated Account; (iii) recoveries under third party reinsurance agreements in respect of the Segregated Account Policies; and (iv) any recoveries arising from remediation efforts or reimbursement or collection rights with respect to policies allocated to the Segregated Account.
Ambac Assurance is not obligated to make payments under the Reinsurance Agreement or Cooperation Agreement if its surplus as regards to policyholders is less than
$100,000
(the “Minimum Surplus Amount”). As long as the surplus as regards to policyholders is not less than the Minimum Surplus Amount, payments by Ambac Assurance to the Segregated Account under the Reinsurance Agreement and Cooperation Agreement are not capped. At
December 31, 2014
, Ambac Assurance’s surplus as regards to policyholders is at the Minimum Surplus Amount and therefore
$149,482
of the Segregated Account’s insurance liabilities were not assumed by Ambac Assurance under the Reinsurance Agreement. In the event that Ambac Assurance does not generate future surplus in the amount of insurance liabilities not assumed under the Reinsurance Agreement, the Segregated Account would experience a shortfall in funds available to pay its liabilities. Any such shortfall would be a consideration for the Rehabilitator in the determination of whether any changes to the Segregated Account Rehabilitation Plan (as defined below) and/or the amount of partial policy claim payments are necessary or appropriate or whether to institute general rehabilitation proceedings against Ambac Assurance.
During the Segregated Account Rehabilitation Proceedings, the Rehabilitator controls the management of the Segregated Account and possesses ultimate decision-making authority with respect to all matters relating to the policies allocated to the Segregated Account. Ambac Assurance provides certain management and administrative services to the Segregated Account and the Rehabilitator pursuant to the Management Services Agreement, including information technology services, credit exposure management, treasury, accounting, tax, management information, risk management, loss management, internal audit services and business continuity services. Services are provided at cost, subject to mutual agreement of the Segregated Account and Ambac Assurance. Either party may terminate the Management Services Agreement for cause upon 120 days written notice (or such shorter period as the Rehabilitator may determine) and the Segregated Account may terminate without cause at any time upon at least 30 days prior notice. If the Segregated Account elects to terminate the Management Services Agreement, Ambac Assurance will not have the right to consent to the replacement services provider.
Pursuant to the Secured Note and the Reinsurance Agreement, Ambac Assurance has made certain covenants to the Segregated Account, including covenants that Ambac Assurance will not, (i) without the Segregated Account’s consent (not to be unreasonably withheld), amend its investment policies if doing so would have a material adverse effect on Ambac Assurance’s ability to perform its obligations under the Secured Note, the Reinsurance Agreement and the documents relating thereto or under any other material agreement to which it is a party, (ii) without the prior approval of the OCI, directly or indirectly make any distribution to its shareholder or redeem any of its securities and, (iii) without the Segregated Account’s consent (not to be unreasonably withheld), enter into any transaction other than pursuant to the reasonable requirements of Ambac Assurance’s business and which Ambac Assurance reasonably believes are fair and reasonable terms and provisions.
Pursuant to the Cooperation Agreement, Ambac Assurance and the Segregated Account have agreed to certain matters related to decision-making, information sharing, tax compliance and allocation of expenses, including an agreement by Ambac Assurance to reimburse the Segregated Account for specified expenses to the extent not reimbursed under the Secured Note, subject to the Minimum Surplus Amount. Ambac Assurance has made certain covenants to the Segregated Account pursuant to the Cooperation Agreement, including an agreement to not enter into any transaction involving consideration or other proceeds of more than
$5,000
(or such higher amount as determined by the Rehabilitator) without the Segregated Account’s prior written consent (other than policy claim payments made in the ordinary course of business and investments in accordance with Ambac Assurance’s investment policy), and providing the Segregated Account with an annual operating expense budget for Ambac Assurance and its subsidiaries, as well as quarterly analyses of variances. The Cooperation Agreement also addresses Ambac Assurance’s rights in the event Ambac Assurance is no longer the management and administrative services provider to the Segregated Account as described above. The Cooperation Agreement Amendment made each of the Company and the Rehabilitator a party to the Cooperation Agreement and provides the Rehabilitator with certain additional approval rights with respect to (a) the tax positions taken by the Company in its consolidated tax return; (b) the acceptance by Ambac Assurance of the repayment of intercompany loans or the modification of the terms thereof; (c) changes by Ambac Assurance in the assumptions or vendors utilized in determining loss reserves determined in accordance with Statutory Accounting Principles; and (d) changes to Ambac Assurance’s investment policy and transfer of the investment management function for Ambac Assurance’s investment portfolio.
On October 8, 2010, OCI filed a plan of rehabilitation for the Segregated Account (the “Segregated Account Rehabilitation Plan”) in the Rehabilitation Court. The Rehabilitation Court confirmed the Segregated Account Rehabilitation Plan on January 24, 2011, although it did not become effective at such time. The confirmed Segregated Account Rehabilitation Plan also made permanent the injunctions issued by the Rehabilitation Court on March 24, 2010. On June 4, 2012, the Rehabilitation Court approved a motion made by the Rehabilitator to make partial interim policy claim payments to Segregated Account policyholders. In accordance with such approval, on August 1, 2012, the Rehabilitator promulgated Rules Governing the Submission, Processing and Partial Payment of Policy Claims in accordance with the June 4, 2012 Interim
84
Cash Payment Order (the “Policy Claim Rules”). Pursuant to the Policy Claim Rules, effective from August 1, 2012, holders of policies allocated to the Segregated Account were allowed to submit policy claims for review and partial payment equating to
25%
of the permitted policy claim amount, and on or about September 20, 2012, the Segregated Account commenced paying
25%
of each permitted policy claim that arose since the commencement of the Segregated Account Rehabilitation Proceedings.
On July 11, 2013 the Rehabilitator filed a motion with the Rehabilitation Court seeking approval from the Rehabilitation Court for the Segregated Account to make cash payments in excess of
25%
of the permitted policy claim amount (“Supplemental Payments”) with respect to certain policies (the “SP Policies”) so that cash flow in the related securitization trusts that would have been available to reimburse Ambac Assurance had it paid claims in full under such policies is not diverted to uninsured holders who would not have received such cash flow if claims had been paid in full. Without making such Supplemental Payments, Ambac Assurance would likely realize lower levels of reimbursements and subrogation recoveries as cash flow that would have been available for the benefit of Ambac Assurance in relation to the SP Policies would be lost to such uninsured holders. A hearing on such motion was held on August 2, 2013, following which the Rehabilitation Court granted such motion and entered an order permitting Supplemental Payments to be made with respect to the SP Policies. As a result, the Segregated Account has been making Supplemental Payments on SP Policies since August 2013. On February 13, 2014, the Rehabilitator also received approval from the Rehabilitation Court for the Rehabilitator and the Segregated Account to disburse settlement proceeds from RMBS remediation claims as permitted policy claim payments, with such distributions to include (i) paying claims payments in excess of the then applicable claims cash payment percentage, and/or (ii) paying all or portions of unpaid permitted policy claims (such policy claim payments, “Special Policy Payments”).
On June 11, 2014, the Rehabilitation Court approved amendments to the Segregated Account Rehabilitation Plan that had been proposed by the Rehabilitator, and the Segregated Account Rehabilitation Plan, as amended, became effective on June 12, 2014. The amendments to the Segregated Account Rehabilitation Plan primarily modified the mechanism for handling claims. Instead of the combination of cash payments and interest-bearing surplus notes originally contemplated by the Segregated Account Rehabilitation Plan, under the amended Segregated Account Rehabilitation Plan holders of permitted policy claims have received and will receive an initial interim cash payment for a portion of such policy claim (“Interim Payment”), together with the right to receive a deferred payment equal to the balance of the unpaid policy claim, as may be adjusted from time to time pursuant to the terms of the amended Segregated Account Rehabilitation Plan (“Deferred Amount”). Payments of Deferred Amounts will be made at such times as the Rehabilitator deems appropriate in his sole discretion. The Segregated Account will also establish junior deferred amounts (“Junior Deferred Amounts”) with respect to permitted general claims instead of issuing junior surplus notes to the holders of such claims as contemplated under the original Segregated Account Rehabilitation Plan.
Under the amended Segregated Account Rehabilitation Plan, Deferred Amounts and Junior Deferred Amounts generally accrue and compound interest at an annual effective rate of
5.1%
. However, in the case of insured bonds whose outstanding principal balance is not reduced by the unpaid portion of permitted policy claims (such bonds, “Undercollateralized Bonds”), the
5.1%
effective annual interest rate on the Deferred Amount will be reduced by the bond interest rate applicable to such Undercollateralized Bonds. In the case of permitted policy claims relating to transactions that pay monthly, interest will begin to accrue on Deferred Amounts from the first distribution date (under the transaction documents for the relevant bond) after the date on which the Interim Payment in respect of such permitted policy claim was made. For permitted policy claims relating to transactions that do not pay monthly, interest will begin to accrue on Deferred Amounts from the first Payment Date (as defined in the Segregated Account Rehabilitation Plan, as amended) to occur after the date on which the Interim Payment in respect of such permitted policy claim was made.
Following the effective date of the Segregated Account Rehabilitation Plan, as amended, the percentage of the initial cash Interim Payment for permitted policy claims increased from
25%
to
45%
with effect from July 21, 2014. As with previously permitted policy claims, the remaining portion of the unpaid permitted policy claims (in this case,
55%
) will remain outstanding as Deferred Amounts and, subject to the adjustment for Undercollateralized Bonds, will accrue interest at
5.1%
per annum. These Deferred Amounts, together with interest thereon, may be paid from time to time in the future at the sole discretion of the Rehabilitator.
A portion of Deferred Amounts outstanding as of July 20, 2014 (the “Reconciliation Date”) (together with interest thereon), if still outstanding, was paid on December 22, 2014 (the "Deferred Payment Date") in accordance with the Segregated Account Rehabilitation Plan, as amended, such that those policyholders that received
25%
(and not 45%) cash Interim Payments in respect of their permitted policy claims were generally entitled to receive equalizing payments in cash of
26.67%
of their Deferred Amounts (including accrued interest thereon) outstanding as of the Reconciliation Date. Policyholders were entitled to receive an equalizing payment of their Deferred Amounts equal to the lower of (i) their outstanding Deferred Amounts on December 22, 2014, and (ii)
26.67%
of their Deferred Amounts as of the Reconciliation Date, even if they had received a Supplemental Payment and/or a Special Policy Payment. The aggregate amount of equalizing payments for Deferred Amounts (including interest thereon) paid on the Deferred Payment Date was $
1,137,471
.
In addition, the Segregated Account was required, pursuant to the terms of the amended Segregated Account Rehabilitation Plan, to early redeem a portion of its surplus notes (excluding junior surplus notes) on or about the Deferred Payment Date. The redemption amount of the Segregated Account surplus notes was equal to
26.67%
of the sum of par and accrued interest on such Segregated Account surplus notes, in each case, outstanding as at the Reconciliation Date. Pursuant to the terms of the Settlement Agreement, Ambac Assurance is also required to make a proportionate redemption of its surplus notes when the Segregated Account redeems Segregated Account surplus notes (excluding junior surplus notes). Therefore, the Segregated Account and Ambac Assurance were both required to make redemptions of surplus notes (excluding any junior surplus notes) on or about the Deferred Payment Date in an amount equal to
26.67%
of the sum of par and accrued interest outstanding on such surplus notes as at the Reconciliation Date, which was
$413,587
in respect of those surplus notes owned by third parties. Ambac Assurance, for and on behalf of itself and as the management services provider for the Segregated Account, sought and received the approval of the Commissioner of Insurance of the State of Wisconsin to effect these redemptions of surplus notes on November 20, 2014, rather than the Deferred Payment Date, to save interest expense. Such approval was granted on October 13, 2014.
85
2. BASIS OF PRESENTATION AND SIGNIFICANT ACCOUNTING POLICIES
Ambac’s consolidated financial statements have been prepared on the basis of U.S. generally accepted accounting principles (“GAAP”). The preparation of financial statements in conformity with GAAP requires management to make estimates and assumptions that affect the reported amounts of assets, liabilities, revenues, expenses and disclosures of contingent assets and liabilities. Such estimates that are particularly susceptible to change are used in connection with certain fair value measurements, the evaluation of other than temporary impairments on investments, loss reserves for non-derivative insurance policies, the evaluation of the need for an impairment of goodwill or valuation allowance on the deferred tax asset, any of which individually could be material.
Reorganization:
Entities operating in bankruptcy and expecting to reorganize under Chapter 11 of the Bankruptcy Code are subject to the additional accounting and financial reporting guidance under the Reorganization Topic of the Accounting Standards Codification (the “ASC”). While the Reorganization Topic of the ASC provides specific guidance for certain matters, other portions of U.S. GAAP continue to apply so long as the guidance does not conflict with the Reorganization Topic of the ASC. This accounting literature provides guidance for periods subsequent to a Chapter 11 filing, among other things, the presentation of liabilities that are and are not subject to compromise pursuant to the bankruptcy proceedings, as well as the treatment of interest expense and presentation of costs associated with the proceedings. For the purpose of presenting an entity’s financial condition, the financial statements for periods including and after filing the Chapter 11 petition shall distinguish transactions and events that are directly associated with the reorganization from the ongoing operations of the business.
Under the Reorganization Topic of the ASC, the Company determined that fresh start financial statement reporting was to be applied upon our emergence from Chapter 11 because (i) the reorganization value (further described in
Note 3. Fresh Start Financial Statement Reporting
) of the emerging entity was less than total post-petition liabilities and allowed claims, and (ii) the holders of existing voting shares immediately before the confirmation of the Reorganization Plan received less than
50%
of the voting shares of the emerging entity. Specifically, fresh start reporting was applied upon confirmation of the Reorganization Plan by the Bankruptcy Court and the satisfaction of the remaining material contingencies necessary to complete implementation of the Reorganization Plan. All conditions required for the adoption of fresh start reporting were satisfied by the Company on April 30, 2013 (“Fresh Start Reporting Date”) when Ambac executed a closing agreement with the United States Internal Revenue Service (the "IRS") to conclude the settlement of a dispute. As such, fresh start financial statement reporting ("Fresh Start") was adopted by the Company on April 30, 2013, incorporating, among other things, the discharge of debt obligations, issuance of new common stock and fair value adjustments. Adopting Fresh Start results in a new reporting entity with no beginning retained earnings or accumulated deficit. For periods after the Fresh Start Reporting Date, the Company will be referred to as Successor Ambac, whereas for all periods as of and preceding the Fresh Start Reporting Date, the Company will be referred to as Predecessor Ambac. Presentation of information for Successor Ambac represents the financial position and results of operations of Successor Ambac and is not comparable to Predecessor Ambac financial statements. The implementation of fresh start reporting is further described in
Note 3 - Fresh Start Financial Statement Reporting.
Reorganization items:
Professional advisory fees and other costs directly associated with our reorganization are reported separately as reorganization items pursuant to the Reorganizations Topic of the ASC. Reorganization items also include adjustments to reflect the carrying value of certain pre-petition liabilities at their allowable claim amounts, gain on the settlement of liabilities subject to compromise and fresh start reporting adjustments. The reorganization items in the Consolidated Statements of Total Comprehensive Income (Loss) consisted of the following items:
|
Successor Ambac
|
Predecessor Ambac
|
|||||||||||||||
|
Period from May 1
|
Period from January 1
|
|||||||||||||||
|
Year Ended
|
through
|
through
|
Year Ended
|
|||||||||||||
|
December 31, 2014
|
December 31, 2013
|
April 30, 2013
|
December 31, 2012
|
|||||||||||||
|
U.S. Trustee fees
|
$
|
7
|
|
$
|
33
|
|
$
|
23
|
|
$
|
50
|
|
||||
|
Professional fees
|
204
|
|
460
|
|
4,483
|
|
7,165
|
|
||||||||
|
Gain from cancellation and satisfaction of Predecessor Ambac debt
|
—
|
|
—
|
|
(1,521,435
|
)
|
—
|
|
||||||||
|
Fresh start reporting adjustments
|
—
|
|
—
|
|
(1,228,251
|
)
|
—
|
|
||||||||
|
Total reorganization items
|
$
|
211
|
|
$
|
493
|
|
$
|
(2,745,180
|
)
|
$
|
7,215
|
|
||||
Ambac Unconsolidated Financial Information:
Financial information of Ambac is presented in Schedule II to this Form 10-K as of
December 31, 2014 and 2013
and for the years ended
December 31, 2014
,
2013
and
2012
. Investments in subsidiaries are accounted for using the equity method of accounting.
Consolidation:
The consolidated financial statements include the accounts of Ambac and all other entities in which Ambac (directly or through its subsidiaries) has a controlling financial interest, including variable interest entities (“VIEs”) for which Ambac or an Ambac subsidiary is deemed the primary beneficiary in accordance with the Consolidation Topic of the ASC. All significant intercompany balances have been eliminated. The usual
86
condition for a controlling financial interest is ownership of a majority of the voting interests of an entity. However, a controlling financial interest may also exist in entities, such as VIEs, through arrangements that do not involve controlling voting interests. The primary beneficiary of a VIE is the party that has both the following characteristics: a) the power to direct the activities of the VIE that most significantly impact the VIE’s economic performance and b) the obligation to absorb losses of the VIE that could potentially be significant to the VIE or the right to receive benefits from the VIE that could potentially be significant to the VIE. An entity that is deemed the primary beneficiary of a VIE is required to consolidate the VIE.
A VIE is an entity: a) that lacks enough equity investment at risk to permit the entity to finance its activities without additional subordinated financial support from other parties; or b) where the group of equity holders does not have: (1) the power, through voting rights or similar rights, to direct the activities of an entity that most significantly impact the entity’s economic performance; (2) the obligation to absorb the entity’s expected losses; or (3) the right to receive the entity’s expected residual returns. The determination of whether a variable interest holder is the primary beneficiary involves performing a qualitative analysis of the VIE that includes, among other factors, its capital structure, contractual terms including the rights of each variable interest holder, the activities of the VIE, whether the variable interest holder has the power to direct the activities of a VIE that most significantly impact the VIE’s economic performance, whether the variable interest holder has the obligation to absorb losses of the VIE that could potentially be significant to the VIE or the right to receive benefits from the VIE that could potentially be significant to the VIE, related party relationships and the design of the VIE. Refer to
Note 4. Special Purpose Entities, including Variable Interest Entities
, for a detailed discussion of Ambac’s involvement in VIEs, Ambac’s methodology for determining whether Ambac is required to consolidate a VIE and the effects of VIEs consolidated.
Goodwill:
At the Fresh Start Reporting Date, we revalued our assets and liabilities to current estimated fair value. The excess reorganization value which could not be attributed to the fair value of specific identified tangible and intangible assets was recorded as goodwill. Pursuant to the Intangibles - Goodwill and Other Topic of the ASC, goodwill is not amortized but is subject to annual impairment testing. We test goodwill for impairment as of October 1
st
of each year. Goodwill is also tested more frequently if indicators of impairment exist for each reporting unit. The Company has an option to first assess qualitative factors, in their totality, to determine whether it is more likely than not that the fair value of a reporting unit is less than its carrying amount as a basis for determining whether it is necessary to perform a goodwill impairment test. If the Company determines that it is more likely than not that the fair value of a reporting unit is less than its carrying amount, then the Company is required to perform the goodwill impairment test. Alternatively, we may bypass this qualitative assessment and perform step one of the goodwill impairment test described below.
Goodwill impairment is determined using a two-step approach. In step one of the goodwill impairment test, the fair value of a reporting unit is compared with its carrying amount, including goodwill. If the fair value is in excess of the carrying amount, including goodwill, the reporting unit’s goodwill is considered not to be impaired. If the carrying amount, including goodwill, of a reporting unit exceeds its fair value, the second step of the goodwill impairment test is performed to measure the amount of impairment loss, if any. In step two of the goodwill impairment test, the implied fair value of a reporting unit’s goodwill is compared with the carrying amount of that goodwill. The implied fair value of goodwill is determined in the same manner as the amount of goodwill recognized in a business combination and is defined as the excess of the fair value of a reporting unit over the fair value of the net assets of a reporting unit. If the carrying amount of goodwill exceeds its implied fair value, an impairment loss is recognized for the excess. If the carrying amount of goodwill is less than its implied fair value, no goodwill impairment is recognized.
Goodwill impairment testing is performed at the reporting unit level. We have identified two reporting units of Ambac: (1) Financial Guarantee, which provides financial guarantees (including credit derivatives) for public finance, structured finance and other obligations; and (2) Financial Services, which provides investment agreements, funding conduits, and interest rate swaps, principally to clients of the financial guarantee business. These reporting units are also the sole operating segments which make up the Financial Guarantee and Financial Services reportable segments, respectively, as further described in
Note 19. Segment Information
. We have assigned assets and liabilities to each reporting unit based on specific identification. In evaluating which reporting units should be assigned goodwill, we considered the sources of Ambac’s estimated enterprise value at the Fresh Start Reporting Date, as further described in
Note 3. Fresh Start Financial Statement Reporting
. Based on that analysis, we have assigned all goodwill recorded at the Fresh Start Reporting Date to the Financial Guarantee reporting unit.
For the
2014
and
2013
annual assessment, we performed step one of the goodwill impairment test for the Financial Guarantee reporting unit. We estimated the fair value of the Financial Guarantee reporting unit using a market approach, which incorporated Ambac’s market capitalization, fair value estimates of noncontrolling interests and an estimated control premium. After completing our annual impairment reviews, we concluded that goodwill is not impaired.
87
The following is a summary of activity in goodwill for the Financial Guarantee reporting unit:
|
Successor Ambac
|
Predecessor Ambac
|
|||||||||||||||
|
Period from May 1
|
Period from January 1
|
|||||||||||||||
|
Year Ended
|
through
|
through
|
Year Ended
|
|||||||||||||
|
December 31, 2014
|
December 31, 2013
|
April 30, 2013
|
December 31, 2012
|
|||||||||||||
|
Beginning balance
|
$
|
514,511
|
|
$
|
—
|
|
$
|
—
|
|
$
|
—
|
|
||||
|
Goodwill recorded in connection with emergence from Chapter 11
|
—
|
|
514,511
|
|
—
|
|
—
|
|
||||||||
|
Accumulated impairment loss
|
—
|
|
—
|
|
—
|
|
—
|
|
||||||||
|
Ending balance
|
$
|
514,511
|
|
$
|
514,511
|
|
$
|
—
|
|
$
|
—
|
|
||||
Restricted Cash:
Cash that we do not have the right to use for general purposes is recorded as restricted cash in our consolidated balance sheets. Restricted cash includes consolidated variable interest entity cash restricted to fund the obligations of the consolidated VIEs.
Net Income Per Share:
Basic net income per share is computed by dividing net income (loss) attributable to common stockholders by the weighted-average number of common shares outstanding, inclusive of unsettled vested restricted stock units. Diluted net income per share is computed by dividing net income (loss) attributable to common stockholders by the weighted-average number of common shares outstanding plus all dilutive potential common shares outstanding during the period. All dilutive potential common shares outstanding consider common stock deliverable pursuant to warrants issued under the Reorganization Plan and those pursuant to stock options and non-vested restricted and performance stock units.
Net Premiums Earned:
Gross premiums are received either upfront (typical of public finance obligations) or in installments (typical of structured finance obligations). For premiums received upfront, an unearned premium revenue (“UPR”) liability is established, which is initially recorded as the cash amount received. For installment premium transactions, a premium receivable asset and offsetting UPR liability is initially established in an amount equal to: (i) the present value of future contractual premiums due (the “contractual” method) or (ii) if the underlying insured obligation is a homogenous pool of assets which are contractually prepayable, the present value of premiums to be collected over the expected life of the transaction (the “expected” method). An appropriate risk-free rate corresponding to the weighted average life of each policy and currency is used to discount the future premiums contractually due or expected to be collected. For example, U.S. dollar exposures are discounted using U.S. Treasury rates while exposures denominated in a foreign currency are discounted using the appropriate risk-free rate for the respective currency. The weighted average risk-free rate at
December 31, 2014 and 2013
, was
2.7%
. and
3.0%
, respectively, and the weighted average period of future premiums used to estimate the premium receivable at
December 31, 2014 and 2013
, was
10.1 years
and
9.6 years
, respectively.
Insured obligations consisting of homogeneous pools for which Ambac uses expected future premiums to estimate the premium receivable and UPR include residential mortgage-backed securities. As prepayment assumptions change for homogenous pool transactions, or if there is an actual prepayment for a “contractual” method installment transaction, the related premium receivable and UPR are adjusted in equal and offsetting amounts with no immediate effect on earnings using new premium cash flows and the then current risk-free rate.
For both upfront and installment premium policies, premium revenues are earned over the life of the financial guarantee contract in proportion to the insured principal amount outstanding at each reporting date (referred to as the level-yield method). For installment paying policies, the premium receivable discount, equating to the difference between the undiscounted future installment premiums and the present value of future installment premiums, is accreted as premiums earned in proportion to the premium receivable balance at each reporting date.
Similar to gross premiums, premiums ceded to reinsurers are paid either upfront or in installments. For premiums paid upfront, a deferred ceded premium asset is established which is initially recorded as the cash amount paid. For installment premiums, a ceded installment premiums payable liability and offsetting deferred ceded premium asset are initially established in an amount equal to: i) the present value of future contractual premiums due or, ii) if the underlying insured obligation is a homogenous pool of assets which are contractually pre-payable, the present value of expected premiums to be paid over the life of the transaction. An appropriate risk-free rate corresponding to the weighted average life of each policy and exposure currency is used to discount the future premiums contractually due or expected to be collected. Premiums ceded to reinsurers reduce the amount of premiums earned by Ambac from its financial guarantee insurance policies. For both up-front and installment premiums, ceded premiums written are primarily recognized in earnings in proportion to and at the same time as the related gross premium revenue is recognized. For premiums paid to reinsurers on an installment basis, Ambac records the present value of future ceding commissions as an offset to ceded premiums payable, using the same assumptions noted above for installment premiums.
When a bond issue insured by Ambac Assurance has been retired, including those retirements due to refundings or calls, any remaining UPR is recognized at that time to the extent the financial guarantee contract is legally extinguished, causing accelerated premium revenue. For installment premium paying transactions, we offset the recognition of any remaining UPR by the reduction of the related premium receivable to zero (as it
88
will not be collected as a result of the retirement), which may cause negative accelerated premium revenue. Certain obligations insured by Ambac have been legally defeased whereby government securities are purchased by the issuer with the proceeds of a new bond issuance, or less frequently with other funds of the issuer, and held in escrow (a pre-refunding). The principal and interest received from the escrowed securities are then used to retire the Ambac-insured obligations at a future date either to their maturity date or a specified call date. Ambac has evaluated the provisions in certain financial guarantee insurance policies issued on legally defeased obligations and determined those insurance policies have not been legally extinguished and, therefore, premium revenue recognition has not been accelerated.
Loss Reserves:
The loss and loss expense reserve (“loss reserve”) policy for financial guarantee insurance relates only to Ambac’s non-derivative insurance business for insurance policies issued to beneficiaries, including VIEs, for which we do not consolidate the VIE. Losses and loss expenses are based upon estimates of the ultimate aggregate losses inherent in the non-derivative financial guarantee portfolio as of the reporting date. The policy for derivative contracts is discussed in “Derivative Contracts” below. A loss reserve is recorded on the balance sheet on a policy-by-policy basis. Loss reserve components of an insurance policy include unpaid claims and the present value ("PV") of expected net cash flows required to be paid under an insurance contract, further described below:
|
•
|
Unpaid claims represent the sum of (i) claims presented and not yet paid for policies allocated to the Segregated Account, including Deferred Amounts (as defined in
Note 1. Background and Business Description
) and (ii) accrued interest on Deferred Amounts (generally at an effective rate of
5.1%
.) as required by the amended Segregated Account Rehabilitation Plan that became effective on June 12, 2014. Refer to
Note 1. Background and Business Description
for further discussion of the amended Segregated Account Rehabilitation Plan. Unpaid claims are measured based on the estimated cost of settling the claims, which is principal plus accrued interest.
|
|
•
|
The PV of expected net cash flows represents the PV of expected cash outflows less the PV of expected cash inflows. Expected cash
outflows
represent future claims to be paid under an insurance contract, including the impact of potential settlement outcomes upon future installment premiums. Expected cash
inflows
represent potential future recoveries.
|
Net cash
outflow
policies represent contracts where the sum of unpaid claims plus the PV of expected cash outflows are greater than the PV of expected cash inflows. For such policies, a “Loss and loss expense reserves” liability is recorded for the sum of: (i) unpaid claims plus (ii) the excess of the PV of expected net cash outflows over the unearned premium reserve. Net cash
inflow
policies represent contracts where losses have been paid, but not yet recovered, such that the PV of expected cash inflows are greater than the sum of unpaid claims plus the PV of expected cash outflows. For such policies, a “Subrogation recoverable” asset is recorded for the difference between (i) the PV of expected net cash inflows and (ii) unpaid claims.
The approaches used to estimate expected future claims and expected future recoveries considers the likelihood of all possible outcomes. The evaluation process for determining expected losses is subject to certain estimates and judgments based on our assumptions regarding the probability of default by the issuer of the insured security, probability of settlement outcomes (which may include commutation settlements, refinancing and/or other settlement outcomes) and expected severity of credits for each insurance contract. Ambac’s loss reserves are based on management’s on-going review of the financial guarantee credit portfolio. Active surveillance of the insured portfolio enables Ambac’s Portfolio Risk Management ("PRM") group to track credit migration of insured obligations from period to period and update internal classifications and credit ratings for each transaction. Non-adversely classified credits are assigned a Class I or Survey List (“SL”) rating while adversely classified credits are assigned a rating of Class IA through Class V. The criteria for an exposure to be assigned an adversely classified credit rating includes the deterioration of an issuer’s financial condition, underperformance of the underlying collateral (for collateral dependent transactions such as mortgage-backed or student loan securitizations), poor performance by the servicer of the underlying collateral and other adverse economic events or trends. The servicer of the underlying collateral of an insured securitization transaction is a consideration in assessing credit quality because the servicer’s performance can directly impact the performance of the related issue. For example, a servicer of a mortgage-backed securitization that does not remain current in its collection loss mitigation efforts could cause an increase in the delinquency and potential default of the underlying obligation. Similarly, loss severities increase when a servicer does not effectively handle loss mitigation activities such as (i) the advancing of delinquent principal and interest and of default related expenses which are deemed to be recoverable by the servicer, (ii) pursuit of loan charge-offs which maximize cash flows from the mortgage loan pool, and (iii) foreclosure and real estate owned disposition strategies and timelines. All credits are assigned risk classifications by the Surveillance Group using the following guidelines:
CLASS I - “Fully Performing - Meets Ambac Criteria with Remote Probability of Claim”
- Credits that demonstrate adequate security and structural protection with a strong capacity to pay interest, repay principal and perform as underwritten. Factors supporting debt service payment and performance are considered unlikely to change and any such change would not have a negative impact upon the fundamental credit quality.
SURVEY LIST - “Investigation of Specific Condition or Weakness Underway”
- Credits that require additional analysis to determine if adverse classification is warranted. These credits may lack information or demonstrate a weakness but further deterioration is not expected.
CLASS IA - “Potential Problem with Risks to be Dimensioned”
- Credits that are fully current and monetary default or claims-payment are not anticipated. The payor’s or issuer’s financial condition may be deteriorating or the credits may lack adequate collateral. A structured financing may also evidence weakness in its fundamental credit quality as evidenced by its under-performance relative to its modeled projections at underwriting, issues related to the servicer’s ability to perform or questions about the structural integrity of the transaction. While these credits may still retain an investment grade rating, they usually have experienced or are vulnerable to a ratings downgrade. Further investigation is
89
required to dimension and correct any deficiencies. A complete legal review of documents may be required. An action plan should be developed with triggers for future classification changes upward or downward.
CLASS II - “Substandard Requiring Intervention”
- Credits whose fundamental credit quality has deteriorated to the point that timely payment of debt service may be jeopardized by adversely developing trends of a financial, economic, structural, managerial or political nature. No claim payment is currently foreseen but the probability of loss or claim payment over the life of the transaction is now existent (generally 10% or greater probability). Class II credits may be border-line or below investment grade (BBB- to B). Prompt and sustained action must be taken to execute a comprehensive loss mitigation plan and correct deficiencies.
CLASS III - “Doubtful with Clear Potential for Loss”
- Credits whose fundamental credit quality has deteriorated to the point that timely payment of debt service has been or will be jeopardized by adverse trends of a financial, economic, structural, managerial or political nature which, in the absence of positive change or corrective action, are likely to result in a loss. The probability of monetary default or claims paying over the life of the transaction is generally 50% or greater. Full exercise of all available remedial actions is required to avert or minimize losses. Class III credits will generally be rated below investment grade (B to CCC).
CLASS IV - “Imminent Default or Defaulted”
- Monetary default or claim payments have occurred or are expected imminently. Class IV credits are generally rated D.
CLASS V - “Fully Reserved”
- The credit has defaulted and payments have occurred. The claim payments are scheduled and known, reserves have been established to fully cover such claims, and no claim volatility is expected.
The population of credits evaluated in Ambac’s loss reserve process are: (i) all adversely classified credits (Class IA through V) and ii) non-adversely classified credits (Class I and SL) which had an internal Ambac rating downgrade since the transaction’s inception. One of two approaches is then utilized to estimate expected losses to ultimately determine if a loss reserve should be established. The first approach is a statistical expected loss approach, which considers the likelihood of all possible outcomes. The “base case” statistical expected loss is the product of: (i) the par outstanding on the credit; (ii) internally developed historical default information (taking into consideration internal ratings and average life of an obligation); (iii) internally developed loss severities; and (iv) a discount factor. The loss severities and default information are based on rating agency information, are specific to each bond type and are established and approved by senior officers of the PRM group. For certain credit exposures, Ambac’s additional monitoring, loss remediation efforts and probabilities of potential settlement outcomes may provide information relevant to adjust this estimate of “base case” statistical expected losses. Analysts may accept the “base case” statistical expected loss as the best estimate of expected loss or assign multiple probability weighted scenarios to determine an adjusted statistical expected loss that better reflects management’s view of a given transaction’s expected losses, as well as the potential for additional remediation activities (i.e. commutations).
The second approach entails the use of cash-flow based models to estimate expected losses (future claim payments, net of potential recoveries, expected to be paid to the holder of the insured financial obligation). Ambac’s PRM group will consider the likelihood of all possible outcomes and develop appropriate cash flow scenarios. This approach can include the utilization of internal or third party models to project future losses and resultant claim payment estimates. We utilize cash flow models for residential mortgage-backed, student loan, and other exposures. In general, these models use historical performance of the collateral pools in order to then derive future performance characteristics, such as default and voluntary prepayment rates, which in turn determine projected future claim payments. In this approach a probability-weighted expected loss estimate is developed based on assigning probabilities to multiple claim payment scenarios and applying an appropriate discount factor. Additionally, we assign a probability to the issuer’s ability to refinance an insured issue and/or Ambac’s ability to execute a potential settlement (i.e. commutation) of the insurance policy, including the impact on future installment premiums. The commutation scenarios and the related probabilities of occurrence vary by transaction, depending on our view of the likelihood of negotiating such a transaction with issuers and/or investors.
The potential recovery component of expected losses include: (i) recoveries related to contractual breaches of RMBS representations and warranties by transaction sponsors, which is discussed further in the “RMBS Representation and Warranty Subrogation Recoveries” section below, (ii) other subrogation that primarily relates to excess spread within the underlying transaction's cash flow structure, and (iii) other contractual recoveries. Ambac does not include potential recoveries from litigation attributed solely to fraudulent inducement claims in our estimate of representation and warranty subrogation recoveries, since any remedies under such claims would be non-contractual.
The discount factor applied to the statistical expected loss approach is based on a risk-free discount rate corresponding to the remaining expected weighted-average life of the exposure and the exposure currency. For the cash flow scenario approach, discount factors are applied based on a risk-free discount rate term structure and correspond to the date of each respective cash flow payment or recovery and the exposure currency. Discount factors are updated for the current risk-free rate each reporting period.
Ambac establishes loss expense reserves based on our estimate of expected net cash outflows for loss expenses, such as legal and consulting costs.
RMBS Representation and Warranty Subrogation Recoveries:
Ambac records potential future recoveries related to securitized loans in RMBS transactions that breached certain representations and warranties described herein. Generally, the sponsor of an RMBS transaction provided representations and warranties with respect to the securitized loans,
90
including representations with respect to the loan characteristics, the absence of borrower fraud in the underlying loan pools, or other misconduct in the origination process and attesting to the compliance of loans with the prevailing underwriting policies. In such cases, the sponsor of the transaction is contractually obligated to repurchase, cure or substitute collateral for any loan that breaches the representations and warranties. Ambac or its counsel have engaged consultants with significant mortgage underwriting experience to review the underwriting documentation for mortgage loans underlying certain insured RMBS transactions which exhibited exceptionally poor performance. Factors which Ambac believes to be indicative of poor performance include (i) increased levels of early payment defaults, (ii) significant numbers of loan liquidations or charge-offs and resulting high levels of losses, and (iii) rapid elimination of credit protections inherent in the transactions’ structures. With respect to item (ii), “loan liquidations” refers to loans for which the servicer has liquidated the related collateral and the securitization has realized losses on the loan; “charge-offs” refers to loans which have been written off as uncollectible by the servicer, generating no recoveries to the securitization, and may also refer to the unrecovered balance of liquidated loans. In either case, the servicer has taken actions to recover against the collateral, and the securitization has incurred losses to the extent such actions did not result in full repayment of the borrower’s obligations.
Generally, subsequent to the forensic exercise of examining loan files to ascertain whether the loans conformed to the representations and warranties, we submit nonconforming loans for repurchase to the contractual counterparty bearing the repurchase obligation, which is typically the transaction sponsor. To effect a repurchase, depending on the transaction, the sponsor is obligated to repurchase the loan at (a) for loans which have not been liquidated or charged off, either (i) the current unpaid principal balance of the loan, (ii) the current unpaid principal balance plus accrued unpaid interest, or (iii) the current unpaid principal balance plus accrued interest plus unreimbursed servicer advances/expenses and/or trustee expenses resulting from the breach of representations and warranties that trigger the repurchase, and (b) for a loan that has already been liquidated or charged-off, the amount of the realized loss (which in certain cases may exclude accrued unpaid interest). In cases where loans are repurchased by a sponsor, the effect is typically to offset current period losses and then to increase the over-collateralization of the securitization, depending on the extent of loan repurchases and the structure of the securitization. Specifically, the repurchase price is paid by the sponsor to the securitization trust which holds the loan. The cash becomes an asset of the trust, replacing the loan that was repurchased by the sponsor. On a monthly basis the cash received related to loan repurchases by the sponsor is aggregated with cash collections from the underlying mortgages and applied in accordance with the trust indenture payment waterfall. This payment waterfall typically includes principal and interest payments to the note holders, various expenses of the trust and reimbursements to Ambac, as financial guarantor, for previously paid claims. Notwithstanding the reimbursement of previous claim payments, to the extent there continues to be insufficient cash in the waterfall in the current month to make scheduled principal and interest payments to the note holders, Ambac is required to make additional claim payments to cover this shortfall. Ambac may also receive payments directly from transaction sponsors in settlement of their repurchase obligations pursuant to negotiated settlement agreements or otherwise as a result of related litigation.
Ambac’s approach in estimating subrogation recoveries is a function of the population of loan files the sponsor makes available for review. In transactions where Ambac has been provided access to loans files for all loans in the original loan pool, we utilize a “random sample” approach to estimate subrogation recoveries. Prior to the June 30, 2014 reporting period, in transactions where Ambac had only obtained loan files for seriously delinquent or defaulted loans, we utilized an “adverse sample” approach to estimate subrogation recoveries. Beginning with the June 30, 2014 reporting period, as a result of gaining further access to loan files, the random sample approach has been utilized for all transactions which were previously evaluated using the adverse sample approach. Both approaches are described in further detail below. We do not include estimates of damages attributed solely to fraudulent inducement claims in our estimate of subrogation recoveries under either approach. The amount the sponsors believe to be their liability for these breaches is not known; however, certain large financial institutions which have served as sponsors for certain transactions that Ambac has insured have disclosed that they have established reserves related to claims by financial guarantors and others for breaches of representations and warranties in RMBS transactions.
While the obligation by sponsors to repurchase loans with material breaches is clear, generally the sponsors have not yet honored those obligations. Ambac has utilized the results of the above described loan file examinations to make demands for loan repurchases from sponsors or their successors and, in certain instances, as a part of the basis for litigation. Ambac’s approach to resolving these disputes has included negotiating with individual sponsors at the transaction level and in some cases at the individual loan level and has resulted in the repurchase of some loans. Ambac has initiated and will continue to pursue lawsuits seeking compliance with the repurchase obligations in the securitization documents.
Ambac has performed the above-mentioned, detailed examinations on a variety of second-lien and first-lien transactions that have experienced exceptionally poor performance. However, the loan file examinations and related estimated recoveries we have reviewed and recorded to date have been limited to only those transactions whose sponsors (or their successors) are subsidiaries of large financial institutions, all of which carry an investment grade rating from at least one nationally recognized rating agency, or are otherwise deemed to have the financial wherewithal to live up to their repurchase obligations. While our contractual recourse is generally to the sponsor/subsidiary, rather than to the parent, each of these large institutions has significant financial resources and may have an ongoing interest in mortgage finance, and we therefore believe that the financial institution/parent would ultimately assume financial responsibility for these obligations if the sponsor/subsidiary is unable to honor its contractual obligations or pay a judgment that we may obtain in litigation. Additionally, in the case of successor institutions, we are not aware of any provisions that explicitly preclude or limit the successors’ ability to honor the obligations of the original sponsor. Certain successor financial institutions have made significant payments to certain claimants to settle breaches of representations and warranties perpetrated by sponsors that have been acquired by such financial institutions. As a result, we did not make significant adjustments to our estimated subrogation recoveries with respect to the credit risk of these sponsors or their successors. We believe that focusing our loan remediation efforts on large financial institutions first will provide the greatest economic benefit to Ambac. Ambac retains the right to review other RMBS transactions for representations and warranties breaches and management continues to review transactions for inclusion in this effort. As part of this effort, there have been limited cases for certain smaller transactions where Ambac has successfully negotiated recoveries for breaches of representations and warranties without a detailed examination of the respective loan files.
91
Our ability to recover the RMBS subrogation recoveries is subject to significant uncertainty, including risks inherent in litigation, collectability of such amounts from counterparties and/or their respective parents and affiliates, timing of receipt of any such recoveries, intervention by OCI which could impede our ability to take actions required to realize such recoveries, and uncertainties inherent in the assumptions used in estimating such recoveries.
Random sample approach:
The random sample approach to estimate subrogation recoveries is based on obtaining a random sample of the original loans in the pool, using a protocol developed by a statistical expert. In this approach, the ratio of: (a) loans identified in the sample as having materially breached representations and warranties to (b) the total loan sample size, is applied (extrapolated) to the sum of realized and estimated future collateral pool losses to determine an estimated repurchase obligation. We limit the estimated repurchase obligation by ever-to-date incurred losses, with respect to the remaining steps in this approach.
Multiple probability-weighted scenarios were then developed by applying various realization factors to the estimated repurchase obligation. The realization factors in these scenarios were developed using Ambac’s own assumptions about the likelihood of outcomes based on all the information available to it including, but not limited to, (i) discussions with external legal counsel and their views on ultimate settlement and/or litigation outcomes, (ii) experience with loan put back negotiations where the existence of a material breach was debated and negotiated at the loan level, and (iii) the pervasiveness of the breach rates. The probability weightings are developed based on the unique facts and circumstances for each transaction. The sum of these probability-weighted scenarios represents the undiscounted subrogation recovery, which is then discounted using a factor derived from a risk-free discount rate term structure that corresponds to the date of each respective recovery. Discount factors are updated for the current risk-free rate each reporting period.
Adverse sample approach:
The adverse sample approach was used in transactions where Ambac was only given access by the sponsor to impaired loan files, meaning loans greater than 90 days past due, charged off, or in foreclosure, REO or bankruptcy. This limitation precluded us from selecting a valid random sample from the entire loan pool. Consequently, the adverse sample approach utilized the following subsets of loans to estimate a repurchase obligation: (i) loans identified as breaching representations and warranties (i.e. adverse loans) taken from a sample of impaired loans and (ii) transactions identified where the underlying loans have similar attributes, including but not limited to type, vintage and composition, to loans that were included in RMBS settlements between the same sponsor and other parties, and where the transactions had substantially similar representations and warranties (
i.e
. “prototype transactions”). The calculation of subrogation recovery with respect to the adverse loan subset was based on the original principal balance of the loans in the adverse sample.
Multiple probability-weighted scenarios were then developed by applying various realization factors to the estimated repurchase obligations under both subsets of loans. The realization factors in these scenarios were developed using assumptions similar to those discussed in the random sample approach above, as well as an internal analysis of the RMBS settlements discussed above. The sum of these probability-weighted scenarios represents the undiscounted subrogation recovery, which is then discounted using a factor derived from a risk-free discount rate term structure that corresponds to the date of each respective recovery. Discount factors are updated for the current risk-free rate each reporting period.
Intangible assets:
Insurance intangible
: At the Fresh Start Reporting Date, an insurance intangible asset was recorded which represented the difference between the fair value and aggregate carrying value of the financial guarantee insurance and reinsurance assets and liabilities. The carrying values of our financial guarantee insurance and reinsurance contracts will continue to be reported and measured in accordance with existing accounting policies. Pursuant to the Financial Services-Insurance Topic of the ASC, the insurance intangible is to be measured on a basis consistent with the related financial guarantee insurance and reinsurance contracts. The insurance intangible asset will be amortized using a level yield method based on par exposure of the related financial guarantee insurance or reinsurance contracts and will be applied to groups of contracts with similar characteristics. The weighted-average amortization period at Fresh Start Reporting Date was
9.4 years
.
VIE intangible
:
Effective April 30, 2013, Ambac consolidated a VIE which had assets that included finite lived intangible assets associated with its operations. The intangible assets were recorded at their fair value on the consolidation date in the amount of
$164,520
and were considered held for use.
Pursuant to the Intangible - Goodwill and Other Topic of the ASC, finite lived intangibles held for use are amortized over their useful lives. The useful lives are determined after considering the specific facts and circumstances including, contractual term of any agreement, the long-term strategy for the use of the asset and other economic factors. A VIE intangible held for use is tested for impairment if conditions exist that might indicate the carrying amount of the intangible is not recoverable and exceeds its fair value. Such conditions may include an economic downturn in a geographic market or a change in the assessment of future operations. If such conditions are present, a two-step impairment evaluation is performed. In the first step, a recoverability test is performed by comparing the sum of the estimated undiscounted future cash flows attributable to the intangible asset to its carrying amount. If the undiscounted cash flows are less than the carrying amount, the second step of the test is performed to measure the impairment amount, if any. In the second step, an impairment loss would be recognized to the extent the carrying amount of the intangible exceeds its fair value.
92
In the period an intangible asset is classified as held for sale, the asset is reported at the lower of carrying value or fair value less costs to sell, with the adjustment reported as a loss through earnings. In subsequent periods, a loss is recognized for any further reduction in fair value less cost to sell. A gain is recognized for any subsequent increase in fair value less cost to sell, but not in excess of the cumulative loss previously recognized. During 2013, management approved plans to sell the VIE intangible assets and such assets were reclassified as held for sale, resulting in a loss from the reduction of their carrying value to fair value less costs to sell in the eight months ended December 31, 2013. The sale of the intangible assets was completed in 2014. Refer to
Note 4. Special Purpose Entities, including Variable Interest Entities
for further discussion of the VIE intangibles and their impact on the consolidated financial statements.
Deferred Acquisition Costs:
Financial guarantee insurance costs that vary with and are primarily related to the production of business had been deferred. These costs included compensation of certain employees, premium taxes, ceding commissions payable on assumed business and certain other underwriting expenses, net of ceding commissions receivable on ceded business. Certain future costs associated with installment premium contracts, such as premium taxes and reinsurance ceding commissions, are estimated and present valued using the same assumptions used to estimate the related premiums receivable described in the “Net Premiums Earned” section above. Premium taxes and reinsurance commissions were deferred in their entirety. Ambac has not undertaken any new business since 2008; accordingly, we have not deferred any costs in the periods presented, except for changes in estimates for premiums taxes and ceding commissions. Costs associated with credit derivatives are expensed as incurred. Prior to the Fresh Start Reporting Date, deferred acquisition costs were expensed in proportion to premium revenue recognized. Amortization of deferred acquisition costs is adjusted to reflect acceleration of premium revenue due to refunding or calls and to reflect changes in the estimated lives of certain obligations. Amortization of deferred acquisition costs amounted to
$6,480
and
$25,465
for the four months ended April 30, 2013 and the year ended December 31, 2012, respectively. A premium deficiency exists if the sum of: (i) unearned premium, and (ii) losses and loss expense reserve, net of reinsurance and subrogation recoveries, recognized as of the balance sheet date, is less than the sum of: (i) the present value of expected loss and loss expenses, (ii) present value of future expected servicing and maintenance costs, and (iii) unamortized deferred acquisition costs. The present value of the expected loss and loss expenses and future expected servicing and maintenance costs are discounted at the rate of return on Ambac’s investment portfolio. If a premium deficiency were to exist, unamortized deferred acquisition costs would be reduced by a charge to expense and a liability would be established for any remaining deficiency. The remaining deferred costs at the Fresh Start Reporting Date were reduced to their fair value of zero; refer to
Note 3. Fresh Start Financial Statement Reporting
for further information.
Investments:
The Investments - Debt and Equity Securities Topic of the ASC requires that all debt instruments and certain equity instruments be classified in Ambac’s Consolidated Balance Sheets according to their purpose and, depending on that classification, be carried at either cost or fair market value. Ambac’s non-VIE investment portfolio is accounted for on a trade-date basis and consists primarily of investments in fixed income securities that are considered available-for-sale as defined by the Investments - Debt and Equity Securities Topic of the ASC. Available-for-sale securities are reported in the financial statements at fair value with unrealized gains and losses, net of deferred taxes, reflected in Accumulated Other Comprehensive Income in Stockholders’ Equity and computed using amortized cost as the basis. For purposes of computing amortized cost, premiums and discounts are accounted for using the effective interest method over the remaining term of the securities. For securities that are not structured securities with a large underlying pool of homogenous loans, such as corporate and municipal bonds, premiums and discounts are amortized or accreted over the remaining term of the securities even if they are callable. Premiums and discounts on mortgage-backed and asset-backed securities are adjusted for the effects of actual and anticipated prepayments on a retrospective basis.
Beginning in 2013, Ambac’s investment portfolio also included equity interests in pooled investment funds. Such equity interests in the form of common stock or in-substance common stock are classified as trading securities. Equity interests in pooled funds organized as limited liability companies are recorded under the fair value option. Investments classified either as trading or fair value option securities are reported as Other investments on the Consolidated Balance Sheet at fair value with changes in fair value reported through Net investment income on the Statement of Comprehensive Income. Investments in pooled funds have been classified as trading or fair value option securities so that any undistributed earnings of the funds may be reflected in Net investment income as they occur.
Fair value is based primarily on quotes obtained from independent market sources. When quotes are not available or cannot be reasonably corroborated, valuation models are used to estimate fair value. These models include estimates, made by management, which utilize current market information. The quotes received or modeled valuations could differ materially from amounts that would actually be realized in the market. Realized gains and losses on the sale of investments are determined on the basis of specific identification.
VIE investments in fixed income securities are carried at fair value under the fair value option in accordance with the Financial Instruments Topic of the ASC Topic 825. For additional information about VIE investments, including fair value by asset-type, see
Note 4. Special Purpose Entities, including Variable Interest Entities
.
Ambac has a formal impairment review process for available for sale securities in its investment portfolio. Ambac conducts a review each quarter to identify and evaluate investments that have indications of possible impairment that is other than temporary in accordance with the Investments - Debt and Equity Securities Topic of the ASC. Factors considered when assessing impairment include: (i) fair values that have declined by 20% or more below amortized cost; (ii) market values that have declined by 5% or more but less than 20% below amortized cost for a continuous period of at least six months; (iii) recent downgrades by rating agencies; (iv) the financial condition of the issuer and financial guarantor, as applicable, and an analysis of projected defaults on the underlying collateral; (v) scheduled interest payments are past due; (vi) whether Ambac has the intent to sell the security; and (vii) whether it is more likely than not that Ambac will be required to sell a security before the anticipated
93
recovery of its amortized cost basis. If we believe a decline in the fair value of a particular investment is temporary, we record the decline as an unrealized loss net of tax in Accumulated Other Comprehensive Income in Stockholders’ Equity on our Consolidated Balance Sheets. If management either: (i) has the intent to sell its investment in a debt security or (ii) determines that the Company more likely than not will be required to sell the debt security before its anticipated recovery of the amortized cost basis less any current period credit impairment, then an other-than-temporary impairment charge must be recognized in earnings, with the amortized cost of the security being written-down to fair value. If these conditions are not met, but it is determined that a credit loss exists, the credit impairment loss is recognized in earnings, and the other-than-temporary amount related to all other factors is recognized in other comprehensive income. For fixed income securities that have other-than-temporary impairments in a period, the previous amortized cost of the security less the amount of the other-than-temporary impairment recorded through earnings becomes the investment’s new cost basis. Ambac accretes the new cost basis to par or to the estimated future cash flows to be recovered over the expected remaining life of the security.
The evaluation of securities for impairment is a quantitative and qualitative process, which is subject to risks and uncertainties and is intended to determine whether, and to what extent, declines in the fair value of investments should be recognized in current period earnings. The risks and uncertainties include changes in general economic conditions, the issuer’s or guarantor’s financial condition and/or future prospects, the effects of regulatory actions on the investment portfolio, the performance of the underlying collateral, the effects of changes in interest rates or credit spreads and the expected recovery period. With respect to Ambac-wrapped securities guaranteed under policies that have been allocated to the Segregated Account, future cash flows used to measure credit impairment represents the sum of (i) the bond’s intrinsic cash flows and (ii) the estimated Ambac Assurance claim payments, including interest on Deferred Amounts. Ambac estimates the timing of such claim payment receipts but the actual timing of such amounts are at the sole discretion of the Rehabilitator. Further modifications to the Segregated Account Rehabilitation Plan or to the rules and guidelines promulgated thereunder, orders from the Rehabilitation Court or actions by the Rehabilitator with respect to the form, amount and timing of satisfying permitted policy claims, or making payments on Deferred Amounts or surplus notes, may have a material effect on the fair value of Ambac-wrapped securities and future recognition of other-than-temporary impairments. Refer to
Note 1. Background and Business Description
for information relating to the amended Segregated Account Rehabilitation Plan. Ambac’s assessment about whether a decline in value is other-than-temporary reflects management’s current judgment regarding facts and circumstances specific to a security and the factors noted above, including Ambac's intention to sell securities and ability to hold temporarily impaired securities until recovery. If that judgment changes, Ambac may ultimately record a charge for other-than-temporary impairment in future periods.
Derivative Contracts:
The Company has entered into derivative contracts both for trading purposes and to hedge certain economic risks inherent in its financial asset and liability portfolios. Derivatives for trading include credit derivatives, interest rate and currency swaps, and futures contracts. None of Ambac’s derivative contracts were designated as hedges under the Derivatives and Hedging Topic of the ASC. Ambac’s credit derivative contracts are accounted for at fair value since they do not qualify for the financial guarantee scope exception under the Derivatives and Hedging Topic of the ASC. Changes in fair value of credit derivatives are recorded in Net change in fair value of credit derivatives on the Consolidated Statements of Total Comprehensive Income (Loss). Ambac provides interest rate and currency swaps principally to states, municipalities and their authorities and asset-backed issuers in connection with their financings. In 2012, Ambac terminated its remaining currency swap transactions. Changes in fair value of interest rate and currency swaps are recorded in Derivative product revenue on the Consolidated Statements of Total Comprehensive Income (Loss). VIEs consolidated under the Consolidation Topic of the ASC entered into derivative contracts to meet specified purposes within their securitization structure. Changes in fair value of consolidated VIE derivatives are included within Income (loss) on variable interest entities on the Consolidated Statements of Total Comprehensive Income (Loss). The Company had certain options to repurchase Ambac Assurance’s surplus notes at a discount to par value which were required to be accounted for as stand-alone derivatives. Changes in fair value of these options, which were exercised in June 2012, were recorded in Other income on the Consolidated Statements of Total Comprehensive Income (Loss).
All derivatives are recorded on the Consolidated Balance Sheets at fair value on a gross basis; assets and liabilities are netted by customer only when a legal right of offset exists. Ambac has determined that the amounts recognized for the right to reclaim cash collateral or the obligation to return cash collateral may not be used to offset amounts due under the derivative instruments in the normal course of settlement. Therefore, such amounts are not offset against fair value amounts recognized for derivative instruments executed with the same counterparty under the same master netting arrangement. Refer to
Note 12. Derivative Instruments
for further discussion of the Company’s use of derivative instruments and their impact of the consolidated financial statements. Refer to
Note 10 . Fair Value Measurements
for further description of the methodologies used to determine the fair value of derivative contracts, including model inputs and assumptions where applicable.
Loans:
Loans are reported at either their outstanding principal balance less unamortized discount or at fair value. For loans reported at their outstanding principal balance less unamortized discount (non-VIE loans), interest income is earned using the effective interest method based upon interest accrued on the unpaid principal balance adjusted for accretion of discounts. A loan is considered impaired when, based on the financial condition of the borrower, it is probable that Ambac will be unable to collect all principal and interest due according to the contractual terms of the loan agreement. Loans held by VIEs consolidated as required under the Consolidation Topic of the ASC are carried at fair value, with changes in fair value recorded in Income (loss) on variable interest entities on the Consolidated Statements of Total Comprehensive Income (Loss).
Obligations under Investment Agreements and Investment Repurchase Agreements:
Ambac provides investment agreements principally to asset-backed and structured finance issuers, states, municipalities and municipal authorities, whereby Ambac agrees to pay an agreed-upon rate of interest based on funds deposited. Proceeds from these investment agreement and investment
94
repurchase agreement obligations are used to invest in fixed income investments. Interest income from these investments is included in Net investment income on the Consolidated Statements of Total Comprehensive Income (Loss).
Obligations under investment agreements are reported as liabilities on the Consolidated Balance Sheets at their principal value less unamortized discount. The carrying value of these obligations is adjusted for principal paid and interest credited to the account. Interest expense is computed based upon daily outstanding liability balances at rates and periods specified in the agreements adjusted for accretion of discount.
Subject to a negotiation among the parties, investment agreements may be settled for an amount different than the carrying value of the obligation. Any difference between the settlement payment and carrying value of the terminated investment agreement obligation is reported in Net realized losses on extinguishment of debt on the Consolidated Statements of Total Comprehensive Income (Loss).
Income Taxes:
Ambac files a consolidated U.S. Federal income tax return with its subsidiaries. Ambac UK files tax returns in both the United Kingdom and Italy (for its Milan branch). Deferred tax assets and liabilities are recognized for the future tax consequences attributable to differences between the financial statement carrying amounts of existing assets and liabilities and their respective tax bases. Deferred tax assets and liabilities are measured using enacted tax rates expected to apply to taxable income in the years in which those temporary differences are expected to be recovered or settled. The effect on deferred tax assets and liabilities of a change in tax rates is recognized in the period that includes the enactment date.
Ambac evaluates our deferred income taxes quarterly to determine if valuation allowances are required. The Income Taxes Topic of the ASC requires that companies assess whether valuation allowances should be established against their deferred tax assets based on the consideration of all available evidence using a ‘more likely than not” standard. In making such judgments, significant weight is given to evidence that can be objectively verified.
The level of deferred tax asset recognition is influenced by management’s assessment of future profitability, which depends on the existence of sufficient taxable income of the appropriate character (ordinary vs. capital) within the carry back or carry forward periods available under the tax law. In the event that we determine that we would not be able to realize all or a portion of our deferred tax assets in the future, we would reduce such amounts through a charge to the Statement of Total Comprehensive Income in the period in which that determination is made.
The Income Taxes Topic of the ASC provides a framework to determine the appropriate level of tax reserves for uncertain tax positions. This framework prescribes a more-likely-than-not threshold for financial statement recognition and measurement of a tax position taken or expected to be taken in a tax return. Ambac also accrues interest and penalties related to these unrecognized tax benefits in the provision for income taxes.
Postretirement and Postemployment Benefits:
Ambac provides postretirement and postemployment benefits, including health and life benefits covering employees who meet certain age and service requirements. Ambac accounts for these benefits under the accrual method of accounting. Amounts related to the postretirement health benefits liability are established and charged to expense based on actuarial determinations.
Stock Compensation Plan:
The Ambac 2013 Incentive Compensation Plan (the “Equity Plan”) provides for the granting of stock options, restricted stock, stock appreciation rights, restricted and performance units and other awards that are valued or determined by reference to Ambac's common stock to employees and directors. In March 2014, Ambac developed a long term incentive compensation plan (“LTIP”) as a sub-plan of the 2013 Plan. Ambac recognizes compensation costs for all equity classified awards granted at fair value with an estimation of forfeitures for all unvested shares.
Stock options and restricted stock units granted only require future service and accordingly the respective fair value is amortized over the relevant service period.
Performance stock units granted require both future service and achieving specified performance targets to vest and accordingly compensation costs are only recognized when the achievement of the performance conditions are considered probable. Compensation costs are initially based on the probable outcome of the performance conditions and adjusted for subsequent changes in the estimated or actual outcome each reporting period as necessary. Changes in the estimated or actual outcome of a performance condition are recognized by reflecting a retrospective adjustment to compensation cost in the current period.
Depreciation and Amortization:
Depreciation of furniture and fixtures and electronic data processing equipment is charged over the estimated useful lives of the respective assets, ranging from
three
to
five
years, using the straight-line method. Amortization of leasehold improvements is charged over the remaining term of the operating leases using the straight-line method.
95
Foreign Currency:
Financial statement accounts expressed in foreign currencies are translated into U.S. dollars in accordance with the Foreign Currency Matters Topic of the ASC. Functional currency assets and liabilities of Ambac’s foreign subsidiaries are translated into U.S. dollars using exchange rates in effect at the balance sheet dates and the related translation adjustments, net of deferred taxes, are included as a component of Accumulated Other Comprehensive Income in Stockholders' Equity. Functional currencies are generally the currencies of the local operating environment. Consolidated Statements of Total Comprehensive Income (Loss) accounts expressed in functional currencies are translated using average exchange rates.
Foreign currency transaction gains and losses arising from sales of foreign denominated investment securities are reflected in Net realized investment gains. Foreign currency transaction gains and losses arising from cash denominated in non-functional currencies as well as the re-measurement of non-functional currency premium receivables are reflected in Other income in the Consolidated Statements of Total Comprehensive Income (Loss). The Consolidated Statements of Total Comprehensive Income (Loss) include pre-tax gains (losses) from such foreign exchange items of
$1,326
for the year ended December 31, 2014,
$(12,372)
for the eight months ended December 31, 2013,
$8,694
for the four months ended April 30, 2013 and
$(7,894)
for the year ended December 31, 2012. Foreign currency transaction gains and losses arising from the re-measurement of non-functional currency loss reserves are included within losses and loss expenses in the Consolidated Statements of Total Comprehensive Income (Loss).
Reclassifications:
Certain reclassifications have been made to prior years' amounts to conform to the current year's presentation.
Recently
Adopted and Recently Issued Accounting Standards:
Adopted:
Effective January 1, 2014, Ambac adopted ASU No. 2013-11,
Presentation of an Unrecognized Tax Benefit When a Net Operating Loss Carryforward, a Similar Tax Loss, or a Tax Credit Carryforward Exists
. The ASU requires an entity to present an unrecognized tax benefit in the financial statements as a reduction to a deferred tax asset for an NOL carryforward, a similar tax loss, or a tax credit carryforward except when: i) an NOL carryforward, a similar tax loss, or a tax credit carryforward is not available as of the reporting date under the governing tax law to settle taxes that would result from the disallowance of the tax position and ii) the entity does not intend to use the deferred tax asset for this purpose. If either of these conditions exists, an entity should present an unrecognized tax benefit in the financial statements as a liability and should not net the unrecognized tax benefit with a deferred tax asset. The adoption of this ASU did not have a material effect on Ambac’s financial statements.
Issued:
In April 2014, the FASB issued ASU 2014-08,
Presentation of Financial Statements (Topic 205) and Property, Plant, and Equipment (Topic 360) - Reporting Discontinued Operations and Disclosures of Disposals of Components of an Entity
. The objective of this ASU is to limit discontinued operations reporting to disposals of components of an entity that represent strategic shifts that have (or will have) a major effect on an entity's operations and financial results. Under current U.S. GAAP, many disposals, some of which may be routine in nature and not a change in an entity's strategy, are reported in discontinued operations. The ASU also requires certain expanded disclosures for discontinued operations and disclosure of the pre-tax profit or loss of an individually significant component of an entity that does not qualify for discontinued operations reporting. The ASU is effective prospectively for all disposal (or classifications of held for sale) components that occur within annual periods beginning on or after December 15, 2014. Ambac will adopt ASU 2014-08 on January 1, 2015. The adoption of this ASU is not expected to have a material effect on Ambac's financial statements.
In June 2014, the FASB issued ASU 2014-12,
Compensation - Stock Compensation (Topics 718) - Accounting for Share-Based Payments When the Terms of an Award Provide That a Performance Target Could Be Achieved after the Requisite Service Period
. Generally, share-based payment awards that require a specific performance target to be met also require an employee to render service until the performance target is achieved. However, in some cases, the terms of an award may provide that the performance target could be achieved after the employee completes the requisite service period. Under current U.S. GAAP, there is no explicit guidance on how to account for share-based payment awards with performance targets that could be achieved after the requisite service period. This ASU is intended to resolve diversity in practice with respect to how the performance target is considered in the grant-date fair value of the award, which impacts the amount of compensation cost recognized over time. The ASU requires that a performance target that affects vesting and that could be achieved after the requisite service period be treated as a performance condition. As a result, the performance target would not be reflected in estimating the fair value of the award at the grant date. The ASU is effective for annual periods and interim periods within those annual periods beginning after December 15, 2015. Earlier adoption is permitted. Entities may apply this ASU either (a) prospectively to all awards granted or modified after the effective date or (b) retrospectively to all awards with performance targets that are outstanding as of the beginning of the earliest annual period presented in the financial statements and to all new or modified awards thereafter. Ambac presently follows the guidance in ASU 2014-12 for its share-based awards which have performance targets, thus there will be no material impact on Ambac's financial statements.
In August 2014, the FASB issued ASU 2014-13,
Consolidation (Topic 810): Measuring the Financial Assets and the Financial Liabilities of a Consolidated Collateralized Financing Entity
. A collateralized financing entity ("CFE") is a variable interest entity with nominal or no equity
96
that holds financial assets and issues beneficial interests in those financial assets. The beneficial interests, which are financial liabilities of the CFE, have contractual recourse only to the related assets of the CFE. Currently, a reporting entity that is required to consolidate a CFE may elect to measure the financial assets and financial liabilities of the CFE at fair value. Under the ASU, a reporting entity may elect to measure such assets and liabilities using either: i) the measurement principles in the Fair Value Measurement Topic of the ASC or ii) an alternative measurement approach specified in the ASU. The alternative measurement approach uses the more observable of either the fair value of the financial assets or financial liabilities to measure both. The ASU is intended to address diversity in practice in accounting for the measurement difference between financial assets and financial liabilities of CFEs. The ASU is effective for annual periods and interim periods with those annual periods beginning after December 15, 2015. A reporting entity may apply the ASU using a modified retrospective approach by recording a cumulative-effect adjustment to equity as of the beginning of the annual period of adoption. A reporting entity may also apply the ASU retrospectively to all relevant prior periods beginning within the annual period in which ASU 2009-17,
Consolidation (Topic 810): Improvements to Financial Reporting by Enterprises Involved with Variable Interest Entities
, was adopted. Ambac will adopt ASU 2014-13 on January 1, 2016 and is currently evaluating the impact of the ASU on its financial statements.
In August 2014, the FASB issued ASU 2014-15,
Presentation of Financial Statements - Going Concern (Subtopic 205-40): Disclosure of Uncertainties about an Entity’s Ability to Continue as a Going Concern.
Currently, there is no guidance in U.S. GAAP about management’s responsibility to evaluate whether there is substantial doubt about an entity’s ability to continue as a going concern or to provide related footnote disclosures. The ASU requires management to assess, at each interim and annual reporting period, whether substantial doubt exists about the company’s ability to continue as a going concern within one year after the date that the financial statements are issued or available to be issued. If management determines there is substantial doubt, it should also consider whether the substantial doubt is overcome by management’s plans, and provide certain disclosures based on facts and circumstances. The ASU is effective for annual periods and interim periods within those annual periods beginning after December 15, 2016, with early adoption permitted. Ambac will adopt ASU 2014-14 on January 1, 2017. As this is a disclosure requirement, adoption of this ASU will not have a material effect on Ambac’s financial statements.
In November 2014, the FASB issued ASU 2014-16,
Derivatives and Hedging
(Topic 815): Determining Whether the Host Contract in a Hybrid Financial Instrument Issued in the Form of a Share Is More Akin to Debt or to Equity.
The objective of this ASU is to eliminate the existing diversity in practice in accounting for hybrid financial instruments issued in the form of a share. A hybrid financial instrument consists of a “host contract” into which one or more derivative terms have been embedded. The ASU requires an entity to consider the terms and features of the entire financial instrument, including the embedded derivative features, in order to determine whether the nature of the host contract is more akin to debt or to equity. The ASU is effective for annual periods and interim periods within those annual periods beginning after December 15, 2015, with early adoption permitted. A reporting entity should apply the ASU using a modified retrospective approach by recording a cumulative-effect adjustment to equity as of the beginning of the annual period of adoption. Retrospective application is permitted to all relevant prior periods. Ambac will adopt ASU 2014-16 on January 1, 2016. Adoption of this ASU is not expected to have a material effect on Ambac’s financial statements.
In January 2015, the FASB issued ASU 2015-01,
Income Statement - Extraordinary and Unusual Items (Subtopic 225-20): Simplifying Income Statement Presentation by Eliminating the Concept of Extraordinary Items.
Extraordinary items are defined as both unusual in nature and infrequent in occurrence. Under previous guidance, a reporting entity was required to separately present and disclose extraordinary items. This ASU eliminates from current U.S. GAAP the concept of extraordinary items. However, the ASU retains the presentation and disclosure guidance for items that are unusual in nature or occur infrequently. Items that meet either or both of these criteria must be presented as a separate component on the face of the income statement or, alternatively, disclosed in the notes to the financial statements. The ASU is effective for annual periods and interim periods within those annual periods beginning after December 15, 2015. Entities may apply this ASU either prospectively or retrospectively to all prior periods presented in the financial statements. Early adoption is permitted provided that the ASU is applied from the beginning of the fiscal year of adoption. Ambac has not determined whether it will early adopt this ASU, however adoption of this ASU is not expected to have a material effect on Ambac’s financial statements.
In February 2015, the FASB issued ASU 2015-02,
Consolidation (Topic 810): Amendments to the Consolidation Analysis
. This ASU makes changes to the VIE model and voting interest ("VOE") model consolidation guidance. The main provisions of the ASU include the following: i) adding a requirement that limited partnerships and similar legal entities must provide partners with
either
substantive kick-out rights or substantive participating rights over the general partner to qualify as a VOE rather than a VIE; ii) eliminating the presumption that the general partner should consolidate a limited partnership; iii) eliminating certain conditions that need to be met when evaluating whether fees paid to a decision maker or service provider are considered a variable interest; iv) excluding certain fees paid to decision makers or service providers when evaluating which party is the primary beneficiary of a VIE; and v) revising how related parties are evaluated under the VIE guidance. Lastly, the ASU eliminates the indefinite deferral of FAS 167, which allowed reporting entities with interests in certain investment funds to follow previous guidance in FIN 46 (R). However, the ASU permanently exempts reporting entities from consolidating registered money market funds that operate in accordance with Rule 2a-7 of the Investment Company Act of 1940. The ASU is effective for annual periods and interim periods within those annual periods beginning after December 15, 2015. Entities may apply this ASU either using a modified retrospective approach by recording a cumulative-effect adjustment to equity as of the beginning period of adoption or retrospectively to all prior periods presented in the financial statements. Early adoption is also permitted provided that the ASU is applied from the beginning of the fiscal year of adoption. Ambac will adopt ASU 2015-02 on January 1, 2016 and is currently evaluating the impact of this ASU on its financial statements.
3.
FRESH START FINANCIAL STATEMENT REPORTING
Below is a discussion of key principles and assumptions used in the implementation of fresh start financial statement reporting (“Fresh Start”) as a result of the Company’s emergence from Chapter 11.
97
Enterprise Value / Reorganization Value Determination:
In conjunction with formulating the Reorganization Plan, Ambac directed a third-party financial advisor to prepare a valuation analysis to determine Ambac’s estimated enterprise value, which was estimated to be
$185,000
. The enterprise value, which represents the Company’s equity value attributable to common stockholders and warrant holders immediately after restructuring, was included in the Disclosure Statement filed by Ambac with the Bankruptcy Court in September 2011. Management believed that this enterprise value of
$185,000
would provide the best representation of the Company’s post-emergence reorganization value in accordance with the Reorganizations Topic of the ASC. The enterprise value was based on a discounted cash flow analysis using estimates of after-tax free cash flows through 2045. The terminal date of 2045 was used as the expected run-off of Ambac Assurance’s insurance operations will be substantially completed by 2045. The valuation uses a range of discount rates between
12%
and
17%
, which considered the cost of capital associated with a set of comparable insurance holding companies, indicative ranges suggested by third parties during Ambac’s 2008 capital raise process and discussions with financial professionals knowledgeable about the insurance industry.
The net cash flows used in the valuation analysis include income relating to, but not limited to, interest and principal on notes receivable; interest receipts on invested assets; reimbursement from Ambac Assurance for operating expenses; tolling payments and the upfront cash payment from Ambac Assurance, which are outlined in the Mediation Agreement and further described below. Expenses include operating expenses; intercompany settlements and tax payments. In addition, the long-term financial projections include value from the junior surplus note issued to Ambac by the Segregated Account, excess net operating tax losses (the “NOL Valuation”) and a residual equity dividend from Ambac Assurance.
For the purposes of estimating Ambac’s enterprise value, the following assumptions were made in accordance with the terms of the Mediation Agreement and the Reorganization Plan with respect to future consideration to be received by Ambac from Ambac Assurance or the Segregated Account:
|
(i)
|
$5,000
per annum reimbursement for operating expenses until March 2017;
|
|
(ii)
|
Tolling payments on NOLs according to the tranches and tolling rates, as outlined in the Reorganization Plan. In conjunction with the Reorganization Plan, Ambac and Ambac Assurance entered into the Amended TSA, which provides that certain NOLs (“Allocated NOL Amount”) generated by Ambac’s affiliated group (including Ambac Assurance) for federal tax purposes on or prior to September 30, 2011 (the “Determination Date”) shall be available for use by the Ambac Assurance Subgroup subject to certain NOL tolling payments by Ambac Assurance to Ambac. Ambac Assurance Subgroup is defined as Ambac Assurance and any direct or indirect subsidiary of Ambac Assurance that would be treated as an includable corporation of an affiliated group of corporations under the Internal Revenue Code. The Allocated NOL Amount is
$3.65 billion
which may be subject to change from future audit adjustments. Under the terms of the Amended TSA, the Ambac Assurance Subgroup may utilize the Allocated NOL Amount in exchange for tolling payments that are calculated based on the amount of notional federal tax liability that would have been imposed on the Ambac Assurance Subgroup if such NOLs were not available for its use. The tolling payments due from Ambac Assurance to Ambac for the use of the Allocated NOL are determined as a percentage of this notional federal tax liability as follows: a) the first
$0.479 billion
of Allocated NOL -
15%
, b) the next
$1.057 billion
of Allocated NOL -
40%
, c) the next
$1.057 billion
of Allocated NOL -
10%
, d) the next
$1.057 billion
of Allocated NOL -
15%
.
|
The Amended TSA also provides for tolling payments from Ambac Assurance to Ambac for the use of NOLs to determine the Ambac Assurance Subgroup’s alternative minimum tax (“AMT”) liability using a similar schedule for the use of the Allocated NOL Amount. However the tolling payments for the use of NOLs for AMT purposes shall be subject to certain credits that may be used to offset the amounts due from Ambac Assurance for the use of such AMT NOLs under the Amended TSA. These credits may be carried forward into future taxable periods to offset future payment under the Amended TSA, which may not exceed, in the aggregate,
$60,000
.
The estimated NOL tolling payments utilized in Ambac’s enterprise value were estimated based on financial projections of the Ambac Assurance Subgroup’s taxable income;
|
(iii)
|
$30,000
in upfront cash, which Ambac Assurance can apply as a credit for up to
$15,000
of future tolling payments;
|
|
(iv)
|
a
$350,000
junior surplus note, assumed to accrue interest at a rate of
5.1%
per annum and to be paid down in 2045; and
|
|
(v)
|
from March 2017, an additional
$4,000
per annum reimbursement for operating expenses (the “Additional Opex Subsidy”). There is uncertainty as to whether or not the Additional Opex Subsidy will be approved by the Rehabilitator and, if approved, for what period of time it would be in effect.
|
The NOL Valuation relies on several key assumptions relating to the use of NOLs in a new corporate opportunity. The NOL Valuation assumes that Ambac raises capital to acquire additional assets in a manner that complies with the relevant tax rules related to NOL usage and utilizes the NOL to shelter, to the greatest extent permitted by the tax law, any tax that otherwise would be payable from the taxable income generated by the acquired assets. The required capital is assumed to be raised as equity in a range from
$135,000
to
$190,000
. The equity capital is assumed to be invested in portfolios similar in nature to Ambac Assurance. The following assumptions were used to value the tax savings arising from the newly acquired entity’s utilization of the NOLs: (i) compounded annual rate of return on investment of approximately
6%
-
8%
; (ii) a
25%
-
35%
discount rate, the assumed equity rate of return an investor would target upon making such an investment; and (iii) an assumed expiration of the NOLs in 2030 in accordance with their 20-year life.
98
Dividends and other expected cash flows from Ambac Assurance are highly contingent upon the financial performance of Ambac Assurance. Ambac Assurance’s financial performance is sensitive to a number of key variables, including: (i) loss estimates and loss experience; (ii) remediation and recoveries; (iii) additional value creation initiatives; (iv) the form of the Segregated Account Rehabilitation Plan, including the treatment of Segregated Account claims and Deferred Amounts; (v) investment portfolio yield and mix, including intercompany loan repayment assumptions; (vi) installment premiums and operating expenses; and (vii) value, if any, received from Ambac UK and Everspan.
The projections and other financial information provided in connection with the above-described valuation analysis were based on information available to us at that time and we have not and do not intend to update such information. Projections are inherently subject to uncertainties and risks and such projections and other financial information reflect numerous assumptions as of the date of the Disclosure Statement. Our actual results and financial condition may vary significantly from those contemplated by the projections and other financial information provided to the Bankruptcy Court.
In accordance with Fresh Start, the Company adjusted the historical carrying values of its assets, liabilities and noncontrolling interests to fair value, with the exception of deferred taxes and liabilities associated with postretirement benefits, which were recorded in accordance with the Income Taxes and Compensation Topics of the ASC, respectively. The sum of the enterprise value, the adjusted value of liabilities and the adjusted value of noncontrolling interests equals the Company’s reorganization value, which approximates the fair value of the Company’s assets. Management also evaluated, in accordance with the Business Combinations Topic of the ASC, whether there are other identifiable intangible assets to be recognized separately from goodwill and determined that no other identifiable intangible assets of a material nature, except for the insurance intangible asset related to financial guarantees, should be recognized as part of Fresh Start. The portion of the reorganization value that could not be attributed to specific tangible or identified intangible assets of the emerging company was recorded as goodwill. The reorganization value approximates the amount a willing buyer would pay for the assets of the entity, before considering liabilities or noncontrolling interests, immediately after restructuring.
The following table represents a reconciliation of the enterprise value to the reorganization value, and the determination of goodwill:
|
Enterprise value
|
$
|
185,000
|
|
|
Add: Fair value of liabilities
|
28,393,020
|
|
|
|
Add: Fair value of noncontrolling interest
|
275,415
|
|
|
|
Reorganization value allocated to assets
|
28,853,435
|
|
|
|
Less: Fair value of identified tangible and intangible assets
|
28,338,924
|
|
|
|
Reorganization value in excess of fair value of assets (goodwill)
|
$
|
514,511
|
|
99
Reorganized Condensed Consolidated Balance Sheet:
The implementation of the Reorganization Plan and the adoption of Fresh Start in the Company’s condensed consolidated balance sheet as of the Fresh Start Reporting Date are as follows:
AMBAC FINANCIAL GROUP, INC. AND SUBSIDIARIES
Reorganized Condensed Consolidated Balance Sheet (Unaudited)
As of April 30, 2013
|
(Dollars in Thousands)
|
Predecessor
Ambac
|
Reorganization
Item
Adjustments
|
Fresh Start
Adjustments
|
Successor
Ambac
|
|||||||||||
|
Assets:
|
|||||||||||||||
|
Investments
|
$
|
6,457,264
|
|
$
|
—
|
|
$
|
—
|
|
$
|
6,457,264
|
|
|||
|
Cash
|
254,851
|
|
(101,900
|
)
|
(A)
|
152,951
|
|
||||||||
|
Receivable for securities sold
|
682
|
|
682
|
|
|||||||||||
|
Investment income due and accrued
|
37,961
|
|
37,961
|
|
|||||||||||
|
Premium receivables
|
1,531,631
|
|
1,531,631
|
|
|||||||||||
|
Reinsurance recoverable on paid and unpaid losses
|
151,311
|
|
151,311
|
|
|||||||||||
|
Deferred ceded premium
|
166,212
|
|
166,212
|
|
|||||||||||
|
Subrogation recoverable
|
533,673
|
|
533,673
|
|
|||||||||||
|
Deferred acquisition costs
|
184,953
|
|
(184,953
|
)
|
(C)
|
—
|
|
||||||||
|
Loans
|
8,857
|
|
(1,575
|
)
|
(C)
|
7,282
|
|
||||||||
|
Derivative assets
|
121,643
|
|
121,643
|
|
|||||||||||
|
Current taxes
|
—
|
|
4,410
|
|
(A)
|
4,410
|
|
||||||||
|
Insurance intangible asset
|
—
|
|
1,658,972
|
|
(C)
|
1,658,972
|
|
||||||||
|
Goodwill
|
—
|
|
514,511
|
|
(C)
|
514,511
|
|
||||||||
|
Other assets
|
54,821
|
|
54,821
|
|
|||||||||||
|
Variable interest entity assets:
|
—
|
|
|||||||||||||
|
Fixed income securities, at fair value
|
2,500,565
|
|
2,500,565
|
|
|||||||||||
|
Restricted cash
|
24,150
|
|
24,150
|
|
|||||||||||
|
Investment income due and accrued
|
4,851
|
|
4,851
|
|
|||||||||||
|
Loans
|
14,758,077
|
|
(6,024
|
)
|
(C)
|
14,752,053
|
|
||||||||
|
Intangible assets
|
164,520
|
|
164,520
|
|
|||||||||||
|
Other assets
|
13,972
|
|
13,972
|
|
|||||||||||
|
Total assets
|
$
|
26,969,994
|
|
$
|
(97,490
|
)
|
$
|
1,980,931
|
|
$
|
28,853,435
|
|
|||
|
Liabilities and Stockholders’ Equity:
|
|||||||||||||||
|
Liabilities:
|
|||||||||||||||
|
Liabilities subject to compromise
|
$
|
1,704,641
|
|
$
|
(1,704,641
|
)
|
(B)
|
$
|
—
|
|
$
|
—
|
|
||
|
Unearned premiums
|
2,482,314
|
|
2,482,314
|
|
|||||||||||
|
Losses and loss expense reserve
|
6,106,345
|
|
6,106,345
|
|
|||||||||||
|
Ceded premiums payable
|
92,468
|
|
92,468
|
|
|||||||||||
|
Obligations under investment agreements
|
357,373
|
|
1,505
|
|
(C)
|
358,878
|
|
||||||||
|
Obligations under investment repurchase agreements
|
5,926
|
|
5,926
|
|
|||||||||||
|
Deferred taxes
|
1,580
|
|
1,580
|
|
|||||||||||
|
Current taxes
|
97,490
|
|
(97,490
|
)
|
(A)
|
—
|
|
||||||||
|
Long-term debt
|
155,271
|
|
(973
|
)
|
(B)
|
786,015
|
|
(C)
|
940,313
|
|
|||||
|
Accrued interest payable
|
252,788
|
|
(821
|
)
|
(B)
|
(18,091
|
)
|
(C)
|
233,876
|
|
|||||
|
Derivative liabilities
|
621,645
|
|
621,645
|
|
|||||||||||
|
Other liabilities
|
88,908
|
|
1,837
|
|
(C)
|
90,745
|
|
||||||||
|
Payable for securities purchased
|
27
|
|
27
|
|
|||||||||||
|
Variable interest entity liabilities:
|
—
|
|
|||||||||||||
|
Accrued interest payable
|
4,318
|
|
4,318
|
|
|||||||||||
|
Long-term debt
|
15,041,624
|
|
(18,586
|
)
|
(C)
|
15,023,038
|
|
||||||||
|
Derivative liabilities
|
2,425,517
|
|
2,425,517
|
|
|||||||||||
|
Other liabilities
|
6,030
|
|
6,030
|
|
|||||||||||
|
Total liabilities
|
$
|
29,444,265
|
|
$
|
(1,803,925
|
)
|
$
|
752,680
|
|
$
|
28,393,020
|
|
|||
100
|
(Dollars in Thousands)
|
Predecessor
Ambac
|
Reorganization
Item
Adjustments
|
Fresh Start
Adjustments
|
Successor
Ambac
|
|||||||||||
|
Stockholders’ (deficit) equity:
|
|||||||||||||||
|
Preferred stock
|
$
|
—
|
|
$
|
—
|
|
$
|
—
|
|
$
|
—
|
|
|||
|
Common stock-Predecessor Ambac
|
3,080
|
|
(3,080
|
)
|
(D)
|
—
|
|
||||||||
|
Common stock-Successor Ambac
|
—
|
|
450
|
|
(B)
|
450
|
|
||||||||
|
Additional paid-in capital-Predecessor Ambac
|
2,172,027
|
|
(2,172,027
|
)
|
(D)
|
—
|
|
||||||||
|
Additional paid-in capital-Successor Ambac
|
—
|
|
184,550
|
|
(B)
|
|
|
184,550
|
|
||||||
|
Accumulated other comprehensive income
|
800,260
|
|
(800,260
|
)
|
(D)
|
—
|
|
||||||||
|
Accumulated deficit
|
(5,697,961
|
)
|
1,521,435
|
|
(B)
|
4,176,526
|
|
(C) (D)
|
—
|
|
|||||
|
Common stock held in treasury at cost
|
(410,695
|
)
|
410,695
|
|
(D)
|
—
|
|
||||||||
|
Total Ambac Financial Group, Inc. stockholders’ (deficit) equity
|
(3,133,289
|
)
|
1,706,435
|
|
1,611,854
|
|
185,000
|
|
|||||||
|
Noncontrolling interest
|
659,018
|
|
(383,603
|
)
|
(D)
|
275,415
|
|
||||||||
|
Total stockholders’ (deficit) equity
|
(2,474,271
|
)
|
1,706,435
|
|
1,228,251
|
|
460,415
|
|
|||||||
|
Total liabilities and stockholders’ (deficit) equity
|
$
|
26,969,994
|
|
$
|
(97,490
|
)
|
$
|
1,980,931
|
|
$
|
28,853,435
|
|
|||
Reorganization Item Adjustments:
Items shown in the Reorganization Items column of the Reorganized Condensed Consolidated Balance Sheet above represent amounts recorded for the implementation of the Reorganization Plan on the Effective Date as described below:
|
(A)
|
Reflects the cash payment of
$101,900
to the IRS under a settlement with the IRS on the Fresh Start Reporting Date pursuant to the Reorganization Plan.
|
|
(B)
|
Reflects the discharge of liabilities subject to the Reorganization Plan, issuance of
45,000,000
and
5,047,138
shares of Successor Ambac common stock and warrants, respectively, to certain claim holders, resulting in a pre-tax gain of
$1,521,435
on extinguishment of obligations pursuant to the Reorganization Plan. The following reflects the calculation of the pre-tax gain, which was recorded as a Reorganization item on Predecessor Ambac’s Consolidated Statements of Total Comprehensive Income (Loss):
|
|
Liabilities subject to compromise
|
$
|
1,704,641
|
|
|
|
Long-term debt
|
973
|
|
(1)
|
|
|
Accrued interest payable
|
821
|
|
(1)
|
|
|
Total debt discharged
|
1,706,435
|
|
||
|
Less: Successor Ambac common stock
|
(450
|
)
|
(2)
|
|
|
Successor Ambac additional paid-in capital
|
(184,550
|
)
|
(2)
|
|
|
Pre-tax gain from cancellation and satisfaction of Predecessor Ambac debt
|
$
|
1,521,435
|
|
|
|
(1)
|
Represents the proportional reduction in the carrying value of long-term debt and associated accrued interest payable upon the discharge of $8,043 par value of Segregated Account junior surplus notes that were issued to a pre-petition creditor, One State Street, LLC (“OSS”). Pursuant to a settlement agreement (the “OSS Settlement Agreement”) to terminate the Company’s office lease with OSS and to settle all claims among the parties, the outstanding principal amount of the Segregated Account junior surplus notes issued to OSS were reduced based on the value of distribution that OSS received on account of its allowed claim in Ambac’s bankruptcy case. Refer to
|
|
(2)
|
Warrants issued in connection with the Reorganization Plan are classified as equity and initially measured at fair value. The enterprise value of
$185,000
is allocated between common stock and warrants based on their relative fair values as quoted on the Effective Date. Successor Ambac common stock of
$450
represents the par value of
45,000,000
shares of common stock issued at
$0.01
per share. Included in the Successor Ambac additional paid-in capital of
$184,550
,
$11,437
was allocated to
5,047,138
warrants at their initial fair value, with the remaining
$173,113
additional paid-in capital attributable to common stock.
|
Fresh Start Adjustments:
Items shown in the Fresh Start Adjustments column of the Reorganized Condensed Consolidated Balance Sheet above reflects (i) the fair value adjustments to assets and liabilities which are not already reported at fair value under U.S. GAAP accounting rules, including the re-measurement of deferred tax assets and liabilities, if any, which result from such adjustments and (ii) the cancellation of Predecessor Ambac equity accounts attributable to its common shareholders, including the fair value adjustment to noncontrolling interests. These adjustments are described below:
101
|
(C)
|
The following table summarizes the impact of the fresh start adjustments, which in the aggregate was recorded as a Reorganization item gain on Predecessor Ambac’s Consolidated Statements of Total Comprehensive Income (Loss):
|
|
Deferred acquisition costs
|
$
|
(184,953
|
)
|
|
Loans (non-VIE)
|
(1,575
|
)
|
|
|
Insurance intangible asset
|
1,658,972
|
|
|
|
Goodwill
|
514,511
|
|
|
|
Obligations under investment agreements
|
(1,505
|
)
|
|
|
Long-term debt and accrued interest payable
|
(767,924
|
)
|
|
|
Other liabilities
|
(1,837
|
)
|
|
|
Variable Interest Entities:
|
|||
|
VIE loans and long-term debt
|
12,562
|
|
|
|
Asset/liability fair value adjustments impacting Reorganization items
|
1,228,251
|
|
|
|
Adjustment to deferred tax provision
|
—
|
|
|
|
Gain on fresh start adjustments
|
$
|
1,228,251
|
|
|
•
|
Deferred acquisition costs
-These deferred costs do not represent future cash flows and therefore the fair value is zero at the Fresh Start Reporting Date.
|
|
•
|
Loans
-
The fair value adjustment for this line item relates to non-VIE loans that have historically been reported at their outstanding principal balance. Refer to
Note 10. Fair Value Measurements
for a discussion of the valuation methodology used to estimate fair value for each of these financial instruments. Subsequent to the Fresh Start Reporting Date, the fair value discounts are accretable to interest income using the effective interest method over the remaining lives of the loans. Fair value as of April 30, 2013 was calculated using a discounted cash flow approach. As of April 30, 2013, the loans had a principal-weighted average life of
6.81 years
and a coupon rate of .
5.01%
. Discount rates used to determine the fair value of the loans at April 30, 2013 were consistent with the credit quality of the borrowers and had a weighted average of
9.71%
.
|
|
•
|
Insurance intangible asset
-Pursuant to the business combinations guidance for insurance entities in the Financial Services-Insurance Topic of the ASC, Successor Ambac accounted for the insurance and reinsurance assets and liabilities acquired as new contracts, and measured them at fair value in two components as follows:
|
|
a.
|
Insurance and reinsurance assets and liabilities measured in accordance with Successor Ambac’s accounting policies for insurance and reinsurance contracts that it issues or holds, as further described in
|
|
b.
|
An insurance intangible asset representing the difference between: 1) the fair value of the contractual insurance and reinsurance assets acquired and liabilities assumed and 2) the amounts described in (a) above. Refer to
|
102
The significant differences between the measurement methods used for fair value and Successor Ambac’s accounting policies for insurance and reinsurance contracts which impact the magnitude of the insurance intangible asset are as follows:
|
Measurement input
|
Fair value methodology
(Refer to Note 10)
|
Successor Ambac accounting policy
(Refer to Note 2)
|
||
|
Cash flows
|
All projected cash flows to be paid and/or received under the insurance contract are based on management’s expectations of how a market participant would make such estimates.
|
Premium receipts are projected based on management’s expectations if the insured obligation is a homogenous pool of assets. For non-homogenous contracts, premium projections are based on contractual cash flows.
Loss payments, including subrogation recoveries, are projected using a probability-weighted average of all possible outcomes.
|
||
|
Discount rates
|
Discount rates are applied to
net
cash flows at the policy level as follows:
Insurance policies which are in a liability (i.e. net cash outflow) position are discounted using rates which incorporate Ambac’s own credit risk, under the assumption we will be transferring the policies to a market participant with similar credit risk.
Insurance policies which are in an asset (i.e. net cash inflow) position are discounted using a hypothetical buyer’s cost of capital and does
not
assume we would be transferring the policies to a party with similar credit risk.
|
Discount rates are applied to gross cash flows at the policy level as follows:
Premiums are discounted at the relevant risk-free rate based on the remaining expected or contractual weighted-average life of the exposure, as applicable. Losses, including subrogation recoveries, are discounted at the relevant risk-free rate. |
||
|
Profit margin
|
For insurance policies in a net liability position (i.e. net cash outflow) a profit margin is applied to the discounted value, which represents the additional consideration another market participant would require from Ambac to assume the contract. At April 30, 2013, a profit margin of 17% was applied to the discounted value of insurance policies in a net liability position.
|
No profit margin is applied.
|
||
|
•
|
Goodwill
-This amount represents the excess of the reorganization value over the fair value of identified tangible and intangible assets of the emerging company. Changes in the fair values of these assets and liabilities from the current estimated values, as well as changes in assumptions, could significantly impact the amount of recorded goodwill. Accordingly, there can be no assurance that the estimates, assumptions, and values reflected in the valuations will be realized, and actual results could vary materially. Please refer to the above table located immediately prior to the Reorganized Condensed Consolidated Balance Sheet which indicates how goodwill was determined. Refer to
Note 2.
Basis of Presentation and Significant Accounting Policies
for the subsequent accounting treatment of goodwill.
|
|
•
|
|
|
•
|
Obligations under investment agreements
-These instruments have previously been reported at their principal value less unamortized discount. We have adjusted these items to fair value for fresh start reporting. Refer to
|
|
•
|
Long-term debt and accrued interest payable
-All debt liabilities subject to the Reorganization Plan were discharged. The remaining long-term debt is primarily related to surplus notes and junior surplus notes issued by Ambac Assurance and the Segregated Account, which were carried at their face value less unamortized discount. The notes have been adjusted to estimated fair value for fresh start reporting. Refer to
Note 10.
Fair Value Measurements
for a discussion of the valuation methodology used to estimate fair value.
|
103
The fair value discount will be amortized into interest expense using the effective interest method over the lives of the respective debt. Surplus notes issued in June 2010 were valued at April 30, 2013 using a discounted cash flow approach corroborated by third party quotes. Internally estimated cash flows were discounted at
10.6%
. To the extent that the remaining surplus notes rank pari passu with the June 2010 notes, valuations were determined using projected cash flows discounted at the same
10.6%
. Junior surplus notes which cannot be paid until all principal and interest is paid on the other surplus notes were valued with projected cash flows discounted at
16.6%
.
|
•
|
Other liabilities
-This amount reflects an adjustment, based on actuarial evaluation, to re-measure the accumulated postretirement benefit obligation as of the Effective Date, as a result of application of fresh start reporting. This adjustment primarily reflects changes in mortality assumptions.
|
|
•
|
Deferred taxes
-Deferred taxes were determined in conformity with the accounting requirements for the Income Tax Topic of the ASC. As a result of Fresh Start, a new deferred tax liability was established to recognize the tax effect of the fair value adjustments to identified tangible and intangible assets of the emerging company. This deferred tax liability adjustment was offset by a reduction in the deferred tax valuation allowance, resulting in no change to the deferred tax provision.
|
|
(D)
|
Reflects the cancellation of Predecessor Ambac equity accounts attributable to its common shareholders and the fair value adjustment of noncontrolling interests, as follows:
|
|
Common stock
|
$
|
(3,080
|
)
|
|
|
Additional paid-in-capital
|
(2,172,027
|
)
|
||
|
Accumulated other comprehensive income
|
(800,260
|
)
|
||
|
Accumulated deficit
|
2,948,275
|
|
||
|
Common stock held in treasury at cost
|
410,695
|
|
||
|
Noncontrolling interest fair value adjustment
|
(383,603
|
)
|
(1)
|
|
|
Net adjustment
|
$
|
—
|
|
|
|
(1)
|
Non-controlling interest is primarily related to Ambac Assurance preferred stock issued to third parties. Non-controlling interest was adjusted to fair value based on current quotes from market sources. Noncontrolling interest is a component of equity and as a result, the fair value adjustment is a permanent item that will not be accreted into income.
|
4. SPECIAL PURPOSE ENTITIES, INCLUDING VARIABLE INTEREST ENTITIES ("VIEs")
Ambac, with its subsidiaries, has engaged in transactions with special purpose entities, including VIEs, in various capacities. Ambac most commonly provides financial guarantees, including credit derivative contracts, for various debt obligations issued by special purpose entities, including VIEs. Ambac has also sponsored two special purpose entities that issued medium-term notes to fund the purchase of certain financial assets. Ambac is also an investor in collateralized debt obligations, mortgage-backed and other asset-backed securities issued by VIEs and its ownership interest is generally insignificant to the VIE and/or Ambac does not have rights that direct the activities that are most significant to such VIE. As further described in
Note 1. Background and Business Description
, on August 28, 2014, Ambac monetized its ownership of the junior surplus note issued to it by the Segregated Account by depositing the junior surplus note into a newly formed VIE trust in exchange for cash and an owner trust certificate, which represents Ambac's right to residual cash flows from the junior surplus note. Ambac does not consolidate the VIE. Ambac reports its interest in the VIE as an equity investment within Other investments on the Consolidated Balance Sheets with associated results included within Net investment income: Other investments on the Consolidated Statements of Total Comprehensive Income (Loss).
In 2011, Ambac Assurance entered into a secured borrowing transaction under which VIEs were created for the purpose of re-securitizing certain invested assets and collateralizing the borrowing. These VIEs were consolidated because Ambac Assurance was involved in their design and held a significant amount of the beneficial interests issued by the VIEs or guaranteed the assets held by the VIEs. There was
no
VIE debt outstanding to third parties under this secured borrowing transaction as of
December 31, 2014 and 2013
. The third party debt represented the senior-most tranche of the securitization structure and was repaid from the non-insurance proceeds of certain RMBS securities which are guaranteed by Ambac Assurance. These VIE were liquidated in August 2014. Refer to
Note 11. Investments
for further discussion of the restrictions on the invested assets.
Financial Guarantees:
Ambac’s subsidiaries provide financial guarantees in respect of assets held or debt obligations of special purpose entities, including VIEs. Ambac’s primary variable interest exists through this financial guarantee insurance or credit derivative contract. The transaction structures provide certain financial protection to Ambac. This financial protection can take several forms; however, the most common are over-collateralization, first loss and excess spread. In the case of over-collateralization (i.e., the principal amount of the securitized assets exceeds the principal amount of the debt obligations guaranteed), the structure allows the transaction to experience defaults among the securitized assets before a default is experienced on the debt obligations that have been guaranteed by Ambac’s subsidiaries. In the case of first loss, the financial guarantee insurance policy or credit derivative contract only covers a senior layer of losses on assets held or debt issued by special purpose entities, including VIEs. The first loss with respect to the assets is either retained by the asset seller or sold off in the form of equity or mezzanine debt to other investors. In the case of excess spread, the securitized assets contributed to special purpose entities, including VIEs, generate interest
104
cash flows that are in excess of the interest payments on the related debt; such excess cash flow is applied to redeem debt, thus creating over-collateralization. Generally, upon deterioration in the performance of a transaction or upon an event of default as specified in the transaction legal documents, Ambac will obtain certain loss remediation rights. These rights may enable Ambac to direct the activities of the entity that most significantly impact the entity’s economic performance.
We determined that Ambac’s subsidiaries generally have the obligation to absorb a VIE's expected losses given that they have issued financial guarantees supporting the liabilities (and in certain cases assets). As further described below, we consolidated certain VIEs because: (i) we determined for certain transactions that experienced the aforementioned performance deterioration, that Ambac’s subsidiaries had the power, through voting rights or similar rights, to direct the activities of certain VIEs that most significantly impact the VIE’s economic performance because certain triggers had been breached in these transactions resulting in their ability to exercise certain loss remediation activities, or (ii) due to the passive nature of the VIEs’ activities, Ambac’s subsidiaries’ contingent loss remediation rights upon a breach of certain triggers in the future is considered to be the power to direct the activities that most significantly impact the VIEs’ economic performance. With respect to existing VIEs involving Ambac financial guarantees, Ambac is generally required to consolidate a VIE in the period that applicable triggers result in Ambac having control over the VIE’s most significant economic activities. A VIE is deconsolidated in the period that Ambac no longer has such control, which could occur in connection with insurance policies that are allocated to the Segregated Account, execution of remediation activities on the transaction or amortization of insured exposure, any of which may reduce the degree of Ambac’s control over a VIE.
Ambac Sponsored VIEs:
A subsidiary of Ambac transferred financial assets to two special purpose entities. The business purpose of these entities was to provide certain financial guarantee clients with funding for their debt obligations. These special purpose entities are legal entities that are demonstrably distinct from Ambac. Ambac, its affiliates or its agents cannot unilaterally dissolve these entities. The permitted activities of these entities are limited to those outlined below. Ambac does not consolidate these entities because Ambac Assurance’s policies issued to these entities have been allocated to the Segregated Account, thereby limiting Ambac’s control over the entities’ most significant economic activities. Ambac has elected to account for its equity interest in these entities at fair value under the fair value option in accordance with the Financial Instruments Topic of the ASC. We believe that the fair value of the investments in these entities provides for greater transparency for recording profit or loss as compared to the equity method under the Investments – Equity Method and Joint Ventures Topic of the ASC. Refer to
Note 10.. Fair Value Measurements
for further information on the valuation technique and inputs used to measure the fair value of Ambac’s equity interest in these entities. At
December 31, 2014 and 2013
the fair value of these entities are
$12,036
and
$13,384
, respectively, and is reported within Other assets on the Consolidated Balance Sheets.
Since their inception, there have been
15
individual transactions with these entities, of which
3
transactions remain outstanding as of
December 31, 2014
. Total principal amount of debt outstanding was
$457,960
and
$461,355
at
December 31, 2014 and 2013
, respectively. In each case, Ambac sold assets to these entities. The assets are composed of utility obligations with a weighted average rating of
BBB
at
December 31, 2014
and weighted average life of
6.8 years
. The purchase by these entities of financial assets was financed through the issuance of medium-term notes (“MTNs”), which are cross-collateralized by the purchased assets. The MTNs have the same expected weighted average life as the purchased assets. Derivative contracts (interest rate swaps) are used within the entities for economic hedging purposes only. Derivative positions were established at the time MTNs were issued to purchase financial assets. The activities of these entities are contractually limited to purchasing assets from Ambac, issuing MTNs to fund such purchase, executing derivative hedges and obtaining financial guarantee policies with respect to indebtedness incurred. As of
December 31, 2014
Ambac Assurance had financial guarantee insurance policies issued for all assets, MTNs and derivative contracts owned and outstanding by the entities.
Insurance premiums paid to Ambac Assurance by these entities are earned in a manner consistent with other insurance policies, over the risk period. Additionally, any losses incurred on such insurance policies are included in Ambac’s Consolidated Statements of Total Comprehensive Income (Loss). Under the terms of an Administrative Agency Agreement, Ambac provides certain administrative duties, primarily collecting amounts due on the obligations and making interest payments on the MTNs.
Successor Ambac was not presented with claims on insurance policies issued to these entities for the
year ended
December 31, 2014
or the eight months ended
December 31, 2013
. Predecessor Ambac was not presented with claims on insurance policies issued to these entities for the four months ended April 30, 2013 or the
year ended
December 31, 2012
. Successor Ambac received recoveries of
$988
for the
year ended
December 31, 2014
and
$2,747
for the eight months ended
December 31, 2013
, in respect of previously paid claims. Predecessor Ambac received recoveries of
$1,455
for the four months ended April 30, 2013, and
$14,691
for the
year ended
December 31, 2012
, in respect of previously paid claims.
Consolidation of VIEs:
Upon initial consolidation of a VIE, we recognize a gain or loss in earnings for the difference between: (i) the fair value of the consideration paid, the fair value of any non-controlling interests and the reported amount of any previously held interests and (ii) the net amount, as measured on a fair value basis, of the assets and liabilities consolidated. Upon deconsolidation of a VIE, we recognize a gain or loss for the difference between: (i) the fair value of any consideration received, the fair value of any retained non-controlling investment in the VIE and the carrying amount of any non-controlling interest in the VIE and (ii) the carrying amount of the VIE’s assets and liabilities. Gains or losses from consolidation and deconsolidation that are reported in earnings are reported within Income (loss) on variable interest entities on the Consolidated Statements of Total Comprehensive Income (Loss).
105
The variable interest in a VIE generally involves one or more of the following: a financial guarantee policy issued to the VIE, a written credit derivative contract that references liabilities of the VIE or an investment in securities issued by the VIE. The impact of consolidating such VIEs on Ambac’s balance sheet is the elimination of transactions between the consolidated VIEs and Ambac’s operating subsidiaries and the inclusion of the VIE’s third party assets and liabilities. For a financial guarantee insurance policy issued to a consolidated VIE, Ambac does not reflect the financial guarantee insurance policy in accordance with the related insurance accounting rules under the Financial Services – Insurance Topic of the ASC. Consequently, upon consolidation, Ambac eliminates the insurance assets and liabilities associated with the policy from the Consolidated Balance Sheets. Such insurance assets and liabilities may include premium receivables, reinsurance recoverable, deferred ceded premium, subrogation recoverable, unearned premiums, loss and loss expense reserves, ceded premiums payable and insurance intangible assets. For investment securities owned by Ambac that are debt instruments issued by the VIE, the investment securities balance is eliminated upon consolidation. Ambac did not consolidate any VIEs solely as a result of purchases of the VIE’s debt instruments.
As of
December 31, 2014
consolidated VIE assets and liabilities relating to
15
consolidated entities were
$15,126,110
and
$15,085,685
, respectively. As of
December 31, 2013
, consolidated VIE assets and liabilities relating to
18
consolidated entities were
$15,988,697
and
$15,872,770
, respectively. Ambac is not primarily liable for, and does not guarantee all of the debt obligations issued by the VIEs. Ambac would only be required to make payments on the guaranteed debt obligations in the event that the issuer of such debt obligations defaults on any principal or interest due. Additionally, Ambac’s creditors do not have rights with regard to the assets of the VIEs. Ambac evaluates the net income effects and earnings per share effects to determine attributions between Ambac and non-controlling interests as a result of consolidating a VIE. Ambac has determined that the net changes in fair value of most consolidated VIE assets and liabilities are attributable to Ambac due to Ambac’s interest through financial guarantee premium and loss payments with the VIE.
The financial reports of certain VIEs are prepared by outside trustees and are not available within the time constraints Ambac requires to ensure the financial accuracy of the operating results. As such, the financial results of certain VIEs are consolidated on a time lag that is no longer than 90 days.
The table below provides the fair value of fixed income securities, by asset-type, held by consolidated VIEs as of
December 31, 2014 and 2013
:
|
December 31,
|
|||||||
|
2014
|
2013
|
||||||
|
Investments:
|
|||||||
|
Corporate obligations
|
$
|
2,743,050
|
|
$
|
2,475,182
|
|
|
|
Total variable interest entity assets: fixed income securities
|
$
|
2,743,050
|
|
$
|
2,475,182
|
|
|
The following table provides supplemental information about the loans held as assets and long-term debt associated with the VIEs for which the fair value option has been elected as of
December 31, 2014 and 2013
:
|
Estimated fair value
|
Unpaid principal balance
|
||||||
|
December 31, 2014
|
|||||||
|
Loans
|
$
|
12,371,177
|
|
$
|
10,236,695
|
|
|
|
Long-term debt
|
12,882,076
|
|
11,925,499
|
|
|||
|
December 31, 2013
|
|||||||
|
Loans
|
13,398,895
|
|
12,226,481
|
|
|||
|
Long-term debt
|
$
|
14,091,753
|
|
$
|
14,251,771
|
|
|
Effective
April 30, 2013
, Ambac was required to consolidate a VIE which resulted in a gain of
$385,291
reported in Predecessor Ambac included in Income (loss) on variable interest entities on the Consolidated Statements of Total Comprehensive Income (Loss). The assets of this VIE consisted primarily of identified intangible assets associated with its subsidiaries’ operations. The intangible assets recorded at fair value upon consolidation on
April 30, 2013
were
$164,520
and were considered held for use. The intangible assets were being amortized over their estimated useful lives resulting in a weighted-average amortization period at the consolidation date of
16 years
. Amortization expense for intangible assets for the eight months ended
December 31, 2013
was
$5,015
, and is included in Income (loss) on variable interest entities on the Consolidated Statements of Total Comprehensive Income (Loss). During 2013, management approved plans to sell the VIE intangible assets. Such assets were reclassified as held for sale and their carrying value was reduced to fair value less costs to sell of
$76,140
as of
December 31, 2013
. In
2014
, such intangible assets were sold.
During 2014, Ambac deconsolidated three VIEs; one as a result of the termination of the associated financial guarantee exposure and two associated with a fully repaid secured borrowing transaction. There was no gain or loss resulting from these deconsolidations. During the eight months ended
December 31, 2013
. Ambac deconsolidated a VIE, resulting in a loss of
$15,273
reported in Income (loss) on variable interest entities. During 2012, Ambac deconsolidated a VIE. There was no gain or loss resulting from this deconsolidation.
106
Variable Interests in Non-Consolidated VIEs
The following table displays the carrying amount of the assets, liabilities and maximum exposure to loss of Ambac’s variable interests in non-consolidated VIEs resulting from financial guarantee and derivative contracts by major underlying asset classes, as of
December 31, 2014 and 2013
:
|
Carrying Value of Assets and Liabilities
|
|||||||||||||||
|
Maximum
Exposure To Loss (1) |
Insurance
Assets (2) |
Insurance
Liabilities (3) |
Net Derivative
Assets (Liabilities) (4) |
||||||||||||
|
December 31, 2014:
|
|||||||||||||||
|
Global structured finance:
|
|||||||||||||||
|
Collateralized debt obligations
|
$
|
1,386,100
|
|
$
|
345
|
|
$
|
4,000
|
|
$
|
(145,565
|
)
|
|||
|
Mortgage-backed—residential
|
16,202,408
|
|
1,011,888
|
|
2,924,987
|
|
—
|
|
|||||||
|
Other consumer asset-backed
|
5,109,776
|
|
65,204
|
|
885,572
|
|
(36,877
|
)
|
|||||||
|
Other commercial asset-backed
|
3,119,891
|
|
135,215
|
|
128,988
|
|
—
|
|
|||||||
|
Other
|
3,801,382
|
|
97,345
|
|
599,915
|
|
18,176
|
|
|||||||
|
Total global structured finance
|
29,619,557
|
|
1,309,997
|
|
4,543,462
|
|
(164,266
|
)
|
|||||||
|
Global public finance
|
31,639,004
|
|
457,774
|
|
533,192
|
|
(22,135
|
)
|
|||||||
|
Total
|
$
|
61,258,561
|
|
$
|
1,767,771
|
|
$
|
5,076,654
|
|
$
|
(186,401
|
)
|
|||
|
December 31, 2013:
|
|||||||||||||||
|
Global structured finance:
|
|||||||||||||||
|
Collateralized debt obligations
|
$
|
2,317,612
|
|
$
|
3,867
|
|
$
|
7,119
|
|
$
|
(102,704
|
)
|
|||
|
Mortgage-backed—residential
|
19,231,335
|
|
581,498
|
|
3,890,937
|
|
—
|
|
|||||||
|
Other consumer asset-backed
|
5,425,583
|
|
68,511
|
|
992,177
|
|
(39,916
|
)
|
|||||||
|
Other commercial asset-backed
|
7,237,953
|
|
429,559
|
|
559,600
|
|
—
|
|
|||||||
|
Other
|
4,347,287
|
|
113,468
|
|
608,213
|
|
8,324
|
|
|||||||
|
Total global structured finance
|
38,559,770
|
|
1,196,903
|
|
6,058,046
|
|
(134,296
|
)
|
|||||||
|
Global public finance
|
35,732,858
|
|
531,519
|
|
604,339
|
|
(27,112
|
)
|
|||||||
|
Total
|
$
|
74,292,628
|
|
$
|
1,728,422
|
|
$
|
6,662,385
|
|
$
|
(161,408
|
)
|
|||
|
(1)
|
Maximum exposure to loss represents the maximum future payments of principal and interest on insured obligations and derivative contracts. Ambac’s maximum exposure to loss does not include accrued and unpaid interest on Deferred Amounts nor the benefit of any financial instruments (such as reinsurance or hedge contracts) that Ambac may utilize to mitigate the risks associated with these variable interests.
|
|
(2)
|
Insurance assets represent the amount recorded in “Premium receivables” and “Subrogation recoverable” for financial guarantee contracts on Ambac’s Consolidated Balance Sheets.
|
|
(3)
|
Insurance liabilities represent the amount recorded in “Loss and loss expense reserves” and “Unearned premiums” for financial guarantee contracts on Ambac’s Consolidated Balance Sheets.
|
|
(4)
|
Net derivative assets (liabilities) represent the fair value recognized on credit derivative contracts and interest rate swaps on Ambac’s Consolidated Balance Sheets.
|
107
5. COMPREHENSIVE INCOME
The following tables detail the changes in the balances of each component of accumulated other comprehensive income for the affected periods:
|
Unrealized Gains
(Losses) on Available- for Sale Securities (1) |
Amortization of
Postretirement Benefit (1) |
Gain (Loss) on
Foreign Currency Translation (1) |
Total
|
||||||||||||
|
Successor Ambac
|
|||||||||||||||
|
Year Ended December 31, 2014
|
|||||||||||||||
|
Beginning Balance
|
$
|
(41,910
|
)
|
$
|
10,847
|
|
$
|
42,724
|
|
$
|
11,661
|
|
|||
|
Other comprehensive income before reclassifications
|
285,565
|
|
—
|
|
(43,165
|
)
|
242,400
|
|
|||||||
|
Amounts reclassified from accumulated other comprehensive income
|
(32,962
|
)
|
(816
|
)
|
—
|
|
(33,778
|
)
|
|||||||
|
Net current period other comprehensive income (loss)
|
252,603
|
|
(816
|
)
|
(43,165
|
)
|
208,622
|
|
|||||||
|
Balance at December 31, 2014
|
$
|
210,693
|
|
$
|
10,031
|
|
$
|
(441
|
)
|
$
|
220,283
|
|
|||
|
Successor Ambac
|
|||||||||||||||
|
Period from May 1 to December 31, 2013
|
|||||||||||||||
|
Beginning Balance
|
$
|
—
|
|
$
|
—
|
|
$
|
—
|
|
$
|
—
|
|
|||
|
Other comprehensive income before reclassifications
|
(85,641
|
)
|
10,847
|
|
42,724
|
|
(32,070
|
)
|
|||||||
|
Amounts reclassified from accumulated other comprehensive income
|
43,731
|
|
—
|
|
—
|
|
43,731
|
|
|||||||
|
Net current period other comprehensive income (loss)
|
(41,910
|
)
|
10,847
|
|
42,724
|
|
11,661
|
|
|||||||
|
Balance at December 31, 2013
|
$
|
(41,910
|
)
|
$
|
10,847
|
|
$
|
42,724
|
|
$
|
11,661
|
|
|||
|
Predecessor Ambac
|
|||||||||||||||
|
Period from January 1 through April 30, 2013
|
|||||||||||||||
|
Beginning Balance
|
$
|
651,272
|
|
$
|
(5,860
|
)
|
$
|
(20,027
|
)
|
$
|
625,385
|
|
|||
|
Other comprehensive income before reclassifications
|
188,212
|
|
—
|
|
(657
|
)
|
187,555
|
|
|||||||
|
Amounts reclassified from accumulated other comprehensive income
|
(12,865
|
)
|
185
|
|
—
|
|
(12,680
|
)
|
|||||||
|
Elimination of Predecessor Ambac Shareholder Equity Accounts
(2)
|
(826,619
|
)
|
5,675
|
|
20,684
|
|
(800,260
|
)
|
|||||||
|
Net current period other comprehensive income (loss)
|
(651,272
|
)
|
5,860
|
|
20,027
|
|
(625,385
|
)
|
|||||||
|
Balance at April 30, 2013
|
$
|
—
|
|
$
|
—
|
|
$
|
—
|
|
$
|
—
|
|
|||
(1) All amounts are net of tax and noncontrolling interest. Amounts in parentheses indicate debits.
(2) See
Note 3. Fresh Start Financial Statement Reporting
for additional details.
108
The following table details the significant amounts reclassified from each component of accumulated other comprehensive income for the affected periods:
|
Amount Reclassified from Accumulated
Other Comprehensive Income (1) |
|||||||||||||||
|
Successor Ambac
|
Predecessor Ambac
|
||||||||||||||
|
Period from May 1
|
Period from January 1
|
Affected Line Item in the
|
|||||||||||||
|
Details about Accumulated Other
|
Year Ended
|
through
|
through
|
Consolidated Statement of
|
|||||||||||
|
Comprehensive Income Components
|
December 31, 2014
|
December 31, 2013
|
April 30, 2013
|
Total Comprehensive Income
|
|||||||||||
|
Unrealized Gains (Losses) on Available-for-Sale Securities
|
|||||||||||||||
|
$
|
(32,962
|
)
|
$
|
43,731
|
|
$
|
(12,865
|
)
|
Net realized investment gains
|
||||||
|
—
|
|
—
|
|
—
|
|
Tax (expense) benefit
|
|||||||||
|
$
|
(32,962
|
)
|
$
|
43,731
|
|
$
|
(12,865
|
)
|
Net of tax and noncontrolling interest
(3)
|
||||||
|
Amortization of Postretirement Benefit
|
|||||||||||||||
|
Prior service cost
|
$
|
(664
|
)
|
$
|
—
|
|
$
|
1,616
|
|
Underwriting and operating expenses
(2)
|
|||||
|
Actuarial gains (losses)
|
(152
|
)
|
—
|
|
(727
|
)
|
Underwriting and operating expenses
(2)
|
||||||||
|
(816
|
)
|
—
|
|
889
|
|
Total before tax
|
|||||||||
|
—
|
|
—
|
|
(704
|
)
|
Tax (expense) benefit
|
|||||||||
|
$
|
(816
|
)
|
$
|
—
|
|
$
|
185
|
|
Net of tax and noncontrolling interest
(3)
|
||||||
|
Total reclassifications for the period
|
$
|
(33,778
|
)
|
$
|
43,731
|
|
$
|
(12,680
|
)
|
Net of tax and noncontrolling interest
(3)
|
|||||
|
(1)
|
Amounts in parentheses indicate debits to the Consolidated Statement of Comprehensive Income.
|
|
(2)
|
These accumulated other comprehensive income components are included in the computation of net periodic benefit cost.
|
|
(3)
|
Amount agrees with amount reported as reclassifications from AOCI in the disclosure about changes in AOCI balances.
|
6. NET INCOME PER SHARE
Predecessor Ambac common stock (and related stock options and restricted stock units) was canceled upon emergence from bankruptcy on the Effective Date. Pursuant to the Reorganization Plan,
45,000,000
shares of new common stock at par value of
$0.01
per share and
5,047,138
warrants were issued. Warrants entitle such holders to acquire up to
5,047,138
shares of new common stock at an exercise price of
$16.67
per share at any time on or prior to
April 30, 2023
. For the years ended
December 31, 2014 and 2013
,
949
and
6,312
warrants, respectively, were exercised, resulting in an issuance of
949
and
2,524
shares of common stock for the years ended
December 31, 2014 and 2013
. As of
December 31, 2014
, Successor Ambac had
5,039,877
warrants outstanding. The earnings per share information for Predecessor Ambac is not meaningful to investors in Successor Ambac’s common stock and warrants.
Basic net income per share is computed by dividing net income attributable to common shareholders by the weighted-average number of common shares outstanding and vested restricted stock units. Diluted net income per share is computed by dividing net income attributable to common shareholders by the weighted-average number of common shares outstanding plus all potential dilutive common shares outstanding during the period. All potential dilutive common shares outstanding consider common stock deliverable pursuant to warrants issued under the Reorganization Plan and unvested options, restricted stock units and performance stock units granted under employee and director compensation plans.
109
The following table provides a reconciliation of the common shares used for basic net income per share to the diluted shares used for diluted net income per share:
|
Successor Ambac
|
Predecessor Ambac
|
|||||||||||
|
Period from May 1
|
Period from January 1
|
|||||||||||
|
Year Ended
|
through
|
through
|
Year Ended
|
|||||||||
|
December 31, 2014
|
December 31, 2013
|
April 30, 2013
|
December 31, 2012
|
|||||||||
|
Weighted average number of common shares used for basic earnings per share
|
45,093,304
|
|
45,003,925
|
|
302,469,544
|
|
302,468,867
|
|
||||
|
Effect of potential dilutive shares:
|
||||||||||||
|
Warrants
|
1,786,804
|
|
1,297,620
|
|
—
|
|
—
|
|
||||
|
Stock options
|
9,807
|
|
—
|
|
—
|
|
—
|
|
||||
|
Restricted stock units
|
37,812
|
|
1,189
|
|
109,701
|
|
—
|
|
||||
|
Performance stock units
|
5,526
|
|
—
|
|
—
|
|
—
|
|
||||
|
Weighted average number of common shares and potential dilutive shares used for diluted earnings per share
|
46,933,253
|
|
46,302,734
|
|
302,579,245
|
|
302,468,867
|
|
||||
|
Anti-dilutive shares excluded from the above reconciliation:
|
||||||||||||
|
Warrants
|
—
|
|
—
|
|
—
|
|
—
|
|
||||
|
Stock options
|
—
|
|
855
|
|
475,550
|
|
805,999
|
|
||||
|
Restricted stock units
|
—
|
|
—
|
|
—
|
|
71,295
|
|
||||
|
Performance stock units
|
—
|
|
—
|
|
—
|
|
—
|
|
||||
7. FINANCIAL GUARANTEES IN FORCE
Financial guarantees outstanding includes the exposures of policies that insure variable interest entities (“VIEs”) consolidated in accordance with ASC Topic 810,
Consolidation.
Financial guarantees outstanding excludes the exposures of policies that insure bonds which have been called, pre-refunded or refunded. The gross par amount of financial guarantees outstanding was
$159,688,000
and
$197,691,000
at
December 31, 2014 and 2013
, respectively. The par amount of financial guarantees outstanding, net of reinsurance, was
$144,734,000
and
$179,092,000
at
December 31, 2014 and 2013
, respectively.
110
As of
December 31, 2014 and 2013
, the guarantee portfolio was diversified by type of guaranteed bond as shown in the following table:
|
Net Par Amount Outstanding
|
|||||||
|
December 31,
|
|||||||
|
2014
|
2013
|
||||||
|
Public Finance:
|
|||||||
|
Lease and tax-backed revenue
|
$
|
33,411,000
|
|
$
|
41,858,000
|
|
|
|
General obligation
|
22,699,000
|
|
29,115,000
|
|
|||
|
Utility revenue
|
11,687,000
|
|
14,933,000
|
|
|||
|
Transportation revenue
|
7,738,000
|
|
9,653,000
|
|
|||
|
Housing revenue
|
7,108,000
|
|
7,439,000
|
|
|||
|
Higher education
|
6,389,000
|
|
7,810,000
|
|
|||
|
Health care revenue
|
3,106,000
|
|
3,903,000
|
|
|||
|
Other
|
1,310,000
|
|
1,351,000
|
|
|||
|
Total Public Finance
|
93,448,000
|
|
116,062,000
|
|
|||
|
Structured Finance:
|
|||||||
|
Mortgage-backed and home equity
|
13,686,000
|
|
16,026,000
|
|
|||
|
Investor-owned utilities
|
5,411,000
|
|
5,881,000
|
|
|||
|
Student loan
|
3,390,000
|
|
4,357,000
|
|
|||
|
Asset-backed
(1)
|
1,335,000
|
|
2,361,000
|
|
|||
|
CDOs
|
637,000
|
|
897,000
|
|
|||
|
Other
|
1,875,000
|
|
1,890,000
|
|
|||
|
Total Structured Finance
|
26,334,000
|
|
31,412,000
|
|
|||
|
International Finance:
|
|||||||
|
Investor-owned and public utilities
|
8,455,000
|
|
9,595,000
|
|
|||
|
Sovereign/sub-sovereign
|
6,758,000
|
|
7,394,000
|
|
|||
|
Asset-backed
(1)
|
4,442,000
|
|
6,884,000
|
|
|||
|
Transportation
|
3,425,000
|
|
5,021,000
|
|
|||
|
Mortgage-backed and home equity
|
410,000
|
|
484,000
|
|
|||
|
CDOs
|
233,000
|
|
822,000
|
|
|||
|
Other
|
1,229,000
|
|
1,418,000
|
|
|||
|
Total International Finance
|
24,952,000
|
|
31,618,000
|
|
|||
|
Total
|
$
|
144,734,000
|
|
$
|
179,092,000
|
|
|
|
(1)
|
At
December 31, 2014 and 2013
, all asset-backed net par amounts outstanding relate to commercial asset-based transactions.
|
As of
December 31, 2014 and 2013
, the International Finance guaranteed portfolio is shown in the following table by location of risk:
|
Net Par Amount Outstanding
|
|||||||
|
December 31,
|
|||||||
|
2014
|
2013
|
||||||
|
United Kingdom
|
$
|
17,998,000
|
|
$
|
21,282,000
|
|
|
|
Australia
|
2,168,000
|
|
3,331,000
|
|
|||
|
Italy
|
1,415,000
|
|
2,412,000
|
|
|||
|
Austria
|
841,000
|
|
967,000
|
|
|||
|
New Zealand
|
459,000
|
|
526,000
|
|
|||
|
Internationally diversified
(1)
|
1,225,000
|
|
1,918,000
|
|
|||
|
Other international
|
846,000
|
|
1,182,000
|
|
|||
|
Total International Finance
|
$
|
24,952,000
|
|
$
|
31,618,000
|
|
|
|
(1)
|
Internationally diversified obligations represent pools of geographically diversified exposures which may include components of U.S. exposure.
|
Gross financial guarantees in force (principal and interest) was
$253,383,000
and
$312,710,000
at
December 31, 2014 and 2013
, respectively. Net financial guarantees in force (after giving effect to reinsurance) was
$228,890,000
and
$282,210,000
as of
December 31, 2014 and 2013
, respectively.
111
In the United States,
California
and
New York
were the states with the highest aggregate net par amounts in force, accounting for
14.3%
and
6.4%
of the total at
December 31, 2014
, respectively. No other state accounted for more than
5.0%
. The highest single insured risk represented
1.4%
of the aggregate net par amount guaranteed.
8. FINANCIAL GUARANTEE INSURANCE CONTRACTS
Amounts presented in this Note relate only to Ambac’s non-derivative insurance business for insurance policies issued to beneficiaries, including VIEs, for which we do not consolidate the VIE.
Net Premiums Earned:
Below is the gross premium receivable roll-forward (direct and assumed contracts) for the affected periods:
|
Successor Ambac
|
Predecessor Ambac
|
|||||||||||||||
|
|
Period from May 1
|
Period from January 1
|
||||||||||||||
|
Year Ended
|
through
|
through
|
Year Ended
|
|||||||||||||
|
December 31, 2014
|
December 31, 2013
|
April 30, 2013
|
December 31, 2012
|
|||||||||||||
|
Beginning premium receivable
|
$
|
1,453,021
|
|
$
|
1,531,631
|
|
$
|
1,620,621
|
|
$
|
2,028,479
|
|
||||
|
Premium receipts
|
(126,497
|
)
|
(82,071
|
)
|
(48,296
|
)
|
(155,626
|
)
|
||||||||
|
Adjustments for changes in expected and contractual cash flows
|
(322,443
|
)
|
(91,241
|
)
|
(28,237
|
)
|
(299,906
|
)
|
||||||||
|
Accretion of premium receivable discount
|
36,651
|
|
26,184
|
|
14,740
|
|
50,407
|
|
||||||||
|
Deconsolidation of certain VIEs
|
—
|
|
45,883
|
|
—
|
|
—
|
|
||||||||
|
Uncollectable premiums
|
(2,518
|
)
|
(15,262
|
)
|
(634
|
)
|
(28,031
|
)
|
||||||||
|
Other adjustments (including foreign exchange)
|
(37,607
|
)
|
37,897
|
|
(26,563
|
)
|
25,298
|
|
||||||||
|
Ending premium receivable
|
$
|
1,000,607
|
|
$
|
1,453,021
|
|
$
|
1,531,631
|
|
$
|
1,620,621
|
|
||||
Generally, the priority for the payment of financial guarantee premiums to Ambac, as required by the bond indentures of the insured obligations, is very senior in the waterfall. Additionally, in connection with the allocation of certain liabilities to the Segregated Account, trustees are required under the Segregated Account Rehabilitation Plan and related court orders to continue to pay installment premiums, notwithstanding the Segregated Account Rehabilitation Proceedings. In evaluating the credit quality of the premium receivables, management evaluates the transaction waterfall structures and the internal ratings of the transactions underlying the premium receivables. As of
December 31, 2014 and 2013
, approximately
32%
and
44%
of the premium receivables related to transactions with non-investment grade internal ratings, comprised mainly of non-investment grade RMBS, student loan transactions and a certain asset-backed transaction, which comprised
7%
,
8%
, and
0%
of the total premium receivables at
December 31, 2014
and
7%
,
7%
and
17%
of the total premium receivables at
December 31, 2013
, respectively. At
December 31, 2014 and 2013
,
$17,780
and
$15,262
respectively, of premium receivables were deemed uncollectable. Past due premiums on policies insuring non-investment grade obligations amounted to less than
$500
at
December 31, 2014
.
The effect of reinsurance on premiums written and earned was as follows:
|
Successor Ambac
|
||||||||||||||||
|
Year Ended
|
Period from May 1 through
|
|||||||||||||||
|
December 31, 2014
|
December 31, 2013
|
|||||||||||||||
|
Written
|
Earned
|
Written
|
Earned
|
|||||||||||||
|
Direct
|
$
|
(288,310
|
)
|
$
|
261,634
|
|
$
|
(80,309
|
)
|
$
|
226,326
|
|
||||
|
Assumed
|
—
|
|
137
|
|
—
|
|
65
|
|
||||||||
|
Ceded
|
(6,842
|
)
|
15,411
|
|
(7,810
|
)
|
12,873
|
|
||||||||
|
Net premiums
|
$
|
(281,468
|
)
|
$
|
246,360
|
|
$
|
(72,499
|
)
|
$
|
213,518
|
|
||||
|
Predecessor Ambac
|
||||||||||||||||
|
Period from January 1 through
|
Year Ended
|
|||||||||||||||
|
April 30, 2013
|
December 31, 2012
|
|||||||||||||||
|
Written
|
Earned
|
Written
|
Earned
|
|||||||||||||
|
Direct
|
$
|
(14,125
|
)
|
$
|
138,468
|
|
$
|
(277,508
|
)
|
$
|
434,488
|
|
||||
|
Assumed
|
—
|
|
32
|
|
—
|
|
155
|
|
||||||||
|
Ceded
|
(1,098
|
)
|
8,500
|
|
(23,371
|
)
|
20,039
|
|
||||||||
|
Net premiums
|
$
|
(13,027
|
)
|
$
|
130,000
|
|
$
|
(254,137
|
)
|
$
|
414,604
|
|
||||
112
Successor Ambac’s accelerated premium revenue for retired obligations for the
year ended
December 31, 2014
and the eight months ended
December 31, 2013
were
$29,964
and
$56,541
, respectively. Predecessor Ambac’s accelerated premium revenue for retired obligations for the four months ended
April 30, 2013
and for the year ended
December 31, 2012
were
$36,433
and
$127,628
, respectively.
The table below summarizes the future gross undiscounted premiums to be collected and future premiums earned, net of reinsurance at
December 31, 2014
:
|
Future premiums
to be collected (1) |
Future
premiums to be earned net of reinsurance (1) |
||||||
|
Three months ended:
|
|||||||
|
March 31, 2015
|
$
|
25,413
|
|
$
|
38,161
|
|
|
|
June 30, 2015
|
22,681
|
|
37,272
|
|
|||
|
September 30, 2015
|
23,415
|
|
35,279
|
|
|||
|
December 31, 2015
|
22,739
|
|
33,840
|
|
|||
|
Twelve months ended:
|
|||||||
|
December 31, 2016
|
87,454
|
|
125,754
|
|
|||
|
December 31, 2017
|
81,156
|
|
113,937
|
|
|||
|
December 31, 2018
|
76,245
|
|
105,115
|
|
|||
|
December 31, 2019
|
72,404
|
|
97,864
|
|
|||
|
Five years ended:
|
|||||||
|
December 31, 2024
|
320,870
|
|
401,094
|
|
|||
|
December 31, 2029
|
267,513
|
|
282,294
|
|
|||
|
December 31, 2034
|
194,711
|
|
175,689
|
|
|||
|
December 31, 2039
|
76,970
|
|
69,030
|
|
|||
|
December 31, 2044
|
24,577
|
|
23,197
|
|
|||
|
December 31, 2049
|
9,570
|
|
9,797
|
|
|||
|
December 31, 2054
|
1,244
|
|
2,184
|
|
|||
|
December 31, 2059
|
5
|
|
2
|
|
|||
|
Total
|
$
|
1,306,967
|
|
$
|
1,550,509
|
|
|
|
(1)
|
Future premiums to be collected is undiscounted and relates to the discounted premium receivable asset recorded on Ambac's balance sheet. Future premiums to be earned, net of reinsurance relate to the unearned premium liability and deferred ceded premium asset recorded on Ambac’s balance sheet. The use of contractual lives for many bond types which do not have homogeneous pools of underlying collateral is required in the calculation of the premium receivable as described
|
Loss and Loss Expense Reserves:
A loss reserve is recorded on the balance sheet on a policy-by-policy basis as further described in Note 2.
Basis of Presentation and Significant Accounting Policies
. Below are the components of the Loss and loss expense reserves liability and the Subrogation recoverable asset at
December 31, 2014 and 2013
:
|
Unpaid Claims
|
Present Value of Expected
Net Cash Flows |
||||||||||||||||||||||
|
Balance Sheet Line Item
|
Claims
|
Accrued
Interest |
Claims and
Loss Expenses |
Recoveries
|
Unearned
Premium Revenue |
Gross Loss and
Loss Expense Reserves |
|||||||||||||||||
|
December 31, 2014:
|
|||||||||||||||||||||||
|
Loss and loss expense reserves
|
$
|
2,172,041
|
|
$
|
234,802
|
|
$
|
3,792,133
|
|
$
|
(1,205,621
|
)
|
$
|
(241,348
|
)
|
$
|
4,752,007
|
|
|||||
|
Subrogation recoverable
|
772,948
|
|
94,425
|
|
197,751
|
|
(2,018,398
|
)
|
—
|
|
(953,274
|
)
|
|||||||||||
|
Totals
|
$
|
2,944,989
|
|
$
|
329,227
|
|
$
|
3,989,884
|
|
$
|
(3,224,019
|
)
|
$
|
(241,348
|
)
|
$
|
3,798,733
|
|
|||||
|
December 31, 2013:
|
|||||||||||||||||||||||
|
Loss and loss expense reserves
|
$
|
3,374,224
|
|
$
|
—
|
|
$
|
4,895,277
|
|
$
|
(1,797,805
|
)
|
$
|
(502,984
|
)
|
$
|
5,968,712
|
|
|||||
|
Subrogation recoverable
|
530,091
|
|
—
|
|
135,610
|
|
(1,164,179
|
)
|
—
|
|
(498,478
|
)
|
|||||||||||
|
Totals
|
$
|
3,904,315
|
|
$
|
—
|
|
$
|
5,030,887
|
|
$
|
(2,961,984
|
)
|
$
|
(502,984
|
)
|
$
|
5,470,234
|
|
|||||
113
Below is the loss and loss expense reserve roll-forward, net of subrogation recoverable and reinsurance, for the affected periods:
|
Successor Ambac
|
Predecessor Ambac
|
|||||||||||||||
|
|
Period from May 1
|
Period from January 1
|
||||||||||||||
|
Year Ended
|
through
|
through
|
Year Ended
|
|||||||||||||
|
December 31, 2014
|
December 31, 2013
|
April 30, 2013
|
December 31, 2012
|
|||||||||||||
|
Beginning gross loss and loss expense reserves
|
$
|
5,470,234
|
|
$
|
5,572,672
|
|
$
|
6,122,140
|
|
$
|
6,384,260
|
|
||||
|
Less reinsurance on loss and loss expense reserves
|
122,357
|
|
138,155
|
|
$
|
147,409
|
|
$
|
153,480
|
|
||||||
|
Beginning balance of net loss and loss expense reserves
|
$
|
5,347,877
|
|
$
|
5,434,517
|
|
$
|
5,974,731
|
|
$
|
6,230,780
|
|
||||
|
Changes in the loss and loss expense reserves due to:
|
||||||||||||||||
|
Current year:
|
||||||||||||||||
|
Establishment of new loss and loss expense reserves, gross of RMBS subrogation and net of reinsurance
|
309
|
|
97,342
|
|
2,748
|
|
464,058
|
|
||||||||
|
Claim and loss expense payments, net of subrogation and reinsurance
|
(17
|
)
|
(442
|
)
|
(58
|
)
|
(20,765
|
)
|
||||||||
|
Establishment of RMBS subrogation recoveries, net of reinsurance
|
—
|
|
(315
|
)
|
(159
|
)
|
—
|
|
||||||||
|
Total current year
|
292
|
|
96,585
|
|
2,531
|
|
443,293
|
|
||||||||
|
Prior years:
|
||||||||||||||||
|
Change in previously established loss and loss expense reserves, gross of RMBS subrogation and net of reinsurance
|
(269,606
|
)
|
(514,728
|
)
|
(52,642
|
)
|
72,700
|
|
||||||||
|
Claim and loss expense (payments) recoveries, net of subrogation and reinsurance
|
(1,067,321
|
)
|
59,184
|
|
20,902
|
|
(944,860
|
)
|
||||||||
|
(Increase) decrease in previously established RMBS subrogation recoveries, net of reinsurance
|
(312,864
|
)
|
272,319
|
|
(12,596
|
)
|
172,818
|
|
||||||||
|
Total prior years
|
(1,649,791
|
)
|
(183,225
|
)
|
(44,336
|
)
|
(699,342
|
)
|
||||||||
|
Net change in net loss and loss expense reserves
|
(1,649,499
|
)
|
(86,640
|
)
|
(41,805
|
)
|
(256,049
|
)
|
||||||||
|
Net consolidation of certain VIEs
|
—
|
|
—
|
|
(498,409
|
)
|
—
|
|
||||||||
|
Ending net loss and loss expense reserves
|
$
|
3,698,378
|
|
$
|
5,347,877
|
|
$
|
5,434,517
|
|
$
|
5,974,731
|
|
||||
|
Add reinsurance on loss and loss expense reserves
(1)
|
100,355
|
|
122,357
|
|
138,155
|
|
147,409
|
|
||||||||
|
Ending gross loss and loss expense reserves
|
$
|
3,798,733
|
|
$
|
5,470,234
|
|
$
|
5,572,672
|
|
$
|
6,122,140
|
|
||||
|
(1)
|
Reinsurance recoverable reported on the Balance Sheet also includes reinsurance recoverables of previously presented loss and loss expenses of
$(517)
,
$(1,108)
,
$1,879
, and,
$675
as of
December 31, 2014
,
December 31, 2013
,
April 30, 2013
and
December 31, 2012
, respectively.
|
The positive development in loss and loss expense reserves for Successor Ambac established in prior years for the
year ended December 31, 2014
was primarily due to improved performance in all sectors, including RMBS, Student Loans, international, municipal and other structured finance, partially offset by the addition of accrued interest on Deferred Amounts pursuant to the amended Segregated Account Rehabilitation Plan. The positive development in loss and loss expense reserves for Successor Ambac established in prior years for the eight months ended
December 31, 2013
was primarily due to improved performance of the Student Loan and RMBS portfolios. The positive development in loss and loss expense reserves for Predecessor Ambac established in prior years for the four months ended
April 30, 2013
was primarily due to improved performance of the RMBS portfolio offset by deterioration in certain Public Finance and Ambac UK credits. For the year ended December 31, 2012, the adverse development in loss reserves established in prior years was primarily due to projected deterioration of collateral supporting structured finance policies, including RMBS and Student Loan exposures, which resulted in greater expected ultimate losses and lower expected subrogation recoveries related to representation and warranty breaches on insured RMBS securitizations.
The net change in net loss and loss expense reserves are included in losses and loss expenses in the Consolidated Statement of Total Comprehensive Income. For Successor Ambac, reinsurance recoveries of losses included in losses and loss expenses in the Consolidated Statements of Total Comprehensive Income (Loss) were an expense of
$21,164
and
$14,106
for the
year ended December 31, 2014
and the eight months ended
December 31, 2013
, respectively. For Predecessor Ambac, reinsurance recoveries of losses included in losses and loss expenses in the Consolidated Statements of Total Comprehensive Income (Loss) were a benefit of
$3,889
for the four months ended
April 30, 2013
and a benefit of
$6,996
for the year ended December 31, 2012.
114
The tables below summarize information related to policies currently included in Ambac’s loss and loss expense reserves or subrogation recoverable at
December 31, 2014 and 2013
. Net par exposures include capital appreciation bonds which are reported at the par amount at the time of issuance of the insurance policy. The weighted average risk-free rate used to discount loss reserves at
December 31, 2014 and 2013
was
2.3%
and
3.2%
, respectively.
|
Surveillance Categories as of December 31, 2014
|
|||||||||||||||||||||||||||
|
I/SL
|
IA
|
II
|
III
|
IV
|
V
|
Total
|
|||||||||||||||||||||
|
Number of policies
|
36
|
|
26
|
|
33
|
|
69
|
|
160
|
|
1
|
|
325
|
|
|||||||||||||
|
Remaining weighted-average contract period (in years)
|
8
|
|
12
|
|
15
|
|
21
|
|
12
|
|
6
|
|
16
|
|
|||||||||||||
|
Gross insured contractual payments outstanding:
|
|||||||||||||||||||||||||||
|
Principal
|
$
|
1,026,513
|
|
$
|
519,291
|
|
$
|
3,091,744
|
|
$
|
3,792,559
|
|
$
|
9,892,760
|
|
$
|
47
|
|
$
|
18,322,914
|
|
||||||
|
Interest
|
418,746
|
|
212,296
|
|
1,878,770
|
|
2,765,537
|
|
1,979,627
|
|
19
|
|
7,254,995
|
|
|||||||||||||
|
Total
|
$
|
1,445,259
|
|
$
|
731,587
|
|
$
|
4,970,514
|
|
$
|
6,558,096
|
|
$
|
11,872,387
|
|
$
|
66
|
|
$
|
25,577,909
|
|
||||||
|
Gross undiscounted claim liability
(1)
|
$
|
16,360
|
|
$
|
11,525
|
|
$
|
155,488
|
|
$
|
2,040,402
|
|
$
|
6,456,139
|
|
$
|
60
|
|
$
|
8,679,974
|
|
||||||
|
Discount, gross claim liability
|
(1,147
|
)
|
(937
|
)
|
(16,438
|
)
|
(716,812
|
)
|
(774,611
|
)
|
(3
|
)
|
(1,509,948
|
)
|
|||||||||||||
|
Gross claim liability before all subrogation and before reinsurance
|
$
|
15,213
|
|
$
|
10,588
|
|
$
|
139,050
|
|
$
|
1,323,590
|
|
$
|
5,681,528
|
|
$
|
57
|
|
$
|
7,170,026
|
|
||||||
|
Less:
|
|||||||||||||||||||||||||||
|
Gross RMBS subrogation
(2)
|
—
|
|
—
|
|
—
|
|
—
|
|
(2,541,219
|
)
|
—
|
|
(2,541,219
|
)
|
|||||||||||||
|
Discount, RMBS subrogation
|
—
|
|
—
|
|
—
|
|
—
|
|
17,679
|
|
—
|
|
17,679
|
|
|||||||||||||
|
Discounted RMBS subrogation, before reinsurance
|
—
|
|
—
|
|
—
|
|
—
|
|
(2,523,540
|
)
|
—
|
|
(2,523,540
|
)
|
|||||||||||||
|
Less:
|
|||||||||||||||||||||||||||
|
Gross other subrogation
(3)
|
—
|
|
—
|
|
(18,034
|
)
|
(127,143
|
)
|
(647,110
|
)
|
—
|
|
(792,287
|
)
|
|||||||||||||
|
Discount, other subrogation
|
—
|
|
—
|
|
6,069
|
|
36,779
|
|
48,960
|
|
—
|
|
91,808
|
|
|||||||||||||
|
Discounted other subrogation, before reinsurance
|
—
|
|
—
|
|
(11,965
|
)
|
(90,364
|
)
|
(598,150
|
)
|
—
|
|
(700,479
|
)
|
|||||||||||||
|
Gross claim liability, net of all subrogation and discounts, before reinsurance
|
$
|
15,213
|
|
$
|
10,588
|
|
$
|
127,085
|
|
$
|
1,233,226
|
|
$
|
2,559,838
|
|
$
|
57
|
|
$
|
3,946,007
|
|
||||||
|
Less: Unearned premium revenue
|
(10,945
|
)
|
(3,432
|
)
|
(73,749
|
)
|
(88,332
|
)
|
(64,890
|
)
|
—
|
|
(241,348
|
)
|
|||||||||||||
|
Plus: Loss expense reserves
|
3
|
|
1,303
|
|
1,968
|
|
6,470
|
|
84,330
|
|
—
|
|
94,074
|
|
|||||||||||||
|
Gross loss and loss expense reserves
|
$
|
4,271
|
|
$
|
8,459
|
|
$
|
55,304
|
|
$
|
1,151,364
|
|
$
|
2,579,278
|
|
$
|
57
|
|
$
|
3,798,733
|
|
||||||
|
Reinsurance recoverable reported on Balance Sheet
(4)
|
$
|
73
|
|
$
|
890
|
|
$
|
1,355
|
|
$
|
110,957
|
|
$
|
(13,437
|
)
|
$
|
—
|
|
$
|
99,838
|
|
||||||
|
(1)
|
Gross undiscounted claim liability includes unpaid claims, including accrued interest on Deferred Amounts, on policies allocated to the Segregated Account and Ambac's estimate of expected future claims.
|
|
(2)
|
RMBS subrogation represents Ambac’s probability-weighted estimate of subrogation recoveries from RMBS transaction sponsors for representation and warranty ("R&W") breaches.
|
|
(3)
|
Other subrogation primarily represents subrogation-related to excess spread or other contractual cash flows on structured finance transactions including RMBS.
|
|
(4)
|
Reinsurance recoverable reported on Balance Sheet includes reinsurance recoverables of
$100,355
related to future loss and loss expenses and
$(517)
related to previously presented loss and loss expenses.
|
115
|
Surveillance Categories as of December 31, 2013
|
|||||||||||||||||||||||||||
|
I/SL
|
IA
|
II
|
III
|
IV
|
V
|
Total
|
|||||||||||||||||||||
|
Number of policies
|
18
|
|
23
|
|
52
|
|
76
|
|
169
|
|
1
|
|
339
|
|
|||||||||||||
|
Remaining weighted-average contract period (in years)
|
13
|
|
19
|
|
17
|
|
19
|
|
11
|
|
6
|
|
14
|
|
|||||||||||||
|
Gross insured contractual payments outstanding:
|
|||||||||||||||||||||||||||
|
Principal
|
$
|
834,708
|
|
$
|
1,125,284
|
|
$
|
3,464,420
|
|
$
|
5,597,387
|
|
$
|
11,184,943
|
|
$
|
47
|
|
$
|
22,206,789
|
|
||||||
|
Interest
|
506,903
|
|
871,751
|
|
2,130,271
|
|
2,331,222
|
|
2,556,968
|
|
18
|
|
8,397,133
|
|
|||||||||||||
|
Total
|
$
|
1,341,611
|
|
$
|
1,997,035
|
|
$
|
5,594,691
|
|
$
|
7,928,609
|
|
$
|
13,741,911
|
|
$
|
65
|
|
$
|
30,603,922
|
|
||||||
|
Gross undiscounted claim liability
(1)
|
$
|
7,447
|
|
$
|
54,398
|
|
$
|
221,321
|
|
$
|
3,029,891
|
|
$
|
7,963,137
|
|
$
|
65
|
|
$
|
11,276,259
|
|
||||||
|
Discount, gross claim liability
|
(1,225
|
)
|
(6,726
|
)
|
(32,630
|
)
|
(1,299,032
|
)
|
(1,112,829
|
)
|
(6
|
)
|
(2,452,448
|
)
|
|||||||||||||
|
Gross claim liability before all subrogation and before reinsurance
|
$
|
6,222
|
|
$
|
47,672
|
|
$
|
188,691
|
|
$
|
1,730,859
|
|
$
|
6,850,308
|
|
$
|
59
|
|
$
|
8,823,811
|
|
||||||
|
Less:
|
|||||||||||||||||||||||||||
|
Gross RMBS subrogation
(2)
|
—
|
|
—
|
|
—
|
|
(4,516
|
)
|
(2,211,333
|
)
|
—
|
|
(2,215,849
|
)
|
|||||||||||||
|
Discount, RMBS subrogation
|
—
|
|
—
|
|
—
|
|
15
|
|
9,236
|
|
—
|
|
9,251
|
|
|||||||||||||
|
Discounted RMBS subrogation, before reinsurance
|
—
|
|
—
|
|
—
|
|
(4,501
|
)
|
(2,202,097
|
)
|
—
|
|
(2,206,598
|
)
|
|||||||||||||
|
Less:
|
|||||||||||||||||||||||||||
|
Gross other subrogation
(3)
|
—
|
|
—
|
|
(20,367
|
)
|
(116,145
|
)
|
(710,187
|
)
|
—
|
|
(846,699
|
)
|
|||||||||||||
|
Discount, other subrogation
|
—
|
|
—
|
|
9,522
|
|
36,125
|
|
45,666
|
|
—
|
|
91,313
|
|
|||||||||||||
|
Discounted other subrogation, before reinsurance
|
—
|
|
—
|
|
(10,845
|
)
|
(80,020
|
)
|
(664,521
|
)
|
—
|
|
(755,386
|
)
|
|||||||||||||
|
Gross claim liability, net of all subrogation and discounts, before reinsurance
|
$
|
6,222
|
|
$
|
47,672
|
|
$
|
177,846
|
|
$
|
1,646,338
|
|
$
|
3,983,690
|
|
$
|
59
|
|
$
|
5,861,827
|
|
||||||
|
Less: Unearned premium revenue
|
(4,060
|
)
|
(22,901
|
)
|
(95,550
|
)
|
(280,245
|
)
|
(100,228
|
)
|
—
|
|
(502,984
|
)
|
|||||||||||||
|
Plus: Loss expense reserves
|
—
|
|
11
|
|
2,257
|
|
1,658
|
|
107,465
|
|
—
|
|
111,391
|
|
|||||||||||||
|
Gross loss and loss expense reserves
|
$
|
2,162
|
|
$
|
24,782
|
|
$
|
84,553
|
|
$
|
1,367,751
|
|
$
|
3,990,927
|
|
$
|
59
|
|
$
|
5,470,234
|
|
||||||
|
Reinsurance recoverable reported on Balance Sheet
(4)
|
$
|
146
|
|
$
|
2,271
|
|
$
|
2,273
|
|
$
|
119,795
|
|
$
|
(3,236
|
)
|
$
|
—
|
|
$
|
121,249
|
|
||||||
|
(1)
|
Gross undiscounted claim liability includes unpaid claims, including accrued interest on Deferred Amounts, on policies allocated to the Segregated Account and Ambac's estimate of expected future claims.
|
|
(2)
|
RMBS subrogation represents Ambac’s probability-weighted estimate of subrogation recoveries from RMBS transaction sponsors for R&W breaches.
|
|
(3)
|
Other subrogation primarily represents subrogation related to excess spread or other contractual cash flows on structure finance transactions, including RMBS.
|
|
(4)
|
Reinsurance recoverable reported on Balance Sheet includes reinsurance recoverables of
$122,357
related to future loss and loss expenses and
$(1,108)
related to previously presented loss and loss expenses.
|
Ambac records estimated subrogation recoveries for breaches of representations and warranties (R&W) by sponsors of certain RMBS transactions. Prior to the June 30, 2014 reporting period, Ambac utilized the Adverse and Random Sample approaches to estimate R&W subrogation recoveries for certain RMBS transactions. For a discussion of these subrogation recovery approaches, see
Note 2 - Basis Of Presentation And Significant Accounting Policies
. Beginning with the June 30, 2014 reporting period, as a result of gaining further access to loan files, the Random Sample approach has been utilized for all transactions which were previously evaluated using the Adverse Sample approach.
Ambac has recorded RMBS subrogation recoveries of
$2,523,540
, (
$2,496,515
net of reinsurance) and
$2,206,598
, (
$2,183,652
net of reinsurance) at
December 31, 2014 and 2013
, respectively. The balance of RMBS subrogation recoveries and the related claim liabilities, by estimation approach, at
December 31, 2014 and 2013
, are as follows:
116
|
Approach
|
Gross loss
reserves before subrogation recoveries (1) |
Subrogation
recoveries (2)(3) |
Gross loss
reserves after subrogation recoveries |
||||||||
|
December 31, 2014:
|
|||||||||||
|
Random samples
(4)
|
$
|
1,897,426
|
|
$
|
(2,523,540
|
)
|
$
|
(626,114
|
)
|
||
|
Totals
|
$
|
1,897,426
|
|
(2,523,540
|
)
|
$
|
(626,114
|
)
|
|||
|
December 31, 2013:
|
|||||||||||
|
Adverse samples
|
$
|
2,084,911
|
|
(1,252,773
|
)
|
$
|
832,138
|
|
|||
|
Random samples
(4)
|
1,078,861
|
|
(953,825
|
)
|
125,036
|
|
|||||
|
Totals
|
$
|
3,163,772
|
|
(2,206,598
|
)
|
$
|
957,174
|
|
|||
|
(1)
|
Includes unpaid RMBS claims, including accrued interest on Deferred Amounts, on policies allocated to the Segregated Account.
|
|
(2)
|
The amount of recorded subrogation recoveries related to each securitization is limited to ever-to-date paid and unpaid losses plus the present value of expected cash flows for each policy. To the extent losses have been paid but not yet fully recovered, the recorded amount of RMBS subrogation recoveries may exceed the sum of the unpaid claims and the present value of expected cash flows for a given policy. The net cash inflow for these policies is recorded as a “Subrogation recoverable” asset. For those transactions where the subrogation recovery is less than the sum of unpaid claims and the present value of expected cash flows, the net cash outflow for these policies is recorded as a “Loss and loss expense reserves” liability.
|
|
(3)
|
The sponsor’s repurchase obligation may differ depending on the terms of the particular transaction and the status of the specific loan, such as whether it is performing or has been liquidated or charged off. The estimated subrogation recovery for these transactions is based primarily on loan level data provided through trustee reports received in the normal course of our surveillance activities or provided by the sponsor. While this data may not include all the components of the sponsor’s contractual repurchase obligation we believe it is the best information available to estimate the subrogation recovery.
|
|
(4)
|
From time to time R&W subrogation may include estimates of potential sponsor settlements that are currently in negotiation, but have not been subject to a sampling approach. However, such estimates are not material to Ambac’s financial results and therefore are included in the Random Sample section of this table.
|
117
Below is the rollforward of RMBS subrogation, by estimation approach, for the affected periods:
|
Random
sample |
Adverse
sample |
Total
|
|||||||||
|
Successor Ambac:
|
|||||||||||
|
Discounted RMBS subrogation (gross of reinsurance) at January 1, 2014
|
$
|
953,825
|
|
$
|
1,252,773
|
|
$
|
2,206,598
|
|
||
|
Changes recognized in 2014:
|
|||||||||||
|
Additional transactions reviewed
|
24,565
|
|
—
|
|
24,565
|
|
|||||
|
Changes in estimation approach
(1)
|
1,417,556
|
|
(1,218,681
|
)
|
198,875
|
|
|||||
|
Impact of sponsor actions
(2)
|
(146,270
|
)
|
—
|
|
(146,270
|
)
|
|||||
|
All other changes
(3)
|
273,864
|
|
(34,092
|
)
|
239,772
|
|
|||||
|
Discounted RMBS subrogation (gross of reinsurance) at December 31, 2014
|
$
|
2,523,540
|
|
$
|
—
|
|
$
|
2,523,540
|
|
||
|
Successor Ambac:
|
|||||||||||
|
Discounted RMBS subrogation (gross of reinsurance) at May 1, 2013
|
$
|
1,004,252
|
|
$
|
1,478,666
|
|
$
|
2,482,918
|
|
||
|
Changes recognized through December 31, 2013:
|
|||||||||||
|
Additional transactions reviewed
|
2,451
|
|
—
|
|
2,451
|
|
|||||
|
Changes in estimation approach
(1)
|
—
|
|
—
|
|
—
|
|
|||||
|
Adverse loans repurchased by the sponsor
|
—
|
|
—
|
|
—
|
|
|||||
|
Impact of sponsor actions
(2)
|
—
|
|
98
|
|
98
|
|
|||||
|
All other changes
(3)
|
(52,878
|
)
|
(225,991
|
)
|
(278,869
|
)
|
|||||
|
Discounted RMBS subrogation (gross of reinsurance) at December 31, 2013
|
$
|
953,825
|
|
$
|
1,252,773
|
|
$
|
2,206,598
|
|
||
|
Predecessor Ambac
|
|||||||||||
|
Discounted RMBS subrogation (gross of reinsurance) at January 1, 2013
|
$
|
1,080,408
|
|
$
|
1,442,817
|
|
$
|
2,523,225
|
|
||
|
Changes recognized through April 30, 2013:
|
|||||||||||
|
Additional transactions reviewed
|
—
|
|
—
|
|
—
|
|
|||||
|
Changes in estimation approach
(1)
|
—
|
|
—
|
|
—
|
|
|||||
|
Adverse loans repurchased by the sponsor
|
—
|
|
—
|
|
—
|
|
|||||
|
Impact of sponsor actions
(2)
|
(54,195
|
)
|
—
|
|
(54,195
|
)
|
|||||
|
All other changes
(3)
|
(21,961
|
)
|
35,849
|
|
13,888
|
|
|||||
|
Discounted RMBS subrogation (gross of reinsurance) at April 30, 2013
|
$
|
1,004,252
|
|
$
|
1,478,666
|
|
$
|
2,482,918
|
|
||
|
Predecessor Ambac:
|
|||||||||||
|
Discounted RMBS subrogation (gross of reinsurance) at January 1, 2012
|
$
|
1,262,794
|
|
$
|
1,457,472
|
|
$
|
2,720,266
|
|
||
|
Changes recognized in 2012:
|
|||||||||||
|
Additional transactions reviewed
|
54,467
|
|
(35,486
|
)
|
18,981
|
|
|||||
|
Changes in estimation approach
(1)
|
—
|
|
—
|
|
—
|
|
|||||
|
Adverse loans repurchased by the sponsor
|
—
|
|
35
|
|
35
|
|
|||||
|
Impact of sponsor actions
(2)
|
—
|
|
—
|
|
—
|
|
|||||
|
All other changes
(3)
|
(236,853
|
)
|
20,796
|
|
(216,057
|
)
|
|||||
|
Discounted RMBS subrogation (gross of reinsurance) at December 31, 2012
|
$
|
1,080,408
|
|
$
|
1,442,817
|
|
$
|
2,523,225
|
|
||
|
(1)
|
Represents estimated subrogation for those transactions previously evaluated using the Adverse Sample approach, which are evaluated using a Random Sample approach beginning June 30, 2014. The amounts shown in the Random and Adverse Sample columns are different as a result of the differences in estimation approaches.
|
|
(2)
|
Sponsor actions include loan repurchases, direct payments to Ambac and other contributions from sponsors.
|
|
(3)
|
All other changes which may impact RMBS subrogation recoveries include changes in actual or projected collateral performance, changes in the creditworthiness of a sponsor, and/or the projected timing of recoveries. All other changes may also include estimates of potential sponsor settlements that are currently in negotiation but have not been subject to a sampling approach. However, such estimates are not material to Ambac’s financial results and therefore are included in the Random Sample column of this table.
|
Assumed Reinsurance:
Assumed par outstanding was
$245,900
and
$248,225
at
December 31, 2014 and 2013
, respectively. On March 24, 2010, all assumed reinsurance agreements with third parties were allocated to the Segregated Account, which will not allow for cancellations without the approval of the Rehabilitator.
118
Ceded Reinsurance:
Ambac Assurance has reinsurance in place pursuant to surplus share treaty and facultative reinsurance agreements. The reinsurance of risk does not relieve Ambac Assurance of its original liability to its policyholders. In the event that any of Ambac Assurance’s reinsurers are unable to meet their obligations under reinsurance contracts, Ambac Assurance would, nonetheless, be liable to its policyholders for the full amount of its policy.
Ambac Assurance’s reinsurance assets, including deferred ceded premiums and reinsurance recoverables on losses amounted to
$223,114
at
December 31, 2014
. Credit exposure existed at
December 31, 2014
with respect to reinsurance recoverables to the extent that any reinsurer may not be able to reimburse Ambac Assurance under the terms of these reinsurance arrangements. At
December 31, 2014
, there were ceded reinsurance balances payable of
$60,436
offsetting this credit exposure.
To minimize its credit exposure to losses from reinsurer insolvencies, Ambac Assurance (i) is entitled to receive collateral from its reinsurance counterparties in certain reinsurance contracts; and (ii) has certain cancellation rights that can be exercised by Ambac Assurance in the event of rating agency downgrades of a reinsurer (among other events and circumstances). Ambac Assurance held letters of credit and collateral amounting to
$141,337
from its reinsurers at
December 31, 2014
. As of
December 31, 2014
, the aggregate amount of insured par ceded by Ambac Assurance to reinsurers under reinsurance agreements was
$14,954,444
with the largest reinsurer accounting for
$13,365,743
or
8.4%
of gross par outstanding at
December 31, 2014
. The following table represents the percentage ceded to reinsurers and reinsurance recoverable at
December 31, 2014
and its rating levels as of
February 25, 2015
:
|
Reinsurers
|
Moody’s
Rating
|
Moody’s
Outlook
|
Percentage
ceded Par
|
Net unsecured
reinsurance
recoverable
(1)
|
|||||
|
Assured Guaranty Re Ltd
|
Baa1
|
Negative
|
89.4%
|
$
|
37,553
|
|
|||
|
Sompo Japan Nipponkoa Holdings, Inc.
|
A1
|
Stable
|
6.1
|
—
|
|
||||
|
Assured Guaranty Corporation
|
A3
|
Negative
|
4.5
|
4,388
|
|
||||
|
Total
|
100%
|
$
|
41,941
|
|
|||||
|
(1)
|
Represents reinsurance recoverables on paid and unpaid losses and deferred ceded premiums, net of ceded premium payables due to reinsurers, letters of credit, and collateral posted for the benefit of Ambac Assurance.
|
Insurance intangible asset:
The insurance intangible amortization expense is included in insurance intangible amortization on the Consolidated Statements of Total Comprehensive Income (Loss) for Successor Ambac. For the
year ended
December 31, 2014
and the eight months ending
December 31, 2013
, the insurance intangible amortization expense was
$151,830
and
$99,658
, respectively. As of
December 31, 2014 and 2013
, the gross carrying value of the insurance intangible asset was
$1,660,125
and $
1,698,732
, respectively. Accumulated amortization of the insurance intangible asset was
$249,205
and
$100,767
, as of
December 31, 2014 and 2013
, respectively, resulting in a net insurance intangible asset of
$1,410,920
and
$1,597,965
, respectively.
The estimated future amortization expense for the net insurance intangible asset is as follows:
|
2015
|
$
|
122,675
|
|
|
2016
|
108,582
|
|
|
|
2017
|
99,446
|
|
|
|
2018
|
92,078
|
|
|
|
2019
|
85,356
|
|
|
|
Thereafter
|
902,783
|
|
|
9. INSURANCE REGULATORY RESTRICTIONS
United States:
Ambac Assurance (exclusive of the Segregated Account which is under the control of OCI via the Segregated Account Rehabilitation Plan and Segregated Account Rehabilitation Proceedings) and Everspan are subject to the insurance laws and regulations of each jurisdiction in which it is licensed, some of which are described below. Failure to comply with applicable insurance laws and regulations (including, without limitation, minimum surplus requirements, aggregate risk limits and single risk limits) could expose Ambac Assurance or Everspan to fines, the loss or suspension of insurance licenses in certain jurisdictions, the imposition of orders by regulators with respect to the conduct of business by Ambac Assurance or Everspan and/or the inability to pay dividends, all of which could have an adverse impact on our business results.
New York’s comprehensive financial guarantee insurance law defines the scope of permitted financial guarantee insurance and governs the conduct of business of all financial guarantors licensed to do business in New York, including Ambac Assurance. The New York financial guarantee insurance law also establishes single risk and aggregate limits with respect to obligations insured by financial guarantee insurers. Such
119
single risk limits are specific to the type of insured obligation (for example, municipal or asset-backed). Under the aggregate limits, policyholders’ surplus and contingency reserves must at least equal a percentage of aggregate net financial guarantee liability that is equal to the sum of various percentages of aggregate net liability for various categories of specified obligations. Wisconsin laws and regulations applicable to financial guarantors, as well as the laws of several other states, are less comprehensive than New York law and relate primarily to single and aggregate risk limits.
As a result of decreased statutory capital resulting from the significant losses experienced by Ambac Assurance, Ambac Assurance is not in compliance with applicable regulatory single and aggregate risk limits. Through run-off of the portfolio, Ambac Assurance will seek to reduce its exposure to no more than the permitted amounts, but may not be able to do so. Everspan is in compliance with all of such limits.
Ambac Assurance’s statutory financial statements are prepared on the basis of accounting practices prescribed or permitted by OCI. OCI recognizes only statutory accounting practices prescribed or permitted by the State of Wisconsin for determining and reporting the financial condition and results of operations of an insurance company for determining its solvency under Wisconsin Insurance Law. The National Association of Insurance Commissioners (“NAIC”) Accounting Practices and Procedures manual (“NAIC SAP”) has been adopted as a component of prescribed practices by the State of Wisconsin.
Ambac Assurance’s statutory policyholder surplus and qualified statutory capital were
$100,000
and
$268,353
at
December 31, 2014
, respectively as compared to
$840,262
and
$905,065
as of
December 31, 2013
, respectively. The Segregated Account reported statutory policyholder surplus of
$239,280
and
$442,639
as of
December 31, 2014 and 2013
, respectively. At
December 31, 2014
Ambac Assurance’s surplus as regards to policyholders was at the Minimum Surplus and therefore
$149,482
of the Segregated Account’s insurance liabilities were not assumed by Ambac Assurance under the Reinsurance Agreement. Statutory capital and surplus differs from stockholders’ equity determined under GAAP principally due to statutory accounting rules that treat loss reserves, consolidation of subsidiaries, premiums earned, policy acquisition costs and deferred income taxes differently. Additionally, Fresh Start accounting is not applicable under statutory accounting principles.
The Wisconsin Insurance Commissioner has prescribed or permitted additional accounting practices for Ambac Assurance and the Segregated Account of Ambac Assurance. As a result of the prescribed and permitted practices discussed below, Ambac Assurance’s statutory surplus at December 31, 2014 and December 31, 2013 was
higher by
$168,085
and
lower by
$227,334
, respectively, than if Ambac Assurance and the Segregated Account had reported such amounts in accordance with NAIC SAP.
|
•
|
OCI has prescribed an accounting practice related to the total liabilities and total surplus of the Segregated Account that are reported as discrete components of Ambac Assurance’s liabilities and surplus reported in Ambac Assurance’s statutory basis financial statements. Pursuant to this prescribed practice, the results of the Segregated Account are not included in Ambac Assurance’s financial statements if Ambac Assurance’s surplus is (or would be) less than the Minimum Surplus Amount.
|
|
•
|
OCI has prescribed an additional accounting practice that differs from NAIC SAP. Paragraph 7 of Statement of Statutory Accounting Principles No. 60 “Financial Guaranty Insurance” (“SSAP 60”) allows for a deduction from loss reserves for the time value of money by application of a discount rate equal to the average rate of return on the admitted assets of the financial guaranty insurer as of the date of the computation of the reserve. The discount rate shall be adjusted at the end of each calendar year. Additionally, in accordance with paragraph 7 of Statutory Accounting Principles No. 5R “Liabilities, Contingencies and Impairments of Assets - Revised,” Ambac Assurance records probable losses on its subsidiaries for which it guarantees their obligations, using a discount rate equal to the average rate of return on its admitted assets. Ambac Assurance’s average rates of return on its admitted assets at
December 31, 2014 and 2013
were
7.87%
and
9.80%
, respectively. OCI has directed Ambac Assurance to utilize a prescribed discount rate of
5.10%
for the purpose of discounting both its loss reserves and its estimated impairment losses on subsidiary guarantees.
|
|
•
|
OCI has prescribed an additional accounting practice that differs from NAIC SAP. Paragraph 4 of Statement of Statutory Accounting Principles No. 41 “Surplus Notes” (“SSAP 41”) states that proceeds received by the issuer of surplus notes must be in the form of cash or other admitted assets having readily determinable values and liquidity satisfactory to the commissioner of the state of domicile. Under the statutory accounting principles as generally applied, surplus notes issued in conjunction with commutations or the settlement of claims would be valued at zero upon issuance pursuant to paragraph 4, SSAP 41. OCI has directed Ambac Assurance to record surplus notes issued in connection with commutations or the settlement of claims at full par value upon issuance as in these instances the surplus notes did not represent a contribution of capital, but rather a distribution of value from the common and preferred shareholders of Ambac Assurance. The surplus notes issued in connection with commutations or settlement of claims has a claim against surplus senior to the preferred and common shareholders. Beginning with the
December 31, 2014
statutory financial statements, Ambac Assurance and the Segregated Account reclassified these surplus notes from policyholder surplus to a liability. This reclassification was because the partial redemption of these surplus notes was required in accordance with the Segregated Account Rehabilitation Plan and the Settlement Agreement to ensure that they are treated pari passu with payments of Deferred Amounts.
|
|
•
|
OCI has extended the preceding prescribed practice related to surplus notes to the evaluation of other-than-temporary impairments for Ambac Assurance guaranteed securities held in the investment portfolio. Paragraph 35 of Statement of Statutory Accounting Principles No. 43R “Loan-backed and Structured Securities” states that when an other-than-temporary impairment has occurred, the amount of the other-than-temporary impairment recognized as a realized loss shall equal the difference between the investment’s amortized cost basis and the present value of cash flows expected to be collected, discounted at the loan-backed or structured security’s effective interest rate. Under NAIC SAP, the present value of cash flows expected to be collected should include the fair value of surplus notes received from the Segregated Account, as required under the originally confirmed Segregated Account Rehabilitation Plan. OCI has
|
120
prescribed an accounting practice that differs from NAIC SAP and has directed Ambac Assurance to utilize par value rather than fair value of these surplus notes in this computation. As a result of the amended Segregated Account Rehabilitation Plan becoming effective on June 12, 2014, this prescribed practice is no longer effective. Ambac Assurance has received a new prescribed practice from OCI with regard to the carrying value of investments in Ambac Assurance insured securities with policies that were allocated to the Segregated Account. The new prescribed practice exempts Ambac Assurance from evaluating such investments for other than temporary impairments and requires all such investments be reported at amortized cost regardless of its NAIC risk designation. This accounting determination is intended to recognize that Ambac Assurance continues to maintain statutory loss reserves without adjustment for the economic effects of its ownership of the insured investment securities, improve transparency to the users of the statutory financial statements and to minimize operational risks.
|
•
|
Wisconsin accounting practices for changes to contingency reserves differ from NAIC SAP. Under NAIC SAP, contributions to and releases from the contingency reserve are recorded via a direct charge or credit to surplus. Under the Wisconsin Administrative Code, contributions to and releases from the contingency reserve are to be recorded through underwriting income. Ambac Assurance received permission from OCI to record contributions to and releases from the contingency reserve and the related tax and loss bond impact, in accordance with NAIC SAP.
|
|
•
|
Ambac Assurance received permission from OCI to report investment holdings of Ambac Assurance insured securities, with coverage under financial guaranty policies that have been allocated to the Segregated Account, as a separate invested asset on the balance sheet rather than combined with other bond investments. This permitted practice only impacts the balance sheet classification and has no impact on the valuation of the securities to which it applies or to statutory surplus.
|
United Kingdom
The Prudential Regulatory Authority (“PRA”) and Financial Conduct Authority (“FCA”) (and their predecessor regulator the Financial Services Authority (“FSA”)) have exercised significant oversight of Ambac UK since 2008, after Ambac, Ambac Assurance and Ambac UK began experiencing financial stress. In 2009, Ambac UK’s license to write new business was curtailed by the FSA and the insurance license was limited to undertaking only run-off related activity. As such, Ambac UK is authorized to run-off its credit, suretyship and financial guarantee insurance portfolio in the United Kingdom, and to do the same through a branch in Milan, Italy, and a number of other European Union (“EU”) countries. EU legislation has allowed Ambac UK to conduct business in EU states other than the United Kingdom through a “passporting” arrangement, which eliminates the necessity of additional licensing or authorization in those other EU jurisdictions.
The PRA and FCA is the dual statutory regulator responsible for regulating the financial services industry in the United Kingdom, with the purpose of maintaining confidence in the U.K. financial system, providing public understanding of the system, securing the proper degree of protection for consumers and helping to reduce financial crime. In addition, the regulatory regime in the United Kingdom must comply with certain EU legislation binding on all EU member states.
The PRA requires that non-life insurance companies such as Ambac UK maintain a margin of solvency at all times in respect of the liabilities of the insurance company, the calculation of which depends on the type and amount of insurance business a company writes. These solvency requirements will be amended in order to implement the European Union's "Solvency II" directive on risk-based capital. The requirements of the Solvency II directive will become effective on January 1, 2016 and, during the course of 2015, Ambac UK will be required to make certain transitional Solvency II-compliant regulatory filings with the PRA.
Notwithstanding the foregoing, Ambac UK is deficient in terms of compliance with currently applicable regulatory capital requirements, and is expected to remain deficient in applicable regulatory requirements once the Solvency II directive becomes effective. The PRA and FCA are aware of the same, and dialogue between Ambac UK management and its regulators remains ongoing with respect to options for addressing the shortcoming, although such options remain few.
Dividend Restrictions, Including Contractual Restrictions
Due to losses experienced by Ambac Assurance, Ambac Assurance has been unable to pay common dividends to Ambac since 2008 and will be unable to pay common dividends in
2015
without the prior consent of the OCI, which is unlikely. Ambac Assurance’s ability to pay dividends is further restricted by the Settlement Agreement (as described below) and by certain covenants made for the benefit of the Segregated Account. See
Note 1. Background and Business Description
for further information.
Subject to the foregoing, pursuant to the Wisconsin Insurance Laws, Ambac Assurance and Everspan may declare dividends, subject to restrictions in their respective articles of incorporation, provided that, after giving effect to the distribution, such dividends would not violate certain statutory equity, solvency, income and asset tests. Board action authorizing a shareholder distribution by Ambac Assurance or Everspan (other than stock dividends) must be reported to the OCI at least 30 days prior to payment. Additionally, no quarterly dividend may exceed the dividend paid in the corresponding quarter of the preceding year by more than
15%
without notifying the OCI 30 days in advance of payment. Wisconsin insurance law restricts the payment of dividends in any 12-month period without regulatory approval to the lesser of (a)
10%
of policyholders’ surplus as of the preceding December 31, and (b) the greater of (i) statutory net income (loss) for the calendar year preceding the date of the dividend, minus realized capital gains for that calendar year or (ii) the aggregate of statutory net income (loss) for three calendar years preceding the date of the dividend, minus realized capital gains for those calendar years and minus dividends paid or credited within the first two of the three preceding calendar years. In connection with the termination of reinsurance contracts, OCI requires adjustments to the dividend calculation for
121
any surplus or net income gains recognized. Extraordinary dividends must be reported prior to payment and are subject to disapproval by the OCI.
UK law prohibits Ambac UK from declaring a dividend to its shareholders unless it has “profits available for distribution.” The determination of whether a company has profits available for distribution is based on its accumulated realized profits less its accumulated realized losses. While the UK insurance regulatory laws impose no statutory restrictions on a general insurer’s ability to declare a dividend, the PRA’s and FCA’s capital requirements in practice act as a restriction on the payment of dividends. Further, the FSA amended Ambac UK’s license in 2010 such that the PRA must specifically approve (“non-objection”) any transfer of value and/or assets from Ambac UK to Ambac Assurance or any other Ambac group company, other than in respect of certain disclosed contracts between the two parties (such as in respect of a management services agreement between Ambac Assurance and Ambac UK). Ambac UK is not expected to pay any dividends to Ambac Assurance for the foreseeable future.
Pursuant to the Settlement Agreement Ambac Assurance may not make any “Restricted Payment” (which includes dividends from Ambac Assurance to Ambac) in excess of
$5,000
in the aggregate per annum, other than Restricted Payments from Ambac Assurance to Ambac in an amount up to
$7,500
per annum solely to pay operating expenses of Ambac. Concurrent with making any such Restricted Payment, a pro rata amount of the surplus notes issued by Ambac Assurance under the Settlement Agreement would also need to be redeemed at par.
Under the terms of Ambac Assurance’s Auction Market Preferred Shares (“AMPS”), dividends may not be paid on the common stock of Ambac Assurance unless all accrued and unpaid dividends on the AMPS for the then current dividend period have been paid, provided, that dividends on the common stock may be made at all times for the purpose of, and only in such amounts as are necessary for, enabling Ambac (i) to service its indebtedness for borrowed money as such payments become due or (ii) to pay its operating expenses. If dividends are paid on the common stock as provided in the prior sentence, dividends on the AMPS become cumulative until the date that all accumulated and unpaid dividends have been paid on the AMPS.
10. FAIR VALUE MEASUREMENTS
The Fair Value Measurement Topic of the ASC establishes a framework for measuring fair value and disclosures about fair value measurements.
Fair Value Hierarchy:
The Fair Value Measurement Topic of the ASC specifies a fair value hierarchy based on whether the inputs to valuation techniques used to measure fair value are observable or unobservable. Observable inputs reflect market data obtained from independent sources, while unobservable inputs reflect Company-based assumptions. The fair value hierarchy prioritizes model inputs into three broad levels as follows:
|
Ÿ
Level 1
|
Quoted prices for identical instruments in active markets. Assets and liabilities classified as Level 1 include US Treasury securities, exchange traded futures contracts, variable rate demand obligations, money market funds and mutual funds.
|
|
|
Ÿ
Level 2
|
Quoted prices for similar instruments in active markets; quoted prices for identical or similar instruments in markets that are not active; and model-derived valuations in which all significant inputs and significant value drivers are observable in active markets. Assets and liabilities classified as Level 2 generally include direct investments in fixed income securities representing municipal, asset-backed and corporate obligations, most financial services derivatives, and most long-term debt of variable interest entities consolidated under the Consolidation Topic of the ASC. Also included are equity interests in pooled investment funds measured at fair value where the investment can be redeemed in the near term at a value based on the net asset value.
|
|
|
Ÿ
Level 3
|
Model derived valuations in which one or more significant inputs or significant value drivers are unobservable. This hierarchy requires the use of observable market data when available. Assets and liabilities classified as Level 3 include credit derivative contracts written as part of the financial guarantee business, certain financial services interest rate swap contracts, equity interests in Ambac sponsored special purpose entities and certain investments in fixed income securities. Additionally, Level 3 assets and liabilities generally include fixed income securities, loan receivables, and certain long-term debt of variable interest entities consolidated under the Consolidation Topic of the ASC.
|
|
122
The following table sets forth the carrying amount and fair value of Ambac’s financial assets and liabilities as of
December 31, 2014 and 2013
, including the level within the fair value hierarchy at which fair value measurements are categorized. As required by the Fair Value Measurement Topic of the ASC financial assets and liabilities are classified in their entirety based on the lowest level of input that is significant to the fair value measurement.
|
Carrying
Amount |
Total Fair
Value |
Fair Value Measurements Categorized as:
|
|||||||||||||||||
|
Level 1
|
Level 2
|
Level 3
|
|||||||||||||||||
|
December 31, 2014:
|
|||||||||||||||||||
|
Financial assets:
|
|||||||||||||||||||
|
Fixed income securities:
|
|||||||||||||||||||
|
Municipal obligations
|
$
|
525,792
|
|
$
|
525,792
|
|
$
|
—
|
|
$
|
525,792
|
|
$
|
—
|
|
||||
|
Corporate obligations
|
1,385,594
|
|
1,385,594
|
|
—
|
|
1,381,786
|
|
3,808
|
|
|||||||||
|
Foreign obligations
|
127,757
|
|
127,757
|
|
—
|
|
127,757
|
|
—
|
|
|||||||||
|
U.S. government obligations
|
42,979
|
|
42,979
|
|
42,979
|
|
—
|
|
—
|
|
|||||||||
|
U.S. agency obligations
|
29,486
|
|
29,486
|
|
—
|
|
29,486
|
|
—
|
|
|||||||||
|
Residential mortgage-backed securities
|
1,710,955
|
|
1,710,955
|
|
—
|
|
1,516,562
|
|
194,393
|
|
|||||||||
|
Collateralized debt obligations
|
21,122
|
|
21,122
|
|
—
|
|
21,122
|
|
—
|
|
|||||||||
|
Other asset-backed securities
|
882,001
|
|
882,001
|
|
—
|
|
882,001
|
|
—
|
|
|||||||||
|
Fixed income securities, pledged as collateral:
|
|||||||||||||||||||
|
U.S. government obligations
|
64,267
|
|
64,267
|
|
64,267
|
|
—
|
|
—
|
|
|||||||||
|
Short term investments
|
360,065
|
|
360,065
|
|
358,190
|
|
1,875
|
|
—
|
|
|||||||||
|
Other investments
|
357,016
|
|
349,468
|
|
—
|
|
336,013
|
|
13,455
|
|
|||||||||
|
Cash and cash equivalents
|
73,903
|
|
73,903
|
|
73,903
|
|
—
|
|
—
|
|
|||||||||
|
Loans
|
5,714
|
|
5,634
|
|
—
|
|
—
|
|
5,634
|
|
|||||||||
|
Derivative assets:
|
|||||||||||||||||||
|
Credit derivatives
|
2,043
|
|
2,043
|
|
—
|
|
—
|
|
2,043
|
|
|||||||||
|
Interest rate swaps—asset position
|
106,974
|
|
106,974
|
|
—
|
|
106,974
|
|
—
|
|
|||||||||
|
Interest rate swaps—liability position
|
—
|
|
—
|
|
—
|
|
—
|
|
—
|
|
|||||||||
|
Futures contracts
|
—
|
|
—
|
|
—
|
|
—
|
|
—
|
|
|||||||||
|
Other assets
|
12,036
|
|
12,036
|
|
—
|
|
—
|
|
12,036
|
|
|||||||||
|
Variable interest entity assets:
|
|||||||||||||||||||
|
Fixed income securities:
|
|||||||||||||||||||
|
Corporate obligations
|
2,743,050
|
|
2,743,050
|
|
—
|
|
—
|
|
2,743,050
|
|
|||||||||
|
Restricted cash
|
7,708
|
|
7,708
|
|
7,708
|
|
—
|
|
—
|
|
|||||||||
|
Loans
|
12,371,177
|
|
12,371,177
|
|
—
|
|
—
|
|
12,371,177
|
|
|||||||||
|
Total financial assets
|
$
|
20,829,639
|
|
$
|
20,822,011
|
|
$
|
547,047
|
|
$
|
4,929,368
|
|
$
|
15,345,596
|
|
||||
|
Financial liabilities:
|
|||||||||||||||||||
|
Obligations under investment agreements
|
$
|
160,079
|
|
$
|
161,821
|
|
$
|
—
|
|
$
|
—
|
|
$
|
161,821
|
|
||||
|
Long term debt, including accrued interest
|
1,273,805
|
|
1,379,864
|
|
—
|
|
—
|
|
1,379,864
|
|
|||||||||
|
Derivative liabilities:
|
|||||||||||||||||||
|
Credit derivatives
|
75,502
|
|
75,502
|
|
—
|
|
—
|
|
75,502
|
|
|||||||||
|
Interest rate swaps—asset position
|
(54,666
|
)
|
(54,666
|
)
|
—
|
|
(54,666
|
)
|
—
|
|
|||||||||
|
Interest rate swaps—liability position
|
385,346
|
|
385,346
|
|
—
|
|
243,459
|
|
141,887
|
|
|||||||||
|
Futures contracts
|
562
|
|
562
|
|
562
|
|
—
|
|
—
|
|
|||||||||
|
Other contracts
|
200
|
|
200
|
|
—
|
|
200
|
|
—
|
|
|||||||||
|
Liabilities for net financial guarantees written
(1)
|
2,923,652
|
|
4,539,000
|
|
—
|
|
—
|
|
4,539,000
|
|
|||||||||
|
Variable interest entity liabilities:
|
|||||||||||||||||||
|
Long-term debt
|
12,882,076
|
|
12,882,076
|
|
—
|
|
11,618,412
|
|
1,263,664
|
|
|||||||||
|
Derivative liabilities:
|
|||||||||||||||||||
|
Interest rate swaps—liability position
|
2,133,268
|
|
2,133,268
|
|
—
|
|
2,133,268
|
|
—
|
|
|||||||||
|
Currency swaps—liability position
|
66,895
|
|
66,895
|
|
—
|
|
66,895
|
|
—
|
|
|||||||||
|
Total financial liabilities
|
$
|
19,846,719
|
|
$
|
21,569,868
|
|
$
|
562
|
|
$
|
14,007,568
|
|
$
|
7,561,738
|
|
||||
|
(1)
|
The carrying value of net financial guarantees written includes the following balance sheet items: Premium receivables; Reinsurance recoverable on paid and unpaid losses; Deferred ceded premium; Subrogation recoverable; Insurance intangible asset; Unearned premiums; Loss and loss expense reserves; Ceded premiums payable, premiums taxes payable and other deferred fees recorded in Other liabilities.
|
123
|
Carrying
Amount |
Total Fair
Value |
Fair Value Measurements Categorized as:
|
|||||||||||||||||
|
Level 1
|
Level 2
|
Level 3
|
|||||||||||||||||
|
December 31, 2013:
|
|||||||||||||||||||
|
Financial assets:
|
|||||||||||||||||||
|
Fixed income securities:
|
|||||||||||||||||||
|
Municipal obligations
|
$
|
1,377,723
|
|
$
|
1,377,723
|
|
$
|
—
|
|
$
|
1,377,723
|
|
$
|
—
|
|
||||
|
Corporate obligations
|
1,489,369
|
|
1,489,369
|
|
—
|
|
1,485,867
|
|
3,502
|
|
|||||||||
|
Foreign obligations
|
124,877
|
|
124,877
|
|
—
|
|
124,877
|
|
—
|
|
|||||||||
|
U.S. government obligations
|
126,248
|
|
126,248
|
|
126,248
|
|
—
|
|
—
|
|
|||||||||
|
U.S. agency obligations
|
32,154
|
|
32,154
|
|
—
|
|
31,946
|
|
208
|
|
|||||||||
|
Residential mortgage-backed securities
|
1,558,625
|
|
1,558,625
|
|
—
|
|
1,558,625
|
|
—
|
|
|||||||||
|
Collateralized debt obligations
|
183,872
|
|
183,872
|
|
—
|
|
183,872
|
|
—
|
|
|||||||||
|
Other asset-backed securities
|
992,448
|
|
992,448
|
|
—
|
|
928,375
|
|
64,073
|
|
|||||||||
|
Fixed income securities, pledged as collateral:
|
|||||||||||||||||||
|
U.S. government obligations
|
126,223
|
|
126,223
|
|
126,223
|
|
—
|
|
—
|
|
|||||||||
|
Short term investments
|
271,119
|
|
271,119
|
|
267,612
|
|
3,507
|
|
—
|
|
|||||||||
|
Other investments
|
241,069
|
|
241,069
|
|
—
|
|
240,969
|
|
100
|
|
|||||||||
|
Cash and cash equivalents
|
77,370
|
|
77,370
|
|
74,425
|
|
2,945
|
|
—
|
|
|||||||||
|
Loans
|
6,179
|
|
6,238
|
|
—
|
|
—
|
|
6,238
|
|
|||||||||
|
Derivative assets:
|
|||||||||||||||||||
|
Interest rate swaps—asset position
|
76,631
|
|
76,631
|
|
—
|
|
76,631
|
|
—
|
|
|||||||||
|
Interest rate swaps—liability position
|
(1,257
|
)
|
(1,257
|
)
|
—
|
|
(1,257
|
)
|
—
|
|
|||||||||
|
Futures contracts
|
2,337
|
|
2,337
|
|
2,337
|
|
—
|
|
—
|
|
|||||||||
|
Other assets
|
13,384
|
|
13,384
|
|
—
|
|
—
|
|
13,384
|
|
|||||||||
|
Variable interest entity assets:
|
|||||||||||||||||||
|
Fixed income securities:
|
|||||||||||||||||||
|
Corporate obligations
|
2,475,182
|
|
2,475,182
|
|
—
|
|
—
|
|
2,475,182
|
|
|||||||||
|
Restricted cash
|
17,498
|
|
17,498
|
|
17,498
|
|
—
|
|
—
|
|
|||||||||
|
Loans
|
13,398,895
|
|
13,398,895
|
|
—
|
|
—
|
|
13,398,895
|
|
|||||||||
|
Total financial assets
|
$
|
22,589,946
|
|
$
|
22,590,005
|
|
$
|
614,343
|
|
$
|
6,014,080
|
|
$
|
15,961,582
|
|
||||
|
Financial liabilities:
|
|||||||||||||||||||
|
Obligations under investment agreements
|
$
|
359,070
|
|
$
|
360,506
|
|
$
|
—
|
|
$
|
—
|
|
$
|
360,506
|
|
||||
|
Long term debt, including accrued interest
|
1,256,602
|
|
1,215,029
|
|
—
|
|
—
|
|
1,215,029
|
|
|||||||||
|
Derivative liabilities:
|
|||||||||||||||||||
|
Credit derivatives
|
94,322
|
|
94,322
|
|
—
|
|
—
|
|
94,322
|
|
|||||||||
|
Interest rate swaps—asset position
|
(55,619
|
)
|
(55,619
|
)
|
—
|
|
(55,619
|
)
|
—
|
|
|||||||||
|
Interest rate swaps—liability position
|
215,030
|
|
215,030
|
|
—
|
|
122,418
|
|
92,612
|
|
|||||||||
|
Other contracts
|
165
|
|
165
|
|
—
|
|
165
|
|
—
|
|
|||||||||
|
Liabilities for net financial guarantees written
(1)
|
4,509,539
|
|
4,876,617
|
|
—
|
|
—
|
|
4,876,617
|
|
|||||||||
|
Variable interest entity liabilities:
|
|||||||||||||||||||
|
Long-term debt
|
14,091,753
|
|
14,091,753
|
|
—
|
|
12,577,148
|
|
1,514,605
|
|
|||||||||
|
Derivative liabilities:
|
|||||||||||||||||||
|
Interest rate swaps—liability position
|
1,680,834
|
|
1,680,834
|
|
—
|
|
1,680,834
|
|
—
|
|
|||||||||
|
Currency swaps—liability position
|
91,472
|
|
91,472
|
|
—
|
|
91,472
|
|
—
|
|
|||||||||
|
Total financial liabilities
|
$
|
22,243,168
|
|
$
|
22,570,109
|
|
$
|
—
|
|
$
|
14,416,418
|
|
$
|
8,153,691
|
|
||||
|
(1)
|
The carrying value of net financial guarantees written includes the following balance sheet items: Premium receivables; Reinsurance recoverable on paid and unpaid losses; Deferred ceded premium; Subrogation recoverable; Insurance intangible asset; Unearned premiums; Loss and loss expense reserves; Ceded premiums payable, premiums taxes payable and other deferred fees recorded in Other liabilities.
|
Determination of Fair Value:
When available, Ambac uses quoted active market prices specific to the financial instrument to determine fair value, and classifies such items within Level 1. Because many fixed income securities do not trade on a daily basis, pricing sources apply available information through processes such as matrix pricing to calculate fair value. In those cases, the items are classified within Level 2. If quoted market prices are not available, fair value is based upon models that use, where possible, current market-based or independently-sourced market parameters. Items valued using
124
valuation models are classified according to the lowest level input or value driver that is significant to the valuation. Thus, an item may be classified in Level 3 even though there may be significant inputs that are readily observable.
The determination of fair value for financial instruments categorized in Level 2 or 3 involves significant judgment due to the complexity of factors contributing to the valuation. Third-party sources from which we obtain independent market quotes also use assumptions, judgments and estimates in determining financial instrument values and different third parties may use different methodologies or provide different prices for securities. We believe the potential for differences in third-party pricing levels is particularly significant with respect to residential mortgage-backed and certain other asset-backed securities held in our investment portfolio and referenced in our credit derivative portfolio, due to the low levels of trading activity for such securities. In addition, the use of internal valuation models may require assumptions about hypothetical or inactive markets. As a result of these factors, the actual trade value of a financial instrument in the market, or exit value of a financial instrument position by Ambac, may be significantly different from its recorded fair value.
Ambac’s financial instruments carried at fair value are mainly comprised of investments in fixed income securities, equity interests in pooled investment funds, derivative instruments, variable interest entity assets and liabilities and equity interests in Ambac sponsored special purpose entities. Valuation of financial instruments is performed by Ambac’s finance group using methods approved by senior financial management with consultation from risk management and portfolio managers as appropriate. Preliminary valuation results are discussed with portfolio managers quarterly to assess consistency with market transactions and trends as applicable. Market transactions such as trades or negotiated settlements of similar positions, if any, are reviewed quarterly to validate fair value model results. However many of the financial instruments valued using significant unobservable inputs have very little or no observable market activity. Methods and significant inputs and assumptions used to determine fair values across portfolios are reviewed quarterly by senior financial management. Other valuation control procedures specific to particular portfolios are described further below.
We reflect Ambac’s own creditworthiness in the fair value of financial liabilities by including a credit valuation adjustment (“CVA”) in the determination of fair value. A decline (increase) in Ambac’s creditworthiness as perceived by market participants will generally result in a higher (lower) CVA, thereby lowering (increasing) the fair value of Ambac’s financial liabilities as reported.
Fixed Income Securities:
The fair values of fixed income investment securities are based primarily on market prices received from dealer quotes or alternative pricing sources with reasonable levels of price transparency. Such quotes generally consider a variety of factors, including recent trades of the same and similar securities. For those fixed income investments where quotes were not available or cannot be reasonably corroborated, fair values are based on internal valuation models. Key inputs to the internal valuation models generally include maturity date, coupon and yield curves for asset-type and credit rating characteristics that closely match those characteristics of the specific investment securities being valued. Longer (shorter) expected maturities or higher (lower) yields used in the valuation model will, in isolation, result in decreases (increases) in fair value. Generally, lower credit ratings or longer expected maturities will be accompanied by higher yields used to value a security. Certain investments in Ambac-wrapped securities for which projected cash flows consist solely of Deferred Amounts and interest thereon, are internally valued based upon the valuation of surplus notes. At
December 31, 2014
, approximately
10%
,
86%
, and
4%
of the investment portfolio (excluding variable interest entity investments) was valued using dealer quotes, alternative pricing sources with reasonable levels of price transparency and internal valuation models, respectively. At
December 31, 2013
, approximately
11%
,
88%
, and
1%
of the investment portfolio (excluding variable interest entity investments) was valued using dealer quotes, alternative pricing sources with reasonable levels of price transparency and internal valuation models, respectively.
Ambac performs various review and validation procedures to quoted and modeled prices for fixed income securities, including price variance analysis, missing and static price reviews, overall valuation analysis by senior traders and finance managers and reviews associated with our ongoing impairment analysis. Unusual prices identified through these procedures will be evaluated further against alternative third party quotes (if available) and/or internally modeled prices, and the pricing source values will be challenged as necessary. Price challenges generally result in the use of the pricing source’s quote as originally provided or as revised by the source following their internal diligence process. A price challenge may result in a determination by either the pricing source or Ambac management that the pricing source cannot provide a reasonable value for a security or cannot adequately support a quote, in which case Ambac would resort to using either other quotes or internal models. Results of price challenges are reviewed by senior traders and finance managers.
The reported fair values of Level 2 fixed income securities are obtained from third party quotes. Information about the valuation inputs for fixed income securities classified as Level 3 is included below:
Corporate obligations:
These securities represent interest only strips of investment grade corporate obligations. The fair value of such securities classified as Level 3 was
$3,808
and
$3,502
at
December 31, 2014 and 2013
, respectively. Fair value was calculated using a discounted cash flow approach with the discount rate determined from the yields of corporate bonds from the same issuers. Significant inputs for the interest only strips valuation at
December 31, 2014 and 2013
include the following weighted averages:
125
|
December 31, 2014
|
December 31, 2013
|
|||
|
a. Coupon rate:
|
0.345%
|
a. Coupon rate:
|
0.345%
|
|
|
b. Maturity:
|
19.14 years
|
b. Maturity:
|
20.14 years
|
|
|
c. Yield:
|
4.93%
|
c. Yield:
|
6.30%
|
|
U.S. agency obligations
: These notes are secured by separate lease rental agreements with the U.S. Government acting through the General Services Administration. The fair value of such securities classified as Level 3 was
$0
and
$208
at
December 31, 2014 and 2013
, respectively. Valuation of these assets was classified as Level 2 as of
December 31, 2014
. At
December 31, 2013
, fair value of these assets was calculated using a discounted cash flow approach with the yield based on comparable U.S. agency securities. Significant inputs for the valuation at
December 31, 2013
include the following weighted averages:
December 31, 2013
a.
Coupon rate:
6.98%
b.
Maturity:
1.37 years
c.
Yield:
0.39%
Other asset-backed securities:
These securities are floating rate investment grade notes collateralized by various asset types. The fair value of such securities classified as Level 3 was
$0
and
$64,073
at
December 31, 2014 and 2013
, respectively. Fair value was calculated using a discounted cash flow approach with expected future cash flows discounted using a yield curve consistent with the security type and rating. Significant inputs for the valuation at
December 31, 2013
include the following weighted averages:
December 31, 2013
a.
Coupon rate:
0.64%
b.
Maturity:
7.15 years
c.
Yield:
5.17%
Non-Agency RMBS securities:
These securities are guaranteed under policies that are subject to the Segregated Account Rehabilitation Plan and have projected future cash flows consisting solely of Deferred Amounts under such policies including interest thereon. The fair value of such securities classified as Level 3 was
$194,393
at
December 31, 2014
. Fair value was calculated based on the valuation of Ambac Assurance surplus notes which, under the terms of the Segregated Account Rehabilitation Plan, are to be redeemed in proportion with the payment of Deferred Amounts on or about the dates when such payments are made. Refer to
Note 1. Background and Business Description
for further description of the Segregated Account Rehabilitation Plan and its impact on the payment of Segregated Account policy claims and surplus note redemptions.
Other Investments:
Other investments primarily relate to investments in pooled investment funds, which are valued using the net asset value (“NAV”) per share, calculated on at least a monthly basis where NAV is the basis for determining the redemption value of the investment. These investments are classified as Level 2 as redemptions may be made in the near term (within 90 days) without significant impediments or restrictions. Ambac assesses impediments to redemption and other factors that may restrict the ability to redeem investments in the near term or at values approximating the NAV and may classify the investments as Level 3 if such factors exist. As of December 31, 2014, Ambac's interest in a non-consolidated VIE, which is carried under the equity method, is included in Other investments. Valuation of this equity interest is internally calculated using a discounted cash flow approach.
Derivative Instruments:
Ambac’s derivative instruments primarily comprise interest rate and credit default swaps, and exchange traded futures contracts. Fair value is determined based upon market quotes from independent sources, when available. When independent quotes are not available, fair value is determined using valuation models. These valuation models require market-driven inputs, including contractual terms, credit spreads and ratings on underlying referenced obligations, yield curves and tax-exempt interest ratios. The valuation of certain interest rate as well as all credit derivative contracts also require the use of data inputs and assumptions that are determined by management and are not readily observable in the market. Under the Fair Value Measurement Topic of the ASC, Ambac is required to consider its own credit risk when measuring the fair value of derivative and other liabilities. The fair value of credit derivative liabilities was reduced by
$15,910
and
$38,966
at
December 31, 2014 and 2013
, as a result of incorporating a CVA into the valuation model for these transactions. Interest rate swaps and other derivative liabilities may also require an adjustment to fair value to reflect Ambac’s credit risk. Derivative liabilities were reduced by
$64,547
and
$48,425
at
December 31, 2014 and 2013
, as a result of Ambac CVA adjustments to derivative contracts other than credit derivatives. Additional factors considered in estimating the amount of any Ambac CVA on such contracts include collateral posting provisions, right of set-off with the counterparty, the period of time remaining on the derivatives and the pricing of recent terminations.
126
As described further below, certain valuation models require other inputs that are not readily observable in the market. The selection of a model to value a derivative depends on the contractual terms of, and specific risks inherent in the instrument as well as the availability of pricing information in the market.
For derivatives that are less complex and trade in liquid markets or may be valued primarily by reference to interest rates and yield curves that are observable and regularly quoted, such as interest rate swaps, we utilize vendor-developed models. These models provide the net present value of the derivatives based on contractual terms and observable market data. Downgrades of Ambac Assurance, as guarantor of the financial services derivatives, have increased collateral requirements and triggered termination provisions in certain interest rate swaps. Termination activity since the initial rating downgrades of Ambac Assurance provided additional information about the replacement and/or exit value of certain financial services derivatives, which has been incorporated into the fair value of these derivatives as appropriate. Generally, the need for counterparty (or Ambac) CVAs is mitigated by the existence of collateral posting agreements under which adequate collateral has been posted. Derivative contracts entered into with financial guarantee customers are not typically subject to collateral posting agreements. Counterparty credit risk related to such customer derivative assets is included in our fair value adjustments.
For derivatives that do not trade, or trade in less liquid markets such as credit derivatives, an internal model is used because such instruments tend to be unique, contain complex or heavily modified and negotiated terms, and pricing information is not readily available in the market. Derivative fair value models and the related assumptions are continuously re-evaluated by management and enhanced, as appropriate, based on improvements in modeling techniques. Ambac has not made any significant changes to its modeling techniques or related model inputs for the periods presented.
Credit Derivatives (“CDS”):
Fair value of Ambac’s CDS is determined using internal valuation models and represents the net present value of the difference between the fees Ambac originally charged for the credit protection and our estimate of what a financial guarantor of comparable credit quality would hypothetically charge to provide the same protection at the balance sheet date. Ambac competed in the financial guarantee market, which differs from the credit markets where Ambac-insured obligations may trade. As a financial guarantor, Ambac assumes only credit risk; we do not assume other risks and costs inherent in direct ownership of the underlying reference securities. Additionally, as a result of having the ability to influence our CDS counterparty in certain investor decisions, financial guarantors generally have the ability to actively remediate the credit, potentially reducing the loss given a default. Financial guarantee contracts, including CDS, issued by Ambac and its competitors are typically priced to capture some portion of the spread that would be observed in the capital markets for the underlying (insured) obligation. Such pricing was well established by historical financial guarantee fees relative to capital market spreads as observed and executed in competitive markets, including in financial guarantee reinsurance and secondary market transactions. Because of this relationship and in the absence of severe credit deterioration, changes in the fair value of our credit default swaps will generally be less than changes in the fair value of the underlying reference obligations.
Key variables used in our valuation of substantially all of our credit derivatives include the balance of unpaid notional, expected term, fair values of the underlying reference obligations, reference obligation credit ratings, assumptions about current financial guarantee CDS fee levels relative to reference obligation spreads and the CVA applied against Ambac Assurance liabilities by market participants. Notional balances, expected remaining term and reference obligation credit ratings are monitored and determined by Ambac’s portfolio risk management group. Fair values of the underlying reference obligations are obtained from broker quotes when available, or are estimated internally. Implicit in the fair values we obtain on the underlying reference obligations are the market’s assumptions about default probabilities, default timing, correlation, recovery rates and collateral values.
Broker quotes on the reference obligations named in our CDS contracts represent an input to determine the estimated fair value of the CDS contract. Broker quotes are indicative values for the reference obligation and generally do not represent a bid for the reference instrument. Such quotes follow methodologies that are generally consistent with those used to value similar assets on the quote providers’ own books. Methodologies may differ among brokers but are understood to reflect observable trading activity (when available) and modeling that relies on empirical data and reasonable assumptions. For certain CDS contracts referencing unsecuritized pools of assets, we will obtain counterparty quotes on the credit derivative itself. Such quotes are adjusted to reflect Ambac’s own credit risk when determining the fair value of credit derivative liabilities. Third party reference obligation values or specific credit derivative quotes were used in the determination of CDS fair values related to transactions representing
85%
of CDS gross par outstanding and
66%
of the CDS derivative liability as of
December 31, 2014
.
When broker quotes for reference obligations are not available, reference obligation prices used in the valuation model are estimated internally based on available market prices or spreads for securities or indices with similar characteristics such as underlying collateral, credit rating and expected life. Internal estimates may also consider historical quotes on the reference obligation, updated for changes in market factors and security specific developments such as credit rating changes. Reference obligation prices derived internally as described above were used in the determination of CDS fair values related to transactions representing
15%
of CDS gross par outstanding and
34%
of the CDS derivative liability as of
December 31, 2014
.
Ambac’s CDS fair value calculations are adjusted for changes in our estimates of expected loss on the reference obligations and observable changes in financial guarantee market pricing. If no adjustment is considered necessary, Ambac maintains the same percentage of the credit spread (over LIBOR) demanded in the market for the reference obligation as existed at the inception of the CDS. Therefore, absent changes in expected loss on the reference obligations or financial guarantee CDS market pricing, the financial guarantee CDS fee used for a particular contract in Ambac’s fair value calculations represent a consistent percentage, period to period, of the credit spread determinable from the reference
127
obligation value at the balance sheet date. This results in a CDS fair value balance that fluctuates in proportion with the reference obligation value.
The amount of expected loss on a reference obligation is a function of the probability that the obligation will default and severity of loss in the event of default. Ambac’s CDS transactions were all originally underwritten with extremely low expected losses. Both the reference obligation spreads and Ambac’s CDS fees at the inception of these transactions reflected these low expected losses. When reference obligations experience credit deterioration, there is an increase in the probability of default on the obligation and, therefore, an increase in expected loss. Ambac reflects the effects of changes in expected loss on the fair value of its CDS contracts by increasing the percentage of the reference obligation spread (over LIBOR) which would be captured as a CDS fee (“relative change ratio”) at the valuation date, resulting in a higher mark-to-market loss on our CDS relative to any price decline on the reference obligation. The fundamental assumption is that financial guarantee CDS fees will increase relative to reference obligation spreads as the underlying credit quality of the reference obligation deteriorates and approaches payment default. For example, if the credit spread of an underlying reference obligation was 80 basis points at the inception of a transaction and Ambac received a 20 basis point fee for issuing a CDS on that obligation, the relative change ratio, which represents the CDS fee to cash market spread Ambac would utilize in its valuation calculation, would be
25%
. If the reference obligation spread increased to 100 basis points in the current reporting period, absent any observable changes in financial guarantee CDS market pricing or credit deterioration, Ambac’s current period CDS fee would be computed by multiplying the current reference obligation spread of 100 basis points by the relative change ratio of
25%
, resulting in a 25 basis point fee. Thus, the model indicates we would need to receive an additional 5 basis points (25 basis points currently less the 20 basis points contractually received) for issuing a CDS in the current reporting period for this reference obligation. We would then discount the product of the notional amount of the CDS and the 5 basis point hypothetical CDS fee increase, over the weighted average life of the reference obligation to compute the current period mark-to-market loss. Using the same example, if the reference obligation spread increased to 100 basis points and there was credit deterioration as evidenced by an internal rating downgrade which increased the relative change ratio from
25%
to
35%
, we would estimate a 15 basis point CDS fee increase in our model (
35%
of 100 basis points reference obligation spread, or 35 basis points currently, less the 20 basis points contractually received). Therefore, we would record a higher mark-to-market loss based on the computations described above absent any observable changes in financial guarantee CDS market pricing.
We do not adjust the relative change ratio until an actual internal rating downgrade has occurred unless we observe new pricing on financial guarantee CDS contracts. However, because we have active surveillance procedures in place for our entire CDS portfolio, particularly for transactions at or near a below investment grade threshold, we believe it is unlikely that an internal downgrade would lag the actual credit deterioration of a transaction for any meaningful time period. The factors used to increase the relative change ratio are based on rating agency probability of default percentages determined by management to be appropriate for the relevant bond type. That is, the probability of default associated with the respective tenor and internal rating of each CDS transaction is utilized in the computation of the relative change ratio in our CDS valuation model. The new relative change ratio in the event of an internal downgrade of the reference obligation is calculated as the weighted average of: (i) a given transaction’s inception relative change ratio and (ii) a ratio of 100%. The weight given to the inception relative change ratio is 100% minus the current probability of default (the probability of non-default) and the weight given to using a
100%
relative change ratio is the probability of default. For example, assume a transaction having an inception relative change ratio of
33%
is downgraded to B-during the period, at which time it has an estimated remaining life of
8
years. If the estimated probability of default for an 8 year, B-rated credit of this type is 60% then the revised relative change ratio will be
73.2%
. The revised relative change ratio can be calculated as 33% x (100%-60%) +100% x 60% = 73.2%.
As noted above, reference obligation spreads incorporate market perceptions of default probability and loss severity, as well as liquidity risk and other factors. By increasing the relative change ratio in our calculations proportionally to default probabilities, Ambac incorporates into its CDS fair value the higher expected loss on the reference obligation (probability of default x loss severity), by increasing the portion of reference obligation spread that should be paid to the CDS provider.
Ambac incorporates its own credit risk into the valuation of its CDS liabilities by applying a CVA to the calculations described above. Under our methodology, determination of the CDS fair value requires estimating hypothetical financial guarantee CDS fees for a given credit at the valuation date and estimating the present value of those fees. Our approach begins with pricing in the risk of default of the reference obligation using that obligation’s credit spread. The widening of the reference obligation spread results in a mark-to-market loss to Ambac, as the credit protection seller, and a gain to the credit protection buyer because the current cost of credit protection on the reference obligation (ignoring CDS counterparty credit risk) will be greater than the amount of the actual contractual CDS fees. The Ambac CVA represents the difference between the present value of the hypothetical fees discounted at LIBOR compared to rates that incorporate Ambac credit risk. The discount rates used to determine the Ambac CVA are estimated using relevant data points, including quoted prices of securities guaranteed by Ambac Assurance which indicate the value placed by market participants on Ambac Assurance’s insurance obligations and the fair value of Ambac Assurance surplus notes. The resulting Ambac CVA, as a percentage of the CDS mark-to-market liability determined by discounting at LIBOR, was
17.8%
and
29.2%
as of
December 31, 2014 and 2013
, respectively. In instances where narrower reference obligation spreads result in a CDS asset to Ambac, those hypothetical future CDS fees are discounted at a rate which incorporates our counterparty’s credit spread (i.e. the discount rate used is LIBOR plus the current credit spread of the counterparty).
In addition, when there are sufficient numbers of new observable transactions, negotiated settlements or other market indications of a general change in market pricing trends for CDS on a given bond type, management will adjust its assumptions about the percentage of reference obligation spreads captured as CDS fees to match the current market. No such adjustments were made during the periods presented. Ambac is not transacting CDS business currently and other guarantors have stated they have exited this product. Additionally, there have been no negotiated settlements of CDS contracts during the periods presented.
128
Key variables which impact the “Realized gains and losses and other settlements” component of “Net change in fair value of credit derivatives” in the Consolidated Statements of Total Comprehensive Income (Loss) are the most readily observable variables since they are based solely on the CDS contractual terms and cash settlements. Those variables include premiums received and accrued and losses paid and payable on written credit derivative contracts for the appropriate accounting period. Losses paid and payable reported in “Realized gains and losses and other settlements” include those arising after a credit event that requires a payment under the contract terms has occurred or in connection with a negotiated termination of a contract. The remaining key variables described above impact the “Unrealized gains (losses)” component of “Net change in fair value of credit derivatives.”
The net notional outstanding of Ambac’s CDS contracts were
$1,529,759
and
$2,776,103
at
December 31, 2014 and 2013
, respectively. Credit derivative liabilities at
December 31, 2014 and 2013
had a combined net fair value of
$73,459
and
$94,322
, respectively, and related to underlying reference obligations that are classified as either collateralized loan obligations (“CLOs”) or Other. Information about the above described model inputs used to determine the fair value of each class of credit derivatives, including the CVA as a percentage of the gross mark-to-market liability before considering Ambac credit risk (“CVA percentage”), as of
December 31, 2014 and 2013
is summarized below:
|
CLOs
|
Other
(1)
|
||||||
|
December 31, 2014:
|
|||||||
|
Notional outstanding
|
$
|
549,923
|
|
$
|
921,036
|
|
|
|
Weighted average reference obligation price
|
98.9
|
|
86.8
|
|
|||
|
Weighted average life (WAL) in years
|
1.8
|
|
5.7
|
|
|||
|
Weighted average credit rating
|
AA
|
|
BBB-
|
|
|||
|
Weighted average relative change ratio
|
35.9
|
%
|
49.0
|
%
|
|||
|
CVA percentage
|
5.40
|
%
|
15.82
|
%
|
|||
|
Fair value of derivative liabilities
|
$
|
2,027
|
|
$
|
71,104
|
|
|
|
December 31, 2013:
|
|||||||
|
Notional outstanding
|
$
|
1,337,737
|
|
$
|
1,291,371
|
|
|
|
Weighted average reference obligation price
|
98.0
|
|
85.7
|
|
|||
|
Weighted average life (WAL) in years
|
2.1
|
|
5.4
|
|
|||
|
Weighted average credit rating
|
AA
|
|
BBB-
|
|
|||
|
Weighted average relative change ratio
|
35.3
|
%
|
43.1
|
%
|
|||
|
CVA percentage
|
13.67
|
%
|
30.70
|
%
|
|||
|
Fair value of derivative liabilities
|
$
|
7,993
|
|
$
|
84,780
|
|
|
|
(1)
|
Excludes contracts for which fair values are based on credit derivative quotes rather than reference obligation quotes. Such contracts have a combined notional outstanding of
$58,800
, WAL of
1.2
years and liability fair value of
$328
as of
December 31, 2014
. Other inputs to the valuation of these transactions at
December 31, 2014
include weighted average quotes of
1%
of notional, weighted average rating of
A
and Ambac CVA percentage of
2.21%
. As of
December 31, 2013
, these contracts had a combined notional outstanding of
$146,995
, WAL of
1.0
years and liability fair value of
$1,549
. Other inputs to the valuation of these transactions at
December 31, 2013
include weighted average quotes of
1%
of notional, weighted average rating of
A+
and Ambac CVA percentage of
8.7%
.
|
Significant unobservable inputs for credit derivatives include WAL, internal credit rating, relative change ratio and CVA percentage. A longer (shorter) WAL, lower (higher) reference obligation credit rating, higher (lower) relative change ratio or lower (higher) CVA, in isolation, would result in an increase (decrease) in the fair value liability measurement. A change in an internal credit rating of a reference obligation in our model will generally result in a directionally opposite change in the relative change ratio. Also, a shorter (longer) WAL will generally correspond with a lower (higher) CVA percentage.
Financial Guarantees:
Fair value of net financial guarantees written represents our estimate of the cost to Ambac to completely transfer its insurance obligation to another market participant of comparable credit worthiness. In theory, this amount should be the same amount that another market participant of comparable credit worthiness would hypothetically charge in the market place, on a present value basis, to provide the same protection as of the balance sheet date. This fair value estimate of financial guarantees is presented on a net basis and includes direct and assumed contracts written, net of ceded reinsurance contracts.
The fair value estimate of financial guarantees is computed by utilizing cash flows calculated at the policy level. For direct and assumed contracts, net cash flows for each policy included: (i) installment premium receipts, (ii) estimated future gross claim payments, (iii) subrogation receipts, and (iv) unpaid claims on claims presented and not yet paid for policies allocated to the Segregated Account, including Deferred Amounts including interest thereon. For ceded reinsurance contracts, net cash flows for each policy included: (i) installment ceded premium payments, (ii) ceding commission receipts, (iii) ceded claim receipts, and (iv) ceded subrogation payments. For each individual direct, assumed, and ceded reinsurance contract, the respective undiscounted cash flow components are aggregated to determine if we are in a net asset or net liability position. U.S. GAAP requires that the nonperformance risk of a financial liability be included in the estimation of fair value, which includes
129
considering Ambac Assurance’s own credit risk. Accordingly, for each contract in a net liability position, we estimate the fair value using internally developed discount rates and market pricing that incorporate Ambac’s own credit risk and subsequently apply a profit margin. This profit margin represents what another market participant would require to assume the financial guarantee contracts. Given the unique nature of financial guarantees there is a lack of observable market information to make this estimate. A profit margin was developed based on discussions with the third-party institutions with valuation expertise, discussions with industry participants and yields on Ambac Assurance surplus notes. The profit margin was
17%
and
17%
as of
December 31, 2014 and 2013
, respectively and is applied to the present value of contracts in a net liability position. The discount rates used for contracts in a net liability position are derived from the rates implicit in the fair value of surplus notes and guaranteed securities with future cash flows that are highly dependent upon Ambac financial guarantee payments. For each contract in a net asset position, we estimate the fair value using a discount rate that is commensurate with a hypothetical buyer’s cost of capital.
This methodology is based on management’s expectations of how a market participant would estimate net cash flows. We are aware of a number of factors that may cause such fair or exit value to differ, perhaps materially. For example, (i) since no financial guarantor with Ambac’s credit quality is writing new financial guarantee business we do not have access to observable pricing data points; (ii) although the fair value accounting guidance for liabilities requires a company to consider the cost to completely transfer its obligation to another party of comparable credit worthiness, our primary insurance obligation is irrevocable and thus there is no established active market for transferring such obligations; and (iii) certain segments of Ambac's financial guarantees have been allocated to the Segregated Account and timing of the payments of such liabilities are at the sole discretion of the Rehabilitator.
Long-term Debt:
The fair value of surplus notes issued by Ambac Assurance and the Segregated Account and classified as long-term debt is internally estimated considering market transactions when available and internally developed discounted cash flow models.
Other Financial Assets and Liabilities:
The fair values of Ambac’s equity interest in Ambac sponsored special purpose entities (included in Other assets), Loans, and Obligations under investment agreements are estimated based upon internal valuation models that discount expected cash flows using discount rates consistent with the credit quality of the obligor after considering collateralization.
Variable Interest Entity Assets and Liabilities:
The financial assets and liabilities of VIEs consolidated under the Consolidation Topic of the ASC consist primarily of fixed income securities, loans, derivative and debt instruments and are generally carried at fair value. These consolidated VIEs are securitization entities which have liabilities and/or assets guaranteed by Ambac Assurance. The fair values of VIE debt instruments are determined using the same methodologies used to value Ambac’s fixed income securities in its investment portfolio as described above. VIE debt fair value is based on market prices received from dealer quotes or alternative pricing sources with reasonable levels of price transparency. Such quotes are considered Level 2 and generally consider a variety of factors, including recent trades of the same and similar securities. For those VIE debt instruments where quotes were not available, the debt instrument fair values are considered Level 3 and are based on internal discounted cash flow models. Comparable to the sensitivities of investments in fixed income securities described above, longer (shorter) expected maturities or higher (lower) yields used in the valuation model will, in isolation, result in decreases (increases) in fair value liability measurement for VIE debt. VIE debt instruments considered Level 3 include fixed rate, floating rate and zero coupon notes secured by various asset types, primarily European ABS. Information about the valuation inputs for the various VIE debt categories classified as Level 3 is as follows:
European ABS transactions:
The fair value of such obligations classified as Level 3 was
$1,070,439
and
$1,329,985
at
December 31, 2014 and 2013
, respectively. Fair values were calculated by using a discounted cash flow approach. The discount rates used were based on the rates implied from the third party quoted values (Level 2) for comparable notes from the same securitization entity. Significant inputs for the valuation at
December 31, 2014 and 2013
include the following weighted averages:
|
December 31, 2014
|
December 31, 2013
|
|||
|
a. Coupon rate:
|
0.30%
|
a. Coupon rate:
|
0.72%
|
|
|
b. Maturity:
|
21.25 years
|
b. Maturity:
|
17.86 years
|
|
|
c. Yield:
|
9.52%
|
c. Yield:
|
8.02%
|
|
US Commercial ABS transaction:
The fair value of such obligations classified as Level 3 was
$193,225
and
$184,620
at
December 31, 2014 and 2013
, respectively. Fair values were calculated as the sum of the present value of expected future cash flows from the underlying VIE assets plus the present value of the related Ambac financial guarantee cash flows. The discount rates applied to cash flows sourced from VIE assets were based on interest rates for similar obligations. The fair value of financial guarantee cash flows include internal estimates of future loss payments by Ambac discounted at a rate that incorporates Ambac’s own credit risk. Significant inputs for the valuation at
December 31, 2014 and 2013
, include the following weighted averages:
130
|
December 31, 2014
|
December 31, 2013
|
|||
|
a. Coupon rate:
|
5.88%
|
a. Coupon rate:
|
6.11%
|
|
|
b. Maturity:
|
15.84 years
|
b. Maturity:
|
6.83 years
|
|
|
c. Yield:
|
7.37%
|
c. Yield:
|
11.95%
|
|
VIE derivative asset and liability fair values are determined using valuation models. When specific derivative contractual terms are available and may be valued primarily by reference to interest rates, foreign exchange rates and yield curves that are observable and regularly quoted, the derivatives are valued using vendor-developed models. Other derivatives within the VIEs that include significant unobservable valuation inputs are valued using internally developed models. VIE derivative fair value balances at
December 31, 2014 and 2013
were developed using vendor-developed models and do not use significant unobservable inputs.
The fair value of VIE assets are obtained from market quotes when available. Typically the asset fair values are not readily available from market quotes and are estimated internally. The consolidated VIEs are securitization entities in which net cash flows from assets and derivatives (after adjusting for financial guarantor cash flows and other expenses) will be paid out to note holders or equity interests. Our valuation of VIE assets (fixed income securities or loans), therefore, are derived from the fair value of notes and derivatives, as described above, adjusted for the fair value of cash flows from Ambac’s financial guarantee. The fair value of financial guarantee cash flows include: (i) estimated future premiums discounted at a rate consistent with that implicit in the fair value of the VIE’s liabilities and (ii) internal estimates of future loss payments by Ambac discounted at a rate that includes Ambac’s own credit risk. Estimated future premium payments to be paid by the VIEs were discounted at a weighted average rate of
4.1%
and
5.1%
at
December 31, 2014 and 2013
, respectively. The value of future loss payments to be paid by Ambac to the VIEs was adjusted to include an Ambac CVA appropriate for the term of expected Ambac claim payments.
Additional Fair Value Information:
The following tables present the changes in the Level 3 fair value category for the periods presented in
2014
and
2013
. Ambac classifies financial instruments in Level 3 of the fair value hierarchy when there is reliance on at least one significant unobservable input to the valuation model. In addition to these unobservable inputs, the valuation models for Level 3 financial instruments typically also rely on a number of inputs that are readily observable either directly or indirectly. Thus, the gains and losses presented below include changes in the fair value related to both observable and unobservable inputs.
Level-3 Financial Assets and Liabilities Accounted for at Fair Value
|
VIE Assets and Liabilities
|
||||||||||||||||||||||||||||
|
Successor Ambac - Year Ended December 31, 2014
|
Investments
|
Other
assets |
Derivatives
|
Investments
|
Loans
|
Long-term
debt |
Total
|
|||||||||||||||||||||
|
Balance, beginning of period
|
$
|
67,783
|
|
$
|
13,384
|
|
$
|
(186,934
|
)
|
$
|
2,475,182
|
|
$
|
13,398,895
|
|
$
|
(1,514,605
|
)
|
$
|
14,253,705
|
|
|||||||
|
Additions of VIEs consolidated
|
—
|
|
—
|
|
—
|
|
—
|
|
—
|
|
—
|
|
—
|
|
||||||||||||||
|
Total gains/(losses) realized and unrealized:
|
||||||||||||||||||||||||||||
|
Included in earnings
|
11,057
|
|
(1,348
|
)
|
(45,392
|
)
|
429,113
|
|
1,118,084
|
|
(290,457
|
)
|
1,221,057
|
|
||||||||||||||
|
Included in other comprehensive income
|
(541
|
)
|
—
|
|
—
|
|
(161,245
|
)
|
(726,827
|
)
|
66,515
|
|
(822,098
|
)
|
||||||||||||||
|
Purchases
|
54,013
|
|
—
|
|
—
|
|
—
|
|
70,000
|
|
—
|
|
124,013
|
|
||||||||||||||
|
Issuances
|
—
|
|
—
|
|
—
|
|
—
|
|
—
|
|
—
|
|
—
|
|
||||||||||||||
|
Sales
|
(59,878
|
)
|
—
|
|
—
|
|
—
|
|
—
|
|
—
|
|
(59,878
|
)
|
||||||||||||||
|
Settlements
|
(62,266
|
)
|
—
|
|
16,980
|
|
—
|
|
(792,186
|
)
|
433,896
|
|
(403,576
|
)
|
||||||||||||||
|
Transfers into Level 3
|
188,241
|
|
—
|
|
—
|
|
—
|
|
—
|
|
—
|
|
188,241
|
|
||||||||||||||
|
Transfers out of Level 3
|
(208
|
)
|
—
|
|
—
|
|
—
|
|
—
|
|
4,096
|
|
3,888
|
|
||||||||||||||
|
Deconsolidations of VIEs
|
—
|
|
—
|
|
—
|
|
—
|
|
(696,789
|
)
|
36,891
|
|
(659,898
|
)
|
||||||||||||||
|
Balance, end of period
|
$
|
198,201
|
|
$
|
12,036
|
|
$
|
(215,346
|
)
|
$
|
2,743,050
|
|
$
|
12,371,177
|
|
$
|
(1,263,664
|
)
|
$
|
13,845,454
|
|
|||||||
|
The amount of total gains/(losses) included in earnings attributable to the change in unrealized gains or losses relating to assets and liabilities still held at the reporting date
|
$
|
—
|
|
$
|
(1,348
|
)
|
$
|
(53,509
|
)
|
$
|
429,113
|
|
$
|
1,119,219
|
|
$
|
(286,405
|
)
|
$
|
1,207,070
|
|
|||||||
131
|
VIE Assets and Liabilities
|
||||||||||||||||||||||||||||
|
Successor Ambac – Period from May 1 through December 31, 2013
|
Investments
|
Other
assets |
Derivatives
|
Investments
|
Loans
|
Long-term
debt |
Total
|
|||||||||||||||||||||
|
Balance, beginning of period
|
$
|
69,412
|
|
$
|
14,061
|
|
$
|
(415,360
|
)
|
$
|
2,500,565
|
|
$
|
14,752,053
|
|
$
|
(1,750,372
|
)
|
$
|
15,170,359
|
|
|||||||
|
Additions of VIEs consolidated
|
—
|
|
—
|
|
—
|
|
—
|
|
—
|
|
—
|
|
—
|
|
||||||||||||||
|
Total gains/(losses) realized and unrealized:
|
||||||||||||||||||||||||||||
|
Included in earnings
|
1,870
|
|
(677
|
)
|
217,666
|
|
(178,322
|
)
|
(455,231
|
)
|
(2,490
|
)
|
(417,184
|
)
|
||||||||||||||
|
Included in other comprehensive income
|
7,184
|
|
—
|
|
—
|
|
152,939
|
|
873,986
|
|
(79,063
|
)
|
955,046
|
|
||||||||||||||
|
Purchases
|
—
|
|
—
|
|
—
|
|
—
|
|
—
|
|
—
|
|
—
|
|
||||||||||||||
|
Issuances
|
—
|
|
—
|
|
—
|
|
—
|
|
—
|
|
—
|
|
—
|
|
||||||||||||||
|
Sales
|
(4,528
|
)
|
—
|
|
—
|
|
—
|
|
—
|
|
—
|
|
(4,528
|
)
|
||||||||||||||
|
Settlements
|
(6,428
|
)
|
—
|
|
10,760
|
|
—
|
|
(219,909
|
)
|
173,196
|
|
(42,381
|
)
|
||||||||||||||
|
Transfers into Level 3
|
273
|
|
—
|
|
—
|
|
—
|
|
—
|
|
(220,922
|
)
|
(220,649
|
)
|
||||||||||||||
|
Transfers out of Level 3
|
—
|
|
—
|
|
—
|
|
—
|
|
—
|
|
365,046
|
|
365,046
|
|
||||||||||||||
|
Deconsolidation of VIEs
|
$
|
—
|
|
$
|
—
|
|
$
|
—
|
|
$
|
—
|
|
$
|
(1,552,004
|
)
|
$
|
—
|
|
$
|
(1,552,004
|
)
|
|||||||
|
Balance, end of period
|
$
|
67,783
|
|
$
|
13,384
|
|
$
|
(186,934
|
)
|
$
|
2,475,182
|
|
$
|
13,398,895
|
|
$
|
(1,514,605
|
)
|
$
|
14,253,705
|
|
|||||||
|
The amount of total gains/(losses) included in earnings attributable to the change in unrealized gains or losses relating to assets and liabilities still held at the reporting date
|
$
|
—
|
|
$
|
(677
|
)
|
$
|
91,436
|
|
$
|
(178,322
|
)
|
$
|
(475,152
|
)
|
$
|
(2,490
|
)
|
$
|
(565,205
|
)
|
|||||||
|
VIE Assets and Liabilities
|
||||||||||||||||||||||||||||
|
Predecessor Ambac – Period from January 1 through April 30, 2013
|
Investments
|
Other
assets |
Derivatives
|
Investments
|
Loans
|
Long-term
debt |
Total
|
|||||||||||||||||||||
|
Balance, beginning of period
|
$
|
60,402
|
|
$
|
14,557
|
|
$
|
(322,337
|
)
|
$
|
2,261,294
|
|
$
|
15,359,073
|
|
$
|
(2,956,501
|
)
|
$
|
14,416,488
|
|
|||||||
|
Additions of VIEs consolidated
|
—
|
|
—
|
|
—
|
|
—
|
|
—
|
|
(409,300
|
)
|
(409,300
|
)
|
||||||||||||||
|
Total gains/(losses) realized and unrealized:
|
||||||||||||||||||||||||||||
|
Included in earnings
|
(33
|
)
|
(496
|
)
|
(88,546
|
)
|
328,768
|
|
956,402
|
|
(138,914
|
)
|
1,057,181
|
|
||||||||||||||
|
Included in other comprehensive income
|
12,329
|
|
—
|
|
—
|
|
(89,497
|
)
|
(849,833
|
)
|
150,987
|
|
(776,014
|
)
|
||||||||||||||
|
Purchases
|
—
|
|
—
|
|
—
|
|
—
|
|
—
|
|
—
|
|
—
|
|
||||||||||||||
|
Issuances
|
—
|
|
—
|
|
—
|
|
—
|
|
—
|
|
—
|
|
—
|
|
||||||||||||||
|
Sales
|
—
|
|
—
|
|
—
|
|
—
|
|
—
|
|
—
|
|
—
|
|
||||||||||||||
|
Settlements
|
(3,286
|
)
|
—
|
|
(4,477
|
)
|
—
|
|
(713,589
|
)
|
4,864
|
|
(716,488
|
)
|
||||||||||||||
|
Transfers into Level 3
|
—
|
|
—
|
|
—
|
|
—
|
|
—
|
|
—
|
|
—
|
|
||||||||||||||
|
Transfers out of Level 3
|
—
|
|
—
|
|
—
|
|
—
|
|
—
|
|
1,598,492
|
|
1,598,492
|
|
||||||||||||||
|
Balance, end of period
|
$
|
69,412
|
|
$
|
14,061
|
|
$
|
(415,360
|
)
|
$
|
2,500,565
|
|
$
|
14,752,053
|
|
$
|
(1,750,372
|
)
|
$
|
15,170,359
|
|
|||||||
|
The amount of total gains/(losses) included in earnings attributable to the change in unrealized gains or losses relating to assets and liabilities still held at the reporting date
|
$
|
—
|
|
$
|
(496
|
)
|
$
|
(92,002
|
)
|
$
|
328,768
|
|
$
|
956,402
|
|
$
|
(138,914
|
)
|
$
|
1,053,758
|
|
|||||||
132
|
VIE Assets and Liabilities
|
||||||||||||||||||||||||||||
|
Predecessor Ambac - Year Ended December 31, 2012
|
Investments
|
Other
assets |
Derivatives
|
Investments
|
Loans
|
Long-term
debt |
Total
|
|||||||||||||||||||||
|
Balance, beginning of period
|
$
|
97,522
|
|
$
|
16,779
|
|
$
|
(486,775
|
)
|
$
|
2,199,338
|
|
$
|
14,126,994
|
|
$
|
(1,934,642
|
)
|
$
|
14,019,216
|
|
|||||||
|
Additions of VIEs consolidated
|
—
|
|
—
|
|
—
|
|
—
|
|
—
|
|
—
|
|
—
|
|
||||||||||||||
|
Total gains/(losses) realized and unrealized:
|
||||||||||||||||||||||||||||
|
Included in earnings
|
(3
|
)
|
(2,222
|
)
|
21,076
|
|
(41,289
|
)
|
952,463
|
|
(208,678
|
)
|
721,347
|
|
||||||||||||||
|
Included in other comprehensive income
|
7,485
|
|
—
|
|
—
|
|
103,245
|
|
637,954
|
|
(98,311
|
)
|
650,373
|
|
||||||||||||||
|
Purchases
|
—
|
|
—
|
|
—
|
|
—
|
|
—
|
|
—
|
|
—
|
|
||||||||||||||
|
Issuances
|
—
|
|
—
|
|
—
|
|
—
|
|
—
|
|
(162,460
|
)
|
(162,460
|
)
|
||||||||||||||
|
Sales
|
—
|
|
—
|
|
—
|
|
—
|
|
—
|
|
—
|
|
—
|
|
||||||||||||||
|
Settlements
|
(97,206
|
)
|
—
|
|
(48,886
|
)
|
—
|
|
(358,338
|
)
|
64,781
|
|
(439,649
|
)
|
||||||||||||||
|
Transfers in Level 3
|
58,905
|
|
—
|
|
—
|
|
—
|
|
—
|
|
(1,875,121
|
)
|
(1,816,216
|
)
|
||||||||||||||
|
Transfers out of Level 3
|
(6,301
|
)
|
—
|
|
192,248
|
|
—
|
|
—
|
|
1,257,930
|
|
1,443,877
|
|
||||||||||||||
|
Balance, end of period
|
$
|
60,402
|
|
$
|
14,557
|
|
$
|
(322,337
|
)
|
$
|
2,261,294
|
|
$
|
15,359,073
|
|
$
|
(2,956,501
|
)
|
$
|
14,416,488
|
|
|||||||
|
The amount of total gains/(losses) included in earnings attributable to the change in unrealized gains or losses relating to assets and liabilities still held at the reporting date
|
—
|
|
(2,222
|
)
|
(113,836
|
)
|
(41,289
|
)
|
952,944
|
|
(208,678
|
)
|
587,983
|
|
||||||||||||||
The tables below provide roll-forward information by class of investments and derivatives measured using significant unobservable inputs.
Level-3 Investments by Class
|
Successor Ambac - Year Ended December 31, 2014
|
Collateralized
Debt Obligations |
Other Asset
Backed Securities |
Corporate
Obligations |
U.S. Agency
Obligations |
Non-Agency
RMBS |
Total
Investments |
||||||||||||||||||
|
Balance, beginning of period
|
$
|
—
|
|
$
|
64,073
|
|
$
|
3,502
|
|
$
|
208
|
|
$
|
—
|
|
$
|
67,783
|
|
||||||
|
Total gains/(losses) realized and unrealized:
|
||||||||||||||||||||||||
|
Included in earnings
|
—
|
|
6,994
|
|
(97
|
)
|
—
|
|
4,160
|
|
11,057
|
|
||||||||||||
|
Included in other comprehensive income
|
—
|
|
(8,182
|
)
|
403
|
|
—
|
|
7,238
|
|
(541
|
)
|
||||||||||||
|
Purchases
|
—
|
|
—
|
|
—
|
|
—
|
|
54,013
|
|
54,013
|
|
||||||||||||
|
Issuances
|
—
|
|
—
|
|
—
|
|
—
|
|
—
|
|
—
|
|
||||||||||||
|
Sales
|
—
|
|
(59,878
|
)
|
—
|
|
—
|
|
—
|
|
(59,878
|
)
|
||||||||||||
|
Settlements
|
—
|
|
(3,007
|
)
|
—
|
|
—
|
|
(59,259
|
)
|
(62,266
|
)
|
||||||||||||
|
Transfers into Level 3
|
—
|
|
—
|
|
—
|
|
—
|
|
188,241
|
|
188,241
|
|
||||||||||||
|
Transfers out of Level 3
|
—
|
|
—
|
|
—
|
|
(208
|
)
|
—
|
|
(208
|
)
|
||||||||||||
|
Balance, end of period
|
$
|
—
|
|
$
|
—
|
|
$
|
3,808
|
|
$
|
—
|
|
$
|
194,393
|
|
$
|
198,201
|
|
||||||
|
The amount of total gains/(losses) included in earnings attributable to the change in unrealized gains or losses relating to assets and liabilities still held at the reporting date
|
$
|
—
|
|
$
|
—
|
|
$
|
—
|
|
$
|
—
|
|
$
|
—
|
|
$
|
—
|
|
||||||
133
|
Successor Ambac - Period from May 1 through December 31, 2013
|
Collateralized
Debt Obligations |
Other Asset
Backed Securities |
Corporate
Obligations |
U.S. Agency
Obligations |
Total
Investments |
|||||||||||||||
|
Balance, beginning of period
|
$
|
3,949
|
|
$
|
61,782
|
|
$
|
3,681
|
|
$
|
—
|
|
$
|
69,412
|
|
|||||
|
Total gains/(losses) realized and unrealized:
|
|
|
|
|
||||||||||||||||
|
Included in earnings
|
25
|
|
1,912
|
|
(62
|
)
|
(5
|
)
|
1,870
|
|
||||||||||
|
Included in other comprehensive income
|
(19
|
)
|
7,315
|
|
(117
|
)
|
5
|
|
7,184
|
|
||||||||||
|
Purchases
|
—
|
|
—
|
|
—
|
|
—
|
|
—
|
|
||||||||||
|
Issuances
|
—
|
|
—
|
|
—
|
|
—
|
|
—
|
|
||||||||||
|
Sales
|
—
|
|
(4,528
|
)
|
—
|
|
—
|
|
(4,528
|
)
|
||||||||||
|
Settlements
|
(3,955
|
)
|
(2,408
|
)
|
—
|
|
(65
|
)
|
(6,428
|
)
|
||||||||||
|
Transfers into Level 3
|
—
|
|
—
|
|
—
|
|
273
|
|
273
|
|
||||||||||
|
Transfers out of Level 3
|
—
|
|
—
|
|
—
|
|
—
|
|
—
|
|
||||||||||
|
Balance, end of period
|
$
|
—
|
|
$
|
64,073
|
|
$
|
3,502
|
|
$
|
208
|
|
$
|
67,783
|
|
|||||
|
The amount of total gains/(losses) included in earnings attributable to the change in unrealized gains or losses relating to assets and liabilities still held at the reporting date
|
$
|
—
|
|
$
|
—
|
|
$
|
—
|
|
$
|
—
|
|
$
|
—
|
|
|||||
|
Predecessor Ambac – Period from January 1 through April 30, 2013
|
Collateralized
Debt Obligations |
Other Asset
Backed Securities |
Corporate
Obligations |
U.S. Agency
Obligations |
Total
Investments |
|||||||||||||||
|
Balance, beginning of period
|
$
|
6,482
|
|
$
|
50,264
|
|
$
|
3,656
|
|
$
|
—
|
|
$
|
60,402
|
|
|||||
|
Additions of VIEs consolidated
|
—
|
|
—
|
|
—
|
|
—
|
|
—
|
|
||||||||||
|
Total gains/(losses) realized and unrealized:
|
||||||||||||||||||||
|
Included in earnings
|
(6
|
)
|
—
|
|
(27
|
)
|
—
|
|
(33
|
)
|
||||||||||
|
Included in other comprehensive income
|
160
|
|
12,117
|
|
52
|
|
—
|
|
12,329
|
|
||||||||||
|
Purchases
|
—
|
|
—
|
|
—
|
|
—
|
|
—
|
|
||||||||||
|
Issuances
|
—
|
|
—
|
|
—
|
|
—
|
|
—
|
|
||||||||||
|
Sales
|
—
|
|
—
|
|
—
|
|
—
|
|
—
|
|
||||||||||
|
Settlements
|
(2,687
|
)
|
(599
|
)
|
—
|
|
—
|
|
(3,286
|
)
|
||||||||||
|
Transfers into Level 3
|
—
|
|
—
|
|
—
|
|
—
|
|
—
|
|
||||||||||
|
Transfers out of Level 3
|
—
|
|
—
|
|
—
|
|
—
|
|
—
|
|
||||||||||
|
Balance, end of period
|
$
|
3,949
|
|
$
|
61,782
|
|
$
|
3,681
|
|
$
|
—
|
|
$
|
69,412
|
|
|||||
|
The amount of total gains/(losses) included in earnings attributable to the change in unrealized gains or losses relating to assets and liabilities still held at the reporting date
|
$
|
—
|
|
$
|
—
|
|
$
|
—
|
|
$
|
—
|
|
$
|
—
|
|
|||||
|
Predecessor Ambac - Year Ended December 31, 2012
|
Collateralized
Debt Obligations |
Other Asset
Backed Securities |
Corporate
Obligations |
U.S. Agency
Obligations |
Total
Investments |
|||||||||||||||
|
Balance, beginning of period
|
$
|
12,482
|
|
$
|
75,886
|
|
$
|
7,930
|
|
$
|
1,224
|
|
$
|
97,522
|
|
|||||
|
Additions of VIEs consolidated
|
—
|
|
—
|
|
—
|
|
—
|
|
—
|
|
||||||||||
|
Total gains/(losses) realized and unrealized:
|
||||||||||||||||||||
|
Included in earnings
|
(5
|
)
|
—
|
|
4
|
|
(2
|
)
|
(3
|
)
|
||||||||||
|
Included in other comprehensive income
|
646
|
|
7,051
|
|
(203
|
)
|
(9
|
)
|
7,485
|
|
||||||||||
|
Purchases
|
—
|
|
—
|
|
—
|
|
—
|
|
—
|
|
||||||||||
|
Issuances
|
—
|
|
—
|
|
—
|
|
—
|
|
—
|
|
||||||||||
|
Sales
|
—
|
|
—
|
|
—
|
|
—
|
|
—
|
|
||||||||||
|
Settlements
|
(6,641
|
)
|
(85,741
|
)
|
(4,075
|
)
|
(749
|
)
|
(97,206
|
)
|
||||||||||
|
Transfers into Level 3
|
—
|
|
53,068
|
|
5,837
|
|
—
|
|
58,905
|
|
||||||||||
|
Transfers out of Level 3
|
—
|
|
—
|
|
(5,837
|
)
|
(464
|
)
|
(6,301
|
)
|
||||||||||
|
Balance, end of period
|
$
|
6,482
|
|
$
|
50,264
|
|
$
|
3,656
|
|
$
|
—
|
|
$
|
60,402
|
|
|||||
|
The amount of total gains/(losses) included in earnings attributable to the change in unrealized gains or losses relating to assets and liabilities still held at the reporting date
|
$
|
—
|
|
$
|
—
|
|
$
|
—
|
|
$
|
—
|
|
$
|
—
|
|
|||||
134
Level-3 Derivatives by Class
|
Successor Ambac - Year Ended December 31, 2014
|
Interest Rate
Swaps |
Credit
Derivatives |
Total
Derivatives |
|||||||||
|
Balance, beginning of period
|
$
|
(92,612
|
)
|
$
|
(94,322
|
)
|
$
|
(186,934
|
)
|
|||
|
Additions of VIEs consolidated
|
—
|
|
—
|
|
—
|
|
||||||
|
Total gains/(losses) realized and unrealized:
|
||||||||||||
|
Included in earnings
|
(69,298
|
)
|
23,906
|
|
(45,392
|
)
|
||||||
|
Included in other comprehensive income
|
—
|
|
—
|
|
—
|
|
||||||
|
Purchases
|
—
|
|
—
|
|
—
|
|
||||||
|
Issuances
|
—
|
|
—
|
|
—
|
|
||||||
|
Sales
|
—
|
|
—
|
|
—
|
|
||||||
|
Settlements
|
20,023
|
|
(3,043
|
)
|
16,980
|
|
||||||
|
Transfers into Level 3
|
—
|
|
—
|
|
—
|
|
||||||
|
Transfers out of Level 3
|
—
|
|
—
|
|
—
|
|
||||||
|
Deconsolidation of VIEs
|
—
|
|
—
|
|
—
|
|
||||||
|
Balance, end of period
|
$
|
(141,887
|
)
|
$
|
(73,459
|
)
|
$
|
(215,346
|
)
|
|||
|
The amount of total gains/(losses) included in earnings attributable to the change in unrealized gains or losses relating to assets and liabilities still held at the reporting date
|
$
|
(69,298
|
)
|
$
|
15,789
|
|
$
|
(53,509
|
)
|
|||
|
Successor Ambac – Period from May 1 through December 31, 2013
|
Interest Rate
Swaps |
Credit
Derivatives |
Total
Derivatives |
|||||||||
|
Balance, beginning of period
|
$
|
(137,947
|
)
|
$
|
(277,413
|
)
|
$
|
(415,360
|
)
|
|||
|
Additions of VIEs consolidated
|
—
|
|
—
|
|
—
|
|
||||||
|
Total gains/(losses) realized and unrealized:
|
||||||||||||
|
Included in earnings
|
24,797
|
|
192,869
|
|
217,666
|
|
||||||
|
Included in other comprehensive income
|
—
|
|
—
|
|
—
|
|
||||||
|
Purchases
|
—
|
|
—
|
|
—
|
|
||||||
|
Issuances
|
—
|
|
—
|
|
—
|
|
||||||
|
Sales
|
—
|
|
—
|
|
—
|
|
||||||
|
Settlements
|
20,538
|
|
(9,778
|
)
|
10,760
|
|
||||||
|
Transfers into Level 3
|
—
|
|
—
|
|
—
|
|
||||||
|
Transfers out of Level 3
|
—
|
|
—
|
|
—
|
|
||||||
|
Deconsolidation of VIEs
|
—
|
|
—
|
|
—
|
|
||||||
|
Balance, end of period
|
$
|
(92,612
|
)
|
$
|
(94,322
|
)
|
$
|
(186,934
|
)
|
|||
|
The amount of total gains/(losses) included in earnings attributable to the change in unrealized gains or losses relating to assets and liabilities still held at the reporting date
|
$
|
24,797
|
|
$
|
66,639
|
|
$
|
91,436
|
|
|||
|
Predecessor Ambac – Period from January 1 through April 30, 2013
|
Interest Rate
Swaps |
Credit
Derivatives |
Total
Derivatives |
|||||||||
|
Balance, beginning of period
|
$
|
(108,752
|
)
|
$
|
(213,585
|
)
|
$
|
(322,337
|
)
|
|||
|
Additions of VIEs consolidated
|
—
|
|
—
|
|
—
|
|
||||||
|
Total gains/(losses) realized and unrealized:
|
||||||||||||
|
Included in earnings
|
(28,162
|
)
|
(60,384
|
)
|
(88,546
|
)
|
||||||
|
Included in other comprehensive income
|
—
|
|
—
|
|
—
|
|
||||||
|
Purchases
|
—
|
|
—
|
|
—
|
|
||||||
|
Issuances
|
—
|
|
—
|
|
—
|
|
||||||
|
Sales
|
—
|
|
—
|
|
—
|
|
||||||
|
Settlements
|
(1,033
|
)
|
(3,444
|
)
|
(4,477
|
)
|
||||||
|
Transfers into Level 3
|
—
|
|
—
|
|
—
|
|
||||||
|
Transfers out of Level 3
|
—
|
|
—
|
|
—
|
|
||||||
|
Deconsolidation of VIEs
|
—
|
|
—
|
|
—
|
|
||||||
|
Balance, end of period
|
$
|
(137,947
|
)
|
$
|
(277,413
|
)
|
$
|
(415,360
|
)
|
|||
|
The amount of total gains/(losses) included in earnings attributable to the change in unrealized gains or losses relating to assets and liabilities still held at the reporting date
|
$
|
(28,162
|
)
|
$
|
(63,840
|
)
|
$
|
(92,002
|
)
|
|||
135
|
Predecessor Ambac - Year Ended December 31, 2012
|
Interest Rate
Swaps
|
Credit
Derivatives
|
Call Options
on Long-
term debt
|
Total
Derivatives
|
||||||||||||
|
Balance, beginning of period
|
$
|
(302,177
|
)
|
$
|
(190,653
|
)
|
$
|
6,055
|
|
$
|
(486,775
|
)
|
||||
|
Additions of VIEs consolidated
|
—
|
|
—
|
|
—
|
|
—
|
|
||||||||
|
Total gains/(losses) realized and unrealized:
|
||||||||||||||||
|
Included in earnings
|
(70,415
|
)
|
(9,219
|
)
|
100,710
|
|
21,076
|
|
||||||||
|
Included in other comprehensive income
|
—
|
|
—
|
|
—
|
|
—
|
|
||||||||
|
Purchases
|
—
|
|
—
|
|
—
|
|
—
|
|
||||||||
|
Issuances
|
—
|
|
—
|
|
—
|
|
—
|
|
||||||||
|
Sales
|
—
|
|
—
|
|
—
|
|
—
|
|
||||||||
|
Settlements
|
71,592
|
|
(13,713
|
)
|
(106,765
|
)
|
(48,886
|
)
|
||||||||
|
Transfers in Level 3
|
—
|
|
—
|
|
—
|
|
—
|
|
||||||||
|
Transfers out of Level 3
|
192,248
|
|
—
|
|
—
|
|
192,248
|
|
||||||||
|
Deconsolidation of VIEs
|
—
|
|
—
|
|
—
|
|
—
|
|
||||||||
|
Balance, end of period
|
$
|
(108,752
|
)
|
$
|
(213,585
|
)
|
$
|
—
|
|
$
|
(322,337
|
)
|
||||
|
The amount of total gains/(losses) included in earnings attributable to the change in unrealized gains or losses relating to assets and liabilities still held at the reporting date
|
$
|
(78,505
|
)
|
$
|
(35,331
|
)
|
$
|
—
|
|
$
|
(113,836
|
)
|
||||
Invested assets and VIE long-term debt are transferred into Level 3 when internal valuation models that include significant unobservable inputs are used to estimate fair value. All such securities that have internally modeled fair values have been classified as Level 3. Invested assets transferred into Level 3 in 2014 consist of certain investments in Ambac-wrapped RMBS securities for which projected cash flows consist solely of Deferred Amounts and interest thereon. These assets were internally valued at December 31, 2014 as management could not corroborate the reasonableness of third party quotes. Derivative instruments are transferred into Level 3 when the use of unobservable inputs becomes significant to the overall valuation. All transfers into and out of Level 3 represent transfers between Level 3 and Level 2. There were no transfers between Level 1 and Level 2 for the periods presented. All transfers between fair value hierarchy Levels 1, 2, and 3 are recognized at the beginning of each accounting period.
136
Gains and losses (realized and unrealized) relating to Level 3 assets and liabilities included in earnings for the affected periods are reported as follows:
|
Net
investment income |
Realized
gains or (losses) and other settlements on credit derivative contracts |
Unrealized
gains or (losses) on credit derivative contracts |
Derivative
products revenues (interest rate swaps) |
Income
(loss) on variable interest entities |
Other
income or (loss) |
|||||||||||||||||||
|
Successor Ambac:
|
||||||||||||||||||||||||
|
Year Ended December 31, 2014
|
||||||||||||||||||||||||
|
Total gains or losses included in earnings for the period
|
$
|
11,057
|
|
$
|
3,043
|
|
$
|
20,863
|
|
$
|
(69,298
|
)
|
$
|
1,256,740
|
|
$
|
(1,348
|
)
|
||||||
|
Changes in unrealized gains or losses relating to the assets and liabilities still held at the reporting date
|
—
|
|
—
|
|
15,789
|
|
(69,298
|
)
|
1,261,927
|
|
(1,348
|
)
|
||||||||||||
|
Successor Ambac:
|
||||||||||||||||||||||||
|
Period from May 1 through December 31, 2013
|
||||||||||||||||||||||||
|
Total gains or losses included in earnings for the period
|
$
|
1,870
|
|
$
|
9,778
|
|
$
|
183,091
|
|
$
|
24,797
|
|
$
|
(636,043
|
)
|
$
|
(677
|
)
|
||||||
|
Changes in unrealized gains or losses relating to the assets and liabilities still held at the reporting date
|
—
|
|
—
|
|
66,639
|
|
24,797
|
|
(655,964
|
)
|
(677
|
)
|
||||||||||||
|
Predecessor Ambac:
|
||||||||||||||||||||||||
|
Period from January 1 through April 30, 2013
|
||||||||||||||||||||||||
|
Total gains or losses included in earnings for the period
|
$
|
(33
|
)
|
$
|
3,444
|
|
$
|
(63,828
|
)
|
$
|
(28,162
|
)
|
$
|
1,146,256
|
|
$
|
(496
|
)
|
||||||
|
Changes in unrealized gains or losses relating to the assets and liabilities still held at the reporting date
|
—
|
|
—
|
|
(63,840
|
)
|
(28,162
|
)
|
1,146,256
|
|
(496
|
)
|
||||||||||||
|
Predecessor Ambac:
|
||||||||||||||||||||||||
|
Year ended December 31, 2012
|
||||||||||||||||||||||||
|
Total gains or losses included in earnings for the period
|
$
|
(3
|
)
|
$
|
13,713
|
|
$
|
(22,932
|
)
|
$
|
(70,415
|
)
|
$
|
702,496
|
|
$
|
98,488
|
|
||||||
|
Changes in unrealized gains or losses relating to the assets and liabilities still held at the reporting date
|
—
|
|
—
|
|
(35,331
|
)
|
(78,505
|
)
|
702,977
|
|
(2,222
|
)
|
||||||||||||
137
11. INVESTMENTS
Ambac’s invested assets are primarily comprised of fixed income securities classified as available-for-sale and equity interests in pooled investment funds. Such equity interests in the form of common stock or in-substance common stock are classified as trading securities.
The amortized cost and estimated fair value of available-for-sale investments, excluding VIE investments, at
December 31, 2014 and 2013
were as follows:
|
Amortized
Cost |
Gross
Unrealized Gains |
Gross
Unrealized Losses |
Estimated
Fair Value |
Non-credit other-
than-temporary Impairments (1) |
||||||||||||||||
|
Successor Ambac - December 31, 2014
|
||||||||||||||||||||
|
Fixed income securities:
|
||||||||||||||||||||
|
Municipal obligations
|
$
|
523,019
|
|
$
|
9,769
|
|
$
|
6,996
|
|
$
|
525,792
|
|
$
|
—
|
|
|||||
|
Corporate obligations
|
1,382,195
|
|
12,815
|
|
9,416
|
|
1,385,594
|
|
—
|
|
||||||||||
|
Foreign obligations
|
126,041
|
|
3,060
|
|
1,344
|
|
127,757
|
|
—
|
|
||||||||||
|
U.S. government obligations
|
42,328
|
|
1,078
|
|
427
|
|
42,979
|
|
—
|
|
||||||||||
|
U.S. agency obligations
|
29,524
|
|
—
|
|
38
|
|
29,486
|
|
—
|
|
||||||||||
|
Residential mortgage-backed securities
|
1,557,059
|
|
167,396
|
|
13,500
|
|
1,710,955
|
|
7,773
|
|
||||||||||
|
Collateralized debt obligations
|
21,346
|
|
50
|
|
274
|
|
21,122
|
|
—
|
|
||||||||||
|
Other asset-backed securities
|
833,366
|
|
48,794
|
|
159
|
|
882,001
|
|
—
|
|
||||||||||
|
4,514,878
|
|
242,962
|
|
32,154
|
|
4,725,686
|
|
7,773
|
|
|||||||||||
|
Short-term
|
360,069
|
|
—
|
|
4
|
|
360,065
|
|
—
|
|
||||||||||
|
4,874,947
|
|
242,962
|
|
32,158
|
|
5,085,751
|
|
7,773
|
|
|||||||||||
|
Fixed income securities pledged as collateral:
|
||||||||||||||||||||
|
U.S. government obligations
|
64,378
|
|
—
|
|
111
|
|
64,267
|
|
—
|
|
||||||||||
|
Total collateralized investments
|
64,378
|
|
—
|
|
111
|
|
64,267
|
|
—
|
|
||||||||||
|
Total available-for-sale investments
|
$
|
4,939,325
|
|
$
|
242,962
|
|
$
|
32,269
|
|
$
|
5,150,018
|
|
$
|
7,773
|
|
|||||
|
Successor Ambac - December 31, 2013
|
||||||||||||||||||||
|
Fixed income securities:
|
||||||||||||||||||||
|
Municipal obligations
|
$
|
1,405,293
|
|
$
|
857
|
|
$
|
28,427
|
|
$
|
1,377,723
|
|
$
|
—
|
|
|||||
|
Corporate obligations
|
1,508,377
|
|
4,886
|
|
23,894
|
|
1,489,369
|
|
—
|
|
||||||||||
|
Foreign obligations
|
131,709
|
|
69
|
|
6,901
|
|
124,877
|
|
—
|
|
||||||||||
|
U.S. government obligations
|
128,415
|
|
9
|
|
2,176
|
|
126,248
|
|
—
|
|
||||||||||
|
U.S. agency obligations
|
32,214
|
|
10
|
|
70
|
|
32,154
|
|
—
|
|
||||||||||
|
Residential mortgage-backed securities
|
1,516,877
|
|
59,853
|
|
18,105
|
|
1,558,625
|
|
852
|
|
||||||||||
|
Collateralized debt obligations
|
184,118
|
|
217
|
|
463
|
|
183,872
|
|
—
|
|
||||||||||
|
Other asset-backed securities
|
1,020,251
|
|
8,795
|
|
36,598
|
|
992,448
|
|
—
|
|
||||||||||
|
5,927,254
|
|
74,696
|
|
116,634
|
|
5,885,316
|
|
852
|
|
|||||||||||
|
Short-term
|
271,118
|
|
1
|
|
—
|
|
271,119
|
|
—
|
|
||||||||||
|
6,198,372
|
|
74,697
|
|
116,634
|
|
6,156,435
|
|
852
|
|
|||||||||||
|
Fixed income securities pledged as collateral:
|
||||||||||||||||||||
|
U.S. government obligations
|
126,196
|
|
27
|
|
—
|
|
126,223
|
|
—
|
|
||||||||||
|
Total collateralized investments
|
126,196
|
|
27
|
|
—
|
|
126,223
|
|
—
|
|
||||||||||
|
Total available-for-sale investments
|
$
|
6,324,568
|
|
$
|
74,724
|
|
$
|
116,634
|
|
$
|
6,282,658
|
|
$
|
852
|
|
|||||
|
(1)
|
Represents the amount of non-credit other-than-temporary impairment losses remaining in accumulated other comprehensive loss on securities that also had a credit impairment. These losses are included in gross unrealized losses as of
December 31, 2014 and 2013
.
|
138
The amortized cost and estimated fair value of available-for-sale investments, excluding VIE investments, at
December 31, 2014
, by contractual maturity, were as follows:
|
Amortized
Cost |
Estimated
Fair Value |
|||||||
|
Due in one year or less
|
$
|
551,712
|
|
$
|
551,618
|
|
||
|
Due after one year through five years
|
845,986
|
|
846,430
|
|
||||
|
Due after five years through ten years
|
931,471
|
|
935,797
|
|
||||
|
Due after ten years
|
198,385
|
|
202,095
|
|
||||
|
2,527,554
|
|
2,535,940
|
|
|||||
|
Residential mortgage-backed securities
|
1,557,059
|
|
1,710,955
|
|
||||
|
Collateralized debt obligations
|
21,346
|
|
21,122
|
|
||||
|
Other asset-backed securities
|
833,366
|
|
882,001
|
|
||||
|
Total
|
$
|
4,939,325
|
|
$
|
5,150,018
|
|
||
Expected maturities will differ from contractual maturities because borrowers may have the right to call or prepay certain obligations with or without call or prepayment penalties.
Unrealized Losses:
The following table shows gross unrealized losses and fair values of Ambac’s available-for-sale investments, aggregated by investment category and length of time that the individual securities have been in a continuous unrealized loss position, at
December 31, 2014 and 2013
:
|
Less Than 12 Months
|
12 Months or More
|
Total
|
||||||||||||||||||||||
|
Fair Value
|
Gross
Unrealized Loss |
Fair Value
|
Gross
Unrealized Loss |
Fair Value
|
Gross
Unrealized Loss |
|||||||||||||||||||
|
December 31, 2014
|
||||||||||||||||||||||||
|
Fixed income securities:
|
||||||||||||||||||||||||
|
Municipal obligations
|
$
|
77,788
|
|
$
|
1,244
|
|
$
|
135,076
|
|
$
|
5,752
|
|
$
|
212,864
|
|
$
|
6,996
|
|
||||||
|
Corporate obligations
|
453,504
|
|
4,998
|
|
172,045
|
|
4,418
|
|
625,549
|
|
9,416
|
|
||||||||||||
|
Foreign government obligations
|
20,827
|
|
748
|
|
14,277
|
|
596
|
|
35,104
|
|
1,344
|
|
||||||||||||
|
U.S. government obligations
|
7,223
|
|
154
|
|
14,735
|
|
273
|
|
21,958
|
|
427
|
|
||||||||||||
|
U.S. agency obligations
|
25,039
|
|
2
|
|
4,378
|
|
36
|
|
29,417
|
|
38
|
|
||||||||||||
|
Residential mortgage-backed securities
|
413,203
|
|
12,391
|
|
10,076
|
|
1,109
|
|
423,279
|
|
13,500
|
|
||||||||||||
|
Collateralized debt obligations
|
5,012
|
|
274
|
|
—
|
|
—
|
|
5,012
|
|
274
|
|
||||||||||||
|
Other asset-backed securities
|
248,823
|
|
155
|
|
68
|
|
4
|
|
248,891
|
|
159
|
|
||||||||||||
|
1,251,419
|
|
19,966
|
|
350,655
|
|
12,188
|
|
1,602,074
|
|
32,154
|
|
|||||||||||||
|
Short-term
|
8,803
|
|
4
|
|
—
|
|
—
|
|
8,803
|
|
4
|
|
||||||||||||
|
$
|
1,260,222
|
|
$
|
19,970
|
|
$
|
350,655
|
|
$
|
12,188
|
|
$
|
1,610,877
|
|
$
|
32,158
|
|
|||||||
|
Fixed income securities, pledged as collateral:
|
||||||||||||||||||||||||
|
U. S. government obligations
|
64,267
|
|
111
|
|
—
|
|
—
|
|
64,267
|
|
111
|
|
||||||||||||
|
Total collateralized investments
|
64,267
|
|
111
|
|
—
|
|
—
|
|
64,267
|
|
111
|
|
||||||||||||
|
Total temporarily impaired securities
|
1,324,489
|
|
20,081
|
|
350,655
|
|
12,188
|
|
1,675,144
|
|
32,269
|
|
||||||||||||
139
|
Less Than 12 Months
(1)
|
||||||||
|
Fair Value
|
Gross
Unrealized Loss |
|||||||
|
December 31, 2013
|
||||||||
|
Fixed income securities:
|
||||||||
|
Municipal obligations
|
$
|
437,683
|
|
$
|
28,427
|
|
||
|
Corporate obligations
|
877,356
|
|
23,894
|
|
||||
|
Foreign government obligations
|
117,905
|
|
6,901
|
|
||||
|
U.S. government obligations
|
70,044
|
|
2,176
|
|
||||
|
U.S. agency obligations
|
5,834
|
|
70
|
|
||||
|
Residential mortgage-backed securities
|
644,502
|
|
18,105
|
|
||||
|
Collateralized debt obligations
|
137,685
|
|
463
|
|
||||
|
Other asset-backed securities
|
629,957
|
|
36,598
|
|
||||
|
2,920,966
|
|
116,634
|
|
|||||
|
Short-term
|
—
|
|
—
|
|
||||
|
Total temporarily impaired securities
|
$
|
2,920,966
|
|
$
|
116,634
|
|
||
|
(1)
|
As a result of the implementation of Fresh Start, amortized cost for available for sale securities were set to equal fair value on
April 30, 2013
. Accordingly, as of
December 31, 2013
Successor Ambac did not have any gross unrealized losses that were in a continuous unrealized loss position for greater than 12 months.
|
Management has determined that the unrealized losses reflected in the tables above are temporary in nature as of
December 31, 2014 and 2013
based upon (i) no unexpected principal and interest payment defaults on these securities; (ii) analysis of the creditworthiness of the issuer and financial guarantor, as applicable, and analysis of projected defaults on the underlying collateral; (iii) management has no intent to sell these investments in debt securities; and (iv) it is not more likely than not that Ambac will be required to sell these debt securities before the anticipated recovery of its amortized cost basis. The assessment under (iv) is based on a comparison of future available liquidity from the investment portfolio against the projected net cash outflow from operating activities and debt service. For purposes of this assessment, available liquidity from the investment portfolio is comprised of the fair value of securities for which management has asserted its intent to sell, the fair value of other securities that are available for sale and in an unrealized gain position, plus the scheduled maturities and interest payments from the remaining securities in the portfolio. To the extent that securities that management intends to sell are in an unrealized loss position, they would have already been considered other-than-temporarily impaired with the amortized cost written down to fair value. Because the above-described assessment indicates that future available liquidity exceeds projected net cash outflow, it is not more likely than not that we would be required to sell securities in an unrealized loss position before the recovery of their amortized cost basis. In the liquidity assessment described above, principal payments on securities pledged as collateral are not considered to be available for other liquidity needs until the collateralized positions are projected to be settled. Projected interest receipts on securities pledged as collateral generally belong to Ambac and are considered to be sources of available liquidity from the investment portfolio.
As of
December 31, 2014
, for securities that have indications of possible other-than-temporary impairment but which management does not intend to sell and will not more likely than not be required to sell, management compared the present value of cash flows expected to be collected to the amortized cost basis of the securities to assess whether the amortized cost will be recovered. Cash flows were discounted at the effective interest rate implicit in the security at the date of acquisition (or Fresh Start Reporting Date of
April 30, 2013
for securities purchased prior to that date) or for debt securities that are beneficial interests in securitized financial assets, at a rate equal to the current yield used to accrete the beneficial interest. For floating rate securities, future cash flows and the discount rate used were both adjusted to reflect changes in the index rate applicable to each security as of the evaluation date. Of the securities that were in a gross unrealized loss position at
December 31, 2014
,
$473,656
of the total fair value and
$16,001
of the unrealized loss related to below investment grade securities and non-rated securities. Of the securities that were in a gross unrealized loss position at
December 31, 2013
,
$821,308
of the total fair value and
$36,900
of the unrealized loss related to below investment grade securities and non-rated securities. With respect to Ambac-wrapped securities guaranteed under policies that have been allocated to the Segregated Account, future cash flows used to measure credit impairment represents the sum of (i) the bond’s intrinsic cash flows and (ii) the estimated Ambac Assurance claim payments, including interest on Deferred Amounts. Ambac estimates the timing of such claim payment receipts but the actual timing of such amounts are at the sole discretion of the Rehabilitator. Further modifications to the Segregated Account Rehabilitation Plan or to the rules and guidelines promulgated thereunder, orders from the Rehabilitation Court or actions by the Rehabilitator with respect to the form, amount and timing of satisfying permitted policy claims, or making payments on Deferred Amounts or surplus notes, may have a material effect on the fair value of Ambac-wrapped securities and future recognition of other-than-temporary impairments. Refer to
Note 1. Background and Business Description
for information relating to the amended Segregated Account Rehabilitation Plan. Ambac’s assessment about whether a decline in value is other-than-temporary reflects management’s current judgment regarding facts and circumstances specific to a security and the factors noted above, including Ambac's intention to sell securities and ability to hold temporarily impaired securities until recovery. If that judgment changes, Ambac may ultimately record a charge for other-than-temporary impairment in future periods.
140
Municipal and corporate obligations
The gross unrealized losses on municipal and corporate obligations as of
December 31, 2014
are primarily the result of the increase in interest rates since
April 30, 2013
. These securities are primarily fixed-rate securities with an investment grade credit rating. Management believes that the timely receipt of all principal and interest on these positions is probable
.
Residential mortgage-backed securities
Of the
$13,500
of unrealized losses on residential mortgage-backed securities,
$11,358
is attributable to Ambac-wrapped securities. The unrealized loss on these securities is primarily the result of discount accretion, which has exceeded the increase in fair value since
April 30, 2013
. As part of the quarterly impairment review process, management estimates expected future cash flows from residential mortgage-backed securities. This approach includes the utilization of market accepted software models in conjunction with detailed data of the historical performance of the collateral pools, which assists in the determination of assumptions such as defaults, severity and voluntary prepayment rates that are largely driven by home price forecasts as well as other macro-economic factors. Additionally, for Ambac-wrapped securities that are allocated to the Segregated Account, expected future cash flows include assumptions about the timing of Ambac Assurance claim payments, including interest on Deferred Amounts, although the actual timing of such payments are at the sole discretion of the Rehabilitator. These assumptions are used to project future cash flows for each security. Management considered this analysis in making our determination that a credit loss has not occurred at
December 31, 2014
on these transactions.
Realized Gains and Losses and Other-Than-Temporary Impairments:
The following table details amounts included in net realized gains and other-than-temporary impairments included in earnings for the affected periods:
|
Successor Ambac
|
Predecessor Ambac
|
||||||||||||||||
|
|
Period from May 1
|
Period from January 1
|
|||||||||||||||
|
Year Ended
|
through
|
through
|
Year Ended
|
||||||||||||||
|
December 31, 2014
|
December 31, 2013
|
April 30, 2013
|
December 31, 2012
|
||||||||||||||
|
Gross realized gains on securities
|
$
|
63,366
|
|
$
|
22,983
|
|
$
|
47,448
|
|
$
|
73,404
|
|
|||||
|
Gross realized losses on securities
|
(9,824
|
)
|
(10,347
|
)
|
(320
|
)
|
(1,128
|
)
|
|||||||||
|
Foreign exchange (losses) gains
|
5,235
|
|
(8,169
|
)
|
6,177
|
|
(175
|
)
|
|||||||||
|
Net realized gains
|
$
|
58,777
|
|
$
|
4,467
|
|
$
|
53,305
|
|
$
|
72,101
|
|
|||||
|
Net other-than-temporary impairments
(1)
|
$
|
(25,794
|
)
|
$
|
(46,764
|
)
|
$
|
(467
|
)
|
$
|
(5,990
|
)
|
|||||
|
(1)
|
Other-than-temporary impairments exclude impairment amounts recorded in other comprehensive income under ASC Paragraph 320-10-65-1, which comprise non-credit related amounts on securities that are credit impaired but which management does not intend to sell and it is not more likely than not that the company will be required to sell before recovery of the amortized cost basis.
|
During 2002 and 2003 Ambac recognized investment realized losses relating to its investment in asset-backed notes issued by National Century Financial Enterprises, Inc. (“NCFE”). These notes defaulted and NCFE filed for protection under Chapter 11 of the U.S. Bankruptcy Code in November 2002. In connection with a full and final settlement of a lawsuit brought by NCFE bondholders against Credit Suisse Securities LLC, a subsidiary of Ambac Assurance received cash recoveries of
$39,978
in the period from January 1 through April 30, 2013. Additionally,
$1,441
and
$35
of other recoveries were received from NCFE in the eight months ended December 31, 2013 and year ended December 31, 2014, respectively. These amounts were recorded within gross realized gains on securities.
Since commencement of the Segregated Account Rehabilitation Proceedings, changes in the estimated timing of claim payments have resulted in adverse changes in projected cash flows on certain impaired Ambac-wrapped securities. Such changes in estimated claim payments on Ambac-wrapped securities contributed to net other-than-temporary impairments for the periods presented in the table above. Further changes to the timing of estimated claim payments could result in additional other-than-temporary impairment charges in the future. Successor Ambac’s other-than-temporary impairments relate to adverse changes in projected cash flows on certain Ambac-wrapped securities as well as the company’s intent to sell certain securities that were in an unrealized loss position as of the impairment evaluation dates. Future changes in our estimated liquidity needs could result in a determination that Ambac no longer has the ability to hold additional securities that are in an unrealized loss position, which could result in additional other-than-temporary impairment charges.
141
The following table presents a roll-forward of Ambac’s cumulative credit losses on debt securities held as of
December 31, 2014
and
2013
for which a portion of an other-than-temporary impairment was recognized in other comprehensive income:
|
Credit
Impairment
|
||||
|
Successor Ambac:
|
||||
|
Balance as of January 1, 2014
|
$
|
1,182
|
|
|
|
Additions for credit impairments recognized on:
|
||||
|
Securities not previously impaired
|
12,873
|
|
||
|
Securities previously impaired
|
7
|
|
||
|
Reductions for credit impairments previously recognized on:
|
||||
|
Securities that matured or were sold during the period
|
—
|
|
||
|
Securities that no longer have a portion of other-than-temporary impairment in other comprehensive income
because of Ambac's intent to sell such securities |
—
|
|
||
|
Balance as of December 31, 2014
|
$
|
14,062
|
|
|
|
Successor Ambac:
|
|
|||
|
Balance as of May 1, 2013
|
$
|
—
|
|
|
|
Additions for credit impairments recognized on:
|
|
|||
|
Securities not previously impaired
|
1,185
|
|
||
|
Securities previously impaired
|
—
|
|
||
|
Reductions for credit impairments previously recognized on:
|
|
|||
|
Securities that matured or were sold during the period
|
(3
|
)
|
||
|
Balance as of December 31, 2013
|
$
|
1,182
|
|
|
|
Predecessor Ambac:
|
||||
|
Balance as of January 1, 2013
|
$
|
183,300
|
|
|
|
Additions for credit impairments recognized on:
|
||||
|
Securities not previously impaired
|
—
|
|
||
|
Securities previously impaired
|
—
|
|
||
|
Reductions for credit impairments previously recognized on:
|
||||
|
Securities that matured or were sold during the period
(1)
|
(183,300
|
)
|
||
|
Balance as of April 30, 2013
|
$
|
—
|
|
|
|
Predecessor Ambac:
|
||||
|
Balance as of January 1, 2012
|
$
|
201,317
|
|
|
|
Additions for credit impairments recognized on:
|
||||
|
Securities not previously impaired
|
824
|
|
||
|
Securities previously impaired
|
5,166
|
|
||
|
Reductions for credit impairments previously recognized on:
|
||||
|
Securities that matured or were sold during the period
|
(24,007
|
)
|
||
|
Balance as of December 31, 2012
|
$
|
183,300
|
|
|
|
(1)
|
Includes reductions made in connection with Fresh Start, under which the cost basis of all invested assets were set to fair value as of the Fresh Start Reporting Date. As described in Note 3.
Special Purpose Entities, including Variable Interest Entities
, adopting Fresh Start results in a new reporting entity with no beginning retained earnings or accumulated deficit. Therefore cumulative credit impairments for Successor Ambac on May 1, 2013 are $0.
|
Counterparty Collateral, Deposits with Regulators and Other Restrictions:
Ambac routinely pledges and receives collateral related to certain business lines and/or transactions. The following is a description of those arrangements by collateral source:
|
(1)
|
Cash and securities held in Ambac’s investment portfolio
—Ambac pledges assets it holds in its investment portfolio to investment agreement and derivative counterparties. Securities pledged to investment agreement counterparties may not then be re-pledged to another entity. Ambac’s counterparties under derivative agreements have the right to pledge or rehypothecate the securities and as such, these pledged securities are separately classified on the Consolidated Balance Sheets as “Fixed income securities pledged as collateral, at fair value”.
|
142
|
(2)
|
Cash and securities pledged to Ambac under derivative agreements
—Ambac may re-pledge securities it holds from certain derivative counterparties to other derivative counterparties in accordance with its rights and obligations under those agreements.
|
The following table presents (i) the sources of collateral either received from various counterparties where Ambac is permitted to sell or re-pledge the collateral or collateral held directly in the investment portfolio and (ii) how that collateral was pledged to various investment agreement, derivative and repurchase agreement counterparties at
December 31, 2014 and 2013
:
|
Fair Value of
Cash and Underlying Securities |
Fair Value of Cash
and Securities Pledged to Investment Agreement Counterparties |
Fair Value of
Cash and Securities Pledged to Derivative Counterparties |
||||||||||
|
December 31, 2014:
|
||||||||||||
|
Sources of Collateral:
|
||||||||||||
|
Cash and securities pledged directly from the investment portfolio
|
$
|
379,423
|
|
$
|
156,916
|
|
$
|
222,507
|
|
|||
|
Cash and securities pledged from derivative counterparties
|
—
|
|
—
|
|
—
|
|
||||||
|
December 31, 2013:
|
||||||||||||
|
Sources of Collateral:
|
||||||||||||
|
Cash and securities pledged directly from the investment portfolio
|
$
|
500,986
|
|
$
|
371,723
|
|
$
|
129,263
|
|
|||
|
Cash and securities pledged from derivative counterparties
|
690
|
|
—
|
|
—
|
|
||||||
Securities carried at
$6,790
and
$6,799
at
December 31, 2014 and 2013
, respectively, were deposited by Ambac Assurance and Everspan with governmental authorities or designated custodian banks as required by laws affecting insurance companies.
Securities with fair value of
$0
and
$240,150
at
December 31, 2014 and 2013
, respectively, were held by a bankruptcy remote trust to collateralize and fund repayment of debt issued through a re-securitization transaction. The third party debt was fully repaid in 2013 and trust was liquidated in 2014. Prior to liquidation of the trust, the securities could not be sold or repledged by the trust. These assets were held and the secured debt issued by entities that qualified as VIEs and were consolidated in Ambac’s consolidated financial statements. Refer to
Note 4. Special Purpose Entities, Including Variable Interest Entities
for a further description of this transaction.
143
Guaranteed Securities:
Ambac’s fixed income portfolio includes securities covered by guarantees issued by Ambac Assurance and other financial guarantors (“insured securities”). The published rating agency ratings on these securities reflect the higher of the financial strength rating of the financial guarantor or the rating of the underlying issuer. Rating agencies do not always publish separate underlying ratings (those ratings excluding the insurance by the financial guarantor) because the insurance cannot be legally separated from the underlying security by the insurer. In the event these underlying ratings are not available from the rating agencies, Ambac will assign an internal rating. The following table represents the fair value, including the value of the financial guarantee, and weighted-average underlying rating, excluding the financial guarantee, of the insured securities at
December 31, 2014 and 2013
, respectively:
|
Municipal
obligations |
Corporate
obligations |
Mortgage
and asset- backed securities |
Short-term
|
Total
|
Weighted
Average Underlying Rating (1) |
|||||||||||||||||
|
December 31, 2014:
|
||||||||||||||||||||||
|
Ambac Assurance Corporation
(2)
|
$
|
53,164
|
|
$
|
—
|
|
$
|
2,146,555
|
|
$
|
—
|
|
$
|
2,199,719
|
|
CCC-
|
||||||
|
Assured Guaranty Municipal Corporation
|
119,492
|
|
—
|
|
—
|
|
—
|
|
119,492
|
|
A
|
|||||||||||
|
National Public Finance Guarantee Corporation
|
67,895
|
|
—
|
|
—
|
|
—
|
|
67,895
|
|
A-
|
|||||||||||
|
MBIA Insurance Corporation
|
—
|
|
32,460
|
|
—
|
|
—
|
|
32,460
|
|
A+
|
|||||||||||
|
Assured Guaranty Corporation
|
—
|
|
—
|
|
—
|
|
—
|
|
—
|
|
|
|||||||||||
|
Financial Guarantee Insurance Corporation
|
—
|
|
—
|
|
—
|
|
—
|
|
—
|
|
|
|||||||||||
|
Total
|
$
|
240,551
|
|
$
|
32,460
|
|
$
|
2,146,555
|
|
$
|
—
|
|
$
|
2,419,566
|
|
CCC
|
||||||
|
December 31, 2013:
|
||||||||||||||||||||||
|
Ambac Assurance Corporation
(2)
|
$
|
64,596
|
|
$
|
—
|
|
$
|
1,747,283
|
|
$
|
—
|
|
$
|
1,811,879
|
|
CCC+
|
||||||
|
Assured Guaranty Municipal Corporation
|
372,392
|
|
77,163
|
|
—
|
|
—
|
|
449,555
|
|
A+
|
|||||||||||
|
National Public Finance Guarantee Corporation
|
532,752
|
|
—
|
|
—
|
|
—
|
|
532,752
|
|
AA-
|
|||||||||||
|
MBIA Insurance Corporation
|
—
|
|
55,086
|
|
—
|
|
—
|
|
55,086
|
|
A-
|
|||||||||||
|
Assured Guaranty Corporation
|
—
|
|
—
|
|
2,917
|
|
—
|
|
2,917
|
|
D
|
|||||||||||
|
Financial Guarantee Insurance Corporation
|
—
|
|
—
|
|
2,869
|
|
—
|
|
2,869
|
|
D
|
|||||||||||
|
Total
|
$
|
969,740
|
|
$
|
132,249
|
|
$
|
1,753,069
|
|
$
|
—
|
|
$
|
2,855,058
|
|
BB-
|
||||||
|
(1)
|
Ratings are based on the lower of Standard & Poor’s or Moody’s rating. If unavailable, Ambac’s internal rating is used.
|
|
(2)
|
Includes asset-backed securities with a fair value of
$51,395
and
$50,953
at
December 31, 2014 and 2013
, respectively, insured by Ambac UK.
|
Investment Income:
Net investment income was comprised of the following for the affected periods:
|
Successor Ambac
|
Predecessor Ambac
|
||||||||||||||||
|
|
Period from May 1
|
Period from January 1
|
|||||||||||||||
|
Year Ended
|
through
|
through
|
Year Ended
|
||||||||||||||
|
December 31, 2014
|
December 31, 2013
|
April 30, 2013
|
December 31, 2012
|
||||||||||||||
|
Fixed income securities
|
$
|
299,694
|
|
$
|
147,014
|
|
$
|
118,097
|
|
$
|
386,385
|
|
|||||
|
Short-term investments
|
3,092
|
|
1,528
|
|
677
|
|
1,405
|
|
|||||||||
|
Loans
|
529
|
|
306
|
|
146
|
|
714
|
|
|||||||||
|
Investment expense
|
(10,477
|
)
|
(5,982
|
)
|
(2,549
|
)
|
(5,602
|
)
|
|||||||||
|
Securities available-for-sale and short-term
|
292,838
|
|
142,866
|
|
116,371
|
|
382,902
|
|
|||||||||
|
Other investments
|
8,108
|
|
3,580
|
|
369
|
|
—
|
|
|||||||||
|
Total net investment income
|
$
|
300,946
|
|
$
|
146,446
|
|
$
|
116,740
|
|
$
|
382,902
|
|
|||||
Net investment income from Other investments primarily represents changes in fair value on securities classified as trading or under the fair value option. The portion of net gains related to such securities still held at the end of each period is as follows:
144
|
Successor Ambac
|
Predecessor Ambac
|
||||||||||||||||
|
Period from May 1
|
Period from January 1
|
||||||||||||||||
|
Year Ended
|
through
|
through
|
Year Ended
|
||||||||||||||
|
December 31, 2014
|
December 31, 2013
|
April 30, 2013
|
December 31, 2012
|
||||||||||||||
|
Net gains recognized during the period on trading securities
|
$
|
6,713
|
|
$
|
3,580
|
|
$
|
369
|
|
$
|
—
|
|
|||||
|
Less: net gains and (losses) recognized during the reporting period on trading securities sold during the period
|
(487
|
)
|
1,702
|
|
—
|
|
—
|
|
|||||||||
|
Unrealized gains and (losses) recognized during the reporting period on trading securities still held at the reporting date
|
$
|
7,200
|
|
$
|
1,878
|
|
$
|
369
|
|
$
|
—
|
|
|||||
145
12. DERIVATIVE INSTRUMENTS
The following tables summarize the gross fair values of individual derivative instruments and the impact of legal rights of offset as reported in the Consolidated Balance Sheets as of
December 31, 2014 and 2013
.
|
Gross
Amounts of Recognized Assets / Liabilities |
Gross
Amounts Offset in the Consolidated Balance Sheet |
Net Amounts
of Assets/ Liabilities Presented in the Consolidated Balance Sheet |
Gross
Amount of Collateral Received / Pledged Not Offset in the Consolidated Balance Sheet |
Net Amount
|
|||||||||||||||
|
December 31, 2014:
|
|||||||||||||||||||
|
Derivative Assets:
|
|||||||||||||||||||
|
Credit derivatives
|
$
|
2,043
|
|
$
|
—
|
|
$
|
2,043
|
|
$
|
—
|
|
$
|
2,043
|
|
||||
|
Interest rate swaps
|
161,640
|
|
54,666
|
|
106,974
|
|
—
|
|
106,974
|
|
|||||||||
|
Futures contracts
|
—
|
|
—
|
|
—
|
|
—
|
|
—
|
|
|||||||||
|
Total non-VIE derivative assets
|
$
|
163,683
|
|
$
|
54,666
|
|
$
|
109,017
|
|
$
|
—
|
|
$
|
109,017
|
|
||||
|
Derivative Liabilities:
|
|||||||||||||||||||
|
Credit derivatives
|
$
|
75,502
|
|
$
|
—
|
|
$
|
75,502
|
|
$
|
—
|
|
$
|
75,502
|
|
||||
|
Interest rate swaps
|
385,346
|
|
54,666
|
|
330,680
|
|
169,573
|
|
161,107
|
|
|||||||||
|
Futures contracts
|
562
|
|
—
|
|
562
|
|
562
|
|
—
|
|
|||||||||
|
Other contracts
|
200
|
|
—
|
|
200
|
|
—
|
|
200
|
|
|||||||||
|
Total non-VIE derivative liabilities
|
$
|
461,610
|
|
$
|
54,666
|
|
$
|
406,944
|
|
$
|
170,135
|
|
$
|
236,809
|
|
||||
|
Variable Interest Entities
|
|||||||||||||||||||
|
Interest rate swaps
|
$
|
2,133,268
|
|
$
|
—
|
|
$
|
2,133,268
|
|
$
|
—
|
|
$
|
2,133,268
|
|
||||
|
Currency swaps
|
66,895
|
|
—
|
|
66,895
|
|
—
|
|
66,895
|
|
|||||||||
|
Total VIE derivative liabilities
|
$
|
2,200,163
|
|
$
|
—
|
|
$
|
2,200,163
|
|
$
|
—
|
|
$
|
2,200,163
|
|
||||
|
December 31, 2013:
|
|||||||||||||||||||
|
Derivative Assets:
|
|||||||||||||||||||
|
Interest rate swaps
|
$
|
132,250
|
|
$
|
56,876
|
|
$
|
75,374
|
|
$
|
—
|
|
$
|
75,374
|
|
||||
|
Futures contracts
|
2,337
|
|
—
|
|
2,337
|
|
690
|
|
1,647
|
|
|||||||||
|
Total non-VIE derivative assets
|
$
|
134,587
|
|
$
|
56,876
|
|
$
|
77,711
|
|
$
|
690
|
|
$
|
77,021
|
|
||||
|
Derivative Liabilities:
|
|||||||||||||||||||
|
Credit derivatives
|
$
|
94,322
|
|
$
|
—
|
|
$
|
94,322
|
|
$
|
—
|
|
$
|
94,322
|
|
||||
|
Interest rate swaps
|
216,287
|
|
56,876
|
|
159,411
|
|
42,555
|
|
116,856
|
|
|||||||||
|
Other contracts
|
165
|
|
—
|
|
165
|
|
—
|
|
165
|
|
|||||||||
|
Total non-VIE derivative liabilities
|
$
|
310,774
|
|
$
|
56,876
|
|
$
|
253,898
|
|
$
|
42,555
|
|
$
|
211,343
|
|
||||
|
Variable Interest Entities
|
|||||||||||||||||||
|
Interest rate swaps
|
$
|
1,680,834
|
|
$
|
—
|
|
$
|
1,680,834
|
|
$
|
—
|
|
$
|
1,680,834
|
|
||||
|
Currency swaps
|
91,472
|
|
—
|
|
91,472
|
|
—
|
|
91,472
|
|
|||||||||
|
Total VIE derivative liabilities
|
$
|
1,772,306
|
|
$
|
—
|
|
$
|
1,772,306
|
|
$
|
—
|
|
$
|
1,772,306
|
|
||||
Amounts recognized for the right to reclaim cash collateral or the obligation to return cash collateral are not offset against fair value amounts recognized for derivative instruments on the Consolidated Balance Sheets. The amounts representing the right to reclaim cash collateral and posted margin, recorded in “Other assets” were
$158,240
and
$3,040
as of
December 31, 2014 and 2013
, respectively. The amounts representing the obligation to return cash collateral recorded in “Other liabilities” were
$0
and
$690
as of
December 31, 2014 and 2013
.
146
|
|
|
|
Successor Ambac
|
||||||||
|
Location of Gain or (Loss)
Recognized in Consolidated Statement of Total Comprehensive Income |
Amount of Gain or
(Loss) Recognized in Consolidated Statement of Total Comprehensive Income – Year Ended December 31,2014 |
Amount of Gain or
(Loss) Recognized in Consolidated Statement of Total Comprehensive Income – Period from May 1 through December 31, 2013 |
|||||||||
|
Financial Guarantee:
|
|||||||||||
|
Credit derivatives
|
Net change in fair value of credit derivatives
|
$
|
23,906
|
|
$
|
192,869
|
|
||||
|
Financial Services derivatives products:
|
|||||||||||
|
Interest rate swaps
|
Derivative products
|
(173,595
|
)
|
104,114
|
|
||||||
|
Currency swaps
|
Derivative products
|
—
|
|
—
|
|
||||||
|
Futures contracts
|
Derivative products
|
(7,472
|
)
|
10,925
|
|
||||||
|
Other derivatives
|
Derivative products
|
(20
|
)
|
(268
|
)
|
||||||
|
Total Financial Services derivative products
|
(181,087
|
)
|
114,771
|
|
|||||||
|
Variable Interest Entities:
|
|||||||||||
|
Currency swaps
|
Income (loss) on variable interest entities
|
24,577
|
|
(890
|
)
|
||||||
|
Interest rate swaps
|
Income (loss) on variable interest entities
|
(452,434
|
)
|
495,712
|
|
||||||
|
Total Variable Interest Entities
|
(427,857
|
)
|
494,822
|
|
|||||||
|
Total derivative contracts
|
$
|
(585,038
|
)
|
$
|
802,462
|
|
|||||
|
Predecessor Ambac
|
|||||||||||
|
Location of Gain or (Loss)
Recognized in Consolidated Statement of Total Comprehensive Income |
Amount of Gain or
(Loss) Recognized in Consolidated Statement of Total Comprehensive Income – Period from January 1 through April 30, 2013 |
Amount of Gain or
(Loss) Recognized in Consolidated Statement of Total Comprehensive Income – Year Ended December 31, 2012 |
|||||||||
|
Financial Guarantee:
|
|||||||||||
|
Credit derivatives
|
Net change in fair value of credit derivatives
|
$
|
(60,384
|
)
|
$
|
(9,219
|
)
|
||||
|
Financial Services derivatives products:
|
|||||||||||
|
Interest rate swaps
|
Derivative products
|
(30,622
|
)
|
(111,396
|
)
|
||||||
|
Currency swaps
|
Derivative products
|
—
|
|
807
|
|
||||||
|
Futures contracts
|
Derivative products
|
(3,133
|
)
|
(14,864
|
)
|
||||||
|
Other derivatives
|
Derivative products
|
20
|
|
449
|
|
||||||
|
Total Financial Services derivative products
|
(33,735
|
)
|
(125,004
|
)
|
|||||||
|
Call options on long-term debt
|
Other income
|
—
|
|
100,710
|
|
||||||
|
Variable Interest Entities:
|
|||||||||||
|
Currency swaps
|
Income (loss) on variable interest entities
|
(116
|
)
|
(27,388
|
)
|
||||||
|
Interest rate swaps
|
Income (loss) on variable interest entities
|
(203,620
|
)
|
(107,341
|
)
|
||||||
|
Total Variable Interest Entities
|
(203,736
|
)
|
(134,729
|
)
|
|||||||
|
Total derivative contracts
|
$
|
(297,855
|
)
|
$
|
(168,242
|
)
|
|||||
Financial Guarantee Credit Derivatives:
Credit derivatives, which are privately negotiated contracts, provide the counterparty with credit protection against the occurrence of a specific event such as a payment default or bankruptcy relating to an underlying obligation. Upon a credit event, Ambac is generally required to make payments equal to the difference between the scheduled debt service payment and the actual payment made by the issuer. Substantially all of Ambac’s credit derivative contracts relate to structured finance transactions. Credit derivatives issued are insured by Ambac Assurance. None of the outstanding credit derivative transactions at
December 31, 2014
include ratings based collateral-posting triggers or otherwise require Ambac to post collateral regardless of Ambac’s ratings or the size of the mark to market exposure to Ambac.
The majority of our credit derivatives were written on a “pay-as-you-go” basis. Similar to an insurance policy execution, pay-as-you-go provides that Ambac pays interest shortfalls on the referenced transaction as they are incurred on each scheduled payment date, but only pays principal
147
shortfalls upon the earlier of (i) the date on which the assets designated to fund the referenced obligation have been disposed of and (ii) the legal final maturity date of the referenced obligation. The last transaction that was not “pay-as-you-go” terminated in July 2013.
Ambac maintains internal credit ratings on its guaranteed obligations, including credit derivative contracts, solely to indicate management’s view of the underlying credit quality of the guaranteed obligations. Independent rating agencies may have assigned different ratings on the credits in Ambac’s portfolio than Ambac’s internal ratings. The following tables summarize the gross principal notional outstanding for CDS contracts, by Ambac rating, for each major category as of
December 31, 2014 and 2013
:
|
Ambac Rating
|
CLO
|
Other
|
Total
|
||||||||
|
December 31, 2014:
|
|||||||||||
|
AAA
|
$
|
—
|
|
$
|
—
|
|
$
|
—
|
|
||
|
AA
|
549,923
|
|
217,680
|
|
767,603
|
|
|||||
|
A
|
—
|
|
43,160
|
|
43,160
|
|
|||||
|
BBB
(1)
|
—
|
|
448,249
|
|
448,249
|
|
|||||
|
Below investment grade
(2)
|
—
|
|
270,747
|
|
270,747
|
|
|||||
|
Total
|
$
|
549,923
|
|
$
|
979,836
|
|
$
|
1,529,759
|
|
||
|
December 31, 2013:
|
|||||||||||
|
AAA
|
$
|
—
|
|
$
|
24,034
|
|
$
|
24,034
|
|
||
|
AA
|
1,209,071
|
|
203,025
|
|
1,412,096
|
|
|||||
|
A
|
128,666
|
|
107,251
|
|
235,917
|
|
|||||
|
BBB
(1)
|
—
|
|
826,175
|
|
826,175
|
|
|||||
|
Below investment grade
(2)
|
—
|
|
277,881
|
|
277,881
|
|
|||||
|
Total
|
$
|
1,337,737
|
|
$
|
1,438,366
|
|
$
|
2,776,103
|
|
||
|
(1)
|
BBB internal ratings reflect bonds which are of medium grade credit quality with adequate capacity to pay interest and repay principal. Certain protective elements and margins may weaken under adverse economic conditions and changing circumstances. These bonds are more likely than higher rated bonds to exhibit unreliable protection levels over all cycles.
|
|
(2)
|
Below investment grade internal ratings reflect bonds which are of speculative grade credit quality with the adequacy of future margin levels for payment of interest and repayment of principal potentially adversely affected by major ongoing uncertainties or exposure to adverse conditions.
|
The tables below summarize information by major category as of
December 31, 2014 and 2013
:
|
CLO
|
Other
|
Total
|
|||||||||
|
December 31, 2014:
|
|||||||||||
|
Number of CDS transactions
|
6
|
|
10
|
|
16
|
|
|||||
|
Remaining expected weighted-average life of obligations (in years)
|
1.8
|
|
5.4
|
|
4.1
|
|
|||||
|
Gross principal notional outstanding
|
$
|
549,923
|
|
$
|
979,836
|
|
$
|
1,529,759
|
|
||
|
Net derivative liabilities at fair value
|
$
|
2,027
|
|
$
|
71,432
|
|
$
|
73,459
|
|
||
|
December 31, 2013:
|
|||||||||||
|
Number of CDS transactions
|
7
|
|
13
|
|
20
|
|
|||||
|
Remaining expected weighted-average life of obligations (in years)
|
2.1
|
|
5.0
|
|
3.6
|
|
|||||
|
Gross principal notional outstanding
|
$
|
1,337,737
|
|
$
|
1,438,366
|
|
$
|
2,776,103
|
|
||
|
Net derivative liabilities at fair value
|
$
|
7,993
|
|
$
|
86,329
|
|
$
|
94,322
|
|
||
The maximum potential amount of future payments under Ambac’s credit derivative contracts is generally the gross principal notional outstanding amount included in the above table plus future interest payments payable by the derivative reference obligations. Since Ambac’s credit derivatives typically reference obligations of or assets held by special purpose entities that meet the definition of a VIE, the amount of maximum potential future payments for credit derivatives is included in the table in
Note 4. Special Purpose Entities, Including Variable Interest Entities
.
Changes in fair value of Ambac’s credit derivative contracts are accounted for at fair value since they do not qualify for the financial guarantee scope exception under the Derivatives and Hedging Topic of the ASC. Changes in fair value are recorded in “Net change in fair value of credit derivatives” on the Consolidated Statements of Total Comprehensive Income (Loss). Although CDS contracts are accounted for at fair value, they are surveilled similar to non-derivative financial guarantee contracts. As with financial guarantee insurance policies, Ambac’s risk group tracks credit migration of CDS contracts’ reference obligations from period to period.
Adversely classified credits are assigned risk classifications by the risk group. As of
December 31, 2014
, there are
four
CDS contracts on Ambac’s adversely classified credit listing, with a net derivative liability fair value of
$60,729
and gross notional principal outstanding of
$270,747
. As
148
of
December 31, 2013
, there were
four
CDS contracts on Ambac’s adversely classified credit listing, with a net derivative liability fair value of
$62,296
and total notional principal outstanding of
$277,881
.
Financial Services Derivative Products:
Ambac, through its subsidiary Ambac Financial Services (“AFS”), provides interest rate and currency swaps to states, municipalities and their authorities, asset-backed issuers and other entities in connection with their financings. AFS manages its interest rate swaps business with the goal of retaining some basis risk and excess interest rate sensitivity as an economic hedge against the effects of rising interest rates elsewhere in the Company, including on Ambac’s financial guarantee exposures. As of
December 31, 2014 and 2013
the notional amounts of AFS’s trading derivative products are as follows:
|
Notional - December 31,
|
|||||||
|
Type of derivative
|
2014
|
2013
|
|||||
|
Interest rate swaps—receive-fixed/pay-variable
|
$
|
782,904
|
|
$
|
697,837
|
|
|
|
Interest rate swaps—pay-fixed/receive-variable
|
1,479,650
|
|
1,540,976
|
|
|||
|
Interest rate swaps—basis swaps
|
55,800
|
|
146,705
|
|
|||
|
Futures contracts
|
80,000
|
|
100,000
|
|
|||
|
Other contracts
|
75,650
|
|
75,650
|
|
|||
Derivatives of Consolidated Variable Interest Entities
Certain VIEs consolidated under the Consolidation Topic of the ASC entered into derivative contracts to meet specified purposes within the securitization structure. The notional for VIE derivatives outstanding as of
December 31, 2014 and 2013
are as follows:
|
Notional - December 31,
|
|||||||
|
Type of VIE derivative
|
2014
|
2013
|
|||||
|
Interest rate swaps—receive-fixed/pay-variable
|
$
|
1,710,344
|
|
$
|
1,818,118
|
|
|
|
Interest rate swaps—pay-fixed/receive-variable
|
3,152,090
|
|
3,350,714
|
|
|||
|
Currency swaps
|
724,656
|
|
770,319
|
|
|||
|
Credit derivatives
|
18,278
|
|
20,130
|
|
|||
Contingent Features in Derivatives Related to Ambac Credit Risk
Ambac’s interest rate swaps with professional swap-dealer counterparties and certain front-end counterparties are generally executed under standardized derivative documents including collateral support and master netting agreements. Under these agreements, Ambac is required to post collateral in the event net unrealized losses exceed predetermined threshold levels. Additionally, given that Ambac Assurance is no longer rated by an independent rating agency, counterparties have the right to terminate the swap positions.
As of
December 31, 2014 and 2013
, the net liability fair value of all derivative instruments with contingent features linked to Ambac’s own credit risk was
$92,869
and
$42,555
, respectively, related to which Ambac had posted assets as collateral with a fair value of
$118,844
and
$126,223
, respectively. All such ratings-based contingent features have been triggered as requiring maximum collateral levels to be posted by Ambac while preserving counterparties’ rights to terminate the contracts. Assuming all contracts terminated on
December 31, 2014
, settlement of collateral balances and net derivative liabilities would result in a net receipt of cash and/or securities by Ambac. If counterparties elect to exercise their right to terminate, the actual termination payment amounts will be determined in accordance with derivative contract terms, which may result in amounts that differ from market values as reported in Ambac’s financial statements.
13. LOANS
Loans had been extended: (i) by VIEs which are consolidated by Ambac under ASC Topic 810 as a result of Ambac’s financial guarantees of the VIEs’ note liabilities and/or assets, and (ii) to certain institutions in connection with various transactions.
Loans by consolidated VIEs are generally carried at fair value on the Consolidated Balance Sheets. See
Note 4. Special Purpose Entities, Including Variable Interest Entities
for further information about VIEs for which the assets and liabilities are carried at fair value. VIE loans that had not been carried at fair value have been adjusted to fair value for fresh start reporting. Subsequent to the Fresh Start Reporting Date, we have elected to continue accounting for these VIEs at fair value under the fair value option in accordance with the Financial Instruments Topic of the ASC.
Other loans had a combined outstanding principal balance of
$6,936
and
$7,734
at
December 31, 2014 and 2013
, respectively. Interest rates on these loans were
4.68%
and
4.62%
at
December 31, 2014 and 2013
, respectively. The maturity dates of these loans was
June 2026
as of
December 31, 2014 and 2013
. Collectability of these loans is evaluated individually on an ongoing basis; no loan has been considered impaired and as such no loan impairments have been recorded as of
December 31, 2014 and 2013
.
149
|
14.
|
LONG-TERM DEBT
|
The carrying value of long-term debt was as follows:
|
December 31,
|
||||||||
|
2014
|
2013
|
|||||||
|
Ambac Assurance:
|
||||||||
|
5.1% surplus notes, general account, due 2020
|
$
|
696,330
|
|
$
|
909,186
|
|
||
|
5.1% surplus notes, segregated account, due 2020
|
30,479
|
|
39,797
|
|
||||
|
5.1% junior surplus notes, segregated account, due 2020
|
244,307
|
|
14,195
|
|
||||
|
Ambac Assurance long-term debt
|
$
|
971,116
|
|
$
|
963,178
|
|
||
|
Variable Interest Entities long-term debt
|
$
|
12,882,076
|
|
$
|
14,091,753
|
|
||
Surplus Notes, General Account
Ambac Assurance surplus notes, with a par amount of
$893,300
and
$1,210,821
at
December 31, 2014 and 2013
, respectively, are reported in long-term debt on the Consolidated Balance Sheet and have a scheduled maturity of June 7, 2020. These surplus notes were issued in connection with the Settlement Agreement and were recorded at their fair value at the date of issuance. Since issuance, Predecessor Ambac had accreted the discount into earnings using the effective interest method, based on an imputed interest rate of
53.9%
at the date of issuance. The carrying values of these surplus notes were adjusted to fair value as of the Fresh Start Reporting Date. Subsequent to the Fresh Start Reporting Date, Successor Ambac has accreted the discount based on an imputed interest rate of
10.5%
. All payments of principal and interest on the Ambac Assurance surplus notes are subject to the prior approval of the OCI. If the OCI does not approve the payment of interest on the Ambac Assurance surplus notes, such interest will accrue and compound annually until paid. OCI disapproved the requests of Ambac Assurance to pay interest on the outstanding Ambac Assurance surplus notes on their respective scheduled interest payment dates since their issuance.
At the time of issuance of the general account surplus notes, Ambac Assurance entered into call option agreements to repurchase, at significant discounts to par, such surplus notes with an aggregate par amount of
$939,179
. Certain of these call options were free-standing derivatives for accounting purposes and were carried at fair value as assets on the Consolidated Balance Sheets. In June 2012, Ambac Assurance exercised certain of these options and repurchased surplus notes with total par value of
$789,179
for an aggregate cash payment of
$188,446
pursuant to such call option agreements. The acquisition of surplus notes pursuant to such call option agreements had been approved by OCI and by the Rehabilitator, whose approval was conditioned upon the approval by the Rehabilitation Court, which was granted on June 4, 2012. Ambac Assurance had sought approval from OCI and the Rehabilitator to repurchase an additional
$150,000
of Ambac Assurance surplus notes pursuant to a third call option agreement entered into with respect to such surplus notes, but OCI and the Rehabilitator declined to approve the repurchase. The carrying value of extinguished surplus notes and accrued interest less the fair value of the free-standing derivatives were below the call option exercise prices and, accordingly, for the year ended December 31, 2012, Ambac recognized a realized loss of
$177,745
. The remaining options to acquire surplus notes have expired.
Surplus Notes, Segregated Account
The Segregated Account surplus notes, with a par amount of
$39,102
and
$53,000
at
December 31, 2014 and 2013
, respectively, are reported in long-term debt on the Consolidated Balance Sheets and have a scheduled maturity of June 7, 2020. These surplus notes were recorded at their fair value at the date of issuance. Since issuance, Predecessor Ambac had accreted the discount into earnings using the effective interest method, based on an imputed interest rate of
52.8%
at the date of issuance. The carrying values of these surplus notes were adjusted to estimated fair value as of the Fresh Start Reporting Date. Subsequent to the Fresh Start Reporting Date, Successor Ambac has accreted the discount based on an imputed interest rate of
10.5%
. All payments of principal and interest on the Segregated Account surplus notes are subject to the prior approval of the OCI. If the OCI does not approve the payment of interest on the Segregated Account surplus notes, such interest will accrue and compound annually until paid. OCI disapproved of the requests of the Rehabilitator of the Segregated Account, acting for and on behalf of the Segregated Account, to pay interest on the outstanding Segregated Account surplus notes on their respective scheduled interest payment dates since their issuance.
As described in
Note 1. Background and Business Description
, the Rehabilitator redeemed certain Segregated Account surplus notes (other than junior surplus notes) on November 20, 2014 at a redemption price that included an amount equal to accrued interest on such redeemed surplus notes. Such redemption also triggered similar proportionate redemption payments on Ambac Assurance surplus notes. The redemption of surplus notes resulted in a charge representing the accelerated recognition of the unamortized discount on the redeemed surplus notes. The unamortized discount on the redeemed portion of Segregated Account and Ambac Assurance surplus notes were
$3,134
and
$71,590
, respectively, and recognized in Net realized losses on extinguishment of debt of the Consolidated Statements of Total Comprehensive Income (Loss).
Junior Surplus Notes, Segregated Account
The Segregated Account junior surplus notes, with a par value of
$378,039
and
$28,039
at
December 31, 2014 and 2013
, respectively, are reported in long-term debt on the Consolidated Balance Sheets and have a scheduled maturity of June 7, 2020, subject to restrictions described below. Par value at
December 31, 2014 and 2013
includes
$28,039
of junior surplus notes issued in connection with a settlement agreement (the “OSS Settlement Agreement”) entered into among Ambac, Ambac Assurance, the Segregated Account and One State Street, LLC (“OSS”)
150
with respect to the termination of Ambac’s office lease with OSS. The outstanding principal amount of one such note issued to OSS shall, according to its terms, be reduced based on any rents paid after the initial term of the lease entered into between OSS and Ambac Assurance as part of such settlement. These junior surplus notes were recorded at their fair value at the dates of issuance. Since issuance, Predecessor Ambac had accreted the discount into earnings using the effective interest method, based on an imputed interest rate of
58.3%
at the date of issuance. The carrying values of these surplus notes were adjusted to estimated fair value as of the Fresh Start Reporting Date. Subsequent to the Fresh Start Reporting Date, Successor Ambac has accreted the discount based on an imputed interest rate of
19.5%
. Par value at
December 31, 2014
includes
$350,000
face amount of a junior surplus note originally issued to Ambac pursuant to Ambac's Reorganization Plan in accordance with the Mediation Agreement and that Ambac sold to a newly formed Trust on August 28, 2014 (as further described in
Note 1. Background and Business Description
). This note was recorded at a discount to par based on its fair value on August 28, 2014. Ambac is accreting the discount on this junior surplus note into earnings using the effective interest method, based on an imputed interest rate of
8.4%
. Principal and interest payments on Segregated Account junior surplus notes cannot be made until all Ambac Assurance and Segregated Account surplus notes are paid in full and after all Segregated Account future and existing senior indebtedness, policy and other priority claims have been paid in full. All payments of principal and interest on the junior surplus notes are subject to the prior approval of the OCI. If the OCI does not approve the payment of interest on the junior surplus notes, such interest will accrue and compound annually until paid. No such approval has been sought or obtained to pay interest on junior surplus notes since their issuance.
Variable Interest Entities, Long-term Debt
The variable interest entity notes were issued by consolidated VIEs. Generally, Ambac is the primary beneficiary of the VIEs as a result of providing financial guarantees on the variable interest notes. Consequently, Ambac has consolidated these variable interest entity notes and all other assets and liabilities of the VIEs. Ambac is not primarily liable for the debt obligations of these entities. Ambac would only be required to make payments on these debt obligations in the event that the issuer defaults on any principal or interest due. The total unpaid principal amount of outstanding long-term debt associated with VIEs consolidated as a result of the financial guarantee provided by Ambac was
$11,925,499
and
$14,251,771
as of
December 31, 2014 and 2013
, respectively. The range of final maturity dates of the outstanding long-term debt associated with these VIEs is March 2015 to December 2047 as of
December 31, 2014
, and February 2015 to December 2047 as of
December 31, 2013
. As of
December 31, 2014 and 2013
, the interest rates on these VIEs’ long-term debt ranged from
0.69%
to
13.00%
and from
0.50%
to
13.00%
, respectively. Final maturities of VIE long-term debt for each of the five years following
December 31, 2014
are as follows:
2015
-
$77,920
;
2016
-
$0
;
2017
-
$0
;
2018
-
$162,939
;
2019
-
$393,235
.
15. OBLIGATIONS UNDER INVESTMENT AGREEMENTS
Certain investment agreements have contractual provisions that allow our counterparty the flexibility to withdraw funds prior to the legal maturity date. Amounts included in the table below are based on the expected optional draw date. As of
December 31, 2014 and 2013
, the contractual interest rates for these agreements, which include both fixed and variable, ranged from
0.25%
to
6.04%
and
0.23%
to
6.04%
, respectively.
As of
December 31, 2014 and 2013
, the carrying value of obligations under investment agreements, including unamortized discounts or premiums to principal, were
$160,079
and
$359,070
, respectively. Principal due under investment agreements, based on the expected optional draw date, in each of the next five years ending December 31, and the periods thereafter, are as follows:
|
Principal
|
||||
|
Amount
|
||||
|
2015
|
$
|
48,928
|
|
|
|
2016
|
5,263
|
|
||
|
2017
|
107,260
|
|
||
|
2018
|
—
|
|
||
|
2019
|
—
|
|
||
|
All later years
|
—
|
|
||
|
$
|
161,451
|
|
||
16. INCOME TAXES
Ambac files a consolidated Federal income tax return with its subsidiaries. Ambac and its subsidiaries also file separate or combined income tax returns in various states, local and foreign jurisdictions. The following are the major jurisdictions in which Ambac and its affiliates operate and the earliest tax years subject to examination:
|
Jurisdiction
|
Tax Year
|
|
United States
|
2010
|
|
New York State
|
2010
|
|
New York City
|
2011
|
|
United Kingdom
|
2009
|
|
Italy
|
2009
|
151
As of
December 31, 2014
Ambac had loss carryforwards totaling
$5,401,573
. This includes carryforwards of
$167,004
relating to U.S. capital losses,
$248,363
of Ambac UK loss carryforwards, and an ordinary U. S. federal net operating tax carryforward of approximately
$4,986,206
, which, if not utilized, will begin expiring in
2029
, and will fully expire in
2034
.
On April 30, 2013, Ambac paid to the United States Department of the Treasury
$1,900
and the Segregated Account paid the United States Department of Treasury
$100,000
as consideration to settle certain disputes with the Internal Revenue Service. Upon confirmation of payment, Ambac and the Internal Revenue Service entered into a closing agreement on April 30, 2013 which resolved with finality all federal income tax liability of Ambac for the 2003 through 2009 tax years and resolved with finality the federal income tax liability of Ambac for the 2010 tax year solely with respect to items of income, gain, deductions or loss related to the CDS contracts. Ambac relinquished its claim to all net operating loss carry forwards resulting from losses on credit default swap contracts arising on or before December 31, 2010 to the extent such net operating loss carry forwards exceed
$3,400,000
. The exact amount of the loss carryforward relinquishment was
$1,059,988
. The closing agreement does not resolve the tax treatment of CDS contracts for tax years subsequent to 2010.
Upon emergence from bankruptcy, approximately
$816,380
of the Net Operating Loss (“NOL”) was reduced for cancellation of indebtedness income and reduction of interest expense pursuant to IRC Section 382(l)(5).
The tax effects of temporary differences that give rise to significant portions of the deferred tax liabilities and deferred tax assets at
December 31, 2014 and 2013
are presented below:
|
December 31,
|
|||||||
|
2014
|
2013
|
||||||
|
Deferred tax liabilities:
|
|||||||
|
Insurance intangible
|
$
|
493,822
|
|
$
|
559,288
|
|
|
|
Variable interest entities
|
14,149
|
|
131,137
|
|
|||
|
Investments
|
138,072
|
|
168,653
|
|
|||
|
Unearned premiums and credit fees
|
104,589
|
|
38,826
|
|
|||
|
Other
|
33,835
|
|
2,221
|
|
|||
|
Total deferred tax liabilities
|
784,467
|
|
900,125
|
|
|||
|
Deferred tax assets:
|
|||||||
|
Net operating loss and capital carryforward
|
1,890,551
|
|
2,177,029
|
|
|||
|
Loss reserves
|
185,881
|
|
634,692
|
|
|||
|
Compensation
|
5,276
|
|
8,724
|
|
|||
|
AMT Credits
|
10,359
|
|
4,269
|
|
|||
|
Other
|
9,539
|
|
58,581
|
|
|||
|
Sub total deferred tax assets
|
2,101,606
|
|
2,883,295
|
|
|||
|
Valuation allowance
|
1,319,218
|
|
1,985,369
|
|
|||
|
Total deferred tax assets
|
782,388
|
|
897,926
|
|
|||
|
Net deferred tax asset (liability)
|
$
|
(2,079
|
)
|
$
|
(2,199
|
)
|
|
In accordance with the Income Tax Topic of the ASC, a valuation allowance is recognized if, based on the weight of available evidence, it is more-likely-than-not that some, or all, of the deferred tax asset will not be realized. Recent cumulative losses are a significant piece of negative evidence in assessing whether a valuation allowance is required. As a result of Ambac’s history of operating losses as well as the risks and uncertainties associated with future operating results, management believes it is more likely than not that the Company will not generate sufficient taxable income to recover the deferred tax operating asset and therefore has a full valuation allowance.
Ambac’s provision for income taxes charged to income from continuing operations is comprised of the following:
|
Successor Ambac
|
Predecessor Ambac
|
|||||||||||||||
|
Period from May 1
|
Period from January 1
|
|||||||||||||||
|
Year Ended
|
through
|
through
|
Year Ended
|
|||||||||||||
|
December 31, 2014
|
December 31, 2013
|
April 30, 2013
|
December 31, 2012
|
|||||||||||||
|
Current taxes
|
$
|
9,463
|
|
$
|
6,984
|
|
$
|
761
|
|
$
|
1,263
|
|
||||
|
Deferred taxes
|
94
|
|
530
|
|
(6
|
)
|
1,586
|
|
||||||||
|
Total
|
$
|
9,557
|
|
$
|
7,514
|
|
$
|
755
|
|
$
|
2,849
|
|
||||
152
The total effect of income taxes on net income and stockholders’ equity for the years ended
December 31, 2014 and 2013
is as follows:
|
Successor Ambac
|
Predecessor Ambac
|
|||||||||||||||
|
Period from May 1
|
Period from January 1
|
|||||||||||||||
|
Year Ended
|
through
|
through
|
Year Ended
|
|||||||||||||
|
December 31, 2014
|
December 31, 2013
|
April 30, 2013
|
December 31, 2012
|
|||||||||||||
|
Total income taxes charged to net income
|
$
|
9,557
|
|
$
|
7,514
|
|
$
|
755
|
|
$
|
2,849
|
|
||||
|
Income taxes charged (credited) to stockholders’ equity:
|
||||||||||||||||
|
Unrealized gains (losses) on investment securities
|
73,306
|
|
284
|
|
(204,145
|
)
|
18,448
|
|
||||||||
|
Valuation allowance to equity
|
(73,306
|
)
|
(284
|
)
|
204,145
|
|
(18,448
|
)
|
||||||||
|
Total charged to stockholders’ equity:
|
—
|
|
—
|
|
—
|
|
—
|
|
||||||||
|
Total effect of income taxes
|
$
|
9,557
|
|
$
|
7,514
|
|
$
|
755
|
|
$
|
2,849
|
|
||||
The tax provisions in the accompanying Consolidated Statements of Total Comprehensive Loss reflect effective tax rates differing from prevailing Federal corporate income tax rates. The following is a reconciliation of these differences:
|
Successor Ambac
|
Predecessor Ambac
|
|||||||||||||||||||||||
|
Period from May 1
|
Period from January 1
|
|||||||||||||||||||||||
|
Year Ended
|
through
|
through
|
Year Ended
|
|||||||||||||||||||||
|
December 31, 2014
|
December 31, 2013
|
April 30, 2013
|
December 31, 2012
|
|||||||||||||||||||||
|
$
|
%
|
$
|
%
|
$
|
%
|
$
|
%
|
|||||||||||||||||
|
Tax on income from continuing operations at statutory rate
|
172,639
|
|
35.0
|
%
|
179,311
|
|
35.0
|
%
|
1,171,812
|
|
35.0
|
%
|
(89,777
|
)
|
35.0
|
%
|
||||||||
|
Changes in expected tax resulting from:
|
||||||||||||||||||||||||
|
Reorganization income
|
—
|
|
—
|
%
|
—
|
|
—
|
%
|
(712,581
|
)
|
(21.3
|
)%
|
—
|
|
—
|
%
|
||||||||
|
Tax bankruptcy adjustments
|
—
|
|
—
|
%
|
—
|
|
—
|
%
|
285,734
|
|
8.5
|
%
|
—
|
|
—
|
%
|
||||||||
|
IRS Settlement
|
—
|
|
—
|
%
|
—
|
|
—
|
%
|
370,996
|
|
11.1
|
%
|
—
|
|
—
|
%
|
||||||||
|
Tax-exempt interest
|
(6,811
|
)
|
(1.4
|
)%
|
(11,988
|
)
|
(2.3
|
)%
|
(4,996
|
)
|
(0.1
|
)%
|
(17,795
|
)
|
6.9
|
%
|
||||||||
|
Valuation allowance
|
(159,661
|
)
|
(32.4
|
)%
|
(160,064
|
)
|
(31.2
|
)%
|
(1,110,230
|
)
|
(33.2
|
)%
|
107,502
|
|
(41.9
|
)%
|
||||||||
|
Foreign taxes
|
3,472
|
|
0.7
|
%
|
—
|
|
—
|
%
|
—
|
|
—
|
%
|
—
|
|
—
|
%
|
||||||||
|
Other, net
|
(82
|
)
|
—
|
%
|
255
|
|
—
|
%
|
20
|
|
—
|
%
|
2,919
|
|
(1.1
|
)%
|
||||||||
|
Tax expense on income from continuing operations
|
9,557
|
|
1.9
|
%
|
7,514
|
|
1.5
|
%
|
755
|
|
—
|
%
|
2,849
|
|
(1.1
|
)%
|
||||||||
A reconciliation of the beginning and ending amount of unrecognized tax benefits for
2014
and
2013
is as follows:
|
Successor Ambac
|
Predecessor Ambac
|
|||||||||||
|
Period from May 1
|
Period from January 1
|
|||||||||||
|
Year Ended
|
through
|
through
|
Year Ended
|
|||||||||
|
December 31, 2014
|
December 31, 2013
|
April 30, 2013
|
December 31, 2012
|
|||||||||
|
Balance at January 1,
|
—
|
|
—
|
|
96,900
|
|
96,900
|
|
||||
|
Increases related to prior year tax positions
|
—
|
|
—
|
|
—
|
|
—
|
|
||||
|
Decreases related to prior year tax positions
(1)
|
—
|
|
—
|
|
(96,900
|
)
|
—
|
|
||||
|
Balance at December 31,
|
—
|
|
—
|
|
—
|
|
96,900
|
|
||||
|
(1)
|
Amount paid in connection with IRS settlement as noted above.
|
Included in these balances at
December 31, 2014
,
December 31, 2013
, April 30, 2013 and December 31, 2012 are
$0
,
$0
,
$0
and
$96,900
, respectively, of unrecognized tax benefits that, if recognized, would affect the effective tax rate. During the Successor period for the
year ended December 31, 2014
and from May 1 to December 31, 2013, the Predecessor period January 1 to April 30, 2013 and the year ended December 31, 2012, Ambac recognized interest of approximately
$0
,
$0
,
$0
and
$0
, respectively. Ambac had approximately
$0
,
$0
,
$0
and
$0
for the payment of interest accrued at
December 31, 2014
,
December 31, 2013
, April 30, 2013 and December 31, 2012, respectively.
Pursuant to the Amended TSA, to the extent Ambac Assurance generates taxable income after September 30, 2011, which is offset with NOLs (or the proportionate amount of AMT NOL (as defined below)), it is obligated to make payments (“Tolling Payments”), subject to certain credits, to Ambac in accordance with the following NOL usage table, where the “Applicable Percentage” is applied to the aggregate amount of federal income tax liability that would have been paid if the “Allocated NOLs” were not available:
153
NOL Usage Table
|
NOL Usage
Tier
|
Allocated NOLs
(1)
|
Applicable
Percentage
|
||
|
A
|
The first
|
$479,000
|
15%
|
|
|
B
|
The next
|
$1,057,000
|
after Tier A
|
40%
|
|
C
|
The next
|
$1,057,000
|
after Tier B
|
10%
|
|
D
|
The next
|
$1,057,000
|
after Tier C
|
15%
|
|
(1)
|
A credit is available to offset the first $5 million payment due under each of the NOL usage Tiers A, B and C.
|
To the extent Ambac Assurance utilizes Allocated NOLs generated prior to September 30, 2011 greater than
$3,650,000
it is obligated to pay Ambac
25%
of the federal income tax liability that would have been paid if the NOLs were not available.
Ambac Assurance has utilized all of its current post determination date NOLs generated from September 30, 2011 through
December 31, 2014
(post determination date NOLs); however, additional post determination date NOLs may be generated in the future. During this time period, Ambac Assurance's cumulative net taxable income was approximately
$43,743
.
Future taxable income of Ambac Assurance will be subject to payments by NOL usage tier and after certain credits and any additional post determination date NOLs, under its NOL tolling agreement with Ambac. A credit is available to offset the first
$5,000
of payments due under each of the NOL usage Tiers A, B, and C. Ambac Assurance used approximately
$2,297
of its Tier A credit.
The NOL allocable to AFG as of
December 31, 2014
is
$1,379,082
.
17. EMPLOYMENT BENEFIT PLANS
Postretirement Health Care and Other Benefits:
Ambac provides postretirement and postemployment benefits, including health and life benefits for certain employees who meet certain age and service requirements. None of the plans are currently funded. For Successor Ambac, postretirement and postemployment benefits expense was
$2,249
and
$2,101
for the
year ended December 31, 2014
and eight months ended
December 31, 2013
, respectively. For Predecessor Ambac, postretirement and postemployment benefits expense was
$1,344
and
$2,099
for the four months ended April 30, 2013 and for the year ended
December 31, 2012
, respectively.
Effective August 1, 2005, new employees were not eligible for postretirement benefits. In 2013, postretirement benefits offered to retirees were amended such that Ambac would no longer sponsor a health plan beginning in 2014. This requires retirees to purchase their own insurance policy with a portion of their premium being reimbursed by Ambac. The unfunded accumulated postretirement benefit obligation was
$10,050
as of
December 31, 2014
. The assumed health care cost trend rates range from
6.3%
in
2015
, decreasing ratably to
5.0%
in
2021
. Increasing the assumed health care cost trend rate by one percentage point in each future year would increase the accumulated postretirement benefit obligation at
December 31, 2014
, by
$1,788
and the
2014
benefit expense by
$173
. Decreasing the assumed health care cost trend rate by one percentage point in each future year would decrease the accumulated postretirement benefit obligation at
December 31, 2014
by
$1,395
and the
2014
benefit expense by
$131
.
The following table sets forth projected benefit payments from Ambac’s postretirement plan over the next ten years for current retirees:
|
Amount
|
||||
|
2015
|
$
|
311
|
|
|
|
2016
|
333
|
|
||
|
2017
|
338
|
|
||
|
2018
|
358
|
|
||
|
2019
|
377
|
|
||
|
2020-2024
|
2,198
|
|
||
|
$
|
3,915
|
|
||
The discount rate used in determining the projected benefit obligations for the postretirement plan is selected by reference to the year-end Moody’s corporate AA rate as well as other high-quality indices with similar duration to that of the benefit plans. The rate used for the projected plan benefit obligations at the measurement date for
December 31, 2014 and 2013
was
4.00%
and
4.75%
, respectively.
154
Savings Incentive Plan:
Substantially all employees of Ambac Assurance are covered by a defined contribution plan (the “Savings Incentive Plan”). Ambac Assurance makes employer matching contributions equal
100%
of the employees’ contributions, up to
3%
of such participants’ base compensation plus
50%
of contributions to an additional
2%
of base compensation, subject to limits set by the Internal Revenue Code. For Successor Ambac, the total cost of the Savings Incentive Plan was
$1,056
and
$683
for the
year ended December 31, 2014
and eight months ended
December 31, 2013
, respectively. For Predecessor Ambac, the total cost of the Savings Incentive Plan was
$447
and
$1,058
for the four months ended April 30, 2013 and for the year ended
December 31, 2012
, respectively.
Stock Compensation:
Employees, directors and consultants of Ambac are eligible to participate in Ambac’s 2013 Incentive Compensation Plan (“2013 Plan”) subject to the discretion of the compensation committee of Ambac’s Board of Directors. The 2013 Plan provides for incentives and rewards that are valued or determined by reference to Ambac common stock as traded on the NASDAQ exchange. There are
4,000,000
shares of Ambac’s common stock authorized for awards under the 2013 Plan of which
3,676,693
shares are available for future grant as of
December 31, 2014
.
In March 2014, Ambac developed a long term incentive compensation plan (“LTIP”) as a sub-plan of the 2013 Plan. The LTIP, approved by the Compensation Committee of the Board of Directors, is a significant component of management’s compensation program that is intended to strike an appropriate balance between short-term compensation and longer-term incentives aimed at fostering retention and aligning management's interest with those of Ambac's stakeholders. Awards granted under the LTIP are designed to further the financial and operational objectives of both Ambac and Ambac Assurance. The LTIP is intended to be an annual program.
Employees of Ambac previously participated in Ambac Financial Group Inc.’s 1997 Equity Plan, which provided for the granting of stock options, stock appreciation rights, restricted stock units, performance units and other awards that were valued or determined by reference to its common stock. The 1997 Equity Plan was cancelled upon Ambac’s emergence from bankruptcy in 2013. No stock grants were made under the 1997 Equity Plan in 2013 or 2012.
The amount of stock-based compensation expense and corresponding after-tax expense are as follows:
|
Successor Ambac
|
Predecessor Ambac
|
|||||||||||||||
|
Period from May 1
|
Period from January 1
|
|||||||||||||||
|
Year Ended
|
through
|
through
|
Year Ended
|
|||||||||||||
|
December 31, 2014
|
December 31, 2013
|
April 30, 2013
|
December 31, 2012
|
|||||||||||||
|
Stock options
|
$
|
444
|
|
$
|
56
|
|
$
|
—
|
|
$
|
—
|
|
||||
|
Restricted stock units
|
2,816
|
|
1,050
|
|
—
|
|
—
|
|
||||||||
|
Performance stock units
(1)
|
190
|
|
—
|
|
—
|
|
—
|
|
||||||||
|
Total stock-based compensation
|
$
|
3,450
|
|
$
|
1,106
|
|
$
|
—
|
|
$
|
—
|
|
||||
|
Total stock-based compensation (after-tax)
|
$
|
3,450
|
|
$
|
1,106
|
|
$
|
—
|
|
$
|
—
|
|
||||
|
(1)
|
Represents expense related to performance stock units portion of performance awards. Performance awards are split evenly between performance stock units and cash. Cash based compensation expense related to performance awards was
$190
for the year ended
December 31, 2014
.
|
Stock Options:
Stock options were awarded to directors in 2013 that vested on April 30, 2014 with a term of seven years from the grant date. The Company intends to use Treasury shares first and then, if necessary, issue new shares to satisfy stock option exercises. No stock options were awarded to directors in 2014. Additionally, no stock options have been awarded to employees or consultants under the 2013 Plan.
The Black-Scholes-Merton model was used to estimate the fair value of the service condition based stock options on the grant date. The following assumptions were used in estimating the fair value of options on the grant date for the 2013 stock option grant:
|
Risk-free interest rate
|
0.963
|
%
|
|
|
Expected volatility
|
50.2
|
%
|
|
|
Dividend yield
|
0.0
|
%
|
|
|
Expected life
|
3.33 years
|
|
|
|
Weighted-average grant-date fair value per share
|
$
|
7.50
|
|
The expected volatility is based on implied volatilities from traded options on Ambac’s stock, the historical volatility of Ambac’s stock, and the historical volatilities of our peer industry group. Peer group historical volatilities were considered due to the fact that Ambac stock had been traded for a time period less than the expected life of the options. A zero dividend yield was assumed based on the uncertainty of Ambac making
155
dividend payments over the expected life of these options. The risk-free interest rate reflects the U.S. Treasury yield curve in effect at the time of the grant. The expected life represents the period of time that options granted are expected to be outstanding and is based on certain factors we believe will influence exercise behavior.
A summary of option activity for
2014
is as follows:
|
Shares
|
Weighted Average
Exercise Price |
Aggregate
Intrinsic Value |
Weighted Average
Remaining Contractual Life |
|||||||||
|
Successor Ambac - Year Ended December 31, 2014
|
||||||||||||
|
Outstanding at beginning of period
|
66,668
|
|
$
|
20.63
|
|
6.98
|
||||||
|
Granted
|
—
|
|
—
|
|
|
|
||||||
|
Exercised
|
—
|
|
—
|
|
|
|
||||||
|
Forfeited or expired
|
—
|
|
—
|
|
|
|
||||||
|
Outstanding at end of period
|
66,668
|
|
$
|
20.63
|
|
$
|
258
|
|
5.98
|
|||
|
Exercisable
|
66,668
|
|
$
|
20.63
|
|
$
|
258
|
|
5.98
|
|||
All stock options were fully vested during 2014. As a result, total unrecognized compensation costs related to unvested stock options granted were
$0
as of
December 31, 2014
. No stock options were exercised during the year ended December 31, 2014, eight months ended December 31, 2013, four months ended April 30, 2013 and the year ended December 31, 2012.
Restricted Stock Units (“RSUs”):
RSUs were awarded to employees in 2013 that vested in two installments, 50% on the grant date and 50% on the first anniversary of the grant date. RSU awards to employees provided for accelerated vesting upon change in control or death or disability. Such employee RSUs will settle and convert into Ambac shares upon the earlier of (a) the employee’s termination of employment (other than for cause) and (b) the second anniversary of the applicable vesting date.
RSUs are awarded annually to directors that vest on the last day of April of the following year. These RSUs will not settle until the respective director’s termination from the board of directors or, if earlier, upon a change in control. All RSUs provide for accelerated vesting upon a change in control, death or disability or involuntary removal other than for cause (not including removal pursuant to a shareholder vote at a regularly scheduled annual meeting of shareholders). Upon termination (other than for cause), the RSUs shall vest as of the date of such termination in an amount equal to the number of then outstanding RSUs multiplied by a fraction, the numerator of which shall be the number of calendar days which have lapsed since the grant date and the denominator of which shall be the total number of calendar days of the original vesting period.
As of
December 31, 2014
,
185,800
RSUs remained outstanding, of which (i)
33,136
units required future service as a condition to the delivery of the underlying shares of common stock and (ii)
152,664
units did not require future service. As of
December 31, 2013
,
154,186
RSUs remained outstanding, of which (i)
113,921
units required future service as a condition to the delivery of the underlying shares of common stock and (ii)
40,265
units did not require future service.
Ambac’s closing share price on the grant date was used to estimate the fair value of the service condition based RSU on the grant date.
A summary of RSU activity for
2014
,
2013
and
2012
is as follows:
|
Successor Ambac
|
|||||||||||||
|
Year Ended
December 31, 2014 |
Period from May 1 through
December 31, 2013 |
||||||||||||
|
Shares
|
Weighted Average
Grant Date
Fair Value
|
Shares
|
Weighted Average
Grant Date
Fair Value
|
||||||||||
|
Outstanding at beginning of period
|
154,186
|
|
$
|
20.63
|
|
—
|
|
$
|
—
|
|
|||
|
Granted
|
33,136
|
|
30.18
|
|
155,123
|
|
20.63
|
|
|||||
|
Delivered or returned to plan
(1)
|
(1,522
|
)
|
20.63
|
|
(937
|
)
|
20.63
|
|
|||||
|
Forfeited
|
—
|
|
—
|
|
—
|
|
—
|
|
|||||
|
Outstanding at end of period
|
185,800
|
|
$
|
22.33
|
|
154,186
|
|
$
|
20.63
|
|
|||
|
(1)
|
When restricted stock unit awards issued by Ambac become taxable compensation to employees, shares may be withheld to cover the employee’s withholding taxes. In December
2014
and
2013
, Ambac purchased shares from employees that settled restricted stock units to meet the required tax withholdings.
|
156
|
Predecessor Ambac
|
|||||||||||||
|
Period from January 1 through
April 30, 2013
|
Year Ended
December 31, 2012
|
||||||||||||
|
Shares
|
Weighted Average
Grant Date
Fair Value
|
Shares
|
Weighted Average
Grant Date
Fair Value
|
||||||||||
|
Outstanding at beginning of period
|
104,389
|
|
$
|
21.43
|
|
113,739
|
|
$
|
23.96
|
|
|||
|
Granted
|
—
|
|
—
|
|
—
|
|
—
|
|
|||||
|
Delivered
|
(843
|
)
|
74.43
|
|
(9,350
|
)
|
52.16
|
|
|||||
|
Forfeited
|
(103,546
|
)
|
20.40
|
|
—
|
|
—
|
|
|||||
|
Outstanding at end of period
|
—
|
|
$
|
—
|
|
104,389
|
|
$
|
21.43
|
|
|||
As of
December 31, 2014
, there was
$333
total unrecognized compensation costs related to unvested RSUs granted. These costs are expected to be recognized over a weighted average period of
0.3 years
. The fair value for RSUs vested and delivered during the year ended December 31,
2014
, eight months ended December 31,
2013
, four months ended April 30, 2013 and year ended December 31,
2012
was
$37
,
$19
,
$0
and
$0
, respectively.
Performance Stock Awards:
In May 2014, performance awards were granted under the LTIP to certain members of management. These grants vest in
3
years and are evenly split between performance stock units ("PSUs") and cash. Actual awards will be based on performance at both Ambac and Ambac Assurance, but generally no awards will be earned unless a minimum performance threshold is met by Ambac Assurance. Actual awards can payout
0%
to
200%
of the number of units granted. Ambac performance will be evaluated relative to cumulative earnings before interest, taxes, depreciation and amortization over the vesting period (exclusive of Ambac Assurance earnings), which is intended to reward participants on generating taxable income from new business development. Over the same period, Ambac Assurance performance will be evaluated according to changes in a ratio of Ambac Assurance's assets to its insurance and financial obligations, which is intended to reward participants for increases in the relative value of Ambac Assurance. Other than voluntary termination or involuntary termination for cause, and provided that a participant's employment with the Company is not terminated within the first year of the performance period, the performance awards shall partially vest as of the date of such termination in the proportion of the number of calendar days which have lapsed since the grant date and the denominator of which shall be the total number of calendar days of the original vesting period. Settlements of all performance awards shall be
60 days
after the end of the performance period, including those that had a partial vesting.
A summary of PSU activity for
2014
is as follows:
|
Year Ended
December 31, 2014
|
||||||
|
Shares
(1)
|
Weighted Average
Grant Date
Fair Value
|
|||||
|
Outstanding at beginning of period
|
—
|
|
$
|
—
|
|
|
|
Granted
|
49,011
|
|
29.78
|
|
||
|
Delivered
|
—
|
|
—
|
|
||
|
Forfeited
|
(13,599
|
)
|
29.78
|
|
||
|
Outstanding at end of period
|
35,412
|
|
$
|
29.78
|
|
|
|
(1)
|
Represents performance share units at
100%
of units granted.
|
As of
December 31, 2014
there was
$1,460
of total unrecognized compensation costs related to unvested performance awards which are evenly split between PSUs and cash. The
2014
costs are expected to be recognized over a weighted average period of
2.3 years
.
157
18. COMMITMENTS AND CONTINGENCIES
Ambac is responsible for leases on the rental of office space. The executive office of Ambac is located in New York City under a lease agreement that expires in December 2015. The lease has a provision where Ambac Assurance can remain at One State Street Plaza through September 2019 (requires consent of both parties) with the potential for a reduced amount of space. In February 2015, both parties committed to extending the lease term with the rental cost still to be determined. Ambac leases additional space for its data center, disaster recovery site and for its international locations under lease agreements that expire periodically through October 2020. An estimate of future net minimum lease payments in each of the next five years ending December 31, and the periods thereafter, is as follows:
|
Amount
|
||||
|
2015
|
$
|
5,679
|
|
|
|
2016
|
533
|
|
||
|
2017
|
533
|
|
||
|
2018
|
533
|
|
||
|
2019
|
416
|
|
||
|
All later years
|
324
|
|
||
|
$
|
8,018
|
|
||
The Segregated Account and Wisconsin Rehabilitation Proceeding
On March 24, 2010, Ambac Assurance established a segregated account (the “Segregated Account”) and allocated to the Segregated Account certain financial guaranty insurance policies and other contingent liabilities, certain claims and other rights, and certain equity interests in subsidiaries. An insurance rehabilitation proceeding (the “Rehabilitation Proceeding”) was commenced with respect to the Segregated Account in the Wisconsin Circuit Court for Dane County (the “Rehabilitation Court”) on March 24, 2010 by the Commissioner of Insurance of the State of Wisconsin (the “Commissioner”) and the Rehabilitation Court entered an order of rehabilitation for the Segregated Account, appointing the Commissioner as Rehabilitator, and entered orders enjoining certain actions that could have an adverse effect on the financial condition of the Segregated Account.
Various third parties filed motions or objections in the Rehabilitation Court and/or moved to intervene in the Segregated Account Rehabilitation Proceeding. On January 24, 2011, the Rehabilitation Court issued its Decision and Final Order Confirming the Rehabilitator’s Plan of Rehabilitation, with Findings of Fact and Conclusions of Law (the “Confirmation Order”). Notices of appeal from the Confirmation Order were filed by various parties, including policyholders. These appeals challenged various provisions of the Segregated Account Rehabilitation Plan and actions the Rehabilitator or the Wisconsin Commissioner of Insurance had taken in formulating the Segregated Account Rehabilitation Plan. These appeals from the Confirmation Order were consolidated with earlier-filed appeals challenging, among other things, the issuance of injunctive relief and a settlement between Ambac Assurance and various financial institutions. On October 24, 2013, the Wisconsin Court of Appeals affirmed the Confirmation Order and the Rehabilitation Court’s rejection of the objections filed by various third parties before entry of the Confirmation Order. On November 22, 2013, petitions seeking discretionary review of this ruling by the Wisconsin Supreme Court were filed by various parties. The Rehabilitator responded by opposing further review by the Wisconsin Supreme Court. On March 17, 2014, the Supreme Court of Wisconsin denied the petitions for review making the decision by the Wisconsin Court of Appeals final and controlling law.
On January 17, 2014, the Rehabilitator filed a motion to obtain court approval to disburse settlement proceeds as permitted policy claim payments to specific policyholders as required by a settlement entered into with Residential Capital, LLC and related debtors in bankruptcy proceedings in the U.S. Bankruptcy Court for the Southern District of New York (the “ResCap Settlement”). In addition to seeking this approval with respect to the ResCap Settlement, the motion sought the court’s confirmation of the Rehabilitator’s authority to distribute proceeds from settlements of RMBS remediation claims as he deems appropriate and in the best interests of the Segregated Account and such distributions may include (i) paying claims by making payments in excess of the then applicable claims cash payment percentage, and/or (ii) paying all or portions of unpaid permitted policy claims. On February 7, 2014,
three
RMBS trustees jointly filed a partial objection to the motion. On February 13, 2014, the Rehabilitation Court heard argument on this motion and issued an order approving the Rehabilitator’s motion.
On April 21, 2014, the Rehabilitator filed a motion with the Rehabilitation Court seeking approval to amend the Segregated Account Rehabilitation Plan (the “Amendment Motion”). On May 20, 2014 and June 5, 2014, the Rehabilitator filed supplements to his Amendment Motion, further supplementing and amending his amendments to the Segregated Account Rehabilitation Plan. The Rehabilitation Court heard and granted the Amendment Motion on June 11, 2014. The approved amendments modify the treatment of claims under the Segregated Account Rehabilitation Plan, as more fully described in
Note 1. Background and Business Description
. Following approval of such amendments by the Rehabilitation Court, the Segregated Account Rehabilitation Plan, as amended, became effective on June 12, 2014, as more fully described in
Note 1. Background and Business Description
.
On June 9, 2014, the Rehabilitator filed in the Rehabilitation Court a motion to confirm and declare the reimbursement amounts due with respect to cash claim payments made by Ambac Assurance and the Segregated Account on
two
policies. Certain investors filed objections to the motion on July 2, 2014. On July 7, 2014, after a hearing on the motion, the Rehabilitation Court granted the Rehabilitator’s motion. On August 20, 2014, a group of investors filed a notice of appeal. The appellants’ opening brief was filed on November 5, 2014, the Rehabilitator’s response brief was filed on December 8, 2014, and the appellants’ reply brief was filed on December 23, 2014.
158
Litigation Against Ambac
County of Alameda et al. v. Ambac Assurance Corporation et al. (Superior Court of the State of California, County of San Francisco, second amended complaint filed on or about August 23, 2011) (“Alameda Complaint”); Contra Costa County et al. v. Ambac Assurance Corporation et al. (Superior Court of the State of California, County of San Francisco, third amended complaint filed on or about October 21, 2011) (“Contra Costa Complaint”); The Olympic Club v. Ambac Assurance Corporation et al. (Superior Court of the State of California, County of San Francisco, fourth amended complaint filed on or about October 21, 2011) (“Olympic Club Complaint”). The Contra Costa Complaint was brought on behalf of
five
California municipal entities and the non-profit Jewish Community Center of San Francisco. The Alameda Complaint was brought on behalf of nineteen California municipal entities. The Olympic Club Complaint was brought on behalf of the non-profit Olympic Club. The
three
actions make similar allegations against Ambac Assurance, various other financial guarantee insurance companies and employees thereof (collectively with Ambac Assurance, the “Bond Insurer Defendants”), and, in the case of the Contra Costa Complaint and the Olympic Club Complaint, the major credit rating agencies (the “Rating Agencies”). The actions allege that (1) Ambac Assurance and the other Bond Insurer Defendants colluded with the Rating Agencies to perpetuate a “dual rating system” pursuant to which the Rating Agencies rated the debt obligations of municipal issuers differently from corporate debt obligations, thereby keeping municipal ratings artificially low relative to corporate ratings; (2) Ambac Assurance and the other Bond Insurer Defendants issued false and misleading financial statements and failed to disclose the extent of the insurers’ respective exposures to mortgage-backed securities and collateralized debt obligations; and (3) as a result of these actions, plaintiffs incurred higher interest costs and bond insurance premiums in respect of their respective bond issues. Ambac Financial Group was originally a defendant in each of these actions, but on November 22, 2010, Ambac Financial Group was dismissed without prejudice as a defendant by the plaintiffs in each of these actions. Ambac Assurance and the other Bond Insurer Defendants filed a demurrer seeking dismissal of the current amended complaints on September 21, 2011, which was denied on October 20, 2011. On December 2, 2011, Ambac Assurance and the other Bond Insurer Defendants filed a special motion to strike the current amended complaints under California’s Anti-SLAPP statute (Calif. Code of Civ. Proc. Section 425.16). A hearing on the motion was held on March 23, 2012. On May 1, 2012, the Court ruled that the complaints were governed by the Anti-SLAPP statute to the extent they alleged conspiracy to influence the rating agencies’ rating methodologies, but not to the extent that the complaints alleged false or misleading statements or nondisclosures. After oral argument on March 21, 2013, the court dismissed claims related to the conspiracy branch of the complaint under the California Antitrust Law (the Cartwright Act) and after oral argument on April 22, 2013 denied defendants’ motion to dismiss claims under the California Unfair Competition Law. The court entered an order to this effect on July 9, 2013. On September 9, 2013, plaintiffs filed a notice of appeal of the July 9th order and on September 30, 2013, Ambac Assurance filed a notice of cross-appeal. On September 9, 2013, the parties filed motions for attorneys’ fees in connection with the portions of the Anti-SLAPP motions on which they were successful. The court denied plaintiffs’ motion for fees from the bench on November 8, 2013. On March 26, 2014, the court granted the defendants’ motions for attorneys’ fees awarding Ambac Assurance approximately
$207
. On July 7, 2014, plaintiffs filed a notice of appeal from the court’s decision awarding attorneys’ fees to Ambac Assurance and the other defendants. This appeal was dismissed on December 19, 2014. Plaintiffs have filed a motion to reinstate the appeal, stating that it should only have been dismissed as against one defendant with whom plaintiffs settled. Ambac did not oppose that motion, which was granted on January 29, 2015. Also on July 7, 2014, the Bond Insurer Defendants filed their appellate brief appealing the July 9th Order. Plaintiffs’ opposition to the Bond Insurer Defendants’ appellate brief and plaintiffs’ affirmative brief on their cross-motion were filed on November 5, 2014. The defendants’ brief in opposition to plaintiffs’ appeal and in further support of their cross-appeal was filed on February 3, 2015.
NPS LLC v. Ambac Assurance Corporation (United States District Court, District of Massachusetts, filed on July 8, 2008). This action was brought by NPS LLC (“NPS”), the owner of Gillette Stadium, the home stadium of the New England Patriots, with respect to the termination of a financial guarantee insurance policy issued by Ambac Assurance relating to auction rate bonds issued by NPS in 2006. Due to well-documented disruption of the auction rate securities market, the interest rate on the bonds floated to high levels and NPS therefore refinanced the bonds in a fixed rate financing without Ambac Assurance’s involvement. Pursuant to the insurance agreement between NPS and Ambac Assurance, NPS is obligated to pay a “make whole” premium to Ambac Assurance equal to the present value of the installment premiums that Ambac Assurance would have earned through 2017 if the bonds had not been redeemed (approximately
$2,700
). NPS alleged that it is not liable to pay the “make whole” premium because Ambac Assurance misrepresented its financial condition at the time the bonds were issued and that the alleged misrepresentations induced NPS to enter into the insurance agreement, thereby causing NPS to incur additional interest costs in connection with the bonds. NPS also alleged that Ambac Assurance was liable to NPS for the additional interest costs incurred by NPS which resulted from the disruption of the auction rate securities market. On February 25, 2010, the court granted Ambac Assurance’s motion for summary judgment as to all of NPS’s claims and Ambac Assurance’s counterclaim for the “make whole” premium and interest and costs. The parties are awaiting a determination by the court of the amount of Ambac Assurance’s legal fees that NPS will be required to pay. NPS has stated that it intends to appeal the grant of summary judgment in favor of Ambac Assurance.
Broadbill Partners LP et al. v. Ambac Assurance Corporation (Supreme Court of the State of New York, County of New York, filed November 8, 2012). Plaintiffs, alleged owners of Ambac Assurance preferred stock, commenced litigation against Ambac Assurance asserting claims for breach of contract, unjust enrichment, constructive trust, resulting trust and rescission related to Ambac Assurance’s exercise in or about December 2008 of rights under put option agreements with certain trusts. Plaintiffs allege that as a result of the improper exercise of such rights, Ambac Assurance received approximately
$800,000
in trust assets from the trusts in exchange for nearly worthless shares of Ambac Assurance preferred stock, which were thereafter delivered to the holders of the securities issued by the trusts. Plaintiffs seek damages, the imposition of a constructive trust, rescission and attorney’s fees. Ambac Assurance filed a motion to dismiss on January 15, 2013, which the plaintiffs opposed. The Court held oral argument on September 11, 2013. On March 12, 2014, the court granted Ambac Assurance’s motion dismissing the plaintiffs’ claims in their entirety. Plaintiffs filed a notice of appeal on March 31, 2014 but to date they have not perfected their appeal or filed any appellate brief. Plaintiffs’ deadline for timely perfecting the appeal expired on December 31, 2014.
Ambac Assurance’s estimates of projected losses for RMBS transactions consider, among other things, the RMBS transactions’ payment waterfall structure, including the application of interest and principal payments and recoveries, and depend in part on our interpretations of contracts and
159
other bases of our legal rights. From time to time, bond trustees and other transaction participants have employed different contractual interpretations. Ambac Assurance has been made aware that a transaction participant has directed a bond trustee to employ a different waterfall interpretation in a RMBS transaction, which may lead to the commencement of legal action. It is not possible to predict whether additional disputes will arise, nor the outcomes of any potential litigation. It is possible that there could be unfavorable outcomes in this or other disputes or proceedings and that our interpretations may prove to be incorrect, which could lead to changes to our estimate of loss reserves.
Ambac Assurance has periodically received various regulatory inquiries and requests for information with respect to investigations and inquiries that such regulators are conducting. Ambac Assurance has complied with all such inquiries and requests for information.
Ambac is involved from time to time in various routine legal proceedings, including proceedings related to litigation with present or former employees. Although Ambac’s litigation with present or former employees is routine and incidental to the conduct of its business, such litigation can result in large monetary awards when a civil jury is allowed to determine compensatory and/or punitive damages for, among other things, termination of employment that is wrongful or in violation of implied contracts.
It is not reasonably possible to predict whether additional suits will be filed or whether additional inquiries or requests for information will be made, and it is also not possible to predict the outcome of litigation, inquiries or requests for information. It is possible that there could be unfavorable outcomes in these or other proceedings. Legal accruals for litigation against Ambac which are probable and reasonably estimable, and management's estimated range of loss for such matters, are not material to the operating results or financial position of the Company. For the litigation matters Ambac is defending that do not meet the “probable and reasonably estimable” accrual threshold and where no loss estimates have been provided above, management is unable to make a meaningful estimate of the amount or range of loss that could result from unfavorable outcomes but, under some circumstances, adverse results in any such proceedings could be material to our business, operations, financial position, profitability or cash flows. The Company believes that it has substantial defenses to the claims above and, to the extent that these actions proceed, the Company intends to defend itself vigorously; however, the Company is not able to predict the outcomes of these actions.
Litigation Filed by Ambac
In the ordinary course of their businesses, certain of Ambac’s subsidiaries assert claims in legal proceedings against third parties to recover losses already paid and/or mitigate future losses. The amounts recovered and/or losses avoided which may result from these proceedings is uncertain, although recoveries and/or losses avoided in any one or more of these proceedings during any quarter or fiscal year could be material to Ambac’s results of operations in that quarter or fiscal year.
Ambac Assurance Corporation v. Adelanto Public Utility Authority (United States District Court, Southern District of New York, filed on June 1, 2009). Ambac Assurance commenced this action to recover from the defendant on account of Ambac Assurance’s payment under a swap termination surety bond. The defendant counterclaimed (as amended on June 12, 2010), alleging breach of contract, breach of the covenant of good faith and fair dealing, violations of California insurance statutes, fraud and promissory estoppel. Defendant claims that, in connection with defendant’s purchase of a bond insurance policy with respect to its variable rate bond issue in September 2005, Ambac Assurance misrepresented the stability of its “AAA” financial strength ratings and subsequently breached an implied covenant by underwriting risky structured obligations that ultimately led to the loss of the “AAA” ratings. On November 14, 2011, the court dismissed the defendant’s amended counterclaim in its entirety upon the motion of Ambac Assurance, and discovery commenced in December 2011. Both parties moved for summary judgment at the conclusion of discovery. On January 11, 2013 the court granted Ambac Assurance’s motion for summary judgment on all claims except Ambac Assurance’s claim for specific performance (as to which no summary judgment motion was made) and denied defendant’s motion. At a March 13, 2013 conference, the court requested that the parties prepare submissions regarding the amount of damages and fees Ambac Assurance is entitled to recover. Following a hearing on August 23, 2013, the court issued an order on August 29, 2013, awarding Ambac interest on the termination payment as well as legal fees and expenses as of March 31, 2013. In order to expedite the disposition of any appeals, Ambac Assurance filed a motion for the entry of final judgment for the claims upon which summary judgment was awarded and the defendant has moved for the entry of final judgment on the dismissal in 2011 of all its counterclaims against Ambac Assurance. On March 6, 2014, the court granted both motions and entered final judgment on March 8, 2014 on the dismissal of defendant’s counterclaims and on the claims for which Ambac Assurance was granted summary judgment awarding Ambac Assurance approximately $
7,760
as of March 11, 2014. Defendant filed a notice of appeal to the United States Court of Appeals for the Second Circuit on April 9, 2014. On June 26, 2014, the District Court granted Ambac Assurance’s motion for permission to register the judgment in its favor with the U.S. District Court for the Central District of California notwithstanding the pendency of Defendant’s Second Circuit appeal and denied Defendant’s cross-motion for a stay of enforcement pending appeal with a partial supersedeas bond, and the judgment has been registered in the Central District. In the meantime, defendant’s Second Circuit appeal schedule has been repeatedly adjourned with the consent of Ambac Assurance while discussions concerning defendant’s satisfaction of the judgment occur under the auspices of the mediation program of the Court of Appeals. On December 23, 2014, the parties entered into a Judgment Satisfaction and Release Agreement to resolve the matter. Defendant made the $
7,768
payment called for by this agreement before the end of 2014, and the agreement will become fully effective unless defendant enters insolvency proceedings or receivership within 100 days of its payment.
Ambac Assurance Corporation v. City of Detroit, Michigan, Kevyn D. Orr, John Naglick, Michael Jamison and Cheryl Johnson (United States Bankruptcy Court, Eastern District of Michigan Southern Division, filed on November 8, 2013). Ambac Assurance commenced this adversary proceeding, which relates to certain
ad valorem
taxes that the City levies and collects, in connection with the City of Detroit’s bankruptcy proceeding. On December 9, 2013, defendants filed motions to dismiss the complaint. Ambac Assurance filed an amended complaint on December 23, 2013. In its amended complaint, Ambac Assurance seeks a declaratory judgment that, among other things, (i) under Michigan law, the defendants must segregate the
ad valorem
tax revenues pledged to pay the City’s general obligation bonds insured by Ambac Assurance and not commingle them with City funds, and such
ad valorem
tax revenues are restricted funds and cannot be used for any purpose other than to satisfy the City’s payment obligations with respect to its general obligation bonds; (ii) the City lacks any equitable or beneficial property
160
interest in such
ad valorem
tax revenues and the bondholders have equitable and beneficial property interests therein; (iii) the City’s general obligation bonds insured by Ambac Assurance are secured by, and the bondholders have, a statutory lien on such
ad valorem
tax revenues, or in the alternative, a security interest therein; (iv) a portion of the
ad valorem
tax revenues are “special revenues” under the United States Bankruptcy Code and must be applied in accordance therewith; and (v) the City’s diversion of the
ad valorem
tax revenues or a grant of any post-petition interest therein to any other person without just compensation is an unlawful taking under the Takings Clause of the Fifth Amendment to the United States Constitution. On January 17, 2014, the defendants filed a renewed motion to dismiss. Ambac Assurance opposed the motion. The court heard oral argument on February 19, 2014. In July, 2014, the parties finalized settlement agreements pursuant to which, among other things, the litigation would be stayed pending the issuance of either an approval order concerning the settlement agreements or a confirmation order concerning the City of Detroit’s plan of adjustment and the occurrence of the effective date in the City’s bankruptcy proceedings. The Court stayed the litigation on September 16, 2014. Subsequently, on October 6, 2014, on its own initiative, the Court issued an order dismissing the litigation without prejudice to having it reinstated at a later date if necessary.
Erste Europäische Pfandbriefund Kommunalkreditbank AG In Luxemburg and Ambac Assurance Corporation v. City of San Bernardino, California (United States Bankruptcy Court, Central District of California, Riverside Division, filed on January 7, 2015). Plaintiffs commenced this adversary proceeding, which relates to the Debtor’s obligations under the Public Employees Retirement Law, California Government Code Section 20000
et seq.
(the “Retirement Law”), in connection with the City of San Bernardino’s bankruptcy proceeding. In the complaint, plaintiffs seek a declaratory judgment that the Debtor is obligated to make equivalent payments to both the holders of certain pension obligation bonds (the “Bonds”), a portion of which are insured by Ambac, and the California Public Employees Retirement Systems (“CalPERS”) to fund pension and other retirement benefits. It is the plaintiffs’ position that they are entitled to declaratory judgment because (i) when the City issue the Bonds, the City argued and a California court found, that the obligations under the Bonds were of the same legal character as the City’s obligations to CalPERS and (ii) the amounts owed to the bondholders are to CalPERS are merely separate portions of a single obligation owed by the Debtor under the Retirement Law. Plaintiffs therefore seek equivalent payment as to CalPERS, whether such payment takes for the form of current payments during the bankruptcy proceeding and thereafter, payments otherwise made in connection with the Retirement Law or any agreements entered into in accordance therewith, or distributions under a plan of adjustment. Defendant's response to the complaint is due March 2, 2015.
In connection with Ambac Assurance’s efforts to seek redress for breaches of representations and warranties and fraud related to the information provided by both the underwriters and the sponsors of various transactions and for failure to comply with the obligation by the sponsors to repurchase ineligible loans, Ambac Assurance has filed various lawsuits:
|
•
|
Ambac Assurance Corporation v. EMC Mortgage LLC (formerly known as EMC Mortgage Corporation), J.P. Morgan Securities, Inc. (formerly known as Bear, Stearns & Co. Inc.), and JP Morgan Chase Bank, N.A. (Supreme Court of the State of New York, County of New York, filed February 17, 2011). This case is the continuation of a case that was originally filed on November 5, 2008 in the U.S. District Court for the Southern District of New York but that was dismissed from federal court after Ambac Assurance was granted leave to amend its complaint to add certain new claims (but not others) and a new party, which deprived the federal court of jurisdiction over the litigation. After the decision by the federal judge, dated February 8, 2011, Ambac Assurance re-filed the suit in New York state court on February 17, 2011. On July 18, 2011, Ambac Assurance filed a First Amended Complaint in its state-court litigation. In its state-court action, Ambac Assurance asserts claims for breach of contract, indemnification and reimbursement against EMC, as well as claims of fraudulent conduct by EMC and J. P. Morgan Securities Inc. In its First Amended Complaint, Ambac Assurance asserts an additional claim for breach of contract against EMC and a claim for successor liability against a new defendant, JP Morgan Chase Bank, N.A. The Defendants filed their answer to the First Amended Complaint on August 30, 2011, and the parties are currently engaged in discovery. On December 18, 2014, defendants filed a motion for partial summary judgment seeking to dismiss the plaintiffs’ claim for fraudulent inducement arguing that as a matter of law, plaintiffs cannot prove justifiable reliance. Ambac Assurance filed its opposition on February 13, 2015.
|
|
•
|
Ambac Assurance Corporation and The Segregated Account of Ambac Assurance Corporation v. EMC Mortgage LLC (formerly known as EMC Mortgage Corporation), J.P. Morgan Securities, Inc. (formerly known as Bear, Stearns & Co. Inc.), and JP Morgan Chase Bank, N.A. (Supreme Court of the State of New York, County of New York, filed March 30, 2012 and amended on August 14, 2012). Ambac Assurance alleges claims for fraudulent inducement and breaches of contract against EMC and J.P. Morgan Securities Inc., as well as claims against JP Morgan Chase Bank, N.A. as EMC’s successor in interest, arising from the defendants’ misrepresentations and breaches of contractual warranties regarding certain transactions that are not the subject of Ambac Assurance’s previously filed lawsuit against the same defendants (described above). Defendants filed a motion to dismiss the amended complaint on September 28, 2012, which Ambac Assurance opposed on October 26, 2012. Oral argument was held on February 21, 2013. On June 13, 2013, the court dismissed Ambac Assurance’s contractual claims but not its claims for fraudulent inducement or successor liability. Ambac Assurance appealed the trial court’s decision. On October 16, 2014, the Appellate Division for the First Department affirmed the trial court’s dismissal. In November 2014, Ambac Assurance filed for leave to re-argue, or in the alternative to appeal, the decision. Defendants opposed the motion. No decision has been issued. With respect to the claims that remain in the case, discovery is ongoing.
|
|
•
|
Ambac Assurance Corporation and The Segregated Account of Ambac Assurance Corporation v. First Franklin Financial Corporation, Bank of America, N.A., Merrill Lynch, Pierce, Fenner & Smith Inc., Merrill Lynch Mortgage Lending, Inc., and Merrill Lynch Mortgage Investors, Inc. (Supreme Court of the State of New York, County of New York, filed April 16, 2012). Ambac Assurance alleges breach of contract, fraudulent inducement, indemnification, reimbursement and requested the repurchase of loans that breach representations and warranties as required under the contracts, as well as damages. Defendants filed a motion to dismiss on July 13, 2012, which Ambac opposed on September 21, 2012. Oral argument was held on May 6, 2013. On July 18, 2013 the court dismissed Ambac Assurance’s claims for indemnification and limited Ambac Assurance’s claim for breach of loan-level warranties to the repurchase protocol, but did not dismiss Ambac Assurance’s other contractual claims or fraudulent inducement claim. On August 21, 2013, defendants filed a notice of appeal, and on August 30, 2013, Ambac Assurance filed a notice of cross-appeal. On April 22, 2014, the
|
161
parties filed a stipulation withdrawing defendants’ appeal and Ambac Assurance’s cross-appeal of the court’s July 18, 2013 decision. Discovery is ongoing. No trial date has been set.
|
•
|
Ambac Assurance Corporation and The Segregated Account of Ambac Assurance Corporation v. Countrywide Securities Corp., Countrywide Financial Corp. (a.k.a. Bank of America Home Loans) and Bank of America Corp. (Supreme Court of the State of New York, County of New York, filed on September 28, 2010). Ambac Assurance filed an Amended Complaint on September 8, 2011. Ambac Assurance alleged breach of contract, fraudulent inducement, indemnification and reimbursement, and breach of representations and warranties, requested the repurchase of loans that breach representations and warranties as required under the contracts, as well as damages, and asserted a successor liability claim against Bank of America. On May 28, 2013, Ambac Assurance filed a Second Amended Complaint adding an alter ego claim against Bank of America alleging that, because Bank of America and Countrywide are alter egos of one another, Bank of America is responsible for Countrywide’s liabilities to Ambac. The defendants served their answers on July 31, 2013. Fact discovery has ended and the parties are currently engaged in expert discovery. No trial date has been set.
|
|
•
|
Ambac Assurance Corporation and The Segregated Account of Ambac Assurance Corporation v. Capital One, N.A., as successor by merger to Chevy Chase Bank, F.S.B. (United States District Court for the Southern District of New York, filed on October 24, 2012). Ambac Assurance alleges claims for breach of contract, indemnification, reimbursement and requested the repurchase of loans that breach representations and warranties as required under the contracts, as well as damages. Defendants filed a motion to dismiss on February 6, 2013, which Ambac Assurance opposed in a brief filed on February 20, 2013. The motion was fully briefed and filed on March 5, 2013. The court held oral argument on March 7, 2013 and on March 27, 2014, the court ordered the motion withdrawn. Defendant filed its answer on April 11, 2014. On June 16, 2014, the court entered an order discontinuing the litigation with prejudice pursuant to stipulation signed by the parties.
|
|
•
|
Ambac Assurance Corporation and The Segregated Account of Ambac Assurance Corporation v. Nomura Credit & Capital, Inc. and Nomura Holding America Inc. (Supreme Court of the State of New York, County of New York, filed on April 15, 2013). Ambac Assurance alleges claims for material breach of contract and for the repurchase of loans that breach representations and warranties under the contracts, as well as damages. Ambac Assurance has also asserted alter ego claims against Nomura Holding America, Inc. Defendants filed a motion to dismiss on July 12, 2013, which Ambac Assurance opposed. The court held oral argument on November 13, 2013. The court has not yet decided the motion. On September 22, 2014, plaintiffs filed an amended complaint alleging claims for fraudulent inducement, material breach of contract and for the repurchase of loans that breach representations and warranties under the contracts, as well as damages. Pursuant to court order, on October 29, 2014, the parties submitted supplemental briefing on the impact, if any, of the First Department’s appellate decision in Ambac v. EMC on defendants’ pending motion to dismiss the contractual claims. On October 31, 2014 defendants filed a motion to strike the amended complaint. Ambac Assurance opposed that motion and at the court’s recommendation also filed a cross motion for leave to amend the complaint on November 14, 2014, which the defendants opposed. Defendants filed a motion to dismiss the fraudulent inducement claim, which Ambac Assurance opposed. All motions are fully briefed. No decision has been issued on any of the outstanding motions.
|
|
•
|
The Segregated Account of Ambac Assurance Corporation and Ambac Assurance Corporation v. Countrywide Home Loans, Inc. (Wisconsin Circuit Court for Dane County, filed on December 30, 2014). Ambac Assurance alleges a claim for fraudulent inducement in connection with Ambac Assurance’s issuance of insurance policies relating to
five
residential mortgage-backed securitizations that are not the subject of Ambac Assurance’s previously filed lawsuit against the same defendant. Defendant filed a motion to dismiss the complaint on February 20, 2015, which Ambac Assurance intends to oppose.
|
|
•
|
Ambac Assurance Corporation and the Segregated Account of Ambac Assurance Corporation v. Countrywide Home Loans, Inc., Countrywide Securities Corp., Countrywide Financial Corp., and Bank of America Corp. (Supreme Court of the State of New York, County of New York, filed on December 30, 2014). Ambac Assurance alleges a claim for fraudulent inducement in connection with Ambac Assurance’s issuance of insurance policies relating to eight residential mortgage-backed securitizations that are not the subject of Ambac Assurance’s previously filed lawsuits against the same defendants. On February 20, 2015, the Countrywide defendants filed a motion to dismiss the complaint, which Bank of America joined on February 23, 2015. Ambac Assurance intends to oppose the motion.
|
19. SEGMENT INFORMATION
Ambac has
two
reportable segments, as follows: (i) Financial Guarantee, which provides financial guarantees (including credit derivatives) for public finance, structured finance and international obligations; and (ii) Financial Services, which provides investment agreements, funding conduits, interest rate and currency swaps, principally to clients of the financial guarantee business. Ambac’s reportable segments were strategic business units that offer different products and services. They are managed separately because each business required different marketing strategies, personnel skill sets and technology.
Ambac Assurance guarantees the swap and investment agreement obligations of its Financial Services subsidiaries. Additionally, Ambac Assurance provides loans to the Financial Services businesses. Inter-segment revenues include the premiums and investment income earned under those agreements. Such premiums are determined as if they were premiums paid by third parties, that is, at current market prices.
Information provided below for unaffiliated “Corporate and Other” primarily relates to investment income on Ambac's investment portfolio. Equity in net income of investees accounted for by the equity method relates to the Owner Trust Certificate received when Ambac deposited its Segregated Account junior surplus note into a Trust (see
Note 1. Background and Business Description
for further information relating to the sale by Ambac of a junior surplus note issued to it by the Segregated Account). Inter-segment for "Corporate and Other" relates to amounts received by Ambac under the Mediation Agreement dated September 21, 2011 (as more fully described in
Note 1. Background and Business Description
), including accrual of interest on the junior surplus notes issued by the Segregated Account prior to Ambac's deposit into a Trust.
162
The following table is a summary of financial information by reportable segment for the affected periods:
|
Successor Ambac - Year Ended December 31, 2014
|
Financial
Guarantee |
Financial
Services |
Corporate
and Other |
Inter-segment
Eliminations |
Consolidated
|
|||||||||||||||
|
Revenues:
|
||||||||||||||||||||
|
Unaffiliated customers
(1)
|
$
|
506,558
|
|
$
|
(179,691
|
)
|
$
|
408
|
|
$
|
—
|
|
$
|
327,275
|
|
|||||
|
Equity in net income of investees accounted for by equity method
|
—
|
|
—
|
|
1,395
|
|
—
|
|
1,395
|
|
||||||||||
|
Inter-segment
|
1,243
|
|
(1,197
|
)
|
23,299
|
|
(23,345
|
)
|
—
|
|
||||||||||
|
Total revenues
|
507,801
|
|
(180,888
|
)
|
25,102
|
|
(23,345
|
)
|
328,670
|
|
||||||||||
|
Pre-tax income (loss) from continuing operations:
|
||||||||||||||||||||
|
Unaffiliated customers
(1)(2)(3)
|
684,750
|
|
(182,941
|
)
|
(9,951
|
)
|
—
|
|
491,858
|
|
||||||||||
|
Equity in net income of investees accounted for by equity method
|
—
|
|
—
|
|
1,395
|
|
—
|
|
1,395
|
|
||||||||||
|
Inter-segment
|
(25,443
|
)
|
(1,545
|
)
|
26,988
|
|
—
|
|
—
|
|
||||||||||
|
Pre-tax income (loss) from continuing operations
|
659,307
|
|
(184,486
|
)
|
18,432
|
|
—
|
|
493,253
|
|
||||||||||
|
Total assets as of December 31, 2014
|
24,444,514
|
|
436,072
|
|
279,278
|
|
—
|
|
25,159,864
|
|
||||||||||
|
Net investment income
|
298,020
|
|
1,123
|
|
1,803
|
|
—
|
|
300,946
|
|
||||||||||
|
Insurance intangible amortization
|
151,830
|
|
—
|
|
—
|
|
—
|
|
151,830
|
|
||||||||||
|
Interest expense
|
125,892
|
|
1,584
|
|
—
|
|
—
|
|
127,476
|
|
||||||||||
|
Reorganization items
(4)
|
$
|
—
|
|
$
|
—
|
|
$
|
211
|
|
$
|
—
|
|
$
|
211
|
|
|||||
|
Successor Ambac – Period from May 1 through December 31, 2013
|
Financial
Guarantee |
Financial
Services |
Corporate
and Other |
Inter-segment
Eliminations |
Consolidated
|
|||||||||||||||
|
Revenues:
|
||||||||||||||||||||
|
Unaffiliated customers
(1)
|
$
|
464,701
|
|
$
|
116,177
|
|
$
|
170
|
|
$
|
—
|
|
$
|
581,048
|
|
|||||
|
Inter-segment
|
1,837
|
|
(1,210
|
)
|
219,181
|
|
(219,808
|
)
|
—
|
|
||||||||||
|
Total revenues
|
466,538
|
|
114,967
|
|
219,351
|
|
(219,808
|
)
|
581,048
|
|
||||||||||
|
Pre-tax income (loss) from continuing operations:
|
||||||||||||||||||||
|
Unaffiliated customers
(1) (2) (3)
|
405,004
|
|
113,347
|
|
(6,035
|
)
|
—
|
|
512,316
|
|
||||||||||
|
Inter-segment
|
(220,218
|
)
|
(1,644
|
)
|
221,862
|
|
—
|
|
—
|
|
||||||||||
|
Pre-tax income (loss) from continuing operations
|
184,786
|
|
111,703
|
|
215,827
|
|
—
|
|
512,316
|
|
||||||||||
|
Total assets as of December 31, 2013
|
26,582,635
|
|
472,886
|
|
36,956
|
|
—
|
|
27,092,477
|
|
||||||||||
|
Net investment income
|
145,269
|
|
1,115
|
|
62
|
|
—
|
|
146,446
|
|
||||||||||
|
Insurance intangible amortization
|
99,658
|
|
—
|
|
—
|
|
—
|
|
99,658
|
|
||||||||||
|
Interest expense
|
83,595
|
|
1,355
|
|
—
|
|
—
|
|
84,950
|
|
||||||||||
|
Reorganization items
(4)
|
$
|
—
|
|
$
|
—
|
|
$
|
493
|
|
$
|
—
|
|
$
|
493
|
|
|||||
|
Predecessor Ambac - Period from January 1 through April 30, 2013
|
Financial
Guarantee |
Financial
Services |
Corporate
and Other |
Inter-segment
Eliminations |
Consolidated
|
|||||||||||||||
|
Revenues:
|
||||||||||||||||||||
|
Unaffiliated customers
(1)
|
$
|
633,010
|
|
$
|
7,339
|
|
$
|
39
|
|
$
|
—
|
|
$
|
640,388
|
|
|||||
|
Inter-segment
|
940
|
|
(882
|
)
|
—
|
|
(58
|
)
|
—
|
|
||||||||||
|
Total revenues
|
633,950
|
|
6,457
|
|
39
|
|
(58
|
)
|
640,388
|
|
||||||||||
|
Pre-tax income (loss) from continuing operations:
|
||||||||||||||||||||
|
Unaffiliated customers
(1) (2) (3)
|
1,831,237
|
|
3,394
|
|
1,513,402
|
|
—
|
|
3,348,033
|
|
||||||||||
|
Inter-segment
|
(132
|
)
|
(1,101
|
)
|
1,233
|
|
—
|
|
—
|
|
||||||||||
|
Pre-tax income (loss) from continuing operations
|
1,831,105
|
|
2,293
|
|
1,514,635
|
|
—
|
|
3,348,033
|
|
||||||||||
|
Total assets as of April 30, 2013
|
28,287,321
|
|
536,711
|
|
29,403
|
|
—
|
|
28,853,435
|
|
||||||||||
|
Net investment income
|
115,129
|
|
1,572
|
|
39
|
|
—
|
|
116,740
|
|
||||||||||
|
Interest expense
|
29,718
|
|
1,307
|
|
—
|
|
—
|
|
31,025
|
|
||||||||||
|
Reorganization items
(4)
|
$
|
(1,231,550
|
)
|
$
|
1,505
|
|
$
|
(1,515,135
|
)
|
$
|
—
|
|
$
|
(2,745,180
|
)
|
|||||
163
|
Predecessor Ambac - Year Ended December 31, 2012
|
Financial
Guarantee |
Financial
Services |
Corporate
and Other |
Inter-segment
Eliminations |
Consolidated
|
|||||||||||||||
|
Revenues:
|
||||||||||||||||||||
|
Unaffiliated customers
(1)
|
$
|
758,331
|
|
$
|
(72,977
|
)
|
$
|
335
|
|
$
|
—
|
|
$
|
685,689
|
|
|||||
|
Inter-segment
|
5,189
|
|
(4,992
|
)
|
645
|
|
(842
|
)
|
—
|
|
||||||||||
|
Total revenues
|
763,520
|
|
(77,969
|
)
|
980
|
|
(842
|
)
|
685,689
|
|
||||||||||
|
Pre-tax income (loss) from continuing operations:
|
||||||||||||||||||||
|
Unaffiliated customers
(1) (2) (3)
|
(162,797
|
)
|
(82,429
|
)
|
(11,279
|
)
|
—
|
|
(256,505
|
)
|
||||||||||
|
Inter-segment
|
580
|
|
(5,775
|
)
|
5,195
|
|
—
|
|
—
|
|
||||||||||
|
Pre-tax income (loss) from continuing operations
|
(162,217
|
)
|
(88,204
|
)
|
(6,084
|
)
|
—
|
|
(256,505
|
)
|
||||||||||
|
Total assets as of December 31, 2012
|
26,519,480
|
|
533,528
|
|
32,257
|
|
—
|
|
27,085,265
|
|
||||||||||
|
Net investment income
|
365,912
|
|
16,769
|
|
221
|
|
—
|
|
382,902
|
|
||||||||||
|
Interest expense
|
105,973
|
|
6,347
|
|
—
|
|
—
|
|
112,320
|
|
||||||||||
|
Reorganization items
(4)
|
$
|
—
|
|
$
|
—
|
|
$
|
7,215
|
|
$
|
—
|
|
$
|
7,215
|
|
|||||
|
(1)
|
Included in both revenues from unaffiliated customers and in pre-tax income (loss) from continuing operations from unaffiliated customers is net investment income.
|
|
(2)
|
Included in pre-tax income (loss) from continuing operations from unaffiliated customers is interest expense.
|
|
(3)
|
Included in pre-tax income (loss) from continuing operations from unaffiliated customers is amortization of intangible asset arising from financial guarantee contracts that were set to fair value upon adoption of Fresh Start.
|
|
(4)
|
Refer to
|
The following table summarizes gross premiums written, net premiums earned and the net change in fair value of credit derivatives included in the Financial Guarantee segment by location of risk for the affected periods:
|
Successor Ambac
|
||||||||||||||||||||||||
|
Year Ended
December 31, 2014 |
Period from May 1 through
December 31, 2013 |
|||||||||||||||||||||||
|
Gross
Premiums Written |
Net
Premiums Earned |
Net Change in
Fair Value of Credit Derivatives |
Gross
Premiums Written |
Net
Premiums Earned |
Net Change in
Fair Value of Credit Derivatives |
|||||||||||||||||||
|
United States
|
$
|
(46,279
|
)
|
$
|
197,154
|
|
$
|
8,669
|
|
$
|
(61,255
|
)
|
$
|
165,099
|
|
$
|
122,696
|
|
||||||
|
United Kingdom
|
(221,516
|
)
|
31,672
|
|
—
|
|
(7,368
|
)
|
35,387
|
|
22,548
|
|
||||||||||||
|
Other international
|
(20,515
|
)
|
17,534
|
|
15,237
|
|
(11,686
|
)
|
13,032
|
|
47,625
|
|
||||||||||||
|
Total
|
$
|
(288,310
|
)
|
$
|
246,360
|
|
$
|
23,906
|
|
$
|
(80,309
|
)
|
$
|
213,518
|
|
$
|
192,869
|
|
||||||
|
Predecessor Ambac
|
||||||||||||||||||||||||
|
Period from January1 through
April 30, 2013 |
Year Ended
December 31, 2012 |
|||||||||||||||||||||||
|
Gross
Premiums Written |
Net
Premiums Earned |
Net Change in
Fair Value of Credit Derivatives |
Gross
Premiums Written |
Net
Premiums Earned |
Net Change in
Fair Value of Credit Derivatives |
|||||||||||||||||||
|
United States
|
$
|
(16,102
|
)
|
$
|
104,594
|
|
$
|
(31,134
|
)
|
$
|
(260,517
|
)
|
$
|
315,367
|
|
$
|
(8,496
|
)
|
||||||
|
United Kingdom
|
10,673
|
|
18,071
|
|
(5,861
|
)
|
10,785
|
|
73,955
|
|
(5,709
|
)
|
||||||||||||
|
Other international
|
(8,696
|
)
|
7,335
|
|
(23,389
|
)
|
(27,776
|
)
|
25,282
|
|
4,986
|
|
||||||||||||
|
Total
|
$
|
(14,125
|
)
|
$
|
130,000
|
|
$
|
(60,384
|
)
|
$
|
(277,508
|
)
|
$
|
414,604
|
|
$
|
(9,219
|
)
|
||||||
164
|
20.
|
QUARTERLY FINANCIAL INFORMATION (Unaudited)
|
|
($ in thousands)
|
First
Quarter |
Second
Quarter |
Third
Quarter |
Fourth
Quarter |
||||||||||||
|
2014
|
||||||||||||||||
|
Gross premiums written
|
$
|
(5,766
|
)
|
$
|
(45,486
|
)
|
$
|
(13,700
|
)
|
$
|
(223,358
|
)
|
||||
|
Net premiums earned
|
82,547
|
|
65,013
|
|
64,831
|
|
33,969
|
|
||||||||
|
Net investment income
|
70,801
|
|
80,093
|
|
83,581
|
|
66,471
|
|
||||||||
|
Other than temporary impairment losses
|
(10,392
|
)
|
(8,754
|
)
|
(5,011
|
)
|
(1,637
|
)
|
||||||||
|
Net realized investment gains
|
16,289
|
|
3,067
|
|
10,045
|
|
29,376
|
|
||||||||
|
Net change in fair value of credit derivatives
|
7,382
|
|
(1,219
|
)
|
7,416
|
|
10,327
|
|
||||||||
|
Derivative products revenue
|
(53,841
|
)
|
(47,985
|
)
|
(15,685
|
)
|
(63,576
|
)
|
||||||||
|
Net realized losses on extinguishment of debt
|
—
|
|
—
|
|
—
|
|
(74,724
|
)
|
||||||||
|
Income on Variable Interest Entities ("VIEs")
|
(5,542
|
)
|
(38,148
|
)
|
9,116
|
|
2,362
|
|
||||||||
|
Loss and loss expenses (benefit)
|
(140,011
|
)
|
175,317
|
|
(28,698
|
)
|
(552,182
|
)
|
||||||||
|
Insurance intangible amortization
|
31,714
|
|
36,256
|
|
41,908
|
|
41,952
|
|
||||||||
|
Underwriting and operating expenses
|
25,786
|
|
24,033
|
|
25,513
|
|
26,142
|
|
||||||||
|
Interest expense
|
32,328
|
|
31,953
|
|
31,841
|
|
31,354
|
|
||||||||
|
Reorganization items
|
23
|
|
186
|
|
2
|
|
—
|
|
||||||||
|
Pre-tax income (loss) from continuing operations
|
159,298
|
|
(210,412
|
)
|
84,773
|
|
459,594
|
|
||||||||
|
Net income attributable to Common Shareholders
|
155,942
|
|
(207,905
|
)
|
82,450
|
|
453,584
|
|
||||||||
|
Net income (loss) per share:
|
||||||||||||||||
|
Basic
|
$
|
3.46
|
|
$
|
(4.61
|
)
|
$
|
1.83
|
|
$
|
10.05
|
|
||||
|
Diluted
|
$
|
3.31
|
|
$
|
(4.61
|
)
|
$
|
1.77
|
|
$
|
9.73
|
|
||||
|
Predecessor
|
Successor
|
||||||||||||||||||||
|
One Month
|
Two Months
|
||||||||||||||||||||
|
First
|
Ended
|
Ended
|
Third
|
Fourth
|
|||||||||||||||||
|
($ in thousands)
|
Quarter
|
April 30
|
June 30
|
Quarter
|
Quarter
|
||||||||||||||||
|
2013
(1)
|
|||||||||||||||||||||
|
Gross premiums written
|
$
|
(3,530
|
)
|
$
|
(10,595
|
)
|
$
|
(34,081
|
)
|
$
|
(34,380
|
)
|
$
|
(11,848
|
)
|
||||||
|
Net premiums earned
|
100,256
|
|
29,744
|
|
58,039
|
|
70,949
|
|
84,530
|
|
|||||||||||
|
Net investment income
|
84,514
|
|
32,226
|
|
26,196
|
|
52,126
|
|
68,124
|
|
|||||||||||
|
Other than temporary impairment losses
|
—
|
|
(467
|
)
|
(2,002
|
)
|
(38,037
|
)
|
(6,725
|
)
|
|||||||||||
|
Net realized investment gains
|
46,060
|
|
7,245
|
|
18,472
|
|
(10,310
|
)
|
(3,695
|
)
|
|||||||||||
|
Net change in fair value of credit derivatives
|
12,787
|
|
(73,171
|
)
|
51,220
|
|
31,194
|
|
110,455
|
|
|||||||||||
|
Derivative products revenue
|
(569
|
)
|
(33,166
|
)
|
83,713
|
|
12,372
|
|
18,686
|
|
|||||||||||
|
Income on Variable Interest Entities ("VIEs")
|
38,326
|
|
388,240
|
|
4,598
|
|
55,109
|
|
(108,330
|
)
|
|||||||||||
|
Loss and loss expenses (benefit)
|
(51,135
|
)
|
13,079
|
|
(26,117
|
)
|
(154,290
|
)
|
(4,731
|
)
|
|||||||||||
|
Insurance intangible amortization
|
—
|
|
—
|
|
24,952
|
|
37,473
|
|
37,233
|
|
|||||||||||
|
Underwriting and operating expenses
|
33,874
|
|
10,692
|
|
16,217
|
|
25,047
|
|
27,505
|
|
|||||||||||
|
Interest expenses
|
23,165
|
|
7,860
|
|
21,144
|
|
31,817
|
|
31,989
|
|
|||||||||||
|
Reorganization items
|
2,059
|
|
(2,747,239
|
)
|
424
|
|
4
|
|
65
|
|
|||||||||||
|
Pre-tax income (loss) from continuing operations
|
282,909
|
|
3,065,124
|
|
205,795
|
|
231,601
|
|
74,920
|
|
|||||||||||
|
Net income attributable to Common Shareholders
|
282,299
|
|
3,066,750
|
|
205,681
|
|
230,975
|
|
68,563
|
|
|||||||||||
|
Net income (loss) per share:
|
|
|
|
|
|
||||||||||||||||
|
Basic
|
$
|
0.93
|
|
$
|
10.14
|
|
$
|
4.57
|
|
$
|
5.13
|
|
$
|
1.52
|
|
||||||
|
Diluted
|
$
|
0.93
|
|
$
|
10.14
|
|
$
|
4.42
|
|
$
|
4.98
|
|
$
|
1.49
|
|
||||||
|
(1)
|
The financial statements for the year ended December 31, 2013 include Predecessor Ambac for the period January 1, 2013 - April 30, 2013 and Successor Ambac for the period from May 1, 2013 - December 31, 2013.
|
165
None.
(a)
Evaluation of Disclosure Controls and Procedures
. Ambac’s management, with the participation of Ambac’s Chief Executive Officer and Chief Financial Officer, has evaluated the effectiveness of Ambac’s disclosure controls and procedures (as such term is defined in Rules 13a-15(e) and 15d-15(e) under the Securities Exchange Act of 1934, as amended (the “Exchange Act”)), as of the end of the period covered by this report.
Disclosure controls and procedures are designed to ensure that information required to be disclosed by Ambac (including its consolidated subsidiaries) in the reports that it files or submits under the Exchange Act is recorded, processed, summarized and reported within the time periods specified in the SECs rules and forms, and that such information is accumulated and communicated to Ambac’s management, including its Chief Executive Officer and Chief Financial officer, to allow timely decisions regarding required disclosure.
Based on this evaluation, Ambac’s Chief Executive Officer and Chief Financial Officer have concluded that, as of
December 31, 2014
, Ambac’s disclosure controls and procedures were effective at the reasonable assurance level.
There were no changes in Ambac’s internal control over financial reporting (as such term is defined in Rules 13a-15(f) and 15d-15(f) under the Exchange Act) during Ambac’s fiscal year ended
December 31, 2014
that have materially affected, or are reasonably likely to materially affect, Ambac’s internal control over financial reporting.
(b)
Management’s Report on Internal Control Over Financial Reporting
. Management of Ambac is responsible for establishing and maintaining adequate internal control over financial reporting. Ambac’s internal control over financial reporting is a process designed under the supervision of the Chief Executive Officer and Chief Financial Officer and effected by Ambac’s Board of Directors, management and other personnel, to provide reasonable assurance regarding the reliability of financial reporting and the preparation of Ambac’s financial statements for external reporting purposes in accordance with U.S. generally accepted accounting principles. Ambac’s internal control over financial reporting includes those policies and procedures that (i) pertain to the maintenance of records that, in reasonable detail, accurately and fairly reflect the transactions and dispositions of assets of Ambac; (ii) provide reasonable assurance that transactions are recorded as necessary to permit preparation of financial statements in accordance with U.S. generally accepted accounting principles, and that receipts and expenditures of the company are being made only in accordance with authorizations of management and directors of Ambac; and (iii) provide reasonable assurance regarding the prevention or timely detection and remediation of unauthorized acquisition, use or disposition of Ambac’s assets that could have a material effect on the financial statements.
Because of its inherent limitations, internal control over financial reporting may not prevent or detect misstatements. Also, projections of any evaluation of effectiveness to future periods are subject to the risk that controls may become inadequate because of changes in conditions, or that the degree of compliance with the policies or procedures may deteriorate.
Management conducted an assessment of the effectiveness of the Corporation’s internal control over financial reporting as of
December 31, 2014
. In making this assessment, management used the framework set forth in Internal Control—Integrated Framework (1992) issued by the Committee of Sponsoring Organizations of the Treadway Commission. Based on this assessment, management has determined that, as of
December 31, 2014
, the Corporation’s internal control over financial reporting is effective.
The Corporation’s internal control over financial reporting as of
December 31, 2014
has been audited by KPMG, LLP, the independent registered public accounting firm who also audited the Corporation’s consolidated financial statements. Their attestation report on the Corporation’s internal control over financial reporting is shown in Part II, Item 8 in this Form 10-K.
None.
166
Information relating to the Registrant’s executive officers and directors, including its audit committee and audit committee financial experts will be in the Registrant’s definitive Proxy Statement for its
2015
Annual Meeting of Stockholders to be held on May 14,
2015
, which will be filed within 120 days of the end of our fiscal year ended
December 31, 2014
(the “
2015
Proxy Statement”) and is incorporated herein by reference.
Ambac has a Code of Business Conduct which promotes management’s control philosophy and expresses the values which govern employee behavior and help maintain Ambac’s commitment to the highest standards of conduct. This code can be found on Ambac’s website at
www.ambac.com
on the “Investor Relations” page under “Corporate Governance.” Ambac will disclose on its website any amendment to, or waiver from, a provision of its Code of Business Conduct that applies to its Chief Executive Officer, Chief Financial Officer or Chief Accounting Officer. Ambac’s corporate governance guidelines and the charters for the committees of the Board of Directors are also available on our website under the “Corporate Governance” page.
Information relating to the Registrant’s executive officer and director compensation will be in the
2015
Proxy Statement and is incorporated herein by reference.
Information relating to security ownership of certain beneficial owners of the Registrant’s common stock and information relating to the security ownership of the Registrant’s management will be in the
2015
Proxy Statement and is incorporated herein by reference.
Equity Compensation Plan Information
The following table provides information as of
December 31, 2014
regarding securities issued under our 2013 Incentive Compensation Plan.
|
Plan
Category
|
Number of Securities
to be Issued
Upon
Exercise of
Outstanding Options,
Warrants and Rights
|
Weighted-Average
Exercise Price of
Outstanding
Options,
Warrants and Rights
|
Number of Securities
Remaining Available
for Future Issuance
Under Equity
Compensation Plans
(Excluding Securities
Reflected in the
Second Column)
|
|||||
|
Equity compensation plans approved by security holders
|
2013 Incentive
Compensation
Plan
(1)
|
323,307
(2)
|
$25.92
(3)
|
3,676,693
|
||||
|
Equity compensation plans not approved by security holders
|
None
|
---
|
---
|
---
|
||||
|
Total
|
323,307
(2)
|
$25.92
(3)
|
3,676,693
|
|||||
|
(1)
|
Our 2013 Incentive Compensation Plan was approved by the stockholders of Ambac on December 18, 2013. The total number of shares of Ambac common stock available for issuance under the 2013 Incentive Compensation Plan is 4,000,000.
|
|
(2)
|
Represents, as of
December 31, 2014
, the number of
outstanding restricted stock unit awards, stock options and the maximum number of performance stock units that may be issued if certain performance goals are achieved. Refer to
|
|
(3)
|
Each restricted stock unit, stock option and performance stock units awarded under our 2013 Incentive Compensation Plan was granted at no cost to the persons receiving them. Restricted stock units represent the contingent right to receive the equivalent number of shares of Ambac common stock. Stock options represent the right to acquire an equivalent number of shares of Ambac common stock at a specified exercise price. Performance stock units represent the contingent right to receive a number of shares of Ambac common stock ranging from 0% to 200% of the number of units granted depending upon the achievement of certain company-wide performance goals.
|
Information relating to the Registrant with respect to certain relationships and related transactions and director independence will be in the
2015
Proxy Statement and is incorporated herein by reference.
Information relating to principal accountant fees and services will be in the
2015
Proxy Statement and is incorporated herein by reference.
167
|
(a)
|
Documents filed as a part of this report:
|
|
1.
|
Financial Statements
|
The consolidated financial statements included in Part II, Item 8 above are filed as part of this Annual Report on Form 10-K.
|
2.
|
Financial Statement Schedules
|
The financial statement schedules filed herein, which are the only schedules required to be filed, are as follows:
168
|
Exhibit
Number |
Description
|
|
|
3.1
|
Amended and Restated Certificate of Incorporation of Ambac Financial Group, Inc. (incorporated by reference to Exhibit 3.1 to Form 8-A, filed on May 1, 2013).
|
|
|
3.2
|
Amended By-laws of Ambac Financial Group, Inc. (filed as Exhibit 3.2 to Ambac Financial Group, Inc.’s Annual Report on Form 10-K for the year ended December 31, 2013 and incorporated herein by reference).
|
|
|
4.1
|
Specimen form of common stock certificate (incorporated by reference to Exhibit 4.1 to Form 8-A, filed on May 1, 2013).
|
|
|
4.2
|
Warrant Agreement between Ambac Financial Group, Inc. and Computershare Inc. (incorporated by reference to Exhibit 4.2 to Form 8-A, filed on May 1, 2013).
|
|
|
4.3
|
Specimen form of warrant certificate (included in Exhibit 4.2).
|
|
|
4.4
|
Junior Note Fiscal Agency Agreement, dated as of April 30, 2013, by and between the Segregated Account of Ambac Assurance Corporation and The Bank of New York Mellon, as fiscal agent (filed as Exhibit 4.5 to Ambac Financial Group, Inc.’s Annual Report on Form 10-K for the year ended December 31, 2013 and incorporated herein by reference).
|
|
|
4.5
|
5.1% Junior Surplus Note due June 7, 2020 in the aggregate amount of $350 million issued by the Segregated Account of Ambac Assurance Corporation pursuant to the Junior Note Fiscal Agency Agreement, dated as of April 30, 2013 (filed as Exhibit 4.6 to Ambac Financial Group, Inc.’s Annual Report on Form 10-K for the year ended December 31, 2013 and incorporated herein by reference).
|
|
|
4.6
|
Form of 5.1% Non-Reducing Junior Surplus Note due June 7, 2020 issued by the Segregated Account of Ambac Assurance Corporation (filed as Exhibit 4.7 to Ambac Financial Group, Inc.’s Annual Report on Form 10-K for the year ended December 31, 2013 and incorporated herein by reference).
|
|
|
4.7
|
Form of 5.1% Bankruptcy Reducing Junior Surplus Note due June 7, 2020 issued by the Segregated Account of Ambac Assurance Corporation (filed as Exhibit 4.8 to Ambac Financial Group, Inc.’s Annual Report on Form 10-K for the year ended December 31, 2013 and incorporated herein by reference).
|
|
|
4.8
|
Form of 5.1% Reducing Junior Surplus Note due June 7, 2020, issued by the Segregated Account of Ambac Assurance Corporation (filed as Exhibit 4.9 to Ambac Financial Group, Inc.’s Annual Report on Form 10-K for the year ended December 31, 2013 and incorporated herein by reference).
|
|
|
4.9
|
Fiscal Agency Agreement, dated as of July 19, 2010, by and between the Segregated Account of Ambac Assurance Corporation and The Bank of New York Mellon, as fiscal agent (filed as Exhibit 4.10 to Ambac Financial Group, Inc.’s Annual Report on Form 10-K for the year ended December 31, 2013 and incorporated herein by reference).
|
|
|
4.10
|
Form of Surplus Note due June 7, 2020 issued by the Segregated Account of Ambac Assurance Corporation.(included in Exhibit 4.9).
|
|
|
4.11
|
Fiscal Agency Agreement, dated as of June 7, 2010, by and between Ambac Assurance Corporation and The Bank of New York Mellon, as fiscal agent (filed as Exhibit 10.2 to Ambac Financial Group, Inc.’s Current Report on Form 8-K filed June 8, 2010 and incorporated herein by reference).
|
|
|
10.1
|
Amended and Restated Trust Agreement dated as of August 28, 2014, among Ambac Financial Group, Inc., The Bank of New York Mellon, and Wilmington Trust, National Association (filed as exhibit 99.2 to Ambac Financial Group, Inc.’s Current Report on Form 8-K filed August 28, 2014 and incorporated herein by reference).
|
|
|
10.2
|
Long-Term Incentive Compensation Agreement dated as of May 9, 2014 between Ambac Financial Group, Inc. and Diana N. Adams (filed as Exhibit 10.2 to Ambac Financial Group, Inc.'s Quarterly Report on Form 10-Q for the quarter ended June 30, 2014 and incorporated herein by reference).
|
|
|
10.3
|
Long-Term Incentive Compensation Agreement dated as of May 9, 2014 between Ambac Financial Group, Inc. and David Trick (filed as Exhibit 10.3 to Ambac Financial Group Inc.'s Quarterly Report on Form 10-Q for the quarter ended June 30, 2014 and incorporated herein by reference).
|
|
|
10.4
|
Long-Term Incentive Compensation Agreement dated as of May 9, 2014 between Ambac Financial Group, Inc. and Robert B. Eisman (filed as Exhibit 10.4 to Ambac Financial Group, Inc.'s Quarterly Report on Form 10-Q for the quarter ended June 30, 2014 and incorporated herein by reference).
|
|
|
10.5
|
Ambac Financial Group, Inc.'s Long-Term Incentive Compensation Plan (filed as Exhibit 10.1 to Ambac Financial Group, Inc.'s Quarterly Report on Form 10-Q for the quarter ended June 30, 2014 and incorporated herein by reference).
|
|
|
10.6
|
Ambac Financial, Group, Inc.’s Incentive Compensation Plan (incorporated by reference to Appendix A to Ambac Financial Group’s 2013 Definitive Proxy Statement on Schedule 14A filed on November 8, 2013).
|
|
|
10.7
|
Form of Amended and Restated Restricted Stock Unit Award Letter for executive officers (filed as Exhibit 10.4 to Ambac Financial Group, Inc.’s Annual Report on Form 10-K for the year ended December 31, 2013 and incorporated herein by reference).
|
|
|
10.8
|
Form of Equity Award Letter for directors (filed as Exhibit 10.5 to Ambac Financial Group, Inc.’s Annual Report on Form 10-K for the year ended December 31, 2013 and incorporated herein by reference).
|
|
|
10.9
|
Closing Agreement between Ambac Financial, Group, Inc. and Commissioner of Internal Revenue, dated April 30, 2013 (filed as Exhibit 10.2 to Ambac Financial Group, Inc.’s Current Report on Form 8-K, filed on May 3, 2013 and incorporated herein by reference).
|
|
|
10.10
|
Amendment No. 1, dated April 29 2013, to the Amended and Restated Tax Sharing Agreement among Ambac Financial Group, Inc. and certain of its affiliates (filed as Exhibit 10.1 to Ambac Financial Group, Inc.’s Current Report on Form 8-K, filed on May 3, 2013 and incorporated herein by reference).
|
|
169
|
Exhibit
Number |
Description
|
|
|
10.11
|
Tax Sharing Agreement dated March 14, 2012 among Ambac Financial Group, Inc. and certain of its affiliates (filed as Exhibit 10.12 to Ambac Financial Group, Inc.’s Annual Report on Form 10-K for the year ended December 31, 2013 and incorporated herein by reference).
|
|
|
10.12
|
Form of Amendment No. 1 to Cooperation Agreement between the Segregated Account of Ambac Assurance Corporation and Ambac Assurance Corporation (filed as Exhibit 10.3 to Ambac Financial Group, Inc.’s Current Report on Form 8-K filed September 27, 2011 and incorporated herein by reference).
|
|
|
10.13
|
Form of Expense Sharing and Cost Allocation Agreement among Ambac Assurance Corporation, Ambac Financial Group, Inc. and their respective subsidiaries and affiliates (filed as Exhibit 10.2 to Ambac Financial Group, Inc.’s Current Report on Form 8-K filed September 27, 2011 and incorporated herein by reference).
|
|
|
10.14
|
Mediation Agreement dated September 21, 2011 among Ambac Financial Group, Inc., Ambac Assurance Corporation, the statutory committee of creditors appointed by the United States Trustee on November 17, 2010, the Segregated Account of Ambac Assurance Corporation, the Rehabilitator of the Segregated Account, and OCI (filed as Exhibit 10.1 to Ambac Financial Group, Inc.’s Current Report on Form 8-K filed September 27, 2011 and incorporated herein by reference).
|
|
|
10.15
|
Lease, dated as of March 1, 2011, by and between One State Street, LLC and Ambac Assurance Corporation (filed as Exhibit 10.34 to Ambac Financial Group, Inc.’s Annual Report on Form 10-K for the year ended December 31, 2010 and incorporated herein by reference).
|
|
|
10.16
|
Settlement, Discontinuance and Release Agreement, dated as of March 1, 2011, by and among One State Street, LLC, Ambac Financial Group, Inc., Ambac Assurance Corporation and the Segregated Account of Ambac Assurance Corporation (filed as Exhibit 10.33 to Ambac Financial Group, Inc.’s Annual Report on Form 10-K for the year ended December 31, 2010 and incorporated herein by reference).
|
|
|
10.17
|
Settlement Agreement, dated as of June 7, 2010, by and among Ambac Assurance Corporation, Ambac Credit Products LLC, Ambac Financial Group, Inc. and the parties listed on Schedule A thereto (filed as Exhibit 10.1 to Ambac Financial Group, Inc.’s Quarterly Report on Form 10-Q for the quarter ended September 30, 2010 and incorporated herein by reference).
|
|
|
10.18
|
Ambac Financial Group, Inc. Severance Pay Plan (Applicable to termination on or after January 1, 2010) (filed as Exhibit 10.26 to Ambac Financial Group, Inc.’s Quarterly Report on Form 10-Q for the quarter ended March 31, 2010 and incorporated herein by reference).
|
|
|
10.119
|
Management Services Agreement, dated as of March 24, 2010, by and between the Segregated Account of Ambac Assurance Corporation and Ambac Assurance Corporation (filed as Exhibit 10.22 to Ambac Financial Group, Inc.’s Annual Report on Form 10-K for the year ended December 31, 2010 and incorporated herein by reference).
|
|
|
10.120
|
Cooperation Agreement, dated as of March 24, 2010, by and between the Segregated Account of Ambac Assurance Corporation and Ambac Assurance Corporation (filed as Exhibit 10.23 to Ambac Financial Group, Inc.’s Annual Report on Form 10-K for the year ended December 31, 2010 and incorporated herein by reference).
|
|
|
10.221
|
Aggregate Excess of Loss Reinsurance Agreement, dated as of March 24, 2010, by and between the Segregated Account of Ambac Assurance Corporation and Ambac Assurance Corporation (filed as Exhibit 10.24 to Ambac Financial Group, Inc.’s Annual Report on Form 10-K for the year ended December 31, 2010 and incorporated herein by reference).
|
|
|
10.22
|
Secured Note, dated as of March 24, 2010, from Ambac Assurance Corporation to the Segregated Account of Ambac Assurance Corporation (filed as Exhibit 10.25 to Ambac Financial Group, Inc.’s Annual Report on Form 10-K for the year ended December 31, 2010 and incorporated herein by reference).
|
|
|
10.23
|
Separation Agreement dated as of December 23, 2014, by and among Ambac Financial Group, Inc., Ambac Assurance Corporation and Diana Adams
(filed as Exhibit 10.1 to Ambac Financial Group, Inc.’s Current Report on Form 8-K filed December 23, 2014 and incorporated herein by reference).
|
|
|
12.1+
|
Computation of Ratio of Earnings to Fixed Charges
|
|
|
21.1+
|
List of Subsidiaries of Ambac Financial Group, Inc.
|
|
|
24.1+
|
Power of Attorney for directors of Ambac Financial Group, Inc.
|
|
|
31.1+
|
Certification of Chief Executive Officer Pursuant to Rules 13a-14(a) and 15d-14(a) Promulgated under the Securities Exchange Act of 1934, as amended.
|
|
|
31.2+
|
Certification of Chief Financial Officer Pursuant to Rules 13a-14(a) and 15d-14(a) Promulgated under the Securities Exchange Act of 1934, as amended.
|
|
|
32.1++
|
Certification of Chief Executive Officer Pursuant to 18 U.S.C. Section 1350 as Adopted Pursuant to Section 906 of the Sarbanes-Oxley Act of 2002.
|
|
|
32.2++
|
Certification of Chief Financial Officer Pursuant to 18 U.S.C. Section 1350 as Adopted Pursuant to Section 906 of the Sarbanes-Oxley Act of 2002.
|
|
|
99.1
|
Amendment dated as June 12, 2014 to the Plan of Rehabilitation of the Segregated Account of Ambac Assurance Corporation (filed as Exhibit 99.1 to Ambac Financial Group, Inc.'s Quarterly Report on Form 10-Q for the quarter ended September 30, 2014 and incorporated herein by reference.)
|
|
|
99.2
|
Second Modified Fifth Amended Plan of Reorganization of Ambac Financial Group, Inc., effective as of May 1, 2013.
|
|
|
99.3
|
Plan of Rehabilitation of the Segregated Account of Ambac Assurance Corporation. (Filed as Exhibit 99.2 to Ambac Financial Group, Inc.’s Annual Report on Form 10-K for the year ended December 31, 2010 and incorporated herein by reference.)
|
|
|
99.4
|
Plan of Operation of the Segregated Account of Ambac Assurance Corporation (Filed as Exhibit 99.1 to Ambac Financial Group, Inc.’s Quarterly Report on Form 10-Q for the quarter ended June 30, 2010 and incorporated herein by reference.)
|
|
170
|
Exhibit
Number |
Description
|
|
|
101.INS
|
XBRL Instance Document.
|
|
|
101.SCH
|
XBRL Taxonomy Extension Schema Document.
|
|
|
101.CAL
|
XBRL Taxonomy Extension Calculation Linkbase Document.
|
|
|
101.LAB
|
XBRL Taxonomy Extension Label Linkbase Document.
|
|
|
101.PRE
|
XBRL Taxonomy Extension Presentation Linkbase Document.
|
|
|
101.DEF
|
XBRL Taxonomy Extension Definition Linkbase Document.
|
|
|
+
|
Filed herewith.
|
|
|
++
|
Furnished herewith.
|
|
171
AMBAC FINANCIAL GROUP, INC. AND SUBSIDIARIES
SCHEDULE I — SUMMARY OF INVESTMENTS
Other Than Investments in Related Parties
December 31, 2014
|
Type of Investment
($ in Thousands)
|
Amortized
Cost
|
Estimated
Fair Value
|
Amount at Which
Shown in the
Balance Sheet
|
||||||||
|
U.S. government obligations
|
$
|
106,706
|
|
$
|
107,246
|
|
$
|
107,246
|
|
||
|
U.S. agency obligations
|
29,524
|
|
29,486
|
|
29,486
|
|
|||||
|
Municipal obligations
|
523,019
|
|
525,792
|
|
525,792
|
|
|||||
|
Residential mortgage-backed securities
|
1,557,059
|
|
1,710,955
|
|
1,710,955
|
|
|||||
|
Collateralized debt obligations
|
21,346
|
|
21,122
|
|
21,122
|
|
|||||
|
Other asset-backed securities
|
833,366
|
|
882,001
|
|
882,001
|
|
|||||
|
Corporate obligations
|
1,382,195
|
|
1,385,594
|
|
1,385,594
|
|
|||||
|
Foreign obligations
|
126,041
|
|
127,757
|
|
127,757
|
|
|||||
|
Short-term
|
360,069
|
|
360,065
|
|
360,065
|
|
|||||
|
Other
|
357,016
|
|
357,016
|
|
357,016
|
|
|||||
|
Total
|
$
|
5,296,341
|
|
$
|
5,507,034
|
|
$
|
5,507,034
|
|
||
172
AMBAC FINANCIAL GROUP, INC. AND SUBSIDIARIES
SCHEDULE II— CONDENSED FINANCIAL INFORMATION
OF REGISTRANT
(PARENT COMPANY ONLY)
Condensed Balance Sheets
|
December 31,
|
|||||||
|
($ in Thousands, except share data)
|
2014
|
2013
|
|||||
|
Assets:
|
|||||||
|
Fixed income securities, at fair value (amortized cost of $234,029 in 2014 and $28,149 in 2013)
|
$
|
234,310
|
|
$
|
28,145
|
|
|
|
Junior surplus note of Ambac Assurance Segregated Account
|
—
|
|
177,194
|
|
|||
|
Short-term investments, at cost (approximates fair value)
|
22,936
|
|
8,319
|
|
|||
|
Other investments
|
21,003
|
|
—
|
|
|||
|
Total investments
|
278,249
|
|
213,658
|
|
|||
|
Cash
|
141
|
|
43
|
|
|||
|
Investment in subsidiaries
|
1,116,044
|
|
473,215
|
|
|||
|
Investment income due and accrued
|
54
|
|
11,959
|
|
|||
|
Other assets
|
5,770
|
|
4,936
|
|
|||
|
Total assets
|
$
|
1,400,258
|
|
$
|
703,811
|
|
|
|
Liabilities and Stockholders' Equity:
|
|||||||
|
Liabilities:
|
|||||||
|
Current taxes
|
221
|
|
—
|
|
|||
|
Accounts payable and other liabilities
|
932
|
|
828
|
|
|||
|
Total liabilities
|
1,153
|
|
828
|
|
|||
|
Stockholders’ equity:
|
|||||||
|
Preferred stock, par value $0.01 per share; authorized shares—20,000,000; issued and outstanding shares—none
|
—
|
|
—
|
|
|||
|
Common stock, par value $0.01 per share; authorized shares—130,000,000; issued and outstanding shares—45,005,932 at December 31, 2014 and 45,003,461 at December 31, 2013
|
450
|
|
450
|
|
|||
|
Additional paid-in capital
|
189,138
|
|
185,672
|
|
|||
|
Accumulated other comprehensive income
|
220,283
|
|
11,661
|
|
|||
|
Retained earnings
|
989,290
|
|
505,219
|
|
|||
|
Common stock held in treasury at cost, 2,459 shares at December 31, 2014 and 937 shares at December 31, 2013
|
(56
|
)
|
(19
|
)
|
|||
|
Total Ambac Financial Group, Inc. stockholders’ equity
|
1,399,105
|
|
702,983
|
|
|||
|
Total liabilities and stockholders’ equity
|
$
|
1,400,258
|
|
$
|
703,811
|
|
|
The condensed financial statements should be read in conjunction with the consolidated financial statements and notes thereto and the accompanying notes.
173
AMBAC FINANCIAL GROUP, INC. AND SUBSIDIARIES
SCHEDULE II— CONDENSED FINANCIAL INFORMATION
OF REGISTRANT
(PARENT COMPANY ONLY)
Condensed Statement of Comprehensive Income (Loss)
|
Successor Ambac
|
Predecessor Ambac
|
|||||||||||||||
|
Period from May 1
|
Period from January 1
|
|||||||||||||||
|
Year Ended
|
through
|
through
|
Year Ended
|
|||||||||||||
|
($ in Thousands)
|
December 31, 2014
|
December 31, 2013
|
April 30, 2013
|
December 31, 2012
|
||||||||||||
|
Revenues:
|
||||||||||||||||
|
Investment income
|
$
|
25,147
|
|
$
|
22,227
|
|
$
|
39
|
|
$
|
221
|
|
||||
|
Other income
|
—
|
|
197,122
|
|
—
|
|
758
|
|
||||||||
|
Net realized gains (losses)
|
(46
|
)
|
2
|
|
—
|
|
—
|
|
||||||||
|
Total revenues
|
25,101
|
|
219,351
|
|
39
|
|
979
|
|
||||||||
|
Expenses:
|
||||||||||||||||
|
Operating expenses
|
6,458
|
|
3,018
|
|
539
|
|
(151
|
)
|
||||||||
|
Total expenses
|
6,458
|
|
3,018
|
|
539
|
|
(151
|
)
|
||||||||
|
Income (loss) before income taxes, reorganization costs and equity in undistributed net loss of subsidiaries
|
18,643
|
|
216,333
|
|
(500
|
)
|
1,130
|
|
||||||||
|
Reorganization items
|
211
|
|
493
|
|
(2,745,180
|
)
|
7,215
|
|
||||||||
|
Income (loss) before income taxes and equity in undistributed net loss of subsidiaries
|
18,432
|
|
215,840
|
|
2,744,680
|
|
(6,085
|
)
|
||||||||
|
Federal income tax benefit
|
221
|
|
—
|
|
(703
|
)
|
(136
|
)
|
||||||||
|
Income (loss) before equity in undistributed net income (loss) of subsidiaries
|
18,211
|
|
215,840
|
|
2,745,383
|
|
(5,949
|
)
|
||||||||
|
Equity in undistributed net income (loss) of subsidiaries
|
465,860
|
|
289,379
|
|
603,666
|
|
(250,729
|
)
|
||||||||
|
Net income (loss)
|
$
|
484,071
|
|
$
|
505,219
|
|
$
|
3,349,049
|
|
$
|
(256,678
|
)
|
||||
|
Other comprehensive income, after tax:
|
||||||||||||||||
|
Net income (loss)
|
$
|
484,071
|
|
$
|
505,219
|
|
$
|
3,349,049
|
|
$
|
(256,678
|
)
|
||||
|
Unrealized gains (losses) on securities, net of deferred income taxes of $0
|
252,603
|
|
(41,910
|
)
|
175,347
|
|
166,252
|
|
||||||||
|
Gain (loss) gain on foreign currency translation, net of deferred income taxes of $0.
|
(43,165
|
)
|
42,724
|
|
(657
|
)
|
(334
|
)
|
||||||||
|
Changes to postretirement benefit, net of tax
|
(816
|
)
|
10,847
|
|
185
|
|
(3,792
|
)
|
||||||||
|
Total other comprehensive income
|
208,622
|
|
11,661
|
|
174,875
|
|
162,126
|
|
||||||||
|
Total comprehensive income (loss) attributable to Ambac Financial Group, Inc.
|
$
|
692,693
|
|
$
|
516,880
|
|
$
|
3,523,924
|
|
$
|
(94,552
|
)
|
||||
The condensed financial statements should be read in conjunction with the consolidated financial statements and notes thereto and the accompanying notes.
174
AMBAC FINANCIAL GROUP, INC. AND SUBSIDIARIES
SCHEDULE II— CONDENSED FINANCIAL INFORMATION
OF REGISTRANT
(PARENT COMPANY ONLY)
Condensed Statement of Stockholders' Equity
|
($ in Thousands)
|
Total
|
Retained
Earnings
|
Accumulated
Other
Comprehensive
Income
|
Preferred
Stock
|
Common
Stock
|
Additional Paid-in
Capital
|
Common
Stock Held
in Treasury,
at Cost
|
||||||||||||||||||||
|
Successor Ambac
|
|||||||||||||||||||||||||||
|
Balance at January 1, 2014
|
$
|
702,983
|
|
$
|
505,219
|
|
$
|
11,661
|
|
$
|
—
|
|
$
|
450
|
|
$
|
185,672
|
|
$
|
(19
|
)
|
||||||
|
Total comprehensive income
|
692,693
|
|
484,071
|
|
208,622
|
|
—
|
|
—
|
|
—
|
|
—
|
|
|||||||||||||
|
Stock based compensation
|
3,450
|
|
—
|
|
—
|
|
—
|
|
—
|
|
3,450
|
|
—
|
|
|||||||||||||
|
Shares issued under equity plan
|
(37
|
)
|
—
|
|
—
|
|
—
|
|
—
|
|
—
|
|
(37
|
)
|
|||||||||||||
|
Warrants exercised
|
16
|
|
—
|
|
—
|
|
—
|
|
—
|
|
16
|
|
—
|
|
|||||||||||||
|
Balance at December 31, 2014
|
$
|
1,399,105
|
|
$
|
989,290
|
|
$
|
220,283
|
|
$
|
—
|
|
$
|
450
|
|
$
|
189,138
|
|
$
|
(56
|
)
|
||||||
|
Successor Ambac
|
|||||||||||||||||||||||||||
|
Balance at May 1, 2013
|
$
|
—
|
|
$
|
—
|
|
$
|
—
|
|
$
|
—
|
|
$
|
—
|
|
$
|
—
|
|
$
|
—
|
|
||||||
|
Issuance of new equity in connection with emergence from Chapter 11
|
185,000
|
|
—
|
|
—
|
|
—
|
|
450
|
|
184,550
|
|
—
|
|
|||||||||||||
|
Balance at May 1, 2013
|
185,000
|
|
—
|
|
—
|
|
—
|
|
450
|
|
184,550
|
|
—
|
|
|||||||||||||
|
Total comprehensive income
|
516,880
|
|
505,219
|
|
11,661
|
|
—
|
|
—
|
|
—
|
|
—
|
|
|||||||||||||
|
Stock based compensation
|
1,106
|
|
—
|
|
—
|
|
—
|
|
—
|
|
1,106
|
|
—
|
|
|||||||||||||
|
Cost of shares acquired
|
(19
|
)
|
—
|
|
—
|
|
—
|
|
—
|
|
—
|
|
(19
|
)
|
|||||||||||||
|
Warrants exercised
|
16
|
|
—
|
|
—
|
|
—
|
|
—
|
|
16
|
|
—
|
|
|||||||||||||
|
Balance at December 31, 2013
|
$
|
702,983
|
|
$
|
505,219
|
|
$
|
11,661
|
|
$
|
—
|
|
$
|
450
|
|
$
|
185,672
|
|
$
|
(19
|
)
|
||||||
|
Predecessor Ambac
|
|||||||||||||||||||||||||||
|
Balance at January 1, 2013
|
$
|
(3,907,527
|
)
|
$
|
(6,297,264
|
)
|
$
|
625,385
|
|
$
|
—
|
|
$
|
3,080
|
|
$
|
2,172,027
|
|
$
|
(410,755
|
)
|
||||||
|
Total comprehensive income
|
3,523,924
|
|
3,349,049
|
|
174,875
|
|
—
|
|
—
|
|
—
|
|
—
|
|
|||||||||||||
|
Stock-based compensation
|
(60
|
)
|
(60
|
)
|
—
|
|
—
|
|
—
|
|
—
|
|
—
|
|
|||||||||||||
|
Shares issued under equity plans
|
60
|
|
—
|
|
—
|
|
—
|
|
—
|
|
—
|
|
60
|
|
|||||||||||||
|
Elimination of Predecessor Ambac Shareholder equity accounts
|
383,603
|
|
2,948,275
|
|
(800,260
|
)
|
—
|
|
(3,080
|
)
|
(2,172,027
|
)
|
410,695
|
|
|||||||||||||
|
Balance at April 30, 2013
|
$
|
—
|
|
$
|
—
|
|
$
|
—
|
|
$
|
—
|
|
$
|
—
|
|
$
|
—
|
|
$
|
—
|
|
||||||
|
Predecessor Ambac
|
|||||||||||||||||||||||||||
|
Balance at January 1, 2012
|
$
|
(3,812,975
|
)
|
$
|
(6,039,922
|
)
|
$
|
463,259
|
|
$
|
—
|
|
$
|
3,080
|
|
$
|
2,172,027
|
|
$
|
(411,419
|
)
|
||||||
|
Total comprehensive loss
|
(94,552
|
)
|
(256,678
|
)
|
162,126
|
|
—
|
|
—
|
|
—
|
|
—
|
|
|||||||||||||
|
Stock-based compensation
|
(664
|
)
|
(664
|
)
|
—
|
|
—
|
|
—
|
|
—
|
|
—
|
|
|||||||||||||
|
Shares issued under equity plans
|
664
|
|
—
|
|
—
|
|
—
|
|
—
|
|
—
|
|
664
|
|
|||||||||||||
|
Balance at December 31, 2012
|
$
|
(3,907,527
|
)
|
$
|
(6,297,264
|
)
|
$
|
625,385
|
|
$
|
—
|
|
$
|
3,080
|
|
$
|
2,172,027
|
|
$
|
(410,755
|
)
|
||||||
The condensed financial statements should be read in conjunction with the consolidated financial statements and notes thereto and the accompanying notes.
175
AMBAC FINANCIAL GROUP, INC. AND SUBSIDIARIES
SCHEDULE II— CONDENSED FINANCIAL INFORMATION
OF REGISTRANT
(PARENT COMPANY ONLY)
Condensed Statements of Cash Flow
|
Successor Ambac
|
Predecessor Ambac
|
|||||||||||||||
|
Period from May 1
|
Period from January 1
|
|||||||||||||||
|
Year Ended
|
through
|
through
|
Year Ended
|
|||||||||||||
|
($ in Thousands)
|
December 31, 2014
|
December 31, 2013
|
April 30, 2013
|
December 31, 2012
|
||||||||||||
|
Cash flows from operating activities:
|
||||||||||||||||
|
Net income (loss)
|
$
|
484,071
|
|
$
|
505,219
|
|
$
|
3,349,049
|
|
$
|
(256,678
|
)
|
||||
|
Adjustments to reconcile net income loss to net cash used in operating activities:
|
||||||||||||||||
|
Equity in undistributed net (income) loss of non-debtor subsidiaries
|
(465,860
|
)
|
(289,379
|
)
|
(603,666
|
)
|
250,729
|
|
||||||||
|
Reorganization items
|
211
|
|
493
|
|
(2,745,180
|
)
|
7,215
|
|
||||||||
|
Junior surplus notes received from Ambac Assurance Corporation Segregated Account
|
—
|
|
(167,020
|
)
|
—
|
|
—
|
|
||||||||
|
Net realized gains
|
46
|
|
(2
|
)
|
—
|
|
—
|
|
||||||||
|
Increase (decrease) in current income taxes payable
|
221
|
|
—
|
|
(1,900
|
)
|
—
|
|
||||||||
|
Share-based compensation
|
3,450
|
|
1,106
|
|
—
|
|
—
|
|
||||||||
|
Investment income due and accrued
|
11,905
|
|
(11,942
|
)
|
(6
|
)
|
9
|
|
||||||||
|
(Increase) decrease in other assets
|
(834
|
)
|
(1,677
|
)
|
3,182
|
|
21
|
|
||||||||
|
Other, net
|
(36,624
|
)
|
(28,030
|
)
|
(4,107
|
)
|
(6,334
|
)
|
||||||||
|
Net cash provided by (used in) operating activities
|
(3,414
|
)
|
8,768
|
|
(2,628
|
)
|
(5,038
|
)
|
||||||||
|
Cash flows from investing activities:
|
||||||||||||||||
|
Proceeds from matured bonds
|
65,032
|
|
14,355
|
|
—
|
|
—
|
|
||||||||
|
Purchases of bonds
|
(271,181
|
)
|
(42,506
|
)
|
—
|
|
—
|
|
||||||||
|
Change in short-term investments
|
(14,617
|
)
|
19,360
|
|
2,637
|
|
4,583
|
|
||||||||
|
Net cash (used in) provided by investing activities
|
(220,766
|
)
|
(8,791
|
)
|
2,637
|
|
4,583
|
|
||||||||
|
Cash flows from financing activities:
|
||||||||||||||||
|
Proceeds from the sale of Junior Surplus Notes of the Segregated Account
|
224,262
|
|
—
|
|
—
|
|
—
|
|
||||||||
|
Proceeds from warrant exercise
|
16
|
|
16
|
|
—
|
|
—
|
|
||||||||
|
Net cash provided by financing activities
|
224,278
|
|
16
|
|
—
|
|
—
|
|
||||||||
|
Net cash flow
|
98
|
|
(7
|
)
|
9
|
|
(455
|
)
|
||||||||
|
Cash at beginning of period
|
43
|
|
50
|
|
41
|
|
496
|
|
||||||||
|
Cash at end of period
|
$
|
141
|
|
$
|
43
|
|
$
|
50
|
|
$
|
41
|
|
||||
|
Supplemental disclosure of cash flow information:
|
||||||||||||||||
|
Cash paid during the period for:
|
||||||||||||||||
|
Income taxes
|
$
|
—
|
|
$
|
—
|
|
$
|
1,900
|
|
$
|
—
|
|
||||
|
Cash payments related to reorganization items:
|
||||||||||||||||
|
Professional fees paid for services rendered in connection with the Chapter 11 proceeding
|
$
|
272
|
|
$
|
15,546
|
|
$
|
3,860
|
|
$
|
9,141
|
|
||||
The condensed financial statements should be read in conjunction with the consolidated financial statements and notes thereto and the accompanying notes.
176
AMBAC FINANCIAL GROUP, INC. AND SUBSIDIARIES
SCHEDULE II— CONDENSED FINANCIAL INFORMATION
OF REGISTRANT
(PARENT COMPANY ONLY)
Notes to Condensed Financial Information
(Dollar Amounts in Thousands)
The condensed financial information of Ambac Financial Group, Inc. (“Ambac” or the “Company”) as of December 31, 2014 and 2013 and for the years ended
December 31, 2014
,
2013
and
2012
, should be read in conjunction with the consolidated financial statements of Ambac Financial Group, Inc. and Subsidiaries and the notes thereto. Investments in subsidiaries are accounted for using the equity method of accounting.
Ambac, headquartered in New York City, is a financial services holding company incorporated in the state of Delaware on
April 29, 1991
. On May 1, 2013 (the “Effective Date”), Ambac emerged from Chapter 11 bankruptcy protection when the Second Modified Fifth Amended Plan of Reorganization of Ambac Financial Group, Inc. (the “Reorganization Plan”) became effective. On December 26, 2013, the United States Bankruptcy Court for the Southern District of New York (the “Bankruptcy Court”) entered an order of final decree closing Ambac’s Chapter 11 case. Ambac filed a voluntary petition for relief under Chapter 11 of the United States Bankruptcy Code in the Bankruptcy Court on November 8, 2010 as a result of losses incurred since the beginning of the financial crisis in 2007.
Chapter 11 Reorganization of Ambac:
The Reorganization Plan reflects a resolution of certain issues (the “Amended Plan Settlement”) among the Company, the statutory committee of creditors appointed by the United States Trustee on November 17, 2010 (the “Creditors’ Committee”), Ambac Assurance, the Segregated Account and OCI related to (i) the net operating loss carry forwards (“NOLs”) of the consolidated tax group of which the Company is the parent and Ambac Assurance is a member, (ii) certain tax refunds received in respect thereof and (iii) the sharing of expenses between the Company and Ambac Assurance. The terms of the Amended Plan Settlement are memorialized in that certain Mediation Agreement dated September 21, 2011 (the “Mediation Agreement”) among such parties. In accordance with the Amended Plan Settlement, the Company shall use its best efforts to preserve the use of NOLs as contemplated by the Amended Plan Settlement.
Pursuant to the Amended Plan Settlement, (i) the Company, Ambac Assurance and certain affiliates entered into an amended and restated tax sharing agreement (the “Amended TSA”), (ii) the Company, Ambac Assurance and certain affiliates entered into an expense sharing and cost allocation agreement (the “Cost Allocation Agreement”) and (iii) the Company, Ambac Assurance, the Segregated Account and OCI entered into an amendment of the Cooperation Agreement (the “Cooperation Agreement Amendment”).
The Amended TSA amended and restated the existing tax sharing agreement among the Company and its affiliates. The Amended TSA addresses certain issues including, but not limited to, the allocation and use of NOLs by the Company, Ambac Assurance and their respective subsidiaries.
The Cost Allocation Agreement provides for the allocation of costs and expenses among the Company, Ambac Assurance and certain affiliates. Additionally, the Cost Allocation Agreement requires Ambac Assurance to reimburse reasonable operating expenses incurred by the Company, subject to an annual
$5,000
cap, which, during 2017, shall be reduced to a
$4,000
per year cap, only with the approval by the Rehabilitator.
The Cooperation Agreement Amendment provides for the Rehabilitator to have certain rights with respect to (a) the tax positions taken by the Company in its consolidated tax return; (b) the acceptance by Ambac Assurance of the repayment of intercompany loans or the modification of the terms thereof; (c) changes by Ambac Assurance in the assumptions or vendors utilized in determining loss reserves determined in accordance with Statutory Accounting Principles; and (d) changes to Ambac Assurance’s investment policy and transfer of the investment management function for Ambac Assurance’s investment portfolio.
As provided for in the Reorganization Plan, Ambac’s Amended and Restated Certificate of Incorporation and revised Bylaws became effective on the Effective Date. On February 28, 2014, Ambac’s Bylaws were amended, primarily to (i) revise the advance notice provisions for stockholders proposing business or nominating directors; (ii) add procedural and disclosure requirements for stockholders proposing business or nominating directors, calling special meetings or taking action by written consent; (iii) add a forum selection clause specifying state or federal courts located in the State of Delaware as the sole and exclusive forum for proceedings which, among other things, (A) are brought on behalf of Ambac, (B)claim breaches of fiduciary duty, (C) involve claims arising under Ambac’s governing documents or the Delaware General Corporation Law, or (D) are governed by the internal affairs doctrine; and (iv) update other bylaw provisions, including revisions related to the use of electronic communication technologies. Pursuant to the Amended and Restated Certificate of Incorporation of Ambac, Ambac is authorized to issue
150,000,000
shares of capital stock, consisting of
130,000,000
shares of common stock, par value
$0.01
per share and
20,000,000
shares of preferred stock, par value
$0.01
per share. Pursuant to the Reorganization Plan, Ambac distributed
45,000,000
shares of new common stock on May 1, 2013. Under the Reorganization Plan, Ambac also distributed warrants to holders of allowed general unsecured claims and subordinated debt securities, which as of the Effective Date entitled such holders to acquire an additional
5,047,138
shares of new common stock of the Company at an exercise price of
$16.67
per share at any time on or prior to April 30, 2023. Through
December 31, 2014
,
7,261
warrants were exercised, resulting in an issuance of
3,473
shares of common stock. The new common stock and warrants are listed on NASDAQ and trade under the symbols “AMBC” and “AMBCW,” respectively. All such common stock and warrants were issued without registration under the Securities Act of 1933, as amended or state securities laws, in reliance on Section 1145 of the United States Bankruptcy Code. The common stock of the Company in existence prior to the Effective Date was cancelled on the Effective Date and the holders of such stock did not receive, and will not receive, any distributions under the Reorganization Plan.
177
Pursuant to the Mediation Agreement, Ambac Assurance transferred
$30,000
(plus accrued interest) from an escrow account to Ambac on the Effective Date. Additionally, the Segregated Account issued a junior surplus note in the amount of
$350,000
(recorded at the fair value of
$167,020
) to Ambac on the Effective Date in accordance with the Mediation Agreement. Ambac recorded such amounts received as Other income in the Condensed Statements of Total Comprehensive Income (Loss). On August 28, 2014, Ambac deposited this junior surplus note plus accrued but unpaid interest thereon, into a newly formed Trust in exchange for cash of
$224,262
and a subordinated owner trust certificate (the "Owner Trust Certificate") issued by the Trust in the face amount of
$74,794
. The Trust funded the cash portion of its purchase of the junior surplus note with proceeds of the private placement of
$299,175
face amount of notes to third party investors ("Notes"), which amount equates to approximately
80%
of par plus accrued and unpaid interest on the junior surplus note. The Notes have a final maturity of
August 28, 2039
. Interest on the Notes will accrue at
5.1%
per annum and compound annually on June 7th of each year up to and including the maturity date. Payments on the Notes will be made when and to the extent that the Segregated Account makes payments on the junior surplus note. The Notes must be paid in full before any payments will be made on the Owner Trust Certificate. The Notes and Owner Trust Certificate are non-recourse to Ambac, Ambac Assurance and the Segregated Account, but are collateralized by the junior surplus note. Ambac records the Owner Trust Certificate as an equity investment and will reflect the activities of the non-consolidated Trust within Net investment income on the Consolidated Statements of Total Comprehensive Income (Loss).
Ambac’s Amended and Restated Certificate of Incorporation limits voting and transfer rights of stockholders in significant ways. Article IV contains voting restrictions applicable to any person owning at least
10%
of Ambac’s common stock so that such person (including any group consisting of such person and any other person with whom such person or any affiliate or associate of such person has any agreement, contract, arrangement or understanding with respect to acquiring, voting, holding or disposing of Ambac’s common stock) shall not be entitled to cast votes in excess of one vote less than
10%
of the votes entitled to be cast by all common stock holders, except as otherwise approved by OCI.
There are substantial restrictions on the ability to transfer Ambac’s common stock set forth in Article XII of Ambac’s Amended and Restated Certificate of Incorporation. In order to preserve certain tax benefits, subject to limited exceptions, any attempted transfer of common stock shall be prohibited and void to the extent that, as a result of such transfer (or any series of transfers of which such transfer is a part), either (i) any person or group of persons shall become a holder of
5.0%
or more of the Company’s common stock or (ii) the percentage stock ownership interest in Ambac of any holder of
5.0%
or more of the Company’s common stock shall be increased (a “Prohibited Transfer”). These restrictions shall not apply to an attempted transfer if the transferor or the transferee obtains the written approval of Ambac’s Board of Directors to such transfer. A purported transferee of a Prohibited Transfer shall not be recognized as a stockholder of Ambac for any purpose whatsoever in respect of the securities which are the subject of the Prohibited Transfer (the “Excess Securities”). Until the Excess Securities are acquired by another person in a transfer that is not a Prohibited Transfer, the purported transferee of a Prohibited Transfer shall not be entitled with respect to such Excess Securities to any rights of stockholders of Ambac, including, without limitation, the right to vote such Excess Securities and to receive dividends or distributions, whether liquidating or otherwise, in respect thereof, if any. Once the Excess Securities have been acquired in a transfer that is not a Prohibited Transfer, the securities shall cease to be Excess Securities. If the Board determines that a transfer of securities constitutes a Prohibited Transfer then, upon written demand by Ambac, the purported transferee shall transfer or cause to be transferred any certificate or other evidence of ownership of the Excess Securities within the purported transferee’s possession or control, together with any distributions paid by Ambac with respect to such Excess Securities, to an agent designated by Ambac. Such agent shall thereafter sell such Excess Securities and the proceeds of such sale shall be distributed as set forth in the Amended and Restated Certificate of Incorporation. If the purported transferee of a Prohibited Transfer has resold the Excess Securities before receiving such demand, such person shall be deemed to have sold the Excess Securities for Ambac’s agent and shall be required to transfer to such agent the proceeds of such sale, which shall be distributed as set forth in the Amended and Restated Certificate of Incorporation.
As of the Effective Date, the Company was generally discharged and released from all pre-Effective Date debts, liabilities, claims, causes of action and interests in accordance with the provisions of the Reorganization Plan. Holders of claims and equity interests are also generally barred from commencing or continuing any action or proceeding relating to such claims, causes of action or interests. The Reorganization Plan also provides for broad exculpation and releases of the Company, Ambac Assurance, the Segregated Account, OCI, the Rehabilitator, the board of directors and board committees of the Company and Ambac Assurance, all individual directors, officers and employees of the Company and Ambac Assurance, the Creditors’ Committee and the individual members thereof, and each of the respective representatives of such parties, for actions or omissions that occurred on or prior to the Effective Date.
Reorganization:
Entities operating in bankruptcy and expecting to reorganize under Chapter 11 of the Bankruptcy Code are subject to the additional accounting and financial reporting guidance under the Reorganization Topic of the Accounting Standards Codification (the “ASC”). While the Reorganization Topic of the ASC provides specific guidance for certain matters, other portions of US GAAP continue to apply so long as the guidance does not conflict with the Reorganization Topic of the ASC. This accounting literature provides guidance for periods subsequent to a Chapter 11 filing, among other things, the presentation of liabilities that are and are not subject to compromise by the Bankruptcy Court proceedings, as well as the treatment of interest expense and presentation of costs associated with the proceedings. For the purpose of presenting an entity’s financial condition, the financial statements for periods including and after filing the Chapter 11 petition shall distinguish transactions and events that are directly associated with the reorganization from the ongoing operations of the business.
Under the Reorganization Topic of the ASC, the Company determined that fresh start financial statement reporting was to be applied upon our emergence from Chapter 11 because (i) the reorganization value (further described in
Note 3. Fresh Start Financial Statement Reporting
to the Consolidated Financial Statements included in Part II, Item 8 in this Form 10-K) of the emerging entity was less than total post-petition liabilities and allowed claims, and (ii) the holders of existing voting shares immediately before the confirmation of the Reorganization Plan received less than
50%
of the voting shares of the emerging entity. Specifically, fresh start reporting was applied upon confirmation of the Reorganization
178
Plan by the Bankruptcy Court and the satisfaction of the remaining material contingencies necessary to complete implementation of the Reorganization Plan. All conditions required for the adoption of fresh start reporting were satisfied by the Company on April 30, 2013 (“Fresh Start Reporting Date”) when Ambac executed a closing agreement with the United States Internal Revenue Service (the "IRS") to conclude the settlement of a dispute. As such, fresh start financial statement reporting ("Fresh Start") was adopted by the Company on April 30, 2013, incorporating, among other things, the discharge of debt obligations, issuance of new common stock and fair value adjustments. Adopting Fresh Start results in a new reporting entity with no beginning retained earnings or accumulated deficit. For periods after the Fresh Start Reporting Date, the Company will be referred to as Successor Ambac, whereas for all periods as of and preceding the Fresh Start Reporting Date, the Company will be referred to as Predecessor Ambac. Presentation of information for Successor Ambac represents the financial position and results of operations of Successor Ambac and is not comparable to Predecessor Ambac financial statements. The implementation of fresh start reporting is further described in
Note 3. Fresh Start Financial Statement Reporting
to the Consolidated Financial Statements included in Part II, Item 8 in this Form 10-K.
Reorganization items:
Professional advisory fees and other costs directly associated with our reorganization are reported separately as reorganization items pursuant to the Reorganizations Topic of the ASC. Reorganization items also include adjustments to reflect the carrying value of certain pre-petition liabilities at their allowable claim amounts, gain on the settlement of liabilities subject to compromise and fresh start reporting adjustments. The reorganization items in the Consolidated Statements of Total Comprehensive Income (Loss) consisted of the following items:
|
Successor Ambac
|
Predecessor Ambac
|
|||||||||||||||
|
Period from May 1
|
Period from January 1
|
|||||||||||||||
|
Year Ended
|
through
|
through
|
Year Ended
|
|||||||||||||
|
($ in Thousands)
|
December 31, 2014
|
December 31, 2013
|
April 30, 2013
|
December 31, 2012
|
||||||||||||
|
U.S. Trustee fees
|
$
|
7
|
|
$
|
33
|
|
$
|
23
|
|
$
|
50
|
|
||||
|
Professional fees
|
204
|
|
460
|
|
4,483
|
|
7,165
|
|
||||||||
|
Gain from cancellation and satisfaction of Predecessor Ambac debt
|
—
|
|
—
|
|
(1,521,435
|
)
|
—
|
|
||||||||
|
Fresh start reporting adjustments
|
—
|
|
—
|
|
(1,228,251
|
)
|
—
|
|
||||||||
|
Total reorganization items
|
$
|
211
|
|
$
|
493
|
|
$
|
(2,745,180
|
)
|
$
|
7,215
|
|
||||
179
AMBAC FINANCIAL GROUP, INC. AND SUBSIDIARIES
SCHEDULE IV— REINSURANCE
Year Ended December 31, 2014
Eight Months Ended December 31, 2013 and Four Months Ended April 30, 2013
Year Ended December 31, 2012
|
Insurance Premiums Written
($ in Thousands)
|
Gross
Amount
|
Ceded to Other
Companies
|
Assumed from
Other
Companies
|
Net
Amount
|
Percentage of
Amount
Assumed to
Net
|
||||||||||||
|
Successor Ambac
|
|||||||||||||||||
|
Year ended December 31, 2014
|
$
|
(288,310
|
)
|
$
|
(6,842
|
)
|
$
|
—
|
|
$
|
(281,468
|
)
|
—%
|
||||
|
Successor Ambac
|
|||||||||||||||||
|
Eight months ended December 31, 2013
|
(80,309
|
)
|
(7,810
|
)
|
—
|
|
(72,499
|
)
|
—%
|
||||||||
|
Predecessor Ambac
|
|||||||||||||||||
|
Four months ended April 30, 2013
|
(14,125
|
)
|
(1,098
|
)
|
—
|
|
(13,027
|
)
|
—%
|
||||||||
|
Predecessor Ambac
|
|||||||||||||||||
|
Year ended December 31, 2012
|
(277,508
|
)
|
(23,371
|
)
|
—
|
|
(254,137
|
)
|
—%
|
||||||||
180
SIGNATURES
Pursuant to the requirements of Section 13 or 15(d) of the Securities Exchange Act of 1934, the Registrant has caused this report to be signed on its behalf by the undersigned, thereunto duly authorized.
|
AMBAC FINANCIAL GROUP, INC.
|
|||
|
Dated:
|
March 2, 2015
|
By:
|
/S/ DAVID TRICK
|
|
Name:
|
David Trick
|
||
|
Title:
|
Chief Financial Officer and Treasurer
|
||
Pursuant to the requirements of the Securities Exchange Act of 1934, this report has been signed below by the following persons on behalf of the Registrant and in the capacities and on the dates indicated.
|
Signature
|
Title
|
Date
|
||
|
/S/ JEFFREY S. STEIN*
|
Chairman of the Board and Director
|
March 2, 2015
|
||
|
Jeffrey S. Stein
|
||||
|
/S/ NADER TAVAKOLI
|
President, Chief Executive Officer and Director
|
March 2, 2015
|
||
|
Nader Tavakoli
|
(Principal Executive Officer)
|
|||
|
/S/ DAVID TRICK
|
Senior Managing Director and Chief Financial Officer
|
March 2, 2015
|
||
|
David Trick
|
(Principal Financial Officer)
|
|||
|
/S/ ROBERT B. EISMAN
|
Senior Managing Director and Chief Accounting Officer
|
March 2, 2015
|
||
|
Robert B. Eisman
|
(Principal Accounting Officer)
|
|||
|
/S/ EUGENE M. BULLIS*
|
Director
|
March 2, 2015
|
||
|
Eugene M. Bullis
|
||||
|
/S/ VICTOR MANDEL*
|
Director
|
March 2, 2015
|
||
|
Victor Mandel
|
||||
|
*BY: /S/ STEPHEN M. KSENAK
|
Attorney-in-fact
|
March 2, 2015
|
||
181
TABLE OF CONTENTS
Part IItem 1. BusinessItem 1A. Risk FactorsItem 1B. Unresolved Staff CommentsItem 2. PropertiesItem 3. Legal ProceedingsItem 4. Mine Safety DisclosuresPart IIItem 5. Market For Registrant's Common Equity, Related Stockholder Matters and Issuer Purchases Of Equity SecuritiesItem 6. Selected Financial DataItem 7. Management S Discussion and Analysis Of Financial Condition and Results Of OperationsItem 7A. Quantitative and Qualitative Disclosures About Market RiskItem 8. Financial Statements and Supplementary DataNote 14. Long-term DebtNote 3. Fresh Start Financial Statement ReportingNote 3 - Fresh Start Financial Statement ReportingNote 4. Special Purpose Entities, Including Variable Interest EntitiesNote 19. Segment InformationNote 1. Background and Business DescriptionNote 12. Derivative InstrumentsNote 10 . Fair Value MeasurementsNote 10. Fair Value MeasurementsNote 2. Basis Of Presentation and Significant Accounting PoliciesNote 11. InvestmentsNote 10. . Fair Value MeasurementsNote 2. Basis Of Presentation and Significant Accounting PrinciplesNote 2 - Basis Of Presentation and Significant Accounting PoliciesNote 1. Background and Business Description, Reorganization Under Chapter 11,Item 9. Changes in and Disagreements with Accountants on Accounting and Financial DisclosureItem 9A. Controls and ProceduresItem 9B. Other InformationPart IIIItem 10. Directors, Executive Officers and Corporate GovernanceItem 11. Executive CompensationItem 12. Security Ownership Of Certain Beneficial Owners and Management and Related Stockholder MattersNote 17. Employment Benefit PlansItem 13. Certain Relationships and Related Transactions, and Director IndependenceItem 14. Principal Accountant Fees and ServicesPart IVItem 15. Exhibits, Financial Statement Schedules