AMBAC FINANCIAL GROUP INC
10-Ks and 10-Qs
|
|
|
|
|
|
|
|
|
|
|
|
|
|
|
|
|
|
|
|
|
|
|
|
|
|
|
|
|
|
|
|
|
|
|
|
|
|
|
|
|
|
|
|
|
|
|
|
|
|
|
|
|
|
|
|
UNITED STATES
SECURITIES AND EXCHANGE COMMISSION
Washington, D.C. 20549
|
FORM 10-Q
|
|
x
|
QUARTERLY REPORT PURSUANT TO SECTION 13 OR 15(d)
|
|
OF THE SECURITIES EXCHANGE ACT OF 1934
|
|
For the Quarterly Period Ended June 30, 2017
|
¨
|
TRANSITION REPORT PURSUANT TO SECTION 13 OR 15(d)
|
|
OF THE SECURITIES EXCHANGE ACT OF 1934
|
|
Commission File Number: 1-10777
|
Ambac Financial Group, Inc.
|
|
(Exact name of Registrant as specified in its charter)
|
|
Delaware
|
13-3621676
|
|
|
(State of incorporation)
|
(I.R.S. employer identification no.)
|
|
|
One State Street Plaza, New York, New York
|
10004
|
|
|
(Address of principal executive offices)
|
(Zip code)
|
|
|
212-658-7470
|
|
(Registrant's telephone number, including area code)
|
Indicate by check mark whether the Registrant: (1) has filed all reports required to be filed by Section 13 or 15(d) of the Securities Exchange Act of 1934 during the preceding 12 months (or for such shorter period that the Registrant was required to file such reports), and (2) has been subject to such filing requirements for the past 90 days. Yes
x
No
¨
Indicate by check mark whether the Registrant has submitted electronically and posted on its corporate Web site, if any, every Interactive Data File required to be submitted and posted pursuant to Rule 405 of Regulation S-T (
§
232.405 of this chapter) during the preceding 12 months (or for such shorter period that the Registrant was required to submit and post such files). Yes
x
No
¨
Indicate by check mark whether the Registrant is a large accelerated filer, an accelerated filer, a non-accelerated filer, smaller reporting company or an emerging growth company. See definition of “large accelerated filer”, “accelerated filer”, “smaller reporting company” and "emerging growth company" in Rule 12b-2 of the Exchange Act): (Check one):
|
Large accelerated filer
|
x
|
Accelerated filer
|
¨
|
Non-accelerated filer
|
¨
|
Smaller reporting company
|
¨
|
Emerging growth company
|
¨
|
If an emerging growth company, indicate by check mark if the registrant has elected not to use the extended transition period for complying with any new or revised financial accounting standards provided pursuant to Section 13(a) of the Exchange Act.
¨
Indicate by check mark whether the Registrant is a shell company (as defined in Rule 12b-2 of the Exchange Act). Yes
¨
No
x
Indicate by check mark whether the registrant has filed all documents and reports required to be filed by Sections 12, 13 or 15(d) of the Securities Exchange Act of 1934 subsequent to the distribution of securities under a plan confirmed by a court. Yes
x
No
¨
As of
August 7, 2017
,
45,251,166
shares of common stock, par value $0.01 per share, of the Registrant were outstanding.
AMBAC FINANCIAL GROUP, INC. AND SUBSIDIARIES
TABLE OF CONTENTS
|
PAGE
|
|||
|
PART I.
|
FINANCIAL INFORMATION
|
||
|
Item 1.
|
Unaudited Consolidated Financial Statements of Ambac Financial Group, Inc. and Subsidiaries
|
||
|
Item 2.
|
|||
|
Item 3.
|
|||
|
Item 4.
|
|||
|
PART II.
|
OTHER INFORMATION
|
||
|
Item 1.
|
|||
|
Item 1A.
|
|||
|
Item 2.
|
|||
|
Item 3.
|
|||
|
Item 4.
|
|||
|
Item 5.
|
|||
|
Item 6.
|
|||
AMBAC FINANCIAL GROUP, INC. AND SUBSIDIARIES
|
June 30,
|
December 31,
|
||||||
|
(Dollars in thousands, except share data) (June 30, 2017 (Unaudited))
|
2017
|
2016
|
|||||
|
Assets:
|
|||||||
|
Investments:
|
|||||||
|
Fixed income securities, at fair value (amortized cost of $5,165,245 and $5,435,385)
|
$
|
5,318,195
|
|
$
|
5,554,215
|
|
|
|
Fixed income securities pledged as collateral, at fair value (amortized cost of $64,944 and $64,833)
|
64,928
|
|
64,905
|
|
|||
|
Short-term investments, at fair value (amortized cost of $504,093 and $430,827)
|
504,006
|
|
430,788
|
|
|||
|
Other investments (includes $419,614 and $420,304 at fair value)
|
452,032
|
|
450,307
|
|
|||
|
Total investments
|
6,339,161
|
|
6,500,215
|
|
|||
|
Cash and cash equivalents
|
54,238
|
|
91,025
|
|
|||
|
Receivable for securities
|
3,218
|
|
2,090
|
|
|||
|
Investment income due and accrued
|
24,258
|
|
26,023
|
|
|||
|
Premium receivables
|
653,176
|
|
661,337
|
|
|||
|
Reinsurance recoverable on paid and unpaid losses
|
46,466
|
|
30,418
|
|
|||
|
Deferred ceded premium
|
59,471
|
|
69,624
|
|
|||
|
Subrogation recoverable
|
658,875
|
|
684,731
|
|
|||
|
Loans
|
10,125
|
|
4,160
|
|
|||
|
Derivative assets
|
79,047
|
|
77,742
|
|
|||
|
Insurance intangible asset
|
912,173
|
|
962,080
|
|
|||
|
Other assets
|
70,025
|
|
158,423
|
|
|||
|
Variable interest entity assets:
|
|||||||
|
Fixed income securities, at fair value
|
2,722,316
|
|
2,622,566
|
|
|||
|
Restricted cash
|
5,015
|
|
4,873
|
|
|||
|
Loans, at fair value
|
11,301,298
|
|
10,658,963
|
|
|||
|
Derivative assets
|
65,507
|
|
80,407
|
|
|||
|
Other assets
|
1,074
|
|
1,025
|
|
|||
|
Total assets
|
$
|
23,005,443
|
|
$
|
22,635,702
|
|
|
|
Liabilities and Stockholders’ Equity:
|
|||||||
|
Liabilities:
|
|||||||
|
Unearned premiums
|
$
|
893,456
|
|
$
|
967,258
|
|
|
|
Loss and loss expense reserves
|
4,582,153
|
|
4,380,769
|
|
|||
|
Ceded premiums payable
|
39,664
|
|
42,529
|
|
|||
|
Obligations under investment agreements
|
—
|
|
82,358
|
|
|||
|
Deferred taxes
|
1,866
|
|
1,720
|
|
|||
|
Current taxes
|
26,082
|
|
14,280
|
|
|||
|
Long-term debt
|
988,150
|
|
1,114,405
|
|
|||
|
Accrued interest payable
|
397,974
|
|
421,975
|
|
|||
|
Derivative liabilities
|
91,549
|
|
319,286
|
|
|||
|
Other liabilities
|
72,582
|
|
76,589
|
|
|||
|
Payable for securities purchased
|
6,126
|
|
1,084
|
|
|||
|
Variable interest entity liabilities:
|
|||||||
|
Accrued interest payable
|
860
|
|
859
|
|
|||
|
Long-term debt, at fair value
|
11,902,682
|
|
11,155,936
|
|
|||
|
Derivative liabilities
|
2,064,071
|
|
2,078,601
|
|
|||
|
Other liabilities
|
15
|
|
29
|
|
|||
|
Total liabilities
|
21,067,230
|
|
20,657,678
|
|
|||
|
Commitments and contingencies (See Note 11)
|
|||||||
|
Stockholders’ equity:
|
|||||||
|
Preferred stock, par value $0.01 per share; 20,000,000 shares authorized shares; issued and outstanding shares—none
|
—
|
|
—
|
|
|||
|
Common stock, par value $0.01 per share; 130,000,000 shares authorized; issued and outstanding shares: 45,275,982 and 45,194,954
|
453
|
|
452
|
|
|||
|
Additional paid-in capital
|
197,652
|
|
195,267
|
|
|||
|
Accumulated other comprehensive income (loss)
|
38,828
|
|
(38,990
|
)
|
|||
|
Retained earnings
|
1,437,641
|
|
1,557,681
|
|
|||
|
Treasury stock, shares at cost: 24,816 and
22,458
|
(471
|
)
|
(496
|
)
|
|||
|
Total Ambac Financial Group, Inc. stockholders’ equity
|
1,674,103
|
|
1,713,914
|
|
|||
|
Noncontrolling interest
|
264,110
|
|
264,110
|
|
|||
|
Total stockholders’ equity
|
1,938,213
|
|
1,978,024
|
|
|||
|
Total liabilities and stockholders’ equity
|
$
|
23,005,443
|
|
$
|
22,635,702
|
|
|
See accompanying Notes to Unaudited Consolidated Financial Statements
| Ambac Financial Group, Inc.
1
2017 Second Quarter FORM 10-Q |
AMBAC FINANCIAL GROUP, INC. AND SUBSIDIARIES
|
Three Months Ended June 30,
|
Six Months Ended June 30,
|
|||||||||||||||
|
(Dollars in thousands, except share data)
|
2017
|
2016
|
2017
|
2016
|
||||||||||||
|
Revenues:
|
||||||||||||||||
|
Net premiums earned
|
$
|
43,152
|
|
$
|
41,402
|
|
$
|
90,765
|
|
94,202
|
|
|||||
|
Net investment income:
|
||||||||||||||||
|
Securities available-for-sale and short-term
|
80,943
|
|
64,368
|
|
154,093
|
|
122,350
|
|
||||||||
|
Other investments
|
4,217
|
|
6,390
|
|
12,626
|
|
9,229
|
|
||||||||
|
Total net investment income
|
85,160
|
|
70,758
|
|
166,719
|
|
131,579
|
|
||||||||
|
Other-than-temporary impairment losses:
|
||||||||||||||||
|
Total other-than-temporary impairment losses
|
(1,763
|
)
|
(18,880
|
)
|
(22,917
|
)
|
(66,950
|
)
|
||||||||
|
Portion of other-than-temporary impairment recognized in other comprehensive income
|
—
|
|
11,439
|
|
17,212
|
|
50,175
|
|
||||||||
|
Net other-than-temporary impairment losses recognized in earnings
|
(1,763
|
)
|
(7,441
|
)
|
(5,705
|
)
|
(16,775
|
)
|
||||||||
|
Net realized investment gains (losses)
|
4,180
|
|
14,897
|
|
(716
|
)
|
15,999
|
|
||||||||
|
Change in fair value of credit derivatives:
|
||||||||||||||||
|
Realized gains and other settlements
|
1,134
|
|
233
|
|
1,333
|
|
485
|
|
||||||||
|
Unrealized gains (losses)
|
5,490
|
|
3,722
|
|
6,343
|
|
16,336
|
|
||||||||
|
Net change in fair value of credit derivatives
|
6,624
|
|
3,955
|
|
7,676
|
|
16,821
|
|
||||||||
|
Net gains (losses) on interest rate derivatives
|
34,068
|
|
(36,331
|
)
|
32,554
|
|
(119,755
|
)
|
||||||||
|
Net realized gains (losses) on extinguishment of debt
|
2,179
|
|
3,586
|
|
4,920
|
|
4,821
|
|
||||||||
|
Other income (expense)
|
467
|
|
6,919
|
|
381
|
|
14,918
|
|
||||||||
|
Income (loss) on variable interest entities
|
(1,219
|
)
|
8,987
|
|
2,482
|
|
(18,176
|
)
|
||||||||
|
Total revenues
|
172,848
|
|
106,732
|
|
299,076
|
|
123,634
|
|
||||||||
|
Expenses:
|
||||||||||||||||
|
Losses and loss expenses (benefit)
|
66,100
|
|
(52,496
|
)
|
201,111
|
|
(157,777
|
)
|
||||||||
|
Insurance intangible amortization
|
33,471
|
|
39,013
|
|
70,996
|
|
89,903
|
|
||||||||
|
Operating expenses
|
31,051
|
|
27,995
|
|
59,031
|
|
56,004
|
|
||||||||
|
Interest expense
|
28,234
|
|
30,709
|
|
59,806
|
|
61,139
|
|
||||||||
|
Total expenses
|
158,856
|
|
45,221
|
|
390,944
|
|
49,269
|
|
||||||||
|
Pre-tax income (loss)
|
13,992
|
|
61,511
|
|
(91,868
|
)
|
74,365
|
|
||||||||
|
Provision for income taxes
|
6,882
|
|
3,156
|
|
26,463
|
|
6,595
|
|
||||||||
|
Net income (loss)
|
7,110
|
|
58,355
|
|
(118,331
|
)
|
67,770
|
|
||||||||
|
Less: net gain (loss) attributable to noncontrolling interest
|
—
|
|
(292
|
)
|
—
|
|
(292
|
)
|
||||||||
|
Net income (loss) attributable to common shareholders
|
$
|
7,110
|
|
$
|
58,647
|
|
$
|
(118,331
|
)
|
$
|
68,062
|
|
||||
|
Other comprehensive income (loss), after tax:
|
||||||||||||||||
|
Net income (loss)
|
$
|
7,110
|
|
$
|
58,355
|
|
$
|
(118,331
|
)
|
$
|
67,770
|
|
||||
|
Unrealized gains (losses) on securities, net of deferred income taxes of $0
|
12,649
|
|
48,170
|
|
33,984
|
|
107,961
|
|
||||||||
|
Gains (losses) on foreign currency translation, net of deferred income taxes of $0
|
29,292
|
|
(55,152
|
)
|
41,885
|
|
(72,933
|
)
|
||||||||
|
Changes to postretirement benefit, net of tax of $0
|
(338
|
)
|
(255
|
)
|
1,949
|
|
532
|
|
||||||||
|
Total other comprehensive income (loss), net of tax
|
41,603
|
|
(7,237
|
)
|
77,818
|
|
35,560
|
|
||||||||
|
Total comprehensive income (loss)
|
48,713
|
|
51,118
|
|
(40,513
|
)
|
103,330
|
|
||||||||
|
Less: comprehensive (gain) loss attributable to the noncontrolling interest:
|
||||||||||||||||
|
Net gain (loss)
|
—
|
|
(292
|
)
|
—
|
|
(292
|
)
|
||||||||
|
Total comprehensive income (loss) attributable to Ambac Financial Group, Inc.
|
$
|
48,713
|
|
$
|
51,410
|
|
$
|
(40,513
|
)
|
$
|
103,622
|
|
||||
|
Net income (loss) per share attributable to Ambac Financial Group, Inc. common stockholders
|
||||||||||||||||
|
Basic
|
$
|
0.16
|
|
$
|
1.30
|
|
$
|
(2.61
|
)
|
$
|
1.51
|
|
||||
|
Diluted
|
$
|
0.16
|
|
$
|
1.29
|
|
$
|
(2.61
|
)
|
$
|
1.50
|
|
||||
See accompanying Notes to Unaudited Consolidated Financial Statements
| Ambac Financial Group, Inc.
2
2017 Second Quarter FORM 10-Q |
AMBAC FINANCIAL GROUP, INC. AND SUBSIDIARIES
Consolidated Statements of Stockholders’ Equity (Unaudited)
|
Ambac Financial Group, Inc.
|
|||||||||||||||||||||||||||||||
|
(Dollars in thousands)
|
Total
|
Retained
Earnings |
Accumulated
Other Comprehensive Income (Loss) |
Preferred
Stock |
Common
Stock |
Additional Paid-in
Capital |
Common
Stock Held in Treasury, at Cost |
Noncontrolling
Interest |
|||||||||||||||||||||||
|
Balance at January 1, 2017
|
$
|
1,978,024
|
|
$
|
1,557,681
|
|
$
|
(38,990
|
)
|
$
|
—
|
|
$
|
452
|
|
$
|
195,267
|
|
$
|
(496
|
)
|
$
|
264,110
|
|
|||||||
|
Total comprehensive income
|
(40,513
|
)
|
(118,331
|
)
|
77,818
|
|
—
|
|
—
|
|
—
|
|
—
|
|
—
|
|
|||||||||||||||
|
Adjustment to initially apply ASU 2016-09
|
(137
|
)
|
(137
|
)
|
—
|
|
—
|
|
—
|
|
—
|
|
—
|
|
—
|
|
|||||||||||||||
|
Stock-based compensation
|
2,385
|
|
—
|
|
—
|
|
—
|
|
—
|
|
2,385
|
|
—
|
|
—
|
|
|||||||||||||||
|
Cost of shares (acquired) issued under equity plan
|
(1,547
|
)
|
(1,572
|
)
|
—
|
|
—
|
|
—
|
|
—
|
|
25
|
|
—
|
|
|||||||||||||||
|
Issuance of common stock
|
1
|
|
—
|
|
—
|
|
—
|
|
1
|
|
—
|
|
—
|
|
—
|
|
|||||||||||||||
|
Balance at June 30, 2017
|
$
|
1,938,213
|
|
$
|
1,437,641
|
|
$
|
38,828
|
|
$
|
—
|
|
$
|
453
|
|
$
|
197,652
|
|
$
|
(471
|
)
|
$
|
264,110
|
|
|||||||
|
Balance at January 1, 2016
|
$
|
1,958,346
|
|
$
|
1,478,439
|
|
$
|
15,215
|
|
$
|
—
|
|
$
|
450
|
|
$
|
190,813
|
|
$
|
(118
|
)
|
$
|
273,547
|
|
|||||||
|
Total comprehensive income
|
103,330
|
|
68,062
|
|
35,560
|
|
—
|
|
—
|
|
—
|
|
—
|
|
(292
|
)
|
|||||||||||||||
|
Adjustment to initially apply ASU 2014-13
|
—
|
|
6,442
|
|
—
|
|
—
|
|
—
|
|
—
|
|
—
|
|
(6,442
|
)
|
|||||||||||||||
|
Stock-based compensation
|
2,777
|
|
—
|
|
—
|
|
—
|
|
—
|
|
2,777
|
|
—
|
|
—
|
|
|||||||||||||||
|
Cost of shares (acquired) issued under equity plan
|
(9
|
)
|
(127
|
)
|
—
|
|
—
|
|
—
|
|
—
|
|
118
|
|
—
|
|
|||||||||||||||
|
Cost of warrants acquired
|
(1,610
|
)
|
(1,092
|
)
|
—
|
|
—
|
|
—
|
|
(518
|
)
|
—
|
|
—
|
|
|||||||||||||||
|
Issuance of common stock
|
1
|
|
—
|
|
—
|
|
—
|
|
1
|
|
—
|
|
—
|
|
—
|
|
|||||||||||||||
|
Warrants exercised
|
2
|
|
—
|
|
—
|
|
—
|
|
—
|
|
2
|
|
—
|
|
—
|
|
|||||||||||||||
|
Balance at June 30, 2016
|
$
|
2,062,837
|
|
$
|
1,551,724
|
|
$
|
50,775
|
|
$
|
—
|
|
$
|
451
|
|
$
|
193,074
|
|
$
|
—
|
|
$
|
266,813
|
|
|||||||
See accompanying Notes to Unaudited Consolidated Financial Statements
| Ambac Financial Group, Inc.
3
2017 Second Quarter FORM 10-Q |
AMBAC FINANCIAL GROUP, INC. AND SUBSIDIARIES
|
Six Months Ended June 30,
|
||||||||
|
(Dollars in thousands)
|
2017
|
2016
|
||||||
|
Cash flows from operating activities:
|
||||||||
|
Net income (loss) attributable to common shareholders
|
$
|
(118,331
|
)
|
$
|
68,062
|
|
||
|
Noncontrolling interest in subsidiaries’ earnings
|
—
|
|
(292
|
)
|
||||
|
Net income (loss)
|
$
|
(118,331
|
)
|
$
|
67,770
|
|
||
|
Adjustments to reconcile net income to net cash used in operating activities:
|
||||||||
|
Depreciation and amortization
|
533
|
|
637
|
|
||||
|
Amortization of bond premium and discount
|
(83,180
|
)
|
(56,353
|
)
|
||||
|
Share-based compensation
|
2,385
|
|
2,777
|
|
||||
|
Deferred income taxes
|
146
|
|
(493
|
)
|
||||
|
Current income taxes
|
12,283
|
|
(537
|
)
|
||||
|
Unearned premiums, net
|
(63,820
|
)
|
(143,098
|
)
|
||||
|
Losses and loss expenses, net
|
206,693
|
|
812,937
|
|
||||
|
Ceded premiums payable
|
(2,865
|
)
|
(7,767
|
)
|
||||
|
Investment income due and accrued
|
1,755
|
|
182
|
|
||||
|
Premium receivables
|
8,378
|
|
89,962
|
|
||||
|
Accrued interest payable
|
6,576
|
|
24,581
|
|
||||
|
Amortization of insurance intangible assets
|
70,996
|
|
89,903
|
|
||||
|
Net mark-to-market (gains) losses
|
(6,343
|
)
|
(16,336
|
)
|
||||
|
Net realized investment gains
|
716
|
|
(15,999
|
)
|
||||
|
Other-than-temporary impairment charges
|
5,705
|
|
16,775
|
|
||||
|
(Gain) loss on extinguishment of debt
|
(4,920
|
)
|
(4,821
|
)
|
||||
|
Variable interest entity activities
|
(2,482
|
)
|
18,176
|
|
||||
|
Derivative assets and liabilities
|
(211,149
|
)
|
80,783
|
|
||||
|
Other, net
|
15,921
|
|
(85,060
|
)
|
||||
|
Net cash provided by (used in) operating activities
|
(161,003
|
)
|
874,019
|
|
||||
|
Cash flows from investing activities:
|
||||||||
|
Proceeds from sales of bonds
|
885,507
|
|
303,807
|
|
||||
|
Proceeds from matured bonds
|
390,309
|
|
585,274
|
|
||||
|
Purchases of bonds
|
(986,364
|
)
|
(1,416,297
|
)
|
||||
|
Proceeds from sales of other invested assets
|
177,805
|
|
34,499
|
|
||||
|
Purchases of other invested assets
|
(161,375
|
)
|
(145,788
|
)
|
||||
|
Change in short-term investments
|
(73,092
|
)
|
(111,869
|
)
|
||||
|
Loans, net
|
(5,965
|
)
|
591
|
|
||||
|
Change in cash collateral receivable
|
73,174
|
|
(90,966
|
)
|
||||
|
Other, net
|
(4,534
|
)
|
7,996
|
|
||||
|
Net cash provided by (used in) investing activities
|
295,465
|
|
(832,753
|
)
|
||||
|
Cash flows from financing activities:
|
||||||||
|
Paydowns of a secured borrowing
|
(16,929
|
)
|
(13,630
|
)
|
||||
|
Payments for investment agreement draws
|
(82,358
|
)
|
(17,989
|
)
|
||||
|
Payments for extinguishment of long-term debt
|
(69,499
|
)
|
(19,550
|
)
|
||||
|
Tax payments related to shares withheld for share-based compensation plans
|
(1,268
|
)
|
—
|
|
||||
|
Proceeds from warrant exercises
|
—
|
|
2
|
|
||||
|
Cost of warrants acquired
|
—
|
|
(1,610
|
)
|
||||
|
Net cash used in financing activities
|
(170,054
|
)
|
(52,777
|
)
|
||||
|
Effect of foreign exchange on cash and cash equivalents
|
(1,195
|
)
|
(1,189
|
)
|
||||
|
Net cash flow
|
(36,787
|
)
|
(12,700
|
)
|
||||
|
Cash and cash equivalents at beginning of period
|
91,025
|
|
35,744
|
|
||||
|
Cash and cash equivalents end of period
|
$
|
54,238
|
|
$
|
23,044
|
|
||
|
Supplemental disclosure of cash flow information:
|
||||||||
|
Cash paid during the period for:
|
||||||||
|
Income taxes
|
$
|
16,012
|
|
$
|
7,662
|
|
||
|
Interest on long-term debt and investment agreements
|
37,471
|
|
2,352
|
|
||||
|
Non-cash financing activities:
|
||||||||
|
Decrease in long-term debt as a result of an exchange for investment securities
|
$
|
55,426
|
|
$
|
—
|
|
||
See accompanying Notes to Unaudited Consolidated Financial Statements
| Ambac Financial Group, Inc.
4
2017 Second Quarter FORM 10-Q |
AMBAC FINANCIAL GROUP, INC. AND SUBSIDIARIES
Notes to Unaudited Consolidated Financial Statements
(Dollar Amounts in Thousands, Except Share Amounts)
1. BACKGROUND AND BUSINESS DESCRIPTION
Ambac Financial Group, Inc. (“Ambac” or the “Company”), headquartered in New York City, is a financial services holding company incorporated in the state of Delaware on
April 29, 1991
.
Ambac provides financial guarantee insurance policies through its principal operating subsidiary, Ambac Assurance Corporation (“Ambac Assurance" or ”AAC") and its wholly owned subsidiary, Ambac Assurance UK Limited (“Ambac UK”). Insurance policies issued by Ambac Assurance and Ambac UK generally guarantee payment when due of the principal and interest on the obligations guaranteed. Ambac also has another wholly-owned subsidiary, Everspan Financial Guarantee Corp. (“Everspan”), which has been in runoff since its acquisition in 1997. The deterioration of Ambac Assurance’s financial condition resulting from losses in its insured portfolio since 2007 has prevented Ambac Assurance and Ambac UK from being able to write new business. The inability to write new business has and will continue to negatively impact Ambac’s future operations and financial results. Ambac Assurance’s ability to pay dividends and, as a result, Ambac’s liquidity, have been significantly restricted by the deterioration of Ambac Assurance’s financial condition, by the rehabilitation of the Segregated Account (as defined below) and by the terms of the Settlement Agreement, dated as of June 7, 2010 (the "Settlement Agreement"), by and among Ambac Assurance, Ambac Credit Products LLC (“ACP”), Ambac and certain counterparties to credit default swaps with ACP that were guaranteed by Ambac Assurance. Ambac Assurance is also restricted in its ability to pay dividends pursuant to regulatory restrictions, the terms of its Auction Market Preferred Shares and the terms of agreements entered into with the Segregated Account. It is highly unlikely that Ambac Assurance will be able to make dividend payments to Ambac for the foreseeable future.
Ambac also provides other financial products through subsidiaries of Ambac Assurance. These products consist of interest rate swaps, funding conduits, and investment agreements (until the first quarter of 2017) that were provided principally to clients that were also provided financial guarantee policies. These financial products have been in active run-off since 2007.
Prior to the second quarter of 2017, Ambac had
two
reportable business segments: i) the financial guarantee segment, which consisted of financial guarantee insurance policies and credit derivative contracts and ii) the financial services segment which consisted of the other financial products discussed above. With respect to the financial services segment, there were significant swap commutations in June 2017. The remaining interest rate swaps, along with other interest rate derivatives, are managed to economically hedge interest rate risk in the financial guarantee and investment portfolios. The last remaining investment agreement matured in March 2017 and the remaining conduit transactions are not material. The significant wind-down of these financial products, along with the appointment of a new Chief Executive Officer effective January 1, 2017, has resulted in a change in how the Company manages its business. Management now reviews financial information, allocates resources and measures financial performance on a consolidated basis. As a result, beginning with the second quarter of 2017, the Company has a single reportable segment. All prior period amounts and disclosures have been adjusted to reflect the reportable segment change.
Ambac’s primary goal is to maximize stockholder value by executing the following key strategies:
|
•
|
Active runoff of Ambac Assurance and its subsidiaries through transaction terminations, policy commutations, settlements and restructurings that we believe will improve our risk profile, and maximizing the risk-adjusted return on invested assets;
|
|
•
|
Loss recovery through litigation and exercise of contractual and legal rights;
|
|
•
|
Improved cost effectiveness and efficiency of the operating platform;
|
|
•
|
Rationalization of Ambac's and its subsidiaries' capital and liability structures, enabling simplification of corporate governance and facilitating the successful rehabilitation of the Segregated Account (as defined below); and
|
|
•
|
Selective business transactions offering attractive risk-adjusted returns that, among other things, may permit utilization of Ambac’s tax net operating loss carry-forwards.
|
Although we are exploring selective business transactions for Ambac, no assurance can be given that we will be able to execute the acquisition or development of any new businesses or assets. In addition, there can be no assurance that we will be able to obtain the financial and other resources that may be required to finance the acquisition or development of new businesses or assets that may permit utilization of Ambac’s tax net operating loss carry-forwards. Due to these factors, as well as uncertainties relating to the ability of Ambac Assurance to deliver value to Ambac, the value of our securities is speculative.
The execution of Ambac’s strategy to increase the value of its investment in Ambac Assurance remains subject to the authority of the Rehabilitator to control the management of the Segregated Account. In exercising such authority, the Rehabilitator will act for the benefit of policyholders, and will not take into account the interests of Ambac. The Rehabilitator's authority includes, but is not limited to, sole discretion over the rate at which the Segregated Account pays claims and the accretion rate on Deferred Amounts. Similarly, by operation of the contracts executed in connection with the establishment, and subsequent rehabilitation, of the Segregated Account, the Rehabilitator retains rights to oversee and approve certain actions taken by or in respect of Ambac Assurance. Opportunities for remediating losses on poorly performing insured transactions
| Ambac Financial Group, Inc.
5
2017 Second Quarter FORM 10-Q |
AMBAC FINANCIAL GROUP, INC. AND SUBSIDIARIES
Notes to Unaudited Consolidated Financial Statements
(Dollar Amounts in Thousands, Except Share Amounts)
also depend on market conditions, including the perception of Ambac Assurance’s creditworthiness, the structure of the underlying risk and associated policy as well as other counterparty specific factors. Oversight by the Rehabilitator could impair Ambac’s ability to execute certain of its strategies. Ambac Assurance's ability to commute policies or purchase certain investments may also be limited by available liquidity.
As a result of uncertainties associated with the oversight by the Rehabilitator of the Segregated Account as noted herein, management has concluded that there is substantial doubt about Ambac's ability to continue as a going concern. Ambac’s financial statements as of and for the
three and six months ended June 30, 2017
and the year ended
December 31, 2016
, are prepared assuming Ambac continues as a going concern and do not include any adjustment that might result from its inability to continue as a going concern.
The Segregated Account
In March 2010, Ambac Assurance established a Segregated Account pursuant to Wisc. Stat. §611.24 (2) (the “Segregated Account”) to segregate certain segments of Ambac Assurance’s liabilities, and the Office of the Commissioner of Insurance for the State of Wisconsin (“OCI” (which term shall be understood to refer to such office as regulator of Ambac Assurance and to refer to the Commissioner of Insurance for the State of Wisconsin as rehabilitator of the Segregated Account (the “Rehabilitator”), as the context requires)) commenced rehabilitation proceedings in the Dane County, Wisconsin Circuit Court (the “Rehabilitation Court”) with respect to the Segregated Account (the “Segregated Account Rehabilitation Proceedings”) in order to permit OCI to facilitate an orderly run-off and/or settlement of the liabilities allocated to the Segregated Account pursuant to the provisions of the Wisconsin Insurers Rehabilitation and Liquidation Act. On October 8, 2010, OCI filed a plan of rehabilitation for the Segregated Account (the “Segregated Account Rehabilitation Plan”) in the Rehabilitation Court. The Rehabilitation Court confirmed the Segregated Account Rehabilitation Plan on January 24, 2011. On June 11, 2014, the Rehabilitation Court approved amendments to the Segregated Account Rehabilitation Plan and the Segregated Account Rehabilitation Plan, as amended, became effective on June 12, 2014. Net par exposure as of
June 30, 2017
for policies allocated to the Segregated Account was
$10,772,572
. Policy obligations not allocated to the Segregated Account remain in the General Account of Ambac Assurance, and such policies in the General Account are not subject to and, therefore, are not directly impacted by the Segregated Account Rehabilitation Plan.
To pay claims and other liabilities, the Segregated Account has the ability to demand payment from time to time under an aggregate excess of loss reinsurance agreement provided by Ambac Assurance (the “Reinsurance Agreement”). In addition, certain operating and administrative costs and expenses of the Segregated Account are reimbursable by Ambac Assurance pursuant to the Cooperation Agreement, dated as of March 24, 2010, by and between the Segregated Account and Ambac Assurance, as amended (the “Cooperation Agreement”). Ambac Assurance is not obligated to make payments under the Reinsurance Agreement or Cooperation Agreement if its surplus as regards to policyholders is less than
$100,000
(the “Minimum Surplus Amount”). As long as the surplus as regards to policyholders is not less than the Minimum Surplus Amount, payments by Ambac Assurance to the Segregated Account under the Reinsurance Agreement and Cooperation Agreement are not capped. At
June 30, 2017
, Ambac Assurance’s surplus as regards to policyholders exceeded the Minimum Surplus Amount. In the event that Ambac Assurance does not maintain surplus in excess of the Minimum Surplus Amount, the Segregated Account would experience a shortfall in funds available to pay its liabilities. Any such shortfall would be a consideration for the Rehabilitator in the determination of whether any changes to the Segregated Account Rehabilitation Plan and/or the amount of partial policy claim payments are necessary or appropriate or whether to institute general rehabilitation proceedings against Ambac Assurance.
Rehabilitation Exit Support Agreement
On July 19, 2017, Ambac Assurance and Ambac entered into an agreement (the “Rehabilitation Exit Support Agreement”) with holders or beneficial owners (the “Supporting Holders”) of surplus notes issued by Ambac Assurance and beneficial interests in Deferred Amounts (as defined in the Segregated Account Rehabilitation Plan) of the Segregated Account with respect to a transaction which, subject to the conditions precedent set forth in the Rehabilitation Exit Support Agreement, and if consummated, would generally involve (i) the exchange of certain surplus notes held by holders of surplus notes that elect to participate in a voluntary exchange transaction and (ii) the satisfaction and discharge of all Deferred Amounts, in each case for an effective consideration package comprised of cash and new Secured Notes (as defined below) and certain existing surplus notes and (iii) the exit from rehabilitation of the Segregated Account (the “Rehabilitation Exit Transactions”).
The settlement of the Deferred Amounts and the Segregated Account’s exit from rehabilitation are expected to be realized through the amendment (the “Rehabilitation Plan Amendment”) of the Segregated Account Rehabilitation Plan to be pursued by the Rehabilitator, and a series of transactions which would provide to holders of beneficial interests in Deferred Amounts (other than Ambac, but including Ambac Assurance) a total effective consideration package, in full satisfaction and discharge of each
$1.00
of Deferred Amounts (including accretion), of (i)
$0.40
in cash, (ii)
$0.41
in principal amount of new Secured Notes (as defined below) and (iii) from certain holders of surplus notes,
$0.125
currently outstanding surplus notes. Such consideration package would thereby provide a discount of
$0.065
(set first against accretion of Deferred Amounts). Ambac would receive
$0.91
in principal amount of Secured Notes for each
$1.00
of Deferred Amounts (including accretion) that it holds, and would provide a
$0.09
discount in full satisfaction and discharge of its Deferred Amount claims. It is anticipated that the Rehabilitator will file a motion in the Rehabilitation Court by no later than October 2, 2017 seeking entry of an order approving the Rehabilitation Plan Amendment. The Rehabilitator has reserved December 12, 2017 through December 14, 2017 for a confirmation hearing on the Rehabilitation Plan Amendment, and November 30, 2017 for a pre-trial hearing.
The Rehabilitation Exit Support Agreement calls for a series of interrelated transactions involving the exchange of certain surplus notes (collectively, the “Exchange Offers”), pursuant to which, for each
$1.00
of principal amount outstanding and accrued and unpaid interest thereon,
| Ambac Financial Group, Inc.
6
2017 Second Quarter FORM 10-Q |
AMBAC FINANCIAL GROUP, INC. AND SUBSIDIARIES
Notes to Unaudited Consolidated Financial Statements
(Dollar Amounts in Thousands, Except Share Amounts)
holders effectively would (i) receive
$0.40
in cash, (ii) receive
$0.41
in principal amount of Secured Notes, (iii) retain
$0.125
in principal amount and accrued and unpaid interest thereon of surplus notes and (iv) provide a discount of
$0.065
in principal amount and accrued and unpaid interest thereon. Ambac will not participate in the Exchange Offers and will hold surplus notes issued by the Segregated Account and Ambac Assurance until the Rehabilitation Exit Transactions are consummated and a certain amount of such surplus notes for a time after such transactions are completed, as described below.
As part of the Rehabilitation Exit Transactions, Ambac and Ambac Assurance will seek consents from holders of surplus notes to a waiver and amendment (the “BSA Waiver and Amendment”) of certain provisions of the Settlement Agreement, such consents to be executed by holders of more than
50%
in aggregate principal amount of the surplus notes. Holders who participate in the Exchange Offers will be required to deliver their consent to the BSA Waiver and Amendment.
As contemplated by the Rehabilitation Exit Support Agreement and as a portion of the consideration received by holders of beneficial interests in Deferred Amounts (including Ambac Assurance) in satisfaction and discharge of their claims pursuant to the Rehabilitation Plan Amendment and by holders of surplus notes pursuant to the Exchange Offers (as specified above), a newly formed special purpose entity will issue new secured notes (the “Secured Notes”), secured by all assets of the special purpose entity, which include a note issued by Ambac Assurance to the special purpose entity, which note is secured by a pledge of Ambac Assurance’s right, title and interest in up to the first
$1,400,000
of proceeds (net of reinsurance) from certain litigations in which Ambac Assurance and the Segregated Account seek redress for breaches of representations and warranties and/or fraud related to residential mortgage-backed securitizations (the “
RMBS Litigations
”). In addition, the note issued by Ambac Assurance to the special purpose entity will be secured by RMBS securities having a market value of not less than
$350,000
on the date that is not more than five business days prior to the closing date of the Rehabilitation Exit Transactions. Ambac Assurance will also pledge for the benefit of the holders of Secured Notes (other than Ambac Assurance) the proceeds of any Secured Notes held by AAC from time to time, and will issue a financial guaranty insurance policy to a trustee for the benefit of holders of Secured Notes irrevocably guarantying all principal and interest payments in respect of the Secured Notes as and when such payments become due and owing. Should Ambac Assurance settle any of the RMBS Litigations before the closing of the Rehabilitation Exit Transactions, any proceeds received by Ambac Assurance from any settlement which would have secured the Secured Notes will replace Secured Notes having a face amount equal to the amount of proceeds received that would otherwise be issued.
Following the consummation of the Rehabilitation Exit Transactions and until the earlier of (i) June 8, 2020 and (ii) the date on which at least
25%
of the principal amount of Remaining Senior Surplus Notes (as defined the Rehabilitation Exit Support Agreement) are no longer outstanding, Ambac shall hold and not sell Remaining Senior Surplus Notes which, as of June 30, 2017, have an aggregate of
$60,000
of principal amount and accrued and unpaid interest outstanding.
The Company may terminate the Rehabilitation Exit Support Agreement upon the occurrence of certain events, including if the Rehabilitation Exit Transactions have not been consummated within
365
days of the signing date of the Rehabilitation Exit Support Agreement.
Supporting Holders that, in the aggregate, beneficially own at least
66
2/3% of the principal amount outstanding under the surplus notes and
66
2/3% of the principal amount of the Deferred Amounts, held by the Supporting Holders as a whole may terminate the Rehabilitation Exit Support Agreement upon the occurrence of certain events, including if (i) within
75
days of signing date of the Rehabilitation Exit Support Agreement, the Rehabilitator has not filed a motion in the Rehabilitation Court seeking entry of the approval order; (ii) the confirmation hearing has not commenced within
180
days of the signing date of the Rehabilitation Exit Support Agreement; and (iii) the Rehabilitation Exit Transactions have not been consummated within
270
days of the Signing Date. In addition if the Rehabilitation Exit Transactions have not been consummated within
365
days of the signing date of the Rehabilitation Exit Support Agreement, each Supporting Holder shall have the right to terminate the Agreement with respect to itself.
Ambac can provide no assurance that any of the termination events described above or in the Rehabilitation Exit Support Agreement will not arise.
The Exchange Offers will be subject to a number of conditions precedent, including, among others, (i) approval by the OCI; (ii) the effectiveness of the Rehabilitation Plan Amendment concurrent with the closing of the Exchange Offers; (iii) participation by
85%
of the outstanding principal amount owned by holders of surplus notes (including Ambac and Ambac Assurance) in the Exchange Offers; (iv) receipt of consents of at least a majority of the outstanding aggregate principal amount of the surplus notes (other than surplus notes beneficially owned by Ambac or Ambac Assurance or any of their affiliates) to the BSA Waiver and Amendment; and (v) subject to the approval of the OCI, a one-time current interest payment of approximately
$12,500
on the surplus notes outstanding immediately following the effective date of the Rehabilitation Plan Amendment.
The Rehabilitation Plan Amendment is subject to a number of conditions precedent having been satisfied or waived by the Rehabilitator, in his sole discretion, including, among others, (i) the Rehabilitation Plan Amendment will have been approved by the Rehabilitation Court, and such order will have become a final order; (ii) as of the effective date, Ambac Assurance will have sufficient capital and claims-paying resources to effect all of the Rehabilitation Exit Transactions and to exit rehabilitation; (iii) the conditions to consummation of the Exchange Offers will have
| Ambac Financial Group, Inc.
7
2017 Second Quarter FORM 10-Q |
AMBAC FINANCIAL GROUP, INC. AND SUBSIDIARIES
Notes to Unaudited Consolidated Financial Statements
(Dollar Amounts in Thousands, Except Share Amounts)
been satisfied or waived in full in accordance with the terms thereof; and (iv) Ambac will have received from the Internal Revenue Service a ruling, in form and substance reasonably satisfactory to the Rehabilitator, Ambac Assurance, and Ambac.
Ambac can provide no assurances that these approvals or consents will be obtained or that the other conditions precedent will be satisfied or waived in a timely manner or at all. Even if the Rehabilitation Exit Transactions are consummated, OCI may impose on Ambac and Ambac Assurance reporting requirements and restrictions on transactions or other activities, which may create additional challenges or obstacles with respect to Ambac Assurance's ability to deliver value to Ambac and Ambac's ability to deliver value to its stockholders.
Tier 2 Commitment
On July 19, 2017, Ambac Assurance also entered into a commitment letter (the “Commitment Letter”) with certain investors (the “Investors”), with respect to the issuance of an aggregate principal amount of
$240,000
of senior notes (the “Tier 2 Notes”) secured by Ambac Assurance’s rights, title and interest in the cash and non-cash proceeds (net of reinsurance) above
$1,600,000
received in connection with the RMBS Litigations. The Commitment Letter will terminate upon the earliest occurrence of: (i)
365
days from the execution of the Rehabilitation Exit Support Agreement, and (ii) the date on which the Tier 2 Notes are issued. In addition, Ambac Assurance and the Investors have the option to terminate the Commitment Letter following (i) the resolution of Ambac Assurance Corp. et al. v. Countrywide Home Loans, Inc. et al., Index No. 651612/2010 (N.Y. Sup. Ct. N.Y. Cnty.) (Bransten, J.) or (ii) the termination of the Rehabilitation Exit Support Agreement. The issuance of the Tier 2 Notes is subject to a number of conditions precedent including, among others, satisfaction or waiver of the conditions to effectiveness set forth in the Plan Amendment.
The terms, conditions, and timing of the conclusion of the Segregated Account Rehabilitation Proceedings are in the sole discretion of the OCI, and subject to the approval of the Rehabilitation Court. No assurance can be given that Rehabilitation Exit Transactions or issuance of the Tier 2 Notes will be consummated. OCI retains the authority, subject to the approval of the Rehabilitation Court, to address Segregated Account obligations without the agreement of Ambac Assurance or its board of directors. Moreover, even if the Segregated Account Rehabilitation Proceedings could be brought to a successful conclusion, there can be no assurance that any level of capital deemed sufficient by OCI to permit such conclusion will be sufficient to cover all future losses, whether currently anticipated or unanticipated.
Ambac Assurance will seek to further improve its financial condition by continuing to pursue asset monetizations; loss recoveries; restructurings, purchases, modifications or exchanges of certain outstanding obligations; extinguishment or modification of certain contractual restrictions; and/or commuting or reducing insured exposures Separately from or in connection with the actions described above, we may seek to further optimize our capital and corporate structure to unlock shareholder value.
Augusta Funding Limited IV ("Augusta") Commutation
On June 27, 2017, Ambac entered into a termination agreement with various parties, including Augusta, in connection with the commutation of interest rate swaps between Augusta and Ambac's wholly-owned subsidiary, Ambac Financial Services. During the second quarter, Ambac had net settlement payments of approximately
$103,592
, including
$94,407
under the termination agreement. At March 31, 2017, Ambac had recorded a mark-to-market liability under this swap transaction of
$147,035
, resulting in a gain of approximately
$43,443
and
$42,157
during the
three and six months ended June 30, 2017
, respectively. In July 2017, Augusta redeemed its outstanding Ambac-insured debt and accordingly Ambac will recognize approximately
$2,600
in accelerated earnings in the third quarter of 2017 relating to this redemption.
Ballantyne Litigation
On March 25, 2017, Ambac UK agreed in principle to a confidential settlement of litigation brought by Ambac UK in the name of Ballantyne Re plc ("Ballantyne") against J.P. Morgan Investment Management Inc. ("JPMIM") relating to the management of Ballantyne’s investment accounts, which were funded with the proceeds of notes issued in 2006 in connection with a structured reinsurance transaction and guaranteed in part by Ambac UK. On April 11, 2017, Ambac UK, Ballantyne and JPMIM signed a settlement agreement. Pursuant to the settlement, Ballantyne received a payment of
$325,600
from JPMIM in return for releases of all claims by Ballantyne and Ambac UK. As a result of the settlement, Ambac recognized an incremental benefit through a reduction in losses and loss expenses of approximately
$91,600
in the first quarter of 2017. Ambac had previously included an estimated benefit through a reduction of loss and loss expense reserves of approximately
$53,000
related to our probability weighted estimate of the value of the litigation. The total
$144,600
benefit recognized from the settlement of the litigation will reduce the ultimate Ballantyne claims Ambac UK is expecting to pay and not result in a direct cash payment to Ambac UK.
Puerto Rico
On March 13, 2017, the Financial Management and Oversight Board for Puerto Rico (the "Oversight Board") certified the 10-year Fiscal and Economic Growth Plan ("FEGP") for the Commonwealth of Puerto Rico (the “Commonwealth"). The certified FEGP, among other things, was intended to provide Commonwealth creditors a base from which to progress consensual negotiations under Title VI of the
P
uerto Rico Oversight, Management and Economic Stability Act ("PROMESA"). However, the certified FEGP implied a 77% discount to all debt service due to be paid by the Commonwealth and its instrumentalities covered by the FEGP over the ten-years of the plan (FY2017-2026). The FEGP did not provide details regarding its underlying assumptions and data, expense definitions, cause of expense growth or accounting adjustments and did
| Ambac Financial Group, Inc.
8
2017 Second Quarter FORM 10-Q |
AMBAC FINANCIAL GROUP, INC. AND SUBSIDIARIES
Notes to Unaudited Consolidated Financial Statements
(Dollar Amounts in Thousands, Except Share Amounts)
not include any restructuring proposals. These deficiencies of the FEGP, when combined with the absence of sufficient projected cash flows for debt service, increased the uncertainty of whether successful consensual negotiations can be reached.
On April 28, 2017, the Fiscal Agency and Financial Advisory Authority of Puerto Rico (“FAFAA”) released a restructuring proposal covering General Obligation (“GO”), GO-guaranteed, Puerto Rico Sales Tax Financing Corporations ("COFINA"), Puerto Rico Highways and Transportation Authority ("PRHTA"), Puerto Rico Infrastructure Financing Authority ("PRIFA") and Puerto Rico Convention Center District Authority ("CCDA") bonds. Under the proposal, bondholders would receive a “senior bond” based on amounts expected to be available for debt service under the FEGP and a “cash flow bond” that would allow for additional payments if amounts available for debt service exceeded FEGP forecasts. FAFAA’s proposal further provides that GO and GO-guaranteed bondholders would be offered a maximum recovery of 77% (52% senior bond, 25% cash flow bond), COFINA bondholders would receive a maximum recovery of 58% (39% senior bond, 19% cash flow bond), and PRHTA, CCDA, PRIFA, and Metropolitan Bus Authority bondholders would receive a maximum recovery of 30% (0% senior bond, 30% cash flow bond). Recoveries relating to the cash flow bond component could be lower depending upon future surpluses at the General Fund and future new money GO bond issuances. The proposal was premised only on the cash available for debt service included in the certified FEGP, despite challenges from creditors and repeated calls for a review and adjustment of the assumptions underlying such Plan. Among other infirmities, the proposal lacks textured narrative or economic or financial logic for treating Senior and Junior tranches within the COFINA structure as pari passu obligations and fails to explain how the allocation of cashflow between GO and GO-guaranteed bonds and COFINA bonds was derived. The proposal was not accepted by affected bondholders.
On April 29, 2017, the Commonwealth enacted the Fiscal Plan Compliance Act, also known as Act No. 26 (the “Fiscal Plan Compliance Act” or “Act 26-2017”). Articles 4.01 and 4.02 of Chapter 4 of the Fiscal Plan Compliance Act order all public corporations, agencies and instrumentalities of the Government of Puerto Rico to transfer their revenue surplus to the Commonwealth Treasury, after covering operational expenses and obligations, as per the expense budget recommended by the Office of Management and Budget of Puerto Rico for each fiscal year. Article 4.01 further states that such funds would be considered “available resources” for the Commonwealth and would be deposited in the Commonwealth’s General Fund to meet the liquidity requirements contemplated in the FEGP. Article 4.02 empowers a committee composed of the Executive Director of the Fiscal Agency and Financial Advisory Authority of Puerto Rico, the Secretary of the Puerto Rico Treasury Department and the Executive Director of the Office of Management and Budget of Puerto Rico to determine the amount each public corporation and instrumentality would contribute. Such committee is also empowered to revise the sources of revenue of the public corporations, agencies and instrumentalities and adjust, increase or reduce any of their charges, fees, tariffs and similar revenues, with the objective of complying with the metrics stated in the FEGP.
Article 4.03 of Chapter 4 of Act 26-2017, “Exclusions”, explicitly excludes certain entities from coverage of Articles 4.01 and 4.02, including the University of Puerto Rico, the Public Corporation for the Supervision and Insurance of Cooperatives (COSSEC), and funds from public corporations and entities received by private entities for community-related objectives.
While Article 4.03 does not explicitly exclude COFINA from coverage of such Articles 4.01 and 4.02, as it does with other entities, it does state that the Executive Branch shall be authorized to use the COFINA funds, occasionally, solely as a last alternative, and subject to the filing of a sworn certification before the Legislative Assembly. Such sworn certification, which, according to Article 4.03 shall not be interpreted to give the Executive Branch indefinite use of the COFINA funds, must establish the need, term and amount of funds that will be used to cover significant occasional cash flow deficits to comply with the FEGP. An Explicative Declaration of Act 26-2017 signed by the Governor of Puerto Rico on April 29, 2017 states that because COFINA does not generate surpluses, the dispositions of Chapter 4 are not applicable to COFINA. The Explicative Declaration further states that the Fiscal Plan Compliance Act does not refer to other revenues from public corporations except for those determined by fee adjustments of the corporations specifically included in the FEGP. The statements in the Explicative Declaration appear to contradict the statutory language of Articles 4.01, 4.02 and 4.03, resulting in uncertainty about how the Fiscal Plan Compliance Act will be implemented.
In its Chapter 6, the Fiscal Plan Compliance Act also requires that, commencing July 1, 2017, all special funds and other revenues of dependencies and public corporations must be deposited with the Puerto Rico Treasury. The Puerto Rico Secretary of Treasury is authorized to establish the order of priority for the disbursement of payments chargeable to the special funds and other revenues, in accordance with the approved budget and the Fiscal Plan.
On May 1, 2017, Ambac Assurance sent COFINA a notice of failures to comply with covenants and events of default under COFINA’s bond resolution and enabling legislation. Among other things, Ambac Assurance stated that the Commonwealth had violated its covenant not to limit or restrict the right granted by the Resolution or COFINA’s rights to meet its obligations to its bondholders by enacting the Fiscal Plan Compliance Act; that COFINA had violated its covenant to defend, preserve, and protect the pledge of the Dedicated Sales Tax to COFINA and the rights of COFINA’s bondholders under the Resolution against all claims and demands; and that both covenant violations were incurable and therefore constituted immediate Events of Default under the COFINA resolution. Also on May 1, 2017, the COFINA trustee, Bank of New York Mellon (“BNY”), sent a letter to COFINA and the Puerto Rico Fiscal Agency and Financial Advisory Authority stating that the Fiscal Plan Compliance Act was inconsistent with COFINA’s and the Commonwealth’s covenants under COFINA’s resolution and enabling legislation, and seeking a response detailing any curative action either intended to take. On May 4, 2017, BNY sent COFINA a notice of default arising out of the Fiscal Plan Compliance Act, and stated that the defaults by COFINA and the Commonwealth would be deemed Events of Default under the COFINA resolution if left uncured within 30 days of Ambac’s May 1, 2017 letter noticing the defaults. Later on May 4, 2017, Ambac Assurance, together
| Ambac Financial Group, Inc.
9
2017 Second Quarter FORM 10-Q |
AMBAC FINANCIAL GROUP, INC. AND SUBSIDIARIES
Notes to Unaudited Consolidated Financial Statements
(Dollar Amounts in Thousands, Except Share Amounts)
with holders of more than 25% of the senior COFINA bonds, sent a letter to BNY demanding immediate acceleration of all senior bonds issued by COFINA. On May 16, 2017, BNY filed an interpleader action in COFINA’s Title III case against COFINA and certain creditors of COFINA, including Ambac Assurance, that have made competing claims of entitlement to funds held by BNY. This action will resolve the parties’ respective entitlements to the funds, including a determination of whether an Event of Default have occurred under the COFINA resolution.
On May 2, 2017, the Oversight Board certified a ten-year fiscal plan (the “PRHTA Fiscal Plan”) for the Puerto Rico Highways and Transportation Authority (“PRHTA”). The PRHTA Fiscal Plan reflects an expectation that the Puerto Rico Treasury and PRHTA will temporarily cease funding debt service payments in July of 2017. The PRHTA Fiscal Plan states that as a result of the “clawback” of certain revenues pledged to PRHTA, PRHTA has insufficient cash flow to service debt. It is currently unclear when the funding of PRHTA debt service payments with pledged revenues will resume.
The Governor signed into law Act No. 1 of 2017, on January 11, 2017, which amended the Commonwealth’s Public-Private Partnership Act (Act No. 29 of 2009) ("P3 Act") authorizing the Public-Private Partnerships Authority (“P3A”) to facilitate privatization agreements between Partnering Government Entities (as such term is defined in the P3 Act) and private entities. The 2017 amendments allow the P3A to receive and consider unsolicited or voluntary proposals from proponents that meet the minimum criteria set forth in the P3 Act, whereas prior to the 2017 amendments, proposals could only be received in response to a P3A request for proposals. Direct negotiations with proponents of unsolicited or voluntary proposals may be conducted without a request for qualifications or a request for proposals process if the P3A determines that certain criteria have been met. The 2017 amendments also permit the use of the initial and/or periodical payments received from any partnership for contributions to the retirement systems of the Government of Puerto Rico, in addition to other uses provided for by the P3 Act, including the payment of debts of Partnering Government Entities. It is unclear how Puerto Rico will make use of the law and to what extent it will impact the obligations that we insure.
In response to letter requests from Governor Rosselló, the Oversight Board commenced a Title III proceeding for the Commonwealth of Puerto Rico on May 3, 2017 and for COFINA on May 5, 2017. Subsequently
,
the
Oversight Board commenced a Title III proceeding for the Employees Retirement System and PRHTA on May 21, 2017, and for the Puerto Rico Electric Power Authority on July 2, 2017. Ambac Assurance has not issued any financial guaranty policies with respect to obligations of the Employees Retirement System or the Puerto Rico Electric Power Authority. As part of the Title III filings for the Commonwealth and COFINA, the Oversight Board noted that the Oversight Board and the Commonwealth intend to continue pursuing consensual negotiations under the protection of the Title III automatic stay.
On June 14, 2017, Judge Laura Taylor Swain entered an order appointing a team of mediators to facilitate confidential mediation discussions in order to facilitate consensual resolution of certain issues arising in the context of these Title III cases. The mediation team is led by Chief Judge Barbara Houser of the United States Bankruptcy Court for the Northern District of Texas, and consists of Circuit Judge Thomas Ambro of the United States Court of Appeals for the Third Circuit, Senior District Judge Nancy Atlas of the United States District Court for the Southern District of Texas, Bankruptcy Judge Christopher Klein of the United States Bankruptcy Court for the Eastern District of California, and Senior District Judge Victor Marrero of the United States District Court for the Southern District of New York. The mediators held an introductory mediation session, primarily for scheduling and housekeeping matters, on July 12, 2017. The mediators requested initial, confidential mediation statements identifying the issues to be discussed in the mediation(s) and the order in which the issues presented are to be taken up by July 24, 2017. The substantive mediation process is not expected to get underway until September. No assurances can be given that consensual resolutions will be achieved with respect to the Commonwealth’s or COFINA’s obligations or those of any other Puerto Rico instrumentality. In addition, Ambac is uncertain how the Title III process will be implemented and to what extent the rights of Ambac Assurance will be respected as part of that process.
On June 30, 2017, the Oversight Board certified the Commonwealth’s fiscal year 2018 budget, which is largely compliant with the FEGP. The budget does not allocate funds for debt service, stating only that it will do so after a Title III plan of adjustment or Title VI agreement is approved by the Court.
Ambac Assurance is party to nine litigations related to its Puerto Rico exposures. These include three litigations challenging the constitutionality and legality of the FEGP and the Fiscal Plan Compliance Act, discussed below under
Note 11. Commitments and Contingencies
, one of which is an adversary proceeding actively pending in PRHTA’s Title III proceedings
.
Ambac Assurance filed several of those cases to protect and assert its rights under transaction documents and applicable law. Six of these litigations are stayed under Title III of PROMESA, and one has been stayed by order of the United States District Court for the District of Puerto Rico pending resolution of an interpleader action related to COFINA funds (to which interpleader action Ambac is also a party). Accordingly, Ambac is unable to predict when and how the issues raised in those cases will be resolved. If Ambac Assurance is unsuccessful with any of these challenges, Ambac’s financial condition, including liquidity, loss reserves and capital resources may suffer a material negative impact.
Ambac has considered these developments and other factors in evaluating its Puerto Rico loss reserves. During the
six months ended June 30, 2017
, Ambac had incurred losses associated with its Domestic Public Finance insured portfolio of
$221,604
, which was significantly impacted by the continued uncertainty and volatility of the situation in Puerto Rico. While management believes its reserves are adequate to cover losses in its Public Finance insured portfolio, there can be no assurance that Ambac may not incur additional losses in the future, particularly given the developing economic, political, and legal circumstances in Puerto Rico. Such additional losses may have a material adverse effect on Ambac’s results of operations and financial condition. For public finance credits, including Puerto Rico, as well as other issuers, for which Ambac has
| Ambac Financial Group, Inc.
10
2017 Second Quarter FORM 10-Q |
AMBAC FINANCIAL GROUP, INC. AND SUBSIDIARIES
Notes to Unaudited Consolidated Financial Statements
(Dollar Amounts in Thousands, Except Share Amounts)
an estimate of expected loss at June 30, 2017, the possible increase in loss reserves under stress or other adverse conditions and circumstances was estimated to be approximately
$1.6
billion. However, there can be no assurance that losses may not exceed such amount.
2. BASIS OF PRESENTATION AND SIGNIFICANT ACCOUNTING POLICIES
The Company has disclosed its significant accounting policies in
Note 2. Basis of Presentation and Significant Accounting Policies
in the Notes to Consolidated Financial Statements included in the Company’s Annual Report on Form 10-K for the year ended
December 31, 2016
. The following significant accounting policies provide an update to those included in the Company’s Annual Report on Form 10-K.
Basis of Presentation
The accompanying unaudited consolidated financial statements have been prepared in accordance with U.S. generally accepted accounting principles ("GAAP") for interim financial reporting and with the instructions to Form 10-Q and Article 10 of Regulation S-X. Accordingly, they do not include all of the information and disclosures required by GAAP for annual periods. These financial statements should be read in conjunction with the consolidated financial statements and notes thereto included in the Annual Report on Form 10-K for the year ended
December 31, 2016
. The accompanying consolidated financial statements have not been audited by an independent registered public accounting firm in accordance with the standards of the Public Company Accounting Oversight Board (U.S.), but in the opinion of management such financial statements include all adjustments necessary for the fair presentation of the Company’s consolidated financial position and results of operations. All intercompany balances and transactions have been eliminated. The results of operations for the
three and six months ended June 30, 2017
may not be indicative of the results that may be expected for the year ending
December 31, 2017
. The
December 31, 2016
consolidated balance sheet was derived from audited financial statements.
The preparation of financial statements requires management to make estimates and assumptions that affect the reported amounts of assets and liabilities and disclosures of contingent assets and liabilities at the date of the financial statements, and the reported amounts of revenues and expenses during the reporting period. Actual results could differ from those estimates. As additional information becomes available or actual amounts become determinable, the recorded estimates are revised and reflected in operating results.
Foreign Currency:
Financial statement accounts expressed in foreign currencies are translated into U.S. dollars in accordance with the Foreign Currency Matters Topic of the ASC. The functional currencies of Ambac's subsidiaries are the local currencies of the country where the respective subsidiaries are based, which are also the primary operating environments in which the subsidiaries operate.
Foreign currency translation
: Functional currency assets and liabilities of Ambac’s foreign subsidiaries are translated into U.S. dollars using exchange rates in effect at the balance sheet dates and the related translation adjustments, net of deferred taxes, are included as a component of Accumulated Other Comprehensive Income in Stockholders' Equity. Consolidated Statements of Total Comprehensive Income (Loss) accounts expressed in functional currencies are translated using average exchange rates.
Foreign currency transactions
: The impact of non-functional currency transactions and the remeasurement of non-functional currency assets and liabilities into the respective subsidiaries' functional currency (collectively "foreign currency transactions gains/(losses)") are
$14,786
and
$(29,150)
for the
six months ended
June 30, 2017 and 2016
. Foreign currency transactions gains/(losses) are primarily the result of remeasuring Ambac UK's assets and liabilities denominated in currencies other than its functional currency, primarily the U.S. dollar and the Euro. The significant components of foreign currency transaction gains/(losses), including the respective classifications in the Consolidated Statement of Total Comprehensive Income, are as follows:
|
•
|
Remeasurement of loss reserves, classified in Loss and loss expenses, in the amount of
$17,622
and
$(48,260)
for the
six months ended
June 30, 2017 and 2016
, respectively;
|
|
•
|
Realized gain (losses) from the sale of investment securities and the unrealized gains (losses) of trading and short-term investment securities, classified in Net realized investment gains, in the amount of
$(432)
and
$13,632
for the
six months ended
June 30, 2017 and 2016
, respectively;
|
|
•
|
Remeasurement of premium receivables, classified in Other income, in the amount of
$(981)
and
$6,945
for the
six months ended
June 30, 2017 and 2016
, respectively;
|
|
•
|
Remeasurement of cash held, classified in Other income, in the amount of
$(503)
and
$(965)
for the
six months ended
June 30, 2017 and 2016
, respectively and
|
|
•
|
Remeasurement of credit derivative liabilities, classified in Net change in fair value of credit derivative, in the amount of
$(920)
and
$(502)
for the
six months ended
June 30, 2017 and 2016
, respectively.
|
Reclassifications:
Certain reclassifications may have been made to prior years' amounts to conform to the current year's presentation.
| Ambac Financial Group, Inc.
11
2017 Second Quarter FORM 10-Q |
AMBAC FINANCIAL GROUP, INC. AND SUBSIDIARIES
Notes to Unaudited Consolidated Financial Statements
(Dollar Amounts in Thousands, Except Share Amounts)
Recently Adopted Accounting Standards:
Effective January 1, 2017, Ambac adopted the following accounting standards:
Consolidation of Variable Interest Entities - Decision Makers
In October 2016, the FASB issued ASU 2016-17,
Consolidation (Topic 810) - Interests Held through Related Parties That Are under Common Control
. The new guidance changes how a reporting entity that is a single decision maker for a VIE will consider its indirect interests in that VIE when determining whether the reporting entity is the primary beneficiary and should consolidate the VIE. Under previous GAAP, a single decision maker in a VIE is required to consider an indirect interest held by a related party under common control in its entirety. Under the new ASU, the single decision maker will consider the indirect interest on a proportionate basis. Adoption of this ASU did not have an impact on Ambac's financial statements.
Improvements to Employee Share-Based Payment Accounting
In March 2016, the FASB issued ASU 2016-09,
Compensation-Stock Compensation (Topic 718) - Improvements to Employee Share-Based Payment Accounting
. The objective of this ASU is to improve and simplify the accounting for employee share-based payment accounting. The amendments are as follows: (i) recognizing excess tax benefits and tax deficiencies as income tax expense, (ii) recognizing excess tax benefits regardless of whether it reduces taxes payable in the current period, (iii) classifying excess tax benefits related to share-based payments along with other income tax cash flows as an operating activity on the statement of cash flows, (iv) for purposes of accruing compensation costs, allowing companies to make an accounting policy election to either: a) estimate forfeitures or b) account for forfeitures as they occur, which Ambac elected to do upon adoption, (v) to qualify for equity classification treatment, permitting tax withholding by employees up to the maximum statutory tax rate and (vi) classifying cash paid by an employer to a taxing authority when directly withholding shares as a financing activity on the statement of cash flows. Adoption of this ASU did not have a material impact on Ambac's financial statements.
Equity Method of Accounting
In March 2016, the FASB issued ASU 2016-07,
Investments-Equity Method and Joint Ventures (Topic 323) - Simplifying the Transition to the Equity Method of Accounting
. This ASU eliminates the requirement that when an investment qualifies for use of the equity method as a result of an increase in the level of ownership interest or degree of influence, an investor must adjust the investment, results of operations, and retained earnings retroactively as if the equity method had been in effect during all previous periods that the investment had been owned. The ASU will now require that at the date an available-for-sale equity security becomes qualified for the equity method of accounting, the reporting entity will recognize through earnings the unrealized holding gain or loss in accumulated other comprehensive income. Adoption of this ASU did not have an impact on Ambac's financial statements.
Contingent Put and Call Options in Debt Instruments
In March 2016, the FASB issued ASU 2016-06,
Derivatives and Hedging (Topic 815) - Contingent Put and Call Options in Debt Instruments
. Previous accounting rules required that embedded derivatives be separated from the host contract in a financial instrument and accounted for separately as derivatives if certain criteria are met. One of these criteria is that the economic characteristics and risks of the embedded derivatives are not "clearly and closely related" to the host contract. The objective of the ASU is to resolve diversity in practice in assessing embedded contingent put and call options. The ASU clarifies what steps are required when assessing whether the economic characteristics and risk of put and call options are clearly and closely related to their debt host contracts. Adoption of this ASU did not have an impact on Ambac's financial statements.
Future Application of Accounting Standards:
Equity-linked instruments with down round features
In July 2017, the FASB issued ASU 2017-11,
Earnings Per Share (Topic 260) and Derivatives and Hedging (Topic 815) - Accounting for Certain Financial Instruments with Down Round Features
. Equity-linked instruments, such as warrants and convertible instruments may contain down round features that result in the strike price being reduced on the basis of the pricing of future equity offerings. Under the ASU, a down round feature will no longer require a freestanding equity-linked instrument (or embedded conversion option) to be classified as a liability that is remeasured at fair value through the income statement (i.e. marked-to-market). However, other features of the equity-linked instrument (or embedded conversion option) must still be evaluated to determine whether liability or equity classification is appropriate. Equity classified instruments are not marked-to-market. For earnings per share ("EPS") reporting, the ASU requires companies to recognize the effect of the down round feature only when it is triggered by treating it as a dividend and as a reduction of income available to common shareholders in basic EPS. The amendments in this ASU are effective for all entities for fiscal years, and interim periods within those fiscal years, beginning after December 15, 2018. Early adoption is permitted, including adoption in any interim period. We have not determined whether Ambac will early adopt this ASU. The adoption of this ASU is not expected to have a material impact on Ambac's financial statements.
The ASU also contains accounting guidance on mandatorily redeemable financial instruments that is only applicable to nonpublic companies.
| Ambac Financial Group, Inc.
12
2017 Second Quarter FORM 10-Q |
AMBAC FINANCIAL GROUP, INC. AND SUBSIDIARIES
Notes to Unaudited Consolidated Financial Statements
(Dollar Amounts in Thousands, Except Share Amounts)
Stock Compensation--Scope of Modification Accounting
In May 2017, the FASB issued ASU 2017-09,
Compensation-Stock Compensation (Topic 718) - Scope of Modification Accounting
. The ASU provides guidance about which changes to the terms or conditions of a share-based payment award require an entity to apply modification accounting. Entities will apply the modification accounting guidance if the value, vesting conditions or classification of the award changes. The current disclosure requirements in Topic 718 apply regardless of whether an entity is required to apply modification accounting under the amendments in this ASU. The amendments in this ASU are effective for all entities for annual periods, and interim periods within those annual periods, beginning after December 15, 2017. Early adoption is permitted, including adoption in any interim period for which financial statements have not yet been issued. Ambac will adopt this ASU on January 1, 2018. The adoption of this ASU is not expected to have a consequential impact on Ambac's financial statements.
Premium Amortization on Callable Debt Securities
In March 2017, the FASB issued ASU 2017-08,
Receivables-Nonrefundable Fees and Other Costs (Subtopic 310-20) - Premium Amortization on Purchased Callable Debt Securities
. The ASU shortens the amortization period for the premium on callable debt securities to the earliest call date. Under current GAAP, a reporting entity generally amortizes the premium as yield adjustment over the contractual life (i.e. maturity) of the debt security and if that debt security is called, the entity would record a loss equal to the unamortized premium. The ASU does not change the accounting for callable debt securities held at a discount, which will continue to be amortized to maturity. ASU 2017-08 is effective for fiscal years beginning after December 15, 2018, and interim periods within those fiscal years, with early adoption permitted. The ASU must be applied on a modified retrospective basis through a cumulative-effect adjustment directly to retained earnings as of the beginning of the period of adoption. We have not determined whether Ambac will early adopt this ASU and are evaluating the impact on Ambac's financial statements.
Net Periodic Pension and Postretirement Costs
In March 2017, the FASB issued ASU 2017-07,
Compensation-Retirement Benefits (Topic 715) - Improving the Presentation of Net Periodic Pension Cost and Net Periodic Postretirement Benefit Cost
. The objective of the ASU is to increase transparency in the reporting of net pension cost and net postretirement cost (collectively "net benefit cost"). The ASU requires that the service cost component of net benefit cost be reported on the same line item as other compensation costs arising from services rendered by employees. It further requires that the other components of net benefit costs (i.e. interest costs, amortization of prior service cost, etc.) be presented separately from the service cost component and outside the subtotal of income from operations, if one is presented. ASU 2017-09 is effective for fiscal years beginning after December 15, 2017 and interim periods within those fiscal years, with early adoption permitted. Ambac will adopt this ASU on January 1, 2018. The adoption of this ASU is not expected to have a consequential impact on Ambac's financial statements.
3. SPECIAL PURPOSE ENTITIES, INCLUDING VARIABLE INTEREST ENTITIES
Ambac, with its subsidiaries, has engaged in transactions with special purpose entities, including VIEs, in various capacities.
|
•
|
Ambac most commonly provides financial guarantees, including credit derivative contracts, for various debt obligations issued by special purpose entities, including VIEs ("FG VIEs").
|
|
•
|
Ambac sponsors special purpose entities that issued notes to fund the purchase of certain financial assets.
|
|
•
|
Ambac monetized its ownership of the junior surplus note issued to it by the Segregated Account by depositing the junior surplus note into a newly formed VIE trust in exchange for cash and an owner trust certificate, which represents Ambac's right to residual cash flows from the junior surplus note.
|
|
•
|
Ambac is an investor in collateralized debt obligations, mortgage-backed and other asset-backed securities issued by VIEs and its ownership interest is generally insignificant to the VIE and/or Ambac does not have rights that direct the activities that are most significant to such VIE.
|
FG VIEs:
Ambac’s subsidiaries provide financial guarantees in respect of assets held or debt obligations of special purpose entities, including VIEs. Ambac’s primary variable interest exists through this financial guarantee insurance or credit derivative contract. The transaction structures provide certain financial protection to Ambac. This financial protection can take several forms; however, the most common are over-collateralization, first loss and excess spread. In the case of over-collateralization (i.e., the principal amount of the securitized assets exceeds the principal amount of the debt obligations guaranteed), the structure allows the transaction to experience defaults among the securitized assets before a default is experienced on the debt obligations that have been guaranteed by Ambac’s subsidiaries. In the case of first loss, the financial guarantee insurance policy or credit derivative contract only covers a senior layer of losses on assets held or debt issued by special purpose entities, including VIEs. The first loss with respect to the assets is either retained by the asset seller or sold off in the form of equity or mezzanine debt to other investors. In the case of excess spread, the securitized assets contributed to special purpose entities, including VIEs, generate interest cash flows that are in excess of the interest payments on the related debt; such excess cash flow is applied to redeem debt, thus creating over-collateralization. Generally, upon deterioration in the performance of a transaction or upon an event of default as specified in the transaction legal documents, Ambac will
| Ambac Financial Group, Inc.
13
2017 Second Quarter FORM 10-Q |
AMBAC FINANCIAL GROUP, INC. AND SUBSIDIARIES
Notes to Unaudited Consolidated Financial Statements
(Dollar Amounts in Thousands, Except Share Amounts)
obtain certain loss remediation rights. These rights may enable Ambac to direct the activities of the entity that most significantly impact the entity’s economic performance.
We determined that Ambac’s subsidiaries generally have the obligation to absorb a FG VIE's expected losses given that they have issued financial guarantees supporting the liabilities (and in certain cases assets). As further described below, we consolidated certain FG VIEs because: (i) we determined for certain transactions that experienced the aforementioned performance deterioration, that Ambac’s subsidiaries had the power, through voting rights or similar rights, to direct the activities that most significantly impact the VIE’s economic performance because certain triggers had been breached in these transactions resulting in Ambac's subsidiaries' ability to exercise certain loss remediation activities, or (ii) due to the passive nature of the VIEs’ activities, Ambac’s subsidiaries’ contingent loss remediation rights upon a breach of certain triggers in the future is considered to be the power to direct the activities that most significantly impact the VIEs’ economic performance. With respect to existing VIEs involving Ambac financial guarantees, Ambac is generally required to consolidate a VIE in the period that applicable triggers result in Ambac having control over the VIE’s most significant economic activities. In connection with the potential exit from Rehabilitation of the Segregated Account, as further described in
Note 1. Background and Business Description
, Ambac will need to evaluate consolidation of certain VIEs in the event certain rights are obtained by Ambac Assurance. Ambac has been informed by the OCI that they intend maintain certain control rights for policies that are currently allocated to the Segregated Account. Accordingly management expects the number of additional VIEs that may be consolidated as a result of the Segregated Account's potential exit from Rehabilitation will be reduced and possibly eliminated. A VIE is deconsolidated in the period that Ambac no longer has such control, which could occur in connection with the execution of remediation activities on the transaction or amortization of insured exposure, any of which may reduce the degree of Ambac’s control over a VIE. Assets and liabilities of FG VIEs that are consolidated are reported within Variable interest entity assets or Variable interest entity liabilities on the Consolidated Balance Sheets. The net results from such FG VIEs are reported within Income (loss) on variable interest entities in the Consolidated Statements of Total Comprehensive Income (Loss).
Upon initial consolidation of a FG VIE, we recognize a gain or loss in earnings for the difference between: (i) the fair value of the consideration paid, the fair value of any non-controlling interests and the reported amount of any previously held interests and (ii) the net amount, as measured on a fair value basis, of the assets and liabilities consolidated. Upon deconsolidation of a FG VIE, we recognize a gain or loss for the difference between: (i) the fair value of any consideration received, the fair value of any retained non-controlling investment in the VIE and the carrying amount of any non-controlling interest in the VIE and (ii) the carrying amount of the VIE’s assets and liabilities. Gains or losses from consolidation and deconsolidation that are reported in earnings are reported within Income (loss) on variable interest entities on the Consolidated Statements of Total Comprehensive Income (Loss).
The impact of consolidating such FG VIEs on Ambac’s balance sheet is the elimination of transactions between the consolidated FG VIEs and Ambac’s operating subsidiaries and the inclusion of the FG VIE’s third party assets and liabilities. For a financial guarantee insurance policy issued to a consolidated VIE, Ambac does not reflect the financial guarantee insurance policy in accordance with the related insurance accounting rules under the Financial Services – Insurance Topic of the ASC. Consequently, upon consolidation, Ambac eliminates the insurance assets and liabilities associated with the policy from the Consolidated Balance Sheets. Such insurance assets and liabilities may include premium receivables, reinsurance recoverable, deferred ceded premium, subrogation recoverable, unearned premiums, loss and loss expense reserves, ceded premiums payable and insurance intangible assets. For investment securities owned by Ambac that are debt instruments issued by the VIE, the investment securities balance is eliminated upon consolidation.
As of
June 30, 2017
consolidated FG VIE assets and liabilities relating to
12
consolidated entities were
$14,095,210
and
$13,967,628
, respectively. As of
December 31, 2016
, consolidated FG VIE assets and liabilities relating to
12
consolidated entities were
$13,367,834
and
$13,235,425
, respectively. As of both
June 30, 2017
and
December 31, 2016
,
eight
and
four
consolidated FG VIEs related to transactions insured by Ambac UK and Ambac Assurance, respectively. As of
June 30, 2017
, FG VIE assets and liabilities of
$13,700,687
and
$13,583,319
and as of
December 31, 2016
, FG VIE assets and liabilities of
$12,950,009
and
$12,833,466
related to transactions guaranteed by Ambac UK. The remaining balance of consolidated FG VIE assets and liabilities are related to transactions guaranteed by Ambac Assurance. Ambac is not primarily liable for, and generally does not guarantee all of the debt obligations issued by the VIEs. Ambac would only be required to make payments on the VIE debt obligations in the event that the issuer of such debt obligations defaults on any principal or interest due and such obligation is guaranteed by Ambac. Additionally, Ambac’s general creditors, other than those specific policy holders which own the VIE debt obligations, do not have rights with regard to the assets of the VIEs. Ambac evaluates the net income effects and earnings per share effects to determine attributions between Ambac and non-controlling interests as a result of consolidating a VIE. Ambac has determined that the net income and earnings per share effect of most consolidated FG VIEs are attributable to Ambac’s interests through financial guarantee premium and loss payments with the VIE.
Below is a schedule detailing the change in fair value of the various financial instruments within the consolidated FG VIEs, along with gains (losses) from consolidating and deconsolidating FG VIEs, that together comprise Income (loss) on variable interest entities for the affected periods:
| Ambac Financial Group, Inc.
14
2017 Second Quarter FORM 10-Q |
AMBAC FINANCIAL GROUP, INC. AND SUBSIDIARIES
Notes to Unaudited Consolidated Financial Statements
(Dollar Amounts in Thousands, Except Share Amounts)
|
Three Months Ended June 30,
|
Six Months Ended June 30,
|
|||||||||||||||
|
2017
|
2016
|
2017
|
2016
|
|||||||||||||
|
Income (loss) on changes related to:
|
||||||||||||||||
|
Net fair value of VIE assets and liabilities
|
$
|
(1,219
|
)
|
$
|
8,987
|
|
$
|
2,482
|
|
$
|
(18,176
|
)
|
||||
|
Consolidation / Deconsolidation
|
—
|
|
—
|
|
—
|
|
—
|
|
||||||||
|
Income (loss) on Variable Interest Entities
|
$
|
(1,219
|
)
|
$
|
8,987
|
|
$
|
2,482
|
|
$
|
(18,176
|
)
|
||||
Ambac consolidated
zero
and deconsolidated
zero
VIEs for the
three and six months ended June 30, 2017 and 2016
.
The table below provides the fair value of fixed income securities, by asset-type, held by consolidated VIEs as of
June 30, 2017 and December 31, 2016
:
|
June 30,
2017 |
December 31,
2016 |
||||||
|
Investments:
|
|||||||
|
Corporate obligations
|
$
|
2,722,316
|
|
$
|
2,622,566
|
|
|
|
Total variable interest entity assets: fixed income securities
|
$
|
2,722,316
|
|
$
|
2,622,566
|
|
|
The following table provides supplemental information about the loans held as assets and long-term debt associated with the VIEs for which the fair value option has been elected as of
June 30, 2017 and December 31, 2016
:
|
Estimated fair value
|
Unpaid principal balance
|
||||||
|
June 30, 2017:
|
|||||||
|
Loans
|
$
|
11,301,298
|
|
$
|
7,913,293
|
|
|
|
Long-term debt
|
11,902,682
|
|
9,144,036
|
|
|||
|
December 31, 2016:
|
|||||||
|
Loans
|
$
|
10,658,963
|
|
$
|
7,641,756
|
|
|
|
Long-term debt
|
11,155,936
|
|
8,854,530
|
|
|||
Ambac Sponsored VIEs:
A subsidiary of Ambac transferred financial assets to a special purpose entity. The business purpose of this entity was to provide certain financial guarantee clients with funding for their debt obligations. This special purpose entity was established as a separate legal entity, demonstrably distinct from Ambac and that Ambac, its affiliates or its agents could not unilaterally dissolve. The permitted activities of this entity was contractually limited to purchasing assets from Ambac, issuing medium-term notes (“MTNs”) to fund such purchases, executing derivative hedges and obtaining financial guarantee policies with respect to indebtedness incurred. Ambac has not consolidated this entity because Ambac Assurance’s policies issued to this entity were allocated to the Segregated Account, thereby limiting Ambac’s control over the entity's most significant economic activities. Ambac has elected to account for its equity interest in this entity at fair value under the fair value option in accordance with the Financial Instruments Topic of the ASC. We believe that the fair value of the investments in this entity provides for greater transparency for recording profit or loss as compared to the equity method under the Investments – Equity Method and Joint Ventures Topic of the ASC. Refer to
Note 7. Fair Value Measurements
for further information on the valuation technique and inputs used to measure the fair value of Ambac’s equity interest in this entity. At
June 30, 2017 and December 31, 2016
the fair value of this entity was
$6,691
and
$7,382
, respectively, and is reported within Other assets on the Consolidated Balance Sheets.
|
•
|
Total principal amount of debt outstanding was
$409,830
and
$388,950
at
June 30, 2017 and December 31, 2016
, respectively. In each case, Ambac sold assets to this entity. The assets are composed of utility obligations with a weighted average rating of
BBB+
at
June 30, 2017
and weighted average life of
4.9 years
. The purchase by this entity of financial assets was financed through the issuance of MTNs, which are cross-collateralized by the purchased assets. The MTNs have the same expected weighted average life as the purchased assets. Derivative contracts (interest rate swaps) are used within the entity for economic hedging purposes only. Derivative positions were established at the time MTNs were issued to purchase financial assets. As of
June 30, 2017
Ambac Assurance had financial guarantee insurance policies issued for all assets, MTNs and derivative contracts owned and outstanding by the entity.
|
|
•
|
Insurance premiums paid to Ambac Assurance by this entity is earned in a manner consistent with other insurance policies, over the risk period. Additionally, any losses incurred on such insurance policies are included in Ambac’s Consolidated Statements of Total Comprehensive Income (Loss). Under the terms of an Administrative Agency Agreement, Ambac provides certain administrative duties, primarily collecting amounts due on the obligations and making interest payments on the MTNs.
|
| Ambac Financial Group, Inc.
15
2017 Second Quarter FORM 10-Q |
AMBAC FINANCIAL GROUP, INC. AND SUBSIDIARIES
Notes to Unaudited Consolidated Financial Statements
(Dollar Amounts in Thousands, Except Share Amounts)
In July 2015, Ambac Assurance entered into a secured borrowing transaction whereby it sold
17
Ambac insured residential mortgage-backed securities (the "Securities") and all rights associated therewith as of May 31, 2015, to a Delaware statutory trust (the "Trust") in exchange for an equity certificate in the Trust, all financial guarantee claim payments associated with the Securities and cash of
$146,000
(prior to expenses associated with the transaction). Although the Securities were legally sold to the Trust, the Securities will remain in Invested assets on the Consolidated Balance Sheets. The Securities had par and fair value of
$311,528
and
$352,446
as of
June 30, 2017
, respectively. Refer to
Note 8. Investments
for further discussion of the restrictions on the invested assets. At the same time, a second Delaware statutory trust (the "Issuer"), issued
$146,000
of debt securities and used the proceeds, together with an equity certificate of the Issuer, to purchase from the Trust a certificate secured by and entitling the Issuer to all principal and interest payments (other than financial guarantee claim payments) on the Securities. Interest on the debt securities is payable monthly at an annual rate of one month LIBOR +
2.8%
. Both the Trust and the Issuer are consolidated VIEs because Ambac Assurance was involved in their design and holds a significant amount of the beneficial interests issued by the VIEs or guaranteed the assets held by the VIEs. VIE debt outstanding to third parties under this secured borrowing transaction had a carrying value of
$85,981
and
$102,403
as of
June 30, 2017 and December 31, 2016
, respectively, and is reported in Long-Term Debt on the Consolidated Balance Sheets.
Variable Interests in Non-Consolidated VIEs
On August 28, 2014, Ambac monetized its ownership of the junior surplus note issued to it by the Segregated Account by depositing the junior surplus note into a newly formed VIE trust in exchange for cash and an owner trust certificate, which represents Ambac's right to residual cash flows from the junior surplus note. Ambac does not consolidate the VIE. Ambac reports its interest in the VIE as an equity investment within Other investments on the Consolidated Balance Sheets with associated results from operations included within Net investment income: Other investments on the Consolidated Statements of Total Comprehensive Income (Loss). The equity investment had a carrying value of
$32,418
and
$30,003
as of
June 30, 2017 and December 31, 2016
, respectively.
The following table displays the carrying amount of the assets, liabilities and maximum exposure to loss of Ambac’s variable interests in non-consolidated VIEs resulting from financial guarantee and derivative contracts by major underlying asset classes, as of
June 30, 2017 and December 31, 2016
:
|
Carrying Value of Assets and Liabilities
|
|||||||||||||||
|
Maximum
Exposure To Loss (1) |
Insurance
Assets (2) |
Insurance
Liabilities (3) |
Net Derivative
Assets (Liabilities) (4) |
||||||||||||
|
June 30, 2017:
|
|||||||||||||||
|
Global structured finance:
|
|||||||||||||||
|
Collateralized debt obligations
|
$
|
453,698
|
|
$
|
188
|
|
$
|
3,155
|
|
$
|
(25
|
)
|
|||
|
Mortgage-backed—residential
|
14,003,635
|
|
692,759
|
|
3,169,649
|
|
—
|
|
|||||||
|
Other consumer asset-backed
|
2,320,779
|
|
25,356
|
|
329,504
|
|
—
|
|
|||||||
|
Other commercial asset-backed
|
1,515,903
|
|
64,285
|
|
64,993
|
|
—
|
|
|||||||
|
Other
|
2,727,962
|
|
62,624
|
|
319,324
|
|
12,051
|
|
|||||||
|
Total global structured finance
|
21,021,977
|
|
845,212
|
|
3,886,625
|
|
12,026
|
|
|||||||
|
Global public finance
|
25,762,817
|
|
347,529
|
|
384,444
|
|
(8,973
|
)
|
|||||||
|
Total
|
$
|
46,784,794
|
|
$
|
1,192,741
|
|
$
|
4,271,069
|
|
$
|
3,053
|
|
|||
|
December 31, 2016:
|
|||||||||||||||
|
Global structured finance:
|
|||||||||||||||
|
Collateralized debt obligations
|
$
|
761,451
|
|
$
|
218
|
|
$
|
3,319
|
|
$
|
(145,402
|
)
|
|||
|
Mortgage-backed—residential
|
14,859,909
|
|
725,106
|
|
3,118,892
|
|
—
|
|
|||||||
|
Other consumer asset-backed
|
2,391,604
|
|
26,758
|
|
302,335
|
|
—
|
|
|||||||
|
Other commercial asset-backed
|
1,686,256
|
|
66,277
|
|
64,961
|
|
—
|
|
|||||||
|
Other
|
2,963,521
|
|
66,091
|
|
412,929
|
|
13,347
|
|
|||||||
|
Total global structured finance
|
22,662,741
|
|
884,450
|
|
3,902,436
|
|
(132,055
|
)
|
|||||||
|
Global public finance
|
25,608,471
|
|
338,587
|
|
359,142
|
|
(8,827
|
)
|
|||||||
|
Total
|
$
|
48,271,212
|
|
$
|
1,223,037
|
|
$
|
4,261,578
|
|
$
|
(140,882
|
)
|
|||
|
(1)
|
Maximum exposure to loss represents the maximum future payments of principal and interest on insured obligations and derivative contracts plus Deferred Amounts and accrued and unpaid interest thereon. Ambac’s maximum exposure to loss does not include the benefit of any financial instruments (such as reinsurance or hedge contracts) that Ambac may utilize to mitigate the risks associated with these variable interests.
|
|
(2)
|
Insurance assets represent the amount recorded in “Premium receivables” and “Subrogation recoverable” for financial guarantee contracts on Ambac’s Consolidated Balance Sheets.
|
| Ambac Financial Group, Inc.
16
2017 Second Quarter FORM 10-Q |
AMBAC FINANCIAL GROUP, INC. AND SUBSIDIARIES
Notes to Unaudited Consolidated Financial Statements
(Dollar Amounts in Thousands, Except Share Amounts)
|
(3)
|
Insurance liabilities represent the amount recorded in “Loss and loss expense reserves” and “Unearned premiums” for financial guarantee contracts on Ambac’s Consolidated Balance Sheets.
|
|
(4)
|
Net derivative assets (liabilities) represent the fair value recognized on credit derivative contracts and interest rate swaps on Ambac’s Consolidated Balance Sheets.
|
4. COMPREHENSIVE INCOME
The following tables detail the changes in the balances of each component of accumulated other comprehensive income for the affected periods:
|
Unrealized Gains
(Losses) on Available for Sale Securities (1) |
Amortization of
Postretirement Benefit (1) |
Gain (Loss) on
Foreign Currency Translation (1) |
Total
|
||||||||||||
|
Three Months Ended June 30, 2017:
|
|||||||||||||||
|
Beginning Balance
|
$
|
140,198
|
|
$
|
11,654
|
|
$
|
(154,627
|
)
|
$
|
(2,775
|
)
|
|||
|
Other comprehensive income (loss) before reclassifications
|
15,070
|
|
—
|
|
29,292
|
|
44,362
|
|
|||||||
|
Amounts reclassified from accumulated other comprehensive income (loss)
|
(2,421
|
)
|
(338
|
)
|
—
|
|
(2,759
|
)
|
|||||||
|
Net current period other comprehensive income (loss)
|
12,649
|
|
(338
|
)
|
29,292
|
|
41,603
|
|
|||||||
|
Balance at June 30, 2017
|
$
|
152,847
|
|
$
|
11,316
|
|
$
|
(125,335
|
)
|
$
|
38,828
|
|
|||
|
Three Months Ended June 30, 2016:
|
|||||||||||||||
|
Beginning Balance
|
$
|
110,754
|
|
$
|
10,131
|
|
$
|
(62,873
|
)
|
$
|
58,012
|
|
|||
|
Other comprehensive income (loss) before reclassifications
|
55,623
|
|
—
|
|
(55,152
|
)
|
471
|
|
|||||||
|
Amounts reclassified from accumulated other comprehensive income (loss)
|
(7,453
|
)
|
(255
|
)
|
—
|
|
(7,708
|
)
|
|||||||
|
Net current period other comprehensive income (loss)
|
48,170
|
|
(255
|
)
|
(55,152
|
)
|
(7,237
|
)
|
|||||||
|
Balance at June 30, 2016
|
$
|
158,924
|
|
$
|
9,876
|
|
$
|
(118,025
|
)
|
$
|
50,775
|
|
|||
|
Six Months Ended June 30, 2017:
|
|||||||||||||||
|
Beginning Balance
|
$
|
118,863
|
|
$
|
9,367
|
|
$
|
(167,220
|
)
|
$
|
(38,990
|
)
|
|||
|
Other comprehensive income (loss) before reclassifications
|
27,570
|
|
—
|
|
41,885
|
|
69,455
|
|
|||||||
|
Amounts reclassified from accumulated other comprehensive income (loss)
|
6,414
|
|
1,949
|
|
—
|
|
8,363
|
|
|||||||
|
Net current period other comprehensive income (loss)
|
33,984
|
|
1,949
|
|
41,885
|
|
77,818
|
|
|||||||
|
Balance at June 30, 2017
|
$
|
152,847
|
|
$
|
11,316
|
|
$
|
(125,335
|
)
|
$
|
38,828
|
|
|||
|
Six Months Ended June 30, 2016:
|
|||||||||||||||
|
Beginning Balance
|
$
|
50,963
|
|
$
|
9,344
|
|
$
|
(45,092
|
)
|
$
|
15,215
|
|
|||
|
Other comprehensive income (loss) before reclassifications
|
107,185
|
|
—
|
|
(72,933
|
)
|
34,252
|
|
|||||||
|
Amounts reclassified from accumulated other comprehensive income (loss)
|
776
|
|
532
|
|
—
|
|
1,308
|
|
|||||||
|
Net current period other comprehensive income (loss)
|
107,961
|
|
532
|
|
(72,933
|
)
|
35,560
|
|
|||||||
|
Balance at June 30, 2016
|
$
|
158,924
|
|
$
|
9,876
|
|
$
|
(118,025
|
)
|
$
|
50,775
|
|
|||
|
(1)
|
All amounts are net of tax and noncontrolling interest. Amounts in parentheses indicate debits.
|
| Ambac Financial Group, Inc.
17
2017 Second Quarter FORM 10-Q |
AMBAC FINANCIAL GROUP, INC. AND SUBSIDIARIES
Notes to Unaudited Consolidated Financial Statements
(Dollar Amounts in Thousands, Except Share Amounts)
The following table details the significant amounts reclassified from each component of accumulated other comprehensive income, shown in the above rollforward tables, for the affected periods:
|
Details about Accumulated Other
Comprehensive Income Components
|
Amount Reclassified from Accumulated
Other Comprehensive Income (1) |
Affected Line Item in the
Consolidated Statement of
Total Comprehensive Income (Loss)
|
||||||||
|
Three Months Ended June 30,
|
||||||||||
|
2017
|
2016
|
|||||||||
|
Unrealized Gains (Losses) on Available-for-Sale Securities
|
||||||||||
|
$
|
(2,421
|
)
|
$
|
(7,453
|
)
|
Net realized investment (losses) gains and other-than-temporary impairment losses
|
||||
|
—
|
|
—
|
|
Tax (expense) benefit
|
||||||
|
$
|
(2,421
|
)
|
$
|
(7,453
|
)
|
Net of tax and noncontrolling interest
|
||||
|
Amortization of Postretirement Benefit
|
||||||||||
|
Prior service cost
|
$
|
(241
|
)
|
$
|
(167
|
)
|
Operating expenses
(2)
|
|||
|
Actuarial (losses)
|
(97
|
)
|
(88
|
)
|
Operating expenses
(2)
|
|||||
|
(338
|
)
|
(255
|
)
|
Total before tax
|
||||||
|
—
|
|
—
|
|
Tax (expense) benefit
|
||||||
|
(338
|
)
|
(255
|
)
|
Net of tax and noncontrolling interest
|
||||||
|
Total reclassifications for the period
|
$
|
(2,759
|
)
|
$
|
(7,708
|
)
|
Net of tax and noncontrolling interest
|
|||
|
Details about Accumulated Other
Comprehensive Income Components |
Amount Reclassified from Accumulated
Other Comprehensive Income (1) |
Affected Line Item in the
Consolidated Statement of Total Comprehensive Income (Loss) |
||||||||
|
Six Months Ended June 30,
|
||||||||||
|
2017
|
2016
|
|||||||||
|
Unrealized Gains (Losses) on Available-for-Sale Securities
|
||||||||||
|
$
|
6,414
|
|
$
|
776
|
|
Net realized investment (losses) gains and other-than-temporary impairment losses
|
||||
|
—
|
|
—
|
|
Tax (expense) benefit
|
||||||
|
$
|
6,414
|
|
$
|
776
|
|
Net of tax and noncontrolling interest
|
||||
|
Amortization of Postretirement Benefit
|
||||||||||
|
Prior service cost
|
$
|
(482
|
)
|
$
|
(333
|
)
|
Operating expenses
(2)
|
|||
|
Actuarial gains
|
2,431
|
|
865
|
|
Operating expenses
(2)
|
|||||
|
1,949
|
|
532
|
|
Total before tax
|
||||||
|
—
|
|
—
|
|
Tax (expense) benefit
|
||||||
|
$
|
1,949
|
|
$
|
532
|
|
Net of tax and noncontrolling interest
|
||||
|
Total reclassifications for the period
|
$
|
8,363
|
|
$
|
1,308
|
|
Net of tax and noncontrolling interest
|
|||
|
(1)
|
Amounts in parentheses indicate debits to the Consolidated Statement of Total Comprehensive Income (Loss).
|
|
(2)
|
These accumulated other comprehensive income components are included in the computation of net periodic benefit cost.
|
5. NET INCOME PER SHARE
On May 1, 2013, pursuant to the Second Modified Fifth Amended Plan of Reorganization of Ambac (the "Reorganization Plan"),
45,000,000
shares of new common stock at par value of
$0.01
per share and
5,047,138
of warrants were issued. Warrants entitled such holders to acquire up to
5,047,138
shares of new common stock at an exercise price of
$16.67
per share at any time on or prior to
April 30, 2023
. For the
three and six months ended June 30, 2017 and 2016
,
0
and
136
warrants were exercised, respectively, resulting in an issuance of
0
and
136
shares of common stock, respectively.
On June 30, 2015, the Board of Directors of Ambac authorized the establishment of a warrant repurchase program that permits the repurchase of up to
$10,000
of warrants. For the
six months ended June 30, 2017
, Ambac repurchased
0
warrants at a cost of
$0
. As of
June 30, 2017
, Ambac has repurchased
985,331
warrants totaling
$8,092
, (average cost of
$8.21
per warrant) leaving
4,053,670
warrants outstanding. On November 3, 2016, the Board of Directors of Ambac authorized a
$10,000
increase to the warrant repurchase program, bringing the remaining aggregate authorization at
June 30, 2017
to
$11,939
.
| Ambac Financial Group, Inc.
18
2017 Second Quarter FORM 10-Q |
AMBAC FINANCIAL GROUP, INC. AND SUBSIDIARIES
Notes to Unaudited Consolidated Financial Statements
(Dollar Amounts in Thousands, Except Share Amounts)
Basic net income per share is computed by dividing net income attributable to common stockholders by the weighted-average number of common shares outstanding and vested restricted stock units. Diluted net income per share is computed by dividing net income attributable to common stockholders by the weighted-average number of common shares used for basic earnings per share plus all potential dilutive common shares outstanding during the period. All potential dilutive common shares outstanding consider common stock deliverable pursuant to warrants issued under the Reorganization Plan, vested and unvested options, unvested restricted stock units and performance stock units granted under employee and director compensation plans.
The following table provides a reconciliation of the common shares used for basic net income per share to the diluted shares used for diluted net income per share:
|
Three Months Ended June 30,
|
Six Months Ended June 30,
|
|||||||||||
|
2017
|
2016
|
2017
|
2016
|
|||||||||
|
Basic weighted average shares outstanding
|
45,369,213
|
|
45,212,484
|
|
45,330,946
|
|
45,194,731
|
|
||||
|
Effect of potential dilutive shares
(1)
:
|
||||||||||||
|
Warrants
|
250,289
|
|
—
|
|
—
|
|
—
|
|
||||
|
Stock options
|
—
|
|
—
|
|
—
|
|
—
|
|
||||
|
Restricted stock units
|
27,609
|
|
104,457
|
|
—
|
|
80,680
|
|
||||
|
Performance stock units
|
126,398
|
|
58,147
|
|
—
|
|
34,132
|
|
||||
|
Diluted weighted average shares outstanding
|
45,773,509
|
|
45,375,088
|
|
45,330,946
|
|
45,309,543
|
|
||||
|
Anti-dilutive shares excluded from the above reconciliation:
|
||||||||||||
|
Stock options
|
126,667
|
|
176,668
|
|
126,667
|
|
176,668
|
|
||||
|
Warrants
|
—
|
|
4,178,901
|
|
—
|
|
4,178,901
|
|
||||
|
Restricted stock units
|
—
|
|
23,334
|
|
68,654
|
|
23,334
|
|
||||
|
Performance stock units
(2)
|
151,527
|
|
—
|
|
342,092
|
|
—
|
|
||||
|
(1)
|
For the
six months ended June 30, 2017
, Ambac had a net loss and accordingly excluded all potentially dilutive securities from the determination of diluted loss per share as their impact was anti-dilutive.
|
|
(2)
|
Performance stock units are reflected herein at their target issuance amounts. Vesting of these units is contingent upon meeting certain performance metrics. Although a portion of these performance metrics have been achieved as of the respective period end, it is possible that awards may no longer meet the metric at the end of the performance period.
|
| Ambac Financial Group, Inc.
19
2017 Second Quarter FORM 10-Q |
AMBAC FINANCIAL GROUP, INC. AND SUBSIDIARIES
Notes to Unaudited Consolidated Financial Statements
(Dollar Amounts in Thousands, Except Share Amounts)
6. FINANCIAL GUARANTEE INSURANCE CONTRACTS
Amounts presented in this Note relate only to Ambac’s non-derivative insurance business for insurance policies issued to beneficiaries, including VIEs, for which we do not consolidate the VIE.
Net Premiums Earned:
Gross premiums are received either upfront or in installments. For premiums received upfront, an unearned premium revenue (“UPR”) liability is established, which is initially recorded as the cash amount received. For installment premium transactions, a premium receivable asset and offsetting UPR liability is initially established in an amount equal to: (i) the present value of future contractual premiums due (the “contractual” method) or (ii) if the assets underlying the insured obligation are homogenous pools which are contractually prepayable, the present value of premiums to be collected over the expected life of the transaction (the “expected” method). An appropriate risk-free rate corresponding to the weighted average life of each policy and currency is used to discount the future premiums contractually due or expected to be collected. For example, U.S. dollar exposures are discounted using U.S. Treasury rates while exposures denominated in a foreign currency are discounted using the appropriate risk-free rate for the respective currency. The weighted average risk-free rate at
June 30, 2017 and December 31, 2016
, was
2.5%
and
2.6%
, respectively, and the weighted average period of future premiums used to estimate the premium receivable at
June 30, 2017 and December 31, 2016
, was
8.9 years
and
9.0 years
, respectively.
Insured obligations consisting of homogeneous pools for which Ambac uses expected future premiums to estimate the premium receivable and UPR include residential mortgage-backed securities. As prepayment assumptions change for homogenous pool transactions, or if there is an actual prepayment for a “contractual” method installment transaction, the related premium receivable and UPR are adjusted in equal and offsetting amounts with no immediate effect on earnings using new premium cash flows and the then current risk-free rate.
In structured finance transactions, the priority for the payment of financial guarantee premiums to Ambac, as required by bond indentures of insured structured finance obligations, is generally senior in the waterfall. Additionally, in connection with the allocation of certain liabilities to the Segregated Account, trustees and other parties are required under the Segregated Account Rehabilitation Plan and related court orders to continue to pay installment premiums, notwithstanding the Segregated Account Rehabilitation Proceedings. In evaluating the credit quality of the premium receivables, management evaluates the transaction waterfall structures and the internal ratings of the transactions underlying the premium receivables. Uncollectable premiums are determined on a policy basis and utilize a combination of historical premium collection data in addition to cash flow analysis to determine if an impairment in the related policy's premium receivables exist. As of
June 30, 2017 and December 31, 2016
, approximately
22%
and
25%
of the premium receivables related to transactions with non-investment grade internal ratings, comprised mainly of non-investment grade RMBS, structured insurance, lease securitizations and student loan transactions, which comprised
7%
,
5%
,
3%
and
3%
, of the total premium receivables at
June 30, 2017
and
8%
,
5%
,
4%
and
3%
of the total premium receivables at
December 31, 2016
, respectively. At
June 30, 2017 and December 31, 2016
,
$9,337
and
$9,186
respectively, of premium receivables were deemed uncollectable. Past due premiums on policies insuring non-investment grade obligations amounted to less than
$500
at
June 30, 2017
.
Below is the gross premium receivable roll-forward for the affected periods:
|
Six Months Ended June 30,
|
||||||||
|
2017
|
2016
|
|||||||
|
Beginning premium receivable
|
$
|
661,337
|
|
$
|
831,575
|
|
||
|
Premium receipts
|
(33,953
|
)
|
(39,569
|
)
|
||||
|
Adjustments for changes in expected and contractual cash flows
|
4,285
|
|
(43,125
|
)
|
||||
|
Accretion of premium receivable discount
|
8,379
|
|
9,967
|
|
||||
|
Changes to uncollectable premiums
|
(151
|
)
|
4,337
|
|
||||
|
Other adjustments (including foreign exchange)
|
13,279
|
|
(21,771
|
)
|
||||
|
Ending premium receivable
(1)
|
$
|
653,176
|
|
$
|
741,414
|
|
||
|
(1)
|
Gross premium receivable includes premiums to be received in foreign denominated currencies most notab
ly in British Pounds and Euros. At
June 30, 2017 and 2016
, premium receivables include British Pounds of
$192,983
(
£148,277
) and
$206,834
(
£156,136
), respectively, and Euros of
$35,814
(
€31,361
) and
$37,741
(
€34,056
), respectively.
|
Similar to gross premiums, premiums ceded to reinsurers are paid either upfront or in installments. Premiums ceded to reinsurers reduce the amount of premiums earned by Ambac from its financial guarantee insurance policies.
When a bond issue insured by Ambac Assurance has been retired early, typically due to an issuer call, any remaining UPR is recognized at that time to the extent the financial guarantee contract is legally extinguished, causing accelerated premium revenue. For installment premium paying transactions, we offset the recognition of any remaining UPR by the reduction of the related premium receivable to zero (as it will not be collected as a result of the retirement), which may cause negative accelerated premium revenue. Ambac’s accelerated premium revenue for retired obligations for the
three and six months ended June 30, 2017
was
$13,190
and
$29,470
, respectively, and for the
three and six months ended June 30, 2016
was
$5,081
and
$20,057
, respectively. Certain obligations insured by Ambac have been legally defeased whereby government securities are purchased by the issuer with the proceeds of a new bond issuance, or less frequently with other funds of the issuer, and held in escrow. The
| Ambac Financial Group, Inc.
20
2017 Second Quarter FORM 10-Q |
AMBAC FINANCIAL GROUP, INC. AND SUBSIDIARIES
Notes to Unaudited Consolidated Financial Statements
(Dollar Amounts in Thousands, Except Share Amounts)
principal and interest received from the escrowed securities are then used to retire the Ambac-insured obligations at a future date either to their maturity date (a refunding) or a specified call date (a pre-refunding). Ambac has evaluated the provisions in policies issued on these obligations and determined those insurance policies have not been legally extinguished. For policies with refunding securities, premium revenue recognition is not impacted as the escrowed maturity date is the same as the previous legal maturity date. For policies with pre-refunding securities, the maturity date of the pre-refunded security has been shortened from its previous legal maturity. Although premium revenue recognition has not been accelerated in the period of the pre-refunding, it results in an increase in the rate at which the policy's remaining UPR is to be recognized.
The effect of reinsurance on premiums written and earned for the respective periods was as follows:
|
Three Months Ended June 30,
|
|||||||||||||||
|
2017
|
2016
|
||||||||||||||
|
Written
|
Earned
|
Written
|
Earned
|
||||||||||||
|
Direct
|
$
|
6,928
|
|
$
|
47,235
|
|
$
|
(4,041
|
)
|
$
|
44,974
|
|
|||
|
Assumed
|
—
|
|
20
|
|
—
|
|
21
|
|
|||||||
|
Ceded
|
238
|
|
4,103
|
|
(854
|
)
|
3,593
|
|
|||||||
|
Net premiums
|
$
|
6,690
|
|
$
|
43,152
|
|
$
|
(3,187
|
)
|
$
|
41,402
|
|
|||
|
Six Months Ended June 30,
|
|||||||||||||||
|
2017
|
2016
|
||||||||||||||
|
Written
|
Earned
|
Written
|
Earned
|
||||||||||||
|
Direct
|
$
|
12,512
|
|
$
|
99,300
|
|
$
|
(28,821
|
)
|
$
|
101,963
|
|
|||
|
Assumed
|
—
|
|
41
|
|
—
|
|
43
|
|
|||||||
|
Ceded
|
(1,577
|
)
|
8,576
|
|
(6,899
|
)
|
7,804
|
|
|||||||
|
Net premiums
|
$
|
14,089
|
|
$
|
90,765
|
|
$
|
(21,922
|
)
|
$
|
94,202
|
|
|||
The following table summarizes net premiums earned by location of risk for the respective periods:
|
Three Months Ended June 30,
|
Six Months Ended June 30,
|
|||||||||||||||
|
2017
|
2016
|
2017
|
2016
|
|||||||||||||
|
United States
|
$
|
36,006
|
|
$
|
34,632
|
|
$
|
76,627
|
|
$
|
80,746
|
|
||||
|
United Kingdom
|
5,558
|
|
6,704
|
|
10,821
|
|
13,092
|
|
||||||||
|
Other international
|
1,588
|
|
66
|
|
3,317
|
|
364
|
|
||||||||
|
Total
|
$
|
43,152
|
|
$
|
41,402
|
|
$
|
90,765
|
|
$
|
94,202
|
|
||||
| Ambac Financial Group, Inc.
21
2017 Second Quarter FORM 10-Q |
AMBAC FINANCIAL GROUP, INC. AND SUBSIDIARIES
Notes to Unaudited Consolidated Financial Statements
(Dollar Amounts in Thousands, Except Share Amounts)
The table below summarizes the future gross undiscounted premiums to be collected and future premiums earned, net of reinsurance at
June 30, 2017
:
|
Future premiums
to be collected (1) |
Future
premiums to be earned net of reinsurance (1) |
||||||
|
Three months ended:
|
|||||||
|
September 30, 2017
|
$
|
17,154
|
|
$
|
23,632
|
|
|
|
December 31, 2017
|
14,693
|
|
20,366
|
|
|||
|
Twelve months ended:
|
|||||||
|
December 31, 2018
|
61,748
|
|
72,838
|
|
|||
|
December 31, 2019
|
58,367
|
|
66,387
|
|
|||
|
December 31, 2020
|
55,492
|
|
62,269
|
|
|||
|
December 31, 2021
|
49,222
|
|
57,042
|
|
|||
|
Five years ended:
|
|||||||
|
December 31, 2026
|
217,611
|
|
233,432
|
|
|||
|
December 31, 2031
|
173,390
|
|
157,907
|
|
|||
|
December 31, 2036
|
102,072
|
|
88,261
|
|
|||
|
December 31, 2041
|
35,463
|
|
30,421
|
|
|||
|
December 31, 2046
|
16,977
|
|
14,596
|
|
|||
|
December 31, 2051
|
5,250
|
|
6,148
|
|
|||
|
December 31, 2056
|
240
|
|
686
|
|
|||
|
Total
|
$
|
807,679
|
|
$
|
833,985
|
|
|
|
(1)
|
Future premiums to be collected are undiscounted and are used to derive the discounted premium receivable asset recorded on Ambac's balance sheet. Future premiums to be earned, net of reinsurance relate to the unearned premiums liability and deferred ceded premium asset recorded on Ambac’s balance sheet. The use of contractual lives for many bond types which do not have homogeneous pools of underlying collateral is required in the calculation of the premium receivable, as further described in
Note 2. Basis of Presentation and Significant Accounting Policies
in the Notes to Consolidated Financial Statements included in Ambac's Annual Report on Form 10-K for the year ended
December 31, 2016
. This results in a different premium receivable balance than if expected lives were considered. If installment paying policies are retired or prepay early, premiums reflected in the premium receivable asset and amounts reported in the above table for such policies may not be collected. Future premiums to be earned also considers the use of contractual lives for many bond types which do not have homogeneous pools of underlying collateral, which may result in different unearned premium than if expected lives were considered. If those bonds types are retired early, premium earnings may be negative in the period of call or refinancing.
|
Loss and Loss Expense Reserves:
The loss and loss expense reserve (“loss reserve”) policy for financial guarantee insurance relates only to Ambac’s non-derivative insurance business for insurance policies issued to beneficiaries, including VIEs, for which we do not consolidate the VIE. Losses and loss expenses are based upon estimates of the ultimate aggregate losses inherent in the non-derivative financial guarantee portfolio as of the reporting date. A loss reserve is recorded on the balance sheet on a policy-by-policy basis. Loss reserve components of an insurance policy include unpaid claims and the present value ("PV") of expected net cash flows required to be paid under an insurance contract, further described below:
|
•
|
Unpaid claims represent the sum of (i) claims presented and not yet paid for policies allocated to the Segregated Account, including Deferred Amounts and (ii) accrued interest on Deferred Amounts as required by the amended Segregated Account Rehabilitation Plan that became effective on June 12, 2014. Refer to
Note 1. Background and Business Description
in the Notes to Consolidated Financial Statements included in Ambac's Annual Report on Form 10-K for further discussion of the amended Segregated Account Rehabilitation Plan. Unpaid claims are measured based on the cost of settling the claims, which is principal plus accrued interest.
|
|
•
|
The PV of expected net cash flows represents the PV of expected cash outflows less the PV of expected cash inflows. The PV of expected net cash flows are impacted by: (i) expected future claims to be paid under an insurance contract, including the impact of potential settlement outcomes upon future installment premiums,
(ii) expected recoveries from contractual breaches of RMBS representations and warranties ("R&W") by transaction sponsors, (iii) excess spread within the underlying transaction's cash flow structure, and (iv) other subrogation recoveries. Expected receipts from third parties within the underlying transaction's cash flow structure
relating to
contractual breaches in non-RMBS securitizations may also reduce expected future claims. Ambac’s approach to resolving disputes involving contractual breaches by transaction sponsors or other third parties has included negotiations and/or pursuing litigation. Ambac does not include potential recoveries attributed solely to fraudulent inducement claims in our estimate of subrogation recoveries, since any remedies under such claims would be non-contractual.
|
| Ambac Financial Group, Inc.
22
2017 Second Quarter FORM 10-Q |
AMBAC FINANCIAL GROUP, INC. AND SUBSIDIARIES
Notes to Unaudited Consolidated Financial Statements
(Dollar Amounts in Thousands, Except Share Amounts)
Net cash
outflow
policies represent contracts where the sum of unpaid claims plus the PV of expected cash outflows are greater than the PV of expected cash inflows. For such policies, a “Loss and loss expense reserves” liability is recorded for the sum of: (i) unpaid claims plus (ii) the excess of the PV of expected net cash outflows over the unearned premium revenue. Net cash
inflow
policies represent contracts where losses have been paid, but not yet recovered, such that the PV of expected cash inflows are greater than the sum of unpaid claims plus the PV of expected cash outflows. For such policies, a “Subrogation recoverable” asset is recorded for the difference between (i) the PV of expected net cash inflows and (ii) unpaid claims.
The approaches used to estimate expected future claims and expected future recoveries considers the likelihood of all possible outcomes. The evaluation process for determining expected losses is subject to material estimates and judgments based on our assumptions regarding the probability of default by the issuer of the insured security, probability of settlement outcomes (which may include commutation settlements, refinancing and/or other settlement outcomes), expected severity of credits for each insurance contract, and the timing of expected events including default, commutation and recovery. Ambac’s loss reserves are based on management’s on-going review of the financial guarantee credit portfolio. Below are the components of the Loss and loss expense reserves liability and the Subrogation recoverable asset at
June 30, 2017 and December 31, 2016
:
|
Unpaid Claims
|
Present Value of Expected
Net Cash Flows |
||||||||||||||||||||||
|
Balance Sheet Line Item
|
Claims
|
Accrued
Interest |
Claims and
Loss Expenses |
Recoveries
|
Unearned
Premium Revenue |
Gross Loss and
Loss Expense Reserves |
|||||||||||||||||
|
June 30, 2017:
|
|||||||||||||||||||||||
|
Loss and loss expense reserves
|
$
|
2,418,005
|
|
$
|
600,510
|
|
$
|
2,869,074
|
|
$
|
(1,158,779
|
)
|
$
|
(146,657
|
)
|
$
|
4,582,153
|
|
|||||
|
Subrogation recoverable
|
581,533
|
|
148,878
|
|
41,217
|
|
(1,430,503
|
)
|
—
|
|
(658,875
|
)
|
|||||||||||
|
Totals
|
$
|
2,999,538
|
|
$
|
749,388
|
|
$
|
2,910,291
|
|
$
|
(2,589,282
|
)
|
$
|
(146,657
|
)
|
$
|
3,923,278
|
|
|||||
|
December 31, 2016:
|
|||||||||||||||||||||||
|
Loss and loss expense reserves
|
$
|
2,411,105
|
|
$
|
529,703
|
|
$
|
2,681,198
|
|
$
|
(1,098,096
|
)
|
$
|
(143,141
|
)
|
$
|
4,380,769
|
|
|||||
|
Subrogation recoverable
|
583,042
|
|
132,139
|
|
68,419
|
|
(1,468,331
|
)
|
—
|
|
(684,731
|
)
|
|||||||||||
|
Totals
|
$
|
2,994,147
|
|
$
|
661,842
|
|
$
|
2,749,617
|
|
$
|
(2,566,427
|
)
|
$
|
(143,141
|
)
|
$
|
3,696,038
|
|
|||||
Below is the loss and loss expense reserve roll-forward, net of subrogation recoverable and reinsurance, for the affected periods:
|
Six Months Ended June 30,
|
|||||||
|
2017
|
2016
|
||||||
|
Beginning gross loss and loss expense reserves
|
$
|
3,696,038
|
|
$
|
2,858,813
|
|
|
|
Reinsurance recoverable
|
30,767
|
|
44,059
|
|
|||
|
Beginning balance of net loss and loss expense reserves
|
3,665,271
|
|
2,814,754
|
|
|||
|
Losses and loss expenses (benefit):
|
|||||||
|
Current year
|
5,137
|
|
12
|
|
|||
|
Prior year
|
195,974
|
|
(157,789
|
)
|
|||
|
Total
(1) (2)
|
201,111
|
|
(157,777
|
)
|
|||
|
Loss and loss expenses (recovered) paid:
|
|||||||
|
Current year
|
153
|
|
—
|
|
|||
|
Prior year
|
7,607
|
|
(1,011,956
|
)
|
|||
|
Total
|
7,760
|
|
(1,011,956
|
)
|
|||
|
Foreign exchange effect
|
17,622
|
|
(48,260
|
)
|
|||
|
Ending net loss and loss expense reserves
|
3,876,244
|
|
3,620,673
|
|
|||
|
Reinsurance recoverable
(3)
|
47,034
|
|
30,108
|
|
|||
|
Ending gross loss and loss expense reserves
(4)
|
$
|
3,923,278
|
|
$
|
3,650,781
|
|
|
|
(1)
|
Total losses and loss expenses (benefit) includes
$(16,469)
and
$7,607
for the
six months ended June 30, 2017 and 2016
, respectively, related to ceded reinsurance.
|
|
(2)
|
Ambac records the impact of estimated recoveries related to securitized loans in RMBS transactions that breached certain R&Ws within losses and loss expenses (benefit). The losses and loss expense (benefit) incurred associated with changes in estimated representation and warranties for the
six months ended June 30, 2017 and 2016
was
$22,175
and
$(48,646)
, respectively.
|
| Ambac Financial Group, Inc.
23
2017 Second Quarter FORM 10-Q |
AMBAC FINANCIAL GROUP, INC. AND SUBSIDIARIES
Notes to Unaudited Consolidated Financial Statements
(Dollar Amounts in Thousands, Except Share Amounts)
|
(3)
|
Represents reinsurance recoverable on future loss and loss expenses. Additionally, the Balance Sheet line "Reinsurance recoverable on paid and unpaid losses" includes reinsurance recoverables (payables) of
$(568)
and
$(1,404)
as of
June 30, 2017 and 2016
, respectively, related to previously presented loss and loss expenses and subrogation.
|
|
(4)
|
Includes Euro denominated gross loss and loss expense reserves of
$20,212
(
€17,699
) and
$16,655
(
€15,029
) at
June 30, 2017 and 2016
, respectively.
|
For
2017
, the net adverse development was primarily the result of negative development in certain public finance transactions, including Puerto Rico, and interest accrued on Deferred Amounts partially offset by positive development in certain Ambac UK transactions.
For
2016
, the net positive development was primarily the result of lower estimated projected losses in the RMBS and Student Loan portfolios partially offset by interest accrued on Deferred Amounts and by negative development in certain public finance, including Puerto Rico, and Ambac UK transactions.
The tables below summarize information related to policies currently included in Ambac’s loss and loss expense reserves or subrogation recoverable at
June 30, 2017 and December 31, 2016
. Gross par exposures include capital appreciation bonds which are reported at the par amount at the time of issuance of the insurance policy as opposed to the current accreted value of the bond. The weighted average risk-free rate used to discount loss reserves at
June 30, 2017 and December 31, 2016
was
2.5%
and
2.7%
, respectively.
|
Surveillance Categories as of June 30, 2017
|
|||||||||||||||||||||||||||
|
I/SL
|
IA
|
II
|
III
|
IV
|
V
|
Total
|
|||||||||||||||||||||
|
Number of policies
|
23
|
|
23
|
|
33
|
|
47
|
|
168
|
|
4
|
|
298
|
|
|||||||||||||
|
Remaining weighted-average contract period (in years)
(1)
|
11
|
|
22
|
|
11
|
|
21
|
|
13
|
|
3
|
|
16
|
|
|||||||||||||
|
Gross insured contractual payments outstanding:
|
|||||||||||||||||||||||||||
|
Principal
|
$
|
1,050,971
|
|
$
|
418,857
|
|
$
|
1,630,620
|
|
$
|
2,591,392
|
|
$
|
7,347,507
|
|
$
|
49,370
|
|
$
|
13,088,717
|
|
||||||
|
Interest
|
327,175
|
|
376,557
|
|
730,585
|
|
7,624,470
|
|
2,293,047
|
|
18,197
|
|
11,370,031
|
|
|||||||||||||
|
Total
|
$
|
1,378,146
|
|
$
|
795,414
|
|
$
|
2,361,205
|
|
$
|
10,215,862
|
|
$
|
9,640,554
|
|
$
|
67,567
|
|
$
|
24,458,748
|
|
||||||
|
Gross undiscounted claim liability
(2)
|
$
|
3,845
|
|
$
|
33,672
|
|
$
|
110,022
|
|
$
|
1,430,192
|
|
$
|
6,058,978
|
|
$
|
67,526
|
|
$
|
7,704,235
|
|
||||||
|
Discount, gross claim liability
|
(363
|
)
|
(4,758
|
)
|
(19,363
|
)
|
(504,001
|
)
|
(599,815
|
)
|
(4,663
|
)
|
(1,132,963
|
)
|
|||||||||||||
|
Gross claim liability before all subrogation and before reinsurance
|
3,482
|
|
28,914
|
|
90,659
|
|
926,191
|
|
5,459,163
|
|
62,863
|
|
6,571,272
|
|
|||||||||||||
|
Less:
|
|||||||||||||||||||||||||||
|
Gross RMBS subrogation
(3)
|
$
|
—
|
|
$
|
—
|
|
$
|
—
|
|
$
|
—
|
|
$
|
(1,908,130
|
)
|
$
|
—
|
|
$
|
(1,908,130
|
)
|
||||||
|
Discount, RMBS subrogation
|
—
|
|
—
|
|
—
|
|
—
|
|
23,674
|
|
—
|
|
23,674
|
|
|||||||||||||
|
Discounted RMBS subrogation, before reinsurance
|
—
|
|
—
|
|
—
|
|
—
|
|
(1,884,456
|
)
|
—
|
|
(1,884,456
|
)
|
|||||||||||||
|
Less:
|
|||||||||||||||||||||||||||
|
Gross other subrogation
(4)
|
—
|
|
—
|
|
(18,962
|
)
|
(152,634
|
)
|
(596,660
|
)
|
(12,679
|
)
|
(780,935
|
)
|
|||||||||||||
|
Discount, other subrogation
|
—
|
|
—
|
|
8,889
|
|
11,529
|
|
52,126
|
|
3,565
|
|
76,109
|
|
|||||||||||||
|
Discounted other subrogation, before reinsurance
|
—
|
|
—
|
|
(10,073
|
)
|
(141,105
|
)
|
(544,534
|
)
|
(9,114
|
)
|
(704,826
|
)
|
|||||||||||||
|
Gross claim liability, net of all subrogation and discounts, before reinsurance
|
3,482
|
|
28,914
|
|
80,586
|
|
785,086
|
|
3,030,173
|
|
53,749
|
|
3,981,990
|
|
|||||||||||||
|
Less: Unearned premium revenue
|
(2,114
|
)
|
(6,758
|
)
|
(18,329
|
)
|
(61,611
|
)
|
(57,462
|
)
|
(383
|
)
|
(146,657
|
)
|
|||||||||||||
|
Plus: Loss expense reserves
|
13,481
|
|
2,174
|
|
331
|
|
18,414
|
|
53,396
|
|
149
|
|
87,945
|
|
|||||||||||||
|
Gross loss and loss expense reserves
|
$
|
14,849
|
|
$
|
24,330
|
|
$
|
62,588
|
|
$
|
741,889
|
|
$
|
3,026,107
|
|
$
|
53,515
|
|
$
|
3,923,278
|
|
||||||
|
Reinsurance recoverable reported on Balance Sheet
(5)
|
$
|
170
|
|
$
|
2,697
|
|
$
|
14,704
|
|
$
|
45,897
|
|
$
|
(17,002
|
)
|
$
|
—
|
|
$
|
46,466
|
|
||||||
|
(1)
|
Remaining weighted-average contract period is weighted based on projected gross claims over the lives of the respective policies.
|
|
(2)
|
Gross undiscounted claim liability includes unpaid claims, including accrued interest on Deferred Amounts, on policies allocated to the Segregated Account and Ambac's estimate of expected future claims.
|
|
(3)
|
RMBS subrogation represents Ambac’s estimate of subrogation recoveries from RMBS transaction sponsors for representation and warranty ("R&W") breaches.
|
|
(4)
|
Other subrogation represents subrogation related to excess spread and other contractual cash flows on public finance and structured finance transactions, including RMBS.
|
| Ambac Financial Group, Inc.
24
2017 Second Quarter FORM 10-Q |
AMBAC FINANCIAL GROUP, INC. AND SUBSIDIARIES
Notes to Unaudited Consolidated Financial Statements
(Dollar Amounts in Thousands, Except Share Amounts)
|
(5)
|
Reinsurance recoverable reported on Balance Sheet includes reinsurance recoverables of
$47,034
related to future loss and loss expenses and
$(568)
related to presented loss and loss expenses and subrogation.
|
|
Surveillance Categories as of December 31, 2016
|
|||||||||||||||||||||||||||
|
I/SL
|
IA
|
II
|
III
|
IV
|
V
|
Total
|
|||||||||||||||||||||
|
Number of policies
|
19
|
|
22
|
|
26
|
|
43
|
|
169
|
|
3
|
|
282
|
|
|||||||||||||
|
Remaining weighted-average contract period (in years)
(1)
|
9
|
|
8
|
|
30
|
|
17
|
|
14
|
|
5
|
|
16
|
|
|||||||||||||
|
Gross insured contractual payments outstanding:
|
|||||||||||||||||||||||||||
|
Principal
|
$
|
918,456
|
|
$
|
733,036
|
|
$
|
1,992,543
|
|
$
|
1,779,889
|
|
$
|
7,926,991
|
|
$
|
49,247
|
|
$
|
13,400,162
|
|
||||||
|
Interest
|
345,802
|
|
199,631
|
|
7,080,969
|
|
1,110,051
|
|
2,275,421
|
|
14,185
|
|
11,026,059
|
|
|||||||||||||
|
Total
|
$
|
1,264,258
|
|
$
|
932,667
|
|
$
|
9,073,512
|
|
$
|
2,889,940
|
|
$
|
10,202,412
|
|
$
|
63,432
|
|
$
|
24,426,221
|
|
||||||
|
Gross undiscounted claim liability
(2)
|
$
|
3,439
|
|
$
|
21,175
|
|
$
|
547,550
|
|
$
|
861,455
|
|
$
|
6,139,060
|
|
$
|
63,431
|
|
$
|
7,636,110
|
|
||||||
|
Discount, gross claim liability
|
(314
|
)
|
(1,243
|
)
|
(331,234
|
)
|
(256,108
|
)
|
(710,608
|
)
|
(5,859
|
)
|
(1,305,366
|
)
|
|||||||||||||
|
Gross claim liability before all subrogation and before reinsurance
|
3,125
|
|
19,932
|
|
216,316
|
|
605,347
|
|
5,428,452
|
|
57,572
|
|
6,330,744
|
|
|||||||||||||
|
Less:
|
|||||||||||||||||||||||||||
|
Gross RMBS subrogation
(3)
|
—
|
|
—
|
|
—
|
|
—
|
|
(1,926,165
|
)
|
—
|
|
(1,926,165
|
)
|
|||||||||||||
|
Discount, RMBS subrogation
|
—
|
|
—
|
|
—
|
|
—
|
|
19,130
|
|
—
|
|
19,130
|
|
|||||||||||||
|
Discounted RMBS subrogation, before reinsurance
|
—
|
|
—
|
|
—
|
|
—
|
|
(1,907,035
|
)
|
—
|
|
(1,907,035
|
)
|
|||||||||||||
|
Less:
|
|||||||||||||||||||||||||||
|
Gross other subrogation
(4)
|
—
|
|
—
|
|
(14,529
|
)
|
(118,272
|
)
|
(593,919
|
)
|
(12,751
|
)
|
(739,471
|
)
|
|||||||||||||
|
Discount, other subrogation
|
—
|
|
—
|
|
6,526
|
|
13,426
|
|
56,273
|
|
3,854
|
|
80,079
|
|
|||||||||||||
|
Discounted other subrogation, before reinsurance
|
—
|
|
—
|
|
(8,003
|
)
|
(104,846
|
)
|
(537,646
|
)
|
(8,897
|
)
|
(659,392
|
)
|
|||||||||||||
|
Gross claim liability, net of all subrogation and discounts, before reinsurance
|
3,125
|
|
19,932
|
|
208,313
|
|
500,501
|
|
2,983,771
|
|
48,675
|
|
3,764,317
|
|
|||||||||||||
|
Less: Unearned premium revenue
|
(2,394
|
)
|
(1,807
|
)
|
(49,578
|
)
|
(31,785
|
)
|
(57,194
|
)
|
(383
|
)
|
(143,141
|
)
|
|||||||||||||
|
Plus: Loss expense reserves
|
6,621
|
|
339
|
|
777
|
|
11,036
|
|
56,089
|
|
—
|
|
74,862
|
|
|||||||||||||
|
Gross loss and loss expense reserves
|
$
|
7,352
|
|
$
|
18,464
|
|
$
|
159,512
|
|
$
|
479,752
|
|
$
|
2,982,666
|
|
$
|
48,292
|
|
$
|
3,696,038
|
|
||||||
|
Reinsurance recoverable reported on Balance Sheet
(5)
|
$
|
120
|
|
$
|
6,063
|
|
$
|
2,737
|
|
$
|
39,352
|
|
$
|
(17,854
|
)
|
$
|
—
|
|
$
|
30,418
|
|
||||||
|
(1)
|
Remaining weighted-average contract period is weighted based on projected gross claims over the lives of the respective policies.
|
|
(2)
|
Gross undiscounted claim liability includes unpaid claims, including accrued interest on Deferred Amounts, on policies allocated to the Segregated Account and Ambac's estimate of expected future claims.
|
|
(3)
|
RMBS subrogation represents Ambac’s estimate of subrogation recoveries from RMBS transaction sponsors for R&W breaches.
|
|
(4)
|
Other subrogation represents subrogation related to excess spread and other contractual cash flows on public finance and structured finance transactions, including RMBS.
|
|
(5)
|
Reinsurance recoverable reported on Balance Sheet includes reinsurance recoverables of
$30,767
related to future loss and loss expenses and
$(349)
related to presented loss and loss expenses and subrogation.
|
Ambac records estimated subrogation recoveries for breaches of R&Ws by sponsors of certain RMBS transactions. For a discussion of the Random Sample approach utilized to estimate R&W subrogation recoveries, see
Note 2. Basis of Presentation and Significant Accounting Policies
in the Notes to Consolidated Financial Statements included Part II, Item 8 in the Company’s Annual Report on Form 10-K for the year ended
December 31, 2016
. R&W subrogation may include estimates of potential sponsor settlements, but have not been subject to a sampling approach. However, such estimates are not material to Ambac’s financial results and therefore are included in the Random Sample section of this table.
Ambac has recorded R&W subrogation recoveries of
$1,884,456
(
$1,856,565
net of reinsurance) and
$1,907,035
(
$1,878,740
net of reinsurance) at
June 30, 2017 and December 31, 2016
, respectively. The balance of R&W subrogation recoveries and the related loss reserves, using the Random Sample estimation approach, at
June 30, 2017 and December 31, 2016
, are as follows:
| Ambac Financial Group, Inc.
25
2017 Second Quarter FORM 10-Q |
AMBAC FINANCIAL GROUP, INC. AND SUBSIDIARIES
Notes to Unaudited Consolidated Financial Statements
(Dollar Amounts in Thousands, Except Share Amounts)
|
Random Sample Approach
|
Gross loss
reserves before subrogation recoveries (1) |
Subrogation
recoveries (2)(3) |
Gross loss
reserves after subrogation recoveries |
|||||||||
|
At June 30, 2017
|
$
|
1,360,985
|
|
$
|
(1,884,456
|
)
|
$
|
(523,471
|
)
|
|||
|
At December 31, 2016
|
$
|
1,351,640
|
|
$
|
(1,907,035
|
)
|
$
|
(555,395
|
)
|
|||
|
(1)
|
Amount represents gross loss reserves
for policies that have established a representation and warranty subrogation recovery.
Includes unpaid RMBS claims, including accrued interest on Deferred Amounts, on policies allocated to the Segregated Account.
|
|
(2)
|
The amount of recorded subrogation recoveries related to each securitization is limited to ever-to-date paid and unpaid losses plus the present value of expected future cash flows for each policy. To the extent losses have been paid but not yet fully recovered, the recorded amount of R&W subrogation recoveries may exceed the sum of the unpaid claims and the present value of expected cash flows for a given policy. The net cash inflow for these policies is recorded as a “Subrogation recoverable” asset. For those transactions where the subrogation recovery is less than the sum of unpaid claims and the present value of expected cash flows, the net cash outflow for these policies is recorded as a “Loss and loss expense reserves” liability.
|
|
(3)
|
The sponsor’s repurchase obligation may differ depending on the terms of the particular transaction and the status of the specific loan, such as whether it is performing or has been liquidated or charged off. The estimated subrogation recovery for these transactions is based primarily on loan level data provided through trustee reports received in the normal course of our surveillance activities or provided by the sponsor. While this data may not include all the components of the sponsor’s contractual repurchase obligation we believe it is the best information available to estimate the subrogation recovery.
|
Below is the rollforward of R&W subrogation, by random sample estimation approach, for the affected periods:
|
Six Months Ended June 30,
|
|||||||
|
2017
|
2016
|
||||||
|
Discounted R&W subrogation (gross of reinsurance) at beginning of period
|
$
|
1,907,035
|
|
$
|
2,829,575
|
|
|
|
Changes recognized during the period:
|
|||||||
|
Impact of sponsor actions
(1)
|
—
|
|
(995,000
|
)
|
|||
|
All other changes
(2)
|
(22,579
|
)
|
49,251
|
|
|||
|
Discounted R&W subrogation (gross of reinsurance) at end of period
|
$
|
1,884,456
|
|
$
|
1,883,826
|
|
|
|
(1)
|
Sponsor actions include loan repurchases, direct payments to Ambac and other contributions from sponsors. In January 2016, Ambac Assurance settled its RMBS-related disputes and litigation against JP Morgan Chase & Co. and certain of its affiliates (collectively "JP Morgan"). Pursuant to the settlement, JP Morgan paid Ambac Assurance
$995,000
in cash in return for releases of all of Ambac Assurance's claims against JP Morgan arising from certain RMBS transactions insured by Ambac Assurance. Ambac Assurance also agreed to withdraw its objections to JP Morgan's global RMBS settlement with RMBS trustees.
|
|
(2)
|
All other changes which may impact R&W subrogation recoveries include changes in actual or projected collateral performance, changes in the creditworthiness of a sponsor and/or the projected timing of recoveries. All other changes may also include estimates of potential sponsor settlements that may not have been subject to a sampling approach or have been executed but the settlement amounts have not yet been received. Those that have not been subject to a sampling approach are not material to Ambac’s financial results and therefore are included in the Random Sample column of this table.
|
Our ability to realize R&W subrogation recoveries is subject to significant uncertainty, including risks inherent in litigation, collectability of such amounts from counterparties (and/or their respective parents and affiliates), timing of receipt of any such recoveries, intervention by the Rehabilitator or OCI, which could impede our ability to take actions required to realize such recoveries, and uncertainty inherent in the assumptions used in estimating such recoveries.
Insurance intangible asset:
The insurance intangible amortization expense is included in insurance intangible amortization on the Consolidated Statements of Total Comprehensive Income (Loss). For the
three and six months ended June 30, 2017
, the insurance intangible amortization expense was
$33,471
and
$70,996
, respectively and for the
three and six months ended June 30, 2016
, the insurance intangible amortization expenses was
$39,013
and
$89,903
, respectively. As of
June 30, 2017 and December 31, 2016
, the gross carrying value of the insurance intangible asset was
$1,561,592
and
$1,534,419
, respectively. Accumulated amortization of the insurance intangible asset was
$649,419
and
$572,339
, as of
June 30, 2017 and December 31, 2016
, respectively, resulting in a net insurance intangible asset of
$912,173
and
$962,080
, respectively.
The estimated future amortization expense for the net insurance intangible asset is as follows:
|
2017
|
2018
|
2019
|
2020
|
2021
|
Thereafter
|
|||||||||||||||||||
|
Amortization expense
(1)
|
$
|
45,673
|
|
$
|
80,743
|
|
$
|
72,291
|
|
$
|
66,509
|
|
$
|
60,041
|
|
$
|
586,916
|
|
||||||
|
(1)
|
Future amortization considers the use of contractual lives for many bond types which do not have homogeneous pools of underlying collateral. Actual maturities will differ from contractual maturities because
borrowers may have the right to call or prepay certain obligations. If those bonds types are retired
|
| Ambac Financial Group, Inc.
26
2017 Second Quarter FORM 10-Q |
AMBAC FINANCIAL GROUP, INC. AND SUBSIDIARIES
Notes to Unaudited Consolidated Financial Statements
(Dollar Amounts in Thousands, Except Share Amounts)
early, amortization expense may differ in the period of call or refinancing. If consummated, the Segregated Account transaction highlighted in
Note 1. Background and Business Description
will cause an acceleration of amortization expense for a portion of the insurance intangible asset.
7. FAIR VALUE MEASUREMENTS
The Fair Value Measurement Topic of the ASC establishes a framework for measuring fair value and disclosures about fair value measurements.
Fair Value Hierarchy:
The Fair Value Measurement Topic of the ASC specifies a fair value hierarchy based on whether the inputs to valuation techniques used to measure fair value are observable or unobservable. Observable inputs reflect market data obtained from independent sources, while unobservable inputs reflect Company-based assumptions. The fair value hierarchy prioritizes model inputs into three broad levels as follows:
|
l
|
Level 1
|
Quoted prices for identical instruments in active markets. Assets and liabilities classified as Level 1 include US Treasury and other foreign government obligations traded in highly liquid and transparent markets, exchange traded futures contracts, variable rate demand obligations and money market funds.
|
|
|
l
|
Level 2
|
Quoted prices for similar instruments in active markets; quoted prices for identical or similar instruments in markets that are not active; and model-derived valuations in which all significant inputs and significant value drivers are observable in active markets. Assets and liabilities classified as Level 2 generally include investments in fixed income securities representing municipal, asset-backed and corporate obligations, certain interest rate swap contracts, and most long-term debt of variable interest entities consolidated under the Consolidation Topic of the ASC.
|
|
|
l
|
Level 3
|
Model derived valuations in which one or more significant inputs or significant value drivers are unobservable. This hierarchy requires the use of observable market data when available. Assets and liabilities classified as Level 3 include credit derivative contracts written as part of the financial guarantee business, certain uncollateralized interest rate swap contracts, equity interests in Ambac sponsored special purpose entities and certain investments in fixed income securities. Additionally, Level 3 assets and liabilities generally include fixed income securities, loan receivables, and certain long-term debt of variable interest entities consolidated under the Consolidation Topic of the ASC.
|
|
The following table sets forth the carrying amount and fair value of Ambac’s financial assets and liabilities as of
June 30, 2017 and December 31, 2016
, including the level within the fair value hierarchy at which fair value measurements are categorized. As required by the Fair Value Measurement Topic of the ASC, financial assets and liabilities are classified in their entirety based on the lowest level of input that is significant to the fair value measurement.
| Ambac Financial Group, Inc.
27
2017 Second Quarter FORM 10-Q |
AMBAC FINANCIAL GROUP, INC. AND SUBSIDIARIES
Notes to Unaudited Consolidated Financial Statements
(Dollar Amounts in Thousands, Except Share Amounts)
|
Carrying
Amount |
Total Fair
Value |
Fair Value Measurements Categorized as:
|
||||||||||||||||||
|
June 30, 2017:
|
Level 1
|
Level 2
|
Level 3
|
|||||||||||||||||
|
Financial assets:
|
||||||||||||||||||||
|
Fixed income securities:
|
||||||||||||||||||||
|
Municipal obligations
|
$
|
661,506
|
|
$
|
661,506
|
|
$
|
—
|
|
$
|
661,506
|
|
$
|
—
|
|
|||||
|
Corporate obligations
|
1,500,413
|
|
1,500,413
|
|
—
|
|
1,500,413
|
|
—
|
|
||||||||||
|
Foreign obligations
|
29,746
|
|
29,746
|
|
28,802
|
|
944
|
|
—
|
|
||||||||||
|
U.S. government obligations
|
41,633
|
|
41,633
|
|
41,633
|
|
—
|
|
—
|
|
||||||||||
|
Residential mortgage-backed securities
|
2,299,528
|
|
2,299,528
|
|
—
|
|
1,599,212
|
|
700,316
|
|
||||||||||
|
Collateralized debt obligations
|
125,106
|
|
125,106
|
|
—
|
|
125,106
|
|
—
|
|
||||||||||
|
Other asset-backed securities
|
660,263
|
|
660,263
|
|
—
|
|
594,897
|
|
65,366
|
|
||||||||||
|
Fixed income securities, pledged as collateral:
|
||||||||||||||||||||
|
U.S. government obligations
|
64,928
|
|
64,928
|
|
64,928
|
|
—
|
|
—
|
|
||||||||||
|
Short term investments
|
504,006
|
|
504,006
|
|
402,296
|
|
101,710
|
|
—
|
|
||||||||||
|
Other investments
(2)
|
452,032
|
|
436,187
|
|
89,753
|
|
—
|
|
16,573
|
|
||||||||||
|
Cash and cash equivalents
|
54,238
|
|
54,238
|
|
26,300
|
|
27,938
|
|
—
|
|
||||||||||
|
Loans
|
10,125
|
|
10,170
|
|
—
|
|
—
|
|
10,170
|
|
||||||||||
|
Derivative assets:
|
||||||||||||||||||||
|
Interest rate swaps—asset position
|
75,936
|
|
75,936
|
|
—
|
|
14,201
|
|
61,735
|
|
||||||||||
|
Futures contracts
|
3,111
|
|
3,111
|
|
3,111
|
|
—
|
|
—
|
|
||||||||||
|
Other assets
|
6,691
|
|
6,691
|
|
—
|
|
—
|
|
6,691
|
|
||||||||||
|
Variable interest entity assets:
|
||||||||||||||||||||
|
Fixed income securities:
|
||||||||||||||||||||
|
Corporate obligations
|
2,722,316
|
|
2,722,316
|
|
—
|
|
—
|
|
2,722,316
|
|
||||||||||
|
Restricted cash
|
5,015
|
|
5,015
|
|
5,015
|
|
—
|
|
—
|
|
||||||||||
|
Loans
|
11,301,298
|
|
11,301,298
|
|
—
|
|
—
|
|
11,301,298
|
|
||||||||||
|
Derivative assets:
|
||||||||||||||||||||
|
Currency swaps-asset position
|
65,507
|
|
65,507
|
|
—
|
|
65,507
|
|
—
|
|
||||||||||
|
Total financial assets
|
$
|
20,583,398
|
|
$
|
20,567,598
|
|
$
|
661,838
|
|
$
|
4,691,434
|
|
$
|
14,884,465
|
|
|||||
|
Financial liabilities:
|
||||||||||||||||||||
|
Long term debt, including accrued interest
|
$
|
1,386,124
|
|
$
|
1,371,102
|
|
$
|
—
|
|
$
|
1,042,366
|
|
$
|
328,736
|
|
|||||
|
Derivative liabilities:
|
||||||||||||||||||||
|
Credit derivatives
|
9,006
|
|
9,006
|
|
—
|
|
—
|
|
9,006
|
|
||||||||||
|
Interest rate swaps—asset position
|
(731
|
)
|
(731
|
)
|
—
|
|
(731
|
)
|
—
|
|
||||||||||
|
Interest rate swaps—liability position
|
83,274
|
|
83,274
|
|
—
|
|
83,274
|
|
—
|
|
||||||||||
|
Futures contracts
|
—
|
|
—
|
|
—
|
|
—
|
|
—
|
|
||||||||||
|
Liabilities for net financial guarantees written
(1)
|
3,212,581
|
|
5,214,437
|
|
—
|
|
—
|
|
5,214,437
|
|
||||||||||
|
Variable interest entity liabilities:
|
||||||||||||||||||||
|
Long-term debt
|
11,902,682
|
|
11,902,682
|
|
—
|
|
9,098,464
|
|
2,804,218
|
|
||||||||||
|
Derivative liabilities:
|
||||||||||||||||||||
|
Interest rate swaps—liability position
|
2,064,071
|
|
2,064,071
|
|
—
|
|
2,064,071
|
|
—
|
|
||||||||||
|
Total financial liabilities
|
$
|
18,657,007
|
|
$
|
20,643,841
|
|
$
|
—
|
|
$
|
12,287,444
|
|
$
|
8,356,397
|
|
|||||
| Ambac Financial Group, Inc.
28
2017 Second Quarter FORM 10-Q |
AMBAC FINANCIAL GROUP, INC. AND SUBSIDIARIES
Notes to Unaudited Consolidated Financial Statements
(Dollar Amounts in Thousands, Except Share Amounts)
|
Carrying
Amount |
Total Fair
Value |
Fair Value Measurements Categorized as:
|
||||||||||||||||||
|
December 31, 2016:
|
Level 1
|
Level 2
|
Level 3
|
|||||||||||||||||
|
Financial assets:
|
||||||||||||||||||||
|
Fixed income securities:
|
||||||||||||||||||||
|
Municipal obligations
|
$
|
374,368
|
|
$
|
374,368
|
|
$
|
—
|
|
$
|
374,368
|
|
$
|
—
|
|
|||||
|
Corporate obligations
|
1,802,165
|
|
1,802,165
|
|
—
|
|
1,802,165
|
|
—
|
|
||||||||||
|
Foreign obligations
|
43,135
|
|
43,135
|
|
42,212
|
|
923
|
|
—
|
|
||||||||||
|
U.S. government obligations
|
36,186
|
|
36,186
|
|
36,186
|
|
—
|
|
—
|
|
||||||||||
|
U.S. agency obligations
|
4,060
|
|
4,060
|
|
—
|
|
4,060
|
|
—
|
|
||||||||||
|
Residential mortgage-backed securities
|
2,351,595
|
|
2,351,595
|
|
—
|
|
1,654,882
|
|
696,713
|
|
||||||||||
|
Collateralized debt obligations
|
113,923
|
|
113,923
|
|
—
|
|
113,923
|
|
—
|
|
||||||||||
|
Other asset-backed securities
|
828,783
|
|
828,783
|
|
—
|
|
762,793
|
|
65,990
|
|
||||||||||
|
Fixed income securities, pledged as collateral:
|
||||||||||||||||||||
|
U.S. government obligations
|
64,905
|
|
64,905
|
|
64,905
|
|
—
|
|
—
|
|
||||||||||
|
Short term investments
|
430,788
|
|
430,788
|
|
371,367
|
|
59,421
|
|
—
|
|
||||||||||
|
Other investments
(2)
|
450,307
|
|
435,237
|
|
83,791
|
|
—
|
|
14,934
|
|
||||||||||
|
Cash and cash equivalents
|
91,025
|
|
91,025
|
|
46,587
|
|
44,438
|
|
—
|
|
||||||||||
|
Loans
|
4,160
|
|
4,066
|
|
—
|
|
—
|
|
4,066
|
|
||||||||||
|
Derivative assets:
|
||||||||||||||||||||
|
Interest rate swaps—asset position
|
77,206
|
|
77,206
|
|
—
|
|
16,950
|
|
60,256
|
|
||||||||||
|
Futures contracts
|
536
|
|
536
|
|
536
|
|
—
|
|
—
|
|
||||||||||
|
Other assets
|
7,382
|
|
7,382
|
|
—
|
|
—
|
|
7,382
|
|
||||||||||
|
Variable interest entity assets:
|
||||||||||||||||||||
|
Fixed income securities:
|
||||||||||||||||||||
|
Corporate obligations
|
2,622,566
|
|
2,622,566
|
|
—
|
|
—
|
|
2,622,566
|
|
||||||||||
|
Restricted cash
|
4,873
|
|
4,873
|
|
4,873
|
|
—
|
|
—
|
|
||||||||||
|
Loans
|
10,658,963
|
|
10,658,963
|
|
—
|
|
—
|
|
10,658,963
|
|
||||||||||
|
Derivative assets:
|
||||||||||||||||||||
|
Currency swaps—asset position
|
80,407
|
|
80,407
|
|
—
|
|
80,407
|
|
—
|
|
||||||||||
|
Total financial assets
|
$
|
20,047,333
|
|
$
|
20,032,169
|
|
$
|
650,457
|
|
$
|
4,914,330
|
|
$
|
14,130,870
|
|
|||||
|
Financial liabilities:
|
||||||||||||||||||||
|
Obligations under investment agreements
|
$
|
82,358
|
|
$
|
82,333
|
|
$
|
—
|
|
$
|
—
|
|
$
|
82,333
|
|
|||||
|
Long term debt, including accrued interest
|
1,536,352
|
|
1,494,340
|
|
—
|
|
1,147,728
|
|
346,612
|
|
||||||||||
|
Derivative liabilities:
|
||||||||||||||||||||
|
Credit derivatives
|
15,349
|
|
15,349
|
|
—
|
|
—
|
|
15,349
|
|
||||||||||
|
Interest rate swaps—asset position
|
(61,839
|
)
|
(61,839
|
)
|
—
|
|
(61,839
|
)
|
—
|
|
||||||||||
|
Interest rate swaps—liability position
|
365,776
|
|
365,776
|
|
—
|
|
220,587
|
|
145,189
|
|
||||||||||
|
Liabilities for net financial guarantees written
(1)
|
3,009,943
|
|
4,490,070
|
|
—
|
|
—
|
|
4,490,070
|
|
||||||||||
|
Variable interest entity liabilities:
|
||||||||||||||||||||
|
Long-term debt
|
11,155,936
|
|
11,155,936
|
|
—
|
|
8,573,716
|
|
2,582,220
|
|
||||||||||
|
Derivative liabilities:
|
||||||||||||||||||||
|
Interest rate swaps—liability position
|
2,078,601
|
|
2,078,601
|
|
—
|
|
2,078,601
|
|
—
|
|
||||||||||
|
Total financial liabilities
|
$
|
18,182,476
|
|
$
|
19,620,566
|
|
$
|
—
|
|
$
|
11,958,793
|
|
$
|
7,661,773
|
|
|||||
|
(1)
|
The carrying value of net financial guarantees written includes the following balance sheet items: Premium receivables; Reinsurance recoverable on paid and unpaid losses; Deferred ceded premium; Subrogation recoverable; Insurance intangible asset; Unearned premiums; Loss and loss expense reserves; Ceded premiums payable, premiums taxes payable and other deferred fees recorded in Other liabilities.
|
|
(2)
|
Excluded from the fair value measurement categories in the table above are investment funds of
$329,861
and
$336,513
as of
June 30, 2017 and December 31, 2016
, respectively, which are measured using NAV per share as a practical expedient.
|
| Ambac Financial Group, Inc.
29
2017 Second Quarter FORM 10-Q |
AMBAC FINANCIAL GROUP, INC. AND SUBSIDIARIES
Notes to Unaudited Consolidated Financial Statements
(Dollar Amounts in Thousands, Except Share Amounts)
Determination of Fair Value:
When available, Ambac uses quoted active market prices specific to the financial instrument to determine fair value, and classifies such items within Level 1. Because many fixed income securities do not trade on a daily basis, pricing sources apply available market information through processes such as matrix pricing to calculate fair value. In those cases, the items are classified within Level 2. If quoted market prices are not available, fair value is based upon models that use, where possible, current market-based or independently-sourced market parameters. Items valued using valuation models are classified according to the lowest level input or value driver that is significant to the valuation. Thus, an item may be classified in Level 3 even though there may be significant inputs that are readily observable.
The determination of fair value for financial instruments categorized in Level 2 or 3 involves significant judgment due to the complexity of factors contributing to the valuation. Third-party sources from which we obtain independent market quotes also use assumptions, judgments and estimates in determining financial instrument values and different third parties may use different methodologies or provide different prices for securities. In addition, the use of internal valuation models may require assumptions about hypothetical or inactive markets. As a result of these factors, the actual trade value of a financial instrument in the market, or exit value of a financial instrument position by Ambac, may be significantly different from its recorded fair value.
Ambac’s financial instruments carried at fair value are mainly comprised of investments in fixed income securities, equity interests in pooled investment funds, derivative instruments, variable interest entity assets and liabilities and equity interests in Ambac sponsored special purpose entities. Valuation of financial instruments is performed by Ambac’s finance group using methods approved by senior financial management with consultation from risk management and portfolio managers as appropriate. Preliminary valuation results are discussed with portfolio managers quarterly to assess consistency with market transactions and trends as applicable. Market transactions such as trades or negotiated settlements of similar positions, if any, are reviewed to validate fair value model results. However many of the financial instruments valued using significant unobservable inputs have very little or no observable market activity. Methods and significant inputs and assumptions used to determine fair values across portfolios are reviewed quarterly by senior financial management. Other valuation control procedures specific to particular portfolios are described further below.
We reflect Ambac’s own creditworthiness in the fair value of financial liabilities by including a credit valuation adjustment (“CVA”) in the determination of fair value. A decline (increase) in Ambac’s creditworthiness as perceived by market participants will generally result in a higher (lower) CVA, thereby lowering (increasing) the fair value of Ambac’s financial liabilities as reported.
Fixed Income Securities:
The fair values of fixed income investment securities are based primarily on market prices received from dealer quotes or alternative pricing sources with reasonable levels of price transparency. Such quotes generally consider a variety of factors, including recent trades of the same and similar securities. For those fixed income investments where quotes were not available or cannot be reasonably corroborated, fair values are based on internal valuation models. Key inputs to the internal valuation models generally include maturity date, coupon and yield curves for asset-type and credit rating characteristics that closely match those characteristics of the specific investment securities being valued. Longer (shorter) expected maturities or higher (lower) yields used in the valuation model will, in isolation, result in decreases (increases) in fair value. Generally, lower credit ratings or longer expected maturities will be accompanied by higher yields used to value a security. At
June 30, 2017
, approximately
5%
,
82%
and
13%
of the fixed income investment portfolio (excluding variable interest entity investments) was valued using dealer quotes, alternative pricing sources with reasonable levels of price transparency and internal valuation models, respectively. At
December 31, 2016
, approximately
5%
,
82%
and
13%
of the fixed income investment portfolio (excluding variable interest entity investments) was valued using dealer quotes, alternative pricing sources with reasonable levels of price transparency and internal valuation models, respectively. Among the investments valued using internal valuation models are Ambac insured securities for which projected cash flows consist solely of Deferred Amounts and interest thereon. These securities are internally valued based upon the valuation of Ambac Assurance's surplus notes and comprise
11%
and
12%
of the portfolio at
June 30, 2017 and December 31, 2016
, respectively.
Ambac performs various review and validation procedures to quoted and modeled prices for fixed income securities, including price variance analyses, missing and static price reviews, overall valuation analysis by senior traders and finance managers and reviews associated with our ongoing impairment analysis. Unusual prices identified through these procedures will be evaluated further against alternative third party quotes (if available) and/or internally modeled prices, and the pricing source values will be challenged as necessary. Price challenges generally result in the use of the pricing source’s quote as originally provided or as revised by the source following their internal diligence process. A price challenge may result in a determination by either the pricing source or Ambac management that the pricing source cannot provide a reasonable value for a security or cannot adequately support a quote, in which case Ambac would resort to using either other quotes or internal models. Results of price challenges are reviewed by senior traders and finance managers.
Valuation Inputs
Information about the valuation inputs for fixed income securities classified as Level 3 is included below:
Residential mortgage-backed securities:
A portion of these securities are guaranteed under policies that are subject to the Segregated Account Rehabilitation Plan and have projected future cash flows consisting solely of Deferred Amounts under such policies including interest thereon. The fair value of such securities classified as Level 3 was
$673,897
and
$696,713
at
June 30, 2017 and December 31, 2016
, respectively. Fair value was calculated based on the valuation of Ambac Assurance surplus notes which, under the terms of the Segregated Account Rehabilitation
| Ambac Financial Group, Inc.
30
2017 Second Quarter FORM 10-Q |
AMBAC FINANCIAL GROUP, INC. AND SUBSIDIARIES
Notes to Unaudited Consolidated Financial Statements
(Dollar Amounts in Thousands, Except Share Amounts)
Plan, are to be redeemed in proportion with the payment of Deferred Amounts on or about the dates when such payments are made. Refer to
Note 1. Background and Business Description
in the Notes to Consolidated Financial Statements included in the Company’s Annual Report on Form 10-K for the year ended
December 31, 2016
for further description of the Segregated Account Rehabilitation Plan and its impact on the payment of Segregated Account policy claims and surplus note redemptions.
The remaining portion of Level 3 residential mortgage-backed securities are an Ambac-insured re-REMIC containing distressed mortgage-backed securities as collateral, the fair value of which was
$26,419
at
June 30, 2017
. There were
$0
such securities classified as Level 3 as of
December 31, 2016
. Fair value was calculated using a discounted cash flow approach with expected future cash flows discounted using a yield consistent with the security type and rating. Significant inputs for the valuation at
June 30, 2017
were as follows:
|
June 30, 2017
|
||
|
a. Coupon rate:
|
1.72%
|
|
|
b. Average Life:
|
4.11 years
|
|
|
c. Yield:
|
10.00%
|
|
Other asset-backed securities:
These securities are a subordinated tranche of a resecuritization collateralized by Ambac-insured military housing bonds. The fair value of such securities classified as Level 3 was
$65,366
and
$65,990
at
June 30, 2017 and December 31, 2016
, respectively. Fair value was calculated using a discounted cash flow approach with expected future cash flows discounted using a yield consistent with the security type and rating. Significant inputs for the valuation at
June 30, 2017 and December 31, 2016
include the following weighted averages:
|
June 30, 2017:
|
December 31, 2016:
|
|||
|
a. Coupon rate:
|
5.97%
|
a. Coupon rate:
|
5.93%
|
|
|
b. Average Life:
|
17.44 years
|
b. Maturity:
|
17.74 years
|
|
|
c. Yield:
|
13.50%
|
c. Yield:
|
13.50%
|
|
Other Investments:
Other investments primarily relate to investments in pooled investment funds. The fair value of pooled investment funds is determined using dealer quotes or alternative pricing sources when such investments have readily determinable fair values. When fair value is not readily determinable, pooled investment funds are valued using the net asset value (“NAV”) per share as a practical expedient as permitted under the Fair Value Measurement Topic of the ASC. Refer to
Note 8. Investments
for additional information about such investments in pooled funds that are reported at fair value using NAV as a practical expedient.
Other investments also includes Ambac's interest in a non-consolidated VIE, which is carried under the equity method. Valuation of this equity interest is internally calculated using a discounted cash flow approach and is classified as Level 3.
Derivative Instruments:
Ambac’s derivative instruments primarily comprise interest rate and credit default swaps and exchange traded futures contracts. Fair value is determined based upon market quotes from independent sources, when available. When independent quotes are not available, fair value is determined using valuation models. These valuation models require market-driven inputs, including contractual terms, credit spreads and ratings on underlying referenced obligations, yield curves and tax-exempt interest ratios. The valuation of certain interest rate as well as all credit derivative contracts also require the use of data inputs and assumptions that are determined by management and are not readily observable in the market. Under the Fair Value Measurement Topic of the ASC, Ambac is required to consider its own credit risk when measuring the fair value of derivatives and other liabilities. The fair value of credit derivative liabilities was reduced by
$1,383
and
$1,924
at
June 30, 2017 and December 31, 2016
, respectively, as a result of incorporating an Ambac CVA into the valuation model for these contracts. Interest rate swaps may also require an adjustment to fair value to reflect Ambac’s credit risk. During the three months ended June 30, 2017, interest rate swaps that had incorporated an Ambac CVA into the valuation were terminated. As a result, derivative liabilities are no longer reduced as a result of Ambac CVA at June 30, 2017 compared to
$44,943
at December 31, 2016. Additional factors considered in estimating the amount of any Ambac CVA on such contracts include collateral posting provisions, right of set-off with the counterparty, the period of time remaining on the derivative and the pricing of recent terminations.
As described further below, certain valuation models require other inputs that are not readily observable in the market. The selection of a model to value a derivative depends on the contractual terms of, and specific risks inherent in the instrument as well as the availability of pricing information in the market.
Derivatives that are less complex may be valued primarily by reference to interest rates and yield curves that are observable and regularly quoted, such as interest rate swaps, for which we generally utilize vendor-developed models. These models provide the net present value of the derivatives based on contractual terms and observable market data. Downgrades of Ambac Assurance, as guarantor of the derivatives, have increased collateral requirements and triggered termination provisions in certain interest rate swaps. Termination activity since the initial rating downgrades of Ambac
| Ambac Financial Group, Inc.
31
2017 Second Quarter FORM 10-Q |
AMBAC FINANCIAL GROUP, INC. AND SUBSIDIARIES
Notes to Unaudited Consolidated Financial Statements
(Dollar Amounts in Thousands, Except Share Amounts)
Assurance provided additional information about the replacement and/or exit value of certain derivatives, which has been incorporated into the fair value of these derivatives as appropriate. Generally, the need for counterparty (or Ambac) CVAs is mitigated by the existence of collateral posting agreements under which adequate collateral has been posted. Derivative contracts entered into with financial guarantee customers are not subject to collateral posting agreements. Counterparty credit risk related to such customer derivative assets is included in our fair value adjustments.
For derivatives that do not trade, or trade in less liquid markets such as credit derivatives, an internal model is generally used because such instruments tend to be unique, contain complex or heavily modified and negotiated terms and pricing information is not readily available in the market. Derivative fair value models and the related assumptions are continuously re-evaluated by management and enhanced, as appropriate, based on improvements in modeling techniques. Ambac has not made any significant changes to its modeling techniques or related model inputs for the periods presented.
Credit Derivatives (“CDS”):
Fair value of Ambac’s CDS is determined using internal valuation models and represents the hypothetical transfer cost of the contract calculated as the difference between the net present value of the projected fees receivable under the CDS and our estimate of the fees a financial guarantor of comparable credit quality would charge to provide the same protection at the balance sheet date. Financial guarantee contracts, including CDS, are typically priced to capture some portion of the spread that would be observed in the capital markets for the underlying (insured) obligation. Because of this relationship and in the absence of severe credit deterioration, changes in the fair value of our credit default swaps will generally be less than changes in the fair value of the underlying reference obligations.
Key variables used in the valuation of our credit derivatives include the balance of unpaid notional, expected term, fair values of the underlying reference obligations, reference obligation credit ratings and the CVA applied against Ambac Assurance liabilities by market participants. Notional balances, expected remaining term and reference obligation credit ratings are monitored and determined by Ambac’s portfolio risk management group. Fair values of the underlying reference obligations are obtained from broker quotes when available or are estimated internally using the same methodologies used to value Ambac’s fixed income securities in its investment portfolio.
Ambac reflects changes in reference obligation credit ratings within the fair value of its CDS contracts by changing the percentage of the obligation's market spread (over LIBOR) that would be captured as a CDS fee at the valuation date. We adjust this percentage (“relative change ratio”) in our valuations based on internal rating changes such that the resulting fair value liability of the CDS contract, excluding the effect of Ambac's own credit risk, will increase up to the full amount of the unrealized loss on the reference obligation as the credit rating declines. Ambac incorporates its own credit risk into the valuation of its CDS liabilities by applying a CVA to the calculations described above. The Ambac CVA represents the difference between the present value of the hypothetical fees discounted at LIBOR compared to discount rates that incorporate Ambac credit risk.
Information about the above described model inputs used to determine the fair value of credit derivatives, including the CVA as a percentage of the gross mark-to-market liability before considering Ambac credit risk (“CVA percentage”), as of
June 30, 2017 and December 31, 2016
is summarized below:
|
June 30,
2017 |
December 31, 2016
|
|||||||
|
Notional outstanding
|
$
|
455,792
|
|
$
|
737,380
|
|
||
|
Weighted average reference obligation price
|
94.0
|
|
93.5
|
|
||||
|
Weighted average life (WAL) in years
|
5.7
|
|
5.2
|
|
||||
|
Weighted average credit rating
|
A-
|
|
A-
|
|
||||
|
Weighted average relative change ratio
|
29.5
|
%
|
31.6
|
%
|
||||
|
CVA percentage
|
13.31
|
%
|
11.14
|
%
|
||||
|
Fair value of derivative liabilities
|
$
|
9,006
|
|
$
|
15,349
|
|
||
Significant unobservable inputs for credit derivatives include WAL, internal credit rating, relative change ratio and CVA percentage. A longer (shorter) WAL, lower (higher) reference obligation credit rating, higher (lower) relative change ratio or lower (higher) CVA, in isolation, would result in an increase (decrease) in the fair value liability measurement. A change in an internal credit rating of a reference obligation in our model will generally result in a directionally opposite change in the relative change ratio. Also, a shorter (longer) WAL will generally correspond with a lower (higher) CVA percentage.
Financial Guarantees:
Fair value of net financial guarantees written represents our estimate of the cost to Ambac to completely transfer its insurance obligation to another market participant of comparable credit worthiness. In theory, this amount should be the same amount that another market participant of comparable credit worthiness would hypothetically charge in the market place, on a present value basis, to provide the same protection as of the balance sheet date. This fair value estimate of financial guarantees is presented on a net basis and includes direct and assumed contracts written, net of ceded reinsurance contracts.
| Ambac Financial Group, Inc.
32
2017 Second Quarter FORM 10-Q |
AMBAC FINANCIAL GROUP, INC. AND SUBSIDIARIES
Notes to Unaudited Consolidated Financial Statements
(Dollar Amounts in Thousands, Except Share Amounts)
The fair value estimate of financial guarantees is computed by utilizing cash flows calculated at the policy level. For direct and assumed contracts, net cash flows for each policy includes future: (i) installment premium receipts, (ii) gross claim payments, (iii) subrogation receipts, and (iv) unpaid claims on claims presented and not yet paid for policies allocated to the Segregated Account, including Deferred Amounts and interest thereon. The timing of future claim payments of the Segregated Account are at the sole discretion of the Rehabilitator. For ceded reinsurance contracts, net cash flows for each policy includes future: (i) installment ceded premium payments, (ii) ceding commission receipts, (iii) ceded claim receipts, and (iv) ceded subrogation payments. For each assumed or ceded reinsurance contract, the respective undiscounted cash flow components are aggregated to determine if we are in a net asset or net liability position. U.S. GAAP requires that the nonperformance risk of a financial liability be included in the estimation of fair value, which includes considering Ambac Assurance’s own credit risk. Accordingly, for each contract in a net liability position, we estimate the fair value using internally developed discount rates and market pricing that incorporate Ambac’s own credit risk and subsequently apply a profit margin. This profit margin represents what another market participant would require to assume the financial guarantee contracts. Given the unique nature of financial guarantees there is a lack of observable market information to make this estimate. A profit margin was developed based on discussions with the third-party institutions with valuation expertise, discussions with industry participants and yields on Ambac Assurance surplus notes. The discount rates used for contracts in a net liability position are derived from the rates implicit in the fair value of surplus notes and guaranteed securities with future cash flows that are highly dependent upon Ambac financial guarantee payments. For each contract in a net asset position, we estimate the fair value using a discount rate that is commensurate with a hypothetical buyer’s cost of capital.
This methodology is based on management’s expectations of how a market participant would estimate net cash flows. We are aware of a number of factors that may cause such fair or exit value to differ, perhaps materially. For example, (i) since no financial guarantor with Ambac Assurance’s credit quality is writing or otherwise obtaining financial guarantee business (e.g. reinsurance or novation of policies from other insurers) we do not have access to observable pricing data points and (ii) certain segments of Ambac's financial guarantees have been allocated to the Segregated Account and timing of the payments of such liabilities are at the sole discretion of the Rehabilitator.
Long-term debt includes surplus notes issued by Ambac Assurance, surplus notes issued by the Segregated Account of Ambac Assurance and notes outstanding to third parties arising from Ambac Assurance's secured borrowing transaction. The fair values of Ambac Assurance surplus notes and the secured borrowing notes are based on market prices received from dealer quotes or alternative pricing sources with reasonable levels of price transparency. The fair value of Segregated Account surplus notes are classified as Level 3 and are internally estimated considering market transactions when available and internally developed discounted cash flow models. Internal valuation estimates of Segregated Account surplus notes consider differences in contractual accrued interest and seniority of payment relative to Ambac Assurance surplus notes.
Other Financial Assets and Liabilities:
The fair values of Ambac’s equity interest in Ambac sponsored special purpose entities (included in Other assets), Loans, and Obligations under investment agreements are estimated based upon internal valuation models that discount expected cash flows using discount rates consistent with the credit quality of the obligor after considering collateralization.
Variable Interest Entity Assets and Liabilities:
The financial assets and liabilities of VIEs consolidated under the Consolidation Topic of the ASC consist primarily of fixed income securities, loans, derivative and debt instruments and are generally carried at fair value. These consolidated VIEs are securitization entities which have liabilities and/or assets guaranteed by Ambac Assurance. The fair values of VIE debt instruments are determined using the same methodologies used to value Ambac’s fixed income securities in its investment portfolio as described above. VIE debt fair value is based on market prices received from dealer quotes or alternative pricing sources with reasonable levels of price transparency. Such quotes are considered Level 2 and generally consider a variety of factors, including recent trades of the same and similar securities. For those VIE debt instruments where quotes were not available, the debt instrument fair values are considered Level 3 and are based on internal discounted cash flow models. Comparable to the sensitivities of investments in fixed income securities described above, longer (shorter) expected maturities or higher (lower) yields used in the valuation model will, in isolation, result in decreases (increases) in fair value liability measurement for VIE debt. VIE debt instruments considered Level 3 include fixed rate, floating rate and zero coupon notes secured by various asset types, primarily European ABS. Information about the valuation inputs for the various VIE debt categories classified as Level 3 is as follows:
European ABS transactions:
The fair value of such obligations classified as Level 3 was
$2,773,411
and
$2,551,278
at
June 30, 2017 and December 31, 2016
, respectively. Fair values were calculated by using a discounted cash flow approach. The discount rates used were based on the rates implied from the third party quoted values for comparable notes from the same securitization entity. Significant inputs for the valuation at
June 30, 2017 and December 31, 2016
include the following weighted averages:
|
June 30, 2017:
|
December 31, 2016:
|
|||
|
a. Coupon rate:
|
0.43%
|
a. Coupon rate:
|
0.46%
|
|
|
b. Maturity:
|
15.79 years
|
b. Maturity:
|
16.16 years
|
|
|
c. Yield:
|
4.79%
|
c. Yield:
|
4.95%
|
|
| Ambac Financial Group, Inc.
33
2017 Second Quarter FORM 10-Q |
AMBAC FINANCIAL GROUP, INC. AND SUBSIDIARIES
Notes to Unaudited Consolidated Financial Statements
(Dollar Amounts in Thousands, Except Share Amounts)
US Commercial ABS transaction:
The fair value of such obligations classified as Level 3 was
$30,807
and
$30,942
at
June 30, 2017 and December 31, 2016
, respectively. Fair values were calculated as the sum of the present value of expected future cash flows from the underlying VIE assets plus the present value of the related Ambac financial guarantee cash flows. The discount rates applied to cash flows sourced from VIE assets were based on interest rates for similar obligations. The fair value of financial guarantee cash flows include internal estimates of future loss payments by Ambac discounted at a rate that incorporates Ambac’s own credit risk. Significant inputs for the valuation at
June 30, 2017 and December 31, 2016
, include the following weighted averages:
|
June 30, 2017:
|
December 31, 2016:
|
|||
|
a. Coupon rate:
|
5.88%
|
a. Coupon rate:
|
5.88%
|
|
|
b. Maturity:
|
20.35 years
|
b. Maturity:
|
20.85 years
|
|
|
c. Yield:
|
5.96%
|
c. Yield:
|
5.86%
|
|
VIE derivative asset and liability fair values are determined using valuation models. When specific derivative contractual terms are available and may be valued primarily by reference to interest rates, foreign exchange rates and yield curves that are observable and regularly quoted, the derivatives are valued using vendor-developed models. Other derivatives within the VIEs that include significant unobservable valuation inputs are valued using internally developed models. VIE derivative fair value balances at
June 30, 2017 and December 31, 2016
were developed using vendor-developed models and do not use significant unobservable inputs.
The fair value of VIE assets are obtained from market quotes when available. Typically the asset fair values are not readily available from market quotes and are estimated internally. The consolidated VIEs are securitization entities in which net cash flows from assets and derivatives (after adjusting for financial guarantor cash flows and other expenses) will be paid out to note holders or equity interests. Our valuation of VIE assets (fixed income securities or loans), therefore, are derived from the fair value of notes and derivatives, as described above, adjusted for the fair value of cash flows from Ambac’s financial guarantee. The fair value of financial guarantee cash flows include: (i) estimated future premiums discounted at a rate consistent with that implicit in the fair value of the VIE’s liabilities and (ii) internal estimates of future loss payments by Ambac discounted at a rate that includes Ambac’s own credit risk. Estimated future premium payments to be paid by the VIEs were discounted at a weighted average rate of
3.3%
and
3.6%
at
June 30, 2017 and December 31, 2016
, respectively. The value of future loss payments to be paid by Ambac to the VIEs was adjusted to include an Ambac CVA appropriate for the term of expected Ambac claim payments.
Additional Fair Value Information for Financial Assets and Liabilities Accounted for at Fair Value:
The following tables present the changes in the Level 3 fair value category for the periods presented in
2017
and
2016
. Ambac classifies financial instruments in Level 3 of the fair value hierarchy when there is reliance on at least one significant unobservable input to the valuation model. In addition to these unobservable inputs, the valuation models for Level 3 financial instruments typically also rely on a number of inputs that are readily observable either directly or indirectly. Thus, the gains and losses presented below include changes in the fair value related to both observable and unobservable inputs.
| Ambac Financial Group, Inc.
34
2017 Second Quarter FORM 10-Q |
AMBAC FINANCIAL GROUP, INC. AND SUBSIDIARIES
Notes to Unaudited Consolidated Financial Statements
(Dollar Amounts in Thousands, Except Share Amounts)
|
Level 3 - Financial Assets and Liabilities Accounted for at Fair Value
|
||||||||||||||||||||||||||||
|
VIE Assets and Liabilities
|
||||||||||||||||||||||||||||
|
Investments
|
Other
assets |
Derivatives
|
Investments
|
Loans
|
Long-term
debt |
Total
|
||||||||||||||||||||||
|
Three Months Ended June 30, 2017:
|
||||||||||||||||||||||||||||
|
Balance, beginning of period
|
$
|
721,624
|
|
$
|
7,039
|
|
$
|
(102,588
|
)
|
$
|
2,663,719
|
|
$
|
11,015,305
|
|
$
|
(2,716,642
|
)
|
$
|
11,588,457
|
|
|||||||
|
Total gains/(losses) realized and unrealized:
|
||||||||||||||||||||||||||||
|
Included in earnings
|
16,479
|
|
(348
|
)
|
54,115
|
|
(26,259
|
)
|
32,198
|
|
14,100
|
|
90,285
|
|
||||||||||||||
|
Included in other comprehensive income
|
10,812
|
|
—
|
|
—
|
|
100,783
|
|
402,842
|
|
(102,138
|
)
|
412,299
|
|
||||||||||||||
|
Purchases
|
25,930
|
|
—
|
|
—
|
|
—
|
|
—
|
|
—
|
|
25,930
|
|
||||||||||||||
|
Settlements
|
(9,163
|
)
|
—
|
|
101,202
|
|
(15,927
|
)
|
(149,047
|
)
|
462
|
|
(72,473
|
)
|
||||||||||||||
|
Balance, end of period
|
$
|
765,682
|
|
$
|
6,691
|
|
$
|
52,729
|
|
$
|
2,722,316
|
|
$
|
11,301,298
|
|
$
|
(2,804,218
|
)
|
$
|
12,044,498
|
|
|||||||
|
The amount of total gains/(losses) included in earnings attributable to the change in unrealized gains or losses relating to assets and liabilities still held at the reporting date
|
$
|
—
|
|
$
|
(348
|
)
|
$
|
4,240
|
|
$
|
(26,259
|
)
|
$
|
32,198
|
|
$
|
14,100
|
|
$
|
23,931
|
|
|||||||
|
Three Months Ended June 30, 2016:
|
||||||||||||||||||||||||||||
|
Balance, beginning of period
|
$
|
711,490
|
|
$
|
8,411
|
|
$
|
(109,894
|
)
|
$
|
2,622,723
|
|
$
|
11,516,241
|
|
$
|
(2,788,416
|
)
|
$
|
11,960,555
|
|
|||||||
|
Total gains/(losses) realized and unrealized:
|
||||||||||||||||||||||||||||
|
Included in earnings
|
14,616
|
|
276
|
|
(3,047
|
)
|
171,325
|
|
516,091
|
|
(332,605
|
)
|
366,656
|
|
||||||||||||||
|
Included in other comprehensive income
|
(4,783
|
)
|
—
|
|
—
|
|
(216,755
|
)
|
(895,557
|
)
|
233,100
|
|
(883,995
|
)
|
||||||||||||||
|
Purchases
|
17
|
|
—
|
|
—
|
|
—
|
|
—
|
|
—
|
|
17
|
|
||||||||||||||
|
Settlements
|
(4,913
|
)
|
—
|
|
8,909
|
|
—
|
|
(62,003
|
)
|
106,663
|
|
48,656
|
|
||||||||||||||
|
Transfers into Level 3
|
6,243
|
|
—
|
|
—
|
|
—
|
|
—
|
|
—
|
|
6,243
|
|
||||||||||||||
|
Transfers out of Level 3
|
—
|
|
—
|
|
—
|
|
—
|
|
—
|
|
523,249
|
|
523,249
|
|
||||||||||||||
|
Balance, end of period
|
$
|
722,670
|
|
$
|
8,687
|
|
$
|
(104,032
|
)
|
$
|
2,577,293
|
|
$
|
11,074,772
|
|
$
|
(2,258,009
|
)
|
$
|
12,021,381
|
|
|||||||
|
The amount of total gains/(losses) included in earnings attributable to the change in unrealized gains or losses relating to assets and liabilities still held at the reporting date
|
$
|
—
|
|
$
|
276
|
|
$
|
(3,280
|
)
|
$
|
171,325
|
|
$
|
516,091
|
|
$
|
(332,605
|
)
|
$
|
351,807
|
|
|||||||
| Ambac Financial Group, Inc.
35
2017 Second Quarter FORM 10-Q |
AMBAC FINANCIAL GROUP, INC. AND SUBSIDIARIES
Notes to Unaudited Consolidated Financial Statements
(Dollar Amounts in Thousands, Except Share Amounts)
|
Level 3 - Financial Assets and Liabilities Accounted for at Fair Value
|
||||||||||||||||||||||||||||
|
VIE Assets and Liabilities
|
||||||||||||||||||||||||||||
|
Investments
|
Other
assets |
Derivatives
|
Investments
|
Loans
|
Long-term
debt |
Total
|
||||||||||||||||||||||
|
Six Months Ended June 30, 2017:
|
||||||||||||||||||||||||||||
|
Balance, beginning of period
|
$
|
762,703
|
|
$
|
7,382
|
|
$
|
(100,282
|
)
|
$
|
2,622,566
|
|
$
|
10,658,963
|
|
$
|
(2,582,220
|
)
|
$
|
11,369,112
|
|
|||||||
|
Total gains/(losses) realized and unrealized:
|
||||||||||||||||||||||||||||
|
Included in earnings
|
26,298
|
|
(691
|
)
|
51,298
|
|
(31,454
|
)
|
378,390
|
|
(80,307
|
)
|
343,534
|
|
||||||||||||||
|
Included in other comprehensive income
|
17,097
|
|
—
|
|
—
|
|
147,131
|
|
586,391
|
|
(148,394
|
)
|
602,225
|
|
||||||||||||||
|
Purchases
|
35,781
|
|
—
|
|
—
|
|
—
|
|
—
|
|
—
|
|
35,781
|
|
||||||||||||||
|
Sales
|
(79,319
|
)
|
—
|
|
—
|
|
—
|
|
—
|
|
—
|
|
(79,319
|
)
|
||||||||||||||
|
Settlements
|
(18,956
|
)
|
—
|
|
101,713
|
|
(15,927
|
)
|
(322,446
|
)
|
6,703
|
|
(248,913
|
)
|
||||||||||||||
|
Transfers into Level 3
|
22,078
|
|
—
|
|
—
|
|
—
|
|
—
|
|
—
|
|
22,078
|
|
||||||||||||||
|
Balance, end of period
|
$
|
765,682
|
|
$
|
6,691
|
|
$
|
52,729
|
|
$
|
2,722,316
|
|
$
|
11,301,298
|
|
$
|
(2,804,218
|
)
|
$
|
12,044,498
|
|
|||||||
|
The amount of total gains/(losses) included in earnings attributable to the change in unrealized gains or losses relating to assets and liabilities still held at the reporting date
|
$
|
—
|
|
$
|
(691
|
)
|
$
|
3,914
|
|
$
|
(31,454
|
)
|
$
|
378,390
|
|
$
|
(80,307
|
)
|
$
|
269,852
|
|
|||||||
|
Six Months Ended June 30, 2016:
|
||||||||||||||||||||||||||||
|
Balance, beginning of period
|
$
|
488,884
|
|
$
|
8,696
|
|
$
|
(99,192
|
)
|
$
|
2,588,556
|
|
$
|
11,690,324
|
|
$
|
(3,180,170
|
)
|
$
|
11,497,098
|
|
|||||||
|
Total gains/(losses) realized and unrealized:
|
||||||||||||||||||||||||||||
|
Included in earnings
|
27,019
|
|
(9
|
)
|
(11,030
|
)
|
264,592
|
|
676,632
|
|
(334,557
|
)
|
622,647
|
|
||||||||||||||
|
Included in other comprehensive income
|
23,236
|
|
—
|
|
—
|
|
(275,855
|
)
|
(1,163,959
|
)
|
305,960
|
|
(1,110,618
|
)
|
||||||||||||||
|
Purchases
|
91,892
|
|
—
|
|
—
|
|
—
|
|
—
|
|
—
|
|
91,892
|
|
||||||||||||||
|
Issuances
|
—
|
|
—
|
|
—
|
|
—
|
|
—
|
|
—
|
|
—
|
|
||||||||||||||
|
Sales
|
—
|
|
—
|
|
—
|
|
—
|
|
—
|
|
—
|
|
—
|
|
||||||||||||||
|
Settlements
|
(9,159
|
)
|
—
|
|
6,190
|
|
—
|
|
(128,225
|
)
|
212,860
|
|
81,666
|
|
||||||||||||||
|
Transfers in Level 3
|
100,798
|
|
—
|
|
—
|
|
—
|
|
—
|
|
—
|
|
100,798
|
|
||||||||||||||
|
Transfers out of Level 3
|
—
|
|
—
|
|
—
|
|
—
|
|
—
|
|
737,898
|
|
737,898
|
|
||||||||||||||
|
Balance, end of period
|
$
|
722,670
|
|
$
|
8,687
|
|
$
|
(104,032
|
)
|
$
|
2,577,293
|
|
$
|
11,074,772
|
|
$
|
(2,258,009
|
)
|
$
|
12,021,381
|
|
|||||||
|
The amount of total gains/(losses) included in earnings attributable to the change in unrealized gains or losses relating to assets and liabilities still held at the reporting date
|
$
|
—
|
|
$
|
(9
|
)
|
$
|
(11,525
|
)
|
$
|
264,592
|
|
$
|
676,632
|
|
$
|
(334,557
|
)
|
$
|
595,133
|
|
|||||||
| Ambac Financial Group, Inc.
36
2017 Second Quarter FORM 10-Q |
AMBAC FINANCIAL GROUP, INC. AND SUBSIDIARIES
Notes to Unaudited Consolidated Financial Statements
(Dollar Amounts in Thousands, Except Share Amounts)
The tables below provide roll-forward information by class of investments and derivatives measured using significant unobservable inputs.
|
Level 3 - Investments by Class:
|
||||||||||||||||||||||||
|
Three Months Ended June 30, 2017
|
Three Months Ended June 30, 2016
|
|||||||||||||||||||||||
|
Other Asset
Backed Securities |
Non-Agency
RMBS
|
Total
Investments |
Other Asset
Backed Securities |
Non-Agency
RMBS
|
Total
Investments |
|||||||||||||||||||
|
Balance, beginning of period
|
$
|
65,807
|
|
$
|
655,817
|
|
$
|
721,624
|
|
$
|
71,786
|
|
$
|
639,704
|
|
$
|
711,490
|
|
||||||
|
Total gains/(losses) realized and unrealized:
|
||||||||||||||||||||||||
|
Included in earnings
|
356
|
|
16,123
|
|
16,479
|
|
272
|
|
14,344
|
|
14,616
|
|
||||||||||||
|
Included in other comprehensive income
|
(555
|
)
|
11,367
|
|
10,812
|
|
20
|
|
(4,803
|
)
|
(4,783
|
)
|
||||||||||||
|
Purchases
|
—
|
|
25,930
|
|
25,930
|
|
—
|
|
17
|
|
17
|
|
||||||||||||
|
Settlements
|
(242
|
)
|
(8,921
|
)
|
(9,163
|
)
|
(258
|
)
|
(4,655
|
)
|
(4,913
|
)
|
||||||||||||
|
Transfers into Level 3
|
—
|
|
—
|
|
—
|
|
—
|
|
6,243
|
|
6,243
|
|
||||||||||||
|
Balance, end of period
|
$
|
65,366
|
|
$
|
700,316
|
|
$
|
765,682
|
|
$
|
71,820
|
|
$
|
650,850
|
|
$
|
722,670
|
|
||||||
|
The amount of total gains/(losses) included in earnings attributable to the change in unrealized gains or losses relating to assets and liabilities still held at the reporting date
|
$
|
—
|
|
$
|
—
|
|
$
|
—
|
|
$
|
—
|
|
$
|
—
|
|
$
|
—
|
|
||||||
|
Level 3 - Investments by Class:
|
||||||||||||||||||||||||
|
Six Months Ended June 30, 2017
|
Six Months Ended June 30, 2016
|
|||||||||||||||||||||||
|
Other Asset
Backed Securities |
Non-Agency
RMBS |
Total
Investments |
Other Asset
Backed Securities |
Non-Agency
RMBS |
Total
Investments |
|||||||||||||||||||
|
Balance, beginning of period
|
$
|
65,990
|
|
$
|
696,713
|
|
$
|
762,703
|
|
$
|
—
|
|
$
|
488,884
|
|
$
|
488,884
|
|
||||||
|
Total gains/(losses) realized and unrealized:
|
|
|
||||||||||||||||||||||
|
Included in earnings
|
709
|
|
25,589
|
|
26,298
|
|
561
|
|
26,458
|
|
27,019
|
|
||||||||||||
|
Included in other comprehensive income
|
(834
|
)
|
17,931
|
|
17,097
|
|
1,065
|
|
22,171
|
|
23,236
|
|
||||||||||||
|
Purchases
|
—
|
|
35,781
|
|
35,781
|
|
—
|
|
91,892
|
|
91,892
|
|
||||||||||||
|
Sales
|
—
|
|
(79,319
|
)
|
(79,319
|
)
|
—
|
|
—
|
|
—
|
|
||||||||||||
|
Settlements
|
(499
|
)
|
(18,457
|
)
|
(18,956
|
)
|
(513
|
)
|
(8,646
|
)
|
(9,159
|
)
|
||||||||||||
|
Transfers into Level 3
|
—
|
|
22,078
|
|
22,078
|
|
70,707
|
|
30,091
|
|
100,798
|
|
||||||||||||
|
Balance, end of period
|
65,366
|
|
700,316
|
|
765,682
|
|
71,820
|
|
650,850
|
|
722,670
|
|
||||||||||||
|
The amount of total gains/(losses) included in earnings attributable to the change in unrealized gains or losses relating to assets and liabilities still held at the reporting date
|
$
|
—
|
|
$
|
—
|
|
$
|
—
|
|
$
|
—
|
|
$
|
—
|
|
$
|
—
|
|
||||||
| Ambac Financial Group, Inc.
37
2017 Second Quarter FORM 10-Q |
AMBAC FINANCIAL GROUP, INC. AND SUBSIDIARIES
Notes to Unaudited Consolidated Financial Statements
(Dollar Amounts in Thousands, Except Share Amounts)
|
Level 3 - Derivatives by Class:
|
||||||||||||||||||||||||
|
Three Months Ended June 30, 2017
|
Three Months Ended June 30, 2016
|
|||||||||||||||||||||||
|
Interest
Rate Swaps |
Credit
Derivatives |
Total
Derivatives |
Interest
Rate Swaps |
Credit
Derivatives |
Total
Derivatives |
|||||||||||||||||||
|
Balance, beginning of period
|
$
|
(88,092
|
)
|
$
|
(14,496
|
)
|
$
|
(102,588
|
)
|
$
|
(87,965
|
)
|
$
|
(21,929
|
)
|
$
|
(109,894
|
)
|
||||||
|
Total gains/(losses) realized and unrealized:
|
||||||||||||||||||||||||
|
Included in earnings
|
47,491
|
|
6,624
|
|
54,115
|
|
(7,002
|
)
|
3,955
|
|
(3,047
|
)
|
||||||||||||
|
Included in other comprehensive income
|
—
|
|
—
|
|
—
|
|
—
|
|
—
|
|
—
|
|
||||||||||||
|
Purchases
|
—
|
|
—
|
|
—
|
|
—
|
|
—
|
|
—
|
|
||||||||||||
|
Sales
|
—
|
|
—
|
|
—
|
|
—
|
|
—
|
|
—
|
|
||||||||||||
|
Settlements
|
102,336
|
|
(1,134
|
)
|
101,202
|
|
9,142
|
|
(233
|
)
|
8,909
|
|
||||||||||||
|
Balance, end of period
|
$
|
61,735
|
|
$
|
(9,006
|
)
|
$
|
52,729
|
|
$
|
(85,825
|
)
|
$
|
(18,207
|
)
|
$
|
(104,032
|
)
|
||||||
|
The amount of total gains/(losses) included in earnings attributable to the change in unrealized gains or losses relating to assets and liabilities still held at the reporting date
|
$
|
4,049
|
|
$
|
191
|
|
$
|
4,240
|
|
$
|
(7,002
|
)
|
$
|
3,722
|
|
$
|
(3,280
|
)
|
||||||
|
Level 3 - Derivatives by Class:
|
||||||||||||||||||||||||
|
Six Months Ended June 30, 2017:
|
Six Months Ended June 30, 2016:
|
|||||||||||||||||||||||
|
Interest
Rate Swaps |
Credit
Derivatives |
Total
Derivatives |
Interest
Rate Swaps |
Credit
Derivatives |
Total
Derivatives |
|||||||||||||||||||
|
Balance, beginning of period
|
$
|
(84,933
|
)
|
$
|
(15,349
|
)
|
$
|
(100,282
|
)
|
$
|
(64,649
|
)
|
$
|
(34,543
|
)
|
$
|
(99,192
|
)
|
||||||
|
Total gains/(losses) realized and unrealized:
|
||||||||||||||||||||||||
|
Included in earnings
|
43,622
|
|
7,676
|
|
51,298
|
|
(27,851
|
)
|
16,821
|
|
(11,030
|
)
|
||||||||||||
|
Included in other comprehensive income
|
—
|
|
—
|
|
—
|
|
—
|
|
—
|
|
—
|
|
||||||||||||
|
Purchases
|
—
|
|
—
|
|
—
|
|
—
|
|
—
|
|
—
|
|
||||||||||||
|
Sales
|
—
|
|
—
|
|
—
|
|
—
|
|
—
|
|
—
|
|
||||||||||||
|
Settlements
|
103,046
|
|
(1,333
|
)
|
101,713
|
|
6,675
|
|
(485
|
)
|
6,190
|
|
||||||||||||
|
Transfers into Level 3
|
—
|
|
—
|
|
—
|
|
—
|
|
—
|
|
—
|
|
||||||||||||
|
Transfers out of Level 3
|
—
|
|
—
|
|
—
|
|
—
|
|
—
|
|
—
|
|
||||||||||||
|
Balance, end of period
|
$
|
61,735
|
|
$
|
(9,006
|
)
|
$
|
52,729
|
|
$
|
(85,825
|
)
|
$
|
(18,207
|
)
|
$
|
(104,032
|
)
|
||||||
|
The amount of total gains/(losses) included in earnings attributable to the change in unrealized gains or losses relating to assets and liabilities still held at the reporting date
|
$
|
3,863
|
|
$
|
51
|
|
$
|
3,914
|
|
$
|
(27,851
|
)
|
$
|
16,336
|
|
$
|
(11,515
|
)
|
||||||
Invested assets and VIE long-term debt are transferred into Level 3 when internal valuation models that include significant unobservable inputs are used to estimate fair value. All such securities that have internally modeled fair values have been classified as Level 3. Non-agency RMBS securities transferred into Level 3 in 2017 consist of an Ambac-insured re-REMIC collateralized by distressed mortgage-backed securities. Non-agency RMBS transferred into Level 3 in 2016 consist of certain investments in Ambac-wrapped RMBS securities for which projected cash flows consist solely of Deferred Amounts and interest thereon. Other asset-backed securities transferred into Level 3 in 2016 consist of a subordinated tranche of a resecuritization collateralized by Ambac-insured military housing bonds. These invested assets were internally valued as management could not corroborate the reasonableness of third party quotes. Derivative instruments are transferred into Level 3 when the use of unobservable inputs becomes significant to the overall valuation. There were no transfers of derivative instruments into or out of Level 3 in the periods disclosed. All transfers out of Level 3 represent transfers between Level 3 and Level 2 for the periods presented. There were no transfers between Level 1 and Level 2 for the periods presented. All transfers between fair value hierarchy Levels 1, 2, and 3 are recognized at the beginning of each accounting period.
| Ambac Financial Group, Inc.
38
2017 Second Quarter FORM 10-Q |
AMBAC FINANCIAL GROUP, INC. AND SUBSIDIARIES
Notes to Unaudited Consolidated Financial Statements
(Dollar Amounts in Thousands, Except Share Amounts)
Gains and losses (realized and unrealized) relating to Level 3 assets and liabilities included in earnings for the affected periods are reported as follows:
|
Net
investment income |
Realized
gains or (losses) and other settlements on credit derivative contracts |
Unrealized
gains or (losses) on credit derivative contracts |
Derivative
products revenues (interest rate swaps) |
Income
(loss) on variable interest entities |
Other
income or (loss) |
|||||||||||||||||||
|
Three Months Ended June 30, 2017:
|
||||||||||||||||||||||||
|
Total gains or losses included in earnings for the period
|
$
|
16,479
|
|
$
|
1,134
|
|
$
|
5,490
|
|
$
|
47,491
|
|
$
|
20,039
|
|
$
|
(348
|
)
|
||||||
|
Changes in unrealized gains or losses relating to the assets and liabilities still held at the reporting date
|
—
|
|
—
|
|
191
|
|
4,049
|
|
20,039
|
|
(348
|
)
|
||||||||||||
|
Three Months Ended June 30, 2016:
|
||||||||||||||||||||||||
|
Total gains or losses included in earnings for the period
|
$
|
14,616
|
|
$
|
233
|
|
$
|
3,722
|
|
$
|
(7,002
|
)
|
$
|
354,811
|
|
$
|
276
|
|
||||||
|
Changes in unrealized gains or losses relating to the assets and liabilities still held at the reporting date
|
—
|
|
—
|
|
3,722
|
|
(7,002
|
)
|
354,811
|
|
276
|
|
||||||||||||
|
Six Months Ended June 30, 2017:
|
||||||||||||||||||||||||
|
Total gains or losses included in earnings for the period
|
$
|
26,298
|
|
$
|
1,333
|
|
$
|
6,343
|
|
$
|
43,622
|
|
$
|
266,629
|
|
$
|
(691
|
)
|
||||||
|
Changes in unrealized gains or losses relating to the assets and liabilities still held at the reporting date
|
—
|
|
—
|
|
51
|
|
3,863
|
|
266,629
|
|
(691
|
)
|
||||||||||||
|
Six Months Ended June 30, 2016:
|
||||||||||||||||||||||||
|
Total gains or losses included in earnings for the period
|
$
|
27,019
|
|
$
|
485
|
|
$
|
16,336
|
|
$
|
(27,851
|
)
|
$
|
606,667
|
|
$
|
(9
|
)
|
||||||
|
Changes in unrealized gains or losses relating to the assets and liabilities still held at the reporting date
|
—
|
|
—
|
|
16,326
|
|
(27,851
|
)
|
606,667
|
|
(9
|
)
|
||||||||||||
| Ambac Financial Group, Inc.
39
2017 Second Quarter FORM 10-Q |
AMBAC FINANCIAL GROUP, INC. AND SUBSIDIARIES
Notes to Unaudited Consolidated Financial Statements
(Dollar Amounts in Thousands, Except Share Amounts)
8. INVESTMENTS
Ambac’s non-VIE invested assets are primarily comprised of fixed income securities classified as available-for-sale and equity interests in pooled investment funds. Such equity interests in the form of common stock or in-substance common stock are classified as trading securities and are reported within Other investments on the Consolidated Balance Sheets. Other investments also include Ambac's equity interest in an unconsolidated trust created in connection with its sale of Segregated Account junior surplus notes on August 28, 2014.
Fixed Income Securities:
The amortized cost and estimated fair value of available-for-sale investments, excluding VIE investments, at
June 30, 2017 and December 31, 2016
were as follows:
|
Amortized
Cost |
Gross
Unrealized Gains |
Gross
Unrealized Losses |
Estimated
Fair Value |
Non-credit
other-than temporary Impairments (1) |
||||||||||||||||
|
June 30, 2017:
|
||||||||||||||||||||
|
Fixed income securities:
|
||||||||||||||||||||
|
Municipal obligations
|
$
|
662,514
|
|
$
|
10,924
|
|
$
|
11,932
|
|
$
|
661,506
|
|
$
|
—
|
|
|||||
|
Corporate obligations
|
1,487,806
|
|
21,651
|
|
9,044
|
|
1,500,413
|
|
—
|
|
||||||||||
|
Foreign obligations
|
29,201
|
|
639
|
|
94
|
|
29,746
|
|
—
|
|
||||||||||
|
U.S. government obligations
|
41,625
|
|
770
|
|
762
|
|
41,633
|
|
—
|
|
||||||||||
|
U.S. agency obligations
|
—
|
|
—
|
|
—
|
|
—
|
|
—
|
|
||||||||||
|
Residential mortgage-backed securities
|
2,220,640
|
|
111,072
|
|
32,184
|
|
2,299,528
|
|
27,624
|
|
||||||||||
|
Collateralized debt obligations
|
124,913
|
|
195
|
|
2
|
|
125,106
|
|
—
|
|
||||||||||
|
Other asset-backed securities
|
598,546
|
|
69,690
|
|
7,973
|
|
660,263
|
|
—
|
|
||||||||||
|
5,165,245
|
|
214,941
|
|
61,991
|
|
5,318,195
|
|
27,624
|
|
|||||||||||
|
Short-term
|
504,093
|
|
14
|
|
101
|
|
504,006
|
|
—
|
|
||||||||||
|
5,669,338
|
|
214,955
|
|
62,092
|
|
5,822,201
|
|
27,624
|
|
|||||||||||
|
Fixed income securities pledged as collateral:
|
||||||||||||||||||||
|
U.S. government obligations
|
64,944
|
|
—
|
|
16
|
|
64,928
|
|
—
|
|
||||||||||
|
Total collateralized investments
|
64,944
|
|
—
|
|
16
|
|
64,928
|
|
—
|
|
||||||||||
|
Total available-for-sale investments
|
$
|
5,734,282
|
|
$
|
214,955
|
|
$
|
62,108
|
|
$
|
5,887,129
|
|
$
|
27,624
|
|
|||||
|
December 31, 2016:
|
||||||||||||||||||||
|
Fixed income securities:
|
||||||||||||||||||||
|
Municipal obligations
|
$
|
376,064
|
|
$
|
5,509
|
|
$
|
7,205
|
|
$
|
374,368
|
|
$
|
—
|
|
|||||
|
Corporate obligations
|
1,803,136
|
|
19,589
|
|
20,560
|
|
1,802,165
|
|
—
|
|
||||||||||
|
Foreign obligations
|
41,932
|
|
1,303
|
|
100
|
|
43,135
|
|
—
|
|
||||||||||
|
U.S. government obligations
|
33,732
|
|
2,551
|
|
97
|
|
36,186
|
|
—
|
|
||||||||||
|
U.S. agency obligations
|
4,063
|
|
—
|
|
3
|
|
4,060
|
|
—
|
|
||||||||||
|
Residential mortgage-backed securities
|
2,284,425
|
|
110,955
|
|
43,785
|
|
2,351,595
|
|
35,232
|
|
||||||||||
|
Collateralized debt obligations
|
113,650
|
|
493
|
|
220
|
|
113,923
|
|
—
|
|
||||||||||
|
Other asset-backed securities
|
778,383
|
|
58,028
|
|
7,628
|
|
828,783
|
|
—
|
|
||||||||||
|
5,435,385
|
|
198,428
|
|
79,598
|
|
5,554,215
|
|
35,232
|
|
|||||||||||
|
Short-term
|
430,827
|
|
5
|
|
44
|
|
430,788
|
|
—
|
|
||||||||||
|
5,866,212
|
|
198,433
|
|
79,642
|
|
5,985,003
|
|
35,232
|
|
|||||||||||
|
Fixed income securities pledged as collateral:
|
||||||||||||||||||||
|
U.S. government obligations
|
64,833
|
|
72
|
|
—
|
|
64,905
|
|
—
|
|
||||||||||
|
Total collateralized investments
|
64,833
|
|
72
|
|
—
|
|
64,905
|
|
—
|
|
||||||||||
|
Total available-for-sale investments
|
$
|
5,931,045
|
|
$
|
198,505
|
|
$
|
79,642
|
|
$
|
6,049,908
|
|
$
|
35,232
|
|
|||||
|
(1)
|
Represents the amount of non-credit other-than-temporary impairment losses remaining in accumulated other comprehensive income on securities that also had a credit impairment. These losses are included in gross unrealized losses as of
June 30, 2017 and December 31, 2016
.
|
| Ambac Financial Group, Inc.
40
2017 Second Quarter FORM 10-Q |
AMBAC FINANCIAL GROUP, INC. AND SUBSIDIARIES
Notes to Unaudited Consolidated Financial Statements
(Dollar Amounts in Thousands, Except Share Amounts)
The amortized cost and estimated fair value of available-for-sale investments, excluding VIE investments, at
June 30, 2017
, by contractual maturity, were as follows:
|
Amortized
Cost |
Estimated
Fair Value |
|||||||
|
Due in one year or less
|
$
|
629,872
|
|
$
|
629,937
|
|
||
|
Due after one year through five years
|
947,797
|
|
954,210
|
|
||||
|
Due after five years through ten years
|
721,951
|
|
728,627
|
|
||||
|
Due after ten years
|
490,563
|
|
489,458
|
|
||||
|
2,790,183
|
|
2,802,232
|
|
|||||
|
Residential mortgage-backed securities
|
2,220,640
|
|
2,299,528
|
|
||||
|
Collateralized debt obligations
|
124,913
|
|
125,106
|
|
||||
|
Other asset-backed securities
|
598,546
|
|
660,263
|
|
||||
|
Total
|
$
|
5,734,282
|
|
$
|
5,887,129
|
|
||
Expected maturities will differ from contractual maturities because borrowers may have the right to call or prepay certain obligations with or without call or prepayment penalties.
Unrealized Losses on Fixed Income Securities:
The following table shows gross unrealized losses and fair values of Ambac’s available-for-sale investments, aggregated by investment category and length of time that the individual securities have been in a continuous unrealized loss position, at
June 30, 2017 and December 31, 2016
:
|
Less Than 12 Months
|
12 Months or More
|
Total
|
||||||||||||||||||||||
|
Fair Value
|
Gross
Unrealized Loss |
Fair Value
|
Gross
Unrealized Loss |
Fair Value
|
Gross
Unrealized Loss |
|||||||||||||||||||
|
June 30, 2017:
|
||||||||||||||||||||||||
|
Fixed income securities:
|
||||||||||||||||||||||||
|
Municipal obligations
|
$
|
226,184
|
|
$
|
7,956
|
|
$
|
66,681
|
|
$
|
3,976
|
|
$
|
292,865
|
|
$
|
11,932
|
|
||||||
|
Corporate obligations
|
507,877
|
|
9,029
|
|
1,159
|
|
15
|
|
509,036
|
|
9,044
|
|
||||||||||||
|
Foreign obligations
|
9,816
|
|
94
|
|
—
|
|
—
|
|
9,816
|
|
94
|
|
||||||||||||
|
U.S. government obligations
|
32,710
|
|
762
|
|
—
|
|
—
|
|
32,710
|
|
762
|
|
||||||||||||
|
U.S. agency obligations
|
—
|
|
—
|
|
—
|
|
—
|
|
—
|
|
—
|
|
||||||||||||
|
Residential mortgage-backed securities
|
254,070
|
|
3,895
|
|
434,077
|
|
28,289
|
|
688,147
|
|
32,184
|
|
||||||||||||
|
Collateralized debt obligations
|
—
|
|
—
|
|
8,005
|
|
2
|
|
8,005
|
|
2
|
|
||||||||||||
|
Other asset-backed securities
|
79,459
|
|
132
|
|
70,868
|
|
7,841
|
|
150,327
|
|
7,973
|
|
||||||||||||
|
1,110,116
|
|
21,868
|
|
580,790
|
|
40,123
|
|
1,690,906
|
|
61,991
|
|
|||||||||||||
|
Short-term
|
154,834
|
|
101
|
|
—
|
|
—
|
|
154,834
|
|
101
|
|
||||||||||||
|
1,264,950
|
|
21,969
|
|
580,790
|
|
40,123
|
|
1,845,740
|
|
62,092
|
|
|||||||||||||
|
Fixed income securities, pledged as collateral:
|
||||||||||||||||||||||||
|
U. S. government obligations
|
64,928
|
|
16
|
|
—
|
|
—
|
|
64,928
|
|
16
|
|
||||||||||||
|
Total collateralized investments
|
64,928
|
|
16
|
|
—
|
|
—
|
|
64,928
|
|
16
|
|
||||||||||||
|
Total temporarily impaired securities
|
$
|
1,329,878
|
|
$
|
21,985
|
|
$
|
580,790
|
|
$
|
40,123
|
|
$
|
1,910,668
|
|
$
|
62,108
|
|
||||||
| Ambac Financial Group, Inc.
41
2017 Second Quarter FORM 10-Q |
AMBAC FINANCIAL GROUP, INC. AND SUBSIDIARIES
Notes to Unaudited Consolidated Financial Statements
(Dollar Amounts in Thousands, Except Share Amounts)
|
Less Than 12 Months
|
12 Months or More
|
Total
|
||||||||||||||||||||||
|
Fair Value
|
Gross
Unrealized Loss |
Fair Value
|
Gross
Unrealized Loss |
Fair Value
|
Gross
Unrealized Loss |
|||||||||||||||||||
|
December 31, 2016:
|
||||||||||||||||||||||||
|
Fixed income securities:
|
||||||||||||||||||||||||
|
Municipal obligations
|
$
|
98,147
|
|
$
|
2,045
|
|
$
|
122,928
|
|
$
|
5,160
|
|
$
|
221,075
|
|
$
|
7,205
|
|
||||||
|
Corporate obligations
|
963,513
|
|
20,232
|
|
6,492
|
|
328
|
|
970,005
|
|
20,560
|
|
||||||||||||
|
Foreign obligations
|
5,063
|
|
100
|
|
—
|
|
—
|
|
5,063
|
|
100
|
|
||||||||||||
|
U.S. government obligations
|
6,037
|
|
93
|
|
5,045
|
|
4
|
|
11,082
|
|
97
|
|
||||||||||||
|
U.S. agency obligations
|
4,060
|
|
3
|
|
—
|
|
—
|
|
4,060
|
|
3
|
|
||||||||||||
|
Residential mortgage-backed securities
|
226,889
|
|
7,201
|
|
550,807
|
|
36,584
|
|
777,696
|
|
43,785
|
|
||||||||||||
|
Collateralized debt obligations
|
6,986
|
|
23
|
|
25,780
|
|
197
|
|
32,766
|
|
220
|
|
||||||||||||
|
Other asset-backed securities
|
115,622
|
|
203
|
|
77,712
|
|
7,425
|
|
193,334
|
|
7,628
|
|
||||||||||||
|
1,426,317
|
|
29,900
|
|
788,764
|
|
49,698
|
|
2,215,081
|
|
79,598
|
|
|||||||||||||
|
Short-term
|
65,176
|
|
44
|
|
—
|
|
—
|
|
65,176
|
|
44
|
|
||||||||||||
|
Total temporarily impaired securities
|
$
|
1,491,493
|
|
$
|
29,944
|
|
$
|
788,764
|
|
$
|
49,698
|
|
$
|
2,280,257
|
|
$
|
79,642
|
|
||||||
Management has determined that the unrealized losses reflected in the tables above are temporary in nature as of
June 30, 2017 and December 31, 2016
based upon (i) no unexpected principal and interest payment defaults on these securities; (ii) analysis of the creditworthiness of the issuer and financial guarantor, as applicable, and analysis of projected defaults on the underlying collateral; (iii) management has no intent to sell these investments in debt securities; and (iv) it is not more likely than not that Ambac will be required to sell these debt securities before the anticipated recovery of its amortized cost basis. The assessment under (iv) is based on a comparison of future available liquidity from the investment portfolio against the projected net cash outflow from operating activities and debt service. For purposes of this assessment, available liquidity from the investment portfolio is comprised of the fair value of securities for which management has asserted its intent to sell, the fair value of other securities that are available for sale and in an unrealized gain position, trading securities plus the scheduled maturities and interest payments from the remaining securities in the portfolio. To the extent that securities that management intends to sell are in an unrealized loss position, they would have already been considered other-than-temporarily impaired with the amortized cost written down to fair value. Because the above-described assessment indicates that future available liquidity exceeds projected net cash outflow, it is not more likely than not that we would be required to sell securities in an unrealized loss position before the recovery of their amortized cost basis. In the liquidity assessment described above, principal payments on securities pledged as collateral are not considered to be available for other liquidity needs until the collateralized positions are projected to be settled. Projected interest receipts on securities pledged as collateral generally belong to Ambac and are considered to be sources of available liquidity from the investment portfolio.
As of
June 30, 2017
, for securities that have indications of possible other-than-temporary impairment but which management does not intend to sell and will not more likely than not be required to sell, management compared the present value of cash flows expected to be collected to the amortized cost basis of the securities to assess whether the amortized cost will be recovered. Cash flows were discounted at the effective interest rate implicit in the security at the date of acquisition (or Fresh Start Reporting Date of
April 30, 2013
for securities purchased prior to that date) or for debt securities that are beneficial interests in securitized financial assets, at a rate equal to the current yield used to accrete the beneficial interest. For floating rate securities, future cash flows and the discount rate used were both adjusted to reflect changes in the index rate applicable to each security as of the evaluation date. Of the securities that were in a gross unrealized loss position at
June 30, 2017
,
$997,251
of the total fair value and
$49,242
of the unrealized loss related to below investment grade and non-rated securities. Of the securities that were in a gross unrealized loss position at
December 31, 2016
,
$890,952
of the total fair value and
$53,273
of the unrealized loss related to below investment grade and non-rated securities. With respect to Ambac guaranteed securities, future cash flows relating to those invested assets include the sum of (i) the bond’s intrinsic cash flows and (ii) the estimated Ambac claim payments, including Deferred Amounts (as defined in the Segregated Account Rehabilitation Plan) for securities with policies allocated to the Segregated Account. Ambac estimates the timing of such claim payment receipts but the actual timing of such amounts are at the sole discretion of the Rehabilitator. Further modifications to the Segregated Account Rehabilitation Plan or to the rules and guidelines promulgated thereunder, orders from the Rehabilitation Court or actions by the Rehabilitator with respect to the form, amount and timing of satisfying permitted policy claims, or making payments on Deferred Amounts or surplus notes, or the accretion rate on Deferred Amounts, may have a material effect on the fair value of Ambac insured securities and future recognition of other-than-temporary impairments. Refer to
Note 1. Background and Business Description
and to
Note 1. Background and Business Description
in the Notes to Consolidated Financial Statements included in the Company’s Annual Report on Form 10-K for the year ended
December 31, 2016
for information relating to the amended Segregated Account Rehabilitation Plan. Ambac’s assessment about whether a decline in value is other-than-temporary reflects management’s current judgment regarding facts and circumstances specific to a security and the factors noted above. If that judgment changes, Ambac may ultimately record a charge for other-than-temporary impairment in future periods.
| Ambac Financial Group, Inc.
42
2017 Second Quarter FORM 10-Q |
AMBAC FINANCIAL GROUP, INC. AND SUBSIDIARIES
Notes to Unaudited Consolidated Financial Statements
(Dollar Amounts in Thousands, Except Share Amounts)
Municipal and corporate obligations
The gross unrealized losses on municipal and corporate obligations as of
June 30, 2017
are primarily the result of the increase in interest rates since purchase (or the Fresh Start Reporting Date of
April 30, 2013
if owned as of that date). These securities are primarily fixed-rate securities with an investment grade credit rating. Management believes that the timely receipt of all principal and interest on these positions is probable
.
Residential mortgage-backed securities
Of the
$32,184
of unrealized losses on residential mortgage-backed securities,
$32,184
is attributable to Ambac insured securities. The unrealized loss on these securities is primarily the result of discount accretion, which has exceeded the increase in fair value since either the purchase date or Fresh Start Reporting Date of
April 30, 2013
for securities owned prior to such date. As part of the quarterly impairment review process, management estimates expected future cash flows from residential mortgage-backed securities. This approach includes the utilization of market accepted software models in conjunction with detailed data of the historical performance of the collateral pools, which assists in the determination of assumptions such as defaults, severity and voluntary prepayment rates that are largely driven by home price forecasts as well as other macro-economic factors. Additionally, for Ambac insured securities that are allocated to the Segregated Account, expected future cash flows include assumptions about the timing of Ambac Assurance claim payments, including interest on Deferred Amounts, although the actual timing of such payments are at the sole discretion of the Rehabilitator. These assumptions are used to project future cash flows for each security. Management considered this analysis in making our determination that a credit loss has not occurred at
June 30, 2017
on these transactions.
Realized Gains and Losses and Other-Than-Temporary Impairments:
The following table details amounts included in net realized gains (losses) and other-than-temporary impairments included in earnings for the affected periods:
|
Three Months Ended June 30,
|
Six Months Ended June 30,
|
|||||||||||||||
|
2017
|
2016
|
2017
|
2016
|
|||||||||||||
|
Gross realized gains on securities
|
$
|
8,286
|
|
$
|
4,551
|
|
$
|
10,944
|
|
$
|
6,479
|
|
||||
|
Gross realized losses on securities
|
(1,757
|
)
|
(503
|
)
|
(11,228
|
)
|
(4,112
|
)
|
||||||||
|
Net foreign exchange (losses) gains
|
(2,349
|
)
|
10,849
|
|
(432
|
)
|
13,632
|
|
||||||||
|
Net realized gains (losses)
|
$
|
4,180
|
|
$
|
14,897
|
|
$
|
(716
|
)
|
$
|
15,999
|
|
||||
|
Net other-than-temporary impairments
(1)
|
$
|
(1,763
|
)
|
$
|
(7,441
|
)
|
$
|
(5,705
|
)
|
$
|
(16,775
|
)
|
||||
|
(1)
|
Other-than-temporary impairments exclude impairment amounts recorded in other comprehensive income under ASC Paragraph 320-10-65-1, which comprise non-credit related amounts on securities that are credit impaired but which management does not intend to sell and it is not more likely than not that Ambac will be required to sell before recovery of the amortized cost basis.
|
Since commencement of the Segregated Account Rehabilitation Proceedings, changes in the estimated timing of claim payments have resulted in adverse changes in projected cash flows on certain impaired Ambac insured securities. Such changes in estimated claim payments on Ambac insured securities contributed to net other-than-temporary impairments for the six months ended June 30, 2017 and 2016 and the three months ended June 30, 2016, presented in the table above. Further changes to the estimated timing of claim payments could result in additional other-than-temporary impairment charges in the future. Future changes in our estimated liquidity needs could result in a determination that Ambac no longer has the ability to hold securities that are in an unrealized loss position, which could result in additional other-than-temporary impairment charges.
The following table presents a roll-forward of Ambac’s cumulative credit losses on debt securities held as of
June 30, 2017 and 2016
for which a portion of an other-than-temporary impairment was recognized in other comprehensive income:
|
Six Months Ended June 30,
|
||||||||
|
2017
|
2016
|
|||||||
|
Balance, beginning of period
|
$
|
52,070
|
|
$
|
31,176
|
|
||
|
Additions for credit impairments recognized on:
|
||||||||
|
Securities not previously impaired
|
307
|
|
1,544
|
|
||||
|
Securities previously impaired
|
1,985
|
|
14,785
|
|
||||
|
Balance, end of period
|
$
|
54,362
|
|
$
|
47,505
|
|
||
Counterparty Collateral, Deposits with Regulators and Other Restrictions:
Ambac routinely pledges and receives collateral related to certain transactions. Ambac pledges assets it holds in its investment portfolio to investment agreement (prior to repayment in March 2017) and derivative counterparties as collateral. Securities pledged to investment agreement counterparties were not to be re-pledged to another entity. Ambac’s counterparties under derivative agreements have the right to pledge or rehypothecate the securities and as such, these pledged securities are separately classified on the Consolidated Balance Sheets as “Fixed income securities pledged as collateral, at fair value”.
| Ambac Financial Group, Inc.
43
2017 Second Quarter FORM 10-Q |
AMBAC FINANCIAL GROUP, INC. AND SUBSIDIARIES
Notes to Unaudited Consolidated Financial Statements
(Dollar Amounts in Thousands, Except Share Amounts)
The following table presents (i) the sources of collateral either received from various counterparties where Ambac is permitted to sell or re-pledge the collateral or collateral held directly in the investment portfolio and (ii) how that collateral was pledged to investment agreement and derivative counterparties at
June 30, 2017 and December 31, 2016
:
|
Fair Value of Cash
and Underlying Securities |
Fair Value of Cash
and Securities Pledged to Investment Agreement Counterparties |
Fair Value of Cash
and Securities Pledged to Derivative Counterparties |
||||||||||
|
June 30, 2017:
|
||||||||||||
|
Cash and securities pledged directly from the investment portfolio
|
$
|
117,905
|
|
$
|
—
|
|
$
|
117,905
|
|
|||
|
December 31, 2016:
|
||||||||||||
|
Cash and securities pledged directly from the investment portfolio
|
$
|
291,545
|
|
$
|
88,940
|
|
$
|
202,605
|
|
|||
Securities carried at
$6,021
and
$5,872
at
June 30, 2017 and December 31, 2016
, respectively, were deposited by Ambac Assurance and Everspan with governmental authorities or designated custodian banks as required by laws affecting insurance companies.
Securities with fair value of
$352,446
and
$360,759
at
June 30, 2017 and December 31, 2016
, respectively, were held by a bankruptcy remote trust to collateralize and fund repayment of debt issued through a re-securitization transaction. The securities may not be sold or repledged by the trust. These assets are held and the secured debt is issued by entities that qualify as VIEs and are consolidated in Ambac’s unaudited consolidated financial statements. Refer to
Note 3. Special Purpose Entities, Including Variable Interest Entities
for a further description of this transaction.
Guaranteed Securities:
Ambac’s fixed income portfolio includes securities covered by guarantees issued by Ambac Assurance and other financial guarantors (“insured securities”). The published rating agency ratings on these securities reflect the higher of the financial strength rating of the financial guarantor or the rating of the underlying issuer. Rating agencies do not always publish separate underlying ratings (those ratings excluding the insurance by the financial guarantor). In the event these underlying ratings are not available from the rating agencies, Ambac will assign an internal rating. The following table represents the fair value, including the value of the financial guarantee, and weighted-average underlying rating, excluding the financial guarantee, of the insured securities at
June 30, 2017 and December 31, 2016
, respectively:
|
Municipal
obligations |
Corporate
obligations |
Mortgage
and asset- backed securities |
Total
|
Weighted
Average Underlying Rating (1) |
||||||||||||||
|
June 30, 2017:
|
||||||||||||||||||
|
Ambac Assurance Corporation
(2)
|
$
|
397,154
|
|
$
|
30,777
|
|
$
|
2,745,909
|
|
$
|
3,173,840
|
|
CC
|
|||||
|
National Public Finance Guarantee Corporation
|
32,892
|
|
—
|
|
—
|
|
32,892
|
|
A-
|
|||||||||
|
Assured Guaranty Municipal Corporation
|
25,792
|
|
—
|
|
—
|
|
25,792
|
|
AA
|
|||||||||
|
MBIA Insurance Corporation
|
—
|
|
2,594
|
|
—
|
|
2,594
|
|
BBB+
|
|||||||||
|
Total
|
$
|
455,838
|
|
$
|
33,371
|
|
$
|
2,745,909
|
|
$
|
3,235,118
|
|
CC
|
|||||
|
December 31, 2016:
|
||||||||||||||||||
|
Ambac Assurance Corporation
(2)
|
$
|
81,651
|
|
$
|
—
|
|
$
|
2,739,073
|
|
$
|
2,820,724
|
|
CC
|
|||||
|
National Public Finance Guarantee Corporation
|
38,687
|
|
—
|
|
—
|
|
38,687
|
|
A-
|
|||||||||
|
Assured Guaranty Municipal Corporation
|
25,660
|
|
—
|
|
—
|
|
25,660
|
|
AA
|
|||||||||
|
MBIA Insurance Corporation
|
—
|
|
2,630
|
|
—
|
|
2,630
|
|
BBB+
|
|||||||||
|
Total
|
$
|
145,998
|
|
$
|
2,630
|
|
$
|
2,739,073
|
|
$
|
2,887,701
|
|
CC
|
|||||
|
(1)
|
Ratings are based on the lower of Standard & Poor’s or Moody’s rating. If unavailable, Ambac’s internal rating is used.
|
|
(2)
|
Includes corporate obligations and asset-backed securities with a fair value of
$169,672
and
$118,813
at
June 30, 2017 and December 31, 2016
, respectively, insured by Ambac UK.
|
| Ambac Financial Group, Inc.
44
2017 Second Quarter FORM 10-Q |
AMBAC FINANCIAL GROUP, INC. AND SUBSIDIARIES
Notes to Unaudited Consolidated Financial Statements
(Dollar Amounts in Thousands, Except Share Amounts)
Equity Interests:
Ambac's investment portfolio includes equity interests in various pooled investment funds, which are classified as trading. The fair value and additional information about such investments in pooled funds, by investment type, is summarized in the table below. Except as noted in the table, fair value reported is determined using NAV per share as a practical expedient. There are no unfunded commitments applicable to any of these investments for the periods disclosed.
|
Fair Value
|
||||||||||||
|
Class of Funds
|
June 30,
2017 |
December 31,
2016 |
Redemption Frequency
|
Redemption Notice Period
|
||||||||
|
Real estate properties
(1)
|
$
|
33,218
|
|
$
|
33,303
|
|
quarterly
|
10 business days
|
||||
|
Diversified hedge fund strategies
(2)
|
49,292
|
|
53,985
|
|
semi-monthly
|
15 - 30 days
|
||||||
|
Interest rate products
(3) (7)
|
223,364
|
|
261,315
|
|
daily, weekly or monthly
|
0 - 30 days
|
||||||
|
Illiquid investments
(4)
|
63,027
|
|
39,068
|
|
quarterly
|
180 days
|
||||||
|
Insurance-linked investments
(5)
|
13,224
|
|
—
|
|
quarterly
|
90-120 days
|
||||||
|
Equity market investments
(6) (7)
|
36,489
|
|
32,633
|
|
daily
|
0 days
|
||||||
|
Total equity investments in pooled funds
|
$
|
418,614
|
|
$
|
420,304
|
|
||||||
|
(1)
|
Investments consist of UK property to generate income and capital growth.
|
|
(2)
|
Investments seek diversified exposure to hedge fund core strategies to produce high risk-adjusted returns, with low long-term correlation to traditional markets and with targeted volatility levels. Funds may have the right to defer redemptions under certain circumstances.
|
|
(3)
|
This class of funds includes investments in a range of instruments including leveraged loans, CLOs, asset-backed securities and floating rate notes to generate income and capital appreciation. Funds with less frequent redemption periods limit redemptions to as little as 15% per period. Funds with a same day redemption notice period are redeemable only weekly, while funds that may be redeemed any business day have notice periods of 15-30 days.
|
|
(4)
|
This class seeks to obtain high long-term total return through investments with low liquidity and defined term, resulting in expected capital distributions to subscribers between 2020 and 2023. Redemptions cannot occur prior to the expiration of the investment lock-up period in May 2018.
|
|
(5)
|
This class aims to provide returns from the insurance and reinsurance markets through investments in catastrophe bonds, life insurance and other insurance linked investments. Redemption periods are quarterly, subject to 90-day notice for January/July redemption dates and 120-day notice for April/October redemption dates with redemptions greater than 3.5% during the first five years following share issuance subject to redemption fees.
|
|
(6)
|
Investments represent a diversified exposure to global equity market returns through holdings of various regional market index funds.
|
|
(7)
|
Interest rate products include
$52,264
at
June 30, 2017
and
$51,158
at December 31, 2016 and equity market investments include
$36,489
at
June 30, 2017
and
$32,633
at
December 31, 2016
that have readily determinable fair values priced through pricing vendors.
|
Ambac also holds an equity interest in an unconsolidated trust created in connection with the 2014 sale of Segregated Account junior surplus notes, which is accounted for under the equity method.
Investment Income:
Net investment income was comprised of the following for the affected periods:
|
Three Months Ended June 30,
|
Six Months Ended June 30,
|
|||||||||||||||
|
2017
|
2016
|
2017
|
2016
|
|||||||||||||
|
Fixed income securities
|
$
|
81,751
|
|
$
|
66,104
|
|
$
|
155,820
|
|
$
|
125,527
|
|
||||
|
Short-term investments
|
1,151
|
|
374
|
|
2,140
|
|
930
|
|
||||||||
|
Loans
|
85
|
|
70
|
|
174
|
|
176
|
|
||||||||
|
Investment expense
|
(2,044
|
)
|
(2,180
|
)
|
(4,041
|
)
|
(4,283
|
)
|
||||||||
|
Securities available-for-sale and short-term
|
80,943
|
|
64,368
|
|
154,093
|
|
122,350
|
|
||||||||
|
Other investments
|
4,217
|
|
6,390
|
|
12,626
|
|
9,229
|
|
||||||||
|
Total net investment income
|
$
|
85,160
|
|
$
|
70,758
|
|
$
|
166,719
|
|
$
|
131,579
|
|
||||
Net investment income from Other investments primarily represents changes in fair value on securities classified as trading or under the fair value option plus income from Ambac's equity interest in an unconsolidated trust created in connection with its sale of Segregated Account junior surplus notes. The portion of net unrealized gains (losses) related to trading securities still held at the end of each period is as follows:
| Ambac Financial Group, Inc.
45
2017 Second Quarter FORM 10-Q |
AMBAC FINANCIAL GROUP, INC. AND SUBSIDIARIES
Notes to Unaudited Consolidated Financial Statements
(Dollar Amounts in Thousands, Except Share Amounts)
|
Three Months Ended June 30,
|
Six Months Ended June 30,
|
|||||||||||||||
|
2017
|
2016
|
2017
|
2016
|
|||||||||||||
|
Net gains (losses) recognized during the period on trading securities
|
$
|
3,000
|
|
$
|
5,240
|
|
$
|
10,211
|
|
$
|
6,948
|
|
||||
|
Less: net gains (losses) recognized during the reporting period on trading securities sold during the period
|
2,070
|
|
1,498
|
|
3,698
|
|
1,531
|
|
||||||||
|
Unrealized gains (losses) recognized during the reporting period on trading securities still held at the reporting date
|
$
|
930
|
|
$
|
3,742
|
|
$
|
6,513
|
|
$
|
5,417
|
|
||||
9. DERIVATIVE INSTRUMENTS
The following tables summarize the gross fair values of individual derivative instruments and the impact of legal rights of offset as reported in the Consolidated Balance Sheets as of
June 30, 2017 and December 31, 2016
:
|
Gross
Amounts of Recognized Assets / Liabilities |
Gross
Amounts Offset in the Consolidated Balance Sheet |
Net Amounts
of Assets/ Liabilities Presented in the Consolidated Balance Sheet |
Gross Amount
of Collateral Received / Pledged Not Offset in the Consolidated Balance Sheet |
Net Amount
|
|||||||||||||||
|
June 30, 2017:
|
|||||||||||||||||||
|
Derivative Assets:
|
|||||||||||||||||||
|
Interest rate swaps
|
$
|
76,667
|
|
$
|
731
|
|
$
|
75,936
|
|
$
|
—
|
|
$
|
75,936
|
|
||||
|
Futures contracts
|
3,111
|
|
—
|
|
3,111
|
|
—
|
|
3,111
|
|
|||||||||
|
Total non-VIE derivative assets
|
$
|
79,778
|
|
$
|
731
|
|
$
|
79,047
|
|
$
|
—
|
|
$
|
79,047
|
|
||||
|
Derivative Liabilities:
|
|||||||||||||||||||
|
Credit derivatives
|
$
|
9,006
|
|
$
|
—
|
|
$
|
9,006
|
|
$
|
—
|
|
$
|
9,006
|
|
||||
|
Interest rate swaps
|
83,274
|
|
731
|
|
82,543
|
|
81,129
|
|
1,414
|
|
|||||||||
|
Futures contracts
|
—
|
|
—
|
|
—
|
|
—
|
|
—
|
|
|||||||||
|
Total non-VIE derivative liabilities
|
$
|
92,280
|
|
$
|
731
|
|
$
|
91,549
|
|
$
|
81,129
|
|
$
|
10,420
|
|
||||
|
Variable Interest Entities Derivative Assets:
|
|||||||||||||||||||
|
Currency swaps
|
$
|
65,507
|
|
$
|
—
|
|
$
|
65,507
|
|
$
|
—
|
|
$
|
65,507
|
|
||||
|
Total VIE derivative assets
|
$
|
65,507
|
|
$
|
—
|
|
$
|
65,507
|
|
$
|
—
|
|
$
|
65,507
|
|
||||
|
Variable Interest Entities Derivative Liabilities:
|
|||||||||||||||||||
|
Interest rate swaps
|
$
|
2,064,071
|
|
$
|
—
|
|
$
|
2,064,071
|
|
$
|
—
|
|
$
|
2,064,071
|
|
||||
|
Total VIE derivative liabilities
|
$
|
2,064,071
|
|
$
|
—
|
|
$
|
2,064,071
|
|
$
|
—
|
|
$
|
2,064,071
|
|
||||
|
December 31, 2016:
|
|||||||||||||||||||
|
Derivative Assets:
|
|||||||||||||||||||
|
Interest rate swaps
|
$
|
139,045
|
|
$
|
61,839
|
|
$
|
77,206
|
|
$
|
—
|
|
$
|
77,206
|
|
||||
|
Futures contracts
|
536
|
|
—
|
|
536
|
|
—
|
|
536
|
|
|||||||||
|
Total non-VIE derivative assets
|
$
|
139,581
|
|
$
|
61,839
|
|
$
|
77,742
|
|
$
|
—
|
|
$
|
77,742
|
|
||||
|
Derivative Liabilities:
|
|||||||||||||||||||
|
Credit derivatives
|
$
|
15,349
|
|
$
|
—
|
|
$
|
15,349
|
|
$
|
—
|
|
$
|
15,349
|
|
||||
|
Interest rate swaps
|
365,776
|
|
61,839
|
|
303,937
|
|
156,925
|
|
147,012
|
|
|||||||||
|
Total non-VIE derivative liabilities
|
$
|
381,125
|
|
$
|
61,839
|
|
$
|
319,286
|
|
$
|
156,925
|
|
$
|
162,361
|
|
||||
|
Variable Interest Entities Derivative Assets:
|
|||||||||||||||||||
|
Currency swaps
|
$
|
80,407
|
|
$
|
—
|
|
$
|
80,407
|
|
$
|
—
|
|
$
|
80,407
|
|
||||
|
Total VIE derivative assets
|
$
|
80,407
|
|
$
|
—
|
|
$
|
80,407
|
|
$
|
—
|
|
$
|
80,407
|
|
||||
|
Variable Interest Entities Derivative Liabilities:
|
|||||||||||||||||||
|
Interest rate swaps
|
$
|
2,078,601
|
|
$
|
—
|
|
$
|
2,078,601
|
|
$
|
—
|
|
$
|
2,078,601
|
|
||||
|
Total VIE derivative liabilities
|
$
|
2,078,601
|
|
$
|
—
|
|
$
|
2,078,601
|
|
$
|
—
|
|
$
|
2,078,601
|
|
||||
| Ambac Financial Group, Inc.
46
2017 Second Quarter FORM 10-Q |
AMBAC FINANCIAL GROUP, INC. AND SUBSIDIARIES
Notes to Unaudited Consolidated Financial Statements
(Dollar Amounts in Thousands, Except Share Amounts)
Effective January 3, 2017, the central clearing party ("CCP") for certain of Ambac's derivative contracts changed its rules governing the character of variation payments. Under the new CCP rules, variation payments are considered settlements of the associated derivative balance. Prior to the rule change such variation payments were considered to be margin and were not offset against the fair value of the derivatives, but were recognized as collateral receivable or payable. The amount of variation margin included within "Other assets" on the Consolidated Balance Sheet as of
December 31, 2016
, and was applied as a reduction to derivative liabilities effective January 3, 2017 under the new CCP rules is
$71,023
. Amounts recognized for the right to reclaim cash collateral or the obligation to return cash collateral are not offset against fair value amounts recognized for derivative instruments on the Consolidated Balance Sheets. The amounts representing the right to reclaim cash collateral and posted margin, recorded in “Other assets” were
$52,977
and
$137,701
as of
June 30, 2017 and December 31, 2016
, respectively. There were
no
amounts held representing an obligation to return cash collateral as of
June 30, 2017 and December 31, 2016
.
The following tables summarize the location and amount of gains and losses of derivative contracts in the Consolidated Statements of Total Comprehensive Income (Loss) for the
three and six months ended
June 30, 2017 and 2016
:
|
Location of Gain or (Loss)
Recognized in Consolidated
Statements of Total
Comprehensive Income (Loss)
|
Amount of Gain or (Loss) Recognized in
Consolidated Statement of Total Comprehensive Income (Loss)
|
||||||||||||||||||
|
Three Months Ended June 30,
|
Six Months Ended June 30,
|
||||||||||||||||||
|
2017
|
2016
|
2017
|
2016
|
||||||||||||||||
|
Non-VIEs:
|
|||||||||||||||||||
|
Credit derivatives
|
Net change in fair value of credit derivatives
|
$
|
6,624
|
|
$
|
3,955
|
|
$
|
7,676
|
|
$
|
16,821
|
|
||||||
|
Non-VIE derivatives:
|
|||||||||||||||||||
|
Interest rate swaps
|
Net gains (losses) on interest rate derivatives
|
37,141
|
|
(33,326
|
)
|
37,249
|
|
(110,433
|
)
|
||||||||||
|
Futures contracts
|
Net gains (losses) on interest rate derivatives
|
(3,073
|
)
|
(3,005
|
)
|
(4,695
|
)
|
(9,322
|
)
|
||||||||||
|
Total Non-VIE derivatives
|
34,068
|
|
(36,331
|
)
|
32,554
|
|
(119,755
|
)
|
|||||||||||
|
Variable Interest Entities:
|
|||||||||||||||||||
|
Currency swaps
|
Income (loss) on variable interest entities
|
(9,951
|
)
|
14,366
|
|
(14,899
|
)
|
26,305
|
|
||||||||||
|
Interest rate swaps
|
Income (loss) on variable interest entities
|
34
|
|
(437
|
)
|
14,530
|
|
(158,780
|
)
|
||||||||||
|
Total Variable Interest Entities
|
(9,917
|
)
|
13,929
|
|
(369
|
)
|
(132,475
|
)
|
|||||||||||
|
Total derivative contracts
|
$
|
30,775
|
|
$
|
(18,447
|
)
|
$
|
39,861
|
|
$
|
(235,409
|
)
|
|||||||
Credit Derivatives:
Credit derivatives, which are privately negotiated contracts, provide the counterparty with credit protection against the occurrence of a specific event such as a payment default or bankruptcy relating to an underlying obligation. Upon a credit event, Ambac is required to make payments equal to the difference between the scheduled debt service payment and the actual payment made by the issuer. Credit derivatives issued are insured by Ambac Assurance. None of the outstanding credit derivative transactions at
June 30, 2017
include ratings based collateral-posting triggers or otherwise require Ambac to post collateral regardless of Ambac’s ratings or the size of the mark to market exposure to Ambac.
The portfolio of our credit derivatives were written on a “pay-as-you-go” basis. Similar to an insurance policy execution, pay-as-you-go provides that Ambac pays interest shortfalls on the referenced transaction as they are incurred on each scheduled payment date, but only pays principal shortfalls upon the earlier of (i) the date on which the assets designated to fund the referenced obligation have been disposed of and (ii) the legal final maturity date of the referenced obligation.
Ambac maintains internal credit ratings on its guaranteed obligations, including credit derivative contracts, solely to indicate management’s view of the underlying credit quality of the guaranteed obligations. Independent rating agencies may have assigned different ratings on the credits in Ambac’s portfolio than Ambac’s internal ratings. The following table summarizes the gross principal notional outstanding for CDS contracts, by Ambac rating as of
June 30, 2017 and December 31, 2016
:
| Ambac Financial Group, Inc.
47
2017 Second Quarter FORM 10-Q |
AMBAC FINANCIAL GROUP, INC. AND SUBSIDIARIES
Notes to Unaudited Consolidated Financial Statements
(Dollar Amounts in Thousands, Except Share Amounts)
|
Ambac Rating
|
June 30,
2017 |
December 31, 2016
|
||||||
|
AAA
|
$
|
—
|
|
$
|
—
|
|
||
|
AA
|
240,850
|
|
315,201
|
|
||||
|
A
|
—
|
|
227,146
|
|
||||
|
BBB
(1)
|
142,750
|
|
127,250
|
|
||||
|
Below investment grade
(2)
|
72,192
|
|
67,783
|
|
||||
|
Total
|
$
|
455,792
|
|
$
|
737,380
|
|
||
|
(1)
|
BBB internal ratings reflect bonds which are of medium grade credit quality with adequate capacity to pay interest and repay principal. Certain protective elements and margins may weaken under adverse economic conditions and changing circumstances. These bonds are more likely than higher rated bonds to exhibit unreliable protection levels over all cycles.
|
|
(2)
|
Below investment grade internal ratings reflect bonds which are of speculative grade credit quality with the adequacy of future margin levels for payment of interest and repayment of principal potentially adversely affected by major ongoing uncertainties or exposure to adverse conditions.
|
The table below summarizes other information related to credit derivatives outstanding as of
June 30, 2017 and December 31, 2016
:
|
June 30,
2017 |
December 31, 2016
|
|||||||
|
Number of CDS transactions
|
5
|
|
8
|
|
||||
|
Remaining expected weighted-average life of obligations (in years)
|
5.7
|
|
5.2
|
|
||||
|
Gross principal notional outstanding
|
$
|
455,792
|
|
$
|
737,380
|
|
||
|
Net derivative liabilities at fair value
|
$
|
9,006
|
|
$
|
15,349
|
|
||
The maximum potential amount of future payments under Ambac’s credit derivative contracts is generally the gross principal notional outstanding amount included in the above table plus future interest payments payable by the derivative reference obligations. Since Ambac’s credit derivatives typically reference obligations of or assets held by special purpose entities that meet the definition of a VIE, the amount of maximum potential future payments for credit derivatives is included in the table in
Note 3. Special Purpose Entities, Including Variable Interest Entities
.
Changes in fair value of Ambac’s credit derivative contracts are accounted for at fair value since they do not qualify for the financial guarantee scope exception under the Derivatives and Hedging Topic of the ASC. Changes in fair value are recorded in “Net change in fair value of credit derivatives” on the Consolidated Statements of Total Comprehensive Income (Loss). Although CDS contracts are accounted for at fair value, they are surveilled similar to non-derivative financial guarantee contracts. As with financial guarantee insurance policies, Ambac’s Portfolio Risk Management group tracks credit migration of CDS contracts’ reference obligations from period to period.
Adversely classified credits are assigned risk classifications by the Portfolio Risk Management group. As of
June 30, 2017
, there are
two
CDS contracts on Ambac’s adversely classified credit listing, with a net derivative liability fair value of
$6,031
and gross notional principal outstanding of
$72,192
. As of
December 31, 2016
, there were
two
CDS contracts on Ambac’s adversely classified credit listing, with a net derivative liability fair value of
$6,123
and total notional principal outstanding of
$67,783
.
Interest Rate Derivatives:
Ambac, through its subsidiary Ambac Financial Services (“AFS”), provided interest rate swaps to states, municipalities and their authorities, asset-backed issuers and other entities in connection with their financings. Additionally, AFS uses interest rate derivatives as an economic hedge against the effects of rising interest rates elsewhere in the Company, including on Ambac’s financial guarantee exposures. As of
June 30, 2017 and December 31, 2016
the notional amounts of AFS’s derivatives are as follows:
|
Notional
|
|||||||
|
Type of derivative
|
June 30,
2017 |
December 31,
2016 |
|||||
|
Interest rate swaps—receive-fixed/pay-variable
|
$
|
579,648
|
|
$
|
973,130
|
|
|
|
Interest rate swaps—pay-fixed/receive-variable
|
281,920
|
|
1,874,678
|
|
|||
|
US Treasury futures contracts—short
|
1,105,000
|
|
195,000
|
|
|||
| Ambac Financial Group, Inc.
48
2017 Second Quarter FORM 10-Q |
AMBAC FINANCIAL GROUP, INC. AND SUBSIDIARIES
Notes to Unaudited Consolidated Financial Statements
(Dollar Amounts in Thousands, Except Share Amounts)
Derivatives of Consolidated Variable Interest Entities
Certain VIEs consolidated under the Consolidation Topic of the ASC entered into derivative contracts to meet specified purposes within the securitization structure. The notional for VIE derivatives outstanding as of
June 30, 2017 and December 31, 2016
are as follows:
|
Notional
|
|||||||
|
Type of VIE derivative
|
June 30,
2017 |
December 31,
2016 |
|||||
|
Interest rate swaps—receive-fixed/pay-variable
|
$
|
1,428,396
|
|
$
|
1,352,010
|
|
|
|
Interest rate swaps—pay-fixed/receive-variable
|
2,409,852
|
|
2,300,584
|
|
|||
|
Currency swaps
|
393,350
|
|
312,357
|
|
|||
|
Credit derivatives
|
12,132
|
|
12,059
|
|
|||
Contingent Features in Derivatives Related to Ambac Credit Risk
Ambac’s over-the-counter interest rate swaps are centrally cleared when eligible. Certain interest rate swaps remain with professional swap-dealer counterparties and certain front-end counterparties. These non-cleared swaps are generally executed under standardized derivative documents including collateral support and master netting agreements. Under these agreements, Ambac is required to post collateral in the event net unrealized losses exceed predetermined threshold levels. Additionally, given that Ambac Assurance is no longer rated by an independent rating agency, counterparties have the right to terminate the swap positions.
As of
June 30, 2017 and December 31, 2016
, the net liability fair value of derivative instruments with contingent features linked to Ambac’s own credit risk was
$81,814
and
$82,944
, respectively, related to which Ambac had posted cash and securities as collateral with a fair value of
$102,090
and
$128,754
, respectively. All such ratings-based contingent features have been triggered as requiring maximum collateral levels to be posted by Ambac while preserving counterparties’ rights to terminate the contracts. Assuming all such contracts terminated on
June 30, 2017
, settlement of collateral balances and net derivative liabilities would result in a net receipt of cash and/or securities by Ambac. If counterparties elect to exercise their right to terminate, the actual termination payment amounts will be determined in accordance with derivative contract terms, which may result in amounts that differ from market values as reported in Ambac’s financial statements.
10. INCOME TAXES
Ambac files a consolidated Federal income tax return with its subsidiaries. Ambac and its subsidiaries also file separate or combined income tax returns in various states, local and foreign jurisdictions. The following are the major jurisdictions in which Ambac and its subsidiaries operate and the earliest tax years subject to examination:
|
Jurisdiction
|
Tax Year
|
|
United States
|
2010
|
|
New York State
|
2013
|
|
New York City
|
2013
|
|
United Kingdom
|
2014
|
|
Italy
|
2013
|
As of
June 30, 2017
Ambac had loss carryforwards totaling
$4,019,178
. This includes carryforwards of
$87,216
relating to U.S. capital losses and an ordinary U.S. federal net operating tax carryforward of approximately
$3,931,962
, which, if not utilized, will begin expiring in
2029
, and will fully expire in
2033
. Ambac's capital losses will begin expiring in 2017 and fully expire in 2022.
| Ambac Financial Group, Inc.
49
2017 Second Quarter FORM 10-Q |
AMBAC FINANCIAL GROUP, INC. AND SUBSIDIARIES
Notes to Unaudited Consolidated Financial Statements
(Dollar Amounts in Thousands, Except Share Amounts)
The tax effects of temporary differences that give rise to significant portions of the deferred tax liabilities and deferred tax assets at
June 30, 2017 and December 31, 2016
are presented below:
|
June 30,
2017 |
December 31,
2016 |
||||||
|
Deferred tax liabilities:
|
|||||||
|
Insurance intangible
|
$
|
319,260
|
|
$
|
336,728
|
|
|
|
Variable interest entities
|
44,654
|
|
46,343
|
|
|||
|
Investments
|
83,944
|
|
38,656
|
|
|||
|
Unearned premiums and credit fees
|
67,940
|
|
68,682
|
|
|||
|
Unremitted foreign earnings
|
67,715
|
|
30,699
|
|
|||
|
Other
|
4,195
|
|
4,276
|
|
|||
|
Total deferred tax liabilities
|
587,708
|
|
525,384
|
|
|||
|
Deferred tax assets:
|
|||||||
|
Net operating loss and capital carryforward
|
1,406,713
|
|
1,409,565
|
|
|||
|
Loss reserves
|
297,313
|
|
224,553
|
|
|||
|
AMT Credits
|
32,149
|
|
31,532
|
|
|||
|
Other
|
17,324
|
|
16,726
|
|
|||
|
Subtotal deferred tax assets
|
1,753,499
|
|
1,682,376
|
|
|||
|
Valuation allowance
|
1,167,657
|
|
1,158,712
|
|
|||
|
Total deferred tax assets
|
585,842
|
|
523,664
|
|
|||
|
Net deferred tax (liability)
|
$
|
(1,866
|
)
|
$
|
(1,720
|
)
|
|
In accordance with the Income Tax Topic of the ASC, a valuation allowance is recognized if, based on the weight of available evidence, it is more-likely-than-not that some, or all, of the deferred tax asset will not be realized. As a result of the risks and uncertainties associated with future operating results, management believes it is more likely than not that the Company will not generate sufficient taxable income to recover the deferred tax operating asset and therefore has a full valuation allowance.
U.S. and foreign components of pre-tax income were as follows:
|
Three Months Ended June 30,
|
Six Months Ended June 30,
|
||||||||||||||
|
2017
|
2016
|
2017
|
2016
|
||||||||||||
|
U.S.
|
$
|
(25,177
|
)
|
$
|
98,399
|
|
$
|
(217,050
|
)
|
$
|
125,899
|
|
|||
|
Foreign
|
39,169
|
|
(36,888
|
)
|
125,182
|
|
(51,534
|
)
|
|||||||
|
Total
|
$
|
13,992
|
|
$
|
61,511
|
|
$
|
(91,868
|
)
|
$
|
74,365
|
|
|||
The components of the provision for income taxes were as follows:
|
Three Months Ended June 30,
|
Six Months Ended June 30,
|
||||||||||||||
|
2017
|
2016
|
2017
|
2016
|
||||||||||||
|
Current taxes
|
|||||||||||||||
|
U. S. federal
|
$
|
618
|
|
$
|
76
|
|
$
|
618
|
|
$
|
76
|
|
|||
|
U.S. state and local
|
(320
|
)
|
116
|
|
—
|
|
237
|
|
|||||||
|
Foreign
|
6,584
|
|
2,964
|
|
25,845
|
|
6,396
|
|
|||||||
|
Current taxes
|
6,882
|
|
3,156
|
|
26,463
|
|
6,709
|
|
|||||||
|
Deferred taxes
|
|||||||||||||||
|
Deferred taxes
|
—
|
|
—
|
|
—
|
|
(114
|
)
|
|||||||
|
Provision for income taxes
|
$
|
6,882
|
|
$
|
3,156
|
|
$
|
26,463
|
|
$
|
6,595
|
|
|||
NOL Usage
Pursuant to the Amended TSA (as defined in
Note 1. Background and Business Description
to the Consolidated Financial Statements included in Part II, Item 8 in the Company's Annual Report on Form 10-K for the year ended
December 31, 2016
), to the extent Ambac Assurance generates taxable income after September 30, 2011, which is offset with "Allocated NOLs" of
$3,650,000
, it is obligated to make payments (“Tolling
| Ambac Financial Group, Inc.
50
2017 Second Quarter FORM 10-Q |
AMBAC FINANCIAL GROUP, INC. AND SUBSIDIARIES
Notes to Unaudited Consolidated Financial Statements
(Dollar Amounts in Thousands, Except Share Amounts)
Payments”), subject to certain credits, to Ambac in accordance with the following NOL usage table, where the “Applicable Percentage” is applied to the aggregate amount of federal income tax liability that would have been paid if the Allocated NOLs were not available.
NOL Usage Table
|
NOL Usage Tier
|
Allocated NOLs
|
Applicable Percentage
|
||
|
A
|
The first
|
$479,000
|
15%
|
|
|
B
|
The next
|
$1,057,000
|
after Tier A
|
40%
|
|
C
|
The next
|
$1,057,000
|
after Tier B
|
10%
|
|
D
|
The next
|
$1,057,000
|
after Tier C
|
15%
|
Any post determination date NOLs generated by Ambac Assurance are utilized prior to any Allocated NOLs for which Tolling Payments will be due. Ambac Assurance has utilized all of its current post determination date NOLs generated from September 30, 2011 through
December 31, 2016
, generating cumulative taxable income of
$1,086,124
. Of the bankruptcy related credits available to offset the first
$5,000
of payments due under each of the NOL usage Tiers A, B, and C, Ambac Assurance has fully utilized the combined
$10,000
of Tier A and Tier B credits. For the two years ended December 31, 2016, Ambac Assurance utilized all of the
$479,000
Tier A NOL and
$607,124
of the
$1,057,000
Tier B NOL resulting in cumulative Tolling Payments, net of applicable credits, of
$100,145
, of which
$71,454
was paid to Ambac in 2016 and
$28,691
was paid in 2017. For the six months ended
June 30, 2017
, Ambac Assurance generated taxable income of
$18,610
, which resulted in additional accrued Tolling Payments of
$2,605
and, assuming Ambac Assurance's cumulative full year taxable income does not change, will be paid in 2018.
Beginning on the fifth anniversary date subsequent to Ambac's May 1, 2013 emergence from bankruptcy, and subject to Ambac's consent, not to be unreasonably withheld, to the extent Ambac Assurance generates post-determination date income in excess of the
$3,650,000
Allocated NOLs, Ambac Assurance may utilize Ambac's then remaining NOLs in exchange for a payment of
25%
of the federal income tax liability that Ambac Assurance would have paid had Ambac's NOLs not been available. After Ambac fully utilizes its Allocated NOLs it may utilize Ambac Assurance's then remaining Allocated NOLs in exchange for a payment of
50%
of the federal income tax liability that Ambac would have paid had Ambac Assurance's NOL not been available.
As of
June 30, 2017
, the remaining balance of the
$3,931,962
NOL allocated to Ambac Assurance was
$2,545,266
. As of
June 30, 2017
Ambac's NOL was
$1,386,696
.
11. COMMITMENTS AND CONTINGENCIES
The following commitments and contingencies provide an update of those discussed in
Note 18: Commitments and Contingencies
in the Notes to Consolidated Financial Statements included Part II, Item 8 in the Company’s Annual Report on Form 10-K for the year ended
December 2016
, and should be read in conjunction with the complete descriptions provided in the aforementioned Form 10-K.
The Segregated Account and Wisconsin Rehabilitation Proceeding
On July 15, 2016, the Rehabilitator filed a motion to confirm and declare the nature of the Segregated Account Rehabilitation Proceedings in order to avoid misunderstandings that may arise in litigation involving Ambac Assurance concerning certain military housing projects. Certain parties to these military housing litigations filed an opposition to the Rehabilitator’s motion on September 30, 2016. On October 11, 2016 the Rehabilitation Court held a hearing on the motion and on October 24, 2016, the Rehabilitation Court entered an order granting the Rehabilitator’s motion. On November 7, 2016, the interested parties that had opposed the Rehabilitator’s motion filed a notice of appeal from the October 24 order, and that appeal is now fully briefed before the Wisconsin Court of Appeals. On November 21, 2016, the Rehabilitator filed a motion to quash a subpoena served on the Wisconsin Commissioner of Insurance by certain parties to the military housing litigations. The Rehabilitation Court granted the Rehabilitator’s motion to quash on November 23, 2016. The interested parties that had served the subpoena filed an opposition to the Rehabilitator’s motion to quash on November 23, 2016, and filed on November 28, 2016 a motion to reconsider the November 23 order, which the Rehabilitator opposed on December 6, 2016. The Rehabilitation Court held a hearing on January 6, 2017 and entered an order on January 20, 2017 denying the motion to reconsider and clarifying procedures for discovery relating to the Segregated Account Rehabilitation Proceedings.
In connection with the Rehabilitation Exit Transactions, it is anticipated that the Rehabilitator will file a motion in the Rehabilitation Court by no later than October 2, 2017 seeking entry of an order approving the Rehabilitation Plan Amendment. The Rehabilitator has reserved December 12, 2017 through December 14, 2017 for a confirmation hearing on the Rehabilitation Plan Amendment, and November 30, 2017 for a pre-trial hearing.
Litigation Against Ambac
Ori Wilbush, individually and on behalf of all others similarly situated v. Ambac Financial Group, Inc., Diana N. Adams, David Trick, Jeffrey S. Stein, Nader Tavakoli and Cathleen Matanle (United States District Court, Southern District of New York, Civil Action No. 16-cv-05076-
| Ambac Financial Group, Inc.
51
2017 Second Quarter FORM 10-Q |
AMBAC FINANCIAL GROUP, INC. AND SUBSIDIARIES
Notes to Unaudited Consolidated Financial Statements
(Dollar Amounts in Thousands, Except Share Amounts)
RMB, filed on June 28, 2016). Defendants filed a motion to dismiss the amended complaint on February 27, 2017. Plaintiff filed its brief in opposition to the motion on April 24, 2017. Ambac filed its reply brief on May 9, 2017. Ambac believes the lawsuit is without merit.
County of Alameda et al. v. Ambac Assurance Corporation et al. (Superior Court of the State of California, County of San Francisco, second amended complaint filed on or about August 23, 2011); Contra Costa County et al. v. Ambac Assurance Corporation et al. (Superior Court of the State of California, County of San Francisco, third amended complaint filed on or about October 21, 2011); The Olympic Club v. Ambac Assurance Corporation et al. (Superior Court of the State of California, County of San Francisco, fourth amended complaint filed on or about October 21, 2011). Ambac Assurance and plaintiffs have executed an agreement to settle these litigations and the cases against Ambac Assurance were dismissed on August 1, 2017.
Erste Europäische Pfandbriefund Kommunalkreditbank AG In Luxemburg and Ambac Assurance Corporation v. City of San Bernardino, California (United States Bankruptcy Court, Central District of California, Riverside Division, Docket No. 15-1185, filed on January 7, 2015). Plaintiffs commenced this adversary proceeding, which relates to the Debtor’s obligations under the Public Employees Retirement Law, California Government Code Section 20000 et seq. (the “Retirement Law”), in connection with the City of San Bernardino’s bankruptcy proceeding. In the complaint, plaintiffs seek a declaratory judgment that the Debtor is obligated to make equivalent payments to both the holders of certain pension obligation bonds (the “Bonds”), a portion of which are insured by Ambac, and the California Public Employees Retirement Systems (“CalPERS”) to fund pension and other retirement benefits. It is the plaintiffs’ position that they are entitled to declaratory judgment because (i) when the City issue the Bonds, the City argued and a California court found, that the obligations under the Bonds were of the same legal character as the City’s obligations to CalPERS and (ii) the amounts owed to the bondholders and to CalPERS are merely separate portions of a single obligation owed by the Debtor under the Retirement Law. Plaintiffs therefore seek equivalent payment as to CalPERS, whether such payment takes for the form of current payments during the bankruptcy proceeding and thereafter, payments otherwise made in connection with the Retirement Law or any agreements entered into in accordance therewith, or distributions under a plan of adjustment. On March 13, 2015, the City filed a motion to dismiss the complaint, which plaintiffs opposed. On May 11, 2015, the court heard oral argument and granted the City’s motion to dismiss. On June 8, 2015, plaintiffs filed a notice of appeal of the court’s order granting the City’s motion to dismiss with the Bankruptcy Appellate Panel for the Ninth Circuit and filed their appellate brief on January 5, 2016. The parties have reached a settlement and pursuant to the settlement agreement dated March 28, 2016, the plaintiffs have agreed to dismiss the appeal with prejudice upon confirmation of the City’s plan of adjustment by the bankruptcy judge and the plan of adjustment becoming effective. The plan of adjustment was confirmed on February 7, 2017 and became effective on June 15, 2017. Accordingly, the parties filed a stipulation agreeing to dismiss the appeal with prejudice with the Bankruptcy Appellate Panel on June 25, 2017. The bankruptcy appellate panel dismissed the appeal on July 13, 2017.
Ambac Assurance is defending several lawsuits in which borrowers have brought declaratory judgment actions claiming, among other things, that Ambac Assurance’s claims for specific performance related to the construction and development of housing at various military bases to replace or cash-fund a debt-service-reserve surety bond, as required under the applicable loan documents (see Litigation Filed By Ambac), are time-barred or are barred by the doctrine of laches, that Ambac lacks standing on the basis that there has been an “Ambac Default,” and that Ambac is not entitled to specific performance pursuant to the terms of the loan documents. Ambac Assurance is a defendant in various lawsuits, including the following:
|
•
|
Meade Communities LLC v. Ambac Assurance Corporation (Circuit Court, Anne Arundel County, Maryland, Case No. C-02-CV-15-003745). On April 26, 2017, the court granted a motion by Meade to amend its complaint to add a new count that Ambac had allegedly "unreasonably withheld" consent to a proposed Out-Year Development plan submitted by Meade to Ambac for approval. On April 28, 2017, Ambac Assurance filed a motion for summary judgment on all counts of the original Meade complaint. On April 28, 2017, Meade filed a motion for partial summary judgment on two counts of the complaint and certain Ambac Assurance affirmative defenses. On June 2, 2017, the parties filed oppositions to the summary judgment motions. The parties filed reply briefs in support of their motions on June 16, 2017. On July 14, 2017, the parties cross-moved for summary judgment on the additional count added to the amended complaint on April 26, 2017. The court will hear oral argument on all motions for summary judgment on September 1, 2017.
|
|
•
|
Monterey Bay Military Housing LLC and Monterey Bay Land LLC v. Ambac Assurance Corporation (Superior Court, Monterey County, California, Case No. 15CV000599). On March 30, 2017, Ambac Assurance filed a motion for summary judgment on all counts of the Monterey Bay complaint. On March 30, 2017, Monterey Bay filed a motion for partial summary judgment on two counts of the complaint and certain Ambac Assurance affirmative defenses. The parties filed their opposition briefs on June 2, 2017 and reply briefs on June 9, 2017. On June 19, 2017, the court issued a preliminary order that partially granted Monterey Bay's motion for summary judgment and ruled that the California statute of limitations had run on Ambac Assurance's claim for specific performance, subject to Ambac Assurance's defense of equitable tolling. The court also partially granted Ambac Assurance's motion for summary judgment on certain of Monterey Bay's declaratory judgment claims. On June 23, 2017, Ambac Assurance withdrew its defense of equitable tolling. The parties agreed that the court's summary judgment ruling on the statute of limitations was sufficient to end the case at the trial court level and submitted final orders to the court for approval. The court signed the final orders on July 13, 2017.
|
Ambac Assurance’s estimates of projected losses for RMBS transactions consider, among other things, the RMBS transactions’ payment waterfall structure, including the application of interest and principal payments and recoveries, and depend in part on our interpretations of contracts and other bases of our legal rights. From time to time, bond trustees and other transaction participants have employed different contractual interpretations. It is not possible to predict whether additional disputes will arise, nor the outcomes of any potential litigation. It is possible that
| Ambac Financial Group, Inc.
52
2017 Second Quarter FORM 10-Q |
AMBAC FINANCIAL GROUP, INC. AND SUBSIDIARIES
Notes to Unaudited Consolidated Financial Statements
(Dollar Amounts in Thousands, Except Share Amounts)
there could be unfavorable outcomes in this or other disputes or proceedings and that our interpretations may prove to be incorrect, which could lead to changes to our estimate of loss reserves.
It is not reasonably possible to predict whether additional suits will be filed or whether additional inquiries or requests for information will be made, and it is also not possible to predict the outcome of litigation, inquiries or requests for information. It is possible that there could be unfavorable outcomes in these or other proceedings. Legal accruals for litigation against Ambac which are probable and reasonably estimable, and management's estimated range of loss for such matters, are not material to the operating results or financial position of the Company. For the litigation matters Ambac is defending that do not meet the “probable and reasonably estimable” accrual threshold and where no loss estimates have been provided above, management is unable to make a meaningful estimate of the amount or range of loss that could result from unfavorable outcomes. Under some circumstances, adverse results in any such proceedings could be material to our business, operations, financial position, profitability or cash flows. The Company believes that it has substantial defenses to the claims above and, to the extent that these actions proceed, the Company intends to defend itself vigorously; however, the Company is not able to predict the outcomes of these actions.
Litigation Filed or Joined by Ambac
In the ordinary course of their businesses, certain of Ambac’s subsidiaries assert claims in legal proceedings against third parties to recover losses already paid and/or mitigate future losses. The amounts recovered and/or losses avoided which may result from these proceedings is uncertain, although recoveries and/or losses avoided in any one or more of these proceedings during any quarter or fiscal year could be material to Ambac’s results of operations in that quarter or fiscal year.
Ambac UK v. J.P. Morgan Investment Management (Supreme Court of the State of New York, County of New York, filed May 4, 2009, No. 650259/2009). Trial commenced in March 2017. On March 25, 2017 the parties reached a confidential settlement in principle and on April 11, 2017 executed a settlement agreement memorializing the terms of the agreement.
Assured Guaranty Corp., Assured Guaranty Municipal Corp., and Ambac Assurance Corporation v. Alejandro Garcia Padilla, et al. (United States District Court, District of Puerto Rico No. 3:16-cv-01037, filed January 7, 2016). Ambac Assurance, along with co-plaintiffs Assured Guaranty Corp. and Assured Guaranty Municipal Corp., filed a complaint for declaratory and injunctive relief to protect its rights against the illegal clawback of certain revenue by the Commonwealth of Puerto Rico. Defendants (including the Government Development Bank (GDB) President but solely in her capacity as a member of the Working Group For The Fiscal and Economic Restoration of Puerto Rico) filed a motion to dismiss for lack of subject matter jurisdiction on January 29, 2016. The GDB President, in her official capacity, moved to dismiss for failure to state a claim upon which relief can be granted on January 29, 2016. Plaintiffs filed their oppositions to the motions on February 16, 2016 and defendants filed replies on February 23, 2016. This case was administratively consolidated with a similar case before the same judge, Financial Guaranty Insurance Company v. Alejandro Garcia Padilla, et al. (United States District Court, District of Puerto Rico No. 3:16- cv-01095). On October 4, 2016, the court denied the Defendants’ and GDB President’s motions to dismiss with respect to all claims asserted by Ambac Assurance and Assured. On October 14, 2016, Defendants filed a Notice of Automatic Stay, asserting that Plaintiffs’ claims have been rendered moot and further asserting that the case is automatically stayed under section 405 of the Puerto Rico Oversight, Management and Economic Stability Act (PROMESA). On October 28, 2016, Plaintiffs informed the court that neither party was currently challenging the stay, and expressly reserved their right to seek to lift the stay at any time. Plaintiffs also objected to Defendants’ assertion that the case should be dismissed as moot. PROMESA’s litigation stay expired on May 2, 2017. On May 3, 2017, a petition under Title III of PROMESA was filed on behalf of the Commonwealth of Puerto Rico. On May 16, 2017, Defendants filed a statement requesting that the court take notice of the stay resulting from the Commonwealth’s Title III filing. On May 17, 2017, the court issued an order staying this case until further order of the court.
Ambac Assurance Corporation v. Puerto Rico Highways and Transportation Authority (United States District Court, District of Puerto Rico, No. 16-cv-1893, filed May 10, 2016). Ambac Assurance filed a complaint against the Puerto Rico Highways and Transportation Authority (PRHTA) on May 10, 2016, alleging breach of fiduciary duty and breach of contract in connection with PRHTA’s extension of an existing toll road concession agreement. The complaint alleges that it was inappropriate for PRHTA to enter into the extension agreement in its current state of financial distress because PRHTA has no control over, and is unlikely to receive, the proceeds of the transaction. The complaint also seeks specific performance of PRHTA’s contractual duty to provide information requested by Ambac Assurance under documents related to PRHTA bonds insured by Ambac Assurance. Ambac Assurance filed related motions seeking the appointment of a provisional receiver for PRHTA and expedited discovery. In addition to those remedies, Ambac Assurance seeks an order of the court that would, among other things, compel PRHTA to allow Ambac Assurance to inspect PRHTA’s financial records on an ongoing basis and permanently enjoin PRHTA from committing further breaches of its fiduciary and contractual duties. On July 1, 2016, PRHTA filed an Emergency Notice of Stay, asserting that the case was automatically stayed under section 405 of PROMESA. Ambac Assurance filed a response on July 11, 2016, disagreeing that the PROMESA stay applies but electing not to contest the stay at such time and reserving the right to challenge it or to seek to lift the stay in the future. Ambac Assurance also asserted that PRHTA still is obligated to make available to Ambac Assurance certain information, notwithstanding the stay on litigation and provided a proposed order for the court to issue. PRHTA filed a reply on July 18, 2016, contesting Ambac Assurance’s characterization, and provided an alternative order for the court to issue. Ambac Assurance’s response was filed July 25, 2016. PRHTA also filed an Urgent Motion to Exempt PRHTA from Outstanding Filings in the case during the pendency of the stay, which was granted. On August 23, 2016 the court issued an order staying the case. PROMESA’s litigation stay expired on May 2, 2017. The Commonwealth and Oversight Board have stated to Ambac Assurance that they believe this action is stayed due to the Commonwealth’s Title III filing. Subsequent to that statement, on May 21, 2017, a petition under Title III of PROMESA was filed on behalf of PRHTA.
| Ambac Financial Group, Inc.
53
2017 Second Quarter FORM 10-Q |
AMBAC FINANCIAL GROUP, INC. AND SUBSIDIARIES
Notes to Unaudited Consolidated Financial Statements
(Dollar Amounts in Thousands, Except Share Amounts)
Lex Claims, LLC et al. v. Alejandro Garcia Padilla et al. (United States District Court, District of Puerto Rico, No. 16-2374, filed July 20, 2016). On October 7, 2016, certain General Obligation bondholder plaintiffs in an action to which Ambac Assurance is not currently a party filed a motion for leave to amend their complaint and for partial relief from the PROMESA stay. Plaintiffs’ proposed second amended complaint adds the Puerto Rico Sales Tax Financing Corporation (COFINA), COFINA’s executive director, and the trustee for the COFINA bonds as defendants, and asserts numerous claims that challenge the legal validity of the COFINA structure and seek injunctive relief requiring the sales and use tax proceeds securing COFINA’s bonds to be transferred to the Puerto Rico Treasury. The plaintiffs contend that many of the claims challenging COFINA are not subject to PROMESA’s litigation stay provisions. On October 24, 2016, the defendants filed an opposition to the motion for leave to amend, arguing that the entire action is subject to the PROMESA stay. On October 26, 2016, Ambac Assurance filed a motion for leave to intervene and in support of the PROMESA stay. Ambac Assurance seeks to intervene principally to argue that the claims challenging COFINA are stayed by PROMESA, but also reserves the right to move to dismiss or otherwise defend against those claims should the court determine they are not stayed. On November 4, 2016, the Court granted the plaintiffs’ motion for leave to amend. The plaintiffs filed their second amended complaint that same day. On November 7, 2016, the government defendants sought to stay the case. On February 17, 2017, the court granted the motions to intervene of Ambac Assurance and certain other parties that moved to intervene. The court also denied the defendants’ motion to stay, rejecting the arguments in support of the stay filed by the defendants and the intervenors, including Ambac Assurance. On March 20, 2017, Ambac Assurance filed in the district court an answer to the second amended complaint and a motion to dismiss the plaintiffs’ claim against COFINA, to strike certain portions of the second amended complaint, or, in the alternative, to certify the question of COFINA’s constitutionality to the Supreme Court of Puerto Rico. Certain other intervenors also filed answers and various motions in the district court. On April 4, 2017, the U.S. Court of Appeals for the First Circuit reversed the district court’s decision concerning the application of the PROMESA stay, which had the effect of reinstating the stay. PROMESA’s litigation stay expired on May 2, 2017. On May 3, 2017, a petition under Title III of PROMESA was filed on behalf of the Commonwealth of Puerto Rico. On May 16, 2017, the defendants filed a statement requesting that the court take notice of the stay resulting from the Commonwealth’s Title III filing. On May 17, 2017, the court issued an order staying this case until further order of the court. On August 2, 2017, the Oversight Board filed a motion to approve a stipulation to resolve the Commonwealth-COFINA dispute regarding their entitlement to the sales and use taxes. The stipulation contemplates separate agents for each of COFINA and the Commonwealth, which agents will litigate the dispute, while preserving the ability of interested parties, including Ambac Assurance, to participate in the litigation. The procedures motion names Ms. Bettina Whyte as the agent for COFINA, represented by Willkie Farr & Gallagher LLP, with Klee, Tuchin, Bogdanoff & Stern LLP as special municipal bankruptcy counsel, and names the Official Committee of Unsecured Creditors for the Commonwealth of Puerto Rico (the Creditors’ Committee) as the agent for the Commonwealth, represented by Paul Hastings LLP.
Ambac Assurance Corporation v. Puerto Rico, et al. (United States District Court, District of Puerto Rico, No. 17-1567, filed May 2, 2017). On May 2, 2017, Ambac Assurance filed a complaint seeking a declaration that the Commonwealth’s Fiscal and Economic Growth Plan (the FEGP) and a recently enacted statute called the “Fiscal Plan Compliance Law” are unconstitutional and unlawful because they violate the Contracts, Takings, and Due Process Clauses of the U.S. Constitution, are preempted by PROMESA, and are unlawful transfers of property from COFINA to the Commonwealth in violation of PROMESA. The complaint further seeks an injunction against the filing of any Title III petitions, an injunction against the enactment or enforcement of any future legislation, rules, budgets, or restructuring plans premised on the FEGP, and a declaration that the Commonwealth is liable for any funds unlawfully transferred to it from COFINA. The complaint also seeks a declaration that the FEGP and Fiscal Plan Compliance Law violate covenants made by the Commonwealth and COFINA in the COFINA Resolution, which constitute Events of Default under the COFINA Resolution. On May 3, 2017, a petition under Title III of PROMESA was filed on behalf of the Commonwealth of Puerto Rico, and on May 5, 2017, a petition under Title III of PROMESA was filed on behalf of COFINA. On May 15, 2017, the Oversight Board filed a statement requesting that the court take notice of the stays resulting from these Title III filings. On May 17, 2017, the court issued an order staying this case until further order of the court.
Ambac Assurance Corporation v. Puerto Rico, et al. (United States District Court, District of Puerto Rico, No. 17-1568, filed May 2, 2017). On May 2, 2017, Ambac Assurance filed a complaint alleging that various moratorium laws and executive orders enacted by the Commonwealth to claw back funds from the PRIFA, PRHTA, and PRCCDA bonds violate the Contracts, Takings, and Due Process Clauses of the U.S. Constitution, are preempted by PROMESA, and unlawfully transfer PRHTA, PRCCDA, and PRIFA property to the Commonwealth. The complaint further seeks a declaration that the Commonwealth is liable for any funds unlawfully transferred to it from COFINA, an injunction against enforcement of the moratorium laws and executive orders, an injunction against the filing of any Title III petitions, and an injunction against the enactment or enforcement of any future legislation, rules, budgets, or restructuring plans premised on the FEGP. On May 3, 2017, a petition under Title III of PROMESA was filed on behalf of the Commonwealth of Puerto Rico. On May 15, 2017, the Oversight Board filed a statement requesting that the court take notice of the stay resulting from the Commonwealth’s Title III filing. On May 17, 2017, the court issued an order staying this case until further order of the court.
Ambac Assurance Corporation v. U.S. Department of Treasury et al. (United States District Court, District of Columbia, No. 17-809, filed May 2, 2017). On May 2, 2017, Ambac Assurance filed a complaint against the U.S. Department of Treasury and Steven Mnuchin, in his official capacity as Secretary of the Treasury, alleging that Puerto Rico’s ongoing diversion of rum taxes from PRIFA violates the Contracts, Takings, and Due Process Clauses of the U.S. Constitution, and seeking an equitable lien on all rum taxes possessed by the U.S. Treasury, and an injunction preventing their transfer to the Commonwealth, in order to prevent further dissipation of those funds by the Commonwealth. On May 24, 2017, the Oversight Board filed a statement requesting that the court take notice of the stay resulting from the Commonwealth’s Title III filing. On May 25, 2017, the court issued an order staying this case pending the final disposition of the Title III proceedings.
| Ambac Financial Group, Inc.
54
2017 Second Quarter FORM 10-Q |
AMBAC FINANCIAL GROUP, INC. AND SUBSIDIARIES
Notes to Unaudited Consolidated Financial Statements
(Dollar Amounts in Thousands, Except Share Amounts)
Ambac Assurance Corporation v. Bank of New York Mellon (United States District Court, Southern District of New York. No. 1:17-cv-03804, filed May 2, 2017). On May 2, 2017, Ambac Assurance filed a complaint in New York State Supreme Court, New York County, against the trustee for the COFINA bonds, Bank of New York Mellon (BNY), alleging breach of fiduciary, contractual, and other duties for failing to adequately and appropriately protect the holders of certain Ambac-insured senior COFINA bonds. The complaint seeks money damages; a declaration that BONY breached its fiduciary, contractual, and other duties; a declaration compelling BNY to recognize an event of default under the COFINA Resolution and accelerate the COFINA debt; an injunction to prevent BNY from making payments to holders of subordinate COFINA bonds; and forced replacement of BNY as trustee. On May 19, 2017, BNY filed a notice of removal of this action from New York state court to the United States District Court for the Southern District of New York. On May 30, 2017, the United States District Court for the District of Puerto Rico entered an order in an adversary proceeding brought by BNY (No. 1:17-ap-00133) staying this litigation pending further order of the court.
Bank of New York Mellon v. COFINA, et al. (United States District Court, District of Puerto Rico, No. 1:17-ap-00133, filed May 16, 2017). On May 16, 2017, BNY filed an adversary complaint in COFINA’s Title III case for an order to show cause why the court should not: (i) grant an interpleader of funds that BNY is holding for future interest payments to holders of COFINA bonds; (ii) stay pending and future litigation against BNY related to its role as trustee for COFINA bonds, including the action by Ambac Assurance against BNY; and (iii) discharge BNY from any liability in association with the interpleaded funds. BNY filed this interpleader action against COFINA and certain creditors of COFINA, including Ambac Assurance, that have made competing claims of entitlement to funds held by BNY in order to determine the parties’ respective entitlements to the funds. On May 30, 2017, the court granted BNY’s motion to interplead, and on June 6, 2017, the court set a schedule for discovery and briefing. Discovery and briefing are ongoing. An
ad hoc
group of general obligation bondholders and the Creditors’ Committee each moved to intervene (respectively) on May 23 and July 31, 2017; these motions to intervene were denied (respectively) on July 6 and August 1, 2017.
Peaje Investments LLC v. Puerto Rico Highways and Transportation Authority, et al. (United States District Court, District of Puerto Rico, No. 1:17-ap-00151, filed May 31, 2017). On June 15, 2017, Ambac Assurance moved to intervene in an adversary proceeding brought by Peaje Investments (Peaje), a holder of 1968 Bonds issued by PRHTA, against PRHTA. On May 31, 2017, Peaje filed a complaint seeking relief with respect to its ownership of the 1968 Bonds, including a declaration that the toll road revenues pledged to the 1968 Bonds are “special revenues” under Section 922 of the Bankruptcy Code, an injunction preventing the diversion of toll revenues to the Commonwealth and ordering the application of the toll revenues to the 1968 Bonds, and various declarations and injunctions related thereto. Peaje also filed a motion for a temporary restraining order and preliminary injunction on the same day, seeking to enjoin PRHTA from diverting the toll revenues to the Commonwealth. A hearing on the motion for a temporary restraining order was held on June 5, 2017, at which time Peaje withdrew the motion for a temporary restraining order and an evidentiary hearing on the motion for a preliminary injunction was set for August 8, 2017. Ambac moved to intervene in June 15, 2017, arguing that issues will be decided in this case that will have a significant impact on Ambac’s own interests with respect to PRHTA bonds. On July 21, 2017, the court denied Ambac Assurance's motion to intervene. On July 21, 2017, the Creditors’ Committee moved to intervene, which motion both Peaje and the defendants opposed on July 28, 2017; the court has not yet ruled on the motion. On July 31, 2017, the defendants moved to strike certain arguments Peaje raised in its reply in support of its motion for a preliminary injunction, arguing that Peaje improperly raised these arguments for the first time in its reply. On August 3, 2017, the court granted the defendants’ motion to strike. On August 3, 2017, the court approved a stipulation entered into by the parties that BNYM, as fiscal agent for PRHTA bondholders, shall continue to hold the funds in the reserve accounts established under PRHTA’s governing bond documents until further order of the court.
Ambac Assurance Corporation v. Puerto Rico, et al. (United States District Court, District of Puerto Rico, No. 1:17-ap-00159, filed June 8, 2017). On June 8, 2017, Ambac filed an adversary complaint in the Commonwealth’s Title III case against the Commonwealth, PRHTA, the Oversight Board, AAFAF, and other Commonwealth government officers. The complaint seeks declarations that (i) various moratorium laws and executive orders enacted by the Commonwealth to claw back funds from the PRIFA, PRHTA, and PRCCDA bonds and (ii) the FEGP and Fiscal Plan Complaint Act violate the Contracts, Takings, and Due Process Clauses of the U.S. Constitution, are preempted by PROMESA, and unlawfully transfer PRHTA, PRCCDA, and PRIFA property to the Commonwealth. The complaint further seeks a declaration that revenues pledged to the PRHTA bonds are “special revenues” under Sections 922 and 928 of the Bankruptcy Code, and an injunction compelling defendants to remit the pledged special revenues to PRHTA for payment of the PRHTA bonds. On July 7, 2017, Ambac Assurance filed an amended complaint that added an additional claim for relief: a declaration that the funds held in the PRHTA reserve accounts are property of the PRHTA bondholders. A pre-trial conference was held in this and other related matters on June 28, 2017. A further pre-trial conference is scheduled for September 27, 2017, and briefing on an anticipated motion to dismiss by the defendants is scheduled to be complete by October 12, 2017. On August 3, 2017, the court entered an order, to which all parties stipulated, providing that BNYM, as fiscal agent for PRHTA bondholders, shall continue to hold the funds in the reserve accounts established under PRHTA’s governing bond documents until further order of the court.
Ambac Assurance has filed various lawsuits seeking specific performance of obligations of borrowers on loans related to the construction and development of housing at various military bases to replace or cash-fund a debt-service-reserve surety bond provided by Ambac Assurance, as required under the applicable loan documents. Ambac Assurance has filed various lawsuits, including the following:
|
•
|
Ambac Assurance Corporation v. Fort Leavenworth Frontier Heritage Communities, II, LLC (U.S. District Court, District of Kansas, Index No. 15-CV-9596). Ambac Assurance filed an amended complaint on July 13, 2016. On August 1, 2016, Defendant filed a motion to dismiss the amended complaint for lack of subject matter jurisdiction. Ambac Assurance opposed the motion. On March 17, 2017, the court granted Fort Leavenworth's motion to dismiss for lack of subject matter jurisdiction. On March 28, 2017, Ambac re-filed the case
|
| Ambac Financial Group, Inc.
55
2017 Second Quarter FORM 10-Q |
AMBAC FINANCIAL GROUP, INC. AND SUBSIDIARIES
Notes to Unaudited Consolidated Financial Statements
(Dollar Amounts in Thousands, Except Share Amounts)
in state court in Shawnee County, Kansas. The re-filed case is styled Ambac Assurance Corporation v. Fort Leavenworth Frontier Heritage Communities II, LLC (District Court, Shawnee County, Kansas, No. 2017-cv-000216).
In connection with Ambac Assurance’s efforts to seek redress for breaches of R&Ws and fraud related to the information provided by both the underwriters and the sponsors of various transactions and for failure to comply with the obligation by the sponsors to repurchase ineligible loans, Ambac Assurance has filed various lawsuits, including the following:
|
•
|
Ambac Assurance Corporation and The Segregated Account of Ambac Assurance Corporation v. Countrywide Securities Corp., Countrywide Financial Corp. (a.k.a. Bank of America Home Loans) and Bank of America Corp. (Supreme Court of the State of New York, County of New York, Case No. 651612/2010, filed on September 28, 2010). On May 1, 2015, Ambac Assurance filed motions for partial summary judgment, which defendants opposed. Defendants also each filed motions for summary judgment, which Ambac Assurance opposed. On October 27, 2015, the court issued a decision dated October 22, 2015 granting in part and denying in part the parties’ respective summary judgment motions regarding Ambac Assurance’s claims against Countrywide (primary-liability claims), and issued a second decision granting Ambac Assurance’s partial motion for summary judgment and denying Bank of America’s motion for summary judgment regarding Ambac Assurance’s secondary-liability claims against Bank of America. Ambac Assurance and Countrywide filed notices of appeal of the October 22, 2015 decision relating to primary liability and Bank of America filed a notice of appeal of the October 27, 2015 decision relating to its secondary-liability to the New York Appellate Division, First Department. On May 16, 2017, the First Department issued rulings in both appeals, reversing a number of rulings that the trial court had made and affirming other rulings. On June 15, 2017, Ambac Assurance filed a motion with the First Department for leave to appeal certain rulings in the May 16, 2017 decision to the Court of Appeals, which Countrywide opposed. On July 25, 2017 the First Department granted Ambac Assurance’s motion.
|
|
•
|
Ambac Assurance Corporation and The Segregated Account of Ambac Assurance Corporation v. Nomura Credit & Capital, Inc. and Nomura Holding America Inc. (Supreme Court of the State of New York, County of New York, Case No. 651359/2013, filed on April 15, 2013). On June 3, 2015, the court denied defendants’ July 2013 motion to dismiss Ambac’s claim for breaches of R&Ws, but granted the defendants’ motion to dismiss Ambac’s claims for breach of the repurchase protocol and for alter ego liability against Nomura Holding. On March 27, 2017, Nomura appealed the June 2015 decision to the extent it denied its motion to dismiss and filed its opening appellate brief. Ambac Assurance filed its opening brief on June 23, 2017. Discovery is ongoing.
|
|
•
|
The Segregated Account of Ambac Assurance Corporation and Ambac Assurance Corporation v. Countrywide Home Loans, Inc. (Wisconsin Circuit Court for Dane County, Case No 14 CV 3511, filed on December 30, 2014). On June 23, 2016, the Wisconsin Court of Appeals reversed the trial court’s prior dismissal of the complaint, and on October 11, 2016, the Wisconsin Supreme Court granted Countrywide’s petition for review of the June 23 decision by the Wisconsin Court of Appeals. The Wisconsin Supreme Court appeal was argued on February 28, 2017. On June 30, 2017, the Wisconsin Supreme Court reversed the decision of the Wisconsin Court of Appeals and remanded the case to the Wisconsin Court of Appeals for further proceedings.
|
|
•
|
Ambac Assurance Corporation and The Segregated Account of Ambac Assurance Corporation v. U.S. Bank National Association (United States District Court, Southern District of New York, Docket No. 17-cv-00446 (SHS), filed January 20, 2017). On February 23, 2017, plaintiffs filed a second amended complaint to reflect a revised settlement offer, and also filed a motion for a preliminary injunction, which U.S. Bank opposed. On March 9, 2017, U.S. Bank filed a motion to dismiss the second amended complaint, which plaintiffs opposed. The court heard oral argument on plaintiffs’ motion for a preliminary injunction and U.S. Bank’s motion to dismiss on April 24, 2017. On June 1, 2017, the court denied U.S. Bank’s motion to dismiss and denied plaintiffs’ motion for preliminary injunction. U.S. Bank filed a motion for reconsideration of the court’s denial of its motion to dismiss, which has been fully briefed. On March 6, 2017, U.S. Bank filed a trust instruction proceeding in Minnesota state court
concerning the proposed settlement, which is captioned, In the matter of HarborView Mortgage Loan Trust 2005-10, No. 27-TR-CV-17-32 (the “Minnesota Action”). On April 5, 2017, Ambac Assurance filed a motion to dismiss the Minnesota Action. On June 12, 2017, U.S. Bank filed an amended petition in the Minnesota Action, and on July 7, 2017 Ambac Assurance filed a renewed motion to dismiss, which U.S. Bank opposed. Additionally, certain certificateholders have objected or otherwise responded to the petition filed by U.S. Bank.
|
|
•
|
Ambac Assurance Corporation and The Segregated Account of Ambac Assurance Corporation v. U.S. Bank National Association (United States District Court, Southern District of New York, Docket No. 17-cv-02614, filed April 11, 2017). Ambac alleges claims for breach of contract, breach of fiduciary duty, declaratory judgment, and violation of the Streit Act
in connection with defendant’s failure to enforce rights and remedies and defendant’s treatment of trust recoveries, as trustee of five residential mortgage-backed securitizations for which Ambac Assurance issued insurance policies
.
On June 12, 2017, the court granted U.S. Bank’s application for a pre-motion conference regarding U.S. Bank’s proposed motion to dismiss.
|
Following this summary is a discussion addressing the consolidated results of operations and financial condition of Ambac Financial Group, Inc. (“Ambac” or “the Company”) for the periods indicated. This discussion should be read in conjunction with Ambac’s Annual Report on Form 10-K for the year ended
December 31, 2016
, the CAUTIONARY STATEMENT PURSUANT TO THE PRIVATE SECURITIES LITIGATION REFORM ACT OF 1995 below and Risk Factors set forth in Part II, Item 1A of this Form 10-Q.
| Ambac Financial Group, Inc.
56
2017 Second Quarter FORM 10-Q |
This Management’s Discussion and Analysis of Financial Condition and Results of Operations (“MD&A”) contains certain financial measures, in particular the presentation of Adjusted Earnings and Adjusted Book Value, which are not presented in accordance with U.S. generally accepted accounting principles (“GAAP”). We are presenting these non-GAAP financial measures because they provide greater transparency and enhanced visibility into the underlying drivers of our business. We do not intend for these non-GAAP financial measures to be a substitute for any GAAP financial measures and they may differ from similar reporting provided by other companies. Readers of this Form 10-Q should use these non-GAAP financial measures only in conjunction with the comparable GAAP financial measures. Adjusted Earnings and Adjusted Book Value are non-GAAP financial measures that adjust for the impact of certain non-recurring or non-economic GAAP accounting requirements and include the addition of certain items that the Company has or expects to realize in the future, but that are not reported under GAAP. We also provide reconciliations to the most directly comparable GAAP measures; Adjusted Earnings to Net income attributable to common stockholders and Adjusted Book Value to Total Ambac Financial Group, Inc. stockholders’ equity.
CAUTIONARY STATEMENT PURSUANT TO THE PRIVATE SECURITIES LITIGATION REFORM ACT OF 1995
Management has included in Parts I and II of this Quarterly Report on Form 10-Q, including this MD&A,
statements that may constitute “forward-looking statements” within the meaning of the safe harbor provisions of the Private Securities Litigation Reform Act of 1995. Words such as “estimate,” “project,” “plan,” “believe,” “anticipate,” “intend,” “planned,” “potential” and similar expressions, or future or conditional verbs such as “will,” “should,” “would,” “could,” and “may,” or the negative of those expressions or verbs, identify forward-looking statements. We caution readers that these statements are not guarantees of future performance. Forward-looking statements are not historical facts but instead represent only our beliefs regarding future events, which, may by their nature be inherently uncertain and some of which may be outside our control. These statements may relate to plans and objectives with respect to the future, among other things which may change. We are alerting you to the possibility that our actual results may differ, possibly materially, from the expected objectives or anticipated results that may be suggested, expressed or implied by these forward-looking statements. Important factors that could cause our results to differ, possibly materially, from those indicated in the forward-looking statements include, among others, those discussed under “Risk Factors”
in Part I, Item 1A of the 2016 Annual Report on Form 10-K and in Part II, Item 1A of this quarterly Report on Form 10-Q.
Any or all of management’s forward-looking statements here or in other publications may turn out to be incorrect and are based on management’s current belief or opinions. Ambac’s actual results may vary materially, and there are no guarantees about the performance of Ambac’s securities. Among events, risks, uncertainties or factors that could cause actual results to differ materially are: (1) the highly speculative nature of Ambac’s common stock and volatility in the price of Ambac’s common stock; (2) uncertainty concerning our ability to achieve value for holders of Ambac securities, whether from Ambac Assurance Corporation (“Ambac Assurance”) or from transactions or opportunities apart from Ambac Assurance; (3) adverse effects on our share price resulting from future offerings of debt or equity securities that rank senior to our common stock; (4) potential of rehabilitation proceedings against Ambac Assurance; (5) dilution of current shareholder value or adverse effects on our share price resulting from the issuance of additional shares of common stock; (6) inadequacy of reserves established for losses and loss expenses and possibility that changes in loss reserves may result in further volatility of earnings or financial results; (7) decisions made by the rehabilitator of the Segregated Account of Ambac Assurance Corporation (the “Segregated Account”) for the benefit of policyholders that may result in material adverse consequences for holders of Ambac’s securities or holders of securities issued or insured by Ambac Assurance or the Segregated Account; (8) increased fiscal stress experienced by issuers of public finance obligations or an increased incidence of Chapter 9 filings or other restructuring proceedings by public finance issuers; (9) our inability to realize the expected recoveries included in our financial statements; (10) changes in Ambac’s estimated representation and warranty recoveries or loss reserves over time; (11) credit risk throughout our business, including but not limited to credit risk related to residential mortgage-backed securities, student loan and other asset securitizations, collateralized loan obligations, public finance obligations and exposures to reinsurers; (12) concentration and essentiality risk in connection with Military Housing insured debt; (13) the risk that our risk management policies and practices do not anticipate certain risks and/or the magnitude of potential for loss; (14) risks associated with adverse selection as our insured portfolio runs off; (15) adverse effects on operating results or our financial position resulting from measures taken to reduce risks in our insured portfolio; (16) intercompany disputes or disputes with the rehabilitator of the Segregated Account; (17) our inability to complete our announced Rehabilitation Exit Transactions on the terms contemplated or on a timely basis or at all; (18) the risk of loss from market and interest rate risk as Ambac Assurance raises additional liquidity to fund the cash component of the Segregated Account rehabilitation exit plan; (19) our inability to close the Tier 2 Note issuance; (20) our inability to mitigate or remediate losses, commute or reduce insured exposures or achieve recoveries or investment objectives, or the failure of any transaction intended to accomplish one or more of these objectives to deliver anticipated results; (21) our substantial indebtedness could adversely affect our financial condition, operating flexibility and ability to obtain financing in the future; (22) restrictive covenants in agreements and instruments may impair our ability to pursue or achieve our business strategies; (23) loss of control rights in transactions for which we provide insurance due to a finding that Ambac Assurance has defaulted, whether due to the Segregated Account rehabilitation proceedings or otherwise; (24) our results of operation may be adversely affected by events or circumstances that result in the accelerated amortization of our insurance intangible asset; (25) adverse tax consequences or other costs resulting from the Segregated Account rehabilitation plan, from rules and procedures governing the payment of permitted policy claims, or from the characterization of our surplus notes as equity; (26) risks attendant to the change in composition of securities in our investment portfolio; (27) changes in tax law; (28) changes in prevailing interest rates; (29) factors that may influence the amount of installment premiums paid to Ambac, including the Segregated Account rehabilitation proceedings; (30) default by one or more of Ambac Assurance’s portfolio investments, insured issuers or counterparties; (31) market risks impacting assets in our investment portfolio or the value of our assets posted as collateral in respect of interest rate swap transactions; (32) risks relating to determinations of amounts of impairments taken on investments; (33) the risk of litigation and regulatory inquiries or investigations, and the risk of adverse outcomes in connection therewith, which could have a material adverse effect on our business, operations, financial position, profitability or cash flows; (34) our inability to realize value from Ambac Assurance UK Limited or other subsidiaries of Ambac Assurance; (35) system security risks; (36) market spreads and pricing on derivative
| Ambac Financial Group, Inc.
57
2017 Second Quarter FORM 10-Q |
products insured or issued by Ambac or its subsidiaries; (37) the risk of volatility in income and earnings, including volatility due to the application of fair value accounting; (38) changes in accounting principles or practices that may impact Ambac’s reported financial results; (39) legislative and regulatory developments; (40) the economic impact of “Brexit” may have an adverse effect on Ambac’s insured international portfolio and the value of its foreign investments, both of which primarily reside with its subsidiary Ambac UK; (41) operational risks, including with respect to internal processes, risk and investment models, systems and employees, and failures in services or products provided by third parties; (42) Ambac’s financial position and the Segregated Account rehabilitation proceedings that may prompt departures of key employees and may impact our ability to attract qualified executives and employees; and (43) other risks and uncertainties that have not been identified at this time.
| Ambac Financial Group, Inc.
58
2017 Second Quarter FORM 10-Q |
EXECUTIVE SUMMARY
Company Overview:
See
Note 1. Background and Business Description
for a description of the Company and our key strategic priorities to achieve our primary goal to maximize stockholder value.
Ambac Assurance and Subsidiaries:
A key strategy for Ambac is to increase the value of its investment in Ambac Assurance by actively managing its assets and liabilities. Asset management primarily entails maximizing the risk adjusted return on non-VIE invested assets and managing liquidity to help ensure resources are available to meet operational and strategic cash needs. These strategic cash needs include activities associated with Ambac's liability management and loss mitigation programs. Management evaluates the potential impact of loss mitigation and avoidance strategies in order to target and prioritize policies, or portions thereof, for commutation, refinancing, restructuring or other risk reduction or defeasance strategies.
Asset Management:
Investment portfolios are subject to internal investment guidelines, including limits on types and quality of investments imposed by applicable insurance laws and regulations. As part of its investment strategy, and in accordance with the aforementioned guidelines, Ambac Assurance and Ambac Assurance UK Limited ("Ambac UK"), a subsidiary of Ambac Assurance, purchase distressed Ambac-insured securities based on their relative risk/reward characteristics. The investment portfolios of Ambac Assurance and Ambac UK also hold fixed income securities and funds that include a variety of other assets including, but not limited to, corporate bonds, asset backed and mortgage backed securities, municipal bonds, high yield bonds, leveraged loans, equities, real estate and hedge funds. Refer to
Note 8. Investments
to the Consolidated Financial Statements, included in Part I, Item 1 in this Form 10-Q for further details of fixed income investments by asset class.
During the
three and six months ended June 30, 2017
, Ambac (inclusive of its subsidiaries) acquired $241.9 million and $442.1 million of distressed Ambac-insured securities, including $25.9 million and $97.3 million of insured RMBS with policies allocated to the Segregated Account and $216.0 million and $313.1 million of Puerto Rico insured securities, respectively. Future cash flows relating to those invested assets include the sum of (i) the bond’s intrinsic cash flows and (ii) the estimated Ambac claim payments, including Deferred Amounts (as defined in the Segregated Account Rehabilitation Plan) for securities with policies allocated to the Segregated Account. At
June 30, 2017
, Ambac owned approximately $1.5 billion, or 41% of the total Deferred Amounts outstanding and approximately 12% of PRIFA and 30% of COFINA Ambac insured bonds. Subject to applicable internal and regulatory guidelines, Ambac will continue to opportunistically purchase Ambac-insured securities.
Liability and Insured Exposure Management:
Ambac Assurance's Risk Management Group focuses on the analysis, implementation and execution of commutations, risk reduction or defeasance and loss recovery strategies. Analysts evaluate the estimated timing and severity of projected policy claims as well as the potential impact of loss mitigation or remediation strategies in order to target and prioritize policies, or portions thereof, for commutation, refinancing, restructuring or other risk reduction or defeasance strategies. For targeted policies, analysts will engage with bondholders, issuers and other economic stakeholders to negotiate, structure and execute such strategies.
On July 19, 2017, Ambac Assurance and Ambac entered into an agreement (the “Rehabilitation Exit Support Agreement”) with holders or beneficial owners (the “Supporting Holders”) of surplus notes issued by Ambac Assurance and beneficial interests in Deferred Amounts of the Segregated Account with respect to a transaction which, subject to the conditions precedent set forth in the Rehabilitation Exit Support Agreement, and if consummated, would generally involve (i) the exchange of certain surplus notes held by holders of surplus notes that elect to participate in a voluntary exchange transaction and (ii) the satisfaction and discharge of all Deferred Amounts, in each case for an effective consideration package comprised of cash and new Secured Notes and certain existing surplus notes and (iii) the exit from rehabilitation of the Segregated Account (the “Rehabilitation Exit Transactions”). The exit of the Segregated Account from rehabilitation is subject to certain conditions, including approval by the Rehabilitation Court, and no assurance can be given that Ambac will ultimately be successful in meeting such conditions. See
Note 1. Background and Business Description
for details regarding the Rehabilitation Exit Support Agreement, the Rehabilitation Exit Transactions, and the risks associated with the Rehabilitation Exit Transactions (see also
Part II, Item 1A. Risk Factors
).
On June 27, 2017, Ambac Assurance entered into a termination agreement with various parties, including a special purpose entity Augusta Funding Limited IV ("Augusta"), in connection with the commutation of an interest rate swap between Augusta and Ambac Assurance's wholly-owned subsidiary, Ambac Financial Services ("AFS"). During the second quarter, AFS had net settlement payments of approximately $103.6 million, including $94.4 million under the termination agreement. At March 31, 2017, Ambac had recorded a mark-to-market liability under this swap transaction of $147.0 million (net of an Ambac Assurance CVA of $42.9 million), resulting in a gain of approximately $43.4 million during the three months ended June 30, 2017. In July 2017, Augusta redeemed its outstanding Ambac Assurance-insured debt and accordingly will recognize approximately $2.6 million in accelerated earnings in the third quarter of 2017 relating to this redemption. The Ambac Assurance-insured Augusta net par outstanding was $185 million at the time of redemption and was adversely classified.
During the second quarter of 2017, Ambac Assurance purchased the remaining $4.0 million of unpaid accrued interest related to certain surplus notes that were previously repurchased under call options. Ambac recognized a realized gain on these purchases of $1.1 million in the Consolidated Statements of Total Comprehensive Income (Loss).
| Ambac Financial Group, Inc.
59
2017 Second Quarter FORM 10-Q |
On March 25, 2017, Ambac UK agreed in principle to a confidential settlement of litigation brought by Ambac UK in the name of Ballantyne Re plc (“Ballantyne”) against J.P. Morgan Investment Management Inc. (“JPMIM”) relating to the management of Ballantyne’s investment accounts, which were funded with the proceeds of notes issued in 2006 in connection with a structured reinsurance transaction and guaranteed in part by Ambac UK. On April 11, 2017, Ambac UK, Ballantyne and JPMIM signed a settlement agreement. Pursuant to the settlement, Ballantyne received a payment in return for releases of all claims by Ballantyne and Ambac UK. Ambac realized a US GAAP benefit through losses and loss expenses of approximately $91.6 million in the first quarter of 2017 as a result of the settlement, which resulted from the reduction of loss and loss expense reserves previously established in relation to Ballantyne, and not from a direct cash payment to Ambac UK.
The following table provides a comparison of both total and below investment grade ("BIG") net par outstanding in the insured portfolio at
June 30, 2017 and December 31, 2016
. Net par exposures within the U.S. public finance market includes capital appreciation bonds which are reported at the par amount at the time of issuance of the insurance policy
as opposed to the current accreted value of the bonds
.
|
($ in billions)
|
June 30,
2017 |
December 31,
2016 |
$ Variance
|
% Variance
|
||||||||||
|
Total
|
$
|
71.2
|
|
$
|
79.3
|
|
$
|
(8.1
|
)
|
(10
|
)%
|
|||
|
BIG
|
15.2
|
|
16.8
|
|
(1.6
|
)
|
(10
|
)%
|
||||||
The overall reduction in total net par outstanding resulted from scheduled maturities, amortizations, refundings, refinancings and calls.
The reduction in below investment grade net par outstanding was primarily due to (i) reductions to residential mortgage-backed securities during the year and (ii) the upgrade of certain Public Finance exposures partially offset by the downgrade of a certain Military Housing transaction.
Although our insured portfolio has generally performed satisfactorily in the first half of 2017, we continue to experience stress in certain sectors and insured exposures, particularly within our approximately
$2.1 billion
of exposure to Puerto Rico consisting of several different issuing entities (all below investment grade). Each issuing entity has its own credit risk profile attributable to discreet revenue sources, direct general obligation pledges and general obligation guarantees.
Ambac:
As of
June 30, 2017
total cash and investments of Ambac were
$379.0 million
, which include the following:
|
•
|
Asset backed and short-term securities of
$139.5 million
|
|
•
|
Ambac-insured securities with a fair value of
$6.0 million
|
|
•
|
Ambac Assurance surplus notes with a fair value of
$201.1 million
, which are eliminated in consolidation
|
|
•
|
Residual interest in a VIE Trust that was created in 2014 to monetize Ambac's ownership interest in junior surplus notes issued by the Segregated Account. Ambac's carrying value, utilizing the equity method, of this investment was
$32.4 million
at
June 30, 2017
.
Refer to
Note 3. Special Purpose Entities, Including Variable Interest Entities
to the Consolidated Financial Statements included in Part II, Item 8 in the Company’s Annual Report on Form 10-K for the year ended
December 31, 2016
for more information on this transaction
.
|
During 2017, Ambac purchased ($101.8 million) and exchanged Ambac-insured bonds (fair value of $79.3 million) to extinguish (on a consolidated basis) $108.1 million par of Ambac Assurance surplus notes and $39.1 million par of Segregated Account surplus notes. Ambac recognized $1.1 million and $3.8 million of gains on the extinguishment of debt in the Consolidated Statements of Income (Loss) as a result of these transactions during the
three and six months ended June 30, 2017
, respectively.
As a result of positive taxable income at Ambac Assurance in 2016, Ambac received approximately
$28.7 million
in tax tolling payments in May 2017. There are no assurances that Ambac Assurance will continue to generate taxable income and therefore make tolling payments to Ambac, which may ultimately constrain Ambac's access to capital and liquidity to support it operations and strategic initiatives.
Financial Statement Impact of Foreign Currency:
The impact of foreign currency as reported in Ambac's Consolidated Statement of Total Comprehensive Income for the
six months ended June 30, 2017
included the following:
|
($ in millions)
|
||||
|
Net income
(1)
|
$
|
14.8
|
|
|
|
Gain on foreign currency translation
|
29.3
|
|
||
|
Unrealized (losses) on non-functional currency available-for-sale securities
|
(12.6
|
)
|
||
|
Impact on total comprehensive income (loss)
|
$
|
31.5
|
|
|
|
(1)
|
A portion of Ambac UK's, and to a lesser extent Ambac Assurance's, assets and liabilities are denominated in currencies other than its functional currency and accordingly, we recognized net foreign currency transaction gains/(losses) as a result of changes to foreign currency rates through our Consolidated Statement of Total Comprehensive Income (Loss). Refer to
Note 2. Basis of Presentation and Significant Accounting Policies
to the Consolidated Financial Statements included in Part II, Item 8 in the Company's Form 10-K for the year ended
December 2016
for further details on transaction gains and losses.
|
| Ambac Financial Group, Inc.
60
2017 Second Quarter FORM 10-Q |
Future changes to currency rates may adversely affect our financial results. Refer to Part I, Item 3
"Quantitative and Qualitative Disclosures about Market Risk"
for further information on the impact of future currency rate changes on Ambac's financial instruments.
CRITICAL ACCOUNTING POLICIES AND ESTIMATES
Ambac’s Consolidated Financial Statements have been prepared in accordance with U.S. generally accepted accounting principles (“GAAP”), which require the use of material estimates and assumptions. For a discussion of Ambac’s critical accounting policies and estimates, see “Critical Accounting Policies and Estimates” in Part II, Item 7 “Management’s Discussion and Analysis of Financial Condition and Results of Operations” included in Ambac’s Annual Report on Form 10-K for the year ended
December 31, 2016
.
FINANCIAL GUARANTEES IN FORCE
Financial guarantee products were sold in three principal markets: U.S. public finance, U.S. structured finance and international finance. The following table provides a breakdown of guaranteed net par outstanding by market at
June 30, 2017 and December 31, 2016
. Net par exposures within the U.S. public finance market include capital appreciation bonds which are reported at the par amount at the time of issuance of the insurance policy as opposed to the current accreted value of the bonds. Guaranteed net par outstanding includes the exposures of policies insuring variable interest entities (“VIEs”) consolidated in accordance with the Consolidation Topic of the ASC,
Consolidation.
Guaranteed net par outstanding excludes the exposures of policies that insure bonds which have been refunded or pre-refunded:
|
($ in millions)
|
June 30,
2017 |
December 31,
2016 |
|||||
|
Public Finance
(1) (2)
|
$
|
37,889
|
|
$
|
45,062
|
|
|
|
Structured Finance
|
15,701
|
|
16,951
|
|
|||
|
International Finance
|
17,608
|
|
17,333
|
|
|||
|
Total net par outstanding
(3)
|
$
|
71,198
|
|
$
|
79,346
|
|
|
|
(1)
|
Includes
$5,862
and
$5,896
of Military Housing net par outstanding at
June 30, 2017 and December 31, 2016
, respectively.
|
|
(2)
|
Includes
$2,058
of Puerto Rico net par outstanding at
June 30, 2017 and December 31, 2016
. Components of Puerto Rico net par outstanding includes capital appreciation bonds which are reported at the par amount at the time of issuance of the related insurance policy as opposed to the current accreted value of the bonds.
|
|
(3)
|
Included in the above net par exposures at
June 30, 2017 and December 31, 2016
are
$456
and
$737
, respectively, of exposures that were executed in credit derivative form.
|
Total net par outstanding decreased
$8,148 million
from
December 31, 2016
.
|
•
|
Reductions in public finance net par outstanding included
$5,162 million
from calls of insured exposures,
$910 million
from refundings and pre-refundings of insured exposures and
$1,101 million
from scheduled paydown activity.
|
|
•
|
Reductions in structured finance net par primarily were due to RMBS reductions of
$972 million
.
|
|
•
|
Increases in international finance were primarily due to changes in foreign exchange rates of
$938 million
primarily related to changes in the British Pound, partially offset by policy runoff including prepayments of investor-owned utility and asset-backed transactions.
|
Although insured net par outstanding has decreased during 2017, the size of the portfolio is significantly greater than the assets of Ambac. Accordingly, financial stress in the insured portfolio could have a material adverse effect on Ambac's financial condition and results of operations.
Exposure Currency
The table below shows the distribution by currency of Ambac Assurance’s insured exposure as of
June 30, 2017
:
|
Currency
(Amounts in millions)
|
Net Par Amount
Outstanding in
Base Currency
|
Net Par Amount
Outstanding in
U.S. Dollars
|
||||||
|
U.S. Dollars
|
$
|
54,754
|
|
$
|
54,754
|
|
||
|
British Pounds
|
£
|
10,075
|
|
13,113
|
|
|||
|
Euros
|
€
|
1,812
|
|
2,069
|
|
|||
|
Australian Dollars
|
A$
|
1,403
|
|
1,077
|
|
|||
|
New Zealand Dollars
|
NZ$
|
252
|
|
185
|
|
|||
|
Total
|
$
|
71,198
|
|
|||||
Ambac discloses its exposures by currency to help interested parties understand its insured book of business. These insured exposures do not represent the cash outflows that may result from such insurance policies.
| Ambac Financial Group, Inc.
61
2017 Second Quarter FORM 10-Q |
Exposure Concentrations within each Market
The table below shows Ambac’s ten largest U.S. public finance exposures, by repayment source, as a percentage of total financial guarantee net par outstanding at
June 30, 2017
:
|
($ in millions)
|
Ambac
Ratings
(1)
|
Net Par
Outstanding
|
% of Total
Net Par
Outstanding
|
||||||
|
New Jersey Transportation Trust Fund Authority - Transportation System
|
BBB+
|
$
|
1,642
|
|
2.3
|
%
|
|||
|
Puerto Rico Sales Tax Financing Corporation - Senior Sales Tax Revenue (COFINA)
|
BIG
|
805
|
|
1.1
|
%
|
||||
|
Massachusetts Commonwealth - GO
|
AA
|
802
|
|
1.1
|
%
|
||||
|
Mets Queens Baseball Stadium Project, NY, Lease Revenue
|
BBB
|
564
|
|
0.8
|
%
|
||||
|
Hickam Community Housing LLC
|
BBB
|
475
|
|
0.7
|
%
|
||||
|
Puerto Rico Infrastructure Financing Authority, Special Tax Revenue
|
BIG
|
471
|
|
0.7
|
%
|
||||
|
Chicago, IL - GO
|
BBB-
|
458
|
|
0.6
|
%
|
||||
|
Puerto Rico Highways & Transportation Authority, Transportation Revenue
|
BIG
|
458
|
|
0.6
|
%
|
||||
|
Bragg Communities, LLC
|
A-
|
433
|
|
0.6
|
%
|
||||
|
Metropolitan Washington Airports Authority, DC, Airport System Revenue
|
AA-
|
429
|
|
0.6
|
%
|
||||
|
Total
|
$
|
6,537
|
|
9.2
|
%
|
||||
|
(1)
|
Internal credit ratings are provided solely to indicate the underlying credit quality of guaranteed obligations based on the view of Ambac Assurance. In cases where Ambac Assurance has insured multiple tranches of an issue with varying internal ratings, or more than one obligation of an issuer with varying internal ratings, a weighted average rating is used. Ambac Assurance credit ratings are subject to revision at any time and do not constitute investment advice. Ambac Assurance, or one of its affiliates, has guaranteed the obligations listed and may also provide other products or services to the issuers of these obligations for which Ambac Assurance, or one of its affiliates, may have received premiums or fees. “BIG” denotes credits deemed below investment grade.
|
Net par related to the top ten U.S. public finance exposures
reduced
$864 million
from
December 31, 2016
. Changes in these exposure amounts will occur due to scheduled paydowns, calls and refundings executed during the period. During 2017 due to calls, California State - GO was removed from the top 10 largest U.S. public finance exposures offset by the addition of Metropolitan Washington Airports Authority.
The table below shows Ambac’s ten largest structured finance transactions, as a percentage of total financial guarantee net par outstanding at
June 30, 2017
:
|
($ in millions)
|
Bond Type
|
Ambac
Rating
(1)
|
Net Par
Outstanding
|
% of Total
Net Par
Outstanding
|
|||||||
|
Ballantyne Re Plc
(2)
|
Structured Insurance
|
BIG
|
$
|
900
|
|
1.3
|
%
|
||||
|
Wachovia Asset Securitization Issuance II, LLC 2007-HE2
(3)
|
Mortgage Backed Securities
|
BIG
|
593
|
|
0.8
|
%
|
|||||
|
Progress Energy Carolinas, Inc.
|
Investor Owned Utility
|
A-
|
558
|
|
0.8
|
%
|
|||||
|
Timberlake Financial, LLC
|
Structured Insurance
|
BBB
|
554
|
|
0.8
|
%
|
|||||
|
Wachovia Asset Securitization Issuance II, LLC 2007-HE1
(3)
|
Mortgage Backed Securities
|
BIG
|
417
|
|
0.6
|
%
|
|||||
|
CenterPoint Energy Inc.
|
Investor Owned Utility
|
BBB+
|
376
|
|
0.5
|
%
|
|||||
|
Consolidated Edison Company of New York
|
Investor Owned Utility
|
A
|
347
|
|
0.5
|
%
|
|||||
|
Option One Mortgage Loan Trust 2007-FXD1
(3)
|
Mortgage Backed Securities
|
BIG
|
299
|
|
0.4
|
%
|
|||||
|
Niagara Mohawk Power Corporation
|
Investor Owned Utility
|
A
|
257
|
|
0.4
|
%
|
|||||
|
Countrywide Asset-Backed Certificates Trust 2005-16
(3)
|
Mortgage Backed Securities
|
BIG
|
256
|
|
0.4
|
%
|
|||||
|
Total
|
$
|
4,557
|
|
6.4
|
%
|
||||||
|
(1)
|
Internal credit ratings are provided solely to indicate the underlying credit quality of guaranteed obligations based on the view of Ambac Assurance, and for Ambac UK related transactions, based on the view of Ambac UK. In cases where Ambac Assurance or Ambac UK has insured multiple tranches of an issue with varying internal ratings, or more than one obligation of an issuer with varying internal ratings, a weighted average rating is used. Ambac Assurance and Ambac UK credit ratings are subject to revision at any time and do not constitute investment advice. Ambac Assurance, or one of its affiliates, has guaranteed the obligations listed and may also provide other products or services to the issuers of these obligations for which Ambac may have received premiums or fees. “BIG” denotes credits deemed below investment grade.
|
|
(2)
|
Insurance policy issued by Ambac UK.
|
|
(3)
|
Ambac Assurance has allocated this transaction to the Segregated Account.
|
Net par related to the top ten U.S. structured finance exposures
reduced
$137 million
from
December 31, 2016
. The primary change in top U.S. structured finance exposure relates to amortization of RMBS during the
six months ended June 30, 2017
.
The table below shows our ten largest international finance transactions as a percentage of total financial guarantee net par outstanding at
June 30, 2017
. Except where noted, all international finance transactions included in the table below are insured by Ambac UK:
| Ambac Financial Group, Inc.
62
2017 Second Quarter FORM 10-Q |
|
($ in millions)
|
Country-Bond Type
|
Ambac
Rating
(1)
|
Net Par
Outstanding
|
% of Total
Net Par
Outstanding
|
|||||||
|
Mitchells & Butlers Finance plc-UK Pub Securitisation
|
UK-Asset Securitizations
|
A+
|
$
|
1,473
|
|
2.1
|
%
|
||||
|
National Grid Electricity Transmission
|
UK-Utility
|
A-
|
1,077
|
|
1.5
|
%
|
|||||
|
Aspire Defence Finance plc
|
UK-Infrastructure
|
BBB+
|
904
|
|
1.3
|
%
|
|||||
|
Capital Hospitals plc
(2)
|
UK-Infrastructure
|
A-
|
887
|
|
1.2
|
%
|
|||||
|
Posillipo Finance II S.r.l
|
Italy-Sub-Sovereign
|
BBB-
|
790
|
|
1.1
|
%
|
|||||
|
Telereal Securitisation plc
|
UK-Asset Securitizations
|
AA
|
760
|
|
1.1
|
%
|
|||||
|
Anglian Water
|
UK-Utility
|
A-
|
752
|
|
1.1
|
%
|
|||||
|
Ostregion Investmentgesellschaft NR 1 SA
(2)
|
Austria-Infrastructure
|
BIG
|
744
|
|
1.0
|
%
|
|||||
|
National Grid Gas
|
UK-Utility
|
A-
|
694
|
|
1.0
|
%
|
|||||
|
RMPA Services plc
|
UK-Infrastructure
|
BBB+
|
606
|
|
0.9
|
%
|
|||||
|
Total
|
$
|
8,687
|
|
12.2
|
%
|
||||||
|
(1)
|
Internal credit ratings are provided solely to indicate the underlying credit quality of guaranteed obligations based on the view of Ambac Assurance, and for Ambac UK related transactions, based on the view of Ambac UK. In cases where Ambac Assurance or Ambac UK has insured multiple tranches of an issue with varying internal ratings, or more than one obligation of an issuer with varying internal ratings, a weighted average rating is used. Ambac Assurance and Ambac UK credit ratings are subject to revision at any time and do not constitute investment advice. Ambac Assurance, or one of its affiliates, has guaranteed the obligations listed and may also provide other products or services to the issuers of these obligations for which Ambac may have received premiums or fees. “BIG” denotes credits deemed below investment grade.
|
|
(2)
|
A portion of this transaction is insured by an insurance policy issued by Ambac Assurance.
|
Net par related to the top ten international finance exposures
increased
$458 million
from
December 31, 2016
. International exposures are impacted by changes in foreign exchange rates, certain indexation rates and scheduled and unscheduled paydowns. As of
June 30, 2017
, there was no change in the listing of exposures included within the top ten international exposures although the exposure amounts have increased due to movements in foreign exchange rates.
The concentration of net par amongst the structured finance and international finance top ten categories noted above (as a percentage of net par outstanding) has increased since
December 31, 2016
. Given that Ambac has not written any new Financial Guarantee policies since 2008, the risk exists that the insured portfolio becomes increasingly concentrated to large and/or below investment grade exposures.
Ratings Distribution
The following tables provide a rating distribution of net par outstanding based upon internal Ambac Assurance credit ratings
(1)
and a distribution by bond type of Ambac Assurance’s below investment grade net par exposures at
June 30, 2017 and December 31, 2016
. Below investment grade is defined as those exposures with an Ambac internal credit rating below BBB-:
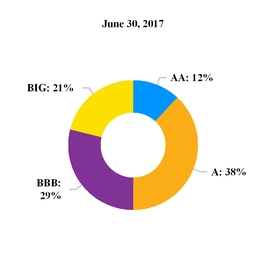
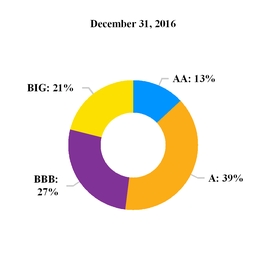
Note:
AAA is less than 1% in both periods.
|
(1)
|
Internal credit ratings are provided solely to indicate the underlying credit quality of guaranteed obligations based on the view of Ambac Assurance, and for Ambac UK related transactions, based on the view of Ambac UK. In cases where Ambac Assurance or Ambac UK has insured multiple tranches of an issue with varying internal ratings, or more than one obligation of an issuer with varying internal ratings, a weighted average rating is used. Ambac Assurance and Ambac UK credit ratings are subject to revision at any time and do not constitute investment advice.
|
| Ambac Financial Group, Inc.
63
2017 Second Quarter FORM 10-Q |
|
Summary of Below Investment Grade Exposure
Net Par Outstanding
($ in millions)
|
June 30,
2017 |
December 31,
2016 |
||||||
|
Public Finance:
|
||||||||
|
Lease and tax-backed
(1)
|
$
|
2,109
|
|
$
|
2,145
|
|
||
|
General obligation
(1)
|
765
|
|
681
|
|
||||
|
Transportation
|
397
|
|
415
|
|
||||
|
Housing
(2)
|
319
|
|
125
|
|
||||
|
Health care
|
27
|
|
29
|
|
||||
|
Other
|
192
|
|
775
|
|
||||
|
Total Public Finance
|
3,809
|
|
4,170
|
|
||||
|
Structured Finance:
|
||||||||
|
Residential mortgage-backed and home equity—first lien
|
4,736
|
|
5,163
|
|
||||
|
Residential mortgage-backed and home equity—second lien
|
3,093
|
|
3,483
|
|
||||
|
Student loans
|
962
|
|
991
|
|
||||
|
Structured Insurance
|
900
|
|
900
|
|
||||
|
Mortgage-backed and home equity—other
|
181
|
|
251
|
|
||||
|
Other
|
140
|
|
304
|
|
||||
|
Total Structured Finance
|
10,012
|
|
11,092
|
|
||||
|
International Finance:
|
||||||||
|
Other
|
1,378
|
|
1,562
|
|
||||
|
Total International Finance
|
1,378
|
|
1,562
|
|
||||
|
Total
|
$
|
15,199
|
|
$
|
16,824
|
|
||
|
(1)
|
Lease and tax-backed revenue includes
$1,871
of Puerto Rico net par at
June 30, 2017 and December 31, 2016
. General obligation includes
$187
of Puerto Rico net par at
June 30, 2017 and December 31, 2016
. Components of Puerto Rico net par outstanding includes capital appreciation bonds which are reported at the par amount at the time of issuance of the related insurance policy as opposed to the current accreted value of the bonds.
|
|
(2)
|
Includes
$319
and
$125
of military housing net par at
June 30, 2017 and December 31, 2016
.
|
The decrease in below investment grade exposures is primarily due to (i) paydowns or calls by issuers, mostly related to residential mortgage-backed securities and (ii) the net upgrade of several public finance transactions, partially offset by the downgrade of a Military Housing transaction and (iii) the upgrade of an international CDO transaction. Despite the decrease in below investment grade exposures, such exposures could increase as a relative proportion of the guarantee portfolio given that stressed borrowers generally have less ability to prepay or refinance their debt. Accordingly, due to these and other factors, it is not unreasonable to expect the proportion of below investment grade exposure in the guarantee portfolio to increase in the future.
| Ambac Financial Group, Inc.
64
2017 Second Quarter FORM 10-Q |
RESULTS OF OPERATIONS
Net
income
in the
second
quarter of
2017
was
$7 million
compared to
income
of
$59 million
in the
second
quarter of
2016
. The lower
second
quarter
2017
net
income
as compared to the
second
quarter
2016
was primarily driven by (i) loss and loss expenses as compared to a loss and loss expense benefit in the second quarter of 2016, (ii) a loss on variable interest entities compared to income in the second quarter of 2016, and (iii) a higher provision for income taxes in the second quarter of 2017, partially offset by (i) net gains on interest rate derivatives compared to losses in the second quarter of 2016, and (ii) higher investment income in the second quarter 2017.
Net
loss
for the
six months ended June 30, 2017
was
$118 million
compared to net
income
of
$68 million
for the
six months ended June 30, 2016
. The decrease was primarily driven by (i) loss and loss expenses as compared to a loss and loss expenses benefit in the
six months ended June 30, 2016
, (ii) a higher provision for income taxes, and (iii) realized investment losses compared to realized investment gains in the first half of 2016, partially offset by (i) net gains on interest rate derivatives compared to losses in the first half of 2016, (ii) higher investment income, (iii) income on variable interest entity activities, and (iv) lower insurance intangible amortization.
A summary of our financial results is shown below:
|
Three Months Ended June 30,
|
Six Months Ended June 30,
|
|||||||||||||||
|
($ in millions)
|
2017
|
2016
|
2017
|
2016
|
||||||||||||
|
Revenues:
|
||||||||||||||||
|
Net premiums earned
|
$
|
43.2
|
|
$
|
41.4
|
|
$
|
90.8
|
|
$
|
94.2
|
|
||||
|
Net investment income
|
85.2
|
|
70.8
|
|
166.7
|
|
131.6
|
|
||||||||
|
Net other-than-temporary impairment losses
|
(1.8
|
)
|
(7.4
|
)
|
(5.7
|
)
|
(16.8
|
)
|
||||||||
|
Net realized investment gains (losses)
|
4.2
|
|
14.9
|
|
(0.7
|
)
|
16.0
|
|
||||||||
|
Change in fair value of credit derivatives
|
6.6
|
|
4.0
|
|
7.7
|
|
16.8
|
|
||||||||
|
Net gains (losses) on interest rate derivatives
|
34.1
|
|
(36.3
|
)
|
32.6
|
|
(119.8
|
)
|
||||||||
|
Net realized gains (losses) on extinguishment of debt
|
2.2
|
|
3.6
|
|
4.9
|
|
4.8
|
|
||||||||
|
Other income
|
0.5
|
|
6.9
|
|
0.4
|
|
14.9
|
|
||||||||
|
Income (loss) on variable interest entities
|
(1.2
|
)
|
9.0
|
|
2.5
|
|
(18.2
|
)
|
||||||||
|
Expenses:
|
||||||||||||||||
|
Losses and loss expenses (benefit)
|
66.1
|
|
(52.5
|
)
|
201.1
|
|
(157.8
|
)
|
||||||||
|
Insurance intangible amortization
|
33.5
|
|
39.0
|
|
71.0
|
|
89.9
|
|
||||||||
|
Operating expenses
|
31.1
|
|
28.0
|
|
59.0
|
|
56.0
|
|
||||||||
|
Interest expense
|
28.2
|
|
30.7
|
|
59.8
|
|
61.1
|
|
||||||||
|
Provision for income taxes
|
6.9
|
|
3.2
|
|
26.5
|
|
6.6
|
|
||||||||
|
Net income (loss) (attributable to common shareholders)
|
$
|
7.1
|
|
$
|
58.6
|
|
$
|
(118.3
|
)
|
$
|
68.1
|
|
||||
The following paragraphs describe the consolidated results of operations of Ambac and its subsidiaries for the
three and six months ended
June 30, 2017 and 2016
, respectively.
Net Premiums Earned
.
Net premiums earned primarily represent the amortization into income of insurance premiums. We present accelerated premiums, which result from calls and other accelerations of insured obligations separate from normal net premiums earned. When an insured bond has been retired, any remaining unearned premium revenue ("UPR") is recognized at that time to the extent the financial guarantee contract is legally extinguished, causing accelerated premium revenue. For installment premium paying transactions, we offset the recognition of any remaining UPR by the reduction of the related premium receivable to zero (as it will not be collected as a result of the retirement), which may cause negative accelerated premium revenue.
Net premiums earned
increased
$1.8 million
and decreased
$3.4 million
for the
three and six months ended June 30, 2017
, respectively, compared to the same periods in the prior year. Normal net premiums earned and accelerated premiums are reconciled to total net premiums earned in the table below. The following table provides a breakdown of net premiums earned by market:
| Ambac Financial Group, Inc.
65
2017 Second Quarter FORM 10-Q |
|
Three Months Ended June 30,
|
Six Months Ended June 30,
|
|||||||||||||||
|
($ in millions)
|
2017
|
2016
|
2017
|
2016
|
||||||||||||
|
Normal Premium Earned:
|
||||||||||||||||
|
Public finance
|
$
|
17.6
|
|
$
|
21.7
|
|
$
|
36.3
|
|
$
|
43.3
|
|
||||
|
Structured finance
|
5.2
|
|
6.1
|
|
10.9
|
|
13.5
|
|
||||||||
|
International finance
|
7.2
|
|
8.5
|
|
14.1
|
|
17.3
|
|
||||||||
|
Total normal premiums earned
|
30.0
|
|
36.3
|
|
61.3
|
|
74.1
|
|
||||||||
|
Accelerated Earnings:
|
||||||||||||||||
|
Public finance
|
13.2
|
|
8.1
|
|
29.3
|
|
20.8
|
|
||||||||
|
Structured Finance
|
—
|
|
(1.2
|
)
|
0.2
|
|
3.2
|
|
||||||||
|
International finance
|
—
|
|
(1.8
|
)
|
—
|
|
(3.9
|
)
|
||||||||
|
Accelerated earnings
|
13.2
|
|
5.1
|
|
29.5
|
|
20.1
|
|
||||||||
|
Total net premiums earned
|
$
|
43.2
|
|
$
|
41.4
|
|
$
|
90.8
|
|
$
|
94.2
|
|
||||
The
decrease
in normal premiums earned in the
three and six months ended June 30, 2017
is primarily attributable to the continued runoff of the portfolio. Terminations and accelerations, including those which occurred in prior periods, result in lower normal premiums earned in current and future periods. Normal premiums are also impacted by the earnings of pre-refunded insured securities within Public Finance. Since the maturity date of pre-refunded securities is shortened (to a specified call date from its previous legal maturity), normal premiums earned will increase over the remaining period of the related policy as the existing unearned premiums will be earned in the period between the pre-refunding date and the specified call date. Structured Finance normal premiums earned were impacted by continued runoff of the portfolio, particularly within the RMBS sector. International Finance normal premiums earned were reduced in the
three and six months ended June 30, 2017
as compared to the
three and six months ended June 30, 2016
as a result of the weakening of the British Pound since the Brexit vote has impacted the translation of Ambac UK's premiums earned.
The
increase
in accelerated earnings in the
three and six months ended June 30, 2017
is primarily attributed to an increased volume of public finance calls. The increase in structured finance accelerated earnings in the
three months ended June 30, 2017
is due to the termination of certain investor-owned utility transactions during the
three months ended June 30, 2016
which resulted in negative accelerated earnings. The decrease in structured finance accelerated earnings in the
six months ended June 30, 2017
was due to refinancing of certain student loan installment premium transactions during
six months ended June 30, 2016
partially offset by the negative acceleration impact of the termination of certain investor-owned utility transactions. The increase in international finance accelerated earnings in the
three months ended June 30, 2017
is due to a termination of a certain asset backed installment premium transaction during the
three months ended June 30, 2016
, which resulted in negative accelerated earnings. The increase in international finance accelerated earnings in the
six months ended June 30, 2017
is due to a termination of a certain structured insurance transaction in addition to the termination of certain asset backed installment transactions during the
six months ended June 30, 2016
, which resulted in negative accelerated earnings.
Net Investment Income.
Net investment income
increased
$14.4 million
and
$35.1 million
for the
three and six months ended June 30, 2017
compared to the same periods in the prior year. The
increase
s for the three and six months ended June 30, 2017 was due to growth in the size of the portfolio and higher average returns compared to the prior year periods. The larger portfolio primarily resulted from the receipt of $995 million in January 2016 in connection with a representation and warranty settlement. Higher average returns for the 2017 periods reflect higher long-term portfolio allocations in Ambac insured securities and high income investment funds classified as trading.
Net Other-Than-Temporary Impairment Losses.
Net other-than-temporary impairment losses recorded in earnings include only credit related impairment amounts to the extent management does not intend to sell and it is not more likely than not that the Company will be required to sell before recovery of the amortized cost basis. Non-credit related impairment amounts are recorded in other comprehensive income. Alternatively, non-credit related impairment is reported through earnings as part of net other-than-temporary impairment losses if management intends to sell securities or it is more likely than not that the Company will be required to sell before recovery of amortized cost less any current period credit impairment.
Net other-than-temporary impairments for the three months ended June 30, 2017 related to management's intent to sell certain securities. For the six months ended June 30, 2017 and the
three and six months ended June 30, 2016
, net other-than-temporary impairments resulted primarily from credit losses on certain Ambac insured securities stemming from cash flow timing and also included some other-than-temporary impairments related to management's intent to sell certain securities.
| Ambac Financial Group, Inc.
66
2017 Second Quarter FORM 10-Q |
Net Realized Investment Gains (Losses).
The following table provides a breakdown of net realized gains (losses) for the periods presented:
|
Three Months Ended June 30,
|
Six Months Ended June 30,
|
|||||||||||||||
|
($ in millions)
|
2017
|
2016
|
2017
|
2016
|
||||||||||||
|
Net (losses) on securities sold or called
|
$
|
6.5
|
|
$
|
4.0
|
|
$
|
(0.3
|
)
|
$
|
2.4
|
|
||||
|
Net foreign exchange gains
|
(2.3
|
)
|
10.9
|
|
(0.4
|
)
|
13.6
|
|
||||||||
|
Total net realized gains (losses)
|
$
|
4.2
|
|
$
|
14.9
|
|
$
|
(0.7
|
)
|
$
|
16.0
|
|
||||
Change in Fair Value of Credit Derivatives.
The valuation of credit derivative liabilities is impacted by the market’s view of Ambac Assurance’s credit quality. We reflect Ambac’s own credit quality in the fair value of such liabilities by including a credit valuation adjustment (“CVA”) in the determination of fair value. The gain from change in fair value of credit derivatives for the
three and six months ended June 30, 2017
was
$6.6 million
and
$7.7 million
, as compared to the gain of
$4.0 million
and
$16.8 million
for the
three and six months ended June 30, 2016
. The gains for
three and six months ended June 30, 2017
were primarily due to the termination of a credit derivative. The gains for the
three and six months ended June 30, 2016
were primarily due to improved reference obligation pricing on certain transactions and a stronger credit assessment of one transaction within the portfolio, partially offset by the impact of incorporating Ambac's CVA and foreign exchange rates.
Realized gains and other settlements on credit derivative contracts represent premiums received and accrued on such contracts. Realized gains and other settlements were
$1.1 million
and
$1.3 million
for the
three and six months ended June 30, 2017
and
$0.2 million
and
$0.5 million
three and six months ended June 30, 2016
, respectively. The gains for
three and six months ended June 30, 2017
were higher than the comparable 2016 periods, due to recognition of a make-whole premium associated to the termination of a credit derivative, partially offset by the impact of continued runoff of the portfolio. There were no loss or settlement payments in the periods presented.
Unrealized gains (losses) on credit derivative contract reflect the impact of all other factors on the overall change in fair value of credit derivatives noted above.
See
Note 9. Fair Value Measurements
to the Consolidated Financial Statements included in Part II, Item 8 in the Company's Form 10-K for the year ended
December 31, 2016
, for a further description of Ambac’s methodology for determining the fair value of credit derivatives. The table below indicates the impact of incorporating Ambac’s own credit risk into the fair value of credit derivatives as of
June 30, 2017 and December 31, 2016
:
|
($ in millions)
|
June 30,
2017 |
December 31,
2016 |
|||||
|
Mark-to-market liability of credit derivatives, excluding CVA
|
$
|
10.4
|
|
$
|
17.2
|
|
|
|
CVA on credit derivatives
|
(1.4
|
)
|
(1.9
|
)
|
|||
|
Net credit derivative liability at fair value
|
$
|
9.0
|
|
$
|
15.3
|
|
|
Net Gain (Loss) on Interest Rate Derivatives.
The interest rate derivatives portfolio is positioned to benefit from rising rates as an economic hedge against interest rate exposure in the financial guarantee portfolio. Results in Net gain (loss) on interest rate derivatives generally reflect mark-to-market gains (losses) in the portfolio caused by increases (declines) in forward interest rates during the periods, the carrying cost of the net liability position of the portfolio and the impact of the Ambac CVA and counterparty credit adjustments as discussed below.
Net gain (loss) on interest rate derivatives for the
three and six months ended June 30, 2017
were
$34.1 million
and
$32.6 million
compared to
($36.3) million
and
($119.8) million
for the
three and six months ended June 30, 2016
. The net gain for the
three and six months ended June 30, 2017
was primarily driven by the commutation of interest rate swaps with a structured finance vehicle counterparty (the "Augusta swaps"). The net gains on these swaps for the three and six months ended June 30, 2017 were $43.4 million and $42.2 million, respectively. Refer to
Note 1. Background and Business Description
to the Consolidated Financial Statements, included in Part I, Item 1 in this Form 10-Q for further information related to the Augusta swaps settlement. Excluding the gains on Augusta swaps, the remaining net losses of ($9.4) million and ($9.6) million for the three and six months ended June 30, 2017 resulted from declines in forward interest rates and carrying cost. This compares to higher net losses for the
three and six months ended June 30, 2016
, caused by significant declines in interest rates during the first half of 2016.
The fair value of derivatives include valuation adjustments to reflect Ambac’s own credit risk and counterparty credit risk when appropriate. Within the interest rate derivatives portfolio, an Ambac CVA is generally applicable for uncollateralized derivative liabilities that may not be offset by derivative assets under a master netting agreement. For the periods presented, an Ambac CVA was applicable only to the Augusta swaps that were terminated in June 2017 as discussed above. Reversal of the Ambac CVA due to the Augusta commutation resulted in losses within Net gain (loss) on interest rate derivatives of $42.9 million and $44.9 million for the
three and six months ended June 30, 2017
. Inclusion of an Ambac CVA resulted in gains within Net gain (loss) on interest rate derivatives of $6.8 million and $10.6 million for the
three and six months ended June 30, 2016
.
Counterparty credit adjustments are generally applicable for uncollateralized derivative assets that may not be offset by derivative liabilities under a master netting agreement. Inclusion of counterparty credit adjustments in the valuation of interest rate derivatives resulted in gains (losses) within Net gain (loss) on interest rate derivatives of $0.4 million and $2.0 million for the
three and six months ended June 30, 2017
, compared to $(4.6) million and $(8.8) million for the
three and six months ended June 30, 2016
.
The table below indicates the impact of incorporating Ambac’s own credit risk into the fair value of the interest rate derivatives portfolio (excluding credit derivatives) as of
June 30, 2017 and December 31, 2016
:
| Ambac Financial Group, Inc.
67
2017 Second Quarter FORM 10-Q |
|
($ in millions)
|
June 30,
2017 |
December 31,
2016 |
|||||
|
Interest rate derivatives mark-to-market liability, excluding CVA
(1)
|
$
|
3.5
|
|
$
|
271.1
|
|
|
|
CVA on interest rate derivatives portfolio
|
—
|
|
(44.9
|
)
|
|||
|
Net interest rate derivatives portfolio liability at fair value
|
$
|
3.5
|
|
$
|
226.2
|
|
|
|
(1)
|
Concurrent with rule changes effective January 3, 2017 that govern the character of variation payments on Ambac's centrally cleared interest rate swaps, variation margin in the amount of $71 million was reclassified as a reduction to derivative liabilities. Refer to Note 9. Derivative Instruments to the Unaudited Consolidated Financial Statements included in Part I, Item 1 in this Form 10-Q for further information.
|
Net Realized Gains (Losses) on Extinguishment of Debt.
Net realized gains on extinguishment of debt was
$2.2 million
and
$4.9 million
for the
three and six months ended June 30, 2017
, compared to gains of
$3.6 million
and
$4.8 million
for the
three and six months ended June 30, 2016
. The gains for both the
three and six months ended June 30, 2017
and the
three and six months ended June 30, 2016
included gains from the settlements of repurchased surplus notes below their carrying values and gains from the settlements of certain residual obligations related to previously called surplus notes.
Other Income
.
The below table summarizes other income for the presented periods:
|
Three Months Ended June 30,
|
Six Months Ended June 30,
|
|||||||||||||||
|
($ in millions)
|
2017
|
2016
|
2017
|
2016
|
||||||||||||
|
Foreign exchange gain/(loss)
|
$
|
(0.9
|
)
|
$
|
3.9
|
|
$
|
(1.5
|
)
|
$
|
6.0
|
|
||||
|
Other
|
1.4
|
|
3.0
|
|
1.9
|
|
8.9
|
|
||||||||
|
Total other income (loss)
|
$
|
0.5
|
|
$
|
6.9
|
|
$
|
0.4
|
|
$
|
14.9
|
|
||||
Foreign exchange gains/(losses) include gains/(losses) relating to foreign currency changes on the present value of premium receivables denominated in a subsidiary's non-functional currency in addition to foreign exchange gains/(losses) on cash. Other includes various fees, primarily consent and waiver fees and in 2016, insurance recoveries on a partially cancelled asset-backed transaction which is consolidated as a VIE.
Income (loss) on Variable Interest Entities
.
Included within Income (loss) on variable interest entities are income statement amounts relating to VIEs consolidated under the Consolidation Topic of the ASC as a result of Ambac's variable interest arising from financial guarantees written by Ambac's subsidiaries, including gains or losses attributable to consolidating or deconsolidating VIEs during the periods reported. Generally, the Company’s consolidated VIEs are entities for which Ambac has provided financial guarantees on all of or a portion of its assets or liabilities. In consolidation, assets and liabilities of the VIEs are reported at fair value and the related insurance assets and liabilities are eliminated. However, the amount of VIE net assets (liabilities) that remain in consolidation generally result from the net positive (negative) present value of projected cash flows from (to) the VIEs which are attributable to Ambac’s insurance subsidiaries in the form of financial guarantee insurance premiums, fees and losses. In the case of VIEs with net negative projected cash flows, the net liability is generally to be funded by Ambac’s insurance subsidiaries through insurance claim payments. Differences between the net carrying value of the insurance accounts under the Financial Services—Insurance Topic of the ASC and the carrying value of the consolidated VIE’s net assets or liabilities are recorded through income at the time of consolidation or deconsolidation.
Income (loss) on variable interest entities was
$(1.2) million
and
$2.5 million
, respectively, for the
three and six months ended June 30, 2017
, compared to income (loss) of
$9.0 million
and
($18.2) million
, respectively, for the
three and six months ended June 30, 2016
. Loss on variable interest entities for the
three months ended June 30, 2017
included lower net asset values on certain VIEs reflecting higher estimated fair values on Ambac-insured long-term debt. Income on variable interest entities for the
six months ended June 30, 2017
included higher net asset values on most VIEs reflecting lower market interest rates. Income (loss) on variable interest entities for the
three and six months ended June 30, 2016
included higher net asset values on most VIEs reflecting lower market interest rates. For the
six months ended June 30, 2016
, these gains were more than offset by increases in the fair value of certain VIE long-term debt obligations that include significant projected financial guarantee claims. The fair value of VIE liabilities that include significant projected financial guarantee claims increase (decrease), resulting in mark-to-market losses (gains), as the market's perception of Ambac Assurance's credit quality improves (declines). Refer to
Note 3. Special Purpose Entities, Including Variable Interest Entities
to the Unaudited Consolidated Financial Statements included in Part I, Item 1 in this Form 10-Q for further information on the accounting for VIEs.
Losses and Loss Expenses.
Losses and loss expenses are based upon estimates of the aggregate losses inherent in the non-derivative financial guarantee portfolio for insurance policies issued to beneficiaries, including unconsolidated VIEs. Losses and loss expenses include interest on Deferred Amounts pursuant to the amended Segregated Account Rehabilitation Plan, which became effective June 12, 2014.
Ambac records as a component of its loss reserve estimate subrogation recoveries related to securitized loans in RMBS transactions with respect to which Ambac Assurance is pursuing claims for breaches of R&Ws. Ambac does not include potential recoveries attributed solely to fraudulent inducement claims in our litigations in our estimate of subrogation recoveries. Generally, the sponsor of an RMBS transaction provided R&Ws with respect to the securitized loans, including representations with respect to the loan characteristics, the absence of borrower fraud in the underlying loan pools or other misconduct in the origination process and attesting to the compliance of loans with the prevailing underwriting
| Ambac Financial Group, Inc.
68
2017 Second Quarter FORM 10-Q |
policies. Ambac has recorded R&W subrogation recoveries, net of reinsurance, of approximately
$1.9 billion
at
June 30, 2017 and December 31, 2016
. Refer to
Note 2. Basis of Presentation and Significant Accounting Policies
to the Consolidated Financial Statements included in Part II, Item 8 in the Company’s Annual Report on Form 10-K for the year ended
December 31, 2016
for more information regarding the estimation process for R&W subrogation recoveries.
Losses and loss expenses for the
three and six months ended June 30, 2017
were
a loss
of
$66.1 million
and
$201.1 million
, respectively, as compared to
a benefit
for the
three and six months ended June 30, 2016
of
$52.5 million
and
$157.8 million
, respectively. The following provides details, by bond type, for losses and loss expenses (benefit) incurred for the periods presented:
|
Three Months Ended June 30,
|
Six Months Ended June 30,
|
|||||||||||||||
|
($ in millions)
|
2017
|
2016
|
2017
|
2016
|
||||||||||||
|
RMBS
(1)
|
$
|
(15.9
|
)
|
$
|
(164.1
|
)
|
$
|
(24.6
|
)
|
$
|
(314.4
|
)
|
||||
|
Domestic Public Finance
|
52.3
|
|
16.4
|
|
221.6
|
|
71.6
|
|
||||||||
|
Student Loans
|
20.3
|
|
(11.3
|
)
|
22.6
|
|
(88.7
|
)
|
||||||||
|
Ambac UK
|
(34.5
|
)
|
61.6
|
|
(108.3
|
)
|
88.2
|
|
||||||||
|
All other credits
|
0.1
|
|
2.8
|
|
2.3
|
|
1.6
|
|
||||||||
|
Interest on Deferred Amounts
|
43.8
|
|
42.1
|
|
87.5
|
|
83.9
|
|
||||||||
|
Totals
(2)
|
$
|
66.1
|
|
$
|
(52.5
|
)
|
$
|
201.1
|
|
$
|
(157.8
|
)
|
||||
|
(1)
|
Ambac records the impact of estimated recoveries related to securitized loans in RMBS transactions that breached certain R&Ws within losses and loss expenses (benefit). The losses and loss expense (benefit) associated with changes in estimated representation and warranties was $8.4 and $22.2 for the
three and six months ended June 30, 2017
, respectively, and ($28.3) and ($48.6) for the
three and six months ended June 30, 2016
, respectively.
|
|
(2)
|
Includes loss expenses incurred of $15.8 and $34.1 for the
three and six months ended June 30, 2017
, respectively, and $18.1 and $19.8 for the
three and six months ended June 30, 2016
, respectively.
|
Losses and loss expenses (benefit) for the
three and six months ended June 30, 2017
were driven by the following:
|
•
|
Higher projected losses in domestic public finance largely driven by negative development on insured Puerto Rico bonds for the
three and six months ended June 30, 2017
. In addition, the three months ended June 30, 2017 saw negative development in the Military Housing sector;
|
|
•
|
Interest on deferred amounts; partially offset by
|
|
•
|
Lower projected losses in the Ambac UK portfolio for the
three and six months ended June 30, 2017
from activities executed by the Ballantyne trust that indirectly reduced future expected claims on the Ambac insured notes. Lower projected losses for the six months ended June 30, 2017 in the Ambac UK portfolio primarily is due to the confidential settlement of litigation brought by Ambac UK in the name of Ballantyne against JPMIM;
|
|
•
|
A portion of Ambac UK's loss reserves are denominated in currencies other than their functional currency of British Pounds resulting in incurred losses (gains) when the British Pound depreciates (appreciates). Ambac recognized $11.8 million and $17.6 million in foreign exchange gains for the
three and six months ended June 30, 2017
, respectively.
|
Losses and loss expenses (benefit) for the
three and six months ended June 30, 2016
were driven by the following:
|
•
|
Lower projected losses in the RMBS portfolio due to lower interest rates, improved deal performance, higher representation and warranty subrogation recoveries and a second quarter settlement of a non-representation and warranty dispute with regards to an Ambac insured RMBS transaction;
|
|
•
|
The positive impact of executed commutations on student loan policies; partially offset by
|
|
•
|
Higher projected losses in domestic public finance largely driven by negative development on insured Puerto Rico bonds;
|
|
•
|
Interest on deferred amounts;
|
|
•
|
Increased projected losses in the Ambac UK portfolio due to an increase in interest rates and foreign exchange losses of $38.2 million and $48.3 million for the
three and six months ended June 30, 2016
, respectively.
|
| Ambac Financial Group, Inc.
69
2017 Second Quarter FORM 10-Q |
The following table provides details of net claims recorded, net of reinsurance for the affected periods:
|
Three Months Ended June 30,
|
Six Months Ended June 30,
|
|||||||||||||||
|
($ in millions)
|
2017
|
2016
|
2017
|
2016
|
||||||||||||
|
Claims recorded
(1) (2)
|
$
|
48.7
|
|
$
|
82.5
|
|
$
|
110.4
|
|
$
|
231.4
|
|
||||
|
Subrogation received
(3)
|
(53.1
|
)
|
(173.4
|
)
|
(118.3
|
)
|
(1,228.1
|
)
|
||||||||
|
Net Claims Recorded
|
$
|
(4.4
|
)
|
$
|
(90.9
|
)
|
$
|
(7.9
|
)
|
$
|
(996.7
|
)
|
||||
|
(1)
|
Claims recorded include (i) claims paid, including commutation payments and (ii) changes to claims presented and not yet presented through the balance sheet date for policies which were allocated to the Segregated Account. Item (ii) includes permitted policy claims for policies allocated to the Segregated Account that were presented and approved by the Rehabilitator of the Segregated Account but not paid through to the balance sheet date in accordance with the amended Segregated Account Rehabilitation Plan and associated rules and guidelines. Amounts recorded for claims not yet presented and/or permitted are based on management’s judgment. Claims recorded exclude interest accrued on Deferred Amounts.
|
|
(2)
|
Claims recorded includes claims paid (including commutation payments) of $37.5 and $105.1 for the
three and six months ended June 30, 2017
, respectively, and $63.7 and $196.4 for the
three and six months ended June 30, 2016
.
|
|
(3)
|
Subrogation received for the
three and six months ended June 30, 2016
includes $99.1 million ($100.3 million gross of reinsurance) related to the Countrywide Investor Settlement. Additionally, the
six months ended June 30, 2016
includes $992.8 million ($995 million gross of reinsurance) received from the settlement of representation and warranty related litigation with JP Morgan.
|
Operating Expenses.
Operating expenses consist of gross operating expenses plus reinsurance commissions. The following table provides details of operating expenses for the periods presented:
|
Three Months Ended June 30,
|
Six Months Ended June 30,
|
|||||||||||||||
|
($ in millions)
|
2017
|
2016
|
2017
|
2016
|
||||||||||||
|
Compensation
|
$
|
12.1
|
|
$
|
16.4
|
|
$
|
24.9
|
|
$
|
31.9
|
|
||||
|
Non-compensation
|
19.0
|
|
11.4
|
|
33.8
|
|
23.0
|
|
||||||||
|
Gross operating expenses
|
31.1
|
|
27.8
|
|
58.7
|
|
54.8
|
|
||||||||
|
Reinsurance commissions, net
|
—
|
|
0.2
|
|
0.3
|
|
1.2
|
|
||||||||
|
Total operating expenses
|
$
|
31.1
|
|
$
|
28.0
|
|
$
|
59.0
|
|
$
|
56.0
|
|
||||
Gross operating expenses for the
three months ended June 30, 2017
were $31.1 million, an increase of $3.3 million from the
three months ended June 30, 2016
. The increase was due to the following:
|
•
|
Higher non-compensation costs primarily due to (i) $8.4 million of incremental legal, consulting and advisory fees in connection with the plan of exit from Rehabilitation by the Segregated Account, (ii) $1.1 million of incremental OCI legal, consulting and advisory fees primarily in connection with the plan of exit from Rehabilitation by the Segregated Account, partially offset by
|
|
•
|
Costs associated with stockholder activism of $2.6 million in the
three months ended June 30, 2016
, and
|
|
•
|
Lower compensation costs primarily related to reduced salaries, bonuses and post-employment costs as a result of reductions in headcount during 2016.
|
Gross operating expenses for the
six months ended June 30, 2017
are $58.7 million, an increase of $3.9 million from the
six months ended June 30, 2016
. The increase was due to the following:
|
•
|
Higher non-compensation costs primarily due to (i) $11.0 million of incremental legal, consulting and advisory fees in connection with the plan of exit from Rehabilitation by the Segregated Account, (ii) $2.1 million of incremental OCI legal, consulting and advisory fees primarily in connection with the plan of exit from Rehabilitation by the Segregated Account and (iii) a $1.5 million increase of litigation contingencies, partially offset by
|
|
•
|
Costs associated with stockholder activism of $5.7 million in the
six months ended June 30, 2016
, and
|
|
•
|
Lower compensation costs primarily related to reduced salaries, bonuses, severance and post-employment costs as a result of reductions in headcount during 2016. Additionally, for 2017 a larger employee population is receiving a portion of their short-term incentive compensation in the form of equity in lieu of a cash bonus. Equity grants will be expensed when they are granted in 2018.
|
As a consequence of the Segregated Account Rehabilitation Proceedings, the Rehabilitator retains operational control and decision-making authority with respect to all matters related to the Segregated Account, including the hiring of advisers. Legal and consulting services provided for the benefit of OCI amounted to
$2.3 million
and
$4.6 million
during the
three and six months ended June 30, 2017
, respectively, compared to
$1.2 million
and
$2.5 million
for the
three and six months ended June 30, 2016
, respectively.
| Ambac Financial Group, Inc.
70
2017 Second Quarter FORM 10-Q |
Interest Expense.
Interest expense includes accrued interest on investment agreements (repaid in the first quarter of 2017), secured borrowing notes outstanding and surplus notes issued by Ambac Assurance and the Segregated Account. Additionally, interest expense includes discount accretion on surplus notes as their carrying value is at a discount to par.
The following table provides details by type of obligation for the periods presented:
|
Three Months Ended June 30,
|
Six Months Ended June 30,
|
|||||||||||||||
|
($ in millions)
|
2017
|
2016
|
2017
|
2016
|
||||||||||||
|
Surplus notes
|
$
|
27.1
|
|
$
|
29.2
|
|
$
|
57.4
|
|
$
|
58.1
|
|
||||
|
Investment agreements
|
—
|
|
0.2
|
|
0.2
|
|
0.3
|
|
||||||||
|
Secured borrowing
|
1.1
|
|
1.3
|
|
2.2
|
|
2.7
|
|
||||||||
|
Total interest expense
|
$
|
28.2
|
|
$
|
30.7
|
|
$
|
59.8
|
|
$
|
61.1
|
|
||||
The decrease in interest expense on surplus notes for the
three and six months ended June 30, 2017
compared to the
three and six months ended June 30, 2016
primarily results from the impact of repurchases of surplus notes during the
three and six months ended June 30, 2017
and reduced debt balances resulting from amortization of the secured borrowing notes outstanding. The decrease in interest expense was partially offset by the impact of applying the level yield method as the discount to the face value of the surplus note accretes over time.
Surplus note principal and interest payments require the approval of OCI. Annually from 2011 through 2017, OCI issued its disapproval of the requests of Ambac Assurance and the Rehabilitator of the Segregated Account, acting for and on behalf of the Segregated Account, to pay interest on outstanding surplus notes issued by Ambac and the Segregated Account on the annual scheduled interest payment date of June 7th. Neither Ambac Assurance nor the Rehabilitator of the Segregated Account, acting for and on behalf of the Segregated Account, have requested to pay interest on any junior surplus notes since their issuance. The interest on the outstanding surplus notes and junior surplus notes were accrued for and Ambac is accruing interest on the interest amounts following each scheduled interest payment date. Total accrued and unpaid interest for surplus notes and junior surplus notes outstanding to third parties were
$318.0 million
and
$88.6 million
, respectively, at
June 30, 2017
.
Provision for Income Taxes
.
The provision for income taxes for the
three and six months ended June 30, 2017
, was
$6.9 million
and
$26.5 million
,
an increase
of
$3.7 million
and
an increase
of
$19.9 million
compared to the provision for income taxes reported for
three and six months ended June 30, 2016
. The increase for the
three and six months ended June 30, 2017
was primarily due to a provision for Ambac UK taxes of
$6.6 million
and
$25.8 million
for the
three and six months ended June 30, 2017
compared to the provision for Ambac UK income taxes for
three and six months ended June 30, 2016
of
$3.0 million
and
$6.4 million
, which was driven primarily by the Ballantyne litigation settlement, partly offset with the utilization of Ambac UK's remaining NOL during
three and six months ended June 30, 2016
.
At
June 30, 2017
the Company had
$4.0 billion
of loss carryforwards consisting of
$3.9 billion
of U.S. Federal net ordinary operating loss carryforwards (
$1.4 billion
at Ambac Financial Group and
$2.5 billion
at Ambac Assurance) and
$87.2 million
of capital loss carryforwards at Ambac Assurance.
LIQUIDITY AND CAPITAL RESOURCES
Ambac Financial Group, Inc. Liquidity
.
Ambac’s liquidity is dependent on its cash and liquid investments of
$139 million
as of
June 30, 2017
and expense sharing and other arrangements with Ambac Assurance. Ambac also has investments of
$207 million
in Ambac Assurance insured RMBS and surplus notes issued by Ambac Assurance and the Segregated Account, which, while less liquid than other investments, can be sold. Ambac also owns a subordinated owner trust certificate (the “Owner Trust Certificate”) that it received as part of a 2014 transaction whereby Ambac deposited
$350 million
face amount of a junior surplus note issued to it by the Segregated Account, plus accrued but unpaid interest thereon, into a statutory trust (the "Trust") in exchange for net proceeds of
$224 million
and the Owner Trust Certificate in the face amount of
$75 million
(current carrying value of
$32.4 million
). The Trust funded the cash portion of its purchase of the junior surplus note with proceeds of the private placement of
$299.2 million
face amount of senior secured notes (the "Notes") to third party investors. The Notes have a final maturity of August 28, 2039. Interest on the Notes accrues at 5.1% per annum and compounds annually on June 7th of each year up to and including the maturity date. Payments on the Notes will be made when and to the extent that the Segregated Account makes payments on the junior surplus note. The Notes must be paid in full before any payments will be made on the Owner Trust Certificate. The Notes and Owner Trust Certificate are non-recourse to Ambac, Ambac Assurance and the Segregated Account, but are collateralized by the junior surplus note. It is uncertain whether and to what extent Ambac will realize value from the Owner Trust Certificate.
Pursuant to the Mediation Agreement, Amended TSA and Cost Allocation Agreement (as each such term is defined in
Note 1. Background and Business Description
to the Consolidated Financial Statements included in Part II, Item 8 in the Company's Annual Report on Form 10-K for the year ended
December 31, 2016
), Ambac Assurance is required, under certain circumstances, to make payments to Ambac with respect to the utilization of net operating loss carry-forwards (“NOLs”) and to reimburse certain operating costs and expenses. Ambac received
$100.1 million
of tolling payments based on NOLs used by Ambac Assurance through December 31, 2016. For the
six months ended June 30, 2017
, Ambac Assurance has generated a taxable
income
of
$18.6 million
, which generates additional accrued Tolling Payments of
$2,605
and, assuming Ambac Assurance's cumulative full year taxable income does not change, will be paid in 2018.
| Ambac Financial Group, Inc.
71
2017 Second Quarter FORM 10-Q |
It is highly unlikely that Ambac Assurance will be able to make dividend payments to Ambac for the foreseeable future and, therefore, cash and investments, payments under the Cost Allocation Agreement and future NOL tolling payments, if any, will be Ambac’s principal source of liquidity in the near term. Refer to Part I, Item 1, “Insurance Regulatory Matters - Dividend Restrictions, Including Contractual Restrictions” and
Note 9. Insurance Regulatory Restrictions
to the Consolidated Financial Statements included in Part II, Item 8, in the Company’s Annual Report on Form 10-K for the year ended
December 31, 2016
for more information on dividend payment restrictions. The principal use of liquidity is the payment of operating expenses, including costs to explore opportunities to grow and diversify Ambac, and the making of investments including securities issued or insured by Ambac Assurance and the Segregated Account. Securities issued or insured by Ambac Assurance and the Segregated Account are generally less liquid that investment grade and other traded investments. Contingencies could cause material liquidity strains.
Ambac Assurance Liquidity
.
Ambac Assurance’s liquidity is dependent on the balance of liquid investments and, over time, the net impact of sources and uses of funds. The principal sources of Ambac Assurance’s liquidity are gross installment premiums on insurance and credit default swap contracts, principal and interest payments from investments, sales of investments, proceeds from repayment of affiliate loans, recoveries on claim payments and reinsurance recoveries. Termination of installment premium policies on an accelerated basis may adversely impact Ambac Assurance’s liquidity. The principal uses of Ambac Assurance’s liquidity are the payment of operating expenses; claim, commutation and related expense payments on both insurance and credit derivative contracts; ceded reinsurance premiums; surplus note principal and interest payments (if approved by OCI); additional loans to affiliates and tax payments to Ambac, including tolling payments due under the Amended TSA. Interest and principal payments on surplus notes are subject to the approval of OCI, which has full discretion over payments regardless of the liquidity position of Ambac Assurance. The level of claims paid by the Segregated Account is subject to the sole discretion of the Rehabilitator, subject to any required approval of the Rehabilitation Court.
Ambac Assurance manages its liquidity risk by maintaining comprehensive analyses of projected cash flows and maintaining specified levels of cash and short-term investments at all times.
Pursuant to the injunctions issued by the Rehabilitation Court, claims on policies allocated to the Segregated Account are not permitted to be paid during the Segregated Account Rehabilitation Proceedings until approved by the Rehabilitator. As described in
Note 1. Background and Business Description
to the Consolidated Financial Statements included in Part II, Item 8 in in the Company’s Annual Report on Form 10-K for the year ended
December 31, 2016
, the Segregated Account is, and was, obliged to make Interim Payments of 45% of each permitted policy claim to be paid on or after July 21, 2014 in accordance with the amended Segregated Account Rehabilitation Plan and associated rules and guidelines.
In addition, as described in Note 1. Background and Business Description to the Consolidated Financial Statements included in Part II, Item 8 in the Company’s Annual Report on Form 10-K for the year ended
December 31, 2016
,
|
•
|
the Rehabilitator has sought and received approval from the Rehabilitation Court to make Supplemental Payments and Special Policy Payments with respect to certain insured securities. The Segregated Account made, in aggregate, Supplemental Payments and Special Policy Payments in respect of permitted policy claims of $10.2 million and $36.4 million during the
three and six months ended June 30, 2017
, respectively and $23.1 million and $40.5 million during the
three and six months ended June 30, 2016
, respectively.
|
|
•
|
under the Segregated Account Rehabilitation Plan the unpaid balance of permitted policy claims ("Deferred Amounts") will accrue interest until such outstanding policy obligations are paid in full. Interest on the Deferred Amounts will accrue generally at an effective rate of 5.1%, compounded annually. The Segregated Account is responsible for unpaid accrued interest of $749.4 million through
June 30, 2017
.
|
On July 19, 2017, Ambac Assurance and Ambac entered into the Rehabilitation Exit Support Agreement with the Supporting Holders of surplus notes issued by Ambac Assurance and beneficial interests in Deferred Amounts of the Segregated Account with respect to a transaction which, subject to the conditions precedent set forth in the Rehabilitation Exit Support Agreement, and if consummated, would involve the Rehabilitation Exit Transactions. The exit of the Segregated Account from rehabilitation is subject to certain conditions, including approval by the Rehabilitation Court, and no assurance can be given that Ambac will ultimately be successful in meeting such conditions. The expected cash outflow from the Rehabilitation Exit Transactions, if executed, is currently estimated at approximately $1.3 billion. See
Note 1. Background and Business Description
for details regarding the Rehabilitation Exit Support Agreement, the Rehabilitation Exit Transactions, and the risks associated with the Rehabilitation Exit Transactions. (See also
Part II, Item 1A. Risk Factors.
)
Ambac Assurance is limited in its ability to pay dividends pursuant to the terms of its Auction Market Preferred Shares (“AMPS”), which state that dividends may not be paid on the common stock of Ambac Assurance unless all accrued and unpaid dividends on the AMPS for the then current dividend period have been paid, provided that dividends on the common stock may be made at all times for the purpose of, and only in such amounts as are necessary for enabling Ambac (i) to service its indebtedness for borrowed money as such payments become due or (ii) to pay its operating expenses. If dividends are paid on the common stock for such purposes, dividends on the AMPS become cumulative until the date that all accumulated and unpaid dividends have been paid on the AMPS. Ambac Assurance has not paid dividends on the AMPS since 2010. Refer to Part I, Item 1,
“Insurance Regulatory Matters - Dividend Restrictions, Including Contractual Restrictions”
and
Note 9. Insurance Regulatory Restrictions
to the Consolidated Financial Statements included in Part II, Item 8, in the Company’s Annual Report on Form 10-K for the year ended
December 31, 2016
for more information on dividend payment restrictions.
| Ambac Financial Group, Inc.
72
2017 Second Quarter FORM 10-Q |
During the
three and six months ended June 30, 2017
, Ambac Assurance received total subrogation of $53.1 million and $118.3 million, net of reinsurance, primarily related to RMBS. During the
three and six months ended June 30, 2016
, Ambac Assurance received total subrogation of $173.4 million and $1,228.1 million, respectively, net of reinsurance, of which $99.1 million ($100.3 million gross of reinsurance) of subrogation recoveries during the
three and six months ended June 30, 2016
related to the Countrywide Investor Settlement. Additionally, the
six months ended June 30, 2016
includes the representation and warranty receipt from JP Morgan of $992.8 million ($995.0 million gross of reinsurance).
Our ability to realize R&W subrogation recoveries is subject to significant uncertainty, including risks inherent in litigation, collectability of such amounts from counterparties (and/or their respective parents and affiliates), rising interest rates, timing of receipt of any such recoveries, intervention by the Rehabilitator or OCI which could impede our ability to take actions required to realize such recoveries and uncertainty inherent in the assumptions used in estimating such recoveries. The amount of these subrogation recoveries is significant and if we are unable to recover any amounts, our future available liquidity to pay claims would be reduced materially.
A wholly-owned subsidiary of Ambac Assurance is a party to credit default swaps (“CDS”) with various commercial counterparties. Ambac Assurance guarantees its subsidiary’s payment obligations under such CDS. The terms of such CDS include events of default or termination events based on the occurrence of certain events, or the existence of certain circumstances, relating to the financial condition of Ambac Assurance, including the commencement of an insolvency, rehabilitation or like proceeding. If such an event of default or termination event were to occur, the CDS counterparties could claim the contractual right to terminate the CDS and require Ambac Assurance, as financial guarantor, to make termination payments. Ambac Assurance estimates that such potential termination payments amount to $27.3 million as of
June 30, 2017
. However, the Rehabilitation Court has issued an injunction barring the early termination of contracts based on the occurrence of events or the existence of circumstances like those described above. As a result, Ambac Assurance does not expect to make early termination payments in respect of CDS where such amounts are claimed based on the occurrence of events, or the existence of circumstances, relating to the financial condition of Ambac Assurance.
Ambac Financial Services ("AFS") Liquidity
.
AFS
provided interest rate swaps to states, municipalities and their authorities, asset-backed issuers and other entities in connection with their financings. Additionally, AFS uses interest rate derivatives as an economic hedge against the effects of rising interest rates elsewhere in the Company, including on Ambac’s financial guarantee exposures.
The principal uses of liquidity by AFS are payments on intercompany loans, payments under derivative contracts (primarily interest rate swaps and US Treasury futures), collateral posting and operating expenses. In June 2017, AFS received a $94.4 million capital contribution from Ambac Assurance that was used to commute the majority of its remaining interest rate swaps with financial guarantee customer counterparties effective June 27, 2017. Refer to
Note 1. Background and Business Description
to the Consolidated Financial Statements, included in Part I, Item 1 in this Form 10-Q for further information related to the commutation. This swap commutation reduced, but does not eliminate, AFS's liquidity risk from potential early terminations of uncollateralized derivatives. Management believes that AFS’ short and long-term liquidity needs can be funded from intercompany loans from Ambac Assurance and receipts from derivative contracts.
While meaningful progress has been made in unwinding the AFS derivatives portfolio, liquidity risk exists in the derivative portfolios due to contract provisions which may require collateral posting, daily settlements or early termination of contracts. AFS borrows cash and securities from Ambac Assurance to meet liquidity needs when such borrowing is determined to be most economically beneficial to Ambac Assurance. Intercompany loans are made under established lending agreements with defined borrowing limits that have received non-disapproval from OCI.
Cash Flow Statement Discussion
.
The following table summarizes the net cash flows for the periods presented.
|
Six Months Ended June 30,
|
|||||||
|
($ in million)
|
2017
|
2016
|
|||||
|
Cash provided by (used in):
|
|||||||
|
Operating activities
|
$
|
(161.0
|
)
|
$
|
874.0
|
|
|
|
Investing activities
|
295.5
|
|
(832.8
|
)
|
|||
|
Financing activities
|
(170.1
|
)
|
(52.8
|
)
|
|||
|
Foreign exchange impact on cash and cash equivalents
|
(1.2
|
)
|
(1.2
|
)
|
|||
|
Net cash flow
|
$
|
(36.8
|
)
|
$
|
(12.7
|
)
|
|
Operating activities
The principal sources of Ambac's operating cash flows are gross installment premiums on insurance contracts and fees on credit default swap contracts, investment coupon receipts, RMBS subrogation recoveries and claim and reinsurance recoveries. The principal uses of Ambac's liquidity are the payment of operating and loss expenses, claim and commutation payments, ceded reinsurance premiums, interest on surplus notes and secured borrowings, interest rate swap settlements and tax payments. The following represents the significant cash activities during the six months ended June 30, 2017 and 2016:
|
•
|
During the
six months ended June 30, 2017
, Ambac made payments of $94.4 million to commute interest rate swaps with a special purpose entity, Augusta Funding Limited IV;
|
|
•
|
During the
six months ended June 30, 2017
, Ambac made payments of $104.7 million to extinguish (on a consolidated basis) principal and interest of surplus notes of Ambac Assurance and the Segregated Account of Ambac Assurance and settled certain residual
|
| Ambac Financial Group, Inc.
73
2017 Second Quarter FORM 10-Q |
obligations related to previously called surplus notes (
$69.5 million
principal and
$35.2 million
interest). The interest amount reduces operating cash flows and the principal reduced financing cash flows; and
|
•
|
During the
six months ended June 30, 2017
, Ambac had net loss and loss expenses paid of $13.6 million compared to net loss and loss expenses recovered of
$1,012.0 million
, for the
six months ended June 30, 2016
. Included in the recoveries for the
six months ended June 30, 2016
were the representation and warranty receipt from JP Morgan of $992.8 million and $99.1 million of subrogation recoveries related to the Countrywide Investor Settlement. Excluding subrogation receipts, loss and loss expenses paid, including commutation payments, were $126.1 and $216.2 million for the six months ended June 30, 2017 and 2016, respectively. During the six months ended June 30, 2017 and 2016 tax payments amounted to
$16.0 million
and
$7.7 million
, respectively.
|
Future operating cash flows will primarily be impacted by the level of premium collections, investment coupon receipts and claim payments (including further payments of Deferred Amounts and interest thereon) and payments under credit default swap contracts. Future payments of Deferred Amounts, including interest thereon, and increases to the percentage of Interim Payments as required by the Rehabilitator will have adverse consequences to Ambac's future cash flows.
Financing Activities
Financing activities for the
six months ended June 30, 2017
primarily included repayments of a secured borrowing of
$16.9 million
, payment for investment agreements of
$82.4 million
and payments for the extinguishment of surplus notes of
$69.5 million
, compared to repayments of a secured borrowing of
$13.6 million
, payment for investment agreements of
$18.0 million
and payments for the extinguishment of surplus notes of
$19.6 million
for the
six months ended June 30, 2016
. Future payments of surplus notes, including interest thereon, as required by the Rehabilitator will have adverse consequences to Ambac's future cash flows.
Credit Ratings and Collateral
.
Ambac Financial Services, LLC (“AFS”) provides interest rate swaps for states, municipalities, asset-backed issuers and other entities in connection with their financings. AFS hedges its interest rate risk, as well as a portion of the interest rate risk in the financial guarantee portfolio, with standardized derivative contracts, including financial futures contracts, which contain collateral or margin requirements. Under these hedge agreements, AFS is required to post collateral or margin to its counterparties and futures commission merchants to cover unrealized losses. In addition, AFS is required to post collateral or margin in excess of the amounts needed to cover unrealized losses. All AFS derivative contracts containing ratings-based downgrade triggers that could result in collateral or margin posting or a termination have been triggered. If terminations were to occur, AFS would be required to make termination payments but would also receive a return of collateral or margin in the form of cash, U.S. Treasury or U.S. government agency obligations with market values equal to or in excess of market values of the swaps and futures contracts. In most cases, AFS will look to re-establish hedge positions that are terminated early. This may result in additional collateral or margin obligations. The amount of additional collateral or margin posted on derivatives contracts will depend on several variables including the degree to which counterparties exercise their termination rights (or agreements terminate automatically) and the terms on which hedges can be replaced. All collateral and margin obligations are currently met. Collateral and margin posted by AFS totaled a net amount of
$117.9 million
(cash and securities collateral of
$53.0 million
and
$64.9 million
, respectively), including independent amounts, under these contracts at
June 30, 2017
.
Ambac Credit Products (“ACP”) is not required to post collateral under any of its outstanding credit derivative contracts.
BALANCE SHEET
Total assets
increased
by approximately
$370 million
from
December 31, 2016
to
$23,005 million
at
June 30, 2017
, primarily due to higher variable interest entity assets as a result of lower credit spreads, partially offset by (i) consideration paid for Ambac's extinguishment of all Segregated Account surplus notes and a portion of Ambac Assurance surplus notes during the quarter (cash and investments); (ii) amortization of the insurance intangible asset during the period, (iii) payment of $94 million in connection with interest rate swap commutations and (iv) application of $71 million of collateral receivable included in other assets as of December 31, 2016 as a reduction to derivative liabilities under new rules by our central clearing party effective January 3, 2017 governing the character of variation margin. Under the new rules, variation margin payments are considered settlements of the associated derivative balance and accordingly were removed from other assets and recoded as a reduction to derivative liabilities. Refer to
Note 9. Derivative Instruments
in this Form 10-Q located in Part 1. Item 1 of this Form 10-Q for further information on the rule change.
Total liabilities
increased
by approximately
$410 million
from
December 31, 2016
to
$21,067 million
as of
June 30, 2017
, primarily as a result of (i) higher variable interest entity liabilities as a result of lower credit spreads, and (ii) higher loss and loss expense reserves, partially offset by (i) the maturity of the last remaining investment agreement, (ii) reductions to derivative liabilities of $145 million related to the terminated interest rate swaps and $71 million associated with the characterization of variation margin as noted above, and (iv) reductions to long-term debt as a result of the extinguishment of surplus notes.
As of
June 30, 2017
total stockholders’ equity was
$1,938 million
, compared with total stockholders’ equity of
$1,978 million
at
December 31, 2016
. This
decrease
was primarily driven by Other Comprehensive
Income
during the period. Other Comprehensive
Loss
during
2017
was driven by a net loss during the period partially offset by unrealized gains on investment securities and translation gains related to Ambac's foreign subsidiaries.
| Ambac Financial Group, Inc.
74
2017 Second Quarter FORM 10-Q |
Investment Portfolio
.
Ambac Assurance’s and Everspan's non-VIE investment objective is to achieve the highest risk-adjusted after-tax return on a diversified portfolio of primarily fixed income investments while employing asset/liability management practices to satisfy operating and strategic liquidity needs. Ambac Assurance’s investment portfolio is subject to internal investment guidelines and is subject to limits on types and quality of investments imposed by the insurance laws and regulations of the jurisdictions in which it is licensed, primarily the States of Wisconsin and New York. Such guidelines set forth minimum credit rating requirements and credit risk concentration limits. Within these guidelines, Ambac Assurance opportunistically purchases Ambac Assurance insured securities in the open market given their relative risk/reward characteristics. Ambac Assurance’s investment policies are subject to oversight by the Rehabilitator of the Segregated Account pursuant to contracts entered into between Ambac Assurance and the Segregated Account. The Board of Directors of Ambac Assurance approves any changes to Ambac Assurance's investment policy.
Ambac UK’s non-VIE investment policy is designed with the primary objective of ensuring that Ambac UK is able to meet its financial obligations as they fall due, in particular with respect to policyholder claims. Ambac UK’s investment portfolio is primarily fixed income investments and diversified holdings of pooled investment funds. The portfolio is subject to internal investment guidelines and may be subject to limits on types and quality of investments imposed by the PRA as regulator of Ambac UK. Ambac UK’s investment policy sets forth minimum credit rating requirements and concentration limits, among other restrictions. The Board of Directors of Ambac UK approves any changes or exceptions to Ambac UK’s investment policy.
Ambac Financial Group, Inc.'s non-VIE investment portfolio's primary objective is to preserve capital for strategic uses while maximizing income, including investments in securities issued by or guaranteed by Ambac Assurance or the Segregated Account.
Refer to
Note 8. Investments
to the Unaudited Financial Statements included in Part 1, Item 1 in this Form 10-Q for information about Ambac's consolidated non-VIE investment portfolio.
The following table summarizes the composition of Ambac’s investment portfolio, excluding VIE investments, at carrying value at
June 30, 2017 and December 31, 2016
:
|
($ in millions)
|
June 30,
2017 |
December 31,
2016 |
||||||
|
Fixed income securities
|
$
|
5,318.2
|
|
$
|
5,554.2
|
|
||
|
Short-term
|
504.0
|
|
430.8
|
|
||||
|
Other investments
|
452.1
|
|
450.3
|
|
||||
|
Fixed income securities pledged as collateral
|
64.9
|
|
64.9
|
|
||||
|
Total investments
(1)
|
$
|
6,339.2
|
|
$
|
6,500.2
|
|
||
|
(1)
|
Includes investments denominated in non-US dollar currencies with a fair value of
£180.2
(
$234.5
) and
€37.8
(
$43.2
) as of
June 30, 2017
and
£167.8
(
$206.7
) and
€23.5
(
$24.7
) as of
December 31, 2016
.
|
Ambac invests in various asset classes in its fixed income securities portfolio, including
securities covered by guarantees issued by Ambac Assurance and other financial guarantors (“insured securities”).
Refer to
Note 8. Investments
to the Unaudited Financial Statements included in Part 1, Item 1 in this Form 10-Q for information about insured securities by guarantor and asset class.
The following table represents the fair value of mortgage and asset-backed securities at
June 30, 2017 and December 31, 2016
by classification
:
|
($ in millions)
|
June 30,
2017 |
December 31,
2016 |
||||||
|
Residential mortgage-backed securities:
|
||||||||
|
RMBS—First-lien—Alt-A
|
$
|
1,032.4
|
|
$
|
1,044.3
|
|
||
|
RMBS—Second Lien
|
874.0
|
|
910.4
|
|
||||
|
RMBS—First Lien—Sub Prime
|
393.1
|
|
396.9
|
|
||||
|
Total residential mortgage-backed securities
|
2,299.5
|
|
2,351.6
|
|
||||
|
Other asset-backed securities
|
||||||||
|
Military Housing
|
232.9
|
|
236.6
|
|
||||
|
Student Loans
|
151.4
|
|
151.4
|
|
||||
|
Structured Insurance
|
138.9
|
|
118.8
|
|
||||
|
Credit Cards
|
84.1
|
|
164.1
|
|
||||
|
Auto
|
52.8
|
|
137.8
|
|
||||
|
Other
|
0.2
|
|
20.1
|
|
||||
|
Total other asset-backed securities
|
660.3
|
|
828.8
|
|
||||
|
Total
(1)
|
$
|
2,959.8
|
|
$
|
3,180.4
|
|
||
| Ambac Financial Group, Inc.
75
2017 Second Quarter FORM 10-Q |
|
(1)
|
Includes investments guaranteed by Ambac Assurance and Ambac UK for both periods presented. Refer to
|
The weighted average rating, which is based on the lower of Standard & Poor’s or Moody’s ratings, of the mortgage and asset-backed securities is
C
and
B-
as of
June 30, 2017
, and
CC
and
BB-
as of
December 31, 2016
, respectively. The ratings on insured securities reflect the higher of the financial strength rating of the financial guarantor or the rating of the underlying issuer. Rating agencies do not always publish separate underlying ratings (those ratings excluding the insurance by the financial guarantor). In the event these underlying ratings are not available from the rating agencies, Ambac will assign an internal rating.
The following charts provide the ratings
(1)
distribution of the fixed income investment portfolio based on fair value at
June 30, 2017 and December 31, 2016
:
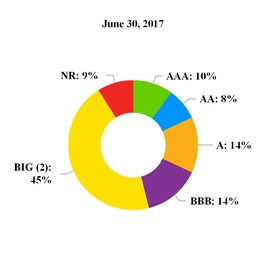
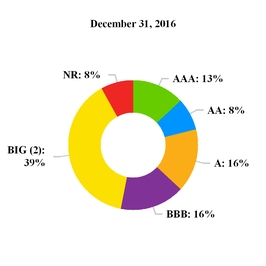
|
(1)
|
Ratings are based on the lower of Moody’s or S&P ratings. If ratings are unavailable from Moody's or S&P, Fitch ratings are used. If guaranteed, rating represents the higher of the underlying or guarantor’s financial strength rating.
|
|
(2)
|
Below investment grade and not rated bonds insured by Ambac represent
53%
and
45%
of the
2017
and
2016
combined portfolio, respectively.
|
Premium Receivables.
Ambac either received premium upfront at time of issuance of the insurance policy (typical of public finance obligations) or in installments (typical of structured finance obligations). For installment premium transactions, a premium receivable asset is established equal to the (i) present value of future contractual premiums due or (ii) if the underlying insured obligation is a homogenous pool of assets which are contractually prepayable, the present value of premiums to be collected over the expected life of the transaction. Ambac's premium receivables
decreased
to
$653 million
at
June 30, 2017
from
$661 million
at
December 31, 2016
. As further discussed in
Note 6. Financial Guarantee Insurance Contracts
, the decrease is due to premium receipts and adjustments for changes in expected and contractual cash flows, partially offset by the impact of currency exchange rates on non-US denominated future premiums, accretion of premium receivable discount and changes to uncollectible premiums.
Premium receivables by payment currency were as follows:
|
Currency
(Amounts in millions) |
Premium Receivable in
Payment Currency |
Premium Receivable in
U.S. Dollars |
||||||
|
U.S. Dollars
|
$
|
423.4
|
|
$
|
423.4
|
|
||
|
British Pounds
|
£
|
148.3
|
|
193.0
|
|
|||
|
Euros
|
€
|
31.4
|
|
35.8
|
|
|||
|
Australian Dollars
|
A$
|
1.2
|
|
0.9
|
|
|||
|
Total
|
$
|
653.2
|
|
|||||
Reinsurance Recoverable on Paid and Unpaid Losses
.
Ambac Assurance has reinsurance in place pursuant to surplus share treaty and facultative agreements. To minimize its exposure to losses from reinsurers, Ambac Assurance (i) monitors the financial condition of its reinsurers; (ii) is entitled to receive collateral from its reinsurance counterparties in certain reinsurance contracts; and (iii) has certain cancellation rights that can be exercised by Ambac Assurance in the event of rating agency downgrades of a reinsurer (among other events and circumstances). Ambac Assurance benefited from letters of credit and collateral amounting to approximately $125.0 million from its reinsurers at
June 30, 2017
. These collateral amounts are in excess of Ambac’s reinsurance recoverable on paid and unpaid losses for the related reinsurer. As of
June 30, 2017
| Ambac Financial Group, Inc.
76
2017 Second Quarter FORM 10-Q |
and December 31, 2016
, reinsurance recoverable on paid and unpaid losses were
$46.5 million
and
$30.4 million
, respectively. The increase was primarily due to adverse loss development within Public Finance.
Insurance Intangible Asset
.
At the Fresh Start Reporting Date, an insurance intangible asset was recorded which represented the difference between the fair value and aggregate carrying value of the financial guarantee insurance and reinsurance assets and liabilities. As of
June 30, 2017 and December 31, 2016
, the gross carrying value of the insurance intangible asset was
$1,562 million
and
$1,534 million
, respectively. Accumulated amortization of the insurance intangible asset was
$649 million
and
$572 million
as of
June 30, 2017 and December 31, 2016
, respectively, resulting in a net insurance intangible asset of
$912 million
and
$962 million
, respectively. The variance in the gross insurance intangible asset is solely impacted by translation gains (losses) from the consolidation of Ambac's foreign subsidiary (Ambac UK).
Derivative Liabilities.
The interest rate derivative portfolio is positioned to benefit from rising rates as an economic hedge against interest rate exposure in the financial guarantee portfolio. Derivative liabilities
decreased
from
$319 million
at December 31, 2016 to
$92 million
as of
June 30, 2017
. The decrease results primarily from the commutation of certain interest rate swaps with a liability fair value of $145 million at December 31, 2016 and the characterization of variation payments on centrally cleared derivatives as settlements of the associated derivative balances resulting from central clearing party rule changes that were effective January 3, 2017. The amount of variation margin included within "Other assets" on the Consolidated Balance Sheet as of December 31, 2016 that was reclassified as a reduction to derivative liabilities under the new CCP rules effective January 3, 2017 is
$71
million. The valuation of derivative liabilities (credit derivatives and interest rate swaps) is impacted by the market’s view of Ambac Assurance’s credit quality. We reflect Ambac’s credit quality in the fair value of such liabilities by including a CVA in the determination of fair value, whereas a lower (higher) CVA, in isolation, would result in an increase (decrease) in the liability. Ambac reduced its derivative liabilities by $1.4 million at
June 30, 2017
and $46.9 million at
December 31, 2016
to incorporate the market’s view of Ambac’s credit quality. The lower CVA as of
June 30, 2017
is a function of the lower gross value of the associated derivative liabilities relative to
December 31, 2016
, as a result of contract terminations.
Loss and Loss Expense Reserves and Subrogation Recoverable
.
Loss and loss expense reserves are based upon estimates of the ultimate aggregate losses inherent in the non-derivative portfolio for insurance policies issued to beneficiaries, including unconsolidated VIEs. Loss and loss expense reserves include the unpaid portion of interest accrued on Deferred Amounts established pursuant to the amended Segregated Account Rehabilitation Plan. The evaluation process for determining the level of reserves is subject to certain estimates and judgments. The loss and loss expense reserves net of subrogation recoverables and before reinsurance as of
June 30, 2017 and December 31, 2016
were
$3,923 million
and
$3,696 million
, respectively.
Loss and loss expense reserves are included in the Consolidated Balance Sheets as follows:
|
Unpaid Claims
|
Present Value of Expected
Net Cash Flows |
Unearned
Premium Revenue |
Gross Loss
and Loss Expense Reserves (2) |
|||||||||||||||||||||
|
($ in millions)
Balance Sheet Line Item |
Claims
|
Accrued Interest
|
Claims and
Loss Expenses |
Recoveries
(1)
|
||||||||||||||||||||
|
June 30, 2017:
|
||||||||||||||||||||||||
|
Loss and loss expense reserves
|
$
|
2,418
|
|
$
|
600
|
|
$
|
2,869
|
|
$
|
(1,158
|
)
|
$
|
(147
|
)
|
$
|
4,582
|
|
||||||
|
Subrogation recoverable
|
582
|
|
149
|
|
41
|
|
(1,431
|
)
|
—
|
|
(659
|
)
|
||||||||||||
|
Totals
|
$
|
3,000
|
|
$
|
749
|
|
$
|
2,910
|
|
$
|
(2,589
|
)
|
$
|
(147
|
)
|
$
|
3,923
|
|
||||||
|
December 31, 2016:
|
||||||||||||||||||||||||
|
Loss and loss expense reserves
|
$
|
2,411
|
|
$
|
530
|
|
$
|
2,681
|
|
$
|
(1,098
|
)
|
$
|
(143
|
)
|
$
|
4,381
|
|
||||||
|
Subrogation recoverable
|
583
|
|
132
|
|
68
|
|
(1,468
|
)
|
—
|
|
(685
|
)
|
||||||||||||
|
Totals
|
$
|
2,994
|
|
$
|
662
|
|
$
|
2,749
|
|
$
|
(2,566
|
)
|
$
|
(143
|
)
|
$
|
3,696
|
|
||||||
|
(1)
|
Present value of future recoveries include R&W subrogation recoveries of
$1,884
and
$1,907
at
June 30, 2017 and December 31, 2016
, respectively.
|
|
(2)
|
Includes Euro denominated gross loss and loss expense reserves. US dollar equivalents of such reserves were
$20
(
€18
) and
$21
(
€20
) at
June 30, 2017 and December 31, 2016
, respectively.
|
Ambac has exposure to various bond types issued in the debt capital markets. Our experience has shown that, for the majority of bond types, we have not experienced significant claims. The bond types that have experienced significant claims, including through commutations, are residential mortgage-backed securities (“RMBS”) and student loan securities. These two bond types represent
89
% of our ever-to-date insurance claims recorded with RMBS comprising
84
%. Although historically RMBS and student loan securities have been the largest source of claim activity there are reserves on Public Finance and Ambac UK credits that may result in significant claim payments in the future.
| Ambac Financial Group, Inc.
77
2017 Second Quarter FORM 10-Q |
The table below indicates gross par outstanding and the components of gross loss and loss expense reserves related to policies in Ambac’s gross loss and loss expense reserves at
June 30, 2017 and December 31, 2016
:
|
Gross
Par
Outstanding
(1)(2)
|
Unpaid Claims
|
Present Value of Expected
Net Cash Flows |
Unearned
Premium Revenue |
Gross Loss
and Loss Expense Reserves (1)(3) |
||||||||||||||||||||||||
|
($ in millions)
|
Claims
|
Accrued
Interest |
Claims and
Loss Expenses |
Recoveries
|
||||||||||||||||||||||||
|
June 30, 2017:
|
||||||||||||||||||||||||||||
|
RMBS
|
$
|
6,157
|
|
$
|
2,987
|
|
$
|
746
|
|
$
|
1,001
|
|
$
|
(2,232
|
)
|
$
|
(26
|
)
|
$
|
2,476
|
|
|||||||
|
Domestic Public Finance
|
4,620
|
|
13
|
|
3
|
|
1,103
|
|
(302
|
)
|
(77
|
)
|
740
|
|
||||||||||||||
|
Student Loans
|
714
|
|
—
|
|
—
|
|
362
|
|
(42
|
)
|
(13
|
)
|
307
|
|
||||||||||||||
|
Ambac UK
|
939
|
|
—
|
|
—
|
|
328
|
|
(13
|
)
|
(19
|
)
|
296
|
|
||||||||||||||
|
All other credits
|
659
|
|
—
|
|
—
|
|
28
|
|
—
|
|
(12
|
)
|
16
|
|
||||||||||||||
|
Loss expenses
|
—
|
|
—
|
|
—
|
|
88
|
|
—
|
|
—
|
|
88
|
|
||||||||||||||
|
Totals
|
$
|
13,089
|
|
$
|
3,000
|
|
$
|
749
|
|
$
|
2,910
|
|
$
|
(2,589
|
)
|
$
|
(147
|
)
|
$
|
3,923
|
|
|||||||
|
December 31, 2016:
|
||||||||||||||||||||||||||||
|
RMBS
|
$
|
6,756
|
|
$
|
2,982
|
|
$
|
660
|
|
$
|
1,073
|
|
$
|
(2,295
|
)
|
$
|
(26
|
)
|
$
|
2,394
|
|
|||||||
|
Domestic Public Finance
|
4,410
|
|
12
|
|
2
|
|
822
|
|
(216
|
)
|
(73
|
)
|
547
|
|
||||||||||||||
|
Student Loans
|
728
|
|
—
|
|
—
|
|
337
|
|
(45
|
)
|
(13
|
)
|
279
|
|
||||||||||||||
|
Ambac UK
(4)
|
939
|
|
—
|
|
—
|
|
416
|
|
(10
|
)
|
(18
|
)
|
388
|
|
||||||||||||||
|
All other credits
|
567
|
|
—
|
|
—
|
|
26
|
|
—
|
|
(13
|
)
|
13
|
|
||||||||||||||
|
Loss expenses
|
—
|
|
—
|
|
—
|
|
75
|
|
—
|
|
—
|
|
75
|
|
||||||||||||||
|
Totals
|
$
|
13,400
|
|
$
|
2,994
|
|
$
|
662
|
|
$
|
2,749
|
|
$
|
(2,566
|
)
|
$
|
(143
|
)
|
$
|
3,696
|
|
|||||||
|
(1)
|
Ceded par outstanding on policies with loss reserves and ceded loss and loss expense reserves are $674 and $47, respectively, at
June 30, 2017
and $607 and $31, respectively at
December 31, 2016
. Ceded loss and loss expense reserves are included in Reinsurance recoverable on paid and unpaid losses.
|
|
(2)
|
Gross Par Outstanding includes capital appreciation bonds, which are reported at the par amount at the time of issuance of the insurance policy as opposed to the current accreted value of the bond.
|
|
(3)
|
Loss reserves are included in the balance sheet as Loss and loss expense reserves or Subrogation recoverable dependent on if a policy is in a net liability or net recoverable position.
|
|
(4)
|
Present value of Expected Net Cash Flows is reduced by estimated recoveries from the Ambac UK v. J.P. Morgan Investment Management litigation.
|
RMBS
Ambac has exposure to the U.S. mortgage market primarily through direct financial guarantees of RMBS, including transactions collateralized by first and second liens.
We established a representation and warranty subrogation recovery as further discussed in
Note 6. Financial Guarantee Insurance Contracts
to the Unaudited Consolidated Financial Statements included in Part I, Item 1 in this Form 10-Q. Our ability to realize RMBS representation and warranty recoveries is subject to significant uncertainty, including risks inherent in litigation, collectability of such amounts from counterparties (and/or their respective parents and affiliates), timing of receipt of any such recoveries, intervention by the Rehabilitator or OCI which could impede our ability to take actions required to realize such recoveries, and uncertainty inherent in the assumptions used in estimating such recoveries.
The table below distinguishes between RMBS credits for which we have not established a representation and warranty subrogation recovery and those for which we have, providing in both cases the gross par outstanding, gross loss reserves before representation and warranty subrogation recoveries, and gross loss reserves net of representation and warranty subrogation recoveries for all RMBS exposures for which Ambac established reserves at
June 30, 2017 and December 31, 2016
:
| Ambac Financial Group, Inc.
78
2017 Second Quarter FORM 10-Q |
|
($ in millions)
|
Gross Par
Outstanding |
Gross Loss
Reserves Before Representation and Warranty Subrogation Recoveries |
Representation
and Warranty Subrogation Recoveries |
Gross Loss
Reserves Net of Representation and Warranty Subrogation Recoveries |
||||||||||||
|
June 30, 2017:
|
||||||||||||||||
|
Second-lien
|
$
|
1,083
|
|
$
|
709
|
|
$
|
—
|
|
$
|
709
|
|
||||
|
First-lien Mid-prime
|
2,043
|
|
1,920
|
|
—
|
|
1,920
|
|
||||||||
|
First-lien Sub-prime
|
1,118
|
|
228
|
|
—
|
|
228
|
|
||||||||
|
Other
|
150
|
|
142
|
|
—
|
|
142
|
|
||||||||
|
Total Credits Without Subrogation
|
4,394
|
|
2,999
|
|
—
|
|
2,999
|
|
||||||||
|
Second-lien
|
907
|
|
711
|
|
(1,315
|
)
|
(604
|
)
|
||||||||
|
First-lien Mid-prime
|
66
|
|
100
|
|
(79
|
)
|
21
|
|
||||||||
|
First-lien Sub-prime
|
790
|
|
550
|
|
(490
|
)
|
60
|
|
||||||||
|
Total Credits With Subrogation
|
1,763
|
|
1,361
|
|
(1,884
|
)
|
(523
|
)
|
||||||||
|
Total
|
$
|
6,157
|
|
$
|
4,360
|
|
$
|
(1,884
|
)
|
$
|
2,476
|
|
||||
|
December 31, 2016:
|
||||||||||||||||
|
Second-lien
|
$
|
1,169
|
|
$
|
679
|
|
$
|
—
|
|
$
|
679
|
|
||||
|
First-lien-Mid-prime
|
2,226
|
|
1,901
|
|
—
|
|
1,901
|
|
||||||||
|
First-lien-Sub-prime
|
1,194
|
|
231
|
|
—
|
|
231
|
|
||||||||
|
Other
|
201
|
|
138
|
|
—
|
|
138
|
|
||||||||
|
Total Credits Without Subrogation
|
4,790
|
|
2,949
|
|
—
|
|
2,949
|
|
||||||||
|
Second-lien
|
1,045
|
|
705
|
|
(1,333
|
)
|
(628
|
)
|
||||||||
|
First-lien Mid-prime
|
72
|
|
97
|
|
(79
|
)
|
18
|
|
||||||||
|
First-lien Sub-prime
|
849
|
|
550
|
|
(495
|
)
|
55
|
|
||||||||
|
Total Credits With Subrogation
|
1,966
|
|
1,352
|
|
(1,907
|
)
|
(555
|
)
|
||||||||
|
Total
|
$
|
6,756
|
|
$
|
4,301
|
|
$
|
(1,907
|
)
|
$
|
2,394
|
|
||||
Public Finance
Ambac’s U.S. public finance portfolio consists predominantly of municipal bonds such as general and revenue obligations and lease and tax-backed obligations of state and local government entities; however, the portfolio also comprises a wide array of non-municipal types of bonds, including financings for not-for-profit entities and transactions with public and private elements, which generally finance infrastructure, housing and other public purpose facilities and interests. The increase in public finance gross loss reserves at
June 30, 2017
as compared to
December 31, 2016
were primarily related to adverse developments in Puerto Rico in addition to military housing. Total public finance gross loss reserves and related gross par outstanding on Ambac insured obligations by bond type were as follows:
|
June 30, 2017
|
December 31, 2016
|
|||||||||||||||
|
Issuer Type
($ in millions) |
Gross Par
Outstanding (1) |
Gross Loss
Reserves |
Gross Par
Outstanding (1) |
Gross Loss
Reserves |
||||||||||||
|
Lease and tax-backed
|
$
|
2,046
|
|
$
|
543
|
|
$
|
2,114
|
|
$
|
395
|
|
||||
|
General obligation
|
1,494
|
|
99
|
|
1,422
|
|
78
|
|
||||||||
|
Transportation revenue
|
495
|
|
64
|
|
516
|
|
62
|
|
||||||||
|
Housing
|
451
|
|
28
|
|
179
|
|
9
|
|
||||||||
|
Other
|
135
|
|
6
|
|
179
|
|
3
|
|
||||||||
|
Total
|
$
|
4,620
|
|
$
|
740
|
|
$
|
4,410
|
|
$
|
547
|
|
||||
|
(1)
|
Gross Par Outstanding includes capital appreciation bonds, which are reported at the par amount at the time of issuance of the insurance policy as opposed to the current accreted value of the bond.
|
Variability of Expected Losses and Recoveries
Ambac’s management believes that the estimated future loss component of loss reserves are adequate to cover future claims presented, but there can be no assurance that the ultimate liability will not be higher than such estimates.
It is possible that our estimated future loss assumptions for insurance policies discussed above could be understated. We have attempted to identify possible cash flows using more stressful assumptions than the probability-weighted outcome recorded. The possible net cash flows consider the highest stress scenario that was utilized in the development of our probability-weighted expected loss at
June 30, 2017
and assumes an inability
| Ambac Financial Group, Inc.
79
2017 Second Quarter FORM 10-Q |
to execute any commutation transactions with issuers and/or investors. Such stress scenarios are developed based on management’s view about all possible outcomes. In arriving at such view, management makes considerable judgments about the possibility of various future events. Although we do not believe it is possible to have worst case outcomes in all cases, it is possible we could have worst case outcomes in some or even many cases.
RMBS Variability:
Changes to assumptions that could make our reserves under-estimated include an increase in interest rates, deterioration in housing prices, poor servicing, the effect of a weakened economy characterized by growing unemployment and wage pressures, and/or illiquidity of the mortgage market. We utilize a model to project losses in our RMBS exposures and changes to reserves, either upward or downward are not unlikely if we used a different model or methodology to project losses. We regularly assess models and methodologies and may change our approaches and/or model. Additionally, our R&W actual subrogation recoveries could be significantly lower than our estimate of $1,884 million as of
June 30, 2017
if the sponsors of these transactions: (i) fail to honor their obligations to repurchase the mortgage loans, (ii) successfully dispute our breach findings, (iii) no longer have the financial means to fully satisfy their obligations under the transaction documents, or (iv) our pursuit of recoveries is otherwise unsuccessful.
In the case of both first and second-lien exposures, the possible stress case assumes a lower housing price appreciation projection, which in turn drives higher defaults and severities. Using this approach, the possible increase in loss reserves for RMBS credits for which we have an estimate of expected loss at
June 30, 2017
could be approximately $80 million. Combined with the absence of any R&W subrogation recoveries, a possible increase in loss reserves for RMBS could be approximately $2 billion.
Public Finance Variability:
It is possible our loss reserves for public finance credits may be under-estimated if issuers are faced with prolonged exposure to adverse political, economic, fiscal or socioeconomic events or trends.
Our experience with the city of Detroit in its bankruptcy proceeding was not favorable and renders future outcomes with other public finance issuers even more difficult to predict and may increase the risk that we may suffer losses that could be sizable. We agreed to settlements regarding our insured Detroit general obligation bonds that provide better treatment of our exposures than the city planned to include in its plan, but nevertheless required us to incur a loss for a significant portion of our exposure. An additional troubling precedent in the Detroit case, as well as other municipal bankruptcies, is the preferential treatment of certain creditor classes, especially the public pensions. The cost of pensions and the need to address frequently sizable unfunded or underfunded pensions is often a key driver of stress for many municipalities and their related authorities, including entities to whom we have significant exposure, such as Chicago, its school district, the State of New Jersey and many others. Less severe treatment of pension obligations in bankruptcy may lead to worse outcomes for traditional debt creditors. In addition, cities may be more inclined to use bankruptcy to resolve their financial stresses if they believe preferred outcomes for various creditor groups can be achieved.
We currently consider high severity outcomes to be outlying and therefore generally assign low or remote probabilities to such outcomes in our current loss reserves unless the situation develops adversely. We expect municipal bankruptcies and defaults to continue to be challenging to project given the unique political, economic, fiscal, governance and public policy differences among municipalities as well as the complexity, long duration and relative infrequency of the cases themselves in forums with a scarcity of legal precedent.
Another potentially adverse development that could cause the loss reserves on our public finance credits to be underestimated is deterioration in the municipal bond market, reduced or no access to alternative forms of credit (such as bank loans) or other exogenous factors (such as federal tax policy changes that reduce retail municipal investor appetite) that deprive issuers access to funding at a level necessary to avoid defaulting on their obligations. While our loss reserves consider our judgment regarding issuers’ financial flexibility to adapt to adverse markets, they may not adequately capture sudden, unexpected or protracted uncertainty that adversely affects market conditions.
Our exposures to the Commonwealth of Puerto Rico are under stress arising from the Commonwealth’s poor financial condition, weak economy and loss of capital markets access. The Commonwealth has indicated it cannot afford to pay its debts and has announced plans to improve its financial position and prospects including the restructuring of debt obligations.
In April 2016, the Commonwealth enacted into law an emergency moratorium, known as "Act 21," on debt payments of the Commonwealth and its instrumentalities. Beginning in April 2016, and culminating on June 30, 2016, former Governor García-Padilla issued executive orders under Act 21 declaring states of emergency at HTA, PRIFA, PRCCDA, and other Puerto Rico instrumentalities through January 31, 2017, and suspending payment obligations on bonds issued by those entities, including bonds insured by Ambac Assurance. Subsequent to the implementation of the moratorium, the Commonwealth defaulted on a significant amount of debt, including certain Puerto Rico bonds insured by Ambac Assurance. On January 29, 2017, current Governor Rosselló enacted Act 5 of 2017, known as the Puerto Financial Emergency and Fiscal Responsibility Act of 2017 ("Act 5") which, among other things, established that the executive orders under Act 21 shall continue in full force and effect until amended, rescinded or superseded. Act 5 also established an emergency period during which certain financial emergency powers were granted to the Governor. Purported financial emergency powers include the power to issue executive orders to establish the priority rules for the disbursement of public funds when a fiscal year’s resources are insufficient to cover that fiscal year’s appropriations; and the power to take any and all actions that the Governor deems reasonable and necessary to preserve the ability of the Commonwealth or any of its instrumentalities to continue providing essential services to its residents. Act 5 also establishes that during an emergency period the Governor shall pay debt service to the extent possible after all essential services of the Commonwealth have been provided for. The emergency period was originally set to expire
| Ambac Financial Group, Inc.
80
2017 Second Quarter FORM 10-Q |
on May 1, 2017. It was later extended to August 1, 2017 via Executive Order 2017-31 and more recently extended until December 31, 2017 by Act 46, which was enacted on July 19, 2017.
As a result of the distressed situation in Puerto Rico coupled with the payment moratorium on debt payments of the Commonwealth and certain provisions under PROMESA, the potential for a restructuring of debt insured by Ambac Assurance, either with or without its consent, and the possibility of protracted litigation as a result of which its rights may be materially impaired, losses may exceed current reserves in a material manner. See "
Note 1. Background and Business Description
- Puerto Rico" for further details on the legal, economic, and fiscal developments that have impacted or may impact Ambac Assurance’s insured Puerto Rico bonds, including implied debt service discounts under both the Commonwealth’s Fiscal and Economic Growth Plan certified by the Oversight Board on March 13, 2017 (“FEGP”), and the Commonwealth’s April 28, 2017 restructuring proposal. In the current Title III process, should court-approved plans of adjustment for the Commonwealth, COFINA, and PRHTA, as well as any other issuers of Ambac-insured debt that are subsequently filed for Title III protection, be based on the certified FEGP from March 13, 2017, the Fiscal Plan Compliance Act being upheld, or Ambac receiving unfavorable judgments on the litigation to which it is a party, Ambac’s and its financial condition could be materially adversely affected. It is also possible that outcomes may be worse than forecast under the certified FEGP or under proposals or plans promulgated by the Commonwealth or its instrumentalities in or in connection with a Title III process or otherwise.
For public finance credits, including Puerto Rico as well as other issuers, for which we have an estimate of expected loss at
June 30, 2017
, the possible increase in loss reserves could be approximately $1.6 billion. However, there can be no assurance that losses may not exceed such amount.
Student Loan Variability:
Changes to assumptions that could make our reserves under-estimated include, but are not limited to, increases in interest rates, default rates and loss severities on the collateral due to economic or other factors. Such factors may include lower recoveries on defaulted loans or additional losses on collateral or trust assets, including as a result of any enforcement actions of the Consumer Finance Protection Bureau. For student loan credits for which we have an estimate of expected loss at
June 30, 2017
, the possible increase in loss reserves could be approximately $200 million.
Other Credits, including Ambac UK, Variability:
It is possible our loss reserves on other types of credits, including those insured by Ambac UK, may be under-estimated because of various risks that vary widely, including the risk that we may not be able to recover or mitigate losses through our remediation processes such as litigation, depending upon the nature of the exposure. For all other credits, including Ambac UK, for which we have an estimate of expected loss, the sum of all the highest stress case loss scenarios is approximately $300 million greater than the loss reserves at
June 30, 2017
.
SPECIAL PURPOSE AND VARIABLE INTEREST ENTITIES
Please refer to
Note 3. Special Purpose Entities, Including Variable Interest Entities
to the Unaudited Consolidated Financial Statements included in Part I, Item 1 in this Form 10-Q and Note 2. Basis of Presentation and Significant Accounting Policies and Note 3. Special Purpose Entities, Including Variable Interest Entities to the Consolidated Financial Statements, included in Part II, Item 8 in the Company’s Annual Report on Form 10-K for the year ended
December 31, 2016
, for information regarding special purpose and variable interest entities.
ACCOUNTING STANDARDS
Please refer to
Note 2. Basis of Presentation and Significant Accounting Policies
to the Unaudited Consolidated Financial Statements, included in Part I, Item 1 in this Form 10-Q, for a discussion of the impact of recent accounting pronouncements on Ambac’s financial condition and results of operations.
AMBAC ASSURANCE STATUTORY BASIS FINANCIAL RESULTS
Ambac Assurance, Everspan and the Segregated Account’s statutory financial statements are prepared on the basis of accounting practices prescribed or permitted by the OCI. OCI recognizes only statutory accounting practices prescribed or permitted by the State of Wisconsin (“SAP”) for determining and reporting the financial condition and results of operations of an insurance company for determining its solvency under Wisconsin Insurance Law. The National Association of Insurance Commissioners (“NAIC”) Accounting Practices and Procedures manual (“NAIC SAP”) has been adopted as a component of prescribed practices by the State of Wisconsin. For further information, see "Ambac Assurance Statutory Basis Financial Results," in Part II, Item 7. "Management's Discussion and Analysis of Financial Condition and Results of Operations," in the Company’s Annual Report on Form 10-K for the year ended
December 31, 2016
.
Ambac Assurance’s statutory policyholder surplus and qualified statutory capital (defined as the sum of policyholders surplus and mandatory contingency reserves) were
$954.2 million
and
$1,382.1 million
at
June 30, 2017
, respectively, as compared to
$976.5 million
and
$1,368.3 million
at
December 31, 2016
, respectively.
The Segregated Account’s statutory policyholder surplus amount was
$378.8 million
and
$381.3 million
as of
June 30, 2017 and December 31, 2016
, respectively. The Segregated Account's decrease in policyholder surplus was primarily due to a reduction in junior surplus notes as a result
| Ambac Financial Group, Inc.
81
2017 Second Quarter FORM 10-Q |
of rent payments made by Ambac Assurance during the
six months ended June 30, 2017
. The junior surplus notes reduce as rent payments are made by Ambac Assurance;
$1.9
million occurred during
2017
.
Ambac Assurance’s statutory policyholder surplus includes
$372.1 million
of junior surplus notes issued by the Segregated Account. The junior surplus notes, as well as preferred stock issued by Ambac Assurance, are obligations that have claims on the resources of Ambac Assurance and the Segregated Account which impact Ambac's ability to realize residual value from its equity in Ambac Assurance.
Ambac Assurance’s statutory surplus is sensitive to multiple factors, including: (i) loss reserve development (inclusive of policies allocated to the Segregated Account), (ii) approval by OCI of interest payments on surplus notes issued by Ambac Assurance or the Segregated Account, (iii) approval by OCI of principal or interest payments on junior surplus notes issued by the Segregated Account, (iv) deterioration in the financial position of Ambac Assurance subsidiaries that have their obligations guaranteed by Ambac Assurance, (v) first time payment defaults of insured obligations, which increase statutory loss reserves, (vi) commutations of insurance policies or credit derivative contracts at amounts that differ from the amount of liabilities recorded, (vii) reinsurance contract terminations at amounts that differ from net assets recorded, (viii) changes to the fair value of investments carried at fair value, (ix) settlements of representation and warranty breach claims at amounts that differ from amounts recorded, including failures to collect such amounts, (x) realized gains and losses, including losses arising from other than temporary impairments of investment securities, (xi) execution of the Rehabilitation Exit Transactions, and (xii) future changes to prescribed SAP practices by the OCI.
AMBAC UK FINANCIAL RESULTS UNDER UK ACCOUNTING PRINCIPLES
Ambac UK is required to prepare financial statements under FRS 102 "The Financial Reporting Standard applicable in the UK and Republic of Ireland." Ambac UK’s shareholder funds under UK GAAP were
£218.8 million
at
June 30, 2017
as compared to
£157.9 million
at
December 31, 2016
. Ambac UK’s improvement in shareholders’ funds was primarily due to net income arising from the receipt of premiums, investment return in the period and reduction in loss provisions, including amounts associated with Ballantyne's litigation settlement in April 2017. At
June 30, 2017
, the carrying value of cash and investments was
£450.9 million
, a
decrease
from
£460.4 million
at
December 31, 2016
. The
decrease
in cash and investments is due to loss expense and tax payments in the period offset by the continued receipt of premiums, investment coupons from Ambac UK's investment portfolio and increases in the value of investments in pooled funds.
Ambac UK is also required to prepare financial information in accordance with the Solvency II Directive. The basis of preparation of this information is significantly different from both US GAAP and UK GAAP. The calculation of capital resources, regulatory capital requirements and regulatory capital deficits under Solvency II as at
March 31, 2017
represents the most recent available data for these three items. The calculation of capital resources, regulatory capital requirements and regulatory capital deficit of Ambac UK as at
June 30, 2017
will be finalized on August 18, 2017 and will be published on Ambac's website shortly thereafter.
Capital resources under Solvency II were a deficit of
£15.0 million
at
March 31, 2017
, an improvement from a deficit of
$67.1 million
at
December 31, 2016
. The deficits at
March 31, 2017
and
December 31, 2016
are in comparison to regulatory capital requirements of
£340.9 million
and
£334.9 million
, respectively. Ambac UK is therefore deficient in terms of compliance with applicable regulatory capital requirements by
£355.9 million
at
March 31, 2017
and
£402.0 million
at
December 31, 2016
. The regulators are aware of the deficiency in capital resources as compared to capital requirements and dialogue between Ambac UK management and its regulators remains ongoing with respect to options for addressing the shortcoming, although such options remain few.
NON-GAAP FINANCIAL MEASURES
In addition to reporting the Company’s quarterly financial results in accordance with GAAP, the Company reports two non-GAAP financial measures: Adjusted Earnings and Adjusted Book Value. The most directly comparable GAAP measures are net income attributable to common stockholders for Adjusted earnings and Total Ambac Financial Group, Inc. stockholders’ equity for Adjusted Book value. A non-GAAP financial measure is a numerical measure of financial performance or financial position that excludes (or includes) amounts that are included in (or excluded from) the most directly comparable measure calculated and presented in accordance with GAAP. We are presenting these non-GAAP financial measures because they provide greater transparency and enhanced visibility into the underlying drivers of our business and the impact of certain items that the Company believes will reverse from GAAP book value over time through the GAAP statements of comprehensive income. Adjusted Earnings and Adjusted Book Value are not substitutes for the Company’s GAAP reporting, should not be viewed in isolation and may differ from similar reporting provided by other companies, which may define non-GAAP measures differently.
Ambac has a significant U.S. tax net operating loss (“NOL”) that is offset by a full valuation allowance in the GAAP consolidated financial statements. As a result of this and other considerations, for purposes of non-GAAP measures, we utilized a 0% effective tax rate; which is subject to change.
The following paragraphs define each non-GAAP financial measure and describe why it is useful. A reconciliation of the non-GAAP financial measure and the most directly comparable GAAP financial measure is also presented below.
Adjusted Earnings (Loss).
Adjusted Earnings (Loss) is defined as net income (loss) attributable to common stockholders, as reported under GAAP, adjusted on an after-tax basis for the following:
| Ambac Financial Group, Inc.
82
2017 Second Quarter FORM 10-Q |
|
•
|
Non-credit impairment fair value (gain) loss on credit derivatives:
Elimination of the non-credit impairment fair value gains (losses) on credit derivatives, which is the amount in excess of the present value of the expected estimated credit losses. Such fair value adjustments are affected by, and in part fluctuate with, changes in market factors such as interest rates and credit spreads, including the market’s perception of Ambac’s credit risk (“Ambac CVA”), and are not expected to result in an economic gain or loss. These adjustments allow for all financial guarantee contracts to be accounted for consistent with the Financial Services – Insurance Topic of ASC, whether or not they are subject to derivative accounting rules.
|
|
•
|
Insurance intangible amortization:
Elimination of the amortization of the financial guarantee insurance intangible asset that arose as a result of Ambac’s emergence from bankruptcy and the implementation of Fresh Start reporting. This adjustment ensures that all financial guarantee contracts are accounted for consistent with the provisions of the Financial Services – Insurance Topic of the ASC.
|
|
•
|
Foreign exchange (gains) losses:
Elimination of the foreign exchange gains (losses) on the re-measurement of assets, liabilities and transactions in non-functional currencies. This adjustment eliminates the foreign exchange gains (losses) on all assets, liabilities and transactions in non-functional currencies, which enables users of our financial statements to better view the business results without the impact of fluctuations in foreign currency exchange rates, particularly as assets held in non-functional currencies have grown, and facilitates period-to-period comparisons of Ambac's operating performance.
|
|
•
|
Fair value (gain) loss on interest rate derivatives from Ambac CVA:
Elimination of the gains (losses) relating to Ambac’s CVA on interest rate derivative contracts. Similar to credit derivatives, fair values include the market’s perception of Ambac’s credit risk and this adjustment only allows for such gain or loss when realized.
|
The following table reconciles net income attributable to common stockholders to the non-GAAP measure, Adjusted Earnings on a total dollar amount and per diluted share basis, for all periods presented:
|
Three Months Ended June 30,
|
|||||||||||||||
|
2017
|
2016
|
||||||||||||||
|
($ in millions, except share data)
|
$ Amount
|
Per Diluted Share
|
$ Amount
|
Per Diluted Share
|
|||||||||||
|
Net income (loss) attributable to common stockholders
|
$
|
7.1
|
|
$
|
0.16
|
|
$
|
58.6
|
|
$
|
1.29
|
|
|||
|
Adjustments:
|
|||||||||||||||
|
Non-credit impairment fair value (gain) loss on credit derivatives
|
(4.6
|
)
|
(0.10
|
)
|
(3.7
|
)
|
(0.08
|
)
|
|||||||
|
Insurance intangible amortization
|
33.5
|
|
0.73
|
|
39.0
|
|
0.86
|
|
|||||||
|
Foreign exchange (gains) losses
|
(8.5
|
)
|
(0.19
|
)
|
33.9
|
|
0.75
|
|
|||||||
|
Fair value (gain) loss on interest rate derivatives from Ambac CVA
|
42.9
|
|
0.94
|
|
(6.8
|
)
|
(0.15
|
)
|
|||||||
|
Adjusted earnings (loss)
|
$
|
70.4
|
|
$
|
1.54
|
|
$
|
121.1
|
|
$
|
2.67
|
|
|||
|
Six Months Ended June 30,
|
|||||||||||||||
|
2017
|
2016
|
||||||||||||||
|
($ in millions, except share data)
|
$ Amount
|
Per Diluted Share
|
$ Amount
|
Per Diluted Share
|
|||||||||||
|
Net income (loss) attributable to common stockholders
|
$
|
(118.3
|
)
|
$
|
(2.61
|
)
|
$
|
68.1
|
|
$
|
1.50
|
|
|||
|
Adjustments:
|
|||||||||||||||
|
Non-credit impairment fair value (gain) loss on credit derivatives
|
(2.9
|
)
|
(0.06
|
)
|
(5.0
|
)
|
(0.11
|
)
|
|||||||
|
Insurance intangible amortization
|
71.0
|
|
1.57
|
|
89.9
|
|
1.98
|
|
|||||||
|
Foreign exchange (gain) loss
|
(15.5
|
)
|
(0.34
|
)
|
41.3
|
|
0.91
|
|
|||||||
|
Fair value (gain) loss on derivative products from Ambac CVA
|
44.9
|
|
0.98
|
|
(10.6
|
)
|
(0.23
|
)
|
|||||||
|
Adjusted earnings (loss)
|
$
|
(20.8
|
)
|
$
|
(0.46
|
)
|
$
|
183.7
|
|
$
|
4.05
|
|
|||
Net income (loss) effects of financial guarantee VIE consolidation:
VIEs that were consolidated as a result of financial guarantees provided by Ambac are accounted for on a fair value basis. Included within Net income (loss) attributable to common stockholders of these consolidated VIEs was
$2.5 million
and
$(18.2) million
for the
six months ended June 30, 2017 and 2016
, respectively. Had these financial guarantee VIEs been accounted for under the provisions of the Financial Services - Insurance Topic of the ASC, the impact would have been
$5.6 million
and
$131.4 million
for the
six months ended June 30, 2017 and 2016
, respectively. The net change of these different accounting bases (including per share amounts) was
$3.2 million
(
$0.07
per diluted share) and
$149.6 million
(
$3.30
per diluted share), for the
six months ended June 30, 2017 and 2016
, respectively.
This is supplemental information only and is not a component of Adjusted Earnings.
Adjusted Book Value.
Adjusted Book Value is defined as Total Ambac Financial Group, Inc. stockholders’ equity as reported under GAAP, adjusted for after-tax impact of the following:
| Ambac Financial Group, Inc.
83
2017 Second Quarter FORM 10-Q |
|
•
|
Non-credit impairment fair value losses on credit derivatives:
Elimination of the non-credit impairment fair value loss on credit derivatives, which is the amount in excess of the present value of the expected estimated economic credit loss. GAAP fair values are affected by, and in part fluctuate with, changes in market factors such as interest rates, credit spreads, including Ambac’s CVA that are not expected to result in an economic gain or loss. These adjustments allow for all financial guarantee contracts to be accounted for within Adjusted Book Value consistent with the provisions of the Financial Services—Insurance Topic of the ASC, whether or not they are subject to derivative accounting rules.
|
|
•
|
Insurance intangible asset:
Elimination of the financial guarantee insurance intangible asset that arose as a result of Ambac’s emergence from bankruptcy and the implementation of Fresh Start reporting. This adjustment ensures that all financial guarantee contracts are accounted for within Adjusted Book Value consistent with the provisions of the Financial Services—Insurance Topic of the ASC.
|
|
•
|
Ambac CVA on interest rate derivative liabilities:
Elimination of the gain relating to Ambac’s CVA on interest rate derivative contracts. Similar to credit derivatives, fair values include the market’s perception of Ambac’s credit risk and this adjustment only allows for such gain when realized.
|
|
•
|
Net unearned premiums and fees in excess of expected losses:
Addition of the value of the unearned premium revenue ("UPR") on financial guarantee contracts, in excess of expected losses, net of reinsurance. This non-GAAP adjustment presents the economics of UPR and expected losses for financial guarantee contracts on a consistent basis. In accordance with GAAP, stockholders’ equity reflects a reduction for expected losses only to the extent they exceed UPR. However, when expected losses are less than UPR for a financial guarantee contract, neither expected losses nor UPR have an impact on stockholders’ equity. This non-GAAP adjustment adds UPR in excess of expected losses, net of reinsurance, to stockholders’ equity for financial guarantee contracts where expected losses are less than UPR.
|
|
•
|
Net unrealized investment (gains) losses in Accumulated Other Comprehensive Income:
Elimination of the unrealized gains and losses on the Company’s investments that are recorded as a component of accumulated other comprehensive income (“AOCI”). The AOCI component of the fair value adjustment on the investment portfolio may differ from realized gains and losses ultimately recognized by the Company based on the Company’s investment strategy. This adjustment only allows for such gains and losses in Adjusted Book Value when realized.
|
The following table reconciles Total Ambac Financial Group, Inc. stockholders’ equity to the non-GAAP measure Adjusted Book Value on a total dollar amount and per share basis, for all periods presented:
|
June 30, 2017
|
December 31, 2016
|
||||||||||||||
|
($ in millions, except share data)
|
$ Amount
|
Per Share
|
$ Amount
|
Per Share
|
|||||||||||
|
Total Ambac Financial Group, Inc. stockholders’ equity
|
$
|
1,674.1
|
|
$
|
37.00
|
|
$
|
1,713.9
|
|
$
|
37.94
|
|
|||
|
Adjustments:
|
|||||||||||||||
|
Non-credit impairment fair value losses on credit derivatives
|
8.6
|
|
0.19
|
|
11.4
|
|
0.25
|
|
|||||||
|
Insurance intangible asset
|
(912.2
|
)
|
(20.16
|
)
|
(962.1
|
)
|
(21.30
|
)
|
|||||||
|
Ambac CVA on interest rate derivative liabilities
|
—
|
|
—
|
|
(44.9
|
)
|
(0.99
|
)
|
|||||||
|
Net unearned premiums and fees in excess of expected losses
|
665.0
|
|
14.70
|
|
732.2
|
|
16.21
|
|
|||||||
|
Net unrealized investment (gains) losses in Accumulated Other Comprehensive Income
|
(152.8
|
)
|
(3.38
|
)
|
(118.9
|
)
|
(2.63
|
)
|
|||||||
|
Adjusted book value
|
$
|
1,282.7
|
|
$
|
28.35
|
|
$
|
1,331.7
|
|
$
|
29.48
|
|
|||
Stockholders' equity effects of financial guarantee VIE consolidation:
VIEs that were consolidated as a result of financial guarantees provided by Ambac are accounted for on a fair value basis. The impact on Total Ambac Financial Group, Inc. stockholders' equity of these consolidated VIEs was
$127.6 million
and
$132.4 million
at
June 30, 2017 and December 31, 2016
, respectively. Had these financial guarantee VIEs been accounted for under the provisions of the Financial Services Insurance Topic of the ASC, the impact would have been
$131.6 million
and
$139.2 million
at
June 30, 2017 and December 31, 2016
, respectively. The net change of these different accounting bases (including per share amounts) was
$4.0 million
(
$0.09
per share) and
$6.7 million
(
$0.15
per share) at
June 30, 2017 and December 31, 2016
, respectively. This is supplemental information only and is not a component of Adjusted Book Value.
Factors that impact changes to Adjusted Book Value include many of the same factors that impact Adjusted Earnings, including the majority of revenues and expenses, but generally exclude components of premium earnings since they are embedded in prior period's Adjusted Book Value through the net unearned premiums and fees in excess of expected losses adjustment. Net unearned premiums and fees in excess of expected losses will affect Adjusted Book Value for (i) changes to future premium assumptions (e.g. expected term, interest rates, foreign currency rates, time passage) and (ii) changes to expected losses for policies which do not exceed their related unearned premiums. The Adjusted Book Value decrease from
December 31, 2016
to
June 30, 2017
was primarily driven by Adjusted earnings and changes to foreign currency rates on future premium receipts.
| Ambac Financial Group, Inc.
84
2017 Second Quarter FORM 10-Q |
Market risk represents the potential for losses that may result from changes in the value of a financial instrument as a result of changes in market conditions. The primary market risks that would impact the value of Ambac’s financial instruments are interest rate risk, credit spread risk and foreign currency risk. There have been no material changes to our exposure to these risks from those disclosed in our Annual Report on Form 10-K/A for the year ended December 31, 2016, other than described below. Below we discuss each of these risks and the specific types of financial instruments impacted. Senior managers are responsible for developing and applying methods to measure risk. Ambac utilizes various systems, models and sensitivity scenarios to monitor and manage market risk. These models include estimates, made by management, which utilize current and historical market information. The valuation results from these models could differ materially from amounts that would actually be realized in the market. Financial instruments of VIEs that are consolidated as a result of Ambac's financial guarantees are excluded from the market risk measures below.
Interest Rate Risk:
Financial instruments for which fair value may be affected by changes in interest rates consist primarily of fixed income investment securities, long-term debt and interest rate derivatives. Fixed income investment securities that are guaranteed by Ambac have interest rate risk characteristics that behave inversely to those associated with future financial guarantee claim payments. Accordingly, such securities are excluded from the interest rate sensitivity table below. Changes in fair value resulting from changes in interest rates are driven primarily by the impact of interest rate shifts on the investment portfolio (which produce net fair value losses as rates increase) and long-term debt and the interest rate derivatives portfolio (which produce net fair value gains as rates increase). Interest rate increases would also have a negative economic impact on expected future claim payments within the financial guarantee portfolio. Ambac performs scenario testing to measure the potential for losses in volatile markets. These scenario tests include parallel and non-parallel shifts in the benchmark interest rate curve.
The interest rate derivatives portfolio is managed as an economic hedge against the effects of rising interest rates elsewhere in the Company, including on Ambac's financial guarantee exposures (the "macro-hedge"). As a result of the commutation of certain financial guarantee customer swaps in June 2017, the macro-hedge encompasses the entire interest rate derivatives portfolio as of June 30, 2017. The interest rate sensitivity of the interest rate derivatives portfolio attributable to the macro-hedge position would produce mark-to-market gains or losses of approximately $0.8 million for a 1 basis point parallel shift in USD benchmark interest rates up or down at
June 30, 2017
.
The following table summarizes the estimated change in fair value (based primarily on the valuation methodology discussed in
Note 7. Fair Value Measurements
to the Consolidated Financial Statements included in Part II, Item 8 in this Form 10-K) on these financial instruments, assuming immediate changes in interest rates at specified levels at
June 30, 2017
:
|
Change in Interest Rates
|
||||||||||||||||||||||||
|
($ in millions)
|
300 basis point rise
|
200 basis point rise
|
100 basis point rise
|
Base scenario
|
100 basis point decline
(1)
|
200 basis point decline
(1)
|
||||||||||||||||||
|
Estimated change in net fair value
|
$
|
124
|
|
$
|
86
|
|
$
|
45
|
|
$
|
—
|
|
$
|
(52
|
)
|
$
|
(103
|
)
|
||||||
|
Estimated net fair value
|
1,672
|
|
1,634
|
|
1,593
|
|
1,548
|
|
1,496
|
|
1,445
|
|
||||||||||||
|
(1)
|
Incorporates an interest rate floor of 0%.
|
Due to the low interest rate environment as of
June 30, 2017
, stress scenarios involving interest rate declines greater than 200 basis points are not meaningful to Ambac's portfolios.
Credit Spread Risk
Financial instruments that may be adversely affected by changes in spreads include Ambac’s outstanding credit derivative contracts, certain interest rate derivatives and investment assets. Changes in spreads are generally caused by changes in the market’s perception of the credit quality of the underlying obligor. Market liquidity and prevailing risk premiums demanded by market participants are also reflected in spreads and impact valuations.
The following table summarizes the estimated change in fair values on Ambac’s net derivative liabilities assuming immediate parallel shifts in reference obligation credit spreads related to written credit derivatives and counterparty credit spreads related to uncollateralized interest rate derivatives at
June 30, 2017
. It is more likely that actual changes in credit spreads will vary by obligor:
|
Change in Obligor Spreads
|
||||||||||||||||||||
|
($ in millions)
|
250 basis point widening
|
50 basis point widening
|
Base scenario
|
50 basis point narrowing
|
250 basis point narrowing
|
|||||||||||||||
|
Estimated change in fair value
|
$
|
(27
|
)
|
$
|
(5
|
)
|
$
|
—
|
|
$
|
7
|
|
$
|
22
|
|
|||||
|
Estimated fair value
|
(40
|
)
|
(18
|
)
|
(13
|
)
|
(6
|
)
|
9
|
|
||||||||||
Also included in the fair value of credit derivative liabilities is the effect of Ambac’s creditworthiness, which reflects market perception of Ambac’s ability to meet its obligations. Incorporating estimates of Ambac’s credit valuation adjustment into the determination of fair value has resulted in a $1.4 million reduction to the credit derivatives liability as of
June 30, 2017
. At
June 30, 2017
the credit valuation adjustment resulted in a 13.3% reduction of the credit derivative liability as measured before considering Ambac credit risk. Refer to
Note 7. Fair Value Measurements
| Ambac Financial Group, Inc.
85
2017 Second Quarter FORM 10-Q |
to the Consolidated Financial Statements included in Part II, Item 8 in this Form 10-K for further information on measurement of the credit valuation adjustment.
The fair value of interest rate derivatives may also be affected by changes to the credit valuation adjustment attributable to the risk of Ambac non-performance. Generally, the need for an Ambac credit valuation adjustment is mitigated by the existence of collateral posting agreements under which adequate collateral has been posted. Derivative contracts entered into with credit exposure to financial guarantee customers are not typically subject to collateral posting agreements. As a result of the commutation of certain such derivatives in June 2017, there are no significant uncollateralized interest rate derivative liabilities as of June 30, 2017. Therefore, Ambac’s credit valuation adjustment included in the fair value of interest rate swaps was $0.0 million as of
June 30, 2017
.
The following table summarizes the estimated change in fair values on Ambac's net derivative liabilities assuming immediate shifts in Ambac credit spreads used to determine the CVA at
June 30, 2017
:
|
Change in Ambac Credit Spreads
|
||||||||||||||||||||
|
($ in millions)
|
250 basis point widening
|
50 basis point widening
|
Base scenario
|
50 basis point narrowing
|
250 basis point narrowing
|
|||||||||||||||
|
Estimated change in fair value
|
$
|
1
|
|
$
|
—
|
|
$
|
—
|
|
$
|
—
|
|
$
|
(1
|
)
|
|||||
|
Estimated fair value
|
(12
|
)
|
(13
|
)
|
(13
|
)
|
(13
|
)
|
(14
|
)
|
||||||||||
Ambac’s fixed income investment portfolio contains securities with different sensitivities to and volatility of spreads. Fixed income securities that are guaranteed by Ambac and were purchased in Ambac's investment portfolio
have credit spread risk characteristics that behave inversely to those associated with future financial guarantee claim payments.
Accordingly, such securities are excluded from the company's spread sensitivity measures. The following table summarizes the estimated change in fair values of Ambac’s fixed income investment portfolio assuming immediate shifts in credit spreads across holdings other than Ambac guaranteed securities at
June 30, 2017
. It is more likely that actual changes in credit spreads will vary by security:
|
Change in Spreads
|
||||||||||||||||||||
|
($ in millions)
|
250 basis point widening
|
50 basis point widening
|
Base scenario
|
50 basis point narrowing
(1)
|
250 basis point narrowing
(1)
|
|||||||||||||||
|
Estimated change in fair value
|
$
|
(234
|
)
|
$
|
(50
|
)
|
$
|
—
|
|
$
|
51
|
|
$
|
139
|
|
|||||
|
Estimated fair value
|
2,689
|
|
2,873
|
|
2,923
|
|
2,974
|
|
3,062
|
|
||||||||||
|
(1)
|
Incorporates a credit spread floor of 0 basis points.
|
Foreign Currency Risk
Ambac has financial instruments denominated in currencies other than the U.S. dollar, primarily pounds sterling, euros and Australian dollars. These financial instruments are primarily invested assets of Ambac UK and credit derivative contracts. The following table summarizes the estimated net change in fair value of these financial instruments assuming immediate shifts in spot foreign exchange rates to U.S. dollars as of
June 30, 2017
.
|
Change in Foreign Exchange Rates Against U.S. Dollar
|
||||||||||||||||
|
($ in millions)
|
20%
Decrease |
10%
Decrease |
10%
Increase |
20%
Increase |
||||||||||||
|
Estimated change in fair value
|
$
|
(55
|
)
|
$
|
(27
|
)
|
$
|
27
|
|
$
|
55
|
|
||||
In connection with the preparation of this
second
quarter Form
10-Q
, an evaluation was carried out by Ambac’s management, with the participation of Ambac’s Chief Executive Officer and Chief Financial Officer, of the effectiveness of Ambac’s disclosure controls and procedures (as defined in rules 13a-15(e) and 15d-15(e) under the Securities Exchange Act of 1934 (Exchange Act)) as of the end of the period covered by this Quarterly Report on Form 10-Q. Management recognizes that any controls and procedures, no matter how well designed and operated, can provide only reasonable assurance of achieving their objectives and management necessarily applies its judgment in evaluating the cost-benefit relationship of possible controls and procedures.
Disclosure controls and procedures are designed to ensure that the information required to be disclosed in reports filed or submitted under the Exchange Act is recorded, processed, summarized and reported within the time periods specified in the SEC rules and forms and that such information is accumulated and communicated to management, including the Chief Executive Officer and Chief Financial Officer, to allow timely decisions regarding required disclosures. Ambac management is committed to maintaining an effective internal control environment over financial reporting. Based on its evaluation, Ambac’s Chief Executive Officer and Chief Financial Officer have concluded that, as of
June 30, 2017
, Ambac’s disclosure controls and procedures were effective.
There were no changes in the Company’s internal control over financial reporting that occurred during the quarter ended
June 30, 2017
that has materially affected, or is reasonably likely to materially affect, the Company’s internal control over financial reporting.
| Ambac Financial Group, Inc.
86
2017 Second Quarter FORM 10-Q |
Please refer to
Note 11. Commitments and Contingencies
of the Unaudited Consolidated Financial Statements located in Part I, Item 1 in this Form 10-Q and Note 18. Commitments and Contingencies in Part II, Item 8 in the Company’s Annual Report on Form 10-K for the year ended
December 31, 2016
for a discussion on legal proceedings against Ambac and its subsidiaries.
You should carefully consider the risk factors set forth in the “Risk Factors” section, Item 1A to Part I in our Annual Report on Form 10-K for the year ended
December 31, 2016
, which are hereby incorporated by reference, as well as the additional risk factor information appearing below in this section and elsewhere in this report. These important factors may cause our actual results to differ materially from those indicated by our forward-looking statements, including those contained in this report. Please also see the section entitled “Cautionary Statement Pursuant to the Private Securities Litigation Reform Act of 1995” in the “Management’s Discussion and Analysis of Financial Condition and Results of Operations” section of this quarterly report on Form 10-Q. Other than as set forth below, there have been no material changes to the risk factors we have disclosed in the “Risk Factors” section of our aforementioned Annual Report on Form 10-K.
Some issuers of public finance obligations we insure are experiencing fiscal stress that could result in increased losses on those obligations or increased liquidity claims, including losses or claims resulting from payment defaults, Chapter 9 bankruptcy or other restructuring proceedings or loss of market access.
We have historically experienced low levels of defaults in our public finance insured portfolio, including during the financial crisis that began in mid-2007. However, some issuers of public finance obligations we insure continue to report budget shortfalls, significantly underfunded pensions or other fiscal stresses that will require them to significantly raise taxes and/or cut spending in order to satisfy their obligations. Government entities may also take other actions that may impact their own creditworthiness or the creditworthiness of related issuers. Some issuers of obligations we insure have declared a payment moratorium, defaulted or filed for bankruptcy, raising concerns about their ultimate ability to service the debt we insure and our ability to recover claims paid in the future. If the issuers of the obligations in our public finance portfolio are unable to raise taxes, cut spending, or receive federal or state assistance, or if such issuers default or file for bankruptcy under Chapter 9 or for similar relief under other laws that allow for the adjustment of debts, we may experience liquidity claims and/or ultimate losses on those obligations, which could adversely affect our business, financial condition and results of operations.
We insure obligations of several issuers that have filed for bankruptcy protection under Chapter 9 or, in the case of Puerto Rico, Title III of the Puerto Rico Oversight, Management, and Economic Stability Act (“PROMESA”). The consequences of such proceedings for creditors remain uncertain. For example, the treatment of general obligation debt in relation to other obligations remains in flux, with Detroit's 2014 precedent unfavorable for debt creditors. If issuers succeed in materially adjusting their obligations to bondholders and financial guarantors, other issuers may be encouraged to default or file for Chapter 9 or similar legal protection and seek adjustments to their debts. These events could materially increase losses in Ambac’s insured portfolio of municipal credits.
Loss of market access is a risk embedded in our municipal exposures. From time to time the municipal bond market evidences heightened investor concerns overall or for select sectors or issuers, as has been the case with Puerto Rico. Such adverse market conditions may trigger a loss of market liquidity for affected issuers, which in turn may significantly raise their cost of alternative financing or cause a liquidity crisis and potential for default on debt service payments we guarantee.
We have over $2 billion of net par exposure to the Commonwealth of Puerto Rico, including its authorities and public corporations. Components of Puerto Rico net par outstanding include capital appreciation bonds that are reported at the par amount at the time of issuance of the related insurance policy as opposed to the current accreted value of the bond. The Commonwealth has previously announced that it cannot meet its obligations and that it intends to impair some or all of its creditors. Due to the activation of the "Priority Debt Provision" in late 2015, certain revenues pledged for the repayment of debt issued by Puerto Rico Infrastructure Financing Authority (“PRIFA”), Puerto Rico Highways and Transportation Authority (“PRHTA”) and Puerto Rico Convention Center District Authority (“PRCCDA”) were diverted by the Commonwealth and not applied to debt service on PRIFA, PRHTA and PRCCDA debt obligations. On June 30, 2016, Gov. García-Padilla signed executive orders suspending payments on General Obligation debt and other debt under Law 21, the Emergency Moratorium and Financial Rehabilitation Act (enacted April 6, 2016). On January 29, 2017, current Governor Rosselló enacted Act 5 of 2017 known as the Puerto Rico Financial Emergency and Fiscal Responsibility Act of 2017 (“Act 5”) which, among other things, established an emergency period and also that the executive orders under Act 21 shall continue in full force and effect until amended, rescinded or superseded . The emergency period was originally set to expire on May 1, 2017. It was later extended to August 1, 2017 via Executive Order 2017-31 and more recently extended until December 31, 2017 by Act 46, which was enacted on July 19, 2017.
The Commonwealth has proposed to restructure and renegotiate its obligations and those of certain of its instrumentalities. It adopted a Fiscal and Economic Growth Plan, certified by the Oversight Board created under PROMESA on March 13, 2017, that implies significant discounts to all debt service due to be paid by the Commonwealth and its instrumentalities and, on April 28, 2017, the Fiscal Agency and Financial Advisory Authority of Puerto Rico released a restructuring proposal that also includes significant discounts to debt service to be paid on Ambac-insured credits. In addition, the Oversight Board commenced a PROMESA Title III proceeding for the Commonwealth of Puerto Rico on May 3, 2017 and for COFINA on May 5, 2017. Subsequently
,
the
Oversight Board commenced a Title III proceeding for the Employees Retirement System
| Ambac Financial Group, Inc.
87
2017 Second Quarter FORM 10-Q |
and PRHTA on May 21, 2017, and for the Puerto Rico Electric Power Authority on July 2, 2017. It is currently unclear which additional Commonwealth entities and instrumentalities, if any, will pursue a plan of adjustment of their debts under Title III or continue to pursue consensual debt restructuring pursuant to Title VI of PROMESA. See "
Note 1. Background and Business Description
- Puerto Rico" for more information on these developments. Given the numerous uncertainties existing with respect to the restructuring process and relevant litigations, no assurance can be given that debt service discounts will not be severe and cause Ambac to experience losses materially exceeding current reserves. These and other long term financial planning, restructuring solutions and associated legislation, budgets and/or public policy could be proposed or adopted that could significantly impair our exposures, including by failing to recognize or properly differentiate legal structures and protections applicable to such exposures, such that losses may exceed our current reserves by a material amount and our loss reserves would need to be increased. In particular, in a Title III process, should court-approved plans of adjustment for the Commonwealth, COFINA or any other issuers of Ambac-insured debt that file for Title III protection be based on the certified FEGP from March 13, 2017, the Fiscal Plan Compliance Act be upheld, or Ambac receive unfavorable judgments in the litigations to which it is a party, Ambac’s financial condition could be materially adversely affected. It is also possible that outcomes may be worse than forecast under the certified FEGP or under proposals or plans promulgated by the Commonwealth or its instrumentalities in or in connection with a Title III process or otherwise. Even a negotiated restructuring to which Ambac agrees as part of a Title VI or other process may involve material losses in excess of current reserves.
Litigation affecting the legal protections on which Ambac Assurance and its insured exposures rely is likely to intensify which, if decided adversely to Ambac Assurance, may materially increase our risk of loss. On October 7, 2016, certain holders of Puerto Rico’s GO bonds requested leave of court to file an amended complaint that, among other things, challenges the structure of the Puerto Rico Sales Tax Financing Corporations ("COFINA") and seeks injunctive relief requiring the sales and use tax proceeds securing the bonds issued by COFINA to be transferred to the Commonwealth treasury for payment of GO bonds. (See discussion of Lex Claims, LLC et al. v. Alejandro García--Padilla et al. (United States District Court, District of Puerto Rico, No. 16-2374) in
Note 11. Commitments and Contingencies
). If successful, the GO plaintiffs’ challenge against COFINA, and any similar claims that could be asserted by other plaintiffs in the future, could have a material adverse impact on Ambac’s liquidity, loss reserves and capital resources. Similarly, the Commonwealth defendants in Ambac's litigation concerning PRHTA have challenged the existence and/or enforceability of Ambac's and other PRHTA creditors' liens on certain revenues pledged to secure PRHTA's bonds. The resolution of claims brought in these and other litigations relating to Ambac's Puerto Rico exposures (as described in
Note 11. Commitments and Contingencies
), and any other cases brought as part of Title III proceedings or otherwise (whether by Ambac Assurance or other parties), may have a material effect on Ambac’s financial condition and results of operation.
As a result of the developments described above, the Commonwealth and certain of its instrumentalities will continue to default on debt service payments, including payments owed on bonds insured by Ambac Assurance. Ambac Assurance may be required to make significant amounts of policy payments over the next several years, the recoverability of which is subject to great uncertainty, which may lead to material permanent losses. Our exposure to Puerto Rico is impacted by the amount of monies available for debt service, which are in turn affected by variability in economic growth, tax revenues, essential services expense as well as federal funding of Commonwealth needs. While our reserving scenarios reflect a wide range of possible outcomes reflecting the significant uncertainty regarding future developments and outcomes, given our exposure to Puerto Rico and the economic, fiscal, legal and political uncertainties associated therewith, our loss reserves may ultimately prove to be insufficient to cover our losses, potentially by a material amount, and may be subject to material volatility.
While Ambac and Ambac Assurance have entered into a Rehabilitation Exit Support Agreement as part of a plan to resolve the rehabilitation of the Segregated Account, there can be no assurance that the rehabilitation of the Segregated Account will be successfully concluded.
On July 19, 2017, Ambac, Ambac Assurance and a number of holders of surplus notes of Ambac Assurance and beneficial interests in Deferred Amounts of the Segregated Account entered into a Rehabilitation Exit Support Agreement contemplating a series of transactions that would, assuming the satisfaction of various conditions, lead to the conclusion of the Segregated Account Rehabilitation Proceedings. On July 19, 2017, the Rehabilitator announced his support for such transactions and indicated that he intended to file with the Rehabilitation Court a plan for the exit of the Segregated Account from rehabilitation.
Execution of a plan to conclude the Segregated Account Rehabilitation Proceedings is subject to various conditions and uncertainties. The parties to the Rehabilitation Exit Support Agreement may terminate the agreement if certain events relative to the conclusion of the rehabilitation do not occur within agreed time periods, or if the Rehabilitator seeks an order or other relief from the Rehabilitation Court, or the Rehabilitation Court issues an order or grants relief, that is inconsistent in any material respect with the transactions contemplated by the Rehabilitation Exit Support Agreement. The Rehabilitation Exit Support Agreement may also be terminated if there is a material breach of the agreement by a party thereto. We can provide no assurance that any of these termination events will not arise. Upon termination of the Rehabilitation Exit Support Agreement, the Rehabilitator may abandon pursuit of a plan for the exit of the Segregated Account from rehabilitation or may pursue a plan with different terms or features than those contemplated by the Rehabilitation Exit Support Agreement.
The conclusion of the Segregated Account Rehabilitation Proceedings will require the approval of the Rehabilitation Court, which may not be obtained. Even if the Rehabilitation Exit Support Agreement remains in effect and the Rehabilitator is pursuing a plan for the exit of the Segregated Account from rehabilitation that is consistent with the Rehabilitation Exit Support Agreement, the Rehabilitation Court may determine that such plan does not meet the legal requirements for the rehabilitation proceedings to be concluded. The failure to obtain court approval would create significant uncertainty with respect to whether or when the Segregated Account Rehabilitation Proceedings could be concluded in the near term or at all.
For the Rehabilitator to continue to support the transactions contemplated by the Rehabilitation Exit Support Agreement and pursue a plan for the Segregated Account to exit rehabilitation based on such agreement, the Rehabilitator will need to be satisfied that Ambac Assurance will
| Ambac Financial Group, Inc.
88
2017 Second Quarter FORM 10-Q |
have sufficient capital and claims-paying resources to effect such transactions and to meet its obligations after the Segregated Account Rehabilitation Proceedings have been terminated. That determination will, in part, be made based on whether Ambac Assurance is successful in closing the Tier 2 Note issuance. We can provide no assurance that Ambac Assurance will be able to close the Tier 2 Note issuance or will not suffer losses or fail to mitigate or remediate losses or achieve recoveries or investment objectives such that the Rehabilitator abandons pursuit of a plan for the exit of the Segregated Account from rehabilitation or decides to pursue a plan with different terms or features than those contemplated by the Rehabilitation Exit Support Agreement.
It is contemplated that the effectiveness of a plan for the exit of the Segregated Account from rehabilitation will be conditioned upon the consummation of certain exchange offers involving Ambac Assurance’s surplus notes. Such exchange offers will require a high level of participation by holders of surplus notes, receipt of consents necessary to modify the Settlement Agreement as contemplated by the Rehabilitation Exit Support Agreement, and OCI approval of the exchange offers as well as a one-time current interest payment on surplus notes that remain outstanding immediately after the effectiveness of the plan for the exit of the Segregated Account from rehabilitation. It is further contemplated that the effectiveness of a plan for the exit of the Segregated Account from rehabilitation will be conditioned upon the receipt of favorable rulings from the United States Internal Revenue Service, and of favorable legal opinions, on certain tax-related issues. We can provide no assurance that such conditions will be satisfied.
The failure to consummate the Rehabilitation Transactions due to the foregoing events or circumstances or other reasons may cause the Rehabilitator to pursue a different plan to conclude the Segregated Account Rehabilitation Proceedings or to abandon the pursuit of a near-term resolution of such proceedings. Either alternative would have uncertain consequences for the Company and for holders of our securities or securities insured by Ambac Assurance or the Segregated Account. If the Segregated Account were to remain in rehabilitation or exit rehabilitation based on a plan other than that envisioned by the Rehabilitation Exit Support Agreement, the equity value and claims-paying resources of Ambac Assurance may be diminished, Ambac Assurance's long-term viability may be less certain, and the Company's ability to create value apart from Ambac Assurance may be impaired.
Even if the Segregated Account Rehabilitation Proceedings could be brought to a successful conclusion, there can be no assurance that any level of capital deemed sufficient by OCI to permit such conclusion will be sufficient to cover all future losses, whether currently anticipated or unanticipated. Moreover, OCI should be expected to more closely scrutinize the operations of, and transactions proposed to be completed by, Ambac Assurance after the Segregated Account Rehabilitation Proceedings are completed compared to other insurance companies, including by imposing on Ambac Assurance reporting requirements and restrictions on transactions or other activities, which may create additional challenges or obstacles with respect to Ambac Assurance's ability to deliver value to Ambac and Ambac's ability to deliver value to stockholders.
Ambac Assurance will be required to raise additional liquidity to fund the cash component of the Segregated Account rehabilitation exit plan, subjecting us to the risk of loss from market and interest rate risk
The Rehabilitation Exit Transactions contemplate a payment of 40% of the accreted value of Deferred Amounts and Ambac Assurance surplus notes in cash. As a result, Ambac Assurance will be required to sell fixed income and other assets to generate the cash requirements of the plan. Market conditions, including liquidity, credit spread, and interest rates, may change resulting in sales prices for assets that are below current market levels and may cause losses to be realized that would have not been realized absent the need to fund the Rehabilitation Exit Transactions. As another consequence to realizing such losses, Ambac Assurance may be required to raise or create additional capital to satisfy the OCI's capital requirements to conclude the Segregated Account Rehabilitation Proceedings. No assurance may be given that Ambac Assurance will be able to raise or create any additional capital required by OCI.
Ambac’s estimate of RMBS litigation recoveries is subject to significant uncertainty and changes to the estimate could adversely impact its liquidity, financial condition and results of operations.
For Ambac’s current RMBS cases for which it records a representation and warranty recovery in its financial statements, Ambac has been provided access to loan files for all loans in the relevant original pool and Ambac utilizes a “random sample” approach to estimate such recoveries. Ambac does not include estimates of damages attributed solely to fraudulent inducement claims in its estimate of representation and warranty recoveries.
The amount estimated for purposes of Ambac’s representation and warranty recovery and the amount Ambac may ultimately receive is subject to significant uncertainty, including risks inherent in litigation, collectability of such amounts from counterparties and/or their respective parents and affiliates, timing of receipt of any recoveries, intervention by the OCI, which could impede Ambac’s ability to take actions required to realize recoveries, and uncertainties inherent in the assumptions used in estimating any recoveries. In particular, Ambac’s assumptions regarding default rates of the loans and Ambac’s expectations with respect to the RMBS litigations have a significant impact on Ambac’s estimated representation and warranty recoveries. If these assumptions, expectations or estimates prove to be incorrect, or if an investor were to use different assumptions, expectations or estimates to predict recoveries, actual recoveries could differ materially from those estimated. Actual recovery will ultimately depend on future events and there can be no assurance that the assumed default rates or estimated RMBS litigations recoveries will not differ from actual events. Although Ambac believes that its methodology for extrapolating estimated recoveries is appropriate for evaluating the amount of potential recoveries, the methodologies Ambac uses to estimate expected losses in general and for any specific obligation in particular may not be similar to methodologies used by Ambac’s competitors, counterparties or other market participants. The determination of expected recovery is an inherently subjective process involving numerous estimates, assumptions and judgments by management, using both internal and external data sources with regard to frequency, economic projections and other factors that affect credit performance. As a result, Ambac’s current estimates may not reflect Ambac’s future ultimate recovery and management makes no representation that the actual amount recovered, if any, will not differ materially from those estimated. The failure of Ambac’s actual recovery to meet or exceed its current estimate could result in a material adverse effect on Ambac’s financial condition, including its capital and liquidity. Refer to “Critical Accounting Policies and Estimates” in Part
| Ambac Financial Group, Inc.
89
2017 Second Quarter FORM 10-Q |
II, Item 7 and
Note 2. Basis of Presentation and Significant Accounting Policies
and
Note 7. Financial Guarantee Insurance Contracts
to the Consolidated Financial Statements included in Part II, Item 8 in Ambac’s Form 10-K for the fiscal year ended December 31, 2016 and
Note 6. Financial Guarantee Insurance Contracts
to the Unaudited Consolidated Financial Statements included in Part I, Item 1 in this Form 10-Q for more information regarding the estimation process.
Ambac’s representation and warranty recovery may change over time, causing the value or the perceived value of the collateral securing the Tier II Notes that Ambac Assurance expects to issue to change and any such changes may be material.
Ambac reevaluates its estimated representation and warranty recoveries on a quarterly basis in connection with the preparation of its financial statements. See “Critical Accounting Policies and Estimates” in Part II, Item 7 and
Note 2. Basis of Presentation and Significant Accounting Policies
and
Note 7. Financial Guarantee Insurance Contracts
to the Consolidated Financial Statements included in Part II, Item 8 of Ambac’s Form 10-K for the fiscal year ended December 31, 2016 and
Note 6. Financial Guarantee Insurance Contracts
to the Unaudited Consolidated Financial Statements included in Part I, Item 1 in this Form 10-Q. As a result of any reevaluation, the amount of Ambac’s representation and warranty recovery may be adjusted upward or downward due to, among other things, changes in management's view of the value of such recoveries and/or changes in the loss reserves related to such recoveries, and any adjustment may be material. Changes in representation and warranty recoveries may result in material changes in Ambac’s financial condition, including its capital and liquidity. In addition, any adjustment to representation and warranty recoveries may alter the value or the perceived value of the collateral securing the Tier 2 Notes that Ambac Assurance expects to issue in connection with the Rehabilitation Exit Transactions before payment on the Tier 2 Notes is made in full, which may affect the value of, and trading market, if any, for, the Tier 2 Notes. Adjustments to Ambac’s representation and warranty recoveries are solely in Ambac’s discretion and management makes no representation that the amounts will not change, materially or at all, including in the near term. There can be no assurance that the apparent, or actual, value of the collateral securing the Tier 2 Notes that Ambac Assurance expects to issue will equal or exceed the principal amount of the Tier 2 Notes at all times prior to maturity.
We are subject to credit risk and other risks in our insured portfolio, including related to RMBS and securities backed by student loans. We are also subject to risks associated with adverse selection as our insured portfolio runs off. Measures taken to reduce such risks may have an adverse effect on operating results or financial position.
Performance of our insured transactions, including (but not limited to) RMBS transactions and those involving securities backed by student loans, can be adversely affected by general economic conditions, such as recession, rising unemployment rates, underemployment, home prices that decline or do not increase in the patterns assumed in our models, increasing foreclosure rates and unavailability of consumer credit, mortgage product attributes, such as interest rate adjustments and balloon payment obligations, borrower and/or originator fraud, mortgage and student loan servicer performance or underperformance and financial difficulty, such as risks related to whether the servicer may be required to delay the remittance of any cash collections held by it or received by it after the time it becomes subject to bankruptcy or insolvency proceedings.
While further deterioration in the performance of consumer assets, including mortgage-related assets and student loans, may occur, the timing, extent and duration of any future deterioration of the credit markets is unknown, as is the impact on potential claim payments and ultimate losses on the securities within Ambac Assurance’s portfolio. In addition, there can be no assurance that any governmental or private sector initiatives designed to address such credit deterioration in the markets will be successful or inure to the benefit of the transactions we insure. For example, any initiative which permits the discharge of student loan debt in bankruptcy may adversely affect our portfolio. Similarly, servicer settlements with governmental authorities regarding foreclosure or servicing irregularities are generally designed to protect borrowers and may increase losses on securities we insure. In particular, the student loan industry and, specifically, trusts with securities insured by Ambac Assurance have been subject to heightened Consumer Finance Protection Bureau (CFPB) scrutiny and review over servicing and collections practices and potential chain of title issues and, consequently, any settlements or penalties resulting from this scrutiny and review, or any failure on the part of servicers or other parties asserting claims against delinquent borrowers to establish title to the loans, could lead to increased losses on securities we insure.
As the runoff of the insured portfolio continues, the proportion of exposures we rate as below investment grade relative to the aggregate insured portfolio is likely to continue to increase, leaving the portfolio increasingly concentrated in higher risk exposures. This risk may result in greater volatility or have adverse effects on our results from operations and on our financial condition.
One of our primary goals is to create shareholder value through transaction terminations, policy commutations, settlements and restructurings that we believe will improve our risk profile. As we take such actions to reduce known and potential risks, such actions may negatively impact our operating results or financial position in one or more reporting periods.
We are subject to concentration and essentiality risk in our insured portfolio in connection with Military Housing insured debt. Over time, Military Housing exposure, given its long-dated maturities, will become a larger percentage of Ambac's remaining insured exposure and will likely be subject to increased Base Realignment and Closure (“BRAC”) risk.
Ambac insures approximately $5.9 billion net par of privatized military housing debt with maturities generally between 2035 and 2055. This represents approximately 8.3% of Ambac’s remaining insured exposure at June 30, 2017. With the passage of time, military housing debt is expected to grow as a percentage of Ambac's total net par outstanding given its relatively long-dated maturity profile. The debt was issued to finance the construction and/or renovation of housing units for military personnel and their families on domestic U.S. military bases. Debt service is not directly paid or guaranteed by the U.S. Government. Rather, the bonds are serviced from the cash flow generated in most cases by rental payments deposited by the military directly into lockbox accounts as part of each service personnel’s Basic Allowance for Housing (BAH). In a small number of cases, rental payments are also coming from civilians, including retired service personnel, living on a particular base. Collateral for these transactions includes the BAH payments as well as an interest in the ground lease. Risk factors affecting these transactions include
| Ambac Financial Group, Inc.
90
2017 Second Quarter FORM 10-Q |
ongoing base essentiality and military deployments and consequently the closure of a base due to a new BRAC process. BRAC is the congressionally authorized process the Department of Defense has used to reorganize its base structure more efficiently and effectively to support U.S. forces and has included the closure of bases in the past. In addition to BRAC, other risks include the U.S. government’s commitment to fund the BAH, the marketability/attractiveness of the on-base housing units versus off base housing, construction completion, environmental remediation, utility and other operating costs, and housing management. The impact of a BRAC-related base closure or the failure of the U.S. government to fund BAH could result in greater than expected losses to the affected Military Housing insured debt.
|
Item 2.
|
Unregistered Sales of Equity Securities and Use of Proceeds
|
|
(a)
|
Unregistered Sales of Equ
ity Securities
|
None.
|
(b)
|
Purchases of Equity Securities By the Issuer and Affiliated Purchasers
|
The following table summarizes Ambac’s activity of share purchases during the
second
quarter of
2017
. When restricted stock unit awards or performance stock unit awards issued by Ambac become taxable compensation to employees, shares may be withheld to cover the employee’s withholding taxes. In the
second
quarter of
2017
, Ambac purchased shares from employees that settled performance stock units to meet employee tax withholdings.
|
Total Shares
Purchased
(1)
|
Average Price
Paid Per Share
|
Total Number of
Shares Purchased
as Part of Publicly
Announced Plan
(1)
|
Maximum
Number of Shares
That May Yet Be
Purchased Under
the Plan
|
|||||||||
|
April 2017
|
—
|
|
$
|
—
|
|
—
|
|
—
|
|
|||
|
May 2017
|
16,243
|
|
17.18
|
|
—
|
|
—
|
|
||||
|
June 2017
|
—
|
|
—
|
|
—
|
|
—
|
|
||||
|
Second Quarter 2017
|
16,243
|
|
$
|
17.18
|
|
—
|
|
—
|
|
|||
|
(1)
|
There were no other repurchases of equity securities made during the three months ended
June 30, 2017
. Ambac does not have a stock repurchase program.
|
Warrants
On June 30, 2015, the Board of Directors of Ambac authorized the establishment of a warrant repurchase program that permits the repurchase of up to $10 million of warrants. On November 3, 2016, the Board of Directors of Ambac authorized a $10 million increase to the warrant repurchase program. As of
June 30, 2017
, Ambac had repurchased
985,331
warrants totaling
$8.1 million
leaving
4,053,670
warrants outstanding with an exercise price of $16.67 per share and expiration of April 30, 2023. The remaining aggregate authorization at
June 30, 2017
is
$11.9 million
.
|
Item 3.
|
Defaults Upon Senior Securities
|
None.
Not applicable.
None.
| Ambac Financial Group, Inc.
91
2017 Second Quarter FORM 10-Q |
|
Exhibit
Number |
Description
|
|
|
10.1
|
||
|
10.2
|
||
|
12.1+
|
Computation of Ratio of Earnings to Fixed Charges.
|
|
|
31.1+
|
Certification of Chief Executive Officer Pursuant to Rules 13a-14(a) and 15d-14(a) Promulgated under the Securities Exchange Act of 1934, as amended.
|
|
|
31.2+
|
Certification of Chief Financial Officer Pursuant to Rules 13a-14(a) and 15d-14(a) Promulgated under the Securities Exchange Act of 1934, as amended.
|
|
|
32.1++
|
Certification of Chief Executive Officer and Chief Financial Officer Pursuant to 18 U.S.C. Section 1350 as Adopted Pursuant to Section 906 of the Sarbanes-Oxley Act of 2002.
|
|
|
101.INS
|
XBRL Instance Document.
|
|
|
101.SCH
|
XBRL Taxonomy Extension Schema Document.
|
|
|
101.CAL
|
XBRL Taxonomy Extension Calculation Linkbase Document.
|
|
|
101.LAB
|
XBRL Taxonomy Extension Label Linkbase Document.
|
|
|
101.PRE
|
XBRL Taxonomy Extension Presentation Linkbase Document.
|
|
|
101.DEF
|
XBRL Taxonomy Extension Definition Linkbase Document.
|
|
|
+ Filed herewith. ++ Furnished herewith.
|
||
SIGNATURES
Pursuant to the requirements of Section 13 or 15(d) of the Securities Exchange Act of 1934, the Registrant has caused this report to be signed on its behalf by the undersigned, thereunto duly authorized.
|
AMBAC FINANCIAL GROUP, INC.
|
|||
|
Dated:
|
August 9, 2017
|
By:
|
/S/ DAVID TRICK
|
|
Name:
|
David Trick
|
||
|
Title:
|
Chief Financial Officer and Treasurer
|
||
|
(Duly Authorized Officer and
|
|||
|
Principal Financial Officer)
|
|||
| Ambac Financial Group, Inc.
92
2017 Second Quarter FORM 10-Q |
TABLE OF CONTENTS
Part I. Financial InformationItem 1. Unaudited Financial Statements Of Ambac Financial Group, Inc. and SubsidiariesNote 11. Commitments and ContingenciesNote 2. Basis Of Presentation and Significant Accounting PoliciesNote 1. Background and Business DescriptionNote 7. Fair Value MeasurementsNote 8. InvestmentsNote 3. Special Purpose Entities, Including Variable Interest EntitiesNote 18: Commitments and ContingenciesItem 2. Management S Discussion and Analysis Of Financial Condition and Results Of OperationsPart Ii, Item 1A. Risk FactorsNote 9. Fair Value MeasurementsNote 9. Insurance Regulatory RestrictionsNote 9. Derivative InstrumentsNote 6. Financial Guarantee Insurance ContractsItem 3. Quantitative and Qualitative Disclosures About Market RiskItem 4. Controls and ProceduresPart II. Other InformationItem 1. Legal ProceedingsItem 1A. Risk FactorsNote 7. Financial Guarantee Insurance ContractsItem 2. Unregistered Sales Of Equity Securities and Use Of ProceedsItem 3. Defaults Upon Senior SecuritiesItem 4. Mine Safety DisclosuresItem 5. Other InformationItem 6. Exhibits