AMC NETWORKS INC.
10-Ks and 10-Qs
|
|
|
|
|
|
|
|
|
|
|
|
|
|
|
|
|
|
|
|
|
|
|
|
|
|
|
|
|
|
|
|
|
|
|
|
|
|
|
|
|
|
|
|
|
|
|
|
|
|
UNITED STATES
SECURITIES AND EXCHANGE COMMISSION
WASHINGTON, D.C. 20549
FORM 10-K
(Mark One)
|
þ
|
Annual report pursuant to Section 13 or 15(d) of the Securities Exchange Act of 1934
|
For the fiscal year ended
December 31, 2013
or
|
¨
|
Transition report pursuant to Section 13 or 15(d) of the Securities Exchange Act of 1934
|
For the transition period from to
Commission File Number: 1-35106
AMC Networks Inc.
(Exact name of registrant as specified in its charter)
|
Delaware
|
|
27-5403694
|
|
(State or other jurisdiction of
incorporation or organization)
|
|
(I.R.S. Employer
Identification No.)
|
|
11 Penn Plaza, New York, NY
|
|
10001
|
|
(Address of principal executive offices)
|
|
(Zip Code)
|
(212) 324-8500
(Registrant’s telephone number, including area code)
Securities registered pursuant to Section 12(b) of the Act:
|
Title of each class
|
|
Name of each exchange on which registered
|
|
Class A Common Stock, par value $0.01 per share
|
|
The NASDAQ Stock Market LLC
|
Securities registered pursuant to Section 12(g) of the Act:
None
Indicate by check mark if the registrant is a well-known seasoned issuer, as defined in Rule 405 of the Securities Act.
Yes
þ
No
¨
Indicate by check mark if the registrant is not required to file reports pursuant to Section 13 or 15(d) of the Act. Yes
¨
No
þ
Indicate by check mark whether the registrant (1) has filed all reports required to be filed by Section 13 or 15(d) of the Securities Exchange Act of 1934 during the preceding 12 months (or for such shorter period that the registrant was required to file such reports), and (2) has been subject to such filing requirements for the past 90 days. Yes
þ
No
¨
Indicate by check mark whether the registrant has submitted electronically and posted on its corporate Website, if any, every Interactive Data File required to be submitted and posted pursuant to Rule 405 of Regulation S-T (§232.405 of this chapter) during the preceding 12 months (or for such shorter period that the registrant was required to submit and post such files). Yes
þ
No
¨
Indicate by check mark if disclosure of delinquent filers pursuant to Item 405 of Regulation S-K (§229.405 of this chapter) is not contained herein, and will not be contained to the best of registrant’s knowledge, in definitive proxy or information statements incorporated by reference in Part III of this Form 10-K or any amendment to this Form 10-K.
þ
Indicate by check mark whether the registrant is a large accelerated filer, an accelerated filer, a non-accelerated filer, or a smaller reporting company (as defined in Exchange Act Rule 12b-2).
|
Large accelerated filer
|
þ
|
Accelerated filer
|
¨
|
|
Non-accelerated filer
|
¨
|
Smaller reporting company
|
¨
|
Indicate by check mark whether the registrant is a shell company (as defined in Rule 12b-2 of the Exchange Act). Yes
¨
No
þ
The aggregate market value of the registrant’s common stock held by non-affiliates of the registrant, computed by reference to the closing price of a share of common stock on June 28, 2013 (the last business day of the registrant’s most recently completed second fiscal quarter) was approximately
$3,923,000,000
.
The number of shares of common stock outstanding as of
February 18, 2014
:
|
Class A Common Stock par value $0.01 per share
|
60,813,360
|
|
|
Class B Common Stock par value $0.01 per share
|
11,484,408
|
|
DOCUMENTS INCORPORATED BY REFERENCE:
Certain information required in Item 10 through Item 14 of Part III of this Annual Report on Form 10-K is incorporated herein by reference to the Registrant’s definitive Proxy Statement for its
2014
Annual Meeting of Stockholders, which shall be filed with the Securities and Exchange Commission pursuant to Regulation 14A of the Securities Exchange Act of 1934, as amended, within 120 days of the Registrant’s fiscal year end.
TABLE OF CONTENTS
|
|
|
Page
|
|
Part I
|
||
|
Item 1.
|
Business
|
|
|
Item 1A.
|
Risk Factors
|
|
|
Item 1B.
|
Unresolved Staff Comments
|
|
|
Item 2.
|
Properties
|
|
|
Item 3.
|
Legal Proceedings
|
|
|
Item 4.
|
Mine Safety Disclosures
|
|
|
Part II
|
||
|
Item 5.
|
Market for Registrant’s Common Equity, Related Stockholder Matters and Issuer Purchases of Equity Securities
|
|
|
Item 6.
|
Selected Financial Data
|
|
|
Item 7.
|
Management’s Discussion and Analysis of Financial Condition and Results of Operations
|
|
|
Item 7A.
|
Quantitative and Qualitative Disclosure About Market Risk
|
|
|
Item 8.
|
Financial Statements and Supplementary Data
|
|
|
Item 9.
|
Changes in and Disagreements With Accountants on Accounting and Financial Disclosure
|
|
|
Item 9A.
|
Controls and Procedures
|
|
|
Item 9B.
|
Other Information
|
|
|
Part III
|
||
|
Item 10.
|
Directors, Executive Officers and Corporate Governance
|
|
|
Item 11.
|
Executive Compensation
|
|
|
Item 12.
|
Security Ownership of Certain Beneficial Owners and Management and Related Stockholder Matters
|
|
|
Item 13.
|
Certain Relationships and Related Transactions, and Director Independence
|
|
|
Item 14.
|
Principal Accounting Fees and Services
|
|
|
Part IV
|
||
|
Item 15.
|
Exhibits, Financial Statement Schedules
|
|
|
SIGNATURES
|
||
3
General
AMC Networks Inc. is a Delaware corporation with our principal executive offices at 11 Penn Plaza, New York, NY 10001. AMC Networks Inc. is a holding company and conducts substantially all of its operations through its subsidiaries. Unless the context otherwise requires, all references to “we,” “our,” “us,” “AMC Networks” or the “Company” refer to AMC Networks Inc., together with its direct and indirect subsidiaries. “AMC Networks Inc.” refers to AMC Networks Inc. individually as a separate entity. Our telephone number is (212) 324-8500. Our internet address is http://www.amcnetworks.com and the investor relations section of our website is located at http://investor.amcnetworks.com. We make available, free of charge through the investor relations section of our website, our annual reports on Form 10-K, quarterly reports on Form 10-Q and current reports on Form 8-K and amendments to those reports filed or furnished pursuant to Section 13(a) or 15(d) of the Securities Exchange Act of 1934, as well as our proxy statements, as soon as reasonably practicable after we electronically file such material with, or furnish it to, the Securities and Exchange Commission (“SEC”). References to our website in this Annual Report on Form 10-K (this “Annual Report”) are provided as a convenience and the information contained on, or available through, the website is not part of this or any other report we file with or furnish to the SEC.
AMC Networks Inc. was incorporated on March 9, 2011 as an indirect, wholly-owned subsidiary of Cablevision Systems Corporation (Cablevision Systems Corporation and its subsidiaries are referred to as “Cablevision”). On June 30, 2011, Cablevision spun off the Company (the “Distribution”) and the Company became an independent public company. In connection with the Distribution, Cablevision contributed all of the membership interests of Rainbow Media Holdings LLC (“RMH”) to the Company. RMH owned, directly or indirectly, the businesses included in Cablevision’s Rainbow Media segment. Both Cablevision and AMC Networks continue to be controlled by Charles F. Dolan, certain members of his immediate family and certain family related entities (collectively the “Dolan Family”).
Our Company
AMC Networks owns and operates several of cable television’s most recognized brands delivering high quality content to audiences and a valuable platform to distributors and advertisers. Since our founding in 1980, we have been a pioneer in the cable television programming industry, having created or developed some of the industry’s leading programming networks, with a focus on programming of film and original productions. AMC, which was created in 1984, features original programming that includes critically-acclaimed and award-winning original scripted dramatic series such as
Mad Men
,
Breaking Bad
,
Hell on Wheels
and
The Walking Dead
, which in 2012 became the first cable series in television history to achieve higher Nielsen ratings than any other show among adults 18-49. Our dedication to quality programming and storytelling also led to the creation of The Independent Film Channel (today known as IFC) in 1994 and WE tv (which we launched as Romance Classics in 1997) as well as our acquisition of SundanceTV (formerly known as Sundance Channel) in 2008.
We manage our business through two operating segments: (i) National Networks, which principally includes AMC, WE tv, IFC and SundanceTV; and (ii) International and Other, which principally includes AMC/Sundance Channel Global, IFC Films, AMC Networks Broadcasting & Technology and various developing online content distribution initiatives. Our National Networks are distributed throughout the United States (“U.S.”) via cable and other multichannel video programming distribution platforms, including direct broadcast satellite (“DBS”), platforms operated by telecommunications providers (we refer to cable and other multichannel video programming distributors as “multichannel video programming distributors” and collectively with digital and home video distributors as “distributors”). In addition to our extensive U.S. distribution, AMC, IFC and Sundance Channel are available in Canada. Sundance Channel is also distributed in Europe, Asia and Latin America and WE tv is distributed in Asia. We earn revenue principally from the distribution of our programming and the sale of advertising. Distribution revenue primarily includes affiliation fees paid by distributors to carry our programming networks and the licensing of original programming for digital, foreign and home video distribution. In 2013, distribution revenue accounted for
58%
of our consolidated revenues, net and advertising sales accounted for
42%
of our consolidated revenues, net. In 2013, revenues from DIRECTV, including domestic and international distribution and advertising sales, accounted for approximately 10% of our consolidated revenues, net.
For financial information of the Company by operating segment, see Item 7, “Management’s Discussion and Analysis of Financial Condition and Results of Operations — Consolidated Results of Operations” and Note 18 to the accompanying consolidated financial statements.
4
Acquisition of Chellomedia
On January 31, 2014, certain subsidiaries of AMC Networks purchased substantially all of Chellomedia, the international content division of Liberty Global plc,
for a purchase price of €750 million (approximately $1.0 billion),
subject to adjustments for working capital, cash, and indebtedness acquired and for the purchase of minority equity interests. AMC Networks funded the purchase price with cash on hand and additional indebtedness of $600 million (see Item 7, "Management's Discussion and Analysis of Financial Condition and Results of Operations - Debt Financing Agreements").
The acquisition provides AMC Networks with television channels that are distributed to more than 390 million subscribers in over 130 countries and span a wide range of programming genres, most notably movie and entertainment networks. The
acquisition of Chellomedia's operating businesses include: Chello Central Europe, Chello Latin America, Chello Multicanal, Chello Zone, the ad sales unit Atmedia, and the broadcast solutions unit, Chello DMC. The acquisition provides us with the opportunity to accelerate and enhance our international expansion strategy.
We view the international opportunity as one that has the potential to provide long-term growth and value.
Our Strengths
Our strengths include:
Strong Industry Presence and Portfolio of Brands.
We have operated in the cable programming industry for more than 30 years and over this time we have continually enhanced the value of our network portfolio. Our programming network brands are well known and well regarded by our key constituents—our viewers, distributors and advertisers—and have developed strong followings within their respective targeted demographics, increasing our value to distributors and advertisers. AMC (which targets adults aged 25 to 54), WE tv (which targets women aged 18 to 49 and 25 to 54), IFC (which targets adults aged 18 to 49) and SundanceTV (which targets adults aged 25 to 54) have established themselves as important within their respective markets. Our deep and established presence in the industry and the recognition we have received for our brands through industry awards and other honors lend us a high degree of credibility with distributors and content producers, and help provide us with stable affiliate and studio relationships, advantageous channel placements and heightened viewer engagement.
Broad Distribution and Penetration of Our National Networks
. Our national networks are broadly distributed in the United States. AMC, WE tv, IFC and SundanceTV are each carried by all major multichannel video programming distributors. Our national networks are available to a significant percentage of subscribers in these distributors’ systems. This broad distribution and penetration provides us with a strong national platform on which to maintain, promote and grow our business.
Compelling Programming.
We continually refine our mix of programming and, in addition to our popular film content, have increasingly focused on highly visible, critically-acclaimed original programming, including the award-winning
Mad Men
,
Breaking Bad
and
The Walking Dead
, which in 2012 became the first cable series in television history to achieve higher Nielsen ratings than any other show among adults 18-49. Other popular series include
Hell on Wheels
,
Rectify, The Returned, Braxton Family Values
,
Tamar & Vince, Mary Mary,
Portlandia
and
Maron
. Our focus on quality original programming, targeting specific audiences, has allowed us in recent years to increase our programming networks’ ratings and their viewership within these respective targeted demographics.
Recurring Revenue from Affiliation Agreements
. Our affiliation agreements with multichannel video programming distributors are a recurring source of revenue. We generally seek to structure these agreements so that they are long-term in nature and to stagger their expiration dates, thereby increasing the predictability and stability of our affiliation fee revenues.
Desirable Advertising Platform
. Our national networks have a strong connection with each of their respective targeted demographics, which make our programming networks an attractive platform to advertisers. We have experienced significant growth in our advertising revenues in recent years, which has allowed us to develop high-quality programming.
Our Strategy
Our strategy is to maintain and improve our position as a leading programming and entertainment company by owning and operating several of the most popular and award-winning brands in cable television that create engagement with audiences globally across multiple media and distribution platforms. The key focuses of our strategy are:
Continued Development of High-Quality Original Programming
. We intend to continue developing strong original programming across all of our programming networks to enhance our brands, strengthen our relationships with our viewers, distributors and advertisers, and increase distribution and audience ratings. We intend to continue to seek increased distribution of our national networks to grow affiliate and advertising revenues. We believe that our continued investment in original programming supports future growth in distribution and advertising revenue. We also intend to continue to expand the exploitation of our original programming across multiple media and distribution platforms.
5
Increased Global Distribution
. We are expanding the distribution of our programming networks around the globe. We first expanded beyond the U.S. market with the launch in Canada of IFC (in 2001), AMC (in 2006), and a distribution arrangement for Sundance Channel in 2010. AMC/Sundance Channel Global has since built on this base, and is now distributed in 40 countries throughout the world. Further expansion for AMC/Sundance Channel Global is anticipated in 2014, within the existing footprint and beyond. Additionally, the acquisition of Chellomedia provides distribution of its programming in over 130 countries.
Continued Growth of Advertising Revenue
. We have a proven track record of significantly increasing revenue by introducing advertising on networks that were previously not advertiser supported. We first accomplished this in 2002, when we moved AMC and WE tv to an advertiser-supported model, followed by IFC in December 2010, and SundanceTV in September 2013. Prior to September 2013, SundanceTV principally sold sponsorships. We seek to continue to evolve the programming on each of our networks to achieve even stronger viewer engagement within their respective core targeted demographics, thereby increasing the value of our programming to advertisers and allowing us to obtain higher advertising rates. We are continuing to seek additional advertising revenue through higher Nielsen ratings in desirable demographics.
Increased Control of Content
. We believe that control (including long-term contract arrangements) and ownership of content is becoming increasingly important, and we intend to increase our control position over our programming content. We currently control, own or have long-term license agreements covering significant portions of our content across our programming networks as well as in our independent film distribution business operated by IFC Films. We intend to continue to focus on obtaining the broadest possible control rights (both as to territory and platforms) for our content.
Exploitation of Emerging Media Platforms
. The technological landscape surrounding the distribution of entertainment content is continuously evolving as new digital platforms emerge. We intend to distribute our content across as many of these new platforms as possible, when it makes business sense to do so, so that our viewers can access our content where, when and how they want it. To that end, our programming networks are allowing many of our distributors to offer our content to subscribers on computers and other digital devices, and on video-on-demand platforms, all of which permit subscribers to access programs at their convenience. We also make our IFC Films library content available on third-party digital platforms such as Netflix and iTunes. In addition to amctv.com, which delivers approximately 4 million unique browsers each month, our networks each host dedicated websites that promote their brands, provide programming information and provide access to content.
Key Challenges
We face a number of challenges, including:
|
•
|
intense competition in the markets in which we operate;
|
|
•
|
a limited number of distributors for our programming networks;
|
|
•
|
continuing availability of desirable programming;
|
|
•
|
integration of Chellomedia; and
|
|
•
|
significant levels of debt and leverage, as a result of the debt financing agreements described under Item 7, “Management’s Discussion and Analysis of Financial Condition and Results of Operations—Liquidity and Capital Resources.”
|
See Item 1A, “Risk Factors” for a discussion of these and other factors that could impact our performance and operating results.
6
National Networks
We own four nationally distributed entertainment programming networks: AMC, WE tv, IFC and SundanceTV, which are available to our distributors in high-definition and/or standard-definition formats. Our programming networks principally generate their revenues from the distribution of programming and the sale of advertising. Affiliation fees paid by multichannel video programming distributors represent the largest component of distribution revenue, which also includes the licensing of original programming for digital, foreign and home video distribution.
AMC
Whether commemorating favorite films from various genres and decades or creating acclaimed original programming, AMC is a television network dedicated to the highest-quality story-telling in keeping with its "Something More" brand. We launched AMC in 1984, and over the past several years it has garnered many of the industry’s highest honors, including multiple Emmy
®
Awards, Golden Globe
®
Awards, Screen Actors Guild Awards, Peabody Awards, and American Film Institute (AFI) Awards for Top 10 Most Outstanding Television Programs of the Year. The network is currently the only cable network in history ever to win the Emmy
®
Award for Outstanding Drama Series four years in a row, and five out of the last six, and boasts the most-watched drama series in basic cable history and the highest Nielsen rated show on television among adults 18-49 with
The Walking Dead
. In 2013, AMC received the Emmy
®
Award for Best Television Series - Drama for
Breaking Bad.
In addition,
Breaking Bad
’s Bryan Cranston received the Emmy
®
Award for Outstanding Lead Actor in a Drama Series, and Anna Gunn received the Emmy
®
Award for Outstanding Supporting Actress in a Drama Series.
AMC’s original drama series include
Mad Men
,
Breaking Bad
and
Hell on Wheels
.
Breaking Bad
completed its run in 2013 and will not return in 2014. The network will premiere three new drama series in 2014;
Turn, Halt and Catch Fire
and the
Breaking Bad
prequel,
Better Call Saul.
Additionally, the network includes a number of unscripted original series:
Talking Dead
,
Comic Book Men
,
Small Town Security
,
Freakshow
and the forthcoming
Game of Arms
.
AMC’s film library consists of films that are licensed from major studios such as Twentieth Century Fox, Warner Bros., Sony, MGM, NBC Universal, Paramount and Buena Vista under long-term contracts. AMC generally structures its contracts for the exclusive cable television rights to air the films during identified window periods.
AMC Subscribers and Affiliation Agreements
. As of
December 31, 2013
, AMC had affiliation agreements with all major U.S. multichannel video programming distributors and reached approximately
97
million Nielsen subscribers.
Historical Subscribers—AMC
|
2013
|
2012
|
2011
|
|||||||
|
|
(in millions)
|
||||||||
|
Nielsen Subscribers (at year-end)
|
97.4
|
|
98.9
|
|
96.3
|
|
|||
|
Growth from Prior Year-end
|
(2
|
)%
|
3
|
%
|
—
|
%
|
|||
Year-to-year changes in the Nielsen subscribers may be impacted by changes in the Nielsen sample.
WE tv
WE tv showcases and celebrates modern women who are bold, independent and taking control of their lives. Whether they are celebrities like Joan Rivers or Toni Braxton, or everyday women, their stories are as relatable as they are entertaining. WE tv’s popular slate of fresh and modern unscripted original series includes the hit shows
Braxton Family Values,
Joan & Melissa: Joan Knows Best?
and
Mary Mary,
among others. WE tv will debut its first scripted original series,
The Divide,
in 2014.
Additionally, WE tv’s programming includes series such as
Will and Grace
and
Roseanne
as well as feature films, with exclusive license rights to certain films from studios such as Paramount, Sony and Warner Bros.
WE tv Subscribers and Affiliation Agreements
. As of
December 31, 2013
, WE tv had affiliation agreements with all major U.S. multichannel video distributors and reached approximately
84
million Nielsen subscribers.
Historical Subscribers—WE tv
|
2013
|
2012
|
2011
|
|||||||
|
|
(in millions)
|
||||||||
|
Nielsen Subscribers (at year-end)
|
84.0
|
|
81.5
|
|
76.1
|
|
|||
|
Growth from Prior Year-end
|
3
|
%
|
7
|
%
|
(1
|
)%
|
|||
The increase in Nielsen subscribers noted in the above table primarily reflects the repositioning of carriage of WE tv with certain operators to more widely distributed tiers of service. Additionally, year-to-year changes in the Nielsen subscribers may be impacted by changes in the Nielsen sample.
7
IFC
IFC creates original comedies that are in keeping with the network’s “Always On. Slightly Off” brand and which air alongside a collection of films and comedic cult TV shows.
The network’s original content includes the comedy series
Portlandia
, created by and starring Fred Armisen and Carrie Brownstein, and executive produced by Saturday Night Live's Lorne Michaels. Other IFC originals include
Comedy Bang! Bang!,
Maron,
The Birthday Boys
and
The Spoils of Babylon
(which premiered in January 2014). IFC's programming also includes films from various film distributors, including Fox, Miramax, Sony, Lionsgate, Universal, Paramount and Warner Bros.
IFC Subscribers and Affiliation Agreements
. As of
December 31, 2013
, IFC had affiliation agreements with all major U.S. multichannel video distributors and reached approximately
70
million Nielsen subscribers.
Historical Subscribers—IFC
|
2013
|
2012
|
2011
|
|||||||
|
|
(in millions)
|
||||||||
|
Nielsen Subscribers (at year-end)
|
69.9
|
|
69.6
|
|
65.3
|
|
|||
|
Growth from Prior Year-end
|
—
|
%
|
7
|
%
|
4
|
%
|
|||
The increase in Nielsen subscribers noted in the above table primarily reflects the repositioning of carriage of IFC with certain operators to more widely distributed tiers of service. Additionally, year-to-year changes in the Nielsen subscribers may be impacted by changes in the Nielsen sample.
SundanceTV
Launched in 1996 and acquired by the Company in 2008, SundanceTV is making and celebrating television as distinctive as the best independent films. Working with today’s most remarkable talent, SundanceTV is attracting viewer and critical acclaim for its original scripted and unscripted series. The network delivers on the spirit of founder Robert Redford’s mission to celebrate creativity.
In 2013, SundanceTV earned ten Emmy
®
Award nominations, its most ever, including one win for its acclaimed original programming for the Jane Campion-helmed mini-series,
Top of the Lake
, starring Elisabeth Moss and Holly Hunter. The network also earned a Golden Globe
®
Award for Best Performance by an Actress in a Mini-Series or a Motion Picture Made for Television (Elisabeth Moss in
Top of the Lake
) as well as a nomination for Best Mini-Series or Motion Picture Made for Television (
Top of the Lake
.) In April 2013, the network launched
Rectify
, its first owned original scripted series which was greeted with critical and audience acclaim. In October 2013, SundanceTV introduced
The Returned,
a French subtitled zombie drama.
Top of the Lake, Rectify
and
The Returned
earned placement on numerous high-profile Top Ten lists for the best TV of 2013.
In 2014, SundanceTV will premiere original scripted series
The Red Road
starring Jason Momoa, Martin Henderson and Julianne Nicholson,
The Honorable Woman
starring Maggie Gyllenhaal, season two of
Rectify
and season two of
The Returned
.
SundanceTV also has a slate of original unscripted series, each exploring aspects of contemporary culture. The network’s original unscripted programming includes
The Writers’ Room
which takes viewers behind the scenes on today’s most popular scripted dramas; it was recently renewed for a second season to premiere in 2014. Non-fiction series
Dream School
premiered in 2013 and was enthusiastically received by audiences.
SundanceTV Subscribers and Affiliation Agreements
. As of
December 31, 2013
, SundanceTV had affiliation agreements with all major U.S. multichannel video programming distributors and reached approximately
56
million Nielsen subscribers. As discussed above, in September 2013, we moved SundanceTV to an advertiser-supported model. Prior to September 2013, SundanceTV principally sold sponsorships.
Historical Subscribers—SundanceTV
|
2013
|
2012
|
2011
|
|||||||
|
|
(in millions)
|
||||||||
|
Nielsen Subscribers (at year-end)
|
56.2
|
|
54.1
|
|
41.8
|
|
|||
|
Growth from Prior Year-end
|
4
|
%
|
29
|
%
|
5
|
%
|
|||
The increase in Nielsen subscribers noted in the above table primarily reflects the repositioning of carriage of our SundanceTV with certain operators to more widely distributed tiers of service. Additionally, year-to-year changes in the Nielsen subscribers may be impacted by changes in the Nielsen sample.
8
International and Other
Our International and Other segment includes the operations of AMC/Sundance Channel Global, IFC Films, and AMC Networks Broadcasting & Technology. Our International and Other segment also includes VOOM HD Holdings LLC (“VOOM HD”).
AMC/Sundance Channel Global
AMC/Sundance Channel Global’s business principally consists of nine distinct channels distributed in sixteen languages spread across forty countries, focusing primarily on AMC in Canada and globally on versions of Sundance Channel and WE tv brands. Principally generating revenues from affiliation fees, AMC/Sundance Channel Global reached approximately 22 million viewing subscribers in Canada, Europe, Asia and Latin America as of
December 31, 2013
, and has broad availability to distributors within these territories through satellite and fiber delivery that can facilitate future expansion.
Sundance Channel—International
An internationally-recognized brand, Sundance Channel’s global services provide not only the best of the independent film world but also feature certain content from AMC, IFC, Sundance Channel and IFC Films, as well as serve as a unique pipeline of international content, in an effort to provide distinctive programming to an upscale audience.
The ability of Sundance Channel to offer content in standard definition and high definition across multiple platforms provides value to distributors and opportunity for expansion into additional international markets. The international version of Sundance Channel is currently available via eight distinct feeds providing service throughout various countries in Europe, Asia and Latin America and provides programming in sixteen different languages. The network is distributed via satellite and fiber in Europe, via satellite in Asia with a substantial footprint (which extends from the Philippines to the Middle East and from Russia to Australia), and by satellite in Latin America, with a footprint that extends throughout all of South America, Central America, and Mexico).
Canada
We provide programming to the Canadian market through our AMC and Sundance Channel brands, which are distributed through affiliation arrangements with the three major Canadian multichannel video programming distributors and through trademark license and content distribution arrangements with Canadian programming outlets. AMC Canada has today achieved near-full distribution in the Canadian market.
WE tv Asia
Providing programming in four languages (Korean, Mandarin, Malay, and Thai), WE tv Asia provides a selection of the best domestic programming from the WE tv U.S. network with programs like
Bridezillas
and
My Fair Wedding with David Tutera
, and some of the best programming from networks in the U.S., such as
Tabatha’s Salon Takeover
and
Tori & Dean
. With the same broad satellite footprint as Sundance Channel—International, WE tv Asia is available in South Korea, Malaysia, Taiwan, Singapore and Thailand.
Chellomedia
On January 31, 2014, we acquired the Chellomedia programming businesses in Europe, Africa, Asia, the Middle East and Latin America as well as joint venture interests in certain programming businesses. Chellomedia produces and markets a number of widely distributed multi-territory thematic channels in over 130 countries and span a wide range of programming genres, most notably movie and entertainment networks. Chellomedia consists of a portfolio of international cable channels and reaches over 390 million subscribers in Europe, Latin America, the Middle East and parts of Asia and Africa. Its channels are distributed to multichannel video programming distributors. In addition, Chellomedia owns and manages a Digital Media Center (DMC) in Amsterdam. The DMC is a technologically advanced production facility that services Chellomedia and third-party clients with channel origination, post-production, VOD encoding and satellite and fiber transmission.
IFC Films
IFC Films, our independent film distribution business, makes independent films available to a worldwide audience. IFC Films operates three distribution labels: Sundance Selects, IFC Films and IFC Midnight, all of which distribute independent films across virtually all available media platforms, including in theaters, on cable/satellite video-on-demand (reaching approximately 50 million homes), DVDs and cable network television, and streaming/downloading to computers and other electronic devices. IFC Films has a film library consisting of more than 600 titles. Recently released films include: the Oscar®-nominated
Dirty Wars
and Golden Globe nominated
Blue is the Warmest Color
and
Frances Ha
.
As part of its strategy to encourage the growth of the marketplace for independent films, IFC Films also operates the IFC Center and the DOC NYC Film Festival. IFC Center is a state-of-the-art independent movie theater located in the heart of New York City’s Greenwich Village. DOC NYC is an annual festival also located in New York City celebrating documentary storytelling in film, photography, prose and other media.
9
AMC Networks Broadcasting & Technology
AMC Networks Broadcasting & Technology is a full-service network programming feed origination and distribution company, which primarily services the national programming networks of the Company. AMC Networks Broadcasting & Technology’s operations are located in Bethpage, New York, where AMC Networks Broadcasting & Technology consolidates origination and satellite communications functions in a 60,000 square-foot facility designed to keep AMC Networks at the forefront of network origination and distribution technology. AMC Networks Broadcasting & Technology has 30 plus years of experience across its network services groups, including network origination, affiliate engineering, network transmission, traffic and scheduling that provide day-to-day delivery of any programming network, in high definition or standard definition.
Currently, AMC Networks Broadcasting & Technology is responsible for the origination and transmission of multiple highly acclaimed network programming feeds for both national and international distribution. In addition to serving the programming networks of the Company, AMC Networks Broadcasting & Technology’s affiliated and third-party clients include Fuse, MSG Network, MSG Plus, MSG Varsity, SNY and Mid Atlantic Sports Network.
Content Rights and Development
The programming on our networks includes original programming that we control, either through outright ownership or through long-term licensing arrangements, and acquired programming that we license from studios and other rights holders.
Original Programming
We contract with some of the industry’s leading production companies, including Lionsgate, Sony Pictures Television, Fox Television Studios, Entertainment One Television USA, Scott Free Productions, RelativityREAL, Magical Elves, Broadway Video, Reveille Productions and Pilgrim Films & Television, to produce most of the original programming that appears on our programming networks. These contractual arrangements either provide us with outright ownership of the programming, in which case we hold all programming and other rights to the content, or they consist of long-term licensing arrangements, which provide us with exclusive rights to exhibit the content on our programming networks, but may be limited in terms of specific geographic markets or distribution platforms. The license agreements are typically of multi-season duration and provide us with a right of first negotiation or a right of first refusal on the renewal of the license for additional programming seasons. Historically, we have generally licensed our owned content to third parties for international distribution. We may also license content to other programming networks or distribution platforms. Future decisions as to how to distribute programming will be made on the basis of a variety of factors including the relative value of any particular alternative. We currently produce certain of our owned original series:
The Walking Dead, Turn
(premiering on AMC in 2014),
Halt
and Catch Fire
(premiering on AMC in 2014)
, The Divide
(premiering on WE tv in 2014),
Rectify
and
The Red Road
(premiering on SundanceTV in 2014). The original programming that we either license or own outright includes, for AMC:
Mad Men
,
Breaking Bad
and
Hell on Wheels;
for WE tv:
Bridezillas,
which is currently in syndication,
Braxton Family Values, Tamar & Vince, Mary Mary, Joan & Melissa: Joan Knows Best?,
and
Marriage Boot Camp
; for IFC:
Portlandia, Maron, Comedy Bang! Bang!,
The Birthday Boys
and
The Spoils of Babylon
(premiered in January 2014); and for SundanceTV:
Dream School
and
The Writers’ Room.
Acquired Programming
The majority of the content on our programming networks consists of existing films, episodic series and specials that we acquire pursuant to rights agreements with film studios, production companies or other rights holders. This acquired programming includes episodic series such as
Law and Order, CSI: Miami
,
Will & Grace
,
Roseanne, Malcolm in the Middle
and
Arrested Development
, as well as an extensive film library. The rights agreements for this content are of varying duration and generally permit our programming networks to carry these series, films and other programming during certain window periods.
Affiliation Agreements
Affiliation Agreements
. Our programming networks are distributed to our viewing audience pursuant to affiliation agreements with multichannel video programming distributors. These agreements, which typically have durations of several years, require us to deliver programming that meets certain standards set forth in the agreement. We earn affiliation fees under these agreements, generally based upon the number of each distributor’s subscribers or, in some cases, based on a fixed contractual monthly fee. Our affiliation agreements also give us the right to sell a specific amount of national advertising time on our programming networks.
Our programming networks’ existing affiliation agreements expire at various dates through 2023. Failure to renew affiliation agreements, or renewal on less favorable terms, or the termination of those agreements could have a material adverse effect on our business, and, even if affiliation agreements are renewed, there can be no assurance that renewal rates will equal or exceed the rates that are currently being charged.
We frequently negotiate with distributors in an effort to increase the subscriber base for our networks. We have in some instances made upfront payments to distributors in exchange for these additional subscribers or agreed to waive or accept lower subscriber fees if certain numbers of additional subscribers are provided. We also may help fund the distributors’ efforts to market our programming networks or we may permit distributors to offer limited promotional periods without payment of subscriber fees.
10
As we continue our efforts to add subscribers, our subscriber revenue may be negatively affected by such deferred carriage fee arrangements, discounted subscriber fees and other payments; however, we believe that these transactions generate a positive return on investment over the contract period.
Advertising Arrangements
Under affiliation agreements with our distributors, we have the right to sell a specified amount of national advertising time on our programming networks. Our advertising revenues are more variable than affiliation fee revenues because the majority of our advertising is sold on a short-term basis, not under long-term contracts. We sell advertising time in both the upfront and scatter markets. In the upfront market, advertisers buy advertising time for the upcoming season, and by purchasing in advance, often receive discounted rates. In the scatter market, advertisers buy advertising time close to the time when the commercials will be run, and often pay a premium. The mix between the upfront and scatter markets is based upon a number of factors, such as pricing, demand for advertising time and economic conditions. Our advertising arrangements with advertisers provide for a set number of advertising units to air over a specific period of time at a negotiated price per unit. In most advertising sales arrangements, our programming networks guarantee specified viewer ratings for their programming. If these guaranteed viewer ratings are not met, we are generally required to provide additional advertising units to the advertiser at no charge. For these types of arrangements, a portion of the related revenue is deferred if the guaranteed viewer ratings are not met and is subsequently recognized either when we provide the required additional advertising time, the guarantee obligation contractually expires or performance requirements become remote. Most of our advertising revenues vary based upon the popularity of our programming as measured by Nielsen.
In
2013
, our national programming networks had approximately 1,200 advertisers representing companies in a broad range of sectors, including the health, insurance, food, automotive and retail industries. All of our National Networks, including SundanceTV beginning in September 2013, use a traditional advertising sales model. Prior to September 2013, SundanceTV principally sold sponsorships.
Subscriber and Viewer Measurement
The number of subscribers receiving our programming from multichannel video programming distributors generally determines the affiliation fees we receive. These numbers are reported monthly by the distributor and are reported net of certain excluded categories of subscribers set forth in the relevant affiliation agreement. For most day-to-day management purposes, we use a different measurement, Nielsen subscribers. Nielsen subscribers represent the number of subscribers receiving our programming from multichannel video programming distributors as reported by Nielsen, based on their sampling procedures. Nielsen subscriber figures tend to be higher than viewing subscribers for a given programming network. Nielsen subscriber figures are available for all of our programming networks.
For purposes of the advertising rates we are able to charge advertisers, the relevant measurement is the Nielsen rating, which measures the number of viewers actually watching the commercials within programs we show on our programming networks. This measurement is calculated by The Nielsen Company using their sampling procedures and reported daily, although advertising rates are adjusted less frequently. In addition to the Nielsen rating, our advertising rates are also influenced by the demographic mix of our viewing audiences, since advertisers tend to pay premium rates for more desirable demographic groups of viewers.
Regulation
The Federal Communications Commission (the “FCC”) regulates programming networks in certain respects when they are affiliated with a cable television operator, as we are with Cablevision. Other FCC regulations, although imposed on cable television operators and satellite operators, affect programming networks indirectly.
11
Closed Captioning
Certain of our networks must provide closed-captioning of programming for the hearing impaired. The 21st Century Communications and Video Accessibility Act of 2010 also requires us to provide closed captioning on certain video content that we offer on the Internet or through other Internet Protocol distribution.
CALM Act
FCC rules require multichannel video programming distributors to ensure that all commercials comply with specified volume standards, and our affiliation agreements generally require us to certify compliance with such standards.
Obscenity Restrictions
Cable operators and other distributors are prohibited from transmitting obscene programming, and our affiliation agreements generally require us to refrain from including such programming on our networks.
Violent Programming
In 2007, the FCC issued a report on violence in programming that recommended that Congress prohibit the availability of violent programming, including cable programming, during the hours when children are likely to be watching. Recent events have led to a renewed interest by some members of Congress in the alleged effects of violent programming, which could lead to a renewal of interest in limiting the availability of such programming or prohibiting it.
Program Access
The “program access” provisions of the Federal Cable Act generally require satellite delivered video programming in which a cable operator holds an attributable interest, as that term is defined by the FCC, to be made available to all multichannel video programming distributors, including DBS providers and telephone companies, on nondiscriminatory prices, terms and conditions, subject to certain exceptions specified in the statute and the FCC’s rules. FCC rules provide that the FCC may order a cable-affiliated programmer to continue to make a programming service available to a multichannel video programming distributor during the pendency of a program access complaint, under the terms of the existing contract. For purposes of these rules, the common directors and five percent or greater voting stockholders of Cablevision and AMC Networks are deemed to be cable operators with attributable interests in us. As long as we continue to have common directors and major stockholders with Cablevision, our satellite-delivered video programming services will remain subject to the program access provisions. The FCC allowed a previous blanket prohibition on exclusive arrangements with cable operators to expire in October 2012, but will consider case-by-case complaints that exclusive contracts between cable operators and cable-affiliated programmers significantly hinder or prevent a competing distributor from providing satellite cable programming.
The FCC has also extended the program access rules to terrestrially-delivered programming created by cable operator-affiliated programmers such as us when a showing can be made that the lack of such programming significantly hinders or prevents the distributor from providing satellite cable programming. The rules authorize the FCC to compel the licensing of such programming in response to a complaint by a multichannel video programming distributor. These rules could require us to make any terrestrial programming services we create available to multichannel video programming distributors on nondiscriminatory prices, terms and conditions.
Program Carriage
The FCC has sought comment on proposed changes to the rules governing carriage agreements between cable programming networks and cable operators or other multichannel video programming distributors. Some of these changes could give an advantage to cable programming networks that are not affiliated with any distributor and make it easier for those programming networks to challenge a distributor’s decision to terminate a carriage agreement or to decline to carry a network in the first place.
Wholesale “À La Carte”
In 2007, the FCC sought comment on whether cable programming networks require distributors to purchase and carry undesired programming in return for the right to carry desired programming and, if so, whether such arrangements should be prohibited. The FCC has taken no action on this proposal. We do not currently require distributors to carry more than one of our national programming networks in order to obtain the right to carry a particular national programming network. However, we generally negotiate with a distributor for the carriage of all of our national networks concurrently.
12
Effect of “Must-Carry” Requirements
The FCC’s implementation of the statutory “must-carry” obligations requires cable and DBS operators to give broadcasters preferential access to channel space. In contrast, programming networks, such as ours, have no guaranteed right of carriage on cable television or DBS systems. This may reduce the amount of channel space that is available for carriage of our networks by cable television systems and DBS operators.
Satellite Carriage
All satellite carriers must under federal law offer their service to deliver our and our competitor’s programming networks on a nondiscriminatory basis (including by means of a lottery). A satellite carrier cannot unreasonably discriminate against any customer in its charges or conditions of carriage.
Media Ownership Restrictions
FCC rules set media ownership limits that restrict, among other things, the number of daily newspapers and radio and television stations in which a single entity may hold an attributable interest as that term is defined by the FCC. Pursuant to a Congressional mandate, the FCC must review these rules every four years. Such a review is currently underway. Cablevision currently owns Newsday, a daily newspaper published on Long Island, New York. The fact that the common directors and five percent or greater voting stockholders of Cablevision and AMC Networks hold attributable interests in each of the companies for purposes of these rules means that these cross-ownership rules may have the effect of limiting the activities or strategic business alternatives available to us, at least for as long as we continue to have common directors and major stockholders with Cablevision. Although we have no plans or intentions to become involved in the businesses affected by these restrictions, we would need to be mindful of these rules if we were to consider engaging in any such business in the future.
Website Requirements
We maintain various websites that provide information regarding our businesses and offer content for sale. The operation of these websites may be subject to a range of federal, state and local laws such as privacy, data security, child safety and consumer protection regulations.
Other Regulation
The FCC also imposes rules regarding political broadcasts and telemarketing. In addition, our international operations are subject to regulation on a country-by-country basis, including programming content requirements, local content quotas, and
requirements to make programming available on nondiscriminatory terms.
Competition
Our programming networks operate in two highly competitive markets. First, our programming networks compete with other programming networks to obtain distribution on cable television systems and other multichannel video programming distribution systems, such as DBS, and ultimately for viewing by each system’s subscribers. Second, our programming networks compete with other programming networks and other sources of video content, including broadcast networks, to secure desired entertainment programming. The success of our businesses depends on our ability to license and produce content for our programming networks that is adequate in quantity and quality and will generate satisfactory viewer ratings. In each of these cases, some of our competitors are large publicly held companies that have greater financial resources than we do. In addition, we compete with these entities for advertising revenue.
It is difficult to predict the future effect of technology on many of the factors affecting AMC Networks’ competitive position. For example, data compression technology has made it possible for most video programming distributors to increase their channel capacity, which may reduce the competition among programming networks and broadcasters for channel space. On the other hand, the addition of channel space could also increase competition for desired entertainment programming and ultimately, for viewing by subscribers. As more channel space becomes available, the position of our programming networks in the most favorable tiers of these distributors would be an important goal. Additionally, video content delivered directly to viewers over the Internet competes with our programming networks for viewership.
13
Distribution of Programming Networks
The business of distributing programming networks to cable television systems and other multichannel video programming distributors is highly competitive. Our programming networks face competition from other programming networks’ carriage by a particular multichannel video programming distributor, and for the carriage on the service tier that will attract the most subscribers. Once our programming network is selected by a distributor for carriage, that network competes for viewers not only with the other programming networks available on the distributor’s system, but also with over-the-air broadcast television, Internet-based video and other online services, mobile services, radio, print media, motion picture theaters, DVDs, and other sources of information and entertainment.
Important to our success in each area of competition we face are the prices we charge for our programming networks, the quantity, quality and variety of the programming offered on our networks, and the effectiveness of our networks’ marketing efforts. The competition for viewers among advertiser supported networks is directly correlated with the competition for advertising revenues with each of our competitors.
Our ability to successfully compete with other networks may be hampered because the cable television systems or other multichannel video programming distributors through which we seek distribution may be affiliated with other programming networks. In addition, because such distributors may have a substantial number of subscribers, the ability of such programming networks to obtain distribution on the systems of affiliated distributors may lead to increased affiliation and advertising revenue for such programming networks because of their increased penetration compared to our programming networks. Even if such affiliated distributors carry our programming networks, such distributors may place their affiliated programming network on a more desirable tier, thereby giving the affiliated programming network a competitive advantage over our own.
New or existing programming networks that are affiliated with broadcasting networks like NBC, ABC, CBS or Fox may also have a competitive advantage over our programming networks in obtaining distribution through the “bundling” of agreements to carry those programming networks with agreements giving the distributor the right to carry a broadcast station affiliated with the broadcasting network.
An important part of our strategy involves exploiting identified markets of the cable television viewing audience that are generally well defined and limited in size. Our networks have faced and will continue to face increasing competition as other programming networks and online or other services seek to serve the same or similar niches.
Sources of Programming
We also compete with other programming networks to secure desired programming. Most of our original programming and all of our acquired programming is obtained through agreements with other parties that have produced or own the rights to such programming. Competition for this programming will increase as the number of programming networks increases. Other programming networks that are affiliated with programming sources such as movie or television studios or film libraries may have a competitive advantage over us in this area.
With respect to the acquisition of entertainment programming, such as syndicated programs and movies that are not produced by or specifically for networks, our competitors include national broadcast television networks, local broadcast television stations, video-on-demand programs and other cable programming networks. Internet-based video content distributors have also emerged as competitors for the acquisition of content or the rights to distribute content. Some of these competitors have exclusive contracts with motion picture studios or independent motion picture distributors or own film libraries.
Competition for Advertising Revenue
Our programming networks must compete with other sellers of advertising time and space, including other cable programming networks, radio, newspapers, outdoor media and, increasingly, Internet sites. We compete for advertisers on the basis of rates we charge and also on the number and demographic nature of viewers who watch our programming. Advertisers will often seek to target their advertising content to those demographic categories they consider most likely to purchase the product or service they advertise. Accordingly, the demographic make-up of our viewership can be equally or more important than the number of viewers watching our programming.
Employees
As of February 3, 2014 we had 2,123 full-time employees and 74 part-time employees (including 1,063 full-time employees and 45 part-time employees from Chellomedia). In addition, certain of our subsidiaries engages the services of writers who are subject to a collective bargaining agreement. We believe that our employee and labor relations are good.
14
The risk factors described below are not inclusive of all risk factors but highlight those that the Company believes are the most significant and that could impact its performance and financial results. These risk factors should be considered together with all other information presented in this Annual Report.
Our business depends on the appeal of our programming to our distributors and our U.S. and foreign viewers, which may be unpredictable and volatile.
Our business depends in part upon viewer preferences and audience acceptance in the U.S. and abroad of the programming on our networks. These factors are often unpredictable and volatile, and subject to influences that are beyond our control, such as the quality and appeal of competing programming, general economic conditions and the availability of other entertainment activities. We may not be able to anticipate and react effectively to shifts in tastes and interests in our markets. A change in viewer preferences could cause our programming to decline in popularity, which could cause a reduction in advertising revenues and jeopardize renewal of our contracts with distributors. In addition, our competitors may have more flexible programming arrangements, as well as greater amounts of available content, distribution and capital resources, and may be able to react more quickly than we can to shifts in tastes and interests.
To an increasing extent, the success of our business depends on original programming, and our ability to predict accurately how audiences will respond to our original programming is particularly important. Because original programming often involves a greater degree of commitment on our part, as compared to acquired programming that we license from third parties, and because our network branding strategies depend significantly on a relatively small number of original programs, a failure to anticipate viewer preferences for such programs could be especially detrimental to our business. We periodically review the programming usefulness of our program rights based on a series of factors, including ratings, type and quality of program material, standards and practices, and fitness for exhibition. We have incurred write-offs of programming rights in the past, and may incur future programming rights write-offs if it is determined that program rights have no future usefulness.
In addition, feature films constitute a significant portion of the programming on our AMC, IFC and SundanceTV programming networks. In general, the popularity of feature-film content on linear television is declining, due in part to the broad availability of such content through an increasing number of distribution platforms. Should the popularity of feature-film programming suffer significant further declines, we may lose viewership or be forced to rely more heavily on original programming, which could increase our costs.
If our programming does not gain the level of audience acceptance we expect, or if we are unable to maintain the popularity of our programming, our ratings may suffer, which will negatively affect advertising revenues, and we may have a diminished bargaining position when dealing with distributors, which could reduce our affiliation fee revenues. We cannot assure you that we will be able to maintain the success of any of our current programming, or generate sufficient demand and market acceptance for our new programming.
If economic problems persist in the United States or in other parts of the world, our results of operations could be adversely affected.
Our business is significantly affected by prevailing economic conditions and by disruptions to financial markets. We derive substantial revenues from advertisers, and these expenditures are sensitive to general economic conditions and consumer buying patterns. Financial instability or a general decline in economic conditions in the United States and other countries where our networks are distributed could adversely affect advertising rates and volume, resulting in a decrease in our advertising revenues.
Decreases in U.S. and consumer discretionary spending in other countries where our networks are distributed may affect cable television and other video service subscriptions, in particular with respect to digital service tiers on which certain of our programming networks are carried. This could lead to a decrease in the number of subscribers receiving our programming from multichannel video programming distributors, which could have a negative impact on our viewing subscribers and affiliation fee revenues. Similarly, a decrease in viewing subscribers would also have a negative impact on the number of viewers actually watching the programs on our programming networks, which could also impact the rates we are able to charge advertisers.
Economic conditions affect a number of aspects of our businesses worldwide and impact the businesses of our partners who purchase advertising on our networks and reduce their spending on advertising. Economic conditions can also negatively affect the ability of those with whom we do business to satisfy their obligations to us. The general worsening of current global economic conditions could adversely affect our business, financial condition or results of operations, and the worsening of economic conditions in certain parts of the world, specifically, could impact the expansion and success of our businesses in such areas.
15
Because a limited number of distributors account for a large portion of our business, the loss of any significant distributor would adversely affect our revenues.
Our programming networks depend upon agreements with a limited number of cable television system operators and other multichannel video programming distributors. The loss of any significant distributor would have a material adverse effect on our consolidated results of operations.
In addition, we have in some instances made upfront payments to distributors in exchange for additional subscribers or have agreed to waive or accept lower affiliation fees if certain numbers of additional subscribers are provided. We also may help fund our distributors' efforts to market our programming networks or we may permit distributors to offer promotional periods without payment of subscriber fees. As we continue our efforts to add viewing subscribers, our net revenues may be negatively affected by these deferred carriage fee arrangements, discounted subscriber fees or other payments.
Failure to renew our programming networks’ affiliation agreements, or renewal on less favorable terms, or the termination of those agreements, both in the U.S. and internationally, could have a material adverse effect on our business.
Currently our programming networks have affiliation agreements that have staggered expiration dates through 2023
.
Failure to renew these affiliation agreements, or renewal on less favorable terms, or the termination of those agreements could have a material adverse effect on our business
.
A reduced distribution of our programming networks would adversely affect our affiliation fee revenue, and impact our ability to sell advertising or the rates we charge for such advertising. Even if affiliation agreements are renewed, we cannot assure you that the renewal rates will equal or exceed the rates that we currently charge these distributors.
In some cases, if a distributor is acquired, the affiliation agreement of the acquiring distributor will govern following the acquisition. In those circumstances, the acquisition of a distributor that is party to one or more affiliation agreements with our programming networks on terms that are more favorable to us could adversely impact our financial condition and results of operations.
Consolidation among cable and satellite operators has given the largest operators considerable leverage in their relationships with programmers, including us. Most of our U.S. revenues come from a handful of the largest distributors. The two largest cable distributors provide service to approximately 33% of U.S. households receiving multichannel video programming distribution, while the two largest DBS distributors provide service to an additional 34% of such households. In certain countries outside the U.S., one or a small number of distributors have a dominant market position. Continued consolidation within the industry could further reduce the number of distributors available to carry our content and increase the negotiating leverage of our distributors which could adversely affect our revenue.
We are subject to intense competition, which may have a negative effect on our profitability or on our ability to expand our business.
The programming industry is highly competitive. Our programming networks compete with other programming networks and other types of video programming services for marketing and distribution by cable and other multichannel video programming distribution systems. In distributing a programming network, we face competition with other providers of programming networks for the right to be carried by a particular cable or other multichannel video programming distribution system and for the right to be carried by such system on a particular “tier” of service.
Certain programming networks affiliated with broadcast networks like NBC, ABC, CBS or Fox or other key free-to-air programming networks in countries where our networks are distributed may have a competitive advantage over our programming networks in obtaining distribution through the “bundling” of carriage agreements for such programming networks with a distributor's right to carry the affiliated broadcasting network. In addition, our ability to compete with certain programming networks for distribution may be hampered because the cable television or other multichannel video programming distributors through which we seek distribution may be affiliated with these programming networks. Because such distributors may have a substantial number of subscribers, the ability of such programming networks to obtain distribution on the systems of affiliated distributors may lead to increased affiliation and advertising revenue for such programming networks because of their increased penetration compared to our programming networks. Even if the affiliated distributors carry our programming networks, they may place their affiliated programming network on a more desirable tier, thereby giving their affiliated programming network a competitive advantage over our own.
16
In addition to competition for distribution, we also face intense competition for viewing audiences with other cable and broadcast programming networks, home video products and Internet-based video content providers, some of which are part of large diversified entertainment or media companies that have substantially greater resources than us. To the extent that our viewing audiences are eroded by competition with these other sources of programming content, our ratings would decline, negatively affecting advertising revenues, and we may face difficulty renewing affiliation agreements with distributors on acceptable terms, which could cause affiliation fee revenues to decline. In addition, competition for advertisers with these content providers, as well as with other forms of media (including print media, Internet websites and radio), could affect the amount we are able to charge for advertising time on our programming networks, and therefore our advertising revenues.
An important part of our strategy involves exploiting identified markets of the cable television viewing audience that are generally well defined and limited in size. Our programming networks have faced and will continue to face increasing competition obtaining distribution and attracting advertisers as other programming networks seek to serve the same or similar markets.
Our programming networks’ success depends upon the availability of programming that is adequate in quantity and quality, and we may be unable to secure or maintain such programming.
Our programming networks' success depends upon the availability of quality programming, particularly original programming and films, that is suitable for our target markets. While we produce some of our original programming, we obtain most of the programming on our networks (including original programming, films and other acquired programming) through agreements with third parties that have produced or control the rights to such programming. These agreements expire at varying times and may be terminated by the other parties if we are not in compliance with their terms.
We compete with other programming networks to secure desired programming. Competition for programming has increased as the number of programming networks has increased. Other programming networks that are affiliated with programming sources such as movie or television studios or film libraries may have a competitive advantage over us in this area. In addition to other cable programming networks, we also compete for programming with national broadcast television networks, local broadcast television stations, video-on-demand services and Internet-based content delivery services, such as Netflix, iTunes, Hulu and Amazon. Some of these competitors have exclusive contracts with motion picture studios or independent motion picture distributors or own film libraries.
We cannot assure you that we will ultimately be successful in negotiating renewals of our programming rights agreements or in negotiating adequate substitute agreements in the event that these agreements expire or are terminated.
Our programming networks have entered into long-term programming acquisition contracts that require substantial payments over long periods of time, even if we do not use such programming to generate revenues.
Our programming networks have entered into numerous contracts relating to the acquisition of programming, including rights agreements with film companies. These contracts typically require substantial payments over extended periods of time. We must make the required payments under these contracts even if we do not use the programming.
Increased programming costs may adversely affect our profits.
We incur costs for the creative talent, including actors, writers and producers, who create our original programming. Some of our original programming has achieved significant popularity and critical acclaim, which has increased and could continue to increase the costs of such programming in the future. An increase in the costs of programming may lead to decreased profitability or otherwise adversely affect our business.
We may not be able to adapt to new content distribution platforms and to changes in consumer behavior resulting from these new technologies, which may adversely affect our business.
We must successfully adapt to technological advances in our industry, including the emergence of alternative distribution platforms. Our ability to exploit new distribution platforms and viewing technologies will affect our ability to maintain or grow our business. Emerging forms of content distribution may provide different economic models and compete with current distribution methods in ways that are not entirely predictable. Such competition could reduce demand for our traditional television offerings or for the offerings of digital distributors and reduce our revenue from these sources. Accordingly, we must adapt to changing consumer behavior driven by advances such as digital video recorders, video-on-demand, Internet-based content delivery, including services such as Netflix, Hulu, Apple TV, Google TV and Amazon and mobile devices. Gaming and other consoles such Microsoft’s Xbox, Sony’s PS3 and Nintendo’s Wii and Roku are establishing themselves as alternative providers of video services. Such changes may impact the revenues we are able to generate from our traditional distribution methods, either by decreasing the viewership of our programming networks on cable and other multichannel video programming distribution systems which are almost entirely directed at television video delivery or by making advertising on our programming networks less valuable to advertisers. If we fail to adapt our distribution methods and content to emerging technologies, our appeal to our targeted audiences might decline and there could be a negative effect on our business. In addition, advertising revenues could be significantly impacted by emerging technologies, since advertising sales are dependent on audience measurement provided by third parties, and the results
17
of audience measurement techniques can vary independent of the size of the audience for a variety of reasons, including difficulties related to the employed statistical sampling methods, new distribution platforms and viewing technologies, and the shifting of the marketplace to the use of measurement of different viewer behaviors, such as delayed viewing. Moreover, devices that allow users to fast forward or skip programming, including commercials, are causing changes in consumer behavior that may affect the desirability of our programming services to advertisers.
We face risks from doing business internationally.
We have operations through which we distribute programming outside the United States. As a result, our business is subject to certain risks inherent in international business, many of which are beyond our control. These risks include:
|
•
|
laws and policies affecting trade and taxes, including laws and policies relating to the repatriation of funds and withholding taxes, and changes in these laws;
|
|
•
|
changes in local regulatory requirements, including restrictions on content, imposition of local content quotas and restrictions on foreign ownership;
|
|
•
|
differing degrees of protection for intellectual property and varying attitudes towards the piracy of intellectual property;
|
|
•
|
the instability of foreign economies and governments;
|
|
•
|
exchange controls;
|
|
•
|
war and acts of terrorism;
|
|
•
|
anti-corruption laws and regulations such as the Foreign Corrupt Practices Act and the U.K. Bribery Act that impose stringent requirements on how we conduct our foreign operations and changes in these laws and regulations;
|
|
•
|
foreign privacy and data protection laws and regulation and changes in these laws; and
|
|
•
|
shifting consumer preferences regarding the viewing of video programming.
|
Events or developments related to these and other risks associated with international trade could adversely affect our revenues from non-U.S. sources, which could have a material adverse effect on our business, financial condition, operating results, liquidity and prospects.
We are also exposed to foreign currency exchange rate risk to the extent that we enter into transactions denominated in currencies other than our or our subsidiaries’ respective functional currencies (non-functional currency risk), such as programming contracts, notes payable and notes receivable (including intercompany amounts) that are denominated in a currency other than the applicable functional currency. Changes in exchange rates with respect to amounts recorded in our consolidated balance sheets related to these items will result in unrealized (based upon period-end exchange rates) or realized foreign currency transaction gains and losses upon settlement of the transactions. Moreover, to the extent that our revenue, costs and expenses are denominated in currencies other than our respective functional currencies, we will experience fluctuations in our revenue, costs and expenses solely as a result of changes in foreign currency exchange rates.
We also are exposed to unfavorable and potentially volatile fluctuations of the U.S. dollar (our reporting currency) against the currencies of our operating subsidiaries when their respective financial statements are translated into U.S. dollars for inclusion in our consolidated financial statements. Cumulative translation adjustments are recorded in accumulated other comprehensive income (loss) as a separate component of equity. Any increase (decrease) in the value of the U.S. dollar against any foreign currency that is the functional currency of one of our operating subsidiaries will cause us to experience unrealized foreign currency translation losses (gains) with respect to amounts already invested in such foreign currencies. Accordingly, we may experience a negative impact on our comprehensive income (loss) and equity with respect to our holdings solely as a result of foreign currency translation. Our primary exposure to foreign currency risk from a foreign currency translation perspective is to the euro and, to a lesser extent, other local currencies in Europe. We generally do not hedge against the risk that we may incur non-cash losses upon the translation of the financial statements of our subsidiaries and affiliates into U.S. dollars.
Our business is limited by United States regulatory constraints which may adversely impact our operations.
Although most aspects of our business generally are not directly regulated by the FCC, there are certain FCC regulations that govern our business either directly or indirectly. See Item 1, “Business—Regulation” in this Annual Report. Furthermore, to the extent that regulations and laws, either presently in force or proposed, hinder or stimulate the growth of the cable television and satellite industries, our business will be affected.
The United States Congress and the FCC currently have under consideration, and may in the future adopt, new laws, regulations and policies regarding a wide variety of matters that could, directly or indirectly, affect our operations.
18
The regulation of cable television services, satellite carriers, and other multichannel video programming distributors is subject to the political process and has been in constant flux over the past two decades. Further material changes in the law and regulatory requirements must be anticipated. We cannot assure you that our business will not be adversely affected by future legislation, new regulation or deregulation.
Our businesses are subject to risks of adverse regulation by foreign governments.
Programming businesses are subject to regulation on a country-by-country basis, including restrictions on types of advertising that can be sold on our networks, programming content requirements, requirements to make programming available on non-discriminatory terms, and local content quotas. Consequently, our businesses must adapt their ownership and organizational structure as well as their pricing and service offerings to satisfy the rules and regulations to which they are subject. A failure to comply with applicable rules and regulations could result in penalties, restrictions on our business or loss of required licenses or other adverse conditions.
Adverse changes in rules and regulations could have a significant adverse impact on our profitability.
Theft of our content, including digital copyright theft and other unauthorized exhibitions of our content, may decrease revenue received from our programming and adversely affect our businesses and profitability.
The success of our businesses depends in part on our ability to maintain and monetize our intellectual property rights to our entertainment content. We are fundamentally a content company and theft of our brands, television programming, digital content and other intellectual property has the potential to significantly affect us and the value of our content. Copyright theft is particularly prevalent in many parts of the world that lack effective copyright and technical protective measures similar to those existing in the United States or that lack effective enforcement of such measures. The interpretation of copyright, privacy and other laws as applied to our content, and piracy detection and enforcement efforts, remain in flux. The failure to strengthen, or the weakening of, existing intellectual property laws could make it more difficult for us to adequately protect our intellectual property and negatively affect its value.
Content theft has been made easier by the wide availability of higher bandwidth and reduced storage costs, as well as tools that undermine security features such as encryption and the ability of pirates to cloak their identities online. In addition, we and our numerous production and distribution partners operate various technology systems in connection with the production and distribution of our programming, and intentional or unintentional acts could result in unauthorized access to our content, a disruption of our services, or improper disclosure of confidential information. The increasing use of digital formats and technologies heightens this risk. Unauthorized access to our content could result in the premature release of television shows, which is likely to have a significant adverse effect on the value of the affected programming.
Copyright theft has an adverse effect on our business because it reduces the revenue that we are able to receive from the legitimate sale and distribution of our content, undermines lawful distribution channels and inhibits our ability to recoup or profit from the costs incurred to create such works. Efforts to prevent the unauthorized distribution, performance and copying of our content may affect our profitability and may not be successful in preventing harm to our business.
Litigation may be necessary to enforce our intellectual property rights, protect trade secrets or to determine the validity and scope of proprietary rights claimed by others. Any litigation of this nature, regardless of outcome or merit, could result in substantial costs and diversion of management and technical resources, any of which could adversely affect our business, financial condition and results of operations. Our failure to protect our intellectual property rights, particularly our brand, in a meaningful manner or challenges to related contractual rights could result in erosion of our brand and limit our ability to control marketing of our networks, which could have a materially adverse effect on our business, financial condition and results of operations.
Protection of electronically stored data is costly and if our data is compromised in spite of this protection, we may incur additional costs, lost opportunities and damage to our reputation.
We maintain information in digital form as necessary to conduct our business, including confidential and proprietary information regarding our distributors, advertisers, viewers and employees as well as personal information. Data maintained in digital form is subject to the risk of intrusion, tampering and theft. We develop and maintain systems to prevent this from occurring, but the development and maintenance of these systems is costly and requires ongoing monitoring and updating as technologies change and efforts to overcome security measures become more sophisticated. Moreover, despite our efforts, the possibility of intrusion, tampering and theft cannot be eliminated entirely, and risks associated with each of these remain. In addition, we provide confidential, proprietary and personal information to third parties when it is necessary to pursue business objectives. While we obtain assurances that these third parties will protect this information and, where appropriate, monitor the protections employed by these third parties, there is a risk the confidentiality of data held by third parties may be compromised. If our data systems are compromised, our ability to conduct our business may be impaired, we may lose profitable opportunities or the value of those opportunities may be diminished and, as described above, we may lose revenue as a result of unlicensed use of our intellectual property. Further, a penetration of our network security or other misappropriation or misuse of personal consumer or employee
19
information could subject us to business, regulatory, litigation and reputation risk, which could have a negative effect on our business, financial condition and results of operations.
If our technology facilities fail or their operations are disrupted, or if we lose access to third party satellites, our performance could be hindered.
Our programming is transmitted using technology facilities at certain of our subsidiaries. These technology facilities are used for a variety of purposes, including signal processing, program editing, promotions, creation of programming segments to fill short gaps between featured programs, quality control, and live and recorded playback. These facilities are subject to interruption from fire, lightning, adverse weather conditions and other natural causes. Equipment failure, employee misconduct or outside interference could also disrupt the facilities' services. Although we have an arrangement with a third party to re-broadcast the previous 48 hours of our national networks' programming in the event of a disruption, we currently do not have a backup operations facility for our programming.
In addition, we rely on third-party satellites in order to transmit our programming signals to our distributors. As with all satellites, there is a risk that the satellites we use will be damaged as a result of natural or man-made causes, or will otherwise fail to operate properly. Although we maintain in-orbit protection providing us with back-up satellite transmission facilities should our primary satellites fail, there can be no assurance that such back-up transmission facilities will be effective or will not themselves fail.
Any significant interruption at any of our technology facilities affecting the distribution of our programming, or any failure in satellite transmission of our programming signals, could have an adverse effect on our operating results and financial condition.
The loss of any of our key personnel and artistic talent could adversely affect our business.
We believe that our success depends to a significant extent upon the performance of our senior executives. We generally do not maintain “key man” insurance. In addition, we depend on the availability of third-party production companies to create most of our original programming. Some of the writers employed by one of our subsidiaries and some of the employees of third party production companies that create our original programming are subject to collective bargaining agreements. Any labor disputes or a strike by one or more unions representing our subsidiary's writers or employees of third-party production companies who are essential to our original programming could have a material adverse effect on our original programming and on our business as a whole. The loss of any significant personnel or artistic talent, or our artistic talent losing their audience base, could also have a material adverse effect on our business.
No assurance can be made that we will be successful in integrating any acquired businesses.
We recently completed the acquisition of Chellomedia and we may make other acquisitions in the future. Integration of new businesses presents significant challenges, including: realizing economies of scale; eliminating duplicative overhead; and integrating networks, financial systems and operational systems. No assurance can be given that, with respect to any acquisition, we will realize anticipated benefits or successfully integrate any acquired business with our existing operations. In addition, while we intend to implement appropriate controls and procedures as we integrate acquired companies, we may not be able to certify as to the effectiveness of these companies’ disclosure controls and procedures or internal control over financial reporting (as required by U.S. federal securities laws and regulations) until we have fully integrated them.
We may have exposure to additional tax liabilities.
We are subject to income taxes as well as non-income based taxes, such as payroll, sales, use, value-added, net worth, property and goods and services taxes, in both the United States and various foreign jurisdictions. Significant judgment is required in determining our worldwide provision for income taxes and other tax liabilities. In the ordinary course of our business, there are many transactions and calculations where the ultimate tax determination is uncertain. We are regularly under audit by tax authorities in both the United States and various foreign jurisdictions. Although we believe that our tax estimates are reasonable, (1) there is no assurance that the final determination of tax audits or tax disputes will not be different from what is reflected in our historical income tax provisions, expense amounts for non-income based taxes and accruals and (2) any material differences could have an adverse effect on our financial position and results of operations in the period or periods for which determination is made.
Although a portion of our revenue and operating income is generated outside the United States, we are subject to potential current U.S. income tax on this income due to our being a U.S. corporation. Our worldwide effective tax rate may be reduced under a provision in U.S. tax law that defers the imposition of U.S. tax on certain foreign active income until that income is repatriated to the United States. Any repatriation of assets held in foreign jurisdictions or recognition of foreign income that fails to meet the U.S. tax requirements related to deferral of U.S. income tax may result in a higher effective tax rate for our company. This includes what is referred to as “Subpart F Income,” which generally includes, but is not limited to, such items as interest, dividends, royalties, gains from the disposition of certain property, certain currency exchange gains in excess of currency exchange losses, and certain related party sales and services income. While the Company may mitigate this increase in its effective tax rate through claiming a foreign tax credit against its U.S. federal income taxes or potentially have foreign or U.S. taxes reduced under
20
applicable income tax treaties, we are subject to various limitations on claiming foreign tax credits or we may lack treaty protections in certain jurisdictions that will potentially limit any reduction of the increased effective tax rate. A higher effective tax rate may also result to the extent that losses are incurred in non-U.S. subsidiaries that do not reduce our U.S. taxable income.
We are subject to changing tax laws, treaties and regulations in and between countries in which we operate, including treaties between the United States and other nations. A change in these tax laws, treaties or regulations, including those in and involving the United States, or in the interpretation thereof, could result in a materially higher income or non-income tax expense. Also, various income tax proposals in the countries in which we operate, such as those relating to fundamental U.S. international tax reform and measures in response to the economic uncertainty in certain European jurisdictions in which we operate, could result in changes to the existing tax laws under which our taxes are calculated. We are unable to predict whether any of these or other proposals in the United States or foreign jurisdictions will ultimately be enacted. Any such material changes could negatively impact our business.
Our substantial debt and high leverage could adversely affect our business.
We have a significant amount of debt. As of December 31, 2013, we have
$2,180 million
principal amount of total debt (excluding capital leases),
$880 million
of which is senior secured debt under our Credit Facility and $1,300 million of which is senior unsecured debt. On January 31, 2014, we incurred additional senior secured indebtedness of $600 million under our Term Loan A Facility in connection with the acquisition of Chellomedia.
Our ability to make payments on, or repay or refinance, our debt, an
d to fund planned distributions and capital expenditures, will depend largely upon our future operating performance. Our future performance, to a certain extent, is subject to general economic, financial, competitive, regulatory and other factors that are beyond our control. In addition, our ability to borrow funds in the future to make payments on our debt will depend on the satisfaction of the covenants in the Credit Facility and our other debt agreements, including the 7.75% Notes Indenture, the 4.75% Notes Indenture and other agreements we may enter into in the future.
Our substantial amount of debt could have important consequences. For example, it could:
• increase our vulnerability to general adverse economic and industry conditions;
• require us to dedicate a substantial portion of our cash flow from operations to make interest and principal payments on our debt, thereby limiting the availability of our cash flow to fund future programming investments, capital expenditures, working capital, business activities and other general corporate requirements;
• limit our flexibility in planning for, or reacting to, changes in our business and the industry in which we operate;
• place us at a competitive disadvantage compared with our competitors; and
• limit our ability to borrow additional funds, even when necessary to maintain adequate liquidity.
In the long-term, we do not expect to generate sufficient cash from operations to repay at maturity our outstanding debt obligations. As a result, we will be dependent upon our ability to access the capital and credit markets. Failure to raise significant amounts of funding to repay these obligations at maturity could adversely affect our business. If we are unable to raise such amounts, we would need to take other actions including selling assets, seeking strategic investments from third parties or reducing other discretionary uses of cash. The Credit Facility, the 7.75% Notes Indenture and the 4.75% Notes Indenture will restrict, and market or business conditions may limit, our ability to do some of these things.
A
significant portion of
our debt bears interest at variable rates. While we have entered into hedging agreements limiting our exposure to higher interest rates, such agreements do not offer complete protection from this risk.
21
The agreements governing our debt, the Credit Facility, the 7.75% Notes Indenture and the 4.75% Notes Indenture, contain various covenants that impose restrictions on us that may affect our ability to operate our business.
The agreements governing the Credit Facility, the 7.75% Notes Indenture and the 4.75% Notes Indenture contain covenants that, among other things, limit our ability to:
|
•
|
borrow money or guarantee debt;
|
|
•
|
create liens;
|
|
•
|
pay dividends on or redeem or repurchase stock;
|
|
•
|
make specified types of investments;
|
|
•
|
enter into transactions with affiliates; and
|
|
•
|
sell assets or merge with other companies.
|
The Credit Facility requires us to comply with a Cash Flow Ratio and an Interest Coverage Ratio, each as defined in Item 7, “Management’s Discussion and Analysis of Financial Condition and Results of Operations — Debt Financing Agreements.”
Compliance with these covenants may limit our ability to take actions that might be to the advantage of the Company and our stockholders.
Various risks, uncertainties and events beyond our control could affect our ability to comply with these covenants and maintain these financial ratios. Failure to comply with any of the covenants in our existing or future financing agreements could result in a default under those agreements and under other agreements containing cross-default provisions. A default would permit lenders to accelerate the maturity for the debt under these agreements and to foreclose upon any collateral securing the debt. Under these circumstances, we might not have sufficient funds or other resources to satisfy all of our obligations. In addition, the limitations imposed by financing agreements on our ability to incur additional debt and to take other actions might significantly impair our ability to obtain other financing.
Despite our current levels of debt, we may still be able to incur substantially more debt. This could further exacerbate the risks associated with our substantial debt.
We may be able to incur additional debt in the future. The terms of the Credit Facility, the 7.75% Notes Indenture and the 4.75% Notes Indenture allow us to incur substantial amounts of additional debt, subject to certain limitations. In addition, we may refinance all or a portion of our debt, including borrowings under the Credit Facility, and obtain the ability to incur more debt as a result. If new debt is added to our current debt levels, the related risks we could face would be magnified.
A lowering or withdrawal of the ratings assigned to our debt securities by rating agencies may further increase our future borrowing costs and reduce our access to capital.
The debt ratings for our notes are below the “investment grade” category, which results in higher borrowing costs as well as a reduced pool of potential purchasers of our debt as some investors will not purchase debt securities that are not rated in an investment grade rating category. In addition, there can be no assurance that any rating assigned will remain for any given period of time or that a rating will not be lowered or withdrawn entirely by a rating agency, if in that rating agency's judgment, future circumstances relating to the basis of the rating, such as adverse changes, so warrant. A lowering or withdrawal of a rating may further increase our future borrowing costs and reduce our access to capital.
A significant amount of our book value consists of intangible assets that may not generate cash in the event of a voluntary or involuntary sale.
At
December 31, 2013
, our consolidated financial statements included approximately
$2.6
billion of consolidated total assets, of which approximately
$286
million were classified as intangible assets. Intangible assets primarily include affiliation agreements and affiliate relationships, advertiser relationships, trademarks and goodwill. While we believe that the carrying values of our intangible assets are recoverable, you should not assume that we would receive any cash from the voluntary or involuntary sale of these intangible assets, particularly if we were not continuing as an operating business.
22
We may have a significant indemnity obligation to Cablevision if the Distribution is treated as a taxable transaction.
Prior to the distribution of all of the outstanding common stock of the Company to Cablevision stockholders in the Distribution, Cablevision received a private letter ruling from the Internal Revenue Service (“IRS”) to the effect that, among other things, the Distribution, and certain related transactions would qualify for tax-free treatment under the Internal Revenue Code (the “Code”) to Cablevision, AMC Networks, and holders of Cablevision common stock. Although a private letter ruling from the IRS generally is binding on the IRS, if the factual representations or assumptions made in the letter ruling request were untrue or incomplete in any material respect, Cablevision would not be able to rely on the ruling. Furthermore, the IRS will not rule on whether a distribution satisfies certain requirements necessary to obtain tax-free treatment under the Code. Rather, the ruling was based upon representations by Cablevision that these conditions were satisfied, and any inaccuracy in such representations could invalidate the ruling.
If the Distribution does not qualify for tax-free treatment for United States federal income tax purposes, then, in general, Cablevision would be subject to tax as if it had sold the common stock of our Company in a taxable sale for its fair market value. Cablevision's stockholders would be subject to tax as if they had received a distribution equal to the fair market value of our common stock that was distributed to them, which generally would be treated first as a taxable dividend to the extent of Cablevision's earnings and profits, then as a non-taxable return of capital to the extent of each stockholder's tax basis in his or her Cablevision stock, and thereafter as capital gain with respect to the remaining value. It is expected that the amount of any such taxes to Cablevision's stockholders and Cablevision would be substantial.
As part of the Distribution, we entered into a tax disaffiliation agreement with Cablevision, which sets out each party's rights and obligations with respect to deficiencies and refunds, if any, of federal, state, local or foreign taxes for periods before and after the Distribution and related matters such as the filing of tax returns and the conduct of IRS and other audits. Pursuant to the tax disaffiliation agreement, we are required to indemnify Cablevision for losses and taxes of Cablevision relating to the Distribution or any related debt exchanges resulting from the breach of certain covenants, including as a result of certain acquisitions of our stock or assets or as a result of modification or repayment of certain related debt in a manner inconsistent with the private letter ruling or letter ruling request. If we are required to indemnify Cablevision under the circumstances set forth in the tax disaffiliation agreement, we may be subject to substantial liabilities, which could have a material negative effect on our business, results of operations, financial position and cash flows.
The tax disaffiliation agreement with Cablevision limits our ability to pre-pay certain of our indebtedness.
The tax disaffiliation agreement with Cablevision limits our ability to pre-pay, pay down, redeem, retire, or otherwise acquire the 7.75% Notes or the 4.75% Notes. These restrictions may for a time limit our ability to optimize our capital structure or to pursue other transactions that could increase the value of our business.
We are controlled by the Dolan family, which may create certain conflicts of interest and which means certain stockholder decisions can be taken without the consent of the majority of the holders of our Class A Common Stock.
We have two classes of common stock:
|
•
|
Class B Common Stock, which is generally entitled to ten votes per share and is entitled collectively to elect 75% of our Board of Directors, and
|
|
•
|
Class A Common Stock, which is entitled to one vote per share and is entitled collectively to elect the remaining 25% of our Board of Directors.
|
As of
December 31, 2013
, Charles F. Dolan, our Executive Chairman, and the Dolan family, including trusts for the benefit of members of the Dolan family, collectively own all of our Class B Common Stock, less than
2%
of our outstanding Class A Common Stock and approximately
66%
of the total voting power of all our outstanding common stock. The members of the Dolan family holding Class B Common Stock have entered into a stockholders agreement pursuant to which, among other things, the voting power of the holders of our Class B Common Stock will be cast as a block with respect to all matters to be voted on by holders of Class B Common Stock. The Dolan family is able to prevent a change in control of our Company and no person interested in acquiring us will be able to do so without obtaining the consent of the Dolan family.
Charles F. Dolan, members of his family and certain related family entities, by virtue of their stock ownership, have the power to elect all of our directors subject to election by holders of Class B Common Stock and are able collectively to control stockholder decisions on matters on which holders of all classes of our common stock vote together as a single class. These matters could include the amendment of some provisions of our certificate of incorporation and the approval of fundamental corporate transactions.
23
In addition, the affirmative vote or consent of the holders of at least 66 2/3% of the outstanding shares of the Class B Common Stock, voting separately as a class, is required to approve:
|
•
|
the authorization or issuance of any additional shares of Class B Common Stock, and
|
|
•
|
any amendment, alteration or repeal of any of the provisions of our certificate of incorporation that adversely affects the powers, preferences or rights of the Class B Common Stock.
|
As a result, Charles F. Dolan, members of his family and certain related family entities also collectively have the power to prevent such issuance or amendment.
We have adopted a written policy whereby an independent committee of our Board of Directors will review and approve or take such other action as it may deem appropriate with respect to certain transactions involving the Company and its subsidiaries, on the one hand, and certain related parties, including Charles F. Dolan and certain of his family members and related entities on the other hand. This policy does not address all possible conflicts which may arise, and there can be no assurance that this policy will be effective in dealing with conflict scenarios.
We are a “controlled company” for NASDAQ purposes, which allows us not to comply with certain of the corporate governance rules of NASDAQ.
Charles F. Dolan, members of his family and certain related family entities have entered into a stockholders agreement relating, among other things, to the voting of their shares of our Class B Common Stock. As a result, we are a “controlled company” under the corporate governance rules of NASDAQ. As a controlled company, we have the right to elect not to comply with the corporate governance rules of NASDAQ requiring: (i) a majority of independent directors on our Board of Directors, (ii) an independent compensation committee and (iii) an independent corporate governance and nominating committee. Our Board of Directors has elected for the Company to be treated as a “controlled company” under NASDAQ corporate governance rules and not to comply with the NASDAQ requirement for a majority independent board of directors and an independent corporate governance and nominating committee because of our status as a controlled company. For purposes of this agreement, the term “independent directors” means the directors of the Company who have been determined by our Board of Directors to be independent directors for purposes of NASDAQ corporate governance standards.
Future stock sales, including as a result of the exercising of registration rights by certain of our shareholders, could adversely affect the trading price of our Class A Common Stock.
Certain parties have registration rights covering a portion of our shares. We have entered into registration rights agreements with Charles F. Dolan, members of his family, certain Dolan family interests and the Dolan Family Foundations that provide them with “demand” and “piggyback” registration rights with respect to approximately 13.4 million shares of Class A Common Stock, including shares issuable upon conversion of shares of Class B Common Stock. Sales of a substantial number of shares of Class A Common Stock could adversely affect the market price of the Class A Common Stock and could impair our future ability to raise capital through an offering of our equity securities.
We share a senior executive and certain directors with Cablevision and The Madison Square Garden Company, which may give rise to conflicts.
Our Executive Chairman, Charles F. Dolan, also serves as the Chairman of Cablevision. As a result, a senior executive officer of the Company will not be devoting his full time and attention to the Company’s affairs. In addition, eight members of our Board of Directors are also directors of Cablevision and seven members of our Board are also directors of The Madison Square Garden Company (“MSG”), an affiliate of Cablevision and the Company. These directors may have actual or apparent conflicts of interest with respect to matters involving or affecting each company. For example, the potential for a conflict of interest exists when we on one hand, and Cablevision or MSG on the other hand, consider acquisitions and other corporate opportunities that may be suitable for us and either or both of them. Also, conflicts may arise if there are issues or disputes under the commercial arrangements that exist between Cablevision or MSG and us. In addition, certain of our directors and officers, including Charles F. Dolan, own Cablevision or MSG stock, restricted stock units and options to purchase, and stock appreciation rights in respect of, Cablevision or MSG stock, as well as cash performance awards with any payout based on Cablevision’s or MSG’s performance. These ownership interests could create actual, apparent or potential conflicts of interest when these individuals are faced with decisions that could have different implications for our Company, Cablevision or MSG. See “Certain Relationships and Related Party Transactions—Certain Relationships and Potential Conflicts of Interest” in our proxy statement filed with the SEC on April 25, 2013 for a description of our related party transaction approval policy that we have adopted to help address such potential conflicts that may arise.
24
Our overlapping directors and executive officer with Cablevision and MSG may result in the diversion of corporate opportunities to and other conflicts with Cablevision or MSG and provisions in our amended and restated certificate of incorporation may provide us no remedy in that circumstance.
The Company’s amended and restated certificate of incorporation acknowledges that directors and officers of the Company may also be serving as directors, officers, employees, consultants or agents of Cablevision and its subsidiaries or MSG and its subsidiaries and that the Company may engage in material business transactions with such entities. The Company has renounced its rights to certain business opportunities and the Company’s amended and restated certificate of incorporation provides that no director or officer of the Company who is also serving as a director, officer, employee, consultant or agent of Cablevision and its subsidiaries or MSG and its subsidiaries will be liable to the Company or its stockholders for breach of any fiduciary duty that would otherwise exist by reason of the fact that any such individual directs a corporate opportunity (other than certain limited types of opportunities set forth in our certificate of incorporation) to Cablevision or any of its subsidiaries or MSG or any of its subsidiaries instead of the Company, or does not refer or communicate information regarding such corporate opportunities to the Company. These provisions in our amended and restated certificate of incorporation also expressly validates certain contracts, agreements, assignments and transactions (and amendments, modifications or terminations thereof) between the Company and Cablevision or any of its subsidiaries or MSG or any of its subsidiaries and, to the fullest extent permitted by law, provide that the actions of the overlapping directors or officers in connection therewith are not breaches of fiduciary duties owed to the Company, any of its subsidiaries or their respective stockholders.
None.
We lease approximately 379,000 square feet of space in the U.S., including approximately 260,000 square feet of office space that we lease at 11 Penn Plaza, New York, NY 10001, under lease arrangements with remaining terms of up to seven years. We use this space as our corporate headquarters and as the principal business location of our Company. We also lease approximately 60,000 square-feet of space for our broadcasting and technology center in Bethpage, New York under a lease arrangement with a remaining term of six years, from which AMC Networks Broadcasting & Technology conducts its operations. In addition, we lease other properties in New York, California and Florida.
We lease approximately 182,000 square feet of space outside of the U.S., including in the Netherlands, Hungary, Argentina, the United Kingdom and Spain that support our international operations.
We believe our properties are adequate for our use.
On April 15, 2011, Thomas C. Dolan, a director of the Company and Executive Vice President, Strategy and Development, in the Office of the Chairman and a director of Cablevision, filed a lawsuit against Cablevision and RMH in New York Supreme Court. The lawsuit raises compensation-related claims (seeking approximately
$11
million) related to events in 2005. The matter is being handled under the direction of an independent committee of the board of directors of Cablevision. In connection with the Distribution Agreement, Cablevision indemnified the Company and RMH against any liabilities and expenses related to this lawsuit. Based on the indemnification and Cablevision’s and the Company’s assessment of this possible loss contingency, no provision has been made for this matter in the consolidated financial statements.
In addition to the matters discussed above, the Company is party to various lawsuits and claims in the ordinary course of business. Although the outcome of these other matters cannot be predicted with certainty and the impact of the final resolution of these other matters on the Company’s results of operations in a particular subsequent reporting period is not known, management does not believe that the resolution of these matters will have a material adverse effect on the financial position of the Company or the ability of the Company to meet its financial obligations as they become due.
Not applicable.
25
Our Class A Common Stock is listed on The NASDAQ Stock Market LLC (“NASDAQ”) under the symbol “AMCX.” Our Class B Common Stock is not listed on any exchange. Our Class A Common Stock began trading on NASDAQ on July 1, 2011.
Performance Graph
The following graph compares the performance of the Company’s Class A Common Stock with the performance of the S&P Mid-Cap 400 Index and a peer group (the “Peer Group Index”) by measuring the changes in our Class A Common Stock prices from July 1, 2011, the first day our Class A Common Stock began regular-way trading on NASDAQ, through
December 31, 2013
. Because no published index of comparable media companies currently reports values on a dividends-reinvested basis, the Company has created a Peer Group Index for purposes of this graph in accordance with the requirements of the SEC. The Peer Group Index is made up of companies that engage in cable television programming as a significant element of their business, although not all of the companies included in the Peer Group Index participate in all of the lines of business in which the Company is engaged, and some of the companies included in the Peer Group Index also engage in lines of business in which the Company does not participate. Additionally, the market capitalizations of many of the companies included in the Peer Group are quite different from that of the Company. The common stocks of the following companies have been included in the Peer Group Index: Discovery Communications Inc., the Walt Disney Company, Scripps Networks Interactive Inc., Starz, Time Warner Inc., Twenty-First Century Fox Inc. and Viacom Inc. The chart assumes $100 was invested on July 1, 2011 in each of: i) Company’s Class A Common Stock, ii) the S&P Mid-Cap 400 Index, and iii) in this Peer Group weighted by market capitalization.
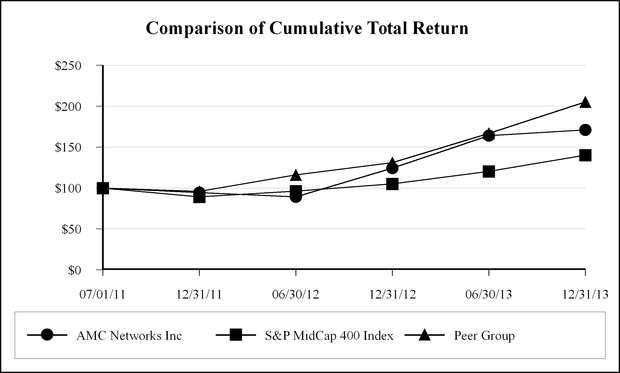
|
|
INDEXED RETURNS
Period Ending
|
|||||||||||
|
Company Name / Index
|
Base Period 7/01/11
|
12/31/11
|
6/30/12
|
12/31/12
|
6/30/13
|
12/31/13
|
||||||
|
AMC Networks Inc.
|
100
|
94.30
|
89.21
|
124.22
|
163.94
|
170.92
|
||||||
|
S&P MidCap 400 Index
|
100
|
89.03
|
96.06
|
104.94
|
120.25
|
140.10
|
||||||
|
Peer Group
|
100
|
95.90
|
115.98
|
131.07
|
166.78
|
205.10
|
||||||
This performance graph shall not be deemed “filed” for purposes of Section 18 of the Securities Exchange Act of 1934, as amended (the “Exchange Act”) or incorporated by reference into any of our filings under the Securities Act of 1933, as amended, or the Exchange Act, except as shall be expressly set forth by specific reference in such filing.
26
As of
February 18, 2014
there were 911 holders of record of our Class A Common Stock and 33 holders of record of our Class B Common Stock. We did not pay any cash dividend on our common stock during 2013 and do not expect to pay a cash dividend on our common stock for the foreseeable future. Our Amended and Restated Credit Facility, the 7.75% Notes Indenture and the 4.75% Notes Indenture restrict our ability to declare dividends in certain situations.
Price Range of AMC Networks' Class A Common Stock
The following table sets forth for the periods indicated the intra-day high and low sales prices per share of the AMCX Class A Common Stock as reported on the NASDAQ:
|
Year Ended December 31, 2013
|
High
|
Low
|
||||||
|
First Quarter
|
$
|
63.26
|
|
$
|
49.97
|
|
||
|
Second Quarter
|
$
|
70.65
|
|
$
|
59.56
|
|
||
|
Third Quarter
|
$
|
72.46
|
|
$
|
61.05
|
|
||
|
Fourth Quarter
|
$
|
73.39
|
|
$
|
61.69
|
|
||
|
Year Ended December 31, 2012
|
High
|
Low
|
||||||
|
First Quarter
|
$
|
46.69
|
|
$
|
36.98
|
|
||
|
Second Quarter
|
$
|
46.00
|
|
$
|
34.78
|
|
||
|
Third Quarter
|
$
|
45.09
|
|
$
|
35.30
|
|
||
|
Fourth Quarter
|
$
|
55.38
|
|
$
|
40.75
|
|
||
Issuer Purchases of Equity Securities
Set forth below is information concerning acquisitions of AMC Networks' Class A Common Stock by the Company during the three months ended
December 31, 2013
.
|
Period
|
(a) Total Number of Shares
(or Units) Purchased
|
(b) Average Price Paid per Share (or Unit)
|
(c) Total Number of Shares (or Units) Purchased as Part of Publicly Announced Plans or Programs
|
(d) Maximum Number (or Approximate Dollar Value) of Shares (or Units) that May Yet Be Purchased Under the Plans or Programs
|
|||||||
|
October 1, 2013 to October 31, 2013
|
—
|
|
$
|
—
|
|
N/A
|
N/A
|
||||
|
November 1, 2013 to November 30, 2013
|
26
|
|
$
|
65.95
|
|
N/A
|
N/A
|
||||
|
December 1, 2013 to December 31, 2013
|
2,031
|
|
$
|
65.54
|
|
N/A
|
N/A
|
||||
|
Total
|
2,057
|
|
$
|
65.54
|
|
N/A
|
|||||
During the fourth quarter of 2013, certain restricted shares of AMC Networks' Class A common stock previously issued to employees of Cablevision vested. In connection with the employees’ satisfaction of the statutory minimum tax withholding obligations for the applicable income and other employment taxes,
2,057
shares, with an aggregate value of approximately $135 thousand, were surrendered to the Company. The
2,057
acquired shares have been classified as treasury stock.
The table above does not include any shares received in connection with forfeitures of awards pursuant to the Company’s employee stock plan.
27
The operating and balance sheet data included in the following selected financial data as of
December 31, 2013
and
2012
and for each of the years in the three-year period ended
December 31, 2013
, have been derived from the audited consolidated financial statements of the Company included in this Annual Report. The balance sheet data included in the following selected financial data as of December 31, 2011, 2010 and 2009 and the operating data for the years ended December 31, 2010 and 2009 have been derived from the audited consolidated financial statements of the Company, not included in this Annual Report. The financial information presented below does not necessarily reflect what our results of operations and financial position would have been through 2011 if we had operated as a separate publicly-traded entity prior to July 1, 2011. The selected financial data below is also not necessarily indicative of results of future operations and should be read in conjunction with Item 7, “Management’s Discussion and Analysis of Financial Condition and Results of Operations” and the accompanying consolidated financial statements and related notes.
|
|
Years Ended December 31,
|
||||||||||||||||||
|
|
2013
|
2012
|
2011
|
2010
|
2009
|
||||||||||||||
|
|
(Dollars in thousands, except per share amounts)
|
||||||||||||||||||
|
Operating Data:
|
|||||||||||||||||||
|
Revenues, net
|
$
|
1,591,858
|
|
$
|
1,352,577
|
|
$
|
1,187,741
|
|
$
|
1,078,300
|
|
$
|
973,644
|
|
||||
|
Operating expenses:
|
|||||||||||||||||||
|
Technical and operating (excluding depreciation and amortization shown below)
|
662,233
|
|
507,436
|
|
425,961
|
|
366,093
|
|
310,365
|
|
|||||||||
|
Selling, general and administrative
|
425,735
|
|
396,926
|
|
335,656
|
|
328,134
|
|
313,904
|
|
|||||||||
|
Restructuring (credit) expense (a)
|
—
|
|
(3
|
)
|
(240
|
)
|
(2,218
|
)
|
5,162
|
|
|||||||||
|
Depreciation and amortization
|
54,667
|
|
85,380
|
|
99,848
|
|
106,455
|
|
106,504
|
|
|||||||||
|
Litigation settlement gain
|
(132,944
|
)
|
—
|
|
—
|
|
—
|
|
—
|
|
|||||||||
|
1,009,691
|
|
989,739
|
|
861,225
|
|
798,464
|
|
735,935
|
|
||||||||||
|
Operating income
|
582,167
|
|
362,838
|
|
326,516
|
|
279,836
|
|
237,709
|
|
|||||||||
|
Other income (expense)
|
(113,166
|
)
|
(140,564
|
)
|
(115,906
|
)
|
(73,574
|
)
|
(78,755
|
)
|
|||||||||
|
Income from continuing operations before income taxes
|
469,001
|
|
222,274
|
|
210,610
|
|
206,262
|
|
158,954
|
|
|||||||||
|
Income tax expense
|
(178,841
|
)
|
(86,058
|
)
|
(84,248
|
)
|
(88,073
|
)
|
(70,407
|
)
|
|||||||||
|
Income from continuing operations
|
290,160
|
|
136,216
|
|
126,362
|
|
118,189
|
|
88,547
|
|
|||||||||
|
Income (loss) from discontinued operations, net of income taxes
|
—
|
|
314
|
|
92
|
|
(38,090
|
)
|
(34,791
|
)
|
|||||||||
|
Net income including noncontrolling interests
|
290,160
|
|
136,530
|
|
126,454
|
|
80,099
|
|
53,756
|
|
|||||||||
|
Net loss attributable to noncontrolling interests
|
578
|
|
—
|
|
—
|
|
—
|
|
—
|
|
|||||||||
|
Net income attributable to AMC Networks' stockholders
|
$
|
290,738
|
|
$
|
136,530
|
|
$
|
126,454
|
|
$
|
80,099
|
|
$
|
53,756
|
|
||||
|
Income from continuing operations per share:
|
|||||||||||||||||||
|
Basic (b)
|
$
|
4.06
|
|
$
|
1.94
|
|
$
|
1.82
|
|
$
|
1.71
|
|
$
|
1.28
|
|
||||
|
Diluted (b)
|
$
|
4.00
|
|
$
|
1.89
|
|
$
|
1.79
|
|
$
|
1.71
|
|
$
|
1.28
|
|
||||
|
|
|||||||||||||||||||
|
Cash and cash equivalents
|
$
|
521,951
|
|
$
|
610,970
|
|
$
|
215,836
|
|
$
|
79,960
|
|
$
|
29,828
|
|
||||
|
Total assets
|
2,636,689
|
|
2,596,219
|
|
2,183,934
|
|
1,853,896
|
|
1,934,362
|
|
|||||||||
|
Total debt (including capital leases) (c)
|
2,171,288
|
|
2,168,977
|
|
2,306,957
|
|
1,118,875
|
|
1,417,711
|
|
|||||||||
|
Stockholders’ (deficiency) equity (c)
|
(571,519
|
)
|
(882,352
|
)
|
(1,036,995
|
)
|
24,831
|
|
(236,992
|
)
|
|||||||||
|
(a)
|
In December 2008, we decided to discontinue funding the domestic programming business of VOOM HD. In connection with this decision, we recorded restructuring expense (credit) in each of the years 2009 to 2012.
|
28
|
(b)
|
Common shares assumed to be outstanding during the years ended December 31, 2010 and 2009 totaled 69,161,000, representing the number of shares of AMC Networks common stock issued to Cablevision shareholders on the Distribution date, and excludes unvested outstanding restricted shares, based on a distribution ratio of one share of AMC Networks common stock for every four shares of Cablevision common stock outstanding.
|
|
(c)
|
In 2011, as part of the Distribution, we incurred $2,425,000 of debt (the “Distribution Debt”), consisting of $1,725,000 aggregate principal amount of senior secured term loans and $700,000 aggregate principal amount of 7.75% senior unsecured notes. Approximately $1,063,000 of the proceeds of the Distribution Debt was used to repay all pre-Distribution outstanding Company debt (excluding capital leases), including principal and accrued and unpaid interest to the date of repayment, and, as partial consideration for Cablevision’s contribution of the membership interests in RMH to the Company, $1,250,000, net of discount, of Distribution Debt was issued to CSC Holdings, a wholly-owned subsidiary of Cablevision, which is reflected as a deemed capital distribution in the consolidated statement of stockholders’ deficiency for the year ended December 31, 2011. See Note 1 to the accompanying consolidated financial statements.
|
29
Forward-Looking Statements
This Management’s Discussion and Analysis of Financial Condition and Results of Operations contains statements that constitute forward-looking information within the meaning of the Private Securities Litigation Reform Act of 1995. In this Management’s Discussion and Analysis of Financial Condition and Results of Operations there are statements concerning our future operating results and future financial performance. Words such as “expects,” “anticipates,” “believes,” “estimates,” “may,” “will,” “should,” “could,” “potential,” “continue,” “intends,” “plans” and similar words and terms used in the discussion of future operating results and future financial performance identify forward-looking statements. You are cautioned that any such forward-looking statements are not guarantees of future performance or results and involve risks and uncertainties and that actual results or developments may differ materially from the forward-looking statements as a result of various factors. Factors that may cause such differences to occur include, but are not limited to:
• the level of our revenues;
• market demand for our programming networks and our programming;
• demand for advertising inventory;
|
•
|
the demand for our programming among cable and other multichannel video programming distributors and our ability to maintain and renew affiliation agreements with multichannel video programming distributors;
|
|
•
|
the cost of, and our ability to obtain or produce, desirable programming content for our networks and independent film distribution businesses;
|
|
•
|
market demand for our services internationally and for our independent film distribution business, and our ability to profitably provide those services;
|
• the security of our program rights and other electronic data;
• the loss of any of our key personnel and artistic talent;
• the highly competitive nature of the cable programming industry;
• changes in both domestic and foreign laws or regulations under which we operate;
• general economic conditions in the areas in which we operate;
• our substantial debt and high leverage;
• reduced access to capital markets or significant increases in costs to borrow;
• the level of our expenses;
• the level of our capital expenditures;
• future acquisitions and dispositions of assets;
•
integration of Chellomedia;
• the outcome of litigation and other proceedings;
|
•
|
whether pending uncompleted transactions are completed on the terms and at the times set forth (if at all);
|
• other risks and uncertainties inherent in our programming businesses;
|
•
|
financial community and rating agency perceptions of our business, operations, financial condition and the industry in which we operate, and the additional factors described herein; and
|
•
the factors described under Item 1A, “Risk Factors” in this Annual Report.
We disclaim any obligation to update or revise the forward-looking statements contained herein, except as otherwise required by applicable federal securities laws.
All dollar amounts and subscriber data included in the following Management’s Discussion and Analysis of Financial Condition and Results of Operations are presented in thousands.
30
Introduction
Management’s discussion and analysis, or MD&A, of our results of operations and financial condition is provided as a supplement to, and should be read in conjunction with, the accompanying consolidated financial statements and notes thereto included elsewhere herein to enhance the understanding of our financial condition, changes in financial condition and results of our operations. Our MD&A is organized as follows:
Business Overview
. This section provides a general description of our business and our operating segments, as well as other matters that we believe are important in understanding our results of operations and financial condition and in anticipating future trends.
Consolidated Results of Operations
. This section provides an analysis of our results of operations for the years ended
December 31, 2013
,
2012
and
2011
. Our discussion is presented on both a consolidated and segment basis. Our two segments are: (i) National Networks and (ii) International and Other.
Liquidity and Capital Resources
. This section provides a discussion of our financial condition as of
December 31, 2013
as well as an analysis of our cash flows for the years ended
December 31, 2013
,
2012
and
2011
. The discussion of our financial condition and liquidity includes summaries of (i) our primary sources of liquidity and (ii) our contractual obligations and off balance sheet arrangements that existed at
December 31, 2013
.
Critical Accounting Policies and Estimates
. This section provides a discussion of our accounting policies considered to be important to an understanding of our financial condition and results of operations, and which require significant judgment and estimates on the part of management in their application.
Business Overview
We manage our business through the following two operating segments:
|
•
|
National Networks:
Principally includes our four nationally distributed programming networks: AMC, WE tv, IFC and SundanceTV. These programming networks are distributed throughout the United States via multichannel video programming distributors;
|
|
•
|
International and Other:
Principally includes AMC/Sundance Channel Global, our international programming business; IFC Films, our independent film distribution business; AMC Networks Broadcasting & Technology, our network technical services business, which primarily services the programming networks of the Company; and various developing online content distribution initiatives. AMC and Sundance Channel are distributed in Canada, Sundance Channel is also distributed in Europe, Asia and Latin America and WE tv is distributed in Asia. The International and Other operating segment also includes VOOM HD.
|
31
The tables presented below set forth our consolidated revenues, net, operating income (loss) and adjusted operating cash flow (“AOCF”), defined below, for the periods indicated.
|
|
Years Ended December 31,
|
||||||||||
|
|
2013
|
2012
|
2011
|
||||||||
|
Revenues, net
|
|||||||||||
|
National Networks
|
$
|
1,485,016
|
|
$
|
1,254,186
|
|
$
|
1,082,358
|
|
||
|
International and Other
|
122,429
|
|
114,541
|
|
125,573
|
|
|||||
|
Inter-segment eliminations
|
(15,587
|
)
|
(16,150
|
)
|
(20,190
|
)
|
|||||
|
Consolidated revenues, net
|
$
|
1,591,858
|
|
$
|
1,352,577
|
|
$
|
1,187,741
|
|
||
|
Operating income (loss)
|
|||||||||||
|
National Networks
|
$
|
501,825
|
|
$
|
408,117
|
|
$
|
349,272
|
|
||
|
International and Other (a)
|
76,598
|
|
(48,607
|
)
|
(21,890
|
)
|
|||||
|
Inter-segment eliminations
|
3,744
|
|
3,328
|
|
(866
|
)
|
|||||
|
Consolidated operating income
|
$
|
582,167
|
|
$
|
362,838
|
|
$
|
326,516
|
|
||
|
AOCF (deficit)
|
|||||||||||
|
National Networks
|
$
|
555,911
|
|
$
|
492,129
|
|
$
|
447,555
|
|
||
|
International and Other
|
(35,466
|
)
|
(30,040
|
)
|
(4,976
|
)
|
|||||
|
Inter-segment eliminations
|
3,744
|
|
3,328
|
|
(866
|
)
|
|||||
|
Consolidated AOCF
|
$
|
524,189
|
|
$
|
465,417
|
|
$
|
441,713
|
|
||
(a) Amounts for the year ended December 31, 2013 include the litigation settlement gain recorded in connection with the settlement with DISH Network. See DISH Network discussion below.
We evaluate segment performance based on several factors, of which the primary financial measure is operating segment AOCF. We define AOCF, which is a financial measure that is not calculated in accordance with generally accepted accounting principles (“GAAP”), as operating income (loss) before depreciation and amortization, share-based compensation expense or benefit, restructuring expense or credit and the litigation settlement gain recorded in connection with the settlement with DISH Network. We do not consider the one-time litigation settlement gain with DISH Network to be indicative of our ongoing operating performance.
We believe that AOCF is an appropriate measure for evaluating the operating performance on both an operating segment and consolidated basis. AOCF and similar measures with similar titles are common performance measures used by investors, analysts and peers to compare performance in the industry.
Internally, we use revenues, net and AOCF measures as the most important indicators of our business performance, and evaluate management’s effectiveness with specific reference to these indicators. AOCF should be viewed as a supplement to and not a substitute for operating income (loss), net income (loss), cash flows from operating activities and other measures of performance and/or liquidity presented in accordance with GAAP. Since AOCF is not a measure of performance calculated in accordance with GAAP, this measure may not be comparable to similar measures with similar titles used by other companies.
The following is a reconciliation of consolidated operating income to AOCF for the periods indicated:
|
|
Years Ended December 31,
|
||||||||||
|
|
2013
|
2012
|
2011
|
||||||||
|
Operating income
|
$
|
582,167
|
|
$
|
362,838
|
|
$
|
326,516
|
|
||
|
Share-based compensation expense
|
20,299
|
|
17,202
|
|
15,589
|
|
|||||
|
Depreciation and amortization
|
54,667
|
|
85,380
|
|
99,848
|
|
|||||
|
Litigation settlement gain
|
(132,944
|
)
|
—
|
|
—
|
|
|||||
|
Restructuring credit
|
—
|
|
(3
|
)
|
(240
|
)
|
|||||
|
AOCF
|
$
|
524,189
|
|
$
|
465,417
|
|
$
|
441,713
|
|
||
32
National Networks
In our National Networks segment, which accounted for
93%
of our consolidated revenues, net for the year ended
December 31, 2013
, we earn revenue principally from the distribution of our programming and the sale of advertising. Distribution revenue primarily includes affiliation fees paid by distributors to carry our programming networks and the licensing of original programming for digital, foreign and home video distribution. Affiliation fees paid by distributors represents the largest component of distribution revenue. Our affiliation fee revenues are generally based on a per subscriber fee under multi-year contracts, commonly referred to as “affiliation agreements,” which generally provide for annual affiliation rate increases. The specific affiliation fee revenues we earn vary from period to period, distributor to distributor and also vary among our networks, but are generally based upon the number of each distributor’s subscribers. The terms of certain other affiliation agreements provide that the affiliation fee revenues we earn are a fixed contractual monthly fee, which could be adjusted for acquisitions and dispositions of multichannel video programming systems by the distributor. Revenue from the licensing of original programming for digital and foreign distribution is recognized upon availability or distribution by the licensee.
Under affiliation agreements with our distributors, we have the right to sell a specified amount of national advertising time on our programming networks. Our advertising revenues are more variable than affiliation fee revenues because the majority of our advertising is sold on a short-term basis, not under long-term contracts. Our advertising arrangements with advertisers provide for a set number of advertising units to air over a specific period of time at a negotiated price per unit. Additionally, in these advertising sales arrangements, our programming networks generally guarantee specified viewer ratings for their programming. If these guaranteed viewer ratings are not met, we are generally required to provide additional advertising units to the advertiser at no charge. For these types of arrangements, a portion of the related revenue is deferred if the guaranteed viewer ratings are not met and is subsequently recognized either when we provide the required additional advertising time, the guarantee obligation contractually expires or performance requirements become remote. Most of our advertising revenues vary based upon the popularity of our programming as measured by Nielsen. In
2013
, our national programming networks had approximately 1,200 advertisers representing companies in a broad range of sectors, including the health, insurance, food, automotive and retail industries. All of our National Networks, including SundanceTV beginning in September 2013, use a traditional advertising sales model. Prior to September 2013, SundanceTV principally sold sponsorships.
Changes in revenue are primarily derived from changes in contractual affiliation rates charged for our services, changes in the number of subscribers, changes in the prices and level of advertising on our networks and changes in the availability, amount and timing of licensing fees earned from the distribution of our original programming. We seek to grow our revenues by increasing the number of viewing subscribers of the distributors that carry our services. We refer to this as our “penetration.” AMC, which is widely distributed, has a more limited ability to increase its penetration than WE tv, IFC and SundanceTV. To the extent not already carried on more widely penetrated service tiers, WE tv, IFC and SundanceTV, although carried by all of the larger distributors, have higher growth opportunities due to their current penetration levels with those distributors. WE tv and IFC are currently carried on either expanded basic or digital tiers, while SundanceTV is currently carried primarily on digital tiers. Our revenues may also increase over time through contractual rate increases stipulated in most of our affiliation agreements. In negotiating for increased or extended carriage, we have agreed in some instances to make upfront payments in exchange for additional subscribers or extended carriage, which we record as deferred carriage fees and which are amortized as a reduction to revenue over the period of the related affiliation agreements, or agreed to waive for a specified period or accept lower per subscriber fees if certain additional subscribers are provided. We also may help fund the distributors’ efforts to market our channels. We believe that these transactions generate a positive return on investment over the contract period. We seek to increase our advertising revenues by increasing the rates we charge for such advertising, which is directly related to the overall distribution of our programming, penetration of our services and the popularity (including within desirable demographic groups) of our services as measured by Nielsen. Distribution revenues in each quarter also vary based on the timing of availability of our programming to distributors. We also seek to increase our revenues by expanding the opportunities for distribution of our programming through digital, foreign and home video services.
Our principal goal is to increase our revenues by increasing distribution and penetration of our services, and increasing our ratings. To do this, we must continue to contract for and produce high-quality, attractive programming. As competition for programming increases and alternative distribution technologies continue to emerge and develop in the industry, costs for content acquisition and original programming may increase. There is a concentration of subscribers in the hands of a few distributors, which could create disparate bargaining power between the largest distributors and us by giving those distributors greater leverage in negotiating the price and other terms of affiliation agreements.
Programming expense, included in technical and operating expense, represents the largest expense of the National Networks segment and primarily consists of amortization and impairments or write-offs of programming rights, such as those for original programming, feature films and licensed series, as well as participation and residual costs. The other components of technical and operating expense primarily include distribution and production related costs and program operating costs, such as origination, transmission, uplinking and encryption.
33
To an increasing extent, the success of our business depends on original programming, both scripted and unscripted, across all of our networks. In recent years, we have introduced a number of scripted original series, primarily on AMC and, in 2013, on SundanceTV. These series have resulted in higher audience ratings for our networks. Historically, in periods when we air original programming, our ratings have increased. Among other things, higher audience ratings drive increased revenues through higher advertising revenues. The timing of exhibition and distribution of original programming varies from period to period, which results in greater variability in our revenues, earnings and cash flows from operating activities. We will continue to increase our investment in programming across all of our channels. During 2013, AMC aired six scripted original series. There may be significant changes in the level of our technical and operating expenses due to the amortization of content acquisition and/or original programming costs and/or the impact of management’s periodic assessment of programming usefulness. Such costs will also fluctuate with the level of revenues derived from owned original programming in each period as these costs are amortized based on the film-forecast-computation method.
Most original series require us to make up-front investments, which are often significant amounts. Not all of our programming efforts are commercially successful, which could result in a write-off of program rights. If it is determined that programming rights have no future programming usefulness based on actual demand or market conditions, a write-off of the unamortized cost is recorded in technical and operating expense. Program rights write-offs of $61,005, $9,990 and $18,332 were recorded for the years ended December 31, 2013, 2012 and 2011, respectively. Program rights write-offs in 2013 primarily related to two scripted original series:
The Killing
and
Low Winter Sun,
each of which was canceled in 2013
.
See “— Critical Accounting Policies and Estimates” for a discussion of the amortization and write-off of program rights.
International and Other
Our International and Other segment primarily includes the operations of AMC/Sundance Channel Global, IFC Films, and AMC Networks Broadcasting & Technology. This operating segment also includes VOOM HD.
VOOM HD historically offered a suite of channels, produced exclusively in high definition and marketed for distribution to DBS and other multichannel video programming distributors. Through 2008, VOOM was available in the U.S. only on the cable television systems of Cablevision and on the satellite delivered programming of DISH Network. VOOM HD, which we are winding down, continues to sell certain limited amounts of programming through program license agreements.
We view our international expansion as an important long-term strategy. While our current international operations represent only a small percentage of our consolidated financial results, on January 31, 2014, as more fully described below, we purchased substantially all of Chellomedia, Liberty Global plc’s international content division.
We may experience an adverse impact to the International and Other segment's operating results and cash flows in periods of increased international investment. Similar to our domestic businesses, the most significant business challenges we expect to encounter in our international business include programming competition (from both foreign and domestic programmers), limited channel capacity on distributors’ platforms, the growth of subscribers on those platforms and economic pressures on affiliation fees. Other significant business challenges unique to international expansion include increased programming costs for international rights and translation (
i.e.
dubbing and subtitling), a lack of availability of international rights for a portion of our domestic programming content, increased distribution costs for cable, satellite or fiber feeds and a limited physical presence in each territory. See also the risk factors described under Item 1A, “Risk Factors - We face risks from doing business internationally.” in this Annual Report.
Acquisition of Chellomedia
On January 31, 2014, certain subsidiaries of AMC Networks purchased substantially all of Chellomedia, the international content division of Liberty Global plc,
for a purchase price of €750 million (approximately $1.0 billion),
subject to adjustments for working capital, cash, and indebtedness acquired and for the purchase of minority equity interests. AMC Networks funded the purchase price with cash on hand and additional indebtedness of $600 million (see "Amended and Restated Credit Facility" discussion below).
The acquisition provides AMC Networks with television channels that are distributed to more than 390 million subscribers in over 130 countries and span a wide range of progra
mming genres, most notably movie and entertainment networks
.
The
acquisition of Chellomedia's operating businesses include: Chello Central Europe, Chello Latin America, Chello Multicanal, Chello Zone, the ad sales unit Atmedia, and the broadcast solutions unit, Chello DMC. The acquisition provides us with the opportunity to accelerate and enhance our international expansion strategy.
34
DISH Network
On October 21, 2012, DISH Network, VOOM HD and Cablevision entered into a confidential settlement agreement (the “Settlement Agreement”) to settle the litigation between VOOM HD and DISH Network. In connection with the Settlement Agreement, DISH Network entered into a long-term affiliation agreement with the Company that provided for the carriage of AMC, WE tv, IFC and SundanceTV. In addition, DISH Network paid $700,000 to an account for the benefit of Cablevision and the Company (“Settlement Funds”). During the fourth quarter of 2012, AMC Networks and Rainbow Programming Holdings LLC, a wholly-owned subsidiary of AMC Networks (collectively, the “AMC Parties”) and CSC Holdings, LLC (“CSC Holdings”), a wholly-owned subsidiary of Cablevision, agreed that, pending a final determination of the allocation of the proceeds, the Settlement Funds would be distributed equally to each of the Company and Cablevision.
On April 8, 2013, Cablevision and the Company entered into an agreement (the “DISH Network Proceeds Allocation Agreement”) in which a final allocation of the proceeds of the settlement, including the Settlement Funds, was made. The principal terms of the DISH Network Proceeds Allocation Agreement were as follows: Cablevision received $525,000 of the Settlement Funds and the Company received $175,000 of the Settlement Funds representing the allocation of cash and non-cash proceeds (including the portion of the DISH Network affiliation agreement attributable to the Settlement). The DISH Network Proceeds Allocation Agreement was in full and final settlement of the allocation between Cablevision and the Company of the proceeds of the Settlement.
In accordance with the Company's Related Party Transaction Approval Policy, the final allocation of the proceeds from the settlement was approved by an independent committee of the Company's Board of Directors, as well as an independent committee of Cablevision's board of directors.
The $350,000 of Settlement Funds previously disbursed to the Company is included in cash and cash equivalents in the consolidated balance sheet at December 31, 2012. Deferred litigation settlement proceeds at December 31, 2012 of approximately $308,000, is the result of the $350,000 of Settlement Funds, less $31,000 representing the excess of the fair value of the DISH Network affiliation agreement over the contractual affiliation fees recorded to deferred revenue on October 21, 2012 and less an $11,000 receivable related to VOOM HD's previous affiliation agreement with DISH Network.
On April 9, 2013, the Company paid to Cablevision $175,000 of the Settlement Funds. Additionally, in 2013, the Company recorded a litigation settlement gain of approximately $133,000, included in operating income within the International and Other segment, representing the deferred litigation settlement proceeds liability of approximately $308,000 recorded in the consolidated balance sheet at December 31, 2012 less the $175,000 paid to Cablevision on April 9, 2013.
Spin-off from Cablevision
On June 30, 2011, Cablevision spun-off the Company (the "Distribution") and we became an independent public company. Immediately prior to the Distribution, we were an indirect wholly-owned subsidiary of Cablevision. Both Cablevision and AMC Networks continue to be controlled by the Dolan Family.
As part of the Distribution, the Company incurred debt of $2,425,000 ("Distribution Debt"), consisting of $1,725,000 aggregate principal amount of senior secured term loans and $700,000 aggregate principal amount of senior unsecured notes (see Note 7 in the accompanying consolidated financial statements). Approximately $1,063,000 of the proceeds of the Distribution Debt was used to repay all pre-Distribution outstanding debt (excluding capital leases), including principal and accrued and unpaid interest to the date of repayment, and, as partial consideration for Cablevision’s contribution of the membership interests in RMH to us, $1,250,000, net of discount, of Distribution Debt was issued to CSC Holdings, a wholly-owned subsidiary of Cablevision, which is reflected as a deemed capital distribution in the consolidated statement of stockholders’ deficiency for the year ended December 31, 2011. CSC Holdings used such Distribution Debt to satisfy and discharge outstanding CSC Holdings debt, which ultimately resulted in such Distribution Debt being held by third party investors.
Corporate Expenses
Our historical results of operations reflected in our consolidated financial statements, for periods prior to the Distribution, include management fee charges and the allocation of expenses related to certain corporate functions historically provided by Cablevision. Our results of operations after the Distribution reflect certain revenues and expenses related to transactions with or charges from related parties as described in Note 15 in the accompanying consolidated financial statements. As a separate, stand-alone public company, we have expanded our financial, administrative and other staff to support the related new requirements. Pursuant to a consulting agreement with Cablevision, until the Distribution date the Company paid a management fee calculated based on certain of our subsidiaries' gross revenues (as defined under the terms of the consulting agreement) on a monthly basis. We terminated the consulting agreement on the Distribution date and did not replace it.
We allocate corporate overhead to each segment based upon their proportionate estimated usage of services. The segment financial information set forth below, including the discussion related to individual line items, does not reflect inter-segment eliminations unless specifically indicated.
35
Impact of Economic Conditions
Our future performance is dependent, to a large extent, on general economic conditions including the impact of direct competition, our ability to manage our businesses effectively, and our relative strength and leverage in the marketplace, both with suppliers and customers.
Capital and credit market disruptions could cause economic downturns, which may lead to lower demand for our products, such as lower demand for television advertising and a decrease in the number of subscribers receiving our programming networks from our distributors. Events such as these may adversely impact our results of operations, cash flows and financial position.
Consolidated Results of Operations
Year Ended December 31, 2013
Compared to
Year Ended December 31, 2012
The following table sets forth our consolidated results of operations for the periods indicated.
|
|
Years Ended December 31,
|
|
|
|||||||||||||||||
|
|
2013
|
2012
|
|
|
||||||||||||||||
|
|
Amount
|
% of
Revenues,
net
|
Amount
|
% of
Revenues,
net
|
$ change
|
%
change
|
||||||||||||||
|
Revenues, net
|
$
|
1,591,858
|
|
100.0
|
%
|
$
|
1,352,577
|
|
100.0
|
%
|
$
|
239,281
|
|
17.7
|
%
|
|||||
|
Operating expenses:
|
||||||||||||||||||||
|
Technical and operating (excluding depreciation and amortization)
|
662,233
|
|
41.6
|
|
507,436
|
|
37.5
|
|
154,797
|
|
30.5
|
|
||||||||
|
Selling, general and administrative
|
425,735
|
|
26.7
|
|
396,926
|
|
29.3
|
|
28,809
|
|
7.3
|
|
||||||||
|
Restructuring credit
|
—
|
|
—
|
|
(3
|
)
|
—
|
|
3
|
|
(100.0
|
)
|
||||||||
|
Depreciation and amortization
|
54,667
|
|
3.4
|
|
85,380
|
|
6.3
|
|
(30,713
|
)
|
(36.0
|
)
|
||||||||
|
Litigation settlement gain
|
(132,944
|
)
|
(8.4
|
)
|
—
|
|
—
|
|
(132,944
|
)
|
n/m
|
|
||||||||
|
Total operating expenses
|
1,009,691
|
|
63.4
|
|
989,739
|
|
73.2
|
|
19,952
|
|
2.0
|
|
||||||||
|
Operating income
|
582,167
|
|
36.6
|
|
362,838
|
|
26.8
|
|
219,329
|
|
60.4
|
|
||||||||
|
Other income (expense):
|
||||||||||||||||||||
|
Interest expense, net
|
(115,041
|
)
|
(7.2
|
)
|
(127,276
|
)
|
(9.4
|
)
|
12,235
|
|
(9.6
|
)
|
||||||||
|
Write-off of deferred financing costs
|
(4,007
|
)
|
(0.3
|
)
|
(1,862
|
)
|
(0.1
|
)
|
(2,145
|
)
|
115.2
|
|
||||||||
|
Loss on extinguishment of debt
|
(1,087
|
)
|
(0.1
|
)
|
(10,774
|
)
|
(0.8
|
)
|
9,687
|
|
(89.9
|
)
|
||||||||
|
Miscellaneous, net
|
6,969
|
|
0.4
|
|
(652
|
)
|
—
|
|
7,621
|
|
n/m
|
|
||||||||
|
Total other income (expense)
|
(113,166
|
)
|
(7.1
|
)
|
(140,564
|
)
|
(10.4
|
)
|
27,398
|
|
(19.5
|
)
|
||||||||
|
Income from continuing operations before income taxes
|
469,001
|
|
29.5
|
|
222,274
|
|
16.4
|
|
246,727
|
|
111.0
|
|
||||||||
|
Income tax expense
|
(178,841
|
)
|
(11.2
|
)
|
(86,058
|
)
|
(6.4
|
)
|
(92,783
|
)
|
107.8
|
|
||||||||
|
Income from continuing operations
|
290,160
|
|
18.2
|
|
136,216
|
|
10.1
|
|
153,944
|
|
113.0
|
|
||||||||
|
Income from discontinued operations, net of income taxes
|
—
|
|
—
|
|
314
|
|
—
|
|
(314
|
)
|
(100.0
|
)
|
||||||||
|
Net income including noncontrolling interests
|
290,160
|
|
18.2
|
%
|
136,530
|
|
10.1
|
%
|
153,630
|
|
112.5
|
%
|
||||||||
|
Net loss attributable to noncontrolling interests
|
578
|
|
—
|
%
|
—
|
|
—
|
%
|
578
|
|
n/m
|
|
||||||||
|
Net income attributable to AMC Networks’ stockholders
|
$
|
290,738
|
|
18.3
|
%
|
$
|
136,530
|
|
10.1
|
%
|
$
|
154,208
|
|
112.9
|
%
|
|||||
36
The following is a reconciliation of our consolidated operating income to AOCF:
|
|
Years Ended December 31,
|
|
|
|||||||||||
|
|
2013
|
2012
|
$ change
|
% change
|
||||||||||
|
Operating income
|
$
|
582,167
|
|
$
|
362,838
|
|
$
|
219,329
|
|
60.4
|
%
|
|||
|
Share-based compensation expense
|
20,299
|
|
17,202
|
|
3,097
|
|
18.0
|
|
||||||
|
Depreciation and amortization
|
54,667
|
|
85,380
|
|
(30,713
|
)
|
(36.0
|
)
|
||||||
|
Litigation settlement gain
|
(132,944
|
)
|
—
|
|
(132,944
|
)
|
n/m
|
|
||||||
|
Restructuring credit
|
—
|
|
(3
|
)
|
3
|
|
(100.0
|
)
|
||||||
|
Consolidated AOCF
|
$
|
524,189
|
|
$
|
465,417
|
|
$
|
58,772
|
|
12.6
|
%
|
|||
National Networks Segment Results
The following table sets forth our National Networks segment results for the periods indicated.
|
|
Years Ended December 31,
|
|
|
|||||||||||||||||
|
|
2013
|
2012
|
|
|
||||||||||||||||
|
|
Amount
|
% of
Revenues,
net
|
Amount
|
% of
Revenues,
net
|
$ change
|
%
change
|
||||||||||||||
|
Revenues, net
|
$
|
1,485,016
|
|
100.0
|
%
|
$
|
1,254,186
|
|
100.0
|
%
|
$
|
230,830
|
|
18.4
|
%
|
|||||
|
Operating expenses:
|
||||||||||||||||||||
|
Technical and operating (excluding depreciation and amortization)
|
592,587
|
|
39.9
|
|
450,124
|
|
35.9
|
|
142,463
|
|
31.6
|
|
||||||||
|
Selling, general and administrative
|
352,731
|
|
23.8
|
|
325,509
|
|
26.0
|
|
27,222
|
|
8.4
|
|
||||||||
|
Depreciation and amortization
|
37,873
|
|
2.6
|
|
70,436
|
|
5.6
|
|
(32,563
|
)
|
(46.2
|
)
|
||||||||
|
Operating income
|
$
|
501,825
|
|
33.8
|
%
|
$
|
408,117
|
|
32.5
|
%
|
$
|
93,708
|
|
23.0
|
%
|
|||||
|
Share-based compensation expense
|
16,213
|
|
1.1
|
|
13,576
|
|
1.1
|
|
2,637
|
|
19.4
|
|
||||||||
|
Depreciation and amortization
|
37,873
|
|
2.6
|
|
70,436
|
|
5.6
|
|
(32,563
|
)
|
(46.2
|
)
|
||||||||
|
AOCF
|
$
|
555,911
|
|
37.4
|
%
|
$
|
492,129
|
|
39.2
|
%
|
$
|
63,782
|
|
13.0
|
%
|
|||||
International and Other Segment Results
The following table sets forth our International and Other segment results for the periods indicated.
|
|
Years Ended December 31,
|
|
|
|||||||||||||||||
|
|
2013
|
2012
|
|
|
||||||||||||||||
|
|
Amount
|
% of
Revenues,
net
|
Amount
|
% of
Revenues,
net
|
$ change
|
%
change
|
||||||||||||||
|
Revenues, net
|
$
|
122,429
|
|
100.0
|
%
|
$
|
114,541
|
|
100.0
|
%
|
$
|
7,888
|
|
6.9
|
%
|
|||||
|
Operating expenses:
|
||||||||||||||||||||
|
Technical and operating (excluding depreciation and amortization)
|
88,665
|
|
72.4
|
|
76,468
|
|
66.8
|
|
12,197
|
|
16.0
|
|
||||||||
|
Selling, general and administrative
|
73,316
|
|
59.9
|
|
71,739
|
|
62.6
|
|
1,577
|
|
2.2
|
|
||||||||
|
Restructuring credit
|
—
|
|
—
|
|
(3
|
)
|
—
|
|
3
|
|
(100.0
|
)
|
||||||||
|
Depreciation and amortization
|
16,794
|
|
13.7
|
|
14,944
|
|
13.0
|
|
1,850
|
|
12.4
|
|
||||||||
|
Litigation settlement gain
|
(132,944
|
)
|
(108.6
|
)%
|
—
|
|
—
|
%
|
(132,944
|
)
|
n/m
|
|
||||||||
|
Operating income (loss)
|
$
|
76,598
|
|
62.6
|
%
|
$
|
(48,607
|
)
|
(42.4
|
)%
|
$
|
125,205
|
|
(257.6
|
)%
|
|||||
|
Share-based compensation expense
|
4,086
|
|
3.3
|
|
3,626
|
|
3.2
|
|
460
|
|
12.7
|
|
||||||||
|
Depreciation and amortization
|
16,794
|
|
13.7
|
|
14,944
|
|
13.0
|
|
1,850
|
|
12.4
|
|
||||||||
|
Litigation settlement gain
|
(132,944
|
)
|
(108.6
|
)
|
—
|
|
—
|
|
(132,944
|
)
|
n/m
|
|
||||||||
|
Restructuring credit
|
—
|
|
—
|
|
(3
|
)
|
—
|
|
3
|
|
(100.0
|
)
|
||||||||
|
AOCF deficit
|
$
|
(35,466
|
)
|
(29.0
|
)%
|
$
|
(30,040
|
)
|
(26.2
|
)%
|
$
|
(5,426
|
)
|
18.1
|
%
|
|||||
37
Revenues, net
Revenues, net
increased
$239,281
to
$1,591,858
for the year ended
December 31, 2013
as compared to the year ended
December 31, 2012
. The net change by segment was as follows:
|
|
Years Ended December 31,
|
|
|
|||||||||||||||||
|
|
2013
|
% of
total
|
2012
|
% of
total
|
$ change
|
%
change
|
||||||||||||||
|
National Networks
|
$
|
1,485,016
|
|
93.3
|
%
|
$
|
1,254,186
|
|
92.7
|
%
|
$
|
230,830
|
|
18.4
|
%
|
|||||
|
International and Other
|
122,429
|
|
7.7
|
|
114,541
|
|
8.5
|
|
7,888
|
|
6.9
|
|
||||||||
|
Inter-segment eliminations
|
(15,587
|
)
|
(1.0
|
)
|
(16,150
|
)
|
(1.2
|
)
|
563
|
|
(3.5
|
)
|
||||||||
|
Consolidated revenues, net
|
$
|
1,591,858
|
|
100.0
|
%
|
$
|
1,352,577
|
|
100.0
|
%
|
$
|
239,281
|
|
17.7
|
%
|
|||||
National Networks
The
increase
in National Networks revenues, net was attributable to the following:
|
|
Years Ended December 31,
|
|
|
|||||||||||||||||
|
|
2013
|
% of
total
|
2012
|
% of
total
|
$ change
|
%
change
|
||||||||||||||
|
Advertising
|
$
|
662,789
|
|
44.6
|
%
|
$
|
522,917
|
|
41.7
|
%
|
$
|
139,872
|
|
26.7
|
%
|
|||||
|
Distribution
|
822,227
|
|
55.4
|
|
731,269
|
|
58.3
|
|
90,958
|
|
12.4
|
|
||||||||
|
$
|
1,485,016
|
|
100.0
|
%
|
$
|
1,254,186
|
|
100.0
|
%
|
$
|
230,830
|
|
18.4
|
%
|
||||||
|
•
|
Advertising revenues increased
$139,872
across all of our networks, with the largest increase attributable to AMC. This increase resulted from higher pricing per unit sold due to an increased demand for our programming by advertisers, led by
The Walking Dead,
and an increased number of original programming series that aired on AMC as compared to the number of original programming series that aired on AMC during 2012. This increase was also impacted by a decrease in advertising revenues in the 2012 associated with the temporary DISH Network carriage termination of all our networks for approximately four months in 2012. As previously discussed, most of our advertising revenues vary based on the timing of our original programming series and the popularity of our programming as measured by Nielsen. Due to these factors, we expect advertising revenues to vary from quarter to quarter; and
|
|
•
|
Distribution revenues increased
$90,958
principally due to an increase of $55,645 in affiliation fee revenues resulting from an increase in rates, primarily at AMC. As previously discussed, affiliation fee revenues and subscribers were negatively impacted in 2012 due to the temporary DISH Network carriage termination of all our networks for approximately four months in 2012. Distribution revenues increased $35,312 principally from licensing and digital distribution revenues derived from our original programming, primarily at AMC and IFC. In addition, distribution revenues vary based on the timing of availability of our programming to distributors. Because of these factors, we expect distribution revenues to vary from quarter to quarter.
|
The following table presents certain subscriber information at
December 31, 2013
and
December 31, 2012
:
|
|
Estimated Domestic
Subscribers
(1)
|
||||
|
|
December 31, 2013
|
December 31, 2012
|
|||
|
National Programming Networks:
|
|||||
|
AMC
|
97,400
|
|
98,900
|
|
|
|
WE tv
|
84,000
|
|
81,500
|
|
|
|
IFC
|
69,900
|
|
69,600
|
|
|
|
SundanceTV
|
56,200
|
|
54,100
|
|
|
________________
|
(1)
|
Estimated U.S. subscribers as measured by Nielsen.
|
38
The increase in subscribers reflects the repositioning of our networks' carriage with certain operators to more widely distributed tiers of service. Additionally, the number of reported subscribers may be impacted by changes in the Nielsen sample.
International and Other
The
increase
in International and Other revenues, net was attributable to the following:
|
|
Years Ended December 31,
|
|
|
|||||||||||||||||
|
|
2013
|
% of
total |
2012
|
% of
total |
$ change
|
%
change |
||||||||||||||
|
Advertising
|
$
|
—
|
|
—
|
%
|
$
|
147
|
|
0.1
|
%
|
$
|
(147
|
)
|
(100.0
|
)%
|
|||||
|
Distribution
|
122,429
|
|
100.0
|
|
114,394
|
|
99.9
|
|
8,035
|
|
7.0
|
|
||||||||
|
$
|
122,429
|
|
100.0
|
%
|
$
|
114,541
|
|
100.0
|
%
|
$
|
7,888
|
|
6.9
|
%
|
||||||
Distribution revenues increased primarily due to an increase in foreign affiliation fee revenues of $12,176 principally from our international distribution of AMC in Canada and, to a lesser extent, from our expanded distribution of Sundance Channel in Europe and an increase in origination fee revenue at AMC Networks Broadcasting and Technology of $1,217. These increases were partially offset by a decrease in revenue of $4,607 at IFC Films primarily due to a decrease in home video distribution revenues and lower performance of theatrical titles.
Technical and operating expense (excluding depreciation and amortization)
The components of technical and operating expense primarily include the amortization and impairments or write-offs of program rights, such as those for original programming, feature films and licensed series, participation and residual costs, distribution and production related costs and program operating costs, such as origination, transmission, uplinking and encryption.
Technical and operating expense (excluding depreciation and amortization)
increased
$154,797
to
$662,233
for
2013
as compared to
2012
. The net change by segment was as follows:
|
|
Years Ended December 31,
|
|
|
|||||||||||
|
|
2013
|
2012
|
$ change
|
% change
|
||||||||||
|
National Networks
|
$
|
592,587
|
|
$
|
450,124
|
|
$
|
142,463
|
|
31.6
|
%
|
|||
|
International and Other
|
88,665
|
|
76,468
|
|
12,197
|
|
16.0
|
|
||||||
|
Inter-segment eliminations
|
(19,019
|
)
|
(19,156
|
)
|
137
|
|
(0.7
|
)
|
||||||
|
Total
|
$
|
662,233
|
|
$
|
507,436
|
|
$
|
154,797
|
|
30.5
|
%
|
|||
|
Percentage of revenues, net
|
41.6
|
%
|
37.5
|
%
|
||||||||||
National Networks
The
increase
in the National Networks segment was attributable to increased program rights expense of $131,117 and an increase of $11,345 for programming related costs. The increase in program rights expense is due to our increased investment in scripted original series primarily at AMC and SundanceTV and includes write-offs of $61,005 based on management's assessment of programming usefulness, primarily at AMC due to the cancellation of
The Killing
and
Low Winter Sun,
and to a lesser extent to programming at SundanceTV as we prepared our programming schedule for the transition to a traditional advertising model. There may be significant changes in the level of our technical and operating expenses due to the amortization of content acquisition and/or original programming costs and/or the impact of management’s periodic assessment of programming usefulness. Such costs will also fluctuate with the level of revenues derived from owned original programming in each period as these costs are amortized based on the film-forecast-computation method. As additional competition for programming increases and alternate distribution technologies continue to develop in the industry, costs for content acquisition and original programming may increase. As we continue to increase our investment in original programming, we expect program rights expense to continue to increase in 2014 over the prior year comparable period.
International and Other
The increase in the International and Other segment was primarily due to an increase of $8,083 related to higher content acquisition costs at IFC Films and an increase of $4,945 at AMC/Sundance Channel Global primarily related to program rights and programming related expenses as we expand internationally.
39
Selling, general and administrative expense
The components of selling, general and administrative expense primarily include sales, marketing and advertising expenses, administrative costs and costs of facilities.
Selling, general and administrative expense
increased
$28,809
to
$425,735
for
2013
as compared to
2012
. The net change by segment was as follows:
|
|
Years Ended December 31,
|
|
|
|||||||||||
|
|
2013
|
2012
|
$ change
|
% change
|
||||||||||
|
National Networks
|
$
|
352,731
|
|
$
|
325,509
|
|
$
|
27,222
|
|
8.4
|
%
|
|||
|
International and Other
|
73,316
|
|
71,739
|
|
1,577
|
|
2.2
|
|
||||||
|
Inter-segment eliminations
|
(312
|
)
|
(322
|
)
|
10
|
|
(3.1
|
)
|
||||||
|
Total
|
$
|
425,735
|
|
$
|
396,926
|
|
$
|
28,809
|
|
7.3
|
%
|
|||
|
Percentage of revenues, net
|
26.7
|
%
|
29.3
|
%
|
||||||||||
National Networks
The
increase
in the National Networks segment was primarily attributable to increased general and administration expenses of $17,684 primarily due to an increase in professional fees, employee related expenses and other corporate expenses. In addition, sales and marketing expenses increased $9,538. Marketing costs increased for the year ended December 31, 2013 compared to the same period in 2012 primarily at AMC due to the airing of a higher number of original programming series; however, this amount was substantially offset by a decrease in marketing costs for subscriber retention marketing efforts as compared to those incurred in 2012 associated with the DISH Network carriage termination for approximately four months in 2012. There may be significant changes in the level of our selling, general and administrative expense from quarter to quarter and year to year due to the timing of promotion and marketing of original programming series and subscriber retention marketing efforts.
International and Other
The
increase
in the International and Other segment was primarily due to an increase in general and administrative expenses of $1,160 principally for employee related expenses. Additionally, during 2013, we incurred acquisition related professional fees of $8,898 primarily related to the Chellomedia acquisition which were substantially offset by a decrease in legal fees and other related costs and expenses of $8,887 compared to the same period in 2012 in connection with the DISH Network contract dispute related to VOOM HD.
Depreciation and amortization
Depreciation and amortization
decreased
$30,713
to
$54,667
for
2013
as compared to
2012
. The net change by segment was as follows:
|
|
Years Ended December 31,
|
|
|
|||||||||||
|
|
2013
|
2012
|
$ change
|
% change
|
||||||||||
|
National Networks
|
$
|
37,873
|
|
$
|
70,436
|
|
$
|
(32,563
|
)
|
(46.2
|
)%
|
|||
|
International and Other
|
16,794
|
|
14,944
|
|
1,850
|
|
12.4
|
|
||||||
|
$
|
54,667
|
|
$
|
85,380
|
|
$
|
(30,713
|
)
|
(36.0
|
)%
|
||||
The
decrease
in depreciation and amortization expense in the National Networks segment was primarily attributable to a decrease in amortization expense of $32,858 principally at AMC and at SundanceTV as certain intangible assets became fully amortized in the second quarter of 2012 (SundanceTV) and in the third quarter of 2013 (AMC).
40
Litigation settlement gain
Litigation settlement gain relates to the final allocation of the proceeds from the settlement of litigation with DISH Network (see “DISH Network” discussion above). The deferred litigation settlement proceeds liability of approximately $308,000 recorded in the consolidated balance sheet at December 31, 2012 less the $175,000 paid to Cablevision on April 9, 2013 resulted in a gain of $132,944 for the year ended December 31, 2013 included in the International and Other segment. See the income tax expense discussion for the increase in income taxes paid, net in connection with this litigation settlement.
AOCF
AOCF
increased
$58,772
to
$524,189
for
2013
as compared to
2012
. The net change by segment was as follows:
|
|
Years Ended December 31,
|
|
|
|||||||||||
|
|
2013
|
2012
|
$ change
|
% change
|
||||||||||
|
National Networks
|
$
|
555,911
|
|
$
|
492,129
|
|
$
|
63,782
|
|
13.0
|
%
|
|||
|
International and Other
|
(35,466
|
)
|
(30,040
|
)
|
(5,426
|
)
|
18.1
|
|
||||||
|
Inter-segment eliminations
|
3,744
|
|
3,328
|
|
416
|
|
12.5
|
|
||||||
|
AOCF
|
$
|
524,189
|
|
$
|
465,417
|
|
$
|
58,772
|
|
12.6
|
%
|
|||
National Networks AOCF
increased
due to an increase in revenues, net of
$230,830
partially offset by an increase in technical and operating expenses of
$142,463
resulting primarily from an increase in program rights including programming rights write-off of $61,005 and an increase in selling and administrative expenses of
$27,222
. As a result of the factors discussed above impacting the variability in revenues and operating expenses, we expect AOCF to vary from quarter to quarter.
International and Other AOCF deficit increased primarily due to an increase in technical and operating expenses of
$12,197
due principally to content acquisitions costs at IFC Films and AMC/Sundance Channel Global, partially offset by an increase in revenues, net of
$7,888
.
Interest expense, net
The
decrease
in interest expense, net of
$12,235
from
2012
to
2013
was attributable to the following:
|
Change in fair value of interest rate swap contracts (a)
|
$
|
(11,660
|
)
|
|
Increase in interest income
|
(317
|
)
|
|
|
Other
|
(258
|
)
|
|
|
$
|
(12,235
|
)
|
|
(a) During 2012, in connection with the repayment of the outstanding principal amount under the term loan B facility, we recorded an unrealized loss of
$8,725
, included in interest expense, on the related interest rate swap contracts previously designated as cash flow hedges of a portion of the term loan B facility as the related interest rate swap contracts no longer qualified for hedge accounting.
As a result of incurring additional indebtedness of $600,000 under our Term Loan A Facility (defined below) on January 31, 2014, we expect interest expense will be higher in future periods. See "Amended and Restated Senior Secured Credit Facility" discussion below.
Write-off of deferred financing costs
On December 16, 2013, we entered into an amended and restated credit agreement. This credit agreement amended and restated AMC Networks’ June 30, 2011 original credit agreement in its entirety. In connection with this amendment, we recorded a write-off of deferred financing costs of
$4,007
for the year ended December 31, 2013, which includes certain unamortized deferred financing costs associated with the original credit agreement of $3,719 and certain financing costs relating to the amended and restated credit agreement of $288.
The write-off of deferred financing costs of
$1,862
for the year ended December 31, 2012 represents $964 of deferred financing costs written off in connection with the $150,000 of voluntary prepayments of the term loan A facility during 2012 and $898 of deferred financing costs written off in connection with the repayment of the outstanding amount of the term loan B facility in December 2012.
41
As discussed above, in connection with entering into the amended and restated credit agreement on December 16, 2013, we also recorded a loss on extinguishment of debt of
$1,087
for the year ended December 31, 2013 related to a portion of the unamortized discount associated with the June 30, 2011 original credit agreement that was written off.
In December 2012, we issued $600,000 aggregate principal amount of 4.75% senior notes due December 15, 2022. We used the net proceeds from the issuance of the notes to repay the outstanding amount under the term loan B facility of approximately $587,600, with the remaining proceeds used for general corporate purposes. In connection with this repayment, we recorded a loss on extinguishment of debt of
$10,774
for the year ended December 31, 2012 representing the excess of the principal amount repaid over the carrying value of the term loan B facility.
Miscellaneous, net
The increase in miscellaneous, net primarily relates to an increase in unrealized transaction gains associated with the strengthening of the euro compared to the U.S. dollar related to the translation of euro denominated cash and cash equivalents at December 31, 2013 in anticipation of closing of the Chellomedia acquisition (see "Chellomedia Acquisition" discussion above).
Income tax expense
Income tax expense attributable to continuing operations was
$178,841
for the year ended
December 31, 2013
, representing an effective tax rate of
38%
. The effective tax rate differs from the federal statutory rate of 35% due primarily to state income tax expense of $8,786, tax expense of $9,089 related to uncertain tax positions, including accrued interest and tax expense of $5,179 resulting from an increase in the valuation allowance relating primarily to certain foreign and local income tax credit carry forwards.
In addition, income taxes paid, net increased by
$95,186
to
$135,708
for the year ended December 31, 2013 as compared to the year ended December 31, 2012. The increase was due primarily to the utilization of our net operating loss carry forward in 2012 and the increase in operating income in 2013. In addition, approximately $23,000 of such increase was a result of the VOOM HD Settlement Agreement and the DISH Network Proceeds Allocation Agreement, which increased tax payments (in the first quarter of 2013) by $81,000, and reduced tax payments (in the remaining quarters of 2013) by $58,000.
Income tax expense attributable to continuing operations was
$86,058
for the year ended
December 31, 2012
, representing an effective tax rate of
39%
. The effective tax rate differs from the federal statutory rate of 35% due primarily to state income tax expense of $4,970, tax expense of $4,685 related to uncertain tax positions, including accrued interest and a tax benefit of $2,344 resulting from a decrease in the valuation allowance relating primarily to certain foreign and local income tax credit carry forwards.
42
Consolidated Results of Operations
Year Ended December 31, 2012
Compared to
Year Ended December 31, 2011
The following table sets forth our consolidated results of operations for the periods indicated.
|
|
Years Ended December 31,
|
|
|
|||||||||||||||||
|
|
2012
|
2011
|
|
|
||||||||||||||||
|
|
Amount
|
% of
Revenues,
net
|
Amount
|
% of
Revenues,
net
|
$ change
|
%
change
|
||||||||||||||
|
Revenues, net
|
$
|
1,352,577
|
|
100.0
|
%
|
$
|
1,187,741
|
|
100.0
|
%
|
$
|
164,836
|
|
13.9
|
%
|
|||||
|
Operating expenses:
|
||||||||||||||||||||
|
Technical and operating (excluding depreciation and amortization)
|
507,436
|
|
37.5
|
|
425,961
|
|
35.9
|
|
81,475
|
|
19.1
|
|
||||||||
|
Selling, general and administrative
|
396,926
|
|
29.3
|
|
335,656
|
|
28.3
|
|
61,270
|
|
18.3
|
|
||||||||
|
Restructuring credit
|
(3
|
)
|
—
|
|
(240
|
)
|
—
|
|
237
|
|
(98.8
|
)
|
||||||||
|
Depreciation and amortization
|
85,380
|
|
6.3
|
|
99,848
|
|
8.4
|
|
(14,468
|
)
|
(14.5
|
)
|
||||||||
|
Total operating expenses
|
989,739
|
|
73.2
|
|
861,225
|
|
72.5
|
|
128,514
|
|
14.9
|
|
||||||||
|
Operating income
|
362,838
|
|
26.8
|
|
326,516
|
|
27.5
|
|
36,322
|
|
11.1
|
|
||||||||
|
Other income (expense):
|
|
|||||||||||||||||||
|
Interest expense, net
|
(127,276
|
)
|
(9.4
|
)
|
(94,796
|
)
|
(8.0
|
)
|
(32,480
|
)
|
34.3
|
|
||||||||
|
Write-off of deferred financing costs
|
(1,862
|
)
|
(0.1
|
)
|
(6,247
|
)
|
(0.5
|
)
|
4,385
|
|
—
|
|
||||||||
|
Loss on extinguishment of debt
|
(10,774
|
)
|
(0.8
|
)
|
(14,726
|
)
|
(1.2
|
)
|
3,952
|
|
—
|
|
||||||||
|
Miscellaneous, net
|
(652
|
)
|
—
|
|
(137
|
)
|
—
|
|
(515
|
)
|
375.9
|
|
||||||||
|
Total other income (expense)
|
(140,564
|
)
|
(10.4
|
)
|
(115,906
|
)
|
(9.8
|
)
|
(24,658
|
)
|
21.3
|
|
||||||||
|
Income from continuing operations before income taxes
|
222,274
|
|
16.4
|
|
210,610
|
|
17.7
|
|
11,664
|
|
5.5
|
|
||||||||
|
Income tax expense
|
(86,058
|
)
|
(6.4
|
)
|
(84,248
|
)
|
(7.1
|
)
|
(1,810
|
)
|
2.1
|
|
||||||||
|
Income from continuing operations
|
136,216
|
|
10.1
|
|
126,362
|
|
10.6
|
|
9,854
|
|
7.8
|
|
||||||||
|
Income from discontinued operations, net of income taxes
|
314
|
|
—
|
|
92
|
|
—
|
|
222
|
|
241.3
|
|
||||||||
|
Net income attributable to AMC Networks’ stockholders
|
$
|
136,530
|
|
10.1
|
%
|
$
|
126,454
|
|
10.6
|
%
|
$
|
10,076
|
|
8.0
|
%
|
|||||
The following is a reconciliation of our consolidated operating income to AOCF:
|
|
Years Ended December 31,
|
|
|
|||||||||||
|
|
2012
|
2011
|
$ change
|
% change
|
||||||||||
|
Operating income
|
$
|
362,838
|
|
$
|
326,516
|
|
$
|
36,322
|
|
11.1
|
%
|
|||
|
Share-based compensation expense
|
17,202
|
|
15,589
|
|
1,613
|
|
10.3
|
|
||||||
|
Depreciation and amortization
|
85,380
|
|
99,848
|
|
(14,468
|
)
|
(14.5
|
)
|
||||||
|
Restructuring credit
|
(3
|
)
|
(240
|
)
|
237
|
|
(98.8
|
)
|
||||||
|
Consolidated AOCF
|
$
|
465,417
|
|
$
|
441,713
|
|
$
|
23,704
|
|
5.4
|
%
|
|||
43
National Networks Segment Results
The following table sets forth our National Networks segment results for the periods indicated.
|
|
Years Ended December 31,
|
|
|
|||||||||||||||||
|
|
2012
|
2011
|
|
|
||||||||||||||||
|
|
Amount
|
% of
Revenues,
net
|
Amount
|
% of
Revenues,
net
|
$ change
|
%
change
|
||||||||||||||
|
Revenues, net
|
$
|
1,254,186
|
|
100.0
|
%
|
$
|
1,082,358
|
|
100.0
|
%
|
$
|
171,828
|
|
15.9
|
%
|
|||||
|
Operating expenses:
|
|
|
||||||||||||||||||
|
Technical and operating (excluding depreciation and amortization)
|
450,124
|
|
35.9
|
|
366,998
|
|
33.9
|
|
83,126
|
|
22.7
|
|
||||||||
|
Selling, general and administrative
|
325,509
|
|
26.0
|
|
280,387
|
|
25.9
|
|
45,122
|
|
16.1
|
|
||||||||
|
Depreciation and amortization
|
70,436
|
|
5.6
|
|
85,701
|
|
7.9
|
|
(15,265
|
)
|
(17.8
|
)
|
||||||||
|
Operating income
|
$
|
408,117
|
|
32.5
|
%
|
$
|
349,272
|
|
32.3
|
%
|
$
|
58,845
|
|
16.8
|
%
|
|||||
|
Share-based compensation expense
|
13,576
|
|
1.1
|
|
12,582
|
|
1.2
|
|
994
|
|
7.9
|
|
||||||||
|
Depreciation and amortization
|
70,436
|
|
5.6
|
|
85,701
|
|
7.9
|
|
(15,265
|
)
|
(17.8
|
)
|
||||||||
|
AOCF
|
$
|
492,129
|
|
39.2
|
%
|
$
|
447,555
|
|
41.3
|
%
|
$
|
44,574
|
|
10.0
|
%
|
|||||
International and Other Segment Results
The following table sets forth our International and Other segment results for the periods indicated.
|
|
Years Ended December 31,
|
|
|
|||||||||||||||||
|
|
2012
|
2011
|
|
|
||||||||||||||||
|
|
Amount
|
% of
Revenues,
net
|
Amount
|
% of
Revenues,
net
|
$ change
|
%
change
|
||||||||||||||
|
Revenues, net
|
$
|
114,541
|
|
100.0
|
%
|
$
|
125,573
|
|
100.0
|
%
|
$
|
(11,032
|
)
|
(8.8
|
)%
|
|||||
|
Operating expenses:
|
||||||||||||||||||||
|
Technical and operating (excluding depreciation and amortization)
|
76,468
|
|
66.8
|
|
77,485
|
|
61.7
|
|
(1,017
|
)
|
(1.3
|
)%
|
||||||||
|
Selling, general and administrative
|
71,739
|
|
62.6
|
|
56,071
|
|
44.7
|
|
15,668
|
|
27.9
|
%
|
||||||||
|
Restructuring credit
|
(3
|
)
|
—
|
|
(240
|
)
|
(0.2
|
)
|
237
|
|
(98.8
|
)%
|
||||||||
|
Depreciation and amortization
|
14,944
|
|
13.0
|
|
14,147
|
|
11.3
|
|
797
|
|
5.6
|
%
|
||||||||
|
Operating loss
|
$
|
(48,607
|
)
|
(42.4
|
)%
|
$
|
(21,890
|
)
|
(17.4
|
)%
|
$
|
(26,717
|
)
|
122.1
|
%
|
|||||
|
Share-based compensation expense
|
3,626
|
|
3.2
|
|
3,007
|
|
2.4
|
|
619
|
|
20.6
|
|
||||||||
|
Depreciation and amortization
|
14,944
|
|
13.0
|
|
14,147
|
|
11.3
|
|
797
|
|
5.6
|
|
||||||||
|
Restructuring credit
|
(3
|
)
|
—
|
|
(240
|
)
|
(0.2
|
)
|
237
|
|
(98.8
|
)
|
||||||||
|
AOCF deficit
|
$
|
(30,040
|
)
|
(26.2
|
)%
|
$
|
(4,976
|
)
|
(4.0
|
)%
|
$
|
(25,064
|
)
|
503.7
|
%
|
|||||
44
Revenues, net
Revenues, net
increased
$164,836
to
$1,352,577
for the year ended
December 31, 2012
as compared to the year ended
December 31, 2011
. The net change by segment was as follows:
|
|
Years Ended December 31,
|
|
|
|||||||||||||||||
|
|
2012
|
% of
total
|
2011
|
% of
total
|
$ change
|
%
change
|
||||||||||||||
|
National Networks
|
$
|
1,254,186
|
|
92.7
|
%
|
$
|
1,082,358
|
|
91.1
|
%
|
$
|
171,828
|
|
15.9
|
%
|
|||||
|
International and Other
|
114,541
|
|
8.5
|
|
125,573
|
|
10.6
|
|
(11,032
|
)
|
(8.8
|
)
|
||||||||
|
Inter-segment eliminations
|
(16,150
|
)
|
(1.2
|
)
|
(20,190
|
)
|
(1.7
|
)
|
4,040
|
|
(20.0
|
)
|
||||||||
|
Consolidated revenues, net
|
$
|
1,352,577
|
|
100.0
|
%
|
$
|
1,187,741
|
|
100.0
|
%
|
$
|
164,836
|
|
13.9
|
%
|
|||||
National Networks
The
increase
in National Networks revenues, net was attributable to the following:
|
|
Years Ended December 31,
|
|
|
|||||||||||||||||
|
|
2012
|
% of
total
|
2011
|
% of
total
|
$ change
|
%
change
|
||||||||||||||
|
Advertising
|
$
|
522,917
|
|
41.7
|
%
|
$
|
447,449
|
|
41.3
|
%
|
$
|
75,468
|
|
16.9
|
%
|
|||||
|
Distribution
|
731,269
|
|
58.3
|
|
634,909
|
|
58.7
|
|
96,360
|
|
15.2
|
|
||||||||
|
$
|
1,254,186
|
|
100.0
|
%
|
$
|
1,082,358
|
|
100.0
|
%
|
$
|
171,828
|
|
15.9
|
%
|
||||||
|
•
|
Advertising revenues increased
$75,468
resulting from higher pricing per unit sold due to an increased demand for our programming by advertisers, primarily at AMC and an increased number of original programming series aired on AMC during 2012 as compared to 2011. These increases were partially offset by decreases in advertising revenues associated with the temporary DISH Network carriage termination of all of our networks for approximately four months in 2012; and
|
|
•
|
Distribution revenues increased
$96,360
primarily due to an increase of $65,918 from digital, licensing, international and home video distribution revenues derived from our National Networks original programming, primarily at AMC and an increase in affiliation fee revenues primarily attributable to an increase in rates, including the impact of lower amortization of deferred carriage fees. These increases were partially offset by a decrease associated with the temporary DISH Network carriage termination and a contractual adjustment from a distributor that increased revenue in 2011.
|
The following table presents certain subscriber information at
December 31, 2012
and
December 31, 2011
:
|
|
Estimated Domestic
Subscribers (1) |
||||
|
|
December 31, 2012
|
December 31, 2011
|
|||
|
National Programming Networks:
|
|||||
|
AMC
|
98,900
|
|
96,300
|
|
|
|
WE tv
|
81,500
|
|
76,100
|
|
|
|
IFC
|
69,600
|
|
65,300
|
|
|
|
SundanceTV
|
54,100
|
|
41,800
|
|
|
________________
|
(1)
|
Estimated U.S. subscribers as measured by Nielsen.
|
45
The increase in subscribers reflects the repositioning of our networks carriage with certain operators to more widely distributed tiers of service. Additionally, the number of reported AMC, WE tv, and IFC subscribers may be impacted by changes in the Nielsen sample.
International and Other
The
decrease
in International and Other revenues, net was attributable to the following:
|
|
Years Ended December 31,
|
|
|
|||||||||||||||||
|
|
2012
|
% of
total
|
2011
|
% of
total
|
$ change
|
%
change
|
||||||||||||||
|
Advertising
|
$
|
147
|
|
0.1
|
%
|
$
|
177
|
|
0.1
|
%
|
$
|
(30
|
)
|
(16.9
|
)%
|
|||||
|
Distribution
|
114,394
|
|
99.9
|
|
125,396
|
|
99.9
|
|
(11,002
|
)
|
(8.8
|
)
|
||||||||
|
$
|
114,541
|
|
100.0
|
%
|
$
|
125,573
|
|
100.0
|
%
|
$
|
(11,032
|
)
|
(8.8
|
)%
|
||||||
Distribution revenues decreased primarily related to $14,525 of decreased transmission revenue at AMC Networks Broadcasting & Technology due to the expiration of certain agreements and a net decrease in revenue at IFC Films due to lower performance for several theatrical titles and lower television licensing revenue. In addition, revenue at VOOM HD decreased primarily related to lower distribution revenue. These decreases were partially offset by increased foreign affiliation fee revenues of $5,005 from our international distribution of Sundance Channel and WE tv channels due to expanded distribution in Asia and Europe.
Technical and operating expense (excluding depreciation and amortization)
Technical and operating expense (excluding depreciation and amortization)
increased
$81,475
to
$507,436
for
2012
as compared to
2011
. The net change by segment was as follows:
|
|
Years Ended December 31,
|
|
|
|||||||||||
|
|
2012
|
2011
|
$ change
|
% change
|
||||||||||
|
National Networks
|
$
|
450,124
|
|
$
|
366,998
|
|
$
|
83,126
|
|
22.7
|
%
|
|||
|
International and Other
|
76,468
|
|
77,485
|
|
(1,017
|
)
|
(1.3
|
)
|
||||||
|
Inter-segment eliminations
|
(19,156
|
)
|
(18,522
|
)
|
(634
|
)
|
3.4
|
|
||||||
|
Total
|
$
|
507,436
|
|
$
|
425,961
|
|
$
|
81,475
|
|
19.1
|
%
|
|||
|
Percentage of revenues, net
|
37.5
|
%
|
35.9
|
%
|
||||||||||
National Networks
The
increase
in the National Networks segment is attributable to increased amortization of program rights of $79,876 primarily at AMC and WE tv, which includes a write-off of $9,990 based on management's assessment of programming usefulness and increased participation and residual costs at AMC, and an increase of $3,250 for programming related costs.
International and Other
The International and Other segment (excluding VOOM HD)
decreased
primarily due to: (i) a decrease of $4,621 in transmission expenses at AMC Networks Broadcasting & Technology due to a reduction in transmission agreements and (ii) a decrease of $5,096 primarily related to lower content acquisition costs at IFC Films. These decreases were partially offset by: (i) an increase at AMC/Sundance Channel Global of $6,261 primarily related to programming costs, (ii) an increase of $2,238 in transmission and programming related expenses due to increased distribution in Asia and Europe, and (iii) an increase of $2,817 in programming expenses for our developing businesses. Technical and operating expenses in the International and Other segment also decreased because programming costs at VOOM HD decreased $2,574 resulting primarily from ceasing distribution of the Rush HD channel in Europe in April 2011.
46
Selling, general and administrative expense
Selling, general and administrative expenses
increased
$61,270
to
$396,926
for
2012
as compared to
2011
. The net change by segment was as follows:
|
|
Years Ended December 31,
|
|
|
|||||||||||
|
|
2012
|
2011
|
$ change
|
% change
|
||||||||||
|
National Networks
|
$
|
325,509
|
|
$
|
280,387
|
|
$
|
45,122
|
|
16.1
|
%
|
|||
|
International and Other
|
71,739
|
|
56,071
|
|
15,668
|
|
27.9
|
|
||||||
|
Inter-segment eliminations
|
(322
|
)
|
(802
|
)
|
480
|
|
(59.9
|
)
|
||||||
|
Total
|
$
|
396,926
|
|
$
|
335,656
|
|
$
|
61,270
|
|
18.3
|
%
|
|||
|
Percentage of revenues, net
|
29.3
|
%
|
28.3
|
%
|
||||||||||
National Networks
The
increase
in the National Networks segment primarily consists of a $52,676 increase for sales and marketing expenses principally due to the airing of a higher number of original programming series during 2012 as compared to 2011 and increased costs for subscriber retention marketing efforts associated with the temporary DISH Network carriage termination. Additionally, there was a net decrease in other general and administrative costs of $7,741 primarily due to a reduction of corporate allocations from Cablevision following the Distribution (including management fees), partially offset by higher employee related expenses incurred in connection with becoming a stand-alone public company.
Prior to the Distribution, pursuant to a consulting agreement with Cablevision, we paid a management fee calculated based on certain subsidiaries’ gross revenues (as defined under the terms of the consulting agreement) on a monthly basis. We terminated the consulting agreement on the Distribution date and did not replace it.
International and Other
The
increase
in the International and Other segment (excluding VOOM HD) primarily consists of an increase of $6,448 for selling, marketing and advertising costs primarily at IFC Films and AMC/Sundance Channel Global due to increased spending on titles being distributed at IFC Films and increased distribution in Europe and Asia and a net increase of $2,617 for general and administrative costs due to higher employee related expenses and costs incurred in connection with becoming a stand-alone public company, net of a reduction of corporate allocations from Cablevision following the Distribution. Selling, general and administrative expenses related to VOOM HD were $10,971 in 2012, an increase of $5,668 as compared to 2011, due to higher legal fees and other related costs and expenses in connection with the DISH Network contract dispute.
Depreciation and amortization
Depreciation and amortization
decreased
$14,468
to
$85,380
for
2012
as compared to
2011
. The net change by segment was as follows:
|
|
Years Ended December 31,
|
|
|
|||||||||||
|
|
2012
|
2011
|
$ change
|
% change
|
||||||||||
|
National Networks
|
$
|
70,436
|
|
$
|
85,701
|
|
$
|
(15,265
|
)
|
(17.8
|
)%
|
|||
|
International and Other
|
14,944
|
|
14,147
|
|
797
|
|
5.6
|
|
||||||
|
$
|
85,380
|
|
$
|
99,848
|
|
$
|
(14,468
|
)
|
(14.5
|
)%
|
||||
The decrease in depreciation and amortization expense in the National Networks segment is primarily attributable to a decrease in amortization expense of $14,620 at SundanceTV and AMC as certain intangible assets became fully amortized in the second and third quarters of 2012.
47
AOCF
AOCF
increased
$23,704
for
2012
as compared to
2011
. The net change by segment was as follows:
|
|
Years Ended December 31,
|
|
|
|||||||||||
|
|
2012
|
2011
|
$ change
|
% change
|
||||||||||
|
National Networks
|
$
|
492,129
|
|
$
|
447,555
|
|
$
|
44,574
|
|
10.0
|
%
|
|||
|
International and Other
|
(30,040
|
)
|
(4,976
|
)
|
(25,064
|
)
|
503.7
|
|
||||||
|
Inter-segment eliminations
|
3,328
|
|
(866
|
)
|
4,194
|
|
(484.3
|
)
|
||||||
|
AOCF
|
$
|
465,417
|
|
$
|
441,713
|
|
$
|
23,704
|
|
5.4
|
%
|
|||
National Networks AOCF increased due to an increase in revenues, net of $171,828 and a decrease in management fees, partially offset by an increase in technical and operating expenses resulting primarily from an increase in amortization of program rights expense which includes program rights write-offs of $9,990 and marketing expense due to the increase in the number of original programming premieres and subscriber retention marketing efforts associated with the temporary DISH Network carriage termination.
International and Other AOCF deficit increased primarily due a decrease in revenues, net of $11,032, an increase in selling, general and administrative expenses and programming and transmission related costs and selling costs at AMC/Sundance Channel Global and an increase in legal fees and other costs in connection with the DISH Network contract dispute.
Interest expense, net
The increase in interest expense, net of $32,480 from 2011 to 2012 was attributable to the following:
|
Indebtedness incurred in connection with the Distribution
|
$
|
49,329
|
|
|
Repayment of the Rainbow National Services LLC ("RNS") senior notes in May 2011 and the RNS credit facility and the RNS senior subordinated notes in June 2011
|
(31,036
|
)
|
|
|
Interest rate swap contracts (a)
|
13,743
|
|
|
|
Decrease in interest income
|
572
|
|
|
|
Other
|
(128
|
)
|
|
|
$
|
32,480
|
|
|
(a) During 2012, in connection with the repayment of the outstanding principal amount under the term loan B facility, we recorded an unrealized loss of $8,725, included in interest expense, on the related interest rate swap contracts previously designated as cash flow hedges of a portion of the term loan B facility as the related interest rate swap contracts no longer qualified for hedge accounting.
Write-off of deferred financing costs
The write-off of deferred financing costs of $1,862 for the year ended December 31, 2012 represents $964 of deferred financing costs written off in connection with the $150,000 of voluntary prepayments of the term loan A facility during 2012 and $898 of deferred financing costs written off in connection with the repayment of the outstanding amount of the term loan B facility in December 2012.
The write-off of deferred financing costs of $6,247 for the year ended December 31, 2011 represents $1,186 of deferred financing costs written off in connection with the redemption of the RNS 8 3/4% senior notes in May 2011, $2,062 and $2,455 of deferred financing costs written off in connection with the repayment of the outstanding borrowings under the RNS credit facility and the RNS 10 3/8% senior subordinated notes, respectively, in June 2011 in connection with the Distribution and $544 of deferred financing costs written off associated with the $100,000 of voluntary prepayments of the term loan A facility during 2011.
Loss on extinguishment of debt
In December 2012, we issued $600,000 aggregate principal amount of 4.75% senior notes due December 15, 2022. We used the net proceeds from the issuance of the notes to repay the outstanding amount under the term loan B facility of approximately $587,600, with the remaining proceeds used for general corporate purposes. In connection with this repayment, we recorded a loss on extinguishment of debt of $10,774 for the year ended December 31, 2012 representing the excess of the principal amount repaid over the carrying value of the term loan B facility.
48
The loss on extinguishment of debt of $14,726 for the year ended December 31, 2011 represents $14,535 for the excess of the redemption price, premium paid and related fees along with accretion to principal amount over the carrying value of the $325,000 principal amount of the RNS 10 3/8% senior subordinated notes redeemed June 30, 2011 associated with the tender offer which occurred in connection with the Distribution and $191 associated with the $100,000 of voluntary prepayments of the term loan A facility during 2011.
Income tax expense
Income tax expense attributable to continuing operations was $86,058 for the year ended December 31, 2012, representing an effective tax rate of 39%. The effective tax rate differs from the federal statutory rate of 35% due primarily to state income tax expense of $4,970, tax expense of $4,685 related to uncertain tax positions, including accrued interest and a tax benefit of $2,344 resulting from a decrease in the valuation allowance relating primarily to certain foreign and local income tax credit carry forwards.
Income tax expense attributable to continuing operations was $84,248 for the year ended December 31, 2011, representing an effective tax rate of 40%. The effective tax rate differs from the federal statutory rate of 35% due primarily to state income tax expense of $8,020, tax expense of $3,300 related to uncertain tax positions, including accrued interest and a tax benefit of $2,326 resulting from a decrease in the valuation allowance with regard to certain local income tax credit carry forwards.
Liquidity and Capital Resources
Overview
Our operations have historically generated positive net cash flow from operating activities. However, each of our programming businesses has substantial programming acquisition and production expenditure requirements.
Sources of cash primarily include cash flow from operations, amounts available under our revolving credit facility (as described below) and access to capital markets. Although we currently believe that amounts available under our revolving credit facility will be available when and if needed, we can provide no assurance that access to such funds will not be impacted by adverse conditions in the financial markets. The obligations of the financial institutions under our revolving credit facility are several and not joint and, as a result, a funding default by one or more institutions does not need to be made up by the others. As a public company, we may have access to other sources of capital such as the public bond markets. On December 10, 2012, we filed a Registration Statement on Form S-3 ("Shelf Registration") with the SEC in which we registered debt securities.
Our principal uses of cash include the acquisition and production of programming, investments and acquisitions, debt service and payments for income taxes. We continue to increase our investment in original programming, the funding of which generally occurs six to nine months in advance of a program’s airing. We expect this increased investment to continue in
2014
. Historically, our businesses have not required significant capital expenditures, however, following the Distribution, we have invested in our infrastructure as a stand-alone public company. On December 17, 2012, we issued under the Shelf Registration $600,000 aggregate principal amount of 4.75% senior notes due December 15, 2022 (see "4.75% Senior Notes due 2022" discussion below). We used the net proceeds from the offering to repay the outstanding amount under the term loan B facility of approximately $587,600, with the remaining proceeds used for general corporate purposes.
We believe that a combination of cash-on-hand, cash generated from operating activities and availability under our revolving credit facility will provide sufficient liquidity to service the principal and interest payments on our indebtedness, along with our other funding and investment requirements over the next twelve months and over the longer term. However, we do not expect to generate sufficient cash from operations to repay at maturity the entirety of the then outstanding balances of our debt. As a result, we will then be dependent upon our ability to access the capital and credit markets in order to repay or refinance the outstanding balances of our indebtedness. Failure to raise significant amounts of funding to repay these obligations at maturity would adversely affect our business. In such a circumstance, we would need to take other actions including selling assets, seeking strategic investments from third parties or reducing other discretionary uses of cash.
Our level of debt could have important consequences on our business including, but not limited to, increasing our vulnerability to general adverse economic and industry conditions, limiting the availability of our cash flow to fund future programming investments, capital expenditures, working capital, business activities and other general corporate requirements and limiting our flexibility in planning for, or reacting to, changes in our business and the industry in which we operate.
In addition, economic or market disruptions could lead to lower demand for our services, such as lower levels of advertising. These events would adversely impact our results of operations, cash flows and financial position.
49
Cash Flow Discussion
The following table is a summary of cash flows provided by (used in) continuing operations and discontinued operations for the periods indicated:
|
|
Years Ended December 31,
|
||||||||||
|
|
2013
|
2012
|
2011
|
||||||||
|
Continuing operations:
|
|||||||||||
|
Cash flow (used in) provided by operating activities
|
$
|
(49,463
|
)
|
$
|
569,132
|
|
$
|
255,233
|
|
||
|
Cash flow used in investing activities
|
(26,146
|
)
|
(19,392
|
)
|
(15,691
|
)
|
|||||
|
Cash flow used in financing activities
|
(19,953
|
)
|
(155,087
|
)
|
(104,057
|
)
|
|||||
|
Net (decrease) increase in cash from continuing operations
|
(95,562
|
)
|
394,653
|
|
135,485
|
|
|||||
|
Discontinued operations:
|
|||||||||||
|
Net increase in cash flow from discontinued operations
|
$
|
—
|
|
$
|
481
|
|
$
|
391
|
|
||
Continuing Operations
Operating Activities
Net cash (used in) provided by operating activities amounted to
$(49,463)
for the year ended
December 31, 2013
as compared to
$569,132
for the year ended
December 31, 2012
. The
December 31, 2013
net cash used in operating activities resulted from
$1,041,196
of net income before depreciation and amortization and other non-cash items and an increase of
$17,789
in accounts payable, accrued expenses and other liabilities which was more than offset by payments for program rights of
$517,343
, a net decrease in deferred revenue and deferred litigation settlement proceeds of
$337,700
primarily due to the final allocation of the Settlement Funds (see “DISH Network” discussion above), a decrease in income taxes payable of
$111,881
, an increase in accounts receivable, trade of
$80,083
, an increase in prepaid expenses and other assets of
$52,836
, as well as a net decrease in other net liabilities of
$8,605
.
Net cash provided by operating activities amounted to
$569,132
for the year ended
December 31, 2012
compared to
$255,233
for the year ended
December 31, 2011
. The
December 31, 2012
net cash provided by operating activities resulted from
$536,042
of net income before depreciation and amortization and other non-cash items, an increase in deferred revenue and deferred litigation settlement proceeds of
$337,207
primarily related to the temporary allocation of the VOOM HD lawsuit settlement proceeds (see “DISH Network” discussion above), an increase in income taxes payable of
$116,740
and an increase of other net liabilities of
$7,247
. These increases were partially offset by payments for program rights of
$412,493
, an increase in accounts receivable, trade of
$11,717
, and deferred carriage fee payments of
$3,894
.
Net cash provided by operating activities amounted to
$255,233
for the year ended
December 31, 2011
. The
2011
net cash provided by operating activities resulted from
$641,055
of net income before depreciation and amortization and other non-cash items and an increase of
$28,551
in accounts payable, accrued expenses and other liabilities, partially offset by payments for program rights of
$358,929
, an increase in accounts receivable, trade of
$44,750
, as well as a net decrease in other net liabilities of
$10,694
.
Investing Activities
Net cash used in investing activities for the years ended
December 31, 2013
,
2012
and
2011
was
$26,146
,
$19,392
and
$15,691
, respectively, which consisted primarily of capital expenditures of
$24,303
,
$18,557
, and
$15,371
for the years ended
December 31, 2013
,
2012
, and
2011
, respectively. In 2013 and 2012, capital expenditures are primarily for the purchase of information technology hardware and software and transmission related equipment.
Financing Activities
Net cash used in financing activities amounted to
$19,953
for the year ended
December 31, 2013
as compared to
$155,087
for the year ended
December 31, 2012
. In
2013
, financing activities consisted of payments for financing costs of
$12,994
, treasury stock acquired from the acquisition of restricted shares of
$12,135
and principal payments on capital leases of
$1,558
, partially offset by the excess tax benefits from share-based compensation arrangements of
$4,975
and proceeds from stock option exercises of
$1,759
.
50
Net cash used in financing activities amounted to
$155,087
for the year ended
December 31, 2012
compared to
$104,057
for the year ended
December 31, 2011
. In
2012
, financing activities consisted of repayments of indebtedness under our Credit Facility of
$742,025
, treasury stock acquired from the acquisition of restricted shares of
$15,989
, principal payments on capital leases of
$1,413
and payments for financing costs of
$1,421
, partially offset by the net proceeds from the issuance of 4.75% senior notes of
$589,500
, proceeds from stock option exercises of
$8,777
and the excess tax benefits from share-based compensation arrangements of
$7,484
.
Net cash used in financing activities amounted to
$104,057
for the year ended
December 31, 2011
. In
2011
, financing activities consisted of proceeds from credit facility debt of
$1,442,364
and proceeds from stock option exercises of
$3,622
, which was more than offset by the repayment of credit facility debt of $877,975, payments for the redemption of the RNS senior notes and senior subordinated notes, including tender premiums and fees of $638,365, deferred financing costs of
$27,414
, principal payments on capital leases of
$4,612
, and treasury stock acquired from the acquisition of restricted shares of
$1,677
.
Debt Financing Agreements
Amended and Restated Senior Secured Credit Facility
On December 16, 2013 (the “Refinancing Date”), AMC Networks and its subsidiary, AMC Network Entertainment LLC (the “Borrowers”), and certain of AMC Networks’ subsidiaries, as restricted subsidiaries, entered into an amended and restated credit agreement, which amends and restates AMC Networks’ prior credit agreement dated June 30, 2011 in its entirety.
The amended and restated credit agreement provides the Borrowers with senior secured credit facilities consisting of (a) an initial $880,000 term loan A that was used by AMC Networks to retire the then outstanding term loan A facility provided under the June 30, 2011 original credit agreement, (b) a subsequent $600,000 term loan A (collectively, the “Term Loan A Facility”)which was drawn on January 31, 2014 upon the satisfaction of certain conditions related to consummation of AMC Networks’ acquisition of substantially all of Chellomedia, the international content division of Liberty Global plc, pursuant to the Stock Purchase Agreement entered into by AMC Networks on October 28, 2013, see “Acquisition of Chellomedia” discussed above, and (c) a $500,000 revolving credit facility (together with the Term Loan A Facility, collectively, the “Credit Facility.”) The Term Loan A Facility matures on December 16, 2019. The revolving credit facility matures on December 16, 2018.
The revolving credit facility was not drawn upon on the Refinancing Date and remained undrawn at December 31, 2013. Total undrawn revolver commitments are available to be drawn for our general corporate purposes.
In connection with the Credit Facility, AMC Networks incurred deferred financing costs of $12,669 as of December 31, 2013 and an additional amount of $9,006 was incurred on January 31, 2014 in connection with the subsequent $600,000 term loan A facility, which are amortized to interest expense, utilizing the effective interest method, over the term of each respective component of the Credit Facility.
Borrowings under the Credit Facility bear interest at a floating rate, which at the option of the Borrowers may be either (a) a base rate plus an additional rate ranging from 0.50% to 1.25% per annum (determined based on a cash flow ratio) (the “Base Rate”), or (b) a Eurodollar rate plus an additional rate ranging from 1.50% to 2.25% per annum (determined based on a cash flow ratio) (the “Eurodollar Rate”), provided that for the six month period following the Refinancing Date, the additional rate used in calculating both floating rates is subject to a floor of (i) 1.00% per annum for borrowings bearing the Base Rate, and (ii) 2.00% per annum for borrowings bearing the Eurodollar Rate. At December 31, 2013, the interest rate on the Term Loan A Facility was 2.17%, reflecting a Eurodollar Rate plus the additional rate as described herein.
The Credit Facility requires the Borrowers to pay a commitment fee of between 0.25% and 0.50% (determined based on a cash flow ratio) in respect of the average daily unused commitments under the revolving credit facility. The Borrowers also are required to pay customary letter of credit fees, as well as fronting fees, to banks that issue letters of credit pursuant to the Credit Facility.
All obligations under the Credit Facility are guaranteed, jointly and severally, by certain of AMC Networks’ existing and future domestic restricted subsidiaries in accordance with the Credit Facility. All obligations under the Credit Facility, including the guarantees of those obligations, are secured by certain assets of the Borrowers and certain of its restricted subsidiaries.
Borrowings under the Credit Facility may be voluntarily prepaid without premium and penalty at any time. The Term Loan A Facility also provides for various mandatory prepayments, including with the proceeds from certain dispositions of property and borrowings. The Term Loan A Facility is required to be repaid in quarterly installments of
$18,500
from March 31, 2015 through December 31, 2015,
$37,000
beginning March 31, 2016 through December 31, 2016,
$55,500
beginning March 31, 2017 through December 31, 2017,
$74,000
beginning March 31, 2018 through September 30, 2019 and
$518,000
on December 16, 2019, which is the Term Loan A Facility maturity date. Any amounts outstanding under the revolving credit facility are due at maturity on December 16, 2018.
51
The Credit Facility contains certain affirmative and negative covenants applicable to the Borrowers and certain of their restricted subsidiaries. These include restrictions on the Borrowers’ and certain of their restricted subsidiaries ability to incur indebtedness, make investments in entities that are not restricted subsidiaries, place liens on assets, enter into certain affiliate transactions and make certain restricted payments, including restrictions on AMC Networks’ ability to pay dividends on its common stock. The Credit Facility also requires the Borrowers to comply with the following financial covenants: (i) a maximum ratio of net debt to annual operating cash flow (each defined in the Credit Facility) of 6.50:1 initially, and decreasing to 6.00:1 on and after January 1, 2016; and (ii) a minimum ratio of annual operating cash flow to annual total interest expense (as defined in the Credit Facility) of 2.50:1.
AMC Networks was in compliance with all of its covenants under the Credit Facility as of
December 31, 2013
.
Original Credit Facility
On June 30, 2011, AMC Networks, as borrower, and substantially all of its subsidiaries, as restricted subsidiaries, entered into a credit agreement. Under the terms of such credit agreement, AMC Networks was provided with senior secured credit facilities consisting of a
$1,130,000
term loan A facility, a
$595,000
term loan B facility and a
$500,000
revolving credit facility (collectively, the "Original Credit Facility"). The term loan A facility and the term loan B facility were discounted
$5,650
and
$12,986
, respectively, upon original issuance. On June 30, 2011, approximately
$577,000
of the Original Credit Facility debt was issued to CSC Holdings as partial consideration for the transfer to AMC Networks of the RMH businesses in June 2011 in connection with the Distribution of AMC Networks from Cablevision, which was consummated on June 30, 2011. The issuance of debt to CSC Holdings was reflected as a deemed capital distribution in the consolidated statement of stockholders’ deficiency for the year ended December 31, 2011. CSC Holdings used such debt to satisfy and discharge outstanding CSC Holdings debt.
On December 16, 2013, we used the proceeds from the borrowings under the Term Loan A Facility to repay the outstanding amount under the term loan A facility of the Original Credit Facility. Additionally, we recorded a write-off of deferred financing costs of
$4,007
for the year ended December 31, 2013, which includes certain unamortized deferred financing costs associated with the Original Credit Facility of $3,719 and certain financing costs relating to the Credit Facility of $288 as well as a a loss on extinguishment of debt of
$1,087
for the year ended December 31, 2013 related to a portion of the unamortized discount associated with the Original Credit Facility that was written off.
On December 17, 2012, AMC Networks issued
$600,000
in aggregate principal amount of its 4.75% Notes (see "4.75% Senior Notes due 2022" discussion below) and used the net proceeds of the offering to repay the outstanding amount under the term loan B facility. In connection with this repayment, the Company recorded a write-off of the related unamortized deferred financing costs and a loss on extinguishment of debt of
$898
and
$10,774
, respectively, in the consolidated statement of income for the year ended December 31, 2012. Additionally, the Company recorded an unrealized loss of
$8,725
on the related interest rate swap contracts previously designated as cash flow hedges of a portion of the term loan B facility which is included in interest expense in the consolidated statement of income for the year ended December 31, 2012.
7.75% Senior Notes due 2021
On June 30, 2011, AMC Networks issued
$700,000
in aggregate principal amount of its
7.75%
senior notes, net of an original issue discount of
$14,000
, due
July 15, 2021
(the “7.75% Notes”) to CSC Holdings, as partial consideration for the transfer to AMC Networks of the RMH businesses in June 2011, which is reflected as a deemed capital distribution in the consolidated statement of stockholders’ deficiency for the year ended December 31, 2011. CSC Holdings used the Company’s 7.75% Notes to satisfy and discharge outstanding CSC Holdings debt. The recipients of the 7.75% Notes or their affiliates then offered the 7.75% Notes to investors, through an offering memorandum dated June 22, 2011, which ultimately resulted in the 7.75% Notes being held by third party investors.
The 7.75% Notes were issued under an indenture dated as of June 30, 2011 (the “7.75% Notes Indenture”).
In connection with the issuance of the 7.75% Notes, AMC Networks incurred deferred financing costs of
$1,533
, which are being amortized, using the effective interest method, to interest expense over the term of the 7.75% Notes.
Interest on the 7.75% Notes accrues at the rate of 7.75% per annum and is payable semi-annually in arrears on January 15 and July 15 of each year.
The 7.75% Notes may be redeemed, in whole or in part, at any time on or after
July 15, 2016
, at a redemption price equal to
103.875%
of the principal amount thereof (plus accrued and unpaid interest thereon, if any, to the date of such redemption), declining annually to
100%
of the principal amount thereof (plus accrued and unpaid interest thereon, if any, to the date of such redemption) beginning on
July 15, 2019
.
In addition, if AMC Networks experiences a Change of Control (as defined in the 7.75% Notes Indenture), the holders of the 7.75% Notes may require AMC Networks to repurchase for cash all or a portion of their 7.75% Notes at a price equal to
101%
of the principal amount thereof (plus accrued and unpaid interest thereon, if any, to the date of such repurchase).
52
AMC Networks is a holding company and has no independent assets or operations of its own. The 7.75% Notes are guaranteed on a senior unsecured basis by certain of AMC Networks’ existing and future domestic restricted subsidiaries, in accordance with the 7.75% Notes Indenture. The guarantees under the 7.75% Notes are full and unconditional and joint and several.
The 7.75% Notes Indenture contains certain affirmative and negative covenants applicable to AMC Networks and its restricted subsidiaries including restrictions on their ability to incur additional indebtedness, consummate certain assets sales, make investments in entities that are not restricted subsidiaries, create liens on their assets, enter into certain affiliate transactions and make certain restricted payments, including restrictions on AMC Networks’ ability to pay dividends on, or repurchase, its common stock.
AMC Networks was in compliance with all of its covenants under its 7.75% Notes Indenture as of
December 31, 2013
.
4.75% Senior Notes due 2022
On December 17, 2012, AMC Networks issued
$600,000
in aggregate principal amount of its
4.75%
senior notes, net of an issuance discount of
$10,500
, due
December 15, 2022
(the “4.75% Notes”). AMC Networks used the net proceeds of this offering to repay the outstanding amount under its term loan B facility of approximately
$587,600
, with the remaining proceeds used for general corporate purposes. The 4.75% Notes were issued pursuant to an indenture dated as of December 17, 2012 (the “Base Indenture,” and together with the First Supplemental Indenture, the “4.75% Notes Indenture”).
In connection with the issuance of the 4.75% Notes, AMC Networks incurred deferred financing costs of
$1,393
, which are being amortized, using the effective interest method, to interest expense over the term of the 4.75% Notes.
Interest on the 4.75% Notes accrues at the rate of 4.75% per annum and is payable semi-annually in arrears on June 15 and December 15 of each year.
The 4.75% Notes may be redeemed, in whole or in part, at any time on or after
December 15, 2017
, at a redemption price equal to
102.375%
of the principal amount thereof (plus accrued and unpaid interest thereon, if any, to the date of such redemption), declining annually to
100%
of the principal amount thereof (plus accrued and unpaid interest thereon, if any, to the date of such redemption) beginning on
December 15, 2020
.
In addition, if AMC Networks experiences a Change of Control (as defined in the 4.75% Notes Indenture), the holders of the 4.75% Notes may require AMC Networks to repurchase for cash all or a portion of their 4.75% Notes at a price equal to
101%
of the principal amount thereof (plus accrued and unpaid interest thereon, if any, to the date of such repurchase).
The 4.75% Notes are guaranteed on a senior unsecured basis by certain of AMC Networks’ existing and future domestic restricted subsidiaries in accordance with the 4.75% Notes Indenture. The guarantees under the 4.75% Notes are full and unconditional and joint and several.
The 4.75% Notes Indenture contains certain affirmative and negative covenants applicable to AMC Networks and its restricted subsidiaries including restrictions on their ability to incur additional indebtedness, consummate certain assets sales, make investments in entities that are not restricted subsidiaries, create liens on their assets, enter into certain affiliate transactions and make certain restricted payments, including restrictions on AMC Networks’ ability to pay dividends on, or repurchase, its common stock.
AMC Networks was in compliance with all of its covenants under its 4.75% Notes Indenture as of
December 31, 2013
.
53
Contractual Obligations and Off Balance Sheet Arrangements
Contractual Obligations
Our contractual obligations as of
December 31, 2013
are summarized in the following table:
|
Payments due by period
|
|||||||||||||||||||
|
Total
|
Year 1
|
Years
2 - 3
|
Years
4 - 5
|
More than
5 years
|
|||||||||||||||
|
Debt obligations:
|
|
|
|||||||||||||||||
|
Principal payments (1)
|
$
|
2,180,000
|
|
$
|
—
|
|
$
|
132,000
|
|
$
|
308,000
|
|
$
|
1,740,000
|
|
||||
|
Interest payments (1) (2)
|
811,947
|
|
109,588
|
|
214,409
|
|
208,741
|
|
279,209
|
|
|||||||||
|
Program rights obligations
|
659,777
|
|
210,190
|
|
300,746
|
|
105,248
|
|
43,593
|
|
|||||||||
|
Purchase obligations (3)
|
173,816
|
|
122,560
|
|
24,963
|
|
14,355
|
|
11,938
|
|
|||||||||
|
Operating lease obligations
|
76,750
|
|
17,739
|
|
35,761
|
|
16,066
|
|
7,184
|
|
|||||||||
|
Guarantees (4)
|
60,179
|
|
60,179
|
|
—
|
|
—
|
|
—
|
|
|||||||||
|
Contract obligations (5)
|
51,745
|
|
33,549
|
|
12,471
|
|
3,165
|
|
2,560
|
|
|||||||||
|
Capital lease obligations (6)
|
19,076
|
|
3,036
|
|
6,072
|
|
6,072
|
|
3,896
|
|
|||||||||
|
Total
|
$
|
4,033,290
|
|
$
|
556,841
|
|
$
|
726,422
|
|
$
|
661,647
|
|
$
|
2,088,380
|
|
||||
|
(1)
|
The contractual obligations table above does not include the additional indebtedness of $600,000 under our Term Loan A Facility we incurred on January 31, 2014 in connection with the acquisition of Chellomedia. This additional indebtedness increased the principal payments on our debt obligations as follows: $90,000 in years 2-3, $210,000 in years 4-5 and $300,000 in more than 5 years and increased our interest payments on our debt obligations as follows: $10,842 in year 1, $32,614 in years 2-3, $57,959 in years 4-5 and $36,157 in more than 5 years.
|
|
(2)
|
Interest on variable rate debt and the variable portion of interest rate swap contracts is estimated based on a LIBOR yield curve as of December 31, 2013.
|
|
(3)
|
Purchase obligation amounts not reflected on the balance sheet consist primarily of program rights obligations and marketing commitments that have not yet met the criteria to be recorded in the balance sheet.
|
|
(4)
|
Consists primarily of a guarantee of payments to a production service company for certain production related costs.
|
|
(5)
|
Represents primarily participation obligations and carriage fees payable to distributors.
|
|
(6)
|
Capital lease obligation amounts include imputed interest.
|
The contractual obligations table above does not include any liabilities for uncertain income tax positions due to the fact that we are unable to reasonably predict the ultimate amount or timing of any related payments in settlement of our liabilities for uncertain income tax positions. At
December 31, 2013
, the liability for uncertain tax positions was
$26,333
, excluding the related accrued interest liability of
$3,109
and deferred tax assets of
$7,760
. See Note 11 to the accompanying consolidated financial statements for further discussion of the Company’s income taxes.
Off-Balance Sheet Arrangements
We have no material off-balance sheet arrangements (as defined in Item 303(a)(4) of Regulation S-K).
Critical Accounting Policies and Estimates
In preparing our financial statements, we are required to make certain estimates, judgments and assumptions that affect the reported amounts of assets and liabilities at the date of the financial statements and the reported amounts of revenues and expenses during the periods presented. These judgments can be subjective and complex and, consequently, actual results could differ materially from those estimates and assumptions. We base our estimates on historical experience and various other assumptions believed to be reasonable under the circumstances, the results of which form the basis for making judgments about the carrying values of assets and liabilities that are not readily apparent from other sources. As with any set of assumptions and estimates, there is a range of reasonably likely amounts that may be reported.
The following critical accounting policies have been identified as those that affect the more significant judgments and estimates used in the preparation of the consolidated financial statements:
54
Impairment of Long Lived and Indefinite-Lived Intangible Assets
Long-Lived Assets and Amortizable Intangible Assets
The Company reviews its long-lived assets (property and equipment, and intangible assets subject to amortization that arose from acquisitions) for impairment whenever events or circumstances indicate that the carrying amount of an asset may not be recoverable. If the sum of the expected cash flows, undiscounted and without interest, is less than the carrying amount of the asset, an impairment loss is recognized as the amount by which the carrying amount of the asset exceeds its fair value.
Goodwill
Goodwill and identifiable intangible assets that have indefinite useful lives are not amortized, but instead are tested annually for impairment during the first quarter (“annual impairment test date”) and upon the occurrence of certain events or substantive changes in circumstances.
The annual goodwill impairment test allows for the option to first assess qualitative factors to determine whether it is more likely than not that the fair value of a reporting unit is less than its carrying amount. An entity may choose to perform the qualitative assessment on none, some or all of its reporting units or an entity may bypass the qualitative assessment for any reporting unit and proceed directly to step one of the quantitative impairment test. If it is determined, on the basis of qualitative factors, that the fair value of a reporting unit is, more likely than not, less than its carrying value, the quantitative impairment test is required. The quantitative impairment test is a two-step process. The first step compares the carrying amount of a reporting unit, including goodwill, with its fair value utilizing an enterprise-value based approach. If the carrying amount of a reporting unit exceeds its fair value, the second step of the goodwill impairment test is performed to measure the amount of the goodwill impairment loss, if any. The second step compares the implied fair value of the reporting unit’s goodwill with the carrying amount of that goodwill. If the carrying amount of the reporting unit’s goodwill exceeds the implied fair value of that goodwill, an impairment loss is recognized in an amount equal to that excess. The implied fair value of goodwill is determined in the same manner as the amount of goodwill that would be recognized in a business combination.
The carrying amount of goodwill, by operating segment is as follows:
|
December 31, 2013
|
|||
|
National Networks
|
$
|
75,552
|
|
|
International and Other
|
1,196
|
|
|
|
$
|
76,748
|
|
|
Based on the Company’s annual impairment test for goodwill as of the end of February 2013, no impairment charge was required for any of the reporting units. The Company performed a qualitative assessment for each reporting unit other than the SundanceTV reporting unit. The qualitative assessment included, but was not limited to, consideration of the historical significant excesses of the estimated fair value of each reporting unit over its respective carrying value (including allocated goodwill), macroeconomic conditions, industry and market considerations, cost factors and historical and projected cash flows. The Company performed a quantitative assessment for the SundanceTV reporting unit. Additionally, the Company performed an interim impairment test of goodwill in December 2013 for the SundanceTV reporting unit. Based on the interim assessment, the reporting units fair value exceeded its carrying value (including allocated goodwill). In order to evaluate the sensitivity of the estimated fair value calculation, the Company applied a hypothetical 20% decrease in the fair value of the SundanceTV reporting unit. This hypothetical decrease would have no impact on the conclusions reached in the goodwill impairment analysis.
In assessing the recoverability of goodwill, the Company must make assumptions regarding estimated future cash flows and other factors to determine the fair value of the respective assets. These estimates and assumptions could have a significant impact on whether an impairment charge is recognized and also the magnitude of any such charge. Fair value estimates are made at a specific point in time, based on relevant information. These estimates are subjective in nature and involve uncertainties and matters of significant judgments and therefore cannot be determined with precision. Changes in assumptions could significantly affect the estimates. Estimates of fair value for goodwill impairment testing are primarily determined using discounted cash flows and comparable market transactions methods. These valuation methods are based on estimates and assumptions including projected future cash flows, discount rate and determination of appropriate market comparables and determination of whether a premium or discount should be applied to comparables. Projected future cash flows also include assumptions for renewals of affiliation agreements, the projected number of subscribers and the projected average rates per basic and viewing subscribers and growth in fixed price contractual arrangements used to determine affiliation fee revenue, access to program rights and the cost of such program rights, amount of programming time that is advertiser supported, number of advertising spots available and the sell through rates for those spots, average fee per advertising spot and operating margins, among other assumptions. If these estimates or material related assumptions change in the future, we may be required to record impairment charges related to goodwill.
55
Indefinite-Lived Intangible Assets
Indefinite-lived intangible assets established in connection with business combinations primarily consist of trademarks. The impairment test for identifiable indefinite-lived intangible assets consists of a comparison of the estimated fair value of the intangible asset with its carrying value. If the carrying value exceeds its fair value, an impairment loss is recognized in an amount equal to that excess.
Based on the Company's annual impairment test for identifiable indefinite-lived intangible assets as of the end of February 2013, and interim test as of December 2013, no impairment charge was required. The Company’s indefinite-lived intangible assets relate to SundanceTV trademarks, which were valued using a relief-from-royalty method in which the expected benefits are valued by discounting estimated royalty revenue over projected revenues covered by the trademarks. In order to evaluate the sensitivity of the fair value calculations for the Company’s identifiable indefinite-lived intangible assets, the Company applied a hypothetical
20%
decrease to the estimated fair value of the identifiable indefinite-lived intangible assets. This hypothetical decrease in estimated fair value would not result in an impairment.
Significant judgments inherent in estimating the fair value of indefinite-lived intangible assets include the selection of appropriate discount and royalty rates, estimating the amount and timing of estimated future cash flows and identification of appropriate continuing growth rate assumptions. The discount rates used in the analysis are intended to reflect the risk inherent in the projected future cash flows generated by the respective intangible assets.
Useful Lives of Finite-Lived Intangible Assets
We have recognized intangible assets for affiliation agreements and affiliate relationships, advertiser relationships and other intangible assets as a result of our accounting for business combinations. We have determined that such intangible assets have finite lives. The estimated useful lives and net carrying values of these intangible assets at
December 31, 2013
are as follows:
|
Net Carrying Value at, December 31, 2013
|
Estimated
Useful Lives
in Years
|
||||
|
Affiliate relationships
|
$
|
189,629
|
|
25 years
|
|
|
Other amortizable intangible assets
|
23
|
|
4 to 10 years
|
||
|
$
|
189,652
|
|
|||
The useful lives for the affiliate relationships were determined based upon an analysis of the weighted average remaining terms of existing agreements we had in place with our major customers at the time that purchase accounting was applied, plus an estimate for renewals of such agreements. We have been successful in renewing our major affiliation agreements and maintaining customer relationships in the past and believe we will be able to renew our major affiliation agreements and maintain those customer relationships in the future. However, it is possible that we will not successfully renew such agreements as they expire or that if we do, the net revenue earned may not equal or exceed the net revenue currently being earned, which could have a significant adverse impact on our business.
There have been periods when an existing affiliation agreement has expired and the parties have not finalized negotiations of either a renewal of that agreement or a new agreement for certain periods of time. In substantially all these instances, the affiliates continued to carry and pay for the service under oral or written interim agreements until execution of definitive replacement agreements or renewals. If an affiliate were to cease carrying a service on an other than temporary basis, we would record an impairment charge for the then remaining carrying value of that affiliation agreement intangible asset. If we were to renew an affiliation agreement at rates that produced materially less net revenue compared to the net revenue produced under the previous agreement, we would evaluate the impact on our cash flows and, if necessary, would further evaluate such indication of potential impairment by following the policy described above under “Impairment of Long-Lived and Indefinite-Lived Assets” for the asset group containing that intangible asset. We also would evaluate whether the remaining useful life of the affiliate relationship intangible asset remained appropriate. Based on
December 31, 2013
carrying values, if the estimated remaining life of affiliate relationships and other amortizable intangible assets were shortened by 10%, the effect on amortization for the year ending December 31, 2013 would be to increase our annual amortization expense by approximately $560.
Program Rights
Rights to programming, including feature films and episodic series acquired under license agreements, are stated at the lower of amortized cost or net realizable value. Such licensed rights along with the related obligations are recorded at the contract value when a license agreement is executed, unless there is uncertainty with respect to either cost, acceptability or availability. If such uncertainty exists, those rights and obligations are recorded at the earlier of when the uncertainty is resolved or when the license period begins. Costs are amortized to technical and operating expense on a straight-line basis over a period not to exceed the respective license periods.
56
Our owned original programming is primarily produced by production companies, with the remainder produced by us. Owned original programming costs, including certain development and estimated participation and residual costs, qualifying for capitalization as program rights are amortized to technical and operating expense over their estimated useful lives, commencing upon the first airing, based on attributable revenue for airings to date as a percentage of total projected attributable revenue, or ultimate revenue (film-forecast-computation method). Projected attributable revenue is based on previously generated revenues for similar content in established markets, primarily consisting of distribution and advertising revenues, and projected program usage. Projected program usage is based on the current expectation of future exhibitions taking into account historical usage of similar content. Projected attributable revenue can change based upon programming market acceptance, levels of distribution and advertising revenue, and decisions regarding planned program usage. These calculations require management to make assumptions and to apply judgment regarding revenue and planned usage. We periodically review revenue estimates and planned usage and revise our assumptions if necessary, which could either accelerate or delay the timing of amortization expense or result in a write-down of the program right to net realizable value. We believe the most sensitive factor affecting our estimate of ultimate revenues is the program’s audience ratings. A program’s strong performance could result in increased usage and increased revenues in a particular period resulting in accelerated amortization of production costs in that period. Poor ratings may result in the reduction of planned usage or the abandonment of a program, which would require a write-off of any unamortized production costs. A failure to adjust for a downward change in estimates of ultimate revenues could result in the understatement of program rights amortization expense for the period. Historically, actual ultimate revenue amounts have not significantly differed from our estimates of ultimate revenue.
We periodically review the programming usefulness of our licensed and owned original program rights based on a series of factors, including expected future revenue generation from airings on our networks and other exploitation opportunities, ratings, type and quality of program material, standards and practices and fitness for exhibition through various forms of distribution. If it is determined that film or other program rights have no future programming usefulness, a write-off of the unamortized cost is recorded in technical and operating expense. Any capitalized pilot costs for programs that we determine will not be produced are also written off. Program rights write-offs of
$61,005
,
$9,990
and
$18,332
were recorded for the years ended
December 31, 2013
,
2012
and
2011
.
Income Taxes
Judgment is required in determining the provision for income taxes and related accruals, deferred tax assets and liabilities. Consequently, changes in our estimates with regard to uncertain tax positions and the realization of deferred tax assets will impact our results of operations and financial position. Deferred tax assets are evaluated quarterly for expected future realization and reduced by a valuation allowance to the extent management believes it is more likely than not that a portion will not be realized. See Note 11 to the accompanying consolidated financial statements for further discussion of the Company’s income taxes.
Recently Issued Accounting Pronouncements
In July 2013, the Financial Accounting Standards Board ("FASB") issued Accounting Standards Update (“ASU”) No. 2013-11, Income Taxes (Topic 740): Presentation of an Unrecognized Tax Benefit When a Net Operating Loss Carryforward, a Similar Tax Loss, or a Tax Credit Carryforward Exists (ASU 2013-11). ASU 2013-11 states the presentation of an unrecognized tax benefit, or a portion of an unrecognized tax benefit, should be presented in the financial statements as a reduction to a deferred tax asset for a net operating loss carryforward, a similar tax loss, or a tax credit carryforward, except as follows: to the extent a net operating loss carryforward, a similar tax loss, or a tax credit carryforward is not available at the reporting date under the tax law of the applicable jurisdiction to settle any additional income taxes that would result from the disallowance of a tax position or the tax law of the applicable jurisdiction does not require the entity to use, and the entity does not intend to use, the deferred tax asset for such purpose, the unrecognized tax benefit should be presented in the financial statements as a liability and should not be combined with deferred tax assets. ASU 2013-11 is effective in the first quarter of 2014 and early adoption is permitted. The adoption of ASU 2013-11 is not expected to have a material effect on the Company's consolidated financial statements.
Fair Value of Debt
Based on the level of interest rates prevailing at
December 31, 2013
, the fair value of our fixed rate debt of
$1,359,000
was more than its carrying value of
$1,278,868
by
$80,132
. The fair value of these financial instruments is estimated based on reference to quoted market prices for these or comparable securities. A hypothetical 100 basis point decrease in interest rates prevailing at
December 31, 2013
would increase the estimated fair value of our fixed rate debt by approximately
$61,600
to approximately
$1,420,600
.
57
Managing our Interest Rate Risk
To manage interest rate risk, we enter into interest rate swap contracts from time to time to adjust the amount of total debt that is subject to variable interest rates. Such contracts effectively fix the borrowing rates on floating rate debt to limit the exposure against the risk of rising rates. We do not enter into interest rate swap contracts for speculative or trading purposes and we only enter into interest rate swap contracts with financial institutions that we believe are creditworthy counterparties. We monitor the financial institutions that are counterparties to our interest rate swap contracts and to the extent possible diversify our swap contracts among various counterparties to mitigate exposure to any single financial institution.
As of
December 31, 2013
, we have
$2,157,183
of debt outstanding (excluding capital leases), of which
$878,315
outstanding under the Credit Facility is subject to variable interest rates. A hypothetical 100 basis point increase in interest rates prevailing at
December 31, 2013
could increase our annual interest expense by approximately
$8,800
.
Additionally, on January 31, 2014, we incurred additional indebtedness of $600,000 under our Term Loan A Facility in connection with the acquisition of Chellomedia (see Item 7, "Management's Discussion and Analysis of Financial Condition and Results of Operations - Acquisition of Chellomedia") which is subject to variable interest rates. As a result, interest expense will be higher in future periods.
As of
December 31, 2013
, we have interest rate swap contracts outstanding with notional amounts aggregating
$700,250
. The aggregate fair values of interest rate swap contracts at
December 31, 2013
was a liability of
$12,713
(included in other liabilities). As a result of these transactions, the interest rate paid on approximately
92%
of our debt (excluding capital leases) as of
December 31, 2013
is effectively fixed (
59%
being fixed rate obligations and
33%
effectively fixed through utilization of these interest rate swap contracts). Accumulated other comprehensive loss consists of
$4,495
of cumulative unrealized losses, net of tax, on the portion of floating-to-fixed interest rate swaps designated as cash flow hedges. At
December 31, 2013
, our interest rate swap contracts designated as cash flow hedges were highly effective, in all material respects.
Managing our Foreign Currency Exchange Rate Risk
To manage foreign currency exchange rate risk, we enter into foreign currency contracts from time to time with financial institutions to limit our exposure to fluctuations in foreign currency exchange rates. We do not enter into foreign currency contracts for speculative or trading purposes.
Historically, our exposure to foreign currency fluctuations has been limited to certain trade receivables from the distribution of our programming in certain territories outside of the U.S. that are denominated in a foreign currency.
During 2013, in order to mitigate the foreign currency exchange rate risk in fluctuations in the euro denominated purchase price of the pending acquisition of Chellomedia, the Company purchased euros and entered into foreign currency option contracts. As of December 31, 2013, cash and cash equivalents included
€250,000
and prepaid expense and other current assets included $2,577 representing the fair value of foreign currency option contracts with notional amounts aggregating
€125,000
.
The Company recognized $7,322, $(231) and $(130) of foreign currency transaction gains (losses) for the years ended December 31, 2013, 2012 and 2011, respectively. The foreign currency transaction gain recognized for the year ended December 31, 2013 primarily relates to the translation of euro denominated cash and cash equivalents at December 31, 2013. Such amounts are included in miscellaneous, net in the consolidated statements of income.
For periods subsequent to the acquisition of Chellomeda, we expect the exposure to foreign currency fluctuations will have a more significant impact on our financial position and results of operations.
The Financial Statements required by this Item 8 appear beginning on page 67 of this Annual Report, and are incorporated by reference herein.
None.
(a) Evaluation of Disclosure Controls and Procedures
An evaluation was carried out under the supervision and with the participation of the Company’s management, including our Chief Executive Officer and Chief Financial Officer, of the effectiveness of the design and operation of our disclosure controls and procedures (as defined in Rules 13a-15(e) and 15d-15(e) under the Securities Exchange Act of 1934, as amended). Based upon that evaluation as of
December 31, 2013
, the Company’s Chief Executive Officer and Chief Financial Officer concluded that the Company’s disclosure controls and procedures are effective.
58
(b) Management’s Report on Internal Control over Financial Reporting
Management is responsible for establishing and maintaining effective internal control over financial reporting, as such term is defined under the Securities Exchange Act of 1934 Rule 13a-15(f). The Company's internal control over financial reporting includes those policies and procedures that (i) pertain to the maintenance of records that, in reasonable detail, accurately and fairly reflect the transactions and dispositions of the assets of the Company; (ii) provide reasonable assurance that transactions are recorded as necessary to permit preparation of financial statements in accordance with generally accepted accounting principles, and that receipts and expenditures of the Company are being made only in accordance with authorizations of management and directors of the Company; and (iii) provide reasonable assurance regarding prevention or timely detection of unauthorized acquisition, use, or disposition of the Company's assets that could have a material effect on the financial statements.
Internal control over financial reporting is designed to provide reasonable assurance regarding the reliability of financial reporting and the preparation of financial statements prepared for external purposes in accordance with generally accepted accounting principles. Because of its inherent limitations, internal control over financial reporting may not prevent or detect misstatements. Also, projections of any evaluation of effectiveness to future periods are subject to the risk that controls may become inadequate because of changes in conditions, or that the degree of compliance with the policies or procedures may deteriorate.
Under the supervision and with the participation of management, including the Company's Chief Executive Officer and Chief Financial Officer, we conducted an evaluation of the effectiveness of our internal control over financial reporting based on the framework in Internal Control — Integrated Framework (1992 Framework) issued by the Committee of Sponsoring Organizations of the Treadway Commission. Based on our evaluation under the framework in Internal Control — Integrated Framework, our management concluded that our internal control over financial reporting was effective as of
December 31, 2013
.
The attestation report of the independent registered public accounting firm on the Company’s internal control over financial reporting is included in this report appearing on page F-1.
(c) Attestation Report of Independent Registered Public Accounting Firm
The effectiveness of the Company's internal control over financial reporting as of
December 31, 2013
has been audited by KPMG LLP, an independent registered public accounting firm, as stated in their attestation report appearing on page F-1.
(d) Changes in Internal Control over Financial Reporting
During the three months ended
December 31, 2013
, there were no changes in the Company’s internal control over financial reporting that have materially affected, or are reasonably likely to materially affect, the Company’s internal control over financial reporting.
None.
Information relating to our directors, executive officers and corporate governance will be included in our definitive Proxy Statement for our
2014
Annual Meeting of Stockholders, which will be filed within 120 days of the year ended
December 31, 2013
(the “
2014
Proxy Statement”), which is incorporated herein by reference.
Information relating to executive compensation will be included in the
2014
Proxy Statement, which is incorporated herein by reference.
Information relating to the beneficial ownership of our common stock will be included in the
2014
Proxy Statement, which is incorporated herein by reference.
Information relating to certain relationships and related transactions and director independence will be included in the
2014
Proxy Statement, which is incorporated herein by reference.
59
Information relating to principal accounting fees and services will be included in the
2014
Proxy Statement, which is incorporated herein by reference.
60
(a) Documents filed as part of the Form 10-K:
The following items are filed as part of this Annual Report:
|
(1)
|
The financial statements as indicated in the index set forth on page 67.
|
|
(2)
|
Financial statement schedule:
|
Schedule II—Valuation and Qualifying Accounts
Schedules other than that listed above have been omitted, since they are either not applicable, not required or the information is included elsewhere herein.
|
(3)
|
Exhibits:
|
The exhibits listed in the accompanying Exhibit Index are filed or incorporated by reference as part of this Annual Report.
61
INDEX TO EXHIBITS
|
Exhibit
Number
|
|
Description of Exhibit
|
|
2.1
|
|
Distribution Agreement between Cablevision Systems Corporation and AMC Networks Inc. (incorporated by reference to Exhibit 2.1 to the Company’s Amendment No. 6 to Registration Statement on Form 10 filed on June 10, 2011).
|
|
2.2
|
Stock Purchase Agreement dated October 28, 2013, by and among AMC Networks Inc., AMC Acquisition Company LLC, AMC Chello Zone Holdings Ltd., AMC Minority Holdings B.V., AMC DMC Holdings B.V., Chellomedia Programming B.V., Chellomedia Programming Financing Holdco II B.V., Chellomedia Direct Programming B.V., United Latin America Programming LLC, LMINT Holdings LLC, LGI Ventures B.V., Chellomedia CEE Holdco B.V. and Liberty Global Inc., the Sellers’ Guarantor (incorporated by reference to Exhibit 2.1 to the Company’s Current Report on Form 8-K filed on October 30, 2013).
|
|
|
3.1(i)
|
|
Amended and Restated Certificate of Incorporation of AMC Networks Inc. (incorporated by reference to Exhibit 99.4 to the Company’s Current Report on Form 8-K filed on July 1, 2011).
|
|
3.1(ii)
|
|
Amended and Restated By-Laws of AMC Networks Inc. (incorporated by reference to Exhibit 99.5 to the Company’s Current Report on Form 8-K filed on July 1, 2011).
|
|
4.1
|
|
Form of Registration Rights Agreement between AMC Networks Inc. and The Charles F. Dolan Children Trusts (incorporated by reference to Exhibit 3.5 to the Company’s Amendment No. 5 to Registration Statement on Form 10 filed on June 6, 2011).
|
|
4.2
|
|
Form of Registration Rights Agreement between AMC Networks Inc. and The Dolan Family Affiliates (incorporated by reference to Exhibit 3.6 to the Company’s Amendment No. 5 to Registration Statement on Form 10 filed on June 6, 2011).
|
|
4.3
|
|
Indenture dated as of June 30, 2011, by and among AMC Networks Inc., as Issuer, each of the guarantors party thereto and U.S. Bank National Association, as Trustee, relating to the AMC Networks Inc. 7.75% Senior Notes due July 15, 2021 (incorporated by reference to Exhibit 99.1 to the Company’s Current Report on Form 8-K filed on July 1, 2011).
|
|
4.4
|
Registration Rights Agreement, dated as of June 30, 2011, among AMC Networks Inc., the subsidiary guarantors named therein, Merrill Lynch, Pierce, Fenner & Smith Incorporated and J.P. Morgan Securities LLC, as representatives of the several initial purchasers (incorporated by reference to Exhibit 99.2 to the Company’s Current Report on Form 8-K filed on July 1, 2011).
|
|
|
4.5
|
|
Indenture by and among AMC Networks Inc., as Issuer, each of the guarantors party thereto and U.S. Bank National Association, as Trustee (incorporated by reference to Exhibit 4.1 to the Company’s Registration Statement on Form S-3 filed on December 10, 2012).
|
|
4.6
|
First Supplemental Indenture dated as of December 17, 2012, by and among AMC Networks Inc., as Issuer, each of the guarantors party thereto and U.S. Bank National Association, as Trustee, relating to the AMC Networks Inc. 4.75% Senior Notes due December 15, 2022 (incorporated by reference to Exhibit 4.1 to the Company’s Current Report on Form 8-K filed on December 17, 2012).
|
|
|
10.1
|
|
Form of Transition Services Agreement between Cablevision Systems Corporation and AMC Networks Inc. (incorporated by reference to Exhibit 10.1 to the Company’s Amendment No. 5 to Registration Statement on Form 10 filed on June 6, 2011).
|
|
10.2
|
|
Form of Tax Disaffiliation Agreement between Cablevision Systems Corporation and AMC Networks Inc. (incorporated by reference to Exhibit 10.2 to the Company’s Amendment No. 5 to Registration Statement on Form 10 filed on June 6, 2011).
|
|
10.3
|
|
Form of Employee Matters Agreement between Cablevision Systems Corporation and AMC Networks Inc. (incorporated by reference to Exhibit 10.3 to the Company’s Amendment No. 5 to Registration Statement on Form 10 filed on June 6, 2011).
|
|
10.4
|
|
Form of Equity Administration Agreement between The Madison Square Garden Company and AMC Networks Inc. (incorporated by reference to Exhibit 10.4 to the Company’s Amendment No. 5 to Registration Statement on Form 10 filed on June 6, 2011).
|
|
10.5
|
|
Form of Standstill Agreement by and among AMC Networks Inc. and The Dolan Family Group (incorporated by reference to Exhibit 10.5 to the Company’s Amendment No. 5 to Registration Statement on Form 10 filed on June 6, 2011).
|
|
10.6
|
|
AMC Networks Inc. Amended and Restated 2011 Employee Stock Plan (incorporated by reference to Exhibit 10.1 to the Company’s Quarterly Report on Form 10-Q for the quarter ended June 30, 2012).
|
|
10.7
|
|
AMC Networks Inc. Amended and Restated 2011 Stock Plan for Non-Employee Directors (incorporated by reference to Exhibit 10.3 to the Company’s Quarterly Report on Form 10-Q for the quarter ended June 30, 2012).
|
62
|
10.8
|
|
AMC Networks Inc. Amended and Restated 2011 Cash Incentive Plan (incorporated by reference to Exhibit 10.2 to the Company’s Quarterly Report on Form 10-Q for the quarter ended June 30, 2012).
|
|
10.9
|
|
Form of Time Sharing Agreement between Rainbow Media Holdings LLC and CSC Transport, Inc. (incorporated by reference to Exhibit 10.9 to the Company’s Amendment No. 5 to Registration Statement on Form 10 filed on June 6, 2011).
|
|
10.10
|
|
Form of Time Sharing Agreement between Rainbow Media Holdings LLC and Dolan Family Office, LLC (incorporated by reference to Exhibit 10.10 to the Company’s Amendment No. 5 to Registration Statement on Form 10 filed on June 6, 2011).
|
|
10.11
|
|
Form of Aircraft Dry Lease Agreement between Rainbow Media Holdings LLC and New York Aircam Corp. (incorporated by reference to Exhibit 10.11 to the Company’s Amendment No. 5 to Registration Statement on Form 10 filed on June 6, 2011).
|
|
10.12
|
|
Form of Aircraft Management Agreement between Rainbow Media Holdings LLC and CSC Transport, Inc. (incorporated by reference to Exhibit 10.12 to the Company’s Amendment No. 5 to Registration Statement on Form 10 filed on June 6, 2011).
|
|
10.13
|
|
Form of Employment Agreement by and between AMC Networks Inc. and Charles F. Dolan (incorporated by reference to Exhibit 10.13 to the Company’s Amendment No. 5 to Registration Statement on Form 10 filed on June 6, 2011).
|
|
10.14
|
|
Form of Employment Agreement by and between AMC Networks Inc. and Joshua W. Sapan (incorporated by reference to Exhibit 10.14 to the Company’s Amendment No. 5 to Registration Statement on Form 10 filed on June 6, 2011).
|
|
10.15
|
|
Employment Agreement by and between AMC Networks Inc. and Edward A. Carroll (incorporated by reference to Exhibit 10.1 to the Company’s Current Report on Form 8-K filed on April 24, 2013).
|
|
10.16
|
|
Employment Agreement by and between AMC Networks Inc. and Sean S. Sullivan (incorporated by reference to Exhibit 10.1 to the Company’s Current Report on Form 8-K filed on March 18, 2013).
|
|
10.17
|
|
Employment Agreement by and between AMC Networks Inc. and James G. Gallagher (incorporated by reference to Exhibit 10.2 to the Company’s Current Report on Form 8-K filed on March 18, 2013).
|
|
10.18
|
|
Form of AMC Networks Inc. Option Agreement in respect of Cablevision Options granted on and prior to November 8, 2005 (incorporated by reference to Exhibit 10.17 to the Company’s Amendment No. 5 to Registration Statement on Form 10 filed on June 6, 2011).
|
|
10.19
|
|
Form of AMC Networks Inc. Rights Agreement (incorporated by reference to Exhibit 10.18 to the Company’s Amendment No. 5 to Registration Statement on Form 10 filed on June 6, 2011).
|
|
10.20
|
|
Form of AMC Networks Inc. Option Agreement in respect of Vested Cablevision Options granted on June 5, 2006 and October 19, 2006 (incorporated by reference to Exhibit 10.19 to the Company’s Amendment No. 5 to Registration Statement on Form 10 filed on June 6, 2011).
|
|
10.21
|
|
Form of AMC Networks Inc. Option Agreement in respect of Cablevision Options granted on January 20, 2009 (incorporated by reference to Exhibit 10.20 to the Company’s Amendment No. 5 to Registration Statement on Form 10 filed on June 6, 2011).
|
|
10.22
|
|
Form of AMC Networks Inc. Option Agreement in respect of Cablevision Options granted on March 5, 2009 (incorporated by reference to Exhibit 10.21 to the Company’s Amendment No. 5 to Registration Statement on Form 10 filed on June 6, 2011).
|
|
10.23
|
|
Form of AMC Networks Inc. Non-Employee Director Award Agreement (incorporated by reference to Exhibit 10.22 to the Company’s Amendment No. 5 to Registration Statement on Form 10 filed on June 6, 2011).
|
|
10.24
|
|
Form of AMC Networks Inc. Restricted Shares Agreement (incorporated by reference to Exhibit 10.23 to the Company’s Amendment No. 5 to Registration Statement on Form 10 filed on June 6, 2011).
|
|
10.25
|
|
Form of AMC Networks Inc. Performance Award Agreement (incorporated by reference to Exhibit 10.24 to the Company’s Amendment No. 5 to Registration Statement on Form 10 filed on June 6, 2011).
|
|
10.26
|
|
Form of Letter Agreement from CSC Holdings, LLC to AMC Networks Inc. regarding VOOM Litigation (incorporated by reference to Exhibit 10.25 to the Company’s Amendment No. 5 to Registration Statement on Form 10 filed on June 6, 2011).
|
|
10.27
|
|
Form of Termination Agreement among CSC Holdings, LLC, American Movie Classics Company LLC and WE: Women’s Entertainment LLC (incorporated by reference to Exhibit 10.26 to the Company’s Amendment No. 5 to Registration Statement on Form 10 filed on June 6, 2011).
|
63
|
10.28
|
|
Amended and Restated Credit Agreement, dated December 16, 2013 among AMC Networks Inc. and AMC Network Entertainment LLC, as the Initial Borrowers, certain subsidiaries of AMC Networks Inc. named therein, as restricted subsidiaries, JPMorgan Chase Bank, N.A., as Administrative Agent, Collateral Agent and L/C Issuer, the lenders party thereto and the other financial institutions party thereto (incorporated by reference to Exhibit 10.1 to the Company’s Current Report on Form 8-K filed on December 19, 2013).
|
|
10.29
|
|
Form of AMC Networks Inc. Non-Employee Director Agreement (incorporated by reference to Exhibit 10.4 to the Company’s Quarterly Report on Form 10-Q for the quarter ended June 30, 2012).
|
|
10.30
|
|
Form of Executive Officer Restricted Shares Agreement (incorporated by reference to Exhibit 10.1 to the Company’s Quarterly Report on Form 10-Q for the quarter ended September 30, 2011).
|
|
10.31
|
|
Form of Performance Award Agreement under the 2011 Cash Incentive Plan (incorporated by reference to Exhibit 99.1 to the Company’s Current Report on Form 8-K filed on March 6, 2012).
|
|
10.32
|
|
Form of Restricted Stock Units Award Agreement under the 2011 Employee Stock Plan (incorporated by reference to Exhibit 99.2 to the Company’s Current Report on Form 8-K filed on March 6, 2012).
|
|
10.33
|
|
Form of Cablevision Amended and Restated Performance Award Agreement (incorporated by reference to Exhibit 10.32 to the Company’s Annual Report on Form 10-K for the year ended December 31, 2011).
|
|
*10.34
|
Confidential Settlement Agreement and Release dated as of October 21, 2012 by and between VOOM HD Holdings LLC, CSC Holdings, LLC, DISH Network L.L.C., and for certain limited purposes, MSG Holdings, L.P., The Madison Square Garden Company and EchoStar Corporation (incorporated by reference to Exhibit 10.1 to the Company’s Quarterly Report on Form 10-Q for the quarter ended September 30, 2012).
|
|
|
10.35
|
Form of Performance Award Agreement under the Amended and Restated 2011 Cash Incentive Plan (incorporated by reference to Exhibit 10.4 to the Company’s Quarterly Report on Form 10-Q for the quarter ended March 31, 2013).
|
|
|
10.36
|
Form of Restricted Stock Units Award Agreement under the Amended and Restated 2011 Employee Stock Plan (incorporated by reference to Exhibit 10.5 to the Company’s Quarterly Report on Form 10-Q for the quarter ended March 31, 2013).
|
|
|
12
|
|
Ratio of Earnings to Fixed Charges.
|
|
21
|
|
Subsidiaries of the Registrant.
|
|
23
|
|
Consent of Independent Registered Public Accounting Firm.
|
|
31.1
|
|
Certification of Chief Executive Officer pursuant to Section 302 of the Sarbanes-Oxley Act of 2002.
|
|
31.2
|
|
Certification of Chief Financial Officer pursuant to Section 302 of the Sarbanes-Oxley Act of 2002.
|
|
32
|
|
Certifications of Chief Executive Officer and Chief Financial Officer pursuant to Section 906 of the Sarbanes-Oxley Act of 2002, 18 U.S.C. Section 1350.
|
|
101.INS
|
|
XBRL Instance Document.
|
|
101.SCH
|
|
XBRL Taxonomy Extension Schema Document.
|
|
101.CAL
|
|
XBRL Taxonomy Extension Calculation Linkbase Document.
|
|
101.DEF
|
|
XBRL Taxonomy Extension Definition Linkbase.
|
|
101.LAB
|
|
XBRL Taxonomy Extension Label Linkbase Document.
|
|
101.PRE
|
|
XBRL Taxonomy Extension Presentation Linkbase Document.
|
_______________________
|
*
|
Portions of this exhibit have been omitted and filed separately with the Securities and Exchange Commission in accordance with a request for confidential treatment pursuant to Rule 24b-2 under the Securities Exchange Act of 1934, as amended.
|
64
SIGNATURES
Pursuant to the requirements of the Securities Exchange Act of 1934, the Registrant has duly caused this report to be signed on their behalf by the undersigned thereunto duly authorized.
|
|
AMC Networks Inc.
|
|||
|
Date:
|
February 27, 2014
|
|
By:
|
/s/ Sean S. Sullivan
|
|
|
|
Sean S. Sullivan
|
||
|
|
|
Executive Vice President and Chief Financial Officer
|
||
POWER OF ATTORNEY
KNOW ALL MEN BY THESE PRESENTS, that each person whose signature appears below constitutes and appoints Joshua W. Sapan and Sean S. Sullivan, and each of them, his true and lawful attorneys-in-fact and agents, with full power of substitution and resubstitution, for him in his name, place and stead, in any and all capacities, to sign this report, and file the same, with all exhibits thereto, and other documents in connection therewith, with the Securities and Exchange Commission, granting unto said attorneys-in-fact and agents, full power and authority to do and perform each and every act and thing requisite and necessary to be done as fully to all intents and purposes as he might or could do in person, hereby ratifying and confirming all that said attorneys-in-fact and agents or any of them may lawfully do or cause to be done by virtue hereof.
Pursuant to the requirements of the Securities Exchange Act of 1934, this report has been signed below by the following persons on behalf of the Registrant and in the capacities and on the dates indicated.
|
Name
|
|
Title
|
|
Date
|
|
/s/ Joshua W. Sapan
|
President and Chief Executive Officer
|
February 27, 2014
|
||
|
Joshua W. Sapan
|
|
(Principal Executive Officer)
|
|
|
|
/s/ Sean S. Sullivan
|
Executive Vice President and Chief Financial Officer
|
February 27, 2014
|
||
|
Sean S. Sullivan
|
|
(Principal Financial Officer)
|
|
|
|
/s/ John P. Giraldo
|
Chief Accounting Officer
|
February 27, 2014
|
||
|
John P. Giraldo
|
|
(Principal Accounting Officer)
|
|
|
|
/s/ Charles F. Dolan
|
Chairman of the Board of Directors
|
February 27, 2014
|
||
|
Charles F. Dolan
|
|
|
||
|
/s/ Neil M. Ashe
|
Director
|
February 27, 2014
|
||
|
Neil M. Ashe
|
|
|||
|
/s/ William J. Bell
|
Director
|
February 27, 2014
|
||
|
William J. Bell
|
|
|||
|
/s/ James L. Dolan
|
Director
|
February 27, 2014
|
||
|
James L. Dolan
|
|
|||
|
/s/ Kristin A. Dolan
|
Director
|
February 27, 2014
|
||
|
Kristin A. Dolan
|
|
|
||
65
|
Name
|
|
Title
|
|
Date
|
|
/s/ Marianne Dolan Weber
|
Director
|
February 27, 2014
|
||
|
Marianne Dolan Weber
|
|
|
||
|
/s/ Patrick F. Dolan
|
Director
|
February 27, 2014
|
||
|
Patrick F. Dolan
|
|
|
||
|
/s/ Thomas C. Dolan
|
Director
|
February 27, 2014
|
||
|
Thomas C. Dolan
|
|
|
||
|
/s/ Jonathan F. Miller
|
Director
|
February 27, 2014
|
||
|
Jonathan F. Miller
|
|
|||
|
/s/ Alan D. Schwartz
|
Director
|
February 27, 2014
|
||
|
Alan D. Schwartz
|
|
|
||
|
/s/ Brian G. Sweeney
|
Director
|
February 27, 2014
|
||
|
Brian G. Sweeney
|
|
|||
|
/s/ Leonard Tow
|
Director
|
February 27, 2014
|
||
|
Leonard Tow
|
|
|
||
|
/s/ Carl E. Vogel
|
Director
|
February 27, 2014
|
||
|
Carl E. Vogel
|
|
|||
|
/s/ Robert C. Wright
|
Director
|
February 27, 2014
|
||
|
Robert C. Wright
|
|
|
||
66
AMC NETWORKS INC. AND SUBSIDIARIES
INDEX TO CONSOLIDATED FINANCIAL STATEMENTS
|
Consolidated Financial Statements as of December 31, 2013 and 2012 and for the years ended December 31, 2013, 2012 and 2011
|
|
|
Reports of Independent Registered Public Accounting Firm
|
|
|
Consolidated Balance Sheets as of December 31, 2013 and 2012
|
|
|
Consolidated Statements of Income for the years ended December 31, 2013, 2012 and 2011
|
|
|
Consolidated Statements of Comprehensive Income for the years ended December 31, 2013, 2012 and 2011
|
|
|
Consolidated Statements of Stockholders’ Deficiency for the years ended December 31, 2013, 2012 and 2011
|
|
|
Consolidated Statements of Cash Flows for the years ended December 31, 2013, 2012 and 2011
|
|
|
Notes to Consolidated Financial Statements
|
|
|
Schedule II—Valuation and Qualifying Accounts
|
|
67
REPORT OF INDEPENDENT REGISTERED PUBLIC ACCOUNTING FIRM
The Board of Directors
AMC Networks Inc.:
We have audited AMC Networks Inc. and subsidiaries' (the Company) internal control over financial reporting as of December 31, 2013, based on criteria established in Internal Control - Integrated Framework (1992 Framework) issued by the Committee of Sponsoring Organizations of the Treadway Commission (COSO). AMC Networks Inc.'s management is responsible for maintaining effective internal control over financial reporting and for its assessment of the effectiveness of internal control over financial reporting, included in the accompanying Management's Report on Internal Control Over Financial Reporting in Item 9A. Our responsibility is to express an opinion on the Company's internal control over financial reporting based on our audit.
We conducted our audit in accordance with the standards of the Public Company Accounting Oversight Board (United States). Those standards require that we plan and perform the audit to obtain reasonable assurance about whether effective internal control over financial reporting was maintained in all material respects. Our audit included obtaining an understanding of internal control over financial reporting, assessing the risk that a material weakness exists, and testing and evaluating the design and operating effectiveness of internal control based on the assessed risk. Our audit also included performing such other procedures as we considered necessary in the circumstances. We believe that our audit provides a reasonable basis for our opinion.
A company's internal control over financial reporting is a process designed to provide reasonable assurance regarding the reliability of financial reporting and the preparation of financial statements for external purposes in accordance with generally accepted accounting principles. A company's internal control over financial reporting includes those policies and procedures that (1) pertain to the maintenance of records that, in reasonable detail, accurately and fairly reflect the transactions and dispositions of the assets of the company; (2) provide reasonable assurance that transactions are recorded as necessary to permit preparation of financial statements in accordance with generally accepted accounting principles, and that receipts and expenditures of the company are being made only in accordance with authorizations of management and directors of the company; and (3) provide reasonable assurance regarding prevention or timely detection of unauthorized acquisition, use, or disposition of the company's assets that could have a material effect on the financial statements.
Because of its inherent limitations, internal control over financial reporting may not prevent or detect misstatements. Also, projections of any evaluation of effectiveness to future periods are subject to the risk that controls may become inadequate because of changes in conditions, or that the degree of compliance with the policies or procedures may deteriorate.
In our opinion, AMC Networks Inc. and subsidiaries maintained, in all material respects, effective internal control over financial reporting as of December 31, 2013, based on criteria established in
Internal Control - Integrated Framework
(1992 Framework) issued by the Committee of Sponsoring Organizations of the Treadway Commission (COSO).
We also have audited, in accordance with the standards of the Public Company Accounting Oversight Board (United States), the consolidated balance sheets of AMC Networks Inc. and subsidiaries as of December 31, 2013 and 2012, and the related consolidated statements of income, comprehensive income, stockholders' deficiency, and cash flows for each of the years in the three-year period ended December 31, 2013, and our report dated February 27, 2014 expressed an unqualified opinion on those consolidated financial statements.
/s/ KPMG LLP
New York, New York
February 27, 2014
F-1
REPORT OF INDEPENDENT REGISTERED PUBLIC ACCOUNTING FIRM
The Board of Directors
AMC Networks Inc.:
We have audited the accompanying consolidated balance sheets of AMC Networks Inc. and subsidiaries (the Company) as of December 31, 2013 and 2012, and the related consolidated statements of income, comprehensive income, stockholders’ deficiency and cash flows for each of the years in the three-year period ended December 31, 2013. In connection with our audits of the consolidated financial statements, we also have audited the related financial statement schedule as listed in the index to Item 15. These consolidated financial statements and financial statement schedule are the responsibility of the Company’s management. Our responsibility is to express an opinion on these consolidated financial statements and financial statement schedule based on our audits.
We conducted our audits in accordance with the standards of the Public Company Accounting Oversight Board (United States). Those standards require that we plan and perform the audit to obtain reasonable assurance about whether the financial statements are free of material misstatement. An audit includes examining, on a test basis, evidence supporting the amounts and disclosures in the financial statements. An audit also includes assessing the accounting principles used and significant estimates made by management, as well as evaluating the overall financial statement presentation. We believe that our audits provide a reasonable basis for our opinion.
In our opinion, the consolidated financial statements referred to above present fairly, in all material respects, the financial position of AMC Networks Inc. and subsidiaries as of December 31, 2013 and 2012, and the results of their operations and their cash flows for each of the years in the three-year period ended December 31, 2013, in conformity with U.S. generally accepted accounting principles. Also, in our opinion, the related financial statement schedule referred to above, when considered in relation to the basic consolidated financial statements taken as a whole, presents fairly, in all material respects, the information set forth therein.
We also have audited, in accordance with the standards of the Public Company Accounting Oversight Board (United States), AMC Networks Inc. and subsidiaries' internal control over financial reporting as of December 31, 2013, based on criteria established in
Internal Control - Integrated Framework
(1992 Framework) issued by the Committee of Sponsoring Organizations of the Treadway Commission (COSO), and our report dated February 27, 2014 expressed an unqualified opinion on the effectiveness of the Company's internal control over financial reporting.
/s/ KPMG LLP
New York, New York
February 27, 2014
F-2
AMC NETWORKS INC. AND SUBSIDIARIES
CONSOLIDATED BALANCE SHEETS
December 31, 2013
and
2012
(Dollars in thousands, except per share amounts)
|
2013
|
2012
|
||||||
|
ASSETS
|
|||||||
|
Current Assets:
|
|||||||
|
Cash and cash equivalents
|
$
|
521,951
|
|
$
|
610,970
|
|
|
|
Accounts receivable, trade (less allowance for doubtful accounts of
$931
and $1,378)
|
378,831
|
|
299,792
|
|
|||
|
Amounts due from related parties, net
|
4,774
|
|
7,686
|
|
|||
|
Current portion of program rights, net
|
317,922
|
|
289,644
|
|
|||
|
Prepaid expenses and other current assets
|
65,512
|
|
17,032
|
|
|||
|
Deferred tax asset, net
|
15,668
|
|
121,403
|
|
|||
|
Total current assets
|
1,304,658
|
|
1,346,527
|
|
|||
|
Property and equipment, net
|
71,068
|
|
70,890
|
|
|||
|
Program rights, net
|
853,516
|
|
751,119
|
|
|||
|
Amounts due from related parties, net
|
2,096
|
|
3,193
|
|
|||
|
Deferred carriage fees, net
|
44,032
|
|
41,459
|
|
|||
|
Intangible assets, net
|
209,552
|
|
241,183
|
|
|||
|
Goodwill
|
76,748
|
|
79,305
|
|
|||
|
Other assets
|
75,019
|
|
62,543
|
|
|||
|
Total assets
|
$
|
2,636,689
|
|
$
|
2,596,219
|
|
|
|
LIABILITIES AND STOCKHOLDERS’ DEFICIENCY
|
|||||||
|
Current Liabilities:
|
|||||||
|
Accounts payable
|
$
|
48,126
|
|
$
|
59,077
|
|
|
|
Accrued liabilities
|
131,290
|
|
232,462
|
|
|||
|
Amounts due to related parties, net
|
—
|
|
1,110
|
|
|||
|
Current portion of program rights obligations
|
210,190
|
|
157,584
|
|
|||
|
Deferred litigation settlement proceeds
|
—
|
|
307,944
|
|
|||
|
Deferred revenue
|
23,429
|
|
53,116
|
|
|||
|
Current portion of capital lease obligations
|
1,718
|
|
1,558
|
|
|||
|
Total current liabilities
|
414,753
|
|
812,851
|
|
|||
|
Program rights obligations
|
449,587
|
|
390,715
|
|
|||
|
Long-term debt
|
2,157,183
|
|
2,153,315
|
|
|||
|
Capital lease obligations
|
12,387
|
|
14,104
|
|
|||
|
Deferred tax liability, net
|
95,275
|
|
29,141
|
|
|||
|
Other liabilities
|
78,755
|
|
78,445
|
|
|||
|
Total liabilities
|
3,207,940
|
|
3,478,571
|
|
|||
|
Commitments and contingencies
|
|
|
|
|
|||
|
Stockholders’ deficiency:
|
|||||||
|
Class A Common Stock, $0.01 par value, 360,000,000 shares authorized, 61,692,561 and 61,247,043 shares issued and 60,794,114 and 60,591,030 shares outstanding, respectively
|
617
|
|
612
|
|
|||
|
Class B Common Stock, $0.01 par value, 90,000,000 shares authorized, 11,484,408 and 11,784,408 shares issued and outstanding, respectively
|
115
|
|
118
|
|
|||
|
Preferred stock, $0.01 par value, 45,000,000 shares authorized; none issued
|
—
|
|
—
|
|
|||
|
Paid-in capital
|
64,731
|
|
36,454
|
|
|||
|
Accumulated deficit
|
(602,686
|
)
|
(893,424
|
)
|
|||
|
Treasury stock, at cost (898,447 and 656,013 shares Class A Common Stock, respectively)
|
(29,801
|
)
|
(17,666
|
)
|
|||
|
Accumulated other comprehensive loss
|
(4,495
|
)
|
(8,446
|
)
|
|||
|
Total AMC Networks stockholders’ deficiency
|
(571,519
|
)
|
(882,352
|
)
|
|||
|
Noncontrolling interests
|
268
|
|
—
|
|
|||
|
Total stockholders’ deficiency
|
(571,251
|
)
|
(882,352
|
)
|
|||
|
Total liabilities and stockholders’ deficiency
|
$
|
2,636,689
|
|
$
|
2,596,219
|
|
|
See accompanying notes to consolidated financial statements.
F-3
AMC NETWORKS INC. AND SUBSIDIARIES
Years Ended
December 31, 2013
,
2012
and
2011
(In thousands, except per share amounts)
|
2013
|
2012
|
2011
|
||||||||||
|
Revenues, net (including revenues, net from related parties of $31,188, $32,195 and $31,885, respectively)
|
$
|
1,591,858
|
|
$
|
1,352,577
|
|
$
|
1,187,741
|
|
|||
|
Operating expenses:
|
||||||||||||
|
Technical and operating (excluding depreciation and amortization shown below and including charges from related parties of $324, $620, and $5,040, respectively)
|
662,233
|
|
507,436
|
|
425,961
|
|
||||||
|
Selling, general and administrative (including charges (credits) from related parties of $2,721, $(206) and $57,004, respectively)
|
425,735
|
|
396,926
|
|
335,656
|
|
||||||
|
Restructuring credit
|
—
|
|
(3
|
)
|
(240
|
)
|
||||||
|
Depreciation and amortization
|
54,667
|
|
85,380
|
|
99,848
|
|
||||||
|
Litigation settlement gain
|
(132,944
|
)
|
—
|
|
—
|
|
||||||
|
1,009,691
|
|
989,739
|
|
861,225
|
|
|||||||
|
Operating income
|
582,167
|
|
362,838
|
|
326,516
|
|
||||||
|
Other income (expense):
|
||||||||||||
|
Interest expense
|
(115,860
|
)
|
(127,778
|
)
|
(95,870
|
)
|
||||||
|
Interest income
|
819
|
|
502
|
|
1,074
|
|
||||||
|
Write-off of deferred financing costs
|
(4,007
|
)
|
(1,862
|
)
|
(6,247
|
)
|
||||||
|
Loss on extinguishment of debt
|
(1,087
|
)
|
(10,774
|
)
|
(14,726
|
)
|
||||||
|
Miscellaneous, net
|
6,969
|
|
(652
|
)
|
(137
|
)
|
||||||
|
(113,166
|
)
|
(140,564
|
)
|
(115,906
|
)
|
|||||||
|
Income from continuing operations before income taxes
|
469,001
|
|
222,274
|
|
210,610
|
|
||||||
|
Income tax expense
|
(178,841
|
)
|
(86,058
|
)
|
(84,248
|
)
|
||||||
|
Income from continuing operations
|
290,160
|
|
136,216
|
|
126,362
|
|
||||||
|
Income from discontinued operations, net of income taxes
|
—
|
|
314
|
|
92
|
|
||||||
|
Net income including noncontrolling interests
|
290,160
|
|
136,530
|
|
126,454
|
|
||||||
|
Net loss attributable to noncontrolling interests
|
578
|
|
—
|
|
—
|
|
||||||
|
Net income attributable to AMC Networks’ stockholders
|
$
|
290,738
|
|
$
|
136,530
|
|
$
|
126,454
|
|
|||
|
Basic net income per share attributable to AMC Networks’ stockholders:
|
||||||||||||
|
Income from continuing operations
|
$
|
4.06
|
|
$
|
1.94
|
|
$
|
1.82
|
|
|||
|
Income from discontinued operations
|
$
|
—
|
|
$
|
—
|
|
$
|
—
|
|
|||
|
Net income
|
$
|
4.06
|
|
$
|
1.94
|
|
$
|
1.83
|
|
|||
|
Diluted net income per share attributable to AMC Networks’ stockholders:
|
||||||||||||
|
Income from continuing operations
|
$
|
4.00
|
|
$
|
1.89
|
|
$
|
1.79
|
|
|||
|
Income from discontinued operations
|
$
|
—
|
|
$
|
—
|
|
$
|
—
|
|
|||
|
Net income
|
$
|
4.00
|
|
$
|
1.89
|
|
$
|
1.79
|
|
|||
|
Weighted average common shares:
|
||||||||||||
|
Basic weighted average common shares
|
71,543
|
|
70,374
|
|
69,283
|
|
||||||
|
Diluted weighted average common shares
|
72,703
|
|
72,236
|
|
70,731
|
|
||||||
See accompanying notes to consolidated financial statements.
F-4
AMC NETWORKS INC. AND SUBSIDIARIES
CONSOLIDATED STATEMENTS OF COMPREHENSIVE INCOME
Years Ended
December 31, 2013
,
2012
and
2011
(Dollars in thousands)
|
|
2013
|
2012
|
2011
|
||||||||
|
Net income including noncontrolling interests
|
$
|
290,160
|
|
$
|
136,530
|
|
$
|
126,454
|
|
||
|
Other comprehensive income (loss):
|
|||||||||||
|
Unrealized gain (loss) on interest rate swaps
|
6,262
|
|
5,693
|
|
(19,091
|
)
|
|||||
|
Other comprehensive income (loss), before income taxes
|
6,262
|
|
5,693
|
|
(19,091
|
)
|
|||||
|
Income tax (expense) benefit
|
(2,311
|
)
|
(2,112
|
)
|
7,064
|
|
|||||
|
Other comprehensive income (loss), net of income taxes
|
3,951
|
|
3,581
|
|
(12,027
|
)
|
|||||
|
Comprehensive income
|
294,111
|
|
140,111
|
|
114,427
|
|
|||||
|
Comprehensive loss attributable to noncontrolling interests
|
578
|
|
—
|
|
—
|
|
|||||
|
Comprehensive income attributable to AMC Networks’ stockholders
|
$
|
294,689
|
|
$
|
140,111
|
|
$
|
114,427
|
|
||
See accompanying notes to consolidated financial statements.
F-5
AMC NETWORKS INC. AND SUBSIDIARIES
CONSOLIDATED STATEMENTS OF STOCKHOLDERS’ DEFICIENCY
Years Ended
December 31, 2013
,
2012
and
2011
(Dollars in thousands)
|
Class A
Common
Stock
|
Class B
Common
Stock
|
Paid-in
Capital
|
Accumulated
Deficit
|
Treasury
Stock
|
Accumulated
Other
Comprehensive
Loss
|
Total AMC Networks Stockholders’
Deficiency |
Noncontrolling
Interests |
Total Stockholders’
Deficiency |
|||||||||||||||||||||||||||
|
Balance, January 1, 2011
|
$
|
—
|
|
$
|
—
|
|
$
|
181,724
|
|
$
|
(156,893
|
)
|
$
|
—
|
|
$
|
—
|
|
$
|
24,831
|
|
$
|
—
|
|
$
|
24,831
|
|
||||||||
|
Net income attributable to AMC Networks’ stockholders
|
—
|
|
—
|
|
—
|
|
126,454
|
|
—
|
|
—
|
|
126,454
|
|
—
|
|
126,454
|
|
|||||||||||||||||
|
Other comprehensive loss
|
—
|
|
—
|
|
—
|
|
—
|
|
—
|
|
(12,027
|
)
|
(12,027
|
)
|
—
|
|
(12,027
|
)
|
|||||||||||||||||
|
Cash capital contributions from Cablevision
|
—
|
|
—
|
|
20,813
|
|
—
|
|
—
|
|
—
|
|
20,813
|
|
—
|
|
20,813
|
|
|||||||||||||||||
|
Cash capital distributions to Cablevision
|
—
|
|
—
|
|
(20,813
|
)
|
—
|
|
—
|
|
—
|
|
(20,813
|
)
|
—
|
|
(20,813
|
)
|
|||||||||||||||||
|
Non-cash capital distribution to Cablevision related to employee benefit plans as a result of the Distribution (see Note 15)
|
—
|
|
—
|
|
(6,313
|
)
|
—
|
|
—
|
|
—
|
|
(6,313
|
)
|
—
|
|
(6,313
|
)
|
|||||||||||||||||
|
Non-cash capital distribution associated with the issuance of debt to Cablevision (see Note 7)
|
—
|
|
—
|
|
(250,485
|
)
|
(999,515
|
)
|
—
|
|
—
|
|
(1,250,000
|
)
|
—
|
|
(1,250,000
|
)
|
|||||||||||||||||
|
Non-cash capital contribution, net related to adjustments to the liability for uncertain tax positions and net deferred tax assets as a result of the Distribution
|
—
|
|
—
|
|
44,598
|
|
—
|
|
—
|
|
—
|
|
44,598
|
|
—
|
|
44,598
|
|
|||||||||||||||||
|
Non-cash capital contribution related to the utilization of Cablevision tax losses
|
—
|
|
—
|
|
36,867
|
|
—
|
|
—
|
|
—
|
|
36,867
|
|
—
|
|
36,867
|
|
|||||||||||||||||
|
Non-cash capital distribution related to tax credits utilized by Cablevision
|
—
|
|
—
|
|
(2,586
|
)
|
—
|
|
—
|
|
—
|
|
(2,586
|
)
|
—
|
|
(2,586
|
)
|
|||||||||||||||||
|
Non-cash capital distribution of a promissory note receivable to Cablevision (see Note 15)
|
—
|
|
—
|
|
(17,113
|
)
|
—
|
|
—
|
|
—
|
|
(17,113
|
)
|
—
|
|
(17,113
|
)
|
|||||||||||||||||
|
Non-cash capital contribution related to the allocation of Cablevision share-based compensation expense
|
—
|
|
—
|
|
8,343
|
|
—
|
|
—
|
|
—
|
|
8,343
|
|
—
|
|
8,343
|
|
|||||||||||||||||
|
Reclassification of common stock in connection with the Distribution
|
578
|
|
135
|
|
(713
|
)
|
—
|
|
—
|
|
—
|
|
—
|
|
—
|
|
—
|
|
|||||||||||||||||
|
Share-based compensation expense subsequent to the Distribution
|
—
|
|
—
|
|
7,669
|
|
—
|
|
—
|
|
—
|
|
7,669
|
|
—
|
|
7,669
|
|
|||||||||||||||||
|
Proceeds from the exercise of stock options
|
8
|
|
—
|
|
3,614
|
|
—
|
|
—
|
|
—
|
|
3,622
|
|
—
|
|
3,622
|
|
|||||||||||||||||
|
Treasury stock acquired from forfeitures and acquisition of restricted shares
|
—
|
|
—
|
|
—
|
|
—
|
|
(1,677
|
)
|
—
|
|
(1,677
|
)
|
—
|
|
(1,677
|
)
|
|||||||||||||||||
|
Other non-cash capital contributions, net
|
—
|
|
—
|
|
337
|
|
—
|
|
—
|
|
—
|
|
337
|
|
—
|
|
337
|
|
|||||||||||||||||
|
Balance, December 31, 2011
|
$
|
586
|
|
$
|
135
|
|
$
|
5,942
|
|
$
|
(1,029,954
|
)
|
$
|
(1,677
|
)
|
$
|
(12,027
|
)
|
$
|
(1,036,995
|
)
|
$
|
—
|
|
$
|
(1,036,995
|
)
|
||||||||
F-6
|
Class A
Common Stock |
Class B
Common Stock |
Paid-in
Capital |
Accumulated
Deficit |
Treasury
Stock |
Accumulated
Other Comprehensive Loss |
Total AMC Networks Stockholders’
Deficiency |
Noncontrolling
Interests |
Total Stockholders’
Deficiency |
|||||||||||||||||||||||||||
|
Balance, December 31, 2011
|
$
|
586
|
|
$
|
135
|
|
$
|
5,942
|
|
$
|
(1,029,954
|
)
|
$
|
(1,677
|
)
|
$
|
(12,027
|
)
|
$
|
(1,036,995
|
)
|
$
|
—
|
|
$
|
(1,036,995
|
)
|
||||||||
|
Net income attributable to AMC Networks’ stockholders
|
—
|
|
—
|
|
—
|
|
136,530
|
|
—
|
|
—
|
|
136,530
|
|
—
|
|
136,530
|
|
|||||||||||||||||
|
Other comprehensive income
|
—
|
|
—
|
|
—
|
|
—
|
|
—
|
|
3,581
|
|
3,581
|
|
—
|
|
3,581
|
|
|||||||||||||||||
|
Non-cash capital distribution, net related to adjustments to liability for uncertain tax positions and net deferred tax assets as a result of the Distribution (see Note 10)
|
—
|
|
—
|
|
(1,148
|
)
|
—
|
|
—
|
|
—
|
|
(1,148
|
)
|
—
|
|
(1,148
|
)
|
|||||||||||||||||
|
Non-cash capital distribution related to the utilization of Cablevision tax losses (see Note 10)
|
—
|
|
—
|
|
(1,794
|
)
|
—
|
|
—
|
|
—
|
|
(1,794
|
)
|
—
|
|
(1,794
|
)
|
|||||||||||||||||
|
Share-based compensation expense
|
—
|
|
—
|
|
17,202
|
|
—
|
|
—
|
|
—
|
|
17,202
|
|
—
|
|
17,202
|
|
|||||||||||||||||
|
Proceeds from the exercise of stock options
|
9
|
|
—
|
|
8,768
|
|
—
|
|
—
|
|
—
|
|
8,777
|
|
—
|
|
8,777
|
|
|||||||||||||||||
|
Treasury stock acquired from forfeitures and acquisition of restricted shares (see Note 12)
|
—
|
|
—
|
|
—
|
|
—
|
|
(15,989
|
)
|
—
|
|
(15,989
|
)
|
—
|
|
(15,989
|
)
|
|||||||||||||||||
|
Conversion of Class B to Class A common stock
|
17
|
|
(17
|
)
|
—
|
|
—
|
|
—
|
|
—
|
|
—
|
|
—
|
|
—
|
|
|||||||||||||||||
|
Excess tax benefits on share-based awards
|
—
|
|
—
|
|
7,484
|
|
—
|
|
—
|
|
—
|
|
7,484
|
|
—
|
|
7,484
|
|
|||||||||||||||||
|
Balance, December 31, 2012
|
612
|
|
118
|
|
36,454
|
|
(893,424
|
)
|
(17,666
|
)
|
(8,446
|
)
|
(882,352
|
)
|
—
|
|
(882,352
|
)
|
|||||||||||||||||
|
Net income attributable to AMC Networks’ stockholders
|
—
|
|
—
|
|
—
|
|
290,738
|
|
—
|
|
—
|
|
290,738
|
|
—
|
|
290,738
|
|
|||||||||||||||||
|
Net loss attributable to noncontrolling interests
|
—
|
|
—
|
|
—
|
|
—
|
|
—
|
|
—
|
|
—
|
|
(578
|
)
|
(578
|
)
|
|||||||||||||||||
|
Issuance of members' interest by subsidiary, net
|
—
|
|
—
|
|
1,246
|
|
—
|
|
—
|
|
—
|
|
1,246
|
|
846
|
|
2,092
|
|
|||||||||||||||||
|
Other comprehensive income
|
—
|
|
—
|
|
—
|
|
—
|
|
—
|
|
3,951
|
|
3,951
|
|
—
|
|
3,951
|
|
|||||||||||||||||
|
Share-based compensation expense
|
—
|
|
—
|
|
20,299
|
|
—
|
|
—
|
|
—
|
|
20,299
|
|
—
|
|
20,299
|
|
|||||||||||||||||
|
Proceeds from the exercise of stock options
|
2
|
|
—
|
|
1,757
|
|
—
|
|
—
|
|
—
|
|
1,759
|
|
—
|
|
1,759
|
|
|||||||||||||||||
|
Treasury stock acquired from forfeitures and acquisition of restricted shares (see Note 13)
|
—
|
|
—
|
|
—
|
|
—
|
|
(12,135
|
)
|
—
|
|
(12,135
|
)
|
—
|
|
(12,135
|
)
|
|||||||||||||||||
|
Conversion of Class B to Class A common stock
|
3
|
|
(3
|
)
|
—
|
|
—
|
|
—
|
|
—
|
|
—
|
|
—
|
|
—
|
|
|||||||||||||||||
|
Excess tax benefits on share-based awards
|
—
|
|
—
|
|
4,975
|
|
—
|
|
—
|
|
—
|
|
4,975
|
|
—
|
|
4,975
|
|
|||||||||||||||||
|
Balance, December 31, 2013
|
$
|
617
|
|
$
|
115
|
|
$
|
64,731
|
|
$
|
(602,686
|
)
|
$
|
(29,801
|
)
|
$
|
(4,495
|
)
|
$
|
(571,519
|
)
|
$
|
268
|
|
$
|
(571,251
|
)
|
||||||||
See accompanying notes to consolidated financial statements.
F-7
AMC NETWORKS INC. AND SUBSIDIARIES
Years Ended
December 31, 2013
,
2012
and
2011
(Dollars in thousands)
|
2013
|
2012
|
2011
|
|||||||||
|
Cash flows from operating activities:
|
|||||||||||
|
Income from continuing operations
|
$
|
290,160
|
|
$
|
136,216
|
|
$
|
126,362
|
|
||
|
Adjustments to reconcile income from continuing operations to net cash (used in) provided by operating activities:
|
|||||||||||
|
Depreciation and amortization
|
54,667
|
|
85,380
|
|
99,848
|
|
|||||
|
Share-based compensation expense related to equity classified awards
|
20,299
|
|
17,202
|
|
16,012
|
|
|||||
|
Amortization and write-off of program rights
|
497,608
|
|
355,477
|
|
278,728
|
|
|||||
|
Amortization of deferred carriage fees
|
10,590
|
|
9,211
|
|
23,962
|
|
|||||
|
Foreign exchange gain
|
(6,543
|
)
|
—
|
|
—
|
|
|||||
|
Unrealized (gain) loss on derivative contracts, net
|
(4,313
|
)
|
8,739
|
|
—
|
|
|||||
|
Amortization and write-off of deferred financing costs and discounts on indebtedness
|
11,124
|
|
10,406
|
|
12,159
|
|
|||||
|
Loss on extinguishment of debt
|
1,087
|
|
10,774
|
|
14,726
|
|
|||||
|
Provision for (recovery of) doubtful accounts
|
1,440
|
|
(1,265
|
)
|
338
|
|
|||||
|
Deferred income taxes
|
171,504
|
|
(88,514
|
)
|
69,160
|
|
|||||
|
Excess tax benefits from share-based compensation arrangements
|
(4,975
|
)
|
(7,484
|
)
|
—
|
|
|||||
|
Other, net
|
(1,452
|
)
|
(100
|
)
|
(240
|
)
|
|||||
|
Changes in assets and liabilities:
|
|||||||||||
|
Accounts receivable, trade
|
(80,083
|
)
|
(11,717
|
)
|
(44,750
|
)
|
|||||
|
Amounts due from/to related parties, net
|
2,033
|
|
(6,001
|
)
|
(9,602
|
)
|
|||||
|
Prepaid expenses and other assets
|
(52,836
|
)
|
(24,842
|
)
|
(3,439
|
)
|
|||||
|
Program rights and obligations, net
|
(517,343
|
)
|
(412,493
|
)
|
(358,929
|
)
|
|||||
|
Income taxes payable
|
(111,881
|
)
|
116,740
|
|
(52
|
)
|
|||||
|
Deferred revenue and deferred litigation settlement proceeds
|
(337,700
|
)
|
337,207
|
|
6,039
|
|
|||||
|
Deferred carriage fees and deferred carriage fees payable, net
|
(10,638
|
)
|
(3,894
|
)
|
(3,640
|
)
|
|||||
|
Accounts payable, accrued expenses and other liabilities
|
17,789
|
|
38,090
|
|
28,551
|
|
|||||
|
Net cash (used in) provided by operating activities
|
(49,463
|
)
|
569,132
|
|
255,233
|
|
|||||
|
Cash flows from investing activities:
|
|||||||||||
|
Capital expenditures
|
(24,303
|
)
|
(18,557
|
)
|
(15,371
|
)
|
|||||
|
Acquisition of investment securities
|
(2,500
|
)
|
(750
|
)
|
—
|
|
|||||
|
Payment for acquisition of a business
|
—
|
|
(185
|
)
|
(320
|
)
|
|||||
|
Proceeds from sale of equipment, net of costs of disposal
|
—
|
|
100
|
|
—
|
|
|||||
|
Proceeds from insurance settlements
|
657
|
|
—
|
|
—
|
|
|||||
|
Net cash used in investing activities
|
(26,146
|
)
|
(19,392
|
)
|
(15,691
|
)
|
|||||
|
Cash flows from financing activities:
|
|||||||||||
|
Capital contributions from Cablevision
|
—
|
|
—
|
|
20,813
|
|
|||||
|
Capital distributions to Cablevision
|
—
|
|
—
|
|
(20,813
|
)
|
|||||
|
Repayment of long-term debt
|
(880,000
|
)
|
(742,025
|
)
|
(1,516,340
|
)
|
|||||
|
Proceeds from the issuance of long-term debt
|
880,000
|
|
589,500
|
|
1,442,364
|
|
|||||
|
Payments for financing costs
|
(12,994
|
)
|
(1,421
|
)
|
(27,414
|
)
|
|||||
|
Purchase of treasury stock
|
(12,135
|
)
|
(15,989
|
)
|
(1,677
|
)
|
|||||
|
Proceeds from stock option exercises
|
1,759
|
|
8,777
|
|
3,622
|
|
|||||
|
Excess tax benefits from share-based compensation arrangements
|
4,975
|
|
7,484
|
|
—
|
|
|||||
|
Principal payments on capital lease obligations
|
(1,558
|
)
|
(1,413
|
)
|
(4,612
|
)
|
|||||
|
Net cash used in financing activities
|
(19,953
|
)
|
(155,087
|
)
|
(104,057
|
)
|
|||||
|
Net (decrease) increase in cash and cash equivalents from continuing operations
|
(95,562
|
)
|
394,653
|
|
135,485
|
|
|||||
|
Cash flows from discontinued operations:
|
|||||||||||
|
Net cash used in operating activities
|
—
|
|
(82
|
)
|
(359
|
)
|
|||||
|
Net cash provided by investing activities
|
—
|
|
563
|
|
750
|
|
|||||
|
Net increase in cash and cash equivalents from discontinued operations
|
—
|
|
481
|
|
391
|
|
|||||
|
Effect of exchange rate changes on cash and cash equivalents
|
6,543
|
|
—
|
|
—
|
|
|||||
|
Cash and cash equivalents at beginning of year
|
610,970
|
|
215,836
|
|
79,960
|
|
|||||
|
Cash and cash equivalents at end of year
|
$
|
521,951
|
|
$
|
610,970
|
|
$
|
215,836
|
|
||
See accompanying notes to consolidated financial statements.
F-8
AMC NETWORKS INC. AND SUBSIDIARIES
NOTES TO CONSOLIDATED FINANCIAL STATEMENTS
(Dollars in thousands, except per share amounts)
Description of Business
AMC Networks Inc. (“AMC Networks”) and collectively with its subsidiaries (the “Company”) own and operate entertainment businesses and assets. The Company is comprised of
two
operating segments:
|
•
|
National Networks:
Includes
four
nationally distributed programming networks: AMC, WE tv, IFC and SundanceTV (formerly known as Sundance Channel). These programming networks are distributed throughout the United States (“U.S.”) via cable and other multichannel video programming distribution platforms, including direct broadcast satellite (“DBS”) and platforms operated by telecommunications providers (we refer collectively to these cable and other multichannel video programming distributors as “multichannel video programming distributors” or “distributors”); and
|
|
•
|
International and Other:
Principally includes AMC/Sundance Channel Global, the Company’s international programming business; IFC Films, the Company’s independent film distribution business; AMC Networks Broadcasting & Technology, the Company’s network technical services business, which primarily services the programming networks of the Company; and various developing online content distribution initiatives. AMC and Sundance Channel are distributed in Canada, Sundance Channel is also distributed in Europe, Asia and Latin America and WE tv is distributed in Asia. The International and Other operating segment also includes VOOM HD Holdings LLC (“VOOM HD”).
|
On June 30, 2011, Cablevision Systems Corporation (Cablevision Systems Corporation and its subsidiaries are referred to as “Cablevision”) spun off the Company (the “Distribution”) and the Company became an independent public company. In connection with the Distribution, Cablevision contributed all of the membership interests of Rainbow Media Holdings LLC (“RMH”) to the Company. RMH owned, directly or indirectly, the businesses included in Cablevision’s Rainbow Media segment. On June 30, 2011, Cablevision effected the Distribution of all of AMC Networks’ outstanding common stock. In the Distribution, each holder of Cablevision NY Group (“CNYG”) Class A Common Stock of record on June 16, 2011 received
one
share of AMC Networks Class A Common Stock for every
four
shares of CNYG Class A Common Stock held on the record date, which resulted in the issuance of approximately
57,813,000
shares of Class A Common Stock. Each record holder of CNYG Class B Common Stock received
one
share of AMC Networks Class B Common Stock for every
four
shares of CNYG Class B Common Stock held on the record date, which resulted in the issuance of approximately
13,534,000
shares of Class B Common Stock. Immediately prior to the Distribution, the Company was an indirect wholly-owned subsidiary of Cablevision. Both Cablevision and AMC Networks continue to be controlled by Charles F. Dolan, certain members of his immediate family and certain family related entities (collectively the “Dolan Family”).
As part of the Distribution, the Company incurred
$2,425,000
of debt (the “Distribution Debt”), consisting of
$1,725,000
aggregate principal amount of senior secured term loans and
$700,000
aggregate principal amount of senior unsecured notes (see Note 7). Approximately
$1,063,000
of the proceeds of the Distribution Debt was used to repay all pre-Distribution outstanding Company debt (excluding capital leases), including principal and accrued and unpaid interest to the date of repayment, and, as partial consideration for Cablevision’s contribution of the membership interests in RMH to the Company,
$1,250,000
, net of discount, of Distribution Debt was issued to CSC Holdings, LLC (“CSC Holdings”), a wholly-owned subsidiary of Cablevision, which is reflected as a deemed capital distribution in the consolidated statement of stockholders’ deficiency for the year ended December 31, 2011. CSC Holdings used such Distribution Debt to satisfy and discharge outstanding CSC Holdings debt, which ultimately resulted in such Distribution Debt being held by third party investors.
Basis of Presentation
Principles of Consolidation
The consolidated financial statements include the accounts of AMC Networks and its majority-owned subsidiaries in which a controlling interest is maintained. All intercompany transactions and balances have been eliminated in consolidation.
The Company’s consolidated financial statements for periods prior to the Distribution have been derived from the consolidated financial statements and accounting records of Cablevision and reflect certain assumptions and allocations. The results of operations and cash flows of the Company for those periods could differ from those that might have resulted had the Company been operated autonomously or as an entity independent of Cablevision. The Company’s consolidated financial statements after the Distribution reflect certain revenues and expenses related to transactions with or charges from Cablevision and The Madison Square Garden Company and its subsidiaries (“MSG”) as described in Note 15.
F-9
AMC NETWORKS INC. AND SUBSIDIARIES
NOTES TO CONSOLIDATED FINANCIAL STATEMENTS-(Continued)
(Dollars in thousands, except per share amounts)
Use of Estimates
These consolidated financial statements have been prepared in accordance with U.S. generally accepted accounting principles (“GAAP”). The preparation of financial statements in conformity with GAAP requires management to make estimates and assumptions that affect the reported amounts of assets and liabilities and disclosure of contingent liabilities at the date of the financial statements and the reported amounts of revenues and expenses during the reported period. Actual results could differ from those estimates. Significant estimates and judgments inherent in the preparation of the consolidated financial statements include the useful lives and methodologies used to amortize and assess recoverability of program rights, valuation and recoverability of goodwill and long-lived intangible assets and income taxes.
Reclassifications
Certain reclassifications were made to the prior period amounts to conform to the current period presentation.
Discontinued Operations
The net operating results following the sale of our ownership interests in the Lifeskool and Sportskool video-on-demand services in September and October 2008, respectively, which were recorded under the installment sales method, have been classified as discontinued operations for the years ended
December 31, 2012
and
2011
.
Revenue Recognition
Revenue is recognized when persuasive evidence of a sales arrangement exists, delivery occurs or services are rendered, the sales price is fixed or determinable and collectability is reasonably assured. Revenue recognition for each source of the Company’s revenue is based on the following policies:
Distribution
The Company recognizes revenue from distributors that carry the Company’s programming services under multi-year contracts, commonly referred to as “affiliation agreements.” The programming services are delivered throughout the terms of the agreements and the Company recognizes revenue as programming is provided. Revenue from the licensing of original programming for digital and foreign distribution is recognized upon availability or distribution by the licensee. Revenue from video-on-demand and similar pay-per-view arrangements is recognized as programming is exhibited based on end-customer purchases as reported by the distributor. Revenue derived from other sources is recognized when delivery occurs or the services are rendered.
Advertising
Advertising revenues are recognized when commercials are aired. In most advertising sales arrangements, the Company’s programming businesses guarantee specified viewer ratings for their programming. For these types of transactions, a portion of such revenue is deferred if the guaranteed viewer ratings are not met and is subsequently recognized either when the Company provides the required additional advertising time, the guarantee obligation contractually expires or performance requirements become remote.
Multiple-Element Transactions
For multiple-deliverable revenue arrangements, the Company uses the relative selling price method to allocate the arrangement consideration. Under the relative selling price method, the Company determines its best estimate of selling price in a manner consistent with that used to determine the price to sell the deliverable on a stand-alone basis. For multiple-element deliverable arrangements that include elements other than revenue, if there is objective and reliable evidence of fair value for all elements of accounting, the arrangement consideration is allocated to the separate elements of accounting based on relative fair values. There may be cases in which there is objective and reliable evidence of fair value of undelivered items in an arrangement but no such evidence for the delivered items. In those cases, the total fair value of the undelivered elements, as indicated by vendor-specific objective evidence, is deferred and the remainder of the arrangement consideration is allocated to the delivered elements.
Technical and Operating Expenses
Costs of revenues, including but not limited to programming expense, primarily consisting of amortization and impairments or write-offs of programming rights, such as those for original programming, feature films and licensed series, participation and residual costs, distribution and production related costs and program operating costs, such as origination, transmission, uplinking and encryption, are classified as technical and operating expenses in the consolidated statements of income.
F-10
AMC NETWORKS INC. AND SUBSIDIARIES
NOTES TO CONSOLIDATED FINANCIAL STATEMENTS-(Continued)
(Dollars in thousands, except per share amounts)
Advertising and Distribution Expenses
Advertising costs are charged to expense when incurred and are recorded to selling, general and administrative expenses in the consolidated statements of income. Advertising costs were
$150,734
,
$154,371
and
$105,068
for the years ended
December 31, 2013
,
2012
, and
2011
, respectively. Marketing, distribution and general and administrative costs related to the exploitation of owned original programming are expensed as incurred and are recorded to selling, general and administrative expenses in the consolidated statements of income.
Share-Based Compensation
The Company measures the cost of employee services received in exchange for an award of equity-based instruments based on the grant date fair value of the portion of awards that are ultimately expected to vest. The cost is recognized in earnings over the period during which an employee is required to provide service in exchange for the award using a straight-line amortization method, except for restricted stock units granted to non-employee directors which vest
100%
, and are expensed, at the date of grant.
For periods prior to the Distribution date, Cablevision charged the Company its proportionate share of expenses or benefits related to Cablevision’s employee stock plans and Cablevision’s long-term incentive plans (see Note 15). Share-based compensation expense is included in selling, general and administrative expenses in the consolidated statements of income.
Foreign Currency Transactions
The Company distributes programming in certain territories outside of the U.S. for which it has a limited number of trade receivables denominated in a foreign currency. In addition, in 2013, in connection with the acquisition of Chellomedia, the Company purchased euros to mitigate the foreign currency exchange rate risk in fluctuations in the euro denominated purchase price. Changes in exchange rates with respect to amounts recorded in the Company's consolidated balance sheets related to these non U.S. dollar denominated transactions result in transaction gains and losses that are reflected in the Company's consolidated statements of income as unrealized (based on the applicable period end exchange rates) or realized upon settlement of the transactions. The Company recognized
$7,322
,
$(231)
and
$(130)
of foreign currency transaction gains (losses) for the years ended December 31, 2013, 2012 and 2011, respectively, related to those receivables denominated in a foreign currency and the translation of euro denominated cash and cash equivalents at December 31, 2013 (see Note 19 for further discussion regarding the acquisition of Chellomedia). Such amounts are included in miscellaneous, net in the consolidated statements of income.
Cash and Cash Equivalents
The Company’s cash investments are placed with money market funds and financial institutions that are investment grade as rated by Standard & Poor’s and Moody’s Investors Service. The Company selects money market funds that predominantly invest in marketable, direct obligations issued or guaranteed by the U.S. government or its agencies, commercial paper, fully collateralized repurchase agreements, certificates of deposit, and time deposits.
The Company considers the balance of its investment in funds that substantially hold securities that mature within three months or less from the date the fund purchases these securities to be cash equivalents. The carrying amount of cash and cash equivalents either approximates fair value due to the short-term maturity of these instruments or are at fair value.
Accounts Receivable, Trade
The Company periodically assesses the adequacy of valuation allowances for uncollectible accounts receivable by evaluating the collectability of outstanding receivables and general factors such as length of time individual receivables are past due, historical collection experience, and the economic and competitive environment. As of December 31,
2013
and 2012, the Company had
$48,380
and
$41,983
, respectively, of accounts receivable due in excess of one-year, which are included in other assets in the consolidated balance sheets.
Program Rights
Rights to programming, including feature films and episodic series, acquired under license agreements are stated at the lower of amortized cost or net realizable value. Such licensed rights along with the related obligations are recorded at the contract value when a license agreement is executed, unless there is uncertainty with respect to either cost, acceptability or availability. If such uncertainty exists, those rights and obligations are recorded at the earlier of when the uncertainty is resolved or the license period begins. Costs are amortized to technical and operating expense on a straight-line basis over a period not to exceed the respective license periods.
F-11
AMC NETWORKS INC. AND SUBSIDIARIES
NOTES TO CONSOLIDATED FINANCIAL STATEMENTS-(Continued)
(Dollars in thousands, except per share amounts)
The Company’s owned original programming is primarily produced by production companies, with the remainder produced by the Company. Owned original programming costs, including estimated participation and residual costs, qualifying for capitalization as program rights are amortized to technical and operating expense over their estimated useful lives, commencing upon the first airing, based on attributable revenue for airings to date as a percentage of total projected attributable revenue, or ultimate revenue (film-forecast-computation method). Projected attributable revenue is based on previously generated revenues for similar content in established markets, primarily consisting of distribution and advertising revenues, and projected program usage. Projected program usage is based on the Company’s current expectation of future exhibitions taking into account historical usage of similar content. Projected attributable revenue can change based upon programming market acceptance, levels of distribution and advertising revenue and decisions regarding planned program usage. These calculations require management to make assumptions and to apply judgment regarding revenue and planned usage. Accordingly, the Company periodically reviews revenue estimates and planned usage and revises its assumptions if necessary, which could impact the timing of amortization expense or result in a write-down to net realizable value.
The Company periodically reviews the programming usefulness of its licensed and owned original program rights based on a series of factors, including expected future revenue generation from airings on the Company's networks and other exploitation opportunities, ratings, type and quality of program material, standards and practices, and fitness for exhibition through various forms of distribution. If it is determined that film or other program rights have no future programming usefulness, a write-off of the unamortized cost is recorded in technical and operating expense. See Note 3 for further discussion regarding program rights write-offs.
Long-Lived Assets and Amortizable Intangible Assets
Property and equipment are carried at cost. Equipment under capital leases is recorded at the present value of the total minimum lease payments. Depreciation is calculated on a straight-line basis over the estimated useful lives of the assets or, with respect to equipment under capital leases and leasehold improvements, amortized over the shorter of the lease term or the assets’ useful lives and reported in depreciation and amortization in the consolidated statements of income.
Amortizable intangible assets established in connection with business combinations primarily consist of affiliate relationships. Amortizable intangible assets are amortized on a straight-line basis over their respective estimated useful lives.
The Company reviews its long-lived assets (property and equipment, and intangible assets subject to amortization that arose from acquisitions) for impairment whenever events or circumstances indicate that the carrying amount of an asset may not be recoverable. If the sum of the expected cash flows, undiscounted and without interest, is less than the carrying amount of the asset, an impairment loss is recognized as the amount by which the carrying amount of the asset exceeds its fair value.
Goodwill and Indefinite-Lived Intangible Assets
Goodwill
Goodwill and identifiable intangible assets that have indefinite useful lives are not amortized, but instead are tested annually for impairment during the first quarter (“annual impairment test date”) and upon the occurrence of certain events or substantive changes in circumstances.
The annual goodwill impairment test allows for the option to first assess qualitative factors to determine whether it is more likely than not that the fair value of a reporting unit is less than its carrying amount. An entity may choose to perform the qualitative assessment on none, some or all of its reporting units or an entity may bypass the qualitative assessment for any reporting unit and proceed directly to step one of the quantitative impairment test. If it is determined, on the basis of qualitative factors, that the fair value of a reporting unit is, more likely than not, less than its carrying value, the quantitative impairment test is required. The quantitative impairment test is a two-step process. The first step compares the carrying amount of a reporting unit, including goodwill, with its fair value utilizing an enterprise-value based approach. If the carrying amount of a reporting unit exceeds its fair value, the second step of the goodwill impairment test is performed to measure the amount of the goodwill impairment loss, if any. The second step compares the implied fair value of the reporting unit’s goodwill with the carrying amount of that goodwill. If the carrying amount of the reporting unit’s goodwill exceeds the implied fair value of that goodwill, an impairment loss is recognized in an amount equal to that excess. The implied fair value of goodwill is determined in the same manner as the amount of goodwill that would be recognized in a business combination.
Indefinite-Lived Intangible Assets
Indefinite-lived intangible assets established in connection with business combinations primarily consist of trademarks. The impairment test for identifiable indefinite-lived intangible assets consists of a comparison of the estimated fair value of the intangible asset with its carrying value. If the carrying value exceeds its fair value, an impairment loss is recognized in an amount equal to that excess.
F-12
AMC NETWORKS INC. AND SUBSIDIARIES
NOTES TO CONSOLIDATED FINANCIAL STATEMENTS-(Continued)
(Dollars in thousands, except per share amounts)
Deferred Carriage Fees
Deferred carriage fees represent amounts principally paid to multichannel video distributors to obtain additional subscribers and/or guarantee carriage of certain programming services and are amortized as a reduction of revenue over the period of the related affiliation arrangement (up to
13
years).
Derivative Financial Instruments
The Company’s derivative financial instruments are recorded as either assets or liabilities in the consolidated balance sheet based on their fair values. The Company’s embedded derivative financial instruments are clearly and closely related to the host contracts; therefore, such derivative financial instruments are not accounted for on a stand-alone basis. Changes in the fair values are reported in earnings or other comprehensive income depending on the use of the derivative and whether it qualifies for hedge accounting. Derivative instruments are designated and accounted for as either a hedge of a recognized asset or liability (fair value hedge) or a hedge of a forecasted transaction (cash flow hedge). For derivatives not designated as hedges, changes in fair values are recognized in earnings and included in interest expense, for interest rate swap contracts and miscellaneous, net, for foreign currency contracts. For derivatives designated as effective cash flow hedges, changes in fair values are recognized in other comprehensive income (loss). Changes in fair values related to fair value hedges as well as the ineffective portion of cash flow hedges are recognized in earnings. Changes in the fair value of the underlying hedged item of a fair value hedge are also recognized in earnings. See Note 9 for a further discussion of the Company’s derivative financial instruments.
Income Taxes
The Company’s provision for income taxes is based on current period income, changes in deferred tax assets and liabilities and estimates with regard to the liability for unrecognized tax benefits resulting from uncertain tax positions. Deferred tax assets are evaluated quarterly for expected future realization and reduced by a valuation allowance to the extent management believes it is more likely than not that a portion will not be realized. The Company provides deferred taxes for the outside basis difference for its investment in partnerships. Interest and penalties, if any, associated with uncertain tax positions are included in income tax expense.
Commitments and Contingencies
Liabilities for loss contingencies arising from claims, assessments, litigation, fines and penalties and other sources are recorded when it is probable that a liability has been incurred and the amount of the contingency can be reasonably estimated.
Concentration of Credit Risk
Financial instruments that potentially subject the Company to a concentration of credit risk consist primarily of cash and cash equivalents and trade accounts receivable. Cash is invested in money market funds and bank time deposits. The Company monitors the financial institutions and money market funds where it invests its cash and cash equivalents with diversification among counterparties to mitigate exposure to any single financial institution. The Company’s emphasis is primarily on safety of principal and liquidity and secondarily on maximizing the yield on its investments. As of
December 31, 2013
, one customer accounted for
15%
of consolidated accounts receivable, trade and receivables due in excess of one-year (included in other assets).
Net Income per Share
The consolidated statements of income present basic and diluted net income per share (“EPS”). Basic EPS is based upon net income divided by the weighted-average number of common shares outstanding during the period. Diluted EPS reflects the dilutive effects of AMC Networks stock options (including those held by directors and employees of related parties of the Company) and AMC Networks restricted shares/units (including those held by employees of related parties of the Company).
The following is a reconciliation between basic and diluted weighted average shares outstanding:
|
|
Years Ended December 31,
|
|||||||
|
|
2013
|
2012
|
2011
|
|||||
|
Basic weighted average shares outstanding
|
71,543,000
|
|
70,374,000
|
|
69,283,000
|
|
||
|
Effect of dilution:
|
||||||||
|
Stock options
|
286,000
|
|
783,000
|
|
510,000
|
|
||
|
Restricted shares/units
|
874,000
|
|
1,079,000
|
|
938,000
|
|
||
|
Diluted weighted average shares outstanding
|
72,703,000
|
|
72,236,000
|
|
70,731,000
|
|
||
For the year ended December 31, 2012, approximately
527
restricted shares/units have been excluded from diluted weighted average common shares outstanding since they would have been anti-dilutive.
F-13
AMC NETWORKS INC. AND SUBSIDIARIES
NOTES TO CONSOLIDATED FINANCIAL STATEMENTS-(Continued)
(Dollars in thousands, except per share amounts)
Common Stock of AMC Networks
Each holder of AMC Networks Class A Common Stock has one vote per share while holders of AMC Networks Class B Common Stock have ten votes per share. AMC Networks Class B shares can be converted to AMC Networks Class A Common Stock at anytime with a conversion ratio of one AMC Networks Class A common share for one AMC Networks Class B common share. The AMC Networks Class A stockholders are entitled to elect
25%
of the Company’s Board of Directors. AMC Networks Class B stockholders have the right to elect the remaining members of the Company’s Board of Directors. In addition, AMC Networks Class B stockholders are parties to an agreement which has the effect of causing the voting power of these AMC Networks Class B stockholders to be cast as a block.
|
|
Shares Outstanding
|
||||
|
|
Class A
Common Stock
|
Class B
Common Stock
|
|||
|
Balance at June 30, 2011 (date of Distribution)
|
57,813,267
|
|
13,534,408
|
|
|
|
Employee and non-employee director stock transactions*
|
621,437
|
|
—
|
|
|
|
Balance at December 31, 2011
|
58,434,704
|
|
13,534,408
|
|
|
|
Conversion of Class B common stock to Class A common stock
|
1,750,000
|
|
(1,750,000
|
)
|
|
|
Employee and non-employee director stock transactions*
|
406,326
|
|
—
|
|
|
|
Balance at December 31, 2012
|
60,591,030
|
|
11,784,408
|
|
|
|
Conversion of Class B common stock to Class A common stock
|
300,000
|
|
(300,000
|
)
|
|
|
Employee and non-employee director stock transactions*
|
(96,916
|
)
|
—
|
|
|
|
Balance at December 31, 2013
|
60,794,114
|
|
11,484,408
|
|
|
*Primarily includes issuances of common stock in connection with employee stock option exercises and restricted shares granted to employees, partially offset by shares acquired by the Company in connection with the fulfillment of employees’ statutory tax withholding obligations for applicable income and other employment taxes and forfeited employee restricted shares.
Recently Adopted Accounting Pronouncements
In July 2013, the Financial Accounting Standards Board (“FASB”) issued Accounting Standards Update (“ASU”) No. 2013-10, Derivatives and Hedging (Topic 815): Inclusion of the Fed Funds Effective Swap Rate (or Overnight Index Swap Rate) as a Benchmark Interest Rate for Hedge Accounting Purposes. ASU 2013-10 permits the Fed Funds Effective Swap Rate to be used as a U.S. benchmark interest rate for hedge accounting purposes under Topic 815, in addition to Treasury obligations of the U.S. government and London Interbank Offered Rate. ASU 2013-10 also removes the restriction on using different benchmark rates for similar hedges. The Company adopted ASU 2013-10 prospectively for qualifying new or redesignated hedging relationships entered into on or after July 17, 2013. The adoption of this authoritative guidance did not have any impact on the Company's consolidated financial statements.
In February 2013, the FASB issued ASU No. 2013-02, Comprehensive Income (Topic 220): Reporting of Amounts Reclassified Out of Accumulated Other Comprehensive Income (ASU 2013-02). The amendments in ASU 2013-02 do not change the current requirements for reporting net income or other comprehensive income in financial statements. However, ASU 2013-02 requires an entity to provide information about the amounts reclassified out of accumulated other comprehensive income by component. In addition, an entity is required to present, either on the face of the statement where net income is presented or in the notes, significant amounts reclassified out of accumulated other comprehensive income by the respective line items of net income but only if the amount reclassified is required under GAAP to be reclassified to net income in its entirety in the same reporting period. For other amounts that are not required under GAAP to be reclassified in their entirety to net income, an entity is required to cross-reference to other disclosures required under GAAP that provide additional detail about those amounts. The Company adopted ASU 2013-02 effective January 1, 2013 (see Note 17).
In July 2012, the FASB issued ASU No. 2012-02, Intangibles - Goodwill and Other (Topic 350): Testing Indefinite-Lived Intangible Assets for Impairment (ASU 2012-02), to allow entities to use a qualitative approach to test indefinite-lived intangible assets for impairment. ASU 2012-02 permits an entity to first perform a qualitative assessment to determine whether the existence of events and circumstances indicates that it is more likely than not that the indefinite-lived intangible asset is impaired. If it is concluded that this is the case, an entity is required to determine the fair value of the indefinite-lived intangible asset and perform the quantitative impairment test by comparing the fair value with the carrying amount in accordance with Subtopic 350-30. Otherwise, the quantitative impairment test is not required. The Company adopted ASU 2012-02 effective January 1, 2013. For the annual impairment test as of the end of February 2013, the Company decided to bypass the qualitative approach allowable under this guidance and performed a quantitative assessment of its identifiable indefinite-lived intangible assets (see Note 5).
F-14
AMC NETWORKS INC. AND SUBSIDIARIES
NOTES TO CONSOLIDATED FINANCIAL STATEMENTS-(Continued)
(Dollars in thousands, except per share amounts)
Recently Issued Accounting Pronouncements
In July 2013, the FASB issued ASU No. 2013-11, Income Taxes (Topic 740): Presentation of an Unrecognized Tax Benefit When a Net Operating Loss Carryforward, a Similar Tax Loss, or a Tax Credit Carryforward Exists (ASU 2013-11). ASU 2013-11 states the presentation of an unrecognized tax benefit, or a portion of an unrecognized tax benefit, should be presented in the financial statements as a reduction to a deferred tax asset for a net operating loss carryforward, a similar tax loss, or a tax credit carryforward, except as follows: to the extent a net operating loss carryforward, a similar tax loss, or a tax credit carryforward is not available at the reporting date under the tax law of the applicable jurisdiction to settle any additional income taxes that would result from the disallowance of a tax position or the tax law of the applicable jurisdiction does not require the entity to use, and the entity does not intend to use, the deferred tax asset for such purpose, the unrecognized tax benefit should be presented in the financial statements as a liability and should not be combined with deferred tax assets. ASU 2013-11 is effective in the first quarter of 2014 and early adoption is permitted. The adoption of ASU 2013-11 is not expected to have a material effect on the Company's consolidated financial statements.
Program Rights
Owned original program rights, net of
$100,696
at
December 31, 2013
is included as a component of long-term program rights, net in the consolidated balance sheet. The Company estimates that approximately
94%
of unamortized owned original programming costs, as of
December 31, 2013
, will be amortized within the next three years. The Company expects to amortize
$62,470
of unamortized owned original programming costs during the next twelve months. Program rights write-offs of
$61,005
,
$9,990
and
$18,332
were recorded for the years ended
December 31, 2013
,
2012
and
2011
, respectively.
Program Rights Obligations
Amounts payable subsequent to
December 31, 2013
related to program rights obligations included in the consolidated balance sheet are as follows:
|
Years Ending December 31,
|
|
||
|
2014
|
$
|
210,190
|
|
|
2015
|
169,047
|
|
|
|
2016
|
131,699
|
|
|
|
2017
|
61,453
|
|
|
|
2018
|
43,795
|
|
|
|
Thereafter
|
43,593
|
|
|
|
$
|
659,777
|
|
|
Property and equipment (including equipment under capital leases) consists of the following:
|
|
December 31,
|
Estimated
Useful Lives
|
|||||||
|
|
2013
|
2012
|
|||||||
|
Program, service and test equipment
|
$
|
114,641
|
|
$
|
103,169
|
|
2 to 5 years
|
||
|
Satellite equipment
|
17,443
|
|
16,580
|
|
13 years
|
||||
|
Furniture and fixtures
|
15,803
|
|
15,386
|
|
5 to 8 years
|
||||
|
Transmission equipment
|
41,391
|
|
37,518
|
|
5 years
|
||||
|
Leasehold improvements
|
46,655
|
|
45,321
|
|
Term of lease
|
||||
|
235,933
|
|
217,974
|
|
||||||
|
Accumulated depreciation and amortization
|
(164,865
|
)
|
(147,084
|
)
|
|||||
|
$
|
71,068
|
|
$
|
70,890
|
|
||||
During
2013
, the Company retired
$5,114
of fully depreciated assets that were no longer in use.
Depreciation and amortization expense on property and equipment (including capital leases) amounted to
$23,036
,
$20,891
and
$20,739
, respectively, for the years ended
December 31, 2013
,
2012
and
2011
.
F-15
AMC NETWORKS INC. AND SUBSIDIARIES
NOTES TO CONSOLIDATED FINANCIAL STATEMENTS-(Continued)
(Dollars in thousands, except per share amounts)
At
December 31, 2013
and
2012
, the gross amount of equipment and related accumulated amortization recorded under capital leases were as follows:
|
|
December 31,
|
||||||
|
|
2013
|
2012
|
|||||
|
Satellite equipment
|
$
|
17,443
|
|
$
|
16,580
|
|
|
|
Less accumulated amortization
|
(8,836
|
)
|
(7,474
|
)
|
|||
|
$
|
8,607
|
|
$
|
9,106
|
|
||
The carrying amount of goodwill, by operating segment is as follows:
|
National Networks
|
International and Other
|
Total
|
|||||||||
|
December 31, 2012
|
$
|
78,109
|
|
$
|
1,196
|
|
$
|
79,305
|
|
||
|
Amortization of "second component" goodwill
|
(2,557
|
)
|
—
|
|
(2,557
|
)
|
|||||
|
December 31, 2013
|
$
|
75,552
|
|
$
|
1,196
|
|
$
|
76,748
|
|
||
The reduction of
$2,557
in the carrying amount of goodwill for the National Networks is due to the realization of a tax benefit for the amortization of "second component" goodwill at SundanceTV. Second component goodwill is the amount of tax deductible goodwill in excess of goodwill for financial reporting purposes. In accordance with the authoritative guidance at the time of the SundanceTV acquisition, the tax benefits associated with this excess are applied to first reduce the amount of goodwill, and then other intangible assets for financial reporting purposes, if and when such tax benefits are realized in the Company's tax returns.
There were
no
accumulated impairment losses related to goodwill for any periods as of
December 31, 2013
.
The following table summarizes information relating to the Company’s identifiable intangible assets:
|
|
December 31, 2013
|
Estimated
Useful Lives
|
|||||||||||
|
|
Gross
|
Accumulated
Amortization
|
Net
|
||||||||||
|
Amortizable intangible assets:
|
|||||||||||||
|
Affiliate relationships
|
$
|
243,600
|
|
$
|
(53,971
|
)
|
$
|
189,629
|
|
25 years
|
|||
|
Other amortizable intangible assets
|
644
|
|
(621
|
)
|
23
|
|
4 to 10 years
|
||||||
|
Total amortizable intangible assets
|
244,244
|
|
(54,592
|
)
|
189,652
|
|
|||||||
|
Indefinite-lived intangible assets:
|
|||||||||||||
|
Trademarks
|
19,900
|
|
—
|
|
19,900
|
|
|||||||
|
Total intangible assets
|
$
|
264,144
|
|
$
|
(54,592
|
)
|
$
|
209,552
|
|
||||
|
|
December 31, 2012
|
||||||||||||
|
|
Gross
|
Accumulated
Amortization
|
Net
|
||||||||||
|
Amortizable intangible assets:
|
|||||||||||||
|
Affiliation agreements and affiliate relationships
|
$
|
840,757
|
|
$
|
(623,621
|
)
|
$
|
217,136
|
|
||||
|
Advertiser relationships
|
74,248
|
|
(70,226
|
)
|
4,022
|
|
|||||||
|
Other amortizable intangible assets
|
644
|
|
(519
|
)
|
125
|
|
|||||||
|
Total amortizable intangible assets
|
915,649
|
|
(694,366
|
)
|
221,283
|
|
|||||||
|
Indefinite-lived intangible assets:
|
|||||||||||||
|
Trademarks
|
19,900
|
|
—
|
|
19,900
|
|
|||||||
|
Total intangible assets
|
$
|
935,549
|
|
$
|
(694,366
|
)
|
$
|
241,183
|
|
||||
The gross asset and accumulated amortization amounts related to fully amortized affiliation agreements and advertiser relationships of
$597,157
and
$74,248
, respectively, were removed from the intangible assets balance as of
December 31, 2013
.
F-16
AMC NETWORKS INC. AND SUBSIDIARIES
NOTES TO CONSOLIDATED FINANCIAL STATEMENTS-(Continued)
(Dollars in thousands, except per share amounts)
Aggregate amortization expense for amortizable intangible assets for the years ended
December 31, 2013
,
2012
and
2011
was
$31,631
,
$64,489
and
$79,109
, respectively. Estimated aggregate amortization expense for intangible assets subject to amortization for each of the following five years is:
|
Years Ending December 31,
|
|
||
|
2014
|
$
|
9,759
|
|
|
2015
|
9,746
|
|
|
|
2016
|
9,746
|
|
|
|
2017
|
9,746
|
|
|
|
2018
|
9,746
|
|
|
Annual Impairment Test of Goodwill
Based on the Company’s annual impairment test for goodwill as of the end of February 2013, no impairment charge was required for any of the reporting units. The Company performed a qualitative assessment for each reporting unit other than the SundanceTV reporting unit. The qualitative assessment included, but was not limited to, consideration of the historical significant excesses of the estimated fair value of each reporting unit over its respective carrying value (including allocated goodwill), macroeconomic conditions, industry and market considerations, cost factors and historical and projected cash flows. The Company performed a quantitative assessment for the SundanceTV reporting unit. Additionally, the Company performed an interim impairment test of goodwill in December 2013 for the SundanceTV reporting unit. Based on the interim assessment, the reporting units fair value exceeded its carrying value (including allocated goodwill). In order to evaluate the sensitivity of the estimated fair value calculation, the Company applied a hypothetical 20% decrease in the fair value of the SundanceTV reporting unit. This hypothetical decrease would have no impact on the conclusions reached in the goodwill impairment analysis.
In assessing the recoverability of goodwill, the Company must make assumptions regarding estimated future cash flows and other factors to determine the fair value of the respective assets. These estimates and assumptions could have a significant impact on whether an impairment charge is recognized and also the magnitude of any such charge. Fair value estimates are made at a specific point in time, based on relevant information. These estimates are subjective in nature and involve uncertainties and matters of significant judgments and therefore cannot be determined with precision. Changes in assumptions could significantly affect the estimates. Estimates of fair value for goodwill impairment testing are primarily determined using discounted cash flows and comparable market transactions methods. These valuation methods are based on estimates and assumptions including projected future cash flows, discount rate and determination of appropriate market comparables and determination of whether a premium or discount should be applied to comparables. Projected future cash flows also include assumptions for renewals of affiliation agreements, the projected number of subscribers and the projected average rates per basic and viewing subscribers and growth in fixed price contractual arrangements used to determine affiliation fee revenue, access to program rights and the cost of such program rights, amount of programming time that is advertiser supported, number of advertising spots available and the sell through rates for those spots, average fee per advertising spot and operating margins, among other assumptions. If these estimates or material related assumptions change in the future, we may be required to record impairment charges related to goodwill.
Annual Impairment Test of Identifiable Indefinite-Lived Intangible Assets
Based on the Company's annual impairment test for identifiable indefinite-lived intangible assets as of the end of February 2013, and interim test as of December 2013, no impairment charge was required. The Company’s indefinite-lived intangible assets relate to SundanceTV trademarks, which were valued using a relief-from-royalty method in which the expected benefits are valued by discounting estimated royalty revenue over projected revenues covered by the trademarks. In order to evaluate the sensitivity of the fair value calculations for the Company’s identifiable indefinite-lived intangible assets, the Company applied a hypothetical
20%
decrease to the estimated fair value of the identifiable indefinite-lived intangible assets. This hypothetical decrease in estimated fair value would not result in an impairment.
Significant judgments inherent in estimating the fair value of indefinite-lived intangible assets include the selection of appropriate discount and royalty rates, estimating the amount and timing of estimated future cash flows and identification of appropriate continuing growth rate assumptions. The discount rates used in the analysis are intended to reflect the risk inherent in the projected future cash flows generated by the respective intangible assets.
F-17
AMC NETWORKS INC. AND SUBSIDIARIES
NOTES TO CONSOLIDATED FINANCIAL STATEMENTS-(Continued)
(Dollars in thousands, except per share amounts)
Accrued liabilities consist of the following:
|
December 31, 2013
|
December 31, 2012
|
||||||
|
Interest
|
$
|
27,770
|
|
$
|
28,250
|
|
|
|
Employee related costs
|
88,512
|
|
75,620
|
|
|||
|
Income taxes payable
|
—
|
|
116,740
|
|
|||
|
Other accrued expenses
|
15,008
|
|
11,852
|
|
|||
|
Total accrued liabilities
|
$
|
131,290
|
|
$
|
232,462
|
|
|
Long-term debt consists of:
|
December 31, 2013
|
December 31, 2012
|
||||||
|
Senior Secured Credit Facility:
|
|||||||
|
Term loan A facility
|
$
|
880,000
|
|
$
|
880,000
|
|
|
|
Senior Notes:
|
|||||||
|
7.75% Notes due July 2021
|
700,000
|
|
700,000
|
|
|||
|
4.75% Notes due December 2022
|
600,000
|
|
600,000
|
|
|||
|
Total long-term debt
|
2,180,000
|
|
2,180,000
|
|
|||
|
Unamortized discount
|
(22,817
|
)
|
(26,685
|
)
|
|||
|
Long-term debt, net
|
$
|
2,157,183
|
|
$
|
2,153,315
|
|
|
Amended and Restated Senior Secured Credit Facility
On December 16, 2013 (the “Refinancing Date”), AMC Networks and its subsidiary, AMC Network Entertainment LLC (the “Borrowers”), and certain of AMC Networks’ subsidiaries, as restricted subsidiaries, entered into an amended and restated credit agreement, which amends and restates AMC Networks’ prior credit agreement dated June 30, 2011 in its entirety.
The amended and restated credit agreement provides the Borrowers with senior secured credit facilities consisting of (a) an initial
$880,000
term loan A that was used by AMC Networks to retire the then outstanding term loan A facility provided under the June 30, 2011 original credit agreement, (b) a subsequent
$600,000
term loan A (collectively, the “Term Loan A Facility”)which was drawn on January 31, 2014 upon the satisfaction of certain conditions related to consummation of AMC Networks’ acquisition of substantially all of Chellomedia (see Note 19 for further discussion regarding the acquisition of Chellomedia), and (c) a
$500,000
revolving credit facility (together with the Term Loan A Facility, collectively, the “Credit Facility.”) The Term Loan A Facility matures on
December 16, 2019
. The revolving credit facility matures on
December 16, 2018
.
The revolving credit facility was not drawn upon on the Refinancing Date and remained undrawn at December 31, 2013. Total undrawn revolver commitments are available to be drawn for general corporate purposes of the Company.
In connection with the Credit Facility, AMC Networks incurred deferred financing costs of
$12,669
as of December 31, 2013 and an additional amount of
$9,006
was incurred on January 31, 2014 in connection with the subsequent
$600,000
term loan A facility, which are amortized to interest expense, utilizing the effective interest method, over the term of each respective component of the Credit Facility.
Borrowings under the Credit Facility bear interest at a floating rate, which at the option of the Borrowers may be either (a) a base rate plus an additional rate ranging from
0.50%
to
1.25%
per annum (determined based on a cash flow ratio) (the “Base Rate”), or (b) a Eurodollar rate plus an additional rate ranging from
1.50%
to
2.25%
per annum (determined based on a cash flow ratio) (the “Eurodollar Rate”), provided that for the six month period following the Refinancing Date, the additional rate used in calculating both floating rates is subject to a floor of (i)
1.00%
per annum for borrowings bearing the Base Rate, and (ii)
2.00%
per annum for borrowings bearing the Eurodollar Rate. At December 31, 2013, the interest rate on the Term Loan A Facility was
2.17%
, reflecting a Eurodollar Rate plus the additional rate as described herein.
F-18
AMC NETWORKS INC. AND SUBSIDIARIES
NOTES TO CONSOLIDATED FINANCIAL STATEMENTS-(Continued)
(Dollars in thousands, except per share amounts)
The Credit Facility requires the Borrowers to pay a commitment fee of between
0.25%
and
0.50%
(determined based on a cash flow ratio) in respect of the average daily unused commitments under the revolving credit facility. The Borrowers also are required to pay customary letter of credit fees, as well as fronting fees, to banks that issue letters of credit pursuant to the Credit Facility.
All obligations under the Credit Facility are guaranteed, jointly and severally, by certain of AMC Networks’ existing and future domestic restricted subsidiaries in accordance with the Credit Facility. All obligations under the Credit Facility, including the guarantees of those obligations, are secured by certain assets of the Borrowers and certain of its restricted subsidiaries.
Borrowings under the Credit Facility may be voluntarily prepaid without premium and penalty at any time. The Term Loan A Facility also provides for various mandatory prepayments, including with the proceeds from certain dispositions of property and borrowings. The Term Loan A Facility is required to be repaid in quarterly installments of
$18,500
from March 31, 2015 through December 31, 2015,
$37,000
beginning March 31, 2016 through December 31, 2016,
$55,500
beginning March 31, 2017 through December 31, 2017,
$74,000
beginning March 31, 2018 through September 30, 2019 and
$518,000
on December 16, 2019, which is the Term Loan A Facility maturity date. Any amounts outstanding under the revolving credit facility are due at maturity on December 16, 2018.
The Credit Facility contains certain affirmative and negative covenants applicable to the Borrowers and certain of their restricted subsidiaries. These include restrictions on the Borrowers’ and certain of their restricted subsidiaries ability to incur indebtedness, make investments in entities that are not restricted subsidiaries, place liens on assets, enter into certain affiliate transactions and make certain restricted payments, including restrictions on AMC Networks’ ability to pay dividends on its common stock. The Credit Facility also requires the Borrowers to comply with the following financial covenants: (i) a maximum ratio of net debt to annual operating cash flow (each defined in the Credit Facility) of
6.50
:1 initially, and decreasing to
6.00
:1 on and after January 1, 2016; and (ii) a minimum ratio of annual operating cash flow to annual total interest expense (as defined in the Credit Facility) of
2.50
:1.
AMC Networks was in compliance with all financial covenants under the Credit Facility as of
December 31, 2013
.
Original Credit Facility
On June 30, 2011, AMC Networks, as borrower, and substantially all of its subsidiaries, as restricted subsidiaries, entered into a credit agreement (the "Original Credit Agreement"). Under the terms of such credit agreement, AMC Networks was provided with senior secured credit facilities consisting of a
$1,130,000
term loan A facility, a
$595,000
term loan B facility and a
$500,000
revolving credit facility (collectively, the "Original Credit Facility"). The term loan A facility and the term loan B facility were discounted
$5,650
and
$12,986
, respectively, upon original issuance. On June 30, 2011, approximately
$577,000
of the Original Credit Facility debt was issued to CSC Holdings as partial consideration for the transfer to AMC Networks of the RMH businesses in June 2011 in connection with the Distribution of AMC Networks from Cablevision, which was consummated on June 30, 2011. The issuance of debt to CSC Holdings was reflected as a deemed capital distribution in the consolidated statement of stockholders’ deficiency for the year ended December 31, 2011. CSC Holdings used such debt to satisfy and discharge outstanding CSC Holdings debt.
On December 16, 2013, we used the proceeds from the borrowings under the Term Loan A Facility to repay the outstanding amount under the term loan A facility of the Original Credit Facility. Additionally, we recorded a write-off of deferred financing costs of
$4,007
for the year ended December 31, 2013, which includes certain unamortized deferred financing costs associated with the Original Credit Facility of
$3,719
and certain financing costs relating to the Credit Facility of
$288
as well as a a loss on extinguishment of debt of
$1,087
for the year ended December 31, 2013 related to a portion of the unamortized discount associated with the Original Credit Facility that was written off.
On December 17, 2012, AMC Networks issued
$600,000
in aggregate principal amount of its 4.75% Notes (see "4.75% Senior Notes due 2022" discussion below) and used the net proceeds of the offering to repay the outstanding amount under the term loan B facility. In connection with this repayment, the Company recorded a write-off of the related unamortized deferred financing costs and a loss on extinguishment of debt of
$898
and
$10,774
, respectively, in the consolidated statement of income for the year ended December 31, 2012. Additionally, the Company recorded an unrealized loss of
$8,725
on the related interest rate swap contracts previously designated as cash flow hedges of a portion of the term loan B facility which is included in interest expense in the consolidated statement of income for the year ended December 31, 2012.
F-19
AMC NETWORKS INC. AND SUBSIDIARIES
NOTES TO CONSOLIDATED FINANCIAL STATEMENTS-(Continued)
(Dollars in thousands, except per share amounts)
7.75% Senior Notes due 2021
On June 30, 2011, AMC Networks issued
$700,000
in aggregate principal amount of its
7.75%
senior notes, net of an original issue discount of
$14,000
, due
July 15, 2021
(the “7.75% Notes”) to CSC Holdings, as partial consideration for the transfer to AMC Networks of the RMH businesses in June 2011, which is reflected as a deemed capital distribution in the consolidated statement of stockholders’ deficiency for the year ended December 31, 2011. CSC Holdings used the Company’s 7.75% Notes to satisfy and discharge outstanding CSC Holdings debt. The recipients of the 7.75% Notes or their affiliates then offered the 7.75% Notes to investors, through an offering memorandum dated June 22, 2011, which ultimately resulted in the 7.75% Notes being held by third party investors.
The 7.75% Notes were issued under an indenture dated as of June 30, 2011 (the “7.75% Notes Indenture”).
In connection with the issuance of the 7.75% Notes, AMC Networks incurred deferred financing costs of
$1,533
, which are being amortized, using the effective interest method, to interest expense over the term of the 7.75% Notes.
Interest on the 7.75% Notes accrues at the rate of 7.75% per annum and is payable semi-annually in arrears on January 15 and July 15 of each year.
The 7.75% Notes may be redeemed, in whole or in part, at any time on or after
July 15, 2016
, at a redemption price equal to
103.875%
of the principal amount thereof (plus accrued and unpaid interest thereon, if any, to the date of such redemption), declining annually to
100%
of the principal amount thereof (plus accrued and unpaid interest thereon, if any, to the date of such redemption) beginning on
July 15, 2019
.
In addition, if AMC Networks experiences a Change of Control (as defined in the 7.75% Notes Indenture), the holders of the 7.75% Notes may require AMC Networks to repurchase for cash all or a portion of their 7.75% Notes at a price equal to
101%
of the principal amount thereof (plus accrued and unpaid interest thereon, if any, to the date of such repurchase).
The 7.75% Notes are guaranteed on a senior unsecured basis by certain of AMC Networks’ existing and future domestic restricted subsidiaries, in accordance with the 7.75% Notes Indenture. The guarantees under the 7.75% Notes are full and unconditional and joint and several.
AMC Networks is a holding company and has no independent assets or operations of its own, the guarantees under the 7.75% Notes are full and unconditional and joint and several, and any subsidiaries of AMC Networks other than the restricted subsidiaries are minor. There are no restrictions on the ability of AMC Networks or any of the restricted subsidiaries to obtain funds from its subsidiaries by dividend or loan.
The 7.75% Notes Indenture contains certain affirmative and negative covenants applicable to AMC Networks and its restricted subsidiaries including restrictions on their ability to incur additional indebtedness, consummate certain assets sales, make investments in entities that are not restricted subsidiaries, create liens on their assets, enter into certain affiliate transactions and make certain restricted payments, including restrictions on AMC Networks’ ability to pay dividends on, or repurchase, its common stock.
4.75% Senior Notes due 2022
On December 17, 2012, AMC Networks issued
$600,000
in aggregate principal amount of its
4.75%
senior notes, net of an issuance discount of
$10,500
, due
December 15, 2022
(the “4.75% Notes”). AMC Networks used the net proceeds of this offering to repay the outstanding amount under its term loan B facility of approximately
$587,600
, with the remaining proceeds used for general corporate purposes. The 4.75% Notes were issued pursuant to an indenture dated as of December 17, 2012 (the “Base Indenture,” and together with the First Supplemental Indenture, the “4.75% Notes Indenture”).
In connection with the issuance of the 4.75% Notes, AMC Networks incurred deferred financing costs of
$1,393
, which are being amortized, using the effective interest method, to interest expense over the term of the 4.75% Notes.
Interest on the 4.75% Notes accrues at the rate of 4.75% per annum and is payable semi-annually in arrears on June 15 and December 15 of each year.
The 4.75% Notes may be redeemed, in whole or in part, at any time on or after
December 15, 2017
, at a redemption price equal to
102.375%
of the principal amount thereof (plus accrued and unpaid interest thereon, if any, to the date of such redemption), declining annually to
100%
of the principal amount thereof (plus accrued and unpaid interest thereon, if any, to the date of such redemption) beginning on
December 15, 2020
.
In addition, if AMC Networks experiences a Change of Control (as defined in the 4.75% Notes Indenture), the holders of the 4.75% Notes may require AMC Networks to repurchase for cash all or a portion of their 4.75% Notes at a price equal to
101%
of the principal amount thereof (plus accrued and unpaid interest thereon, if any, to the date of such repurchase).
F-20
AMC NETWORKS INC. AND SUBSIDIARIES
NOTES TO CONSOLIDATED FINANCIAL STATEMENTS-(Continued)
(Dollars in thousands, except per share amounts)
The 4.75% Notes are guaranteed on a senior unsecured basis by certain of AMC Networks’ existing and future domestic restricted subsidiaries, in accordance with the 4.75% Notes Indenture. The guarantees under the 4.75% Notes are full and unconditional and joint and several.
AMC Networks is a holding company and has no independent assets or operations of its own, the guarantees under the 4.75% Notes are full and unconditional and joint and several, and any subsidiaries of AMC Networks other than the restricted subsidiaries are minor. There are no restrictions on the ability of AMC Networks or any of the restricted subsidiaries to obtain funds from its subsidiaries by dividend or loan.
The 4.75% Notes Indenture contains certain affirmative and negative covenants applicable to AMC Networks and its restricted subsidiaries including restrictions on their ability to incur additional indebtedness, consummate certain assets sales, make investments in entities that are not restricted subsidiaries, create liens on their assets, enter into certain affiliate transactions and make certain restricted payments, including restrictions on AMC Networks’ ability to pay dividends on, or repurchase, its common stock.
Summary of Debt Maturities
Total amounts payable by the Company under its various debt obligations (excluding capital leases) outstanding as of
December 31, 2013
are as follows:
|
Years Ending December 31,
|
|
||
|
2014
|
$
|
—
|
|
|
2015
|
44,000
|
|
|
|
2016
|
88,000
|
|
|
|
2017
|
132,000
|
|
|
|
2018
|
176,000
|
|
|
|
Thereafter
|
1,740,000
|
|
|
On January 31, 2014, in connection with the consummation of the Company's acquisition of substantially all of Chellomedia, the Company incurred an additional term loan A borrowing of
$600,000
. This additional borrowing increases the future amounts payable as follows:
$30,000
in 2015,
$60,000
in 2016,
$90,000
in 2017,
$120,000
in 2018 and
$300,000
thereafter.
RNS Senior Notes and Senior Subordinated Notes Redemption
RNS Senior Notes
In April 2011, Rainbow National Services LLC (“RNS”), a wholly-owned indirect subsidiary of the Company, issued a notice of redemption to holders of its 8 3/4% senior notes due September 2012. In connection therewith, on May 13, 2011 RNS redeemed
100%
of the outstanding senior notes at a redemption price equal to
100%
of the principal amount of the notes of
$300,000
, plus accrued and unpaid interest of
$5,250
to the redemption date. In order to fund the May 13, 2011 redemption, the Company borrowed
$300,000
under its
$300,000
revolving credit facility which existed prior to June 30, 2011. The Company used cash on hand to fund the payment of accrued and unpaid interest of
$5,250
. In connection with the redemption, the Company recorded a write-off of the related unamortized deferred financing costs and a loss on extinguishment of debt of
$1,186
and
$350
, respectively, in the consolidated statement of income for the year ended December 31, 2011.
RNS Senior Subordinated Notes (tender prices per note in dollars)
On June 15, 2011, RNS announced that it commenced a cash tender offer (the “Tender Offer”) for all of its outstanding
$325,000
aggregate principal amount 10 3/8% senior subordinated notes due 2014 (the “RNS Senior Subordinated Notes”) for total consideration of
$1,039.58
per
$1,000
principal amount of notes tendered for purchase, consisting of tender offer consideration of
$1,029.58
per
$1,000
principal amount of notes plus an early tender premium of
$10
per
$1,000
principal amount of notes. The Tender Offer was made in connection with the Distribution of AMC Networks by Cablevision.
In connection with the Tender Offer, on June 30, 2011 RNS redeemed
100%
of the outstanding
$325,000
aggregate principal amount of the RNS Senior Subordinated Notes. The Company used proceeds from borrowings under the Credit Facility to fund the redemption, and payment of fees and accrued and unpaid interest of
$11,146
. Tender premiums aggregating
$12,864
, along with accretion to the principal amount and other transaction costs of
$1,321
have been recorded in loss on extinguishment of debt in the consolidated statement of income for the year ended December 31, 2011. The related unamortized deferred financing costs aggregating approximately
$2,455
were written off and recorded in write-off of deferred financing costs in the consolidated statement of income for the year ended December 31, 2011.
F-21
AMC NETWORKS INC. AND SUBSIDIARIES
NOTES TO CONSOLIDATED FINANCIAL STATEMENTS-(Continued)
(Dollars in thousands, except per share amounts)
RNS Credit Facility Repayment
Outstanding borrowings under the RNS term loan facility and revolving credit facility were
$425,000
and
$50,000
, respectively, at December 31, 2010. In connection with the Distribution, RNS repaid amounts then outstanding under its RNS credit facility at June 30, 2011 of
$412,500
under its term A loan facility and
$300,000
under its revolving credit facility which aggregated
$713,785
, including accrued and unpaid interest and fees to the repayment date of June 30, 2011. The Company used proceeds from borrowings under the Credit Facility to fund the repayment. The related unamortized deferred financing costs aggregating approximately
$2,062
were written off and recorded in write-off of deferred financing costs in the consolidated statement of income for the year ended December 31, 2011.
The fair value hierarchy is based on inputs to valuation techniques that are used to measure fair value that are either observable or unobservable. Observable inputs reflect assumptions market participants would use in pricing an asset or liability based on market data obtained from independent sources while unobservable inputs reflect a reporting entity’s pricing based upon their own market assumptions. The fair value hierarchy consists of the following three levels:
|
•
|
Level I—Quoted prices for identical instruments in active markets.
|
|
•
|
Level II—Quoted prices for similar instruments in active markets; quoted prices for identical or similar instruments in markets that are not active; and model-derived valuations whose inputs are observable or whose significant value drivers are observable.
|
|
•
|
Level III—Instruments whose significant value drivers are unobservable.
|
The following table presents for each of these hierarchy levels, the Company’s financial assets and liabilities that are measured at fair value on a recurring basis at
December 31, 2013
and
December 31, 2012
:
|
Level I
|
Level II
|
Level III
|
Total
|
|||||||||||||
|
At December 31, 2013:
|
||||||||||||||||
|
Assets:
|
||||||||||||||||
|
Cash equivalents
(a)
|
$
|
63,029
|
|
$
|
—
|
|
$
|
—
|
|
$
|
63,029
|
|
||||
|
Foreign currency option contracts
|
$
|
—
|
|
$
|
2,577
|
|
$
|
—
|
|
$
|
2,577
|
|
||||
|
Liabilities:
|
||||||||||||||||
|
Interest rate swap contracts
|
$
|
—
|
|
$
|
12,713
|
|
$
|
—
|
|
$
|
12,713
|
|
||||
|
At December 31, 2012:
|
||||||||||||||||
|
Assets:
|
||||||||||||||||
|
Cash equivalents
(a)
|
$
|
487,900
|
|
$
|
—
|
|
$
|
—
|
|
$
|
487,900
|
|
||||
|
Liabilities:
|
||||||||||||||||
|
Interest rate swap contracts
|
$
|
—
|
|
$
|
22,137
|
|
$
|
—
|
|
$
|
22,137
|
|
||||
|
(a)
|
Represents the Company’s investment in funds that invest primarily in money market securities.
|
The Company’s cash equivalents are classified within Level I of the fair value hierarchy because they are valued using quoted market prices.
The Company’s foreign currency option contracts and interest rate swap contracts (discussed in Note 9 below) are classified within Level II of the fair value hierarchy and their fair values are determined based on a market approach valuation technique that uses readily observable market parameters and the consideration of counterparty risk.
F-22
AMC NETWORKS INC. AND SUBSIDIARIES
NOTES TO CONSOLIDATED FINANCIAL STATEMENTS-(Continued)
(Dollars in thousands, except per share amounts)
Credit Facility Debt and Senior Notes
The fair values of each of the Company’s debt instruments are based on quoted market prices for the same or similar issues or on the current rates offered to the Company for instruments of the same remaining maturities.
The carrying values and estimated fair values of the Company’s financial instruments, excluding those that are carried at fair value in the consolidated balance sheets are summarized as follows:
|
|
December 31, 2013
|
||||||
|
|
Carrying
Amount
|
Estimated
Fair Value
|
|||||
|
Debt instruments:
|
|||||||
|
Term loan A facility
|
$
|
878,315
|
|
$
|
876,700
|
|
|
|
7.75% Notes due July 2021
|
688,497
|
|
787,500
|
|
|||
|
4.75% Notes due December 2022
|
590,371
|
|
571,500
|
|
|||
|
$
|
2,157,183
|
|
$
|
2,235,700
|
|
||
|
|
December 31, 2012
|
||||||
|
|
Carrying
Amount
|
Estimated
Fair Value
|
|||||
|
Debt instruments:
|
|||||||
|
Term loan A facility
|
$
|
876,358
|
|
$
|
876,154
|
|
|
|
7.75% Notes due July 2021
|
687,423
|
|
801,500
|
|
|||
|
4.75% Notes due December 2022
|
589,534
|
|
603,000
|
|
|||
|
$
|
2,153,315
|
|
$
|
2,280,654
|
|
||
Fair value estimates related to the Company’s debt instruments presented above are made at a specific point in time, based on relevant market information and information about the financial instrument. These estimates are subjective in nature and involve uncertainties and matters of significant judgments and therefore cannot be determined with precision. Changes in assumptions could significantly affect the estimates.
Interest Rate Risk
To manage interest rate risk, the Company enters into interest rate swap contracts to adjust the amount of total debt that is subject to variable interest rates. Such contracts effectively fix the borrowing rates on floating rate debt to limit the exposure against the risk of rising interest rates. The Company does not enter into interest rate swap contracts for speculative or trading purposes and it has only entered into interest rate swap contracts with financial institutions that it believes are creditworthy counterparties. The Company monitors the financial institutions that are counterparties to its interest rate swap contracts and to the extent possible diversifies its swap contracts among various counterparties to mitigate exposure to any single financial institution.
The Company’s risk management objective and strategy with respect to interest rate swap contracts is to protect the Company against adverse fluctuations in interest rates by reducing its exposure to variability in cash flows relating to interest payments on a portion of its outstanding debt. The Company is meeting its objective by hedging the risk of changes in its cash flows (interest payments) attributable to changes in the LIBOR index rate, the designated benchmark interest rate being hedged (the “hedged risk”), on an amount of the Company’s debt principal equal to the then-outstanding swap notional. The forecasted interest payments are deemed to be probable of occurring.
In 2011, the Company entered into primarily amortizing interest rate swap contracts to effectively fix borrowing rates on a substantial portion of the Company’s floating rate debt. These contracts were designated as cash flow hedges for accounting and tax purposes (see below). The Company assesses, both at the hedge’s inception and on an ongoing basis, hedge effectiveness based on the overall changes in the fair value of the interest rate swap contracts. Hedge effectiveness of the interest rate swap contracts is based on a hypothetical derivative methodology. Any ineffective portion of the interest rate swap contracts is recorded in current-period earnings.
F-23
AMC NETWORKS INC. AND SUBSIDIARIES
NOTES TO CONSOLIDATED FINANCIAL STATEMENTS-(Continued)
(Dollars in thousands, except per share amounts)
As discussed in Note 7, in connection with the repayment of the term loan B facility in December 2012, the Company recorded an unrealized loss of
$8,725
related to the interest rate swap contracts previously designated as cash flow hedges of a portion of the term loan B facility which was reclassified from accumulated other comprehensive loss to interest expense in the consolidated statement of income for the year ended December 31, 2012 as the related interest rate swap contracts no longer qualified for hedge accounting. Subsequent changes in fair values related to these interest rate swap contracts are recognized in earnings and included in interest expense. The interest rate swap contracts outstanding hedging the Company's floating rate debt on the Term Loan A Facility continue to be designated and qualify as effective interest rate swap cash flow hedges.
As of
December 31, 2013
, the Company had interest rate swap contracts outstanding with notional amounts aggregating
$700,250
, which consists of interest rate swap contracts with notional amounts of
$500,250
that are designated as cash flow hedges and interest rate swap contracts with notional amounts of
$200,000
that are not designated as hedging instruments. The Company’s outstanding interest rate swap contracts have varying maturities ranging from September 2015 to July 2017. At
December 31, 2013
, the Company’s interest rate swap contracts designated as cash flow hedges were highly effective, in all material respects.
Foreign Currency Exchange Rate Risk
To manage foreign currency exchange rate risk, the Company enters into foreign currency contracts from time to time with financial institutions to limit the exposure to fluctuations in foreign currency exchange rates. The Company does not enter into foreign currency contracts for speculative or trading purposes.
Historically, the Company's exposure to foreign currency fluctuations has been limited to certain trade receivables from the distribution of our programming in certain territories outside of the U.S. that are denominated in a foreign currency.
During 2013, in order to mitigate the foreign currency exchange rate risk in fluctuations in the euro denominated purchase price of the pending acquisition of Chellomedia, the Company purchased euros and entered into foreign currency option contracts. As of December 31, 2013, cash and cash equivalents included
€250,000
and prepaid expense and other current assets included
$2,577
representing the fair value of foreign currency option contracts with notional amounts aggregating
€125,000
.
F-24
AMC NETWORKS INC. AND SUBSIDIARIES
NOTES TO CONSOLIDATED FINANCIAL STATEMENTS-(Continued)
(Dollars in thousands, except per share amounts)
The fair values of the Company's derivative financial instruments included in the consolidated balance sheets are as follows:
|
|
Asset Derivatives
|
Liability Derivatives
|
|||||||||||||||||
|
|
Balance Sheet
Location |
Fair Value
|
Balance Sheet
Location
|
Fair Value
|
|||||||||||||||
|
December 31,
|
December 31,
|
||||||||||||||||||
|
|
2013
|
2012
|
|
2013
|
2012
|
||||||||||||||
|
Derivatives designated as hedging instruments:
|
|||||||||||||||||||
|
Interest rate swap contracts
|
$
|
—
|
|
$
|
—
|
|
Other liabilities
|
$
|
7,136
|
|
$
|
13,398
|
|
||||||
|
Derivatives not designated as hedging instruments:
|
|||||||||||||||||||
|
Interest rate swap contracts
|
—
|
|
—
|
|
Other liabilities
|
5,577
|
|
8,739
|
|
||||||||||
|
Foreign currency option contracts
|
Prepaid expenses and other current assets
|
2,577
|
|
—
|
|
—
|
|
—
|
|
||||||||||
|
Total derivatives
|
$
|
2,577
|
|
$
|
—
|
|
$
|
12,713
|
|
$
|
22,137
|
|
|||||||
The amount of the gains and losses related to the Company's derivative financial instruments designated as hedging instruments are as follows:
|
|
Amount of Gain or (Loss)
Recognized in Other
Comprehensive Income(“OCI”) on Derivatives
(Effective Portion)
|
Location of Gain or (Loss)Reclassified from
Accumulated OCI
into Earnings (Effective Portion)
|
Amount of Gain or (Loss)
Reclassified from
Accumulated OCI
into Earnings
(Effective Portion)(a)
|
||||||||||||||
|
Years Ended December 31,
|
Years Ended December 31,
|
||||||||||||||||
|
|
2013
|
2012
|
|
2013
|
2012
|
||||||||||||
|
Derivatives in cash flow hedging relationships:
|
|||||||||||||||||
|
Interest rate swap contracts
|
$
|
(1,018
|
)
|
$
|
(12,663
|
)
|
Interest expense
|
$
|
(7,280
|
)
|
$
|
(18,356
|
)
|
||||
|
(a)
|
There were
no
gains or losses recognized in earnings related to any ineffective portion of the hedging relationship or related to any amount excluded from the assessment of hedge effectiveness for the years ended
December 31, 2013
and
2012
.
|
The amount of the gains and losses related to the Company's derivative financial instruments not designated as hedging instruments are as follows:
|
|
Location of Gain (Loss) Recognized in Earnings on Derivatives
|
Amount of Gain (Loss) Recognized in Earnings on Derivatives
|
|||||||
|
Years Ended December 31,
|
|||||||||
|
|
|
2013
|
2012
|
||||||
|
Derivatives not designated as hedging relationships:
|
|||||||||
|
Interest rate swap contracts
|
Interest expense
|
$
|
569
|
|
$
|
(14
|
)
|
||
|
Foreign currency option contracts
|
Miscellaneous, net
|
1,151
|
|
—
|
|
||||
|
Total
|
$
|
1,720
|
|
$
|
(14
|
)
|
|||
F-25
AMC NETWORKS INC. AND SUBSIDIARIES
NOTES TO CONSOLIDATED FINANCIAL STATEMENTS-(Continued)
(Dollars in thousands, except per share amounts)
Operating Leases
Certain subsidiaries of the Company lease office space and equipment under long-term non-cancelable operating lease agreements which expire at various dates through
2020
. The leases generally provide for fixed annual rentals plus certain other costs or credits. Costs associated with such operating leases are recognized on a straight-line basis over the initial lease term. The difference between rent expense and rent paid is recorded as deferred rent. Rent expense for the years ended
December 31, 2013
,
2012
and
2011
amounted to
$15,640
,
$14,814
and
$13,312
, respectively.
The future minimum annual payments for the Company’s operating leases related to continuing operations (with initial or remaining terms in excess of one year) during the next five years from
January 1, 2014
through
December 31, 2018
and thereafter, at rates now in force are as follows:
|
2014
|
$
|
17,739
|
|
|
2015
|
17,895
|
|
|
|
2016
|
17,866
|
|
|
|
2017
|
11,007
|
|
|
|
2018
|
5,059
|
|
|
|
Thereafter
|
7,184
|
|
|
Capital Leases
Future minimum capital lease payments as of
December 31, 2013
are as follows:
|
2014
|
$
|
3,036
|
|
|
2015
|
3,036
|
|
|
|
2016
|
3,036
|
|
|
|
2017
|
3,036
|
|
|
|
2018
|
3,036
|
|
|
|
Thereafter
|
3,896
|
|
|
|
Total minimum lease payments
|
19,076
|
|
|
|
Less amount representing interest (at 9.3%-10.4%)
|
(4,971
|
)
|
|
|
Present value of net minimum future capital lease payments
|
14,105
|
|
|
|
Less principal portion of current installments
|
(1,718
|
)
|
|
|
Long-term portion of obligations under capital leases
|
$
|
12,387
|
|
F-26
AMC NETWORKS INC. AND SUBSIDIARIES
NOTES TO CONSOLIDATED FINANCIAL STATEMENTS-(Continued)
(Dollars in thousands, except per share amounts)
Income tax expense attributable to continuing operations consists of the following components:
|
|
Years Ended December 31,
|
||||||||||
|
|
2013
|
2012
|
2011
|
||||||||
|
Current (benefit) expense:
|
|||||||||||
|
Federal
|
$
|
(10,137
|
)
|
$
|
148,495
|
|
$
|
2,333
|
|
||
|
State and foreign
|
7,507
|
|
18,836
|
|
6,489
|
|
|||||
|
(2,630
|
)
|
167,331
|
|
8,822
|
|
||||||
|
Deferred (benefit) expense:
|
|||||||||||
|
Federal
|
154,299
|
|
(77,360
|
)
|
62,131
|
|
|||||
|
State
|
17,205
|
|
(11,154
|
)
|
7,029
|
|
|||||
|
171,504
|
|
(88,514
|
)
|
69,160
|
|
||||||
|
Tax expense relating to uncertain tax positions, including accrued interest
|
9,967
|
|
7,241
|
|
6,266
|
|
|||||
|
Income tax expense
|
$
|
178,841
|
|
$
|
86,058
|
|
$
|
84,248
|
|
||
Income tax expense attributable to discontinued operations is classified as current income tax expense for the year ended December 31, 2012 and deferred income tax expense for the year ended December 31, 2011.
A reconciliation of the federal statutory income tax rate to the effective income tax rate is as follows:
|
|
Years Ended December 31,
|
|||||||
|
|
2013
|
2012
|
2011
|
|||||
|
U.S. federal statutory income tax rate
|
35
|
%
|
35
|
%
|
35
|
%
|
||
|
State and local income taxes, net of federal benefit
|
2
|
|
2
|
|
4
|
|
||
|
Changes in the valuation allowance
|
1
|
|
(1
|
)
|
(1
|
)
|
||
|
Domestic production activity deduction
|
(1
|
)
|
—
|
|
—
|
|
||
|
Tax expense relating to uncertain tax positions, including accrued interest, net of deferred tax benefits
|
2
|
|
2
|
|
2
|
|
||
|
Other
|
(1
|
)
|
1
|
|
—
|
|
||
|
Effective income tax rate
|
38
|
%
|
39
|
%
|
40
|
%
|
||
F-27
AMC NETWORKS INC. AND SUBSIDIARIES
NOTES TO CONSOLIDATED FINANCIAL STATEMENTS-(Continued)
(Dollars in thousands, except per share amounts)
The tax effects of temporary differences that give rise to significant components of deferred tax assets or liabilities at
December 31, 2013
and
2012
are as follows:
|
|
December 31,
|
||||||
|
|
2013
|
2012
|
|||||
|
Deferred Tax Asset (Liability)
|
|||||||
|
Current
|
|||||||
|
NOLs and tax credit carry forwards
|
$
|
5,130
|
|
$
|
687
|
|
|
|
Compensation and benefit plans
|
13,299
|
|
10,230
|
|
|||
|
Allowance for doubtful accounts
|
316
|
|
392
|
|
|||
|
Deferred litigation settlement proceeds
|
—
|
|
114,210
|
|
|||
|
Other liabilities
|
1,280
|
|
1
|
|
|||
|
Deferred tax asset
|
20,025
|
|
125,520
|
|
|||
|
Valuation allowance
|
(2,623
|
)
|
(4,117
|
)
|
|||
|
Net deferred tax asset, current
|
17,402
|
|
121,403
|
|
|||
|
Other assets
|
(1,734
|
)
|
—
|
|
|||
|
Deferred tax liability, current
|
(1,734
|
)
|
—
|
|
|||
|
Net deferred tax asset, current
|
15,668
|
|
121,403
|
|
|||
|
Noncurrent
|
|||||||
|
NOLs and tax credit carry forwards
|
26,413
|
|
25,625
|
|
|||
|
Compensation and benefit plans
|
18,713
|
|
13,768
|
|
|||
|
Fixed assets and intangible assets
|
—
|
|
7,480
|
|
|||
|
Interest rate swap contracts
|
3,577
|
|
4,971
|
|
|||
|
Other liabilities
|
7,281
|
|
7,537
|
|
|||
|
Deferred tax asset
|
55,984
|
|
59,381
|
|
|||
|
Valuation allowance
|
(7,335
|
)
|
(1,947
|
)
|
|||
|
Net deferred tax asset, noncurrent
|
48,649
|
|
57,434
|
|
|||
|
Prepaid liabilities
|
(825
|
)
|
(668
|
)
|
|||
|
Fixed assets and intangible assets
|
(8,595
|
)
|
—
|
|
|||
|
Investments in partnerships
|
(131,116
|
)
|
(85,907
|
)
|
|||
|
Other assets
|
(3,388
|
)
|
—
|
|
|||
|
Deferred tax liability, noncurrent
|
(143,924
|
)
|
(86,575
|
)
|
|||
|
Net deferred tax liability, noncurrent
|
(95,275
|
)
|
(29,141
|
)
|
|||
|
Total net deferred tax (liability) asset
|
$
|
(79,607
|
)
|
$
|
92,262
|
|
|
At
December 31, 2013
, the Company had
foreign tax credit carry forwards of approximately
$23,000
, expiring on various
dates from
2014
through
2023
, subject to a valuation allowance of approximately
$2,000
. As a result of the Chellomedia acquisition, the Company is in the process of evaluating its foreign tax credit carry forwards.
For the year ended December 31, 2013, excess tax benefits of
$4,975
relating to share-based compensation awards and
$1,613
relating to amortization of tax deductible second component goodwill were realized as a reduction in tax liability (as determined on a 'with-and-without' approach).
At December 31, 2013, the liability for uncertain tax positions was
$26,333
, excluding the related accrued interest liability of
$3,109
and deferred tax assets of
$7,760
. All of such unrecognized tax benefits, if recognized, would reduce the Company's income tax expense and effective tax rate.
F-28
AMC NETWORKS INC. AND SUBSIDIARIES
NOTES TO CONSOLIDATED FINANCIAL STATEMENTS-(Continued)
(Dollars in thousands, except per share amounts)
A reconciliation of the beginning to ending amount of the liability for uncertain tax positions (excluding related accrued interest and deferred tax benefit) is as follows:
|
Balance at December 31, 2012
|
$
|
16,721
|
|
|
Increases related to prior year tax positions
|
6,802
|
|
|
|
Increases related to current year tax positions
|
4,907
|
|
|
|
Decreases due to settlements of prior year tax positions
|
(1,810
|
)
|
|
|
Decreases due to payments related to prior year tax positions
|
(287
|
)
|
|
|
Balance at December 31, 2013
|
$
|
26,333
|
|
Interest expense (net of the related deferred tax benefit) of
$796
offset by interest income of
$746
, related to the settlements of prior year tax positions, was recognized during the year ended December 31, 2013 and is included in income tax expense in the consolidated statement of income. At December 31, 2013 and 2012, the liability for uncertain tax positions and related accrued interest noted above are included in other liabilities in the consolidated balance sheets.
Under the Company's Tax Disaffiliation Agreement with Cablevision, Cablevision is liable for all income taxes of the Company for periods prior to the Distribution except for New York City Unincorporated Business Tax. The City of New York is currently auditing the Company's Unincorporated Business Tax Returns for the years 2008 through 2011. The Internal Revenue Service is currently auditing the Company’s U.S. Corporate Income Tax Return for 2011.
For periods prior to the Distribution, the Company’s taxable income or loss was included in the consolidated federal and certain state and local income tax returns of Cablevision. Consequently, income tax expense for such periods is based on the taxable income of the Company on a separate tax return basis. The reductions in taxes payable during such periods realized by the Company through the utilization of Cablevision’s NOLs or by Cablevision through the utilization of the Company’s NOLs or credits are reflected as deemed capital contributions or distributions, respectively, in the periods of utilization and are adjusted for true-ups in subsequent periods. Accordingly, deemed capital contributions, net of
$36,867
was recorded in the consolidated statement of stockholders’ deficiency for the year ended December 31, 2011 to reflect the estimated NOLs of Cablevision used by the Company. In addition, deemed capital distributions, net of
$2,942
and
$2,586
were recorded in the consolidated statements of stockholders’ deficiency for the years ended December 31, 2012 and 2011, respectively, to reflect true-ups as of the Distribution date for utilization of Cablevision's NOLs and for adjustments to liabilities for uncertain tax positions and net deferred tax assets as a result of the Distribution and the estimated New York City Unincorporated Business Tax credits of the Company used by Cablevision, respectively.
As a result of the Distribution, the following adjustments to the deferred tax assets and liabilities were recorded as a deemed capital distribution, net in the consolidated statement of stockholders’ deficiency for the year ended December 31, 2011: (i) a decrease in the net deferred tax assets of
$2,302
to reflect the lower stand-alone estimated applicable corporate tax rates, (ii) a decrease in the deferred tax asset for share-based awards of
$7,292
to eliminate the portion of the deferred tax asset relating to share-based compensation expense attributable to Cablevision corporate employees that was allocated to the Company prior to the Distribution, and (iii) a decrease in the deferred tax asset of
$1,314
to reflect that certain compensation awards are no longer anticipated to be realized as a tax deduction pursuant to Internal Revenue Code Section 162(m). In addition, as of the Distribution date, liabilities for uncertain tax positions of
$56,409
, accrued interest of
$1,284
, and the related deferred tax assets of
$2,358
were eliminated and recorded as a deemed capital contribution, net in the consolidated statement of stockholders’ deficiency as the liability for such uncertain tax positions became an obligation of Cablevision.
Pursuant to the Company's Tax Disaffiliation Agreement with Cablevision, the Company is required to indemnify Cablevision for losses and taxes of Cablevision relating to the Distribution or any related debt exchanges resulting from the breach of certain covenants, including as a result of certain acquisitions of our stock or assets or as a result of modification or repayment of certain related debt in a manner inconsistent with the private letter ruling or letter ruling request.
F-29
AMC NETWORKS INC. AND SUBSIDIARIES
NOTES TO CONSOLIDATED FINANCIAL STATEMENTS-(Continued)
(Dollars in thousands, except per share amounts)
Commitments
The Company has purchase obligations which consist primarily of program rights obligations that have not yet met the criteria to be recorded in the balance sheet. Future purchase obligations at December 31,
2013
, are as follows:
$122,560
in 2014,
$24,963
in years 2015-2016,
$14,355
in years 2017-2018 and
$11,938
thereafter. The Company has guarantee commitments which consists primarily of a guarantee of payments to a production service company for certain production related costs. Guarantees at December 31,
2013
, are
$60,179
in 2014. The Company has contract obligations which primarily represents participation obligations and deferred carriage fees payable to distributors. Contract obligations at December 31,
2013
, are as follows:
$33,549
in 2014,
$12,471
in years 2015-2016,
$3,165
in years 2017-2018 and
$2,560
thereafter.
Legal Matters
On April 15, 2011, Thomas C. Dolan, a director of the Company and Executive Vice President, Strategy and Development, in the Office of the Chairman and a director of Cablevision, filed a lawsuit against Cablevision and RMH in New York Supreme Court. The lawsuit raises compensation-related claims (seeking approximately
$11,000
) related to events in 2005. The matter is being handled under the direction of an independent committee of the board of directors of Cablevision. In connection with the Distribution Agreement, Cablevision indemnified the Company and RMH against any liabilities and expenses related to this lawsuit. Based on the indemnification and Cablevision’s and the Company’s assessment of this possible loss contingency, no provision has been made for this matter in the consolidated financial statements.
In addition to the matters discussed above, the Company is party to various lawsuits and claims in the ordinary course of business. Although the outcome of these other matters cannot be predicted with certainty and the impact of the final resolution of these other matters on the Company’s results of operations in a particular subsequent reporting period is not known, management does not believe that the resolution of these matters will have a material adverse effect on the financial position of the Company or the ability of the Company to meet its financial obligations as they become due.
In connection with the Distribution, the Company adopted the AMC Networks Inc. 2011 Employee Stock Plan (the “2011 Employee Stock Plan”), the AMC Networks Inc. 2011 Stock Plan for Non-Employee Directors (the “2011 Non-Employee Director Plan”) and the AMC Networks Inc. 2011 Cash Incentive Plan (the “2011 Cash Incentive Plan”). All Plans were amended and restated and approved by the Company’s shareholders on June 5, 2012.
Equity Plans
Under the 2011 Employee Stock Plan, the Company is authorized to grant incentive stock options, non-qualified stock options, restricted shares, restricted stock units, stock appreciation rights ("SARs") and other equity-based awards. The Company may grant awards for up to
5,000,000
shares of AMC Networks Class A Common Stock (subject to certain adjustments). Equity-based awards granted under the 2011 Employee Stock Plan must be granted with an exercise price of not less than the fair market value of a share of AMC Networks Class A Common Stock on the date of grant and must expire no later than
10
years from the date of grant. The terms and conditions of awards granted under the 2011 Employee Stock Plan, including vesting and exercisability, are determined by the Compensation Committee of the Board of Directors (“Compensation Committee”) and may include terms or conditions based upon performance criteria. Restricted share awards that were awarded under the 2011 Employee Stock Plan are subject to three-year cliff vesting, and certain restricted share awards are also subject to certain performance conditions. Restricted share awards that were awarded by the Company to its employees will settle in shares of the Company's Class A Common Stock (either from treasury or with newly issued shares), or, at the option of the Compensation Committee, in cash. As of
December 31, 2013
, there are
2,065,728
share awards available for future grant under the 2011 Employee Stock Plan.
Under the 2011 Non-Employee Director Plan, the Company is authorized to grant non-qualified stock options, restricted stock units, restricted shares, SARs and other equity-based awards. The Company may grant awards for up to
465,000
shares of AMC Networks Class A Common Stock (subject to certain adjustments). Stock options under the 2011 Non-Employee Director Plan must be granted with an exercise price of not less than the fair market value of a share of AMC Networks Class A Common Stock on the date of grant and must expire no later than
10
years from the date of grant. The terms and conditions of awards granted under the 2011 Non-Employee Director Plan, including vesting and exercisability, are determined by the Compensation Committee. Unless otherwise provided in an applicable award agreement, stock options granted under this plan will be fully vested and exercisable, and restricted stock units granted under this plan will be fully vested, upon the date of grant and will settle in shares of the Company's Class A Common Stock (either from treasury or with newly issued shares), or, at the option of the Compensation Committee, in cash, on the first business day after ninety days from the date the director's service on the Board of Directors ceases or, if earlier, upon the director's death. In 2013, 2012 and 2011, the Company granted
21,712
,
30,393
and
38,951
restricted stock
F-30
AMC NETWORKS INC. AND SUBSIDIARIES
NOTES TO CONSOLIDATED FINANCIAL STATEMENTS-(Continued)
(Dollars in thousands, except per share amounts)
units, respectively, with weighted-average fair market values of
$62.69
,
$39.81
and
$31.06
per share, respectively, to non-employee directors under the 2011 Non-Employee Director Plan, which vested on the grant date. As of
December 31, 2013
, there are
294,417
share awards available for future grant under the 2011 Non-Employee Director Plan.
Stock Option Award Activity
The following table summarizes activity relating to Company employees who held AMC Networks stock options for the year ended
December 31, 2013
:
|
|
Shares Under Option
|
Weighted
Average
Exercise Price
Per Share
|
Weighted
Average
Contractual
Term
(in years)
|
Aggregate
Intrinsic
Value(a)
|
|||||||||||
|
|
Time
Vesting
Options
|
Performance
Vesting
Options
|
|||||||||||||
|
Balance, December 31, 2012
|
129,151
|
|
2,500
|
|
$
|
10.59
|
|
2.05
|
$
|
5,123
|
|
||||
|
Exercised
|
(102,550
|
)
|
(2,500
|
)
|
$
|
9.38
|
|
||||||||
|
Balance, December 31, 2013
|
26,601
|
|
—
|
|
$
|
15.33
|
|
2.07
|
$
|
1,404
|
|
||||
|
Options exercisable at December 31, 2013
|
26,061
|
|
—
|
|
$
|
15.33
|
|
2.07
|
$
|
1,404
|
|
||||
|
Options expected to vest in the future
|
—
|
|
—
|
|
n/a
|
|
n/a
|
n/a
|
|
||||||
|
(a)
|
The aggregate intrinsic value is calculated as the difference between (i) the exercise price of the underlying award and (ii) the quoted price of AMC Networks Class A Common Stock on
December 31, 2013
or
December 31, 2012
, as indicated.
|
In addition, the following table summarizes activity relating to Cablevision and MSG employees who held AMC Networks stock options for the year ended
December 31, 2013
:
|
|
Shares Under Option
|
Weighted
Average
Exercise Price
Per Share
|
Weighted
Average
Contractual
Term
(in years)
|
Aggregate
Intrinsic
Value(a)
|
|||||||||||
|
|
Time
Vesting
Options
|
Performance
Vesting
Options
|
|||||||||||||
|
Balance, December 31, 2012
|
326,376
|
|
35,600
|
|
$
|
16.57
|
|
3.42
|
$
|
11,918
|
|
||||
|
Exercised
|
(40,468
|
)
|
—
|
|
$
|
19.09
|
|
||||||||
|
Balance, December 31, 2013
|
285,908
|
|
35,600
|
|
$
|
16.26
|
|
2.27
|
$
|
16,671
|
|
||||
|
Options exercisable at December 31, 2013
|
260,908
|
|
35,600
|
|
$
|
15.23
|
|
2.03
|
$
|
15,680
|
|
||||
|
Options expected to vest in the future
|
25,000
|
|
—
|
|
$
|
28.48
|
|
5.06
|
$
|
991
|
|
||||
|
(a)
|
The aggregate intrinsic value is calculated as the difference between (i) the exercise price of the underlying award and (ii) the quoted price of AMC Networks Class A Common Stock on
December 31, 2013
or
December 31, 2012
, as indicated, and
December 31, 2013
in the case of the stock options expected to vest in the future.
|
F-31
AMC NETWORKS INC. AND SUBSIDIARIES
NOTES TO CONSOLIDATED FINANCIAL STATEMENTS-(Continued)
(Dollars in thousands, except per share amounts)
Restricted Share Award Activity
The following table summarizes activity relating to Company employees who held AMC Networks restricted shares for the year ended
December 31, 2013
:
|
Number of
Restricted
Shares
|
Number of
Performance
Restricted
Shares
|
Weighted
Average Fair
Value Per
Share at Date
of Grant
|
|||||||
|
Unvested award balance, December 31, 2012
|
433,030
|
|
205,193
|
|
$
|
34.16
|
|
||
|
Vested
|
(129,758
|
)
|
—
|
|
$
|
25.41
|
|
||
|
Forfeited
|
(14,665
|
)
|
—
|
|
$
|
36.60
|
|
||
|
Unvested award balance, December 31, 2013
|
288,607
|
|
205,193
|
|
$
|
36.38
|
|
||
The following table summarizes activity relating to Cablevision employees who held AMC Networks restricted shares for the year ended
December 31, 2013
:
|
Number of
Restricted
Shares
|
Number of
Performance
Restricted
Shares
|
Weighted
Average Fair
Value Per
Share at Date
of Grant
|
|||||||
|
Unvested award balance, December 31, 2012
|
470,361
|
|
135,175
|
|
$
|
30.41
|
|
||
|
Vested
|
(294,755
|
)
|
(76,025
|
)
|
$
|
25.53
|
|
||
|
Forfeited
|
(23,335
|
)
|
—
|
|
$
|
37.87
|
|
||
|
Unvested award balance, December 31, 2013
|
152,271
|
|
59,150
|
|
$
|
38.13
|
|
||
During the year ended
December 31, 2013
,
500,538
shares of AMC Networks Class A Common Stock previously issued to employees of AMC Networks and Cablevision vested. In connection with the employees’ satisfaction of the statutory minimum tax withholding obligations for the applicable income and other employment taxes,
204,434
of these shares, with an aggregate value of
$12,135
, were surrendered to the Company. These acquired shares, as well as
38,000
forfeited unvested restricted shares have been classified as treasury stock.
Restricted Share Unit Activity
The following table summarizes activity relating to Company employees who held AMC Networks restricted share units for the year ended
December 31, 2013
:
|
Number of
Restricted
Share Units
|
Number of
Performance
Restricted
Share Units
|
Weighted
Average Fair
Value Per
Share Unit at Date
of Grant
|
|||||||
|
Unvested award balance, December 31, 2012
|
337,634
|
|
97,915
|
|
$
|
45.01
|
|
||
|
Granted
|
294,470
|
|
82,227
|
|
$
|
59.57
|
|
||
|
Forfeited
|
(27,271
|
)
|
—
|
|
$
|
50.33
|
|
||
|
Unvested award balance, December 31, 2013
|
604,833
|
|
180,142
|
|
$
|
51.84
|
|
||
F-32
AMC NETWORKS INC. AND SUBSIDIARIES
NOTES TO CONSOLIDATED FINANCIAL STATEMENTS-(Continued)
(Dollars in thousands, except per share amounts)
Share-based Compensation Expense
The following table presents the share-based compensation expense reduced for forfeitures recorded during the years ended December 31,
2013
,
2012
and
2011
. Forfeitures were estimated based on historical experience. To the extent actual results of forfeitures differ from those estimates, such amounts will be recorded as an adjustment in the period the estimates are revised.
|
Years ended December 31,
|
|||||||||||
|
2013
|
2012
|
2011
|
|||||||||
|
Restricted shares/units (including performance based shares/units)
|
$
|
20,299
|
|
$
|
17,133
|
|
$
|
15,173
|
|
||
|
Stock options (including performance based options)
|
—
|
|
69
|
|
839
|
|
|||||
|
Stock appreciation rights
|
—
|
|
—
|
|
(423
|
)
|
|||||
|
Share-based compensation expense
|
$
|
20,299
|
|
$
|
17,202
|
|
$
|
15,589
|
|
||
For periods prior to the Distribution, the Company’s share-based compensation includes amounts related to Company employees participating in the Cablevision equity awards programs, as well as amounts related to Cablevision corporate employees and non-employee directors to the extent allocated to the Company. For periods after the Distribution, the Company no longer receives an allocation of share-based compensation expense for Cablevision corporate employees and non-employee directors, including expense related to the Company’s Executive Chairman with respect to his participation in the Cablevision equity awards program (since he remained an executive officer of Cablevision). The Company does not record any share-based compensation expense for AMC Networks stock options or restricted shares held by Cablevision and MSG employees, however such stock options or restricted shares do have a dilutive effect on the Company’s net income per share. The Company records share-based compensation expense for Cablevision and MSG stock options and restricted shares/units held by the Company’s employees.
Share-based compensation expense is recognized in the consolidated statements of income as part of selling, general and administrative expenses. As of
December 31, 2013
, there was
$26,134
of total unrecognized share-based compensation costs related to Company employees who held unvested AMC Networks and Cablevision restricted shares/units. The unrecognized compensation cost is expected to be recognized over a weighted-average remaining period of approximately
1.8
years. There were no costs related to share-based compensation that were capitalized.
The Company receives income tax deductions related to restricted share/units, stock options or other equity awards granted to its employees by the Company, Cablevision or MSG, but does not receive income tax deductions for Company equity awards held by Cablevision or MSG employees. The Company uses the 'with-and-without' approach to determine the recognition and measurement of excess tax benefits.
Cash flows resulting from excess tax benefits are classified as cash flows from financing activities. Excess tax benefits are realized tax benefits from tax deductions for options exercised and restricted shares issued in excess of the deferred tax asset attributable to stock compensation costs for such awards. Excess tax benefits of
$4,975
and
$7,484
were recorded for the years ended
December 31, 2013
and 2012.
Treatment of Previously Outstanding Share-Based Payment Awards After the AMC Networks Distribution
In connection with the Distribution and as provided for in Cablevision’s equity plans, each stock option and SAR outstanding at the effective date of the Distribution became two stock options or two SARs, as the case may be: (i) one with respect to Cablevision’s CNYG Class A Common Stock and (ii) one with respect to the Company’s Class A Common Stock. The existing exercise price of each stock option/SAR was allocated between the existing Cablevision stock option/SAR and the Company’s new stock option/SAR based on the weighted average trading price of Cablevision’s and the Company’s common shares for the 10 trading days subsequent to the Distribution and the underlying share amount took into account the
1
:
4
distribution ratio. As a result of this adjustment, approximately
73.59%
of the pre-Distribution exercise price of stock options/SARs was allocated to the Cablevision stock options/SARs and approximately
26.41%
was allocated to the Company’s new stock options/SARs.
On February 9, 2010, Cablevision distributed to its stockholders all of the outstanding common stock of MSG (the “MSG Distribution”). As a result of the Distribution and the MSG Distribution, certain employees of MSG hold stock options, SARs and restricted stock with respect to AMC Networks Class A Common Stock. In addition, as a result of the MSG Distribution, certain employees of the Company held MSG stock options, SARs and restricted shares with respect to MSG Class A Common Stock as of the MSG Distribution date.
F-33
AMC NETWORKS INC. AND SUBSIDIARIES
NOTES TO CONSOLIDATED FINANCIAL STATEMENTS-(Continued)
(Dollars in thousands, except per share amounts)
Long-Term Incentive Plans
Under the terms of the 2011 Cash Incentive Plan, the Company is authorized to grant a cash award to certain employees. The terms and conditions of such awards are determined by the Compensation Committee of the Company’s Board of Directors, may include the achievement of certain performance criteria and may extend for a period not to exceed ten years.
In connection with the long-term incentive awards outstanding, the Company recorded expense of
$17,516
,
$11,001
and
$11,392
for the years ended
December 31, 2013
,
2012
and
2011
respectively. Accrued liabilities for long-term incentive awards of
$29,047
and
$20,673
are included in accrued liabilities and other liabilities in the consolidated balance sheets at
December 31, 2013
and
2012
, respectively. These liabilities include certain performance-based awards for which the performance criteria had not yet been met as of
December 31, 2013
as such awards are based on achievement of certain performance criteria through December 31, 2014 or 2015. The Company has accrued the pro-rata amount earned that it currently believes will ultimately be paid based upon the performance criteria established for these performance-based awards. If the Company subsequently determines that the performance criteria for such awards is not probable of being achieved, the Company would reverse the accrual in respect of such award at that time.
Through June 30, 2011, the date of the Distribution, certain employees of the Company participated in Cablevision’s non-contributory, qualified defined benefit cash balance pension plan (the “Cash Balance Pension Plan”) and non-contributory non-qualified defined benefit excess cash balance plan (the “Excess Cash Balance Plan”). In connection with the Cash Balance Pension Plan and the Excess Cash Balance Plan (collectively, the “Pension Plans”), the Company was charged by Cablevision for credits made into an account established for each participant. Such credits were based upon a percentage of eligible base pay and a market-based rate of return.
Since the date of the Distribution, certain employees of the Company participated in Cablevision’s qualified defined contribution 401(k) savings plan (the “401(k) Plan”) and non-qualified excess savings plan (the “Excess Savings Plan”). Under the 401(k) Plan, a tax-qualified retirement savings plan, participating Company employees may contribute into their plan accounts a percentage of their eligible pay on a before-tax basis as well as a percentage of their eligible pay on an after-tax basis. The Company makes matching contributions on behalf of participating employees in accordance with the terms of the 401(k) Plan. In addition to the matching contribution, the Company will make a discretionary year-end contribution to employee 401(k) Plan accounts equal to
4%
of eligible compensation, subject to certain conditions.
The Excess Savings Plan is a non-qualified deferred compensation plan that operates in conjunction with the 401(k) Plan. The Company provides a matching contribution to the Excess Savings Plan similar to the 401(k) Plan.
Effective June 28, 2013, the Company established the AMC Networks 401(k) Savings Plan and the AMC Networks Excess Savings Plan (the "AMC Networks Plans"). As of June 28, 2013, employees of the Company who were eligible participants have ceased participation in the Cablevision 401(k) Plan and Excess Savings Plan and participate in the AMC Networks Plans.
Total expense related to all benefit plans was
$10,371
,
$8,929
and
$7,865
for the years ended
December 31, 2013
,
2012
and
2011
, respectively. The Company does not provide postretirement benefits for any of its employees.
Members of the Dolan Family, for purposes of Section 13(d) of the Securities Exchange Act of 1934, as amended, including trusts for the benefit of the Dolan Family, collectively beneficially own
all
of the Company’s outstanding Class B Common Stock and own less than
2%
of the Company’s outstanding Class A Common Stock. Such shares of the Company’s Class A Common Stock and Class B Common Stock, collectively, represent approximately
66%
of the aggregate voting power of the Company’s outstanding common stock. Members of the Dolan Family are also the controlling stockholders of both Cablevision and MSG.
In connection with the Distribution, the Company entered into various agreements with Cablevision, such as a distribution agreement, a tax disaffiliation agreement, a transition services agreement, an employee matters agreement and certain related party arrangements. These agreements govern certain of the Company’s relationships with Cablevision subsequent to the Distribution and provide for the allocation of employee benefits, taxes and certain other liabilities and obligations attributable to periods prior to the Distribution. These agreements also include arrangements with respect to transition services and a number of on-going commercial relationships. The distribution agreement includes an agreement that the Company and Cablevision agree to provide each other with indemnities with respect to liabilities arising out of the businesses Cablevision transferred to the Company.
F-34
AMC NETWORKS INC. AND SUBSIDIARIES
NOTES TO CONSOLIDATED FINANCIAL STATEMENTS-(Continued)
(Dollars in thousands, except per share amounts)
The Company provides services to and receives services from Cablevision and MSG. Until the Distribution date, the consolidated financial statements of the Company reflect the application of certain cost allocation policies of Cablevision. Management believes that these allocations were made on a reasonable basis. However, it is not practicable to determine whether the charged amounts represent amounts that might have been incurred on a stand-alone basis, including as a separate independent publicly owned company, as there are no company-specific or comparable industry benchmarks with which to make such estimates. Further, as many of these transactions are conducted between subsidiaries under common control of the Dolan Family, amounts charged for these services may not represent amounts that might have been received or incurred if the transactions were based upon arm’s-length negotiations. Through the Distribution date, the Company paid Cablevision a management fee pursuant to a consulting agreement between Cablevision and certain of the Company’s subsidiaries. The consulting agreement was terminated on the Distribution date and the Company did not replace it.
Revenues, net
The Company recorded affiliation fee revenues earned under affiliation agreements with subsidiaries of Cablevision. In addition, AMC Networks Broadcasting & Technology has entered into agreements with MSG to provide various transponder, technical and support services through 2020. Revenues, net from related parties amounted to
$31,188
,
$32,195
, and
$31,885
for the years ended
December 31, 2013
,
2012
and
2011
, respectively.
Technical and Operating
The Company and its related parties routinely enter into transactions with each other in the ordinary course of business. Such transactions include various studio production services the Company provides to MSG for which the charges are reflected as a reduction of the related expenses. In addition, certain related parties provide various digital media and administrative support functions which primarily include salaries and facilities costs charged to the Company. Furthermore, through December 31, 2011, employees of the Company participated in health and welfare plans sponsored by Cablevision. Health and welfare benefit costs have generally been charged by Cablevision based upon the proportionate number of participants in the plans.
Amounts charged to the Company, included in technical and operating expenses, pursuant to transactions with its related parties amounted to
$324
,
$620
and
$5,040
for the years ended
December 31, 2013
,
2012
and
2011
, respectively.
Selling, General and Administrative
Amounts charged (credited) to the Company, included in selling, general and administrative expenses, pursuant to the transition services agreement and for other transactions, including management fees allocated by Cablevision for periods through the Distribution date, with its related parties amounted to
$2,721
,
$(206)
and
$57,004
for the years ended
December 31, 2013
,
2012
and
2011
, respectively. Amounts charged to the Company for the year ended December 31, 2012 are net of shared legal fees charged to Cablevision associated with the DISH Network Contract Dispute. See DISH Network Proceeds Allocation discussion below.
Through the Distribution date, general and administrative costs, including costs of maintaining corporate headquarters, facilities and common support functions (such as executive management, human resources, legal, finance, tax, accounting, audit, treasury, risk management, strategic planning, information technology, etc.), have been charged to the Company by Cablevision. Additionally, the Company charges MSG for a portion of the Company’s leased facilities utilized by MSG which such cost reimbursements are recorded as a reduction to selling, general and administrative expenses. Subsequent to the Distribution date, amounts charged by Cablevision represent charges pursuant to a transition services agreement. See also Transition Services Agreement discussion below.
Through the Distribution date, the Company paid Cablevision a management fee pursuant to a consulting agreement between Cablevision and certain of the Company’s subsidiaries. The consulting agreement was terminated on the Distribution date and the Company did not replace it.
Transition Services Agreement
In connection with the Distribution, Cablevision and AMC Networks entered into a Transition Services Agreement under which, in exchange for the fees specified in such agreement, Cablevision agreed to provide transition services with regard to such areas as accounting, information systems, risk management and employee services, compensation and benefits. Under the Transition Services Agreement, AMC Networks also provides certain services to Cablevision and MSG on behalf of Cablevision.
Under the Transition Services Agreement, AMC Networks provides transition services to Cablevision and MSG with regard to its information technology systems that AMC Networks, Cablevision and MSG may share. AMC Networks and Cablevision, as parties receiving services under the agreement, have agreed to indemnify the party providing services for losses incurred by such party that arise out of or are otherwise in connection with the provision by such party of services under the agreement, except to the extent that such losses result from the providing party’s gross negligence, willful misconduct or breach of its obligations
F-35
AMC NETWORKS INC. AND SUBSIDIARIES
NOTES TO CONSOLIDATED FINANCIAL STATEMENTS-(Continued)
(Dollars in thousands, except per share amounts)
under the agreement. Similarly, each party providing services under the agreement has agreed to indemnify the party receiving services for losses incurred by such party that arise out of or are otherwise in connection with the indemnifying party’s provision of services under the agreement if such losses result from the providing party’s gross negligence, willful misconduct or breach of its obligations under the agreement.
Share-based Compensation and Long-Term Incentive Plans Expense
Cablevision charged the Company through the Distribution date its proportionate share of expenses or benefits related to Cablevision’s employee stock plans and Cablevision’s long-term incentive plans. Such amounts are included in selling, general and administrative expenses in the consolidated statement of income. As the obligations related to stock option and restricted share awards under the Cablevision stock plans are satisfied by Cablevision, the allocation to the Company of its proportionate share of the related expenses through June 30, 2011 is reflected as capital contributions in the consolidated statement of stockholders’ deficiency.
Treatment of Cablevision Long-Term Incentive Plan Awards After the Distribution
In 2011 and 2010, Cablevision granted three-year performance awards to certain executive officers and other members of the Company’s management under Cablevision’s 2006 Cash Incentive Plan. The Cablevision performance metrics in the awards granted in 2010 to certain executive officers and other employees of the Company were replaced with Company performance metrics. The awards granted to certain executive officers and other employees of the Company in March 2011 under the Cablevision 2006 Cash Incentive Plan were replaced in July 2011 by awards granted under the Company’s 2011 Cash Incentive Plan, and the Cablevision performance metrics related to those awards were replaced with Company performance metrics. Amounts applicable to employees of the Company are and will continue to be reflected as liabilities, based on achievement of certain performance criteria as noted above, in the Company’s consolidated balance sheets until settled.
DISH Network Proceeds Allocation
As noted above, in connection with the Distribution, the Company entered into various agreements with Cablevision, including an agreement between AMC Networks and Rainbow Programming Holdings LLC, a wholly-owned subsidiary of AMC Networks,(collectively, the “AMC Parties”) and CSC Holdings, LLC (“CSC Holdings”), a wholly-owned subsidiary of Cablevision, with respect to the lawsuit entitled VOOM HD Holdings LLC against Echostar Satellite LLC, predecessor-in-interest to DISH Network L.L.C. (“DISH Network”) (the “VOOM Litigation Agreement”). Pursuant to the VOOM Litigation Agreement, CSC Holdings had full control over the litigation with DISH Network, the decision with respect to settlement of the litigation was to be made jointly by CSC Holdings and the AMC Parties, and CSC Holdings and the AMC Parties were to share equally in the proceeds (including in the value of any non-cash consideration) of any settlement of the litigation.
As previously disclosed in the Company's 2012 Form 10-K, CSC Holdings and the Company settled the lawsuit (the “Settlement”) on October 21, 2012. During the fourth quarter of 2012, the AMC Parties and CSC Holdings agreed that, pending a final determination of the allocation of the proceeds, the
$700,000
cash proceeds of the Settlement (the “Settlement Funds”) would be distributed equally to each of the Company and Cablevision.
On April 8, 2013, Cablevision and the Company entered into an agreement (the “DISH Network Proceeds Allocation Agreement”) in which a final allocation of the proceeds of the Settlement, including the Settlement Funds, was made. The principal terms of the DISH Network Proceeds Allocation Agreement were as follows: Cablevision received
$525,000
of the Settlement Funds and the Company received
$175,000
of the Settlement Funds representing the allocation of cash and non-cash proceeds (including the portion of the DISH Network affiliation agreement attributable to the Settlement). The DISH Network Proceeds Allocation Agreement was in full and final settlement of the allocation between Cablevision and the Company of the proceeds of the Settlement.
In accordance with the Company's Related Party Transaction Approval Policy, the final allocation of the proceeds from the Settlement was approved by an independent committee of the Company's Board of Directors, as well as an independent committee of Cablevision's board of directors.
The
$350,000
of Settlement Funds previously disbursed to the Company is included in cash and cash equivalents in the consolidated balance sheet at December 31, 2012. Deferred litigation settlement proceeds at December 31, 2012 of approximately
$308,000
, is the result of the
$350,000
of Settlement Funds, less
$31,000
representing the excess of the fair value of the DISH Network affiliation agreement over the contractual affiliation fees recorded to deferred revenue on October 21, 2012 and less an
$11,000
receivable related to VOOM HD's previous affiliation agreement with DISH Network.
On April 9, 2013, the Company paid to Cablevision
$175,000
of the Settlement Funds. Additionally, in 2013, the Company recorded a litigation settlement gain of approximately
$133,000
, included in operating income within the International and Other segment, representing the deferred litigation settlement proceeds liability of approximately
$308,000
recorded in the consolidated balance sheet at December 31, 2012 less the
$175,000
paid to Cablevision on April 9, 2013.
F-36
AMC NETWORKS INC. AND SUBSIDIARIES
NOTES TO CONSOLIDATED FINANCIAL STATEMENTS-(Continued)
(Dollars in thousands, except per share amounts)
During
2013
,
2012
and
2011
, the Company’s non-cash investing and financing activities and other supplemental data were as follows:
|
|
Years Ended December 31,
|
||||||||||
|
|
2013
|
2012
|
2011
|
||||||||
|
Non-Cash Investing and Financing Activities:
|
|||||||||||
|
Continuing Operations:
|
|||||||||||
|
Leasehold improvements paid by landlord
|
$
|
100
|
|
$
|
2,938
|
|
$
|
150
|
|
||
|
Increase in capital lease obligations and related assets
|
865
|
|
1,398
|
|
39
|
|
|||||
|
Capital expenditures incurred but not yet paid
|
3,202
|
|
5,397
|
|
—
|
|
|||||
|
Deemed capital (distribution) contribution related to the utilization of Cablevision tax losses (see Note
11
)
|
—
|
|
(1,794
|
)
|
36,867
|
|
|||||
|
Deemed capital (distribution) contribution, net related to adjustments to the liability for uncertain tax positions and net deferred tax assets as a result of the Distribution (see Note
11
)
|
—
|
|
(1,148
|
)
|
44,598
|
|
|||||
|
Capital distribution for the transfer of a promissory note receivable to Cablevision (see Promissory Note discussion below)
|
—
|
|
—
|
|
(17,113
|
)
|
|||||
|
Deemed capital distribution to Cablevision related to employee benefit plans as a result of the Distribution (see Employee Matters Agreement discussion below)
|
—
|
|
—
|
|
(6,313
|
)
|
|||||
|
Deemed capital distribution related to tax credits utilized by Cablevision
|
—
|
|
—
|
|
(2,586
|
)
|
|||||
|
Deemed capital distribution associated with the issuance of debt to Cablevision (see Note 1)
|
—
|
|
—
|
|
(1,250,000
|
)
|
|||||
|
Deemed capital contribution related to the allocation of Cablevision share-based compensation expense
|
—
|
|
—
|
|
8,343
|
|
|||||
|
Supplemental Data:
|
|||||||||||
|
Cash interest paid—continuing operations
|
112,053
|
|
113,493
|
|
78,714
|
|
|||||
|
Income taxes paid, net—continuing operations
|
135,708
|
|
40,522
|
|
11,569
|
|
|||||
Promissory Note
In September 2009, RMH and one of its subsidiaries that was transferred by the Company to Cablevision on December 31, 2010 agreed to the terms of a promissory note having an initial principal amount of
$0
and increasing from time to time by advances made by RMH, with an interest rate of
8.625%
. Interest income recognized by RMH related to this note amounted to
$120
for the year ended December 31, 2011, respectively. On January 31, 2011, RMH distributed to a subsidiary of Cablevision all of its rights, title and interest in and to the promissory note. This distribution amounting to
$17,113
, including principal and accrued and unpaid interest, is reflected as a capital distribution in the consolidated statement of stockholders’ deficiency for the year ended December 31, 2011.
Employee Matters Agreement
In connection with the Distribution, AMC Networks entered into an Employee Matters Agreement with Cablevision which allocated assets, liabilities and responsibilities with respect to certain employee compensation and benefit plans and programs and certain other related matters. As a result of such agreement, AMC Networks recorded a net receivable from Cablevision of
$1,166
, an increase in accrued employee related costs of
$7,479
and a capital distribution of
$6,313
which decreased additional paid in capital in the Company’s statement of stockholders’ deficiency for the transfer to the Company from Cablevision of the obligations related to the Company’s employees’ participant accounts in the Cablevision Excess Savings Plan
$(3,616)
and the Cablevision Excess Cash Balance Pension Plan
$(3,863)
and for the Company’s obligation to Cablevision for the
$5,904
unfunded liability associated with Company employee participants in Cablevision’s Cash Balance Pension Plan. In addition, the Company reduced its long-term incentive plan and stock appreciation rights liabilities and increased amounts due to related parties by
$6,742
for its obligation to pay Cablevision for its allocated share of the related expense for Cablevision corporate employees through June 30, 2011. These related party balances were settled in 2011.
F-37
AMC NETWORKS INC. AND SUBSIDIARIES
NOTES TO CONSOLIDATED FINANCIAL STATEMENTS-(Continued)
(Dollars in thousands, except per share amounts)
The following table details the components of accumulated other comprehensive loss:
|
Balance as of December 31, 2012
|
$
|
(8,446
|
)
|
|
Gains and Losses on Cash Flow Hedges:
|
|||
|
Other comprehensive loss before reclassifications
|
(1,018
|
)
|
|
|
Amounts reclassified from accumulated other comprehensive loss to interest expense
|
7,280
|
|
|
|
Net current-period other comprehensive income, before income taxes
|
6,262
|
|
|
|
Income tax expense
|
(2,311
|
)
|
|
|
Net current-period other comprehensive income, net of income taxes
|
3,951
|
|
|
|
Balance as of December 31, 2013
|
$
|
(4,495
|
)
|
The Company classifies its operations into
two
operating segments: National Networks and International and Other. These operating segments represent strategic business units that are managed separately.
The Company generally allocates all corporate overhead costs to the Company’s
two
operating segments based upon their proportionate estimated usage of services, including such costs as executive salaries and benefits, costs of maintaining corporate headquarters, facilities and common support functions (such as human resources, legal, finance, tax, accounting, audit, treasury, risk management, strategic planning and information technology) as well as sales support functions and creative and production services.
The Company evaluates segment performance based on several factors, of which the primary financial measure is operating segment adjusted operating cash flow (defined as operating income (loss) before depreciation and amortization, share-based compensation expense or benefit, restructuring expense or credit and the litigation settlement gain recorded in connection with the settlement with DISH Network), a non-GAAP measure. The Company does not consider the one-time litigation settlement gain with DISH Network to be indicative of its ongoing operating performance. The Company has presented the components that reconcile adjusted operating cash flow to operating income, an accepted GAAP measure and other information as to the continuing operations of the Company’s operating segments below.
|
|
Year Ended December 31, 2013
|
||||||||||||||
|
|
National
Networks
|
International
and Other
|
Inter-segment
eliminations
|
Consolidated
|
|||||||||||
|
Revenues, net
|
|||||||||||||||
|
Advertising
|
$
|
662,789
|
|
$
|
—
|
|
$
|
—
|
|
$
|
662,789
|
|
|||
|
Distribution
|
822,227
|
|
122,429
|
|
(15,587
|
)
|
929,069
|
|
|||||||
|
Consolidated revenues, net
|
$
|
1,485,016
|
|
$
|
122,429
|
|
$
|
(15,587
|
)
|
$
|
1,591,858
|
|
|||
|
Adjusted operating cash flow (deficit)
|
$
|
555,911
|
|
$
|
(35,466
|
)
|
$
|
3,744
|
|
$
|
524,189
|
|
|||
|
Depreciation and amortization
|
(37,873
|
)
|
(16,794
|
)
|
—
|
|
(54,667
|
)
|
|||||||
|
Share-based compensation expense
|
(16,213
|
)
|
(4,086
|
)
|
—
|
|
(20,299
|
)
|
|||||||
|
Litigation settlement gain
|
—
|
|
132,944
|
|
—
|
|
132,944
|
|
|||||||
|
Operating income
|
$
|
501,825
|
|
$
|
76,598
|
|
$
|
3,744
|
|
$
|
582,167
|
|
|||
|
Capital expenditures
|
$
|
5,093
|
|
$
|
19,210
|
|
$
|
—
|
|
$
|
24,303
|
|
|||
F-38
AMC NETWORKS INC. AND SUBSIDIARIES
NOTES TO CONSOLIDATED FINANCIAL STATEMENTS-(Continued)
(Dollars in thousands, except per share amounts)
|
|
Year Ended December 31, 2012
|
||||||||||||||
|
|
National
Networks
|
International
and Other
|
Inter-segment
eliminations
|
Consolidated
|
|||||||||||
|
Revenues, net
|
|||||||||||||||
|
Advertising
|
$
|
522,917
|
|
$
|
147
|
|
$
|
—
|
|
$
|
523,064
|
|
|||
|
Distribution
|
731,269
|
|
114,394
|
|
(16,150
|
)
|
829,513
|
|
|||||||
|
Consolidated revenues, net
|
$
|
1,254,186
|
|
$
|
114,541
|
|
$
|
(16,150
|
)
|
$
|
1,352,577
|
|
|||
|
Adjusted operating cash flow (deficit)
|
$
|
492,129
|
|
$
|
(30,040
|
)
|
$
|
3,328
|
|
$
|
465,417
|
|
|||
|
Depreciation and amortization
|
(70,436
|
)
|
(14,944
|
)
|
—
|
|
(85,380
|
)
|
|||||||
|
Share-based compensation expense
|
(13,576
|
)
|
(3,626
|
)
|
—
|
|
(17,202
|
)
|
|||||||
|
Restructuring credit
|
—
|
|
3
|
|
—
|
|
3
|
|
|||||||
|
Operating income (loss)
|
$
|
408,117
|
|
$
|
(48,607
|
)
|
$
|
3,328
|
|
$
|
362,838
|
|
|||
|
Capital expenditures
|
$
|
5,541
|
|
$
|
13,016
|
|
$
|
—
|
|
$
|
18,557
|
|
|||
|
|
Year Ended December 31, 2011
|
||||||||||||||
|
|
National
Networks
|
International
and Other
|
Inter-segment
eliminations
|
Consolidated
|
|||||||||||
|
Revenues, net
|
|||||||||||||||
|
Advertising
|
$
|
447,449
|
|
$
|
177
|
|
$
|
(454
|
)
|
$
|
447,172
|
|
|||
|
Distribution
|
634,909
|
|
125,396
|
|
(19,736
|
)
|
740,569
|
|
|||||||
|
Consolidated revenues, net
|
$
|
1,082,358
|
|
$
|
125,573
|
|
$
|
(20,190
|
)
|
$
|
1,187,741
|
|
|||
|
Adjusted operating cash flow (deficit)
|
$
|
447,555
|
|
$
|
(4,976
|
)
|
$
|
(866
|
)
|
$
|
441,713
|
|
|||
|
Depreciation and amortization
|
(85,701
|
)
|
(14,147
|
)
|
—
|
|
(99,848
|
)
|
|||||||
|
Share-based compensation expense
|
(12,582
|
)
|
(3,007
|
)
|
—
|
|
(15,589
|
)
|
|||||||
|
Restructuring credit
|
—
|
|
240
|
|
—
|
|
240
|
|
|||||||
|
Operating income (loss)
|
$
|
349,272
|
|
$
|
(21,890
|
)
|
$
|
(866
|
)
|
$
|
326,516
|
|
|||
|
Capital expenditures
|
$
|
2,817
|
|
$
|
12,554
|
|
$
|
—
|
|
$
|
15,371
|
|
|||
Inter-segment eliminations are primarily revenues recognized by the International and Other segment for transmission revenues recognized by AMC Networks Broadcasting & Technology.
|
|
Years Ended December 31,
|
||||||||||
|
|
2013
|
2012
|
2011
|
||||||||
|
Inter-segment revenues
|
|||||||||||
|
National Networks
|
$
|
(184
|
)
|
$
|
(569
|
)
|
$
|
(454
|
)
|
||
|
International and Other
|
(15,403
|
)
|
(15,581
|
)
|
(19,736
|
)
|
|||||
|
$
|
(15,587
|
)
|
$
|
(16,150
|
)
|
$
|
(20,190
|
)
|
|||
One customer accounted for
10%
and
11%
of the consolidated revenues, net for the years ended
December 31, 2013
and 2012. Two customers accounted for
10%
and
12%
of consolidated revenues, net for the year ended December 31, 2011.
Failure to renew affiliation agreements with the Company’s largest customers, or renewal on less favorable terms, or the termination of those agreements could have a material adverse effect on the Company’s business. A reduced distribution of the Company’s programming networks would adversely affect the Company’s affiliation fee revenues, and impact the Company’s ability to sell advertising or the rates the Company charges for such advertising.
Substantially all revenues and assets of the Company are attributed to or located in the U.S.
F-39
AMC NETWORKS INC. AND SUBSIDIARIES
NOTES TO CONSOLIDATED FINANCIAL STATEMENTS-(Continued)
(Dollars in thousands, except per share amounts)
Acquisition of Chellomedia
On January 31, 2014, certain subsidiaries of AMC Networks purchased substantially all of Chellomedia, the international content division of Liberty Global plc,
for a purchase price of
€750 million
(approximately
$1.0 billion
),
subject to adjustments for working capital, cash, and indebtedness acquired and for the purchase of minority equity interests. AMC Networks funded the purchase price with cash on hand and additional indebtedness of
$600,000
under our Term Loan A Facility (See Note 7).
The acquisiti
on provides AMC Networks with television channels that are distributed to more than
390 million
subscribers
in over
130
countries
and span a wide range of programming genres, most notably movie and entertainment networks. The
acquisition of Chellomedia's operating businesses include: Chello Central Europe, Chello Latin America, Chello Multicanal, Chello Zone, the ad sales unit Atmedia, and the broadcast solutions unit, Chello DMC. The acquisition provides the Company with the opportunity to accelerate and enhance our international expansion strategy and
the potential to provide international long-term growth and value.
The following is a summary of the Company’s selected quarterly financial data for the years ended
December 31, 2013
and
2012
:
|
|
For the three months ended,
|
||||||||||||||||||
|
2013:
|
March 31, 2013
|
June 30, 2013
|
September 30, 2013
|
December 31, 2013
|
2013
|
||||||||||||||
|
Revenues, net
|
$
|
381,961
|
|
$
|
379,322
|
|
$
|
395,328
|
|
$
|
435,247
|
|
$
|
1,591,858
|
|
||||
|
Operating expenses
|
(254,477
|
)
|
(131,998
|
)
|
(272,941
|
)
|
(350,275
|
)
|
(1,009,691
|
)
|
|||||||||
|
Operating income
|
$
|
127,484
|
|
$
|
247,324
|
|
$
|
122,387
|
|
$
|
84,972
|
|
$
|
582,167
|
|
||||
|
Income from continuing operations
|
$
|
61,517
|
|
$
|
135,731
|
|
$
|
57,950
|
|
$
|
34,962
|
|
$
|
290,160
|
|
||||
|
Net income including noncontrolling interests
|
$
|
61,517
|
|
$
|
135,731
|
|
$
|
57,950
|
|
$
|
34,962
|
|
$
|
290,160
|
|
||||
|
Net income attributable to AMC Networks’ stockholders
|
$
|
61,517
|
|
$
|
135,731
|
|
$
|
58,111
|
|
$
|
35,379
|
|
$
|
290,738
|
|
||||
|
Basic net income per share attributable to AMC Networks’ stockholders:
|
|||||||||||||||||||
|
Income from continuing operations
|
0.86
|
|
1.90
|
|
0.81
|
|
0.49
|
|
4.06
|
|
|||||||||
|
Net income
|
0.86
|
|
1.90
|
|
0.81
|
|
0.49
|
|
4.06
|
|
|||||||||
|
Diluted net income per share attributable to AMC Networks’ stockholders:
|
|||||||||||||||||||
|
Income from continuing operations
|
0.85
|
|
1.87
|
|
0.80
|
|
0.49
|
|
4.00
|
|
|||||||||
|
Net income
|
0.85
|
|
1.87
|
|
0.80
|
|
0.49
|
|
4.00
|
|
|||||||||
F-40
AMC NETWORKS INC. AND SUBSIDIARIES
NOTES TO CONSOLIDATED FINANCIAL STATEMENTS-(Continued)
(Dollars in thousands, except per share amounts)
|
|
For the three months ended,
|
||||||||||||||||||
|
2012:
|
March 31, 2012
|
June 30, 2012
|
September 30, 2012
|
December 31, 2012
|
2012
|
||||||||||||||
|
Revenues, net
|
$
|
326,239
|
|
$
|
327,570
|
|
$
|
332,056
|
|
$
|
366,712
|
|
$
|
1,352,577
|
|
||||
|
Operating expenses
|
(229,200
|
)
|
(229,294
|
)
|
(245,197
|
)
|
(286,048
|
)
|
(989,739
|
)
|
|||||||||
|
Operating income
|
$
|
97,039
|
|
$
|
98,276
|
|
$
|
86,859
|
|
$
|
80,664
|
|
$
|
362,838
|
|
||||
|
Income from continuing operations
|
$
|
43,077
|
|
$
|
41,405
|
|
$
|
36,543
|
|
$
|
15,191
|
|
$
|
136,216
|
|
||||
|
Income from discontinued operations, net of income taxes
|
104
|
|
105
|
|
105
|
|
—
|
|
314
|
|
|||||||||
|
Net income attributable to AMC Networks’ stockholders
|
$
|
43,181
|
|
$
|
41,510
|
|
$
|
36,648
|
|
$
|
15,191
|
|
$
|
136,530
|
|
||||
|
Basic net income per share attributable to AMC Networks’ stockholders:
|
|||||||||||||||||||
|
Income from continuing operations
|
$
|
0.62
|
|
$
|
0.59
|
|
$
|
0.52
|
|
$
|
0.22
|
|
$
|
1.94
|
|
||||
|
Income from discontinued operations
|
$
|
—
|
|
$
|
—
|
|
$
|
—
|
|
$
|
—
|
|
$
|
—
|
|
||||
|
Net income
|
$
|
0.62
|
|
$
|
0.59
|
|
$
|
0.52
|
|
$
|
0.22
|
|
$
|
1.94
|
|
||||
|
Diluted net income per share attributable to AMC Networks’ stockholders:
|
|||||||||||||||||||
|
Income from continuing operations
|
$
|
0.60
|
|
$
|
0.57
|
|
$
|
0.51
|
|
$
|
0.21
|
|
$
|
1.89
|
|
||||
|
Income from discontinued operations
|
$
|
—
|
|
$
|
—
|
|
$
|
—
|
|
$
|
—
|
|
$
|
—
|
|
||||
|
Net income
|
$
|
0.60
|
|
$
|
0.58
|
|
$
|
0.51
|
|
$
|
0.21
|
|
$
|
1.89
|
|
||||
As set forth in the table above, there have been changes in the level of the Company’s revenues, net from quarter to quarter and/or changes from year to year due primarily to increased distribution revenue and advertising revenue. In addition, the Company’s operating expenses have also changed from quarter to quarter and/or year over year due primarily to the timing of the exhibition, promotion and marketing of program rights and/or program rights write-downs based on management’s assessment of programming usefulness. In addition to the changes in operating income, non-operating income and expense items such as interest expense, net, write-off of deferred financing costs, loss on extinguishment of debt and income tax expense also impact quarter over quarter and year over year net income.
F-41
AMC NETWORKS INC. AND SUBSIDIARIES
SCHEDULE II
VALUATION AND QUALIFYING ACCOUNTS
(Dollars in thousands)
|
Balance at
Beginning
of Period
|
Provision
for (Recovery of) Bad
Debt
|
Deductions/
Write-Offs and
Other Charges
|
Balance at
End of Period
|
||||||||||||
|
Year Ended December 31, 2013
|
|||||||||||||||
|
Allowance for doubtful accounts
|
$
|
1,378
|
|
$
|
1,440
|
|
$
|
(1,887
|
)
|
*
|
$
|
931
|
|
||
|
Year Ended December 31, 2012
|
|||||||||||||||
|
Allowance for doubtful accounts
|
$
|
3,092
|
|
$
|
(1,265
|
)
|
$
|
(449
|
)
|
*
|
$
|
1,378
|
|
||
|
Year Ended December 31, 2011
|
|||||||||||||||
|
Allowance for doubtful accounts
|
$
|
8,321
|
|
$
|
338
|
|
$
|
(5,567
|
)
|
*
|
$
|
3,092
|
|
||
|
*
|
Amounts represent primarily the write-off of certain uncollectible trade receivables that had previously been fully reserved.
|
S-1
TABLE OF CONTENTS
Part IItem 1. BusinessItem 1A. Risk FactorsItem 1B. Unresolved Staff CommentsItem 2. PropertiesItem 3. Legal ProceedingsItem 4. Mine Safety DisclosuresPart IIItem 5. Market For Registrant S Common Equity, Related Stockholder Matters and Issuer Purchases Of Equity SecuritiesItem 6. Selected Financial DataItem 7. Management S Discussion and Analysis Of Financial Condition and Results Of OperationsItem 7A. Quantitative and Qualitative Disclosure About Market RiskItem 8. Financial Statements and Supplementary DataItem 9. Changes in and Disagreements with Accountants on Accounting and Financial DisclosureItem 9A. Controls and ProceduresItem 9B. Other InformationPart IIIItem 10. Directors, Executive Officers and Corporate GovernanceItem 11. Executive CompensationItem 12. Security Ownership Of Certain Beneficial Owners and Management and Related Stockholder MattersItem 13. Certain Relationships and Related Transactions, and Director IndependenceItem 14. Principal Accounting Fees and ServicesPart IVItem 15. Exhibits, Financial Statement SchedulesNote 1. Description Of Business and Basis Of PresentationNote 2. Summary Of Significant Accounting PoliciesNote 3. Program Rights and ObligationsNote 4. Property and EquipmentNote 5. Goodwill and Other Intangible AssetsNote 6. Accrued LiabilitiesNote 7. DebtNote 8. Fair Value MeasurementNote 9. Derivative Financial InstrumentsNote 10. LeasesNote 11. Income TaxesNote 12. Commitments and ContingenciesNote 13. Equity and Long-term Incentive PlansNote 14. Benefit PlansNote 15. Related Party TransactionsNote 16. Cash FlowsNote 17. Accumulated Other Comprehensive LossNote 18. Segment InformationNote 19. Other MattersNote 20. Interim Financial Information (unaudited)