AMC NETWORKS INC.
10-Ks and 10-Qs
|
|
|
|
|
|
|
|
|
|
|
|
|
|
|
|
|
|
|
|
|
|
|
|
|
|
|
|
|
|
|
|
|
|
|
|
|
|
|
|
|
|
|
|
|
|
|
|
|
|
UNITED STATES
SECURITIES AND EXCHANGE COMMISSION
WASHINGTON, D.C. 20549
FORM 10-K
|
þ
|
Annual report pursuant to Section 13 or 15(d) of the Securities Exchange Act of 1934
|
For the fiscal year ended
December 31, 2017
or
|
¨
|
Transition report pursuant to Section 13 or 15(d) of the Securities Exchange Act of 1934
|
For the transition period from to
Commission File Number: 1-35106
AMC Networks Inc.
(Exact name of registrant as specified in its charter)
|
Delaware
|
|
27-5403694
|
|
(State or other jurisdiction of
incorporation or organization)
|
|
(I.R.S. Employer
Identification No.)
|
|
11 Penn Plaza, New York, NY
|
|
10001
|
|
(Address of principal executive offices)
|
|
(Zip Code)
|
(212) 324-8500
(Registrant's telephone number, including area code)
Securities registered pursuant to Section 12(b) of the Act:
|
Title of each class
|
|
Name of each exchange on which registered
|
|
Class A Common Stock, par value $0.01 per share
|
|
The NASDAQ Stock Market LLC
|
Securities registered pursuant to Section 12(g) of the Act:
None
Indicate by check mark if the registrant is a well-known seasoned issuer, as defined in Rule 405 of the Securities Act.
Yes
þ
No
¨
Indicate by check mark if the registrant is not required to file reports pursuant to Section 13 or 15(d) of the Act. Yes
¨
No
þ
Indicate by check mark whether the registrant (1) has filed all reports required to be filed by Section 13 or 15(d) of the Securities Exchange Act of 1934 during the preceding 12 months (or for such shorter period that the registrant was required to file such reports), and (2) has been subject to such filing requirements for the past 90 days. Yes
þ
No
¨
Indicate by check mark whether the registrant has submitted electronically and posted on its corporate Website, if any, every Interactive Data File required to be submitted and posted pursuant to Rule 405 of Regulation S-T (§232.405 of this chapter) during the preceding 12 months (or for such shorter period that the registrant was required to submit and post such files). Yes
þ
No
¨
Indicate by check mark if disclosure of delinquent filers pursuant to Item 405 of Regulation S-K (§229.405 of this chapter) is not contained herein, and will not be contained to the best of registrant's knowledge, in definitive proxy or information statements incorporated by reference in Part III of this Form 10-K or any amendment to this Form 10-K.
þ
Indicate by check mark whether the registrant is a large accelerated filer, an accelerated filer, a non-accelerated filer, a smaller reporting company or an emerging growth company (as defined in Exchange Act Rule 12b-2).
|
Large accelerated filer
|
þ
|
Accelerated filer
|
¨
|
|
Non-accelerated filer
|
¨
|
Smaller reporting company
|
¨
|
|
Emerging growth company
|
¨
|
||
If an emerging growth company, indicate by check mark if the registrant has elected not to use the extended transition period for complying with any new or revised financial accounting standards provided pursuant to Section 13(a) of the Exchange Act.
¨
Indicate by check mark whether the registrant is a shell company (as defined in Rule 12b-2 of the Exchange Act). Yes
¨
No
þ
The aggregate market value of the registrant's common stock held by non-affiliates of the registrant, computed by reference to the closing price of a share of common stock on June 30, 2017 (the last business day of the registrant's most recently completed second fiscal quarter) was approximately
$2.8 billion
.
The number of shares of common stock outstanding as of
February 15, 2018
:
|
Class A Common Stock par value $0.01 per share
|
49,239,999
|
|
|
Class B Common Stock par value $0.01 per share
|
11,484,408
|
|
DOCUMENTS INCORPORATED BY REFERENCE:
Certain information required in Item 10 through Item 14 of Part III of this Annual Report on Form 10-K is incorporated herein by reference to the Registrant's definitive Proxy Statement for its
2018
Annual Meeting of Stockholders, which shall be filed with the Securities and Exchange Commission pursuant to Regulation 14A of the Securities Exchange Act of 1934, as amended, within 120 days of the Registrant's fiscal year end.
TABLE OF CONTENTS
|
|
|
Page
|
|
Part I
|
||
|
Item 1.
|
||
|
Item 1A.
|
||
|
Item 1B.
|
||
|
Item 2.
|
||
|
Item 3.
|
||
|
Item 4.
|
||
|
Part II
|
||
|
Item 5.
|
||
|
Item 6.
|
||
|
Item 7.
|
||
|
Item 7A.
|
||
|
Item 8.
|
||
|
Item 9.
|
||
|
Item 9A.
|
||
|
Item 9B.
|
||
|
Part III
|
||
|
Item 10.
|
||
|
Item 11.
|
||
|
Item 12.
|
||
|
Item 13.
|
||
|
Item 14.
|
||
|
Part IV
|
||
|
Item 15.
|
||
|
Item 16.
|
||
3
Forward-Looking Statements
This Annual Report on Form 10-K contains statements that constitute forward-looking information within the meaning of the Private Securities Litigation Reform Act of 1995. In this Annual Report on Form 10-K there are statements concerning our future operating results and future financial performance. Words such as "expects," "anticipates," "believes," "estimates," "may," "will," "should," "could," "potential," "continue," "intends," "plans" and similar words and terms used in the discussion of future operating results and future financial performance identify forward-looking statements. You are cautioned that any such forward-looking statements are not guarantees of future performance or results and involve risks and uncertainties and that actual results or developments may differ materially from the forward-looking statements as a result of various factors. Factors that may cause such differences to occur include, but are not limited to:
• the level of our revenues;
|
•
|
market demand, including changes in viewer consumption patterns, for our programming networks, our subscription streaming services, and our programming;
|
• demand for advertising inventory and our ability to deliver guaranteed viewer ratings;
• the highly competitive nature of the cable, telecommunications and programming industries;
|
•
|
our ability to maintain and renew distribution or affiliation agreements with distributors;
|
|
•
|
the cost of, and our ability to obtain or produce, desirable programming content for our networks, other forms of distribution, including digital and licensing in international markets, as well as our independent film distribution businesses;
|
|
•
|
market demand for our owned original programming and our independent film content;
|
• the security of our program rights and other electronic data;
• the loss of any of our key personnel and artistic talent;
• changes in domestic and foreign laws or regulations under which we operate;
• economic and business conditions and industry trends in the countries in which we operate;
•
fluctuations in currency exchange rates and interest rates;
|
•
|
changes in laws or treaties relating to taxation, or the interpretation thereof, in the U.S. or in the countries in which we operate, including the impact of the Tax Cuts and Jobs Act and the Bipartisan Budget Act of 2018;
|
• our substantial debt and high leverage;
• reduced access to capital markets or significant increases in costs to borrow;
• the level of our expenses;
• the level of our capital expenditures;
• future acquisitions and dispositions of assets;
|
•
|
our ability to successfully acquire new businesses and, if acquired, to integrate, and implement our plan with respect to businesses we acquire;
|
|
•
|
problems we may discover post-closing with the operations, including the internal controls and financial reporting process, of businesses we acquire;
|
|
•
|
uncertainties regarding the financial results of equity method investees and changes in the nature of key strategic relationships with partners and joint ventures;
|
• the outcome of litigation and other proceedings;
•
whether pending uncompleted transactions, if any, are completed on the terms and at the times set forth (if at all);
• other risks and uncertainties inherent in our programming businesses;
|
•
|
financial community and rating agency perceptions of our business, operations, financial condition and the industry in which we operate;
|
|
•
|
events that are outside our control, such as political unrest in international markets, terrorist attacks, natural disasters and other similar events; and
|
•
the factors described under Item 1A, "Risk Factors" in this Annual Report.
We disclaim any obligation to update or revise the forward-looking statements contained herein, except as otherwise required by applicable federal securities laws.
4
General
AMC Networks Inc. is a Delaware corporation with its principal executive offices located at 11 Penn Plaza, New York, NY 10001. AMC Networks Inc. is a holding company and conducts substantially all of its operations through its majority owned or controlled subsidiaries. Unless the context otherwise requires, all references to "we," "our," "us," "AMC Networks" or the "Company" refer to AMC Networks Inc., together with its subsidiaries. "AMC Networks Inc." refers to AMC Networks Inc. individually as a separate entity. Our telephone number is (212) 324-8500. Our corporate website is http://www.amcnetworks.com and the investor relations section of our website is located at http://investor.amcnetworks.com. We make available, free of charge through the investor relations section of our website, our annual reports on Form 10-K, quarterly reports on Form 10-Q and current reports on Form 8-K and amendments to those reports filed or furnished pursuant to Section 13(a) or 15(d) of the Securities Exchange Act of 1934, as well as our proxy statements, as soon as reasonably practicable after we electronically file such material with, or furnish it to, the Securities and Exchange Commission ("SEC"). References to our website in this Annual Report on Form 10-K (this "Annual Report") are provided as a convenience and the information contained on, or available through, the website is not part of this or any other report we file with or furnish to the SEC.
AMC Networks Inc. was incorporated on March 9, 2011 as an indirect, wholly-owned subsidiary of Cablevision Systems Corporation (Cablevision Systems Corporation and its subsidiaries are referred to as "Cablevision"). On June 30, 2011, Cablevision spun off the Company (the "Distribution"), and AMC Networks Inc. became an independent public company.
Our Company
AMC Networks is a global entertainment company that operates several of the most recognized brands in television, creating and presenting high quality content and compelling stories to audiences, and a valuable platform for distributors and advertisers. We have operated in the cable programming industry for more than 30 years, and, over this time, we have continually enhanced the value of our network portfolio. Our content spans multiple genres, including drama, comedy, documentary, reality, anthology, feature film and short form. Our programming networks are well known and well regarded by our key constituents — our viewers, distributors and advertisers — and have developed strong followings within their respective targeted demographics, increasing their value to distributors and advertisers.
In the United States ("U.S."), our programming networks are AMC, WE tv, BBC AMERICA (operated through a joint venture with BBC Worldwide Americas, Inc.), IFC and SundanceTV. Each of our programming networks has established itself within its respective markets. Our deep and established presence in the industry and the recognition we have received for our brands through industry awards and other honors lend us a high degree of credibility with distributors and content producers, and help provide us with stable affiliate and studio relationships, advantageous channel placements, heightened viewer engagement and demand for our owned programming for distribution on platforms other than our own. Our networks are also distributed through virtual multi-channel video programming distributors. We principally license the content we distribute. However, through our AMC Studios operation, we are increasing the amount of our owned original programming. Our ability to produce owned high quality content has provided us with the opportunity to distribute such content on platforms other than our domestic networks. Our owned and licensed content is distributed domestically and internationally and on multiple platforms, including linear television, digital services, home video and syndication.
AMC Networks also operates IFC Films, a film distribution business that distributes independent narrative and documentary films under the IFC Films label as well as the Sundance Selects and IFC Midnight distribution labels. IFC Films is known for attracting high-profile talent and distributing films that regularly garner critical acclaim and industry honors, including numerous Oscar- Golden Globe-, and Cannes Film Festival-award winning titles.
Internationally, we deliver programming that reaches subscribers in more than
140
countries and territories, including countries and territories in Europe, Latin America, the Middle East and parts of Asia and Africa. The international division of the Company, AMC Networks International ("AMCNI"), consists of global brands, including AMC and SundanceTV, in the movie and entertainment programming genres, as well as popular, locally recognized channels in several other programming genres.
We also operate and own two subscription streaming services, Sundance Now, launched in 2014, and Shudder, launched in 2015. These services are available in the United States, Canada and parts of Europe. Sundance Now features independent film, TV shows, documentaries, and original series. Shudder is dedicated to films in the horror, suspense and thriller genres. We primarily license content for these services.
Our Strategy
Our strategy is to maintain and improve our position as a leading entertainment company by creating and presenting content that is high-quality, brand defining and compelling to watch, and by owning and operating some of the most popular and award-
5
winning brands in television that create engagement with audiences globally across multiple distribution platforms. The key focuses of our strategy are:
Continued Development of High-Quality Original Programming
. We intend to continue developing strong original programming across all of our programming networks to further enhance our brands, strengthen our relationships with our viewers, distributors and advertisers, and increase distribution and audience ratings. We intend to continue to seek increased distribution of our national networks to grow distribution and advertising revenues. We believe that our continued investment in original programming supports future growth in distribution and advertising revenue. We also intend to continue to expand the exploitation of our original programming across multiple distribution platforms.
Increased Global Distribution
. We are expanding the distribution of our programming networks around the globe. We first expanded beyond the U.S. market with the launch in Canada of IFC (in 2001) and AMC (in 2006), and SundanceTV in Europe (in 2010). In 2014, AMC was launched internationally and is now available in more than 110 countries. Additionally, SundanceTV has expanded its distribution to over
70
countries. One or more of AMC Networks International's channels are available in more than
140
countries and territories worldwide.
Growth of Advertising Revenue
. We continue to evolve the programming on each of our networks to achieve even stronger viewer engagement within their respective core targeted demographics, thereby increasing the value of our programming to advertisers and allowing us to obtain higher advertising rates. We are continuing to seek additional advertising revenue through higher Nielsen ratings in desirable demographics.
Increased Control of Content
. We believe that control (including long-term contract arrangements) and ownership of content is important. Through our AMC Studios operation, we intend to increase our control position over our programming content. We currently control, own or have long-term license agreements covering significant portions of our content across our programming networks as well as in our independent film distribution business operated by IFC Films. We intend to continue to focus on obtaining the broadest possible control rights (both as to territory and platforms) for our content.
Exploitation of Other Media Platforms
. The technological landscape surrounding the distribution of entertainment content has expanded to include other media platforms. We distribute our content across many of these platforms, when it makes business sense to do so, so that our viewers can access our content where, when and how they want it. To that end, our programming networks are allowing many of our distributors to offer our content to subscribers on computers and other digital devices, and on video on demand platforms, all of which permit subscribers to access programs at their convenience. We also make certain of our content available on third-party digital platforms such as Netflix, Hulu, Amazon Prime and iTunes as well as our subscription streaming services, Sundance Now and Shudder.
Revenue
We earn revenue principally from the distribution of our programming and the sale of advertising. Distribution revenues primarily include fees paid by distributors to carry our programming networks as well as revenue earned from the licensing of original programming for digital, international and home video distribution. In
2017
, distribution revenues and advertising sales accounted for
63%
and
37%
of our consolidated revenues, net, respectively. For the year ended
December 31, 2017
, one customer, AT&T Inc., accounted for greater than 10% of our consolidated revenues, net.
Distribution Revenue
Subscription revenue:
Our programming networks are distributed to our viewing audience throughout the U.S. and around the world via cable and other multichannel video programming distribution platforms, including direct broadcast satellite ("DBS"), platforms operated by telecommunications providers and virtual multichannel video programming distributors (collectively "distributors") pursuant to agreements with the distributors. These agreements, which typically have durations of several years, require us to deliver programming that meets certain standards set forth in the agreement. We earn fees under these agreements, generally based upon the number of each distributor's subscribers or, in some cases, based on a fixed contractual monthly fee. These agreements also give us the right to sell a specific amount of advertising time on our programming networks. Our programming networks' existing distribution agreements expire at various dates through
2026
.
We frequently negotiate with distributors in an effort to increase the subscriber base for our networks. We have in some instances made upfront payments to distributors in exchange for these additional subscribers or agreed to waive or accept lower subscriber fees if certain numbers of additional subscribers are provided. We also may help fund the distributors' efforts to market our programming networks or we may permit distributors to offer limited promotional periods without payment of subscriber fees. As we continue our efforts to add subscribers, our subscriber revenue may be negatively affected by such deferred carriage fee arrangements, discounted subscriber fees and other payments; however, we believe that these transactions generate a positive return on investment over the contract period.
6
Content licensing revenue:
We sell rights to our owned original programming and related brands for distribution in a variety of forms including television markets worldwide, subscription video on demand (SVOD) services or digital platform providers, such as Netflix, Hulu, Amazon Prime and physical (DVD and Blu-ray) formats.
Advertising Revenue
We earn advertising revenue by selling advertising time on our programming networks. In the U.S., we sell advertising time in both the upfront and scatter markets. In the upfront market, advertisers buy advertising time for the upcoming season, and by purchasing in advance, often receive discounted rates. In the scatter market, advertisers buy advertising time close to the time when the commercials will be run, and often pay a premium. The mix between the upfront and scatter markets is based upon a number of factors, such as pricing, demand for advertising time and economic conditions. Internationally, advertising markets vary by jurisdiction. The majority of international advertising is sold close to the time when the commercials will be run (similar to the U.S. scatter market) and are generally represented by third-party sales agents.
Our arrangements with advertisers provide for a set number of advertising units to air over a specific period of time at a negotiated price per unit. In most domestic advertising sales arrangements, our programming networks guarantee specified viewer ratings for their programming. If these guaranteed viewer ratings are not met, we are generally required to provide additional advertising units to the advertiser at no charge. For these types of arrangements, a portion of the related revenue is deferred if the guaranteed viewer ratings are not met and is subsequently recognized either when we provide the required additional advertising unit or the guarantee obligation contractually expires. In the U.S., most of our advertising revenues vary based upon the popularity of our programming as measured by Nielsen. In addition to the Nielsen rating, our advertising rates are also influenced by the demographic mix of our viewing audiences, since advertisers tend to pay premium rates for more desirable demographic groups of viewers.
Our programming networks have advertisers representing companies in a broad range of sectors, including automotive, restaurants/food, health, and telecommunications industries.
Programming
We obtain programming through a combination of development, production and licensing; and we distribute programming directly to consumers in the U.S. and throughout the world through our programming networks, digital and other forms of distribution and theatrical release of our IFC Films acquired content. Our programming includes original programming that we control, either through outright ownership or through long-term licensing arrangements, as well as acquired programming that we license from studios and other rights holders. Since our founding in 1980, we have been a pioneer in the cable television programming industry, having created or developed some of the industry's leading programming networks, with a focus on programming of film and original productions. Certain of our programming networks feature original programming that includes critically-acclaimed original scripted dramatic series.
Original Programming
We contract with some of the industry's leading production companies to produce most of the original programming that appears on our programming networks. These contractual arrangements either provide us with outright ownership of the programming, in which case we hold all programming and other rights to the content, or they consist of long-term licensing arrangements, which provide us with exclusive rights to exhibit the content on our programming networks, but may be limited in terms of specific geographic markets or distribution platforms. The license agreements are typically of multi-season duration and provide us with a right of first negotiation or a right of first refusal on the renewal of the license for additional programming seasons.
We also increasingly produce original programming through our AMC Studios operation, primarily for our programming networks and also for license to third-parties worldwide. Decisions as to how to distribute programming are made on the basis of a variety of factors including the relative value of any particular alternative.
Acquired Programming
The majority of the content on our programming networks consists of films, episodic series and specials that we acquire pursuant to rights agreements with film studios, production companies or other rights holders. This acquired programming includes episodic series such as
Law and Order, CSI: Miami
,
Will & Grace
,
Roseanne, Two and a Half Men
and
Batman
, as well as an extensive film library. The rights agreements for this content are of varying duration and generally permit our programming networks to carry these series, films and other programming during certain window periods.
Segments
We manage our business through the following two operating segments:
|
•
|
National Networks:
Includes activities of our five national programming networks, AMC Studios operations and AMC Broadcasting & Technology. Our national programming networks are AMC, WE tv, BBC AMERICA, IFC,
|
7
and SundanceTV in the U.S.; and AMC, IFC and Sundance Channel in Canada. Our AMC Studios operations produces original programming for our programming networks and also licenses such program rights worldwide. AMC Networks Broadcasting & Technology is our technical services business, which primarily services most of the national programming networks.
|
•
|
International and Other
: Principally includes AMC Networks International (AMCNI), the Company's international programming businesses consisting of a portfolio of channels in Europe, Latin America, the Middle East and parts of Asia and Africa; IFC Films, the Company's independent film distribution business; and our subscription streaming services, Sundance Now and Shudder.
|
For financial information of the Company by operating segment, see Item 7, "Management's Discussion and Analysis of Financial Condition and Results of Operations — Consolidated Results of Operations" and Note
22
to the accompanying consolidated financial statements.
National Networks
AMC
AMC is home to some of the most popular and acclaimed programs on television. The network's series
The Walking Dead,
which recently celebrated its 100th episode, is the highest-rated series in cable television history and has been the number one show on television among adults 18-49 for the past six seasons.
Launched in 1984, AMC helped usher in what is commonly referred to as the current "golden age of television," with its debut of
Mad Men
in 2007 and
Breaking Bad
in 2008. Both series are among the most critically acclaimed and awarded series in the history of television. AMC became the first basic cable network to win the Emmy
®
Award for Outstanding Drama Series with
Mad Men
in 2008, which then went on to win four years in a row before
Breaking Bad
followed shortly thereafter by winning in 2013 and 2014.
AMC's current slate has a range of popular and critically-lauded series including the Emmy-nominated series
Better Call Saul
,
The Walking Dead,
Fear the Walking Dead
,
Into the Badlands
,
Humans
,
Preacher
and
The Son.
Upcoming programming includes
McMafia,
a co-production with the BBC
, The Terror, Dietland
and
Lodge 49.
AMC is also home to original unscripted shows including
Talking Dead
,
Talking With Chris Hardwick
,
Comic Book Men
, and
Ride with Norman Reedus.
The network recently greenlit a new limited series,
The Little Drummer Girl
, an adaptation of the best-selling author John Le Carre's novel. Another Le Carre bestseller,
The Night Manager
, was adapted into a mini-series by AMC in partnership with the BBC.
The Night Manager
starred Hugh Laurie and Tom Hiddleston and debuted to critical acclaim and was the most awarded television series at the 2017 Golden Globe Awards. AMC has also launched a year-round documentary series "AMC Visionaries," partnering with prolific artists to unveil the untold stories and fascinating histories of pop culture genres from the masters themselves. The first two installments include
Robert Kirkman's Secret History of Comics
, which explores the stories, people and events that have transformed the world of comic books,
and
James Cameron's Story Of Science Fiction
from the acclaimed filmmaker behind many iconic sci-fi films.
In 2017, the network announced the launch of AMC Premiere, a premium upgrade option for Comcast's Xfinity customers that offers real-time, commercial-free viewing of AMC originals in season, in addition to new content and other fan-focused benefits. AMC also debuted a new, immersive virtual reality app, AMC VR, which allows users to step into the worlds of AMC's groundbreaking original series like
The Walking Dead
and
Into the Badlands.
AMC's film library consists of films that are licensed under long-term contracts with major studios such as Twentieth Century Fox, Warner Bros., Sony, MGM, NBC Universal, Paramount and Buena Vista. AMC generally structures its contracts for the exclusive cable television rights to air the films during identified window periods.
AMC Subscribers and Distribution Agreements
. As of
December 31, 2017
, AMC had distribution agreements with all major U.S. distributors and reached approximately
91
million Nielsen subscribers. AMC is also distributed in Canada through arrangements with all major Canadian multichannel video programming distributors.
Historical Subscribers—AMC
|
(In millions)
|
2017
|
2016
|
2015
|
|||||
|
Nielsen Subscribers (at year-end)
|
90.5
|
|
91.2
|
|
93.6
|
|
||
|
Change from Prior Year-end
|
(1
|
)%
|
(3
|
)%
|
(1
|
)%
|
||
Year-to-year changes in the Nielsen subscribers may be impacted by changes in the Nielsen sample.
8
WE tv
With compelling unscripted shows, WE tv connects audiences with reality content that is authentic and relatable. WE tv is available across all platforms: on TV, online, on demand, and social media, embracing how today's digitally-savvy, socially-engaged audiences connect through content, using it as a catalyst to drive conversation and build community. Driven by unscripted originals, WE tv continues to grow its target audience, fueled by its popular slate of fresh and modern original series like
Mama June: From Not to Hot, Growing Up Hip Hop, Growing Up Hip Hop: Atlanta, Braxton Family Values
and
Marriage Boot Camp: Reality Stars
, which has helped to cement the network's position as the #1 U.S. cable network for African-American women and adults on Thursday nights, a top 5 destination for women on Friday nights, and a top three social network on both nights.
Mama June: From Not to Hot
was the #1 new reality series for 2017 and 2018 marks the return of WE tv's cultural phenomenon
Bridezillas.
Additionally, WE tv's programming includes series such as
CSI: Miami
and
Law & Order
as well as feature films, with certain exclusive license rights from studios such as Paramount, MGM, Disney and Warner Bros.
WE tv Subscribers and Distribution Agreements
. As of
December 31, 2017
, WE tv had distribution agreements with all major U.S. distributors and reached approximately
86
million Nielsen subscribers.
Historical Subscribers—WE tv
|
(In millions)
|
2017
|
2016
|
2015
|
|||||
|
Nielsen Subscribers (at year-end)
|
86.0
|
|
85.9
|
|
86.5
|
|
||
|
Change from Prior Year-end
|
—
|
%
|
(1
|
)%
|
1
|
%
|
||
Year-to-year changes in the Nielsen subscribers may be impacted by changes in the Nielsen sample.
BBC AMERICA
BBC AMERICA, a hub of innovative, dynamic programming, has garnered one of television's most curious, educated and affluent audiences, with many programs boasting some of the highest levels of fan engagement found on cable television. A joint venture between BBC Worldwide (the commercial arm of the BBC) and AMC Networks, BBC AMERICA has attracted wide critical acclaim for its influential series, including
Orphan Black
and
Luther
, which have been awarded the industry's highest honors, including Emmy®, Golden Globe® , Peabody, and Critics' Choice Awards.
BBC AMERICA's programming includes the Emmy® Award-winning
Planet Earth II
;
Planet Earth:
Blue Planet II
, which takes viewers on a revelatory journey into the mesmerizing world of our oceans; the top-rated and enduring science-fiction phenomenon
Doctor Who,
starring Jodie Whittaker as the newest doctor and the first ever female doctor; a new series of the long-running franchise
Top Gear,
the most-watched unscripted show in the world;
Premiere League Darts
, a new series that makes BBC AMERICA home to the two largest darts tournaments in the world; a new season of fan favorite and critically acclaimed
Luther
starring Idris Elba; and the upcoming series
Killing Eve
from Phoebe Waller-Bridge and starring Sandra Oh.
BBC AMERICA Subscribers and Distribution Agreements
. As of
December 31, 2017
, BBC AMERICA had distribution agreements with all major U.S. distributors and reached approximately
81 million
Nielsen subscribers.
Historical Subscribers—BBC AMERICA
|
(In millions)
|
2017
|
2016
|
2015
|
|||||
|
Nielsen Subscribers (at year-end)
|
80.6
|
|
79.3
|
|
77.1
|
|
||
|
Change from Prior Year-end
|
2
|
%
|
3
|
%
|
(1
|
)%
|
||
Year-to-year changes in the Nielsen subscribers may be impacted by changes in the Nielsen sample.
IFC
IFC is the home of offbeat, unexpected comedies that are in keeping with the network's "Always On Slightly Off" brand, which air alongside fan-favorite movies and comedic cult TV shows. The network's current programming slate includes its Emmy- and Peabody Award-winning sketch comedy series,
Portlandia
, created by and starring Fred Armisen and Carrie Brownstein, and executive produced by
Saturday Night Live's
Lorne Michaels;
Brockmire
, starring Hank Azaria, which originated as a Funny or Die short and concluded its first season as the highest-rated new series in IFC history; Emmy-nominated series
Documentary Now!
, created by Seth Meyers, Bill Hader and Fred Armisen, starring Hader and Armisen and executive produced by Lorne Michaels; critically-acclaimed and award-winning all-female sketch comedy series,
Baroness von Sketch Show
; and horror-comedy
Stan Against Evil,
created by Dana Gould and starring John C. McGinley and Janet Varney. IFC is also the broadcast home for the Film Independent Spirit Awards, which will be hosted this year for the second time in a row by comedians Nick Kroll and John Mulaney.
9
Additionally, AMC Networks and IFC have a minority ownership stake in Funny or Die, and the two comedy brands recently created a night of short-form original comedy from a host of up-and-coming Funny or Die talent called FODTV that currently airs Saturday nights on IFC.
IFC's programming also includes films from various film distributors, including Fox, Miramax, Sony, Lionsgate, Universal, Paramount and Warner Bros.
IFC Subscribers and Distribution Agreements
. As of
December 31, 2017
, IFC had distribution agreements with all major U.S. distributors and reached approximately
74
million Nielsen subscribers.
Historical Subscribers—IFC
|
(In millions)
|
2017
|
2016
|
2015
|
|||||
|
Nielsen Subscribers (at year-end)
|
74.2
|
|
72.4
|
|
71.2
|
|
||
|
Change from Prior Year-end
|
2
|
%
|
2
|
%
|
(3
|
)%
|
||
Year-to-year changes in the Nielsen subscribers may be impacted by changes in the Nielsen sample.
SundanceTV
From delivering critically acclaimed Emmy®, Golden Globe® and Peabody Award-winning television featuring some of the world's most talented creators and performers, to showcasing some of the most compelling and iconic films across genres and generations, SundanceTV is a smart and thought-provoking entertainment destination. SundanceTV has remained true to founder Robert Redford's mission to celebrate creativity and distinctive storytelling through unique voices and narratives found in the best independent films. Working with today's most innovative talent, SundanceTV attracts viewer and critical acclaim for its original scripted programming, including
Top of the Lake: China Girl
, directed by Oscar-winning Jane Campion and starring Elisabeth Moss and Nicole Kidman; fan favorite
Hap and Leonard
;
Liar
, starring Golden Globe-winner and Emmy-nominated actress Joanne Froggatt (
Downton Abbey
); critically-acclaimed series
The A Word;
Australian comedy
Rosehaven;
the Peabody and International Emmy-Award winning series
Deutschland 83
which returns this year as
Deutschland 86;
and true-crime series
Cold Blooded: The Clutter Family Murders
from Academy Award® documentarian Joe Berlinger.
SundanceTV's
The Split
is a new original drama series with a female-led cast and crew from BAFTA and Primetime Emmy Award
®
-winning writer Abi Morgan and BAFTA-winning Executive Producer Jane Featherstone. The network will also continue its exploration of true crime with the greenlighting of three new docuseries:
The Road to Jonestown
from Executive Producers Leonardo DiCaprio and Jennifer Davisson of Appian Way and Executive Producer Stephen David of Emmy Award®-Winning Stephen David Entertainment;
Ministry of Evil: The Twisted Cult of Tony Alamo
from Emmy Award®-winners Fenton Bailey, Randy Barbato, and Peacock Productions; and
The Preppie Murder
with Emmy® Award- winner Robert Friedman's Bungalow Media + Entertainment and the original prosecutor in the case, Linda Fairstein.
SundanceTV Subscribers and Distribution Agreements
. As of
December 31, 2017
, SundanceTV had distribution agreements with all major U.S. distributors and reached approximately
71
million Nielsen subscribers. Sundance Channel is also distributed in Canada through trademark license and content distribution arrangements with Canadian programming outlets.
Historical Subscribers—SundanceTV
|
(In millions)
|
2017
|
2016
|
2015
|
|||||
|
Nielsen Subscribers (at year-end)
|
70.6
|
|
62.4
|
|
59.6
|
|
||
|
Change from Prior Year-end
|
13
|
%
|
5
|
%
|
5
|
%
|
||
The increase in Nielsen subscribers noted in the above table primarily reflects the repositioning of carriage of our SundanceTV with certain operators to more widely distributed tiers of service. Additionally, year-to-year changes in the Nielsen subscribers may be impacted by changes in the Nielsen sample.
AMC Studios
AMC Studios is the in-house studio production operation of the Company. AMC Studios launched in 2010 with its first series,
The Walking Dead
. Since then, AMC Studios has produced several critically acclaimed, award-winning and culturally distinctive originals for AMC including scripted series:
Fear the Walking Dead; TURN: Washington's Spies
;
Halt and Catch Fire; Into the Badlands;
and
The Son
as well as unscripted series:
Ride with Norman Reedus, Robert Kirkman's Secret History of Comics
, which explores the stories, people and events that have transformed the world of comic books,
and
James Cameron's Story Of Science Fiction
from the acclaimed filmmaker behind many iconic sci-fi films. Forthcoming series from AMC Studios include
The Terror, Lodge 49,
and
Dietland.
The Studio has also produced for BBC AMERICA,
Dirk Gently
and for SundanceTV, the
10
Peabody Award-winning
Rectify,
original series
Hap and Leonard
, as well as unscripted series
Cold Blooded: The Clutter Family Murders
.
AMC Networks Broadcasting & Technology
AMC Networks Broadcasting & Technology is a full-service network programming feed origination and distribution company, which primarily services most of the national programming networks of the Company. AMC Networks Broadcasting & Technology's operations are located in Bethpage, New York, where AMC Networks Broadcasting & Technology consolidates origination and satellite communications functions in a
67,000
square-foot facility designed to keep AMC Networks at the forefront of network origination and distribution technology. AMC Networks Broadcasting & Technology has 30 plus years of experience across its network services groups, including network origination, affiliate engineering, network transmission, traffic and scheduling that provide day-to-day delivery of any programming network, in high definition or standard definition.
Currently, AMC Networks Broadcasting & Technology is responsible for the origination and transmission of multiple highly acclaimed network programming feeds for both national and international distribution. In addition to serving most of the programming networks of the Company, AMC Networks Broadcasting & Technology's affiliated and third-party clients include MSG Network, MSG+, SNY and Mid Atlantic Sports Network.
International and Other
Our International and Other segment includes the operations of AMCNI, IFC Films and our subscription streaming services.
AMC Networks International
AMCNI, the international division of the Company, delivers entertaining and acclaimed programming that reaches subscribers in more than
140
countries and territories, including countries and territories in Europe, Latin America, the Middle East and parts of Asia and Africa. AMCNI consists of global brands, AMC and SundanceTV, as well as popular, locally recognized channels in various programming genres.
AMCNI - UK
AMCNI - UK distributes television programming throughout the United Kingdom and other countries in Europe, the Middle East and Africa ("EMEA") and manages a portfolio of channel brands, including AMC, SundanceTV, Extreme Sports Channel, Eva and MGM. AMCNI - UK also operates a number of joint venture, partnership and managed channel services in the EMEA region, including Outdoor Channel, as well as a portfolio of entertainment channels with CBS Studios, including CBS Drama, CBS Action, CBS Reality, CBS Europa and Horror Channel.
AMCNI - Southern Europe
AMCNI - Southern Europe is the largest distributor of thematic television channels in Spain and Portugal and recently expanded to include France and Italy. The current portfolio consists of channel brands including AMC, SundanceTV, Canal Hollywood, Odisea, Sol Musica, Canal Cocina and Decasa, and a number of channels owned through joint ventures. The channels are programmed for local audiences, languages and markets.
AMCNI - Central and Northern Europe
AMCNI - Central and Northern Europe operates a portfolio of thematic television channels with a focus on the Central, Northern and Eastern European markets, including television brands in
five
genres: sport: Sport1, Sport2, SportM, kids: Minimax, Megamax, JimJam, infotainment: Spektrum, TVPaprika, Spektrum Home, film: AMC, Film Mánia, Film Café, Film+ and Kinowelt, MGM and Sundance and general entertainment: OBN. The channels are programmed for local audiences, languages and markets.
AMCNI - Latin America
AMCNI - Latin America produces and distributes high quality television programming throughout Spanish and Portuguese speaking Latin America, the Caribbean and other territories. The portfolio consists of
six
channels including AMC, Sundance, Film&Arts, Europa Europa, Mas Chic and El Gourmet.
AMCNI - Other
AMCNI also distributes television programming in the Middle East and Asia focusing on the international versions of SundanceTV. An internationally recognized brand, SundanceTV's global services provide not only the best of the independent film world but also features certain content from AMC, IFC, SundanceTV and IFC Films, as well as a unique pipeline of international content, in an effort to provide distinctive programming to an upscale audience.
11
IFC Films
IFC Films, our independent film distribution business, is a leading distributor of high-quality, talent-driven independent film and operates three distribution labels: Sundance Selects, IFC Films and IFC Midnight, all of which distribute independent films across virtually all available media platforms, including in theaters, on cable/satellite video on demand, cable network television, streaming/downloading to internet-connected screens and DVDs. IFC Films has a film library consisting of more than
800
titles.
Notable recent releases include
Wakefield
, with Bryan Cranston and Jennifer Garner;
The Trip to Spain
, the third installment of Michael Winterbottom's
The Trip
series, starring Steve Coogan and Rob Brydon; and Olivier Assayas' critically-acclaimed
Personal Shopper
, with Kristen Stewart.
As part of its strategy to encourage the growth of the marketplace for independent films, IFC Films also operates the IFC Center and the DOC NYC Film Festival. IFC Center is a state-of-the-art independent movie theater located in the heart of New York City's Greenwich Village. DOC NYC, which has grown to be the largest non-fiction film festival in the U.S., is an annual festival also located in New York City celebrating documentary storytelling in film, photography, prose and other media. In 2017, IFC Films launched its inaugural Split Screens festival, a new annual event celebrating the art and cultural impact of television, that takes place at the IFC Center.
Subscription Streaming Services
We also operate and own two subscription streaming services, Sundance Now, launched in 2014, and Shudder, launched in 2015. These services are available in the United States, Canada and parts of Europe. Sundance Now features independent film, TV shows, documentaries, and original series. Shudder is dedicated to films in the horror, suspense and thriller genres. We primarily license content for these services.
Regulation
Our businesses are subject to and affected by regulations of U.S. federal, state and local government authorities, and our international operations are subject to laws and regulations of the countries in which they operate, as well as international bodies, such as the European Union. The Federal Communications Commission (the "FCC") regulates U.S. programming networks directly in some respects; other FCC regulations, although imposed on cable television operators and satellite operators, affect programming networks indirectly. The rules, regulations, policies and procedures affecting our businesses are constantly subject to change. The descriptions below are summary in nature and do not purport to describe all present and proposed laws and regulations affecting our businesses.
Closed Captioning
Certain of our networks must provide closed-captioning of programming for the hearing impaired, and we must provide closed captioning on certain video content that we offer on the Internet or through other Internet Protocol distribution methods.
CALM Act
FCC rules require multichannel video programming distributors to ensure that all commercials comply with specified volume standards, and our distribution agreements generally require us to certify compliance with such standards.
Obscenity Restrictions
Cable operators and other multichannel video programming distributors are prohibited from transmitting obscene programming, and our distribution agreements generally require us to refrain from including such programming on our networks.
Packaging Programming and Volume Discounts
The FCC from time to time examines whether to adopt rules restricting how programmers package and price their networks, or whether to impose other restrictions on carriage agreements between programmers and multichannel video programming distributors. We do not currently require distributors to carry more than one of our national programming networks in order to obtain the right to carry a particular national programming network. However, we generally negotiate with a distributor for the carriage of all of our national networks concurrently, and we offer volume discounts to distributors who make our programming available to larger numbers of subscribers or who carry more of our programming networks.
Effect of "Must-Carry" Requirements
The FCC's implementation of the statutory "must-carry" obligations requires cable and DBS operators to give broadcasters preferential access to channel space, and FCC rules allow broadcasters to require cable and DBS operators to carry broadcast-affiliated networks as a condition of access to the local broadcast station. In contrast, programming networks, such as ours, have no guaranteed right of carriage on cable television or DBS systems. This may reduce the amount of channel space that is available for carriage of our networks by cable television systems and DBS operators.
12
Website Requirements
We maintain various websites that provide information regarding our businesses and offer content for sale. The operation of these websites may be subject to a range of federal, state and local laws such as privacy, data security, accessibility, child safety and consumer protection regulations.
Other Regulation
The FCC also imposes rules that may impact us regarding a variety of issues such as political broadcasts, sponsorship identification, advertising in children's television, and telemarketing. Programming businesses are subject to regulation by the country in which they operate, as well as international bodies, such as the European Union. These regulations may include restrictions on types of advertising that can be sold on our networks, programming content requirements, requirements to make programming available on non-discriminatory terms, and local content quotas.
Competition
Our programming networks operate in three highly competitive markets. First, our programming networks compete with other programming networks and other types of programming services to obtain distribution on cable television systems and other multichannel video programming distribution systems, and ultimately for viewing by each distributor's subscribers. Second, our programming networks compete with other programming networks and other sources of video content, to secure desired entertainment programming. Third, our programming networks compete with other sellers of advertising time and space, including other cable programming networks, radio, newspapers, outdoor media and, increasingly, internet sites. The success of our businesses depends on our ability to license and produce content for our programming networks that is adequate in quantity and quality and will generate satisfactory viewer ratings. In each of these cases, some of our competitors are large publicly held companies that have greater financial resources than we do. In addition, we compete with these entities for advertising revenue.
Distribution of Programming Networks
The business of distributing programming networks to cable television systems and other multichannel video programming distributors and licensing of original programming for distribution is highly competitive. Our programming networks face competition from other programming networks for carriage by a particular multichannel video programming distributor, and for the carriage on the service tier that will attract the most subscribers. Once our programming network is selected by a distributor for carriage, that network competes for viewers not only with the other programming networks available on the distributor's system, but also with over-the-air broadcast television, Internet-based video and other online services, mobile services, radio, print media, motion picture theaters, DVDs, and other sources of information and entertainment.
Important to our success in each area of competition we face are the prices we charge for our programming networks, the quantity, quality and variety of the programming offered on our networks, and the effectiveness of our networks' marketing efforts. The competition for viewers among advertiser supported networks is directly correlated with the competition for advertising revenues with each of our competitors.
Our ability to successfully compete with other networks may be hampered because the cable television systems or other multichannel video programming distributors through which we seek distribution may be affiliated with other programming networks. In addition, because such distributors may have a substantial number of subscribers, the ability of such programming networks to obtain distribution on the systems of affiliated distributors may lead to increased distribution and advertising revenue for such programming networks because of their increased penetration compared to our programming networks. Even if such affiliated distributors carry our programming networks, such distributors may place their affiliated programming network on a more desirable tier, thereby giving the affiliated programming network a competitive advantage over our own.
New or existing programming networks that are affiliated with broadcasting networks like ABC, CBS, Fox or NBC may also have a competitive advantage over our programming networks in obtaining distribution through the "bundling" of agreements to carry those programming networks with agreements giving the distributor the right to carry a broadcast station affiliated with the broadcasting network.
Part of our strategy involves exploiting identified segments of the cable television viewing audience that are generally well defined and limited in size. Our networks have faced and will continue to face increasing competition as other programming networks and online or other services seek to serve the same or similar niches.
We also seek to increase our content licensing revenues by expanding the opportunities for licensing our programming through other media platforms and we compete with other programming companies in this market based on the desirability of our programming.
Sources of Programming
We also compete with other programming networks and other distributors including digital distribution platforms to secure desired programming. Most of our original programming and all of our acquired programming is obtained through agreements
13
with other parties that have produced or own the rights to such programming. Competition for this programming will increase as the number of programming networks and other distributors increases. Other programming networks that are affiliated with programming sources such as movie or television studios or film libraries may have a competitive advantage over us in this area.
With respect to the acquisition of entertainment programming, such as syndicated programs and movies that are not produced by or specifically for networks, our competitors include national broadcast television networks, local broadcast television stations, other cable programming networks, Internet-based video content distributors, and video-on-demand programs. Some of these competitors have exclusive contracts with motion picture studios or independent motion picture distributors or own film libraries.
Competition for Advertising Revenue
Our programming networks must compete with other sellers of advertising time and space, including other multichannel video programming distributors, radio, newspapers, outdoor media and increasing shifts in spending toward online and mobile offerings from more traditional media. We compete for advertisers on the basis of rates we charge and also on the number and demographic nature of viewers who watch our programming. Advertisers will often seek to target their advertising content to those demographic categories they consider most likely to purchase the product or service they advertise. Accordingly, the demographic make-up of our viewership can be equally or more important than the number of viewers watching our programming.
Employees
As of
December 31, 2017
we had
1,872
full-time employees and
333
part-time employees. In addition, certain of our U.S. subsidiaries engage the services of writers who are subject to a collective bargaining agreement. Approximately
280
of our employees outside of the U.S. are covered by collective bargaining agreements or works councils. We believe that our relations with the labor unions and our employees are generally good.
A wide range of risks may affect our business, financial condition and results of operations, now and in the future. We consider the risks described below to be the most significant. There may be other currently unknown or unpredictable economic, business, competitive, regulatory or other factors that could have material adverse effects on our future results.
Risks Relating to Our Business
Our business depends on the appeal of our programming to our U.S. and international viewers and our distributors, which may be unpredictable and volatile.
Our business depends, in part, upon viewer preferences and audience acceptance in the U.S. and internationally of the programming on our networks. These factors are often unpredictable and volatile, and subject to influences that are beyond our control, such as the quality and appeal of competing programming, general economic conditions and the availability of other entertainment activities. We may not be able to anticipate and react effectively to shifts in viewer preferences and/or interests in our markets. A change in viewer preferences could cause our programming to decline in popularity, which could result in a reduction of advertising revenues and jeopardize our bargaining position with distributors. In addition, certain of our competitors may have more flexible programming arrangements, as well as greater amounts of available content, distribution and capital resources, and may react more quickly than we might to shifts in tastes and interests.
To an increasing extent, the success of our business depends on original programming, and our ability to accurately predict how audiences will respond to our original programming is particularly important. Because original programming often involves a greater degree of commitment on our part, as compared to acquired programming that we license from third parties, and because our network branding strategies depend significantly on a relatively small number of original programs such as
The Walking Dead
, a failure to anticipate viewer preferences for such programs could be especially detrimental to our business. We periodically review the programming usefulness of our program rights based on a series of factors, including ratings, type and quality of program material, standards and practices, and fitness for exhibition. We have incurred write-offs of programming rights in the past, and may incur future programming rights write-offs if it is determined that program rights have limited, or no, future usefulness.
In addition, feature films constitute a significant portion of the programming on our AMC, IFC and SundanceTV programming networks. In general, the popularity of feature-film content on linear television is declining, due in part to the broad availability of such content through an increasing number of distribution platforms. Should the popularity of feature-film programming suffer significant further declines, we may lose viewership, which could increase our costs.
If our programming does not gain the level of audience acceptance we expect, or if we are unable to maintain the popularity of our programming, our ratings may suffer, which will negatively affect advertising revenues, and we may have a diminished bargaining position with distributors, which could reduce our distribution revenues. Ratings for
The Walking Dead
have declined in recent years and if the ratings of that series continues to decline, it could have a significant effect on our advertising revenues and our financial results. We cannot assure you that we will be able to maintain the success of any of our current programming, or generate sufficient demand and market acceptance for our new programming.
14
Changes in the operating environment of multichannel distributors, including declines in the number of subscribers, could have a material negative effect on our business and results of operations.
Our business derives a substantial portion of its revenues and income from cable television providers and other multichannel video programming distributors. The U.S. television industry is continuing to evolve rapidly, with developments in technology leading to new methods for the distribution of video content and changes in when, where and how audiences consume video content. These changes pose risks to the traditional U.S. television industry, including (i) the disruption of the traditional television content distribution model by subscription streaming services and virtual multichannel video programming services, which are increasing in number and some of which have a significant and growing subscriber base, and (ii) the disruption of the advertising supported television model resulting from increased video consumption through subscription streaming services and virtual multichannel video programing services with no advertising or less advertising than on television networks, time shifted viewing of television programming and the use of DVRs to skip advertisements. In part as a result of these changes, over the past few years, the number of subscribers to traditional multichannel video programming distributors in the U.S. has declined slightly and the U.S. television industry has experienced declines in ratings for programming, which has negatively affected subscription and advertising revenues. Developments in technology and new content delivery products and services have also led to an increasing amount of video content, as well as changes in consumers' expectations regarding the availability of video content, their willingness to pay for access to or ownership of such content, their perception of what quality entertainment is and their tolerance for commercial interruptions. We are engaged in efforts to respond to and mitigate the risks from these changes, but the success of some of these initiatives depends in part on the cooperation of measurement companies, advertisers and affiliates and, therefore, is not within our control. We may incur significant costs to implement our strategy and initiatives, and if they are not successful, our competitive position, businesses and results of operations could be adversely affected.
Our programming networks' success depends upon the availability of programming that is adequate in quantity and quality, and we may be unable to secure or maintain such programming.
Our programming networks' success depends upon the availability of quality programming, particularly original programming and films, that is suitable for our target markets. While we produce certain of our original programming through our studio operations, we obtain most of the programming on our networks (including original programming, films and other acquired programming) through agreements with third parties that have produced or control the rights to such programming. These agreements expire at varying times and may be terminated by the other parties if we are not in compliance with their terms.
Competition for programming has increased as the number of programming networks has increased. Other programming networks that are affiliated with programming sources such as movie or television studios or film libraries may have a competitive advantage over us in this area. In addition to other cable programming networks, we also compete for programming with national broadcast television networks, local broadcast television stations, video on demand services and subscription video on demand services, such as Netflix, Hulu and Amazon Prime. Some of these competitors have exclusive contracts with motion picture studios or independent motion picture distributors or own film libraries.
We cannot assure you that we will ultimately be successful in producing or obtaining the quality programming our networks need to be successful.
Increased programming costs may adversely affect our profits.
We produce a significant amount of original programming and other content and continue to invest in this area, the costs of which are significant. We also acquire programming and television series, as well as a variety of digital content and other ancillary rights from other companies, and we pay license fees, royalties or contingent compensation in connection with these acquired rights. Our investments in original and acquired programming are significant and involve complex negotiations with numerous third parties. These costs may not be recouped when the content is broadcast or distributed and higher costs may lead to decreased profitability or potential write-downs. Increased competition from additional entrants into the market for development and production of original programming, such as Apple, Netflix, Amazon Prime and Hulu, may increase our programming content costs.
We incur costs for the creative talent, including actors, writers and producers, who create our original programming. Some of our original programming has achieved significant popularity and critical acclaim, which has increased and could continue to increase the costs of such programming in the future. In addition, from time to time we have disputes with writers, producers and other creative talent over the amount of royalty and other payments (See Item 3. – Legal Proceedings for additional information). The Company believes that disputes of this type are endemic to its business and similar disputes may arise from time to time in the future. An increase in the costs of programming may lead to decreased profitability or otherwise adversely affect our business.
Original programming requires substantial financial commitment. In some cases, the financial commitment may be partially offset by foreign, state or local tax incentives. However, there is a risk that the tax incentives will not remain available for the duration of a series. If tax incentives are no longer available, reduced substantially, or cannot be utilized, it may result in increased costs for us to complete the production or make the production of additional seasons more expensive. If we are unable to produce
15
original programming content on a cost effective basis our business, financial condition and results of operations may be materially adversely affected.
Theft of our content, including digital copyright theft and other unauthorized exhibitions of our content, may decrease revenue received from our programming and adversely affect our businesses and profitability.
The success of our businesses depends in part on our ability to maintain and monetize our intellectual property rights to our entertainment content. We are fundamentally a content company and theft of our brands, programming, digital content and other intellectual property has the potential to significantly affect us and the value of our content. Copyright theft is particularly prevalent in many parts of the world that lack effective copyright and technical protective measures similar to those existing in the United States or that lack effective enforcement of such measures, including some of the jurisdictions in which we operate. The interpretation of copyright, privacy and other laws as applied to our content, and piracy detection and enforcement efforts, remain in flux. The failure to strengthen, or the weakening of, existing intellectual property laws could make it more difficult for us to adequately protect our intellectual property and negatively affect its value and our results of operations.
Content theft has been made easier by the wide availability of higher bandwidth and reduced storage costs, as well as tools that undermine security features such as encryption and the ability of pirates to cloak their identities online. In addition, we and our numerous production and distribution partners operate various technology systems in connection with the production and distribution of our programming, and intentional, or unintentional, acts could result in unauthorized access to our content, a disruption of our services, or improper disclosure of confidential information. The increasing use of digital formats and technologies heightens this risk. Unauthorized access to our content could result in the premature release of our programming, which may have a significant adverse effect on the value of the affected programming.
Copyright theft has an adverse effect on our business because it reduces the revenue that we are able to receive from the legitimate sale and distribution of our content, undermines lawful distribution channels and inhibits our ability to recoup or profit from the costs incurred to create such content. A change in the laws of one jurisdiction may also have an impact on our ability to protect our intellectual property rights across other jurisdictions. In addition, many parts of the world where piracy is prevalent lack effective copyright and other legal protections or enforcement measures. Efforts to prevent the unauthorized distribution, performance and copying of our content may affect our profitability and may not be successful in preventing harm to our business.
Litigation may be necessary to enforce our intellectual property rights, protect trade secrets or to determine the validity and scope of proprietary rights claimed by others. Any litigation of this nature, regardless of outcome or merit, could result in substantial costs and diversion of management and technical resources, any of which could adversely affect our business, financial condition and results of operations. Our failure to protect our intellectual property rights, particularly our brand, in a meaningful manner or challenges to related contractual rights could result in erosion of our brand and limit our ability to control marketing of our networks, which could have a materially adverse effect on our business, financial condition and results of operations.
Because a limited number of distributors account for a large portion of our business, failure to renew our programming networks' distribution agreements, or renewal on less favorable terms, or the termination of those agreements, both in the U.S. and internationally, could have a material adverse effect on our business.
Our programming networks depend upon agreements with a limited number of cable television system operators and other multichannel video programming distributors. The loss of any significant distributor could have a material adverse effect on our consolidated results of operations.
Currently our programming networks have distribution agreements with staggered expiration dates through
2026
.
Failure to renew distribution agreements, or renewal on less favorable terms, or the termination of distribution agreements could have a material adverse effect on our results of operations
.
A reduced distribution of our programming networks would adversely affect our distribution revenues, and impact our ability to sell advertising or the rates we charge for such advertising. Even if distribution agreements are renewed, there is no assurance that the renewal rates will equal or exceed the rates that we currently charge these distributors.
In addition, we have, in some instances, made upfront payments to distributors in exchange for additional subscribers or have agreed to waive or accept lower subscription fees if certain numbers of additional subscribers are provided. We also may help fund our distributors' efforts to market our programming networks or we may permit distributors to offer promotional periods without payment of subscriber fees. As we continue our efforts to add viewing subscribers, our net revenues may be negatively affected by these deferred carriage fee arrangements, discounted subscriber fees or other payments.
Consolidation among cable, satellite and telecommunications service providers has had, and could continue to have, an adverse effect on our revenue and profitability.
In some cases, if a distributor is acquired, the agreement of the acquiring distributor will govern following the acquisition. In those circumstances, the acquisition of a distributor that is party to one or more distribution agreements with our programming networks on terms that are more favorable to us could adversely impact our financial condition and results of operations.
16
Consolidation among cable and satellite distributors and telecommunications service providers has given the largest operators considerable leverage and market power in their relationships with programmers. We currently have agreements in place with the major U.S. cable and satellite operators and telecommunications service providers and this consolidation has affected, and could continue to affect, our ability to maximize the value of our content through those distributors. In addition, many of the countries and territories in which we distribute our networks also have a small number of dominant distributors. Continued consolidation within the industry could reduce the number of distributors that carry our programming and further increase the negotiating leverage of the cable and satellite television system operators, which could have an adverse effect on our financial condition or results of operations.
We are subject to intense competition, which may have a negative effect on our profitability or on our ability to expand our business.
The programming industry is highly competitive. Our programming networks compete with other programming networks and other types of video programming services for marketing and distribution by cable and other multichannel video programming distribution systems and ultimately for viewing by their subscribers. We compete with other providers of programming networks for the right to be carried by a particular cable or other multichannel video programming distribution system and for the right to be carried by such system on a particular "tier" of service. The increasing offerings by virtual multichannnel video programming distributors through alternative distribution methods creates competition for carriage on those platforms. Our programming networks compete with other programming networks and other sources of video content to secure desired entertainment programming.
Competition for content, audiences and advertising is intense and comes from broadcast television, other cable networks, distributors, including subscription streaming services and virtual multichannel video programming services, social media content distributors, and other entertainment outlets and platforms, as well as from search, social networks, program guides and "second screen" applications.
Increased competition from additional entrants into the market for development and production of original programming, such as Apple, Facebook, YouTube, Netflix, Amazon Prime and Hulu, increases our content costs as creating competing high quality, original content requires significant investment. In addition, as competition with these entrants for the creation and acquisition of quality programming continues to escalate, the complexity of negotiations over acquired rights to the content and the value of the rights we acquire or retain may increase, leading to increased acquisition costs, and our ability to successfully acquire content of the highest quality may face greater uncertainty.
Our ability to compete successfully depends on a number of factors, including our ability to create or acquire high quality and popular programs, adapt to new technologies and distribution platforms, and achieve widespread distribution for our content. More content consumption options increase competition for viewers as well as for programming and creative talent, which can decrease our audience ratings, and therefore potentially our advertising revenues.
Certain programming networks affiliated with broadcast networks like ABC, CBS, Fox or NBC or other key free-to-air programming networks in countries where our networks are distributed may have a competitive advantage over our programming networks in obtaining distribution through the "bundling" of carriage agreements for such programming networks with a distributor's right to carry the affiliated broadcasting network. In addition, our ability to compete with certain programming networks for distribution may be hampered because the cable television or other multichannel video programming distributors through which we seek distribution may be affiliated with these programming networks. Because such distributors may have a substantial number of subscribers, the ability of such programming networks to obtain distribution on the systems of affiliated distributors may lead to increased distribution and advertising revenue for such programming networks because of their increased penetration compared to our programming networks. Even if the affiliated distributors carry our programming networks, they may place their affiliated programming network on a more desirable tier, thereby giving their affiliated programming network a competitive advantage over our own. Our competitors could also have preferential access to important technologies, customer data or other competitive information. There can be no assurance that we will be able to compete successfully in the future against existing or potential competitors, or that competition will not have a material adverse effect on our business, financial condition or results of operations.
In addition, our competitors include market participants with interests in multiple media businesses that are often vertically integrated, whereas our businesses generally rely on distribution relationships with third parties. As more cable and satellite operators, Internet service providers, other content distributors, aggregators and search providers create or acquire their own content, they may have significant competitive advantages, which could adversely affect our ability to negotiate favorable terms and distribution or otherwise compete effectively in the delivery marketplace. Our competitors could also have preferential access to important technologies, customer data or other competitive information.
There can be no assurance that we will be able to compete successfully in the future against existing or new competitors, or that competition will not have a material adverse effect on our business, financial condition or results of operations.
17
We may not be able to adapt to new content distribution platforms and to changes in consumer behavior resulting from these new technologies, which may adversely affect our business.
We must successfully adapt to technological advances in our industry, including alternative distribution platforms. Our ability to exploit new distribution platforms and viewing technologies will affect our ability to maintain or grow our business. New forms of content distribution may provide different economic models and compete with current distribution methods in ways that are not entirely predictable. Such competition could reduce demand for our traditional television offerings or for the offerings of digital platforms and reduce our revenue from these sources. Accordingly, we must adapt to changing consumer behavior driven by advances such as virtual multichannel video programming distributors, digital video recorders, video on demand, subscription video on demand, including services such as Netflix, Hulu, Apple TV, Google TV and Amazon Prime and mobile devices. Gaming and other consoles such as Microsoft's Xbox, Sony's Playstation and Nintendo's Wii and Roku are establishing themselves as alternative providers of video services. Such changes may impact the revenues we are able to generate from our traditional distribution methods, either by decreasing the viewership of our programming networks on cable and other multichannel video programming distribution systems which are almost entirely directed at television video delivery or by making advertising on our programming networks less valuable to advertisers. If we fail to adapt our distribution methods and content to new technologies, our appeal to our targeted audiences might decline and there could be a negative effect on our business. In addition, advertising revenues could be significantly impacted by new technologies, since advertising sales are dependent on audience measurement provided by third parties, and the results of audience measurement techniques can vary independent of the size of the audience for a variety of reasons, including difficulties related to the employed statistical sampling methods, new distribution platforms and viewing technologies, and the shifting of the marketplace to the use of measurement of different viewer behaviors, such as delayed viewing. Moreover, devices that allow users to fast forward or skip programming, including commercials, are causing changes in consumer behavior that may affect the desirability of our programming services to advertisers.
Advertising market conditions in specific markets could cause our revenues and operating results to decline significantly in any given period.
We derive substantial revenues from the sale of advertising on a variety of platforms, and a decline in advertising expenditures could have a significant adverse effect on our revenues and operating results in any given period. The strength of the advertising market can fluctuate in response to the economic prospects of specific advertisers or industries, advertisers' current spending priorities and the economy in general, and this may adversely affect the growth rate of our advertising revenues.
In addition, the pricing and volume of advertising may be affected by shifts in spending toward online and mobile offerings from more traditional media, or toward new ways of purchasing advertising, such as through automated purchasing, dynamic advertising insertion, third parties selling local advertising spots and advertising exchanges, some or all of which may not be as advantageous to the Company as current advertising methods.
Advertising sales are dependent on audience measurement, and the results of audience measurement techniques can vary independent of the size of the audience for a variety of reasons, including variations in the employed statistical sampling methods. While Nielsen's statistical sampling method is the primary measurement technique used in our television advertising sales, we measure and monetize our campaign reach and frequency on and across digital platforms based on other third-party data using a variety of methods including the number of impressions served and demographics. In addition, multi-platform campaign verification is in its infancy, and viewership on tablets and smartphones, which is growing rapidly, is presently not measured by any one consistently applied method. These variations and changes could have a significant effect on advertising revenues.
General Risks
We face risks from doing business internationally.
We have operations through which we distribute programming outside the United States. As a result, our business is subject to certain risks inherent in international business, many of which are beyond our control. These risks include:
|
•
|
laws and policies affecting trade and taxes, including laws and policies relating to the repatriation of funds and withholding taxes, and changes in these laws;
|
|
•
|
changes in local regulatory requirements, including restrictions on content, imposition of local content quotas and restrictions on foreign ownership;
|
|
•
|
exchange controls, tariffs and other trade barriers;
|
|
•
|
differing degrees of protection for intellectual property and varying attitudes towards the piracy of intellectual property;
|
|
•
|
foreign privacy and data protection laws and regulations and changes in these laws;
|
|
•
|
the instability of foreign economies and governments;
|
|
•
|
war and acts of terrorism;
|
18
|
•
|
anti-corruption laws and regulations such as the Foreign Corrupt Practices Act and the U.K. Bribery Act that impose stringent requirements on how we conduct our foreign operations and changes in these laws and regulations; and
|
|
•
|
shifting consumer preferences regarding the viewing of video programming.
|
Events or developments related to these and other risks associated with international trade could adversely affect our revenues from non-U.S. sources, which could have a material adverse effect on our business, financial condition, operating results, liquidity and prospects.
Economic problems in the United States or in other parts of the world could adversely affect our results of operations.
Our business is affected by prevailing economic conditions and by disruptions to financial markets. We derive substantial revenues from advertisers, and these expenditures are sensitive to general economic conditions and consumer buying patterns. Financial instability or a general decline in economic conditions in the United States and other countries where our networks are distributed could adversely affect advertising rates and volume, which may result in a decrease in our advertising revenues.
Decreases in consumer discretionary spending in the U.S and other countries where our networks are distributed may affect cable television and other video service subscriptions, in particular with respect to digital service tiers on which certain of our programming networks are carried. This could lead to a decrease in the number of subscribers receiving our programming from multichannel video programming distributors, which could have a negative impact on our viewing subscribers and subscription fee revenues. Similarly, a decrease in viewing subscribers would also have a negative impact on the number of viewers actually watching the programs on our programming networks, which could also impact the rates we are able to charge advertisers.
Economic conditions affect a number of aspects of our businesses worldwide and impact the businesses of our advertisers on our networks and reduce their spending on advertising. Economic conditions can also negatively affect the ability of those with whom we do business to satisfy their obligations to us. The general worsening of current global economic conditions could adversely affect our business, financial condition or results of operations. Further worsening of economic conditions in certain specific parts of the world could impact the expansion and success of our businesses in such areas. Furthermore, some foreign markets where we operate may be more adversely affected by economic conditions than those prevailing in the U.S. or other countries.
Fluctuations in foreign exchange rates could have an adverse effect on our results of operations.
We have significant operations in a number of foreign jurisdictions and certain of our operations are conducted in foreign currencies. The value of these currencies fluctuates relative to the U.S. dollar. As a result, we are exposed to exchange rate fluctuations, which have had, and may in the future have, an adverse effect on our results of operations in a given period.
Specifically, we are exposed to foreign currency exchange rate risk to the extent that we enter into transactions denominated in currencies other than ours or our subsidiaries' respective functional currencies (non-functional currency risk), such as trade receivables, programming contracts, notes payable and notes receivable (including intercompany amounts) that are denominated in a currency other than the applicable functional currency. Changes in exchange rates with respect to amounts recorded in our consolidated balance sheets related to these items will result in unrealized (based upon period-end exchange rates) or realized foreign currency transaction gains and losses upon settlement of the transactions. Moreover, to the extent that our revenue, costs and expenses are denominated in currencies other than our or our subsidiaries' respective functional currencies, we will experience fluctuations in our revenue, costs and expenses solely as a result of changes in foreign currency exchange rates.
We also are exposed to unfavorable and potentially volatile fluctuations of the U.S. dollar (our reporting currency) against the currencies of our non-U.S. dollar functional currency operating subsidiaries when their respective financial statements are translated into U.S. dollars for inclusion in our consolidated financial statements. Cumulative translation adjustments are recorded in accumulated other comprehensive income (loss) as a separate component of equity. Any increase (decrease) in the value of the U.S. dollar against any foreign currency that is the functional currency of one of our operating subsidiaries will cause us to experience unrealized foreign currency translation losses (gains) with respect to amounts already invested in such foreign currencies. Accordingly, we may experience a negative impact on our comprehensive income (loss) and equity with respect to our holdings solely as a result of foreign currency translation. Our primary exposure to foreign currency risk from a foreign currency translation perspective is to the euro and, to a lesser extent, other local currencies in Europe. We generally do not hedge against the risk that we may incur non-cash losses upon the translation of the financial statements of our non-U.S. dollar functional currency operating subsidiaries and affiliates into U.S. dollars.
Our business is limited by United States regulatory constraints which may adversely impact our operations.
Although most aspects of our business generally are not directly regulated by the FCC, there are certain FCC regulations that govern our business either directly or indirectly. See Item 1, "Business—Regulation" in this Annual Report. Furthermore, to the extent that regulations and laws, either presently in force or proposed, hinder or stimulate the growth of the cable television, satellite or other multichannel video programming distributors, our business could be affected.
19
The United States Congress and the FCC currently have under consideration, and may in the future adopt, new laws, regulations and policies regarding a wide variety of matters that could, directly or indirectly, affect our operations.
The regulation of cable television services, satellite carriers, and other multichannel video programming distributors is subject to the political process and has been in constant flux over the past two decades. Further material changes in the law and regulatory requirements must be anticipated. We cannot assure you that our business will not be adversely affected by future legislation, new regulation or deregulation.
Our businesses are subject to risks of adverse regulation by foreign governments.
Programming businesses are subject to the regulations of the countries in which they operate as well as international bodies, such as the European Union ("E.U."). These regulations may include restrictions on advertising that can be sold on our networks, programming content requirements, requirements to make programming available on non-discriminatory terms, and local content quotas. Consequently, our businesses must adapt their ownership and organizational structure as well as their pricing and service offerings to satisfy the rules and regulations to which they are subject. A failure to comply with applicable rules and regulations could result in penalties, restrictions on our business or loss of required licenses or other adverse conditions.
Proposed or new legislation and regulations could also significantly affect our business. There currently are a number of proposals pending before federal, state, and foreign legislative and regulatory bodies, including a data protection regulation, known as the General Data Protection Regulation (GDPR), which has been finalized and is due to come into force in or around May 2018. The GDPR will include operational requirements for companies that receive or process personal data of residents of the European Union that are different than those currently in place in the European Union, and that will include significant penalties for non-compliance.
Adverse changes in rules and regulations could have a significant adverse impact on our profitability.
As a company that has operations in the United Kingdom, the vote by the United Kingdom to leave the E.U. could have an adverse impact on our business, results of operations and financial position.
On June 23, 2016, the U.K. held a referendum in which voters approved an exit from the E.U., commonly referred to as "Brexit." As a result of the referendum, the British government has begun negotiating the terms of the U.K.'s future relationship with the E.U. The effects of Brexit will depend on any agreements the U.K. makes to retain access to the E.U. markets either during a transitional period or more permanently. The measures could potentially disrupt the markets we serve and may cause us to lose subscribers, distributors and employees. If the U.K. loses access to the single E.U. market and the global trade deals negotiated by the E.U., it could have a detrimental impact on our U.K. growth. Such a decline could also make our doing business in Europe more difficult, which could delay and reduce the scope of our distribution and licensing agreements. Without access to the single E.U. market, it may be more challenging and costly to obtain intellectual property rights for our content within the U.K. or distribute our services in Europe. In addition, Brexit could lead to legal uncertainty and potentially divergent national laws and regulations as the U.K. determines which E.U. laws to replace and replicate. If there are changes to U.K. immigration policy as a result of Brexit, this could affect our employees and their ability to move freely between the E.U. member states for work related matters.
We face continually evolving cybersecurity and similar risks, which could result in the disclosure of confidential information, disruption of our programming, damage to our brands and reputation, legal exposure and financial losses.
We maintain information in digital form as necessary to conduct our business, including confidential and proprietary information regarding our content, distributors, advertisers, viewers and employees. Data maintained in digital form is subject to the risk of intrusion, tampering and theft. We develop and maintain systems to monitor and prevent this from occurring, but the development and maintenance of these systems is costly and requires ongoing monitoring and updating as technologies change and efforts to overcome security measures become more sophisticated. Despite our efforts, the risks of a data breach cannot be entirely eliminated and our information technology and other systems that maintain and transmit consumer, distributor, advertiser, Company, employee and other confidential information may be compromised by a malicious penetration of our network security, or that of a third party provider due to employee error, computer malware or ransomware, viruses, hacking and phishing attacks, or otherwise. Additionally, outside parties may attempt to fraudulently induce employees or users to disclose sensitive or confidential information in order to gain access to data. Because the techniques used to obtain unauthorized access, disable or degrade service, or sabotage systems change frequently and often are not recognized until launched against a target, we may be unable to anticipate these techniques or to implement adequate preventative measures. If our data systems are compromised, our ability to conduct our business may be impaired, we may lose profitable opportunities or the value of those opportunities may be diminished and, as described above, we may lose revenue as a result of unlicensed use of our intellectual property. Further, a penetration of our network security or other misappropriation or misuse of personal consumer or employee information could subject us to business, regulatory, litigation and reputation risk, which could have a negative effect on our business, financial condition and results of operations.
20
If our technology facilities fail or their operations are disrupted, or if we lose access to third party satellites, our performance could be hindered.
Our programming is transmitted using technology facilities at certain of our subsidiaries. These technology facilities are used for a variety of purposes, including signal processing, program editing, promotions, creation of programming segments to fill short gaps between featured programs, quality control, and live and recorded playback. These facilities are subject to interruption from fire, lightning, adverse weather conditions and other natural causes. Equipment failure, employee misconduct or outside interference could also disrupt the facilities' services. We maintain a full time disaster recovery site in Chandler, Arizona. The facility provides simultaneous playout of AMC and evergreen programming for SundanceTV, IFC and WE tv. In the event of a catastrophic failure of the Bethpage facility, the disaster recovery site can be operational within 1-2 hours. Evergreen programming would be replaced with scheduled programming within 12-24 hours for SundanceTV, IFC and WE tv.
In addition, we rely on third-party satellites in order to transmit our programming signals to our distributors. As with all satellites, there is a risk that the satellites we use will be damaged as a result of natural or man-made causes, or will otherwise fail to operate properly. Although we maintain in-orbit protection providing us with back-up satellite transmission facilities should our primary satellites fail, there can be no assurance that such back-up transmission facilities will be effective or will not themselves fail.
Any significant interruption at any of our technology facilities affecting the distribution of our programming, or any failure in satellite transmission of our programming signals, could have an adverse effect on our operating results and financial condition.
The loss of any of our key personnel and artistic talent could adversely affect our business.
We believe that our success depends to a significant extent upon the performance of our senior executives. We generally do not maintain "key man" insurance. In addition, we depend on the availability of third-party production companies to create most of our original programming. Some of the writers employed by certain of our subsidiaries and some of the employees of third party production companies that create our original programming are subject to collective bargaining agreements. Any labor disputes or a strike by one or more unions representing our subsidiary's writers or employees of third-party production companies who are essential to our original programming could have a material adverse effect on our original programming and on our business as a whole. The loss of any significant personnel or artistic talent, or our artistic talent losing their audience base, could also have a material adverse effect on our business.
Our inability to successfully make investments in, and/or acquire and integrate, other businesses, assets, products or technologies could harm our business, financial condition or operating results.
Our success may depend on opportunities to buy other businesses or technologies that could complement, enhance or expand our current business or products or that might otherwise offer us growth opportunities. We have acquired, and have made strategic investments in, a number of companies (including through joint ventures) in the past, and we expect to make additional acquisitions and strategic investments in the future. Such transactions may result in dilutive issuances of our equity securities, use of our cash resources, and incurrence of debt and amortization expenses related to intangible assets. Any acquisitions and strategic investments that we are able to identify and complete may be accompanied by a number of risks, including:
|
•
|
the difficulty of assimilating the operations and personnel of acquired companies into our operations;
|
|
•
|
the potential disruption of our ongoing business and distraction of management;
|
|
•
|
the incurrence of additional operating losses and operating expenses of the businesses we acquired or in which we invested;
|
|
•
|
the difficulty of integrating acquired technology and rights into our services and unanticipated expenses related to such integration;
|
|
•
|
the failure to successfully further develop an acquired business or technology and any resulting impairment of amounts currently capitalized as intangible assets;
|
|
•
|
the failure of strategic investments to perform as expected or to meet financial projections;
|
|
•
|
the potential for patent and trademark infringement and data privacy and security claims against the acquired companies, or companies in which we have invested;
|
|
•
|
litigation or other claims in connection with acquisitions, acquired companies, or companies in which we have invested;
|
|
•
|
the impairment or loss of relationships with customers and partners of the companies we acquired or in which we invested or with our customers and partners as a result of the integration of acquired operations;
|
|
•
|
the impairment of relationships with, or failure to retain, employees of acquired companies or our existing employees as a result of integration of new personnel;
|
|
•
|
the difficulty of integrating operations, systems, and controls as a result of cultural, regulatory, systems, and operational differences;
|
21
|
•
|
the performance of management of companies in which we invest but do not control;
|
|
•
|
in the case of foreign acquisitions and investments, the impact of particular economic, tax, currency, political, legal and regulatory risks associated with specific countries; and
|
|
•
|
the impact of known potential liabilities or liabilities that may be unknown, including as a result of inadequate internal controls, associated with the companies we acquired or in which we invested.
|
Our failure to be successful in addressing these risks or other problems encountered in connection with our past or future acquisitions and strategic investments could cause us to fail to realize the anticipated benefits of such acquisitions or investments, incur unanticipated liabilities, and harm our business, financial condition and results of operations.
We may have exposure to additional tax liabilities.
We are subject to income taxes as well as non-income based taxes, such as payroll, sales, use, value-added, net worth, property and goods and services taxes, in both the United States and various foreign jurisdictions. Significant judgment is required in determining our worldwide provision for income taxes and other tax liabilities. In the ordinary course of our business, there are many transactions and calculations where the ultimate tax determination is uncertain. We are regularly under audit by tax authorities in both the United States and various foreign jurisdictions. Although we believe that our tax estimates are reasonable, (1) there is no assurance that the final determination of tax audits or tax disputes will not be different from what is reflected in our historical income tax provisions, expense amounts for non-income based taxes and accruals and (2) any material differences could have an adverse effect on our financial position and results of operations in the period or periods for which determination is made.
Although a portion of our revenue and operating income is generated outside the United States, we are subject to potential current U.S. income tax on this income due to our being a U.S. corporation. Our worldwide effective tax rate may be reduced under a provision in U.S. tax law that defers the imposition of U.S. tax on certain foreign active income until that income is repatriated to the United States. Any repatriation of assets held in foreign jurisdictions or recognition of foreign income that fails to meet the U.S. tax requirements related to deferral of U.S. income tax may result in a higher effective tax rate for the Company. This includes what is referred to as "Subpart F Income," which generally includes, but is not limited to, such items as interest, dividends, royalties, gains from the disposition of certain property, certain currency exchange gains in excess of currency exchange losses, and certain related party sales and services income. While the Company may mitigate this increase in its effective tax rate through claiming a foreign tax credit against its U.S. federal income taxes or potentially have foreign or U.S. taxes reduced under applicable income tax treaties, we are subject to various limitations on claiming foreign tax credits or we may lack treaty protections in certain jurisdictions that will potentially limit any reduction of the increased effective tax rate. A higher effective tax rate may also result to the extent that losses are incurred in non-U.S. subsidiaries that do not reduce our U.S. taxable income.
On December 22, 2017 the Tax Cuts and Jobs Act ("TCJA") was enacted and is expected to significantly impact companies' accounting for and reporting of income taxes. Under the TCJA, the Subpart F rules continue to exist in addition to a minimum tax on certain foreign earnings in excess of 10 percent of the foreign subsidiaries tangible assets (i.e., global intangible low-taxed income or GILTI). The TCJA also allows a reduced tax on excess returns of a U.S. corporation from foreign sales (i.e., foreign derived intangibles income or FDII). As a transition from the deferral of U.S. tax on certain foreign active income to the new tax laws, the TCJA set forth a one-time transition tax based on total post-1986 earnings and profits ("E&P") of certain foreign subsidiaries that were previously tax deferred. While the Company may mitigate any potential negative impacts of the one-time transition tax or other effects of tax reform through claiming a foreign tax credit against its U.S. federal income taxes, we are subject to various limitations on claiming foreign tax credits that may limit any reduction of the increased effective rate
.
We are subject to changing tax laws, treaties and regulations in and between countries in which we operate, including treaties between the United States and other nations. A change in these tax laws, treaties or regulations, including those in and involving the United States, or in the interpretation thereof, could result in a materially higher or lower income or non-income tax expense. Also, various income tax proposals in the countries in which we operate, such as those relating to fundamental U.S. international tax reform and measures in response to the economic uncertainty in certain European jurisdictions in which we operate, could result in changes to the existing tax laws under which our taxes are calculated. We are unable to predict whether any of these or other proposals in the United States or foreign jurisdictions will ultimately be enacted. Any such changes could negatively impact our business.
A significant amount of our book value consists of intangible assets that may not generate cash in the event of a voluntary or involuntary sale.
At
December 31, 2017
, our consolidated financial statements included approximately
$5.0 billion
of consolidated total assets, of which approximately
$1.2 billion
were classified as intangible assets. Intangible assets primarily include affiliation agreements and affiliate relationships, advertiser relationships, trademarks and goodwill. While we believe that the carrying values of our intangible assets are recoverable, there is no assurance that we would receive any cash from the voluntary or involuntary sale of these intangible assets, particularly if we were not continuing as an operating business.
22
We may have a significant indemnity obligation if the Distribution is treated as a taxable transaction.
Prior to the distribution of all of the outstanding common stock of the Company to stockholders of Cablevision, which is now a subsidiary of Altice USA, in the Distribution, Cablevision received a private letter ruling from the Internal Revenue Service ("IRS") to the effect that, among other things, the Distribution, and certain related transactions would qualify for tax-free treatment under the Internal Revenue Code (the "Code") to Cablevision, AMC Networks, and holders of Cablevision common stock. Although a private letter ruling from the IRS generally is binding on the IRS, if the factual representations or assumptions made in the letter ruling request were untrue or incomplete in any material respect, Cablevision would not be able to rely on the ruling. Furthermore, the IRS will not rule on whether a distribution satisfies certain requirements necessary to obtain tax-free treatment under the Code. Rather, the ruling was based upon representations by Cablevision that these conditions were satisfied, and any inaccuracy in such representations could invalidate the ruling.
If the Distribution does not qualify for tax-free treatment for United States federal income tax purposes, then, in general, Cablevision would be subject to tax as if it had sold the common stock of our Company in a taxable sale for its fair market value. Cablevision's stockholders would be subject to tax as if they had received a distribution equal to the fair market value of our common stock that was distributed to them, which generally would be treated first as a taxable dividend to the extent of Cablevision's earnings and profits, then as a non-taxable return of capital to the extent of each stockholder's tax basis in his or her Cablevision stock, and thereafter as capital gain with respect to the remaining value. It is expected that the amount of any such taxes to Cablevision's stockholders and Cablevision would be substantial.
As part of the Distribution, we entered into a tax disaffiliation agreement with Cablevision, which sets out each party's rights and obligations with respect to deficiencies and refunds, if any, of federal, state, local or foreign taxes for periods before and after the Distribution and related matters such as the filing of tax returns and the conduct of IRS and other audits. Pursuant to the tax disaffiliation agreement, we are required to indemnify Cablevision for losses and taxes of Cablevision relating to the Distribution or any related debt exchanges resulting from the breach of certain covenants, including as a result of certain acquisitions of our stock or assets or as a result of modification or repayment of certain related debt in a manner inconsistent with the private letter ruling or letter ruling request. If we are required to indemnify Cablevision under the circumstances set forth in the tax disaffiliation agreement, we may be subject to substantial liabilities, which could have a material negative effect on our business, results of operations, financial position and cash flows.
Risks Relating to Our Debt
Our substantial long-term debt and high leverage could adversely affect our business.
We have a significant amount of long-term debt. As of
December 31, 2017
, we had
$3.2 billion
principal amount of total long-term debt (excluding capital leases),
$750.0 million
of which is senior secured debt under our Credit Facility and
$2.4 billion
of which is senior unsecured debt.
Our ability to make payments on, or repay or refinance, our debt, and to fund planned distributions and capital expenditures, will depend largely upon our future operating performance. Our future performance, to a certain extent, is subject to general economic, financial, competitive, regulatory and other factors that are beyond our control. In addition, our ability to borrow funds in the future to make payments on our debt will depend on the satisfaction of the covenants in the Credit Facility and our other debt agreements, including indentures governing our notes and other agreements we may enter into in the future.
Our substantial amount of debt could have important consequences. For example, it could:
|
•
|
increase our vulnerability to general adverse economic and industry conditions;
|
|
•
|
require us to dedicate a substantial portion of our cash flow from operations to make interest and principal payments on our debt, thereby limiting the availability of our cash flow to fund future programming investments, capital expenditures, working capital, business activities and other general corporate requirements;
|
|
•
|
limit our flexibility in planning for, or reacting to, changes in our business and the industry in which we operate;
|
|
•
|
place us at a competitive disadvantage compared with our competitors; and
|
|
•
|
limit our ability to borrow additional funds, even when necessary to maintain adequate liquidity.
|
In the long-term, we do not expect to generate sufficient cash from operations to repay at maturity our outstanding debt obligations. As a result, we will be dependent upon our ability to access the capital and credit markets. Failure to raise significant amounts of funding to repay these obligations at maturity could adversely affect our business. If we are unable to raise such amounts, we would need to take other actions including selling assets, seeking strategic investments from third parties or reducing other discretionary uses of cash. The Credit Facility and indentures governing our notes will restrict, and market or business conditions may limit, our ability to do some of these things.
A significant portion of our debt bears interest at variable rates. While we hav
e entered into hedging agreements limiting our exposure to higher interest rates, such agreements do not offer complete protection from this risk.
23
The agreements governing our debt contain various covenants that impose restrictions on us that may affect our ability to operate our business.
The agreements governing the Credit Facility and the indentures governing our notes contain covenants that, among other things, limit our ability to:
|
•
|
borrow money or guarantee debt;
|
|
•
|
create liens;
|
|
•
|
pay dividends on or redeem or repurchase stock;
|
|
•
|
make specified types of investments;
|
|
•
|
enter into transactions with affiliates; and
|
|
•
|
sell assets or merge with other companies.
|
The Credit Facility requires us to comply with a Cash Flow Ratio and an Interest Coverage Ratio, each as defined in Item 7, "Management's Discussion and Analysis of Financial Condition and Results of Operations — Debt Financing Agreements."
Compliance with these covenants may limit our ability to take actions that might be to the advantage of the Company and our stockholders.
Various risks, uncertainties and events beyond our control could affect our ability to comply with these covenants and maintain these financial ratios. Failure to comply with any of the covenants in our existing or future financing agreements could result in a default under those agreements and under other agreements containing cross-default provisions. A default would permit lenders to accelerate the maturity for the debt under these agreements and to foreclose upon any collateral securing the debt. Under these circumstances, we might not have sufficient funds or other resources to satisfy all of our obligations. In addition, the limitations imposed by financing agreements on our ability to incur additional debt and to take other actions might significantly impair our ability to obtain other financing.
Despite our current levels of debt, we may still be able to incur substantially more debt. This could further exacerbate the risks associated with our substantial debt.
We may be able to incur additional debt in the future. The terms of the Credit Facility and indentures governing our notes allow us to incur substantial amounts of additional debt, subject to certain limitations. In addition, as we have in the past, we may in the future refinance all or a portion of our debt, including borrowings under the Credit Facility, and obtain the ability to incur more debt as a result. If new debt is added to our current debt levels, the related risks we could face would be magnified.
A lowering or withdrawal of the ratings assigned to our debt securities by rating agencies may further increase our future borrowing costs and reduce our access to capital.
The debt ratings for our notes are below the "investment grade" category, which results in higher borrowing costs as well as a reduced pool of potential purchasers of our debt as some investors will not purchase debt securities that are not rated in an investment grade rating category. In addition, there can be no assurance that any rating assigned will remain for any given period of time or that a rating will not be lowered or withdrawn entirely by a rating agency, if in that rating agency's judgment, future circumstances relating to the basis of the rating, such as adverse changes, so warrant. A lowering or withdrawal of a rating may further increase our future borrowing costs and reduce our access to capital.
Risks Relating to Our Controlled Ownership
We are controlled by the Dolan family and trusts for their benefit, which may create certain conflicts of interest. In addition, as a result of their control, the Dolan family has the ability to prevent or cause a change in control or approve, prevent or influence certain actions by the Company.
We have two classes of common stock:
|
•
|
Class A Common Stock, which is entitled to one vote per share and is entitled collectively to elect 25% of our Board of Directors.
|
|
•
|
Class B Common Stock, which is generally entitled to ten votes per share and is entitled collectively to elect the remaining 75% of our Board of Directors.
|
As of
December 31, 2017
, the Dolan family, including trusts for the benefit of members of the Dolan family (collectively "the Dolan Family Group"), own all of our Class B Common Stock, approximately
2%
of our outstanding Class A Common Stock and approximately
71%
of the total voting power of all our outstanding common stock. The members of the Dolan Family Group have executed a voting agreement that has the effect of causing the voting power of the holders of our Class B Common Stock to be cast as provided therein with respect to all matters to be voted on by holders of Class B Common Stock. Under the Stockholders Agreement, the shares of Class B Common Stock owned by members of the Dolan Family Group are to be voted on all matters
24
in accordance with the determination of the Dolan Family Committee, except that the decisions of the Dolan Family Committee are non-binding with respect to the Class B Common Stock owned by certain Dolan family trusts (the "Excluded Trusts") that collectively own
48%
of the outstanding Class B Common Stock. The Dolan Family Committee consists of Charles F. Dolan and his six children, James L. Dolan, Thomas C. Dolan, Patrick F. Dolan, Kathleen M. Dolan, Marianne E. Dolan and Deborah A. Dolan-Sweeney (collectively, the "Dolan Siblings"). The Dolan Family Committee generally acts by vote of a majority of the Dolan Siblings, except that a vote on a going-private transaction must be approved by a two-thirds vote of the Dolan siblings and a vote on a change-in-control transaction must be approved by not less than all but one of the Dolan Siblings. The Dolan Family Group is able to prevent a change in control of our Company and no person interested in acquiring us will be able to do so without obtaining the consent of the Dolan Family Group.
Shares of Class B Common Stock owned by Excluded Trusts are to be voted on all matters in accordance with the determination of the Excluded Trusts holding a majority of the Class B Common Stock held by all Excluded Trusts, except in the case of a vote on a going-private transaction or a change in control transaction, in which case a vote of trusts holding two-thirds of the Class B Common Stock owned by Excluded Trusts is required.
The Dolan Family Group by virtue of their stock ownership, have the power to elect all of our directors subject to election by holders of Class B Common Stock and are able collectively to control stockholder decisions on matters on which holders of all classes of our common stock vote together as a single class. These matters could include the amendment of some provisions of our certificate of incorporation and the approval of fundamental corporate transactions.
In addition, the affirmative vote or consent of the holders of at least 66 2/3% of the outstanding shares of the Class B Common Stock, voting separately as a class, is required to approve:
|
•
|
the authorization or issuance of any additional shares of Class B Common Stock, and
|
|
•
|
any amendment, alteration or repeal of any of the provisions of our certificate of incorporation that adversely affects the powers, preferences or rights of the Class B Common Stock.
|
As a result, the Dolan Family Group has the power to prevent such issuance or amendment.
We have adopted a written policy whereby an independent committee of our Board of Directors will review and approve or take such other action as it may deem appropriate with respect to certain transactions involving the Company and its subsidiaries, on the one hand, and certain related parties, including Charles F. Dolan and certain of his family members and related entities on the other hand. This policy does not address all possible conflicts which may arise, and there can be no assurance that this policy will be effective in dealing with conflict scenarios.
We are a "controlled company" for The NASDAQ Stock Market LLC purposes, which allows us not to comply with certain of the corporate governance rules of The NASDAQ Stock Market LLC.
Members of the Dolan Family Group have entered into a stockholders agreement relating, among other things, to the voting and transfer of their shares of our Class B Common Stock. As a result, we are a "controlled company" under the corporate governance rules of The NASDAQ Stock Market LLC ("NASDAQ"). As a controlled company, we have the right to elect not to comply with the corporate governance rules of NASDAQ requiring: (i) a majority of independent directors on our Board of Directors, (ii) an independent compensation committee and (iii) an independent corporate governance and nominating committee. Our Board of Directors has elected for the Company to be treated as a "controlled company" under NASDAQ corporate governance rules and not to comply with the NASDAQ requirement for a majority independent board of directors and an independent corporate governance and nominating committee because of our status as a controlled company. For purposes of this agreement, the term "independent directors" means the directors of the Company who have been determined by our Board of Directors to be independent directors for purposes of NASDAQ corporate governance standards.
Future stock sales, including as a result of the exercising of registration rights by certain of our shareholders, could adversely affect the trading price of our Class A Common Stock.
Certain parties have registration rights covering a portion of our shares. We have entered into registration rights agreements with Charles F. Dolan, members of his family, certain Dolan family interests and the Dolan Family Foundations that provide them with "demand" and "piggyback" registration rights with respect to approximately
12.5 million
shares of Class A Common Stock, including shares issuable upon conversion of shares of Class B Common Stock. Sales of a substantial number of shares of Class A Common Stock could adversely affect the market price of the Class A Common Stock and could impair our future ability to raise capital through an offering of our equity securities.
We share certain executives and directors with The Madison Square Garden Company("MSG") and MSG Networks Inc.("MSG Networks"), which may give rise to conflicts.
One of our executives, Gregg G. Seibert, serves as a Vice Chairman of the Company and as a Vice Chairman of MSG and MSG Networks (collectively MSG and MSG Networks, the "Other Entities"). Each of the Other Entities and the Company are
25
affiliates by virtue of being under common control of the Dolan family. As a result, he will not be devoting his full time and attention to the Company's affairs. In addition, six members of our Board are directors of MSG and four members of our Board are directors of MSG Networks. These directors may have actual or apparent conflicts of interest with respect to matters involving or affecting each company. For example, the potential for a conflict of interest exists when we on one hand, and an Other Entity on the other hand, consider acquisitions and other corporate opportunities that may be suitable for us and for the Other Entity. Also, conflicts may arise if there are issues or disputes under the commercial arrangements that exist between the Other Entities and us. In addition, certain of our directors and officers own stock, restricted stock units and options to purchase stock in one or more of the Other Entities, as well as cash performance awards with any payout based on the performance of one or more of the Other Entities. These ownership interests could create actual, apparent or potential conflicts of interest when these individuals are faced with decisions that could have different implications for our Company and one or more of the Other Entities. See "Certain Relationships and Related Party Transactions—Certain Relationships and Potential Conflicts of Interest" in our proxy statement filed with the SEC on April 27, 2017 for a description of our related party transaction approval policy that we have adopted to help address such potential conflicts that may arise.
Our overlapping directors and executives with the Other Entities may result in the diversion of corporate opportunities to and other conflicts with the Other Entities and provisions in our governance documents may provide us no remedy in that circumstance.
The Company's amended and restated certificate of incorporation acknowledges that directors and officers of the Company may also be serving as directors, officers, employees, consultants or agents of MSG and its subsidiaries and that the Company may engage in material business transactions with such entity. Our policy concerning certain matters relating to MSG Networks, including responsibilities of overlapping directors and officers (the "overlap policy" and together with the applicable provisions of the amended and restated certificate of incorporation, the "Overlap Provisions") acknowledges that directors and officers of the Company may also be serving as directors, officers, employees, consultants or agents of MSG Networks and its subsidiaries and that the Company may engage in material business transactions with such entity. The Company has renounced its rights to certain business opportunities and the Overlap Provisions provide that no director or officer of the Company who is also serving as a director, officer, employee, consultant or agent of an Other Entity or any subsidiary of an Other Entity will be liable to the Company or its stockholders for breach of any fiduciary duty that would otherwise exist by reason of the fact that any such individual directs a corporate opportunity (other than certain limited types of opportunities set forth in our certificate of incorporation) to the Other Entity or any of its subsidiaries, or does not refer or communicate information regarding such corporate opportunities to the Company. The Overlap Provisions also expressly validate certain contracts, agreements, assignments and transactions (and amendments, modifications or terminations thereof) between the Company and the Other Entities and their subsidiaries and, to the fullest extent permitted by law, provide that the actions of the overlapping directors or officers in connection therewith are not breaches of fiduciary duties owed to the Company, any of its subsidiaries or their respective stockholders.
None.
We lease approximately
588,000
square feet of space in the U.S., including approximately
335,000
square feet of office space that we lease at 11 Penn Plaza, New York, NY 10001, under lease arrangements with remaining terms of up to
ten
years. We use this space as our corporate headquarters and as the principal business location of our Company. We also lease approximately
67,000
square-feet of space for our broadcasting and technology center in Bethpage, New York under a lease arrangement with a remaining term of
two
years, from which AMC Networks Broadcasting & Technology conducts its operations. In addition, we lease other properties in New York, California and Florida.
We lease approximately
227,000
square feet of space outside of the U.S., including in Spain, Hungary and the United Kingdom that support our international operations.
We believe our properties are adequate for our use.
On December 17, 2013, Frank Darabont ("Darabont"), Ferenc, Inc., Darkwoods Productions, Inc., and Creative Artists Agency, LLC (together, the "2013 Plaintiffs"), filed a complaint in New York Supreme Court in connection with Darabont's rendering services as a writer, director and producer of the television series entitled
The Walking Dead
and the agreement between the parties related thereto. The Plaintiffs asserted claims for breach of contract, breach of the covenant of good faith and fair dealing, for an accounting and for declaratory relief. On August 19, 2015, Plaintiffs filed their First Amended Complaint (the "Amended Complaint"), in which they retracted their claims for wrongful termination and failure to apply production tax credits in calculating Plaintiffs' contingent compensation. Plaintiffs also added a claim that Darabont is entitled to a larger share, on a
26
percentage basis, of contingent compensation than he is currently being accorded. On September 26, 2016, Plaintiffs filed their note of issue and certificate of readiness for trial, which included a claim for damages of
$280 million
or more and indicated that the parties have completed fact and expert discovery. The parties each filed motions for summary judgment. Oral arguments of the summary judgment motions took place on September 15, 2017. The Court has not yet ruled on the summary judgment motions. The Company has opposed Plaintiffs' claims. The Company believes that the asserted claims are without merit, denies the allegations and continues to defend the case vigorously. At this time, no determination can be made as to the ultimate outcome of this litigation or the potential liability, if any, on the part of the Company.
On August 14, 2017, Robert Kirkman, Robert Kirkman, LLC, Glen Mazzara, 44 Strong Productions, Inc., David Alpert, Circle of Confusion Productions, LLC, New Circle of Confusion Productions, Inc., Gale Anne Hurd, and Valhalla Entertainment, Inc. f/k/a Valhalla Motion Pictures, Inc. (together, the “California Plaintiffs”) filed a complaint in California Superior Court in connection with California Plaintiffs’ rendering of services as writers and producers of the television series entitled
The Walking Dead
, as well as
Fear the Walking Dead
and/or
Talking Dead
, and the agreements between the parties related thereto (the "California Action"). The California Plaintiffs asserted that the Company has been improperly underpaying the California Plaintiffs under their contracts with the Company and they assert claims for breach of contract, breach of the covenant of good faith and fair dealing, inducing breach of contract, and liability for violation of Cal. Bus. & Prof. Code § 17200. On August 15, 2017, two of the California Plaintiffs, Gale Anne Hurd and David Alpert (and their associated production companies), along with Charles Eglee and his production company, United Bongo Drum, Inc., filed a complaint in New York Supreme Court alleging nearly identical claims as the California Action (the "New York Action"). Hurd, Alpert, and Eglee filed the New York Action in connection with their contract claims involving
The Walking Dead
because their agreements contained exclusive New York jurisdiction provisions. On October 23, 2017, the parties stipulated to discontinuing the New York Action without prejudice and consolidating all of the claims in the California Action. The California Plaintiffs seek compensatory and punitive damages and restitution. While answers and/or responsive motions have yet to be filed, the Company believes that the asserted claims are without merit and will vigorously defend against them. At this time, no determination can be made as to the ultimate outcome of this litigation or the potential liability, if any, on the part of the Company.
On January 18, 2018, the 2013 Plaintiffs filed a second action in New York Supreme Court in connection with Darabont’s services on
The Walking Dead
television series and agreements between the parties related thereto. The claims in the action allegedly arise from Plaintiffs' audit of their participation statements covering the accounting period from inception of
The Walking Dead
through September 30, 2014. Plaintiffs seek no less than
$20 million
in damages on claims for breach of contract, breach of the covenant of good faith and fair dealing, and declaratory relief. Plaintiffs also seek a judicial determination that their contracts with the Company entitle them to an "actual fair market license fee" in connection with AMC Networks telecasting of
The Walking Dead
, which they allege is "substantially better than" what they received. The Company has not yet responded to the Complaint, and it has not yet been determined to what extent, if any, this action will be consolidated with the action Plaintiffs filed in the New York Supreme Court on December 17, 2013. The Company believes that the asserted claims are without merit, denies the allegations and will defend the case vigorously. At this time, no determination can be made as to the ultimate outcome of this litigation or the potential liability, if any, on the part of the Company.
The Company is party to various lawsuits and claims in the ordinary course of business, including the matters described above. Although the outcome of these matters cannot be predicted with certainty and while the impact of these matters on the Company's results of operations in any particular subsequent reporting period could be material, management does not believe that the resolution of these matters will have a material adverse effect on the financial position of the Company or the ability of the Company to meet its financial obligations as they become due.
Not applicable.
27
Our Class A Common Stock is listed on NASDAQ under the symbol "AMCX." Our Class B Common Stock is not listed on any exchange. Our Class A Common Stock began trading on NASDAQ on July 1, 2011.
Performance Graph
The following graph compares the performance of the Company's Class A Common Stock with the performance of the S&P Mid-Cap 400 Index and a peer group (the "Peer Group Index") by measuring the changes in our Class A Common Stock prices from July 1, 2011, the first day our Class A Common Stock began regular-way trading on NASDAQ, through
December 31, 2017
. Because no published index of comparable media companies currently reports values on a dividends-reinvested basis, the Company has created a Peer Group Index for purposes of this graph in accordance with the requirements of the SEC. The Peer Group Index is made up of companies that engage in cable television programming as a significant element of their business, although not all of the companies included in the Peer Group Index participate in all of the lines of business in which the Company is engaged, and some of the companies included in the Peer Group Index also engage in lines of business in which the Company does not participate. Additionally, the market capitalizations of many of the companies included in the Peer Group are quite different from that of the Company. The common stocks of the following companies have been included in the Peer Group Index: Discovery Communications Inc., the Walt Disney Company, Scripps Networks Interactive Inc., Time Warner Inc., Twenty-First Century Fox Inc. and Viacom Inc. The chart assumes $100 was invested on December 31, 2012 in each of: i) Company's Class A Common Stock, ii) the S&P Mid-Cap 400 Index, and iii) in this Peer Group weighted by market capitalization.
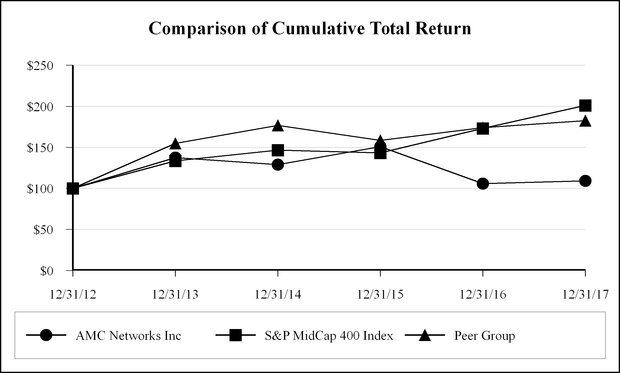
|
|
INDEXED RETURNS
Period Ended
|
|||||||||||
|
Company Name / Index
|
Base Period 12/31/12
|
12/31/13
|
12/31/14
|
12/31/15
|
12/31/16
|
12/31/17
|
||||||
|
AMC Networks Inc.
|
100
|
137.60
|
128.83
|
150.87
|
105.74
|
109.25
|
||||||
|
S&P MidCap 400 Index
|
100
|
133.50
|
146.54
|
143.35
|
173.08
|
201.20
|
||||||
|
Peer Group
|
100
|
154.90
|
176.82
|
158.53
|
174.11
|
182.62
|
||||||
28
This performance graph shall not be deemed "filed" for purposes of Section 18 of the Securities Exchange Act of 1934, as amended (the "Exchange Act") or incorporated by reference into any of our filings under the Securities Act of 1933, as amended, or the Exchange Act, except as shall be expressly set forth by specific reference in such filing.
As of
February 15, 2018
there were
708
holders of record of our Class A Common Stock and
35
holders of record of our Class B Common Stock. We did not pay any cash dividend on our common stock during 2017 and do not expect to pay a cash dividend on our common stock for the foreseeable future. Our Credit Facility and our other debt agreements restrict our ability to declare dividends in certain situations, see Item 7, "Management's Discussion and Analysis of Financial Condition and Results of Operations — Debt Financing Agreements" and Note
10
to the accompanying consolidated financial statements.
Price Range of AMC Networks' Class A Common Stock
The following table sets forth for the periods indicated the intra-day high and low sales prices per share of the AMCX Class A Common Stock as reported on the NASDAQ:
|
Year Ended December 31, 2017
|
High
|
Low
|
||||||
|
First Quarter
|
$
|
67.61
|
|
$
|
52.39
|
|
||
|
Second Quarter
|
$
|
61.53
|
|
$
|
51.51
|
|
||
|
Third Quarter
|
$
|
67.44
|
|
$
|
53.25
|
|
||
|
Fourth Quarter
|
$
|
60.66
|
|
$
|
46.89
|
|
||
|
Year Ended December 31, 2016
|
High
|
Low
|
||||||
|
First Quarter
|
$
|
78.13
|
|
$
|
60.30
|
|
||
|
Second Quarter
|
$
|
70.28
|
|
$
|
54.81
|
|
||
|
Third Quarter
|
$
|
60.80
|
|
$
|
49.93
|
|
||
|
Fourth Quarter
|
$
|
56.27
|
|
$
|
46.17
|
|
||
On March 7, 2016, the Company announced that its Board of Directors authorized a program to repurchase up to
$500 million
of its outstanding shares of common stock (the "2016 Stock Repurchase Program"). On June 6, 2017, the Board of Directors approved an increase of
$500 million
in the amount authorized for a total of
$1.0 billion
authorized under the 2016 Stock Repurchase Program.The 2016 Stock Repurchase Program has no pre-established closing date and may be suspended or discontinued at any time. For the year ended
December 31, 2017
, the Company repurchased
7.8 million
shares of its Class A common stock at an average purchase price of
$55.74
per share. As of
December 31, 2017
, the Company has
$342.6 million
available for repurchase under the 2016 Stock Repurchase Program.
|
Period
|
Total Number of Shares
(or Units) Purchased
|
Average Price Paid per Share (or Unit)
|
Total Number of Shares (or Units) Purchased as Part of Publicly Announced Plans or Programs
|
Maximum Number (or Approximate Dollar Value) of Shares (or Units) that May Yet Be Purchased Under the Plans or Programs
|
||||||||||
|
October 1, 2017 to October 31, 2017
|
1,033,761
|
|
$
|
54.96
|
|
1,033,761
|
|
$
|
373,614,300
|
|
||||
|
November 1, 2017 to November 30, 2017
|
508,689
|
|
$
|
50.11
|
|
508,689
|
|
$
|
348,125,076
|
|
||||
|
December 1, 2017 to December 31, 2017
|
103,937
|
|
$
|
53.61
|
|
103,937
|
|
$
|
342,552,735
|
|
||||
|
Total
|
1,646,387
|
|
$
|
53.37
|
|
1,646,387
|
|
|||||||
29
The operating data for each of the three years ended December 31,
2017
and balance sheet data as of December 31,
2017
and
2016
included in the table below have been derived from the audited consolidated financial statements of the Company included in this Annual Report and should be read in conjunction with Item 7, "Management's Discussion and Analysis of Financial Condition and Results of Operations" and the accompanying consolidated financial statements and related notes. The operating data for the years ended December 31,
2014
and
2013
and balance sheet data as of December 31,
2015
,
2014
and
2013
included in the table below have been derived from the audited consolidated financial statements of the Company, not included in this Annual Report.
|
|
Years Ended December 31,
|
||||||||||||||||||
|
|
2017
(1) (2)
|
2016
(1) (2)
|
2015
(2)
|
2014
(2)
|
2013
(3)
|
||||||||||||||
|
|
(In thousands, except per share amounts)
|
||||||||||||||||||
|
Operating Data:
|
|||||||||||||||||||
|
Revenues, net
|
$
|
2,805,691
|
|
$
|
2,755,654
|
|
$
|
2,580,935
|
|
$
|
2,175,641
|
|
$
|
1,591,858
|
|
||||
|
Operating income
|
722,359
|
|
657,556
|
|
709,193
|
|
546,353
|
|
582,167
|
|
|||||||||
|
Income from continuing operations
|
489,637
|
|
289,963
|
|
381,704
|
|
267,873
|
|
290,160
|
|
|||||||||
|
Loss from discontinued operations, net of income taxes
|
—
|
|
—
|
|
—
|
|
(3,448
|
)
|
—
|
|
|||||||||
|
Net (income) loss attributable to noncontrolling interests
|
(18,321
|
)
|
(19,453
|
)
|
(14,916
|
)
|
(3,628
|
)
|
578
|
|
|||||||||
|
Net income attributable to AMC Networks' stockholders
|
$
|
471,316
|
|
$
|
270,510
|
|
$
|
366,788
|
|
$
|
260,797
|
|
$
|
290,738
|
|
||||
|
Net income per share attributable to AMC Networks' stockholders:
|
|||||||||||||||||||
|
Basic
|
$
|
7.26
|
|
$
|
3.77
|
|
$
|
5.06
|
|
$
|
3.67
|
|
$
|
4.06
|
|
||||
|
Diluted
|
$
|
7.18
|
|
$
|
3.74
|
|
$
|
5.01
|
|
$
|
3.63
|
|
$
|
4.00
|
|
||||
|
|
|||||||||||||||||||
|
Cash and cash equivalents
|
$
|
558,783
|
|
$
|
481,389
|
|
$
|
316,321
|
|
$
|
201,367
|
|
$
|
521,951
|
|
||||
|
Total assets
|
5,032,985
|
|
4,480,595
|
|
4,250,609
|
|
3,949,826
|
|
2,612,641
|
|
|||||||||
|
Long-term debt (including capital leases)
|
3,130,381
|
|
2,859,129
|
|
2,701,148
|
|
2,763,144
|
|
2,147,240
|
|
|||||||||
|
Stockholders' equity (deficiency)
|
$
|
134,944
|
|
$
|
(30,082
|
)
|
$
|
(39,277
|
)
|
$
|
(371,755
|
)
|
$
|
(571,519
|
)
|
||||
(1)
The 2017 and 2016 results include impairment and related charges of $28.1 million and $67.8 million, respectively (see Note
3
to the accompanying consolidated financial statements).
(2)
The 2017, 2016 and 2015 results include restructuring expense of $6.1 million, $29.5 million and $15.0 million (see Note
4
to the accompanying consolidated financial statements). The 2014 results include restructuring expense of $15.7 million.
(3)
The 2013 results include a litigation settlement gain of $133.0 million in connection with a settlement with DISH Network.
30
Management's discussion and analysis of financial condition and results of operations, or MD&A, is a supplement to and should be read in conjunction with the accompanying consolidated financial statements and related notes. This section provides additional information regarding our businesses, recent developments, results of operations, cash flows, financial condition, contractual commitments and critical accounting policies.
Introduction
Our MD&A is provided to enhance the understanding of our financial condition, changes in financial condition and results of our operations and is organized as follows:
Business Overview
. This section provides a general description of our business and our operating segments, as well as other matters that we believe are important in understanding our results of operations and financial condition and in anticipating future trends.
Consolidated Results of Operations
. This section provides an analysis of our results of operations for the years ended
December 31, 2017
,
2016
and
2015
. Our discussion is presented on both a consolidated and segment basis. Our two segments are: (i) National Networks and (ii) International and Other.
Liquidity and Capital Resources
. This section provides a discussion of our financial condition as of
December 31, 2017
as well as an analysis of our cash flows for the years ended
December 31, 2017
,
2016
and
2015
. The discussion of our financial condition and liquidity includes summaries of (i) our primary sources of liquidity and (ii) our contractual obligations and off balance sheet arrangements that existed at
December 31, 2017
.
Critical Accounting Policies and Estimates
. This section provides a discussion of our accounting policies considered to be important to an understanding of our financial condition and results of operations, and which require significant judgment and estimates on the part of management in their application.
Business Overview
We own and operate entertainment businesses and assets. We manage our business through the following two operating segments:
|
•
|
National Networks:
Includes activities of our five national programming networks, AMC Studios operations and AMC Broadcasting & Technology. Our national programming networks are AMC, WE tv, BBC AMERICA, IFC, and SundanceTV in the U.S.; and AMC, IFC and Sundance Channel in Canada. Our AMC Studios operations produces original programming for our programming networks and also licenses such program rights worldwide. AMC Networks Broadcasting & Technology is our technical services business, which primarily services most of the national programming networks.
|
|
•
|
International and Other
: Principally includes AMC Networks International, the Company's international programming businesses consisting of a portfolio of channels in Europe, Latin America, the Middle East and parts of Asia and Africa; IFC Films, the Company's independent film distribution business; AMCNI – DMC, the broadcast solutions unit of certain networks of AMCNI and third-party networks (the AMCNI – DMC business was sold on July 12, 2017); and our subscription streaming services, Sundance Now and Shudder.
|
31
Financial Results Overview
The tables presented below set forth our consolidated revenues, net, operating income (loss) and adjusted operating income ("AOI"), defined below, for the periods indicated.
|
(In thousands)
|
Years Ended December 31,
|
||||||||||
|
2017
|
2016
|
2015
|
|||||||||
|
Revenues, net
|
|||||||||||
|
National Networks
|
$
|
2,367,615
|
|
$
|
2,311,040
|
|
$
|
2,135,367
|
|
||
|
International and Other
|
457,182
|
|
459,996
|
|
452,578
|
|
|||||
|
Inter-segment eliminations
|
(19,106
|
)
|
(15,382
|
)
|
(7,010
|
)
|
|||||
|
Consolidated revenues, net
|
$
|
2,805,691
|
|
$
|
2,755,654
|
|
$
|
2,580,935
|
|
||
|
Operating income (loss)
|
|||||||||||
|
National Networks
|
$
|
817,566
|
|
$
|
784,027
|
|
$
|
754,243
|
|
||
|
International and Other
|
(88,894
|
)
|
(120,914
|
)
|
(42,542
|
)
|
|||||
|
Inter-segment eliminations
|
(6,313
|
)
|
(5,557
|
)
|
(2,508
|
)
|
|||||
|
Consolidated operating income
|
$
|
722,359
|
|
$
|
657,556
|
|
$
|
709,193
|
|
||
|
AOI
|
|||||||||||
|
National Networks
|
$
|
894,912
|
|
$
|
855,488
|
|
$
|
810,993
|
|
||
|
International and Other
|
16,219
|
|
28,608
|
|
29,757
|
|
|||||
|
Inter-segment eliminations
|
(6,313
|
)
|
(5,557
|
)
|
(2,508
|
)
|
|||||
|
Consolidated AOI
|
$
|
904,818
|
|
$
|
878,539
|
|
$
|
838,242
|
|
||
We evaluate segment performance based on several factors, of which the primary financial measure is operating segment AOI. We define AOI, which is a financial measure that is not calculated in accordance with generally accepted accounting principles ("GAAP"), as operating income (loss) before depreciation and amortization, share-based compensation expense or benefit, impairment and related charges (including gains or losses on sales or dispositions of businesses), and restructuring expense or credit.
We believe that AOI is an appropriate measure for evaluating the operating performance on both an operating segment and consolidated basis. AOI and similar measures with similar titles are common performance measures used by investors, analysts and peers to compare performance in the industry.
Internally, we use revenues, net and AOI measures as the most important indicators of our business performance, and evaluate management's effectiveness with specific reference to these indicators. AOI should be viewed as a supplement to and not a substitute for operating income (loss), net income (loss), cash flows from operating activities and other measures of performance and/or liquidity presented in accordance with GAAP. Since AOI is not a measure of performance calculated in accordance with GAAP, this measure may not be comparable to similar measures with similar titles used by other companies.
The following is a reconciliation of consolidated operating income to AOI for the periods indicated:
|
(In thousands)
|
Years Ended December 31,
|
||||||||||
|
2017
|
2016
|
2015
|
|||||||||
|
Operating income
|
$
|
722,359
|
|
$
|
657,556
|
|
$
|
709,193
|
|
||
|
Share-based compensation expense
|
53,545
|
|
38,897
|
|
31,020
|
|
|||||
|
Restructuring expense
|
6,128
|
|
29,503
|
|
14,998
|
|
|||||
|
Impairment and related charges
|
28,148
|
|
67,805
|
|
—
|
|
|||||
|
Depreciation and amortization
|
94,638
|
|
84,778
|
|
83,031
|
|
|||||
|
AOI
|
$
|
904,818
|
|
$
|
878,539
|
|
$
|
838,242
|
|
||
National Networks
In our National Networks segment, which accounted for
84%
of our consolidated revenues, net for the year ended
December 31, 2017
, we earn revenue principally from the distribution of our programming and the sale of advertising. Distribution revenue primarily includes subscription fees paid by distributors to carry our programming networks and content licensing revenue from the licensing of original programming for digital, foreign and home video distribution. Subscription fees paid by distributors
32
represent the largest component of distribution revenue. Our subscription fee revenues are generally based on a per subscriber fee under multi-year contracts, commonly referred to as "affiliation agreements," which generally provide for annual rate increases. The specific subscription fee revenues we earn vary from period to period, distributor to distributor and also vary among our networks, but are generally based upon the number of each distributor's subscribers who receive our programming, referred to as viewing subscribers. The terms of certain other affiliation agreements provide that the subscription fee revenues we earn are a fixed contractual monthly fee, which could be adjusted for acquisitions and dispositions of multichannel video programming systems by the distributor. Content licensing revenue from the licensing of original programming for digital and foreign distribution is recognized upon availability or distribution by the licensee.
Under affiliation agreements with our distributors, we have the right to sell a specified amount of national advertising time on our programming networks. Our advertising revenues are more variable than subscription fee revenues because the majority of our advertising is sold on a short-term basis, not under long-term contracts. Our advertising arrangements with advertisers provide for a set number of advertising units to air over a specific period of time at a negotiated price per unit. Additionally, in these advertising sales arrangements, our programming networks generally guarantee specified viewer ratings for their programming. If these guaranteed viewer ratings are not met, we are generally required to provide additional advertising units to the advertiser at no charge. For these types of arrangements, a portion of the related revenue is deferred if the guaranteed ratings are not met and is subsequently recognized either when we provide the required additional advertising time or the guarantee obligation contractually expires. Most of our advertising revenues vary based upon the popularity of our programming as measured by Nielsen. Our national programming networks have advertisers representing companies in a broad range of sectors, including the automotive, restaurants/food, health, and telecommunications industries.
Changes in revenue are primarily derived from changes in contractual subscription rates charged for our services, changes in the number of subscribers, changes in the prices and level of advertising on our networks and changes in the availability, amount and timing of licensing fees earned from the distribution of our original programming. We seek to grow our revenues by increasing the number of viewing subscribers of the distributors that carry our services. We refer to this as our "penetration." AMC, which is widely distributed throughout the U.S., has a more limited ability to increase its penetration than WE tv, BBC AMERICA, IFC and SundanceTV. To the extent not already carried on more widely penetrated service tiers, WE tv, BBC AMERICA, IFC and SundanceTV, although carried by all of the larger U.S. distributors, have higher growth opportunities due to their current penetration levels with those distributors. WE tv, BBC AMERICA, and IFC are currently carried on either expanded basic or digital tiers, while SundanceTV is currently carried primarily on digital tiers. Our revenues may also increase over time through contractual rate increases stipulated in most of our affiliation agreements. In negotiating for increased or extended carriage, we have agreed in some instances to make upfront payments in exchange for additional subscribers or extended carriage, which we record as deferred carriage fees and which are amortized as a reduction to revenue over the period of the related affiliation agreements, or agreed to waive for a specified period or accept lower per subscriber fees if certain additional subscribers are provided. We also may help fund the distributors' efforts to market our networks. We believe that these transactions generate a positive return on investment over the contract period. We seek to increase our advertising revenues by increasing the rates we charge for such advertising, which is directly related to the overall distribution of our programming, penetration of our services and the popularity (including within desirable demographic groups) of our services as measured by Nielsen.
Our principal goal is to increase our revenues by increasing distribution and penetration of our services, and increasing our ratings. To do this, we must continue to contract for and produce high-quality, attractive programming. As competition for programming increases and alternative distribution technologies continue to emerge and develop in the industry, costs for content acquisition and original programming may increase. There is a concentration of subscribers in the hands of a few distributors, which could create disparate bargaining power between the largest distributors and us by giving those distributors greater leverage in negotiating the price and other terms of affiliation agreements. We also seek to increase our content licensing revenues by expanding the opportunities for licensing our programming through digital, foreign and home video services. Content licensing revenues in each quarter may vary based on the timing of availability of our programming to distributors.
Programming expense, included in technical and operating expense, represents the largest expense of the National Networks segment and primarily consists of amortization and write-offs of programming rights, such as those for original programming, feature films and licensed series, as well as participation and residual costs. The other components of technical and operating expense primarily include distribution and production related costs and program operating costs including cost of delivery, such as origination, transmission, uplinking and encryption.
To an increasing extent, the success of our business depends on original programming, both scripted and unscripted, across all of our networks. In recent years, we have introduced a number of scripted original series. These series generally result in higher ratings for our networks. Among other things, higher audience ratings drive increased revenues through higher advertising revenues. The timing of exhibition and distribution of original programming varies from period to period, which results in greater variability in our revenues, earnings and cash flows from operating activities. We will continue to increase our investment in programming across all of our networks. There may be significant changes in the level of our technical and operating expenses due to the amortization of content acquisition and/or original programming costs and/or the impact of management's periodic assessment of
33
programming usefulness. Such costs will also fluctuate with the level of revenues derived from owned original programming in each period as these costs are amortized based on the film-forecast-computation method.
Most original series require us to make up-front investments, which are often significant amounts. Not all of our programming efforts are commercially successful, which could result in a write-off of program rights. If it is determined that programming rights have limited, or no, future programming usefulness based on actual demand or market conditions, a write-off of the unamortized cost is recorded in technical and operating expense. Program rights write-offs of
$47.7 million
,
$25.6 million
and
$41.0 million
were recorded for the years ended
December 31, 2017
,
2016
and
2015
, respectively (see further discussion below).
See "— Critical Accounting Policies and Estimates" for a discussion of the amortization and write-off of program rights.
International and Other
Our International and Other segment primarily includes the operations of AMCNI, AMCNI – DMC, IFC Films and our subscription streaming services (i.e. Sundance Now and Shudder). The AMCNI – DMC business was sold on July 12, 2017.
In our International and Other segment, which accounted for
16%
of our consolidated revenues for the year ended
December 31, 2017
, we earn revenue principally from the international distribution of programming and, to a lesser extent, the sale of advertising. Distribution revenue primarily includes subscription fees paid by distributors to carry our programming networks. Our subscription fee revenues are generally based on either a per-subscriber fee or a fixed contractual annual fee, under multi-year affiliation agreements, which may provide for annual rate increases. For the year ended
December 31, 2017
, distribution revenues represented
80%
of the revenues of the International and Other segment. Most of these revenues are derived from the distribution of our programming networks primarily in Europe and to a lesser extent, Latin America, the Middle East and parts of Asia and Africa. Our subscription streaming services are available in the United States, Canada and parts of Europe. The International and Other segment also includes IFC Films, our independent film distribution business where revenues are derived principally from theatrical, digital and licensing distribution.
Programming and program operating costs, included in technical and operating expense, represents the largest expense of the International and Other segment and primarily consists of amortization of acquired content, costs of dubbing and sub-titling of programs, participation and residuals. Program operating costs include costs of delivering content such as origination, transmission, uplinking and encryption. Not all of our programming efforts are commercially successful, which could result in a write-off of program rights. If it is determined that programming rights have limited, or no, future programming usefulness based on actual demand or market conditions, a write-off of the unamortized cost is recorded in technical and operating expense.
We view our international expansion as an important long-term strategy. We may experience an adverse impact to the International and Other segment's operating results and cash flows in periods of increased international investment by the Company. Similar to our domestic businesses, the most significant business challenges we expect to encounter in our international business include programming competition (from both foreign and domestic programmers), limited channel capacity on distributors' platforms, the number of subscribers on those platforms and economic pressures on subscription fees. Other significant business challenges unique to our international operations include increased programming costs for international rights and translation (
i.e.
dubbing and subtitling), a lack of availability of international rights for a portion of our domestic programming content, increased distribution costs for cable, satellite or fiber feeds, a limited physical presence in certain territories, and our exposure to foreign currency exchange rate risk. See also the risk factors described under Item 1A, "Risk Factors - We face risks from doing business internationally." in this Annual Report.
In 2016, management revised its outlook for the growth potential of the Amsterdam-based media logistics facility, AMCNI – DMC, resulting in lower expected future cash flows due to increased competition and evolving broadcast technologies. As a result, the Company's 2016 results reflect an impairment charge of
$67.8 million
. On July 12, 2017, the Company completed the sale of AMCNI – DMC and in connection with the sale, the Company recognized a pre-tax loss of
$11.0 million
and an impairment charge of
$17.1 million
(see Note
3
to the accompanying consolidated financial statements).
Corporate Expenses
We allocate corporate overhead within operating expenses to each segment based upon its proportionate estimated usage of services. The segment financial information set forth below, including the discussion related to individual line items, does not reflect inter-segment eliminations unless specifically indicated.
Impact of Economic Conditions
Our future performance is dependent, to a large extent, on general economic conditions including the impact of direct competition, our ability to manage our businesses effectively, and our relative strength and leverage in the marketplace, both with suppliers and customers.
34
Capital and credit market disruptions could cause economic downturns, which may lead to lower demand for our products, such as lower demand for television advertising and a decrease in the number of subscribers receiving our programming networks from our distributors. Events such as these may adversely impact our results of operations, cash flows and financial position.
Consolidated Results of Operations
The amounts presented and discussed below represent 100% of each operating segment's revenues, net and expenses. Where we have management control of an entity, we consolidate 100% of such entity in our consolidated statements of operations notwithstanding that a third-party owns a significant interest in such entity. The noncontrolling owner's interest in the operating results of majority-owned subsidiaries are reflected in net (income) loss attributable to noncontrolling interests in our consolidated statements of operations.
Year Ended December 31, 2017
Compared to
Year Ended December 31, 2016
The following table sets forth our consolidated results of operations for the periods indicated.
|
|
Years Ended December 31,
|
|
|
|||||||||||||||||
|
|
2017
|
2016
|
|
|
||||||||||||||||
|
(In thousands)
|
Amount
|
% of
Revenues,
net
|
Amount
|
% of
Revenues,
net
|
$ change
|
% change
|
||||||||||||||
|
Revenues, net
|
$
|
2,805,691
|
|
100.0
|
%
|
$
|
2,755,654
|
|
100.0
|
%
|
$
|
50,037
|
|
1.8
|
%
|
|||||
|
Operating expenses:
|
||||||||||||||||||||
|
Technical and operating (excluding depreciation and amortization)
|
1,341,076
|
|
47.8
|
|
1,279,984
|
|
46.4
|
|
61,092
|
|
4.8
|
|
||||||||
|
Selling, general and administrative
|
613,342
|
|
21.9
|
|
636,028
|
|
23.1
|
|
(22,686
|
)
|
(3.6
|
)
|
||||||||
|
Depreciation and amortization
|
94,638
|
|
3.4
|
|
84,778
|
|
3.1
|
|
9,860
|
|
11.6
|
|
||||||||
|
Impairment and related charges
|
28,148
|
|
1.0
|
|
67,805
|
|
2.5
|
|
(39,657
|
)
|
(58.5
|
)
|
||||||||
|
Restructuring expense
|
6,128
|
|
0.2
|
|
29,503
|
|
1.1
|
|
(23,375
|
)
|
(79.2
|
)
|
||||||||
|
Total operating expenses
|
2,083,332
|
|
74.3
|
|
2,098,098
|
|
76.1
|
|
(14,766
|
)
|
(0.7
|
)
|
||||||||
|
Operating income
|
722,359
|
|
25.7
|
|
657,556
|
|
23.9
|
|
64,803
|
|
9.9
|
%
|
||||||||
|
Other income (expense):
|
||||||||||||||||||||
|
Interest expense, net
|
(119,297
|
)
|
(4.3
|
)
|
(118,568
|
)
|
(4.3
|
)
|
(729
|
)
|
0.6
|
|
||||||||
|
Loss on extinguishment of debt
|
(3,004
|
)
|
(0.1
|
)
|
(50,639
|
)
|
(1.8
|
)
|
47,635
|
|
(94.1
|
)
|
||||||||
|
Miscellaneous, net
|
40,320
|
|
1.4
|
|
(33,524
|
)
|
(1.2
|
)
|
73,844
|
|
(220.3
|
)
|
||||||||
|
Total other income (expense)
|
(81,981
|
)
|
(2.9
|
)
|
(202,731
|
)
|
(7.4
|
)
|
120,750
|
|
(59.6
|
)
|
||||||||
|
Net income from operations before income taxes
|
640,378
|
|
22.8
|
|
454,825
|
|
16.5
|
|
185,553
|
|
40.8
|
|
||||||||
|
Income tax expense
|
(150,741
|
)
|
(5.4
|
)
|
(164,862
|
)
|
(6.0
|
)
|
14,121
|
|
(8.6
|
)
|
||||||||
|
Net income including noncontrolling interests
|
489,637
|
|
17.5
|
%
|
289,963
|
|
10.5
|
%
|
199,674
|
|
68.9
|
|
||||||||
|
Net income attributable to noncontrolling interests
|
(18,321
|
)
|
(0.7
|
)%
|
(19,453
|
)
|
(0.7
|
)%
|
1,132
|
|
(5.8
|
)
|
||||||||
|
Net income attributable to AMC Networks' stockholders
|
$
|
471,316
|
|
16.8
|
%
|
$
|
270,510
|
|
9.8
|
%
|
$
|
200,806
|
|
74.2
|
%
|
|||||
35
National Networks Segment Results
The following table sets forth our National Networks segment results for the periods indicated.
|
|
Years Ended December 31,
|
|
|
|||||||||||||||||
|
|
2017
|
2016
|
|
|
||||||||||||||||
|
(In thousands)
|
Amount
|
% of
Revenues,
net
|
Amount
|
% of
Revenues,
net
|
$ change
|
% change
|
||||||||||||||
|
Revenues, net
|
$
|
2,367,615
|
|
100.0
|
%
|
$
|
2,311,040
|
|
100.0
|
%
|
$
|
56,575
|
|
2.4
|
%
|
|||||
|
Operating expenses:
|
||||||||||||||||||||
|
Technical and operating (excluding depreciation and amortization)
|
1,064,580
|
|
45.0
|
|
1,011,572
|
|
43.8
|
|
53,008
|
|
5.2
|
|
||||||||
|
Selling, general and administrative
|
451,820
|
|
19.1
|
|
474,549
|
|
20.5
|
|
(22,729
|
)
|
(4.8
|
)
|
||||||||
|
Depreciation and amortization
|
33,702
|
|
1.4
|
|
32,376
|
|
1.4
|
|
1,326
|
|
4.1
|
|
||||||||
|
Restructuring (credit) expense
|
(53
|
)
|
—
|
|
8,516
|
|
0.4
|
|
(8,569
|
)
|
(100.6
|
)
|
||||||||
|
Operating income
|
$
|
817,566
|
|
34.5
|
%
|
$
|
784,027
|
|
33.9
|
%
|
$
|
33,539
|
|
4.3
|
%
|
|||||
|
Share-based compensation expense
|
43,697
|
|
1.8
|
|
30,569
|
|
1.3
|
|
13,128
|
|
42.9
|
|
||||||||
|
Restructuring (credit) expense
|
(53
|
)
|
—
|
|
8,516
|
|
0.4
|
|
(8,569
|
)
|
(100.6
|
)
|
||||||||
|
Depreciation and amortization
|
33,702
|
|
1.4
|
|
32,376
|
|
1.4
|
|
1,326
|
|
4.1
|
|
||||||||
|
AOI
|
$
|
894,912
|
|
37.8
|
%
|
$
|
855,488
|
|
37.0
|
%
|
$
|
39,424
|
|
4.6
|
%
|
|||||
International and Other Segment Results
The following table sets forth our International and Other segment results for the periods indicated.
|
|
Years Ended December 31,
|
|
|
|||||||||||||||||
|
|
2017
|
2016
|
|
|
||||||||||||||||
|
(In thousands)
|
Amount
|
% of
Revenues,
net
|
Amount
|
% of
Revenues,
net
|
$ change
|
% change
|
||||||||||||||
|
Revenues, net
|
$
|
457,182
|
|
100.0
|
%
|
$
|
459,996
|
|
100.0
|
%
|
$
|
(2,814
|
)
|
(0.6
|
)%
|
|||||
|
Operating expenses:
|
||||||||||||||||||||
|
Technical and operating (excluding depreciation and amortization)
|
289,238
|
|
63.3
|
|
277,215
|
|
60.3
|
|
12,023
|
|
4.3
|
|
||||||||
|
Selling, general and administrative
|
161,573
|
|
35.3
|
|
162,501
|
|
35.3
|
|
(928
|
)
|
(0.6
|
)
|
||||||||
|
Depreciation and amortization
|
60,936
|
|
13.3
|
|
52,402
|
|
11.4
|
|
8,534
|
|
16.3
|
|
||||||||
|
Impairment and related charges
|
28,148
|
|
6.2
|
|
67,805
|
|
14.7
|
|
(39,657
|
)
|
(58.5
|
)
|
||||||||
|
Restructuring expense
|
6,181
|
|
1.4
|
|
20,987
|
|
4.6
|
|
(14,806
|
)
|
(70.5
|
)
|
||||||||
|
Operating loss
|
$
|
(88,894
|
)
|
(19.4
|
)%
|
$
|
(120,914
|
)
|
(26.3
|
)%
|
$
|
32,020
|
|
(26.5
|
)%
|
|||||
|
Share-based compensation expense
|
9,848
|
|
2.2
|
|
8,328
|
|
1.8
|
|
1,520
|
|
18.3
|
|
||||||||
|
Restructuring expense
|
6,181
|
|
1.4
|
|
20,987
|
|
4.6
|
|
(14,806
|
)
|
(70.5
|
)
|
||||||||
|
Impairment and related charges
|
28,148
|
|
6.2
|
|
67,805
|
|
14.7
|
|
(39,657
|
)
|
(58.5
|
)
|
||||||||
|
Depreciation and amortization
|
60,936
|
|
13.3
|
|
52,402
|
|
11.4
|
|
8,534
|
|
16.3
|
|
||||||||
|
AOI
|
$
|
16,219
|
|
3.5
|
%
|
$
|
28,608
|
|
6.2
|
%
|
$
|
(12,389
|
)
|
(43.3
|
)%
|
|||||
36
Revenues, net
Revenues, net
increased
$50.0 million
to
$2.8 billion
for the year ended
December 31, 2017
as compared to the year ended
December 31, 2016
. The net change by segment was as follows:
|
|
Years Ended December 31,
|
|
|
|||||||||||||||||
|
(In thousands)
|
2017
|
% of
total
|
2016
|
% of
total
|
$ change
|
% change
|
||||||||||||||
|
National Networks
|
$
|
2,367,615
|
|
84.4
|
%
|
$
|
2,311,040
|
|
83.9
|
%
|
$
|
56,575
|
|
2.4
|
%
|
|||||
|
International and Other
|
457,182
|
|
16.3
|
|
459,996
|
|
16.7
|
|
(2,814
|
)
|
(0.6
|
)
|
||||||||
|
Inter-segment eliminations
|
(19,106
|
)
|
(0.7
|
)
|
(15,382
|
)
|
(0.6
|
)
|
(3,724
|
)
|
24.2
|
|
||||||||
|
Consolidated revenues, net
|
$
|
2,805,691
|
|
100.0
|
%
|
$
|
2,755,654
|
|
100.0
|
%
|
$
|
50,037
|
|
1.8
|
%
|
|||||
National Networks
The
increase
in National Networks revenues, net was attributable to the following:
|
|
Years Ended December 31,
|
|
|
|||||||||||||||||
|
(In thousands)
|
2017
|
% of
total
|
2016
|
% of
total
|
$ change
|
% change
|
||||||||||||||
|
Advertising
|
$
|
959,551
|
|
40.5
|
%
|
$
|
990,508
|
|
42.9
|
%
|
$
|
(30,957
|
)
|
(3.1
|
)%
|
|||||
|
Distribution
|
1,408,064
|
|
59.5
|
|
1,320,532
|
|
57.1
|
|
87,532
|
|
6.6
|
|
||||||||
|
$
|
2,367,615
|
|
100.0
|
%
|
$
|
2,311,040
|
|
100.0
|
%
|
$
|
56,575
|
|
2.4
|
%
|
||||||
|
•
|
Advertising revenues
decreased
$31.0 million
primarily driven by ratings, partially offset by pricing, with a decrease at AMC, partially offset by increases at BBC AMERICA, Sundance TV, and IFC. Most of our advertising revenues vary based on the timing of our original programming series and the popularity of our programming as measured by Nielsen. Due to these factors, we expect advertising revenues to vary from quarter to quarter.
|
|
•
|
Distribution revenues
increased
$87.5 million
principally due to an increase in subscription revenues of $44.2 million primarily driven by higher rates and $43.3 million from content licensing revenues derived from our original programming, primarily at AMC. Subscription revenues vary based on the impact of distributor agreement renewals and content licensing revenue varies based on the timing of availability of our programming to distributors. Because of these factors, we expect distribution revenues to vary from quarter to quarter.
|
The following table presents certain subscriber information at
December 31, 2017
and
December 31, 2016
:
|
|
Estimated Domestic Subscribers
(1)
|
||||
|
|
December 31, 2017
|
December 31, 2016
|
|||
|
National Programming Networks:
|
|||||
|
AMC
|
90,500
|
|
91,200
|
|
|
|
WE tv
|
86,000
|
|
85,900
|
|
|
|
BBC AMERICA
|
80,600
|
|
79,300
|
|
|
|
IFC
|
74,200
|
|
72,400
|
|
|
|
SundanceTV
|
70,600
|
|
62,400
|
|
|
________________
|
(1)
|
Estimated U.S. subscribers as measured by Nielsen.
|
37
International and Other
The
decrease
in International and Other revenues, net was attributable to the following:
|
|
Years Ended December 31,
|
|
|
|||||||||||||||||
|
(In thousands)
|
2017
|
% of
total |
2016
|
% of
total |
$ change
|
% change
|
||||||||||||||
|
Advertising
|
$
|
89,894
|
|
19.7
|
%
|
$
|
94,467
|
|
20.5
|
%
|
$
|
(4,573
|
)
|
(4.8
|
)%
|
|||||
|
Distribution
|
367,288
|
|
80.3
|
|
365,529
|
|
79.5
|
|
1,759
|
|
0.5
|
|
||||||||
|
$
|
457,182
|
|
100.0
|
%
|
$
|
459,996
|
|
100.0
|
%
|
$
|
(2,814
|
)
|
(0.6
|
)%
|
||||||
The
decrease
in advertising revenues was principally due to lower demand in certain international markets. In addition, foreign currency translation had an unfavorable impact of $2.6 million. Distribution revenues increased $11.5 million at AMCNI due to expanded distribution and an increase in subscription revenues of $7.2 million from our subscription streaming services. These increases were partially offset by the absence of $15.4 million of revenues from AMCNI – DMC which was sold in July 2017. Foreign currency translation had a favorable impact of $2.9 million on distribution revenues.
Technical and operating expense (excluding depreciation and amortization)
The components of technical and operating expense primarily include the amortization and write-offs of program rights, such as those for original programming, feature films and licensed series, participation and residual costs, distribution and production related costs and program operating costs, such as origination, transmission, uplinking and encryption.
Technical and operating expense (excluding depreciation and amortization)
increased
$61.1 million
to
$1.3 billion
for
2017
as compared to
2016
. The net change by segment was as follows:
|
|
Years Ended December 31,
|
|
|
|||||||||||
|
(In thousands)
|
2017
|
2016
|
$ change
|
% change
|
||||||||||
|
National Networks
|
$
|
1,064,580
|
|
$
|
1,011,572
|
|
$
|
53,008
|
|
5.2
|
%
|
|||
|
International and Other
|
289,238
|
|
277,215
|
|
12,023
|
|
4.3
|
|
||||||
|
Inter-segment eliminations
|
(12,742
|
)
|
(8,803
|
)
|
(3,939
|
)
|
44.7
|
|
||||||
|
Total
|
$
|
1,341,076
|
|
$
|
1,279,984
|
|
$
|
61,092
|
|
4.8
|
%
|
|||
|
Percentage of revenues, net
|
47.8
|
%
|
46.4
|
%
|
||||||||||
National Networks
The
increase
in the National Networks segment was attributable to increased program rights amortization expense of $72.0 million, partially offset by a decrease in other direct programming related costs which includes participation expense. The increase in program rights amortization expense is due to our increased investment in owned original series, primarily at AMC. Program rights amortization expense in 2017 includes write-offs of $47.7 million, primarily at AMC. Program rights amortization expense in 2016 included write-offs of $25.6 million, primarily at AMC and BBC AMERICA.
There may be significant changes in the level of our technical and operating expenses due to content acquisition and/or original programming costs and/or the impact of management's periodic assessment of programming usefulness. Such costs will also fluctuate with the level of amortization recorded from owned original programming in each period based on the film-forecast-computation method. As additional competition for programming increases and alternate distribution technologies continue to develop in the industry, costs for content acquisition and original programming may increase.
International and Other
The
increase
in the International and Other segment was due to an increase of $9.0 million at our subscription streaming services and a net increase at AMCNI due to increased investment in programming, partially offset by the absence of costs related to AMCNI - DMC following its sale in July 2017. Foreign currency translation had a favorable impact to the change in technical and operating expense of $0.9 million.
38
Selling, general and administrative expense
The components of selling, general and administrative expense primarily include sales, marketing and advertising expenses, administrative costs and costs of non-production facilities.
Selling, general and administrative expense
decreased
$22.7 million
to
$613.3 million
for
2017
as compared to
2016
. The net change by segment was as follows:
|
|
Years Ended December 31,
|
|
|
|||||||||||
|
(In thousands)
|
2017
|
2016
|
$ change
|
% change
|
||||||||||
|
National Networks
|
$
|
451,820
|
|
$
|
474,549
|
|
$
|
(22,729
|
)
|
(4.8
|
)%
|
|||
|
International and Other
|
161,573
|
|
162,501
|
|
(928
|
)
|
(0.6
|
)
|
||||||
|
Inter-segment eliminations
|
(51
|
)
|
(1,022
|
)
|
971
|
|
(95.0
|
)
|
||||||
|
Total
|
$
|
613,342
|
|
$
|
636,028
|
|
$
|
(22,686
|
)
|
(3.6
|
)%
|
|||
|
Percentage of revenues, net
|
21.9
|
%
|
23.1
|
%
|
||||||||||
National Networks
The
decrease
in the National Networks segment selling, general and administrative expense was driven by a decrease in ad sales expense and marketing related costs of $31.1 million primarily related to the timing and level of promotion and marketing of original programming as well as employee related costs, partially offset by a net increase in long-term incentive compensation expense of $7.1 million.
There may be significant changes in the level of our selling, general and administrative expense from quarter to quarter and year to year due to the timing of promotion and marketing of original programming series and subscriber retention marketing efforts.
International and Other
The
decrease
in the International and Other segment was primarily due to a decrease in selling, general and administrative expenses at AMCNI of $4.2 million principally due the absence of expenses of AMCNI - DMC which was sold in July 2017, which were partially offset by an increase of $3.2 million in sales and marketing related costs at our subscription streaming services. Foreign currency translation did not have a meaningful impact to the change in selling, general and administrative expense.
Depreciation and amortization
Depreciation and amortization
increased
$9.9 million
to
$94.6 million
for
2017
as compared to
2016
. The net change by segment was as follows:
|
|
Years Ended December 31,
|
|
|
|||||||||||
|
(In thousands)
|
2017
|
2016
|
$ change
|
% change
|
||||||||||
|
National Networks
|
$
|
33,702
|
|
$
|
32,376
|
|
$
|
1,326
|
|
4.1
|
%
|
|||
|
International and Other
|
60,936
|
|
52,402
|
|
8,534
|
|
16.3
|
|
||||||
|
$
|
94,638
|
|
$
|
84,778
|
|
$
|
9,860
|
|
11.6
|
%
|
||||
The
increase
in depreciation and amortization expense at the National Networks segment was primarily depreciation expense attributable to property and equipment additions primarily at AMC Networks Broadcasting & Technology. The
increase
in depreciation and amortization expense in the International and Other segment was primarily attributable to an increase in amortization expense which resulted in a charge of $9.0 million from the accelerated amortization of certain identifiable intangible assets at AMCNI.
Impairment and related charges
In July 2017, the Company completed the sale of its Amsterdam-based media logistics facility, AMCNI – DMC. In connection with the sale, the Company recognized an impairment charge of
$17.1 million
and an
$11.0 million
pre-tax loss on sale.
In 2016, the Company recorded a charge of
$67.8 million
related to AMCNI - DMC. During the fourth quarter of 2016, management revised its outlook for the growth potential of AMCNI – DMC resulting in lower expected future cash flows due to increased competition and evolving broadcast technologies. This resulted in an impairment charge of
$40.6 million
related to long-lived assets, which consisted of
$22.9 million
related to property and equipment and
$17.7 million
related to intangible assets, and a write down of the entire balance of goodwill of the AMCNI – DMC reporting unit of
$27.2 million
.
39
Restructuring expense
Restructuring expense of
$6.1 million
for the year ended
December 31, 2017
related to charges incurred at the International and Other segment for corporate headquarter severance costs of $2.6 million and charges incurred at AMCNI related to costs associated with the termination of distribution in certain territories of $3.5 million.
Restructuring expense of
$29.5 million
for the year ended December 31, 2016 was comprised of charges of
$8.5 million
in the National Networks segment and
$21.0 million
in the International and Other segment, which includes corporate headquarter related charges of $12.5 million. The Company launched a restructuring initiative that involved modifications to the organizational structure of the Company and is expected to result in reduced employee costs and operating expenses primarily through a voluntary buyout program offered to certain employees. Specifically, restructuring expense at the National Networks segment represents severance charges incurred related to employee terminations primarily as a result of the voluntary buyout program. Restructuring expense at the International and Other segment primarily represents $15.6 million of severance costs incurred related to employee terminations primarily as a result of the voluntary buyout program and $5.4 million of costs related to the elimination of distribution in certain territories.
Operating Income
|
|
Years Ended December 31,
|
|
|
|||||||||||
|
(In thousands)
|
2017
|
2016
|
$ change
|
% change
|
||||||||||
|
National Networks
|
$
|
817,566
|
|
$
|
784,027
|
|
$
|
33,539
|
|
4.3
|
%
|
|||
|
International and Other
|
(88,894
|
)
|
(120,914
|
)
|
32,020
|
|
(26.5
|
)
|
||||||
|
Inter-segment Eliminations
|
(6,313
|
)
|
(5,557)
|
|
(756
|
)
|
13.6
|
|
||||||
|
$
|
722,359
|
|
$
|
657,556
|
|
$
|
64,803
|
|
9.9
|
%
|
||||
The
increase
in operating income at the National Networks segment was primarily attributable to an increase in revenues of
$56.6 million
, a decrease in selling general and administrative expense of
$22.7 million
, and a decrease in restructuring expense of
$8.6 million
, partially offset by an increase in technical and operating expense of
$53.0 million
, and an increase in depreciation and amortization of
$1.3 million
.
The decrease in operating loss in the International and Other segment was primarily attributable to the impairment charge for AMCNI-DMC of $67.8 million recorded in 2016 as compared to $28.1 million charge recorded in 2017 as well as a decrease in restructuring expense of $14.8 million due to the reasons described above. Foreign currency translation had an unfavorable impact to the change in operating income of $6.8 million.
AOI
The following is a reconciliation of our consolidated operating income to consolidated AOI:
|
|
Years Ended December 31,
|
|
|
|||||||||||
|
(In thousands)
|
2017
|
2016
|
$ change
|
% change
|
||||||||||
|
Operating income
|
$
|
722,359
|
|
$
|
657,556
|
|
$
|
64,803
|
|
9.9
|
%
|
|||
|
Share-based compensation expense
|
53,545
|
|
38,897
|
|
14,648
|
|
37.7
|
|
||||||
|
Restructuring expense
|
6,128
|
|
29,503
|
|
(23,375
|
)
|
(79.2
|
)
|
||||||
|
Impairment and related charges
|
28,148
|
|
67,805
|
|
(39,657
|
)
|
(58.5
|
)
|
||||||
|
Depreciation and amortization
|
94,638
|
|
84,778
|
|
9,860
|
|
11.6
|
|
||||||
|
Consolidated AOI
|
$
|
904,818
|
|
$
|
878,539
|
|
$
|
26,279
|
|
3.0
|
%
|
|||
AOI
increased
$26.3 million
to
$904.8 million
for
2017
as compared to
2016
. The net change by segment was as follows:
|
|
Years Ended December 31,
|
|
|
|||||||||||
|
(In thousands)
|
2017
|
2016
|
$ change
|
% change
|
||||||||||
|
National Networks
|
$
|
894,912
|
|
$
|
855,488
|
|
$
|
39,424
|
|
4.6
|
%
|
|||
|
International and Other
|
16,219
|
|
28,608
|
|
(12,389
|
)
|
(43.3
|
)
|
||||||
|
Inter-segment eliminations
|
(6,313
|
)
|
(5,557
|
)
|
(756
|
)
|
13.6
|
|
||||||
|
AOI
|
$
|
904,818
|
|
$
|
878,539
|
|
$
|
26,279
|
|
3.0
|
%
|
|||
40
National Networks AOI
increased
due to an increase in revenues, net of
$56.6 million
and a decrease in selling, general and administrative expenses (excluding stock based compensation) of $35.8 million, partially offset by an increase in technical and operating expenses of
$53.0 million
resulting primarily from an increase in program rights expense.
International and Other AOI
decreased
due to a decrease in revenues, net of
$2.8 million
and an increase in technical and operating expenses of
$12.0 million
, partially offset by a decrease in selling, general and administrative expenses (excluding stock based compensation) of $2.4 million. Foreign currency translation had a favorable impact on AOI of approximately $1.8 million.
Interest expense, net
The increase in interest expense, net of
$0.7 million
from
2016
to
2017
was attributable an increase in interest expense of $10.4 million primarily resulting from the issuance of our $800 million in aggregate principal amount of 4.75% Senior Notes due 2025 on July 28, 2017 and $1.0 billion in aggregate principal amount of 5.00% Senior Notes due 2024 entered into on March 30, 2016, partially offset by a decrease in interest expense related to our early redemption of our 7.75% Notes in March 2016. See further discussion under the heading "Debt Financing Agreement" below. The increase in interest expense, was partially offset by an increase in interest income of $9.6 million principally related to $8.3 million interest income earned on term loans to RLJ Entertainment, Inc. ("RLJE").
Loss on extinguishment of debt
The loss on extinguishment of debt for the year ended
December 31, 2017
of $3.0 million was primarily due to the write-off of a portion of unamortized deferred financing costs following the amendment of our Term Loan A Facility in July 2017.
The loss on extinguishment of debt for the year ended December 31, 2016 of $50.6 million represented $41.0 million of premium paid and related fees on the early redemption of our 7.75% Notes as well as the write-off of the related unamortized discount of $8.7 million and unamortized deferred financing costs of $0.9 million. See further discussion under the heading "Debt Financing Agreements" below.
Miscellaneous, net
The decrease in miscellaneous expense, net of
$73.8 million
was principally the result of a $54.0 million favorable variance in the foreign currency remeasurement of monetary assets and liabilities that are denominated in currencies other than the underlying functional currency of the applicable entity from both foreign currency transactions as well as intercompany loans. Certain intercompany loans which were the primary driver of transaction losses in 2016 were settled in the third quarter of 2016. Miscellaneous, net also includes an increase in gains on derivative instruments of $18.9 million primarily related to the RLJE derivatives due to an increase in the price of RLJE common stock and a gain in the fair market value of RLJE common shares held by the Company of $2.2 million which started to be recognized during the second quarter 2017 upon meeting the criteria to be accounted for as an equity method investment following the exercise of warrants, for which we have elected the fair value option.
Income tax expense
Income tax expense was $150.7 million for the year ended December 31, 2017, representing an effective tax rate of 24%. The effective tax rate differs from the federal statutory rate of 35% due primarily to tax benefit of $67.9 million which represents the one-time impact of the change in the corporate tax rate on deferred tax assets and liabilities, tax benefit from the domestic production activities deduction of $19.3 million, tax benefit from foreign subsidiary earnings indefinitely reinvested outside of the U.S. of $4.6 million, tax benefit of $2.7 million resulting from an decrease in the valuation allowance relating primarily to foreign and local taxes, tax expense of $11.0 million resulting from the one-time transition tax on undistributed foreign earnings, net of foreign taxes deemed paid, state income tax expense of $9.5 million, and tax expense of $3.3 million related to uncertain tax positions, including accrued interest.
Income tax expense was $164.9 million for the year ended December 31, 2016, representing an effective tax rate of 36%. The effective tax rate differs from the federal statutory rate of 35% due primarily to tax expense of $21.4 million resulting from an increase in the valuation allowance relating primarily to foreign and local taxes and impairment charges recorded at the AMCNI - DMC reporting unit, state income tax expense of $9.1 million, tax benefit from the domestic production activities deduction of $13.3 million, tax benefit from foreign subsidiary earnings indefinitely reinvested outside of the U.S. of $3.9 million, and tax benefit of $2.7 million related to uncertain tax positions, including accrued interest. The tax benefit relating to reductions in uncertain tax positions is primarily due to a lapse of the applicable statute of limitations.
Net income attributable to noncontrolling interests
Net income attributable to noncontrolling interests consists of the noncontrolling parties' share of net earnings of consolidated joint ventures. The net change for the year ended
December 31, 2017
as compared to the year ended
December 31, 2016
is primarily due to a decrease in earnings attributable to certain international non-controlling interests.
41
Year Ended December 31, 2016
Compared to
Year Ended December 31, 2015
The following table sets forth our consolidated results of operations for the periods indicated.
|
|
Years Ended December 31,
|
|
|
|||||||||||||||||
|
|
2016
|
2015
|
|
|
||||||||||||||||
|
(In thousands)
|
Amount
|
% of
Revenues,
net
|
Amount
|
% of
Revenues,
net
|
$ change
|
% change
|
||||||||||||||
|
Revenues, net
|
$
|
2,755,654
|
|
100.0
|
%
|
$
|
2,580,935
|
|
100.0
|
%
|
$
|
174,719
|
|
6.8
|
%
|
|||||
|
Operating expenses:
|
||||||||||||||||||||
|
Technical and operating (excluding depreciation and amortization)
|
1,279,984
|
|
46.4
|
|
1,137,133
|
|
44.1
|
|
142,851
|
|
12.6
|
|
||||||||
|
Selling, general and administrative
|
636,028
|
|
23.1
|
|
636,580
|
|
24.7
|
|
(552
|
)
|
(0.1
|
)
|
||||||||
|
Depreciation and amortization
|
84,778
|
|
3.1
|
|
83,031
|
|
3.2
|
|
1,747
|
|
2.1
|
|
||||||||
|
Impairment and related charges
|
67,805
|
|
2.5
|
|
—
|
|
—
|
|
67,805
|
|
n/m
|
|
||||||||
|
Restructuring expense
|
29,503
|
|
1.1
|
|
14,998
|
|
0.6
|
|
14,505
|
|
96.7
|
|
||||||||
|
Total operating expenses
|
2,098,098
|
|
76.1
|
|
1,871,742
|
|
72.5
|
|
226,356
|
|
12.1
|
|
||||||||
|
Operating income
|
657,556
|
|
23.9
|
|
709,193
|
|
27.5
|
|
(51,637
|
)
|
(7.3
|
)%
|
||||||||
|
Other income (expense):
|
|
|
|
|
|
|||||||||||||||
|
Interest expense, net
|
(118,568
|
)
|
(4.3
|
)
|
(125,708
|
)
|
(4.9
|
)
|
7,140
|
|
(5.7
|
)
|
||||||||
|
Loss on extinguishment of debt
|
(50,639
|
)
|
(1.8
|
)
|
—
|
|
—
|
|
(50,639
|
)
|
n/m
|
|
||||||||
|
Miscellaneous, net
|
(33,524
|
)
|
(1.2
|
)
|
(691
|
)
|
—
|
|
(32,833
|
)
|
n/m
|
|
||||||||
|
Total other income (expense)
|
(202,731
|
)
|
(7.4
|
)
|
(126,399
|
)
|
(4.9
|
)
|
(76,332
|
)
|
60.4
|
|
||||||||
|
Net income from operations before income taxes
|
454,825
|
|
16.5
|
|
582,794
|
|
22.6
|
|
(127,969
|
)
|
(22.0
|
)
|
||||||||
|
Income tax expense
|
(164,862
|
)
|
(6.0
|
)
|
(201,090
|
)
|
(7.8
|
)
|
36,228
|
|
(18.0
|
)
|
||||||||
|
Net income including noncontrolling interests
|
289,963
|
|
10.5
|
%
|
381,704
|
|
14.8
|
%
|
(91,741
|
)
|
(24.0
|
)
|
||||||||
|
Net income attributable to noncontrolling interests
|
(19,453
|
)
|
(0.7
|
)%
|
(14,916
|
)
|
(0.6
|
)%
|
(4,537
|
)
|
30.4
|
|
||||||||
|
Net income attributable to AMC Networks' stockholders
|
$
|
270,510
|
|
9.8
|
%
|
$
|
366,788
|
|
14.2
|
%
|
$
|
(96,278
|
)
|
(26.2
|
)%
|
|||||
42
National Networks Segment Results
The following table sets forth our National Networks segment results for the periods indicated.
|
|
Years Ended December 31,
|
|
|
|||||||||||||||||
|
|
2016
|
2015
|
|
|
||||||||||||||||
|
(In thousands)
|
Amount
|
% of
Revenues,
net
|
Amount
|
% of
Revenues,
net
|
$ change
|
% change
|
||||||||||||||
|
Revenues, net
|
$
|
2,311,040
|
|
100.0
|
%
|
$
|
2,135,367
|
|
100.0
|
%
|
$
|
175,673
|
|
8.2
|
%
|
|||||
|
Operating expenses:
|
|
|
||||||||||||||||||
|
Technical and operating (excluding depreciation and amortization)
|
1,011,572
|
|
43.8
|
|
863,704
|
|
40.4
|
|
147,868
|
|
17.1
|
|
||||||||
|
Selling, general and administrative
|
474,549
|
|
20.5
|
|
484,484
|
|
22.7
|
|
(9,935
|
)
|
(2.1
|
)
|
||||||||
|
Depreciation and amortization
|
32,376
|
|
1.4
|
|
29,742
|
|
1.4
|
|
2,634
|
|
8.9
|
|
||||||||
|
Restructuring expense
|
8,516
|
|
0.4
|
|
3,194
|
|
0.1
|
|
5,322
|
|
166.6
|
|
||||||||
|
Operating income
|
$
|
784,027
|
|
33.9
|
%
|
$
|
754,243
|
|
35.3
|
%
|
$
|
29,784
|
|
3.9
|
%
|
|||||
|
Share-based compensation expense
|
30,569
|
|
1.3
|
|
23,814
|
|
1.1
|
|
6,755
|
|
28.4
|
|
||||||||
|
Restructuring expense
|
8,516
|
|
0.4
|
|
3,194
|
|
0.1
|
|
5,322
|
|
166.6
|
|
||||||||
|
Depreciation and amortization
|
32,376
|
|
1.4
|
|
29,742
|
|
1.4
|
|
2,634
|
|
8.9
|
|
||||||||
|
AOI
|
$
|
855,488
|
|
37.0
|
%
|
$
|
810,993
|
|
38.0
|
%
|
$
|
44,495
|
|
5.5
|
%
|
|||||
International and Other Segment Results
The following table sets forth our International and Other segment results for the periods indicated.
|
|
Years Ended December 31,
|
|
|
|||||||||||||||||
|
|
2016
|
2015
|
|
|
||||||||||||||||
|
(In thousands)
|
Amount
|
% of
Revenues,
net
|
Amount
|
% of
Revenues,
net
|
$ change
|
% change
|
||||||||||||||
|
Revenues, net
|
$
|
459,996
|
|
100.0
|
%
|
$
|
452,578
|
|
100.0
|
%
|
$
|
7,418
|
|
1.6
|
%
|
|||||
|
Operating expenses:
|
||||||||||||||||||||
|
Technical and operating (excluding depreciation and amortization)
|
277,215
|
|
60.3
|
|
277,895
|
|
61.4
|
|
(680
|
)
|
(0.2
|
)
|
||||||||
|
Selling, general and administrative
|
162,501
|
|
35.3
|
|
152,132
|
|
33.6
|
|
10,369
|
|
6.8
|
|
||||||||
|
Depreciation and amortization
|
52,402
|
|
11.4
|
|
53,289
|
|
11.8
|
|
(887
|
)
|
(1.7
|
)
|
||||||||
|
Impairment and related charges
|
67,805
|
|
14.7
|
|
—
|
|
—
|
|
67,805
|
|
n/m
|
|
||||||||
|
Restructuring expense
|
20,987
|
|
4.6
|
|
11,804
|
|
2.6
|
|
9,183
|
|
77.8
|
|
||||||||
|
Operating loss
|
$
|
(120,914
|
)
|
(26.3
|
)%
|
$
|
(42,542
|
)
|
(9.4
|
)%
|
$
|
(78,372
|
)
|
184.2
|
%
|
|||||
|
Share-based compensation expense
|
8,328
|
|
1.8
|
|
7,206
|
|
1.6
|
|
1,122
|
|
15.6
|
|
||||||||
|
Restructuring expense
|
20,987
|
|
4.6
|
|
11,804
|
|
2.6
|
|
9,183
|
|
77.8
|
|
||||||||
|
Impairment and related charges
|
67,805
|
|
14.7
|
|
—
|
|
—
|
|
67,805
|
|
n/m
|
|
||||||||
|
Depreciation and amortization
|
52,402
|
|
11.4
|
|
53,289
|
|
11.8
|
|
(887
|
)
|
(1.7
|
)
|
||||||||
|
AOI
|
$
|
28,608
|
|
6.2
|
%
|
$
|
29,757
|
|
6.6
|
%
|
$
|
(1,149
|
)
|
(3.9
|
)%
|
|||||
43
Revenues, net
Revenues, net increased
$174.7 million
to
$2,755.7 million
for the year ended
December 31, 2016
as compared to the year ended
December 31, 2015
. The net change by segment was as follows:
|
|
Years Ended December 31,
|
|
|
|||||||||||||||||
|
(In thousands)
|
2016
|
% of
total
|
2015
|
% of
total
|
$ change
|
% change
|
||||||||||||||
|
National Networks
|
$
|
2,311,040
|
|
83.9
|
%
|
$
|
2,135,367
|
|
82.7
|
%
|
$
|
175,673
|
|
8.2
|
%
|
|||||
|
International and Other
|
459,996
|
|
16.7
|
|
452,578
|
|
17.5
|
|
7,418
|
|
1.6
|
|
||||||||
|
Inter-segment eliminations
|
(15,382
|
)
|
(0.6
|
)
|
(7,010
|
)
|
(0.3
|
)
|
(8,372
|
)
|
119.4
|
|
||||||||
|
Consolidated revenues, net
|
$
|
2,755,654
|
|
100.0
|
%
|
$
|
2,580,935
|
|
100.0
|
%
|
$
|
174,719
|
|
6.8
|
%
|
|||||
National Networks
The increase in National Networks revenues, net was attributable to the following:
|
|
Years Ended December 31,
|
|
|
|||||||||||||||||
|
(In thousands)
|
2016
|
% of
total
|
2015
|
% of
total
|
$ change
|
% change
|
||||||||||||||
|
Advertising
|
$
|
990,508
|
|
42.9
|
%
|
$
|
945,288
|
|
44.3
|
%
|
$
|
45,220
|
|
4.8
|
%
|
|||||
|
Distribution
|
1,320,532
|
|
57.1
|
|
1,190,079
|
|
55.7
|
|
130,453
|
|
11.0
|
|
||||||||
|
$
|
2,311,040
|
|
100.0
|
%
|
$
|
2,135,367
|
|
100.0
|
%
|
$
|
175,673
|
|
8.2
|
%
|
||||||
|
•
|
Advertising revenues increased
$45.2 million
driven by an increase across substantially all of our national networks due to increased demand by advertisers and higher pricing driven by original programming series and series premieres, partially offset by lower ratings. As previously discussed, most of our advertising revenues vary based on the timing of our original programming series and the popularity of our programming as measured by Nielsen.
|
|
•
|
Distribution revenues increased
$130.5 million
principally due to an increase of
$95.6 million
from content licensing revenues derived from our original programming, primarily at AMC and subscription revenues increased
$34.9 million
, driven by increases at AMC due to an increase in rates during the year ended December 31, 2016 as compared to the same period in 2015. Distribution revenues vary based on the impact of renewals of affiliation agreements and the timing of availability of our programming to distributors.
|
The following table presents certain subscriber information at
December 31, 2016
and
December 31, 2015
:
|
|
Estimated Domestic Subscribers
(1)
|
||||
|
|
December 31, 2016
|
December 31, 2015
|
|||
|
National Programming Networks:
|
|||||
|
AMC
|
91,200
|
|
93,600
|
|
|
|
WE tv
|
85,900
|
|
86,500
|
|
|
|
BBC AMERICA
|
79,300
|
|
77,100
|
|
|
|
IFC
|
72,400
|
|
71,200
|
|
|
|
SundanceTV
|
62,400
|
|
59,600
|
|
|
|
(1)
|
Estimated U.S. subscribers as measured by Nielsen.
|
44
International and Other
The increase in International and Other revenues, net was attributable to the following:
|
|
Years Ended December 31,
|
|
|
|||||||||||||||||
|
(In thousands)
|
2016
|
% of
total
|
2015
|
% of
total
|
$ change
|
% change
|
||||||||||||||
|
Advertising
|
$
|
94,467
|
|
20.5
|
%
|
$
|
82,972
|
|
18.3
|
%
|
$
|
11,495
|
|
13.9
|
|
|||||
|
Distribution
|
365,529
|
|
79.5
|
|
369,606
|
|
81.7
|
|
(4,077
|
)
|
(1.1
|
)
|
||||||||
|
$
|
459,996
|
|
100.0
|
%
|
$
|
452,578
|
|
100.0
|
%
|
$
|
7,418
|
|
1.6
|
%
|
||||||
The increase in advertising revenues was principally due to an increase in revenues of
$5.9 million
from an acquisition at the end of 2015, as well as increased demand for our programming at AMCNI by advertisers. Foreign currency translation had an unfavorable impact of approximately
$7.7 million
. The decrease in distribution revenues was primarily driven by a decrease at IFC Films of
$13.6 million
due to the strong performance of
Boyhood
in 2015, partially offset by the increase at AMCNI of
$6.7 million
due to expanded distribution and an increase of
$2.9 million
in subscription revenues from our subscription streaming services. The unfavorable impact of foreign currency translation at AMCNI on distribution revenue was approximately
$11.1 million
.
Technical and operating expense (excluding depreciation and amortization)
Technical and operating expense (excluding depreciation and amortization) increased
$142.9 million
to
$1,280.0 million
for
2016
as compared to
2015
. The net change by segment was as follows:
|
|
Years Ended December 31,
|
|
|
|||||||||||
|
(In thousands)
|
2016
|
2015
|
$ change
|
% change
|
||||||||||
|
National Networks
|
$
|
1,011,572
|
|
$
|
863,704
|
|
$
|
147,868
|
|
17.1
|
%
|
|||
|
International and Other
|
277,215
|
|
277,895
|
|
(680
|
)
|
(0.2
|
)
|
||||||
|
Inter-segment eliminations
|
(8,803
|
)
|
(4,466
|
)
|
(4,337
|
)
|
97.1
|
|
||||||
|
Total
|
$
|
1,279,984
|
|
$
|
1,137,133
|
|
$
|
142,851
|
|
12.6
|
%
|
|||
|
Percentage of revenues, net
|
46.4
|
%
|
44.1
|
%
|
||||||||||
National Networks
The increase in the National Networks segment was attributable to increased program rights amortization expense of
$100.8 million
and an increase of
$47.0 million
comprised of programming related costs of
$18.2 million
, participation and residuals of
$21.1 million
, and other distribution costs of
$7.7 million
. The increase in program rights amortization expense is due to our increased investment in owned original series, primarily at AMC. Program rights amortization expense in 2016 includes write-offs of
$25.6 million
based on management's assessment of programming usefulness of certain scripted series primarily at AMC and BBC AMERICA. Program rights amortization expense in 2015 included write-offs of
$41.0 million
based on management's assessment of programming usefulness of certain scripted series at SundanceTV, original series at WE tv, and pilot costs at AMC.
International and Other
The decrease in the International and Other segment was due a decrease of
$5.5 million
at IFC Films principally driven by a decrease in participation and residuals expense related to the success of
Boyhood
in 2015. This decrease was partially offset principally by an increase at AMCNI of
$1.9 million
due to an increase in program rights amortization expense and other direct programming related costs due to the increased investment in original programming and an increase of
$3.0 million
related to increased investment at our subscription streaming services. Foreign currency translation had a favorable impact on the change in technical and operating expense of approximately
$12.3 million
.
45
Selling, general and administrative expense
Selling, general and administrative expense decreased
$0.6 million
to
$636.0 million
for
2016
as compared to
2015
. The net change by segment was as follows:
|
|
Years Ended December 31,
|
|
|
|||||||||||
|
(In thousands)
|
2016
|
2015
|
$ change
|
% change
|
||||||||||
|
National Networks
|
$
|
474,549
|
|
$
|
484,484
|
|
$
|
(9,935
|
)
|
(2.1
|
)%
|
|||
|
International and Other
|
162,501
|
|
152,132
|
|
10,369
|
|
6.8
|
|
||||||
|
Inter-segment eliminations
|
(1,022
|
)
|
(36
|
)
|
(986
|
)
|
2,738.9
|
|
||||||
|
Total
|
$
|
636,028
|
|
$
|
636,580
|
|
$
|
(552
|
)
|
(0.1
|
)%
|
|||
|
Percentage of revenues, net
|
23.1
|
%
|
24.7
|
%
|
||||||||||
National Networks
The decrease in the National Networks segment selling, general and administrative expense was driven by a decrease in sales and marketing costs of
$6.9 million
as well as a net decrease in long-term incentive compensation expense of
$5.7 million
.
International and Other
The increase in the International and Other segment was primarily due to increases at AMCNI of
$12.5 million
primarily related to employee and employee related costs of
$5.1 million
, support costs of
$2.4 million
, rent and rent related expense of
$2.7 million
, and bad debt expense of
$1.7 million
as well as an increase of
$9.9 million
at our subscription streaming services principally due to increased subscriber acquisition costs. These increases were partially offset by a decrease at IFC Films of
$9.4 million
due to decreased marketing expense due to the promotion of certain films in 2015 and a net decrease in long-term incentive compensation expense of
$1.8 million
. Foreign currency translation had a favorable impact on the change in selling, general and administrative expense of approximately
$8.1 million
.
Depreciation and amortization
Depreciation and amortization increased
$1.7 million
to
$84.8 million
for
2016
as compared to
2015
. The net change by segment was as follows:
|
|
Years Ended December 31,
|
|
|
|||||||||||
|
(In thousands)
|
2016
|
2015
|
$ change
|
% change
|
||||||||||
|
National Networks
|
$
|
32,376
|
|
$
|
29,742
|
|
$
|
2,634
|
|
8.9
|
%
|
|||
|
International and Other
|
52,402
|
|
53,289
|
|
(887
|
)
|
(1.7
|
)
|
||||||
|
$
|
84,778
|
|
$
|
83,031
|
|
$
|
1,747
|
|
2.1
|
%
|
||||
The increase in depreciation and amortization expense at the National Networks segment was primarily attributable to an increase in depreciation expense of
$2.9 million
due to property and equipment additions. The decrease in depreciation and amortization expense in the International and Other segment was primarily attributable to a decrease in amortization expense of
$3.3 million
resulting from the write-off of certain identifiable intangible assets associated with certain channel closures recorded in 2015, partially offset by an increase in depreciation expense of
$1.8 million
due to property and equipment additions. Foreign currency translation had a favorable impact on change in depreciation and amortization of approximately
$0.9 million
.
Impairment and related charges
In the fourth quarter of 2016, management revised its outlook for the growth potential of the Amsterdam-based media logistics facility, AMCNI – DMC, resulting in lower expected future cash flows due to increased competition and evolving broadcast technologies. As a result, the Company determined that sufficient indicators of potential impairment of long-lived assets existed and in connection with the preparation of the Company's fourth quarter financial information, the Company performed a recoverability test of the long-lived asset group of the AMCNI – DMC business and subsequently a goodwill impairment test on the AMCNI – DMC reporting unit. The Company performed a recoverability test of the long-lived asset group of the AMCNI – DMC business and determined that certain long-lived assets, primarily identifiable intangible assets and analog equipment, were not recoverable. This resulted in an impairment charge of
$40.6 million
related to long-lived assets, which consisted of
$22.9 million
related to property and equipment and
$17.7 million
related to intangible assets. The Company then performed a two-step goodwill impairment test on the AMCNI – DMC reporting unit and determined that the carrying value of AMCNI – DMC's goodwill exceeded its implied fair value. The goodwill impairment test resulted in a write down of the entire balance of goodwill of the AMCNI – DMC reporting unit of
$27.2 million
.
46
Restructuring expense
Restructuring expense of $29.5 million for the year ended December 31, 2016 was comprised of charges of $8.5 million in the National Networks segment and $21.0 million in the International and Other segment, which includes corporate headquarter related charges of $12.5 million. The Company launched a restructuring initiative that involved modifications to the organizational structure of the Company and is expected to result in reduced employee costs and operating expenses primarily through a voluntary buyout program offered to certain employees. Specifically, restructuring expense at the National Networks segment represents severance charges incurred related to employee terminations primarily as a result of the voluntary buyout program. Restructuring expense at the International and Other segment primarily represents $15.6 million of severance charges incurred related to employee terminations primarily as a result of the voluntary buyout program and $5.4 million of costs related to the elimination of distribution in certain territories. Additional charges relating to this restructuring initiative may be incurred in future periods.
Restructuring expense of $15.0 million for the year ended December 31, 2015 was due to restructuring expense of $3.2 million in the National Networks segment and $11.8 million in the International and Other segment, which includes corporate headquarter related charges. Restructuring expense at the National Networks segment represents severance charges incurred related to employee terminations associated with the elimination of certain positions. Restructuring expense at the International and Other segment primarily represents $7.9 million of severance charges incurred related to employee terminations associated with the elimination of certain positions and $3.9 million of costs related to the elimination of distribution in certain territories.
Operating Income
|
|
Years Ended December 31,
|
|
|
|||||||||||
|
(In thousands)
|
2016
|
2015
|
$ change
|
% change
|
||||||||||
|
National Networks
|
$
|
784,027
|
|
$
|
754,243
|
|
$
|
29,784
|
|
3.9
|
%
|
|||
|
International and Other
|
(120,914
|
)
|
(42,542
|
)
|
(78,372
|
)
|
184.2
|
|
||||||
|
Inter-segment Eliminations
|
(5,557)
|
|
(2,508)
|
|
(3,049
|
)
|
121.6
|
|
||||||
|
$
|
657,556
|
|
$
|
709,193
|
|
$
|
(51,637
|
)
|
(7.3
|
)%
|
||||
The increase in operating income at the National Networks segment was primarily attributable to an increase in revenues of
$175.7 million
and a decrease in selling general and administrative expense of
$9.9 million
, partially offset by an increase in technical and operating expense of
$147.9 million
, an increase in restructuring expense of
$5.3 million
and an increase in depreciation and amortization of
$2.6 million
. The decrease in operating income in the International and Other segment was primarily attributable to the impairment charge for AMCNI-DMC of
$67.8 million
and an increase in restructuring expense of
$9.2 million
.
AOI
The following is a reconciliation of our consolidated operating income to consolidated AOI:
|
|
Years Ended December 31,
|
|
|
|||||||||||
|
(In thousands)
|
2016
|
2015
|
$ change
|
% change
|
||||||||||
|
Operating income
|
$
|
657,556
|
|
$
|
709,193
|
|
$
|
(51,637
|
)
|
(7.3
|
)%
|
|||
|
Share-based compensation expense
|
38,897
|
|
31,020
|
|
7,877
|
|
25.4
|
|
||||||
|
Restructuring expense
|
29,503
|
|
14,998
|
|
14,505
|
|
96.7
|
|
||||||
|
Impairment and related charges
|
67,805
|
|
—
|
|
67,805
|
|
n/m
|
|
||||||
|
Depreciation and amortization
|
84,778
|
|
83,031
|
|
1,747
|
|
2.1
|
|
||||||
|
Consolidated AOI
|
$
|
878,539
|
|
$
|
838,242
|
|
$
|
40,297
|
|
4.8
|
%
|
|||
AOI increased
$40.3 million
to
$878.5 million
for
2016
as compared to
2015
. The net change by segment was as follows:
|
|
Years Ended December 31,
|
|
|
|||||||||||
|
(In thousands)
|
2016
|
2015
|
$ change
|
% change
|
||||||||||
|
National Networks
|
$
|
855,488
|
|
$
|
810,993
|
|
$
|
44,495
|
|
5.5
|
%
|
|||
|
International and Other
|
28,608
|
|
29,757
|
|
(1,149
|
)
|
(3.9
|
)
|
||||||
|
Inter-segment eliminations
|
(5,557
|
)
|
(2,508
|
)
|
(3,049
|
)
|
121.6
|
|
||||||
|
AOI
|
$
|
878,539
|
|
$
|
838,242
|
|
$
|
40,297
|
|
4.8
|
%
|
|||
47
National Networks AOI increased due to an increase in revenues, net of
$175.7 million
and a decrease in selling, general and administrative expenses of
$16.7 million
, partially offset by an increase in technical and operating expenses of
$147.9 million
resulting primarily from an increase in program rights expense and other direct programming costs. As a result of the factors discussed above impacting the variability in revenues and operating expenses, we expect AOI to vary, perhaps materially, from quarter to quarter.
International and Other AOI decreased due to an increase in selling, general and administrative expenses of
$9.2 million
, partially offset by an increase in revenues, net of
$7.4 million
and a decrease in technical and operating expenses of
$0.7 million
. Foreign currency translation had a favorable impact on AOI of approximately
$1.3 million
.
Interest expense, net
The decrease in interest expense, net of
$7.1 million
from 2015 to 2016 is attributable to a combination of a reduction in interest expense of
$4.6 million
primarily as a result of a decrease in the interest rate on our fixed rate debt due to the early redemption of our 7.75% Notes in 2016 and an increase in interest income of
$2.6 million
due to increased cash balances throughout 2016 as compared to 2015.
Loss on extinguishment of debt
The loss on extinguishment of debt for the year ended December 31, 2016
of
$50.6 million
represents
$41.0 million
of premium paid and related fees on the early redemption of our 7.75% Notes as well as a write-off of the related unamortized discount of
$8.7 million
and unamortized deferred financing costs of
$0.9 million
.
Miscellaneous, net
The decrease in miscellaneous expense, net of
$32.8 million
is a result of a net increase in foreign currency transaction losses of
$17.0 million
, primarily unrealized foreign exchange losses, from the translation of monetary assets and liabilities that are denominated in currencies other than the underlying functional currency of the applicable entity, primarily intercompany loans and the absence in 2016 of a gain recorded in 2015 on the acquisition of a controlling interest in a previously non-consolidated joint-venture of approximately
$16.1 million
.
Income tax expense
Income tax expense was $164.9 million for the year ended December 31, 2016, representing an effective tax rate of 36%. The effective tax rate differs from the federal statutory rate of 35% due primarily to tax expense of $21.4 million resulting from an increase in the valuation allowance relating primarily to foreign and local taxes and impairment charges recorded at the AMCNI - DMC reporting unit, state income tax expense of $9.1 million, tax benefit from the domestic production activities deduction of $13.3 million, tax benefit from foreign subsidiary earnings indefinitely reinvested outside of the U.S. of $3.9 million, and tax benefit of $2.7 million related to uncertain tax positions, including accrued interest. The tax benefit relating to reductions in uncertain tax positions is primarily due to a lapse of the applicable statute of limitations.
Income tax expense was $201.1 million for the year ended December 31, 2015, representing an effective tax rate of 34%. The effective tax rate differs from the federal statutory rate of 35% due primarily to tax benefit from the domestic production activities deduction of $15.2 million, tax benefit from foreign subsidiary earnings indefinitely reinvested outside of the U.S. of $11.0 million, state income tax expense of $11.6 million, tax expense of $7.9 million resulting from an increase in the valuation allowance relating primarily to certain foreign and local income tax credit carry forwards and tax expense of $2.8 million related to uncertain tax positions, including accrued interest.
Net income attributable to noncontrolling interests
Net income attributable to noncontrolling interests consists of the noncontrolling parties' share of net earnings of consolidated joint ventures. The net change for the year ended December 31, 2016 as compared to the year ended December 31, 2015 is primarily due to the increase in earnings attributable to non-controlling interest of BBC AMERICA.
Liquidity and Capital Resources
Overview
Our operations have historically generated positive net cash flow from operating activities. However, each of our programming businesses has substantial programming acquisition and production expenditure requirements.
Sources of cash primarily include cash flow from operations, amounts available under our revolving credit facility (as described below) and access to capital markets. Although we currently believe that amounts available under our revolving credit facility will be available when and if needed, we can provide no assurance that access to such funds will not be impacted by adverse conditions in the financial markets. The obligations of the financial institutions under our revolving credit facility are several and
48
not joint and, as a result, a funding default by one or more institutions does not need to be made up by the others. As a public company, we may have access to capital and credit markets.
On March 7, 2016, the Company announced that its Board of Directors authorized a program to repurchase up to
$500 million
of its outstanding shares of common stock (the "2016 Stock Repurchase Program"). On June 6, 2017, the Board of Directors approved an increase of
$500 million
in the amount authorized for a total of
$1.0 billion
authorized under the 2016 Stock Repurchase Program.The 2016 Stock Repurchase Program has no pre-established closing date and may be suspended or discontinued at any time. For the year ended
December 31, 2017
, the Company repurchased
7.8 million
shares of its Class A common stock at an average purchase price of
$55.74
per share. As of
December 31, 2017
, the Company has
$342.6 million
available for repurchase under the 2016 Stock Repurchase Program. For the period from January 1, 2018 through
February 15, 2018
, we repurchased 361 thousand additional shares for $18.8 million.
Our principal uses of cash include the acquisition and production of programming, debt service, repurchases of outstanding debt and common stock, payments for income taxes and investments and acquisitions. We continue to increase our investment in original programming, the funding of which generally occurs six to nine months in advance of a program's airing. We expect this increased investment to continue in 2018.
As of
December 31, 2017
, our consolidated cash and cash equivalents balance includes amounts with a value of approximately
$126.9 million
held by foreign subsidiaries, primarily all of which have earnings that were subject to the one-time transition tax in the U.S. The amount of undistributed earnings that were subject to the one-time transition tax as of
December 31, 2017
was approximately
$85 million
. Most or all of the earnings of our foreign subsidiaries will continue to be permanently reinvested in foreign operations and we do not expect to incur any significant, additional taxes related to such amounts, nor have any been provided for in the current period. The Company is still evaluating whether to change its indefinite reinvestment assertion due to certain provisions of the TCJA. Any potential changes to the assertion will be made within the measurement period and accounted for as part of the change in tax law.
We believe that a combination of cash-on-hand, cash generated from operating activities and availability under our revolving credit facility will provide sufficient liquidity to service the principal and interest payments on our indebtedness, along with our other funding and investment requirements over the next twelve months and over the longer term. However, we do not expect to generate sufficient cash from operations to repay at maturity the entirety of the then outstanding balances of our debt. As a result, we will then be dependent upon our ability to access the capital and credit markets in order to repay or refinance the outstanding balances of our indebtedness. Failure to raise significant amounts of funding to repay these obligations at maturity would adversely affect our business. In such a circumstance, we would need to take other actions including selling assets, seeking strategic investments from third parties or reducing other discretionary uses of cash. See Item 1A, "Risk Factors – Risks Related to Our Debt" in this Annual Report.
On February 26, 2018, the Company delivered a letter to RLJE pursuant to which the Company proposed to acquire the outstanding shares of RLJE not currently owned by the Company or entities affiliated with Robert L. Johnson for a purchase price of
$4.25
per share in cash. Through this offer, the Company intends for RLJE to become a privately owned subsidiary of the Company, with a minority stake held by Mr. Johnson. The board of directors of RLJE has formed a special committee of independent directors to consider the proposal. There can be no assurance that the proposal made by the Company to RLJE will result in a transaction or the terms upon which any transaction may occur.
Cash Flow Discussion
The following table is a summary of cash flows provided by (used in) operations for the periods indicated:
|
|
Years Ended December 31,
|
||||||||||
|
(In thousands)
|
2017
|
2016
|
2015
|
||||||||
|
Cash flow provided by operating activities
|
$
|
385,729
|
|
$
|
514,325
|
|
$
|
370,039
|
|
||
|
Cash flow used in investing activities
|
(130,602
|
)
|
(174,574
|
)
|
(116,770
|
)
|
|||||
|
Cash flow used in financing activities
|
(204,210
|
)
|
(153,864
|
)
|
(127,279
|
)
|
|||||
|
Net increase in cash from operations
|
50,917
|
|
185,887
|
|
125,990
|
|
|||||
Operating Activities
Net cash provided by operating activities amounted to
$385.7 million
for the year ended
December 31, 2017
as compared to
$514.3 million
for the year ended
December 31, 2016
. In
2017
, net cash provided by operating activities resulted from
$1.5 billion
of net income before amortization of program rights, depreciation and amortization, loss on extinguishment of debt, impairment charges and other non-cash items, which was partially offset by payments for program rights of
$996.8 million
.
Additionally, income taxes payable
decreased
$22.0 million
and accounts payable, accrued expenses and other liabilities
increased
49
$15.6 million
primarily due to higher accrued interest and participation and residuals, partially offset by lower employee related liabilities at
December 31, 2017
as compared to the prior year. Accounts receivable, trade,
increased
$74.6 million
at
December 31, 2017
as compared to the prior year primarily driven by higher distribution revenues as well as timing of cash receipts and prepaid expenses and other assets increased
$60.0 million
. Changes in all other assets and liabilities during the year resulted in a decrease in cash of
$16.2 million
.
In 2016, net cash provided by operating activities resulted from
$1.5 billion
of net income before amortization of program rights, depreciation and amortization, loss on extinguishment of debt, impairment charges and other non-cash items, which was partially offset by payments for program rights of
$973.2 million
. Additionally, income taxes payable increased
$43.2 million
and accounts payable, accrued expenses and other liabilities increased
$33.1 million
primarily due to higher accrued participation and residuals, partially offset by lower employee related liabilities at December 31, 2016 as compared to the prior year. Accounts receivable, trade, increased
$30.1 million
at December 31, 2016 as compared to the prior year primarily driven by higher revenues as well as timing of cash receipts. Changes in all other assets and liabilities during the year resulted in a decrease in cash of
$21.7 million
.
In 2015, net cash provided by operating activities resulted from
$1.3 billion
of net income before depreciation and amortization and other non-cash items, which was partially offset by payments for program rights of
$839.1 million
. Additionally, accounts payable, accrued expenses and other liabilities increased
$42.4 million
primarily due to higher accrued participation and employee related liabilities at December 31, 2015 as compared to the prior year. Accounts receivable, trade, increased
$111.0 million
at December 31, 2015 as compared to the prior year primarily driven by higher revenues as well as timing of cash receipts. Changes in all other assets and liabilities during the year resulted in a decrease in cash of
$21.2 million
.
Investing Activities
Net cash used in investing activities for the years ended
December 31, 2017
,
2016
and
2015
was
$130.6 million
,
$174.6 million
and
$116.8 million
, respectively. In
2017
, net cash used in investing activities was primarily related to capital expenditures of
$80.0 million
, primarily related to modernization and improvements of facilities and equipment, and investments of
$53.0 million
which included additional funding for RLJE and the purchase of several minority investments.
In 2016, net cash used in investing activities was primarily related to investments of
$95.0 million
which included the RLJE term loans and the purchase of a minority investment, and capital expenditures of
$79.2 million
, primarily related to modernization and improvements of facilities and equipment.
In 2015, net cash used in investing activities was primarily related to capital expenditures of
$68.3 million
, primarily for the purchase of information technology hardware and software and transmission related equipment, as well as purchases of investments of
$24.3 million
and a number of small acquisitions totaling
$24.2 million
.
Financing Activities
Net cash used in financing activities amounted to
$204.2 million
for the year ended
December 31, 2017
as compared to
$153.9 million
for the year ended
December 31, 2016
and
$127.3 million
for the year ended December 31, 2015. In
2017
, financing activities primarily consisted of net proceeds of $786.0 million from the issuance of the 4.75% Notes due 2025 and $750.0 million proceeds for the new Term Loan A Facility, partially offset by payments on the old Term Loan A Facility of
$1.3 billion
. In addition, net cash used in financing activities includes purchases of Class A Common Stock of
$434.2 million
under our 2016 Stock Repurchase Program, distributions to a noncontrolling member of
$18.6 million
, taxes paid in lieu of shares issued for equity-based compensation of
$14.5 million
, payments for financing costs of
$10.4 million
, and principal payments on capital lease obligations of
$4.6 million
.
In 2016, financing activities primarily consisted of cash provided by the issuance of
$1.0 billion
of 5.00% Notes, net of an issuance discount of
$17.5 million
, offset by principal payments on long term debt of
$848.0 million
which included
$700.0 million
for the repayment of the Company's 7.75% Notes, as well as scheduled repayments of principal on the Company's Term A loan facility of
$148.0 million
. In addition, net cash used in financing activities includes purchases of Class A Common Stock of
$223.2 million
under our 2016 Stock Repurchase Program, premium payments and fees for the Tender Offer and redemption of the 7.75% Notes of
$41.0 million
, taxes paid in lieu of shares issued for equity-based compensation of
$10.8 million
, distributions to a noncontrolling member of
$9.0 million
and principal payments on capital lease obligations of
$4.3 million
.
Net cash used in financing activities amounted to
$127.3 million
for the year ended December 31, 2015 was driven by repayment of long-term debt and promissory notes of
$114.0 million
as well as taxes paid in lieu of shares issued for equity-based compensation of
$14.5 million
.
50
Debt Financing Agreements
Amended and Restated Senior Secured Credit Facility
On July 28, 2017, AMC Networks entered into a Second Amended and Restated Credit Agreement (the "Credit Agreement") among AMC Networks and its subsidiary, AMC Network Entertainment LLC, as the Initial Borrowers, certain of AMC Networks' subsidiaries, as restricted subsidiaries, JPMorgan Chase Bank, N.A., as Administrative Agent, Collateral Agent and an L/C Issuer, Bank of America as an L/C Issuer, and the lenders party thereto. The Credit Agreement amends and restates AMC Networks' prior credit agreement dated December 16, 2013 in its entirety. The Credit Agreement provides the Initial Borrowers with senior secured credit facilities consisting of (a) a $750 million Term Loan A (the "Term Loan A Facility") after giving effect to the approximate $400 million payment from the proceeds of the 4.75% Notes due 2025 described below and (b) a $500 million revolving credit facility (the "Revolving Facility") that was not drawn upon initially. Under the Credit Agreement, the maturity date of the Term Loan A Facility was extended to July 28, 2023 and the maturity date of the Revolving Facility was extended to July 28, 2022.
Borrowings under the Credit Agreement bear interest at a floating rate, which at the option of the Initial Borrowers may be either (a) a base rate plus an additional rate ranging from 0.25% to 1.25% per annum (determined based on a cash flow ratio) (the "Base Rate"), or (b) a Eurodollar rate plus an additional rate ranging from 1.25% to 2.25% per annum (determined based on a cash flow ratio) (the "Eurodollar Rate"), provided that for the six month period following the closing date, the additional rate used in calculating both floating rates will be (i) 0.50% per annum for borrowings bearing the Base Rate, and (ii) 1.50% per annum for borrowings bearing the Eurodollar Rate.
The Credit Agreement requires the Initial Borrowers to pay a commitment fee of between 0.25% and 0.50% (determined based on a cash flow ratio) in respect of the average daily unused commitments under the Revolving Facility. The Initial Borrowers also are required to pay customary letter of credit fees, as well as fronting fees, to banks that issue letters of credit pursuant to the Credit Agreement.
All obligations under the Credit Agreement are guaranteed by certain of the Initial Borrowers' existing and future domestic restricted subsidiaries in accordance with the Credit Agreement. All obligations under the Credit Agreement, including the guarantees of those obligations, are secured by certain assets of the Initial Borrowers and certain of their subsidiaries (collectively, the "Loan Parties").
The Credit Agreement contains certain affirmative and negative covenants applicable to the Loan Parties. These include restrictions on the Loan Parties' ability to incur indebtedness, make investments, place liens on assets, dispose of assets, enter into certain affiliate transactions and make certain restricted payments, including restrictions on AMC Networks' ability to pay dividends on and to repurchase its common stock. The Credit Agreement also requires the Initial Borrowers to comply with the following financial covenants: (i) a maximum ratio of net debt to annual operating cash flow (each defined in the Credit Agreement) of 6.00:1 initially and decreasing in steps down to 5.00:1 on and after January 1, 2022, subject to increase if AMC Networks consummates any leveraging acquisition; and (ii) a minimum ratio of annual operating cash flow to annual total interest expense (as defined in the Credit Agreement) of 2.50:1.
The revolving credit facility was not drawn upon at
December 31, 2017
. The total undrawn revolver commitment is available to be drawn for our general corporate purposes.
AMC Networks was in compliance with all of its covenants under the Credit Facility as of December 31, 2017.
4.75% Notes due 2025
On July 28, 2017, AMC Networks issued, and certain of AMC Networks' subsidiaries (hereinafter, the "Guarantors") guaranteed, $800 million aggregate principal amount of senior notes due August 1, 2025 (the "4.75% Notes due 2025") in a registered public offering. The 4.75% Notes due 2025 were issued net of a $14.0 million underwriting discount. AMC Networks used approximately $400 million of the net proceeds to repay loans under the Term Loan A Facility under AMC Networks' senior secured credit facility and to pay fees and expenses related to the issuance. The remaining proceeds are for general corporate purposes. The 4.75% Notes due 2025 were issued pursuant to an indenture, dated as of March 30, 2016, as amended by the Second Supplemental Indenture, dated as of July 28, 2017.
The 4.75% Notes due 2025 bear interest at a rate of 4.75% per annum and mature on August 1, 2025. Interest is payable semiannually on February 1 and August 1 of each year, commencing on February 1, 2018. The 4.75% Notes due 2025 are AMC Networks' general senior unsecured obligations and rank equally with all of AMC Networks' and the Guarantors' existing and future unsecured and unsubordinated indebtedness, but are effectively subordinated to all of AMC Networks' and the guarantors' existing and future secured indebtedness, including all borrowings and guarantees under the Credit Agreement referred to below, to the extent of the assets securing that indebtedness. The 4.75% Notes due 2025 are subject to redemption on the terms set forth in the Second Supplemental Indenture.
The 4.75% Notes due 2025 may be redeemed, at AMC Networks' option, in whole or in part, at any time on or after August 1, 2021, at a redemption price equal to 102.375% of the principal amount thereof (plus accrued and unpaid interest thereon, if any,
51
to the date of such redemption), declining annually to
100%
of the principal amount thereof (plus accrued and unpaid interest thereon, if any, to the date of such redemption) beginning on August 1, 2023.
In addition to the optional redemption of the 4.75% Notes due 2025 described above, at any time prior to August 1, 2020, AMC Networks may redeem up to 35% of the aggregate principal amount of the 4.75% Notes due 2025 at a redemption price equal to 104.750% of the principal amount thereof, plus accrued and unpaid interest and additional interest, if any, using the net proceeds of certain equity offerings.
Finally, at any time prior to August 1, 2021, AMC Networks may redeem the 4.75% Notes due 2025, at its option in whole or in part, at any time and from time to time, at a redemption price equal to 100% of the principal amount thereof to be redeemed plus the "Applicable Premium" calculated as described in the Second Supplemental Indenture at the rate of T+50 basis points, and accrued and unpaid interest thereon, if any, to, but excluding, the redemption date.
The indenture governing the 4.75% Notes due 2025 contains certain affirmative and negative covenants applicable to AMC Networks and its restricted subsidiaries including restrictions on their ability to incur additional indebtedness, consummate certain assets sales, make investments in entities that are not restricted subsidiaries, create liens on their assets, enter into certain affiliate transactions and make certain restricted payments, including restrictions on AMC Networks' ability to pay dividends on, or repurchase, its common stock.
5.00% Notes due 2024
On March 30, 2016, AMC Networks issued $1.0 billion in aggregate principal amount of 5.00% senior notes due 2024 (the "5.00% Notes due 2024"), net of an issuance discount of $17.5 million. AMC Networks used
$703.0 million
of the net proceeds of this offering to make a cash tender ("Tender Offer") for the 7.75% Notes. In addition,
$45.6 million
of the proceeds from the issuance of the 5.00% Notes due 2024 was used for the redemption of the 7.75% Notes not tendered. The remaining proceeds of the 5.00% Notes due 2024 are for general corporate purposes. The 5.00% Notes due 2024 were issued pursuant to an indenture dated as of March 30, 2016.
Interest on the 5.00% Notes due 2024 is payable semi-annually in arrears on April 1 and October 1 of each year.
The 5.00% Notes due 2024 may be redeemed, in whole or in part, at any time on or after April 1, 2020, at a redemption price equal to
102.5%
of the principal amount thereof (plus accrued and unpaid interest thereon, if any, to the date of such redemption), declining annually to
100%
of the principal amount thereof (plus accrued and unpaid interest thereon, if any, to the date of such redemption) beginning on April 1, 2022.
The 5.00% Notes due 2024 are guaranteed on a senior unsecured basis by the Guarantors, in accordance with the indenture governing the 5.00% Notes due 2024. The guarantees under the 5.00% Notes due 2024 are full and unconditional and joint and several.
The indenture governing the 5.00% Notes due 2024 contains certain affirmative and negative covenants applicable to AMC Networks and its restricted subsidiaries including restrictions on their ability to incur additional indebtedness, consummate certain assets sales, make investments in entities that are not restricted subsidiaries, create liens on their assets, enter into certain affiliate transactions and make certain restricted payments, including restrictions on AMC Networks' ability to pay dividends on, or repurchase, its common stock.
4.75% Senior Notes due 2022
On December 17, 2012, AMC Networks issued $600.0 million in aggregate principal amount of its 4.75% senior notes, net of an issuance discount of $10.5 million, due December 15, 2022 (the "4.75% Notes due 2022"). AMC Networks used the net proceeds of this offering to repay the outstanding amount under its term loan B facility of approximately $587.6 million, with the remaining proceeds used for general corporate purposes. The 4.75% Notes due 2022 were issued pursuant to an indenture, and first supplemental indenture, each dated as of December 17, 2012.
Interest on the 4.75% Notes due 2022 accrues at the rate of 4.75% per annum and is payable semi-annually in arrears on June 15 and December 15 of each year.
The 4.75% Notes due 2022 may be redeemed, in whole or in part, at any time on or after December 15, 2017, at a redemption price equal to 102.375% of the principal amount thereof (plus accrued and unpaid interest thereon, if any, to the date of such redemption), declining annually to 100% of the principal amount thereof (plus accrued and unpaid interest thereon, if any, to the date of such redemption) beginning on December 15, 2020.
The 4.75% Notes due 2022 are guaranteed on a senior unsecured basis by the Guarantors, in accordance with the indenture governing the 4.75% Notes due 2022. The guarantees under the 4.75% Notes due 2022 are full and unconditional and joint and several.
52
The indenture governing the 4.75% Notes contains certain affirmative and negative covenants applicable to AMC Networks and its restricted subsidiaries including restrictions on their ability to incur additional indebtedness, consummate certain assets sales, make investments in entities that are not restricted subsidiaries, create liens on their assets, enter into certain affiliate transactions and make certain restricted payments, including restrictions on AMC Networks' ability to pay dividends on, or repurchase, its common stock.
AMC Networks was in compliance with all of its debt covenants as of
December 31, 2017
.
Contractual Obligations and Off Balance Sheet Arrangements
Contractual Obligations
Our contractual obligations as of
December 31, 2017
are summarized in the following table:
|
(In thousands)
|
Payments due by period
|
||||||||||||||||||
|
Total
|
Year 1
|
Years
2 - 3
|
Years
4 - 5
|
More than
5 years
|
|||||||||||||||
|
Debt obligations:
|
|
|
|||||||||||||||||
|
Principal payments
|
$
|
3,150,000
|
|
$
|
—
|
|
$
|
75,000
|
|
$
|
850,000
|
|
$
|
2,225,000
|
|
||||
|
Interest payments (1)
|
919,619
|
|
141,078
|
|
292,291
|
|
284,523
|
|
201,727
|
|
|||||||||
|
Purchase obligations (2)
|
1,983,967
|
|
705,387
|
|
621,937
|
|
186,377
|
|
470,266
|
|
|||||||||
|
Operating lease obligations
|
234,741
|
|
28,895
|
|
52,706
|
|
47,987
|
|
105,153
|
|
|||||||||
|
Guarantees (3)
|
160,024
|
|
160,024
|
|
—
|
|
—
|
|
—
|
|
|||||||||
|
Capital lease obligations (4)
|
44,414
|
|
7,901
|
|
13,016
|
|
9,050
|
|
14,447
|
|
|||||||||
|
Total
|
$
|
6,492,765
|
|
$
|
1,043,285
|
|
$
|
1,054,950
|
|
$
|
1,377,937
|
|
$
|
3,016,593
|
|
||||
|
(1)
|
Interest on variable rate debt and the variable portion of interest rate swap contracts is estimated based on a LIBOR yield curve as of
December 31, 2017
.
|
|
(2)
|
Purchase obligations consist primarily of program rights obligations, participations and residuals, and transmission and marketing commitments.
|
|
(3)
|
Consists primarily of a guarantee of payments to a production service company for certain production related costs.
|
|
(4)
|
Capital lease obligation amounts include imputed interest.
|
The contractual obligations table above does not include any liabilities for uncertain income tax positions due to the fact that we are unable to reasonably predict the ultimate amount or timing of any related payments in settlement of our liabilities for uncertain income tax positions. At
December 31, 2017
, the liability for uncertain tax positions was
$21.8 million
, excluding the related accrued interest liability of
$4.5 million
and deferred tax assets of
$4.9 million
. See Note
14
to the accompanying consolidated financial statements for further discussion of the Company's income taxes.
In connection with the acquisition of BBC AMERICA, the terms of the agreement provide BBCWA with a right to put all of its
50.1%
noncontrolling interest to the Company at the greater of the then fair value or the fair value of the initial equity interest at inception. The put option is exercisable on the fifteenth (October 23, 2029) and twenty-fifth (October 23, 2039) year anniversaries of the agreement. The above table does not include any future payments that would be required upon the exercise of these put rights.
In connection with the creation of a joint venture entity in 2013, the terms of the agreement provide the noncontrolling member with a right to put all of its interest to the Company at the then fair value. The above table does not include any future payments that would be required upon the exercise of this put right.
In connection with our investment in Funny or Die, Inc., we may be obligated to increase our investment over time.
Off-Balance Sheet Arrangements
We have no material off-balance sheet arrangements (as defined in Item 303(a)(4) of Regulation S-K).
Critical Accounting Policies and Estimates
In preparing our financial statements, we are required to make certain estimates, judgments and assumptions that affect the reported amounts of assets and liabilities at the date of the financial statements and the reported amounts of revenues and expenses during the periods presented. These judgments can be subjective and complex and, consequently, actual results could differ materially from those estimates and assumptions. We base our estimates on historical experience and various other assumptions
53
believed to be reasonable under the circumstances, the results of which form the basis for making judgments about the carrying values of assets and liabilities that are not readily apparent from other sources. As with any set of assumptions and estimates, there is a range of reasonably likely amounts that may be reported.
The following critical accounting policies have been identified as those that affect the more significant judgments and estimates used in the preparation of the consolidated financial statements:
Program Rights
Rights to programming, including feature films and episodic series acquired under license agreements, are stated at the lower of amortized cost or net realizable value. Such licensed rights along with the related obligations are recorded at the contract value when a license agreement is executed, unless there is uncertainty with respect to either cost, acceptability or availability. If such uncertainty exists, those rights and obligations are recorded at the earlier of when the uncertainty is resolved or when the license period begins. Costs are amortized to technical and operating expense on a straight-line basis over a period not to exceed the respective license periods.
Our owned original programming is primarily produced by production companies, with the remainder produced by us. Owned original programming costs, including certain development and estimated participation and residual costs, qualifying for capitalization as program rights are amortized to technical and operating expense over their estimated useful lives, commencing upon the first airing, based on attributable revenue for airings to date as a percentage of total projected attributable revenue, or ultimate revenue (film-forecast-computation method). Projected attributable revenue is based on previously generated revenues for similar content in established markets, primarily consisting of distribution and advertising revenues, and projected program usage. Projected program usage is based on the current expectation of future exhibitions taking into account historical usage of similar content. Projected attributable revenue can change based upon programming market acceptance, levels of distribution and advertising revenue, and decisions regarding planned program usage. These calculations require management to make assumptions and to apply judgment regarding revenue and planned usage. We periodically review revenue estimates and planned usage and revise our assumptions if necessary, which could either accelerate or delay the timing of amortization expense or result in a write-down of the program right to its fair value. We believe the most sensitive factor affecting our estimate of ultimate revenues is the program's audience ratings. A program's strong performance could result in increased usage and increased revenues in a particular period resulting in accelerated amortization of production costs in that period. Poor ratings may result in the reduction of planned usage or the abandonment of a program, which would require a write-off of any unamortized production costs. A failure to adjust for a downward change in estimates of ultimate revenues could result in the understatement of program rights amortization expense for the period. Historically, other than in instances of write-offs, actual ultimate revenue amounts have not significantly differed from our estimates of ultimate revenue.
We periodically review the programming usefulness of our licensed and owned original program rights based on a series of factors, including expected future revenue generation from airings on our networks and other exploitation opportunities, ratings, type and quality of program material, standards and practices and fitness for exhibition through various forms of distribution. If it is determined that film or other program rights have limited, or no, future programming usefulness, a write-off of the unamortized cost is recorded in technical and operating expense. Any capitalized pilot costs for programs that we determine will not be produced are also written off. Program rights write-offs of
$49.4 million
,
$26.2 million
and
$43.2 million
were recorded for the years ended
December 31, 2017
,
2016
and
2015
, respectively.
Impairment of Long-Lived and Indefinite-Lived Intangible Assets
Long-Lived Assets and Amortizable Intangible Assets
We review our long-lived assets (property and equipment, and intangible assets subject to amortization that arose from acquisitions) for impairment whenever events or circumstances indicate that the carrying amount of an asset may not be recoverable. If the sum of the expected cash flows, undiscounted and without interest, is less than the carrying amount of the asset, an impairment loss is recognized as the amount by which the carrying amount of the asset exceeds its fair value.
Goodwill
Goodwill and identifiable intangible assets that have indefinite useful lives are not amortized, but instead are tested annually for impairment and upon the occurrence of certain events or substantive changes in circumstances.
The annual goodwill impairment test allows for the option to first assess qualitative factors to determine whether it is more likely than not that the fair value of a reporting unit is less than its carrying amount. An entity may choose to perform the qualitative assessment on none, some or all of its reporting units or an entity may bypass the qualitative assessment for any reporting unit and proceed directly to step one of the quantitative impairment test. If it is determined, on the basis of qualitative factors, that the fair value of a reporting unit is, more likely than not, less than its carrying value, the quantitative impairment test is required. For impairment tests performed after January 1, 2017, the Company adopted the guidance in Accounting Standards Update 2017-04
Intangibles – Goodwill and Other (Topic 350): Simplifying the Test for Goodwill Impairment
, which removes step 2 of the goodwill
54
impairment test and replaces it with a simplified model. Under the simplified model, the Company calculates any goodwill impairment as the difference between the carrying amount of a reporting unit and its fair value, but not to exceed the carrying amount of goodwill. For impairment tests performed before January 1, 2017, the quantitative impairment test is a two-step process. The first step compares the carrying amount of a reporting unit, including goodwill, with its fair value utilizing an enterprise-value based approach. If the carrying amount of a reporting unit exceeds its fair value, the second step of the goodwill impairment test is performed to measure the amount of the goodwill impairment loss, if any. The second step compares the implied fair value of the reporting unit's goodwill with the carrying amount of that goodwill. If the carrying amount of the reporting unit's goodwill exceeds the implied fair value of that goodwill, an impairment loss is recognized in an amount equal to that excess. The implied fair value of goodwill is determined in the same manner as the amount of goodwill that would be recognized in a business combination.
The carrying amount of goodwill, by operating segment is as follows:
|
December 31, 2017
|
|||
|
National Networks
|
$
|
239,759
|
|
|
International and Other
|
455,399
|
|
|
|
$
|
695,158
|
|
|
Based on our annual impairment test for goodwill as of December 1,
2017
, no impairment charge was required for any of our reporting units. We performed a qualitative assessment for all reporting units, other than the International Programming Networks reporting unit. The qualitative assessment included, but was not limited to, consideration of the historical significant excesses of the estimated fair value of the reporting unit over its carrying value (including allocated goodwill), macroeconomic conditions, industry and market considerations, cost factors and historical and projected cash flows. We performed a quantitative assessment for the International Programming Networks reporting unit. Based on the quantitative assessment, if the fair value of the International Programming Networks reporting unit decreased by more than
2%
, we would be required to record an impairment of goodwill, which may be material to our results of operations in any particular subsequent reporting period.
In assessing the recoverability of goodwill, we must make assumptions regarding estimated future cash flows and other factors to determine the fair value of the respective assets. These estimates and assumptions could have a significant impact on whether an impairment charge is recognized and also the magnitude of any such charge. Fair value estimates are made at a specific point in time, based on relevant information. These estimates are subjective in nature and involve uncertainties and matters of significant judgments and therefore cannot be determined with precision. Changes in assumptions could significantly affect the estimates. Estimates of fair value for goodwill impairment testing are primarily determined using discounted cash flows and comparable market transactions methods. These valuation methods are based on estimates and assumptions including projected future cash flows, discount rate and determination of appropriate market comparables and determination of whether a premium or discount should be applied to comparables. Projected future cash flows also include assumptions for renewals of affiliation agreements, the projected number of subscribers and the projected average rates per basic and viewing subscribers and growth in fixed price contractual arrangements used to determine affiliation fee revenue, access to program rights and the cost of such program rights, amount of programming time that is advertiser supported, number of advertising spots available and the sell through rates for those spots, average fee per advertising spot and operating margins, among other assumptions. If these estimates or material related assumptions change in the future, we may be required to record impairment charges related to goodwill. For example, if our future revenue growth is lower than expected, or if our programming costs exceed amounts currently expected, and we are unable to mitigate the impact of these factors, an impairment charge related to the goodwill associated with our International Programming Networks reporting unit may be required.
Indefinite-Lived Intangible Assets
Indefinite-lived intangible assets established in connection with business combinations primarily consist of trademarks. The impairment test for identifiable indefinite-lived intangible assets consists of a comparison of the estimated fair value of the intangible asset with its carrying value. If the carrying value exceeds its fair value, an impairment loss is recognized in an amount equal to that excess.
Based on our impairment test for identifiable indefinite-lived intangible assets, no impairment charge was required. Indefinite-lived intangible assets relate to SundanceTV trademarks, which were valued using a relief-from-royalty method in which the expected benefits are valued by discounting estimated royalty revenue over projected revenues covered by the trademarks. In order to evaluate the sensitivity of the fair value calculations for the identifiable indefinite-lived intangible assets, we applied a hypothetical
20%
decrease to the estimated fair value of the identifiable indefinite-lived intangible assets. This hypothetical decrease in estimated fair value would not result in an impairment.
Significant judgments inherent in estimating the fair value of indefinite-lived intangible assets include the selection of appropriate discount and royalty rates, estimating the amount and timing of estimated future cash flows and identification of
55
appropriate continuing growth rate assumptions. The discount rates used in the analysis are intended to reflect the risk inherent in the projected future cash flows generated by the respective intangible assets.
Useful Lives of Finite-Lived Intangible Assets
We have recognized intangible assets for affiliation agreements and affiliate relationships, advertiser relationships and other intangible assets as a result of our accounting for business combinations. We have determined that such intangible assets have finite lives. The estimated useful lives and net carrying values of these intangible assets at
December 31, 2017
are as follows:
|
Net Carrying Value at, December 31, 2017
|
Estimated Useful
Lives in Years
|
||||
|
Affiliate and customer relationships
|
$
|
359,802
|
|
6 to 25 years
|
|
|
Advertiser relationships
|
32,877
|
|
11 years
|
||
|
Trade names
|
39,341
|
|
20 years
|
||
|
Other amortizable intangible assets
|
5,322
|
|
2 to 15 years
|
||
|
$
|
437,342
|
|
|||
The useful lives for the affiliate relationships were determined based upon an analysis of the weighted average remaining terms of existing agreements we had in place with our major distributors at the time that purchase accounting was applied, plus an estimate for renewals of such agreements. We have been successful in renewing our major affiliation agreements and maintaining customer relationships in the past and believe we will be able to renew our major affiliation agreements and maintain those customer relationships in the future. However, it is possible that we will not successfully renew such agreements as they expire or that if we do, the net revenue earned may not equal or exceed the net revenue currently being earned, which could have a significant adverse impact on our business and the carrying values of the related intangible assets.
There have been periods when an existing affiliation agreement has expired and the parties have not finalized negotiations of either a renewal of that agreement or a new agreement for certain periods of time. In substantially all these instances, the affiliates continued to carry and pay for the service under oral or written interim agreements until execution of definitive replacement agreements or renewals. If an affiliate were to cease carrying a service on an other-than-temporary basis, we would record an impairment charge for the then remaining carrying value of that affiliation agreement intangible asset. If we were to renew an affiliation agreement at rates that produced materially less net revenue compared to the net revenue produced under the previous agreement, we would evaluate the impact on our cash flows and, if necessary, would further evaluate such indication of potential impairment by following the policy described above under "Impairment of Long-Lived and Indefinite-Lived Assets" for the asset group containing that intangible asset. We also would evaluate whether the remaining useful life of the affiliate relationship intangible asset remained appropriate.
Income Taxes
The Tax Cuts and Jobs Act ("TCJA") was enacted on December 22, 2017. The TCJA introduces significant changes in tax law, for example, a reduction in the U.S. federal corporate tax rate from 35% to 21%, the requirement for companies to pay a one-time transition tax on earnings of certain foreign subsidiaries that were previously tax deferred and the creation of new taxes on certain foreign-sourced earnings. Companies are required to recognize the effect of tax law changes in the period of enactment, however, due to the complexities involved in accounting for the enactment of TCJA, SEC Staff Accounting Bulletin ("SAB") 118 allows us to record provisional amounts to reflect the impacts of the TCJA during a one year "measurement period". The Company has recorded the following amounts as provisional due to on-going regulatory guidance, additional analysis and changes in interpretations and assumptions expected over the next twelve months.
The Company recorded a tax benefit of $67.9 million which represents the one-time impact of the change in the corporate tax rate on deferred tax assets and liabilities. Although the accounting related to the rate change is complete, we are still analyzing certain aspects of the TCJA and refining our calculations, which could potentially affect the measurement of these balances or potentially give rise to new deferred tax amounts.
The one-time transition tax is based on total post-1986 earnings and profits ("E&P") which the Company has previously deferred from U.S. income taxes. An estimated amount was recorded for the one-time transition tax liability, net of the foreign taxes deemed paid, resulting in an increase in income tax expense of $11.0 million. The Company has sufficient foreign tax credits to offset the transition tax, however, the Company has not yet completed its calculation of the total post-1986 foreign E&P for these foreign subsidiaries. Further, the transition tax is based in part on the amount of those earnings held in cash and other specified assets. This amount may change when the calculation of post-1986 foreign E&P previously deferred from U.S. federal taxation and the amounts held in cash or other specified assets are finalized.
The Company is still evaluating whether to change its indefinite reinvestment assertion due to certain provisions of the TCJA. Any potential changes to the assertion will be made within the measurement period and accounted for as part of the change in tax law.
56
The Company will continue to analyze the effects of the TCJA on its financial statements and operations. Additional impacts from the enactment of the TCJA will be recorded as they are identified during the measurement period as provided for in SAB 118.
Other significant provisions of TCJA that are not yet effective but may impact income taxes in future years include: the inclusion of commissions and performance based compensation in determining the executive compensation limitation, an exemption from U.S. tax on dividends of future foreign earnings, a reduced tax on excess returns of a U.S. corporation from foreign sales (i.e., foreign derived intangibles income or FDII), a minimum tax on certain foreign earnings in excess of 10 percent of the foreign subsidiaries tangible assets (i.e., global intangible low-taxed income or GILTI). The company is still evaluating whether to make a policy election to treat the GILTI tax as a period expense or to provide U.S. deferred taxes on foreign temporary differences that are expected to generate GILTI income when they reverse in future years.
We estimate that the Bipartisan Budget Act of 2018, enacted on February 9, 2018, will reduce the Company’s current income tax liability and net deferred tax asset from the amounts reported at December 31, 2017 by approximately
$28.0 million
and
$19.0 million
, respectively, primarily as a result of the extension of the provision allowing a current tax deduction for the costs of certain television productions and the impact of the one-time change in the corporate tax rate on deferred tax assets and liabilities.
Judgment is required in determining the provision for income taxes and related accruals, deferred tax assets and liabilities. Consequently, changes in our estimates with regard to uncertain tax positions and the realization of deferred tax assets will impact our results of operations and financial position. Deferred tax assets are evaluated quarterly for expected future realization and reduced by a valuation allowance to the extent management believes it is more likely than not that a portion will not be realized. See Note
14
to the accompanying consolidated financial statements for further discussion of the Company's income taxes.
Recently Issued Accounting Pronouncements
In May 2017, the Financial Accounting Standards Board ("FASB") issued ASU No. 2017-09
Compensation-Stock Compensation (Topic 718)
. ASU 2017-09 addresses changes to the terms or conditions of a share-based payment award, specifically regarding which changes to the terms or conditions of a share-based payment award would require an entity to apply modification accounting. The guidance does not change the accounting for modifications but clarifies that an entity should account for the effects of a modification unless the fair value, vesting conditions, and classification of the modified award are the same immediately before the original award is modified. ASU 2017-09 is effective in the first quarter of 2018, with early adoption permitted. The adoption of ASU 2017-09 is not expected to have a material impact on the Company's consolidated financial statements.
In October 2016, the FASB issued ASU No. 2016-16,
Income Taxes – Intra-Entity Transfers of Assets Other Than Inventory
. ASU 2016-16 simplifies the accounting for the income tax consequences of intra-entity transfers of assets other than inventory and includes requirements to recognize the income tax consequences of an intra-entity transfer of an asset other than inventory when the transfer occurs; therefore, eliminating the exception for an intra-entity transfer of an asset other than inventory. ASU 2016-16 is effective for the Company in the first quarter of 2018, with early adoption permitted. Any adjustments as a result of adoption are to be applied on a modified retrospective basis through a cumulative-effect adjustment directly to retained earnings as of the beginning of the period of adoption. The adoption of ASU 2016-16 is not expected to have a material impact on the Company's consolidated financial statements.
In August 2016, the FASB issued ASU 2016-15,
Statement of Cash Flows (Topic 230), Classification of Certain Cash Receipts and Cash Payments
. The guidance clarifies the way in which certain cash receipts and cash payments should be classified on the statement of cash flows and also how the predominance principle should be applied when cash receipts and cash payments have aspects of more than one class of cash flows. ASU 2016-15 is effective in the first quarter of 2018 with early adoption permitted. The adoption of ASU 2016-15 is not expected to have a material impact on the Company's consolidated financial statements.
In February 2016, the FASB issued ASU No. 2016-02,
Leases (Topic 842)
. ASU 2016-02 requires lessees to record most of their leases on the balance sheet, which will be recognized as a right-of-use asset and a lease liability. The Company will be required to classify each separate lease component as an operating or finance lease at the lease commencement date. Initial measurement of the right-of-use asset and lease liability is the same for operating and finance leases, however, expense recognition and amortization of the right-of-use asset differs. Operating leases will reflect lease expense on a straight-line basis similar to current operating leases. The straight-line expense will reflect the interest expense on the lease liability (effective interest method) and amortization of the right-of-use asset, which will be presented as a single line item in the operating expense section of the income statement. Finance leases will reflect a front-loaded expense pattern similar to the pattern for current capital leases. ASU 2016-02 is effective in the first quarter of 2019, with early adoption permitted. The Company is currently determining its implementation approach and assessing the impact the adoption will have on its consolidated financial statements.
In May 2014, the FASB issued ASU No. 2014-09,
Revenue from Contracts with Customers (Topic 606)
. ASU 2014-09 provides new guidance related to how an entity should recognize revenue to depict the transfer of promised goods or services to customers in an amount that reflects the consideration to which the entity expects to be entitled in exchange for those goods or services. The standard also expands the required disclosures to include the disaggregation of revenue from contracts with customers
57
into categories that depict how the nature, timing and uncertainty of revenue and cash flows are affected by economic factors. Since its issuance, the FASB has issued additional interpretive guidance relating to the standard which included the topics of principal versus agent considerations and identifying performance obligations and licensing.
We have reviewed each of our revenue streams and identified the required changes to our revenue recognition policies. We have substantially completed our evaluation of the impact of the standard and we do not expect the adoption of the standard will have a material impact to our consolidated revenues. However, as a result of applying the standard, there are certain components of our distribution revenues where the standard generally results in earlier recognition of revenue compared to our historical policies due to: (i) the requirement to estimate and recognize variable consideration prior to such amounts becoming fixed and determinable, (ii) recognition of royalties in the period of usage, and (iii) recognition of certain arrangements with minimum guarantees on a time-based (straight-line) basis. The Company will adopt the standard as of January 1, 2018, using the modified retrospective method. Accordingly, we expect to record a net increase in opening retained earnings upon adoption resulting from the acceleration of revenue recognized under the standard.
Fair Value of Debt
Based on the level of interest rates prevailing at
December 31, 2017
, the fair value of our fixed rate debt of
$2,418.3 million
was more than its carrying value of
$2,362.1 million
by
$56.1 million
. The fair value of these financial instruments is estimated based on reference to quoted market prices for these or comparable securities. A hypothetical 100 basis point decrease in interest rates prevailing at
December 31, 2017
would increase the estimated fair value of our fixed rate debt by approximately
$95 million
to approximately
$2,513 million
.
Managing our Interest Rate Risk
To manage interest rate risk, we enter into interest rate swap contracts from time to time to adjust the amount of total debt that is subject to variable interest rates. Such contracts effectively fix the borrowing rates on floating rate debt to limit the exposure against the risk of rising rates. We do not enter into interest rate swap contracts for speculative or trading purposes and we only enter into interest rate swap contracts with financial institutions that we believe are creditworthy counterparties. We monitor the financial institutions that are counterparties to our interest rate swap contracts and to the extent possible diversify our swap contracts among various counterparties to mitigate exposure to any single financial institution.
As of
December 31, 2017
, we have
$3.1 billion
of debt outstanding (excluding capital leases), of which
$737.1 million
outstanding under the Credit Facility is subject to variable interest rates. A hypothetical 100 basis point increase in interest rates prevailing at
December 31, 2017
would increase our annual interest expense by approximately
$7.4 million
.
As of
December 31, 2017
, we have interest rate swap contracts outstanding with notional amounts aggregating
$200.0 million
. The aggregate fair values of interest rate swap contracts at
December 31, 2017
was a net asset of
$1.4 million
. As a result of these transactions, the interest rate paid on approximately
83%
of our debt (excluding capital leases) as of
December 31, 2017
is effectively fixed (
76%
being fixed rate obligations and
7%
effectively fixed through utilization of these interest rate swap contracts). Cumulative unrealized gains, net of tax on the portion of floating-to-fixed interest rate swaps designated as cash flow hedges was
$0.4 million
and is included in accumulated other comprehensive loss. At
December 31, 2017
, none of our interest rate swap contracts were designated as cash flow hedges.
Managing our Foreign Currency Exchange Rate Risk
We are exposed to foreign currency risk to the extent that we enter into transactions denominated in currencies other than our subsidiaries' respective functional currencies (non-functional currency risk), such as affiliation agreements, programming contracts, certain trade receivables and accounts payable (including intercompany amounts) that are denominated in a currency other than the applicable functional currency. Changes in exchange rates with respect to amounts recorded in our consolidated balance sheets related to these items will result in unrealized (based upon period-end exchange rates) or realized foreign currency transaction gains and losses upon settlement of the transactions. Moreover, to the extent that our revenue, costs and expenses are denominated in currencies other than our respective functional currencies, we will experience fluctuations in our revenue, costs and expenses solely as a result of changes in foreign currency exchange rates.
As a result of our international expansion in recent years, we expect the exposure to foreign currency fluctuations will have a more significant impact on our financial position and results of operations.
To manage foreign currency exchange rate risk, we enter into foreign currency contracts from time to time with financial institutions to limit our exposure to fluctuations in foreign currency exchange rates. We do not enter into foreign currency contracts for speculative or trading purposes.
58
The Company recognized
$15.0 million
,
$(39.0) million
and
$(22.0) million
of foreign currency transaction gains (losses) for the years ended
December 31, 2017
,
2016
, and
2015
, respectively, resulting from the translation of monetary assets and liabilities that are denominated in currencies other than the underlying functional currency of the applicable entity. Unrealized foreign currency transaction gains or losses are computed based on period-end exchange rates and are non-cash in nature until such time as the amounts are settled. Such amount is included in miscellaneous, net in the consolidated statement of income.
We also are exposed to fluctuations of the U.S. dollar (our reporting currency) against the currencies of our operating subsidiaries when their respective financial statements are translated into U.S. dollars for inclusion in our consolidated financial statements. Cumulative translation adjustments are recorded in accumulated other comprehensive income (loss) as a separate component of equity. Any increase (decrease) in the value of the U.S. dollar against any foreign currency that is the functional currency of one of our operating subsidiaries will cause us to experience unrealized foreign currency translation losses (gains) with respect to amounts already invested in such foreign currencies. Accordingly, we may experience a negative impact on our comprehensive income (loss) and equity with respect to our holdings solely as a result of changes in foreign currency exchange rates.
The Financial Statements required by this Item 8 appear beginning on page
68
of this Annual Report, and are incorporated by reference herein.
None.
(a) Evaluation of Disclosure Controls and Procedures
An evaluation was carried out under the supervision and with the participation of the Company's management, including our Chief Executive Officer and Chief Financial Officer, of the effectiveness of the design and operation of our disclosure controls and procedures (as defined in Rules 13a-15(e) and 15d-15(e) under the Securities Exchange Act of 1934, as amended). Based upon that evaluation as of
December 31, 2017
, the Company's Chief Executive Officer and Chief Financial Officer concluded that the Company's disclosure controls and procedures are effective.
(b) Management's Report on Internal Control over Financial Reporting
Management is responsible for establishing and maintaining effective internal control over financial reporting, as such term is defined under the Securities Exchange Act of 1934 Rule 13a-15(f). The Company's internal control over financial reporting includes those policies and procedures that (i) pertain to the maintenance of records that, in reasonable detail, accurately and fairly reflect the transactions and dispositions of the assets of the Company; (ii) provide reasonable assurance that transactions are recorded as necessary to permit preparation of financial statements in accordance with generally accepted accounting principles, and that receipts and expenditures of the Company are being made only in accordance with authorizations of management and directors of the Company; and (iii) provide reasonable assurance regarding prevention or timely detection of unauthorized acquisition, use, or disposition of the Company's assets that could have a material effect on the financial statements.
Internal control over financial reporting is designed to provide reasonable assurance regarding the reliability of financial reporting and the preparation of financial statements prepared for external purposes in accordance with generally accepted accounting principles. Because of its inherent limitations, internal control over financial reporting may not prevent or detect misstatements. Also, projections of any evaluation of effectiveness to future periods are subject to the risk that controls may become inadequate because of changes in conditions, or that the degree of compliance with the policies or procedures may deteriorate.
Under the supervision and with the participation of management, including the Company's Chief Executive Officer and Chief Financial Officer, we conducted an evaluation of the effectiveness of our internal control over financial reporting based on the framework in Internal Control — Integrated Framework (2013 Framework) issued by the Committee of Sponsoring Organizations of the Treadway Commission. Based on our evaluation under the framework in Internal Control — Integrated Framework, our management concluded that our internal control over financial reporting was effective as of
December 31, 2017
.
The attestation report of the independent registered public accounting firm on the Company's internal control over financial reporting is included in this report appearing on page F-1.
(c) Attestation Report of Independent Registered Public Accounting Firm
The effectiveness of the Company's internal control over financial reporting as of
December 31, 2017
has been audited by KPMG LLP, an independent registered public accounting firm, as stated in their attestation report appearing on page F-1.
59
(d) Changes in Internal Control over Financial Reporting
During the three months ended
December 31, 2017
, there were no changes in the Company's internal control over financial reporting that have materially affected, or are reasonably likely to materially affect, the Company's internal control over financial reporting.
None.
60
Information relating to our directors, executive officers and corporate governance will be included in our definitive Proxy Statement for our
2018
Annual Meeting of Stockholders, which will be filed within 120 days of the year ended
December 31, 2017
(the "
2018
Proxy Statement"), which is incorporated herein by reference.
Information relating to executive compensation will be included in the
2018
Proxy Statement, which is incorporated herein by reference.
Information relating to the beneficial ownership of our common stock and related stockholder matters will be included in the
2018
Proxy Statement, which is incorporated herein by reference.
Information relating to certain relationships and related transactions and director independence will be included in the
2018
Proxy Statement, which is incorporated herein by reference.
Information relating to principal accounting fees and services will be included in the
2018
Proxy Statement, which is incorporated herein by reference.
61
(a) Documents filed as part of the Form 10-K:
The following items are filed as part of this Annual Report:
|
(1)
|
The financial statements as indicated in the index set forth on page
68
.
|
|
(2)
|
Financial statement schedule:
|
Schedule II—Valuation and Qualifying Accounts
Schedules other than that listed above have been omitted, since they are either not applicable, not required or the information is included elsewhere herein.
|
(3)
|
Exhibits:
|
The exhibits listed in the accompanying Exhibit Index are filed or incorporated by reference as part of this Annual Report.
None.
62
INDEX TO EXHIBITS
|
Exhibit
Number
|
|
Description of Exhibit
|
|
2.1
|
|
|
|
2.2
|
||
|
3.1(i)
|
|
|
|
3.1(ii)
|
|
|
|
4.1
|
|
|
|
4.2
|
|
|
|
4.3
|
||
|
4.4
|
|
|
|
4.5
|
||
|
4.6
|
||
|
4.7
|
||
|
4.8
|
||
|
10.1
|
|
|
|
10.2
|
|
|
|
10.3
|
|
|
63
|
10.4
|
|
|
|
10.5
|
|
|
|
10.6
|
|
|
|
10.7
|
|
|
|
10.8
|
|
|
|
10.9
|
|
|
|
10.10
|
|
|
|
10.11
|
|
|
|
10.12
|
||
|
10.13
|
|
|
|
10.14
|
|
|
|
10.15
|
|
|
|
10.16
|
|
|
|
10.17
|
|
|
|
10.18
|
|
|
|
10.19
|
|
|
|
10.20
|
||
|
10.21
|
||
|
10.22
|
||
|
12
|
|
|
|
21
|
|
|
|
23
|
|
|
|
24
|
||
64
|
31.1
|
|
|
|
31.2
|
|
|
|
32
|
|
|
|
101.INS
|
|
XBRL Instance Document.
|
|
101.SCH
|
|
XBRL Taxonomy Extension Schema Document.
|
|
101.CAL
|
|
XBRL Taxonomy Extension Calculation Linkbase Document.
|
|
101.DEF
|
|
XBRL Taxonomy Extension Definition Linkbase.
|
|
101.LAB
|
|
XBRL Taxonomy Extension Label Linkbase Document.
|
|
101.PRE
|
|
XBRL Taxonomy Extension Presentation Linkbase Document.
|
SIGNATURES
Pursuant to the requirements of the Securities Exchange Act of 1934, the Registrant has duly caused this report to be signed on its behalf by the undersigned thereunto duly authorized.
|
|
AMC Networks Inc.
|
|||
|
Date:
|
March 1, 2018
|
|
By:
|
/s/ Sean S. Sullivan
|
|
|
|
Sean S. Sullivan
|
||
|
|
|
Executive Vice President and Chief Financial Officer
|
||
POWER OF ATTORNEY
KNOW ALL MEN BY THESE PRESENTS, that each person whose signature appears below constitutes and appoints Joshua W. Sapan and Sean S. Sullivan, and each of them, his true and lawful attorneys-in-fact and agents, with full power of substitution and resubstitution, for him in his name, place and stead, in any and all capacities, to sign this report, and file the same, with all exhibits thereto, and other documents in connection therewith, with the Securities and Exchange Commission, granting unto said attorneys-in-fact and agents, full power and authority to do and perform each and every act and thing requisite and necessary to be done as fully to all intents and purposes as he might or could do in person, hereby ratifying and confirming all that said attorneys-in-fact and agents or any of them may lawfully do or cause to be done by virtue hereof.
65
Pursuant to the requirements of the Securities Exchange Act of 1934, this report has been signed below by the following persons on behalf of the Registrant and in the capacities and on the dates indicated.
|
Name
|
|
Title
|
|
Date
|
|
/s/ Joshua W. Sapan
|
President and Chief Executive Officer
|
March 1, 2018
|
||
|
Joshua W. Sapan
|
|
(Principal Executive Officer)
|
|
|
|
/s/ Sean S. Sullivan
|
Executive Vice President and Chief Financial Officer
|
March 1, 2018
|
||
|
Sean S. Sullivan
|
|
(Principal Financial Officer)
|
|
|
|
/s/ Christian B. Wymbs
|
Executive Vice President and Chief Accounting Officer
|
March 1, 2018
|
||
|
Christian B. Wymbs
|
|
(Principal Accounting Officer)
|
|
|
|
/s/ Charles F. Dolan
|
Chairman of the Board of Directors
|
March 1, 2018
|
||
|
Charles F. Dolan
|
|
|
||
|
/s/ William J. Bell
|
Director
|
March 1, 2018
|
||
|
William J. Bell
|
|
|||
|
/s/ James L. Dolan
|
Director
|
March 1, 2018
|
||
|
James L. Dolan
|
|
|||
|
/s/ Kristin A. Dolan
|
Director
|
March 1, 2018
|
||
|
Kristin A. Dolan
|
|
|||
|
/s/ Marianne Dolan Weber
|
Director
|
March 1, 2018
|
||
|
Marianne Dolan Weber
|
|
|
||
66
|
Name
|
|
Title
|
|
Date
|
|
/s/ Patrick F. Dolan
|
Director
|
March 1, 2018
|
||
|
Patrick F. Dolan
|
|
|
||
|
/s/ Thomas C. Dolan
|
Director
|
March 1, 2018
|
||
|
Thomas C. Dolan
|
|
|
||
|
/s/ Jonathan F. Miller
|
Director
|
March 1, 2018
|
||
|
Jonathan F. Miller
|
|
|
||
|
/s/ Brian G. Sweeney
|
Director
|
March 1, 2018
|
||
|
Brian G. Sweeney
|
|
|
||
|
/s/ Vincent Tese
|
Director
|
March 1, 2018
|
||
|
Vincent Tese
|
|
|||
|
/s/ Leonard Tow
|
Director
|
March 1, 2018
|
||
|
Leonard Tow
|
|
|||
|
/s/ David E. Van Zandt
|
Director
|
March 1, 2018
|
||
|
David E. Van Zandt
|
|
|
||
|
/s/ Carl E. Vogel
|
Director
|
March 1, 2018
|
||
|
Carl E. Vogel
|
|
|||
|
/s/ Robert C. Wright
|
Director
|
March 1, 2018
|
||
|
Robert C. Wright
|
|
|
||
67
AMC NETWORKS INC. AND SUBSIDIARIES
INDEX TO CONSOLIDATED FINANCIAL STATEMENTS
|
Consolidated Financial Statements as of December 31, 2017 and 2016 and for the years ended December 31, 2017, 2016 and 2015
|
|
68
REPORT OF INDEPENDENT REGISTERED PUBLIC ACCOUNTING FIRM
The Board of Directors
AMC Network Inc.:
Opinion on Internal Control Over Financial Reporting
We have audited AMC Networks Inc. and subsidiaries’ (the “Company”) internal control over financial reporting as of December 31, 2017, based on criteria established in
Internal Control - Integrated Framework (2013)
issued by the Committee of Sponsoring Organizations of the Treadway Commission. In our opinion, the Company maintained, in all material respects, effective internal control over financial reporting as of December 31, 2017, based on criteria established in
Internal Control - Integrated Framework (2013)
issued by the Committee of Sponsoring Organizations of the Treadway Commission.
We also have audited, in accordance with the standards of the Public Company Accounting Oversight Board (United States) (“PCAOB”), the consolidated balance sheets of the Company as of December 31, 2017 and 2016, the related consolidated statements of income, comprehensive income, stockholders’ equity (deficiency), and cash flows for each of the years in the three-year period ended December 31, 2017, and the related notes, and the related financial statement schedule as listed in the index to Item 15 (collectively, the “consolidated financial statements”), and our report dated March 1, 2018, expressed an unqualified opinion on those consolidated financial statements.
Basis for Opinion
The Company’s management is responsible for maintaining effective internal control over financial reporting and for its assessment of the effectiveness of internal control over financial reporting, included in the accompanying Management’s Report on Internal Control Over Financial Reporting in Item 9A. Our responsibility is to express an opinion on the Company’s internal control over financial reporting based on our audit. We are a public accounting firm registered with the PCAOB and are required to be independent with respect to the Company in accordance with the U.S. federal securities laws and the applicable rules and regulations of the Securities and Exchange Commission and the PCAOB.
We conducted our audit in accordance with the standards of the PCAOB. Those standards require that we plan and perform the audit to obtain reasonable assurance about whether effective internal control over financial reporting was maintained in all material respects. Our audit of internal control over financial reporting included obtaining an understanding of internal control over financial reporting, assessing the risk that a material weakness exists, and testing and evaluating the design and operating effectiveness of internal control based on the assessed risk. Our audit also included performing such other procedures as we considered necessary in the circumstances. We believe that our audit provides a reasonable basis for our opinion.
Definition and Limitations of Internal Control Over Financial Reporting
A company’s internal control over financial reporting is a process designed to provide reasonable assurance regarding the reliability of financial reporting and the preparation of financial statements for external purposes in accordance with generally accepted accounting principles. A company’s internal control over financial reporting includes those policies and procedures that (1) pertain to the maintenance of records that, in reasonable detail, accurately and fairly reflect the transactions and dispositions of the assets of the company; (2) provide reasonable assurance that transactions are recorded as necessary to permit preparation of financial statements in accordance with generally accepted accounting principles, and that receipts and expenditures of the company are being made only in accordance with authorizations of management and directors of the company; and (3) provide reasonable assurance regarding prevention or timely detection of unauthorized acquisition, use, or disposition of the company’s assets that could have a material effect on the financial statements.
Because of its inherent limitations, internal control over financial reporting may not prevent or detect misstatements. Also, projections of any evaluation of effectiveness to future periods are subject to the risk that controls may become inadequate because of changes in conditions, or that the degree of compliance with the policies or procedures may deteriorate.
/s/ KPMG LLP
New York, New York
March 1, 2018
F-1
REPORT OF INDEPENDENT REGISTERED PUBLIC ACCOUNTING FIRM
The Board of Directors
AMC Networks Inc.:
Opinion on the Consolidated
Financial Statements
We have audited the accompanying consolidated balance sheets of AMC Networks Inc. and subsidiaries (the “Company”) as of December 31, 2017 and 2016, the related consolidated statements of income, comprehensive income, stockholders’ equity (deficiency), and cash flows for each of the years in the three‑year period ended December 31, 2017, and the related notes, and the related financial statement schedule as listed in the index to Item 15 (collectively, the “consolidated financial statements”). In our opinion, the consolidated financial statements present fairly, in all material respects, the financial position of the Company as of December 31, 2017 and 2016, and the results of its operations and its cash flows for each of the years in the three‑year period ended December 31, 2017, in conformity with U.S. generally accepted accounting principles.
We also have audited, in accordance with the standards of the Public Company Accounting Oversight Board (United States) (“PCAOB”), the Company’s internal control over financial reporting as of December 31, 2017, based on criteria established in
Internal Control - Integrated Framework (2013)
issued by the Committee of Sponsoring Organizations of the Treadway Commission, and our report dated March 1, 2018, expressed an unqualified opinion on the effectiveness of the Company’s internal control over financial reporting.
Basis for Opinion
These consolidated financial statements are the responsibility of the Company’s management. Our responsibility is to express an opinion on these consolidated financial statements based on our audits. We are a public accounting firm registered with the PCAOB and are required to be independent with respect to the Company in accordance with the U.S. federal securities laws and the applicable rules and regulations of the Securities and Exchange Commission and the PCAOB.
We conducted our audits in accordance with the standards of the PCAOB. Those standards require that we plan and perform the audit to obtain reasonable assurance about whether the consolidated financial statements are free of material misstatement, whether due to error or fraud. Our audits included performing procedures to assess the risks of material misstatement of the consolidated financial statements, whether due to error or fraud, and performing procedures that respond to those risks. Such procedures included examining, on a test basis, evidence regarding the amounts and disclosures in the consolidated financial statements. Our audits also included evaluating the accounting principles used and significant estimates made by management, as well as evaluating the overall presentation of the consolidated financial statements. We believe that our audits provide a reasonable basis for our opinion.
/s/ KPMG LLP
We have served as the Company's auditor since 2011.
New York, New York
March 1, 2018
F-2
AMC NETWORKS INC. AND SUBSIDIARIES
CONSOLIDATED BALANCE SHEETS
(In thousands, except per share amounts)
|
2017
|
2016
|
||||||
|
ASSETS
|
|||||||
|
Current Assets:
|
|||||||
|
Cash and cash equivalents
|
$
|
558,783
|
|
$
|
481,389
|
|
|
|
Accounts receivable, trade (including amounts due from related parties, net,
less allowance for doubtful accounts of $9,691 and $6,064)
|
775,891
|
|
701,163
|
|
|||
|
Current portion of program rights, net
|
453,450
|
|
441,130
|
|
|||
|
Prepaid expenses and other current assets
|
91,726
|
|
72,661
|
|
|||
|
Total current assets
|
1,879,850
|
|
1,696,343
|
|
|||
|
Property and equipment, net
|
183,514
|
|
166,636
|
|
|||
|
Program rights, net
|
1,319,279
|
|
1,108,586
|
|
|||
|
Deferred carriage fees, net
|
29,924
|
|
43,886
|
|
|||
|
Intangible assets, net
|
457,242
|
|
485,809
|
|
|||
|
Goodwill
|
695,158
|
|
657,708
|
|
|||
|
Deferred tax assets, net
|
20,081
|
|
8,598
|
|
|||
|
Other assets
|
447,937
|
|
313,029
|
|
|||
|
Total assets
|
$
|
5,032,985
|
|
$
|
4,480,595
|
|
|
|
LIABILITIES AND STOCKHOLDERS' EQUITY (DEFICIENCY)
|
|||||||
|
Current Liabilities:
|
|||||||
|
Accounts payable
|
$
|
102,197
|
|
$
|
88,677
|
|
|
|
Accrued liabilities
|
263,076
|
|
284,429
|
|
|||
|
Current portion of program rights obligations
|
327,549
|
|
300,845
|
|
|||
|
Deferred revenue
|
46,433
|
|
53,643
|
|
|||
|
Current portion of long-term debt
|
—
|
|
222,000
|
|
|||
|
Current portion of capital lease obligations
|
4,847
|
|
4,584
|
|
|||
|
Total current liabilities
|
744,102
|
|
954,178
|
|
|||
|
Program rights obligations
|
534,980
|
|
398,175
|
|
|||
|
Long-term debt, net
|
3,099,257
|
|
2,597,263
|
|
|||
|
Capital lease obligations
|
26,277
|
|
35,282
|
|
|||
|
Deferred tax liability, net
|
109,698
|
|
145,791
|
|
|||
|
Other liabilities
|
136,122
|
|
132,219
|
|
|||
|
Total liabilities
|
4,650,436
|
|
4,262,908
|
|
|||
|
Commitments and contingencies
|
|
|
|
|
|||
|
Redeemable noncontrolling interests
|
218,604
|
|
219,331
|
|
|||
|
Stockholders' equity (deficiency):
|
|||||||
|
Class A Common Stock, $0.01 par value, 360,000 shares authorized, 62,721 and 62,409 shares issued and 49,601 and 57,079 shares outstanding, respectively
|
627
|
|
624
|
|
|||
|
Class B Common Stock, $0.01 par value, 90,000 shares authorized 11,484 shares issued and outstanding
|
115
|
|
115
|
|
|||
|
Preferred stock, $0.01 par value, 45,000 shares authorized; none issued
|
—
|
|
—
|
|
|||
|
Paid-in capital
|
191,303
|
|
142,798
|
|
|||
|
Accumulated earnings
|
766,725
|
|
295,409
|
|
|||
|
Treasury stock, at cost (13,120 and 5,330 shares Class A Common Stock, respectively)
|
(709,440
|
)
|
(275,230
|
)
|
|||
|
Accumulated other comprehensive loss
|
(114,386
|
)
|
(193,798
|
)
|
|||
|
Total AMC Networks stockholders' equity (deficiency)
|
134,944
|
|
(30,082
|
)
|
|||
|
Non-redeemable noncontrolling interests
|
29,001
|
|
28,438
|
|
|||
|
Total stockholders' equity (deficiency)
|
163,945
|
|
(1,644
|
)
|
|||
|
Total liabilities and stockholders' equity (deficiency)
|
$
|
5,032,985
|
|
$
|
4,480,595
|
|
|
See accompanying notes to consolidated financial statements.
F-3
AMC NETWORKS INC. AND SUBSIDIARIES
(In thousands, except per share amounts)
|
2017
|
2016
|
2015
|
|||||||||
|
Revenues, net (including revenues, net from related parties of $6,168, $15,873 and $27,508, respectively)
|
$
|
2,805,691
|
|
$
|
2,755,654
|
|
$
|
2,580,935
|
|
||
|
Operating expenses:
|
|||||||||||
|
Technical and operating (excluding depreciation and amortization)
|
1,341,076
|
|
1,279,984
|
|
1,137,133
|
|
|||||
|
Selling, general and administrative (including charges from related parties of $1,524, $3,086 and $4,903, respectively)
|
613,342
|
|
636,028
|
|
636,580
|
|
|||||
|
Depreciation and amortization
|
94,638
|
|
84,778
|
|
83,031
|
|
|||||
|
Impairment and related charges
|
28,148
|
|
67,805
|
|
—
|
|
|||||
|
Restructuring expense
|
6,128
|
|
29,503
|
|
14,998
|
|
|||||
|
Total operating expenses
|
2,083,332
|
|
2,098,098
|
|
1,871,742
|
|
|||||
|
Operating income
|
722,359
|
|
657,556
|
|
709,193
|
|
|||||
|
Other income (expense):
|
|||||||||||
|
Interest expense
|
(134,001
|
)
|
(123,632
|
)
|
(128,135
|
)
|
|||||
|
Interest income
|
14,704
|
|
5,064
|
|
2,427
|
|
|||||
|
Loss on extinguishment of debt
|
(3,004
|
)
|
(50,639
|
)
|
—
|
|
|||||
|
Miscellaneous, net
|
40,320
|
|
(33,524
|
)
|
(691
|
)
|
|||||
|
Total other income (expense)
|
(81,981
|
)
|
(202,731
|
)
|
(126,399
|
)
|
|||||
|
Income from operations before income taxes
|
640,378
|
|
454,825
|
|
582,794
|
|
|||||
|
Income tax expense
|
(150,741
|
)
|
(164,862
|
)
|
(201,090
|
)
|
|||||
|
Net income including noncontrolling interests
|
489,637
|
|
289,963
|
|
381,704
|
|
|||||
|
Net income attributable to noncontrolling interests
|
(18,321
|
)
|
(19,453
|
)
|
(14,916
|
)
|
|||||
|
Net income attributable to AMC Networks' stockholders
|
$
|
471,316
|
|
$
|
270,510
|
|
$
|
366,788
|
|
||
|
Net income per share attributable to AMC Networks' stockholders:
|
|||||||||||
|
Basic
|
$
|
7.26
|
|
$
|
3.77
|
|
$
|
5.06
|
|
||
|
Diluted
|
$
|
7.18
|
|
$
|
3.74
|
|
$
|
5.01
|
|
||
|
Weighted average common shares:
|
|||||||||||
|
Basic
|
64,905
|
|
71,746
|
|
72,420
|
|
|||||
|
Diluted
|
65,625
|
|
72,410
|
|
73,190
|
|
|||||
See accompanying notes to consolidated financial statements.
F-4
A
MC NETWORKS INC. AND SUBSIDIARIES
CONSOLIDATED STATEMENTS OF COMPREHENSIVE INCOME
(In thousands)
|
|
2017
|
2016
|
2015
|
||||||||
|
Net income including noncontrolling interests
|
$
|
489,637
|
|
$
|
289,963
|
|
$
|
381,704
|
|
||
|
Other comprehensive income (loss):
|
|||||||||||
|
Foreign currency translation adjustment
|
76,023
|
|
(45,426
|
)
|
(55,852
|
)
|
|||||
|
Unrealized (loss) gain on interest rate swaps
|
(35
|
)
|
22
|
|
3,365
|
|
|||||
|
Unrealized gain on available for sale securities
|
5,398
|
|
—
|
|
—
|
|
|||||
|
Other comprehensive income (loss), before income taxes
|
81,386
|
|
(45,404
|
)
|
(52,487
|
)
|
|||||
|
Income tax expense
|
(1,974
|
)
|
(12,337
|
)
|
(4,322
|
)
|
|||||
|
Other comprehensive income (loss), net of income taxes
|
79,412
|
|
(57,741
|
)
|
(56,809
|
)
|
|||||
|
Comprehensive income
|
569,049
|
|
232,222
|
|
324,895
|
|
|||||
|
Comprehensive income attributable to noncontrolling interests
|
(21,430
|
)
|
(16,491
|
)
|
(13,123
|
)
|
|||||
|
Comprehensive income attributable to AMC Networks' stockholders
|
$
|
547,619
|
|
$
|
215,731
|
|
$
|
311,772
|
|
||
See accompanying notes to consolidated financial statements.
F-5
AMC NETWORKS INC. AND SUBSIDIARIES
CONSOLIDATED STATEMENTS OF STOCKHOLDERS' EQUITY (DEFICIENCY)
(In thousands)
|
Class A
Common Stock |
Class B
Common Stock |
Paid-in
Capital |
Accumulated Earnings
(Deficit) |
Treasury
Stock |
Accumulated
Other Comprehensive Loss |
Total AMC Networks Stockholders'
Equity (Deficiency) |
Non-redeemable Noncontrolling
Interests |
Total Stockholders'
Equity (Deficiency) |
||||||||||||||||||
|
Balance, December 31, 2014
|
618
|
|
115
|
|
100,642
|
|
(341,889
|
)
|
(51,993
|
)
|
(79,248
|
)
|
(371,755
|
)
|
19,846
|
|
(351,909
|
)
|
||||||||
|
Net income attributable to AMC Networks' stockholders
|
—
|
|
—
|
|
—
|
|
366,788
|
|
—
|
|
—
|
|
366,788
|
|
—
|
|
366,788
|
|
||||||||
|
Non-redeemable noncontrolling interests changes
|
—
|
|
—
|
|
—
|
|
—
|
|
—
|
|
—
|
|
—
|
|
6,587
|
|
6,587
|
|
||||||||
|
Net income attributable to non-redeemable noncontrolling interests
|
—
|
|
—
|
|
—
|
|
—
|
|
—
|
|
—
|
|
—
|
|
4,677
|
|
4,677
|
|
||||||||
|
Contribution from noncontrolling member
|
—
|
|
—
|
|
—
|
|
—
|
|
—
|
|
—
|
|
—
|
|
1,322
|
|
1,322
|
|
||||||||
|
Other
|
—
|
|
—
|
|
—
|
|
(19
|
)
|
—
|
|
—
|
|
(19
|
)
|
—
|
|
(19
|
)
|
||||||||
|
Other comprehensive income
|
—
|
|
—
|
|
—
|
|
—
|
|
—
|
|
(56,809
|
)
|
(56,809
|
)
|
(1,793
|
)
|
(58,602
|
)
|
||||||||
|
Share-based compensation expense
|
—
|
|
—
|
|
31,020
|
|
—
|
|
—
|
|
—
|
|
31,020
|
|
—
|
|
31,020
|
|
||||||||
|
Proceeds from the exercise of stock options
|
1
|
|
—
|
|
1,339
|
|
—
|
|
—
|
|
—
|
|
1,340
|
|
—
|
|
1,340
|
|
||||||||
|
Restricted stock units converted to shares
|
2
|
|
—
|
|
(14,454
|
)
|
—
|
|
—
|
|
—
|
|
(14,452
|
)
|
—
|
|
(14,452
|
)
|
||||||||
|
Excess tax benefits on share-based awards
|
—
|
|
—
|
|
4,610
|
|
—
|
|
—
|
|
—
|
|
4,610
|
|
—
|
|
4,610
|
|
||||||||
|
Balance, December 31, 2015
|
621
|
|
115
|
|
123,157
|
|
24,880
|
|
(51,993
|
)
|
(136,057
|
)
|
(39,277
|
)
|
30,639
|
|
(8,638
|
)
|
||||||||
|
Net income attributable to AMC Networks' stockholders
|
—
|
|
—
|
|
—
|
|
270,510
|
|
—
|
|
—
|
|
270,510
|
|
—
|
|
270,510
|
|
||||||||
|
Non-redeemable noncontrolling interests changes
|
—
|
|
—
|
|
—
|
|
—
|
|
—
|
|
—
|
|
—
|
|
(97
|
)
|
(97
|
)
|
||||||||
|
Net income attributable to non-redeemable noncontrolling interests
|
—
|
|
—
|
|
—
|
|
—
|
|
—
|
|
—
|
|
—
|
|
2,784
|
|
2,784
|
|
||||||||
|
Distribution to noncontrolling member
|
—
|
|
—
|
|
—
|
|
—
|
|
—
|
|
—
|
|
—
|
|
(1,926
|
)
|
(1,926
|
)
|
||||||||
|
Treasury stock not yet settled and other
|
—
|
|
—
|
|
(10,454
|
)
|
19
|
|
—
|
|
—
|
|
(10,435
|
)
|
—
|
|
(10,435
|
)
|
||||||||
|
Other comprehensive income
|
—
|
|
—
|
|
—
|
|
—
|
|
—
|
|
(57,741
|
)
|
(57,741
|
)
|
(2,962
|
)
|
(60,703
|
)
|
||||||||
|
Share-based compensation expense
|
—
|
|
—
|
|
38,897
|
|
—
|
|
—
|
|
—
|
|
38,897
|
|
—
|
|
38,897
|
|
||||||||
|
Proceeds from the exercise of stock options
|
1
|
|
—
|
|
1,227
|
|
—
|
|
—
|
|
—
|
|
1,228
|
|
—
|
|
1,228
|
|
||||||||
|
Treasury stock acquired
|
—
|
|
—
|
|
—
|
|
—
|
|
(223,237
|
)
|
—
|
|
(223,237
|
)
|
—
|
|
(223,237
|
)
|
||||||||
|
Restricted stock units converted to shares
|
2
|
|
—
|
|
(10,824
|
)
|
—
|
|
—
|
|
—
|
|
(10,822
|
)
|
—
|
|
(10,822
|
)
|
||||||||
|
Excess tax benefits on share-based awards
|
—
|
|
—
|
|
795
|
|
—
|
|
—
|
|
—
|
|
795
|
|
—
|
|
795
|
|
||||||||
|
Balance, December 31, 2016
|
624
|
|
115
|
|
142,798
|
|
295,409
|
|
(275,230
|
)
|
(193,798
|
)
|
(30,082
|
)
|
28,438
|
|
(1,644
|
)
|
||||||||
|
Net income attributable to AMC Networks' stockholders
|
—
|
|
—
|
|
—
|
|
471,316
|
|
—
|
|
—
|
|
471,316
|
|
—
|
|
471,316
|
|
||||||||
|
Net income attributable to non-redeemable noncontrolling interests
|
—
|
|
—
|
|
—
|
|
—
|
|
—
|
|
—
|
|
—
|
|
524
|
|
524
|
|
||||||||
|
Distribution to noncontrolling member
|
—
|
|
—
|
|
—
|
|
—
|
|
—
|
|
—
|
|
—
|
|
(3,070
|
)
|
(3,070
|
)
|
||||||||
|
Treasury stock not yet settled
|
—
|
|
—
|
|
(995
|
)
|
—
|
|
—
|
|
—
|
|
(995
|
)
|
—
|
|
(995
|
)
|
||||||||
|
Settlement of treasury stock
|
—
|
|
—
|
|
10,454
|
|
—
|
|
—
|
|
—
|
|
10,454
|
|
—
|
|
10,454
|
|
||||||||
|
Other comprehensive income
|
—
|
|
—
|
|
—
|
|
—
|
|
—
|
|
79,412
|
|
79,412
|
|
3,109
|
|
82,521
|
|
||||||||
|
Share-based compensation expense
|
—
|
|
—
|
|
53,545
|
|
—
|
|
—
|
|
—
|
|
53,545
|
|
—
|
|
53,545
|
|
||||||||
|
Treasury stock acquired
|
—
|
|
—
|
|
—
|
|
—
|
|
(434,210
|
)
|
—
|
|
(434,210
|
)
|
—
|
|
(434,210
|
)
|
||||||||
|
Restricted stock units converted to shares
|
3
|
|
—
|
|
(14,499
|
)
|
—
|
|
—
|
|
—
|
|
(14,496
|
)
|
—
|
|
(14,496
|
)
|
||||||||
|
Balance, December 31, 2017
|
627
|
|
115
|
|
191,303
|
|
766,725
|
|
(709,440
|
)
|
(114,386
|
)
|
134,944
|
|
29,001
|
|
163,945
|
|
||||||||
See accompanying notes to consolidated financial statements.
F-6
AMC NETWORKS INC. AND SUBSIDIARIES
(In thousands)
|
2017
|
2016
|
2015
|
|||||||||
|
Cash flows from operating activities:
|
|||||||||||
|
Net income including noncontrolling interests
|
$
|
489,637
|
|
$
|
289,963
|
|
$
|
381,704
|
|
||
|
Adjustments to reconcile income from operations to net cash from operating activities:
|
|||||||||||
|
Depreciation and amortization
|
94,638
|
|
84,778
|
|
83,031
|
|
|||||
|
Impairment and related charges
|
17,112
|
|
67,805
|
|
—
|
|
|||||
|
Share-based compensation expense related to equity classified awards
|
53,545
|
|
38,897
|
|
31,020
|
|
|||||
|
Amortization and write-off of program rights
|
954,238
|
|
862,302
|
|
748,545
|
|
|||||
|
Amortization of deferred carriage fees
|
17,605
|
|
16,990
|
|
16,018
|
|
|||||
|
Unrealized foreign currency transaction (gain) loss
|
(15,258
|
)
|
37,770
|
|
26,775
|
|
|||||
|
Unrealized (gain) loss on derivative contracts, net
|
(27,233
|
)
|
(1,920
|
)
|
2,015
|
|
|||||
|
Amortization and write-off of deferred financing costs and discounts on indebtedness
|
8,436
|
|
9,341
|
|
9,003
|
|
|||||
|
Loss on extinguishment of debt
|
3,004
|
|
50,639
|
|
—
|
|
|||||
|
Provision for doubtful accounts
|
3,567
|
|
1,924
|
|
1,705
|
|
|||||
|
Deferred income taxes
|
(48,665
|
)
|
11,642
|
|
19,616
|
|
|||||
|
Excess tax benefits from share-based compensation arrangements
|
—
|
|
(789
|
)
|
(4,610
|
)
|
|||||
|
Gain on investments
|
—
|
|
—
|
|
(16,632
|
)
|
|||||
|
Other, net
|
(11,014
|
)
|
(6,383
|
)
|
857
|
|
|||||
|
Changes in assets and liabilities:
|
|||||||||||
|
Accounts receivable, trade (including amounts due from related parties, net)
|
(74,561
|
)
|
(26,496
|
)
|
(110,964
|
)
|
|||||
|
Prepaid expenses and other assets
|
(59,979
|
)
|
(4,981
|
)
|
(24,355
|
)
|
|||||
|
Program rights and obligations, net
|
(996,816
|
)
|
(973,193
|
)
|
(839,123
|
)
|
|||||
|
Income taxes payable
|
(21,966
|
)
|
43,153
|
|
(4,796
|
)
|
|||||
|
Deferred revenue
|
(11,553
|
)
|
(9,836
|
)
|
27,495
|
|
|||||
|
Deferred carriage fees, net
|
(4,617
|
)
|
(10,396
|
)
|
(19,616
|
)
|
|||||
|
Accounts payable, accrued expenses and other liabilities
|
15,609
|
|
33,115
|
|
42,351
|
|
|||||
|
Net cash provided by operating activities
|
385,729
|
|
514,325
|
|
370,039
|
|
|||||
|
Cash flows from investing activities:
|
|||||||||||
|
Capital expenditures
|
(80,049
|
)
|
(79,220
|
)
|
(68,321
|
)
|
|||||
|
Return of capital from investees
|
2,447
|
|
—
|
|
—
|
|
|||||
|
Payments for acquisitions, net of cash acquired
|
—
|
|
(354
|
)
|
(24,199
|
)
|
|||||
|
Investments in and loans to investees
|
(53,000
|
)
|
(95,000
|
)
|
(24,250
|
)
|
|||||
|
Net cash used in investing activities
|
(130,602
|
)
|
(174,574
|
)
|
(116,770
|
)
|
|||||
|
Cash flows from financing activities:
|
|||||||||||
|
Proceeds from the issuance of long-term debt
|
1,536,000
|
|
982,500
|
|
—
|
|
|||||
|
Repayment of long-term debt
|
(1,257,965
|
)
|
(848,000
|
)
|
(74,000
|
)
|
|||||
|
Payment of promissory note
|
—
|
|
—
|
|
(40,000
|
)
|
|||||
|
Premium and fees paid on extinguishment of debt
|
—
|
|
(40,954
|
)
|
—
|
|
|||||
|
Payments for financing costs
|
(10,405
|
)
|
(2,070
|
)
|
—
|
|
|||||
|
Deemed repurchase of restricted stock/units
|
(14,496
|
)
|
(10,822
|
)
|
(14,452
|
)
|
|||||
|
Purchase of treasury stock
|
(434,210
|
)
|
(223,237
|
)
|
—
|
|
|||||
|
Proceeds from stock option exercises
|
—
|
|
1,228
|
|
1,340
|
|
|||||
|
Excess tax benefits from share-based compensation arrangements
|
—
|
|
789
|
|
4,610
|
|
|||||
|
Principal payments on capital lease obligations
|
(4,573
|
)
|
(4,288
|
)
|
(2,945
|
)
|
|||||
|
Distributions to noncontrolling interest
|
(18,561
|
)
|
(9,010
|
)
|
(3,154
|
)
|
|||||
|
Contributions from noncontrolling interest
|
—
|
|
—
|
|
1,322
|
|
|||||
|
Net cash used in financing activities
|
(204,210
|
)
|
(153,864
|
)
|
(127,279
|
)
|
|||||
|
Net increase in cash and cash equivalents from operations
|
50,917
|
|
185,887
|
|
125,990
|
|
|||||
|
Effect of exchange rate changes on cash and cash equivalents
|
26,477
|
|
(20,819
|
)
|
(11,036
|
)
|
|||||
|
Cash and cash equivalents at beginning of year
|
481,389
|
|
316,321
|
|
201,367
|
|
|||||
|
Cash and cash equivalents at end of year
|
$
|
558,783
|
|
$
|
481,389
|
|
$
|
316,321
|
|
||
See accompanying notes to consolidated financial statements.
F-7
AMC NETWORKS INC. AND SUBSIDIARIES
NOTES TO CONSOLIDATED FINANCIAL STATEMENTS
Description of Business
AMC Networks Inc. ("AMC Networks") and its subsidiaries (collectively referred to as the "Company") own and operate entertainment businesses and assets. The Company is comprised of
two
operating segments:
|
•
|
National Networks:
Includes activities of our
five
national programming networks, AMC Studios operations and AMC Broadcasting & Technology. Our national programming networks are AMC, WE tv, BBC AMERICA, IFC, and SundanceTV in the U.S.; and AMC, IFC and Sundance Channel in Canada. Our AMC Studios operations produces original programming for our programming networks and also licenses such program rights worldwide. AMC Networks Broadcasting & Technology is our technical services business, which primarily services most of the national programming networks.
|
|
•
|
International and Other
: Principally includes AMC Networks International (AMCNI), the Company's international programming businesses consisting of a portfolio of channels in Europe, Latin America, the Middle East and parts of Asia and Africa; IFC Films, the Company's independent film distribution business; AMCNI – DMC, the broadcast solutions unit of certain networks of AMCNI and third-party networks (the AMCNI – DMC business was sold on July 12, 2017); and our subscription streaming services, Sundance Now and Shudder.
|
Basis of Presentation
Principles of Consolidation
The consolidated financial statements include the accounts of AMC Networks and its majority owned or controlled subsidiaries. All intercompany transactions and balances have been eliminated in consolidation.
Use of Estimates
The preparation of financial statements in conformity with U.S. generally accepted accounting principles ("GAAP") requires management to make estimates and assumptions that affect the reported amounts of assets and liabilities and disclosure of contingent liabilities at the date of the financial statements and the reported amounts of revenues and expenses during the reported period. Actual results could differ from those estimates. Significant estimates and judgments inherent in the preparation of the consolidated financial statements include derivative assets and liabilities, certain stock compensation awards, the useful lives and methodologies used to amortize and assess recoverability of program rights, the estimated useful lives of intangible assets, valuation and recoverability of goodwill and intangible assets and income tax assets and liabilities.
Revenue Recognition
Revenue is recognized when persuasive evidence of a sales arrangement exists, delivery occurs or services are rendered, the sales price is fixed or determinable and collectability is reasonably assured. Revenue recognition for each source of the Company's revenue is based on the following policies:
Distribution
Subscription revenue is recognized from cable and other multichannel video programming distribution platforms, including direct broadcast satellite ("DBS"), platforms operated by telecommunications providers and virtual multichannel video programming distributors (collectively "distributors") that carry the Company's programming services under multi-year contracts, commonly referred to as "affiliation agreements." The programming services are delivered throughout the terms of the agreements and the Company recognizes revenue as programming is provided. Subscription revenue from the Company's subscription streaming services (i.e. Sundance Now and Shudder) is recognized as programming is provided to customers.
Content licensing revenue is recognized from the licensing of original programming for distribution upon availability or distribution by the licensee. Revenue from video on demand and similar pay-per-view arrangements is recognized as programming is exhibited based on end-customer purchases as reported by the distributor. Revenue derived from other sources is recognized when delivery occurs or the services are rendered.
Advertising
Advertising revenues are recognized, net of agency commissions, when commercials are aired. In most advertising sales arrangements, the Company's programming businesses guarantee specified viewer ratings for their programming. For these types
F-8
AMC NETWORKS INC. AND SUBSIDIARIES
NOTES TO CONSOLIDATED FINANCIAL STATEMENTS (Continued)
of transactions, a portion of such revenue is deferred if the guaranteed viewer ratings are not met and is subsequently recognized either when the Company provides the required additional advertising time or the guarantee obligation contractually expires.
Multiple-Element Transactions
For multiple-deliverable revenue arrangements, the Company uses the relative selling price method to allocate the arrangement consideration. Under the relative selling price method, the Company determines its best estimate of selling price in a manner consistent with that used to determine the price to sell the deliverable on a stand-alone basis. For multiple-element deliverable arrangements that include elements other than revenue, if there is objective and reliable evidence of fair value for all elements of accounting, the arrangement consideration is allocated to the separate elements of accounting based on relative fair values. There may be cases in which there is objective and reliable evidence of fair value of undelivered items in an arrangement but no such evidence for the delivered items. In those cases, the total fair value of the undelivered elements, as indicated by vendor-specific objective evidence, is deferred and the remainder of the arrangement consideration is allocated to the delivered elements.
Technical and Operating Expenses
Costs of revenues, including but not limited to programming expense, primarily consisting of amortization or write-offs of programming rights, such as those for original programming, feature films and licensed series, participation and residual costs, distribution and production related costs and program delivery operating costs, such as origination, transmission, uplinking and encryption, are classified as technical and operating expenses in the consolidated statements of income.
Advertising and Distribution Expenses
Advertising costs are charged to expense when incurred and is included in selling, general and administrative expenses in the consolidated statements of income. Advertising costs were
$200.4 million
,
$222.1 million
and
$210.9 million
for the years ended
December 31, 2017
,
2016
and
2015
, respectively. Marketing, distribution and general and administrative costs related to the exploitation of owned original programming are expensed as incurred and is included in selling, general and administrative expenses in the consolidated statements of income.
Share-Based Compensation
The Company measures the cost of employee services received in exchange for an award of equity-based instruments based on the grant date fair value of the portion of awards that are ultimately expected to vest. The cost is recognized in earnings over the period during which an employee is required to provide service in exchange for the award using a straight-line amortization method, except for restricted stock units granted to non-employee directors which vest
100%
, and are expensed, at the date of grant. Share-based compensation expense is included in selling, general and administrative expenses in the consolidated statements of income.
Foreign Currency
The reporting currency of the Company is the U.S. dollar. The functional currency of most of the Company's international subsidiaries is the local currency. Assets and liabilities, including intercompany balances for which settlement is anticipated in the foreseeable future, are translated at exchange rates in effect at the balance sheet date. Foreign currency equity balances are translated at historical rates. Revenues and expenses denominated in foreign currencies are translated at average exchange rates for the respective periods. Foreign currency translation adjustments are recorded as a component of other comprehensive income ("OCI") in the consolidated statements of stockholders' equity (deficiency).
Transactions denominated in currencies other than subsidiaries' functional currencies are recorded based on exchange rates at the time such transactions arise. Changes in exchange rates with respect to amounts recorded in the consolidated balance sheets related to these items will result in unrealized foreign currency transaction gains and losses based upon period-end exchange rates. The Company also records realized foreign currency transaction gains and losses upon settlement of the transactions. The Company recognized foreign currency transaction gains (losses) (realized and unrealized) of
$15.0 million
,
$(39.0) million
and
$(22.0) million
for the years ended
December 31, 2017
,
2016
and
2015
, respectively, which are included in miscellaneous, net in the consolidated statements of income.
Cash and Cash Equivalents
The Company's cash investments are placed with money market funds and financial institutions that are investment grade as rated by Standard & Poor's and Moody's Investors Service. The Company selects money market funds that predominantly invest in marketable, direct obligations issued or guaranteed by the U.S. government or its agencies, commercial paper, fully collateralized repurchase agreements, certificates of deposit, and time deposits.
F-9
AMC NETWORKS INC. AND SUBSIDIARIES
NOTES TO CONSOLIDATED FINANCIAL STATEMENTS (Continued)
The Company considers the balance of its investment in funds that hold securities that mature within three months or less from the date the fund purchases these securities to be cash equivalents. The carrying amount of cash and cash equivalents either approximates fair value due to the short-term maturity of these instruments or are at fair value.
Accounts Receivable, Trade
The Company periodically assesses the adequacy of valuation allowances for uncollectible accounts receivable by evaluating the collectability of outstanding receivables and general factors such as length of time individual receivables are past due, historical collection experience, and the economic and competitive environment. As of December 31,
2017
and
2016
, the Company had
$150.2 million
and
$114.3 million
, respectively, of accounts receivable contractually due in excess of one-year, which are included in other assets in the consolidated balance sheets.
Program Rights
Rights to programming, including feature films and episodic series, acquired under license agreements are stated at the lower of unamortized cost or net realizable value. Such licensed rights along with the related obligations are recorded at the contract value when a license agreement is executed, unless there is uncertainty with respect to either cost, acceptability or availability. If such uncertainty exists, those rights and obligations are recorded at the earlier of when the uncertainty is resolved or the license period begins. Costs are amortized to technical and operating expense on a straight-line basis over a period not to exceed the respective license periods.
The Company's owned original programming is primarily produced by production companies, with the remainder produced by the Company. Owned original programming costs, including estimated participation and residual costs, qualifying for capitalization as program rights are amortized to technical and operating expense over their estimated useful lives, commencing upon the first airing, based on attributable revenue for airings to date as a percentage of total projected attributable revenue, or ultimate revenue (film-forecast-computation method). Projected attributable revenue is based on previously generated revenues for similar content in established markets, primarily consisting of distribution and advertising revenues, and projected program usage. Projected program usage is based on the Company's current expectation of future exhibitions taking into account historical usage of similar content. Projected attributable revenue can change based upon programming market acceptance, levels of distribution and advertising revenue and decisions regarding planned program usage. These calculations require management to make assumptions and to apply judgment regarding revenue and planned usage. Accordingly, the Company periodically reviews revenue estimates and planned usage and revises its assumptions if necessary, which could impact the timing of amortization expense or result in a write-down to fair value.
The Company periodically reviews the programming usefulness of its licensed and owned original program rights based on a series of factors, including expected future revenue generation from airings on the Company's networks and other exploitation opportunities, ratings, type and quality of program material, standards and practices, and fitness for exhibition through various forms of distribution. If it is determined that film or other program rights have limited, or no, future programming usefulness, a write-off of the unamortized cost is included in technical and operating expense. See Note
5
for further discussion regarding program rights write-offs.
Investments
The Company holds investments in equity method and cost method investees and other marketable securities.
Investments in equity method investees are those for which the Company has the ability to exercise significant influence but does not control and is not the primary beneficiary. Significant influence typically exists if the Company has a
20%
to
50%
ownership interest in a venture unless persuasive evidence to the contrary exists. Under this method of accounting, the Company records its proportionate share of the net earnings or losses of equity method investees and a corresponding increase or decrease to the investment balances. Cash payments to equity method investees such as additional investments, loans and advances and expenses incurred on behalf of investees, as well as payments from equity method investees such as dividends, distributions and repayments of loans and advances are recorded as adjustments to investment balances. The Company evaluates its equity method investments for impairment whenever events or changes in circumstances indicate that the carrying amounts of such investments may not be recoverable.
Investments in entities or other securities in which the Company has no control or significant influence and is not the primary beneficiary are accounted for at fair value or cost. Investments in equity securities with readily determinable fair values are accounted for at fair value, based on quoted market prices, and classified as either trading securities or available-for-sale securities. For investments classified as trading securities, unrealized and realized gains and losses related to the investment and corresponding liability are recorded in earnings as a component of miscellaneous, net, in the consolidated statements of income. For investments classified as available-for-sale securities, which include investments in common stock, unrealized gains and losses are recorded net of income taxes in other comprehensive (loss) income until the security is sold or considered impaired. If declines in the value
F-10
AMC NETWORKS INC. AND SUBSIDIARIES
NOTES TO CONSOLIDATED FINANCIAL STATEMENTS (Continued)
of available-for-sale securities are determined to be other-than-temporary, a loss is recorded in earnings in the current period as a component of miscellaneous, net in the consolidated statements of income. Impairments are determined based on, among other factors, the length of time the fair value of the investment has been less than the carrying value, future business prospects for the investee, and information regarding market and industry trends for the investee's business, if available. For purposes of computing realized gains and losses, the Company determines cost on a specific identification basis. Cost method investments are recorded at the lower of cost or fair value. If declines in the value of cost method investments are determined to be other-than-temporary, a loss is recorded in earnings in the current period as a component of miscellaneous, net in the consolidated statements of income.
Long-Lived Assets and Amortizable Intangible Assets
Property and equipment are carried at cost. Equipment under capital leases is recorded at the present value of the total minimum lease payments. Depreciation is calculated on a straight-line basis over the estimated useful lives of the assets or, with respect to equipment under capital leases and leasehold improvements, amortized over the shorter of the lease term or the assets' useful lives and reported in depreciation and amortization in the consolidated statements of income.
Amortizable intangible assets established in connection with business combinations primarily consist of affiliate and customer relationships, advertiser relationships and tradenames. Amortizable intangible assets are amortized on a straight-line basis over their respective estimated useful lives.
The Company reviews its long-lived assets (property and equipment, and amortizable intangible assets) for impairment whenever events or circumstances indicate that the carrying amount of an asset may not be recoverable. If the sum of the expected cash flows, undiscounted and without interest, is less than the carrying amount of the asset, an impairment loss is recognized as the amount by which the carrying amount of the asset exceeds its fair value. See Note
3
for further discussion regarding impairment charges incurred related to long-lived assets associated with the Company's AMCNI – DMC asset group.
Goodwill and Indefinite-Lived Intangible Assets
Goodwill
Goodwill and identifiable intangible assets that have indefinite useful lives are not amortized, but instead are tested annually for impairment and upon the occurrence of certain events or substantive changes in circumstances.
The annual goodwill impairment test allows for the option to first assess qualitative factors to determine whether it is more likely than not that the fair value of a reporting unit is less than its carrying amount. An entity may choose to perform the qualitative assessment on none, some or all of its reporting units or an entity may bypass the qualitative assessment for any reporting unit and proceed directly to step one of the quantitative impairment test. If it is determined, on the basis of qualitative factors, that the fair value of a reporting unit is, more likely than not, less than its carrying value, the quantitative impairment test is required. For impairment tests performed after January 1, 2017, the Company adopted the guidance in Accounting Standards Update 2017-04
Intangibles – Goodwill and Other (Topic 350): Simplifying the Test for Goodwill Impairment
, which removes step 2 of the goodwill impairment test and replaces it with a simplified model. Under the simplified model, the Company calculates any goodwill impairment as the difference between the carrying amount of a reporting unit and its fair value, but not to exceed the carrying amount of goodwill. For impairment tests performed before January 1, 2017, the quantitative impairment test is a two-step process. The first step compares the carrying amount of a reporting unit, including goodwill, with its fair value utilizing an enterprise-value based approach. If the carrying amount of a reporting unit exceeds its fair value, the second step of the goodwill impairment test is performed to measure the amount of the goodwill impairment loss, if any. The second step compares the implied fair value of the reporting unit's goodwill with the carrying amount of that goodwill. If the carrying amount of the reporting unit's goodwill exceeds the implied fair value of that goodwill, an impairment loss is recognized in an amount equal to that excess. The implied fair value of goodwill is determined in the same manner as the amount of goodwill that would be recognized in a business combination. See Note
3
for further discussion regarding impairment charges incurred relating to goodwill associated with the Company's AMCNI – DMC reporting unit.
Indefinite-Lived Intangible Assets
Indefinite-lived intangible assets established in connection with business combinations primarily consist of trademarks. The impairment test for identifiable indefinite-lived intangible assets consists of a comparison of the estimated fair value of the intangible asset with its carrying value. If the carrying value exceeds its fair value, an impairment loss is recognized in an amount equal to that excess.
Deferred Carriage Fees
Deferred carriage fees represent amounts principally paid to multichannel video programming distributors to obtain additional subscribers and/or guarantee carriage of certain programming services and are amortized as a reduction of revenue over the period of the related affiliation arrangement (up to
13
years).
F-11
AMC NETWORKS INC. AND SUBSIDIARIES
NOTES TO CONSOLIDATED FINANCIAL STATEMENTS (Continued)
Derivative Financial Instruments
The Company's derivative financial instruments are recorded as either assets or liabilities in the consolidated balance sheet based on their fair values. The Company's embedded derivative financial instruments which are clearly and closely related to the host contracts are not accounted for on a stand-alone basis. Changes in the fair values are reported in earnings or other comprehensive income depending on the use of the derivative and whether it qualifies for hedge accounting. Derivative instruments are designated and accounted for as either a hedge of a recognized asset or liability (fair value hedge) or a hedge of a forecasted transaction (cash flow hedge). For derivatives not designated as hedges, changes in fair values are recognized in earnings and included in interest expense, for interest rate swap contracts and miscellaneous, net, for foreign currency and other derivative contracts. For derivatives designated as effective cash flow hedges, changes in fair values are recognized in other comprehensive income (loss). Changes in fair values related to fair value hedges as well as the ineffective portion of cash flow hedges are recognized in earnings. Changes in the fair value of the underlying hedged item of a fair value hedge are also recognized in earnings. See Note
12
for a further discussion of the Company's derivative financial instruments.
Income Taxes
The Company's provision for income taxes is based on current period income, changes in deferred tax assets and liabilities and estimates with regard to the liability for unrecognized tax benefits resulting from uncertain tax positions. Deferred tax assets are evaluated quarterly for expected future realization and reduced by a valuation allowance to the extent management believes it is more likely than not that a portion will not be realized. The Company provides deferred taxes for the outside basis difference for its investment in partnerships. Interest and penalties, if any, associated with uncertain tax positions are included in income tax expense.
Commitments and Contingencies
Liabilities for loss contingencies arising from claims, assessments, litigation, fines and penalties and other sources are recorded when it is probable that a liability has been incurred and the amount of the contingency can be reasonably estimated.
Concentration of Credit Risk
Financial instruments that potentially subject the Company to a concentration of credit risk consist primarily of cash and cash equivalents and trade accounts receivable. Cash is invested in money market funds and bank time deposits. The Company monitors the financial institutions and money market funds where it invests its cash and cash equivalents with diversification among counterparties to mitigate exposure to any single financial institution. The Company's emphasis is primarily on safety of principal and liquidity and secondarily on maximizing the yield on its investments. As of
December 31, 2017
and
2016
,
one
customer accounted for
20%
and
19%
, respectively, of the combined balances of consolidated accounts receivable, trade and receivables due in excess of one-year (included in other assets).
Redeemable Noncontrolling Interests
Noncontrolling interest with redemption features, such as put options, that are not solely within the Company's control are considered redeemable noncontrolling interests. Redeemable noncontrolling interests are considered to be temporary equity and are reported in the mezzanine section between total liabilities and stockholders' equity (deficiency) in the Company's consolidated balance sheet at the greater of the initial carrying amount, increased or decreased for the noncontrolling interest's share of net income or loss, or its redemption value.
Net Income per Share
The consolidated statements of income present basic and diluted net income per share ("EPS"). Basic EPS is based upon net income divided by the weighted-average number of common shares outstanding during the period. Diluted EPS reflects the dilutive effects of AMC Networks outstanding equity-based awards.
The following is a reconciliation between basic and diluted weighted average shares outstanding:
|
(In thousands)
|
Years Ended December 31,
|
|||||||
|
2017
|
2016
|
2015
|
||||||
|
Basic weighted average shares outstanding
|
64,905
|
|
71,746
|
|
72,420
|
|
||
|
Effect of dilution:
|
||||||||
|
Stock options
|
1
|
|
13
|
|
148
|
|
||
|
Restricted stock units
|
719
|
|
651
|
|
622
|
|
||
|
Diluted weighted average shares outstanding
|
65,625
|
|
72,410
|
|
73,190
|
|
||
F-12
AMC NETWORKS INC. AND SUBSIDIARIES
NOTES TO CONSOLIDATED FINANCIAL STATEMENTS (Continued)
Common Stock of AMC Networks
Each holder of AMC Networks Class A Common Stock has
one
vote per share while holders of AMC Networks Class B Common Stock have
ten
votes per share. AMC Networks Class B shares can be converted to AMC Networks Class A Common Stock at any time with a conversion ratio of
one
AMC Networks Class A common share for
one
AMC Networks Class B common share. The AMC Networks Class A stockholders are entitled to elect
25%
of the Company's Board of Directors. AMC Networks Class B stockholders have the right to elect the remaining members of the Company's Board of Directors. In addition, AMC Networks Class B stockholders are parties to an agreement which has the effect of causing the voting power of these AMC Networks Class B stockholders to be cast as a block.
Stock Repurchase Program
On March 7, 2016, the Company announced that its Board of Directors authorized a program to repurchase up to
$500 million
of its outstanding shares of common stock (the "2016 Stock Repurchase Program"). On June 6, 2017, the Board of Directors approved an increase of
$500 million
in the amount authorized for a total of
$1.0 billion
authorized under the 2016 Stock Repurchase Program. The 2016 Stock Repurchase Program has no pre-established closing date and may be suspended or discontinued at any time. For the year ended
December 31, 2017
, the Company repurchased
7.8 million
shares of its Class A common stock at an average purchase price of
$55.74
per share. As of
December 31, 2017
, the Company has
$342.6 million
available for repurchase under the 2016 Stock Repurchase Program.
|
|
Shares Outstanding
|
||||
|
(In thousands)
|
Class A
Common Stock
|
Class B
Common Stock
|
|||
|
Balance at December 31, 2014
|
60,553
|
|
11,484
|
|
|
|
Employee and non-employee director stock transactions*
|
357
|
|
—
|
|
|
|
Balance at December 31, 2015
|
60,910
|
|
11,484
|
|
|
|
Share repurchases
|
(4,120
|
)
|
—
|
|
|
|
Employee and non-employee director stock transactions*
|
289
|
|
—
|
|
|
|
Balance at December 31, 2016
|
57,079
|
|
11,484
|
|
|
|
Share repurchases
|
(7,790
|
)
|
—
|
|
|
|
Employee and non-employee director stock transactions*
|
312
|
|
—
|
|
|
|
Balance at December 31, 2017
|
49,601
|
|
11,484
|
|
|
*Reflects common stock activity in connection with restricted stock units and stock options granted to employees, as well as in connection with the fulfillment of employees' statutory tax withholding obligations for applicable income and other employment taxes and forfeited employee restricted stock units.
Recently Issued Accounting Pronouncements
In May 2017, the Financial Accounting Standards Board ("FASB") issued ASU No. 2017-09
Compensation-Stock Compensation (Topic 718)
. ASU 2017-09 addresses changes to the terms or conditions of a share-based payment award, specifically regarding which changes to the terms or conditions of a share-based payment award would require an entity to apply modification accounting. The guidance does not change the accounting for modifications but clarifies that an entity should account for the effects of a modification unless the fair value, vesting conditions, and classification of the modified award are the same immediately before the original award is modified. ASU 2017-09 is effective in the first quarter of 2018, with early adoption permitted. The adoption of ASU 2017-09 is not expected to have a material impact on the Company's consolidated financial statements.
In October 2016, the FASB issued ASU No. 2016-16,
Income Taxes – Intra-Entity Transfers of Assets Other Than Inventory
. ASU 2016-16 simplifies the accounting for the income tax consequences of intra-entity transfers of assets other than inventory and includes requirements to recognize the income tax consequences of an intra-entity transfer of an asset other than inventory when the transfer occurs; therefore, eliminating the exception for an intra-entity transfer of an asset other than inventory. ASU 2016-16 is effective for the Company in the first quarter of 2018, with early adoption permitted. Any adjustments as a result of adoption are to be applied on a modified retrospective basis through a cumulative-effect adjustment directly to retained earnings as of the beginning of the period of adoption. The adoption of ASU 2016-16 is not expected to have a material impact on the Company's consolidated financial statements.
In August 2016, the FASB issued ASU 2016-15,
Statement of Cash Flows (Topic 230), Classification of Certain Cash Receipts and Cash Payments
. The guidance clarifies the way in which certain cash receipts and cash payments should be classified on the
F-13
AMC NETWORKS INC. AND SUBSIDIARIES
NOTES TO CONSOLIDATED FINANCIAL STATEMENTS (Continued)
statement of cash flows and also how the predominance principle should be applied when cash receipts and cash payments have aspects of more than one class of cash flows. ASU 2016-15 is effective in the first quarter of 2018 with early adoption permitted. The adoption of ASU 2016-15 is not expected to have a material impact on the Company's consolidated financial statements.
In February 2016, the FASB issued ASU No. 2016-02,
Leases (Topic 842)
. ASU 2016-02 requires lessees to record most of their leases on the balance sheet, which will be recognized as a right-of-use asset and a lease liability. The Company will be required to classify each separate lease component as an operating or finance lease at the lease commencement date. Initial measurement of the right-of-use asset and lease liability is the same for operating and finance leases, however, expense recognition and amortization of the right-of-use asset differs. Operating leases will reflect lease expense on a straight-line basis similar to current operating leases. The straight-line expense will reflect the interest expense on the lease liability (effective interest method) and amortization of the right-of-use asset, which will be presented as a single line item in the operating expense section of the income statement. Finance leases will reflect a front-loaded expense pattern similar to the pattern for current capital leases. ASU 2016-02 is effective in the first quarter of 2019, with early adoption permitted. The Company is currently determining its implementation approach and assessing the impact the adoption will have on its consolidated financial statements.
In May 2014, the FASB issued ASU No. 2014-09,
Revenue from Contracts with Customers (Topic 606)
. ASU 2014-09 provides new guidance related to how an entity should recognize revenue to depict the transfer of promised goods or services to customers in an amount that reflects the consideration to which the entity expects to be entitled in exchange for those goods or services. The standard also expands the required disclosures to include the disaggregation of revenue from contracts with customers into categories that depict how the nature, timing and uncertainty of revenue and cash flows are affected by economic factors. Since its issuance, the FASB has issued additional interpretive guidance relating to the standard which included the topics of principal versus agent considerations and identifying performance obligations and licensing.
We have reviewed each of our revenue streams and identified the required changes to our revenue recognition policies. We have substantially completed our evaluation of the impact of the standard and we do not expect the adoption of the standard will have a material impact to our consolidated revenues. However, as a result of applying the standard, there are certain components of our distribution revenues where the standard generally results in earlier recognition of revenue compared to our historical policies due to: (i) the requirement to estimate and recognize variable consideration prior to such amounts becoming fixed and determinable, (ii) recognition of royalties in the period of usage, and (iii) recognition of certain arrangements with minimum guarantees on a time-based (straight-line) basis. The Company will adopt the standard as of January 1, 2018, using the modified retrospective method. Accordingly, we expect to record a net increase in opening retained earnings upon adoption resulting from the acceleration of revenue recognized under the standard.
Note
3
. Impairment and Related Charges
In 2016, management revised its outlook for the growth potential of the Amsterdam-based media logistics facility, AMCNI – DMC, resulting in lower expected future cash flows due to increased competition and evolving broadcast technologies. In connection with the preparation of the Company's 2016 fourth quarter financial information, the Company performed a recoverability test of the long-lived asset group of the AMCNI – DMC business and determined that certain long-lived assets, primarily identifiable intangible assets and analog equipment, were not recoverable. In addition, the Company determined that sufficient indicators of potential impairment of goodwill existed and in connection with the preparation of the Company's 2016 fourth quarter financial information, the Company performed the two-step impairment evaluation. The fair value of the AMCNI – DMC asset group was measured based on an income approach (discounted cash flow valuation methodology). Impairment and related charges included in the consolidated statement of income for the year ended December 31, 2016 reflect impairment charges of
$22.9 million
related to property and equipment,
$17.7 million
related to intangible assets and
$27.2 million
for the write-down of all AMCNI – DMC related goodwill.
On July 12, 2017, the Company completed the sale AMCNI – DMC. In connection with the sale, the Company recognized a pre-tax loss of
$11.0 million
and an impairment charge of
$17.1 million
to reflect the AMCNI – DMC assets held for sale at fair value less estimated sale costs, which are included in impairment and related charges in the consolidated statement of income for the year ended December 31, 2017.
Note
4
. Restructuring
In 2017, the Company incurred restructuring expense related to corporate headquarter severance costs and charges incurred at AMCNI related to costs associated with the termination of distribution in certain territories.
In 2016, the Company launched a restructuring initiative that involved modifications to the organizational structure of the Company which resulted in reduced employee costs and operating expenses primarily through a voluntary buyout program offered to certain employees. The year ended December 31, 2016 also included the impact of elimination of distribution of certain channels
F-14
AMC NETWORKS INC. AND SUBSIDIARIES
NOTES TO CONSOLIDATED FINANCIAL STATEMENTS (Continued)
in certain territories. Restructuring activities in 2015 primarily related to severance and other exit costs associated with the elimination of certain positions across the Company and the elimination of distribution in certain territories.
The following table summarizes the restructuring expense (credit) recognized by operating segment:
|
(In thousands)
|
Year Ended December 31, 2017
|
Year Ended December 31, 2016
|
Year Ended December 31, 2015
|
||||||||
|
National Networks
|
$
|
(53
|
)
|
$
|
8,516
|
|
$
|
3,194
|
|
||
|
International & Other
|
6,181
|
|
20,987
|
|
11,804
|
|
|||||
|
Total restructuring expense
|
$
|
6,128
|
|
$
|
29,503
|
|
$
|
14,998
|
|
||
Restructuring expense in the International and Other segment includes corporate headquarter related charges.
The following table summarizes the accrued restructuring costs:
|
(In thousands)
|
Severance and Employee-Related Costs
|
Other Exit Costs
|
Total
|
||||||||
|
Balance at December 31, 2015
|
$
|
9,498
|
|
$
|
512
|
|
$
|
10,010
|
|
||
|
Charges
|
23,557
|
|
5,946
|
|
29,503
|
|
|||||
|
Cash payments
|
(20,871
|
)
|
(935
|
)
|
(21,806
|
)
|
|||||
|
Non-cash adjustments
|
12
|
|
(5,315
|
)
|
(5,303
|
)
|
|||||
|
Currency translation
|
(90
|
)
|
(3
|
)
|
(93
|
)
|
|||||
|
Balance at December 31, 2016
|
$
|
12,106
|
|
$
|
205
|
|
$
|
12,311
|
|
||
|
Charges
|
2,543
|
|
3,585
|
|
6,128
|
|
|||||
|
Cash payments
|
(13,440
|
)
|
(152
|
)
|
(13,592
|
)
|
|||||
|
Non-cash adjustments
|
2
|
|
(3,585
|
)
|
(3,583
|
)
|
|||||
|
Currency translation
|
1
|
|
(29
|
)
|
(28
|
)
|
|||||
|
Balance at December 31, 2017
|
$
|
1,212
|
|
$
|
24
|
|
$
|
1,236
|
|
||
Accrued liabilities for restructuring costs are included in accrued liabilities in the consolidated balance sheet at
December 31, 2017
.
Note
5
. Program Rights and Obligations
Program Rights
Owned original program rights, net is comprised of
$329.4 million
of completed programming and
$235.2 million
of in-production programming at
December 31, 2017
and is included as a component of long-term program rights, net in the consolidated balance sheet. The Company estimates that approximately
90%
of unamortized owned original programming costs, as of
December 31, 2017
, will be amortized within the next
three
years. The Company expects to amortize approximately
$196.0 million
of unamortized owned original programming costs during the next
twelve
months. Program rights write-offs of
$49.4 million
,
$26.2 million
and
$43.2 million
were recorded for the years ended
December 31, 2017
,
2016
and
2015
, respectively.
F-15
AMC NETWORKS INC. AND SUBSIDIARIES
NOTES TO CONSOLIDATED FINANCIAL STATEMENTS (Continued)
Program Rights Obligations
Amounts payable subsequent to
December 31, 2017
related to program rights obligations included in the consolidated balance sheet are as follows:
|
(In thousands)
|
|||
|
Years Ending December 31,
|
|
||
|
2018
|
$
|
327,549
|
|
|
2019
|
217,457
|
|
|
|
2020
|
163,640
|
|
|
|
2021
|
74,796
|
|
|
|
2022
|
48,941
|
|
|
|
Thereafter
|
30,146
|
|
|
|
$
|
862,529
|
|
|
The Company holds several investments and loans in non-consolidated entities. Equity method investments were
$61.3 million
and
$28.2 million
at
December 31, 2017
and
2016
, respectively. Cost method investments were
$46.8 million
and
$32.8 million
at
December 31, 2017
and
2016
, respectively. Equity and cost method investments are included in other assets in the consolidated balance sheet.
RLJE
On October 14, 2016, Digital Entertainment Holdings LLC ("DEH"), a wholly-owned subsidiary of the Company, and RLJ Entertainment, Inc. ("RLJE") entered into a Credit and Guaranty agreement (the "RLJE Credit Agreement") pursuant to which DEH provided senior secured term loans totaling
$65 million
to RLJE, consisting of a
$5 million
Tranche A term loan (the "Tranche A Loan") and a
$60 million
Tranche B term loan (the "Tranche B Loan"), and DEH received warrants to purchase at least
20 million
shares of RLJE's common stock, at a price of
$3.00
per share (the "RLJE Warrants").
On January 30, 2017, the Company and RLJE amended the terms of the Tranche A Loan to increase the principal amount to
$13 million
. On June 16, 2017, DEH and RLJE entered into a second amendment to the RLJE Credit Agreement (the "Second Amendment") pursuant to which DEH provided an additional tranche of the term loan debt to RLJE in the principal amount of
$10 million
(the "Tranche A-2 Loan").
Both the Tranche A Loan and the Tranche A-2 Loan bear interest at a rate of
7.00%
per annum, to be paid in shares of common stock of RLJE. The Tranche A Loan has a maturity date of June 30, 2020. The Tranche A-2 Loan has a maturity date of June 30, 2021. The Tranche B Loan bears interest at a rate of
6.00%
per annum, to be paid in shares of Common Stock of RLJE. Principal payments on the Tranche B loan are
$15 million
due on October 14, 2021,
$30 million
due on October 14, 2022 and the remaining balance due on October 14, 2023. For the purposes of calculating the interest to be paid in shares of RLJE common stock, the value of such shares is based on a fixed
$3.00
per share. Interest on the Tranche A Loan, the Tranche A-2 Loan and the Tranche B Loan is due in arrears on a quarterly basis.
The RLJE Warrants entitle DEH to purchase at least
20 million
shares of Common Stock of RLJE (the “Warrant Shares”) with an initial exercise date of October 14, 2016. The first RLJE Warrant for
5 million
Warrant Shares expires on October 14, 2021, the second RLJE Warrant for
10 million
Warrant Shares expires on October 14, 2022, and the third RLJE Warrant for
5 million
Warrant Shares expires on October 14, 2023. The exercise price of the RLJE Warrants is
$3.00
per share, subject to certain adjustments.
The RLJE Warrants include customary anti-dilution provisions. In addition, the third RLJE Warrant also provides that the number of Warrant Shares shall be increased to the extent necessary to ensure that upon the full exercise of the RLJE Warrant, DEH shall hold at least
50.1%
of the outstanding equity securities of RLJE on a fully diluted basis.
On June 20, 2017, in connection with the Second Amendment, DEH exercised a portion of its RLJE Class A warrants at
$3.00
per share to acquire
1,667,000
shares of RLJE common stock in exchange for the cancellation of
$5 million
of the Tranche B Loan. Following the cancellation, the outstanding balance of the Tranche B Loan is
$55 million
.
The increased ownership interest from the warrant exercise, as well as the existing representation on RLJE's board of directors and the terms of the RLJE Credit Agreement were deemed, for accounting purposes, to provide DEH with the ability to exert significant influence over RLJE. As a result, the RLJE common stock investment held by the Company qualified for the use of
F-16
AMC NETWORKS INC. AND SUBSIDIARIES
NOTES TO CONSOLIDATED FINANCIAL STATEMENTS (Continued)
the equity method of accounting. The Company has elected the fair value option for its investment in RLJE common stock based on the availability of a quoted market price. For the year ended
December 31, 2017
, the Company recognized a gain of
$2.2 million
in the fair value of its investment in RLJE common stock, which is included in miscellaneous, net in the consolidated income statement.
The RLJE term loans are included in other assets in the consolidated balance sheet. The Company accounts for the portion of interest on the RLJE term loans payable in RLJE common stock as an embedded derivative. In addition, the RLJE Warrants are accounted for as derivatives. Both the RLJE Warrants and the embedded derivative for the interest payable in RLJE common stock are remeasured at the end of each period with changes in fair value included in miscellaneous, net in the consolidated statement of income.
Subsequent Event
On February 26, 2018, the Company delivered a letter to RLJE pursuant to which the Company proposed to acquire the outstanding shares of RLJE not currently owned by the Company or entities affiliated with Robert L. Johnson for a purchase price of
$4.25
per share in cash. Through this offer, the Company intends for RLJE to become a privately owned subsidiary of the Company, with a minority stake held by Mr. Johnson. The board of directors of RLJE has formed a special committee of independent directors to consider the proposal. There can be no assurance that the proposal made by the Company to RLJE will result in a transaction or the terms upon which any transaction may occur.
Other Investments
The Company holds a minority investment in Funny or Die, Inc. which is accounted for as a cost method investment. The agreement contains certain provisions under which the Company may be obligated to increase its investment over time.
Note
7
. Property and Equipment
Property and equipment (including equipment under capital leases) consists of the following:
|
(In thousands)
|
December 31,
|
Estimated
Useful Lives
|
|||||||
|
2017
|
2016
|
||||||||
|
Program, service and test equipment
|
$
|
212,357
|
|
$
|
223,847
|
|
2 to 5 years
|
||
|
Satellite equipment
|
46,315
|
|
51,423
|
|
13 years
|
||||
|
Furniture and fixtures
|
21,067
|
|
21,471
|
|
5 to 8 years
|
||||
|
Transmission equipment
|
56,035
|
|
51,954
|
|
5 years
|
||||
|
Leasehold improvements
|
107,659
|
|
90,089
|
|
Term of lease
|
||||
|
Property and equipment
|
443,433
|
|
438,784
|
|
|||||
|
Accumulated depreciation and amortization
|
(259,919
|
)
|
(272,148
|
)
|
|||||
|
Property and equipment, net
|
$
|
183,514
|
|
$
|
166,636
|
|
|||
Depreciation and amortization expense on property and equipment (including capital leases) amounted to
$47.6 million
,
$46.2 million
and
$41.0 million
, for the years ended
December 31, 2017
,
2016
and
2015
, respectively.
At
December 31, 2017
and
2016
, the gross amount of equipment and related accumulated amortization recorded under capital leases were as follows:
|
(In thousands)
|
December 31,
|
||||||
|
2017
|
2016
|
||||||
|
Satellite equipment
|
$
|
46,315
|
|
$
|
51,423
|
|
|
|
Less accumulated amortization
|
(22,783
|
)
|
(19,031
|
)
|
|||
|
$
|
23,532
|
|
$
|
32,392
|
|
||
F-17
AMC NETWORKS INC. AND SUBSIDIARIES
NOTES TO CONSOLIDATED FINANCIAL STATEMENTS (Continued)
Note
8
. Goodwill and Other Intangible Assets
The carrying amount of goodwill, by operating segment is as follows:
|
(In thousands)
|
National Networks
|
International
and Other
|
Total
|
||||||||
|
December 31, 2015
|
$
|
244,849
|
|
$
|
491,426
|
|
$
|
736,275
|
|
||
|
Purchase accounting adjustments
|
—
|
|
(6,040
|
)
|
(6,040
|
)
|
|||||
|
Impairment charges (see Note 3)
|
—
|
|
(27,244
|
)
|
(27,244
|
)
|
|||||
|
Amortization of "second component" goodwill
|
(2,546
|
)
|
—
|
|
(2,546
|
)
|
|||||
|
Foreign currency translation
|
—
|
|
(42,737
|
)
|
(42,737
|
)
|
|||||
|
December 31, 2016
|
$
|
242,303
|
|
$
|
415,405
|
|
$
|
657,708
|
|
||
|
Amortization of "second component" goodwill
|
(2,544
|
)
|
—
|
|
(2,544
|
)
|
|||||
|
Foreign currency translation
|
—
|
|
39,994
|
|
39,994
|
|
|||||
|
December 31, 2017
|
$
|
239,759
|
|
$
|
455,399
|
|
$
|
695,158
|
|
||
The reduction of
$2.5 million
in the carrying amount of goodwill for the National Networks is due to the realization of a tax benefit for the amortization of "second component" goodwill at SundanceTV. Second component goodwill is the amount of tax deductible goodwill in excess of goodwill for financial reporting purposes. In accordance with the authoritative guidance at the time of the SundanceTV acquisition, the tax benefits associated with this excess are applied to first reduce the amount of goodwill, and then other intangible assets for financial reporting purposes, if and when such tax benefits are realized in the Company's tax returns.
Annual Impairment Test of Goodwill
Based on the Company's annual impairment test for goodwill as of December 1, 2017, no impairment charge was required for any of the reporting units. The Company performed a qualitative assessment for all reporting units, with the exception of the International Programming Networks reporting unit. The qualitative assessments included, but were not limited to, consideration of the historical significant excesses of the estimated fair value of the reporting unit over its carrying value (including allocated goodwill), macroeconomic conditions, industry and market considerations, cost factors and historical and projected cash flows. The Company performed a quantitative assessment for the International Programming Networks reporting unit. Based on the quantitative assessment, if the fair value of the International Programming Networks reporting unit decreased by
2%
, the Company would be required to record an impairment of goodwill.
In assessing the recoverability of goodwill, the Company must make assumptions regarding estimated future cash flows and other factors to determine the fair value of the respective assets. These estimates and assumptions could have a significant impact on whether an impairment charge is recognized and also the magnitude of any such charge. Fair value estimates are made at a specific point in time, based on relevant information. These estimates are subjective in nature and involve uncertainties and matters of significant judgments and therefore cannot be determined with precision. Changes in assumptions could significantly affect the estimates. Estimates of fair value for goodwill impairment testing are primarily determined using discounted cash flows and comparable market transactions methods. These valuation methods are based on estimates and assumptions including projected future cash flows, discount rate and determination of appropriate market comparables and determination of whether a premium or discount should be applied to comparables. Projected future cash flows also include assumptions for renewals of affiliation agreements, the projected number of subscribers and the projected average rates per basic and viewing subscribers and growth in fixed price contractual arrangements used to determine affiliation fee revenue, access to program rights and the cost of such program rights, amount of programming time that is advertiser supported, number of advertising spots available and the sell through rates for those spots, average fee per advertising spot and operating margins, among other assumptions. If these estimates or material related assumptions change in the future, the Company may be required to record impairment charges related to goodwill. For example, if our future revenue growth is lower than expected, or if programming costs exceed amounts currently expected, and the Company is unable to mitigate the impact of these factors, an impairment charge related to the goodwill associated with its International Programming Networks reporting unit may be required.
F-18
AMC NETWORKS INC. AND SUBSIDIARIES
NOTES TO CONSOLIDATED FINANCIAL STATEMENTS (Continued)
The following table summarizes information relating to the Company's identifiable intangible assets:
|
(In thousands)
|
December 31, 2017
|
Estimated
Useful Lives
|
|||||||||||
|
Gross
|
Accumulated
Amortization
|
Net
|
|||||||||||
|
Amortizable intangible assets:
|
|||||||||||||
|
Affiliate and customer relationships
|
$
|
527,713
|
|
$
|
(167,911
|
)
|
$
|
359,802
|
|
6 to 25 years
|
|||
|
Advertiser relationships
|
46,282
|
|
(13,405
|
)
|
32,877
|
|
11 years
|
||||||
|
Trade names
|
53,761
|
|
(14,420
|
)
|
39,341
|
|
20 years
|
||||||
|
Other amortizable intangible assets
|
11,401
|
|
(6,079
|
)
|
5,322
|
|
2 to 15 years
|
||||||
|
Total amortizable intangible assets
|
639,157
|
|
(201,815
|
)
|
437,342
|
|
|||||||
|
Indefinite-lived intangible assets:
|
|||||||||||||
|
Trademarks
|
19,900
|
|
—
|
|
19,900
|
|
|||||||
|
Total intangible assets
|
$
|
659,057
|
|
$
|
(201,815
|
)
|
$
|
457,242
|
|
||||
|
(In thousands)
|
December 31, 2016
|
||||||||||||
|
Gross
|
Accumulated
Amortization
|
Net
|
|||||||||||
|
Amortizable intangible assets:
|
|||||||||||||
|
Affiliate and customer relationships
|
$
|
509,992
|
|
$
|
(133,932
|
)
|
$
|
376,060
|
|
||||
|
Advertiser relationships
|
46,282
|
|
(9,198
|
)
|
37,084
|
|
|||||||
|
Trade names
|
49,720
|
|
(6,307
|
)
|
43,413
|
|
|||||||
|
Other amortizable intangible assets
|
10,002
|
|
(791
|
)
|
9,211
|
|
|||||||
|
Total amortizable intangible assets
|
615,996
|
|
(150,228
|
)
|
465,768
|
|
|||||||
|
Indefinite-lived intangible assets:
|
|||||||||||||
|
Trademarks
|
20,041
|
|
—
|
|
20,041
|
|
|||||||
|
Total intangible assets
|
$
|
636,037
|
|
$
|
(150,228
|
)
|
$
|
485,809
|
|
||||
Aggregate amortization expense for amortizable intangible assets for the years ended
December 31, 2017
,
2016
and
2015
was
$47.1 million
,
$38.6 million
and
$42.0 million
, respectively. Amortization expense in 2017 includes a
$9.0 million
charge from the accelerated amortization of certain identifiable intangible assets at AMCNI. Estimated aggregate amortization expense for intangible assets subject to amortization for each of the following five years is:
|
(In thousands)
|
|||
|
Years Ending December 31,
|
|
||
|
2018
|
$
|
37,212
|
|
|
2019
|
37,197
|
|
|
|
2020
|
37,194
|
|
|
|
2021
|
36,821
|
|
|
|
2022
|
36,816
|
|
|
Impairment Test of Identifiable Indefinite-Lived Intangible Assets
Based on the Company's 2017 annual impairment test for identifiable indefinite-lived intangible assets, no impairment charge was required. The Company's indefinite-lived intangible assets relate to SundanceTV trademarks, which were valued using a relief-from-royalty method in which the expected benefits are valued by discounting estimated royalty revenue over projected revenues covered by the trademarks. In order to evaluate the sensitivity of the fair value calculations for the Company's identifiable indefinite-lived intangible assets, the Company applied a hypothetical
20%
decrease to the estimated fair value of the identifiable indefinite-lived intangible assets. This hypothetical decrease in estimated fair value would not result in an impairment.
Significant judgments inherent in estimating the fair value of indefinite-lived intangible assets include the selection of appropriate discount and royalty rates, estimating the amount and timing of estimated future cash flows and identification of
F-19
AMC NETWORKS INC. AND SUBSIDIARIES
NOTES TO CONSOLIDATED FINANCIAL STATEMENTS (Continued)
appropriate continuing growth rate assumptions. The discount rates used in the analysis are intended to reflect the risk inherent in the projected future cash flows generated by the respective intangible assets.
Accrued liabilities consist of the following:
|
(In thousands)
|
December 31, 2017
|
December 31, 2016
|
|||||
|
Interest
|
$
|
30,262
|
|
$
|
15,770
|
|
|
|
Employee related costs
|
117,850
|
|
122,590
|
|
|||
|
Income taxes payable
|
19,558
|
|
43,083
|
|
|||
|
Other accrued expenses
|
95,406
|
|
102,986
|
|
|||
|
Total accrued liabilities
|
$
|
263,076
|
|
$
|
284,429
|
|
|
Note
10
. Long-term Debt
The Company's long-term debt consists of:
|
(In thousands)
|
December 31, 2017
|
December 31, 2016
|
|||||
|
Senior Secured Credit Facility:
|
|||||||
|
Term Loan A Facility
|
$
|
750,000
|
|
$
|
1,258,000
|
|
|
|
Senior Notes:
|
|||||||
|
4.75% Notes due August 2025
|
800,000
|
|
—
|
|
|||
|
5.00% Notes due April 2024
|
1,000,000
|
|
1,000,000
|
|
|||
|
4.75% Notes due December 2022
|
600,000
|
|
600,000
|
|
|||
|
Total long-term debt
|
3,150,000
|
|
2,858,000
|
|
|||
|
Unamortized discount
|
(33,776
|
)
|
(23,675
|
)
|
|||
|
Unamortized deferred financing costs
|
(16,967
|
)
|
(15,062
|
)
|
|||
|
Long-term debt, net
|
3,099,257
|
|
2,819,263
|
|
|||
|
Current portion of long-term debt
|
—
|
|
222,000
|
|
|||
|
Noncurrent portion of long-term debt
|
$
|
3,099,257
|
|
$
|
2,597,263
|
|
|
Amended and Restated Senior Secured Credit Facility
On July 28, 2017, AMC Networks entered into a Second Amended and Restated Credit Agreement (the "Credit Agreement") among AMC Networks and its subsidiary, AMC Network Entertainment LLC, as the Initial Borrowers, certain of AMC Networks' subsidiaries, as restricted subsidiaries, JPMorgan Chase Bank, N.A., as Administrative Agent, Collateral Agent and an L/C Issuer, Bank of America, as an L/C Issuer, and the lenders party thereto. The Credit Agreement amends and restates AMC Networks' prior credit agreement dated December 16, 2013 in its entirety. The Credit Agreement provides the Initial Borrowers with senior secured credit facilities consisting of (a) a
$750 million
Term Loan A (the "Term Loan A Facility") after giving effect to the approximate
$400 million
payment from the proceeds of the 4.75% Notes due 2025 described below and (b) a
$500 million
revolving credit facility (the "Revolving Facility") that was not drawn upon initially. Under the Credit Agreement, the maturity date of the Term Loan A Facility was extended to July 28, 2023 and the maturity date of the Revolving Facility was extended to July 28, 2022.
Borrowings under the Credit Agreement bear interest at a floating rate, which at the option of the Initial Borrowers may be either (a) a base rate plus an additional rate ranging from
0.25%
to
1.25%
per annum (determined based on a cash flow ratio) (the "Base Rate"), or (b) a Eurodollar rate plus an additional rate ranging from
1.25%
to
2.25%
per annum (determined based on a cash flow ratio) (the "Eurodollar Rate"), provided that for the six month period following the closing date, the additional rate used in calculating both floating rates was (i)
0.50%
per annum for borrowings bearing the Base Rate, and (ii)
1.50%
per annum for borrowings bearing the Eurodollar Rate.
The Credit Agreement requires the Initial Borrowers to pay a commitment fee of between
0.25%
and
0.50%
(determined based on a cash flow ratio) in respect of the average daily unused commitments under the Revolving Facility. The Initial Borrowers also are required to pay customary letter of credit fees, as well as fronting fees, to banks that issue letters of credit pursuant to the Credit Agreement.
F-20
AMC NETWORKS INC. AND SUBSIDIARIES
NOTES TO CONSOLIDATED FINANCIAL STATEMENTS (Continued)
All obligations under the Credit Agreement are guaranteed by certain of the Initial Borrowers' existing and future domestic restricted subsidiaries in accordance with the Credit Agreement. All obligations under the Credit Agreement, including the guarantees of those obligations, are secured by certain assets of the Initial Borrowers and certain of their subsidiaries (collectively, the "Loan Parties").
The Credit Agreement contains certain affirmative and negative covenants applicable to the Loan Parties. These include restrictions on the Loan Parties' ability to incur indebtedness, make investments, place liens on assets, dispose of assets, enter into certain affiliate transactions and make certain restricted payments, including restrictions on AMC Networks' ability to pay dividends on and to repurchase its common stock. The Credit Agreement also requires the Initial Borrowers to comply with the following financial covenants: (i) a maximum ratio of net debt to annual operating cash flow (each defined in the Credit Agreement) of
6.00
:1 initially and decreasing in steps down to
5.00
:1 on and after January 1, 2022, subject to increase if AMC Networks consummates any leveraging acquisition; and (ii) a minimum ratio of annual operating cash flow to annual total interest expense (as defined in the Credit Agreement) of
2.50
:1.
The revolving credit facility was not drawn upon at
December 31, 2017
. The total undrawn revolver commitment is available to be drawn for our general corporate purposes.
AMC Networks was in compliance with all of its financial covenants under the Credit Facility as of December 31, 2017.
In connection with the issuance of the 4.75% Notes due 2025 and the amendment to the Credit Agreement, AMC Networks incurred a loss on extinguishment of debt of
$3.0 million
for the write-off of a portion of unamortized deferred financing costs, and incurred financing costs of
$10.4 million
, of which
$9.4 million
were deferred and are being amortized, using the effective interest method, to interest expense over the term of the related borrowing, and
$1.0 million
were expensed when incurred.
4.75% Notes due 2025
On July 28, 2017, AMC Networks issued, and certain of AMC Networks' subsidiaries (hereinafter, the "Guarantors") guaranteed
$800 million
aggregate principal amount of senior notes due August 1, 2025 (the "4.75% Notes due 2025") in a registered public offering. The 4.75% Notes due 2025 were issued net of a
$14.0 million
underwriting discount. AMC Networks used approximately
$400 million
of the net proceeds to repay loans under AMC Networks' Term Loan A Facility and to pay fees and expenses related to the issuance. The remaining proceeds are for general corporate purposes. The 4.75% Notes due 2025 were issued pursuant to an indenture, dated as of March 30, 2016, as amended by the Second Supplemental Indenture, dated as of July 28, 2017.
The 4.75% Notes due 2025 bear interest at a rate of 4.75% per annum and mature on August 1, 2025. Interest is payable semiannually on February 1 and August 1 of each year, commencing on February 1, 2018. The 4.75% Notes due 2025 are AMC Networks' general senior unsecured obligations and rank equally with all of AMC Networks' and the Guarantors' existing and future unsecured and unsubordinated indebtedness, but are effectively subordinated to all of AMC Networks' and the guarantors' existing and future secured indebtedness, including all borrowings and guarantees under the Credit Agreement referred to above, to the extent of the assets securing that indebtedness. The 4.75% Notes due 2025 are subject to redemption on the terms set forth in the Second Supplemental Indenture.
The 4.75% Notes due 2025 may be redeemed, at AMC Networks' option, in whole or in part, at any time on or after August 1, 2021, at a redemption price equal to
102.375%
of the principal amount thereof (plus accrued and unpaid interest thereon, if any, to the date of such redemption), declining annually to
100%
of the principal amount thereof (plus accrued and unpaid interest thereon, if any, to the date of such redemption) beginning on August 1, 2023.
In addition to the optional redemption of the 4.75% Notes due 2025 described above, at any time prior to August 1, 2020, AMC Networks may redeem up to
35%
of the aggregate principal amount of the 4.75% Notes due 2025 at a redemption price equal to
104.750%
of the principal amount thereof, plus accrued and unpaid interest and additional interest, if any, using the net proceeds of certain equity offerings.
Finally, at any time prior to August 1, 2021, AMC Networks may redeem the 4.75% Notes due 2025, at its option in whole or in part, at any time and from time to time, at a redemption price equal to
100%
of the principal amount thereof to be redeemed plus the "Applicable Premium" calculated as described in the Second Supplemental Indenture at the rate of T+50 basis points, and accrued and unpaid interest thereon, if any, to, but excluding, the redemption date.
The indenture governing the 4.75% Notes due 2025 contains certain affirmative and negative covenants applicable to AMC Networks and its restricted subsidiaries including restrictions on their ability to incur additional indebtedness, consummate certain assets sales, make investments in entities that are not restricted subsidiaries, create liens on their assets, enter into certain affiliate transactions and make certain restricted payments, including restrictions on AMC Networks' ability to pay dividends on, or repurchase, its common stock.
F-21
AMC NETWORKS INC. AND SUBSIDIARIES
NOTES TO CONSOLIDATED FINANCIAL STATEMENTS (Continued)
5.00% Notes due 2024
On March 30, 2016, the Company issued
$1.0 billion
in aggregate principal amount of 5.00% senior notes due 2024 (the "5.00% Notes due 2024"), net of an issuance discount of
$17.5 million
. AMC Networks used
$703 million
of the net proceeds of this offering to make a cash tender ("Tender Offer") for its outstanding 7.75% Notes due 2021 (the "7.75% Notes"). In addition,
$45.6 million
of the proceeds from the issuance of the 5.00% Notes due 2024 was used for the redemption of the 7.75% Notes not tendered. The remaining proceeds are for general corporate purposes. The 5.00% Notes due 2024 were issued pursuant to an indenture dated as of March 30, 2016.
In connection with the issuance of the 5.00% Notes due 2024, AMC Networks incurred deferred financing costs of
$2.1 million
, which are being amortized, using the effective interest method, to interest expense over the term of the 5.00% Notes due 2024.
Interest on the 5.00% Notes due 2024 is payable semi-annually in arrears on April 1 and October 1 of each year.
The 5.00% Notes due 2024 may be redeemed, in whole or in part, at any time on or after April 1, 2020, at a redemption price equal to
102.5%
of the principal amount thereof (plus accrued and unpaid interest thereon, if any, to the date of such redemption), declining annually to
100%
of the principal amount thereof (plus accrued and unpaid interest thereon, if any, to the date of such redemption) beginning on April 1, 2022.
The 5.00% Notes due 2024 are guaranteed on a senior unsecured basis by the Guarantors, in accordance with the indenture governing the 5.00% Notes due 2024. The guarantees under the 5.00% Notes due 2024 are full and unconditional and joint and several.
The indenture governing the 5.00% Notes due 2024 contains certain affirmative and negative covenants applicable to AMC Networks and its restricted subsidiaries including restrictions on their ability to incur additional indebtedness, consummate certain assets sales, make investments in entities that are not restricted subsidiaries, create liens on their assets, enter into certain affiliate transactions and make certain restricted payments, including restrictions on AMC Networks' ability to pay dividends on, or repurchase, its common stock.
4.75% Senior Notes due 2022
On December 17, 2012, AMC Networks issued
$600 million
in aggregate principal amount of its 4.75% senior notes, net of an issuance discount of
$10.5 million
, due December 15, 2022 (the "4.75% Notes due 2022"). AMC Networks used the net proceeds of this offering to repay the outstanding amount under its term loan B facility of approximately
$587.6 million
, with the remaining proceeds used for general corporate purposes. The 4.75% Notes due 2022 were issued pursuant to an indenture, and first supplemental indenture, each dated as of December 17, 2012.
In connection with the issuance of the 4.75% Notes due 2022, AMC Networks incurred deferred financing costs of
$1.5 million
, which are being amortized, using the effective interest method, to interest expense over the term of the 4.75% Notes due 2022.
Interest on the 4.75% Notes due 2022 accrues at the rate of 4.75% per annum and is payable semi-annually in arrears on June 15 and December 15 of each year.
The 4.75% Notes due 2022 may be redeemed, in whole or in part, at a redemption price equal to
102.375%
of the principal amount thereof (plus accrued and unpaid interest thereon, if any, to the date of such redemption), declining annually to
100%
of the principal amount thereof (plus accrued and unpaid interest thereon, if any, to the date of such redemption) beginning on December 15, 2020.
The 4.75% Notes due 2022 are guaranteed on a senior unsecured basis by the Guarantors, in accordance with the indenture governing the 4.75% Notes due 2022. The guarantees under the 4.75% Notes due 2022 are full and unconditional and joint and several.
The indenture governing the 4.75% Notes due 2022 contains certain affirmative and negative covenants applicable to AMC Networks and its restricted subsidiaries including restrictions on their ability to incur additional indebtedness, consummate certain assets sales, make investments in entities that are not restricted subsidiaries, create liens on their assets, enter into certain affiliate transactions and make certain restricted payments, including restrictions on AMC Networks' ability to pay dividends on, or repurchase, its common stock.
F-22
AMC NETWORKS INC. AND SUBSIDIARIES
NOTES TO CONSOLIDATED FINANCIAL STATEMENTS (Continued)
Summary of Debt Maturities
Total amounts payable by the Company under its various debt obligations (excluding capital leases) outstanding as of
December 31, 2017
are as follows:
|
(In thousands)
|
|||
|
Years Ending December 31,
|
|
||
|
2018
|
$
|
—
|
|
|
2019
|
18,750
|
|
|
|
2020
|
56,250
|
|
|
|
2021
|
775,000
|
|
|
|
2022
|
75,000
|
|
|
|
Thereafter
|
2,225,000
|
|
|
The fair value hierarchy is based on inputs to valuation techniques that are used to measure fair value that are either observable or unobservable. Observable inputs reflect assumptions market participants would use in pricing an asset or liability based on market data obtained from independent sources while unobservable inputs reflect a reporting entity's pricing based upon their own market assumptions. The fair value hierarchy consists of the following three levels:
|
•
|
Level I—Quoted prices for identical instruments in active markets.
|
|
•
|
Level II—Quoted prices for similar instruments in active markets; quoted prices for identical or similar instruments in markets that are not active; and model-derived valuations whose inputs are observable or whose significant value drivers are observable.
|
|
•
|
Level III—Instruments whose significant value drivers are unobservable.
|
The following table presents for each of these hierarchy levels, the Company's financial assets and liabilities that are measured at fair value on a recurring basis at
December 31, 2017
and
December 31, 2016
:
|
(In thousands)
|
Level I
|
Level II
|
Level III
|
Total
|
||||||||||||
|
At December 31, 2017:
|
||||||||||||||||
|
Assets:
|
||||||||||||||||
|
Cash equivalents
|
$
|
100,615
|
|
$
|
—
|
|
$
|
—
|
|
$
|
100,615
|
|
||||
|
Available for sale securities
|
10,709
|
|
—
|
|
—
|
|
10,709
|
|
||||||||
|
Interest rate swap contracts
|
—
|
|
1,444
|
|
—
|
|
1,444
|
|
||||||||
|
Investments
|
9,948
|
|
—
|
|
—
|
|
9,948
|
|
||||||||
|
Foreign currency derivatives
|
—
|
|
3,801
|
|
—
|
|
3,801
|
|
||||||||
|
Other derivatives
|
—
|
|
6,174
|
|
30,891
|
|
37,065
|
|
||||||||
|
Liabilities:
|
||||||||||||||||
|
Foreign currency derivatives
|
$
|
—
|
|
$
|
4,475
|
|
$
|
—
|
|
$
|
4,475
|
|
||||
|
At December 31, 2016:
|
||||||||||||||||
|
Assets:
|
||||||||||||||||
|
Cash equivalents
|
$
|
65,384
|
|
$
|
—
|
|
$
|
—
|
|
$
|
65,384
|
|
||||
|
Interest rate swap contracts
|
—
|
|
1,471
|
|
—
|
|
1,471
|
|
||||||||
|
Foreign currency derivatives
|
—
|
|
6,096
|
|
—
|
|
6,096
|
|
||||||||
|
Other derivatives
|
—
|
|
—
|
|
12,308
|
|
12,308
|
|
||||||||
|
Liabilities:
|
||||||||||||||||
|
Interest rate swap contracts
|
$
|
—
|
|
$
|
762
|
|
$
|
—
|
|
$
|
762
|
|
||||
|
Foreign currency derivatives
|
—
|
|
3,147
|
|
—
|
|
3,147
|
|
||||||||
F-23
AMC NETWORKS INC. AND SUBSIDIARIES
NOTES TO CONSOLIDATED FINANCIAL STATEMENTS (Continued)
The Company's cash equivalents and available for sale securities are classified within Level I of the fair value hierarchy because they are valued using quoted market prices.
The Company's interest rate swap contracts, foreign currency derivatives and the embedded derivative for the interest on the RLJE Term Loans to be paid in shares of RLJE common stock (see Note
12
) are classified within Level II of the fair value hierarchy and their fair values are determined based on a market approach valuation technique that uses readily observable market parameters and the consideration of counterparty risk.
The RLJE Warrants held by the Company are classified within Level III of the fair value hierarchy and the Company determines the value of the RLJE Warrants using a Black Scholes option pricing model. Inputs to the model are stock price volatility, contractual warrant terms (remaining life of the warrants), exercise price, risk-free interest rate, and the RLJE stock price. The equity volatility used is based on the equity volatility of RLJE with an adjustment for the changes in the capital structure of RLJE. In arriving at the concluded value of the warrants, a discount for the lack of marketability (DLOM) of
32%
was applied. The DLOM, which is unobservable, is determined using the Finnerty Average-Strike Put Option Marketability Discount Model (Finnerty Model), which was applied with a security-specific volatility for the warrants. For the year ended December 31, 2017, the Company recorded a gain of
$20.2 million
related to the RLJE Warrants which is included in Miscellaneous, net in the consolidated statement of income.
At
December 31, 2017
, the Company does not have any other assets or liabilities measured at fair value on a recurring basis that would be considered Level III.
Fair value measurements are also used in nonrecurring valuations performed in connection with acquisition accounting. These nonrecurring valuations primarily include the valuation of affiliate and customer relationships intangible assets, advertiser relationship intangible assets and property and equipment. All of our nonrecurring valuations use significant unobservable inputs and therefore fall under Level III of the fair value hierarchy.
Credit Facility Debt and Senior Notes
The fair values of each of the Company's debt instruments are based on quoted market prices for the same or similar issues or on the current rates offered to the Company for instruments of the same remaining maturities.
The carrying values and estimated fair values of the Company's financial instruments, excluding those that are carried at fair value in the consolidated balance sheets are summarized as follows:
|
(In thousands)
|
December 31, 2017
|
||||||
|
Carrying
Amount
|
Estimated
Fair Value
|
||||||
|
Debt instruments:
|
|||||||
|
Term Loan A Facility
|
$
|
737,140
|
|
$
|
748,125
|
|
|
|
4.75% Notes due August 2025
|
784,757
|
|
793,000
|
|
|||
|
5.00% Notes due April 2024
|
984,056
|
|
1,012,500
|
|
|||
|
4.75% Notes due December 2022
|
593,304
|
|
612,750
|
|
|||
|
$
|
3,099,257
|
|
$
|
3,166,375
|
|
||
|
(In thousands)
|
December 31, 2016
|
||||||
|
Carrying
Amount |
Estimated
Fair Value |
||||||
|
Debt instruments:
|
|||||||
|
Term loan A facility
|
$
|
1,245,175
|
|
$
|
1,254,855
|
|
|
|
5.00% Notes due April 2024
|
981,949
|
|
1,002,500
|
|
|||
|
4.75% Notes due December 2022
|
592,139
|
|
606,000
|
|
|||
|
$
|
2,819,263
|
|
$
|
2,863,355
|
|
||
Fair value estimates related to the Company's debt instruments presented above are made at a specific point in time, based on relevant market information and information about the financial instrument. These estimates are subjective in nature and involve uncertainties and matters of significant judgments and therefore cannot be determined with precision. Changes in assumptions could significantly affect the estimates.
F-24
AMC NETWORKS INC. AND SUBSIDIARIES
NOTES TO CONSOLIDATED FINANCIAL STATEMENTS (Continued)
Note
12
. Derivative Financial Instruments
Interest Rate Risk
To manage interest rate risk, the Company enters into interest rate swap contracts to adjust the amount of total debt that is subject to variable interest rates. Such contracts effectively fix the borrowing rates on floating rate debt to limit the exposure against the risk of rising interest rates. The Company does not enter into interest rate swap contracts for speculative or trading purposes and it has only entered into interest rate swap contracts with financial institutions that it believes are creditworthy counterparties. The Company monitors the financial institutions that are counterparties to its interest rate swap contracts and to the extent possible diversifies its swap contracts among various counterparties to mitigate exposure to any single financial institution.
The Company's risk management objective and strategy with respect to interest rate swap contracts is to protect the Company against adverse fluctuations in interest rates by reducing its exposure to variability in cash flows relating to interest payments on a portion of its outstanding debt. The Company is meeting its objective by hedging the risk of changes in its cash flows (interest payments) attributable to changes in the LIBOR index rate, the designated benchmark interest rate being hedged (the "hedged risk"), on an amount of the Company's debt principal equal to the then-outstanding swap notional. The forecasted interest payments are deemed to be probable of occurring.
The Company assesses, both at the hedge's inception and on an ongoing basis, hedge effectiveness based on the overall changes in the fair value of the interest rate swap contracts. Hedge effectiveness of the interest rate swap contracts is based on a hypothetical derivative methodology. Any ineffective portion of an interest rate swap contract which is designated as a hedging instrument is recorded in current-period earnings. Changes in fair value of interest rate swap contracts not designated as hedging instruments are also recognized in earnings and included in interest expense.
As of
December 31, 2017
, the Company had interest rate swap contracts outstanding with notional amounts aggregating
$200.0 million
that are not designated as hedging instruments. The Company's outstanding interest rate swap contracts mature in October 2018.
Foreign Currency Exchange Rate Risk
We are exposed to foreign currency risk to the extent that we enter into transactions denominated in currencies other than our subsidiaries' respective functional currencies (non-functional currency risk), such as affiliation agreements, programming contracts, certain trade receivables and accounts payable (including intercompany amounts) that are denominated in a currency other than the applicable functional currency.
To manage foreign currency exchange rate risk, the Company may enter into foreign currency contracts from time to time with financial institutions to limit the exposure to fluctuations in foreign currency exchange rates. The Company does not enter into foreign currency contracts for speculative or trading purposes.
In certain circumstances, the Company enters into contracts that are settled in currencies other than the functional or local currencies of the contracting parties. Accordingly, these contracts consist of the underlying operational contract and an embedded foreign currency derivative element. Hedge accounting is not applied to the embedded foreign currency derivative element and changes in their fair values are included in miscellaneous, net in the consolidated statement of income.
Other Derivatives
The RLJE Warrants held by the Company meet the definition of a derivative and are included in other assets in the consolidated balance sheet. In addition, the interest on the RLJE Term Loans to be paid in shares of RLJE common stock is an embedded derivative. Both the RLJE Warrants and the embedded derivative for the future interest to be paid in shares of RLJE common stock are remeasured at the end of each period with changes in fair value recorded in the consolidated statement of income. For the year ended
December 31, 2017
, the Company recorded a gain of
$24.2 million
related to these derivatives, which is included in miscellaneous, net in the consolidated statements of income.
F-25
AMC NETWORKS INC. AND SUBSIDIARIES
NOTES TO CONSOLIDATED FINANCIAL STATEMENTS (Continued)
The fair values of the Company's derivative financial instruments included in the consolidated balance sheets are as follows:
|
(In thousands)
|
Balance Sheet Location
|
December 31,
|
|||||||
|
2017
|
2016
|
||||||||
|
Derivatives designated as hedging instruments:
|
|||||||||
|
Assets:
|
|||||||||
|
Interest rate swap contracts
|
Other assets
|
$
|
—
|
|
$
|
1,471
|
|
||
|
Derivatives not designated as hedging instruments:
|
|||||||||
|
Assets:
|
|||||||||
|
Foreign currency derivatives
|
Prepaid expenses and other current assets
|
943
|
|
1,684
|
|
||||
|
Foreign currency derivatives
|
Other assets
|
2,858
|
|
4,412
|
|
||||
|
Interest rate swap contracts
|
Other assets
|
1,444
|
|
—
|
|
||||
|
Other derivatives
|
Other assets
|
37,065
|
|
12,308
|
|
||||
|
Liabilities:
|
|||||||||
|
Interest rate swap contracts
|
Accrued liabilities
|
—
|
|
762
|
|
||||
|
Foreign currency derivatives
|
Accrued liabilities
|
1,223
|
|
952
|
|
||||
|
Foreign currency derivatives
|
Other liabilities
|
3,252
|
|
2,195
|
|
||||
The amount of the gains and losses related to the Company's derivative financial instruments designated as hedging instruments are as follows:
|
(In thousands)
|
Gain or (Loss) on Derivatives
Recognized in OCI |
Location of Gain or (Loss) in Earnings
|
Gain or (Loss) Reclassified
from Accumulated OCI into Earnings (a) |
||||||||||||||
|
Years Ended December 31,
|
Years Ended December 31,
|
||||||||||||||||
|
2017
|
2016
|
|
2017
|
2016
|
|||||||||||||
|
Derivatives in cash flow hedging relationships:
|
|||||||||||||||||
|
Interest rate swap contracts
|
$
|
565
|
|
$
|
(565
|
)
|
Interest expense
|
$
|
600
|
|
$
|
(587
|
)
|
||||
|
(a)
|
There were no gains or losses recognized in earnings related to any ineffective portion of the hedging relationship or related to any amount excluded from the assessment of hedge effectiveness for the years ended
December 31, 2017
and
2016
.
|
The amount of the gains and losses related to the Company's derivative financial instruments not designated as hedging instruments are as follows:
|
(In thousands)
|
Location of Gain (Loss) Recognized in Earnings on Derivatives
|
Amount of Gain (Loss) Recognized in Earnings
on Derivatives
|
|||||||
|
Years Ended December 31,
|
|||||||||
|
|
2017
|
2016
|
|||||||
|
Derivatives not designated as hedging relationships:
|
|||||||||
|
Interest rate swap contracts
|
Interest expense
|
$
|
3
|
|
$
|
(238
|
)
|
||
|
Foreign currency derivatives
|
Miscellaneous, net
|
(2,958
|
)
|
3,234
|
|
||||
|
Other derivatives
|
Miscellaneous, net
|
24,223
|
|
(892
|
)
|
||||
|
Total
|
$
|
21,268
|
|
$
|
2,104
|
|
|||
Operating Leases
Certain subsidiaries of the Company lease office space and equipment under long-term non-cancelable operating lease agreements which expire at various dates through
2027
. The leases generally provide for fixed annual rentals plus certain other
F-26
AMC NETWORKS INC. AND SUBSIDIARIES
NOTES TO CONSOLIDATED FINANCIAL STATEMENTS (Continued)
costs or credits. Costs associated with such operating leases are recognized on a straight-line basis over the initial lease term. The difference between rent expense and rent paid is recorded as deferred rent. Rent expense for the years ended
December 31, 2017
,
2016
and
2015
amounted to
$31.7 million
,
$29.4 million
and
$25.8 million
, respectively.
The future minimum annual payments for the Company's operating leases (with initial or remaining terms in excess of one year) during the next five years and thereafter, at rates now in force are as follows:
|
(In thousands)
|
|||
|
2018
|
$
|
28,895
|
|
|
2019
|
27,167
|
|
|
|
2020
|
25,539
|
|
|
|
2021
|
23,135
|
|
|
|
2022
|
24,852
|
|
|
|
Thereafter
|
105,153
|
|
|
Capital Leases
Future minimum capital lease payments as of
December 31, 2017
are as follows:
|
(In thousands)
|
|||
|
2018
|
$
|
7,901
|
|
|
2019
|
7,033
|
|
|
|
2020
|
5,983
|
|
|
|
2021
|
4,511
|
|
|
|
2022
|
4,539
|
|
|
|
Thereafter
|
14,447
|
|
|
|
Total minimum lease payments
|
44,414
|
|
|
|
Less amount representing interest (at 8.2%-12%)
|
(13,290
|
)
|
|
|
Present value of net minimum future capital lease payments
|
31,124
|
|
|
|
Less principal portion of current installments
|
(4,847
|
)
|
|
|
Long-term portion of obligations under capital leases
|
$
|
26,277
|
|
Note
14
. Income Taxes
The Tax Cuts and Jobs Act ("TCJA") was enacted on December 22, 2017. The TCJA introduces significant changes in tax law, for example, a reduction in the U.S. federal corporate tax rate from
35%
to
21%
, the requirement for companies to pay a one-time transition tax on earnings of certain foreign subsidiaries that were previously tax deferred and the creation of new taxes on certain foreign-sourced earnings. Companies are required to recognize the effect of tax law changes in the period of enactment, however, due to the complexities involved in accounting for the enactment of TCJA, SEC Staff Accounting Bulletin ("SAB") 118 allows us to record provisional amounts to reflect the impacts of the TCJA during a one-year "measurement period". The Company has recorded the following amounts as provisional due to on-going regulatory guidance, additional analysis and changes in interpretations and assumptions expected over the next twelve months.
The Company recorded a tax benefit of
$67.9 million
which represents the one-time impact of the change in the corporate tax rate on deferred tax assets and liabilities. Although the accounting related to the rate change is complete, we are still analyzing certain aspects of the TCJA and refining our calculations, which could potentially affect the measurement of these balances or potentially give rise to new deferred tax amounts.
The one-time transition tax is based on total post-1986 earnings and profits ("E&P") which the Company has previously deferred from U.S. income taxes. An estimated amount was recorded for the one-time transition tax liability, net of the foreign taxes deemed paid, resulting in an increase in income tax expense of
$11.0 million
. The Company has sufficient foreign tax credits to offset the transition tax, however, the Company has not yet completed its calculation of the total post-1986 foreign E&P for these foreign subsidiaries. Further, the transition tax is based in part on the amount of those earnings held in cash and other specified assets. This amount may change when the calculation of post-1986 foreign E&P previously deferred from U.S. federal taxation and the amounts held in cash or other specified assets are finalized.
F-27
AMC NETWORKS INC. AND SUBSIDIARIES
NOTES TO CONSOLIDATED FINANCIAL STATEMENTS (Continued)
The Company is still evaluating whether to change its indefinite reinvestment assertion due to certain provisions of the TCJA. Any potential changes to the assertion will be made within the measurement period and accounted for as part of the change in tax law.
The Company will continue to analyze the effects of the TCJA on its financial statements and operations. Additional impacts from the enactment of the TCJA will be recorded as they are identified during the measurement period as provided for in SAB 118.
Other significant provisions of TCJA that are not yet effective but may impact income taxes in future years include: the inclusion of commissions and performance based compensation in determining the executive compensation limitation, an exemption from U.S. tax on dividends of future foreign earnings, a reduced tax on excess returns of a U.S. corporation from foreign sales (i.e., foreign derived intangibles income or FDII), a minimum tax on certain foreign earnings in excess of 10 percent of the foreign subsidiaries tangible assets (i.e., global intangible low-taxed income or GILTI). The Company is still evaluating whether to make a policy election to treat the GILTI tax as a period expense or to provide U.S. deferred taxes on foreign temporary differences that are expected to generate GILTI income when they reverse in future years.
We estimate that the Bipartisan Budget Act of 2018, enacted on February 9, 2018, will reduce the Company’s current income tax liability and net deferred tax asset from the amounts reported at December 31, 2017 by approximately
$28.0 million
and
$19.0 million
, respectively, primarily as a result of the extension of the provision allowing a current tax deduction for the costs of certain television productions and the impact of the one-time change in the corporate tax rate on deferred tax assets and liabilities.
Income (loss) from continuing operations before income taxes consists of the following components:
|
(In thousands)
|
Years Ended December 31,
|
||||||||||
|
2017
|
2016
|
2015
|
|||||||||
|
Domestic
|
$
|
618,955
|
|
$
|
500,757
|
|
$
|
566,444
|
|
||
|
Foreign
|
21,423
|
|
(45,932
|
)
|
16,350
|
|
|||||
|
Total
|
$
|
640,378
|
|
$
|
454,825
|
|
$
|
582,794
|
|
||
Income tax expense attributable to continuing operations consists of the following components:
|
(In thousands)
|
Years Ended December 31,
|
||||||||||
|
2017
|
2016
|
2015
|
|||||||||
|
Current expense (benefit):
|
|||||||||||
|
Federal
|
$
|
162,639
|
|
$
|
120,634
|
|
$
|
146,915
|
|
||
|
State
|
14,301
|
|
11,252
|
|
15,713
|
|
|||||
|
Foreign
|
17,382
|
|
22,946
|
|
14,508
|
|
|||||
|
194,322
|
|
154,832
|
|
177,136
|
|
||||||
|
Deferred expense (benefit):
|
|||||||||||
|
Federal
|
(38,416
|
)
|
12,140
|
|
12,563
|
|
|||||
|
State
|
(2,436
|
)
|
2,515
|
|
1,300
|
|
|||||
|
Foreign
|
(7,813
|
)
|
(3,013
|
)
|
5,753
|
|
|||||
|
(48,665
|
)
|
11,642
|
|
19,616
|
|
||||||
|
Tax expense (benefit) relating to uncertain tax positions, including accrued interest
|
5,084
|
|
(1,612
|
)
|
4,338
|
|
|||||
|
Income tax expense
|
$
|
150,741
|
|
$
|
164,862
|
|
$
|
201,090
|
|
||
A reconciliation of the federal statutory income tax rate to the effective income tax rate is as follows:
F-28
AMC NETWORKS INC. AND SUBSIDIARIES
NOTES TO CONSOLIDATED FINANCIAL STATEMENTS (Continued)
|
(In thousands)
|
Years Ended December 31,
|
|||||||
|
2017
|
2016
|
2015
|
||||||
|
U.S. federal statutory income tax rate
|
35
|
%
|
35
|
%
|
35
|
%
|
||
|
State and local income taxes, net of federal benefit
|
2
|
|
2
|
|
2
|
|
||
|
Effect of foreign operations
|
(1
|
)
|
(1
|
)
|
(2
|
)
|
||
|
Effect of rate changes on deferred taxes
|
(11
|
)
|
—
|
|
—
|
|
||
|
Transition tax, net of foreign taxes deemed paid
|
2
|
|
—
|
|
—
|
|
||
|
Nontaxable income attributable to noncontrolling interests
|
(1
|
)
|
(1
|
)
|
(1
|
)
|
||
|
Changes in the valuation allowance
|
—
|
|
5
|
|
1
|
|
||
|
Domestic production activity deduction
|
(3
|
)
|
(3
|
)
|
(3
|
)
|
||
|
Tax expense relating to uncertain tax positions, including accrued interest, net of deferred tax benefits
|
1
|
|
(1
|
)
|
1
|
|
||
|
Other
|
—
|
|
—
|
|
1
|
|
||
|
Effective income tax rate
|
24
|
%
|
36
|
%
|
34
|
%
|
||
The tax effects of temporary differences that give rise to significant components of deferred tax assets or liabilities at
December 31, 2017
and
2016
are as follows:
|
(In thousands)
|
December 31,
|
||||||
|
2017
|
2016
|
||||||
|
Deferred Tax Asset (Liability)
|
|||||||
|
Noncurrent
|
|||||||
|
NOLs and tax credit carry forwards
|
$
|
69,771
|
|
$
|
82,636
|
|
|
|
Compensation and benefit plans
|
30,880
|
|
49,710
|
|
|||
|
Allowance for doubtful accounts
|
370
|
|
421
|
|
|||
|
Fixed assets and intangible assets
|
24,737
|
|
46,595
|
|
|||
|
Interest rate swap contracts
|
1,893
|
|
2,884
|
|
|||
|
Accrued interest expense
|
13,049
|
|
11,567
|
|
|||
|
Other liabilities
|
12,562
|
|
20,811
|
|
|||
|
Deferred tax asset
|
153,262
|
|
214,624
|
|
|||
|
Valuation allowance
|
(57,121
|
)
|
(71,563
|
)
|
|||
|
Net deferred tax asset, noncurrent
|
96,141
|
|
143,061
|
|
|||
|
Prepaid liabilities
|
(501
|
)
|
(819
|
)
|
|||
|
Fixed assets and intangible assets
|
(61,127
|
)
|
(78,616
|
)
|
|||
|
Investments in partnerships
|
(103,474
|
)
|
(177,376
|
)
|
|||
|
Other assets
|
(20,657
|
)
|
(23,444
|
)
|
|||
|
Deferred tax liability, noncurrent
|
(185,759
|
)
|
(280,255
|
)
|
|||
|
Total net deferred tax liability
|
$
|
(89,618
|
)
|
$
|
(137,194
|
)
|
|
At
December 31, 2017
, the Company had foreign tax credit carry forwards of approximately
$15.0 million
, expiring on various dates from
2024
through
2025
, and net operating loss carry forwards of approximately
$302.1 million
related primarily to our foreign subsidiaries. Although the net operating loss carry forward periods range from 5 years to unlimited, the deferred tax assets of approximately
$54.0 million
for these carry forwards have been reduced by a valuation allowance of approximately
$52.3 million
as it is more likely than not that these carry forwards will not be realized. The remainder of the valuation allowance at
December 31, 2017
relates primarily to deferred tax assets attributable to temporary differences of certain foreign subsidiaries for which it is more likely than not that these deferred tax assets will not be realized.
For the year ended
December 31, 2017
,
$1.6 million
relating to amortization of tax deductible second component goodwill was realized as a reduction in tax liability (as determined on a 'with-and-without' approach).
F-29
AMC NETWORKS INC. AND SUBSIDIARIES
NOTES TO CONSOLIDATED FINANCIAL STATEMENTS (Continued)
At
December 31, 2017
, the liability for uncertain tax positions was
$21.8 million
, excluding the related accrued interest liability of
$4.5 million
and deferred tax assets of
$4.9 million
. All of such unrecognized tax benefits, if recognized, would reduce the Company's income tax expense and effective tax rate.
A reconciliation of the beginning to ending amount of the liability for uncertain tax positions (excluding related accrued interest and deferred tax benefit) is as follows:
|
(In thousands)
|
|||
|
Balance at December 31, 2016
|
$
|
18,065
|
|
|
Increases related to current year tax positions
|
5,154
|
|
|
|
Increases related to prior year tax positions
|
293
|
|
|
|
Decreases related to prior year tax positions
|
(1,595
|
)
|
|
|
Decreases due to lapse of statute of limitations
|
(120
|
)
|
|
|
Balance at December 31, 2017
|
$
|
21,797
|
|
Interest expense (net of the related deferred tax benefit) of
$1.5 million
was recognized during the year ended
December 31, 2017
and is included in income tax expense in the consolidated statement of income. At
December 31, 2017
and
2016
, the liability for uncertain tax positions and related accrued interest noted above are included in other liabilities in the consolidated balance sheets.
Under the Company's Tax Disaffiliation Agreement with Cablevision, Cablevision is liable for all income taxes of the Company for periods prior to the spin-off from Cablevision except for New York City Unincorporated Business Tax. The City of New York is currently auditing the Company's General Corporation Tax Return for years 2011 and 2012 and the State of New York is currently auditing the Company's General Business Corporation Franchise Tax Returns for years 2013 and 2014. The State of Georgia is currently auditing the Company's Corporation Tax Returns for years 2013 through 2015. The State of California is currently auditing the Company's California Corporation Franchise or Income Tax Returns for the years 2011 through 2013. The State of Wisconsin is currently auditing the Company's Combined Corporation Franchise or Income Tax Returns for the years 2011 through 2015. The State of Illinois is currently auditing the Company's Corporation Income and Replacement Tax Returns for years 2014 and 2015.
Commitments
|
(In thousands)
|
Payments due by period
|
||||||||||||||||||
|
Total
|
Year 1
|
Years
2 - 3
|
Years
4 - 5
|
More than
5 years
|
|||||||||||||||
|
Purchase obligations (1)
|
$
|
1,983,967
|
|
$
|
705,387
|
|
$
|
621,937
|
|
$
|
186,377
|
|
$
|
470,266
|
|
||||
|
Guarantees (2)
|
160,024
|
|
160,024
|
|
—
|
|
—
|
|
—
|
|
|||||||||
|
Total
|
$
|
2,143,991
|
|
$
|
865,411
|
|
$
|
621,937
|
|
$
|
186,377
|
|
$
|
470,266
|
|
||||
|
(1)
|
Purchase obligations consist primarily of program rights obligations, participations and residuals, and transmission and marketing commitments.
|
|
(2)
|
Consists primarily of a guarantee of payments to a production service company for certain production related costs.
|
Legal Matters
On December 17, 2013, Frank Darabont ("Darabont"), Ferenc, Inc., Darkwoods Productions, Inc., and Creative Artists Agency, LLC (together, the "2013 Plaintiffs"), filed a complaint in New York Supreme Court in connection with Darabont's rendering services as a writer, director and producer of the television series entitled
The Walking Dead
and the agreement between the parties related thereto. The Plaintiffs asserted claims for breach of contract, breach of the covenant of good faith and fair dealing, for an accounting and for declaratory relief. On August 19, 2015, Plaintiffs filed their First Amended Complaint (the "Amended Complaint"), in which they retracted their claims for wrongful termination and failure to apply production tax credits in calculating Plaintiffs' contingent compensation. Plaintiffs also added a claim that Darabont is entitled to a larger share, on a percentage basis, of contingent compensation than he is currently being accorded. On September 26, 2016, Plaintiffs filed their note of issue and certificate of readiness for trial, which included a claim for damages of
$280 million
or more and indicated that the parties have completed fact and expert discovery. The parties each filed motions for summary judgment. Oral arguments of the summary judgment motions took place on September 15, 2017. The Court has not yet ruled on the summary judgment motions. The Company
F-30
AMC NETWORKS INC. AND SUBSIDIARIES
NOTES TO CONSOLIDATED FINANCIAL STATEMENTS (Continued)
has opposed Plaintiffs' claims. The Company believes that the asserted claims are without merit, denies the allegations and continues to defend the case vigorously. At this time, no determination can be made as to the ultimate outcome of this litigation or the potential liability, if any, on the part of the Company.
On August 14, 2017, Robert Kirkman, Robert Kirkman, LLC, Glen Mazzara, 44 Strong Productions, Inc., David Alpert, Circle of Confusion Productions, LLC, New Circle of Confusion Productions, Inc., Gale Anne Hurd, and Valhalla Entertainment, Inc. f/k/a Valhalla Motion Pictures, Inc. (together, the “California Plaintiffs”) filed a complaint in California Superior Court in connection with California Plaintiffs’ rendering of services as writers and producers of the television series entitled
The Walking Dead
, as well as
Fear the Walking Dead
and/or
Talking Dead
, and the agreements between the parties related thereto (the "California Action"). The California Plaintiffs asserted that the Company has been improperly underpaying the California Plaintiffs under their contracts with the Company and they assert claims for breach of contract, breach of the covenant of good faith and fair dealing, inducing breach of contract, and liability for violation of Cal. Bus. & Prof. Code § 17200. On August 15, 2017, two of the California Plaintiffs, Gale Anne Hurd and David Alpert (and their associated production companies), along with Charles Eglee and his production company, United Bongo Drum, Inc., filed a complaint in New York Supreme Court alleging nearly identical claims as the California Action (the "New York Action"). Hurd, Alpert, and Eglee filed the New York Action in connection with their contract claims involving
The Walking Dead
because their agreements contained exclusive New York jurisdiction provisions. On October 23, 2017, the parties stipulated to discontinuing the New York Action without prejudice and consolidating all of the claims in the California Action. The California Plaintiffs seek compensatory and punitive damages and restitution. While answers and/or responsive motions have yet to be filed, the Company believes that the asserted claims are without merit and will vigorously defend against them. At this time, no determination can be made as to the ultimate outcome of this litigation or the potential liability, if any, on the part of the Company.
On January 18, 2018, the 2013 Plaintiffs filed a second action in New York Supreme Court in connection with Darabont’s services on
The Walking Dead
television series and agreements between the parties related thereto. The claims in the action allegedly arise from Plaintiffs' audit of their participation statements covering the accounting period from inception of
The Walking Dead
through September 30, 2014. Plaintiffs seek no less than
$20 million
in damages on claims for breach of contract, breach of the covenant of good faith and fair dealing, and declaratory relief. Plaintiffs also seek a judicial determination that their contracts with the Company entitle them to an "actual fair market license fee" in connection with AMC Networks telecasting of
The Walking Dead
, which they allege is "substantially better than" what they received. The Company has not yet responded to the Complaint, and it has not yet been determined to what extent, if any, this action will be consolidated with the action Plaintiffs filed in the New York Supreme Court on December 17, 2013. The Company believes that the asserted claims are without merit, denies the allegations and will defend the case vigorously. At this time, no determination can be made as to the ultimate outcome of this litigation or the potential liability, if any, on the part of the Company.
The Company is party to various lawsuits and claims in the ordinary course of business, including the matters described above. Although the outcome of these matters cannot be predicted with certainty and while the impact of these matters on the Company's results of operations in any particular subsequent reporting period could be material, management does not believe that the resolution of these matters will have a material adverse effect on the financial position of the Company or the ability of the Company to meet its financial obligations as they become due.
In 2014, the Company, through a wholly-owned subsidiary, acquired 49.9% of the limited liability company interests of New Video Channel America L.L.C, that owns the cable channel BBC AMERICA. In connection with acquisition, the terms of the agreement provide BBC Worldwide Americas, Inc. with a right to put all of its
50.1%
noncontrolling interest to the Company at the greater of the then fair value or the fair value of the initial equity interest at inception. The put option is exercisable on the fifteenth and twenty-fifth year anniversary of the joint venture agreement.
In connection with the creation of another joint venture entity in 2013, the terms of the agreement provide the noncontrolling member with a right to put all of its interest to the Company at the then fair value.
Because exercise of these put rights is outside the Company's control, the noncontrolling interest in each entity is presented as redeemable noncontrolling interest outside of stockholders' equity (deficiency) on the Company's consolidated balance sheet. The activity reflected within redeemable noncontrolling interest for the year ended
December 31, 2017
and
2016
is presented below.
F-31
AMC NETWORKS INC. AND SUBSIDIARIES
NOTES TO CONSOLIDATED FINANCIAL STATEMENTS (Continued)
|
(In thousands)
|
Redeemable Noncontrolling Interest
|
||
|
December 31, 2015
|
$
|
211,691
|
|
|
Net earnings
|
16,669
|
|
|
|
Distributions
|
(9,010
|
)
|
|
|
Other
|
(19
|
)
|
|
|
December 31, 2016
|
$
|
219,331
|
|
|
Net earnings
|
17,797
|
|
|
|
Distributions
|
(18,561
|
)
|
|
|
Other
|
37
|
|
|
|
December 31, 2017
|
$
|
218,604
|
|
In 2011, the Company adopted the AMC Networks Inc. 2011 Stock Plan for Non-Employee Directors (the "2011 Non-Employee Director Plan") and the AMC Networks Inc. 2011 Cash Incentive Plan (the "2011 Cash Incentive Plan"). All Plans were amended and restated and approved by the Company's shareholders on June 5, 2012. On June 8, 2016, the Company's shareholders approved the AMC Networks Inc. 2016 Employee Stock Plan (the "2016 Employee Stock Plan") and the AMC Networks Inc. 2016 Executive Cash Incentive Plan (the "2016 Cash Incentive Plan"). Upon approval of the 2016 Employee Stock Plan, all remaining available share authorization under the Company's 2011 Employee Stock Plan was canceled, other than those shares subject to outstanding grants of restricted stock units and options. Beginning with awards in 2016, the Company's long-term incentive program was modified and the Company issued performance restricted stock units ("PRSUs") whereas in prior years, long-term cash performance awards were issued.
Equity Plans
The 2016 Employee Stock Plan provides for the grants of incentive stock options, non-qualified stock options, stock appreciation rights, restricted shares, restricted stock units and other equity-based awards (collectively, "awards"). Under the 2016 Employee Stock Plan, the Company may grant awards for up to
6,000,000
shares of AMC Networks Class A Common Stock (subject to certain adjustments). Equity-based awards granted under the 2016 Employee Stock Plan must be granted with an exercise price of not less than the fair market value of a share of AMC Networks Class A Common Stock on the date of grant and must expire no later than
10
years from the date of grant. The terms and conditions of awards granted under the 2016 Employee Stock Plan, including vesting and exercisability, are determined by the Compensation Committee of the Board of Directors ("Compensation Committee") and may include terms or conditions based upon performance criteria.
Awards issued to employees under the 2016 Employee Stock Plan will settle in shares of the Company's Class A Common Stock (either from treasury or with newly issued shares), or, at the option of the Compensation Committee, in cash. As of
December 31, 2017
, there are
3,814,797
share awards available for future grant under the 2016 Employee Stock Plan. For the purpose of calculating the remaining shares available for issuance under the 2016 Employee Stock Plan, awards containing performance criteria are excluded based on the maximum potential performance target that can be achieved.
Under the 2011 Non-Employee Director Plan, the Company is authorized to grant non-qualified stock options, restricted stock units, restricted shares, stock appreciation rights and other equity-based awards. The Company may grant awards for up to
465,000
shares of AMC Networks Class A Common Stock (subject to certain adjustments). Stock options under the 2011 Non-Employee Director Plan must be granted with an exercise price of not less than the fair market value of a share of AMC Networks Class A Common Stock on the date of grant and must expire no later than
10
years from the date of grant. The terms and conditions of awards granted under the 2011 Non-Employee Director Plan, including vesting and exercisability, are determined by the Compensation Committee. Unless otherwise provided in an applicable award agreement, stock options granted under this plan will be fully vested and exercisable, and restricted stock units granted under this plan will be fully vested, upon the date of grant and will settle in shares of the Company's Class A Common Stock (either from treasury or with newly issued shares), or, at the option of the Compensation Committee, in cash, on the first business day after ninety days from the date the director's service on the Board of Directors ceases or, if earlier, upon the director's death. As of
December 31, 2017
, there are
188,233
shares available for future grant under the 2011 Non-Employee Director Plan.
F-32
AMC NETWORKS INC. AND SUBSIDIARIES
NOTES TO CONSOLIDATED FINANCIAL STATEMENTS (Continued)
Restricted Stock Unit Activity
The following table summarizes activity relating to Company employees who held AMC Networks restricted stock units for the year ended
December 31, 2017
:
|
Number of
Restricted
Stock Units
|
Number of
Performance
Restricted
Stock Units
|
Weighted Average
Fair Value Per Stock Unit at Date of Grant
|
|||||||
|
Unvested award balance, December 31, 2015
|
853,386
|
|
683,393
|
|
$
|
70.07
|
|
||
|
Granted
|
493,659
|
|
767,693
|
|
$
|
60.73
|
|
||
|
Released/Vested
|
(257,114
|
)
|
(79,321
|
)
|
$
|
61.28
|
|
||
|
Canceled/Forfeited
|
(107,633
|
)
|
(17,304
|
)
|
$
|
71.19
|
|
||
|
Unvested award balance, December 31, 2016
|
982,298
|
|
1,354,461
|
|
$
|
66.23
|
|
||
|
Granted
|
586,600
|
|
642,139
|
|
$
|
59.78
|
|
||
|
Released/Vested
|
(392,892
|
)
|
(164,926
|
)
|
$
|
71.48
|
|
||
|
Canceled/Forfeited
|
(55,965
|
)
|
(15,527
|
)
|
$
|
68.15
|
|
||
|
Unvested award balance, December 31, 2017
|
1,120,041
|
|
1,816,147
|
|
$
|
62.53
|
|
||
During 2017, the Company issued
586,600
restricted stock units and
642,139
performance restricted stock units to certain executive officers and employees under the 2016 Employee Stock Plan. All restricted stock units granted during 2017 vest ratably over a
three
-year period.
The target number of PRSUs granted represents the right to receive a corresponding number of shares, subject to adjustment based on the performance of the Company against target performance criteria for a
three
year period. The number of shares issuable at the end of the applicable measurement period ranges from
0%
to
200%
of the target PRSU award.
The following table summarizes activity relating to Non-employee Directors who held AMC Networks restricted stock units for the year ended
December 31, 2017
:
|
Number of
Restricted
Stock Units
|
Weighted Average
Fair Value Per Stock Unit at Date of Grant |
|||||
|
Vested award balance, December 31, 2015
|
127,555
|
|
$
|
51.33
|
|
|
|
Granted
|
27,066
|
|
$
|
61.69
|
|
|
|
Released/Vested
|
—
|
|
$
|
—
|
|
|
|
Vested award balance, December 31, 2016
|
154,621
|
|
$
|
53.15
|
|
|
|
Granted
|
32,825
|
|
$
|
53.48
|
|
|
|
Released/Vested
|
—
|
|
$
|
—
|
|
|
|
Vested award balance, December 31, 2017
|
187,446
|
|
$
|
53.20
|
|
|
F-33
AMC NETWORKS INC. AND SUBSIDIARIES
NOTES TO CONSOLIDATED FINANCIAL STATEMENTS (Continued)
Stock Option Award Activity
The following table summarizes activity relating to employees of the Company who held unvested AMC Networks stock options for the year ended
December 31, 2017
:
|
|
Shares Under Option
|
Weighted
Average
Exercise Price
Per Share
|
Weighted
Average
Contractual
Term
(in years)
|
Aggregate
Intrinsic
Value(a)
|
||||||||
|
|
Time
Vesting
Options
|
|||||||||||
|
Balance, December 31, 2015
|
—
|
|
$
|
—
|
|
|
|
|
||||
|
Granted
|
388,385
|
|
$
|
48.26
|
|
|||||||
|
Balance, December 31, 2016
|
388,385
|
|
$
|
48.26
|
|
9.79
|
$
|
1,585
|
|
|||
|
Granted
|
—
|
|
$
|
—
|
|
|||||||
|
Balance, December 31, 2017
|
388,385
|
|
$
|
48.26
|
|
8.79
|
$
|
2,260
|
|
|||
|
Options exercisable at December 31, 2017
|
129,462
|
|
$
|
48.26
|
|
8.79
|
$
|
753
|
|
|||
|
Options expected to vest in the future
|
258,923
|
|
$
|
48.26
|
|
8.79
|
$
|
1,507
|
|
|||
|
(a)
|
The aggregate intrinsic value is calculated as the difference between (i) the exercise price of the underlying award and (ii) the quoted price of AMC Networks Class A Common Stock on
December 31, 2017
or
December 31, 2016
, as indicated.
|
Share-based Compensation Expense
The Company recorded share-based compensation expense of
$53.5 million
,
$38.9 million
and
$31.0 million
reduced for forfeitures for the years ended
December 31, 2017
,
2016
and
2015
. Forfeitures are estimated based on historical experience. To the extent actual results of forfeitures differ from those estimates, such amounts are recorded as an adjustment in the period the estimates are revised.
Share-based compensation expense is recognized in the consolidated statements of income as part of selling, general and administrative expenses. As of
December 31, 2017
, there was
$94.5 million
of total unrecognized share-based compensation costs related to Company employees who held unvested AMC Networks restricted stock units and options. The unrecognized compensation cost is expected to be recognized over a weighted-average remaining period of approximately
2.5 years
. There were no costs related to share-based compensation that were capitalized.
The Company receives income tax deductions related to restricted stock units, stock options or other equity awards granted to its employees by the Company. The Company uses the 'with-and-without' approach to determine the recognition and measurement of excess tax benefits and deficiencies.
Cash flows resulting from excess tax benefits and deficiencies are classified along with other income tax cash flows as an operating activity for the year ended
December 31, 2017
and as cash flows from financing activities for the years ended December 31,
2016
and
2015
. Excess tax benefits are realized tax benefits from tax deductions for options exercised and restricted shares issued, in excess of the deferred tax asset attributable to stock compensation costs for such awards. Excess tax deficiencies are realized deficiencies from tax deductions being less than the deferred tax asset. Excess tax deficiencies of
$2.2 million
and excess tax benefits of
$0.8 million
and
$4.6 million
were recorded for the years ended
December 31, 2017
,
2016
and
2015
, respectively.
Long-Term Incentive Plans
Under the terms of the 2011 Cash Incentive Plan and 2016 Cash Incentive Plan, the Company is authorized to grant a cash award to certain employees. The terms and conditions of such awards are determined by the Compensation Committee of the Company's Board of Directors, may include the achievement of certain performance criteria and may extend for a period not to exceed ten years. In 2016, the Company's long-term incentive program was modified and the Company issued PRSUs whereas long-term cash performance awards were issued in prior years.
In connection with the long-term incentive awards outstanding, the Company recorded expense of
$7.5 million
,
$15.1 million
and
$30.5 million
for the years ended
December 31, 2017
,
2016
and
2015
respectively. Liabilities for long-term incentive awards of
$24.3 million
and
$44.8 million
are included in accrued liabilities and other liabilities in the consolidated balance sheets at
December 31, 2017
and
2016
, respectively. The Company has accrued the amount earned that it currently believes will ultimately be paid based upon the performance criteria established for these performance-based awards.
F-34
AMC NETWORKS INC. AND SUBSIDIARIES
NOTES TO CONSOLIDATED FINANCIAL STATEMENTS (Continued)
Certain employees of the Company participate in the AMC Networks 401(k) Savings Plan (the "401(k) Plan"), a qualified defined contribution plan, and the AMC Networks Excess Savings Plan (the "Excess Savings Plan"), a non-qualified deferred compensation plan. Under the 401(k) Plan, participating Company employees may contribute into their plan accounts a percentage of their eligible pay on a before-tax basis as well as a percentage of their eligible pay on an after-tax basis. The Company makes matching contributions on behalf of participating employees in accordance with the terms of the 401(k) Plan. In addition to the matching contribution, the Company may make a discretionary year-end contribution to employee 401(k) Plan accounts up to
4%
of eligible compensation, subject to certain conditions. The Company provides a matching contribution to the Excess Savings Plan similar to the 401(k) Plan.
Total expense related to all benefit plans was
$9.1 million
,
$10.9 million
and
$13.5 million
for the years ended
December 31, 2017
,
2016
and
2015
, respectively. The Company does not provide postretirement benefits for any of its employees.
On June 30, 2011, Cablevision spun off the Company (the "Distribution") and the Company became an independent public company. At the time of the Distribution, both Cablevision and AMC Networks were controlled by Charles F. Dolan, certain members of his immediate family and certain family related entities (collectively the "Dolan Family").
Members of the Dolan Family, for purposes of Section 13(d) of the Securities Exchange Act of 1934, as amended, including trusts for the benefit of the Dolan Family, collectively beneficially own all of the Company's outstanding Class B Common Stock and own approximately
2%
of the Company's outstanding Class A Common Stock. Such shares of the Company's Class A Common Stock and Class B Common Stock, collectively, represent approximately
71%
of the aggregate voting power of the Company's outstanding common stock. Members of the Dolan Family are also the controlling stockholders of The Madison Square Garden Company ("MSG") and MSG Networks Inc. ("MSG Networks"). Prior to June 21, 2016, members of the Dolan Family were also the controlling stockholders of Cablevision.
On June 21, 2016, Cablevision was acquired by a subsidiary of Altice N.V. and a change in control occurred which resulted in members of the Dolan Family no longer being controlling stockholders of the surviving company, Altice USA. Accordingly, Altice USA is not a related party of AMC Networks.
In connection with the Distribution, the Company entered into various agreements with Cablevision that govern certain of the Company's relationships with Cablevision subsequent to the Distribution. These agreements include arrangements with respect to transition services and a number of on-going commercial relationships. The distribution agreement includes an agreement that the Company and Cablevision agree to provide each other with indemnities with respect to liabilities arising out of the businesses Cablevision transferred to the Company. In addition, the Company provides services to and receives services from MSG and MSG Networks.
Revenues, net
The Company recorded affiliation fee revenues earned under affiliation agreements with subsidiaries of Cablevision. In addition, AMC Networks Broadcasting & Technology has entered into agreements with MSG Networks to provide various transponder, technical and support services through 2020. Revenues, net from related parties amounted to
$6.2 million
,
$15.9 million
, and
$27.5 million
for the years ended
December 31, 2017
,
2016
and
2015
, respectively.
Selling, General and Administrative
Amounts charged to the Company, included in selling, general and administrative expenses, pursuant to a transition services agreement and for other transactions with its related parties amounted to
$1.5 million
,
$3.1 million
and
$4.9 million
for the years ended
December 31, 2017
,
2016
and
2015
, respectively.
In connection with the Distribution, Cablevision and AMC Networks entered into a transition services agreement under which, in exchange for the fees specified in such agreement, Cablevision agreed to provide transition services with regard to such areas as accounting, information systems, risk management and employee services, compensation and benefits. Under the transition services agreement, AMC Networks also provides certain services to Cablevision and MSG on behalf of Cablevision. This agreement was terminated effective June 21, 2016.
On June 16, 2016, AMC Networks entered into an arrangement with the Dolan Family Office, LLC ("DFO"), MSG and MSG Networks providing for the sharing of certain expenses associated with executive office space which will be available to Charles F. Dolan (the Executive Chairman and a director of the Company and a director of MSG and MSG Networks), James L. Dolan (the Executive Chairman and a director of MSG and MSG Networks and a director of the Company), and the DFO which is controlled by Charles F. Dolan. The Company's share of initial set-up costs and office expenses is not material.
F-35
AMC NETWORKS INC. AND SUBSIDIARIES
NOTES TO CONSOLIDATED FINANCIAL STATEMENTS (Continued)
During
2017
,
2016
and
2015
, the Company's non-cash investing and financing activities and other supplemental data were as follows:
|
(In thousands)
|
Years Ended December 31,
|
|||||||
|
2017
|
2016
|
2015
|
||||||
|
Non-Cash Investing and Financing Activities:
|
||||||||
|
Continuing Operations:
|
||||||||
|
Increase in capital lease obligations
|
—
|
|
10,982
|
|
6,191
|
|
||
|
Treasury stock not yet settled
|
995
|
|
10,454
|
|
—
|
|
||
|
Exercise of RLJE Warrants
|
5,001
|
|
—
|
|
—
|
|
||
|
Capital expenditures incurred but not yet paid
|
5,889
|
|
6,988
|
|
6,423
|
|
||
|
Supplemental Data:
|
||||||||
|
Cash interest paid—continuing operations
|
110,650
|
|
128,319
|
|
120,394
|
|
||
|
Income taxes paid, net—continuing operations
|
219,425
|
|
106,476
|
|
186,725
|
|
||
The following table details the components of accumulated other comprehensive loss:
|
(In thousands)
|
Year Ended December 31, 2017
|
||||||||||||||
|
Currency Translation Adjustment
|
Gains (Losses) on Cash Flow Hedges
|
Gains (Losses) on Available for Sale Investments
|
Accumulated Other Comprehensive Loss
|
||||||||||||
|
Beginning Balance
|
$
|
(194,189
|
)
|
$
|
391
|
|
$
|
—
|
|
$
|
(193,798
|
)
|
|||
|
Other comprehensive loss before reclassifications
|
76,023
|
|
565
|
|
5,398
|
|
81,986
|
|
|||||||
|
Amounts reclassified from accumulated other comprehensive loss
|
—
|
|
(600
|
)
|
—
|
|
(600
|
)
|
|||||||
|
Net current-period other comprehensive (loss) income, before income taxes
|
76,023
|
|
(35
|
)
|
5,398
|
|
81,386
|
|
|||||||
|
Income tax expense
|
—
|
|
13
|
|
(1,987
|
)
|
(1,974
|
)
|
|||||||
|
Net current-period other comprehensive (loss) income, net of income taxes
|
76,023
|
|
(22
|
)
|
3,411
|
|
79,412
|
|
|||||||
|
Ending Balance
|
$
|
(118,166
|
)
|
$
|
369
|
|
$
|
3,411
|
|
$
|
(114,386
|
)
|
|||
|
(In thousands)
|
Year Ended December 31, 2016
|
||||||||||
|
Currency Translation Adjustment
|
Gains (Losses) on Cash Flow Hedges
|
Accumulated Other Comprehensive Loss
|
|||||||||
|
Beginning Balance
|
$
|
(136,434
|
)
|
$
|
377
|
|
$
|
(136,057
|
)
|
||
|
Other comprehensive loss before reclassifications
|
(45,426
|
)
|
(565
|
)
|
(45,991
|
)
|
|||||
|
Amounts reclassified from accumulated other comprehensive loss
|
—
|
|
587
|
|
587
|
|
|||||
|
Net current-period other comprehensive (loss) income, before income taxes
|
(45,426
|
)
|
22
|
|
(45,404
|
)
|
|||||
|
Income tax expense
|
(12,329
|
)
|
(8
|
)
|
(12,337
|
)
|
|||||
|
Net current-period other comprehensive (loss) income, net of income taxes
|
(57,755
|
)
|
14
|
|
(57,741
|
)
|
|||||
|
Ending Balance
|
$
|
(194,189
|
)
|
$
|
391
|
|
$
|
(193,798
|
)
|
||
F-36
AMC NETWORKS INC. AND SUBSIDIARIES
NOTES TO CONSOLIDATED FINANCIAL STATEMENTS (Continued)
Amounts reclassified to net earnings for gains and losses on cash flow hedges designated as hedging instruments are included in interest expense in the consolidated statements of income.
Note
22
. Segment Information
The Company classifies its operations into
two
operating segments: National Networks and International and Other. These operating segments represent strategic business units that are managed separately.
The Company generally allocates all corporate overhead costs within operating expenses to the Company's
two
operating segments based upon their proportionate estimated usage of services, including such costs as executive salaries and benefits, costs of maintaining corporate headquarters, facilities and common support functions (such as human resources, legal, finance, strategic planning and information technology) as well as sales support functions and creative and production services.
The Company evaluates segment performance based on several factors, of which the primary financial measure is operating segment adjusted operating income ("AOI"), a non-GAAP measure, defined as operating income (loss) before depreciation and amortization, share-based compensation expense or benefit, impairment and related charges (including gains or losses on sales or dispositions of businesses), and restructuring expense or credit. The Company has presented the components that reconcile adjusted operating income to operating income, an accepted GAAP measure, and other information as to the continuing operations of the Company's operating segments below.
|
(In thousands)
|
Year Ended December 31, 2017
|
||||||||||||||
|
National
Networks
|
International
and Other
|
Inter-segment
eliminations
|
Consolidated
|
||||||||||||
|
Revenues, net
|
|||||||||||||||
|
Advertising
|
$
|
959,551
|
|
$
|
89,894
|
|
$
|
—
|
|
$
|
1,049,445
|
|
|||
|
Distribution
|
1,408,064
|
|
367,288
|
|
(19,106
|
)
|
1,756,246
|
|
|||||||
|
Consolidated revenues, net
|
$
|
2,367,615
|
|
$
|
457,182
|
|
$
|
(19,106
|
)
|
$
|
2,805,691
|
|
|||
|
Operating income (loss)
|
$
|
817,566
|
|
$
|
(88,894
|
)
|
$
|
(6,313
|
)
|
$
|
722,359
|
|
|||
|
Share-based compensation expense
|
43,697
|
|
9,848
|
|
—
|
|
53,545
|
|
|||||||
|
Restructuring (credit) expense
|
(53
|
)
|
6,181
|
|
—
|
|
6,128
|
|
|||||||
|
Impairment and related charges
|
—
|
|
28,148
|
|
—
|
|
28,148
|
|
|||||||
|
Depreciation and amortization
|
33,702
|
|
60,936
|
|
—
|
|
94,638
|
|
|||||||
|
Adjusted operating income
|
$
|
894,912
|
|
$
|
16,219
|
|
$
|
(6,313
|
)
|
$
|
904,818
|
|
|||
|
Capital expenditures
|
$
|
25,333
|
|
$
|
54,716
|
|
$
|
—
|
|
$
|
80,049
|
|
|||
|
(In thousands)
|
Year Ended December 31, 2016
|
||||||||||||||
|
National
Networks
|
International
and Other
|
Inter-segment
eliminations
|
Consolidated
|
||||||||||||
|
Revenues, net
|
|||||||||||||||
|
Advertising
|
$
|
990,508
|
|
$
|
94,467
|
|
$
|
(1,000
|
)
|
$
|
1,083,975
|
|
|||
|
Distribution
|
1,320,532
|
|
365,529
|
|
(14,382
|
)
|
1,671,679
|
|
|||||||
|
Consolidated revenues, net
|
$
|
2,311,040
|
|
$
|
459,996
|
|
$
|
(15,382
|
)
|
$
|
2,755,654
|
|
|||
|
Operating income (loss)
|
$
|
784,027
|
|
$
|
(120,914
|
)
|
$
|
(5,557
|
)
|
$
|
657,556
|
|
|||
|
Share-based compensation expense
|
30,569
|
|
8,328
|
|
—
|
|
38,897
|
|
|||||||
|
Restructuring expense
|
8,516
|
|
20,987
|
|
—
|
|
29,503
|
|
|||||||
|
Impairment and related charges
|
—
|
|
67,805
|
|
—
|
|
67,805
|
|
|||||||
|
Depreciation and amortization
|
32,376
|
|
52,402
|
|
—
|
|
84,778
|
|
|||||||
|
Adjusted operating income
|
$
|
855,488
|
|
$
|
28,608
|
|
$
|
(5,557
|
)
|
$
|
878,539
|
|
|||
|
Capital expenditures
|
$
|
15,947
|
|
$
|
63,273
|
|
$
|
—
|
|
$
|
79,220
|
|
|||
F-37
AMC NETWORKS INC. AND SUBSIDIARIES
NOTES TO CONSOLIDATED FINANCIAL STATEMENTS (Continued)
|
(In thousands)
|
Year Ended December 31, 2015
|
||||||||||||||
|
National
Networks
|
International
and Other
|
Inter-segment
eliminations
|
Consolidated
|
||||||||||||
|
Revenues, net
|
|||||||||||||||
|
Advertising
|
$
|
945,288
|
|
$
|
82,972
|
|
$
|
—
|
|
$
|
1,028,260
|
|
|||
|
Distribution
|
1,190,079
|
|
369,606
|
|
(7,010
|
)
|
1,552,675
|
|
|||||||
|
Consolidated revenues, net
|
$
|
2,135,367
|
|
$
|
452,578
|
|
$
|
(7,010
|
)
|
$
|
2,580,935
|
|
|||
|
Operating income (loss)
|
$
|
754,243
|
|
$
|
(42,542
|
)
|
$
|
(2,508
|
)
|
$
|
709,193
|
|
|||
|
Share-based compensation expense
|
23,814
|
|
7,206
|
|
—
|
|
31,020
|
|
|||||||
|
Restructuring expense
|
3,194
|
|
11,804
|
|
—
|
|
14,998
|
|
|||||||
|
Depreciation and amortization
|
29,742
|
|
53,289
|
|
—
|
|
83,031
|
|
|||||||
|
Adjusted operating income
|
$
|
810,993
|
|
$
|
29,757
|
|
$
|
(2,508
|
)
|
$
|
838,242
|
|
|||
|
Capital expenditures
|
$
|
24,386
|
|
$
|
43,935
|
|
$
|
—
|
|
$
|
68,321
|
|
|||
Inter-segment eliminations are primarily licensing revenues recognized between the National Networks and International and Other segments as well as revenues recognized by AMC Networks Broadcasting & Technology for transmission revenues recognized from the International and Other operating segment.
|
(In thousands)
|
Years Ended December 31,
|
||||||||||
|
2017
|
2016
|
2015
|
|||||||||
|
Inter-segment revenues
|
|||||||||||
|
National Networks
|
$
|
(17,634
|
)
|
$
|
(14,963
|
)
|
$
|
(6,719
|
)
|
||
|
International and Other
|
(1,472
|
)
|
(419
|
)
|
(291
|
)
|
|||||
|
$
|
(19,106
|
)
|
$
|
(15,382
|
)
|
$
|
(7,010
|
)
|
|||
One
customer primarily within the National Networks segment accounted for approximately
11%
of consolidated revenues, net for the years ended
December 31, 2017
and
2016
. No customers accounted for more than
10%
of revenues, net for the year ended December 31,
2015
.
The table below summarizes revenue based on customer location:
|
(In thousands)
|
Year Ended December 31, 2017
|
Year Ended December 31, 2016
|
|||||
|
Revenue
|
|||||||
|
United States
|
$
|
2,244,057
|
|
$
|
2,215,430
|
|
|
|
Europe
|
369,815
|
|
384,234
|
|
|||
|
Other
|
191,819
|
|
155,990
|
|
|||
|
$
|
2,805,691
|
|
$
|
2,755,654
|
|
||
The table below summarizes property and equipment based on asset location:
|
(In thousands)
|
December 31, 2017
|
December 31, 2016
|
|||||
|
Property and equipment, net
|
|||||||
|
United States
|
$
|
136,203
|
|
$
|
104,939
|
|
|
|
Europe
|
28,261
|
|
39,976
|
|
|||
|
Other
|
19,050
|
|
21,721
|
|
|||
|
$
|
183,514
|
|
$
|
166,636
|
|
||
F-38
AMC NETWORKS INC. AND SUBSIDIARIES
NOTES TO CONSOLIDATED FINANCIAL STATEMENTS (Continued)
Debt of AMC Networks includes
$600.0 million
of
4.75%
Notes due December 2022 and
$1.0 billion
of
5.00%
Notes due April 2024 and
$800.0 million
of
4.75%
Notes due August 2025. All outstanding senior notes issued by AMC Networks are guaranteed on a senior unsecured basis by certain of its existing and future domestic restricted subsidiaries (the "Guarantor Subsidiaries"). All Guarantor Subsidiaries are owned
100%
by AMC Networks. The outstanding notes are fully and unconditionally guaranteed by the Guarantor Subsidiaries on a joint and several basis.
Set forth below are condensed consolidating financial statements presenting the financial position, results of operations, comprehensive income, and cash flows of (i) the Parent Company, (ii) the Guarantor Subsidiaries on a combined basis (as such guarantees are joint and several), (iii) the direct and indirect non-guarantor subsidiaries of the Parent Company (the "Non-Guarantor Subsidiaries") on a combined basis and (iv) reclassifications and eliminations necessary to arrive at the information for the Company on a consolidated basis.
Basis of Presentation
In presenting the condensed consolidating financial statements, the equity method of accounting has been applied to (i) the Parent Company's interests in the Guarantor Subsidiaries and the Non-Guarantor Subsidiaries, and (ii) the Guarantor Subsidiaries' interests in the Non-Guarantor Subsidiaries, even though all such subsidiaries meet the requirements to be consolidated under GAAP. All intercompany balances and transactions between the Parent Company, the Guarantor Subsidiaries and the Non-Guarantor Subsidiaries have been eliminated, as shown in the column "Eliminations."
The accounting basis in all subsidiaries, including goodwill and identified intangible assets, have been allocated to the applicable subsidiaries.
F-39
AMC NETWORKS INC. AND SUBSIDIARIES
NOTES TO CONSOLIDATED FINANCIAL STATEMENTS (Continued)
|
Condensed Consolidating Balance Sheet
|
|||||||||||||||||||
|
December 31, 2017
|
|||||||||||||||||||
|
(In thousands)
|
Parent Company
|
Guarantor Subsidiaries
|
Non- Guarantor Subsidiaries
|
Eliminations
|
Consolidated
|
||||||||||||||
|
ASSETS
|
|||||||||||||||||||
|
Current Assets:
|
|
||||||||||||||||||
|
Cash and cash equivalents
|
$
|
320
|
|
$
|
391,248
|
|
$
|
167,215
|
|
$
|
—
|
|
$
|
558,783
|
|
||||
|
Accounts receivable, trade
|
—
|
|
581,270
|
|
194,621
|
|
—
|
|
775,891
|
|
|||||||||
|
Current portion of program rights, net
|
—
|
|
304,149
|
|
149,301
|
|
—
|
|
453,450
|
|
|||||||||
|
Prepaid expenses, other current assets and intercompany receivable
|
3,760
|
|
183,815
|
|
8,540
|
|
(104,389
|
)
|
91,726
|
|
|||||||||
|
Total current assets
|
4,080
|
|
1,460,482
|
|
519,677
|
|
(104,389
|
)
|
1,879,850
|
|
|||||||||
|
Property and equipment, net
|
—
|
|
136,032
|
|
47,482
|
|
—
|
|
183,514
|
|
|||||||||
|
Investment in affiliates
|
3,443,013
|
|
934,612
|
|
—
|
|
(4,377,625
|
)
|
—
|
|
|||||||||
|
Program rights, net
|
—
|
|
1,128,021
|
|
191,258
|
|
—
|
|
1,319,279
|
|
|||||||||
|
Long-term intercompany notes receivable
|
—
|
|
489,939
|
|
436
|
|
(490,375
|
)
|
—
|
|
|||||||||
|
Deferred carriage fees, net
|
—
|
|
29,346
|
|
578
|
|
—
|
|
29,924
|
|
|||||||||
|
Intangible assets, net
|
—
|
|
170,554
|
|
286,688
|
|
—
|
|
457,242
|
|
|||||||||
|
Goodwill
|
—
|
|
66,609
|
|
628,549
|
|
—
|
|
695,158
|
|
|||||||||
|
Deferred tax asset, net
|
—
|
|
—
|
|
20,081
|
|
—
|
|
20,081
|
|
|||||||||
|
Other assets
|
—
|
|
142,115
|
|
305,822
|
|
|
447,937
|
|
||||||||||
|
Total assets
|
$
|
3,447,093
|
|
$
|
4,557,710
|
|
$
|
2,000,571
|
|
$
|
(4,972,389
|
)
|
$
|
5,032,985
|
|
||||
|
LIABILITIES AND STOCKHOLDERS' EQUITY
|
|||||||||||||||||||
|
Current Liabilities:
|
|||||||||||||||||||
|
Accounts payable
|
$
|
350
|
|
$
|
50,282
|
|
$
|
51,565
|
|
$
|
—
|
|
$
|
102,197
|
|
||||
|
Accrued liabilities and intercompany payable
|
51,692
|
|
179,003
|
|
136,770
|
|
(104,389
|
)
|
263,076
|
|
|||||||||
|
Current portion of program rights obligations
|
—
|
|
262,004
|
|
65,545
|
|
—
|
|
327,549
|
|
|||||||||
|
Deferred revenue
|
—
|
|
27,530
|
|
18,903
|
|
—
|
|
46,433
|
|
|||||||||
|
Current portion of capital lease obligations
|
—
|
|
2,939
|
|
1,908
|
|
—
|
|
4,847
|
|
|||||||||
|
Total current liabilities
|
52,042
|
|
521,758
|
|
274,691
|
|
(104,389
|
)
|
744,102
|
|
|||||||||
|
Program rights obligations
|
—
|
|
511,996
|
|
22,984
|
|
—
|
|
534,980
|
|
|||||||||
|
Long-term debt, net
|
3,099,257
|
|
—
|
|
—
|
|
—
|
|
3,099,257
|
|
|||||||||
|
Capital lease obligations
|
—
|
|
3,745
|
|
22,532
|
|
—
|
|
26,277
|
|
|||||||||
|
Deferred tax liability, net
|
114,717
|
|
—
|
|
(5,019
|
)
|
—
|
|
109,698
|
|
|||||||||
|
Other liabilities and intercompany notes payable
|
46,133
|
|
77,198
|
|
503,166
|
|
(490,375
|
)
|
136,122
|
|
|||||||||
|
Total liabilities
|
3,312,149
|
|
1,114,697
|
|
818,354
|
|
(594,764
|
)
|
4,650,436
|
|
|||||||||
|
Commitments and contingencies
|
|||||||||||||||||||
|
Redeemable noncontrolling interests
|
—
|
|
—
|
|
218,604
|
|
—
|
|
218,604
|
|
|||||||||
|
Stockholders' equity:
|
|||||||||||||||||||
|
AMC Networks stockholders' equity
|
134,944
|
|
3,443,013
|
|
934,612
|
|
(4,377,625
|
)
|
134,944
|
|
|||||||||
|
Non-redeemable noncontrolling interests
|
—
|
|
—
|
|
29,001
|
|
—
|
|
29,001
|
|
|||||||||
|
Total stockholders' equity
|
134,944
|
|
3,443,013
|
|
963,613
|
|
(4,377,625
|
)
|
163,945
|
|
|||||||||
|
Total liabilities and stockholders' equity
|
$
|
3,447,093
|
|
$
|
4,557,710
|
|
$
|
2,000,571
|
|
$
|
(4,972,389
|
)
|
$
|
5,032,985
|
|
||||
F-40
AMC NETWORKS INC. AND SUBSIDIARIES
NOTES TO CONSOLIDATED FINANCIAL STATEMENTS (Continued)
|
Condensed Consolidating Balance Sheet
|
|||||||||||||||||||
|
December 31, 2016
|
|||||||||||||||||||
|
(In thousands)
|
Parent Company
|
Guarantor Subsidiaries
|
Non- Guarantor Subsidiaries
|
Eliminations
|
Consolidated
|
||||||||||||||
|
ASSETS
|
|||||||||||||||||||
|
Current Assets:
|
|||||||||||||||||||
|
Cash and cash equivalents
|
$
|
565
|
|
$
|
320,950
|
|
$
|
159,874
|
|
$
|
—
|
|
$
|
481,389
|
|
||||
|
Accounts receivable, trade
|
—
|
|
538,259
|
|
162,904
|
|
—
|
|
701,163
|
|
|||||||||
|
Current portion of program rights, net
|
—
|
|
307,050
|
|
134,080
|
|
—
|
|
441,130
|
|
|||||||||
|
Prepaid expenses, other current assets and intercompany receivable
|
948
|
|
151,175
|
|
15,961
|
|
(95,423
|
)
|
72,661
|
|
|||||||||
|
Total current assets
|
1,513
|
|
1,317,434
|
|
472,819
|
|
(95,423
|
)
|
1,696,343
|
|
|||||||||
|
Property and equipment, net
|
—
|
|
104,272
|
|
62,364
|
|
—
|
|
166,636
|
|
|||||||||
|
Investment in affiliates
|
3,029,922
|
|
784,024
|
|
—
|
|
(3,813,946
|
)
|
—
|
|
|||||||||
|
Program rights, net
|
—
|
|
947,657
|
|
160,929
|
|
—
|
|
1,108,586
|
|
|||||||||
|
Long-term intercompany notes receivable
|
—
|
|
432,099
|
|
817
|
|
(432,916
|
)
|
—
|
|
|||||||||
|
Deferred carriage fees, net
|
—
|
|
42,656
|
|
1,230
|
|
—
|
|
43,886
|
|
|||||||||
|
Intangible assets, net
|
—
|
|
180,297
|
|
305,512
|
|
—
|
|
485,809
|
|
|||||||||
|
Goodwill
|
—
|
|
69,154
|
|
588,554
|
|
—
|
|
657,708
|
|
|||||||||
|
Deferred tax asset, net
|
—
|
|
—
|
|
8,598
|
|
—
|
|
8,598
|
|
|||||||||
|
Other assets
|
1,471
|
|
116,608
|
|
194,950
|
|
—
|
|
313,029
|
|
|||||||||
|
Total assets
|
$
|
3,032,906
|
|
$
|
3,994,201
|
|
$
|
1,795,773
|
|
$
|
(4,342,285
|
)
|
$
|
4,480,595
|
|
||||
|
LIABILITIES AND STOCKHOLDERS' (DEFICIENCY) EQUITY
|
|||||||||||||||||||
|
Current Liabilities:
|
|||||||||||||||||||
|
Accounts payable
|
$
|
—
|
|
$
|
40,033
|
|
$
|
48,644
|
|
$
|
—
|
|
$
|
88,677
|
|
||||
|
Accrued liabilities and intercompany payable
|
71,680
|
|
182,667
|
|
125,505
|
|
(95,423
|
)
|
284,429
|
|
|||||||||
|
Current portion of program rights obligations
|
—
|
|
226,474
|
|
74,371
|
|
—
|
|
300,845
|
|
|||||||||
|
Deferred revenue
|
—
|
|
42,782
|
|
10,861
|
|
—
|
|
53,643
|
|
|||||||||
|
Current portion of long-term debt
|
222,000
|
|
—
|
|
—
|
|
—
|
|
222,000
|
|
|||||||||
|
Current portion of capital lease obligations
|
—
|
|
2,645
|
|
1,939
|
|
—
|
|
4,584
|
|
|||||||||
|
Total current liabilities
|
293,680
|
|
494,601
|
|
261,320
|
|
(95,423
|
)
|
954,178
|
|
|||||||||
|
Program rights obligations
|
—
|
|
365,262
|
|
32,913
|
|
—
|
|
398,175
|
|
|||||||||
|
Long-term debt, net
|
2,597,263
|
|
—
|
|
—
|
|
—
|
|
2,597,263
|
|
|||||||||
|
Capital lease obligations
|
—
|
|
6,647
|
|
28,635
|
|
—
|
|
35,282
|
|
|||||||||
|
Deferred tax liability, net
|
145,364
|
|
—
|
|
427
|
|
—
|
|
145,791
|
|
|||||||||
|
Other liabilities and intercompany notes payable
|
26,681
|
|
97,769
|
|
440,685
|
|
(432,916
|
)
|
132,219
|
|
|||||||||
|
Total liabilities
|
3,062,988
|
|
964,279
|
|
763,980
|
|
(528,339
|
)
|
4,262,908
|
|
|||||||||
|
Commitments and contingencies
|
|||||||||||||||||||
|
Redeemable noncontrolling interests
|
—
|
|
—
|
|
219,331
|
|
—
|
|
219,331
|
|
|||||||||
|
Stockholders' deficiency:
|
|||||||||||||||||||
|
AMC Networks stockholders' (deficiency) equity
|
(30,082
|
)
|
3,029,922
|
|
784,024
|
|
(3,813,946
|
)
|
(30,082
|
)
|
|||||||||
|
Non-redeemable noncontrolling interests
|
—
|
|
—
|
|
28,438
|
|
—
|
|
28,438
|
|
|||||||||
|
Total stockholders' (deficiency) equity
|
(30,082
|
)
|
3,029,922
|
|
812,462
|
|
(3,813,946
|
)
|
(1,644
|
)
|
|||||||||
|
Total liabilities and stockholders' equity
|
$
|
3,032,906
|
|
$
|
3,994,201
|
|
$
|
1,795,773
|
|
$
|
(4,342,285
|
)
|
$
|
4,480,595
|
|
||||
F-41
AMC NETWORKS INC. AND SUBSIDIARIES
NOTES TO CONSOLIDATED FINANCIAL STATEMENTS (Continued)
|
Condensed Consolidating Statement of Income
|
|||||||||||||||||||
|
Year Ended December 31, 2017
|
|||||||||||||||||||
|
(In thousands)
|
Parent Company
|
Guarantor Subsidiaries
|
Non- Guarantor Subsidiaries
|
Eliminations
|
Consolidated
|
||||||||||||||
|
Revenues, net
|
$
|
—
|
|
$
|
2,182,867
|
|
$
|
637,823
|
|
$
|
(14,999
|
)
|
$
|
2,805,691
|
|
||||
|
Operating expenses:
|
|||||||||||||||||||
|
Technical and operating (excluding depreciation and amortization)
|
—
|
|
991,476
|
|
352,788
|
|
(3,188
|
)
|
1,341,076
|
|
|||||||||
|
Selling, general and administrative
|
—
|
|
447,118
|
|
178,332
|
|
(12,108
|
)
|
613,342
|
|
|||||||||
|
Depreciation and amortization
|
—
|
|
40,923
|
|
53,715
|
|
—
|
|
94,638
|
|
|||||||||
|
Impairment and related charges
|
—
|
|
—
|
|
28,148
|
|
—
|
|
28,148
|
|
|||||||||
|
Restructuring expense
|
—
|
|
2,566
|
|
3,562
|
|
—
|
|
6,128
|
|
|||||||||
|
Total operating expenses
|
—
|
|
1,482,083
|
|
616,545
|
|
(15,296
|
)
|
2,083,332
|
|
|||||||||
|
Operating income
|
—
|
|
700,784
|
|
21,278
|
|
297
|
|
722,359
|
|
|||||||||
|
Other income (expense):
|
|||||||||||||||||||
|
Interest expense, net
|
(129,971
|
)
|
41,934
|
|
(31,260
|
)
|
—
|
|
(119,297
|
)
|
|||||||||
|
Share of affiliates' income (loss)
|
748,430
|
|
13,360
|
|
—
|
|
(761,790
|
)
|
—
|
|
|||||||||
|
Loss on extinguishment of debt
|
(3,004
|
)
|
—
|
|
—
|
|
—
|
|
(3,004
|
)
|
|||||||||
|
Miscellaneous, net
|
(1,530
|
)
|
2,484
|
|
39,663
|
|
(297
|
)
|
40,320
|
|
|||||||||
|
Total other income (expense)
|
613,925
|
|
57,778
|
|
8,403
|
|
(762,087
|
)
|
(81,981
|
)
|
|||||||||
|
Income from operations before income taxes
|
613,925
|
|
758,562
|
|
29,681
|
|
(761,790
|
)
|
640,378
|
|
|||||||||
|
Income tax (expense) benefit
|
(142,609
|
)
|
(10,132
|
)
|
2,000
|
|
—
|
|
(150,741
|
)
|
|||||||||
|
Net income including noncontrolling interests
|
471,316
|
|
748,430
|
|
31,681
|
|
(761,790
|
)
|
489,637
|
|
|||||||||
|
Net income attributable to noncontrolling interests
|
—
|
|
—
|
|
(18,321
|
)
|
—
|
|
(18,321
|
)
|
|||||||||
|
Net income attributable to AMC Networks' stockholders
|
$
|
471,316
|
|
$
|
748,430
|
|
$
|
13,360
|
|
$
|
(761,790
|
)
|
$
|
471,316
|
|
||||
|
Condensed Consolidating Statement of Income
|
|||||||||||||||||||
|
Year Ended December 31, 2016
|
|||||||||||||||||||
|
(In thousands)
|
Parent Company
|
Guarantor Subsidiaries
|
Non- Guarantor Subsidiaries
|
Eliminations
|
Consolidated
|
||||||||||||||
|
Revenues, net
|
$
|
—
|
|
$
|
2,142,325
|
|
$
|
623,892
|
|
$
|
(10,563
|
)
|
$
|
2,755,654
|
|
||||
|
Operating expenses:
|
|||||||||||||||||||
|
Technical and operating (excluding depreciation and amortization)
|
—
|
|
947,707
|
|
334,888
|
|
(2,611
|
)
|
1,279,984
|
|
|||||||||
|
Selling, general and administrative
|
—
|
|
460,150
|
|
183,597
|
|
(7,719
|
)
|
636,028
|
|
|||||||||
|
Depreciation and amortization
|
—
|
|
40,230
|
|
44,548
|
|
—
|
|
84,778
|
|
|||||||||
|
Impairment and related charges
|
—
|
|
—
|
|
67,805
|
|
—
|
|
67,805
|
|
|||||||||
|
Restructuring expense
|
—
|
|
24,950
|
|
4,553
|
|
—
|
|
29,503
|
|
|||||||||
|
Total operating expenses
|
—
|
|
1,473,037
|
|
635,391
|
|
(10,330
|
)
|
2,098,098
|
|
|||||||||
|
Operating income (loss)
|
—
|
|
669,288
|
|
(11,499
|
)
|
(233
|
)
|
657,556
|
|
|||||||||
|
Other income (expense):
|
|||||||||||||||||||
|
Interest expense, net
|
(119,192
|
)
|
38,137
|
|
(37,513
|
)
|
—
|
|
(118,568
|
)
|
|||||||||
|
Share of affiliates' income (loss)
|
591,395
|
|
(103,464
|
)
|
—
|
|
(487,931
|
)
|
—
|
|
|||||||||
|
Loss on extinguishment of debt
|
(50,639
|
)
|
—
|
|
—
|
|
—
|
|
(50,639
|
)
|
|||||||||
|
Miscellaneous, net
|
(273
|
)
|
(2,892
|
)
|
(30,592
|
)
|
233
|
|
(33,524
|
)
|
|||||||||
|
Total other income (expense)
|
421,291
|
|
(68,219
|
)
|
(68,105
|
)
|
(487,698
|
)
|
(202,731
|
)
|
|||||||||
|
Income (loss) from operations before income taxes
|
421,291
|
|
601,069
|
|
(79,604
|
)
|
(487,931
|
)
|
454,825
|
|
|||||||||
|
Income tax expense
|
(150,781
|
)
|
(9,674
|
)
|
(4,407
|
)
|
—
|
|
(164,862
|
)
|
|||||||||
|
Net income (loss) including noncontrolling interests
|
270,510
|
|
591,395
|
|
(84,011
|
)
|
(487,931
|
)
|
289,963
|
|
|||||||||
|
Net income attributable to noncontrolling interests
|
—
|
|
—
|
|
(19,453
|
)
|
—
|
|
(19,453
|
)
|
|||||||||
|
Net income (loss) attributable to AMC Networks' stockholders
|
$
|
270,510
|
|
$
|
591,395
|
|
$
|
(103,464
|
)
|
$
|
(487,931
|
)
|
$
|
270,510
|
|
||||
F-42
AMC NETWORKS INC. AND SUBSIDIARIES
NOTES TO CONSOLIDATED FINANCIAL STATEMENTS (Continued)
|
Condensed Consolidating Statement of Comprehensive Income
|
|||||||||||||||||||
|
Year Ended December 31, 2017
|
|||||||||||||||||||
|
(In thousands)
|
Parent Company
|
Guarantor Subsidiaries
|
Non- Guarantor Subsidiaries
|
Eliminations
|
Consolidated
|
||||||||||||||
|
Net income including noncontrolling interest
|
$
|
471,316
|
|
$
|
748,430
|
|
$
|
31,681
|
|
$
|
(761,790
|
)
|
$
|
489,637
|
|
||||
|
Other comprehensive income (loss):
|
|||||||||||||||||||
|
Foreign currency translation adjustment
|
76,023
|
|
—
|
|
76,023
|
|
(76,023
|
)
|
76,023
|
|
|||||||||
|
Unrealized loss on interest rate swaps
|
(35
|
)
|
—
|
|
—
|
|
—
|
|
(35
|
)
|
|||||||||
|
Unrealized gain on available for sale securities
|
5,398
|
|
—
|
|
—
|
|
—
|
|
5,398
|
|
|||||||||
|
Other comprehensive income, before income taxes
|
81,386
|
|
—
|
|
76,023
|
|
(76,023
|
)
|
81,386
|
|
|||||||||
|
Income tax expense
|
(1,974
|
)
|
—
|
|
—
|
|
—
|
|
(1,974
|
)
|
|||||||||
|
Other comprehensive income, net of income taxes
|
79,412
|
|
—
|
|
76,023
|
|
(76,023
|
)
|
79,412
|
|
|||||||||
|
Comprehensive income
|
550,728
|
|
748,430
|
|
107,704
|
|
(837,813
|
)
|
569,049
|
|
|||||||||
|
Comprehensive income attributable to noncontrolling interests
|
—
|
|
—
|
|
(21,430
|
)
|
—
|
|
(21,430
|
)
|
|||||||||
|
Comprehensive income attributable to AMC Networks' stockholders
|
$
|
550,728
|
|
$
|
748,430
|
|
$
|
86,274
|
|
$
|
(837,813
|
)
|
$
|
547,619
|
|
||||
|
Condensed Consolidating Statement of Comprehensive Income
|
|||||||||||||||||||
|
Year Ended December 31, 2016
|
|||||||||||||||||||
|
(In thousands)
|
Parent Company
|
Guarantor Subsidiaries
|
Non- Guarantor Subsidiaries
|
Eliminations
|
Consolidated
|
||||||||||||||
|
Net income (loss) including noncontrolling interest
|
$
|
270,510
|
|
$
|
591,395
|
|
$
|
(84,011
|
)
|
$
|
(487,931
|
)
|
$
|
289,963
|
|
||||
|
Other comprehensive income (loss):
|
|||||||||||||||||||
|
Foreign currency translation adjustment
|
(45,426
|
)
|
—
|
|
(45,426
|
)
|
45,426
|
|
(45,426
|
)
|
|||||||||
|
Unrealized gain on interest rate swaps
|
22
|
|
—
|
|
—
|
|
—
|
|
22
|
|
|||||||||
|
Other comprehensive loss, before income taxes
|
(45,404
|
)
|
—
|
|
(45,426
|
)
|
45,426
|
|
(45,404
|
)
|
|||||||||
|
Income tax expense
|
(12,337
|
)
|
—
|
|
—
|
|
—
|
|
(12,337
|
)
|
|||||||||
|
Other comprehensive (loss) income, net of income taxes
|
(57,741
|
)
|
—
|
|
(45,426
|
)
|
45,426
|
|
(57,741
|
)
|
|||||||||
|
Comprehensive income (loss)
|
212,769
|
|
591,395
|
|
(129,437
|
)
|
(442,505
|
)
|
232,222
|
|
|||||||||
|
Comprehensive income attributable to noncontrolling interests
|
—
|
|
—
|
|
(16,491
|
)
|
—
|
|
(16,491
|
)
|
|||||||||
|
Comprehensive income (loss) attributable to AMC Networks' stockholders
|
$
|
212,769
|
|
$
|
591,395
|
|
$
|
(145,928
|
)
|
$
|
(442,505
|
)
|
$
|
215,731
|
|
||||
F-43
AMC NETWORKS INC. AND SUBSIDIARIES
NOTES TO CONSOLIDATED FINANCIAL STATEMENTS (Continued)
|
Condensed Consolidating Statement of Cash Flows
|
|||||||||||||||||||
|
Year Ended December 31, 2017
|
|||||||||||||||||||
|
(In thousands)
|
Parent Company
|
Guarantor Subsidiaries
|
Non- Guarantor Subsidiaries
|
Eliminations
|
Consolidated
|
||||||||||||||
|
Cash flows from operating activities:
|
|||||||||||||||||||
|
Net cash provided by operating activities
|
$
|
454,539
|
|
$
|
662,123
|
|
$
|
31,157
|
|
$
|
(762,090
|
)
|
$
|
385,729
|
|
||||
|
Cash flows from investing activities:
|
|||||||||||||||||||
|
Capital expenditures
|
—
|
|
(63,925
|
)
|
(16,124
|
)
|
—
|
|
(80,049
|
)
|
|||||||||
|
Return of capital from investees
|
—
|
|
1,868
|
|
579
|
|
—
|
|
2,447
|
|
|||||||||
|
Investments in and loans to investees
|
—
|
|
—
|
|
(53,000
|
)
|
—
|
|
(53,000
|
)
|
|||||||||
|
(Increase) decrease to investment in affiliates
|
(282,424
|
)
|
(2,234,682
|
)
|
2,082,401
|
|
434,705
|
|
—
|
|
|||||||||
|
Net cash used in investing activities
|
(282,424
|
)
|
(2,296,739
|
)
|
2,013,856
|
|
434,705
|
|
(130,602
|
)
|
|||||||||
|
Cash flows from financing activities:
|
|
|
|
|
|
|
|
|
|
|
|||||||||
|
Proceeds from the issuance of long-term debt
|
1,536,000
|
|
—
|
|
—
|
|
—
|
|
1,536,000
|
|
|||||||||
|
Repayment of long-term debt
|
(1,257,965
|
)
|
—
|
|
—
|
|
—
|
|
(1,257,965
|
)
|
|||||||||
|
Payments for financing costs
|
(10,405
|
)
|
—
|
|
—
|
|
—
|
|
(10,405
|
)
|
|||||||||
|
Deemed repurchases of restricted stock/units
|
(14,496
|
)
|
—
|
|
—
|
|
—
|
|
(14,496
|
)
|
|||||||||
|
Purchase of treasury stock
|
(434,210
|
)
|
—
|
|
—
|
|
—
|
|
(434,210
|
)
|
|||||||||
|
Principal payments on capital lease obligations
|
—
|
|
(2,725
|
)
|
(1,848
|
)
|
—
|
|
(4,573
|
)
|
|||||||||
|
Distributions to noncontrolling interest
|
—
|
|
—
|
|
(18,561
|
)
|
—
|
|
(18,561
|
)
|
|||||||||
|
Net cash used in financing activities
|
(181,076
|
)
|
(2,725
|
)
|
(20,409
|
)
|
—
|
|
(204,210
|
)
|
|||||||||
|
Net (decrease) increase in cash and cash equivalents from operations
|
(8,961
|
)
|
(1,637,341
|
)
|
2,024,604
|
|
(327,385
|
)
|
50,917
|
|
|||||||||
|
Effect of exchange rate changes on cash and cash equivalents
|
8,716
|
|
1,707,639
|
|
(2,017,263
|
)
|
327,385
|
|
26,477
|
|
|||||||||
|
Cash and cash equivalents at beginning of period
|
565
|
|
320,950
|
|
159,874
|
|
—
|
|
481,389
|
|
|||||||||
|
Cash and cash equivalents at end of period
|
$
|
320
|
|
$
|
391,248
|
|
$
|
167,215
|
|
$
|
—
|
|
$
|
558,783
|
|
||||
F-44
AMC NETWORKS INC. AND SUBSIDIARIES
NOTES TO CONSOLIDATED FINANCIAL STATEMENTS (Continued)
|
Condensed Consolidating Statement of Cash Flows
|
|||||||||||||||||||
|
Year Ended December 31, 2016
|
|||||||||||||||||||
|
(In thousands)
|
Parent Company
|
Guarantor Subsidiaries
|
Non- Guarantor Subsidiaries
|
Eliminations
|
Consolidated
|
||||||||||||||
|
Cash flows from operating activities:
|
|||||||||||||||||||
|
Net cash provided by operating activities
|
$
|
401,179
|
|
$
|
548,381
|
|
$
|
55,450
|
|
$
|
(490,685
|
)
|
$
|
514,325
|
|
||||
|
Cash flows from investing activities:
|
|||||||||||||||||||
|
Capital expenditures
|
—
|
|
(42,064
|
)
|
(37,156
|
)
|
—
|
|
(79,220
|
)
|
|||||||||
|
Payments for acquisitions, net of cash acquired
|
—
|
|
—
|
|
(354
|
)
|
—
|
|
(354
|
)
|
|||||||||
|
Investments in and loans to investees
|
—
|
|
—
|
|
(95,000
|
)
|
—
|
|
(95,000
|
)
|
|||||||||
|
(Increase) decrease to investment in affiliates
|
(159,533
|
)
|
(69,231
|
)
|
—
|
|
228,764
|
|
—
|
|
|||||||||
|
Net cash used in investing activities
|
(159,533
|
)
|
(111,295
|
)
|
(132,510
|
)
|
228,764
|
|
(174,574
|
)
|
|||||||||
|
Cash flows from financing activities:
|
|||||||||||||||||||
|
Proceeds from the issuance of long-term debt
|
982,500
|
|
—
|
|
—
|
|
—
|
|
982,500
|
|
|||||||||
|
Repayment of long-term debt
|
(848,000
|
)
|
—
|
|
—
|
|
—
|
|
(848,000
|
)
|
|||||||||
|
Premium and fees paid on extinguishment of debt
|
(40,954
|
)
|
—
|
|
—
|
|
—
|
|
(40,954
|
)
|
|||||||||
|
Payments for financing costs
|
(2,070
|
)
|
—
|
|
—
|
|
—
|
|
(2,070
|
)
|
|||||||||
|
Deemed repurchases of restricted stock/units
|
(10,822
|
)
|
—
|
|
—
|
|
—
|
|
(10,822
|
)
|
|||||||||
|
Purchase of treasury stock
|
(223,237
|
)
|
—
|
|
—
|
|
—
|
|
(223,237
|
)
|
|||||||||
|
Proceeds from stock option exercises
|
1,228
|
|
—
|
|
—
|
|
—
|
|
1,228
|
|
|||||||||
|
Excess tax benefits from share-based compensation arrangements
|
789
|
|
—
|
|
—
|
|
—
|
|
789
|
|
|||||||||
|
Principal payments on capital lease obligations
|
—
|
|
(2,475
|
)
|
(1,813
|
)
|
—
|
|
(4,288
|
)
|
|||||||||
|
Distributions to noncontrolling interest
|
—
|
|
—
|
|
(9,010
|
)
|
—
|
|
(9,010
|
)
|
|||||||||
|
Net cash used in financing activities
|
(140,566
|
)
|
(2,475
|
)
|
(10,823
|
)
|
—
|
|
(153,864
|
)
|
|||||||||
|
Net increase (decrease) in cash and cash equivalents from operations
|
101,080
|
|
434,611
|
|
(87,883
|
)
|
(261,921
|
)
|
185,887
|
|
|||||||||
|
Effect of exchange rate changes on cash and cash equivalents
|
(100,949
|
)
|
(261,921
|
)
|
80,130
|
|
261,921
|
|
(20,819
|
)
|
|||||||||
|
Cash and cash equivalents at beginning of period
|
434
|
|
148,260
|
|
167,627
|
|
—
|
|
316,321
|
|
|||||||||
|
Cash and cash equivalents at end of period
|
$
|
565
|
|
$
|
320,950
|
|
$
|
159,874
|
|
$
|
—
|
|
$
|
481,389
|
|
||||
F-45
AMC NETWORKS INC. AND SUBSIDIARIES
NOTES TO CONSOLIDATED FINANCIAL STATEMENTS (Continued)
The following is a summary of the Company's selected quarterly financial data for the years ended
December 31, 2017
and
2016
:
|
(In thousands)
|
For the three months ended,
|
||||||||||||||||||
|
2017:
|
March 31,
2017 |
June 30,
2017 |
September 30,
2017 |
December 31,
2017 |
2017
|
||||||||||||||
|
Revenues, net
|
$
|
720,189
|
|
$
|
710,545
|
|
$
|
648,023
|
|
$
|
726,934
|
|
$
|
2,805,691
|
|
||||
|
Operating expenses
|
(488,518
|
)
|
(534,755
|
)
|
(494,669
|
)
|
(565,390
|
)
|
(2,083,332
|
)
|
|||||||||
|
Operating income
|
$
|
231,671
|
|
$
|
175,790
|
|
$
|
153,354
|
|
$
|
161,544
|
|
$
|
722,359
|
|
||||
|
Net income including noncontrolling interests
|
$
|
142,631
|
|
$
|
107,626
|
|
$
|
90,836
|
|
$
|
148,544
|
|
$
|
489,637
|
|
||||
|
Net income attributable to AMC Networks' stockholders
|
$
|
136,217
|
|
$
|
102,598
|
|
$
|
87,002
|
|
$
|
145,499
|
|
$
|
471,316
|
|
||||
|
Net income per share attributable to AMC Networks' stockholders:
|
|||||||||||||||||||
|
Basic
|
$
|
2.00
|
|
$
|
1.55
|
|
$
|
1.37
|
|
$
|
2.36
|
|
$
|
7.26
|
|
||||
|
Diluted
|
$
|
1.98
|
|
$
|
1.54
|
|
$
|
1.35
|
|
$
|
2.33
|
|
$
|
7.18
|
|
||||
|
(In thousands)
|
For the three months ended,
|
||||||||||||||||||
|
2016:
|
March 31,
2016 |
June 30,
2016 |
September 30,
2016 |
December 31,
2016 |
2016
|
||||||||||||||
|
Revenues, net
|
$
|
706,579
|
|
$
|
684,832
|
|
$
|
634,646
|
|
$
|
729,597
|
|
$
|
2,755,654
|
|
||||
|
Operating expenses
|
(447,920
|
)
|
(506,800
|
)
|
(517,509
|
)
|
(625,869
|
)
|
(2,098,098
|
)
|
|||||||||
|
Operating income
|
$
|
258,659
|
|
$
|
178,032
|
|
$
|
117,137
|
|
$
|
103,728
|
|
$
|
657,556
|
|
||||
|
Net income including noncontrolling interests
|
$
|
120,064
|
|
$
|
83,387
|
|
$
|
67,469
|
|
$
|
19,043
|
|
$
|
289,963
|
|
||||
|
Net income attributable to AMC Networks' stockholders
|
$
|
113,444
|
|
$
|
77,175
|
|
$
|
65,393
|
|
$
|
14,498
|
|
$
|
270,510
|
|
||||
|
Net income per share attributable to AMC Networks' stockholders:
|
|||||||||||||||||||
|
Basic
|
$
|
1.56
|
|
$
|
1.06
|
|
$
|
0.91
|
|
$
|
0.21
|
|
$
|
3.77
|
|
||||
|
Diluted
|
$
|
1.55
|
|
$
|
1.05
|
|
$
|
0.91
|
|
$
|
0.20
|
|
$
|
3.74
|
|
||||
The results for the fourth quarter of 2017 were impacted by the enactment of the Tax Cuts and Jobs Act. Specifically, the Company recorded a tax benefit of $56.9 million which represents the one-time impact of the change in the corporate tax rate on deferred tax assets and liabilities, partially offset by the one-time transition tax liability, net of foreign taxes deemed paid.
F-46
AMC NETWORKS INC. AND SUBSIDIARIES
SCHEDULE II
VALUATION AND QUALIFYING ACCOUNTS
(Dollars in thousands)
|
(In thousands)
|
Balance at
Beginning
of Period
|
Provision for (Recovery of) Bad Debt
|
Deductions/ Write-Offs and Other Charges, Net
|
Balance at
End of Period
|
|||||||||||
|
Year Ended December 31, 2017
|
|||||||||||||||
|
Allowance for doubtful accounts
|
$
|
6,064
|
|
$
|
3,567
|
|
$
|
60
|
|
$
|
9,691
|
|
|||
|
Year Ended December 31, 2016
|
|||||||||||||||
|
Allowance for doubtful accounts
|
$
|
4,307
|
|
$
|
1,924
|
|
$
|
(167
|
)
|
$
|
6,064
|
|
|||
|
Year Ended December 31, 2015
|
|||||||||||||||
|
Allowance for doubtful accounts
|
$
|
4,276
|
|
$
|
1,705
|
|
$
|
(1,674
|
)
|
$
|
4,307
|
|
|||
S-1
TABLE OF CONTENTS
Part IItem 1. BusinessItem 1A. Risk FactorsItem 1B. Unresolved Staff CommentsItem 2. PropertiesItem 3. Legal ProceedingsItem 4. Mine Safety DisclosuresPart IIItem 5. Market For Registrant's Common Equity, Related Stockholder Matters and Issuer Purchases Of Equity SecuritiesItem 6. Selected Financial DataItem 7. Management's Discussion and Analysis Of Financial Condition and Results Of OperationsItem 7A. Quantitative and Qualitative Disclosure About Market RiskItem 8. Financial Statements and Supplementary DataItem 9. Changes in and Disagreements with Accountants on Accounting and Financial DisclosureItem 9A. Controls and ProceduresItem 9B. Other InformationPart IIIItem 10. Directors, Executive Officers and Corporate GovernanceItem 11. Executive CompensationItem 12. Security Ownership Of Certain Beneficial Owners and Management and Related Stockholder MattersItem 13. Certain Relationships and Related Transactions, and Director IndependenceItem 14. Principal Accounting Fees and ServicesPart IVItem 15. Exhibits, Financial Statement SchedulesItem 16. Form 10-k SummaryNote 1. Description Of Business and Basis Of PresentationNote 2. Summary Of Significant Accounting PoliciesNote 3. Impairment and Related ChargesNote 4. RestructuringNote 5. Program Rights and ObligationsNote 6. InvestmentsNote 7. Property and EquipmentNote 8. Goodwill and Other Intangible AssetsNote 9. Accrued LiabilitiesNote 10. Long-term DebtNote 11. Fair Value MeasurementNote 12. Derivative Financial InstrumentsNote 13. LeasesNote 14. Income TaxesNote 15. Commitments and ContingenciesNote 16. Redeemable Noncontrolling InterestsNote 17. Equity and Long-term Incentive PlansNote 18. Benefit PlansNote 19. Related Party TransactionsNote 20. Cash FlowsNote 21. Accumulated Other Comprehensive LossNote 22. Segment InformationNote 23. Condensed Consolidating Financial StatementsNote 24. Interim Financial Information (unaudited)