ADVANCED MICRO DEVICES INC
10-Ks and 10-Qs
|
|
|
|
|
|
|
|
|
|
|
|
|
|
|
|
|
|
|
|
|
|
|
|
|
|
|
|
|
|
|
|
|
|
|
|
|
|
|
|
|
|
|
|
|
|
|
|
|
|
|
|
|
|
|
|
UNITED STATES
SECURITIES AND EXCHANGE COMMISSION
Washington, D.C. 20549
FORM 10-K
(Mark One)
|
ý
|
ANNUAL REPORT PURSUANT TO SECTION 13 OR 15(d) OF THE SECURITIES EXCHANGE ACT OF 1934.
|
|
For the fiscal year ended December 30, 2017
|
|
|
OR
|
|
|
¨
|
TRANSITION REPORT PURSUANT TO SECTION 13 OR 15(d) OF THE SECURITIES EXCHANGE ACT OF 1934.
|
|
For the transition period from
to
|
|
Commission File Number 001-07882
ADVANCED MICRO DEVICES, INC.
(Exact name of registrant as specified in its charter)
|
Delaware
|
94-1692300
|
|
(State or other jurisdiction of
incorporation or organization)
|
(I.R.S. Employer
Identification No.)
|
|
2485 Augustine Drive, Santa Clara, California
|
95054
|
|
(Address of principal executive offices)
|
(Zip Code)
|
(408) 749-4000
(Registrant’s telephone number, including area code)
Securities registered pursuant to Section 12(b) of the Act:
|
(Title of each class)
|
(Name of each exchange on which registered)
|
|
Common Stock $0.01 par value per share
|
The NASDAQ Capital Market
|
Securities registered pursuant to Section 12(g) of the Act:
None
Indicate by check mark if the registrant is a well-known seasoned issuer, as defined in Rule 405 of the Securities Act. Yes
ý
No
¨
Indicate by check mark if the registrant is not required to file reports pursuant to Section 13 or Section 15(d) of the Exchange Act. Yes
¨
No
ý
Indicate by check mark whether the registrant (1) has filed all reports required to be filed by Section 13 or 15(d) of the Securities Exchange Act of 1934 during the preceding 12 months (or for such shorter period that the registrant was required to file such reports), and (2) has been subject to such filing requirements for the past 90 days. Yes
ý
No
¨
Indicate by check mark whether the registrant has submitted electronically and posted on its corporate web site, if any, every Interactive Data File required to be submitted and posted pursuant to Rule 405 of Regulation S-T during the preceding 12 months (or for such shorter period that the registrant was required to submit and post such files): Yes
ý
No
¨
Indicate by check mark if disclosure of delinquent filers pursuant to Item 405 of Regulation S-K is not contained herein, and will not be contained, to the best of registrant’s knowledge, in definitive proxy or information statements incorporated by reference in Part III of this Form 10-K or any amendment to this Form 10-K.
ý
Indicate by check mark whether the registrant is a large accelerated filer, an accelerated filer, a non-accelerated filer or a smaller reporting company. See definition of “large accelerated filer,” “accelerated filer” and “smaller reporting company” in Rule 12b-2 of the Exchange Act (check one):
|
Large accelerated filer
|
ý
|
Accelerated filer
|
¨
|
|
Non-accelerated filer
|
¨
(Do not check if a smaller reporting company)
|
Smaller reporting company
|
¨
|
Indicate by check mark whether the registrant is a shell company (as defined by Rule 12b-2 of the Exchange Act). Yes
¨
No
ý
As of
July 1, 2017
, the aggregate market value of the registrant’s common stock held by non-affiliates of the registrant was approximately
$12.0 billion
based on the reported closing sale price of
$12.48
per share as reported on The NASDAQ Capital Market (NASDAQ) on
June 30, 2017
, which was the last business day of the registrant’s most recently completed second fiscal quarter.
Indicate the number of shares outstanding of each of the registrant’s classes of common stock, as of the latest practicable date:
969,110,191
shares of common stock, $0.01 par value per share, as of February 23, 2018.
DOCUMENTS INCORPORATED BY REFERENCE
Portions of the registrant’s proxy statement for the 2018 Annual Meeting of Stockholders (2018 Proxy Statement) are incorporated into Part III hereof. The 2018 Proxy Statement will be filed with the U.S. Securities and Exchange Commission within 120 days after the registrant’s fiscal year ended December 30, 2017.
Advanced Micro Devices, Inc.
FORM 10-K
For The Fiscal Year Ended
December 30, 2017
INDEX
ITEM 1.
BUSINESS
Cautionary Statement Regarding Forward-Looking Statements
The statements in this report include forward-looking statements within the meaning of the Private Securities Litigation Reform Act of 1995. These forward-looking statements are based on current expectations and beliefs and involve numerous risks and uncertainties that could cause actual results to differ materially from expectations. These forward-looking statements speak only as of the date hereof or as of the dates indicated in the statements and should not be relied upon as predictions of future events, as we cannot assure you that the events or circumstances reflected in these statements will be achieved or will occur. You can identify forward-looking statements by the use of forward-looking terminology including “believes,” “expects,” “may,” “will,” “should,” “seeks,” “intends,” “plans,” “pro forma,” “estimates,” “anticipates,” or the negative of these words and phrases, other variations of these words and phrases or comparable terminology. The forward-looking statements relate to, among other things: demand for AMD’s products; the growth, change and competitive landscape of the markets in which AMD participates; future restructuring activities; the nature and extent of AMD’s future payments to GLOBALFOUNDRIES Inc. (GF) and the materiality of these payments; the materiality of AMD’s future purchases from GF; future patent filings; seasonal trends of our business; the timing of the completion of accounting related to the Tax Cuts and Jobs Act of 2017 (Tax Reform Act); AMD's unrecognized tax benefits over the next 12 months; the level of international sales as compared to total sales; AMD's dependence on a small number of customers for a substantial part of its revenue; receipt of license fees relating to the joint ventures between AMD and Tianjin Haiguang Advanced Technology Investment Co., Ltd. (THATIC) (the THATIC JV); expected royalties from future product sales of the THATIC JV; AMD's expectation that based on the information presently known to management, the potential liability from current litigation will not have a material adverse effect on its financial condition, cash flows or results of operations; that AMD’s cash and cash equivalents balances and the secured revolving line of credit (Secured Revolving Line of Credit) will be sufficient to fund AMD’s operations including capital expenditures over the next 12 months; AMD’s ability to obtain sufficient external financing on favorable terms; timing of receipt of unbilled accounts receivables; its expenditures related to environmental compliance; expected impact of new and future accounting standards on AMD's business; and AMD does not expect to pay dividends in the future. Material factors that could cause actual results to differ materially from current expectations include, without limitation, the following: Intel Corporation’s dominance of the microprocessor market and its aggressive business practices may limit AMD’s ability to compete effectively; AMD has a wafer supply agreement with GF with obligations to purchase all of its microprocessor and APU product requirements, and a certain portion of its GPU product requirements from GF with limited exceptions. If GF is not able to satisfy AMD’s manufacturing requirements, AMD's business could be adversely impacted; AMD relies on third parties to manufacture its products, and if they are unable to do so on a timely basis in sufficient quantities and using competitive technologies, AMD’s business could be materially adversely affected; failure to achieve expected manufacturing yields for AMD’s products could negatively impact its financial results; the success of AMD’s business is dependent upon its ability to introduce products on a timely basis with features and performance levels that provide value to its customers while supporting and coinciding with significant industry transitions; if AMD cannot generate sufficient revenue and operating cash flow or obtain external financing, it may face a cash shortfall and be unable to make all of its planned investments in research and development or other strategic investments; the loss of a significant customer may have a material adverse effect on AMD; AMD’s receipt of revenue from its semi-custom SoC products is dependent upon its technology being designed into third-party products and the success of those products; AMD's products may be subject to security vulnerabilities that could have a material adverse effect on AMD; global economic uncertainty may adversely impact AMD’s business and operating results; AMD may not be able to generate sufficient cash to service its debt obligations or meet its working capital requirements; AMD has a large amount of indebtedness which could adversely affect its financial position and prevent it from implementing its strategy or fulfilling its contractual obligations; the agreements governing AMD’s notes and the Secured Revolving Line of Credit impose restrictions on AMD that may adversely affect AMD's ability to operate its business; the markets in which AMD’s products are sold are highly competitive; AMD's issuance to West Coast Hitech L.P. (WCH) of warrants to purchase 75 million shares of its common stock, if and when exercised, will dilute the ownership interests of AMD's existing stockholders, and the conversion of the 2.125% Convertible Senior Notes due 2026 (2.125% Notes) may dilute the ownership interest of AMD's existing stockholders, or may otherwise depress the price of its common stock; uncertainties involving the ordering and shipment of AMD’s products could materially adversely affect it; the demand for AMD’s products depends in part on the market conditions in the industries into which they are sold. Fluctuations in demand for AMD’s products or a market decline in any of these industries could have a material adverse effect on its results of operations; AMD’s ability to design and introduce new products in a timely manner is dependent upon third-party intellectual property; AMD depends on third-party companies for the design, manufacture and supply of motherboards, software and other computer platform components to support its business; if AMD loses Microsoft Corporation’s support for its products or other software vendors do not design and develop software to run on AMD’s products, its ability to sell
1
its products could be materially adversely affected; AMD’s reliance on third-party distributors and AIB partners subjects it to certain risks; AMD’s inability to continue to attract and retain qualified personnel may hinder its business; in the event of a change of control, AMD may not be able to repurchase its outstanding debt as required by the applicable indentures and its Secured Revolving Line of Credit, which would result in a default under the indentures and its Secured Revolving Line of Credit; the semiconductor industry is highly cyclical and has experienced severe downturns that have materially adversely affected, and may continue to materially adversely affect
its business in the future; acquisitions, divestitures and/or joint ventures could disrupt its business, harm its financial condition and operating results or dilute, or adversely affect the price of, its common stock; AMD’s business is dependent upon the proper functioning of its internal business processes and information systems and modification or interruption of such systems may disrupt its business, processes and internal controls; data breaches and cyber-attacks could compromise AMD’s intellectual property or other sensitive information, be costly to remediate and cause significant damage to its business and reputation; AMD’s operating results are subject to quarterly and seasonal sales patterns; if essential equipment, materials or manufacturing processes are not available to manufacture its products, AMD could be materially adversely affected; if AMD’s products are not compatible with some or all industry-standard software and hardware, it could be materially adversely affected; costs related to defective products could have a material adverse effect on AMD; if AMD fails to maintain the efficiency of its supply chain as it responds to changes in customer demand for its products, its business could be materially adversely affected; AMD outsources to third parties certain supply-chain logistics functions, including portions of its product distribution, transportation management and information technology support services; AMD may incur future impairments of goodwill; AMD's stock price is subject to volatility; AMD’s worldwide operations are subject to political, legal and economic risks and natural disasters, which could have a material adverse effect on it; worldwide political conditions may adversely affect demand for AMD’s products; unfavorable currency exchange rate fluctuations could adversely affect AMD; AMD’s inability to effectively control the sales of its products on the gray market could have a material adverse effect on it; if AMD cannot adequately protect its technology or other intellectual property in the United States and abroad, through patents, copyrights, trade secrets, trademarks and other measures, it may lose a competitive advantage and incur significant expenses; AMD is a party to litigation and may become a party to other claims or litigation that could cause it to incur substantial costs or pay substantial damages or prohibit it from selling its products; AMD’s business is subject to potential tax liabilities; and AMD is subject to environmental laws, conflict minerals-related provisions of the Dodd-Frank Wall Street Reform and Consumer Protection Act as well as a variety of other laws or regulations that could result in additional costs and liabilities.
For a discussion of the factors that could cause actual results to differ materially from the forward-looking statements, see “Part I, Item 1A-Risk Factors” and the “Financial Condition” section set forth in “Part II, Item 7-Management’s Discussion and Analysis of Financial Condition and Results of Operations,” or MD&A, beginning on page 37 below and such other risks and uncertainties as set forth below in this report or detailed in our other Securities and Exchange Commission (SEC) reports and filings. We assume no obligation to update forward-looking statements.
General
We are a global semiconductor company primarily offering:
•
x86 microprocessors, as standalone devices or as incorporated into an accelerated processing unit (APU), chipsets; discrete and integrated graphics processing units (GPUs), and professional GPUs; and
•
server and embedded processors and semi-custom System-on-Chip (SoC) products and technology for game consoles.
We also license portions of our intellectual property portfolio.
For financial information about geographic areas and for segment information with respect to revenues and operating results, refer to the information set forth in Note 13 of our consolidated financial statements, beginning on page 88 below.
We use a 52 or 53 week fiscal year ending on the last Saturday in December. The years ended
December 30, 2017
,
December 31, 2016
and
December 26, 2015
included
52
weeks,
53
weeks and
52
weeks, respectively. References in this report to
2017
,
2016
and
2015
refer to the fiscal year unless explicitly stated otherwise.
Additional Information
Advanced Micro Devices, Inc. (AMD) was incorporated under the laws of Delaware on May 1, 1969 and became a publicly held company in 1972. Our common stock is currently listed on The NASDAQ Capital Market (NASDAQ) under the symbol “AMD”. Our mailing address and executive offices are located at 2485 Augustine Drive, Santa Clara, California
2
95054, and our telephone number is (408) 749-4000. References in this Annual Report on Form 10-K to “AMD,” “we,” “us,” “management,” “our” or the “Company” mean Advanced Micro Devices, Inc. and our consolidated subsidiaries.
AMD, the AMD Arrow logo, AMD Athlon, AMD Geode, AMD Opteron, AMD Phenom, EPYC, FirePro, FreeSync, LiquidVR, Radeon, Ryzen, Sempron, Threadripper, Turion, and combinations thereof are trademarks of Advanced Micro Devices, Inc. Microsoft, Windows, Direct X, Xbox 360 and Xbox One are trademarks or registered trademarks of Microsoft Corporation in the United States and/or other jurisdictions.
PlayStation is a registered trademark of Sony Interactive Entertainment LLC. Wii and Wii U are registered trademarks of Nintendo of America, Inc. ARM is a registered trademark of ARM Limited (or its subsidiaries) in the UK and other countries. Vulkan and the Vulkan logo are trademarks of Khronos Group Inc.
Other names are for informational purposes only and are used to identify companies and products and may be trademarks of their respective owners.
Website Access to Our SEC Filings and Corporate Governance Documents
On the Investor Relations pages of our Website,
http://ir.amd.com
, we post links to our filings with the SEC, our Principles of Corporate Governance, our Code of Ethics for our executive officers, all other senior finance executives and certain representatives from legal and internal audit, our Worldwide Standards of Business Conduct, which applies to our Board of Directors and all of our employees, and the charters of the Audit and Finance, Compensation and Leadership Resources, Nominating and Corporate Governance and Innovation and Technology committees of our Board of Directors. Our filings with the SEC are posted as soon as reasonably practical after they are electronically filed with, or furnished to, the SEC. You can also obtain copies of these documents by writing to us at: Corporate Secretary, AMD, 7171 Southwest Parkway, M/S B100.2, Austin, Texas 78735, or emailing us at:
Corporate.Secretary@amd.com
. All of these documents and filings are available free of charge.
If we make substantive amendments to our Code of Ethics or grant any waiver, including any implicit waiver, to our principal executive officer, principal financial officer, principal accounting officer, controller or persons performing similar functions, we intend to disclose the nature of such amendment or waiver on our Website.
The information contained on our Website is not incorporated by reference in, or considered to be a part of, this report.
Our Industry
We are a global semiconductor company. Semiconductors are components used in a variety of electronic products and systems. An integrated circuit (IC) is a semiconductor device that consists of many interconnected transistors on a single chip. Since the invention of the transistor in 1948, improvements in IC process and design technologies have led to the development of smaller, more complex and more reliable ICs at a lower cost-per-function.
The x86 Microprocessor and Chipset Markets
Central Processing Unit (CPU)
. A microprocessor is an IC that serves as the CPU of a computer. It generally consists of hundreds of millions or billions of transistors that process data in a serial fashion and control other devices in the system, acting as the “brain” of the computer. The performance of a microprocessor is a critical factor impacting the performance of computing and entertainment platforms, such as desktop PCs, notebooks and workstations. The principal elements used to measure CPU performance are work-per-cycle (or how many instructions are executed per cycle), clock speed (representing the rate at which a CPU’s internal logic operates, measured in units of gigahertz, or billions of cycles per second) and power consumption. Other factors impacting microprocessor performance include the process technology used in its manufacture, the number and type of cores, the bit size of its instruction set (e.g., 32-bit vs 16-bit), memory size and data access speed.
Developments in IC design and manufacturing process technologies have resulted in significant advances in microprocessor performance. Since businesses and consumers require greater performance from their computer systems due to the growth of digital data and increasingly sophisticated software applications, multi-core microprocessors offer enhanced overall system performance and efficiency because computing tasks can be spread across two or more processing cores, each of which can execute a task at full speed. Multi-core microprocessors can simultaneously increase performance of a computer system without greatly increasing the total amount of power consumed and the total amount of heat emitted. Businesses and consumers also require computer systems with improved power management technology, which helps them to reduce the power consumption of their computer systems, enables smaller and more portable form factors, and lowers the total cost of ownership.
3
Graphics Processing Unit (GPU).
A GPU is a programmable logic chip that helps render images, animations and video and is increasingly being used to handle general computing tasks. GPUs are located in plug-in cards, as a discrete processor or in a chip on the motherboard, or in the same chip as the CPU as part of an accelerated processing unit (APU) or System-on-Chip (SoC). GPUs on stand-alone cards or discrete GPUs on the motherboard typically access their own memory, while GPUs in the chipset or CPU chip share main memory with the CPU.
GPUs perform parallel operations on data to render images for a video display and are essential to presenting computer generated images on that display, decoding and rendering animations and displaying video. The more sophisticated the GPU, the higher the resolution and the faster and smoother moving objects can be displayed on video display or in a virtual environment (virtual and augmented realities).
In addition to graphics processing, GPUs are used to perform parallel operations on multiple sets of data and are increasingly used to perform vector processing for non-graphics applications that require repetitive computations such as supercomputing, deep learning, artificial and machine intelligence, and various other applications (e.g., cryptocurrency mining).
Accelerated Processing Unit (APU).
Consumers increasingly demand computing devices with improved end-user experience, system performance and energy efficiency. Consumers also continue to demand thinner and lighter mobile devices, with better performance and longer battery life. We believe that a computing architecture that optimizes the use of its components can provide these improvements.
An APU is a processing unit that integrates a CPU and a GPU onto one chip (or one piece of silicon), along with, in some cases, other special-purpose components. This integration enhances system performance by “offloading” selected tasks to the best-suited component (i.e., the CPU or the GPU) to optimize component use, increasing the speed of data flow between the CPU and GPU through shared memory and allowing the GPU to function as both a graphics engine and an application accelerator. Having the CPU and GPU on the same chip also typically improves energy efficiency by, for example, eliminating connections between discrete chips.
Heterogeneous System Architecture (HSA) describes an industry standard that is an overarching design for having combinations of CPU and GPU processor cores that operate as a unified, integrated engine that shares system responsibilities and resources. AMD is a founding member of the HSA Foundation, a non-profit organization established to define and promote this open standards-based approach to heterogeneous computing. Heterogeneous computing allows for the elevation of the GPU to the same level of the CPU for memory access, queuing and execution. This capability allows software programmers to develop applications to more fully utilize GPU capabilities.
System-on-Chip (SoC)
. An SoC is a type of IC with a CPU, GPU and other components, such as a memory controller and peripheral management, comprising a complete computing system on a single chip. By combining all of these elements as an SoC, system performance and energy efficiency is improved, similar to an APU.
Chipset.
A chipset is a generic term referring to a collection of system level components that manage data flow among a microprocessor or microprocessors, memory and peripherals (such as CD ROM drives, DVD drives and USB peripherals). Chipsets perform essential logic functions, balance a system’s performance and provide system control and power management functions. Some chipsets have graphics capabilities by including an integrated graphics processor (IGP) within the chipset. A chipset with an IGP is known as an IGP chipset. IGP chipsets can offer a lower cost, reduced power alternative to a discrete GPU, and are often also used in smaller form factors. Systems that are powered by an APU or by a CPU and discrete GPU combination often do not have a chipset and instead use an AMD Controller Hub chip to perform the functions of a chipset. As a result, we believe that either an APU and AMD Controller Hub chip combination or an SoC, which already includes a chipset, will eventually replace the market for IGP chipsets.
Our x86 Microprocessor and Chipset Products
Our microprocessors are incorporated into computing platforms, which are a collection of technologies that are designed to work together to provide a more complete computing solution and to enable and advance the computing components. We believe that integrated, balanced computing platforms consisting of microprocessors, chipsets (either as discrete devices or integrated into an SoC) and GPUs (either as discrete GPUs or integrated into an APU or SoC) that work together at the system level bring end users improved system stability, increased performance and enhanced power efficiency. In addition, we believe our customers also benefit from an all-AMD platform (consisting of an APU or CPU, a discrete GPU, and an AMD Fusion Controller Hub chip when needed), as we are able to optimize interoperability, provide our customers a single point of contact for the key platform components and enable them to bring the platforms to market faster in a variety of client and server system form factors.
4
We currently base our microprocessors and chipsets on the x86 instruction set architecture and the AMD Direct Connect Architecture, which connects an on-chip memory controller and input/output (I/O) channels directly to one or more microprocessor cores. We typically integrate two or more processor cores onto a single die, and each core has its own dedicated cache, which is memory that is located on the semiconductor die, permitting quick access to frequently used data and instructions. Some of our microprocessors have additional levels of cache such as L2, or second-level cache, and L3, or third-level cache, to enable faster data access and higher performance.
We focus on continually improving the energy efficiency of our products through our design principles and innovations in power management technology. To that end, we offer CPUs, GPUs, APUs, SoCs and chipsets with multiple low power states that are designed to utilize lower clock speeds and voltages to reduce processor power consumption during active and idle times. The use of intelligent, dynamic power management is designed to create lower energy use by allowing compute applications to be completed quickly and efficiently, enabling a return to the ultra-low power idle state.
Desktop.
In 2017, we launched our first-generation AMD Ryzen™ desktop CPUs based on our new “Zen” x86 CPU core architecture. Our family of Ryzen processors are built on 14-nm Fin-FET process technology and they utilize our AM4 desktop platform. In March 2017, we released three 8-core, 16-thread models of our AMD Ryzen™ 7 desktop processors designed for PC Gamers, creators and enthusiasts. In April 2017, we launched all four models of our high performance AMD Ryzen™ 5 desktop processors at a variety of price points with up to 6 cores and 12 threads of CPU processing. We released two models of our AMD Ryzen™ 3 desktop processors in July 2017, both of which have 4 cores and 4 threads and are designed to bring “Zen” processing power to mainstream price points. In August 2017, we launched the Ryzen™ Threadripper™ family of high-end desktop processors. Ryzen Threadripper is also built around the “Zen” x86 core architecture, delivers up to 16 CPU cores and utilizes the Socket TR4 platform for greatly expanded I/O capabilities for enthusiasts and workstations.
In July 2017, we also launched the 7
th
Generation AMD A-Series APU for desktops, using the same AM4 platform as the Ryzen processor family. The 7
th
Generation APUs are based on the previous generation “Excavator” CPU core combined with Graphics Core Next (GCN) graphics. We also released the AMD Athlon™ X4 CPU for socket AM4, an entry-level processor solution for this desktop platform. We continue to offer AMD FX™ CPUs based on the “Piledriver” x86 multi-core architecture and AMD A-Series APUs utilizing previous generation platform architectures.
Notebooks and 2-in-1s.
We continue to invest in designing and developing high performing and low power APUs for notebook PC platforms for the consumer market. In October 2017, we announced AMD Ryzen 7 2700U and AMD Ryzen 5 2500U, our first mobile processors with Radeon™ Vega graphics, previously codenamed the “Raven Ridge” mobile APUs, for premium 2-in-1s, convertibles and ultra-thin notebook computers. AMD Ryzen 7 2700U and AMD Ryzen5 2500U processors combine the “Zen” x86 core architecture with Radeon™ Vega graphics in an SoC design. We also continue to offer AMD A-Series APUs and AMD E-Series APUs based on previous generation CPU and graphics architectures, primarily targeting the value and mainstream segments.
Chipsets.
During 2017, we launched a full suite of chipset products, the X370, the B350 and the A320 chipsets, that are combined with AMD Ryzen™ processors for the AM4 desktop platform. The X370 chipset is designed for enthusiast desktop platforms while the B350 is targeted for the performance segment and the A320 is focused on affordable mainstream platforms. We also launched the X300 and A300 chipsets designed for small form factors. We launched the X399 chipset, which pairs with our Ryzen Threadripper product line for High-End Desktops (HEDT) using the all-new socket TR4 platform. We also continue to offer AMD 9-Series chipsets for the Socket AM3/3+ platforms serving desktop PCs, and AMD A-Series Control Hubs for the Socket FM2/2+ platforms. We also offer AMD 785E, 780E, 780M, 690E, SR5690, SP5100, SB600, SB710, SB850 and M690E chipsets and AMD A-Series Controller Hubs for our embedded products.
Commercial.
We offer enterprise-class desktop and notebook PC solutions sold as AMD PRO for the commercial client market. AMD PRO solutions are designed to provide commercial-grade quality, platform longevity and extended image stability, and also include security and manageability features for enterprise customers. In June 2017, we launched AMD Ryzen™ PRO desktop processors, based on the same “Zen” x86 core architecture used in consumer desktops.
Graphics Market
The semiconductor graphics market addresses the need for improved visual and data processing in various computing devices. Many consumers value a rich visual experience to enable a more compelling and immersive experience, and, for these consumers, the PC has evolved from a traditional data processing and communications device to an entertainment platform. As a result, visual realism and graphical display capabilities are key product differentiation elements among computing devices. This has led to increasing creation and use of processing-intensive multimedia content for computing devices, including playing games, capturing media content, viewing online videos, editing photos and managing digital content. In turn, these trends have contributed to higher consumer demand for performance graphics solutions and to
5
manufacturers designing computing devices with these capabilities.
In addition to traditional graphics markets, there is a large and growing market for graphics compute which is primarily made up of high performance compute and machine learning/deep learning. Traditional high performance compute focuses on scientific research, model simulation, and exploration which is mainly driven by university and government research needs for high precision graphics compute workloads. The second market is the rapidly growing area of machine learning and deep learning workloads. Graphics processors are used both in the training of machine learning models as well as the application of models via inference. The expansion of compute workloads on graphics processors is driving market expansion for traditional graphics silicon.
We believe that the rise of cryptocurrency prices and introduction of new cryptocurrencies created a demand for our GPUs in 2017. The cryptocurrency market has existed for several years and their prices and popularity increased in 2017. The mining operation of cryptocurrencies are typically performed using specifically designed application-specific integrated circuits (ASICs); however, the introduction of new cryptocurrencies (e.g. Ethereum) have made mining on GPUs more efficient, providing a higher rate of return for the end user.
Our Graphics Products
Graphics processing is a fundamental component of almost everything we create and can be found in an APU, CPU, SoC or a combination of a discrete GPU with one of the other foregoing products working in tandem. Our customers generally use our graphics solutions to increase the speed of rendering images, to help improve image resolution and color definition, and increasingly to process massive data sets for cloud and datacenter applications. We develop our graphics products for use in various computing devices and entertainment platforms, including desktop PCs, notebook PCs, 2-in-1s, All-in-Ones (AIOs), professional workstations, and the datacenter. With each of our graphics products, we have available drivers and supporting software packages that enable the effective use of these products under a variety of operating systems and applications.
Our APUs deliver visual processing functionality for value and mainstream PCs by integrating a CPU and a GPU on a single chip, while discrete GPUs (which are also known as dGPUs) offer high performance graphics processing across all platforms. AMD Accelerated Parallel Processing or General Purpose GPU (GPGPU) refers to a set of advanced hardware and software technologies that enable discrete AMD GPUs, working in concert with the CPU, to accelerate computational tasks beyond traditional CPU processing by utilizing the vast number of discrete GPU cores while working with the CPU to process information cooperatively. In addition, computing devices with heterogeneous computing features run computationally-intensive tasks more efficiently, which we believe provides a superior application experience to the end user. Moreover, heterogeneous computing allows for the elevation of the GPU to the same level as the CPU for memory access, queuing and execution.
Discrete Desktop and Notebook Graphics
. Our discrete GPUs for desktop and notebook PCs support current generation application program interface (APIs) like DirectX® 12 and Vulkan™, support new displays using Radeon™ FreeSync™ and Radeon™ FreeSync 2™ technology, and are designed to support virtual reality (VR) in PC platforms. In January 2017, we announced Radeon FreeSync 2 technology to deliver smooth gameplay and advanced pixel integrity to gamers. Radeon FreeSync 2 harnesses low-latency, high brightness pixels, black levels and a wide color gamut to display High Dynamic Range (HDR). In April 2017, we introduced the Radeon™ RX 500 series, a new line of graphics cards based on 2nd generation “Polaris” architecture and addressing additional performance, power and cost segments. The Radeon RX 500 series was designed specifically for system upgrades. In June 2017, we launched Radeon™ Vega Frontier Edition powered by our “Vega” GPU architecture that expands the capacity of traditional GPU memory to 256TB allowing users to tackle massive datasets. We also launched the Radeon™ RX Vega family of GPUs. There are three variants of Radeon RX Vega cards: Radeon RX Vega
64
Liquid Cooling Edition; Radeon RX Vega
64
with air cooling; and Radeon RX Vega
56
.
Professional Graphics.
Our AMD Radeon™ Pro and AMD FirePro™ family of professional graphics products include 3D and 2D multi-view graphics cards and GPUs designed for integration in mobile and desktop workstations. AMD Radeon Pro graphics cards are designed for demanding use cases such as Design and Manufacturing for computer assisted design (CAD) and Digital Content Creation (DCC) for broadcast and animation pipelines. AMD Radeon Pro supports end users utilizing VR and augmented reality (AR) for professional use cases such as visualization for construction, architecture and mechanical design. Software drivers for AMD Radeon Pro cards are designed to deliver high stability and performance across a wide variety of software packages including those requiring certifications for end user use. Our AMD Radeon™ Instinct family of GPU products are specifically designed to address growing demand for datacenter applications, including deep learning training and inference, as well as traditional high performance computing (HPC) workloads such as simulation where the compute capabilities of GPUs provide exceptional flexibility and performance. Combined with our open software, Radeon Open Ecosystem Compute Platform (ROCm), we believe are delivering acceleration platforms to address intensive
6
predictive data analytics challenges while minimizing power and space needs in the datacenter.
We also provide the AMD FirePro S-Series GPU products for the server market, which target HPC primarily focused on artificial and machine intelligence, deep neutral networks (DNN), geosciences, biosciences, academic and government workloads, and virtual desktop infrastructure (VDI) use cases primarily focused on workstation-class virtualization, remote desktop and content streaming workloads. In April 2017, we announced a dual-GPU graphics card designed for professionals: the “Polaris” architecture-based Radeon™ Pro Duo card designed for media and entertainment, broadcast, and design and manufacturing workflows. In June 2017, we introduced Radeon™ Pro 500 Series graphics with up to 5.5 TFLOPS of performance and using “Polaris” GPU architecture. In July 2017, we introduced our new professional graphics cards, Radeon™ Pro WX 9100 and Radeon™ Pro SSG, based on the “Vega”GPU architecture. The Radeon Pro WX 9100 uses 16 GB of high-bandwidth cache and harnesses the high-bandwidth cache controller (HBCC) and advanced GPU memory architecture. The Radeon™ Pro SSG offers 2TB onboard solid state graphics (SSG) memory alongside the “Vega” GPU architecture. In addition, our Radeon Pro Software Adrenalin Edition supports Linux
®
. The Linux version of this driver combines an open-source core and AMD Radeon Pro graphics' technologies and performance. In 2017, we launched the Radeon Instinct MI25 server accelerator targeting data center applications including machine learning, deep learning, and artificial intelligence.
Enterprise, Embedded and Semi-Custom
The Enterprise, Embedded and Semi-Custom Markets
Server.
A server is a computer system that performs services for connected customers as part of a client-server architecture. Many servers are designed to run an application or applications often for extended periods of time with minimal human intervention. Examples of servers include cloud, web, e-mail and print servers. These servers can run a variety of applications, including business intelligence, enterprise resource planning, customer relationship management and advanced scientific or engineering models to solve advanced computational problems in disciplines ranging from financial modeling to weather forecasting to oil and gas exploration. Servers are also used in cloud computing, which is a computing model where data, applications and services are delivered over the internet or an intranet which can be rapidly provisioned and released with minimal effort. Today’s datacenters require new technologies and configuration models to meet the demand driven by the growing amount of data that needs to be stored, accessed and managed. Servers must be efficient, scalable and adaptable to meet the compute characteristics of new and changing workloads.
Embedded
.
Embedded products address computing needs in PC-adjacent markets, such as industrial control and automation, digital signage, point-of-sale/self-service kiosks, medical imaging and casino gaming machines as well as enterprise-class telecommunications, networking, security, storage systems and thin clients (which are computers that serve as an access device on a network). Typically, AMD embedded products are used in applications that require high to moderate levels of performance, where key features may include mobility, relatively low power, small form factor, and 24x7 operations. High-performance graphics are increasingly important in many embedded systems. Support for Linux
®
, Windows
®
and other operating systems as well as for increasingly sophisticated applications are also critical for some customers. Other requirements may include meeting rigid specifications for industrial temperatures, shock, vibration and reliability. The embedded market has moved from developing proprietary, custom designs to leveraging industry-standard instruction set architectures and processors as a way to help reduce costs and speed time to market.
Semi-Custom
.
We have leveraged our core IP, including our graphics and processing technologies developed for the gaming, VR, AR and machine intelligence markets, to develop semi-custom solutions for customers who want differentiation in their products. In this market, semiconductor suppliers work alongside system designers and manufacturers to enhance the performance and overall user experience for semi-custom customers. AMD has used this type of collaborative development approach with many of today’s leading game console manufacturers and can also address customer needs in many other markets beyond game consoles. AMD leverages our existing IP to create a variety of products tailored to a specific customer’s needs, ranging from complex fully-customized SoCs to more modest adaptations and integrations of existing CPU, APU or GPU products.
Our Enterprise, Embedded and Semi-Custom Products
Server Processors.
Our microprocessors for server platforms currently include the AMD EPYC™ Series processors and AMD Opteron™ Series processors. In June 2017, we launched the AMD EPYC™ 7000 Series of high performance processors that have up to 32 high-performance “Zen” compute cores and are designed to support a full range of integer, floating point, memory bandwidth and I/O benchmarks and workloads.
Embedded Processors
. Our embedded processors are increasingly driving intelligence into new areas of our lives, like interactive digital signage, casino gaming, and medical imaging devices. These products are designed to support greater connectivity and productivity, and we believe they can be a strong driver for the “internet of things” and “immersive
7
computing” areas in the computing industry. Our products for embedded platforms include AMD Embedded R-Series APU, CPU and SoC, AMD Embedded G-Series SoC platform and AMD Embedded Radeon™ GPUs. In October 2017, we announced the AMD Embedded Radeon™ E9170 Series GPU. The new processor is the first “Polaris” architecture-based AMD Embedded discrete GPU available in multi-chip module (MCM) format with integrated memory for smaller, power-efficient custom designs. The Embedded Radeon E9170 Series GPU is designed for devices that require premium graphics and expanded display capabilities.
Semi-Custom
.
Our semi-custom products are tailored, high-performance, customer-specific solutions based on AMD’s CPU, GPU and multi-media technologies. We work closely together with our customers to define solutions to precisely match the requirements of the device or application. Historically we have leveraged our core graphics processing technology into the game console market by licensing our graphic technology in game consoles such as the Microsoft
®
Xbox 360™ and Nintendo Wii and Wii U. More recently, we developed the semi-custom SoC products that power the Sony PlayStation®
4 and PlayStation
®
4 Pro and Microsoft
®
Xbox One™ and Xbox One S™ and new Xbox One X™ game consoles.
Marketing and Sales
We sell our products through our direct sales force and through independent distributors and sales representatives in both domestic and international markets. Our sales arrangements generally operate on the basis of product forecasts provided by the particular customer, but do not typically include any commitment or requirement for minimum product purchases. We primarily use purchase orders, sales order acknowledgments and contractual agreements as evidence of our sales arrangements. Our agreements typically contain standard terms and conditions covering matters such as payment terms, warranties and indemnities for issues specific to our products.
We generally warrant that our products sold to our customers will conform to our approved specifications and be free from defects in material and workmanship under normal use and conditions for one year. Subject to certain exceptions, we also offer a three-year limited warranty to end users for those CPU and APU products purchased as individually packaged products, commonly referred to as “processors in a box” (PIB) and for PC workstation products. We have also offered extended limited warranties to certain customers of “tray” microprocessor products and/or workstation graphics or server products who have written agreements with us and target their computer systems at the commercial and/or embedded markets.
We market and sell our latest products under the AMD trademark. Our desktop PC product brands for microprocessors are AMD Ryzen™, AMD Ryzen™ Pro, AMD Ryzen™, Threadripper™, AMD A-Series, AMD E-Series, AMD FX™ CPU, AMD Athlon™ CPU and APU, AMD Sempron™ APU and CPU and AMD Pro A-Series APU. Our notebook and 2-in-1s for microprocessors are AMD Ryzen™ processors with Radeon™ Vega GPUs, AMD A-Series, AMD E-Series, AMD C-Series, AMD Z-Series, AMD FX™ APU, AMD Phenom™, AMD Athlon CPU and APU, AMD Turion™ and AMD Sempron APU and CPU. Our server brands for microprocessors are AMD EPYC™ and AMD Opteron™. We also sell low-power versions of our AMD Opteron, AMD Athlon and AMD Sempron, as well as AMD Geode™, AMD R-Series and G-Series processors as embedded processor solutions. Our product brand for the consumer graphics market is AMD Radeon™, and AMD Embedded Radeon™ is our product brand for the embedded graphics market. Our product brand for professional graphics products are AMD Radeon™ Pro and AMD FirePro™. We also market and sell our chipsets under the AMD trademark.
We market our products through direct marketing and co-marketing programs. In addition, we have cooperative advertising and marketing programs with customers and third parties, including market development programs, pursuant to which we may provide product information, training, marketing materials and funds. Under our co-marketing development programs, eligible customers can use market development funds as reimbursement for advertisements and marketing programs related to our products and third-party systems integrating our products, subject to meeting defined criteria.
Customers
Our microprocessor customers consist primarily of original equipment manufacturers (OEMs), large direct datacenters, original design manufacturers (ODMs), system integrators and independent distributors in both domestic and international markets. ODMs provide design and/or manufacturing services to branded and unbranded private label resellers, OEMs and system builders. Our graphics product customers include the foregoing as well as add-in-board manufacturers (AIBs). Large direct datacenters consists of both cloud service providers and mega datacenter customers.
Customers of our chipset products consist primarily of PC and server OEMs, often through ODMs or other contract manufacturers, who build the OEM motherboards, as well as desktop and server motherboard manufacturers who incorporate chipsets into their channel motherboards.
We work closely with our customers to define product features, performance and timing of new products so that the
8
products we are developing meet our customers’ needs. We also employ application engineers to assist our customers in designing, testing and qualifying system designs that incorporate our products. We believe that our commitment to customer service and design support improves our customers’ time-to-market and fosters relationships that encourage customers to use the next generation of our products.
We also work with our customers to create differentiated products that leverage our CPU, GPU and APU technology. Customers of our semi-custom products pay us non-recurring engineering fees for design and development services and a purchase price for the resulting semi-custom products.
Our major customers, Sony Interactive Entertainment LLC and
Microsoft Corporation
, each accounted for more than 10% of our consolidated net revenue for the year ended
December 30, 2017
. Sales to
Sony Interactive Entertainment LLC
and
Microsoft Corporation
consisted of products from our Enterprise, Embedded and Semi-Custom segment. A loss of any of these customers would have a material adverse effect on our business.
Original Equipment Manufacturers
We focus on three types of OEM customers: multi-nationals, selected regional accounts and target market customers. Large multi-nationals and regional accounts are our core OEM customers. Our OEM customers include numerous foreign and domestic manufacturers of servers and workstations, desktops, notebooks, PC motherboards and game consoles.
Third-Party Distributors
Our authorized channel distributors resell to sub-distributors and mid-sized and smaller OEMs and ODMs. Typically, distributors handle a wide variety of products, and may include those that compete with our products. Distributors typically maintain an inventory of our products. In most instances, our agreements with distributors protect their inventory of our products against price reductions and provide return rights with respect to any product that we have removed from our price book that is not more than 12 months older than the manufacturing code date. In addition, some agreements with our distributors may contain standard stock rotation provisions permitting limited levels of product returns.
Add-in-Board (AIB) Manufacturers and System Integrators
We offer component-level graphics and chipset products to AIB manufacturers who in turn build and sell board-level products using our technology to system integrators (SIs), retail buyers and sub distributors. Our agreements with AIBs protect their inventory of our products against price reductions. We also sell directly to our SI customers. SIs typically sell from positions of regional or product-based strength in the market. They usually operate on short design cycles and can respond quickly with new technologies. SIs often use discrete graphics solutions as a means to differentiate their products and add value to their customers.
Competition in the Microprocessor and Chipset Market
Intel Corporation has been the market share leader for microprocessors for many years. Intel’s market share, margins and significant financial resources enable it to market its products aggressively, to target our customers and our channel partners with special incentives and to influence customers who do business with us. These aggressive activities have in the past resulted in lower unit sales and a lower average selling price for many of our products and adversely affected our margins and profitability.
Intel exerts substantial influence over computer manufacturers and their channels of distribution through various brand and other marketing programs. As a result of Intel’s position in the microprocessor market, Intel has been able to control x86 microprocessor and computer system standards and benchmarks and to dictate the type of products the microprocessor market requires of us. Intel also dominates the computer system platform, which includes core logic chipsets, graphics chips, motherboards and other components necessary to assemble a computer system. OEMs that purchase microprocessors for computer systems are highly dependent on Intel, which can make them less innovative on their own and, to a large extent, can become distributors of Intel technology. Additionally, Intel is able to drive de facto standards and specifications for x86 microprocessors that could cause us and other companies to have delayed access to such standards.
As long as Intel remains in this dominant position, we may be materially adversely affected by Intel’s:
|
•
|
business practices, including rebating and allocation strategies and pricing actions which may limit our market share and margins;
|
|
•
|
product mix and introduction schedules;
|
|
•
|
product bundling, marketing and merchandising strategies;
|
|
•
|
exclusivity payments to its current and potential customers, retailers and channel partners that require or result
|
9
in exclusive product arrangements;
|
•
|
de facto control over industry standards, and heavy influence on PC manufacturers and other PC industry participants, including motherboard, memory, chipset and basic input/output system, or BIOS, suppliers and software companies as well as the graphics interface for Intel platforms; and
|
|
•
|
marketing and advertising expenditures in support of positioning the Intel brand over the brand of its OEM customers and retailers.
|
Intel has substantially greater financial resources than we do and accordingly spends substantially greater amounts on marketing and research and development than we do. We expect Intel to maintain its market position and to continue to invest heavily in marketing, research and development, new manufacturing facilities and other technology companies. To the extent Intel manufactures a significantly larger portion of its microprocessor products using more advanced process technologies, or introduces competitive new products into the market before we do, we may be more vulnerable to Intel’s aggressive marketing and pricing strategies for microprocessor products.
Intel could take actions that place our discrete GPUs at a competitive disadvantage, including giving one or more of our competitors in the graphics market, such as Nvidia Corporation, preferential access to its proprietary graphics interface or other useful information. Also, Intel recently announced that it is developing their own high-end discrete GPUs. Intel’s position in the microprocessor market and integrated graphics chipset market, its introduction of competitive new products, its existing relationships with top-tier OEMs and its aggressive marketing and pricing strategies could result in lower unit sales and lower average selling prices for our products, which could have a material adverse effect on us.
Other competitors include a variety of companies providing or developing ARM-based designs at relatively low cost and low power processors for the computing market including tablets and thin-client form factors, as well as dense servers, set-top boxes and gaming consoles. ARM Holdings designs and licenses its ARM cores and architecture to third parties, including us, and offers supporting software and services. Our ability to compete with companies who use ARM-based solutions depends on our ability to timely design and bring to market energy-efficient, high-performing products at an attractive price point.
In the chipset market, our competitors include suppliers of IGP chipsets. PC manufacturers use IGP chipsets because they typically cost less than traditional discrete GPUs while offering acceptable graphics performance for most mainstream PC users. Intel also leverages its dominance in the microprocessor market to sell its IGP chipsets. Intel manufactures and sells IGP chipsets bundled with their microprocessors and is our main competitor in this market.
Competition in the Graphics Markets
In the graphics market, our competitors include suppliers of discrete graphics, embedded graphics processors and IGP chipsets. Intel manufactures and sells embedded graphics processors and IGP chipsets, and is a dominant competitor with respect to this portion of our business. Higher unit shipments of our APUs and Intel’s integrated graphics may drive computer manufacturers to reduce the number of systems they build paired with discrete graphics components, particularly for notebooks, because they may offer satisfactory graphics performance for most mainstream PC users, at a lower cost. Intel could take actions that place our discrete GPUs and IGP chipsets at a competitive disadvantage such as giving one or more of our competitors in the graphics market, such as Nvidia Corporation, preferential access to its proprietary graphics interface or other useful information. Also, Intel recently announced that it is developing its own high-end discrete GPUs.
Our principal competitor in the discrete graphics market is Nvidia. AMD and Nvidia are the two principal companies offering discrete graphics solutions. Other competitors include a number of smaller companies, which may have greater flexibility to address specific market needs, but less financial resources to do so, especially as we believe that the growing complexity of graphics processors and the associated research and development costs represent an increasingly higher barrier to entry in this market.
In the semi-custom game console products, where graphics performance is critical, we compete primarily against Nvidia.
Research and Development
We focus our research and development activities on improving product performance and enhancing product design. Our main area of focus is on delivering the next generation of CPU and GPU IP, and designing that IP into our SoCs for our next generation of products, with, in each case, improved system performance and performance-per-watt characteristics. For example, we are focusing on improving the battery life of our APU products for notebooks, the power efficiency of our microprocessors for servers and the performance and power efficiency of our discrete GPUs. We are also focusing on delivering a range of low-power integrated platforms to serve key markets, including commercial clients, mobile computing
10
and gaming. We believe that these platforms will bring customers increased performance and energy efficiency. We also work with industry leaders on process technology, software and other functional intellectual property and with others in the industry and industry consortia to conduct early stage research and development.
Our research and development expenses for
2017
,
2016
and
2015
were approximately
$1.2 billion
,
$1.0 billion
and
$947 million
, respectively. For more information, see “Part II, Item 7-Management’s Discussion and Analysis of Financial Condition and Results of Operations” below.
We conduct product and system research and development activities for our products in the United States with additional design and development engineering teams located in Australia, China, Canada, India, Singapore and Taiwan.
Manufacturing Arrangements and Assembly and Test Facilities
Third-Party Wafer Foundry Facilities
GLOBALFOUNDRIES Inc
.
On March 2, 2009, we entered into a Wafer Supply Agreement (WSA) with GLOBALFOUNDRIES Inc. (GF). The WSA governs the terms by which we purchase products manufactured by GF, a related party to us. Pursuant to the WSA, we are required to purchase all of our microprocessor and APU product requirements, and a certain portion of our GPU product requirements from GF with limited exceptions. For more information about the WSA, see “Part II, Item 7- Management’s Discussion and Analysis of Financial Condition and Results of Operations- GLOBALFOUNDRIES,” below.
Taiwan Semiconductor Manufacturing Company
. We also have foundry arrangements with Taiwan Semiconductor Manufacturing Company (TSMC) for the production of wafers for certain products.
Other Third-Party Manufacturers
. We outsource board-level graphics product manufacturing to third-party manufacturers.
Assembly, Test, Mark and Packaging Facilities
Wafers for our products are delivered from third-party foundries to our test, assembly and packaging partners located in the Asia-Pacific region who package and test our final semiconductor products.
On April 29, 2016, we and certain of our subsidiaries completed the sale of a majority of the equity interests in two of our assembly, test, mark and packaging facilities, Suzhou TF-AMD Semiconductor Co., Ltd. (formerly, AMD Technologies (China) Co., Ltd.) and TF AMD Microelectronics (Penang) Sdn. Bhd. (formerly, Advanced Micro Devices Export Sdn. Bhd.) to affiliates of Tongfu Fujitsu Microelectronics, Co., Ltd., or TFME (formerly, Nantong Fujitsu Microelectronics Co., Ltd.) to form two joint ventures (each an ATMP JV). As a result of the sale, TFME’s affiliates own 85% of the equity interests in each ATMP JV while certain of our subsidiaries own the remaining 15%.
Intellectual Property and Licensing
We rely on contracts and intellectual property rights to protect our products and technologies from unauthorized third-party copying and use. Intellectual property rights include copyrights, patents, patent applications, trademarks, trade secrets and mask work rights. As of
December 30, 2017
, we had approximately 5,033 patents in the United States and approximately 872 patent applications pending in the United States. In certain cases, we have filed corresponding applications in foreign jurisdictions. Including United States and foreign matters, we have approximately 10,564 patent matters worldwide consisting of approximately 7,955 issued patents and 2,609 patent applications pending. We expect to file future patent applications in both the United States and abroad on significant inventions, as we deem appropriate. We do not believe that any individual patent, or the expiration of any patent, is or would be material to our business.
As is typical in the semiconductor industry, we have numerous cross-licensing and technology exchange agreements with other companies under which we both transfer and receive technology and intellectual property rights. One such agreement is the cross-license agreement that we entered into with Intel on November 11, 2009. Under the cross-license agreement, we granted to Intel and Intel granted to us, non-exclusive, royalty-free licenses to all of each other’s patents that were first filed no later than November 11, 2014 and each party can exploit these patents anywhere in the world for making and selling certain semiconductor- and electronic-related products. Under the cross-license agreement, Intel has rights to make semiconductor products for third parties, but the third-party product designs are not licensed as a result of such manufacture. We have rights to perform assembly and testing for third parties but not rights to make semiconductor products for third parties. The term of the cross-license agreement continues until the expiration of the last to expire of the licensed patents, unless earlier terminated. A party can terminate the cross-license agreement or the rights and licenses of
11
the other party if the other party materially breaches the cross-license agreement and does not correct the noticed material breach within 60 days. Upon such termination, the terminated party’s license rights terminate but the terminating party’s license rights continue, subject to that party’s continued compliance with the terms of the cross-license agreement. The cross-license agreement will automatically terminate if a party undergoes a change of control (as defined in the cross license agreement), and both parties’ licenses will terminate. Upon the bankruptcy of a party, that party may assume, but may not assign, the cross-license agreement, and in the event that the cross-license agreement cannot be assumed, the cross-license agreement and the licenses granted will terminate.
Backlog
Sales are made primarily pursuant to purchase orders for current delivery or agreements covering purchases over a period of time. Some of these orders or agreements may be revised or canceled without penalty. Generally, in light of current industry practice, we do not believe that such orders or agreements provide meaningful backlog figures or are necessarily indicative of actual sales for any succeeding period. With respect to our semi-custom SoC products, our orders and agreements are more stringent resulting in meaningful backlog for the coming quarter.
Seasonality
Our operating results tend to vary seasonally. For example, historically, first quarter PC product sales are generally lower than fourth quarter sales and with respect to our semi-custom SoC products for game consoles, our sales patterns generally follow the seasonal trends of consumer business with sales in the first half of the year being lower than sales in the second half of the year. Following the adoption of the new revenue recognition standard (ASC606) effective in the first quarter of 2018, we expect our seasonality trends to be affected as we will recognize certain revenue earlier than prior to the adoption of the new revenue recognition standard. For example, we expect our second and third quarter sales to be higher than first and fourth quarter sales for our semi-custom SoC products for game consoles.
Employees
As of
December 30, 2017
, we had approximately 8,900 employees.
Environmental Regulations
Our operations and properties have in the past been and continue to be subject to various United States and foreign laws and regulations, including those relating to materials used in our products and manufacturing processes, discharge of pollutants into the environment, the treatment, transport, storage and disposal of solid and hazardous wastes and remediation of contamination. These laws and regulations require our suppliers to obtain permits for operations making our products, including the discharge of air pollutants and wastewater. Although our management systems are designed to oversee our suppliers' compliance, we cannot assure you that our suppliers have been or will be at all times in complete compliance with such laws, regulations and permits. If our suppliers violate or fail to comply with any of them, a range of consequences could result, including fines, suspension of production, alteration of manufacturing processes, import/export restrictions, sales limitations, criminal and civil liabilities or other sanctions. We could also be held liable for any and all consequences arising out of exposure to hazardous materials used, stored, released, disposed of by us or located at, under or emanating from our facilities or other environmental or natural resource damage. While we have budgeted for foreseeable associated expenditures, we cannot assure you that future environmental legal requirements will not become more stringent or costly in the future. Therefore, we cannot assure you that our costs of complying with current and future environmental and health and safety laws, and our liabilities arising from past and future releases of, or exposure to, hazardous substances will not have a material adverse effect on us.
Environmental laws are complex, change frequently and have tended to become more stringent over time. For example, the European Union (EU) and China are two among a growing number of jurisdictions that have enacted restrictions on the use of lead and other materials in electronic products. These regulations affect semiconductor devices and packaging. As regulations restricting materials in electronic products continue to increase around the world, there is a risk that the cost, quality and manufacturing yields of products that are subject to these restrictions, may be less favorable compared to products that are not subject to such restrictions, or that the transition to compliant products may not meet customer roadmaps, or produce sudden changes in demand, which may result in excess inventory. A number of jurisdictions including the EU, Australia, California and China are developing or have finalized market entry or public procurement regulations for computers and servers based on ENERGY STAR specifications as well as additional energy consumption limits. There is the potential for certain of our products being excluded from some of these markets which could materially adversely affect us.
Certain environmental laws, including the U.S. Comprehensive, Environmental Response, Compensation and Liability
12
Act of 1980, or the Superfund Act, impose strict or, under certain circumstances, joint and several liability on current and previous owners or operators of real property for the cost of removal or remediation of hazardous substances and impose liability for damages to natural resources. These laws often impose liability even if the owner or operator did not know of, or was not responsible for, the release of such hazardous substances. These environmental laws also assess liability on persons who arrange for hazardous substances to be sent to disposal or treatment facilities when such facilities are found to be contaminated. Such persons can be responsible for cleanup costs even if they never owned or operated the contaminated facility. We have been named as a responsible party at three Superfund sites in Sunnyvale, California. Although we have not yet been, we could be named a potentially responsible party at other Superfund or contaminated sites in the future. In addition, contamination that has not yet been identified could exist at our other facilities.
Under the Dodd-Frank Wall Street Reform and Consumer Protection Act of 2010, the SEC adopted disclosure and reporting requirements for companies that use “conflict” minerals originating from the Democratic Republic of Congo or adjoining countries. We continue to incur additional costs associated with complying with these requirements, such as costs related to developing internal controls for the due diligence process, determining the source of any conflict minerals used in our products, auditing the process and reporting to our customers and the SEC. In addition to the SEC regulation, the European Union, China and other jurisdictions are developing new policies focused on conflict minerals that may impact and increase the cost of our compliance program. Also, since our supply chain is complex, we may face reputational challenges if we are unable to sufficiently verify the origins of the subject minerals. Moreover, we are likely to encounter challenges to satisfy those customers who require that all of the components of our products are certified as “conflict free.” If we cannot satisfy these customers, they may choose a competitor’s products.
13
The risks and uncertainties described below are not the only ones we face. If any of the following risks actually occurs, our business, financial condition or results of operations could be materially adversely affected. In addition, you should consider the interrelationship and compounding effects of two or more risks occurring simultaneously.
Intel Corporation’s dominance of the microprocessor market and its aggressive business practices may limit our ability to compete effectively.
Intel Corporation has been the market share leader for microprocessors for many years. Intel’s market share, margins and significant financial resources enable it to market its products aggressively, to target our customers and our channel partners with special incentives and to influence customers who do business with us. These aggressive activities have in the past and are likely in the future to result in lower unit sales and a lower average selling price for many of our products and adversely affect our margins and profitability.
Intel exerts substantial influence over computer manufacturers and their channels of distribution through various brand and other marketing programs. As a result of Intel’s position in the microprocessor market, Intel has been able to control x86 microprocessor and computer system standards and benchmarks and to dictate the type of products the microprocessor market requires of us. Intel also dominates the computer system platform, which includes core logic chipsets, graphics chips, motherboards and other components necessary to assemble a computer system. Additionally, Intel is able to drive de facto standards and specifications for x86 microprocessors that could cause us and other companies to have delayed access to such standards.
Intel has substantially greater financial resources than we do and accordingly spends substantially greater amounts on marketing and research and development than we do. We expect Intel to maintain its market position and to continue to invest heavily in marketing, research and development, new manufacturing facilities and other technology companies. To the extent Intel manufactures a significantly larger portion of its microprocessor products using more advanced process technologies, or introduces competitive new products into the market before we do, we may be more vulnerable to Intel’s aggressive marketing and pricing strategies for microprocessor products. For example, Intel has introduced microprocessors for low-cost notebooks, similar to products that we offer for low-cost notebooks.
As long as Intel remains in this dominant position, we may be materially adversely affected by Intel’s:
|
•
|
business practices, including rebating and allocation strategies and pricing actions, designed to limit our market share and margins;
|
|
•
|
product mix and introduction schedules;
|
|
•
|
product bundling, marketing and merchandising strategies;
|
|
•
|
exclusivity payments to its current and potential customers, retailers and channel partners;
|
|
•
|
de facto control over industry standards, and heavy influence on PC manufacturers and other PC industry participants, including motherboard, memory, chipset and basic input/output system, or BIOS, suppliers and software companies as well as the graphics interface for Intel platforms; and
|
|
•
|
marketing and advertising expenditures in support of positioning the Intel brand over the brand of its original equipment manufacturer OEM customers and retailers.
|
Intel could also take actions that place our discrete GPUs at a competitive disadvantage, including giving one or more of our competitors in the graphics market, such as Nvidia Corporation, preferential access to its proprietary graphics interface or other useful information. Also, Intel recently announced that it is developing their own high-end discrete GPUs.Intel’s position in the microprocessor market and integrated graphics chipset market, its introduction of competitive new products, its existing relationships with top-tier OEMs and its aggressive marketing and pricing strategies could result in lower unit sales and a lower average selling price for our products, which could have a material adverse effect on us.
We have a wafer supply agreement with GF with obligations to purchase all of our microprocessor and APU product requirements, and a certain portion of our GPU product requirements from GF, with limited exceptions. If GF is not able to satisfy our manufacturing requirements, our business could be adversely impacted.
The WSA governs the terms by which we purchase products manufactured by GF. The WSA is in place until 2024. Pursuant to the WSA, we are required to purchase all of our microprocessor and APU product requirements, and a portion of our GPU product requirements from GF with limited exceptions. If GF is unable to achieve anticipated manufacturing yields, remain competitive using or implementing advanced leading-edge process technologies needed to manufacture future generations of our products, manufacture our products on a timely basis at competitive prices or meet our capacity requirements, then we may experience delays in product launches, supply shortages for certain products or increased costs and our business could be materially adversely affected. Moreover, if GF is unable to satisfy our manufacturing requirements and we are unable to secure from GF
14
additional exceptions allowing us to contract with another wafer foundry to satisfy those requirements, then our business could be materially adversely affected.
In August 2016, we entered into the sixth amendment to the WSA with GF (Sixth Amendment) pursuant to which we agreed to certain annual wafer purchase targets through 2020, and if we fail to meet the agreed wafer purchase target during a calendar year we will be required to pay to GF a portion of the difference between our actual wafer purchases and the applicable annual purchase target. If our actual wafer requirements are less than the number of wafers required to meet the applicable annual wafer purchase target, we could have excess inventory or higher inventory unit costs, both of which may adversely impact our gross margin and our results of operations.
In addition, GF has relied on Mubadala Technology Investments LLC (Mubadala Tech) for its funding needs. If Mubadala Tech fails to adequately fund GF on a timely basis, or at all, GF’s ability to manufacture products for us could be materially adversely affected.
We rely on third parties to manufacture our products, and if they are unable to do so on a timely basis in sufficient quantities and using competitive technologies, our business could be materially adversely affected.
We rely on third-party wafer foundries to fabricate the silicon wafers for all of our products. We also rely on third-party manufacturers to assemble, test, mark and pack (ATMP) our products. It is important to have reliable relationships with all of these third-party manufacturing suppliers to ensure adequate product supply to respond to customer demand.
We cannot guarantee that these manufacturers or our other third-party manufacturing suppliers will be able to meet our near-term or long-term manufacturing requirements. If we experience supply constraints from our third-party manufacturing suppliers, we may be required to allocate the affected products amongst our customers, which could have a material adverse effect on our relationships with these customers and on our financial condition. In addition, if we are unable to meet customer demand due to fluctuating or late supply from our manufacturing suppliers, it could result in lost sales and have a material adverse effect on our business.
We do not have long-term commitment contracts with some of our third-party manufacturing suppliers. We obtain some of these manufacturing services on a purchase order basis and these manufacturers are not required to provide us with any specified minimum quantity of product beyond the quantities in an existing purchase order. Accordingly, we depend on these suppliers to allocate to us a portion of their manufacturing capacity sufficient to meet our needs, to produce products of acceptable quality and at acceptable manufacturing yields and to deliver those products to us on a timely basis and at acceptable prices. The manufacturers we use also fabricate wafers and ATMP products for other companies, including certain of our competitors. They could choose to prioritize capacity for other customers, increase the prices that they charge us on short notice or reduce or eliminate deliveries to us, which could have a material adverse effect on our business.
Other risks associated with our dependence on third-party manufacturers include limited control over delivery schedules and quality assurance, lack of capacity in periods of excess demand, misappropriation of our intellectual property, dependence on several small undercapitalized subcontractors and limited ability to manage inventory and parts. Moreover, if any of our third-party manufacturers suffer any damage to facilities, lose benefits under material agreements, experience power outages, lack sufficient capacity to manufacture our products, encounter financial difficulties, are unable to secure necessary raw materials from their suppliers or suffer any other disruption or reduction in efficiency, we may encounter supply delays or disruptions. If we are unable to secure sufficient or reliable supplies of products, our ability to meet customer demand may be adversely affected and this could materially affect our business.
If we transition the production of some of our products to new manufacturers, we may experience delayed product introductions, lower yields or poorer performance of our products. If we experience problems with product quality or are unable to secure sufficient capacity from a particular third-party manufacturer, or if we for other reasons cease utilizing one of those suppliers, we may be unable to secure an alternative supply for any specific product in a short time frame. We could experience significant delays in the shipment of our products if we are required to find alternative third-party manufacturers, which could have a material adverse effect on our business.
In April 2016, we consummated a transaction with Tongfu Fujitsu Microelectronics Co., Ltd. (formerly, Nantong Fujitsu Microelectronics Co., Ltd.) (TFME), under which we sold to TFME 85% of the equity interests in our ATMP facilities consisting of Suzhou TF-AMD Semiconductor Co., Ltd. (formerly AMD Technologies (China) Co., Ltd.) and TF-AMD Microelectronics (Penang) Sdn. Bhd. (formerly Advanced Micro Devices Export Sdn. Bhd.) thereby forming two joint ventures (collectively, the JVs). The majority of our ATMP services will be provided by the JVs and there is no guarantee that the JVs will be able to fulfill our long-term ATMP requirements. If we are unable to meet customer demand due to fluctuating or late supply from the JVs, it could result in lost sales and have a material adverse effect on our business.
15
Failure to achieve expected manufacturing yields for our products could negatively impact our financial results.
Semiconductor manufacturing yields are a result of both product design and process technology, which is typically proprietary to the manufacturer, and low yields can result from design failures, process technology failures or a combination of both. Our third-party foundries, including GF, are responsible for the process technologies used to fabricate silicon wafers. If our third-party foundries experience manufacturing inefficiencies or encounter disruptions, errors or difficulties during production, we may fail to achieve acceptable yields or experience product delivery delays. We cannot be certain that our third-party foundries will be able to develop, obtain or successfully implement leading-edge process technologies needed to manufacture future generations of our products profitably or on a timely basis or that our competitors will not develop new technologies, products or processes earlier. Moreover, during periods when foundries are implementing new process technologies, their manufacturing facilities may not be fully productive. A substantial delay in the technology transitions to smaller process technologies could have a material adverse effect on us, particularly if our competitors transition to more cost effective technologies before us. Any decrease in manufacturing yields could result in an increase in per unit costs, which would adversely impact our gross margin and/or force us to allocate our reduced product supply amongst our customers, which could harm our relationships and reputation with our customers and materially adversely affect our business.
The success of our business is dependent upon our ability to introduce products on a timely basis with features and performance levels that provide value to our customers while supporting and coinciding with significant industry transitions.
Our success depends to a significant extent on the development, qualification, implementation and acceptance of new product designs and improvements that provide value to our customers. Our ability to develop, qualify and distribute, and have manufactured, new products and related technologies to meet evolving industry requirements, at prices acceptable to our customers and on a timely basis are significant factors in determining our competitiveness in our target markets. For example, a large portion of our Computing and Graphics revenue is focused on consumer desktop PC and notebook. While overall growth in Computing and Graphics is stabilizing, the areas within Computing and Graphics are changing. Our ability to take advantage of the opportunities within the areas of Computing and Graphics is based on foreseeing those changes and making timely investments in the form factors that serve those areas. As consumers adopt new form factors, have new product feature preferences or have different requirements than those consumers in the PC market, PC sales could be negatively impacted, which could adversely impact our business. Our product roadmap includes AMD Ryzen™ and AMD EPYC™ processors based on our new x86 processor core codenamed “Zen” to help drive our re-entry into high-performance and server computing. We cannot assure you that our efforts to execute our product roadmap and address markets beyond our core PC market will result in innovative products and technologies that provide value to our customers. If we fail to or are delayed in developing, qualifying or shipping new products or technologies that provide value to our customers and address these new trends or if we fail to predict which new form factors consumers will adopt and adjust our business accordingly, we may lose competitive positioning, which could cause us to lose market share and require us to discount the selling prices of our products. Although we make substantial investments in research and development, we cannot be certain that we will be able to develop, obtain or successfully implement new products and technologies on a timely basis or that they will be well-received by our customers. Moreover, our investments in new products and technologies involve certain risks and uncertainties and could disrupt our ongoing business. New investments may not generate sufficient revenue, may incur unanticipated liabilities and may divert our limited resources and distract management from our current operations. We cannot be certain that our ongoing investments in new products and technologies will be successful, will meet our expectations and will not adversely affect our reputation, financial condition and operating results.
Delays in developing, qualifying or shipping new products can also cause us to miss our customers’ product design windows or, in some cases, breach contractual obligations or cause us to pay penalties. If our customers do not include our products in the initial design of their computer systems or products, they will typically not use our products in their systems or products until at least the next design configuration. The process of being qualified for inclusion in a customer’s system or product can be lengthy and could cause us to further miss a cycle in the demand of end-users, which also could result in a loss of market share and harm our business. In addition, market demand requires that products incorporate new features and performance standards on an industry-wide basis. Over the life of a specific product, the sale price is typically reduced over time. The introduction of new products and enhancements to existing products is necessary to maintain the overall corporate average selling price. If we are unable to introduce new products with sufficiently high sale prices or to increase unit sales volumes capable of offsetting the reductions in the sale prices of existing products over time, our business could be materially adversely affected.
If we cannot generate sufficient revenue and operating cash flow or obtain external financing, we may face a cash shortfall and be unable to make all of our planned investments in research and development or other strategic investments.
Our ability to fund research and development expenditures depends on generating sufficient revenue and cash flow from operations and the availability of external financing, if necessary. Our research and development expenditures, together with ongoing operating expenses, will be a substantial drain on our cash flow and may decrease our cash balances. If new competitors, technological advances by existing competitors or other competitive factors require us to invest significantly greater resources
16
than anticipated in our research and development efforts, our operating expenses would increase. If we are required to invest significantly greater resources than anticipated in research and development efforts without an increase in revenue, our operating results could decline.
We regularly assess markets for external financing opportunities, including debt and equity financing. Additional debt or equity financing may not be available when needed or, if available, may not be available on satisfactory terms. The health of the credit markets may adversely impact our ability to obtain financing when needed. Any downgrades from credit rating agencies such as Moody’s or Standard & Poor’s may adversely impact our ability to obtain external financing or the terms of such financing. Credit agency downgrades or concerns regarding our credit worthiness may impact relationships with our suppliers, who may limit our credit lines. Our inability to obtain needed financing or to generate sufficient cash from operations may require us to abandon projects or curtail planned investments in research and development or other strategic initiatives. If we curtail planned investments in research and development or abandon projects, our products may fail to remain competitive and our business would be materially adversely affected.
The loss of a significant customer may have a material adverse effect on us.
Collectively, Sony Interactive Entertainment LLC, Microsoft Corporation and HP Inc. accounted for approximately
44%
of our consolidated net revenue for the year ended December 30, 2017. Sales to Sony and Microsoft consisted of products from our Enterprise, Embedded and Semi-Custom segment and sales to HP consisted primarily of products from our Computing and Graphics segment. We expect that a small number of customers will continue to account for a substantial part of revenue of our businesses in the future. If one of our key customers decides to stop buying our products, or if one of these customers materially reduces or reorganizes its operations or its demand for our products, our business would be materially adversely affected.
Our receipt of revenue from our semi-custom SoC products is dependent upon our technology being designed into third-party products and the success of those products.
The revenue that we receive from our semi-custom SoC products is in the form of non-recurring engineering fees charged to third parties for design and development services and revenue received in connection with sales of our semi-custom SoC products to these third parties. As a result, our ability to generate revenue from our semi-custom products depends on our ability to secure customers for our semi-custom design pipeline, our customers’ desire to pursue the project, and our semi-custom SoC products being incorporated into those customer’s products. Any revenue from sales of our semi-custom SoC products is directly related to sales of the third-party’s products and reflective of their success in the market. Moreover, we have no control over the marketing efforts of these third parties, and we cannot make any assurances that sales of their products will be successful in current or future years. Consequently, the semi-custom SoC product revenue expected by us may not be fully realized and our operating results may be adversely affected.
Our products may be subject to security vulnerabilities that could have a material adverse effect on us
.
The products that we sell are complex and may be subject to security vulnerabilities that could result in, among other things, the loss, corruption, theft or misuse of confidential data or system performance issues. Our efforts to prevent and address security vulnerabilities may decrease performance, be only partially effective or not successful at all. We may also depend on third parties, such as customers, vendors and end users, to deploy our mitigations or create their own, and they may delay, decline or modify the implementation of such mitigations. Our relationships with our customers could be adversely affected as some of our customers may stop purchasing our products, reduce or delay future purchases of our products, or use competing products. Any of these actions by our customers could adversely affect our revenue. We also are subject to claims and litigation related to the recently disclosed side-channel exploits, such as Spectre, and may face additional claims or litigation for future vulnerabilities. Actual or perceived security vulnerabilities of our products may subject us to adverse publicity, damage to our brand and reputation, and could materially harm our business or financial results.
Global economic uncertainty may adversely impact our business and operating results.
Uncertain global economic conditions have in the past and may in the future adversely impact our business, including, without limitation, a slowdown in the Chinese economy, one of the largest global markets for desktop and notebook PCs. Uncertainty in the worldwide economic environment may negatively impact consumer confidence and spending causing our customers to postpone purchases. In addition, during challenging economic times, our current or potential future customers may experience cash flow problems and as a result may modify, delay or cancel plans to purchase our products. Additionally, if our customers are not successful in generating sufficient revenue or are unable to secure financing, they may not be able to pay, or may delay payment of, accounts receivable that they owe us. The risk related to our customers’ potentially defaulting on or delaying payments to us is increased because we expect that a small number of customers will continue to account for a substantial part of our revenue. Any inability of our current or potential future customers to pay us for our products may adversely affect our earnings and cash flow. Moreover, our key suppliers may reduce their output or become insolvent, thereby adversely impacting
17
our ability to manufacture our products. In addition, uncertain economic conditions may make it more difficult for us to raise funds through borrowings or private or public sales of debt or equity securities.
We may not be able to generate sufficient cash to service our debt obligations or meet our working capital requirements.
Our ability to make payments on and to refinance our debt will depend on our financial and operating performance, which may fluctuate significantly from quarter to quarter, and is subject to prevailing economic conditions and financial, business and other factors, many of which are beyond our control. We cannot assure you that we will be able to generate cash flow or that we will be able to borrow funds, including under our secured revolving line of credit for a principal amount up to $500 million (our Secured Revolving Line of Credit), in amounts sufficient to enable us to service our debt or to meet our working capital requirements. If we are not able to generate sufficient cash flow from operations or to borrow sufficient funds to service our debt, we may be required to sell assets or equity, reduce expenditures, refinance all or a portion of our existing debt or obtain additional financing. We cannot assure you that we will be able to refinance our debt, sell assets or equity, borrow funds under our Secured Revolving Line of Credit or borrow more funds on terms acceptable to us, if at all.
We have a large amount of indebtedness which could adversely affect our financial position and prevent us from implementing our strategy or fulfilling our contractual obligations.
Our total debt as of December 30, 2017 was $1.4 billion, net of unamortized debt issuance costs and unamortized debt discount associated with the 2.125% Notes. Our large indebtedness may:
|
•
|
make it difficult for us to satisfy our financial obligations, including making scheduled principal and interest payments;
|
|
•
|
limit our ability to borrow additional funds for working capital, capital expenditures, acquisitions and general corporate and other purposes;
|
|
•
|
limit our ability to use our cash flow or obtain additional financing for future working capital, capital expenditures, acquisitions or other general corporate purposes;
|
|
•
|
require us to use a substantial portion of our cash flow from operations to make debt service payments;
|
|
•
|
place us at a competitive disadvantage compared to our competitors with relatively less debt; and
|
|
•
|
increase our vulnerability to the impact of adverse economic and industry conditions.
|
We enter into sale and factoring arrangements from time to time with respect to certain of our accounts receivables, which arrangements are non-recourse to us in the event that an account debtor fails to pay for credit-related reasons, and are not included in our indebtedness. We could become obligated to repurchase such accounts receivables or otherwise incur liability to the counterparties under these arrangements under certain circumstances, such as where a commercial dispute arises between us and an account debtor.
The agreements governing our notes and our Secured Revolving Line of Credit impose restrictions on us that may adversely affect our ability to operate our business.
The indentures governing our 6.75% Senior Notes due 2019 (6.75% Notes), 7.50% Senior Notes due 2022 (7.50% Notes) and 7.00% Senior Notes due 2024 (7.00% Notes) contain various covenants which limit our ability to, among other things:
|
•
|
incur additional indebtedness;
|
|
•
|
pay dividends and make other restricted payments;
|
|
•
|
make certain investments, including investments in our unrestricted subsidiaries;
|
|
•
|
create or permit certain liens;
|
|
•
|
create or permit restrictions on the ability of certain restricted subsidiaries to pay dividends or make other distributions to us;
|
|
•
|
use the proceeds from sales of assets;
|
|
•
|
enter into certain types of transactions with affiliates; and
|
|
•
|
consolidate or merge or sell our assets as an entirety or substantially as an entirety.
|
In addition, the Amended and Restated Loan Agreement restricts our ability to make cash payments on the notes to the extent that, on the date of such payment, a default or event of default exists under the Amended and Restated Loan Agreement, or we have not had at all times during the 45 consecutive days immediately preceding such payment, or would not have, on a pro forma basis after giving effect to such payment, Excess Cash Availability (as defined in the Amended and Restated Loan Agreement) of at least $50 million. Any of our future debt agreements may contain similar restrictions. If we fail to make any cash payment on a series of notes when required by the applicable indenture, it would constitute an event of default under such indenture, which, in turn, would constitute an event of default under the agreements governing our other indebtedness.
18
Our Secured Revolving Line of Credit also contains various covenants which limit our ability to, among other things, make certain investments, merge or consolidate with other entities and permit certain subsidiaries from incurring indebtedness. In addition, further restrictions apply when certain payment conditions (the Payment Conditions) are not satisfied with respect to specified transactions, events or payments. The Payment Conditions include that (i) no default or event of default exists and (ii) at all times during the 45 consecutive days immediately prior to such transaction, event or payment and on a pro forma basis after giving effect to such transaction, event or payment and any incurrence or repayment of indebtedness in connection therewith, the Excess Cash Availability (as defined in the Amended and Restated Loan Agreement) available cash is greater than the greater of 15% of the total commitment amount and $75 million. If Payment Conditions are not satisfied under certain circumstances, we will become subject to various additional covenants which limit our ability to, among other things:
|
•
|
create liens upon any of the Loan Parties’ property (other than customary permitted liens and liens in respect of up to $1.5 billion of secured credit facilities debt (which amount includes our Secured Revolving Line of Credit);
|
|
•
|
declare or make cash distributions;
|
|
•
|
create any encumbrance on the ability of a subsidiary to make any upstream payments;
|
|
•
|
make asset dispositions other than certain ordinary course dispositions and certain supply chain finance arrangements;
|
|
•
|
make certain loans, make payments with respect to subordinated debt or certain borrowed money prior to its due date; and
|
|
•
|
enter into any non-arm’s-length transaction with an affiliate (except for certain customary exceptions).
|
The agreements governing our notes and our Secured Revolving Line of Credit contain cross-default provisions whereby a default under one agreement would likely result in cross defaults under agreements covering other borrowings. For example, the occurrence of a default with respect to any indebtedness or any failure to repay debt when due in an amount in excess of $50 million would cause a cross default under the indentures (to the extent such default would result in the acceleration of such indebtedness) governing our 6.75% Notes, 7.50% Notes, 7.00% Notes and 2.125% Notes, as well as under our Secured Revolving Line of Credit. The occurrence of a default under any of these borrowing arrangements would permit the applicable note holders or the lenders under our Secured Revolving Line of Credit to declare all amounts outstanding under those borrowing arrangements to be immediately due and payable. If the note holders or the trustee under the indentures governing our 6.75% Notes, 7.50% Notes, 7.00% Notes or 2.125% Notes or the lenders under our Secured Revolving Line of Credit accelerate the repayment of borrowings, we cannot assure you that we will have sufficient assets to repay those borrowings.
The markets in which our products are sold are highly competitive.
The markets in which our products are sold are very competitive and delivering the latest and best products to market on a timely basis is critical to achieving revenue growth. We believe that the main factors that determine our product competitiveness are timely product introductions, product quality, product features and capabilities (including enabling state-of-the-art visual and virtual reality experience), energy efficiency (including power consumption and battery life), reliability, processor clock speed, performance, size (or form factor), selling price, cost, adherence to industry standards (and the creation of open industry standards), level of integration, software and hardware compatibility, security and stability, brand recognition and availability.
We expect that competition will continue to be intense due to rapid technological changes, frequent product introductions by our competitors or new competitors of products that may provide better performance/experience or may include additional features that render our products uncompetitive. We may also face aggressive pricing by competitors, especially during challenging economic times. Some competitors may have greater access or rights to complementary technologies, including interface, processor and memory technical information. For instance, with the introduction of our APU products and other competing solutions with integrated graphics, we believe that demand for additional discrete graphics chips and cards may decrease in the future due to improvements in the quality and performance of integrated graphics. In addition, our competitors have significant marketing and sales resources which could increase the competitive environment in such a declining market, leading to lower prices and margins. If competitors introduce competitive new products into the market before us, demand for our products could be adversely impacted and our business could be adversely affected.
In addition, we are entering markets with current and new competitors who may be able to adapt more quickly to customer requirements and emerging technologies. We cannot assure you that we will be able to compete successfully against current or new competitors who may have stronger positions in these new markets or superior ability to anticipate customer requirements and emerging industry trends. We may face delays or disruptions in research and development efforts, or we may be required to invest significantly greater resources in research and development than anticipated.
19
Our issuance to West Coast Hitech L.P. (WCH) of warrants to purchase 75 million shares of our common stock, if and when exercised, will dilute the ownership interests of our existing stockholders, and the conversion of the 2.125% Notes may dilute the ownership interest of our existing stockholders, or may otherwise depress the price of our common stock.
In consideration for the limited waiver and rights under the Sixth Amendment, we issued warrants to WCH to purchase 75 million shares of our common stock. Any issuance by us of shares of our common stock to WCH upon exercise of the warrants will dilute the ownership interests of our existing stockholders. Any sales in the public market by WCH of any shares owned by WCH could adversely affect prevailing market prices of our common stock, and the anticipated exercise by WCH of the warrants could depress the price of our common stock.
Also, the conversion of some or all of the 2.125% Notes may dilute the ownership interests of our existing stockholders. All of the 2.125% Notes were convertible at the option of their holders prior to their scheduled term from October 1, 2017 until December 31, 2017. Any sales in the public market of our common stock issuable upon such conversion could adversely affect prevailing market prices of our common stock. In addition, the existence of the 2.125% Notes may encourage short selling by market participants because the conversion thereof could be used to satisfy short positions, or the anticipated conversion of the 2.125% Notes into cash and/or shares of our common stock could depress the price of our common stock.
Uncertainties involving the ordering and shipment of our products could materially adversely affect us.
We typically sell our products pursuant to individual purchase orders. We generally do not have long-term supply arrangements with our customers or minimum purchase requirements except that orders generally must be for standard pack quantities. Generally, our customers may cancel orders for standard products more than 30 days prior to shipment without incurring significant fees. We base our inventory levels in part on customers’ estimates of demand for their products, which may not accurately predict the quantity or type of our products that our customers will want in the future or ultimately end up purchasing. Our ability to forecast demand is even further complicated when our products are sold indirectly through downstream channel distributors and customers, as our forecasts for demand are then based on estimates provided by multiple parties throughout the downstream channel.
PC and consumer markets are characterized by short product lifecycles, which can lead to rapid obsolescence and price erosion. In addition, our customers may change their inventory practices on short notice for any reason. We may build inventories during periods of anticipated growth, and the cancellation or deferral of product orders or overproduction due to failure of anticipated orders to materialize, could result in excess or obsolete inventory, which could result in write-downs of inventory and an adverse effect on gross margins.
Factors that may result in excess or obsolete inventory, which could result in write-downs of the value of our inventory, a reduction in the average selling price or a reduction in our gross margin include:
|
•
|
a sudden or significant decrease in demand for our products;
|
|
•
|
a production or design defect in our products;
|
|
•
|
a higher incidence of inventory obsolescence because of rapidly changing technology and customer requirements;
|
|
•
|
a failure to accurately estimate customer demand for our products, including for our older products as our new products are introduced; or
|
|
•
|
our competitors introducing new products or taking aggressive pricing actions.
|
The demand for our products depends in part on the market conditions in the industries into which they are sold. Fluctuations in demand for our products or a market decline in any of these industries could have a material adverse effect on our results of operations.
Industry-wide fluctuations in the computer marketplace have materially adversely affected us in the past and may materially adversely affect us in the future. A large portion of our Computing and Graphics revenue is focused on the consumer desktop PC and notebook segments, which have experienced and continue to experience a decline driven by, among other factors, the adoption of smaller and other form factors, increased competition and changes in replacement cycles. The success of our semi-custom SoC products is dependent on securing customers for our semi-custom design pipeline and consumer market conditions, including the success of the Sony PlayStation
®
4, Sony PlayStation
®
4 Pro, Microsoft Xbox One, Microsoft Xbox One S and Microsoft Xbox One X game console systems worldwide. In addition, the GPU market has seen elevated demand due to the application of GPU products to cryptocurrency mining. For example, our GPU revenue has been driven in part due to an increased interest in cryptocurrency mining. The cryptocurrency market is unstable and demand could change quickly. For example, China and South Korea have recently instituted restrictions on cryptocurrency trading. If we are unable to manage the risks related to a decrease in the demand for cryptocurrency mining, our GPU business could be materially adversely affected.
20
Our ability to design and introduce new products in a timely manner is dependent upon third-party intellectual property.
In the design and development of new and enhanced products, we rely on third-party intellectual property such as software development tools and hardware testing tools. Furthermore, certain product features may rely on intellectual property acquired from third parties. The design requirements necessary to meet customer demand for more features and greater functionality from semiconductor products may exceed the capabilities of the third-party intellectual property or development tools available to us. If the third-party intellectual property that we use becomes unavailable, is not available with required functionality and performance in the time frame or price point needed for our new products or fails to produce designs that meet customer demands, our business could be materially adversely affected.
We depend on third-party companies for the design, manufacture and supply of motherboards, software and other computer platform components to support our business.
We depend on third-party companies for the design, manufacture and supply of motherboards, graphics cards, software (e.g. BIOS, operating systems, drivers) and other components that our customers utilize to support and/or use our microprocessor, GPU and APU offerings. We also rely on AIBs to support our GPU and APU products. In addition, our microprocessors are not designed to function with motherboards and chipsets designed to work with Intel microprocessors. If the designers, manufacturers, AIBs and suppliers of motherboards, graphics cards, software and other components decrease their support for our product offerings, our business could be materially adversely affected.
If we lose Microsoft Corporation’s support for our products or other software vendors do not design and develop software to run on our products, our ability to sell our products could be materially adversely affected.
Our ability to innovate beyond the x86 instruction set controlled by Intel depends partially on Microsoft designing and developing its operating systems to run on or support our x86-based microprocessor products. With respect to our graphics products, we depend in part on Microsoft to design and develop its operating system to run on or support our graphics products. Similarly, the success of our products in the market, such as our APU products, is dependent on independent software providers designing and developing software to run on our products. If Microsoft does not continue to design and develop its operating systems so that they work with our x86 instruction sets or does not continue to develop and maintain their operating systems to support our graphics products, independent software providers may forego designing their software applications to take advantage of our innovations and customers may not purchase PCs with our products. In addition, some software drivers licensed for use with our products are certified by Microsoft. If Microsoft did not certify a driver, or if we otherwise fail to retain the support of Microsoft or other software vendors, our ability to market our products would be materially adversely affected.
Our reliance on third-party distributors and AIB partners subjects us to certain risks.
We market and sell our products directly and through third-party distributors and AIB partners pursuant to agreements that can generally be terminated for convenience by either party upon prior notice to the other party. These agreements are non-exclusive and permit both our distributors and AIBs to offer our competitors’ products. We are dependent on our distributors and AIBs to supplement our direct marketing and sales efforts. If any significant distributor or AIB or a substantial number of our distributors or AIBs terminated their relationship with us, decided to market our competitors’ products over our products or decided not to market our products at all, our ability to bring our products to market would be impacted and we would be materially adversely affected. If we are unable to manage the risks related to the use of our third-party distributors and AIB partners or offer appropriate incentives to focus them on the sale of our products, our business could be materially adversely affected.
Additionally, distributors and AIBs typically maintain an inventory of our products. In most instances, our agreements with distributors protect their inventory of our products against price reductions, as well as provide return rights for any product that we have removed from our price book and that is not more than 12 months older than the manufacturing code date. Some agreements with our distributors also contain standard stock rotation provisions permitting limited levels of product returns. Our agreements with AIBs protect their inventory of our products against price reductions. In the event of a significant decline in the price of our products, the price protection rights we offer would materially adversely affect us because our revenue and corresponding gross margin would decline.
Our inability to continue to attract and retain qualified personnel may hinder our business.
Much of our future success depends upon the continued service of numerous qualified engineering, marketing, sales and executive personnel. Competition for highly skilled employees and executives in the technology industry is intense. If we are not able to continue to attract, train and retain qualified personnel necessary for our business, the progress of our product development programs could be hindered, and we could be materially adversely affected. To help attract, retain and motivate qualified personnel, we use share-based incentive awards such as employee stock options and non-vested share units (restricted stock units). If the value of such stock awards does not appreciate as measured by the performance of the price of our common
21
stock, or if our share-based compensation otherwise ceases to be viewed as a valuable benefit, our ability to attract, retain and motivate personnel could be weakened, which could harm our results of operations. Also, if the value of our stock awards increases substantially, this could potentially create great personal wealth for our employees and affect our ability to retain these employees. In addition, our current and any future restructuring plans may adversely impact our ability to attract and retain key employees.
In the event of a change of control, we may not be able to repurchase our outstanding debt as required by the applicable indentures and our Secured Revolving Line of Credit, which would result in a default under the indentures and our Secured Revolving Line of Credit.
Upon a change of control, we will be required to offer to repurchase all of our 6.75% Notes, 7.50% Notes, 7.00% Notes and 2.125% Notes then outstanding at 101% of the principal amount thereof, plus accrued and unpaid interest, if any, up to, but excluding, the repurchase date. In addition, a change of control would be an event of default under our Secured Revolving Line of Credit. As of December 30, 2017,
$70 million
borrowings were outstanding under the Secured Revolving Line of Credit,
$19 million
related to letters of credit under the Secured Revolving Line of Credit remained outstanding and $1.6 billion principal amount was outstanding under our notes. Future debt agreements may contain similar provisions. We may not have the financial resources to repurchase our outstanding notes and prepay all of our outstanding obligations under our Secured Revolving Line of Credit.
The semiconductor industry is highly cyclical and has experienced severe downturns that have materially adversely affected, and may continue to materially adversely affect, our business in the future.
The semiconductor industry is highly cyclical and has experienced significant downturns, often in conjunction with constant and rapid technological change, wide fluctuations in supply and demand, continuous new product introductions, price erosion and declines in general economic conditions. We have incurred substantial losses in recent downturns, due to:
|
•
|
substantial declines in average selling prices;
|
|
•
|
the cyclical nature of supply and demand imbalances in the semiconductor industry;
|
|
•
|
a decline in demand for end-user products (such as PCs) that incorporate our products; and
|
|
•
|
excess inventory levels.
|
Industry-wide fluctuations in the computer marketplace have materially adversely affected us in the past and may materially adversely affect us in the future. For example, a large portion of our Computing and Graphics revenue is focused on consumer desktop PC and notebook segments. While the overall growth in these segments is stabilizing, the sub-segments of these markets are changing. Our ability to take advantage of the growth in these sub-segments is based on foreseeing those changes and making timely investments in the form factors that serve those growing sub-segments.
Global economic uncertainty and weakness have in the past impacted the semiconductor market as consumers and businesses have deferred purchases, which negatively impacted demand for our products. Our financial performance has been, and may in the future be, negatively affected by these downturns.
The growth of our business is also dependent on continued demand for our products from high-growth adjacent emerging global markets. Our ability to be successful in such markets depends in part on our ability to establish adequate local infrastructure, as well as our ability to cultivate and maintain local relationships in these markets. If demand from these markets is below our expectations, sales of our products may decrease, which would have a material adverse effect on us.
Acquisitions, divestitures and/or joint ventures could disrupt our business, harm our financial condition and operating results or dilute, or adversely affect the price of, our common stock.
Our success will depend, in part, on our ability to expand our product offerings and grow our business in response to changing technologies, customer demands and competitive pressures. In some circumstances, we may pursue growth through the acquisition of complementary businesses, solutions or technologies or through divestitures or joint ventures rather than through internal development. The identification of suitable acquisition or joint venture candidates can be difficult, time-consuming and costly, and we may not be able to successfully complete identified acquisitions or joint ventures. Moreover, if such acquisitions or joint ventures require us to seek additional debt or equity financing, we may not be able to obtain such financing on terms favorable to us or at all. Even if we successfully complete an acquisition or a joint venture, we may not be able to assimilate and integrate effectively or efficiently the acquired business, technologies, solutions, assets, personnel or operations, particularly if key personnel of the acquired company decide not to work for us. Acquisitions and joint ventures may also involve the entry into geographic or business markets in which we have little or no prior experience. Consequently, we may not achieve anticipated benefits of the acquisitions or joint ventures which could harm our operating results. In addition, to complete an acquisition, we may issue equity securities, which would dilute our stockholders’ ownership and could adversely affect the price of our common stock, as well as incur debt, assume contingent liabilities or have amortization expenses and write-downs of acquired assets,
22
which could adversely affect our results of operations. Acquisitions and joint ventures may also reduce our cash available for operations and other uses, which could harm our business. Also, any failure on our part to effectively evaluate and execute new business initiatives could adversely affect our business. We may not adequately assess the risk of new business initiatives and subsequent events may arise that alter the risks that were initially considered.
Furthermore, we may not achieve the objectives and expectations with respect to future operations, products and services. In 2016, we consummated the transaction with TFME, under which we sold to TFME 85% of the equity interests in our JVs. Going forward, we expect the majority of our ATMP services will be provided by the JVs and there is no guarantee that the JVs will be able to fulfill our long-term ATMP requirements. If we are unable to meet customer demand due to fluctuating or late supply from the JVs, it could result in lost sales and have a material adverse effect on our business.
In addition, we may not realize the anticipated benefits from any new business initiatives. For example, in connection with our strategy of licensing portions of our intellectual property portfolio, in 2016, we entered into a joint venture with Tianjin Haiguang Advanced Technology Investment Co., Ltd. (THATIC), comprised of two separate legal entities, China JV1 and China JV2 (collectively, the THATIC JV). The primary purpose of the THATIC JV is to support our expansion into the server and workstation product market in China. We also licensed certain of our intellectual property (Licensed IP) to the THATIC JV for license fees payable over several years contingent upon achievement of certain milestones. We also expect to receive a royalty based on the sales of the THATIC JV’s products to be developed on the basis of such Licensed IP. We may not realize the expected benefits from this joint venture, including the THATIC JV’s expected future performance, the receipt of any future milestone payments from the Licensed IP, and the receipt of any royalty payments from future sales of products by the THATIC JV.
Our business is dependent upon the proper functioning of our internal business processes and information systems and modification or interruption of such systems may disrupt our business, processes and internal controls.
We rely upon a number of internal business processes and information systems to support key business functions, and the efficient operation of these processes and systems is critical to our business. Our business processes and information systems need to be sufficiently scalable to support the growth of our business and may require modifications or upgrades that expose us to a number of operational risks. As such, our information systems will continually evolve and adapt in order to meet our business needs. These changes may be costly and disruptive to our operations and could impose substantial demands on management time.
These changes may also require changes in our information systems, modification of internal control procedures and significant training of employees and third-party resources. We continuously work on simplifying our information systems and applications through consolidation and standardization efforts. There can be no assurance that our business and operations will not experience any disruption in connection with this transition. Our information technology systems, and those of third-party information technology providers or business partners, may also be vulnerable to damage or disruption caused by circumstances beyond our control including catastrophic events, power anomalies or outages, natural disasters, viruses or malware, cyber-attacks, data breaches and computer system or network failures, exposing us to significant cost, reputational harm and disruption or damage to our business.
In addition, as our IT environment continues to evolve, we are embracing new ways of communicating and sharing data internally and externally with customers and partners using methods such as mobility and the cloud that can promote business efficiency. However, these practices can also result in a more distributed IT environment, making it more difficult for us to maintain visibility and control over internal and external users, and meet scalability and administrative requirements. If our security controls cannot keep pace with the speed of these changes, or if we are not able to meet regulatory and compliance requirements, our business would be materially adversely affected.
Data breaches and cyber-attacks could compromise our intellectual property or other sensitive information, be costly to remediate and cause significant damage to our business and reputation.
In the ordinary course of our business, we maintain sensitive data on our networks, and also may maintain sensitive information on our business partners' and third party providers' networks, including our intellectual property and proprietary or confidential business information relating to our business and that of our customers and business partners. The secure maintenance of this information is critical to our business and reputation. We believe that companies have been increasingly subject to a wide variety of security incidents, cyber-attacks, hacking and phishing attacks, and other attempts to gain unauthorized access. These threats can come from a variety of sources, all ranging in sophistication from an individual hacker to a state-sponsored attack. Cyber threats may be generic, or they may be custom-crafted against our information systems. Cyber-attacks have become increasingly more prevalent and much harder to detect and defend against. Our network and storage applications, as well as those of our customers, business partners, and third party providers, may be subject to unauthorized access by hackers or breached due to operator error, malfeasance or other system disruptions. It is often difficult to anticipate or immediately detect such incidents and the damage caused by such incidents. These data breaches and any unauthorized access, misuse or disclosure of our information or intellectual property could compromise our intellectual property and expose sensitive business information. Cyber-attacks on
23
us or our customers, business partners or third party providers could also cause us to incur significant remediation costs, result in product development delays, disrupt key business operations and divert attention of management and key information technology resources. These incidents could also subject us to liability, expose us to significant expense and cause significant harm to our reputation and business. In addition, we are currently subject to claims and could be subject to to additional claims in the future for damages resulting from loss of data from alleged vulnerabilities in the security of our processors. We also maintain confidential and personally identifiable information about our workers. The integrity and protection of our worker data is critical to our business and our workers have a high expectation that we will adequately protect their personal information. We anticipate an increase in costs related to:
|
•
|
implementing new data security procedures, including costs related to upgrading computer and network security;
|
|
•
|
training workers to maintain and monitor our security measures;
|
|
•
|
remediating any data security breach and addressing the related litigation; and
|
|
•
|
mitigating reputational harm.
|
We often partner with third-party providers for certain worker services and we may provide certain limited worker information to such third parties based on the scope of the services provided to us. However, if these third parties fail to adopt or adhere to adequate data security practices, or in the event of a breach of their networks, our workers’ data may be improperly accessed, used or disclosed. A breach of data privacy is likely to cause significant disruption of our business operations. Failure to adequately maintain and update our security systems could materially adversely affect our operations and our ability to maintain worker confidence. Failure to prevent unauthorized access to electronic and other confidential information and data breaches could materially adversely affect our financial condition, our competitive position and operating results.
Our operating results are subject to quarterly and seasonal sales patterns.
A large portion of our quarterly sales have historically been made in the last month of the quarter. This uneven sales pattern makes prediction of revenue for each financial period difficult and increases the risk of unanticipated variations in quarterly results and financial condition. In addition, our operating results tend to vary seasonally with the markets in which our products are sold. For example, historically, first quarter PC product sales are generally lower than fourth quarter sales and with respect to our semi-custom SoC products for game consoles, our sales patterns generally follow the seasonal trends of consumer business with sales in the first half of the year being lower than sales in the second half of the year. Following the adoption of the new revenue recognition standard (ASC 606) effective in the first quarter of 2018, we expect our seasonality trends to be affected as we will recognize certain revenue earlier than prior to the adoption of the new revenue recognition standard. For example, we expect our secon
d
and third quarter sales to be higher than first and fourth quarter sales for our semi-custom SoC products for game consoles.
Many of the factors that create and affect quarterly and seasonal trends are beyond our control.
If essential equipment, materials or manufacturing processes are not available to manufacture our products, we could be materially adversely affected.
We may purchase equipment and materials for our back-end manufacturing operations from a number of suppliers and our operations depend upon obtaining deliveries of adequate supplies of equipment and materials on a timely basis. Our third-party suppliers also depend on the same timely delivery of adequate quantities of equipment and materials in the manufacture of our products. In addition, as many of our products increase in technical complexity, we rely on our third-party suppliers to update their processes in order to continue meeting our back-end manufacturing needs. Certain equipment and materials that are used in the manufacture of our products are available only from a limited number of suppliers, or in some cases, a sole supplier. We also depend on a limited number of suppliers to provide the majority of certain types of integrated circuit packages for our microprocessors, including our APU products. Similarly, certain non-proprietary materials or components such as memory, printed circuit boards (PCBs), interposers, substrates and capacitors used in the manufacture of our products are currently available from only a limited number of sources. Because some of the equipment and materials that we and our third-party manufacturing suppliers purchase are complex, it is sometimes difficult to substitute one supplier for another. From time to time, suppliers may extend lead times, limit supply or increase prices due to capacity constraints or other factors. Also, some of these materials and components may be subject to rapid changes in price and availability. Interruption of supply or increased demand in the industry could cause shortages and price increases in various essential materials. Dependence on a sole supplier or a limited number of suppliers exacerbates these risks. If we are unable to procure certain of these materials for our back-end manufacturing operations, or our third-party foundries or manufacturing suppliers are unable to procure materials for manufacturing our products, our business would be materially adversely affected.
24
If our products are not compatible with some or all industry-standard software and hardware, we could be materially adversely affected.
Our products may not be fully compatible with some or all industry-standard software and hardware. Further, we may be unsuccessful in correcting any such compatibility problems in a timely manner. If our customers are unable to achieve compatibility with software or hardware, we could be materially adversely affected. In addition, the mere announcement of an incompatibility problem relating to our products could have a material adverse effect on our business.
Costs related to defective products could have a material adverse effect on us.
Products as complex as those we offer may contain defects or failures when first introduced or when new versions or enhancements to existing products are released. We cannot assure you that, despite our testing procedures, errors will not be found in new products or releases after commencement of commercial shipments in the future, which could result in loss of or delay in market acceptance of our products, material recall and replacement costs, loss of revenue, writing down the inventory of defective products, the diversion of the attention of our engineering personnel from product development efforts, defending against litigation related to defective products or related liabilities, including property damage, personal injury, damage to our reputation in the industry and loss of data or intangible property, and could adversely affect our relationships with our customers. In addition, we may have difficulty identifying the end customers of the defective products in the field. As a result, we could incur substantial costs to implement modifications to correct defects. Any of these problems could materially adversely affect our business.
We could be subject to potential product liability claims if one of our products causes, or merely appears to have caused, an injury, whether tangible or intangible. Claims may be made by consumers or others selling our products, and we may be subject to claims against us even if an alleged injury is due to the actions of others. A product liability claim, recall or other claim with respect to uninsured liabilities or for amounts in excess of insured liabilities could have a material adverse effect on our business.
If we fail to maintain the efficiency of our supply chain as we respond to changes in customer demand for our products, our business could be materially adversely affected.
Our ability to meet customer demand for our products depends, in part, on our ability to deliver the products our customers want on a timely basis. Accordingly, we rely on our supply chain for the manufacturing, distribution and fulfillment of our products. As we continue to grow our business, expand to high-growth adjacent markets, acquire new customers and strengthen relationships with existing customers, the efficiency of our supply chain will become increasingly important because many of our customers tend to have specific requirements for particular products, and specific time-frames in which they require delivery of these products. If we are unable to consistently deliver the right products to our customers on a timely basis in the right locations, our customers may reduce the quantities they order from us, which could have a material adverse effect on our business.
We outsource to third parties certain supply-chain logistics functions, including portions of our product distribution, transportation management and information technology support services.
We rely on third-party providers to operate our regional product distribution centers and to manage the transportation of our work-in-process and finished products among our facilities, to our manufacturing suppliers and to our customers. In addition, we rely on third parties to provide certain information technology services to us, including help desk support, desktop application services, business and software support applications, server and storage administration, datacenter operations, database administration and voice, video and remote access. We cannot guarantee that these providers will fulfill their respective responsibilities in a timely manner in accordance with the contract terms, in which case our internal operations and the distribution of our products to our customers could be materially adversely affected. Also, we cannot guarantee that our contracts with these third-party providers will be renewed, in which case we would have to transition these functions in-house or secure new providers, which could have a material adverse effect on our business if the transition is not executed appropriately.
We may incur future impairments of goodwill.
We perform our annual goodwill impairment analysis as of the first day of the fourth quarter of each year. Subsequent to our annual goodwill impairment analysis, we monitor for any events or changes in circumstances, such as significant adverse changes in business climate or operating results, changes in management’s business strategy, an inability to successfully introduce new products in the marketplace, an inability to successfully achieve internal forecasts or significant declines in our stock price, which may represent an indicator of impairment. The occurrence of any of these events may require us to record future goodwill impairment charges.
25
Our stock price is subject to volatility.
Our stock price has experienced price and volume fluctuations and could be subject to wide fluctuations in the future. The trading price of our stock may fluctuate widely due to various factors including, actual or anticipated fluctuations in our financial conditions and operating results, changes in financial estimates by us or securities analysts, changes in our capital structure, including issuance of additional debt or equity to the public, interest rate changes, news regarding our products or products of our competitors, and broad market and industry fluctuations. Stock price fluctuations could impact the value of our equity compensation, which could affect our ability to recruit and retain employees. In addition, volatility in our stock price could adversely affect our business and financing opportunities.
Our worldwide operations are subject to political, legal and economic risks and natural disasters, which could have a material adverse effect on us.
We maintain operations around the world, including in the United States, Canada, Europe, Australia and Asia. We rely on third-party wafer foundries in Europe and Asia. Nearly all product assembly and final testing of our products is performed at manufacturing facilities, operated by third-party manufacturing facilities, in China, Malaysia and Taiwan. We also have international sales operations. International sales, as a percent of net revenue, were
74%
in 2017. We expect that international sales will continue to be a significant portion of total sales in the foreseeable future.
The political, legal and economic risks associated with our operations in foreign countries include, without limitation:
|
•
|
expropriation;
|
|
•
|
changes in a specific country’s or region’s political or economic conditions;
|
|
•
|
changes in tax laws, trade protection measures and import or export licensing requirements;
|
|
•
|
difficulties in protecting our intellectual property;
|
|
•
|
difficulties in managing staffing and exposure to different employment practices and labor laws;
|
|
•
|
changes in foreign currency exchange rates;
|
|
•
|
restrictions on transfers of funds and other assets of our subsidiaries between jurisdictions;
|
|
•
|
changes in freight and interest rates;
|
|
•
|
disruption in air transportation between the United States and our overseas facilities;
|
|
•
|
loss or modification of exemptions for taxes and tariffs; and
|
|
•
|
compliance with U.S. laws and regulations related to international operations, including export control and economic sanctions laws and regulations and the Foreign Corrupt Practices Act.
|
In addition, our worldwide operations (or those of our business partners) could be subject to natural disasters such as earthquakes, tsunamis, flooding, typhoons and volcanic eruptions that disrupt manufacturing or other operations. For example, our Sunnyvale operations are located near major earthquake fault lines in California. Any conflict or uncertainty in the countries in which we operate, including public health issues (for example, an outbreak of a contagious disease such as Avian Influenza, measles or Ebola), safety issues, natural disasters, fire, disruptions of service from utilities, nuclear power plant accidents or general economic or political factors. For example, the United Kingdom’s 2016 referendum, commonly referred to as “Brexit,” has created economic and political uncertainty in the European Union. Also the new U.S. administration has called for changes to domestic and foreign policy. We cannot predict the impact, if any, of the policies adopted by the new administration will have on our business. Until we know what changes are enacted, we will not know whether in total we benefit from, or are negatively affected by, the changes. Any of the above risks, should they occur, could result in an increase in the cost of components, production delays, general business interruptions, delays from difficulties in obtaining export licenses for certain technology, tariffs and other barriers and restrictions, longer payment cycles, increased taxes, restrictions on the repatriation of funds and the burdens of complying with a variety of foreign laws, any of which could ultimately have a material adverse effect on our business.
Worldwide political conditions may adversely affect demand for our products.
Worldwide political conditions may create uncertainties that could adversely affect our business. The United States has been and may continue to be involved in armed conflicts that could have a further impact on our sales and our supply chain. The consequences of armed conflict, political instability or civil or military unrest are unpredictable, and we may not be able to foresee events that could have a material adverse effect on us. Terrorist attacks or other hostile acts may negatively affect our operations, or adversely affect demand for our products, and such attacks or related armed conflicts may impact our physical facilities or those of our suppliers or customers. Furthermore, these attacks or hostile acts may make travel and the transportation of our products more difficult and more expensive, which could materially adversely affect us. Any of these events could cause consumer spending to decrease or result in increased volatility in the United States economy and worldwide financial markets.
26
Unfavorable currency exchange rate fluctuations could adversely affect us.
We have costs, assets and liabilities that are denominated in foreign currencies. As a consequence, movements in exchange rates could cause our foreign currency denominated expenses to increase as a percentage of revenue, affecting our profitability and cash flows. Whenever we believe appropriate, we hedge a portion of our short-term foreign currency exposure to protect against fluctuations in currency exchange rates. We determine our total foreign currency exposure using projections of long-term expenditures for items such as payroll. We cannot assure you that these activities will be effective in reducing foreign exchange rate exposure. Failure to do so could have an adverse effect on our business, financial condition, results of operations and cash flow. In addition, the majority of our product sales are denominated in U.S. dollars. Fluctuations in the exchange rate between the U.S. dollar and the local currency can cause increases or decreases in the cost of our products in the local currency of such customers. An appreciation of the U.S. dollar relative to the local currency could reduce sales of our products.
Our inability to effectively control the sales of our products on the gray market could have a material adverse effect on us.
We market and sell our products directly to OEMs and through authorized third-party distributors. From time to time, our products are diverted from our authorized distribution channels and are sold on the “gray market.” Gray market products result in shadow inventory that is not visible to us, thus making it difficult to forecast demand accurately. Also, when gray market products enter the market, we and our distribution channels compete with these heavily discounted gray market products, which adversely affects demand for our products and negatively impact our margins. In addition, our inability to control gray market activities could result in customer satisfaction issues because any time products are purchased outside our authorized distribution channels there is a risk that our customers are buying counterfeit or substandard products, including products that may have been altered, mishandled or damaged, or are used products represented as new.
If we cannot adequately protect our technology or other intellectual property in the United States and abroad, through patents, copyrights, trade secrets, trademarks and other measures, we may lose a competitive advantage and incur significant expenses.
We rely on a combination of protections provided by contracts, including confidentiality and nondisclosure agreements, copyrights, patents, trademarks and common law rights, such as trade secrets, to protect our intellectual property. However, we cannot assure you that we will be able to adequately protect our technology or other intellectual property from third-party infringement or from misappropriation in the United States and abroad. Any patent licensed by us or issued to us could be challenged, invalidated or circumvented or rights granted there under may not provide a competitive advantage to us.
Furthermore, patent applications that we file may not result in issuance of a patent or, if a patent is issued, the patent may not be issued in a form that is advantageous to us. Despite our efforts to protect our intellectual property rights, others may independently develop similar products, duplicate our products or design around our patents and other rights. In addition, it is difficult to monitor compliance with, and enforce, our intellectual property on a worldwide basis in a cost-effective manner. In jurisdictions where foreign laws provide less intellectual property protection than afforded in the United States and abroad, our technology or other intellectual property may be compromised, and our business would be materially adversely affected.
We are party to litigation and may become a party to other claims or litigation that could cause us to incur substantial costs or pay substantial damages or prohibit us from selling our products.
From time to time, we are a defendant or plaintiff in various legal actions. For example, as described in Note 17 of our consolidated financial statements, we have been subject to certain claims concerning federal securities laws and corporate governance. Our products are purchased by and/or used by consumers, which could increase our exposure to consumer actions such as product liability claims and consumer class action claims, including those described in Note 17 of our consolidated financial statements. On occasion, we receive claims that individuals were allegedly exposed to substances used in our former semiconductor wafer manufacturing facilities and that this alleged exposure caused harm. Litigation can involve complex factual and legal questions, and its outcome is uncertain. It is possible that if a claim is successfully asserted against us, including the claims described in Note 17 of our consolidated financial statements, it could result in the payment of damages that could be material to our business.
With respect to intellectual property litigation, from time to time, we have been notified of, or third parties may bring or have brought, actions against us and/or against our customers based on allegations that we are infringing the intellectual property rights of others, contributing to or inducing the infringement of the intellectual property rights of others, improperly claiming ownership of intellectual property or otherwise improperly using the intellectual property of others. If any such claims are asserted, we may seek to obtain a license under the third parties’ intellectual property rights. We cannot assure you that we will be able to obtain all of the necessary licenses on satisfactory terms, if at all. These parties may file lawsuits against us or our customers seeking damages (potentially up to and including treble damages) or an injunction against the sale of products that incorporate allegedly infringed intellectual property or against the operation of our business as presently conducted, which could result in our having to stop the sale of some of our products or to increase the costs of selling some of our products or which could damage
27
our reputation. The award of damages, including material royalty payments, or other types of damages, or the entry of an injunction against the manufacture and sale of some or all of our products could have a material adverse effect on us. We could decide, in the alternative, to redesign our products or to resort to litigation to challenge such claims. Such challenges could be extremely expensive and time-consuming regardless of their merit, could cause delays in product release or shipment and/or could have a material adverse effect on us. We cannot assure you that litigation related to our intellectual property rights or the intellectual property rights of others can always be avoided or successfully concluded.
Even if we were to prevail, any litigation could be costly and time-consuming and would divert the attention of our management and key personnel from our business operations, which could have a material adverse effect on us.
Our business is subject to potential tax liabilities.
We are subject to income taxes in the United States, Canada and other foreign jurisdictions. Significant judgment is required in determining our worldwide provision for income taxes. Tax laws are dynamic and subject to change as new laws are passed and new interpretations of the law are issued or applied. The U.S. recently enacted significant tax reform, and certain provisions of the new law may adversely affect us. The Tax Cuts and Job Act of 2017 (Tax Reform Act) has resulted in significant changes to the U.S. corporate income tax system. These changes include a federal statutory rate reduction from 35% to 21%, the elimination or reduction of certain domestic deductions and credits and limitations on the deductibility of interest expense. The Tax Reform Act also transitions international taxation from a worldwide system to a modified territorial system and includes base erosion prevention measures on non-U.S. earnings, which has the effect of subjecting certain earnings of our foreign subsidiaries to U.S. taxation. These changes are effective beginning in 2018. We recorded preliminary estimates of the impact of the Tax Reform Act in accordance with Staff Accounting Bulletin No.118 (SAB 118). These estimates are subject to further analysis and review which may result in material adjustments in 2018.
In the ordinary course of our business, there are many transactions and calculations where the ultimate tax determination is uncertain, including uncertainties due to the Tax Reform Act. Although we believe our tax estimates are reasonable, we cannot assure you that the final determination of any tax audits and litigation will not be materially different from that which is reflected in historical income tax provisions and accruals. Should additional taxes be assessed as a result of an audit, assessment or litigation, there could be a material adverse effect on our cash, income tax provision and net income in the period or periods for which that determination is made.
We are subject to environmental laws, conflict minerals-related provisions of the Dodd-Frank Wall Street Reform and Consumer Protection Act as well as a variety of other laws or regulations that could result in additional costs and liabilities.
Our operations and properties have in the past been and continue to be subject to various United States and foreign laws and regulations, including those relating to materials used in our products and manufacturing processes, discharge of pollutants into the environment, the treatment, transport, storage and disposal of solid and hazardous wastes and remediation of contamination. These laws and regulations require our suppliers to obtain permits for operations making our products, including the discharge of air pollutants and wastewater. Although our management systems are designed to oversee our suppliers’ compliance, we cannot assure you that our suppliers have been or will be at all times in complete compliance with such laws, regulations and permits. If our suppliers violate or fail to comply with any of them, a range of consequences could result, including fines, suspension of production, alteration of manufacturing processes, import/export restrictions, sales limitations, criminal and civil liabilities or other sanctions. Such non-compliance from our manufacturing suppliers could result in disruptions in supply, higher sourcing costs, and/or reputational damage for us.
Environmental laws are complex, change frequently and have tended to become more stringent over time. For example, the European Union (EU) and China are two among a growing number of jurisdictions that have enacted restrictions on the use of lead and other materials in electronic products. These regulations affect semiconductor devices and packaging. As regulations restricting materials in electronic products continue to increase around the world, there is a risk that the cost, quality and manufacturing yields of products that are subject to these restrictions, may be less favorable compared to products that are not subject to such restrictions, or that the transition to compliant products may not meet customer roadmaps, or produce sudden changes in demand, which may result in excess inventory. A number of jurisdictions including the EU, Australia, California and China are developing or have finalized market entry or public procurement regulations for computers and servers based on ENERGY STAR specifications as well as additional energy consumption limits. There is the potential for certain of our products being excluded from some of these markets which could materially adversely affect us.
Certain environmental laws, including the U.S. Comprehensive, Environmental Response, Compensation and Liability Act of 1980, or the Superfund Act, impose strict or, under certain circumstances, joint and several liability on current and previous owners or operators of real property for the cost of removal or remediation of hazardous substances and impose liability for damages to natural resources. These laws often impose liability even if the owner or operator did not know of, or was not
28
responsible for, the release of such hazardous substances. These environmental laws also assess liability on persons who arrange for hazardous substances to be sent to disposal or treatment facilities when such facilities are found to be contaminated. Such persons can be responsible for cleanup costs even if they never owned or operated the contaminated facility. We have been named as a responsible party at three Superfund sites in Sunnyvale, California. Although we have not yet been, we could be named a potentially responsible party at other Superfund or contaminated sites in the future. In addition, contamination that has not yet been identified could exist at our other facilities.
Under the Dodd-Frank Wall Street Reform and Consumer Protection Act of 2010, the SEC adopted disclosure and reporting requirements for companies that use “conflict” minerals originating from the Democratic Republic of Congo or adjoining countries. We continue to incur additional costs associated with complying with these requirements, such as costs related to developing internal controls for the due diligence process, determining the source of any conflict minerals used in our products, auditing the process and reporting to our customers and the SEC. In addition to the SEC regulation, the European Union, China and other jurisdictions are developing new policies focused on conflict minerals that may impact and increase the cost of our compliance program. Also, since our supply chain is complex, we may face reputational challenges if we are unable to sufficiently verify the origins of the subject minerals. Moreover, we are likely to encounter challenges to satisfy those customers who require that all of the components of our products are certified as “conflict free.” If we cannot satisfy these customers, they may choose a competitor’s products.
The U.S. federal government has issued new policies for federal procurement focused on eradicating the practice of forced labor and human trafficking. In addition, the United Kingdom and the State of California have issued laws that require us to disclose our policy and practices for identifying and eliminating forced labor and human trafficking in our supply chain. Several customers as well as the Electronic Industry Citizenship Coalition (EICC) have also issued expectations to eliminate these practices that may impact us. While we have a policy and management systems to identify and avoid these practices in our supply chain, we cannot guarantee that our suppliers will always be in conformance to these laws and expectations. We may face enforcement liability and reputational challenges if we are unable to sufficiently meet these expectations. Moreover, we are likely to encounter challenges with customers if we cannot satisfy their forced and trafficked labor polices and they may choose a competitor’s product.
|
ITEM 1B.
|
UNRESOLVED STAFF COMMENTS
|
None.
|
ITEM 2.
|
PROPERTIES
|
As of December 30, 2017, we leased approximately 2.42 million square feet of space for research and development, engineering, administrative and warehouse use, including our headquarters in Santa Clara, California, our principal administrative facilities in Austin, Texas, our main facility with respect to graphics and chipset products located in Markham, Ontario, Canada and a number of smaller regional sales offices located in commercial centers near customers, principally in the United States, Latin America, Europe and Asia. These leases expire at varying dates through 2028, although some of these leases include optional renewals. During the third quarter of 2016, we entered into a 10-year operating lease to occupy 220,156 square feet of our new headquarters in Santa Clara, California. The lease commenced in August 2017. We have the option to extend the term of the lease for two additional 5-year periods. The lease for our principal administrative facilities in Austin, Texas expires in March 2025, and provides for one 10-year optional renewal. The lease for our facilities in Markham, Ontario, Canada expires in February 2028, and provides for one 5-year optional renewal.
We currently do not anticipate difficulty in either retaining occupancy of any of our facilities through lease renewals prior to expiration or through month-to-month occupancy, or replacing them with equivalent facilities.
We believe that our existing facilities are suitable and adequate for our present purposes, and that, the productive capacity of such facilities is substantially being utilized or we have plans to utilize such capacity.
Hatamian Securities Litigation
On January 15, 2014, a class action lawsuit captioned
Hatamian v. AMD, et al.
, C.A. No. 3:14-cv-00226 (the Hatamian Lawsuit) was filed against us in the United States District Court for the Northern District of California. The complaint purports to assert claims against us and certain individual officers for alleged violations of Section 10(b) of the Securities Exchange Act of 1934, as amended (the Exchange Act), and Rule 10b-5 of the Exchange Act. The plaintiffs seek to represent a proposed class of all persons who purchased or otherwise acquired our common stock during the period April 4, 2011 through October 18,
29
2012. The complaint seeks damages allegedly caused by alleged materially misleading statements and/or material omissions by us and the individual officers regarding our 32nm technology and “Llano” product, which statements and omissions, the plaintiffs claim, allegedly operated to artificially inflate the price paid for our common stock during the period. The complaint seeks unspecified compensatory damages, attorneys’ fees and costs. On July 7, 2014, we filed a motion to dismiss plaintiffs’ claims. On March 31, 2015, the Court denied the motion to dismiss. On May 14, 2015, we filed our answer to plaintiffs’ corrected amended complaint. On September 4, 2015, plaintiffs filed their motion for class certification, and on March 16, 2016, the Court granted plaintiffs’ motion. A court-ordered mediation held in January 2016 did not result in a settlement of the lawsuit. The discovery process was concluded. The plaintiffs and defendants filed cross-motions for summary judgment, and briefing on those motions was completed in July 2017. On October 9, 2017, the parties signed a definitive settlement agreement resolving this matter and submitted it to the Court for approval. Under the terms of this agreement, the settlement will be funded entirely by certain of AMD’s insurance carriers and the defendants will continue to deny any liability or wrongdoing. The final settlement hearing is scheduled for February 27, 2018.
Based upon information presently known to management, we believe that the potential liability, if any, will not have a material adverse effect on our financial condition, cash flows or results of operations.
Shareholder Derivative Lawsuits
On March 20, 2014, a purported shareholder derivative lawsuit captioned
Wessels v. Read, et al.
, Case No. 1:14 cv-262486 (Wessels) was filed against us (as a nominal defendant only) and certain of our directors and officers in the Santa Clara County Superior Court of the State of California. The complaint purports to assert claims against us and certain individual directors and officers for breach of fiduciary duty, waste of corporate assets and unjust enrichment. The complaint seeks damages allegedly caused by alleged materially misleading statements and/or material omissions by us and the individual directors and officers regarding our 32nm technology and “Llano” product, which statements and omissions, the plaintiffs claim, allegedly operated to artificially inflate the price paid for our common stock during the period. On April 27, 2015, a similar purported shareholder derivative lawsuit captioned
Christopher Hamilton and David Hamilton v. Barnes, et al.
, Case No. 5:15-cv-01890 (Hamilton) was filed against us (as a nominal defendant only) and certain of our directors and officers in the United States District Court for the Northern District of California. The case was transferred to the judge handling the Hatamian Lawsuit and is now Case No. 4:15-cv-01890.
On September 29, 2015, a similar purported shareholder derivative lawsuit captioned
Jake Ha v Caldwell, et al.
, Case No. 3:15-cv-04485 (Ha) was filed against us (as a nominal defendant only) and certain of our directors and officers in the United States District Court for the Northern District of California. The lawsuit also seeks a court order voiding the stockholder vote on our 2015 proxy. The case was transferred to the judge handling the Hatamian Lawsuit and is now Case No. 4:15-cv-04485. The Wessels, Hamilton, and Ha shareholder derivative lawsuits were stayed pending resolution of the Hatamian Lawsuit. On January 30, 2018, the Wessels and Hamilton plaintiffs amended their complaints. On February 2, 2018, the Ha plaintiff filed his amended complaint. On February 22, 2018, we filed motions to dismiss the Hamilton and Ha plaintiffs' amended complaints.
Based upon information presently known to management, we believe that the potential liability, if any, will not have a material adverse effect on our financial condition, cash flows or results of operations.
Dickey Litigation
On October 26, 2015, a putative class action complaint captioned
Dickey et al. v. AMD, No.
15-cv-04922 was filed against us in the United States District Court for the Northern District of California. The plaintiffs allege that we misled consumers by using the term "eight cores" in connection with the marketing of certain AMD FX CPUs that are based on our “Bulldozer” core architecture. The plaintiffs allege these products cannot perform eight calculations simultaneously, without restriction. The plaintiffs seek to obtain damages under several causes of action for a nationwide class of consumers who allegedly were deceived into purchasing certain Bulldozer-based CPUs that were marketed as containing eight cores. The plaintiffs also seek attorneys' fees. On December 21, 2015, we filed a motion to dismiss the complaint, which was granted on April 7, 2016. The plaintiffs then filed an amended complaint with a narrowed putative class definition, which the Court dismissed upon our motion on October 31, 2016. The plaintiffs subsequently filed a second amended complaint, and we filed a motion to dismiss the second amended complaint. On June 14, 2017, the Court issued an order granting in part and denying in part our motion to dismiss, and allowing the plaintiffs to move forward with a portion of their complaint. Discovery is underway. The putative class definition does not encompass our Ryzen™ or EPYC™ processors.
Based upon information presently known to management, we believe that the potential liability, if any, will not have a material adverse effect on our financial condition, cash flows or results of operations.
Kim Securities Litigation
30
On January 16, 2018, a putative class action lawsuit captioned
Kim et al. v. AMD, et al.
, Case No. 3:18-cv-00321 was filed against us in the United States District Court for the Northern District of California. The complaint purports to assert claims against us and certain individual officers for alleged violations of Sections 10(b) and 20(a) of the Exchange Act , and Rule 10b-5 of the Exchange Act. The plaintiff seeks to represent a proposed class of all persons who purchased or otherwise acquired our common stock during the period February 21, 2017 through January 11, 2018. The complaint seeks damages allegedly caused by alleged materially misleading statements and/or material omissions by us and the individual officers regarding a security vulnerability (Spectre), which statements and omissions, the plaintiff claims, allegedly caused our common stock price to be artificially inflated during the purported class period. The complaint seeks unspecified compensatory damages, attorneys’ fees and costs.
Based upon information presently known to management, we believe that the potential liability, if any, will not have a material adverse effect on our financial condition, cash flows or results of operations.
Hauck Litigation
On January 19, 2018, a putative class action complaint captioned
Diana Hauck et al. v. AMD, Inc.,
Case No. 5:18-cv-0047 was filed against us in the United States District Court for the Northern District of California. The plaintiff alleges that we misled consumers in connection with the marketing of AMD processors. Specifically, the plaintiff alleges that AMD’s processors cannot perform at their advertised processing speeds without exposing consumers to the Spectre security vulnerability. The plaintiff seeks to obtain damages under several causes of action for a nationwide class of consumers who allegedly were misled into purchasing or leasing AMD processors (and devices containing AMD processors), as well as attorneys’ fees, punitive damages, and restitution.
Based upon information presently known to management, we believe that the potential liability, if any, will not have a material adverse effect on our financial condition, cash flows or results of operations.
Speck Litigation
On February 4, 2018, a putative class action complaint captioned
Brian Speck et al. v. AMD, Inc.
, Case No. 5:18-cv-0744 was filed against us in the United States District Court for the Northern District of California. The plaintiff alleges that we misled consumers in connection with the design and marketing of AMD processors. Specifically, the plaintiff alleges that AMD's processors are subject to the Spectre security vulnerability, and that any "patches" to remedy this security vulnerability will result in degradation of processor performance. The plaintiff seeks to obtain damages under several causes of action for a nationwide class of consumers and a subclass of Ohio residents who allegedly were misled into purchasing AMD processors (and devices containing AMD processors), as well as attorneys' fees, equitable relief, and restitution.
Based upon information presently known to management, we believe that the potential liability, if any, will not have a material adverse effect on our financial condition, cash flows or results of operations.
Barnes and Caskey-Medina Litigation
On February 9, 2018, a putative class action complaint captioned
Nathan Barnes and Jonathan Caskey-Medina, et al. v. AMD, Inc.
, Case No. 5:18-cv-00883, was filed against us in the United States District Court for the Northern District of California. The plaintiffs allege that we misled consumers in connection with the marketing of AMD processors. Specifically, the plaintiffs allege that AMD touted the speed and reliability of its processors even though these processors are subject to the Spectre security vulnerability. The plaintiffs seek to obtain damages under several causes of action for a nationwide class of consumers who allegedly were misled into purchasing or leasing AMD processors (and devices containing AMD processors), as well as attorneys' fees, equitable relief, and restitution.
Based upon information presently known to management, we believe that the potential liability, if any, will not have a material adverse effect on our financial condition, cash flows or results of operations.
Environmental Matters
We are named as a responsible party on Superfund clean-up orders for three sites in Sunnyvale, California that are on the National Priorities List. Since 1981, we have discovered hazardous material releases to the groundwater from former underground tanks and proceeded to investigate and conduct remediation at these three sites. The chemicals released into the groundwater were commonly used in the semiconductor industry in the United States in the wafer fabrication process prior to 1979.
In 1991, we received Final Site Clean-up Requirements Orders from the California Regional Water Quality Control Board relating to the three sites. We have entered into settlement agreements with other responsible parties on two of the orders. During the term of such agreements, other parties have agreed to assume most of the foreseeable costs as well as the primary role in conducting remediation activities under the orders. We remain responsible for additional costs beyond the scope of the agreements as well as all remaining costs in the event that the other parties do not fulfill their obligations under the settlement agreements.
31
To address anticipated future remediation costs under the orders, we have computed and recorded an estimated environmental liability of approximately $3 million and have not recorded any potential insurance recoveries in determining the estimated costs of the cleanup. Costs could also increase as a result of additional test and remediation obligations imposed by the Environmental Protection Agency or California Regional Water Quality Control Board. The progress of future remediation efforts cannot be predicted with certainty and these costs may change. We believe that the potential liability, if any, in excess of amounts already accrued, will not have a material adverse effect on our financial condition, cash flows or results of operations.
Other Matters
We are a defendant or plaintiff in various actions that arose in the normal course of business. With respect to these matters, based on our management’s current knowledge, we believe that the amount or range of reasonably possible loss, if any, will not, either individually or in the aggregate, have a material adverse effect on our business, financial position, results of operations or cash flows.
Not Applicable.
32
|
ITEM 5.
|
MARKET FOR REGISTRANT’S COMMON EQUITY, RELATED STOCKHOLDER MATTERS AND ISSUER PURCHASES OF EQUITY SECURITIES
|
Our common stock is listed on The NASDAQ Capital Market (NASDAQ) under the symbol “AMD”. On February 23, 2018, there were 5,962 registered holders of our common stock, and the closing price of our common stock was $12.07
per share as reported on NASDAQ.
The following table sets forth on a per share basis the high and low intra-day sales prices on NASDAQ for our common stock for the periods indicated:
|
High
|
Low
|
||||||
|
Fiscal Year 2017 Quarters Ended:
|
|||||||
|
April 1, 2017
|
$
|
15.55
|
|
$
|
9.42
|
|
|
|
July 1, 2017
|
$
|
14.74
|
|
$
|
9.85
|
|
|
|
September 30, 2017
|
$
|
15.65
|
|
$
|
11.86
|
|
|
|
December 30, 2017
|
$
|
14.41
|
|
$
|
9.70
|
|
|
|
|
High
|
Low
|
|||||
|
Fiscal Year 2016 Quarters Ended:
|
|||||||
|
March 26, 2016
|
$
|
3.06
|
|
$
|
1.75
|
|
|
|
June 25, 2016
|
$
|
5.52
|
|
$
|
2.60
|
|
|
|
September 24, 2016
|
$
|
8.00
|
|
$
|
4.65
|
|
|
|
December 31, 2016
|
$
|
12.42
|
|
$
|
6.22
|
|
|
Currently, we do not have any plans to pay dividends on our common stock. Under the terms of our indentures for our 6.75% Senior Notes due 2019 (6.75% Notes), 7.50% Senior Notes due 2022 (7.50% Notes) and 7.00% Senior Notes due 2024 (7.00% Notes), we are prohibited from paying cash dividends if the aggregate amount of dividends and other restricted payments made by us since entering into each indenture would exceed the sum of specified financial measures including fifty percent of consolidated net income as that term is defined in the indentures. We are prohibited from paying cash dividends on our common stock when certain payment conditions (Payment Conditions) are not satisfied. The Payment Conditions include that (i) no default or event of default exists and (ii) at all times during the 45 consecutive days immediately prior to such transaction, event or payment and on a pro forma basis after giving effect to such transaction, event or payment and any incurrence or repayment of indebtedness in connection therewith, the Loan Parties’(as defined in the Amended and Restated Loan Agreement) excess available cash is greater than the greater of 20% of the total commitment amount and $100 million.
For information about our equity compensation plans, see Part III, Item 11, below.
33
Performance Graph
Comparison of Five-Year Cumulative Total Returns
Advanced Micro Devices, S&P 500 and 400 Indicies and S&P 500 and 400 Semiconductor Indices
The following graph shows a five-year comparison of cumulative total return on our common stock, the S&P 500 and 400 Indicies and the S&P 500 and 400 Semiconductor Indices from December 29, 2012 through December 30, 2017. The past performance of our common stock is no indication of future performance.
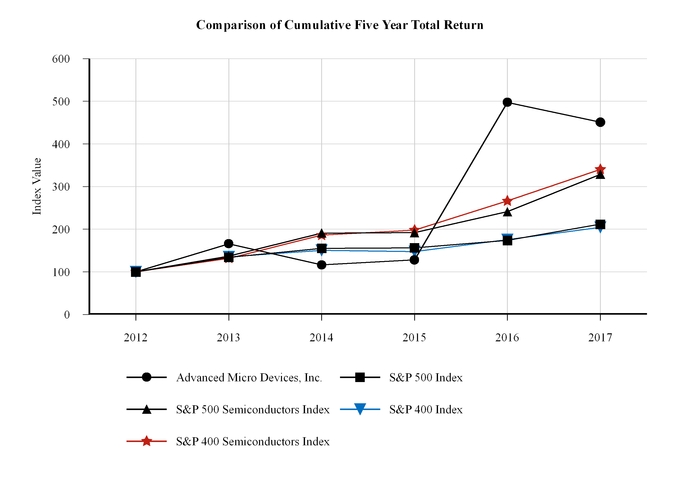
|
Base Period
|
Years Ending
|
|||||
|
Company / Index
|
12/29/2012
|
12/28/2013
|
12/27/2014
|
12/26/2015
|
12/31/2016
|
12/30/2017
|
|
Advanced Micro Devices, Inc.
|
100
|
165.79
|
116.23
|
128.07
|
497.37
|
450.88
|
|
S&P 500 Index
|
100
|
134.11
|
155.24
|
156.43
|
173.74
|
211.67
|
|
S&P 500 Semiconductors Index
|
100
|
137.05
|
190.98
|
191.87
|
241.07
|
328.63
|
|
S&P 400 Index
|
100
|
134.98
|
150.40
|
147.40
|
175.86
|
204.43
|
|
S&P 400 Semiconductors Index
|
100
|
131.78
|
185.99
|
198.09
|
266.20
|
340.33
|
34
|
ITEM 6.
|
SELECTED FINANCIAL DATA
|
|
2017
(1)
|
2016
(1)
|
2015
(1)
|
2014
(1)
|
2013
(1)
|
|||||||||||||||
|
In millions except per share amounts
|
|||||||||||||||||||
|
Net revenue
|
$
|
5,329
|
|
$
|
4,272
|
|
$
|
3,991
|
|
$
|
5,506
|
|
$
|
5,299
|
|
||||
|
Net income (loss)
(2)(3)(4)(5)(6)(7)(8)
|
43
|
|
(497
|
)
|
(660
|
)
|
(403
|
)
|
(83
|
)
|
|||||||||
|
Earnings (loss) per common share
|
|||||||||||||||||||
|
Basic
|
$
|
0.04
|
|
$
|
(0.60
|
)
|
$
|
(0.84
|
)
|
$
|
(0.53
|
)
|
$
|
(0.11
|
)
|
||||
|
Diluted
|
$
|
0.04
|
|
$
|
(0.60
|
)
|
$
|
(0.84
|
)
|
$
|
(0.53
|
)
|
$
|
(0.11
|
)
|
||||
|
Shares used in per share calculation
|
|||||||||||||||||||
|
Basic
|
952
|
|
835
|
|
783
|
|
768
|
|
754
|
|
|||||||||
|
Diluted
|
1,039
|
|
835
|
|
783
|
|
768
|
|
754
|
|
|||||||||
|
Long-term debt, net and other long term liabilities
(9)(10)
|
$
|
1,443
|
|
$
|
1,559
|
|
$
|
2,093
|
|
$
|
2,110
|
|
$
|
2,153
|
|
||||
|
Total assets
(10)
|
$
|
3,540
|
|
$
|
3,321
|
|
$
|
3,084
|
|
$
|
3,737
|
|
$
|
4,315
|
|
||||
|
(1)
|
2017, 2015, 2014 and 2013 each consisted of 52 weeks, whereas 2016 consisted of 53 weeks.
|
|
(2)
|
In 2013, we entered into licenses and settlements regarding patent-related matters. Pursuant to these licenses and settlements, we received in aggregate, $48 million, net, which we recorded within net legal settlements in 2013.
|
|
(3)
|
During the third quarter of 2016, we entered into a Sixth Amendment to the WSA with GLOBALFOUNDRIES (GF) to modify certain terms of the WSA applicable to wafers for our microprocessor, graphics processor and semi-custom products for a five-year period from January 1, 2016 to December 31, 2020. Pursuant to the Sixth Amendment to the WSA, GF agreed to provide us a limited waiver with rights to contract with another wafer foundry with respect to certain products in the 14nm and 7nm technology nodes and gives us greater flexibility in sourcing foundry services across our product portfolio. In consideration for these rights, we agreed to pay GF $100 million in installments starting in the fourth fiscal quarter of 2016 through the third fiscal quarter of 2017. As of
December 30, 2017
, the Company had paid GF
$100 million
in aggregate. Starting in 2017 and continuing through 2020, the Company agreed to make quarterly payments to GF based on the volume of certain wafers purchased from another wafer foundry. In addition, in consideration for the limited waiver and rights under the sixth amendment, we entered into a warrant agreement (the Warrant Agreement) with West Coast Hitech L.P. (WCH), a wholly-owned subsidiary of Mubadala Investment Company PJSC (Mubadala). Accordingly, in 2016, we recorded a charge of $340 million in Cost of sales, consisting of the $100 million payment under the sixth amendment and the $240 million value of the warrant under the Warrant Agreement issued in consideration of the sixth amendment.
|
|
(4)
|
In 2015, 2014 and 2012, we implemented restructuring plans and incurred net charges of $53 million, $58 million and $6 million in 2015, 2014 and 2013, respectively, which primarily consisted of severance and related employee benefits.
|
|
(5)
|
In 2015, we exited the dense server systems business, formerly SeaMicro resulting in a charge of $76 million in restructuring and other special charges, net. In 2014, we incurred other special charges of $13 million primarily related to the departure of a former CEO. In 2013, we sold and leased back buildings in various locations and land in Austin, Texas, for which we recorded a net charge of $24 million in other special charges.
|
|
(6)
|
In 2014, we recorded a goodwill impairment charge of $233 million related to our Computing and Graphics segment. Also in 2014, we recorded a $58 million lower of cost or market inventory adjustment related to our second generation APU products. In 2015, we recorded an inventory write-down of $65 million, which was primarily the result of lower anticipated demand for older-generation APUs, and a technology node transition charge of $33 million.
|
|
(7)
|
In 2016, we and certain of our subsidiaries completed the sale of a majority of the equity interests in Suzhou TF-AMD Semiconductor Co., Ltd., (formerly AMD Technologies (China) Co., Ltd.), and TF AMD Microelectronics (Penang) Sdn. Bhd. (formerly Advanced Micro Devices Export Sdn. Bhd.), to affiliates of Tongfu Microelectronics Co., Ltd. (formerly Nantong Fujitsu Microelectronics Co., Ltd.) (TFME), a Chinese joint stock company, to form two joint ventures (collectively, the ATMP JV). As a result of the sale, TFME’s affiliates own 85% of the equity interests in each ATMP JV while certain of our subsidiaries own the remaining 15%. We have no obligations to fund the ATMP JV. As the result of the transaction, we recorded a cumulative pre-tax gain on the sale of our 85% equity interest in ATMP JV of $146 million which was recognized in
Other income (expense), net
on our consolidated statements of operations. In addition, during
2017
and
2016
, we recorded
$7 million
and
$10 million
, respectively, of
Equity loss in investee
on our consolidated statements of operations, which includes certain expenses incurred by us on behalf of the ATMP JV. During 2017, we recorded a $3 million pre-tax gain for final settlement related to the sale of 85% of the equity interest in ATMP facilities in
Other income (expense), net
on our consolidated statements of operations.
|
35
|
(8)
|
In
2017
and
2016
, we recognized
$52 million
and
$88 million
, respectively, of licensing gain related to the licensing of certain of our intellectual property (Licensed IP) to two joint ventures formed with Tianjin Haiguang Advanced Technology Investment Co., Ltd. (collectively, the THATIC JV).
|
|
(9)
|
Total long-term debt and other long term liabilities
decreased
by
$116 million
from
2016
to
2017
, primarily due to
$110 million decrease in the long term debt mainly due to principal debt reduction from debt buyback.
Total long-term debt and other long term liabilities decreased by
$534 million
from
2015
to
2016
, primarily due to
$1,048 million of net debt reduction, partially offset by the issuance of $805 million in principal amount of 2.125% Notes net of unamortized discount of $308 million and unamortized financing cost of $14 million, and $38 million increase in other long-term liabilities mainly due to higher technology licenses payable
. See Note 11 of our consolidated financial statements and Senior Notes section of Management's Discussion and Analysis for additional information.
|
|
(10)
|
Amounts retrospectively reflected adoption of Financial Accounting Standards Board (FASB) Accounting Standards Update (ASU) 2015-03, Simplifying the Presentation of Debt Issuance Costs beginning in the first quarter of 2016. We reclassified debt issuance costs from long-term assets to long-term debt, net by $25 million, $30 million and $22 million for 2015, 2014 and 2013, respectively, on our consolidated balance sheets.
|
36
|
ITEM 7.
|
MANAGEMENT’S DISCUSSION AND ANALYSIS OF FINANCIAL CONDITION AND RESULTS OF OPERATIONS
|
The following discussion should be read in conjunction with the consolidated financial statements as of
December 30, 2017
and
December 31, 2016
and for each of the three years in the period ended
December 30, 2017
and related notes, which are included in this Annual Report on Form 10-K as well as with the other sections of this Annual Report on Form 10-K, including “Part I, Item 1: Business,” “Part II, Item 6: Selected Financial Data” and “Part II, Item 8: Financial Statements and Supplementary Data.”
Introduction
We are a global semiconductor company primarily offering:
|
•
|
x86 microprocessors, as standalone devices or as incorporated into an accelerated processing unit (APU), chipsets, discrete and integrated graphics processing units (GPUs), and professional GPUs; and
|
|
•
|
server and embedded processors, semi-custom System-on-Chip (SoC) products and technology for game consoles.
|
We also license portions of our intellectual property (IP) portfolio.
In this management 's discussion and analysis (MD&A), we will describe the results of operations and the financial condition for us and our consolidated subsidiaries, including a discussion of our results of operations for
2017
compared to
2016
and
2016
compared to
2015
, an analysis of changes in our financial condition and a discussion of our contractual obligations and off balance sheet arrangements.
Overview
2017 was an important year for AMD as we launched a number of new high-performance products that re-shaped our product portfolio and improved our technology competitiveness. We launched more than 40 new high-performance CPUs and GPUs and experienced strong customer acceptance of our new products.
We launched our first-generation AMD Ryzen™ desktop CPUs based on our entirely new “Zen” x86 CPU core architecture. We released our AMD Ryzen™ 7 desktop processors designed for PC gamers, creators and the enthusiast market. We also launched our high performance AMD Ryzen™ 5 desktop processors at a variety of price points with up to 6 cores and 12 threads of CPU processing in April 2017. We released our AMD Ryzen™ 3 desktop processors in July 2017 designed to bring “Zen” processing power to mainstream price points. In August 2017, we launched the Ryzen™ Threadripper™ family of high-end desktop processors. For the commercial market, we launched AMD Ryzen™ PRO desktop processors, based on the same “Zen” x86 core architecture. In October 2017, we announced AMD Ryzen 7 2700U and AMD Ryzen 5 2500U, our first mobile processors with Radeon™ Vega graphics, previously codenamed the “Raven Ridge” mobile APUs, for premium 2-in-1s, convertibles and ultra-thin notebook computers. AMD Ryzen 7 2700U and AMD Ryzen5 2500U processors combine the “Zen” x86 core architecture with Radeon™ Vega graphics in an SoC design.
We also expanded our consumer and professional graphics offerings with new graphics solutions. We introduced the Radeon™ RX 500 series in April 2017, a new line of graphics cards based on second-generation “Polaris” architecture that provides additional performance. We also announced the “Polaris” architecture-based Radeon™ Pro Duo card designed for media and entertainment, broadcast, and design and manufacturing workflows. We launched our new “Vega” GPU architecture for the high-end gaming, professional, and datacenter markets. We introduced our Radeon™ RX Vega family of GPUs for enthusiast gamers, Radeon™ Pro SSG for up to 8K video production, and Radeon™ Instinct MI25 for machine intelligence and datacenter markets.
We also focused on improving our competitive position in the server and datacenter markets. In June 2017, we launched the AMD EPYC™ 7000 Series of high performance processors that have up to 32 high-performance “Zen” compute cores and are designed to support a full range of integer, floating point, memory bandwidth and I/O workloads. Customer engagement with our EPYC™ processors continued to grow during the year. In October 2017, we announced the AMD Embedded Radeon™ E9170 Series GPU. The new processor is the first “Polaris” architecture-based AMD Embedded discrete GPU available in multi-chip module (MCM) format with integrated memory for smaller, power-efficient custom designs.
Our financial results improved in 2017 compared to 2016 primarily as the demand for our Computing and Graphics segment products increased. Net revenue for 2017 was $5.3 billion, an increase of 25% compared to 2016. Our operating income for 2017 improved to $204 million compared to an operating loss of $372 million for 2016. Our net income for 2017 improved to $43 million compared to a net loss of $497 million in the prior year. Cash and cash equivalents as of December 30, 2017 were
37
$1.18 billion, down from $1.26 billion at the end of 2016. Principal amount of total debt as of December 30, 2017 was $1.70 billion, compared to $1.77 billion as of December 31, 2016.
We intend the discussion of our financial condition and results of operations that follows to provide information that will assist in understanding our financial statements, the changes in certain key items in those financial statements from period to period, the primary factors that resulted in those changes, and how certain accounting principles, policies and estimates affect our financial statements.
Critical Accounting Estimates
Our discussion and analysis of our financial condition and results of operations are based upon our consolidated financial statements, which have been prepared in accordance with U.S. generally accepted accounting principles (U.S. GAAP). The preparation of our financial statements requires us to make estimates and judgments that affect the reported amounts in our consolidated financial statements. We evaluate our estimates on an on-going basis, including those related to our revenue, inventories, goodwill impairments and income taxes. We base our estimates on historical experience and on various other assumptions that we believe to be reasonable under the circumstances, the results of which form the basis for making judgments about the carrying values of assets and liabilities. Although actual results have historically been reasonably consistent with management’s expectations, the actual results may differ from these estimates or our estimates may be affected by different assumptions or conditions.
Management believes the following critical accounting estimates are the most significant to the presentation of our financial statements and require the most difficult, subjective and complex judgments.
Revenue Allowances.
We record a provision for estimated sales returns and allowances on product sales for estimated future price reductions and other customer incentives in the same period that the related revenues are recorded. We base these estimates on actual historical sales returns, historical allowances, historical price reductions, market activity and other known or anticipated trends and factors. These estimates are subject to management’s judgment and actual provisions could be different from our estimates and current provisions, resulting in future adjustments to our revenue and operating results.
Inventory Valuation.
At each balance sheet date, we evaluate our ending inventories for excess quantities and obsolescence based on projected sales outlook. This evaluation includes analysis of historical sales levels by product and projections of future demand. These projections assist us in determining the carrying value of our inventory. In addition, we write off inventories that we consider obsolete. We adjust the remaining specific inventory balances to approximate the lower of our standard manufacturing cost or net realizable value. Among other factors, management considers forecasted demand in relation to the inventory on hand, competitiveness of product offerings, market conditions and product life cycles when determining obsolescence and realizable value. If in any period we anticipate future demand or market conditions to be less favorable than our previous estimates, additional inventory write-downs may be required and would be reflected in cost of sales in the period the revision is made. This would have a negative impact on our gross margin in that period. If in any period we are able to sell inventories that were not valued or that had been written down in a previous period, related revenues would be recorded without any offsetting charge to cost of sales resulting in a net benefit to our gross margin in that period.
Goodwill.
Goodwill represents the excess of the purchase price over the fair value of net tangible and identifiable intangible assets acquired. Goodwill is not amortized, but rather is tested for impairment at least annually, or more frequently if there are indicators of impairment present.
We perform an annual goodwill impairment analysis as of the first day of the fourth quarter of each year. In the third fiscal quarter of 2017, we adopted ASU 2017-04
, Intangibles - Goodwill and Other: Topic 350 Simplifying the Test for Goodwill Impairment.
We therefore applied a different impairment analysis for 2017 than was performed in 2016 and 2015.
In assessing impairment of goodwill prior to our adoption of ASU 2017-04, we first analyzed qualitative factors to determine whether it is more likely than not that the fair value of a reporting unit is less than its carrying amount as a basis for determining whether it is necessary to perform the two-step goodwill impairment test. The qualitative factors we assessed included long-term prospects of our performance, share price trends, market capitalization and company-specific events. If we concluded it was more likely than not that the fair value of a reporting unit exceeded its carrying amount, we needed not perform the two-step impairment test. If based on that assessment we believed it was more likely than not that the fair value of the reporting units was less than its carrying value, a two-step goodwill impairment test would be performed.
The first step of the two-step test measures for impairment by applying fair value-based tests at the reporting unit level. We evaluate whether goodwill has been impaired at the reporting unit level by first determining whether the estimated fair value of the reporting unit is less than its carrying value and, if so, by determining whether the implied fair value of goodwill within the reporting unit is less than the carrying value. The implied fair value of a reporting unit is determined through the application of
38
one or more valuation models common to our industry including income, market and cost approaches. While market valuation data for comparable companies is gathered and analyzed, we believe that there has not been sufficient comparability between the peer groups and the specific reporting units to allow for the derivation of reliable indications of value using the market approach. Therefore, we have ultimately employed the income approach which requires estimates of present value of estimated future cash flows. Cash flow projections are based on management’s estimates of revenue growth rates and operating margins taking into consideration industry and market condition. The discount rate used is based on the weighted-average cost of capital adjusted for the relevant risk associated with business-specific characteristics and the uncertainty related to the reporting unit’s ability to execute on the projected cash flows. A variance in the discount rate could have a significant impact on the amount of the goodwill impairment charge recorded, if any. The second step (if necessary) measures the amount of impairment by applying fair value-based tests to the individual assets and liabilities within each reporting unit.
In the third quarter of 2017, we adopted ASU 2017-04 which eliminated step two from the goodwill impairment test. In assessing impairment of goodwill, if we conclude that it is more likely than not that the carrying amount of a reporting unit exceeds its fair value during our qualitative assessment, a one-step goodwill impairment test will be performed. During the quantitative test, if it is concluded that the carrying amount of a reporting unit exceeds its fair value, an impairment loss shall be recognized in an amount equal to that excess, limited to the total amount of goodwill allocated to that reporting unit.
Based on the results of our annual qualitative analysis of goodwill in 2017, we determined that it was more likely than not that the fair value of our reporting units exceeded their carrying amount and, as such, we did not need to perform the quantitative impairment test and there was no goodwill impairment.
Based on the results of our annual qualitative analysis of goodwill in 2016, we determined that it was more likely than not that the fair value of our reporting units exceeded their carrying amount and, as such, we did not need to perform the two-step impairment test and there was no goodwill impairment.
Estimates of fair value for all of our reporting units can be affected by a variety of external and internal factors. Potential events or circumstances that could reasonably be expected to negatively affect the key assumptions we used in estimating the fair value of our reporting units include adverse changes in our industry, increased competition, an inability to successfully introduce new products in the marketplace or to achieve internal forecasts, and a decline in our stock price. If the estimated fair value of our reporting units declines due to any of these factors, we may be required to record future goodwill impairment.
Income Taxes.
In determining taxable income for financial statement reporting purposes, we must make certain estimates and judgments. These estimates and judgments are applied in the calculation of certain tax liabilities and in the determination of the recoverability of deferred tax assets which arise from temporary differences between the recognition of assets and liabilities for tax and financial statement reporting purposes.
We must assess the likelihood that we will be able to recover our deferred tax assets. If recovery is not likely, we must increase our charge to income tax expense in the form of a valuation allowance for the deferred tax assets that we estimate will not ultimately be recoverable. We consider past performance, future expected taxable income and prudent and feasible tax planning strategies in determining the need for a valuation allowance.
In addition, the calculation of our tax liabilities involves dealing with uncertainties in the application of complex tax rules and the potential for future adjustment of our uncertain tax positions by the Internal Revenue Service or other taxing authorities. If our estimates of these taxes are greater or less than actual results, an additional tax benefit or charge will result. We recognize the interest and penalties related to unrecognized tax benefits as interest expense and income tax expense, respectively.
39
In December 2017,the U.S. government enacted comprehensive tax legislation commonly referred to as the Tax Cuts and Jobs Act of 2017 (Tax Reform Act). The legislation significantly changes U.S. tax law by, among other things, lowering corporate income tax rates, implementing a modified territorial tax system and imposing a transition tax on deemed repatriated earnings of foreign subsidiaries. The Tax Reform Act permanently reduces the U.S. corporate income tax rate from a maximum of 35% to a flat 21% rate, effective January 1, 2018. The SEC staff issued Staff Accounting Bulletin No. 118 (SAB 118) to address the application of U.S. GAAP in situations when a registrant does not have the necessary information available, prepared, or analyzed (including computations) in reasonable detail to complete the accounting for certain income tax effects of the Tax Reform Act. We have recognized the provisional tax impacts related to deemed repatriated earnings and the revaluation of deferred tax assets and liabilities and included these amounts in our consolidated financial statements for the year ended December 30, 2017. The ultimate impact may differ from these provisional amounts due to, among other things, additional analysis, changes in interpretations and assumptions we have made, additional regulatory guidance that may be issued, and actions we may take as a result of the Tax Reform Act. The accounting is expected to be complete within one year of the date of enactment.
In January 2018, the FASB released guidance on the accounting for tax on the global intangible low-taxed income (GILTI) provisions of the Tax Reform Act. The GILTI provisions impose a tax on foreign income in excess of a deemed return on tangible assets of foreign corporations. Because of the complexity of the new provisions, we are continuing to evaluate how the provisions will be accounted for under U.S. GAAP wherein companies are allowed to make an accounting policy election of either (i) account for GILTI as a component of tax expense in the period in which we are subject to the rules (the period cost method), or (ii) account for GILTI in the Company’s measurement of deferred taxes (the deferred method). Currently, we have not elected a method and will only do so after we complete the analysis of the GILTI provisions and our election method will depend, in part, on analyzing our global income to determine whether we expect to have future U.S. inclusions in our taxable income related to GILTI and, if so, the impact that is expected.
Results of Operations
We intend this discussion of our financial condition and our results of operations that follows to provide information that will assist you in understanding our financial statements, the changes in certain key items in those financial statements from year to year, the primary factors that resulted in those changes and how certain accounting principles, policies and estimates affect our financial statements.
We use a 52 or 53 week fiscal year ending on the last Saturday in December. The years ended
December 30, 2017
,
December 31, 2016
and
December 26, 2015
included
52
weeks,
53
weeks and
52
weeks, respectively. The extra week in 2016 did not have a material impact on our results of operations. References in this report to
2017
,
2016
and
2015
refer to the fiscal year unless explicitly stated otherwise.
Management, including the Chief Operating Decision Maker who is our Chief Executive Officer, reviews and assesses our operating performance using segment net revenue and operating income (loss) before interest, other income (expense), net, income taxes and equity loss in investee. These performance measures include the allocation of expenses to the operating segments based on management’s judgment. We have the following two reportable segments:
|
•
|
the Computing and Graphics segment, which primarily includes desktop and notebook processors and chipsets, graphics processing units (GPUs), professional GPUs and licensing portions of our intellectual property (IP) portfolio; and
|
|
•
|
the Enterprise, Embedded and Semi-Custom segment, which primarily includes server and embedded processors, semi-custom System-on-Chip (SoC) products, development services, technology for game consoles and licensing portions of our IP portfolio.
|
In addition to these reportable segments, we have an All Other category which is not a reportable segment. This category primarily includes certain expenses and credits that are not allocated to any of the reportable segments because management does not consider these expenses and credits in evaluating the performance of the reportable segments. Also included in this category are employee stock-based compensation expense, the charge related to the Sixth Amendment to the WSA with GLOBALFOUNDRIES (GF), restructuring and other special charges, net and amortization of acquired intangible assets. We also reported the results of former businesses in the All Other category because the operating results were not material.
40
The following table provides a summary of net revenue and operating income (loss) by segment for
2017
,
2016
and
2015
.
|
2017
|
2016
|
2015
|
|||||||||
|
|
(In millions)
|
||||||||||
|
Net revenue:
|
|||||||||||
|
Computing and Graphics
|
$
|
3,029
|
|
$
|
1,967
|
|
$
|
1,805
|
|
||
|
Enterprise, Embedded and Semi-Custom
|
2,300
|
|
2,305
|
|
2,186
|
|
|||||
|
Total net revenue
|
$
|
5,329
|
|
$
|
4,272
|
|
$
|
3,991
|
|
||
|
Operating income (loss):
|
|||||||||||
|
Computing and Graphics
|
$
|
147
|
|
$
|
(238
|
)
|
$
|
(502
|
)
|
||
|
Enterprise, Embedded and Semi-Custom
|
154
|
|
283
|
|
215
|
|
|||||
|
All Other
|
(97
|
)
|
(417
|
)
|
(194
|
)
|
|||||
|
Total operating income (loss)
|
$
|
204
|
|
$
|
(372
|
)
|
$
|
(481
|
)
|
||
Computing and Graphics
Computing and Graphics net revenue of
$3.0 billion
in
2017
increased
by
54%
compared to
$2.0 billion
in
2016
as a result of a
47%
increase
in average selling price and a
2%
increase
in unit shipments. The
increase
in the average selling price was primarily due to a favorable shift in product mix as we transitioned to our new Radeon™ GPU and Ryzen™ desktop processor products. The increase in unit shipments was primarily attributable to higher demand for our GPU products.
Computing and Graphics net revenue of
$2.0 billion
in
2016
increased
by
9%
compared to
$1.8 billion
in
2015
as a result of a
9%
increase
in unit shipments, offset by a
2%
decrease
in average selling price. The increase in unit shipments was primarily attributable to higher unit shipments of our GPU products, partially offset by lower unit shipments of our microprocessor products. The increase of unit shipments of our GPU products was primarily driven by demand for our Polaris architecture-based GPU products. The decrease in unit shipments of our microprocessor products was primarily due to lower unit shipments of our desktop microprocessor products due to lower demand, partially offset by higher shipments of notebook microprocessor products driven by higher demand for our 7th Generation A-Series notebook processors. The decrease in average selling price was primarily attributable to a decrease in average selling price of our desktop microprocessor and notebook GPU products due to a shift in our product mix, partially offset by an increase in average selling price of our channel GPU products primarily due to strong demand for our Polaris architecture-based GPU products.
Computing and Graphics operating
income
was
$147 million
in
2017
compared to an operating
loss
of
$238 million
in
2016
. The
improvement
in operating results was primarily due to the increase in net revenue referenced above, partially offset by the related increase in cost of sales and an $84 million increase in operating expenses. Operating expenses increased for the reasons set forth under “Expenses” below.
Computing and Graphics operating
loss
was
$238 million
in
2016
compared to an operating
loss
of
$502 million
in
2015
. The improvement in operating results was primarily due to the increase in net revenue referenced above and a decrease in operating expenses, partially offset by an increase in cost of sales primarily due to higher sales in 2016 compared to 2015. In 2015, cost of sales included an inventory write-down of $52 million as a result of lower than anticipated demand for primarily older-generation APU products. Operating expenses decreased for the reasons set forth under “Expenses” below.
Enterprise, Embedded and Semi-Custom
Enterprise, Embedded and Semi-Custom net revenue of
$2.3 billion
in
2017
was flat compared to
2016
. IP related revenue and sales of our AMD EPYC™ datacenter processors, which were launched in June of 2017, were mostly offset by a decrease in non-recurring engineering (NRE) revenue and lower sales of our semi-custom SoC products.
Enterprise, Embedded and Semi-Custom net revenue of
$2.3 billion
in
2016
increased
by
5%
compared to net revenue of
$2.2 billion
in
2015
. The
increase
in net revenue was primarily due to an increase in unit shipments of our semi-custom SoC products and NRE revenue. The increase in unit shipments was primarily driven by increased demand.
Enterprise, Embedded and Semi-Custom operating
income
was
$154 million
in
2017
compared to operating
income
of
$283 million
in
2016
. The
decline
in operating results was primarily due to a $108 million increase in operating expenses driven primarily by datacenter-related operating expenses, and costs associated with the WSA for certain wafers purchased at another foundry, partially offset by IP related revenue. The decline in operating results was also due to $36 million less licensing gain recorded in
41
2017 related to the licensed IP to the THATIC JV compared to 2016. Operating expenses increased for the reasons set forth under “Expenses” below.
Enterprise, Embedded and Semi-Custom operating income was
$283 million
in
2016
compared to operating
income
of
$215 million
in
2015
. The
improvement
in operating results was primarily due to the increase in net revenue referenced above, an $88 million licensing gain recorded in 2016 related to the Licensed IP to the THATIC JV, and a decrease in cost of sales, in part due to the absence of a technology node transition charge of $33 million recorded in 2015, partially offset by an increase in operating expenses. Operating expenses increased for the reasons set forth under “Expenses” below.
All Other
All Other operating
loss
of
$97 million
in
2017
was related to
stock-based compensation expense
.
All Other operating
loss
of
$417 million
in
2016
included a charge of $340 million, which was comprised of the $100 million payment under the Sixth Amendment and the $240 million value of the warrant under the Warrant Agreement, and stock-based compensation expense of $86 million, partially offset by restructuring reversals of $10 million.
All Other operating
loss
of
$194 million
in
2015
included restructuring and other special charges, net of $129 million and stock-based compensation expense of $63 million. Restructuring and other special charges, net of $129 million included $76 million related to our decision to exit from the dense server systems business, $37 million related to our 2015 Restructuring Plan and $16 million related to our 2014 Restructuring Plan.
Comparison of Gross Margin, Expenses, Interest Expense, Other Income (Expense), Net Income Taxes and Equity Loss in investee
The following is a summary of certain consolidated statement of operations data for
2017
,
2016
and
2015
:
|
2017
|
2016
|
2015
|
|||||||||
|
|
(In millions, except for percentages)
|
||||||||||
|
Cost of sales
|
$
|
3,506
|
|
$
|
3,274
|
|
$
|
2,911
|
|
||
|
Gross margin
|
1,823
|
|
998
|
|
1,080
|
|
|||||
|
Gross margin percentage
|
34
|
%
|
23
|
%
|
27
|
%
|
|||||
|
Research and development
|
1,160
|
|
1,008
|
|
947
|
|
|||||
|
Marketing, general and administrative
|
511
|
|
460
|
|
482
|
|
|||||
|
Amortization of acquired intangible assets
|
—
|
|
—
|
|
3
|
|
|||||
|
Restructuring and other special charges, net
|
—
|
|
(10
|
)
|
129
|
|
|||||
|
Licensing gain
|
(52
|
)
|
(88
|
)
|
—
|
|
|||||
|
Interest expense
|
(126
|
)
|
(156
|
)
|
(160
|
)
|
|||||
|
Other income (expense), net
|
(9
|
)
|
80
|
|
(5
|
)
|
|||||
|
Provision for income taxes
|
19
|
|
39
|
|
14
|
|
|||||
|
Equity loss in investee
|
$
|
(7
|
)
|
$
|
(10
|
)
|
$
|
—
|
|
||
Gross Margin
Gross margin as a percentage of net revenue was
34%
in
2017
compared to
23%
in
2016
. Gross margin
improved
in
2017
primarily due to the absence of the charge of $340 million recorded in 2016, described below, which accounted for eight gross margin percentage points. In addition, the increase in gross margin percentage for
2017
compared to
2016
was due to a favorable shift in product mix to new Radeon™ GPU and Ryzen™ desktop processor products in the Computing and Graphics segment.
Gross margin as a percentage of net revenue was
23%
in
2016
compared to
27%
in
2015
. Gross margin in 2016 was adversely impacted by a charge of $340 million, comprised of a $100 million payment under the Sixth Amendment and the value of the warrant of $240 million under the Warrant Agreement. The impact of the charge accounted for eight gross margin percentage points. Gross margin in 2015 was adversely impacted by an inventory write-down of $65 million, which was primarily the result of lower anticipated demand for older-generation APUs, and a technology node transition charge of $33 million. The impact of the inventory write-down and the technology node transition charge accounted for approximately two percentage points. In the absence of these charges, the gross margin would have increased by two percentage points, primarily driven by improved product mix.
42
Expenses
Research and Development Expenses
Research and development expenses of
$1.2 billion
in
2017
increased
by
$152 million
, or
15%
, compared to
$1.0 billion
in
2016
. The
increase
was primarily due to a $92 million increase in product engineering and design related costs, driven by strategic investments in datacenter and other high performance products attributable to both segments, and also due to higher annual employee incentives driven by improved financial performance.
Research and development expenses of $1.0 billion in
2016
increased
by
$61 million
, or
6%
, compared to
$947 million
in
2015
. The
increase
was primarily due to a $138 million increase in research and development expenses attributable to our Enterprise, Embedded and Semi-Custom segment and a $13 million increase attributable to our All Other category, partially offset by a $90 million decrease in research and development expenses attributable to our Computing and Graphics segment. Research and development expenses attributable to our Enterprise, Embedded and Semi-Custom segment increased primarily due to a $128 million increase in product engineering and design costs. Research and development expenses attributable to our All Other category increased primarily due to a $13 million increase in stock-based compensation expense. Research and development expenses attributable to our Computing and Graphics segment decreased primarily due to a $108 million decrease in product engineering and design costs.
Marketing, General and Administrative Expenses
Marketing, general and administrative expenses of
$511 million
in
2017
increased
by
$51 million
, or
11%
, compared to
$460 million
in
2016
. The
increase
was primarily due to a $30 million increase in sales and marketing activities attributable to both segments and also due to higher annual employee incentives driven by our improved financial performance.
Marketing, general and administrative expenses of
$460 million
in
2016
decreased
by
$22 million
, or
5%
, compared to
$482 million
in
2015
. The
decrease
was primarily due to a $40 million decrease in marketing, general and administrative expenses attributable to our Computing and Graphics segment primarily due to an $18 million decrease in sales and marketing activities and a $22 million decrease in other general and administrative expenses, partially offset by a $6 million increase in other general and administrative expenses attributable to our Enterprise, Embedded and Semi-Custom segment and a $12 million increase attributable to our All Other category primarily due to an $11 million increase in stock-based compensation expense.
Restructuring and Other Special Charges, Net
2015 Restructuring Plan
In the third quarter of 2015, we implemented a restructuring plan (2015 Restructuring Plan) focused on our ongoing efforts to simplify our business and better align resources around our priorities and business outlook. The 2015 Restructuring Plan involved a reduction of global headcount by approximately 5% and included organizational actions such as outsourcing certain IT services and application development. During 2015, we recorded a $37 million restructuring charge which consisted of $27 million for severance and benefit costs, $1 million for facilities-related costs and $9 million for intangible asset-related charges. The actions associated with the 2015 Restructuring Plan were completed during the first quarter of 2017. The liabilities related to the 2015 Restructuring Plan recorded in Other current liabilities and Other long-term liabilities on our consolidated balance sheets as of
December 30, 2017
and
December 31, 2016
were zero and $3 million, respectively.
2014 Restructuring Plan
In the fourth quarter of 2014, we implemented a restructuring plan (2014 Restructuring Plan) designed to improve operating efficiencies. The 2014 Restructuring Plan involved a reduction of global headcount by approximately
6%
and an alignment of our real estate footprint with our reduced headcount. We recorded a
$57 million
restructuring charge in the fourth quarter of 2014, which consisted of
$44 million
for severance and costs related to the continuation of certain employee benefits,
$6 million
for contract or program termination costs,
$1 million
for facilities-related costs and
$6 million
for asset impairments, a non-cash charge. During 2015, we recorded a $16 million restructuring charge which consisted of $5 million non-cash charge related to asset impairments, $2 million for severance and related benefits and $9 million for facilities-related costs. The 2014 Restructuring Plan was completed during the third quarter of 2015.The liabilities related to the 2014 Restructuring Plan recorded in Other current liabilities and Other long-term liabilities on our consolidated balance sheets as of
December 30, 2017
and
December 31, 2016
were zero and
$4 million
, respectively.
Dense Server Systems Business Exit
43
As a part of our strategy to simplify and sharpen our investment focus, we exited the dense server systems business, formerly SeaMicro, in the first quarter of 2015. As a result, we recorded a charge of $76 million in “Restructuring and other special charges, net” on our consolidated statements of operations during 2015. This charge consisted of an impairment charge of $62 million related to the acquired intangible assets. We concluded that the carrying value of the acquired intangible assets associated with our dense server systems business was fully impaired as we did not have plans to utilize the related freedom fabric technology in any of our future products nor did we have any plans at that time to monetize the associated intellectual property. In addition, the exit charge consisted of a $7 million non-cash charge related to asset impairments, $4 million of severance and related benefits and $3 million for contract or program termination costs. We substantially completed this exit activity during the second quarter of 2016.
Interest Expense
Interest expense of
$126 million
in
2017
decreased
by
$30 million
compared to
$156 million
in
2016
, primarily due to
lower weighted average interest rates and lower debt balances
.
Interest expense of
$156 million
in
2016
decreased by
$4 million
compared to $160 million in
2015
, primarily due to the repurchases of debt bearing higher interest rates and issuance of new debt at a lower interest rate in late 2016.
Other Income (Expense), Net
Other
expense
, net of
$9 million
in
2017
changed by
$89 million
compared to
$80 million
Other
income
, net in
2016
. Other
expense
, net in
2017
consisted of $12 million total loss on debt redemption partially offset by a $3 million gain for final settlement related to the sale of 85% of the equity interest in the ATMP facilities. The change from
2016
to
2017
was primarily the result of the absence in 2017 of the substantial gain on sale of equity interests in ATMP JV that was partially offset by debt repurchases which was realized in 2016.
Other income, net of
$80 million
in
2016
changed by
$85 million
compared to
$5 million
Other
expense
, net in
2015
, primarily due to net gain on sale of equity interests in the ATMP JV of $146 million partially offset by the $68 million total loss on debt repurchases in 2016.
Income Taxes
In December 2017, the U.S. government enacted comprehensive tax legislation commonly referred to as the Tax Cuts and Jobs Act of 2017 (Tax Reform Act). The Tax Reform Act includes significant changes to the U.S. corporate income tax system which reduces the U.S. federal corporate tax rate from 35% to 21% as of January 1, 2018, shifts to a modified territorial tax regime which requires companies to pay a transition tax on earnings of certain foreign subsidiaries that were previously tax deferred, and creates new taxes on certain foreign-sourced earnings.
We recorded an income tax provision of
$19 million
,
$39 million
and
$14 million
in
2017
,
2016
and
2015
, respectively.
The income tax provision in
2017
was primarily due to $39 million of foreign taxes in profitable locations including $27 million of withholding taxes on cross-border transactions where no foreign tax credit is expected to be realizable, offset by $1 million of tax benefits for Canadian tax credits and $19 million primarily attributable to the reversal of the valuation allowance on Alternate Minimum Tax (AMT) credit carryovers due to the Tax Reform Act.
The income tax provision in
2016
was primarily due to
$41 million of foreign taxes in profitable locations including $27 million attributable to gain on the sale of 85% of the ownership interest in the subsidiary operating a factory in Suzhou and $9 million of withholding taxes on cross-border transactions where no foreign tax credit is expected to be realizable, offset by $2 million of tax benefits for Canadian tax credits and the monetization of certain U.S. tax credits
.
The income tax provision in
2015
was primarily due to
$16 million of foreign taxes in profitable locations, offset by $2 million of tax benefits for Canadian tax credits and the monetization of certain U.S. tax credits
.
As of December 26, 2015, the Italian tax authorities had concluded their audit of our subsidiaries’ activities in Italy for the years 2003 through 2013. We entered into a settlement for $11 million in taxes and penalties, which was reflected in full in the 2015 tax provision and $2 million in interest.
As of
December 30, 2017
, substantially all of our U.S. and foreign deferred tax assets, net of deferred tax liabilities, continued to be subject to a valuation allowance. The realization of these assets is dependent on substantial future taxable income which in management’s estimate at
December 30, 2017
is not more likely than not to be achieved.
44
Stock-Based Compensation Expense
We allocated stock-based compensation expense related to employee stock options and restricted stock units for the years ended
December 30, 2017
,
December 31, 2016
and
December 26, 2015
in our consolidated statements of operations as follows:
|
2017
|
2016
|
2015
|
|||||||||
|
|
(In millions)
|
||||||||||
|
Cost of sales
|
$
|
2
|
|
$
|
2
|
|
$
|
3
|
|
||
|
Research and development
|
57
|
|
49
|
|
36
|
|
|||||
|
Marketing, general and administrative
|
38
|
|
35
|
|
24
|
|
|||||
|
Total stock-based compensation expense, net of tax of $0
|
$
|
97
|
|
$
|
86
|
|
$
|
63
|
|
||
During
2017
, we did not realize any excess tax benefits related to stock-based compensation and therefore we did not record any effects relating to operating cash flows. During
2016
and
2015
, we did not realize any excess tax benefits related to stock-based compensation and therefore we did not record any effects relating to financing cash flows.
Stock-based compensation expense of
$97 million
in
2017
increased
by
$11 million
as compared to
$86 million
in
2016
. The
increase
was primarily due to a higher weighted average grant date fair value of unvested restricted stock units in 2017 compared to 2016. The increase was also driven by fewer actual forfeitures in 2017 compared to 2016.
Stock-based compensation expense of
$86 million
in
2016
increased by
$23 million
as compared to
$63 million
in
2015
. The increase was primarily due to a higher weighted average grant date fair value and higher number of shares related to restricted stock units granted in 2016 compared to the restricted stock units granted in 2015, which became fully amortized in 2016. The increase was also driven by performance-based restricted stock units with market conditions granted in 2015 and 2016.
GLOBALFOUNDRIES
Formation and Accounting
On March 2, 2009, we consummated the transactions contemplated by the Master Transaction Agreement among us, Mubadala Technology Investments LLC, or Mubadala Tech (formerly, Advanced Technology Investment Company LLC) and WCH, pursuant to which we formed GLOBALFOUNDRIES Inc. (GF). In connection with the consummation of the transactions contemplated by the Master Transaction Agreement, AMD, Mubadala Tech and GF entered into a Wafer Supply Agreement (the WSA), a Funding Agreement (the Funding Agreement) and a Shareholders’ Agreement (the Shareholders’ Agreement) on March 2, 2009.
On March 4, 2012, as partial consideration for certain rights received under a second amendment to the WSA, we transferred to GF all of the remaining capital stock of GF that we owned. In addition, as of March 4, 2012, the Funding Agreement was terminated and we were no longer party to the Shareholders’ Agreement. As a result of these transactions, we no longer owned any GF capital stock as of March 4, 2012.
GF continues to be a related party of ours because Mubadala and Mubadala Tech are affiliated with WCH, a significant stockholder of ours. WCH and Mubadala Tech are wholly-owned subsidiaries of Mubadala.
Wafer Supply Agreement
The WSA governs the terms by which we purchase products manufactured by GF. Pursuant to the WSA, we are required to purchase from GF all of our microprocessor and APU product requirements and a certain portion of our GPU product requirements, with limited exceptions. If we acquire a third-party business that manufactures microprocessor and APU products, we will have up to two years to transition the manufacture of such microprocessor and APU products to GF.
The WSA terminates no later than March 2, 2024. GF has agreed to use commercially reasonable efforts to assist us to transition the supply of products to another provider and to continue to fulfill purchase orders for up to two years following the termination or expiration of the WSA. During the transition period, pricing for microprocessor and APU products will remain as set forth in the WSA, but our purchase commitments to GF will no longer apply.
45
Sixth Amendment to Wafer Supply Agreement
On August 30, 2016, we entered into a sixth amendment (the Sixth Amendment) to the WSA with GF. The Sixth Amendment modified certain terms of the WSA applicable to wafers for our microprocessor, graphics processor and semi-custom products for a five-year period from January 1, 2016 to December 31, 2020. We agreed to establish with GF a comprehensive framework for technology collaboration for the 7nm technology node.
The Sixth Amendment also provides us a limited waiver with rights to contract with another wafer foundry with respect to certain products in the 14nm and 7nm technology nodes and gives us greater flexibility in sourcing foundry services across our product portfolio. In consideration for these rights, we agreed to pay GF $100 million in installments starting in the fourth fiscal quarter of 2016 through the third fiscal quarter of 2017. From the fourth fiscal quarter of 2016 to the third fiscal quarter of 2017, we paid GF
$25 million
each quarter and as of
December 30, 2017
, we had paid GF $100 million in aggregate. Starting in 2017 and continuing through 2020, we agreed to make quarterly payments to GF based on the volume of certain wafers purchased from another wafer foundry.
Further, for each calendar year during the term of the Sixth Amendment, we agreed with GF to annual wafer purchase targets that increase from 2016 through 2020. If we do not meet the annual wafer purchase target for any calendar year, we will be required to pay to GF a portion of the difference between our actual wafer purchases and the wafer purchase target for that year. The annual targets were established based on our business and market expectations and took into account the limited waiver we received for certain products. We met our 2017 annual wafer purchase target.
We agreed with GF on fixed pricing for wafers purchased during 2016 and established a framework to agree on annual wafer pricing for the years 2017 to 2020. AMD and GF had agreed on pricing for wafer purchases for
2017
.
Our total purchases from GF related to wafer manufacturing, research and development activities and other for
2017
,
2016
and
2015
were
$1.1 billion
,
$0.7 billion
and
$0.9 billion
, respectively. Included in the total purchases for the year ended
December 30, 2017
are amounts related to the volume of certain wafers purchased from another wafer foundry, as agreed to by us and GF under the Sixth Amendment. As of
December 30, 2017
and
December 31, 2016
, the amount of prepayment and other receivables related to GF was
$27 million
and
$32 million
, respectively, included in
Prepayment and other receivables - related parties
on our consolidated balance sheets. As of
December 30, 2017
and
December 31, 2016
, the amount of payable to GF was
$241 million
and
$255 million
, respectively, included in
Payables to related parties
on our consolidated balance sheets.
Warrant Agreement
Also on August 30, 2016, in consideration of the limited waiver and rights under the Sixth Amendment, we entered into a warrant agreement (the Warrant Agreement) with WCH, a wholly-owned subsidiary of Mubadala. Under the Warrant Agreement, WCH and its permitted assigns are entitled to purchase 75 million shares of our common stock (the Warrant Shares) at a purchase price of $5.98 per share. The warrant under the Warrant Agreement is exercisable in whole or in part until February 29, 2020. Notwithstanding the foregoing, the Warrant Agreement will only be exercisable to the extent that Mubadala does not beneficially own, either directly or through any other entities directly and indirectly owned by Mubadala or its subsidiaries, an aggregate of more than 19.99% of our outstanding capital stock after any such exercise.
Equity Interest Purchase Agreement - ATMP Joint Venture
In April 2016, we and certain of our subsidiaries completed the sale of a majority of the equity interests in Suzhou TF-AMD Semiconductor Co., Ltd. (formerly, AMD Technologies (China) Co., Ltd.), and TF AMD Microelectronics (Penang) Sdn. Bhd. (formerly, Advanced Micro Devices Export Sdn. Bhd.), to affiliates of Tongfu Microelectronics Co., Ltd. (formerly, Nantong Fujitsu Microelectronics Co., Ltd.) (TFME), a Chinese joint stock company, to form two joint ventures (collectively, the ATMP JV). As a result of the sale, TFME’s affiliates own 85% of the equity interests in the ATMP JV while certain of our subsidiaries own the remaining 15%. We have no obligations to fund the ATMP JV.
As the result of the transaction, we received approximately $342 million, including purchase price adjustments, in net cash proceeds for selling 85% of the equity interest in each of Suzhou TF-AMD Semiconductor Co., Ltd. and TF AMD Microelectronics (Penang) Sdn. Bhd. These proceeds, net of certain transaction costs, were included in investing activities on our consolidated statements of cash flows for the year ended December 31, 2016.
We recognized a net pre-tax gain on the sale of the 85% equity interest in ATMP JV of
$146 million
for the year ended December 31, 2016, which was recognized in
Other income (expense), net
on our consolidated statements of operations. The net pre-tax gain reflects the excess of the sum of net cash proceeds and fair value of our retained 15% equity interests in the ATMP JV over the sum of the net book values of our former subsidiaries and other closing costs directly attributed to the divestiture. The above gain includes
$11 million
in excess of fair value of our retained interest over the corresponding net book values. During
46
2017
, we recorded a
$3 million
pre-tax gain for final settlement related to the sale of 85% of the equity interest in ATMP facilities in Other income (expense), net on our consolidated statements of operations.
We account for our equity interests in the ATMP JV under the equity method of accounting due to our significant influence over the ATMP JV. As of
December 30, 2017
and
December 31, 2016
, the carrying value of our investment in the ATMP JV was
$58 million
and
$59 million
, respectively.
Following the deconsolidation, the ATMP JV is our related party. The ATMP JV provides assembly, test, mark and packaging (ATMP) services to us. We currently pay the ATMP JV for ATMP services on a cost-plus basis. Our total purchases from the ATMP JV during
2017
and
2016
amounted to approximately
$438 million
and
$265 million
, respectively. As of
December 30, 2017
and
December 31, 2016
, the amount payable to the ATMP JV was
$171 million
and
$128 million
, respectively, included in Payables to related parties on our consolidated balance sheets.
During
2017
and
2016
, we recorded losses of
$7 million
and
$10 million
, respectively, in Equity loss in investee on our consolidated statements of operations, which included certain expenses incurred by us on behalf of the ATMP JV.
Equity Joint Venture
In February 2016, we and Tianjin Haiguang Advanced Technology Investment Co., Ltd. (THATIC), a third-party Chinese entity (JV Partner), formed a joint venture comprised of two separate legal entities, China JV1 and China JV2 (collectively, the THATIC JV). Our equity share in China JV1 and China JV2 is a majority and minority interest, respectively, funded by our contribution of certain of our patents. The JV Partner is responsible for the initial and on-going financing of the THATIC JV’s operations. We have no obligations to fund the THATIC JV.
We concluded the China JV1 and China JV2 are not operating joint ventures and are variable interest entities due to their reliance on on-going financing by JV Partner. We determined that we are not the primary beneficiary of either China JV1 or China JV2, as we do not have unilateral power to direct selling and marketing, manufacturing and product development activities related to the THATIC JV's products. Accordingly, we do not consolidate either of these entities and therefore account for our investments in the THATIC JV under the equity method of accounting. The THATIC JV is a related party of ours.
In February 2016, we licensed certain of our intellectual property (Licensed IP) to the THATIC JV for a total of approximately $293 million in license fees payable over several years contingent upon achievement of certain milestones. We also expect to receive a royalty based on the sales of the THATIC JV’s products to be developed on the basis of such Licensed IP. We also provided certain engineering and technical support to the THATIC JV in connection with the product development. In March 2017, we entered into a development and intellectual property agreement (Development and IP) with THATIC JV, and also expect to receive a royalty based on the sales of the THATIC JV’s products to be developed on the basis of such agreement. In addition, from time to time, we enter into certain agreements with the THATIC JV to provide other services primarily related to research and development.
We recognized income related to the Licensed IP over the period commencing upon delivery of the first Licensed IP milestone through the date of the milestone that required our continuing involvement in the product development process, which was completed at the end of the second quarter of 2017. Royalty payments will be recognized in income once earned. We classify Licensed IP income and royalty income associated with the February 2016 agreement as other operating income. During 2017, we recognized a
$52 million
licensing gain associated with the Licensed IP. In addition, during 2017 we recognized
$36 million
of Development and IP fees and other services fees of
$12 million
as credits to research and development expenses. During
2016
, we recognized an
$88 million
licensing gain. No credits for the Development and IP agreement and other services was recognized as credits to research and development by us during
2016
. No royalty income was recognized by us during
2017
and
2016
.
Our total exposure to losses through our investment in the THATIC JV is limited to our investments in the THATIC JV, which was zero as of
December 30, 2017
. Our share in the net losses of the THATIC JV for
2017
was not material and is not recorded in our consolidated statement of operations since we are not obligated to fund the THATIC JV's losses in excess of our investment in the THATIC JV. Our receivable from the THATIC JV for these agreements was
$3 million
and
zero
as of
December 30, 2017
and
December 31, 2016
, respectively, included in
Prepayment and other receivables - related parties
on our consolidated balance sheets. As of
December 30, 2017
and
December 31, 2016
, the total assets and liabilities of the THATIC JV were
not material
.
International Sales
International sales as a percentage of net revenue were
74%
in
2017
and
78%
in
2016
. The
decrease
in international sales as a percentage of net revenue in
2017
compared to
2016
was primarily driven by
a higher proportion of revenue from domestic sales of our desktop processors, graphics processors and semi-custom SoC products
.
47
International sales as a percentage of net revenue were
78%
in
2016
and
75%
in
2015
. The
increase
in international sales as a percentage of net revenue in
2016
compared to
2015
was primarily driven by
higher proportion of revenue from international sales of our semi-custom SoC products
.
We expect that international sales will continue to be a significant portion of total sales in the foreseeable future. Substantially all of our sales transactions were denominated in U.S. dollars.
FINANCIAL CONDITION
Liquidity
As of
December 30, 2017
, our cash and cash equivalents consisted of cash, government money market funds and commercial paper. Our cash and cash equivalents as of
December 30, 2017
were
$1.2 billion
compared to
$1.3 billion
as of
December 31, 2016
.
The
decrease
during the year was due to net cash used in our investing and financing activities, partially offset by net cash provided by our operating activities discussed below. The percentage of cash and cash equivalents held domestically was
95%
as of
December 30, 2017
, and
98%
as of
December 31, 2016
.
Our cash flows for fiscal
2017
,
2016
and
2015
were as follows:
|
2017
|
2016
|
2015
|
|||||||||
|
|
(In millions)
|
||||||||||
|
Net cash provided by (used in):
|
|||||||||||
|
Operating activities
|
$
|
68
|
|
$
|
90
|
|
$
|
(226
|
)
|
||
|
Investing activities
|
(114
|
)
|
267
|
|
147
|
|
|||||
|
Financing activities
|
(33
|
)
|
122
|
|
59
|
|
|||||
|
Net increase (decrease) in cash and cash equivalents
|
$
|
(79
|
)
|
$
|
479
|
|
$
|
(20
|
)
|
||
Our debt obligations of
$1.40 billion
, net of unamortized debt discount of
$286 million
, associated with the 2.125% Notes, as of
December 30, 2017
decreased
compared to
$1.44 billion
as of
December 31, 2016
.
We believe our cash and cash equivalents balance along with our Secured Revolving Line of Credit will be sufficient to fund operations, including capital expenditures, over the next 12 months. We believe that in the event we decide to obtain external funding, we may be able to access the capital markets on terms and in amounts adequate to meet our objectives.
Should we require additional funding such as to meet payment obligations of our long-term debt when due, we may need to raise the required funds through borrowings or public or private sales of debt or equity securities, which may be issued from time to time under an effective registration statement, through the issuance of securities in a transaction exempt from registration under the Securities Act of 1933, as amended, or a combination of one or more of the foregoing. Uncertain global economic conditions have in the past adversely impacted, and may in the future adversely impact, our business. If market conditions deteriorate, we may be limited in our ability to access the capital markets to meet liquidity needs on favorable terms or at all, which could adversely affect our liquidity and financial condition including our ability to refinance maturing liabilities.
Operating Activities
Net cash
provided by
operating activities was
$68 million
in
2017
compared to net cash
provided by
operating activities of
$90 million
in
2016
. The
decrease
in cash inflows from operating activities was primarily due to higher operating costs including higher wafer purchases, higher labor costs and payments to GF in aggregate of $50 million of a limited waiver of rights under the Sixth Amendment, partially offset by higher cash collection primarily due to higher revenue and lower interest payments resulting from debt reductions.
Net cash
provided by
operating activities was
$90 million
in
2016
compared to net cash
used in
operating activities of
$226 million
in
2015
. The
increase
in cash flows from operating activities was primarily due to lower operating expenses including lower labor costs and lower restructuring-related payments, the receipt of $97 million associated with the licensing agreement with THATIC JV and higher sales and timing of related collections, partially offset by timing of accounts payable payments.
During
2017
, we did not realize any excess tax benefit related to stock-based compensation. Therefore, we did not record any effects relating to operating cash flows for these periods.
Investing Activities
48
Net cash
used in
investing activities was
$114 million
in 2017, which consisted primarily of a cash outflow of
$113 million
for purchases of property, plant and equipment.
Net cash
provided by
investing activities was
$267 million
in 2016, which consisted of a net cash inflow of $342 million from sale of equity interests in the ATMP JV, partially offset by a cash outflow of
$77 million
for purchases of property, plant and equipment.
Net cash
provided by
investing activities was
$147 million
in 2015, which consisted of a net cash inflow of $235 million from purchases, sales and maturities of available for sale securities, partially offset by a net cash outflow of
$88 million
for purchases and sales of property, plant and equipment.
Financing Activities
Net cash
used in
financing activities was
$33 million
in 2017, primarily due to the repurchases of an aggregate principal amount of $103 million of our outstanding 6.75% Notes and 7.00% Notes for $110 million in cash and $13 million for tax withholding on the vesting of restricted stock, partially offset by the $70 million net proceeds from our Secured Revolving Line of Credit and the $20 million proceeds from issuance of common stock under stock-based compensation equity plans.
Net cash
provided by
financing activities was
$122 million
in 2016, primarily due to the $782 million net proceeds from the issuance of our 2.125% Notes, the $667 million net proceeds from selling 115 million shares of our common stock and the $20 million proceeds from issuance of common stock under stock-based compensation equity plans, partially offset by the repurchases of an aggregate principal amount of $1.1 billion of our outstanding 6.75% Notes, 7.75% Notes, 7.50% Notes and 7.00% Notes for $1.1 billion in cash and repayments in aggregate of $230 million of our Secured Revolving Line of Credit.
Net cash
provided by
financing activities was
$59 million
in 2015, primarily due to net proceeds from borrowings pursuant to our Secured Revolving Line of Credit of $100 million, of which $42 million was used to repay the remaining aggregate principal amount of our 6.00% Convertible Senior Notes due 2015 (6.00% Notes) during the second quarter of 2015. In addition, during 2015, we received $5 million from the exercise of employee stock options.
During
2016
and
2015
, we did not realize any excess tax benefit related to stock-based compensation. Therefore, we did not record any effects relating to financing cash flows for these periods.
49
Contractual Obligations
The following table summarizes our consolidated principal contractual cash obligations, as of
December 30, 2017
, and is supplemented by the discussion following the table:
|
|
Payment due by period
|
||||||||||||||||||||||||||
|
(In millions)
|
Total
|
2018
|
2019
|
2020
|
2021
|
2022
|
2023 and
thereafter |
||||||||||||||||||||
|
Senior Notes
|
|||||||||||||||||||||||||||
|
6.75% Notes
|
$
|
166
|
|
$
|
—
|
|
$
|
166
|
|
$
|
—
|
|
$
|
—
|
|
$
|
—
|
|
$
|
—
|
|
||||||
|
7.50% Notes
|
347
|
|
—
|
|
—
|
|
—
|
|
—
|
|
347
|
|
—
|
|
|||||||||||||
|
7.00% Notes
|
311
|
|
—
|
|
—
|
|
—
|
|
—
|
|
—
|
|
311
|
|
|||||||||||||
|
2.125% Notes
|
805
|
|
—
|
|
—
|
|
—
|
|
—
|
|
—
|
|
805
|
|
|||||||||||||
|
Secured Revolving Line of Credit
|
70
|
|
70
|
|
—
|
|
—
|
|
—
|
|
—
|
|
—
|
|
|||||||||||||
|
Other long-term liabilities
(1)
|
109
|
|
51
|
|
45
|
|
8
|
|
3
|
|
—
|
|
2
|
|
|||||||||||||
|
Aggregate interest obligation
(2)
|
459
|
|
78
|
|
72
|
|
66
|
|
66
|
|
65
|
|
112
|
|
|||||||||||||
|
Operating leases
|
255
|
|
40
|
|
35
|
|
31
|
|
29
|
|
28
|
|
92
|
|
|||||||||||||
|
Purchase obligations
(3)
|
513
|
|
346
|
|
65
|
|
40
|
|
33
|
|
29
|
|
—
|
|
|||||||||||||
|
Obligations to GF
(4)
|
2,841
|
|
1,297
|
|
764
|
|
780
|
|
—
|
|
—
|
|
—
|
|
|||||||||||||
|
Total contractual obligations
(5)
|
$
|
5,876
|
|
$
|
1,882
|
|
$
|
1,147
|
|
$
|
925
|
|
$
|
131
|
|
$
|
469
|
|
$
|
1,322
|
|
||||||
|
(1)
|
Amounts largely represent future fixed and non-cancellable cash payments associated with software technology and licenses and IP licenses, including the payments due within the next 12 months.
|
|
(2)
|
Represents estimated aggregate interest obligations for our outstanding debt obligations that are payable in cash, excluding non-cash amortization of debt issuance costs and debt discount.
|
|
(3)
|
We have purchase obligations for goods and services where payments are based, in part, on the volume or type of services we acquire. In those cases, we only included the minimum volume of purchase obligations in the table above. Purchase orders for goods and services that are cancellable upon notice and without significant penalties are not included in the amounts above.
|
|
(4)
|
These minimum purchase obligations are our contractual minimums and do not necessarily reflect our actual expected expenditures, which could be significantly different. We cannot meaningfully quantify or estimate our future purchase obligations to GF beyond 2020 but expect that our future purchases from GF will continue to be material.
|
|
(5)
|
Total amount excludes contractual obligations already recorded on our condensed consolidated balance sheets except for debt obligations and other liabilities related to software and technology licenses and IP licenses.
|
Senior Notes
6.75% Senior Notes Due 2019
On February 26, 2014, we issued $600 million of our 6.75% Notes. Our 6.75% Notes are our general unsecured senior obligations. Interest is payable on March 1 and September 1 of each year beginning September 1, 2014 until the maturity date of March 1, 2019. Our 6.75% Notes are governed by the terms of an indenture (the 6.75% Indenture) dated February 26, 2014 between us and Wells Fargo Bank, N.A., as trustee.
At any time before March 1, 2019, we may redeem some or all of our 6.75% Notes at a price equal to 100% of the principal amount, plus accrued and unpaid interest and a “make whole” premium (as set forth in the 6.75% Indenture).
In 2016, we repurchased $404 million in aggregate principal amount of our 6.75% Notes pursuant to a partial tender offer for $442 million. During 2017, we settled $30 million in aggregate principal amount of our 6.75% Notes for $26 million in cash and $5 million in treasury stock. As of
December 30, 2017
, the outstanding aggregate principal amount of our 6.75% Notes was
$166 million
.
See Note 11 of “Notes to Consolidated Financial Statements” below, for additional information regarding our 6.75% Notes.
50
7.50% Senior Notes Due 2022
On August 15, 2012, we issued $500 million of our 7.50% Notes. Our 7.50% Notes are our general unsecured senior obligations. Interest is payable on February 15 and August 15 of each year beginning February 15, 2013 until the maturity date of August 15, 2022. The 7.50% Notes are governed by the terms of an indenture (the 7.50% Indenture) dated August 15, 2012 between us and Wells Fargo Bank, N.A., as trustee.
Prior to August 15, 2022, we may redeem some or all of our 7.50% Notes at a price equal to 100% of the principal amount, plus accrued and unpaid interest and a “make whole” premium (as set forth in the 7.50% Indenture).
In 2014, we repurchased $25 million in aggregate principal amount of our 7.50% Notes. In 2016, we repurchased $125 million in aggregate principal amount of our 7.50% Notes. During 2017, we settled $3 million in aggregate principal amount of its 7.50% Notes for $3 million in treasury stock. As of
December 30, 2017
, the outstanding aggregate principal amount of our 7.50% Notes was
$347 million
.
See Note 11 of “Notes to Consolidated Financial Statements” below, for additional information regarding our 7.50% Notes.
7.00% Senior Notes Due 2024
On June 16, 2014, we issued $500 million of our 7.00% Notes. The 7.00% Notes are our general unsecured senior obligations. Interest is payable on January 1 and July 1 of each year beginning January 1, 2015 until the maturity date of July 1, 2024. The 7.00% Notes are governed by the terms of an indenture (the 7.00% Indenture) dated June 16, 2014 between us and Wells Fargo Bank, N.A., as trustee.
Prior to July 1, 2019, we may redeem some or all of the 7.00% Notes at a price equal to 100% of the principal amount plus accrued and unpaid interest and a “make whole” premium (as set forth in the 7.00% Indenture).
Starting July 1, 2019, we may redeem our 7.00% Notes for cash at the following specified prices plus accrued and unpaid interest:
|
Period
|
Price as
Percentage of
Principal Amount
|
|
Beginning on July 1, 2019 through June 30, 2020
|
103.500%
|
|
Beginning on July 1, 2020 through June 30, 2021
|
102.333%
|
|
Beginning on July 1, 2021 through June 30, 2022
|
101.167%
|
|
On July 1, 2022 and thereafter
|
100.000%
|
In 2016, we settled
$84 million
in aggregate principal amount of our
7.00%
Notes for
$77 million
in cash and
$8 million
in treasury stock. During
2017
, we settled
$105 million
in aggregate principal amount of our
7.00%
Notes for
$84 million
in cash and
$26 million
in treasury stock. As of
December 30, 2017
, the outstanding aggregate principal amount of the
7.00%
Notes was
$311 million
.
See Note 11 of “Notes to Consolidated Financial Statements” below, for additional information regarding our 7.00% Notes.
2.125% Convertible Senior Notes Due 2026
On September 14, 2016, we issued $700 million in aggregate principal amount of our 2.125% Notes. We also granted an option to the underwriters to purchase up to an additional $105 million aggregate principal amount of our 2.125% Notes. On September 28, 2016, this option was exercised in full and we issued an additional $105 million aggregate principal amount of our 2.125% Notes.
Our 2.125% Notes are our general unsecured senior obligations and will mature on September 1, 2026, unless earlier repurchased or converted. Interest is payable in arrears on March 1 and September 1 of each year beginning on March 1, 2017. Our 2.125% Notes are governed by the terms of a base indenture and a supplemental indenture (together the 2.125% Indentures) dated September 14, 2016 between us and Wells Fargo Bank, N.A., as trustee.
Holders may convert their notes at their option at any time prior to the close of business on the business day immediately preceding June 1, 2026 only under the following circumstances: (1) during any calendar quarter commencing after the calendar quarter ending on September 30, 2016 (and only during such calendar quarter), if the last reported sale price of our common stock for at least 20 trading days (whether or not consecutive) during a period of 30 consecutive trading days ending on the last trading day of the immediately preceding calendar quarter is greater than or equal to 130% of the conversion price on each applicable trading day; (2) during the five business day period after any 10 consecutive trading day period (the “measurement period”) in which the trading price per $1,000 principal amount of notes for each trading day of the measurement period was less than 98% of the product of the last reported sale price of our common stock and the conversion rate on each such trading day; or (3) upon
51
the occurrence of specified corporate events. On or after June 1, 2026 and until the close of business on the business day immediately preceding the maturity date, holders may convert their notes at any time, regardless of the foregoing circumstances. Upon conversion, we will pay or deliver, as the case may be, cash, shares of our common stock or a combination of cash and shares of the our common stock, at our election. During the fourth quarter of 2017, none of the conversion conditions were satisfied and as a result, the 2.125% Notes are not eligible for conversion during the first calendar quarter of 2018.We may not redeem the notes prior to the maturity date, and no sinking fund is provided for the notes.
The conversion rate is initially
125.0031
shares of common stock per $1,000 principal amount of notes (equivalent to an initial conversion price of approximately
$8.00
per share of common stock). The conversion rate is subject to adjustment in some events but will not be adjusted for any accrued and unpaid interest. In addition, following certain corporate events that occur prior to the maturity date, we will increase the conversion rate for a holder who elects to convert its notes in connection with such a corporate event in certain circumstances.
If we undergo a fundamental change prior to the maturity date of the notes, holders may require us to repurchase for cash all or any portion of their notes at a fundamental change repurchase price equal to 100% of the principal amount of the notes to be repurchased plus accrued and unpaid interest to, but excluding, the fundamental change repurchase date.
As of
December 30, 2017
, the outstanding aggregate principal amount of our 2.125% Notes was
$805 million
. See Note 11 of “Notes to Consolidated Financial Statements” below for additional information regarding our 2.125% Notes.
Potential Repurchase of Outstanding Notes
We may elect to purchase or otherwise retire all or a portion of our 6.75% Notes, 7.50% Notes, 7.00% Notes and 2.125% Notes with cash, stock or other assets from time to time in open market or privately negotiated transactions, either directly or through intermediaries or by tender offer when we believe the market conditions are favorable to do so.
Secured Revolving Line of Credit
Loan and Security Agreement
We and our subsidiary, AMD International Sales & Service, Ltd. (together, the Borrowers), entered into a loan and security agreement on November 12, 2013, as amended on December 11, 2014 (the Loan Agreement), for our secured revolving line of credit for a principal amount of up to $500 million (the Secured Revolving Line of Credit), with up to $75 million available for issuance of letters of credit, with a group of lenders and Bank of America, N.A., acting as agent for the lenders (the Agent). Our Secured Revolving Line of Credit had a maturity date of November 12, 2018. Borrowings under our Secured Revolving Line of Credit were limited to up to 85% of eligible account receivable minus certain reserves and may be used for general corporate purposes including working capital needs.
Amended and Restated Loan and Security Agreement
On April 14, 2015, the Borrowers and ATI Technologies ULC (collectively, the Loan Parties), amended and restated the Loan Agreement (the Amended and Restated Loan Agreement) by and among the Loan Parties, the financial institutions party thereto from time to time as lenders (the Lenders) and the Agent.
The Amended and Restated Loan Agreement provides for a Secured Revolving Line of Credit for a principal amount up to $500 million with up to $75 million available for issuance of letters of credit, which remained unchanged from the Loan Agreement. Borrowings under the Secured Revolving Line of Credit are limited to up to 85% of eligible accounts receivable (90% for certain qualified eligible accounts receivable) minus specified reserves. The size of the commitments under the Secured Revolving Line of Credit may be increased by up to an aggregate amount of $200 million.
The Secured Revolving Line of Credit matures on April 14, 2020 and is secured by a first priority security interest in the Loan Parties’ accounts receivable, inventory, deposit accounts maintained with the Agent and other specified assets including books and records.
First Amendment to the Amended and Restated Loan and Security Agreement
On June 10, 2015, the Loan Parties entered into a first amendment to the Amended and Restated Loan and Security Agreement (the First Amendment) by and among the Loan Parties, the Lenders and the Agent, which modifies the Amended and Restated Loan and Security Agreement. Amendments to the Amended and Restated Loan Agreement effected by the First Amendment included the addition of exceptions to the liens and asset sale covenants to permit the Loan Parties to enter into certain supply chain finance arrangements, as well as the addition of certain definitions related thereto.
52
Second Amendment to the Amended and Restated Loan and Security Agreement
On April 29, 2016, the Loan Parties entered into a second amendment to the Amended and Restated Loan and Security Agreement (the Second Amendment) by and among the Loan Parties, the Lenders and the Agent, which modifies the Amended and Restated Loan and Security Agreement. The primary amendment to the Amended and Restated Loan Agreement effected by the Second Amendment related to the expansion of the definition of the term "Permitted Asset Dispositions" to include the sale or transfer of inventory to the ATMP JV pursuant to the Equity Interest Purchase Agreement between us and TFME.
Third Amendment to the Amended and Restated Loan and Security Agreement
On June 21, 2016, the Loan Parties entered into a third amendment to the Amended and Restated Loan and Security Agreement (the Third Amendment) by and among the Loan Parties, the Lenders and the Agent, which modifies the Amended and Restated Loan and Security Agreement. Amendments to the Amended and Restated Loan Agreement effected by the Third Amendment included the further expansion of the asset sale covenants to permit the Loan Parties to enter into certain supply chain finance arrangements.
Fourth Amendment to the Amended and Restated Loan and Security Agreement
On September 7, 2016, the Loan Parties entered into a fourth amendment to the Amended and Restated Loan and Security Agreement (the Fourth Amendment) by and among the Loan Parties, the Lenders and the Agent, which modifies the Amended and Restated Loan and Security Agreement. The primary amendment to the Amended and Restated Loan agreement effected by the Fourth Amendment increased the dollar limit as set forth the definition related to certain supply chain finance arrangements.
Fifth Amendment to the Amended and Restated Loan and Security Agreement
On March 21, 2017, the Loan Parties entered into a fifth amendment to the Amended and Restated Loan Agreement (the Fifth Amendment) by and among the Loan Parties, the financial institutions party thereto from time to time as lenders and the Agent, which modifies the Amended and Restated Loan Agreement. The Fifth Amendment amends the Amended and Restated Loan Agreement by, among other things, extending the maturity date of the Secured Revolving Line of Credit from April 14, 2020 to March 21, 2022, reducing the Applicable Margin (as defined in the Amended and Restated Loan Agreement), reducing the commitment fee, lowering the minimum threshold of Availability (as defined in the Amended and Restated Loan Agreement) required to be maintained by the Company and AMDISS in order to avoid cash dominion, amending the borrowing base reporting requirement, amending maximum dollar limits related to supply chain finance arrangements, increasing the LC Facility Fees (as defined in the Amended and Restated Loan Agreement) and reducing the amount of the Secured Revolving Line of Credit available for the issuance for letters of credit from $75 million to $45 million.
The Amended and Restated Loan Agreement provides for a Secured Revolving Line of Credit for a principal amount up to $500 million with up to $45 million available for issuance of letters of credit. Borrowings under the Secured Revolving Line of Credit are limited to up to 85% of eligible accounts receivable (90% for certain qualified eligible accounts receivable), minus specified reserves. The size of the commitments under the Secured Revolving Line of Credit may be increased by up to an aggregate amount of $200 million.
The Secured Revolving Line of Credit is secured by a first priority security interest in the Loan Parties’ accounts receivable, inventory, deposit accounts maintained with the Agent and other specified assets, including books and records.
Sixth Amendment to the Amended and Restated Loan and Security Agreement
On September 19, 2017, the Loan Parties entered into a sixth amendment to the Amended and Restated Loan Agreement (the Sixth Amendment) by and among the Loan Parties, the financial institutions party thereto from time to time as lenders and the Agent, which modifies the Amended and Restated Loan Agreement. The Sixth Amendment amends the definition of the term “Qualified Factor Arrangement” to state that the amount held or owing or subject to repurchase is limited to (i) during the Company’s first fiscal quarter of each of its fiscal years, $220 million in the aggregate, (ii) during the Company’s second and third fiscal quarter of each of its fiscal years, $300 million in the aggregate, and (iii) (x) from the first day of the Company’s fourth fiscal quarter of each of its fiscal years to December 20 of each of its fiscal years, $300 million in the aggregate (provided, that not more than $220 million of such amount may consist of Qualified Factor Accounts (as defined in the Sixth Amendment) sold in such period) and(y) from December 21 of each of the Company’s fiscal years to and including the last day of the Company’s fourth fiscal quarter of each of its fiscal years, $220 million in the aggregate.
53
Seventh Amendment to the Amended and Restated Loan and Security Agreement
On November 14, 2017, the Loan Parties entered into a seventh amendment to the Amended and Restated Loan Agreement (the Seventh Amendment) by and among the Loan Parties, the financial institutions party thereto from time to time as lenders and the Agent, which modifies the Amended and Restated Loan Agreement. The Seventh Amendment amends the definition of the term “Qualified Factor Arrangement” to state that the amount held or owing to Qualified Factor or subject to repurchase shall not exceed $300 million in the aggregate.
As of
December 30, 2017
, the Secured Revolving Line of Credit had an outstanding loan balance of
$70 million
at an interest rate of
4.75%
. As of
December 31, 2016
, we had repaid an aggregate of
$230 million
of the Secured Revolving Line of Credit and we had
no
borrowings outstanding. As of
December 30, 2017
, the Secured Revolving Line of Credit had
$19 million
related to outstanding letters of credit and up to
$92 million
available for future borrowings. We report intra-period changes in revolving credit balance on a net basis in our condensed consolidated statement of cash flows as we intend the period of the borrowings to be brief, repaying borrowed amounts within 90 days. As of
December 30, 2017
, we were in compliance with all required covenants stated in the Loan Agreement.
The agreements governing our 6.75% Notes, 7.50% Notes, 7.00% Notes, 2.125% Notes and our Secured Revolving Line of Credit contain cross-default provisions whereby a default under one agreement would likely result in cross defaults under agreements covering other borrowings. The occurrence of a default under any of these borrowing arrangements would permit the applicable note holders or the lenders under the Secured Revolving Line of Credit to declare all amounts outstanding under those borrowing arrangements to be immediately due and payable.
Operating Leases
We lease certain of our facilities and in some jurisdictions we lease the land on which our facilities are built under non-cancellable lease agreements that expire at various dates through 2028. We lease certain office equipment for terms ranging from one to five years. Total future non-cancellable lease obligations as of
December 30, 2017
were
$255 million
, including
$217 million
of future lease payments that occurred in Austin, Texas, Santa Clara, California, Markham, Canada, and Singapore. During the second quarter of 2016, we signed an amendment to the lease agreement associated with our former headquarters in Sunnyvale, California so that the lease expired in December 2017. In connection with the amendment, the lease payments were reduced for 2017. During the third quarter of 2016, we entered into a 10-year operating lease to occupy 220,000 square feet of new office space in Santa Clara. The base rent obligation commenced in August 2017. As of
December 30, 2017
, the total estimate of future base rent over the life of the lease is approximately
$103 million
, included in amounts above. In addition to the base rent payments, we will be obligated to pay certain customary amounts for our share of operating expenses and tax obligation. We will also incur costs for capital projects on the new office space. We have the option to extend the term of the lease for two additional five-year periods.
Purchase Obligations
Our purchase obligations primarily include our obligations to purchase wafers and substrates from third parties, excluding our wafer purchase commitments to GF under the WSA. As of
December 30, 2017
, total non-cancellable purchase obligations were
$513 million
.
Obligations to GF
As of
December 30, 2017
, our minimum wafer purchase obligations for the years 2018 through 2020 are approximately
$2.8 billion
. We cannot meaningfully quantify or estimate our future purchase obligations to GF beyond this amount but expect that our future purchases from GF will continue to be material.
Off-Balance Sheet Arrangements
As of
December 30, 2017
, we had no off-balance sheet arrangements.
54
|
ITEM 7A.
|
QUANTITATIVE AND QUALITATIVE DISCLOSURE ABOUT MARKET RISK
|
Interest Rate Risk.
Our exposure to market risk for changes in interest rates relates primarily to our investment portfolio and long-term debt. We usually invest our cash in investments with short maturities or with frequent interest reset terms. Accordingly, our interest income fluctuates with short-term market conditions. As of
December 30, 2017
, our investment portfolio consisted primarily of commercial paper. These investments were highly liquid. Due to the relatively short, weighted-average maturity of our investment portfolio and the current low interest rate environment, our exposure to interest rate risk is minimal.
As of
December 30, 2017
, all of our outstanding long term debt had fixed interest rates. Consequently, our exposure to market risk for changes in interest rates on reported interest expense and corresponding cash flows is minimal.
We will continue to monitor our exposure to interest rate risk.
Default Risk.
We mitigate default risk in our investment portfolio by investing in only high credit quality securities and by constantly positioning our portfolio to respond to a significant reduction in a credit rating of any investment issuer or guarantor. Our portfolio includes investments in debt and marketable equity securities with active secondary or resale markets to ensure portfolio liquidity. We are averse to principal loss and strive to preserve our invested funds by limiting default risk and market risk.
We actively monitor market conditions and developments specific to the securities and security classes in which we invest. We believe that we take a conservative approach to investing our funds in that we invest only in highly-rated debt securities with relatively short maturities and do not invest in securities which we believe involve a higher degree of risk. As of
December 30, 2017
, substantially all of our investments in debt securities were A-rated by at least one of the rating agencies. While we believe we take prudent measures to mitigate investment-related risks, such risks cannot be fully eliminated as there are circumstances outside of our control.
There were no significant sales of available-for-sale securities during
2017
.
The following table presents the cost basis, fair value and related weighted-average interest rates by year of maturity for our investment portfolio and debt obligations as of
December 30, 2017
:
|
2018
|
2019
|
2020
|
2021
|
2022
|
2023 and thereafter
|
Total
|
2017
Fair Value |
||||||||||||||||||||||||
|
|
(In millions, except for percentages)
|
||||||||||||||||||||||||||||||
|
Investment Portfolio
|
|||||||||||||||||||||||||||||||
|
Cash equivalents:
|
|||||||||||||||||||||||||||||||
|
Fixed rate amounts
|
$
|
682
|
|
$
|
—
|
|
$
|
—
|
|
$
|
—
|
|
$
|
—
|
|
$
|
—
|
|
$
|
682
|
|
$
|
682
|
|
|||||||
|
Weighted-average rate
|
1.47
|
%
|
—
|
|
—
|
|
—
|
|
—
|
|
—
|
|
1.47
|
%
|
1.47
|
%
|
|||||||||||||||
|
Variable rate amounts
|
$
|
395
|
|
$
|
—
|
|
$
|
—
|
|
$
|
—
|
|
$
|
—
|
|
$
|
—
|
|
$
|
395
|
|
$
|
395
|
|
|||||||
|
Weighted-average rate
|
1.19
|
%
|
—
|
|
—
|
|
—
|
|
—
|
|
—
|
|
1.19
|
%
|
1.19
|
%
|
|||||||||||||||
|
Total Investment Portfolio
|
$
|
1,077
|
|
$
|
—
|
|
$
|
—
|
|
$
|
—
|
|
$
|
—
|
|
$
|
—
|
|
$
|
1,077
|
|
$
|
1,077
|
|
|||||||
|
Debt Obligations
|
|||||||||||||||||||||||||||||||
|
Fixed rate amounts
|
$
|
—
|
|
$
|
166
|
|
$
|
—
|
|
$
|
—
|
|
$
|
347
|
|
$
|
1,116
|
|
$
|
1,629
|
|
$
|
—
|
|
|||||||
|
Weighted-average effective interest rate
|
—
|
%
|
6.75
|
%
|
—
|
%
|
—
|
%
|
7.00
|
%
|
3.48
|
%
|
4.67
|
%
|
—
|
%
|
|||||||||||||||
|
Variable rate amounts
|
$
|
—
|
|
$
|
—
|
|
$
|
—
|
|
$
|
—
|
|
$
|
—
|
|
$
|
—
|
|
$
|
—
|
|
$
|
—
|
|
|||||||
|
Weighted-average effective interest rate
|
—
|
%
|
—
|
%
|
—
|
%
|
—
|
%
|
—
|
%
|
—
|
%
|
—
|
%
|
—
|
%
|
|||||||||||||||
|
Total Debt Obligations
|
$
|
—
|
|
$
|
166
|
|
$
|
—
|
|
$
|
—
|
|
$
|
347
|
|
$
|
1,116
|
|
$
|
1,629
|
|
$
|
—
|
|
|||||||
Foreign Exchange Risk.
As a result of our foreign operations, we incur costs and we carry assets and liabilities that are denominated in foreign currencies, while sales of products are primarily denominated in U.S. dollars.
We maintain a foreign currency hedging strategy which uses derivative financial instruments to mitigate the risks associated with changes in foreign currency exchange rates. This strategy takes into consideration all of our exposures. We do not use derivative financial instruments for trading or speculative purposes.
In applying our strategy, from time to time we use foreign currency forward contracts to hedge certain forecasted expenses denominated in foreign currencies. We designate these contracts as cash flow hedges of forecasted expenses to the extent eligible under the accounting rules and evaluate hedge effectiveness prospectively and retrospectively. As such, the effective portion of the gain or loss on these contracts is reported as a component of accumulated other comprehensive income (loss) and reclassified
55
to earnings in the same line item as the associated forecasted transaction and in the same period during which the hedged transaction affects earnings. Any ineffective portion is immediately recorded in earnings.
We also use, from time to time, foreign currency forward contracts to economically hedge recognized foreign currency exposures on the balance sheets of various subsidiaries. We do not designate these forward contracts as hedging instruments. Accordingly, the gain or loss associated with these contracts is immediately recorded in earnings.
The following table provides information about our foreign currency forward contracts as of
December 30, 2017
and
December 31, 2016
. All of our foreign currency forward contracts mature within 12 months.
|
|
December 30, 2017
|
December 31, 2016
|
|||||||||||||||||||
|
|
Notional
Amount
|
Average
Contract
Rate
|
Estimated
Fair Value
Gain (Loss)
|
Notional
Amount
|
Average
Contract
Rate
|
Estimated
Fair Value
Gain (Loss)
|
|||||||||||||||
|
|
(In millions except contract rates)
|
||||||||||||||||||||
|
Foreign currency forward contracts:
|
|||||||||||||||||||||
|
Canadian Dollar
|
$
|
111
|
|
1.2751
|
|
$
|
2
|
|
$
|
77
|
|
1.3189
|
|
$
|
(1
|
)
|
|||||
|
Indian Rupee
|
33
|
|
66.1548
|
|
1
|
|
25
|
|
69.8639
|
|
—
|
|
|||||||||
|
Singapore Dollar
|
23
|
|
1.3553
|
|
—
|
|
18
|
|
1.3740
|
|
(1
|
)
|
|||||||||
|
Taiwan Dollar
|
18
|
|
29.6586
|
|
—
|
|
16
|
|
31.9829
|
|
—
|
|
|||||||||
|
Chinese Renminbi
|
115
|
|
6.7972
|
|
4
|
|
2
|
|
6.9904
|
|
—
|
|
|||||||||
|
Total
|
$
|
300
|
|
$
|
7
|
|
$
|
138
|
|
$
|
(2
|
)
|
|||||||||
56
|
ITEM 8.
|
FINANCIAL STATEMENTS AND SUPPLEMENTARY DATA
|
Advanced Micro Devices, Inc.
|
|
Year Ended
|
||||||||||
|
|
December 30,
2017 |
December 31,
2016 |
December 26,
2015 |
||||||||
|
|
(In millions, except per share amounts)
|
||||||||||
|
Net revenue
|
$
|
5,329
|
|
$
|
4,272
|
|
$
|
3,991
|
|
||
|
Cost of sales
|
3,506
|
|
3,274
|
|
2,911
|
|
|||||
|
Gross margin
|
1,823
|
|
998
|
|
1,080
|
|
|||||
|
Research and development
|
1,160
|
|
1,008
|
|
947
|
|
|||||
|
Marketing, general and administrative
|
511
|
|
460
|
|
482
|
|
|||||
|
Amortization of acquired intangible assets
|
—
|
|
—
|
|
3
|
|
|||||
|
Restructuring and other special charges, net
|
—
|
|
(10
|
)
|
129
|
|
|||||
|
Licensing gain
|
(52
|
)
|
(88
|
)
|
—
|
|
|||||
|
Operating income (loss)
|
204
|
|
(372
|
)
|
(481
|
)
|
|||||
|
Interest expense
|
(126
|
)
|
(156
|
)
|
(160
|
)
|
|||||
|
Other income (expense), net
|
(9
|
)
|
80
|
|
(5
|
)
|
|||||
|
Income (loss) before equity loss and income taxes
|
69
|
|
(448
|
)
|
(646
|
)
|
|||||
|
Provision for income taxes
|
19
|
|
39
|
|
14
|
|
|||||
|
Equity loss in investee
|
(7
|
)
|
(10
|
)
|
—
|
|
|||||
|
Net income (loss)
|
$
|
43
|
|
$
|
(497
|
)
|
$
|
(660
|
)
|
||
|
Earnings (loss) per share
|
|||||||||||
|
Basic
|
$
|
0.04
|
|
$
|
(0.60
|
)
|
$
|
(0.84
|
)
|
||
|
Diluted
|
$
|
0.04
|
|
$
|
(0.60
|
)
|
$
|
(0.84
|
)
|
||
|
Shares used in per share calculation
|
|||||||||||
|
Basic
|
952
|
|
835
|
|
783
|
|
|||||
|
Diluted
|
1,039
|
|
835
|
|
783
|
|
|||||
See accompanying notes to consolidated financial statements.
57
Advanced Micro Devices, Inc.
Consolidated Statements of Comprehensive Income (Loss)
|
|
Year Ended
|
||||||||||
|
December 30,
2017 |
December 31,
2016 |
December 26,
2015 |
|||||||||
|
|
(In millions)
|
||||||||||
|
Net income (loss)
|
$
|
43
|
|
$
|
(497
|
)
|
$
|
(660
|
)
|
||
|
Other comprehensive income (loss):
|
|||||||||||
|
Unrealized gains (losses) on available-for-sale securities:
|
|||||||||||
|
Unrealized gains (losses) arising during period, net of tax effects of $0, $1, and $0
|
1
|
|
—
|
|
(2
|
)
|
|||||
|
Unrealized gains (losses) on cash flow hedges:
|
|||||||||||
|
Unrealized gains (losses) arising during period, net of tax effects of $0, $2, and $0
|
17
|
|
1
|
|
(22
|
)
|
|||||
|
Reclassification adjustment for (gains) losses realized and included in net income (loss), net of tax effect of $1, $0, and $0
|
(7
|
)
|
2
|
|
21
|
|
|||||
|
Total change in unrealized gains (losses) on cash flow hedges, net of tax
|
10
|
|
3
|
|
(1
|
)
|
|||||
|
Total other comprehensive income (loss)
|
11
|
|
3
|
|
(3
|
)
|
|||||
|
Total comprehensive income (loss)
|
$
|
54
|
|
$
|
(494
|
)
|
$
|
(663
|
)
|
||
See accompanying notes to consolidated financial statements.
58
Advanced Micro Devices, Inc.
|
December 30,
2017 |
December 31,
2016 |
||||||
|
|
(In millions, except par value amounts)
|
||||||
|
ASSETS
|
|||||||
|
Current assets:
|
|||||||
|
Cash and cash equivalents
|
$
|
1,185
|
|
$
|
1,264
|
|
|
|
Accounts receivable, net
|
400
|
|
311
|
|
|||
|
Inventories, net
|
739
|
|
751
|
|
|||
|
Prepayment and other receivables - related parties
|
33
|
|
32
|
|
|||
|
Prepaid expenses
|
77
|
|
63
|
|
|||
|
Other current assets
|
188
|
|
109
|
|
|||
|
Total current assets
|
2,622
|
|
2,530
|
|
|||
|
Property, plant and equipment, net
|
261
|
|
164
|
|
|||
|
Goodwill
|
289
|
|
289
|
|
|||
|
Investment: equity method
|
58
|
|
59
|
|
|||
|
Other assets
|
310
|
|
279
|
|
|||
|
Total assets
|
$
|
3,540
|
|
$
|
3,321
|
|
|
|
LIABILITIES AND STOCKHOLDERS’ EQUITY
|
|||||||
|
Current liabilities:
|
|||||||
|
Short-term debt
|
$
|
70
|
|
$
|
—
|
|
|
|
Accounts payable
|
384
|
|
440
|
|
|||
|
Payables to related parties
|
412
|
|
383
|
|
|||
|
Accrued liabilities
|
541
|
|
391
|
|
|||
|
Other current liabilities
|
57
|
|
69
|
|
|||
|
Deferred income on shipments to distributors
|
22
|
|
63
|
|
|||
|
Total current liabilities
|
1,486
|
|
1,346
|
|
|||
|
Long-term debt, net
|
1,325
|
|
1,435
|
|
|||
|
Other long-term liabilities
|
118
|
|
124
|
|
|||
|
Commitments and contingencies (see Notes 16 and 17)
|
|
|
|||||
|
Stockholders’ equity:
|
|||||||
|
Capital stock:
|
|||||||
|
Common stock, par value $0.01; 1,500 shares authorized on December 30, 2017 and December 31, 2016; shares issued: 979 shares on December 30, 2017 and 949 shares on December 31, 2016; shares outstanding: 967 shares on December 30, 2017 and 935 shares on December 31, 2016
|
9
|
|
9
|
|
|||
|
Additional paid-in capital
|
8,464
|
|
8,334
|
|
|||
|
Treasury stock, at cost (
1
2 shares on December 30, 2017 and 14 shares on December 31, 2016)
|
(108
|
)
|
(119
|
)
|
|||
|
Accumulated deficit
|
(7,760
|
)
|
(7,803
|
)
|
|||
|
Accumulated other comprehensive income (loss)
|
6
|
|
(5
|
)
|
|||
|
Total stockholders’ equity
|
611
|
|
416
|
|
|||
|
Total liabilities and stockholders’ equity
|
$
|
3,540
|
|
$
|
3,321
|
|
|
|
(1)
Amounts reflected adoption of FASB ASU 2015-17, Balance Sheet Classification of Deferred Taxes beginning in the first quarter of 2016.
|
|
(2)
Amounts reflected adoption of FASB ASU 2015-03, Simplifying the Presentation of Debt Issuance Costs beginning in the first quarter of 2016.
|
See accompanying notes to consolidated financial statements.
59
Advanced Micro Devices, Inc.
Consolidated Statements of Stockholders’ Equity (Deficit)
Three Years Ended
December 30, 2017
(In millions)
|
Number
of
shares
|
Common Stock
|
Additional
paid-in
capital
|
Treasury
stock
|
Accumulated
deficit
|
Accumulated
other
comprehensive
income (loss)
|
Total
stockholders’
equity (deficit)
|
||||||||||||||||||||
|
December 27, 2014
|
776
|
|
$
|
8
|
|
$
|
6,949
|
|
$
|
(119
|
)
|
$
|
(6,646
|
)
|
$
|
(5
|
)
|
$
|
187
|
|
||||||
|
Net loss
|
—
|
|
—
|
|
—
|
|
—
|
|
(660
|
)
|
—
|
|
(660
|
)
|
||||||||||||
|
Other comprehensive loss
|
—
|
|
—
|
|
—
|
|
—
|
|
—
|
|
(3
|
)
|
(3
|
)
|
||||||||||||
|
Common stock issued under stock-based compensation plans, net of tax withholding
|
16
|
|
—
|
|
5
|
|
(4
|
)
|
—
|
|
—
|
|
1
|
|
||||||||||||
|
Stock-based compensation
|
—
|
|
—
|
|
63
|
|
—
|
|
—
|
|
—
|
|
63
|
|
||||||||||||
|
December 26, 2015
|
792
|
|
8
|
|
7,017
|
|
(123
|
)
|
(7,306
|
)
|
(8
|
)
|
(412
|
)
|
||||||||||||
|
Net loss
|
—
|
|
—
|
|
—
|
|
—
|
|
(497
|
)
|
—
|
|
(497
|
)
|
||||||||||||
|
Other comprehensive income
|
—
|
|
—
|
|
—
|
|
—
|
|
—
|
|
3
|
|
3
|
|
||||||||||||
|
Common stock issued under stock-based compensation plans, net of tax withholding
|
27
|
|
—
|
|
20
|
|
(4
|
)
|
—
|
|
—
|
|
16
|
|
||||||||||||
|
Stock-based compensation
|
—
|
|
—
|
|
86
|
|
—
|
|
—
|
|
—
|
|
86
|
|
||||||||||||
|
Equity component of the 2.125% Notes, net
|
—
|
|
—
|
|
305
|
|
—
|
|
—
|
|
—
|
|
305
|
|
||||||||||||
|
Warrant issued related to sixth amendment to the WSA
|
—
|
|
—
|
|
240
|
|
—
|
|
—
|
|
—
|
|
240
|
|
||||||||||||
|
Issuance of common stock, net of issuance costs
|
115
|
|
1
|
|
666
|
|
—
|
|
—
|
|
—
|
|
667
|
|
||||||||||||
|
Issuance of common stock to partially settle the 7.00% Notes
|
1
|
|
—
|
|
—
|
|
8
|
|
—
|
|
—
|
|
8
|
|
||||||||||||
|
December 31, 2016
|
935
|
|
9
|
|
8,334
|
|
(119
|
)
|
(7,803
|
)
|
(5
|
)
|
416
|
|
||||||||||||
|
Net income
|
—
|
|
—
|
|
—
|
|
—
|
|
43
|
|
—
|
|
43
|
|
||||||||||||
|
Other comprehensive income
|
—
|
|
—
|
|
—
|
|
—
|
|
—
|
|
11
|
|
11
|
|
||||||||||||
|
Common stock issued under stock-based compensation plans, net of tax withholding
|
32
|
|
—
|
|
20
|
|
(13
|
)
|
—
|
|
—
|
|
7
|
|
||||||||||||
|
Stock-based compensation
|
—
|
|
—
|
|
97
|
|
—
|
|
—
|
|
—
|
|
97
|
|
||||||||||||
|
Issuance of treasury stock to partially settle the 6.75% notes and the 7.00% notes
|
—
|
|
—
|
|
13
|
|
24
|
|
—
|
|
—
|
|
37
|
|
||||||||||||
|
December 30, 2017
|
967
|
|
$
|
9
|
|
$
|
8,464
|
|
$
|
(108
|
)
|
$
|
(7,760
|
)
|
$
|
6
|
|
$
|
611
|
|
||||||
See accompanying notes to consolidated financial statements.
60
Advanced Micro Devices, Inc.
|
|
Year Ended
|
||||||||||
|
|
December 30,
2017 |
December 31,
2016 |
December 26,
2015 |
||||||||
|
|
(In millions)
|
||||||||||
|
Cash flows from operating activities:
|
|||||||||||
|
Net income (loss)
|
$
|
43
|
|
$
|
(497
|
)
|
$
|
(660
|
)
|
||
|
Adjustments to reconcile net loss to net cash provided by (used in) operating activities:
|
|||||||||||
|
Net gain on sale of equity interests in ATMP JV
|
(3
|
)
|
(146
|
)
|
—
|
|
|||||
|
Depreciation and amortization
|
144
|
|
133
|
|
167
|
|
|||||
|
Provision for deferred income taxes
|
—
|
|
11
|
|
—
|
|
|||||
|
Stock-based compensation expense
|
97
|
|
86
|
|
63
|
|
|||||
|
Amortization of debt discount and issuance costs
|
36
|
|
21
|
|
11
|
|
|||||
|
Restructuring and other special charges, net
|
—
|
|
—
|
|
83
|
|
|||||
|
Net loss on debt redemption
|
12
|
|
68
|
|
—
|
|
|||||
|
Fair value of warrant issued related to sixth amendment to the WSA
|
—
|
|
240
|
|
—
|
|
|||||
|
Other
|
3
|
|
(6
|
)
|
(3
|
)
|
|||||
|
Changes in operating assets and liabilities:
|
|||||||||||
|
Accounts receivable
|
(89
|
)
|
222
|
|
280
|
|
|||||
|
Inventories
|
12
|
|
(73
|
)
|
(11
|
)
|
|||||
|
Prepayment and other receivables - related parties
|
(1
|
)
|
1
|
|
84
|
|
|||||
|
Prepaid expenses and other assets
|
(140
|
)
|
(166
|
)
|
(111
|
)
|
|||||
|
Payable to related parties
|
29
|
|
138
|
|
27
|
|
|||||
|
Accounts payable, accrued liabilities and other
|
(75
|
)
|
58
|
|
(156
|
)
|
|||||
|
Net cash provided by (used in) operating activities
|
68
|
|
90
|
|
(226
|
)
|
|||||
|
Cash flows from investing activities:
|
|||||||||||
|
Net proceeds from sale of equity interests in ATMP JV
|
1
|
|
342
|
|
—
|
|
|||||
|
Purchases of available-for-sale securities
|
(222
|
)
|
—
|
|
(227
|
)
|
|||||
|
Purchases of property, plant and equipment
|
(113
|
)
|
(77
|
)
|
(96
|
)
|
|||||
|
Proceeds from maturities of available-for-sale securities
|
222
|
|
—
|
|
462
|
|
|||||
|
Proceeds from sale of property, plant and equipment
|
—
|
|
—
|
|
8
|
|
|||||
|
Other
|
(2
|
)
|
2
|
|
—
|
|
|||||
|
Net cash provided by (used in) investing activities
|
(114
|
)
|
267
|
|
147
|
|
|||||
|
Cash flows from financing activities:
|
|||||||||||
|
Proceeds from issuance of common stock, net of issuance costs
|
—
|
|
667
|
|
—
|
|
|||||
|
Proceeds from issuance of convertible senior notes, net of issuance costs
|
—
|
|
782
|
|
—
|
|
|||||
|
Proceeds from issuance of common stock under stock-based compensation equity plans
|
20
|
|
20
|
|
5
|
|
|||||
|
Proceeds from (repayments of) short-term borrowings, net
|
70
|
|
(230
|
)
|
100
|
|
|||||
|
Repayments of long-term debt and capital lease obligations
|
(110
|
)
|
(1,113
|
)
|
(44
|
)
|
|||||
|
Other
|
(13
|
)
|
(4
|
)
|
(2
|
)
|
|||||
|
Net cash provided by (used in) financing activities
|
(33
|
)
|
122
|
|
59
|
|
|||||
|
Net increase (decrease) in cash and cash equivalents
|
(79
|
)
|
479
|
|
(20
|
)
|
|||||
|
Cash and cash equivalents at beginning of year
|
1,264
|
|
785
|
|
805
|
|
|||||
|
Cash and cash equivalents at end of year
|
$
|
1,185
|
|
$
|
1,264
|
|
$
|
785
|
|
||
|
Supplemental disclosures of cash flow information:
|
|||||||||||
|
Cash paid during the year for:
|
|||||||||||
|
Interest
|
$
|
88
|
|
$
|
149
|
|
$
|
149
|
|
||
|
Income taxes
|
$
|
20
|
|
$
|
20
|
|
$
|
3
|
|
||
|
Non-cash investing and financing activities:
|
|||||||||||
|
Purchases of property, plant and equipment, accrued but not paid
|
$
|
50
|
|
$
|
—
|
|
$
|
—
|
|
||
|
Issuance of common stock to partially settle long-term debt
|
$
|
38
|
|
$
|
8
|
|
$
|
—
|
|
||
|
Non-cash acquisition of property and equipment
|
$
|
12
|
|
$
|
—
|
|
$
|
—
|
|
||
See accompanying notes to consolidated financial statements.
61
Advanced Micro Devices, Inc.
Notes to Consolidated Financial Statements
December 30, 2017
,
December 31, 2016
and
December 26, 2015
Advanced Micro Devices, Inc. is a global semiconductor company. References herein to AMD or the Company mean Advanced Micro Devices, Inc. and its consolidated subsidiaries. The Company primarily offers:
|
(i)
|
x86 microprocessors, as standalone devices or as incorporated into an accelerated processing unit (APU), chipsets, discrete and integrated graphics processing units (GPUs), and professional GPUs; and
|
|
(ii)
|
server and embedded processors, semi-custom System-on-Chip (SoC) products and technology for game consoles.
|
We also license portions of our intellectual property (IP) portfolio.
Fiscal Year
. The Company uses a 52 or 53 week fiscal year ending on the last Saturday in December. Fiscal
2017
,
2016
and
2015
ended
December 30, 2017
,
December 31, 2016
and
December 26, 2015
, respectively. Fiscal 2017, 2016 and 2015 consisted of 52, 53 and 52 weeks, respectively.
Principles of Consolidation.
The consolidated financial statements include the Company’s accounts and those of its wholly-owned subsidiaries. Upon consolidation, all significant inter-company accounts and transactions are eliminated.
Use of Estimates.
The preparation of consolidated financial statements in conformity with U.S. generally accepted accounting principles (U.S. GAAP) requires management to make estimates and assumptions that affect the reported amounts of assets and liabilities and disclosure of commitments and contingencies at the date of the financial statements and the reported amounts of revenues and expenses during the reporting periods. Actual results are likely to differ from those estimates, and such differences may be material to the financial statements. Areas where management uses subjective judgment include, but are not limited to, revenue allowances, inventory valuation, valuation and impairment of goodwill, valuation of investments in marketable securities, deferred income taxes and restructuring charges.
Revenue Recognition.
The Company recognizes revenue from products sold directly to customers, including original equipment manufacturers (OEMs), when persuasive evidence of an arrangement exists, the price is fixed or determinable, delivery has occurred and collectability is reasonably assured. Estimates of product returns, allowances and future price reductions based on actual historical experience and other known or anticipated trends and factors are recorded at the time revenue is recognized. The Company sells to distributors under terms allowing the majority of distributors certain rights of return and price protection on unsold merchandise held by them. The distributor agreements, which may be canceled by either party upon specified notice, generally contain a provision for the return of those of the Company’s products that the Company has removed from its price book and that are not more than
12
months older than the manufacturing code date. In addition, some agreements with distributors may contain standard stock rotation provisions permitting limited levels of product returns. Consequently, the Company is unable to readily estimate the product returns and pricing when the product is sold to the distributors. Accordingly, the Company defers the gross margin resulting from the deferral of both revenue and related product costs from sales to distributors with agreements that have the aforementioned terms until the merchandise is resold by the distributors and reports such deferred amounts as Deferred income on shipments to distributors on its consolidated balance sheet. Products are sold to distributors at standard published prices that are contained in price books that are broadly provided to the Company’s various distributors. Distributors are then required to pay for these products within the Company’s standard contractual terms, which are typically net
60
days. The Company records allowances for price protection given to distributors and customer rebates in the period of distributor re-sale. The Company determines these allowances based on specific contractual terms with its distributors. Price reductions generally do not result in sales prices that are less than the Company’s product cost. Deferred income on shipments to distributors is revalued at the end of each period based on the change in inventory units at distributors, on the latest published prices and on the latest product costs.
The Company records estimated reductions to revenue under distributor and customer incentive programs, including certain cooperative advertising and marketing promotions and volume-based incentives and special pricing arrangements, at the time the related revenues are recognized. For transactions where the Company reimburses a customer for a portion of the customer’s cost to perform specific product advertising or marketing and promotional activities, such amounts are recorded as a reduction of revenue unless they qualify for expense recognition. Shipping and handling costs associated with product sales are included in cost of sales.
62
Deferred revenue and related product costs were as follows:
|
December 30,
2017 |
December 31,
2016 |
||||||
|
|
(In millions)
|
||||||
|
Deferred revenue
|
$
|
55
|
|
$
|
124
|
|
|
|
Deferred cost of sales
|
(33
|
)
|
(61
|
)
|
|||
|
Deferred income on shipments to distributors
|
$
|
22
|
|
$
|
63
|
|
|
Inventories.
Inventories are stated at standard cost adjusted to approximate the lower of actual cost (first-in, first-out method) or net realizable value. The Company adjusts inventory carrying value for estimated obsolescence equal to the difference between the cost of inventory and the estimated net realizable value based upon assumptions about future demand and market conditions. The Company fully reserves for inventories and non-cancellable purchase orders for inventory deemed obsolete. The Company performs periodic reviews of inventory items to identify excess inventories on hand by comparing on-hand balances to anticipated usage using recent historical activity as well as anticipated or forecasted demand. If estimates of customer demand diminish further or market conditions become less favorable than those projected by the Company, additional inventory adjustments may be required
.
Goodwill.
Goodwill represents the excess of the purchase price over the fair value of net tangible and identifiable intangible assets acquired. In accordance with Accounting Standards Codification (ASC) 350,
“Goodwill and Other Intangible Assets”
, goodwill is not amortized, but rather is tested for impairment at least annually or more frequently if indicators of impairment are present. The Company performs its annual goodwill impairment analysis as of the first day of the fourth quarter of each year and, if certain events or circumstances indicate that an impairment loss may have been incurred, on an interim basis. The Company adopted ASU 2017-04,
"Intangibles - Goodwill and Other: Topic 350:
Simplifying the Test for Goodwill Impairment"
, which eliminated step two from the goodwill impairment test. In assessing impairment on goodwill, the Company first analyzes qualitative factors to determine whether it is more likely than not that the fair value of a reporting unit is less than its carrying amount as a basis for determining whether it is necessary to perform the quantitative goodwill impairment test. The qualitative factors the Company assesses include long-term prospects of its performance, share price trends and market capitalization and Company-specific events. If the Company concludes it is more likely than not that the fair value of a reporting unit exceeds its carrying amount, the Company does not need to perform the quantitative impairment test. If based on that assessment, the Company believes it is more likely than not that the fair value of the reporting unit is less than its carrying value, a quantitative goodwill impairment test will be performed by comparing the fair value of each reporting unit to its carrying value. A goodwill impairment charge is recognized for the amount by which the reporting unit’s fair value is less than its carrying value. Any loss recognized should not exceed the total amount of goodwill allocated to that reporting unit.
Commitments and Contingencies.
From time to time the Company is a defendant or plaintiff in various legal actions that arise in the normal course of business. The Company is also a party to environmental matters including local, regional, state and federal government clean-up activities at or near locations where the Company currently or has in the past conducted business. The Company is required to assess the likelihood of any adverse judgments or outcomes to these matters as well as potential ranges of reasonably possible losses. A determination of the amount of reserves required for these commitments and contingencies that would be charged to earnings, if any, includes assessing the probability of adverse outcomes and estimating the amount of potential losses. The required reserves, if any, may change in the future due to new developments in each matter or changes in circumstances such as a change in settlement strategy. Changes in required reserves could increase or decrease the Company’s earnings in the period the changes are made (See Notes 16 and 17).
Restructuring Charges.
Restructuring charges are primarily comprised of severance costs, contract and program termination costs, asset impairments and costs of facility consolidation and closure. Restructuring charges are recorded upon approval of a formal management plan and are included in the operating results of the period in which such plan is approved and the expense becomes estimable. To estimate restructuring charges, management utilizes assumptions of the number of employees that would be involuntarily terminated and the amount of future costs to operate and eventually vacate duplicate facilities. Severance and other employee separation costs are accrued when it is probable that benefits will be paid and the amount is reasonably estimable. The rates used in determining severance accruals are based on the Company’s policies and practices and negotiated settlements.
Cash Equivalents.
Cash equivalents consist of financial instruments that are readily convertible into cash and have original maturities of three months or less at the time of purchase.
Accounts Receivable.
The Company maintains an allowance for doubtful accounts based on its assessment of the collectability of amounts owed by customers. The allowance consists of known specific troubled accounts as well as an amount based on overall estimated potential uncollectible accounts receivable based on historical experience.
63
Investments in Certain Debt and Equity Securities
. The Company classifies its investments in debt and marketable equity securities at the date of acquisition as available-for-sale. Available-for-sale securities are reported at fair value with the related unrealized gains and losses included, net of tax, in accumulated other comprehensive income (loss), a component of stockholders’ equity. Realized gains and losses and declines in the value of available-for-sale securities determined to be other than temporary are included in other income (expense), net. The cost of securities sold is determined based on the specific identification method.
The Company classifies investments in debt securities with maturities of more than three months at the time of purchase as marketable securities on its consolidated balance sheet. Classification of these securities as current is based on the Company’s intent and belief in its ability to sell these securities and use the proceeds from sale in operations within
12
months.
Derivative Financial Instruments.
The Company maintains a foreign currency hedging strategy which uses derivative financial instruments to mitigate the risks associated with changes in foreign currency exchange rates. This strategy takes into consideration all of the Company’s consolidated exposures. The Company does not use derivative financial instruments for trading or speculative purposes.
In applying its strategy, the Company uses foreign currency forward contracts to hedge certain forecasted expenses denominated in foreign currencies. The Company designates these contracts as cash flow hedges of forecasted expenses, to the extent eligible under the accounting rules, and evaluates hedge effectiveness prospectively and retrospectively. As such, the effective portion of the gain or loss on these contracts is reported as a component of accumulated other comprehensive income (loss) and is reclassified to earnings in the same line item as the associated forecasted transaction and in the same period during which the hedged transaction affects earnings. Any ineffective portion is immediately recorded in earnings.
The Company also uses, from time to time, foreign currency forward contracts to economically hedge recognized foreign currency exposures on the balance sheets of various subsidiaries. The Company does not designate these forward contracts as hedging instruments. Accordingly, the gain or loss associated with these contracts is immediately recorded in earnings.
Property, Plant and Equipment.
Property, plant and equipment are stated at cost. Depreciation and amortization are provided on a straight-line basis over the estimated useful lives of the assets for financial reporting purposes. Estimated useful lives for financial reporting purposes are as follows: equipment uses
two
to
six years
, buildings and building improvements uses up to
40 years
and leasehold improvements are measured by the shorter of the remaining terms of the leases or the estimated useful economic lives of the improvements.
Product Warranties.
The Company generally warrants that its products sold to its customers will conform to the Company’s approved specifications and be free from defects in material and workmanship under normal use and conditions for
one
year. Subject to certain exceptions, the Company also offers a
three
-year limited warranty to end users for those central processing unit (CPU) and AMD A-Series accelerated processing unit (APU) products purchased as individually packaged products, commonly referred to as “processors in a box”, and for PC workstation products. The Company also has offered extended limited warranties to certain customers of “tray” microprocessor products and/or workstation graphics or server products who have written agreements with the Company and target their computer systems at the commercial and/or embedded markets. The Company accrues warranty costs at the time of sale of warranted products.
Foreign Currency Translation/Transactions.
The functional currency of all of the Company’s foreign subsidiaries is the U.S. dollar. Assets and liabilities denominated in non-U.S. dollars have been remeasured into U.S. dollars at current exchange rates for monetary assets and liabilities and historical exchange rates for non-monetary assets and liabilities. Non-U.S. dollar denominated transactions have been remeasured at average exchange rates in effect during each period, except for those cost of sales and expense transactions related to non-monetary balance sheet amounts which have been remeasured at historical exchange rates. The gains or losses from foreign currency remeasurement are included in earnings.
Subsidies.
The Company received investment grants in connection with the construction and operation of certain facilities in Asia. Generally, such grants are subject to forfeiture in declining amounts over the life of the agreement if the Company does not maintain certain levels of employment or meet other conditions specified in the relevant grant documents. Accordingly, amounts granted are initially recorded as a receivable until cash proceeds are received. In the period the grant receivable is recorded, a current and long-term liability is also recorded which is subsequently amortized as a reduction to cost of sales.
The Company also received grants relating to certain research and development projects. These research and development funds are generally recorded as a reduction of research and development expenses when all conditions and requirements set forth in the underlying grant agreement are met.
Marketing, Communications and Advertising Expenses.
Marketing, communications and advertising expenses for
2017
,
2016
and
2015
were approximately
$156 million
,
$131 million
and
$154 million
, respectively. Cooperative advertising funding obligations under customer incentive programs are accrued and the costs are recorded upon agreement with customers and vendor
64
partners. Cooperative advertising expenses are recorded as marketing, general and administrative expense to the extent the cash paid does not exceed the estimated fair value of the advertising benefit received. Any excess of cash paid over the estimated fair value of the advertising benefit received is recorded as a reduction of revenue.
Earnings (Loss) Per Share.
Basic earnings (loss) per share is computed based on the weighted-average number of shares outstanding.
Diluted net income (loss) per share is computed based on the weighted average number of shares outstanding plus potentially dilutive shares outstanding during the period. Potentially dilutive shares are determined by applying treasury stock method to assumed exercise of outstanding stock options, the assumed vesting of outstanding RSUs, the assumed issuance of common stock under the employee stock purchase plan (ESPP) and the assumed exercise of the warrant under the warrant agreement (the Warrant Agreement) with West Coast Hitech L.P. (WCH), a wholly-owned subsidiary of Mubadala Investment Company PJSC (Mubadala). Potentially dilutive shares shares issuable upon conversion of the
2.125%
Convertible Senior Notes due 2026 (
2.125%
Notes) are calculated using the if-converted method.
The following table sets forth the components of basic and diluted income (loss) per share:
|
2017
|
2016
|
2015
|
|||||||||
|
|
(In millions, except per share amounts)
|
||||||||||
|
Numerator—Net income (loss):
|
|||||||||||
|
Numerator for basic and diluted net income (loss) per share
|
$
|
43
|
|
$
|
(497
|
)
|
$
|
(660
|
)
|
||
|
Denominator—Weighted average shares:
|
|||||||||||
|
Denominator for basic earnings (loss) per share
|
952
|
|
835
|
|
783
|
|
|||||
|
Effect of potentially dilutive shares:
|
|||||||||||
|
Employee stock options, restricted stock units, and warrants
|
87
|
|
—
|
|
—
|
|
|||||
|
Denominator for diluted earnings (loss) per share
|
1,039
|
|
835
|
|
783
|
|
|||||
|
Earnings (loss) per share:
|
|||||||||||
|
Basic
|
$
|
0.04
|
|
$
|
(0.60
|
)
|
$
|
(0.84
|
)
|
||
|
Diluted
|
$
|
0.04
|
|
$
|
(0.60
|
)
|
$
|
(0.84
|
)
|
||
Potential shares from certain employee stock options, restricted stock units, ESPP and the conversion of the
2.125%
Notes totaling
102 million
shares for
2017
and potential shares from certain stock options, restricted stock units, the conversion of the
2.125%
Notes and the warrants under the Warrant Agreement totaling
231 million
and
52 million
shares for
2016
and
2015
, respectively, were not included in the diluted net loss per share calculations as their inclusion would have been anti-dilutive.
Accumulated Other Comprehensive Income (Loss).
Unrealized holding gains or losses on the Company’s available-for-sale securities and unrealized holding gains and losses on derivative financial instruments qualifying as cash flow hedges are included in other comprehensive income (loss).
65
The table below summarizes the changes in accumulated other comprehensive income (loss) by component for the years ended
December 30, 2017
and
December 31, 2016
:
|
December 30,
2017 |
December 31,
2016 |
|||||||||||||||||||||
|
Unrealized gains (losses) on available-for-sale securities
|
Unrealized gains (losses) on cash flow hedges
|
Total
|
Unrealized gains (losses) on available-for-sale securities
|
Unrealized gains (losses) on cash flow hedges
|
Total
|
|||||||||||||||||
|
(In millions)
|
||||||||||||||||||||||
|
Beginning balance
|
$
|
(1
|
)
|
$
|
(4
|
)
|
$
|
(5
|
)
|
$
|
(1
|
)
|
$
|
(7
|
)
|
$
|
(8
|
)
|
||||
|
Unrealized gains arising during the period, net of tax effects
|
1
|
|
17
|
|
18
|
|
—
|
|
1
|
|
1
|
|
||||||||||
|
Reclassification adjustment for (gains) losses realized and included in net income (loss), net of tax effects
|
—
|
|
(7
|
)
|
(7
|
)
|
—
|
|
2
|
|
2
|
|
||||||||||
|
Total other comprehensive income
|
1
|
|
10
|
|
11
|
|
—
|
|
3
|
|
3
|
|
||||||||||
|
Ending balance
|
$
|
—
|
|
$
|
6
|
|
$
|
6
|
|
$
|
(1
|
)
|
$
|
(4
|
)
|
$
|
(5
|
)
|
||||
Stock-Based Compensation
. The Company estimates stock-based compensation cost for stock options at the grant date based on the option’s fair-value as calculated by the lattice-binomial option-pricing model. For restricted stock units, including performance-based restricted stock units (PRSUs), fair value is based on the closing price of the Company’s common stock on the grant date. The Company estimates the grant-date fair value of restricted stock units that involve a market condition using the Monte Carlo simulation model. The Company estimates the grant-date fair value of the ESPP using the Black-Scholes model. Compensation expense is recognized over the vesting period of the applicable award using the straight-line method, except for the compensation expense related to PRSUs, which are recognized ratably for each vesting tranche from the service inception date to the end of the requisite service period.
The application of the lattice-binomial option-pricing model requires the use of extensive actual employee exercise behavior data and the use of a number of complex assumptions including expected volatility of the Company’s common stock, risk-free interest rate and expected dividends. Significant changes in any of these assumptions could materially affect the fair value of stock options granted in the future.
Forfeiture rates are estimated at the time of grant and revised, if necessary, in subsequent periods if actual forfeitures differ from those estimates in order to derive the Company’s best estimate of awards ultimately expected to vest.
Recently Adopted Accounting Standards
Goodwill Impairment.
In January 2017, the Financial Accounting Standards Board (FASB) issued ASU 2017-04,
Intangibles—Goodwill and Other (Topic 350)
:
Simplifying the Test for Goodwill Impairment
(ASU 2017-04), which eliminates step two from the goodwill impairment test. Under the amendments in ASU 2017-04, an entity should recognize an impairment charge for the amount by which the carrying amount of a reporting unit exceeds its fair value; however, the loss recognized should not exceed the total amount of goodwill allocated to that reporting unit. ASU 2017-04 is effective for annual and any interim impairment tests performed for periods beginning after December 15, 2019 on a prospective basis, and earlier adoption is permitted for goodwill impairment tests performed on testing dates after January 1, 2017. The Company early adopted this accounting standard update in the third quarter of 2017 on a prospective basis and did not have an impact on its consolidated financial statements. The adoption of this update is to simplify its annual goodwill impairment testing process by eliminating the need to estimate the implied fair value of a reporting unit’s goodwill if its respective carrying value exceeds fair value.
Stock Compensation.
In March 2016, the FASB issued ASU 2016-09,
Compensation-Stock Compensation (Topic 718) Improvements to Employee Share-Based Payment Accounting
(ASU 2016-09), which is intended to simplify several aspects of the accounting for share-based payment award transactions. The Company adopted this guidance in the first quarter of 2017 and elected to continue to estimate forfeitures expected to occur to determine the amount of compensation cost to be recognized in each period. In the first quarter of 2017, the Company recorded a
$96 million
cumulative-effect adjustment in accumulated deficit and an offsetting increase in deferred tax assets for previously unrecognized excess tax benefits that existed as of December 31, 2016. Since substantially all of the Company’s U.S. and foreign deferred tax assets, net of deferred tax liabilities, are subject to a valuation allowance and the realization of these assets is not more likely than not to be achieved, the Company recorded a
$96 million
valuation allowance against these deferred tax assets with an offsetting adjustment in accumulated deficit. The Company elected to report cash flows related to excess tax benefits as an operating activity on a prospective basis. The presentation requirement
66
for cash flows related to employee taxes paid for withheld shares did not impact the statements of cash flows because such cash flows have historically been presented as a financing activity.
Investments
. In March 2016, the FASB issued ASU 2016-07,
Investments – Equity Method and Joint Ventures (Topic 323): Simplifying the Transition to the Equity Method of Accounting
(ASU 2016-07), which requires the equity method investor to add the cost of acquiring the additional interest in the investee to the current basis of the investor’s previously held interest and adopt the equity method of accounting as of the date the investment qualifies for equity method accounting. The Company adopted this guidance in the first quarter of 2017, and it did not have an impact on its consolidated financial statements.
Inventory.
In July 2015, the FASB issued ASU 2015-11,
Simplifying the Measurement of Inventory
(ASU 2015-11), which requires entities to measure inventory at the lower of cost or net realizable value. This ASU simplifies the subsequent measurement of inventory by replacing the lower of cost or market test with a lower of cost or net realizable value test. The Company adopted this guidance in the first quarter of 2017, and it did not have an impact on its consolidated financial statements.
Recently Issued Accounting Standards
Derivatives and Hedging
. In August 2017, the FASB issued ASU 2017-12,
Derivatives and Hedging (Topic 815): Targeted Improvements to Accounting for Hedging Activities
(ASU 2017-12), which amends and simplifies existing guidance in order to allow companies to more accurately present the economic effects of risk management activities in the financial statements. ASU 2017-12 is effective for fiscal years beginning after December 15, 2018, including interim periods therein with early adoption permitted. The Company will adopt this guidance in the first quarter of 2019 and does not expect a significant impact on its consolidated financial statements.
Stock Compensation
. In May 2017, the FASB issued ASU 2017-09,
Compensation-Stock Compensation (Topic 718): Scope of Modification Accounting
(ASU 2017-09) to provide clarity and reduce both the (1) diversity in practice and (2) cost and complexity when changing the terms or conditions of share-based payment awards. Under ASU 2017-09, modification accounting is required to be applied unless all of the following are the same immediately before and after the change:
1. The award’s fair value (or calculated value or intrinsic value, if those measurement methods are used);
2. The award’s vesting conditions; and
3. The award’s classification as an equity or liability instrument.
ASU 2017-09 is effective for annual and interim periods beginning after December 15, 2017 on a prospective basis, and early adoption is permitted. The Company will adopt this guidance in the first quarter of 2018 and does not expect an impact on its financial statements.
Income Taxes
. In October 2016, the FASB issued ASU 2016-16,
Income Taxes (Topic 740): Intra-Entity Transfers of Assets Other Than Inventory
(ASU 2016-16), which requires entities to recognize the income tax consequences of an intra-entity transfer of an asset other than inventory when the transfer occurs. This amends current GAAP which prohibits recognition of current and deferred income taxes for all types of intra-entity asset transfers until the asset has been sold to an outside party. ASU 2016-16 is effective for fiscal years beginning after December 15, 2017, including interim periods therein. Upon adoption, the Company must apply a modified retrospective transition approach through a cumulative-effect adjustment to retained earnings as of the beginning of the period of adoption. The Company is currently evaluating the impact of this new standard on its consolidated financial statements.
Statement of Cash Flows
. In August 2016, the FASB issued ASU 2016-15,
Statement of Cash Flows (Topic 230): Classification of Certain Cash Receipts and Cash Payments
(ASU 2016-15), which is intended to reduce the existing diversity in practice in how certain cash receipts and cash payments are classified in the statement of cash flows. In November 2016, the FASB issued ASU 2016-18,
Statement of Cash Flows, Restricted Cash (Topic 230)
(ASU 2016-18), which requires the inclusion of restricted cash with cash and cash equivalents when reconciling the beginning-of-period and end-of-period total amounts shown on the statement of cash flows. ASU 2016-15 and ASU 2016-18 are both effective for fiscal years beginning after December 15, 2017, including interim periods within those fiscal years, provided that all of the amendments are adopted in the same period. The amendments will be applied using a retrospective transition method to each period presented. The Company will adopt these guidances in the first quarter of 2018 and does not expect a significant impact on its financial statements.
Financial Instruments
. In June 2016, the FASB issued ASU 2016-13,
Financial Instruments—Credit Losses (Topic 326), Measurement of Credit Losses on Financial Instruments
(ASU 2016-13). The standard changes the methodology for measuring credit losses on financial instruments and the timing of when such losses are recorded. ASU 2016-13 is effective for fiscal years, and interim periods within those years, beginning after December 15, 2019. Early adoption is permitted for fiscal years, and interim
67
periods within those years, beginning after December 15, 2018. The Company will adopt this guidance in the first quarter of 2020 and is currently evaluating the impact of this new standard on its consolidated financial statements.
Leases.
In February 2016, the FASB issued ASU 2016-02,
Leases
(ASU 2016-02), which increases transparency and comparability among organizations by recognizing lease assets and lease liabilities on the balance sheet and disclosing key information about leasing arrangements. ASU 2016-02 is effective for fiscal years beginning after December 15, 2018, including interim periods within those fiscal years, with early adoption permitted. Upon adoption, lessees must apply a modified retrospective transition approach for leases existing at, or entered into after, the beginning of the earliest comparative period presented in the financial statements. The Company will not early adopt the new standard and therefore the new standard will be effective for the Company in the first quarter of its fiscal 2019. The Company expects that upon adoption the most significant impact will be the recognition of right-of-use assets and lease liabilities on our consolidated balance sheets for our operating leases. The Company has established a cross-functional team of key stakeholders for implementing the new standard and has begun to inventory its real estate and equipment leases. As part of the Company’s assessment and implementation plan, the Company is evaluating and implementing changes to its policies, procedures and controls.
Financial Instruments.
In January 2016, the FASB issued ASU 2016-01,
Financial Instruments—Overall: Recognition and Measurement of Financial Assets and Financial Liabilities
(ASU 2016-01), which requires that most equity investments be measured at fair value, with subsequent changes in fair value recognized in net income. The ASU also impacts financial liabilities under the fair value option and the presentation and disclosure requirements for financial instruments. In addition, the FASB clarified guidance related to the valuation allowance assessment when recognizing deferred tax assets resulting from unrealized losses on available-for-sale debt securities. Entities will have to assess the realizability of such deferred tax assets in combination with the entities other deferred tax assets. ASU 2016-01 is effective for fiscal years beginning after December 15, 2017 and for interim periods within that reporting period. In the first quarter of 2018, the Company will elect to adopt the measurement alternative, which will apply this ASU prospectively, for its equity investments that do not have readily determinable fair values. In addition, the Company will record a cumulative effect adjustment to retained earnings for its equity securities that have readily determinable fair values. The Company does not expect the effects of either to have a material impact on its consolidated financial statements.
Revenue Recognition.
In May 2014, the FASB issued ASU 2014-09,
Revenue from Contracts with Customers (Topic 606)
(ASC 606), which creates a single source of revenue guidance under U.S. GAAP for all companies in all industries and replaces most existing revenue recognition guidance in U.S. GAAP. Under the new standard, revenue is recognized when a customer obtains control of promised goods or services and is recognized in an amount that reflects the consideration which the entity expects to receive in exchange for those goods or services. In addition, the new standard requires disclosure of the nature, amount, timing, and uncertainty of revenue and cash flows arising from contracts with customers. The FASB has issued several amendments to the new standard, including clarification on accounting for licenses of intellectual property and identifying performance obligations.
The new standard is effective for annual reporting periods beginning after December 15, 2017, with early adoption permitted. The Company did not early adopt the new standard, and therefore the new standard will be effective for the Company in the first quarter of its fiscal 2018.
The guidance permits two methods of adoption: retrospectively to each prior reporting period presented (full retrospective method), or prospectively with the cumulative effect of initially applying the guidance recognized at the date of initial application and providing additional disclosures comparing results to the previous rules in the year of adoption of the new standard (the modified retrospective method or the cumulative catchup method). The Company will adopt the standard using the full retrospective method to adjust each prior reporting period presented. The Company has implemented changes to its policies, procedures and controls, and finalized the assessment of the accounting impact resulting from the new standard.
See Note 19 Impact to Reported Results for the impact of the adoption of ASC 606 on the Company's consolidated financial statements.
Although there are several other new accounting pronouncements issued or proposed by the FASB, which the Company has adopted or will adopt, as applicable, the Company does not believe any of these accounting pronouncements has had or will have a material impact on its consolidated financial position, operating results or statements of cash flows.
68
Formation and Accounting
On March 2, 2009, the Company consummated the transactions contemplated by the Master Transaction Agreement among the Company, Mubadala Technology Investments LLC, or Mubadala Tech (formerly, Advanced Technology Investment Company LLC) and WCH, pursuant to which the Company formed GLOBALFOUNDRIES Inc. (GF). In connection with the consummation of the transactions contemplated by the Master Transaction Agreement, the Company, Mubadala Tech and GF entered into a Wafer Supply Agreement (the WSA), a Funding Agreement (the Funding Agreement) and a Shareholders’ Agreement (the Shareholders’ Agreement) on March 2, 2009.
On March 4, 2012, as partial consideration for certain rights received under a second amendment to the WSA, the Company transferred to GF all of the remaining capital stock of GF that the Company owned. In addition, as of March 4, 2012, the Funding Agreement was terminated and the Company was no longer party to the Shareholders’ Agreement. As a result of these transactions, the Company no longer owned any GF capital stock as of March 4, 2012.
GF continues to be a related party of the Company because Mubadala and Mubadala Tech are affiliated with WCH, a significant stockholder of the Company. WCH and Mubadala Tech are wholly-owned subsidiaries of Mubadala.
Wafer Supply Agreement
The WSA governs the terms by which the Company purchases products manufactured by GF. Pursuant to the WSA, the Company is required to purchase from GF all of its microprocessor and APU product requirements and a certain portion of its GPU product requirements with limited exceptions. If the Company acquires a third party business that manufactures microprocessor and APU products, the Company will have up to
two
years to transition the manufacture of such microprocessor and APU products to GF.
The WSA terminates no later than March 2, 2024. GF has agreed to use commercially reasonable efforts to assist the Company to transition the supply of products to another provider and to continue to fulfill purchase orders for up to
two
years following the termination or expiration of the WSA. During the transition period, pricing for microprocessor and APU products will remain as set forth in the WSA, but the Company’s purchase commitments to GF will no longer apply.
Sixth Amendment to Wafer Supply Agreement.
On August 30, 2016, the Company entered into a sixth amendment (the Sixth Amendment) to the WSA. The Sixth Amendment modified certain terms of the WSA applicable to wafers for the Company’s microprocessor, graphics processor and semi-custom products for a
five
-year period from January 1, 2016 to December 31, 2020. The Company and GF agreed to establish a comprehensive framework for technology collaboration for the 7nm technology node.
The Sixth Amendment also provides the Company a limited waiver with rights to contract with another wafer foundry with respect to certain products in the 14nm and 7nm technology nodes and gives the Company greater flexibility in sourcing foundry services across its product portfolio. In consideration for these rights, the Company agreed to pay GF
$100 million
in installments starting in the fourth fiscal quarter of 2016 through the third fiscal quarter of 2017. From the fourth fiscal quarter of 2016 to the third fiscal quarter of 2017, the Company paid GF
$25 million
each quarter and as of December 30, 2017, the Company had paid GF
$100 million
in aggregate. Starting in 2017 and continuing through 2020, the Company agreed to make quarterly payments to GF based on the volume of certain wafers purchased from another wafer foundry.
Further, for each calendar year during the term of the Sixth Amendment, the Company and GF agreed to annual wafer purchase targets that increase from 2016 through 2020. If the Company does not meet the annual wafer purchase target for any calendar year, the Company will be required to pay to GF a portion of the difference between the Company’s actual wafer purchases and the wafer purchase target for that year. The annual targets were established based on the Company’s business and market expectations and took into account the limited waiver it received for certain products. The Company met its
2017
annual wafer purchase target.
The Company and GF also agreed on fixed pricing for wafers purchased during 2016 and established a framework to agree on annual wafer pricing for the years 2017 to 2020. The Company and GF had agreed on pricing for wafer purchases for
2017
.
The Company’s total purchases from GF related to wafer manufacturing, research and development activities and other for
2017
,
2016
and
2015
were
$1.1 billion
,
$0.7 billion
and
$0.9 billion
, respectively.
Included in the total purchases for the year ended
December 30, 2017
are amounts related to the volume of certain wafers purchased from another wafer foundry, as agreed to by the Company and GF under the Sixth Amendment. As of
December 30, 2017
and
December 31, 2016
, the amount of prepayment and other receivables related to GF was
$27 million
and
$32 million
, respectively, included in Prepayment and other
69
receivables - related parties on the Company's consolidated balance sheets. As of
December 30, 2017
and
December 31, 2016
, the amount of payable to GF was
$241 million
and
$255 million
, respectively, included in Payables to related parties on the Company's consolidated balance sheets.
Warrant Agreement.
Also on August 30, 2016, in consideration of the limited waiver and rights under the Sixth Amendment, the Company entered into a warrant agreement (the Warrant Agreement) with WCH, a wholly-owned subsidiary of Mubadala. Under the Warrant Agreement, WCH and its permitted assigns are entitled to purchase
75 million
shares of the Company’s common stock (the Warrant Shares) at a purchase price of
$5.98
per share. The warrant under the Warrant Agreement is exercisable in whole or in part until February 29, 2020. Notwithstanding the foregoing, the Warrant Agreement will only be exercisable to the extent that Mubadala does not beneficially own, either directly or through any other entities directly and indirectly owned by Mubadala or its subsidiaries, an aggregate of more than
19.99%
of the Company’s outstanding capital stock after any such exercise.
In April 2016, the Company and certain of its subsidiaries completed the sale of a majority of the equity interests in Suzhou TF-AMD Semiconductor Co., Ltd. (formerly, AMD Technologies (China) Co., Ltd.), and TF AMD Microelectronics (Penang) Sdn. Bhd. (formerly, Advanced Micro Devices Export Sdn. Bhd.), to affiliates of Tongfu Microelectronics Co., Ltd. (formerly, Nantong Fujitsu Microelectronics Co., Ltd.) (TFME), a Chinese joint stock company, to form
two
joint ventures (collectively, the ATMP JV). As a result of the sale, TFME’s affiliates own
85%
of the equity interests in the ATMP JV while certain of the Company’s subsidiaries own the remaining
15%
. The Company has no obligations to fund the ATMP JV.
As a result of the transaction, the Company received approximately
$342 million
, including purchase price adjustments, in net cash proceeds for selling
85%
of the equity interest in each of Suzhou TF-AMD Semiconductor Co., Ltd. and TF AMD Microelectronics (Penang) Sdn. Bhd. These proceeds, net of certain transaction costs, were included in investing activities on the Company’s consolidated statements of cash flows for the year ended December 31, 2016.
The Company recognized a net pre-tax gain on the sale of its
85%
equity interest in ATMP JV of
$146 million
for the year ended December 31, 2016, which was recognized in
Other income (expense), net
on the Company’s consolidated statements of operations. The net pre-tax gain reflects the excess of the sum of net cash proceeds and fair value of the Company’s retained
15%
equity interests in the ATMP JV over the sum of the net book values of the Company’s former subsidiaries and other closing costs directly attributed to the divestiture. The above gain includes
$11 million
in excess of fair value of the Company’s retained interest over the corresponding net book values. During
2017
, the Company recorded a
$3 million
pre-tax gain for final settlement related to the sale of
85%
of the equity interest in ATMP facilities in Other income (expense), net on its consolidated statements of operations.
The Company accounts for its equity interests in the ATMP JV under the equity method of accounting due to its significant influence over the ATMP JV. As of
December 30, 2017
and
December 31, 2016
, the carrying value of the Company’s investment in the ATMP JV was
$58 million
and
$59 million
, respectively.
Following the deconsolidation, the ATMP JV is a related party of the Company. The ATMP JV provides assembly, test, mark and packaging (ATMP) services to the Company. The Company currently pays the ATMP JV for ATMP services on a cost-plus basis. The Company’s total purchases from the ATMP JV during
2017
and
2016
amounted to approximately
$438 million
and
$265 million
, respectively. As of
December 30, 2017
and
December 31, 2016
, the amount payable to the ATMP JV was
$171 million
and
$128 million
, respectively, included in
Payables to related parties
on the Company’s consolidated balance sheets.
During
2017
and
2016
, the Company recorded losses of
$7 million
and
$10 million
, respectively, in Equity loss in investee on its consolidated statements of operations, which included certain expenses incurred by the Company on behalf of the ATMP JV.
In February 2016, the Company and Tianjin Haiguang Advanced Technology Investment Co., Ltd. (THATIC), a third-party Chinese entity (JV Partner), formed a joint venture comprised of
two
separate legal entities, China JV1 and China JV2 (collectively, the THATIC JV). The Company’s equity share in China JV1 and China JV2 is a majority and minority interest, respectively, funded by the Company’s contribution of certain of its patents. The JV Partner is responsible for the initial and on-going financing of the THATIC JV’s operations. The Company has no obligations to fund the THATIC JV.
70
The Company concluded the China JV1 and China JV2 are not operating joint ventures and are variable interest entities due to their reliance on on-going financing by JV Partner. The Company determined that it is not the primary beneficiary of either China JV1 or China JV2, as the Company does not have unilateral power to direct selling and marketing, manufacturing and product development activities related to the THATIC JV’s products. Accordingly, the Company does not consolidate either of these entities and therefore accounts for its investments in the THATIC JV under the equity method of accounting. The THATIC JV is a related party of the Company.
In February 2016, the Company licensed certain of its intellectual property (Licensed IP) to the THATIC JV for a total of approximately
$293 million
in license fees payable over several years contingent upon achievement of certain milestones. The Company also expects to receive a royalty based on the sales of the THATIC JV’s products to be developed on the basis of such Licensed IP. The Company also provided certain engineering and technical support to the THATIC JV in connection with the product development. In March 2017, the Company entered into a development and intellectual property agreement (Development and IP) with THATIC JV, and also expects to receive a royalty based on the sales of the THATIC JV’s products to be developed on the basis of such agreement. In addition, from time to time the Company enters into certain agreements with the THATIC JV to provide other services primarily related to research and development.
The Company recognized income related to the Licensed IP over the period commencing upon delivery of the first Licensed IP milestone through the date of the milestone that required the Company’s continuing involvement in the product development process, which was completed at the end of the second quarter of 2017. Royalty payments will be recognized in income once earned. The Company classifies Licensed IP income and royalty income associated with the February 2016 agreement as other operating income. During
2017
, the Company recognized a
$52 million
licensing gain associated with the Licensed IP. In addition, during 2017, the Company recognized
$36 million
of Development and IP fees and other services fees of
$12 million
as credits to research and development expenses. During
2016
, the Company recognized an
$88 million
licensing gain.
No
credits for the Development and IP agreement and other services was recognized as credits to research and development by the Company during
2016
.
No
royalty income was recognized by the Company during
2017
and
2016
.
The Company’s total exposure to losses through its investment in the THATIC JV is limited to the Company’s investment in the THATIC JV, which was
zero
as of
December 30, 2017
. The Company’s share in the net losses of the THATIC JV for
2017
was
not material
and is not recorded in the Company’s consolidated statement of operations since the Company is not obligated to fund the THATIC JV’s losses in excess of the Company’s investment in the THATIC JV. The Company’s receivable from the THATIC JV for these agreements was
$3 million
and
zero
as of
December 30, 2017
and
December 31, 2016
, respectively, included in
Prepayment and other receivables - related parties
on its consolidated balance sheets. As of
December 30, 2017
and
December 31, 2016
, the total assets and liabilities of the THATIC JV were
not material
.
Accounts Receivable
As of
December 30, 2017
and
December 31, 2016
, Accounts receivable, net included unbilled accounts receivable of
$16 million
and
$37 million
, respectively. Unbilled accounts receivable represent revenue recognized but not billed as payments are deferred by customers until certain contractual milestones are met. All unbilled accounts receivable are expected to be billed and collected within twelve months.
Inventories
|
December 30,
2017 |
December 31,
2016 |
||||||
|
|
(In millions)
|
||||||
|
Raw materials
|
$
|
34
|
|
$
|
11
|
|
|
|
Work in process
|
468
|
|
564
|
|
|||
|
Finished goods
|
237
|
|
176
|
|
|||
|
Total inventories, net
|
$
|
739
|
|
$
|
751
|
|
|
Property, plant and equipment
71
|
December 30,
2017 |
December 31,
2016 |
||||||
|
|
(In millions)
|
||||||
|
Leasehold improvements
|
$
|
187
|
|
$
|
148
|
|
|
|
Equipment
|
758
|
|
714
|
|
|||
|
Construction in progress
|
56
|
|
19
|
|
|||
|
Property, plant and equipment, gross
|
1,001
|
|
881
|
|
|||
|
Accumulated depreciation and amortization
|
(740
|
)
|
(717
|
)
|
|||
|
Total property, plant and equipment, net
|
$
|
261
|
|
$
|
164
|
|
|
The Company incurs costs for the fabrication of mask sets used by its foundry partners to manufacture its products. Beginning the first quarter of 2017, the Company capitalizes mask set costs that are expected to be utilized in production manufacturing as the Company’s product development process has become more predictable and thus supports capitalization of the mask set. The capitalized mask set costs begin depreciating to Cost of sales once the products go into production on a straight-line basis over the estimated useful life of
two
years. Previously, mask sets were expensed to research and development.
Depreciation expense for
2017
,
2016
and
2015
was
$77 million
,
$71 million
and
$94 million
, respectively.
Other assets
|
December 30,
2017 |
December 31,
2016 |
||||||
|
|
(In millions)
|
||||||
|
Software and technology licenses, net
|
$
|
239
|
|
$
|
234
|
|
|
|
Other
|
71
|
|
45
|
|
|||
|
Total other assets
|
$
|
310
|
|
$
|
279
|
|
|
Accrued liabilities
|
December 30,
2017 |
December 31,
2016 |
||||||
|
|
(In millions)
|
||||||
|
Accrued compensation and benefits
|
$
|
206
|
|
$
|
116
|
|
|
|
Marketing programs and advertising expenses
|
150
|
|
102
|
|
|||
|
Software technology and licenses payable
|
41
|
|
24
|
|
|||
|
Other accrued and current liabilities
|
144
|
|
149
|
|
|||
|
Total accrued liabilities
|
$
|
541
|
|
$
|
391
|
|
|
72
Goodwill
The carrying amounts of goodwill as of
December 30, 2017
and
December 31, 2016
were as follows:
|
Computing and Graphics
|
Enterprise, Embedded and Semi-Custom
|
All Other
|
Total
|
||||||||||||
|
|
(In millions)
|
||||||||||||||
|
Initial goodwill due to ATI acquisition
|
$
|
1,194
|
|
$
|
255
|
|
$
|
745
|
|
$
|
2,194
|
|
|||
|
Initial goodwill due to SeaMicro acquisition
|
165
|
|
65
|
|
—
|
|
230
|
|
|||||||
|
1,359
|
|
320
|
|
745
|
|
2,424
|
|
||||||||
|
Accumulated impairment losses
|
(1,359
|
)
|
—
|
|
(745
|
)
|
(2,104
|
)
|
|||||||
|
Assets held-for-sale (sold to ATMP JV during 2016)
|
—
|
|
(42
|
)
|
—
|
|
(42
|
)
|
|||||||
|
Balance as of December 26, 2015
|
—
|
|
278
|
|
—
|
|
278
|
|
|||||||
|
Adjustment to assets sold to ATMP JV
|
—
|
|
11
|
|
—
|
|
11
|
|
|||||||
|
Balance as of December 31, 2016
|
—
|
|
289
|
|
—
|
|
289
|
|
|||||||
|
Balance as of December 30, 2017
|
—
|
|
289
|
|
—
|
|
289
|
|
|||||||
|
Goodwill, gross
|
1,359
|
|
289
|
|
745
|
|
2,393
|
|
|||||||
|
Accumulated impairment losses
|
$
|
(1,359
|
)
|
$
|
—
|
|
$
|
(745
|
)
|
$
|
(2,104
|
)
|
|||
As a result of the decision to form the JVs with TFME in 2015, the balance sheet as of December 26, 2015 reflects held-for-sale accounting of the ATMP assets and liabilities which required reclassification of such financial amounts to current assets and current liabilities. Asset balances reclassified into other current assets included goodwill of
$42 million
. During 2016, the formation of ATMP JV was completed and the actual goodwill assigned to ATMP JV was approximately
$31 million
.
In the fourth quarters of
2017
and
2016
, the Company conducted its annual impairment tests of goodwill. The Company determined that the estimated fair value exceeded the carrying value of the reporting units, indicating that there was no goodwill impairment with respect to these reporting units.
Acquisition-Related Intangible Assets
As a part of the Company’s strategy to simplify and sharpen its investment focus, the Company decided to exit the dense server systems business, formerly SeaMicro, in the first quarter of 2015. As a result, the Company recorded a charge of
$76 million
in Restructuring and other special charges, net on the Company’s consolidated statements of operations during 2015. This charge consisted of an impairment charge of
$62 million
related to the acquired intangible assets. The Company concluded that the carrying value of the acquired intangible assets associated with its dense server systems business was fully impaired as the Company did not have plans to utilize the related freedom fabric technology in any of its future products nor did it have any plans at that time to monetize the associated intellectual property.
There were no unamortized balances of acquisition-related intangible assets as of
December 30, 2017
and
December 31, 2016
. Amortization expense for acquisition-related intangible assets was
zero
,
zero
, and
$3 million
for the years
2017
,
2016
and
2015
, respectively.
73
Cash and Cash Equivalents
Cash and cash equivalents measured and recorded at fair value on a recurring basis, which approximates amortized cost, as of
December 30, 2017
and
December 31, 2016
are summarized below:
|
December 30,
2017 |
December 31,
2016 |
||||||
|
(In millions)
|
|||||||
|
Cash and cash equivalents
|
|||||||
|
Cash
|
$
|
108
|
|
$
|
67
|
|
|
|
Level 1
(1) (2)
|
|||||||
|
Government money market funds
|
395
|
|
50
|
|
|||
|
Total level 1
|
395
|
|
50
|
|
|||
|
Level 2
(1) (3)
|
|||||||
|
Commercial paper
|
682
|
|
1,147
|
|
|||
|
Total level 2
|
682
|
|
1,147
|
|
|||
|
Total
|
$
|
1,185
|
|
$
|
1,264
|
|
|
|
(1)
|
The Company did not have any transfers between Level 1 and Level 2 during
2017
and
2016
.
|
|
(2)
|
The Company’s Level 1 assets are valued using quoted prices for identical instruments in active markets.
|
|
(3)
|
The Company’s Level 2 assets are valued using broker reports that utilize quoted prices for identical instruments in markets that are not active or comparable instruments in active markets. Brokers gather observable inputs for all of the Company’s fixed income securities from a variety of industry data providers and other third-party sources.
|
In addition to those amounts presented above, as of
December 30, 2017
and
December 31, 2016
, the Company had approximately
$2 million
and
$2 million
, respectively, of investments in money market funds used as collateral for letters of credit deposits which were included in Other current assets and Other assets, respectively, on the Company’s consolidated balance sheets. These money market funds are classified within Level 1 because they are valued using quoted prices for identical instruments in active markets. Their amortized costs are the same as the fair value for all periods presented. The Company is restricted from accessing these deposits.
As of
December 30, 2017
and
December 31, 2016
, the Company also had approximately
$18 million
and
$15 million
, respectively, of investments in mutual funds held in a Rabbi trust established for the Company’s deferred compensation plan which were also included in Other assets on the Company’s consolidated balance sheets. These mutual funds are classified within Level 1 because they are valued using quoted prices for identical instruments in active markets. Their amortized cost approximates the fair value for all periods presented. The Company is restricted from accessing these investments.
Financial Instruments Not Recorded at Fair Value on a Recurring Basis.
The Company carries its financial instruments at fair value with the exception of its debt. Financial instruments that are not recorded at fair value are measured at fair value on a quarterly basis for disclosure purposes. The carrying amounts and estimated fair values of financial instruments not recorded at fair value are as follows:
|
|
December 30, 2017
|
December 31, 2016
|
|||||||||||||
|
|
Carrying
Amount
|
Estimated
Fair Value
|
Carrying
Amount
|
Estimated
Fair Value
|
|||||||||||
|
|
(In millions)
|
||||||||||||||
|
Short-term debt
|
$
|
70
|
|
$
|
70
|
|
$
|
—
|
|
$
|
—
|
|
|||
|
Long-term debt, net
(1)
|
$
|
1,324
|
|
$
|
2,103
|
|
$
|
1,434
|
|
$
|
2,313
|
|
|||
|
(1)
|
Carrying amounts of long-term debt are net of unamortized debt issuance costs of
$19 million
and
$25 million
as of
December 30, 2017
and
December 31, 2016
, respectively, based on the adoption of ASU 2015-03, and net of
$286 million
and
$308 million
unamortized debt discount associated with the
2.125%
Notes as of
December 30, 2017
and
December 31, 2016
, respectively.
|
The Company’s short-term and long-term debt, net are classified within Level 2. The fair value of the debt was estimated based on the quoted market prices for the same or similar issues or on the current rates offered to the Company for debt of the same remaining maturities. The fair value of the Company’s accounts receivable, accounts payable and other short-term obligations approximate their carrying value based on existing payment terms.
74
Hedging Transactions and Derivative Financial Instruments
Cash Flow Hedges
The following table shows the amount of gain (loss) included in accumulated other comprehensive income (loss), the amount of gain (loss) reclassified from accumulated other comprehensive income (loss) and included in earnings related to the foreign currency forward contracts designated as cash flow hedges and the amount of gain (loss) included in other income (expense), net, related to contracts not designated as hedging instruments which was allocated in the consolidated statements of operations:
|
2017
|
2016
|
||||||
|
|
(In millions)
|
||||||
|
Foreign Currency Forward Contracts - gains (losses)
|
|||||||
|
Contracts designated as cash flow hedging instruments
|
|||||||
|
Other comprehensive income (loss)
|
$
|
9
|
|
$
|
4
|
|
|
|
Research and development
|
7
|
|
(1
|
)
|
|||
|
Marketing, general and administrative
|
1
|
|
—
|
|
|||
|
Contracts not designated as hedging instruments
|
|||||||
|
Other income (expense), net
|
$
|
(3
|
)
|
$
|
3
|
|
|
The Company’s foreign currency derivative contracts are classified within Level 2 because the valuation inputs are based on quoted prices and market observable data of similar instruments in active markets such as currency spot and forward rates.
The following table shows the fair value amounts included in Other current assets should the foreign currency forward contracts be in a gain position or included in Other current liabilities should these contracts be in a loss position. These amounts were recorded in the Company’s consolidated balance sheets as follows:
|
December 30,
2017 |
December 31,
2016 |
|||||||
|
|
(In millions)
|
|||||||
|
Foreign Currency Forward Contracts - gains (losses)
|
||||||||
|
Contracts designated as cash flow hedging instruments
|
$
|
7
|
|
$
|
(2
|
)
|
||
For the foreign currency contracts designated as cash flow hedges, the ineffective portions of the hedging relationship and the amounts excluded from the assessment of hedge effectiveness were immaterial.
As of
December 30, 2017
and
December 31, 2016
, the notional values of the Company’s outstanding foreign currency forward contracts were
$300 million
and
$138 million
, respectively. All the contracts mature within
12
months and, upon maturity, the amounts recorded in accumulated other comprehensive income (loss) are expected to be reclassified into earnings. The Company hedges its exposure to the variability in future cash flows for forecasted transactions over a maximum of 12 months.
Fair Value Hedges
In the third quarter of 2014, the Company entered into fixed-to-floating interest rate swaps on a notional amount of
$250 million
to hedge a portion of the Company’s
6.75%
Senior Notes due 2019 (
6.75%
Notes). The purpose of these swaps was to manage a portion of the Company’s exposure to interest rate risk by converting fixed rate interest payments to floating rate interest payments. The swaps effectively converted a portion of the fixed interest payments payable on the
6.75%
Notes into variable interest payments based on LIBOR. The interest rate swaps were designated as a fair value hedge. Because the specific terms and notional amount of the swaps were intended to match the portion of the
6.75%
Notes being hedged, it was assumed to be a highly effective hedge. Accordingly, changes in the fair value of the interest rate swaps were exactly offset by changes in the fair value of the
6.75%
Notes. All changes in fair value of the swaps were recorded on the Company’s consolidated balance sheets with no net impact to the Company’s consolidated statements of operations.
During
2016
, the Company terminated the above fair value hedges. In connection with the repurchase of a portion of the principal amount of the
6.75%
Notes during the third quarter of 2016, the Company canceled one of its interest rate swap contracts and recorded a gain of approximately
$2 million
in Other income (expense), net on the Company’s consolidated statement of operations. Additionally, during the fourth quarter of 2016, the Company canceled its remaining interest rate swap contract on the remaining portion of the outstanding
6.75%
Notes. For this cancellation, the Company recorded a deferred gain which is recognized as interest income over the remaining life of the
6.75%
Notes. The total amount of interest income recognized from the deferred
75
gain during
2017
and
2016
was immaterial. As of both
December 30, 2017
and
December 31, 2016
, the balance of the deferred gain included in Long-term debt, net on the Company's consolidated balance sheet was approximately
$1 million
.
The Company’s fair value hedge derivative contracts were classified within Level 2 because the valuation inputs were based on quoted prices and market observable data of similar instruments in active markets.
Financial instruments that potentially subject the Company to concentrations of credit risk consist primarily of investments in debt securities, trade receivables and derivative financial instruments used in hedging activities.
The Company places its investments with high credit quality financial institutions and, by policy, limits the amount of credit exposure with any one financial institution. The Company invests in time deposits and certificates of deposit from banks having combined capital, surplus and undistributed profits of not less than
$200 million
. At the time an investment is made, investments in commercial paper of industrial firms and financial institutions are rated A1, P1 or better. The Company invests in tax-exempt securities including municipal notes and bonds that are rated A, A2 or better and repurchase agreements, each of which have securities of the type and quality listed above as collateral.
The Company believes that concentrations of credit risk with respect to trade receivables are limited because a large number of geographically diverse customers make up the Company’s customer base, thus diluting the trade credit risk. Accounts receivable from the Company’s top
three
customers accounted for approximately
15%
,
13%
and
11%
of the total consolidated accounts receivable balance as of
December 30, 2017
and
12%
,
11%
and
10%
of the total consolidated accounts receivable balance as of
December 31, 2016
. However, the Company does not believe the receivable balance from these customers represents a significant credit risk based on past collection experience and review of their current credit quality. The Company manages its exposure to customer credit risk through credit limits, credit lines, ongoing monitoring procedures and credit approvals. Furthermore, the Company performs in-depth credit evaluations of all new customers and, at intervals, for existing customers. From this, the Company may require letters of credit, bank or corporate guarantees or advance payments if deemed necessary.
The Company’s existing derivative financial instruments are with large international financial institutions of investment grade credit rating. The Company does not believe that there is significant risk of nonperformance by these counterparties because the Company monitors their credit rating on an ongoing basis. By using derivative instruments, the Company is subject to credit and market risk. If a counterparty fails to fulfill its performance obligations under a derivative contract, the Company’s credit risk will equal the fair value of the derivative instrument. Generally, when the fair value of a derivative contract is positive, the counterparty owes the Company, thus creating a receivable risk for the Company. Based upon certain factors including a review of the credit default swap rates for the Company’s counterparties, the Company determined its counterparty credit risk to be immaterial. At
December 30, 2017
, counterparties’ obligations under the contracts exceeded the Company’s obligations by
$7 million
.
The Company is dependent on certain equipment and materials from a limited number of suppliers and relies on a limited number of foreign companies to supply the majority of certain types of integrated circuit packages for back-end manufacturing operations. Similarly, certain non-proprietary materials or components such as memory, PCBs, substrates and capacitors used in the manufacture of the Company’s graphics products are currently available from only a limited number of sources. Interruption of supply or increased demand in the industry could cause shortages and price increases in various essential materials. If the Company or its third-party manufacturing suppliers are unable to procure certain of these materials or its foundries are unable to procure materials for manufacturing its products, its business would be materially adversely affected.
76
The provision for income taxes consists of:
|
2017
|
2016
|
2015
|
|||||||||
|
|
(In millions)
|
||||||||||
|
Current:
|
|||||||||||
|
U.S. Federal
|
$
|
(3
|
)
|
$
|
(2
|
)
|
$
|
(1
|
)
|
||
|
U.S. State and Local
|
—
|
|
—
|
|
—
|
|
|||||
|
Foreign National and Local
|
38
|
|
21
|
|
16
|
|
|||||
|
Total
|
35
|
|
19
|
|
15
|
|
|||||
|
Deferred:
|
|||||||||||
|
U.S. Federal
|
(15
|
)
|
(1
|
)
|
—
|
|
|||||
|
Foreign National and Local
|
(1
|
)
|
21
|
|
(1
|
)
|
|||||
|
Total
|
(16
|
)
|
20
|
|
(1
|
)
|
|||||
|
Provision for income taxes
|
$
|
19
|
|
$
|
39
|
|
$
|
14
|
|
||
Income (loss) before income taxes consists of the following:
|
2017
|
2016
|
2015
|
|||||||||
|
|
(In millions)
|
||||||||||
|
U.S.
|
$
|
108
|
|
$
|
(604
|
)
|
$
|
(1,100
|
)
|
||
|
Foreign
|
(46
|
)
|
146
|
|
454
|
|
|||||
|
Total pre-tax income (loss) including equity loss in investee
|
$
|
62
|
|
$
|
(458
|
)
|
$
|
(646
|
)
|
||
Deferred income taxes reflect the net tax effects of tax carryovers and temporary differences between the carrying amounts of assets and liabilities for financial reporting purposes and the balances for income tax purposes. Significant components of the Company’s deferred tax assets and liabilities as of
December 30, 2017
and
December 31, 2016
are as follows:
|
December 30,
2017 |
December 31,
2016 |
||||||
|
|
(In millions)
|
||||||
|
Deferred tax assets:
|
|||||||
|
Net operating loss carryovers
|
$
|
1,551
|
|
$
|
2,480
|
|
|
|
Deferred distributor income
|
7
|
|
26
|
|
|||
|
Inventory valuation
|
20
|
|
26
|
|
|||
|
Accrued expenses not currently deductible
|
61
|
|
65
|
|
|||
|
Acquired intangibles
|
102
|
|
213
|
|
|||
|
Tax deductible goodwill
|
56
|
|
146
|
|
|||
|
Federal and state tax credit carryovers
|
546
|
|
427
|
|
|||
|
Foreign research and development ITC credits
|
391
|
|
341
|
|
|||
|
Other
|
55
|
|
83
|
|
|||
|
Total deferred tax assets
|
2,789
|
|
3,807
|
|
|||
|
Less: valuation allowance
|
(2,621
|
)
|
(3,526
|
)
|
|||
|
Total deferred tax assets, net of valuation allowance
|
168
|
|
281
|
|
|||
|
Deferred tax liabilities:
|
|||||||
|
Discount of convertible notes
|
(58
|
)
|
(105
|
)
|
|||
|
Undistributed foreign earnings
|
(97
|
)
|
(158
|
)
|
|||
|
Other
|
(13
|
)
|
(18
|
)
|
|||
|
Total deferred tax liabilities
|
(168
|
)
|
(281
|
)
|
|||
|
Net deferred tax assets
|
$
|
—
|
|
$
|
—
|
|
|
77
The breakdown between current and non-current deferred tax assets and deferred tax liabilities as of
December 30, 2017
and
December 31, 2016
is as follows:
|
December 30,
2017 |
December 31,
2016 |
||||||
|
|
(In millions)
|
||||||
|
Current deferred tax assets
|
$
|
—
|
|
$
|
—
|
|
|
|
Non-current deferred tax assets
|
11
|
|
11
|
|
|||
|
Current deferred tax liabilities
|
—
|
|
—
|
|
|||
|
Non-current deferred tax liabilities
|
$
|
(11
|
)
|
$
|
(11
|
)
|
|
|
Net deferred tax assets
|
$
|
—
|
|
$
|
—
|
|
|
Non-current deferred tax assets are included in the caption Other assets on the consolidated balance sheets. Non-current deferred tax liabilities are included in the caption Other long-term liabilities on the consolidated balance sheets.
In December 2017, the U.S. government enacted comprehensive tax legislation commonly referred to as the Tax Cuts and Jobs Act of 2017 (Tax Reform Act). The legislation significantly changes U.S. tax law by, among other things, lowering corporate income tax rates, implementing a modified territorial tax system and imposing a transition tax on deemed repatriated earnings of foreign subsidiaries. The Tax Reform Act permanently reduces the U.S. corporate income tax rate from a maximum of 35% to a flat 21% rate, effective January 1, 2018. ASC 740:
Income Taxes
, requires companies to recognize the effect of the tax law changes in the period of enactment. However, the SEC staff issued Staff Accounting Bulletin 118 which will allow companies to record provisional amounts during a measurement period that is similar to the measurement period used when accounting for business combinations. The Company has adjusted its deferred tax assets and liabilities based on the reduction of the U.S. federal corporate tax rate from 35% to 21% and assessed the realizability of our deferred tax assets based on our current understanding of the provisions of the new law. The Company considers its accounting for the impacts of the Tax Reform Act to be incomplete and the Company will continue to assess the impact of the Tax Reform Act (and expected further guidance from federal and state tax authorities as well as further guidance for the associated income tax accounting) on its business and consolidated financial statements over the next 12 months.
The Tax Reform Act eliminated the corporate alternative minimum tax (AMT) for tax years commencing on or after January 1, 2018. As a result, AMT credit carryforwards may be utilized to reduce future income tax liabilities. In addition, excess AMT credits are refundable in any taxable year beginning after 2017 and before 2022 in an amount equal to 50% (100% in the case of taxable years beginning in 2021) of the excess of the minimum tax credit for the taxable year over the amount of the credit allowable for the year against regular tax liability. Accordingly, the Company has reclassified
$16 million
of AMT credit carry forwards as a non-current tax receivable.
As of
December 30, 2017
, substantially all of the Company’s U.S. and foreign deferred tax assets, net of deferred tax liabilities, continued to be subject to a valuation allowance. The realization of these assets is dependent on substantial future taxable income which at
December 30, 2017
, in management’s estimate, is not more likely than not to be achieved. In
2017
, gross deferred tax assets decreased by
$1,018 million
primarily for provisional decreases related to the remeasurement of deferred tax assets due to the 21% tax rate under the Tax Reform Act, as well as decreases related to acquired intangibles and goodwill, offset by a decrease in the gross deferred tax liability balance of
$112 million
primarily for provisional decreases related to the remeasurement of deferred tax liabilities due to the 21% tax rate under the Tax Reform Act, and a decrease in the gross valuation allowance of
$905 million
. In
2016
, the net valuation allowance
decreased
by
$143 million
primarily for decreases in deferred tax assets related to foreign capitalized research costs, acquired intangibles and goodwill
. In
2015
, the net valuation allowance
increased
by
$174 million
primarily for increases in deferred tax assets related to the net operating losses generated from pre-tax book losses in the U.S.
The following is a summary of the Company’s various tax attribute carryforwards as of
December 30, 2017
.
|
Carryforward
|
Federal
|
State /
Provincial
|
Expiration
|
||||||
|
|
(In millions)
|
|
|||||||
|
U.S.-net operating loss carryovers
|
$
|
7,254
|
|
$
|
309
|
|
2018 to 2037
|
||
|
U.S.-credit carryovers
|
$
|
394
|
|
$
|
213
|
|
2018 to 2037
|
||
|
Canada-credit carryovers
|
$
|
369
|
|
$
|
42
|
|
2021 to 2037
|
||
|
Other foreign net operating loss carryovers
|
$
|
37
|
|
N/A
|
|
various
|
|||
78
Utilization of
$8 million
of the Company’s U.S. federal net operating loss carryforwards are subject to annual limitations as a result of the ATI Technologies ULC (ATI) acquisition.
The table below displays reconciliation between statutory federal income taxes and the total provision (benefit) for income taxes.
|
2017
|
2016
|
2015
|
|||||||||
|
|
(In millions)
|
||||||||||
|
Statutory federal income tax expense (benefit) at 35% rate
|
$
|
22
|
|
$
|
(160
|
)
|
$
|
(226
|
)
|
||
|
State taxes, net of federal benefit
|
1
|
|
1
|
|
1
|
|
|||||
|
Foreign (income) expense at other than U.S. rates
|
—
|
|
(1
|
)
|
9
|
|
|||||
|
U.S. valuation allowance generated
|
16
|
|
201
|
|
232
|
|
|||||
|
Credit monetization
|
(20
|
)
|
(2
|
)
|
(2
|
)
|
|||||
|
Provision for income taxes
|
$
|
19
|
|
$
|
39
|
|
$
|
14
|
|
||
As part of the transition from a world-wide tax system to a territorial (dividend exemption) system, the Tax Reform Act imposes a one-time transition tax on the cumulative undistributed post-1986 earnings and profits of certain foreign subsidiaries. The transition tax applies at a rate of 15.5% for earnings held as liquid assets and 8.0% for earnings held as illiquid assets by the foreign subsidiaries. The Company is currently estimating that it will not be subject to the transition tax because of the aggregate cumulative post-1986 earnings and profits of its foreign subsidiaries are in an overall deficit, however the Company has not yet completed its calculations of the total post-1986 earnings and profits and associated tax pools for its foreign subsidiaries. Additionally, the Company understands that there could be further interpretations from U.S. federal and state governments and regulatory organizations that may impact its final calculation.
Because of the transition to a territorial system under the Tax Reform Act, the taxation of future dividend distributions by foreign subsidiaries is expected to be limited to withholding taxes which may apply based on the jurisdiction of the subsidiary. The Company has made no provision for taxes on approximately
$117 million
of cumulative undistributed earnings of certain foreign subsidiaries through December 30, 2017 based on the Company’s intention to indefinitely reinvest such earnings (2016: approximately
$82 million
). However, if such earnings were distributed, the Company would incur additional withholding taxes.
The Company’s operations in Malaysia currently operate under a tax holiday, which will expire in 2018. This tax holiday may be extended if specific conditions are met. The net impact of the tax holiday did
no
t increase the Company’s net income in
2017
because the Company’s operations in Malaysia were immaterial. The net impact of tax holidays did
no
t decrease the Company’s net loss in
2016
and
2015
because the Company’s operations in Malaysia operated at a loss.
A reconciliation of the gross unrecognized tax benefits is as follows:
|
2017
|
2016
|
2015
|
|||||||||
|
|
(In millions)
|
||||||||||
|
Balance at beginning of year
|
$
|
42
|
|
$
|
38
|
|
$
|
28
|
|
||
|
Increases for tax positions taken in prior years
|
7
|
|
3
|
|
11
|
|
|||||
|
Decreases for tax positions taken in prior years
|
(2
|
)
|
—
|
|
(1
|
)
|
|||||
|
Increases for tax positions taken in the current year
|
3
|
|
2
|
|
2
|
|
|||||
|
Decreases for settlements with taxing authorities
|
—
|
|
—
|
|
(2
|
)
|
|||||
|
Decreases for lapsing of the statute of limitations
|
(1
|
)
|
(1
|
)
|
—
|
|
|||||
|
Balance at end of year
|
$
|
49
|
|
$
|
42
|
|
$
|
38
|
|
||
The amount of unrecognized tax benefits that would impact the effective tax rate was
$9 million
,
$4 million
and
$4 million
as of
December 30, 2017
,
December 31, 2016
and
December 26, 2015
, respectively. The Company had
no
or immaterial amounts of accrued interest and no accrued penalties related to unrecognized tax benefits as of
December 30, 2017
,
December 31, 2016
and
December 26, 2015
. The Company recognizes the accrued interest and penalties to unrecognized tax benefits as interest expense and income tax expense, respectively.
During the 12 months beginning December 31, 2017, the Company expects to reduce its unrecognized tax benefits by
$1 million
primarily as a result of the lapse of statute with certain tax authorities. The Company does not believe it is reasonably possible that other unrecognized tax benefits will materially change in the next 12 months. However, the resolutions and/or closure of open audits are highly uncertain.
79
As of December 26, 2015, the Italian tax authorities had concluded their audit of the Company’s subsidiaries’ activities in Italy for the years 2003 through 2013. The Company entered into a settlement for
$11 million
in taxes and penalties and
$2 million
in interest. The Company and its subsidiaries have several foreign, foreign provincial, and U.S. state audits in process at any one point in time. The Company has provided for uncertain tax positions that require a liability under the adopted method to account for uncertainty in income taxes.
Total Debt
The Company’s total debt as of
December 30, 2017
and
December 31, 2016
consisted of:
|
December 30,
2017 |
December 31,
2016 |
||||||
|
|
(In millions)
|
||||||
|
6.75% Notes
|
$
|
166
|
|
$
|
196
|
|
|
|
7.50% Notes
|
347
|
|
350
|
|
|||
|
7.00% Notes
|
311
|
|
416
|
|
|||
|
2.125% Notes
|
805
|
|
805
|
|
|||
|
Secured Revolving Line of Credit
|
70
|
|
—
|
|
|||
|
Total debt (principal amount)
|
1,699
|
|
1,767
|
|
|||
|
Unamortized debt discount associated with 2.125% Notes
|
(286
|
)
|
(308
|
)
|
|||
|
Unamortized debt issuance costs
|
(19
|
)
|
(25
|
)
|
|||
|
Other
|
1
|
|
1
|
|
|||
|
Total debt (net)
|
1,395
|
|
1,435
|
|
|||
|
Less: current portion
|
(70
|
)
|
—
|
|
|||
|
Total debt, less current portion
|
$
|
1,325
|
|
$
|
1,435
|
|
|
2.125%
Convertible Senior Notes Due 2026
On September 14, 2016, the Company issued
$700 million
in aggregate principal amount of
2.125%
Convertible Senior Notes due 2026 (
2.125%
Notes). The Company also granted an option to the underwriters to purchase an additional
$105 million
aggregate principal amount of the
2.125%
Notes. On September 28, 2016, this option was exercised in full and the Company issued an additional
$105 million
aggregate principal amount of the
2.125%
Notes.
The
2.125%
Notes are general unsecured senior obligations of the Company and will mature on September 1, 2026 unless earlier repurchased or converted. Interest is payable in arrears on March 1 and September 1 of each year beginning on March 1, 2017. The
2.125%
Notes are governed by the terms of a base indenture and a supplemental indenture (together the
2.125%
Indentures) dated September 14, 2016 between the Company and Wells Fargo Bank, N.A., as trustee.
Holders may convert their notes at their option at any time prior to the close of business on the business day immediately preceding June 1, 2026 only under the following circumstances: (1) during any calendar quarter commencing after the calendar quarter ending on September 30, 2016 (and only during such calendar quarter), if the last reported sale price of the Company’s common stock for at least
20
trading days (whether or not consecutive) during a period of
30
consecutive trading days ending on the last trading day of the immediately preceding calendar quarter is greater than or equal to
130%
of the conversion price on each applicable trading day; (2) during the
five
business day period after any
ten
consecutive trading day period (the “measurement period”) in which the trading price per
$1,000
principal amount of notes for each trading day of the measurement period was less than
98%
of the product of the last reported sale price of the Company's common stock and the conversion rate on each such trading day; or (3) upon the occurrence of specified corporate events. On or after June 1, 2026 and until the close of business on the business day immediately preceding the maturity date, holders may convert their notes at any time regardless of the foregoing circumstances. Upon conversion, the Company will pay or deliver, as the case may be, cash, shares of the Company’s common stock or a combination of cash and shares of the Company’s common stock at the Company’s election. During the fourth quarter of 2017, none of the conversion conditions were satisfied and as a result, the
2.125%
Notes are not eligible for conversion during the first calendar quarter of 2018. The Company’s current intent is to deliver shares of its common stock upon conversion of the
2.125%
Notes.
The Company may not redeem the notes prior to the maturity date and no sinking fund is provided for the notes.
80
The conversion rate is initially
125.0031
shares of common stock per
$1,000
principal amount of notes (equivalent to an initial conversion price of approximately
$8.00
per share of common stock). The conversion rate is subject to adjustment in some events but will not be adjusted for any accrued and unpaid interest. In addition, following certain corporate events that occur prior to the maturity date, the Company will increase the conversion rate for a holder who elects to convert its notes in connection with such a corporate event in certain circumstances.
If the Company undergoes a fundamental change prior to the maturity date of the notes, holders may require the Company to repurchase for cash all or any portion of their notes at a fundamental change repurchase price equal to
100%
of the principal amount of the notes to be repurchased plus accrued and unpaid interest to, but excluding, the fundamental change repurchase date.
In accounting for the issuance of the
2.125%
Notes, the Company separated the
2.125%
Notes into liability and equity components. The carrying amount of the liability component was calculated by measuring the fair value of a similar liability that does not have associated conversion features. The carrying amount of the equity component representing the conversion option was determined by deducting the fair value of the liability component from the par value of the
2.125%
Notes as a whole. The excess of the principal amount of the liability component over its book value (debt discount) is accreted to interest expense over the term of the
2.125%
Notes. The equity component is not remeasured as long as it continues to meet the conditions for equity classification.
In accounting for the issuance costs related to the
2.125%
Notes, the Company allocated the total amount of issuance costs incurred to the liability and equity components based on their relative fair values. Issuance costs attributable to the liability component are being amortized to interest expense over the term of the
2.125%
Notes, and the issuance costs attributable to the equity component are netted against the equity component in
additional paid-in capital. During
2016
, the Company recorded issuance costs of
$15 million
and
$9 million
for the liability and equity portions, respectively,
The determination of whether or not the
2.125%
Notes are convertible is performed on a calendar-quarter basis.
The
2.125%
Notes consisted of the following:
|
December 30,
2017 |
December 31,
2016 |
|||||
|
(In millions)
|
||||||
|
Principal amounts:
|
||||||
|
Principal
|
$
|
805
|
|
$
|
805
|
|
|
Unamortized debt discount
(1)
|
(286
|
)
|
(308
|
)
|
||
|
Unamortized debt issuance costs
|
(12
|
)
|
(14
|
)
|
||
|
Net carrying amount
|
$
|
507
|
|
$
|
483
|
|
|
Carrying amount of the equity component, net
(2)
|
$
|
305
|
|
$
|
305
|
|
|
(1)
|
Included in the consolidated balance sheets within Long-term debt, net and amortized over the remaining life of the notes using the effective interest rate method.
|
|
(2)
|
Included in the consolidated balance sheets within additional paid-in capital, net of
$9 million
in equity issuance costs.
|
As of
December 30, 2017
, the remaining life of the
2.125%
Notes was approximately
105 months
.
Based on the closing price of the Company’s common stock of
$10.28
on December 29, 2017, the last business day of 2017, the if-converted value of the
2.125%
Notes exceeded its principal amount by approximately
$229 million
.
The effective interest rate of the liability component of the
2.125%
Notes is
8%
. This interest rate was based on the interest rates of similar liabilities at the time of issuance that did not have associated conversion features. The following table sets forth total interest expense recognized related to the
2.125%
Notes for the year ended
December 30, 2017
:
|
December 30,
2017 |
December 31,
2016 |
|||||
|
(In millions)
|
||||||
|
Contractual interest expense
|
$
|
17
|
|
$
|
5
|
|
|
Interest cost related to amortization of debt issuance costs
|
2
|
|
—
|
|
||
|
Interest cost related to amortization of the debt discount
|
$
|
22
|
|
$
|
6
|
|
81
6.75%
Senior Notes Due 2019
On
February 26, 2014
, the Company issued
$600 million
of its
6.75%
Senior Notes due 2019 (
6.75%
Notes). The
6.75%
Notes are general unsecured senior obligations of the Company. Interest is payable on March 1 and September 1 of each year beginning September 1, 2014 until the maturity date of
March 1, 2019
. The
6.75%
Notes are governed by the terms of an indenture (the
6.75%
Indenture) dated February 26, 2014 between the Company and Wells Fargo Bank, N.A., as trustee.
In 2016, the Company repurchased
$404 million
in aggregate principal amount of its
6.75%
Notes pursuant to a partial tender offer for
$442 million
.
During
2017
, the Company settled
$30 million
in aggregate principal amount of its
6.75%
Notes for
$26 million
in cash and
$5 million
in treasury stock. As of
December 30, 2017
, the outstanding aggregate principal amount of the
6.75%
Notes was
$166 million
.
Subsequent to the end of 2017 and through February 27, 2018, the Company repurchased
$13.6 million
in aggregate principal amount of its
6.75%
Notes in cash.
At any time before March 1, 2019, the Company may redeem some or all of the
6.75%
Notes at a price equal to
100%
of the principal amount, plus accrued and unpaid interest and a “make whole” premium (as set forth in the
6.75%
Indenture).
Holders have the right to require the Company to repurchase all or a portion of the
6.75%
Notes in the event that the Company undergoes a change of control, as defined in the
6.75%
Indenture, at a price of
101%
of the principal amount plus accrued and unpaid interest. Additionally, an event of default (as defined in the
6.75%
Indenture) may result in the acceleration of the maturity of the
6.75%
Notes.
The
6.75%
Indenture contains certain covenants that limit, among other things, the Company’s ability and the ability of its subsidiaries, to:
|
•
|
incur additional indebtedness, except specified permitted debt;
|
|
•
|
pay dividends and make other restricted payments;
|
|
•
|
make certain investments if an event of a default exists, or if specified financial conditions are not satisfied;
|
|
•
|
create or permit certain liens;
|
|
•
|
create or permit restrictions on the ability of its subsidiaries to pay dividends or make other distributions to the Company;
|
|
•
|
use the proceeds from sales of assets;
|
|
•
|
enter into certain types of transactions with affiliates; and
|
|
•
|
consolidate, merge or sell its assets as entirety or substantially as an entirety.
|
7.50%
Senior Notes Due 2022
On
August 15, 2012
, the Company issued
$500 million
of its
7.50%
Senior Notes due 2022 (
7.50%
Notes). The
7.50%
Notes are general unsecured senior obligations of the Company. Interest is payable on February 15 and August 15 of each year beginning February 15, 2013 until the maturity date of
August 15, 2022
. The
7.50%
Notes are governed by the terms of an indenture (the
7.50%
Indenture) dated August 15, 2012 between the Company and Wells Fargo Bank, N.A., as trustee.
In 2014, the Company repurchased
$25 million
in aggregate principal amount of its
7.50%
Notes in open market transactions for
$24 million
. In 2016, the Company repurchased
$125 million
in aggregate principal amount of its
7.50%
Notes pursuant to a partial tender offer for
$135 million
. During
2017
, the Company settled
$3 million
in aggregate principal amount of its
7.50%
Notes for
$3 million
in treasury stock. As of
December 30, 2017
, the outstanding aggregate principal amount of the
7.50%
Notes was
$347 million
.
Prior to August 15, 2022, the Company may redeem some or all of the
7.50%
Notes at a price equal to
100%
of the principal amount plus accrued and unpaid interest and a “make whole” premium (as defined in the
7.50%
Indenture). Holders have the right to require the Company to repurchase all or a portion of the
7.50%
Notes in the event that the Company undergoes a change of control as defined in the
7.50%
Indenture, at a repurchase price of
101%
of the principal amount plus accrued and unpaid interest. Additionally, an event of default (as defined in the
7.50%
Indenture) may result in the acceleration of the maturity of the
7.50%
Notes.
82
The
7.50%
Indenture contains certain covenants that limit, among other things, the Company’s ability and the ability of its subsidiaries, to:
•
incur additional indebtedness, except specified permitted debt;
•
pay dividends and make other restricted payments;
•
make certain investments if an event of a default exists, or if specified financial conditions are not satisfied;
•
create or permit certain liens;
|
•
|
create or permit restrictions on the ability of its subsidiaries to pay dividends or make other distributions to the Company;
|
•
use the proceeds from sales of assets;
•
enter into certain types of transactions with affiliates; and
•
consolidate, merge or sell its assets as entirety or substantially as an entirety.
7.00%
Senior Notes Due 2024
On
June 16, 2014
, the Company issued
$500 million
of its
7.00%
Senior Notes due 2024 (
7.00%
Notes). The
7.00%
Notes are general unsecured senior obligations of the Company. Interest is payable on January 1 and July 1 of each year beginning January 1, 2015 until the maturity date of
July 1, 2024
. The
7.00%
Notes are governed by the terms of an indenture (the
7.00%
Indenture) dated June 16, 2014 between the Company and Wells Fargo Bank, N.A., as trustee.
In 2016, the Company settled
$84 million
in aggregate principal amount of its
7.00%
Notes for
$77 million
in cash and
$8 million
in treasury stock.
During
2017
, the Company settled
$105 million
in aggregate principal amount of its
7.00%
Notes for
$84 million
in cash and
$26 million
in treasury stock. As of
December 30, 2017
, the outstanding aggregate principal amount of the
7.00%
Notes was
$311 million
.
Prior to July 1, 2019, the Company may redeem some or all of the
7.00%
Notes at a price equal to
100%
of the principal amount plus accrued and unpaid interest and a “make whole” premium (as set forth in the
7.00%
Indenture).
Starting July 1, 2019, the Company may redeem the
7.00%
Notes for cash at the following specified prices plus accrued and unpaid interest:
|
Period
|
Price as
Percentage of Principal Amount |
|
|
Beginning on July 1, 2019 through June 30, 2020
|
103.500
|
%
|
|
Beginning on July 1, 2020 through June 30, 2021
|
102.333
|
%
|
|
Beginning on July 1, 2021 through June 30, 2022
|
101.167
|
%
|
|
On July 1, 2022 and thereafter
|
100.000
|
%
|
Holders have the right to require the Company to repurchase all or a portion of the
7.00%
Notes in the event that the Company undergoes a change of control as defined in the
7.00%
Indenture at a repurchase price of
101%
of the principal amount plus accrued and unpaid interest. Additionally, an event of default (as defined in the
7.00%
Indenture) may result in the acceleration of the maturity of the
7.00%
Notes.
The
7.00%
Indenture contains certain covenants that limit, among other things, the Company’s ability and the ability of its subsidiaries, to:
|
•
|
incur additional indebtedness, except specified permitted debt;
|
|
•
|
pay dividends and make other restricted payments;
|
|
•
|
make certain investments if an event of a default exists, or if specified financial conditions are not satisfied;
|
|
•
|
create or permit certain liens;
|
|
•
|
create or permit restrictions on the ability of its subsidiaries to pay dividends or make other distributions to the Company;
|
|
•
|
use the proceeds from sales of assets;
|
|
•
|
enter into certain types of transactions with affiliates; and
|
83
|
•
|
consolidate, merge or sell its assets as entirety or substantially as an entirety.
|
The
6.75%
Notes,
7.50%
Notes,
7.00%
Notes and
2.125%
Notes rank equally with the Company’s existing and future senior debt and are senior to all of the Company’s future subordinated debt. The
6.75%
Notes,
7.50%
Notes,
7.00%
Notes and
2.125%
Notes rank junior to all of the Company’s future senior secured debt to the extent of the collateral securing such debt and are structurally subordinated to all existing and future debt and liabilities of the Company’s subsidiaries.
Potential Repurchase of Outstanding Notes
The Company may elect to purchase or otherwise retire the
6.75%
Notes,
7.50%
Notes,
7.00%
Notes and
2.125%
Notes with cash, stock or other assets from time to time in open market or privately negotiated transactions either directly or through intermediaries or by tender offer when the Company believes the market conditions are favorable to do so.
Secured Revolving Line of Credit
Loan and Security Agreement
The Company and its subsidiary, AMD International Sales & Service, Ltd. (together, the Borrowers), entered into a loan and security agreement on November 12, 2013, as amended on December 11, 2014 (the Loan Agreement), for a secured revolving line of credit for a principal amount of up to
$500 million
(the Secured Revolving Line of Credit) with up to
$75 million
available for issuance of letters of credit with a group of lenders and Bank of America, N.A., acting as agent for the lenders (the Agent). The Secured Revolving Line of Credit had a maturity date of November 12, 2018. Borrowings under the Secured Revolving Line of Credit were limited to up to
85%
of eligible account receivable minus certain reserves. The borrowings of the Secured Revolving Line of Credit may be used for general corporate purposes, including working capital needs.
Amended and Restated Loan and Security Agreement
On April 14, 2015, the Borrowers and ATI Technologies ULC (collectively, the Loan Parties) amended and restated the Loan Agreement (the Amended and Restated Loan Agreement) by and among the Loan Parties, the financial institutions party thereto from time to time as lenders (the Lenders) and the Agent. The Amended and Restated Loan Agreement provides for a Secured Revolving Line of Credit for a principal amount of up to
$500 million
with up to
$75 million
available for issuance of letters of credit, which remained unchanged from the Loan Agreement. Borrowings under the Secured Revolving Line of Credit are limited to up to
85%
of eligible accounts receivable (
90%
for certain qualified eligible accounts receivable) minus specified reserves. The size of the commitments under the Secured Revolving Line of Credit may be increased by up to an aggregate amount of
$200 million
.
The Secured Revolving Line of Credit matures on April 14, 2020 and is secured by a first priority security interest in the Loan Parties’ accounts receivable, inventory, deposit accounts maintained with the Agent and other specified assets including books and records.
The Borrowers may elect a per annum interest rate equal to (a) the London Interbank Offered Rate (LIBOR) plus the applicable margin set forth in the chart below (the Applicable Margin) as determined by the average availability under the Secured Revolving Line of Credit and the fixed charge coverage ratio for the most recently ended four-fiscal-quarter period; or (b) (i) the greatest of (x) the Agent’s prime rate, (y) the federal funds rate as published by the Federal Reserve Bank of New York plus
0.50%
, and (z) LIBOR for a one-month period plus
1.00%
, plus (ii) the Applicable Margin.Applicable Margin, if average availability is equal to or greater than
66.66%
of the total commitment amount and the fixed charge coverage ratio for the most recently ended four-fiscal quarter period is greater than or equal to
1.25
to
1.00
, is
0.25%
for Base Rate Revolver Loans and
1.25%
for LIBOR Revolver Loans. Otherwise, Applicable Margin is determined in accordance with the below table:
|
Level
|
Average
Availability for
Last Fiscal
Month
|
Base Rate
Revolver Loans:
Applicable Margin
|
LIBOR
Revolver Loans:
Applicable Margin
|
|||
|
I
|
greater than or equal to 66.66% of the Revolver Commitment
|
0.25%
|
1.25%
|
|||
|
II
|
greater than or equal to 33.33% of the Revolver Commitment, less than 66.66%
|
0.5%
|
1.5%
|
|||
|
III
|
less than 33.33% of the Revolver Commitment
|
0.75%
|
1.75%
|
|||
The Secured Revolving Line of Credit may be optionally prepaid or terminated and unutilized commitments may be reduced at any time, in each case without premium or penalty. In connection with the Secured Revolving Line of Credit, the Borrowers will pay an unused line fee equal to
0.25%
per annum payable monthly on the unused amount of the commitments under the
84
Secured Revolving Line of Credit. The Borrowers will pay (i) a monthly fee on all letters of credit outstanding under the Secured Revolving Line of Credit equal to the applicable LIBOR margin and (ii) a fronting fee to the Agent equal to
0.25%
of all such letters of credit payable monthly in arrears.
The Amended and Restated Loan Agreement contains covenants that place certain restrictions on the Loan Parties’ ability to, among other things, allow certain of the Company’s subsidiaries that manufacture or process inventory for the Loan Parties to borrow secured debt or unsecured debt beyond a certain amount, amend or modify certain terms of any debt of
$50 million
or more or subordinated debt, create or suffer to exist any liens upon accounts or inventory, sell or transfer any of Loan Parties’ accounts or inventory other than certain ordinary-course transfers and certain supply chain finance arrangements, make certain changes to any Loan Party’s name or form or state of organization without notifying the Agent, liquidate, dissolve, merge, amalgamate, combine or consolidate, or become a party to certain agreements restricting the Loan Parties’ ability to incur or repay debt, grant liens, make distributions, or modify loan agreements.
Further restrictions apply when certain payment conditions (the Payment Conditions) are not satisfied with respect to specified transactions, events or payments. The Payment Conditions include that (i) no default or event of default exists and (ii) at all times during the
45
consecutive days immediately prior to such transaction, event or payment and on a pro forma basis after giving effect to such transaction, event or payment and any incurrence or repayment of indebtedness in connection therewith, the Loan Parties’ Excess Cash Availability (as defined in the Amended and Restated Loan Agreement) is greater than the greater of
20%
of the total commitment amount and
$100 million
. Such restrictions limit the Loan Parties’ ability to, among other things, create any liens upon any of the Loan Parties’ property other than customary permitted liens and liens on up to
$1.5 billion
of secured credit facilities debt (which amount includes the Secured Revolving Line of Credit), declare or make cash distributions, create any encumbrance on the ability of a subsidiary to make any upstream payments, make asset dispositions other than certain ordinary course dispositions and certain supply chain finance arrangements, make certain loans, make payments with respect to subordinated debt or certain borrowed money prior to its due date or become a party to certain agreements restricting the Loan Parties’ ability to enter into any non-arm’s-length transaction with an affiliate.
The Loan Parties are required to repurchase, redeem, defease, repay, create a segregated account for the repayment of, or request Agent to reserve a sufficient available amount under the Secured Revolving Line of Credit for the repayment of, all debt for borrowed money exceeding
$50 million
by no later than 60 days prior to its maturity date (not including the Secured Revolving Line of Credit). Any reserved funds for this purpose would not be included in domestic cash calculations.
In addition, if at any time the Loan Parties’ Excess Cash Availability is less than the greater of
15%
of the total commitment amount and
$75 million
, the Loan Parties must maintain a minimum fixed charge coverage ratio of
1.00
to 1.00 until (i) no event of default exists and (ii) the Loan Parties’ Excess Cash Availability is greater than the greater of
15%
of the total commitment amount and
$75 million
for
45
consecutive days.
The events of default under the Amended and Restated Loan Agreement include, among other things, payment defaults, the inaccuracy of representations or warranties, defaults in the performance of affirmative and negative covenants, bankruptcy and insolvency related defaults, a cross-default related to indebtedness in an aggregate amount in excess of
$50 million
, judgments entered against a Loan Party in an amount that exceeds cumulatively
$50 million
, certain ERISA events and events related to Canadian defined benefits plans and a change of control. When a Payment Condition has not been satisfied, additional events of default include, among other things, a loss, theft damage or destruction with respect to any collateral if the amount not covered by insurance exceeds
$50 million
.
First Amendment to the Amended and Restated Loan and Security Agreement
On June 10, 2015, the Loan Parties entered into a first amendment to the Amended and Restated Loan and Security Agreement (the First Amendment) by and among the Loan Parties, the Lenders and the Agent, which modifies the Amended and Restated Loan and Security Agreement. Amendments to the Amended and Restated Loan Agreement effected by the First Amendment included the addition of exceptions to the liens and asset sale covenants to permit the Loan Parties to enter into certain supply chain finance arrangements, as well as the addition of certain definitions related thereto.
Second Amendment to the Amended and Restated Loan and Security Agreement
On April 29, 2016, the Loan Parties entered into a second amendment to the Amended and Restated Loan and Security Agreement (the Second Amendment) by and among the Loan Parties, the Lenders and the Agent, which modifies the Amended and Restated Loan and Security Agreement. The primary amendment to the Amended and Restated Loan Agreement effected by the Second Amendment related to the expansion of the definition of permitted asset dispositions to include the sale or transfer of inventory to the ATMP JV pursuant to the Equity Interest Purchase Agreement between AMD and TFME.
85
Third Amendment to the Amended and Restated Loan and Security Agreement
On June 21, 2016, the Loan Parties entered into a third amendment to the Amended and Restated Loan and Security Agreement (the Third Amendment) by and among the Loan Parties, the Lenders and the Agent, which modifies the Amended and Restated Loan and Security Agreement. Amendments to the Amended and Restated Loan Agreement effected by the Third Amendment included the further expansion of the asset sale covenants to permit the Loan Parties to enter into certain supply chain finance arrangements.
Fourth Amendment to the Amended and Restated Loan and Security Agreement
On September 7, 2016, the Loan Parties entered into a fourth amendment to the Amended and Restated Loan and Security Agreement (the Fourth Amendment) by and among the Loan Parties, the Lenders and the Agent, which modifies the Amended and Restated Loan and Security Agreement. The primary amendment to the Amended and Restated Loan agreement effected by the Fourth Amendment was to increase the dollar limit as set forth the definition related to certain supply chain finance arrangements.
Fifth Amendment to the Amended and Restated Loan and Security Agreement
On March 21, 2017, the Loan Parties entered into a fifth amendment to the Amended and Restated Loan Agreement (the Fifth Amendment) by and among the Loan Parties, the financial institutions party thereto from time to time as lenders and the Agent, which modifies the Amended and Restated Loan Agreement. The Fifth Amendment amends the Amended and Restated Loan Agreement by, among other things, extending the maturity date of the Secured Revolving Line of Credit from April 14, 2020 to March 21, 2022, reducing the Applicable Margin (as defined in the Amended and Restated Loan Agreement), reducing the commitment fee, lowering the minimum threshold of Availability (as defined in the Amended and Restated Loan Agreement) required to be maintained by the Company and AMDISS in order to avoid cash dominion, amending the borrowing base reporting requirement, amending maximum dollar limits related to supply chain finance arrangements, increasing the LC Facility Fees (as defined in the Amended and Restated Loan Agreement) and reducing the amount of the Secured Revolving Line of Credit available for the issuance for letters of credit from
$75 million
to
$45 million
.
The Amended and Restated Loan Agreement provides for a Secured Revolving Line of Credit for a principal amount up to
$500 million
with up to
$45 million
available for issuance of letters of credit. Borrowings under the Secured Revolving Line of Credit are limited to up to
85%
of eligible accounts receivable (
90%
for certain qualified eligible accounts receivable), minus specified reserves. The size of the commitments under the Secured Revolving Line of Credit may be increased by up to an aggregate amount of
$200 million
.
The Secured Revolving Line of Credit is secured by a first priority security interest in the Loan Parties’ accounts receivable, inventory, deposit accounts maintained with the Agent and other specified assets including books and records.
Sixth Amendment to the Amended and Restated Loan and Security Agreement
On September 19, 2017, the Loan Parties entered into a sixth amendment to the Amended and Restated Loan Agreement (the Sixth Amendment) by and among the Loan Parties, the financial institutions party thereto from time to time as lenders and the Agent, which modifies the Amended and Restated Loan Agreement. The Sixth Amendment amends the definition of the term “Qualified Factor Arrangement” to state that the amount held or owing or subject to repurchase is limited to (i) during the Company’s first fiscal quarter of each of its fiscal years,
$220 million
in the aggregate, (ii) during the Company’s second and third fiscal quarter of each of its fiscal years,
$300 million
in the aggregate, and (iii) (x) from the first day of the Company’s fourth fiscal quarter of each of its fiscal years to December 20 of each of its fiscal years,
$300 million
in the aggregate (provided, that not more than
$220 million
of such amount may consist of Qualified Factor Accounts (as defined in the Sixth Amendment) sold in such period) and (y) from December 21 of each of the Company’s fiscal years to and including the last day of the Company’s fourth fiscal quarter of each of its fiscal years,
$220 million
in the aggregate.
Seventh Amendment to the Amended and Restated Loan and Security Agreement
On November 14, 2017, the Loan Parties entered into a seventh amendment to the Amended and Restated Loan Agreement (the Seventh Amendment) by and among the Loan Parties, the financial institutions party thereto from time to time as lenders and the Agent, which modifies the Amended and Restated Loan Agreement. The Seventh Amendment amends the definition of the term “Qualified Factor Arrangement” to state that the amount held or owing to Qualified Factor or subject to repurchase shall not exceed
$300 million
in the aggregate at any time.
As of
December 30, 2017
, the Secured Revolving Line of Credit had an outstanding loan balance of
$70 million
at an interest rate of
4.75%
. As of
December 31, 2016
, the Company had repaid an aggregate of
$230 million
of the Secured Revolving Line
86
of Credit and had
no
borrowings outstanding. As of
December 30, 2017
, the Secured Revolving Line of Credit had
$19 million
related to outstanding letters of credit and up to
$92 million
available for future borrowings. The Company reports its intra-period changes in its revolving credit balance on a net basis in its condensed consolidated statement of cash flows as the Company intends the period of the borrowings to be brief, repaying borrowed amounts within 90 days. As of
December 30, 2017
, the Company was in compliance with all required covenants stated in the Loan Agreement.
The agreements governing the
6.75%
Notes,
7.50%
Notes,
7.00%
Notes,
2.125%
Notes and the Secured Revolving Line of Credit contain cross-default provisions whereby a default under one agreement would likely result in cross defaults under agreements covering other borrowings. The occurrence of a default under any of these borrowing arrangements would permit the applicable note holders or the lenders under the Secured Revolving Line of Credit to declare all amounts outstanding under those borrowing arrangements to be immediately due and payable.
Future Payments on Total Debt
As of
December 30, 2017
, the Company’s future debt payment obligations for the respective fiscal years were as follows:
|
Long Term Debt (Principal only)
|
|||
|
|
(In millions)
|
||
|
2018
|
$
|
—
|
|
|
2019
|
166
|
|
|
|
2020
|
—
|
|
|
|
2021
|
—
|
|
|
|
2022
|
347
|
|
|
|
2023 and thereafter
|
1,116
|
|
|
|
Total
|
$
|
1,629
|
|
The following table summarizes the components of Other income (expense), net:
|
2017
|
2016
|
2015
|
|||||||||
|
|
(In millions)
|
||||||||||
|
Interest income
|
$
|
6
|
|
$
|
2
|
|
$
|
—
|
|
||
|
Gain on sale of 85% ATMP JV
|
3
|
|
146
|
|
—
|
|
|||||
|
Loss on debt redemption
|
(12
|
)
|
(68
|
)
|
—
|
|
|||||
|
Other
|
(6
|
)
|
—
|
|
(5
|
)
|
|||||
|
Other income (expense), net
|
$
|
(9
|
)
|
$
|
80
|
|
$
|
(5
|
)
|
||
87
Management, including the Chief Operating Decision Maker, who is the Company’s Chief Executive Officer, reviews and assesses operating performance using segment net revenue and operating income (loss) before interest, other income (expense), net, income taxes and equity loss of investee. These performance measures include the allocation of expenses to the operating segments based on management’s judgment. The Company has the following
two
reportable segments:
|
•
|
the Computing and Graphics segment, which primarily includes desktop and notebook processors and chipsets, discrete and integrated graphics processing units (GPUs), professional GPUs and licensing portions of its IP portfolio; and
|
|
•
|
the Enterprise, Embedded and Semi-Custom segment, which primarily includes server and embedded processors, semi-custom System-on-Chip (SoC) products, development services, technology for game consoles and licensing portions of its IP portfolio.
|
In addition to these reportable segments, the Company has an All Other category, which is not a reportable segment. This category primarily includes certain expenses and credits that are not allocated to any of the reportable segments because management does not consider these expenses and credits in evaluating the performance of the reportable segments. Also included in this category are employee stock-based compensation expense, the charge related to the Sixth Amendment, restructuring and other special charges, net and amortization of acquired intangible assets. The Company also reported the results of former businesses in the All Other category because the operating results were not material.
The following table provides a summary of net revenue and operating income (loss) by segment for
2017
,
2016
and
2015
.
|
2017
|
2016
|
2015
|
|||||||||
|
|
(In millions)
|
||||||||||
|
Net revenue:
|
|||||||||||
|
Computing and Graphics
|
$
|
3,029
|
|
$
|
1,967
|
|
$
|
1,805
|
|
||
|
Enterprise, Embedded and Semi-Custom
|
2,300
|
|
2,305
|
|
2,186
|
|
|||||
|
Total net revenue
|
$
|
5,329
|
|
$
|
4,272
|
|
$
|
3,991
|
|
||
|
Operating income (loss):
|
|||||||||||
|
Computing and Graphics
|
$
|
147
|
|
$
|
(238
|
)
|
$
|
(502
|
)
|
||
|
Enterprise, Embedded and Semi-Custom
|
154
|
|
283
|
|
215
|
|
|||||
|
All Other
|
(97
|
)
|
(417
|
)
|
(194
|
)
|
|||||
|
Total operating income (loss)
|
$
|
204
|
|
$
|
(372
|
)
|
$
|
(481
|
)
|
||
The following table provides major items included in All Other category:
|
2017
|
2016
|
2015
|
|||||||||
|
|
(In millions)
|
||||||||||
|
Operating loss:
|
|
|
|||||||||
|
Stock-based compensation expense
|
$
|
(97
|
)
|
$
|
(86
|
)
|
$
|
(63
|
)
|
||
|
Restructuring and other special charges, net
|
—
|
|
10
|
|
(129
|
)
|
|||||
|
Amortization of acquired intangible assets
|
—
|
|
—
|
|
(3
|
)
|
|||||
|
Charge related to the Sixth Amendment to the WSA with GF
|
—
|
|
(340
|
)
|
—
|
|
|||||
|
Other
|
—
|
|
(1
|
)
|
1
|
|
|||||
|
Total operating loss
|
$
|
(97
|
)
|
$
|
(417
|
)
|
$
|
(194
|
)
|
||
The Company does not discretely allocate assets to its operating segments, nor does management evaluate operating segments using discrete asset information.
88
The Company’s operations outside the United States include research and development activities and sales, marketing and administrative activities. The Company conducts product and system research and development activities for its products in the United States with additional design and development engineering teams located in China, Canada, India, Singapore, Australia and Taiwan. The Company’s ATMP facilities located in Malaysia and China were sold in the second quarter of 2016 (see Note 4: Equity Interest Agreement - ATMP Joint Venture). The Company’s material sales and marketing offices are located in the United States, Latin America, Europe and Asia.
The following table summarizes sales to external customers by geographic regions based on billing location of the customer:
|
2017
|
2016
|
2015
|
|||||||||
|
|
(In millions)
|
||||||||||
|
United States
|
$
|
1,364
|
|
$
|
923
|
|
$
|
984
|
|
||
|
Europe
|
263
|
|
155
|
|
168
|
|
|||||
|
China (including Taiwan)
|
1,747
|
|
1,108
|
|
1,145
|
|
|||||
|
Singapore
|
551
|
|
571
|
|
356
|
|
|||||
|
Japan
|
1,242
|
|
1,443
|
|
1,254
|
|
|||||
|
Other countries
|
162
|
|
72
|
|
84
|
|
|||||
|
Total sales to external customers
|
$
|
5,329
|
|
$
|
4,272
|
|
$
|
3,991
|
|
||
The following table summarizes
long-lived assets by geographic areas:
|
2017
|
2016
|
||||||
|
|
(In millions)
|
||||||
|
United States
|
$
|
200
|
|
$
|
104
|
|
|
|
Malaysia
|
5
|
|
9
|
|
|||
|
China
|
7
|
|
7
|
|
|||
|
Singapore
|
22
|
|
24
|
|
|||
|
Other countries
|
27
|
|
20
|
|
|||
|
Total long-lived assets
|
$
|
261
|
|
$
|
164
|
|
|
The following table summarizes sales to major customers that accounted for at least
10%
of the Company’s consolidated net revenue for the respective years:
|
2017
|
2016
|
2015
|
||||||
|
Customer A
|
23
|
%
|
33
|
%
|
31
|
%
|
||
|
Customer B
|
15
|
%
|
16
|
%
|
18
|
%
|
||
|
Customer C
|
6
|
%
|
10
|
%
|
8
|
%
|
||
Sales to customers A and B consisted of products from the Company's Enterprise, Embedded and Semi-Custom segment and sales to customer C consisted primarily of products from the Company's Computing and Graphics segment.
Common Stock
During the third quarter of 2016, the Company completed its registered underwritten public offering of
115 million
shares of the Company’s common stock, par value
$0.01
per share, at a public offering price of
$6.00
per share pursuant to an underwriting agreement with J.P. Morgan Securities LLC, Barclays Capital Inc. and Credit Suisse Securities (USA) LLC as representatives of the several underwriters named therein. The resulting aggregate net proceeds to the Company from the common stock offering were approximately
$667 million
, after deducting underwriting discounts and offering expenses totaling approximately
$23 million
.
Stock-Based Incentive Compensation Plans
The Company’s stock-based incentive programs are intended to attract, retain and motivate highly qualified employees. On April 29, 2004, the Company’s stockholders approved the 2004 Equity Incentive Plan (the 2004 Plan). Shares reserved for future grants under the Company’s prior equity compensation plans were consolidated into the 2004 Plan.
89
Under the 2004 Plan, stock options generally vest and become exercisable over a
three
-year period from the date of grant and expire within
ten
years after the grant date. Unvested shares that are reacquired by the Company from forfeited outstanding equity awards become available for grant and may be reissued as new awards.
Under the 2004 Plan, the Company can grant fair market value awards or full value awards. Fair market value awards are awards granted at or above the fair market value of the Company’s common stock on the date of grant. Full value awards are awards granted at less than the fair market value of the Company’s common stock on the date of grant. Awards can consist of (i) stock options granted at the fair market value of the Company’s common stock on the date of grant and (ii) restricted stock units as full value awards. The following is a description of the material terms of the awards that may be granted under the 2004 Plan.
Stock Options.
A stock option is the right to purchase shares of the Company’s common stock at a fixed exercise price for a fixed period of time. Under the 2004 Plan, nonstatutory and incentive stock options may be granted. The exercise price of the shares subject to each nonstatutory stock option and incentive stock option cannot be less than
100%
of the fair market value of the Company’s common stock on the date of the grant. The exercise price of each option granted under the 2004 Plan must be paid in full at the time of the exercise.
Restricted Stock Units.
Restricted stock units (RSUs) are awards that can be granted to any employee, director or consultant and that obligate the Company to issue a specific number of shares of the Company’s common stock in the future if the vesting terms and conditions are satisfied. The purchase price for the shares is
$0.00
per share.
Performance-based Restricted Stock Units.
Performance-based Restricted Stock Units (PRSUs) can be granted to certain of the Company’s senior executives. The performance metrics can be financial performance, non-financial performance and/or market condition. Each PRSU award reflects a target number of shares (Target Shares) that may be issued to an award recipient before adjusting based on the Company’s financial performance, non-financial performance and/or market conditions. The actual number of shares that a grant recipient receives at the end of the period may range from
0%
to
250%
of the Target Shares granted, depending upon the degree of achievement of the performance target designated by each individual award.
Employee Stock Purchase Plan.
The Company has introduced the Employee Stock Purchase Plan (ESPP) in the fourth quarter of 2017. Under the ESPP, eligible employees who participate in an offering period may have up to
10%
of their earnings withheld, up to certain limitations, to purchase shares of common stock at
85%
of the lower of the fair market value on the first or the last business day of the
six
-month offering period. The offering periods commence in November and May of each year with the first offering period under the ESPP commencing in November 2017.
As of
December 30, 2017
, the Company had
49 million
shares of common stock that were available for future grants and
52 million
shares reserved for issuance upon the exercise of outstanding stock options or the vesting of unvested restricted stock units. In addition, the Company had
50 million
shares of common stock that were available for issuance under the ESPP.
Stock options, RSUs and PRSUs granted after April 29, 2015, generally may not vest in less than one year following the date of grant.
Valuation and Expense Information
Stock-based compensation expense related to employee stock options, restricted stock units, including PRSUs and the ESPP, was allocated in the consolidated statements of operations as follows:
|
2017
|
2016
|
2015
|
|||||||||
|
|
(In millions)
|
||||||||||
|
Cost of sales
|
$
|
2
|
|
$
|
2
|
|
$
|
3
|
|
||
|
Research and development
|
57
|
|
49
|
|
36
|
|
|||||
|
Marketing, general, and administrative
|
38
|
|
35
|
|
24
|
|
|||||
|
Total stock-based compensation expense, net of tax of $0
|
$
|
97
|
|
$
|
86
|
|
$
|
63
|
|
||
During
2017
, the Company did
no
t realize any excess tax benefits related to stock-based compensation and therefore the Company did not record any effects relating to operating cash flows. During
2016
and
2015
, the Company did
no
t realize any excess tax benefits related to stock-based compensation and therefore the Company did not record any effects relating to financing cash flows. The Company did not capitalize stock-based compensation cost as part of the cost of an asset because the cost was immaterial.
Stock Options.
The Company uses the lattice-binomial model in determining the fair value of the employee stock options.
90
The weighted-average estimated fair value of employee stock options granted for the years ended
December 30, 2017
,
December 31, 2016
and
December 26, 2015
was
$5.46
,
$3.10
and
$1.02
per share, respectively, using the following weighted-average assumptions:
|
2017
|
2016
|
2015
|
||||||
|
Expected volatility
|
57.26
|
%
|
62.33
|
%
|
60.14
|
%
|
||
|
Risk-free interest rate
|
1.68
|
%
|
1.02
|
%
|
1.29
|
%
|
||
|
Expected dividends
|
—
|
%
|
—
|
%
|
—
|
%
|
||
|
Expected life (in years)
|
3.92
|
|
3.98
|
|
3.91
|
|
||
The Company uses a combination of the historical volatility of its common stock and the implied volatility for publicly traded options on the Company’s common stock as the expected volatility assumption required by the lattice-binomial model. The risk-free interest rate is based on the rate for a U.S. Treasury zero-coupon yield curve with a term that approximates the expected life of the option grant at the date closest to the option grant date. The expected dividend yield is
zero
as the Company does not expect to pay dividends in the future. The expected term of employee stock options represents the weighted-average period the stock options are expected to remain outstanding and is a derived output of the lattice-binomial model.
The following table summarizes stock option activity and related information:
|
|
2017
|
2016
|
2015
|
|||||||||||||||||
|
|
Number
of Shares
|
Weighted-
Average
Exercise
Price
|
Number
of Shares
|
Weighted-
Average
Exercise
Price
|
Number
of Shares
|
Weighted-
Average
Exercise
Price
|
||||||||||||||
|
|
(In millions, except share price)
|
|||||||||||||||||||
|
Stock options:
|
||||||||||||||||||||
|
Outstanding at beginning of year
|
20
|
|
$
|
4.15
|
|
32
|
|
$
|
4.44
|
|
36
|
|
$
|
4.78
|
|
|||||
|
Granted
|
1
|
|
$
|
12.83
|
|
2
|
|
$
|
6.98
|
|
8
|
|
$
|
2.12
|
|
|||||
|
Canceled
|
—
|
|
*
|
$
|
7.69
|
|
(9
|
)
|
$
|
5.53
|
|
(9
|
)
|
$
|
4.91
|
|
||||
|
Exercised
|
(4
|
)
|
$
|
5.19
|
|
(5
|
)
|
$
|
4.75
|
|
(3
|
)
|
$
|
1.61
|
|
|||||
|
Outstanding at end of year
|
17
|
|
$
|
4.32
|
|
20
|
|
$
|
4.15
|
|
32
|
|
$
|
4.44
|
|
|||||
|
Exercisable at end of year
|
13
|
|
$
|
3.82
|
|
13
|
|
$
|
4.32
|
|
21
|
|
$
|
5.34
|
|
|||||
*: Less than
1 million
shares.
As of
December 30, 2017
, the weighted-average remaining contractual life of outstanding stock options was
3.75 years
and their aggregate intrinsic value was
$104 million
. As of
December 30, 2017
, the weighted-average remaining contractual life of exercisable stock options was
3.30 years
and their aggregate intrinsic value was
$87 million
. The total intrinsic value of stock options exercised for
2017
,
2016
and
2015
was
$27 million
,
$10 million
and
$2 million
, respectively.
As of
December 30, 2017
, the Company had
$9 million
of total unrecognized compensation expense related to stock options that will be recognized over the weighted-average period of
1.43 years
.
RSUs.
RSUs vest in accordance with the terms and conditions established by the Compensation and Leadership Resources Committee of the Board of Directors, and are based either on continued service or continued service and performance. The cost of RSUs is determined using the fair value of the Company’s common stock on the date of the grant, and the compensation expense is recognized over the service period.
91
The summary of the changes in RSUs outstanding, including the PRSUs, during
2017
,
2016
and
2015
is presented below:
|
|
2017
|
2016
|
2015
|
|||||||||||||||||
|
|
Number
of Shares
|
Weighted-
Average
Fair Value
|
Number
of Shares
|
Weighted-
Average
Fair Value
|
Number
of Shares
|
Weighted-
Average
Fair Value
|
||||||||||||||
|
|
(In millions except share price)
|
|||||||||||||||||||
|
Unvested balance at beginning of period
|
52
|
|
$
|
3.73
|
|
51
|
|
$
|
2.61
|
|
43
|
|
$
|
4.05
|
|
|||||
|
Granted
|
12
|
|
$
|
11.63
|
|
29
|
|
$
|
4.72
|
|
38
|
|
$
|
2.03
|
|
|||||
|
Forfeited
|
(3
|
)
|
$
|
5.83
|
|
(5
|
)
|
$
|
2.95
|
|
(15
|
)
|
$
|
3.71
|
|
|||||
|
Vested
|
(26
|
)
|
$
|
3.81
|
|
(23
|
)
|
$
|
2.56
|
|
(15
|
)
|
$
|
4.13
|
|
|||||
|
Unvested balance at end of period
|
35
|
|
$
|
6.60
|
|
52
|
|
$
|
3.73
|
|
51
|
|
$
|
2.61
|
|
|||||
The total fair value of RSUs vested during
2017
,
2016
and
2015
was
$328 million
,
$151 million
and
$33 million
, respectively. Compensation expense recognized for the RSUs for
2017
,
2016
and
2015
was approximately
$93 million
,
$80 million
and
$57 million
, respectively.
As of
December 30, 2017
, the Company had
$184 million
of total unrecognized compensation expense related to RSUs that will be recognized over the weighted-average period of
1.55 years
.
PRSUs.
The Company estimated the fair value for the PRSUs with a market condition using the Monte Carlo simulation model on the date of grant. During
2017
,
2016
and
2015
, the Company granted
0.8 million
,
2.0 million
and
3.9 million
, respectively, PRSUs with a market condition to certain of the Company's senior executives. The weighted-average grant date fair values of the
2017
and
2016
PRSUs were
$17.18
and
$9.00
, respectively. The weighted-average date fair values of the two grants in
2015
were
$0.85
and
$0.91
per share, using the following assumptions:
|
2017
|
2016
|
2015
|
||||||
|
Stock price at valuation date
|
$12.83
|
$5.14
|
$1.85 - $1.99
|
|
||||
|
Expected volatility
|
64.39
|
%
|
57.83
|
%
|
48.88% - 51.69%
|
|
||
|
Risk-free interest rate
|
1.50
|
%
|
0.88
|
%
|
1.08% - 1.12%
|
|
||
|
Expected dividends
|
—
|
%
|
—
|
%
|
—
|
%
|
||
|
Expected term (in years)
|
3.0
|
|
3.07
|
|
2.76 - 3.0
|
|
||
The summary of the changes in the PRSUs during
2017
,
2016
and
2015
is presented below.
|
|
2017
|
2016
|
2015
|
|||||
|
|
(Shares in millions)
|
|||||||
|
Unvested shares at beginning of period
|
5
|
|
7
|
|
9
|
|
||
|
Granted
|
2
|
|
5
|
|
5
|
|
||
|
Forfeited
|
(1
|
)
|
(2
|
)
|
(7
|
)
|
||
|
Vested
|
(3
|
)
|
(5
|
)
|
—
|
|
||
|
Unvested shares at end of period
|
3
|
|
5
|
|
7
|
|
||
ESPP.
The Company uses the Black-Scholes model in determining the fair value of ESPP. The weighted-average grant date fair value for the ESPP during fiscal
2017
was
$3.46
per share using the following assumptions:
|
2017
|
||
|
Expected volatility
|
56.07
|
%
|
|
Risk-free interest rate
|
1.36
|
%
|
|
Expected dividends
|
—
|
%
|
|
Expected term (in years)
|
0.49
|
|
|
Forfeiture rate
|
7.8
|
%
|
The Company recognized
$2.3 million
of stock-based compensation expense in
2017
related to the ESPP.
92
The Company has a retirement savings plan, commonly known as a 401(k) plan, that allows participating employees in the United States to contribute up to
100%
of their pre-tax salary subject to Internal Revenue Service limits. The Company matched
75%
of employees’ contributions up to
6%
of their compensation to a maximum per employee match of
$12,150
,
$11,925
and
$11,925
for
2017
,
2016
and
2015
, respectively. The Company’s contributions to the 401(k) plan for
2017
,
2016
and
2015
were approximately
$18 million
,
$16 million
and
$16 million
, respectively.
Operating Leases
As of
December 30, 2017
, the Company’s future non-cancellable operating lease commitments were as follows:
|
Year
|
Operating
leases
|
||
|
|
(In millions)
|
||
|
2018
|
$
|
40
|
|
|
2019
|
35
|
|
|
|
2020
|
31
|
|
|
|
2021
|
29
|
|
|
|
2022
|
28
|
|
|
|
2023 and thereafter
|
92
|
|
|
|
Total non-cancellable operating lease commitments
|
$
|
255
|
|
The Company leases certain of its facilities and in some jurisdictions the Company leases the land on which these facilities are built under non-cancellable lease agreements that expire at various dates through 2028. The Company also leases certain manufacturing and office equipment for terms ranging from
one
to
five
years. Rent expense for
2017
,
2016
and
2015
was
$44 million
,
$39 million
and
$47 million
, respectively.
In December 1998, the Company arranged for the sale of its marketing, general and administrative facility in Sunnyvale, California and leased it back for a period of
20
years. The Company recorded a deferred gain of
$37 million
on the sale and is amortizing it over the life of the lease. During the second quarter of 2016, the Company signed an amendment to the lease agreement associated with this facility in Sunnyvale, California so that the lease expired in December 2017. In connection with the amendment, the lease payments were reduced for 2017. During the third quarter of 2016, the Company entered into a
10
-year operating lease to occupy
220,000
square feet of new office space in Santa Clara. The base rent obligation commenced in August 2017. As of
December 30, 2017
, the total estimate of future base rent payments over the life of the lease was approximately
$103 million
. In addition to the base rent payments, the Company will be obligated to pay certain customary amounts for its share of operating expenses and tax obligation. The Company has the option to extend the term of the lease for
two
additional
five
-year periods.
In September 2013, the Company sold a light industrial building in Singapore and leased back a portion of the original space. The Company recorded a deferred gain of
$14 million
on the sale and is amortizing it over the initial lease term. The initial operating lease term expires in September, 2023 and provides for options to extend the lease for
4
years at the end of the initial lease term and for an additional
3.5
years thereafter.
Certain other operating leases contain provisions for escalating lease payments subject to changes in the consumer price index. Total future lease obligations as of
December 30, 2017
were
$255 million
.
Purchase and Other Contractual Obligations
The Company’s purchase obligations primarily include the Company’s obligations to purchase wafers and substrates from third parties. As of
December 30, 2017
, total non-cancellable purchase obligations excluding the Company’s wafer purchase commitments to GF under the WSA were
$406 million
.
The Company also had other contractual obligations, primarily included in Other long-term liabilities and Accrued liabilities on its consolidated balance sheet, which primarily consisted of
$107 million
of payments due under certain software and technology licenses and IP licenses that will be paid through 2021.
93
Future unconditional purchase obligations as of
December 30, 2017
were as follows:
|
Year
|
Unconditional purchase obligations
|
||
|
|
(In millions)
|
||
|
2018
|
$
|
346
|
|
|
2019
|
65
|
|
|
|
2020
|
40
|
|
|
|
2021
|
33
|
|
|
|
2022
|
29
|
|
|
|
2023 and thereafter
|
—
|
|
|
|
Total unconditional purchase commitments
|
$
|
513
|
|
Obligations to GF
As of
December 30, 2017
, the Company's minimum purchase obligations for wafer purchases for the years
2018
through 2020 are approximately
$2.8 billion
.
Warranties and Indemnities
The Company generally warrants that its products sold to its customers will conform to the Company’s approved specifications and be free from defects in material and workmanship under normal use and conditions for
one
year. Subject to certain exceptions, the Company also offers a
three
-year limited warranty to end users for those CPU and APU products purchased as individually packaged products, commonly referred to as “processors in a box”, and for PC workstation products. The Company also offered extended limited warranties to certain customers of “tray” microprocessor products and/or workstation graphics or server products who have written agreements with the Company and target their computer systems at the commercial and/or embedded markets.
Changes in the Company’s estimated liability for product warranty during the years ended
December 30, 2017
and
December 31, 2016
are as follows:
|
December 30,
2017 |
December 31,
2016 |
||||||
|
|
(In millions)
|
||||||
|
Beginning balance
|
$
|
12
|
|
$
|
15
|
|
|
|
New warranties issued during the period
|
25
|
|
21
|
|
|||
|
Settlements during the period
|
(21
|
)
|
(19
|
)
|
|||
|
Changes in liability for pre-existing warranties during the period, including expirations
|
(4
|
)
|
(5
|
)
|
|||
|
Ending balance
|
$
|
12
|
|
$
|
12
|
|
|
In addition to product warranties, the Company from time to time in its normal course of business indemnifies other parties with whom it enters into contractual relationships, including customers, lessors and parties to other transactions with the Company, with respect to certain matters. In these limited matters, the Company has agreed to hold certain third parties harmless against specific types of claims or losses such as those arising from a breach of representations or covenants, third-party claims that the Company’s products when used for their intended purpose(s) and under specific conditions infringe the intellectual property rights of a third party, or other specified claims made against the indemnified party. It is not possible to determine the maximum potential amount of liability under these indemnification obligations due to the unique facts and circumstances that are likely to be involved in each particular claim and indemnification provision. Historically, payments made by the Company under these obligations have not been material.
94
Hatamian Securities Litigation
On January 15, 2014, a class action lawsuit captioned
Hatamian v. AMD, et al.
, C.A. No. 3:14-cv-00226 (the Hatamian Lawsuit) was filed against the Company in the United States District Court for the Northern District of California. The complaint purports to assert claims against the Company and certain individual officers for alleged violations of Section 10(b) of the Securities Exchange Act of 1934, as amended (the Exchange Act), and Rule 10b-5 of the Exchange Act. The plaintiffs seek to represent a proposed class of all persons who purchased or otherwise acquired our common stock during the period April 4, 2011 through October 18, 2012. The complaint seeks damages allegedly caused by alleged materially misleading statements and/or material omissions by the Company and the individual officers regarding its 32nm technology and “Llano” product, which statements and omissions, the plaintiffs claim, allegedly operated to artificially inflate the price paid for the Company’s common stock during the period. The complaint seeks unspecified compensatory damages, attorneys’ fees and costs. On July 7, 2014, the Company filed a motion to dismiss plaintiffs’ claims. On March 31, 2015, the Court denied the motion to dismiss. On May 14, 2015, the Company filed its answer to plaintiffs’ corrected amended complaint. On September 4, 2015, plaintiffs filed their motion for class certification, and on March 16, 2016, the Court granted plaintiffs' motion. A court-ordered mediation held in January 2016 did not result in a settlement of the lawsuit. The discovery process was concluded. The plaintiffs and defendants filed cross-motions for summary judgment, and briefing on those motions was completed in July 2017. On October 9, 2017, the parties signed a definitive settlement agreement resolving this matter and submitted it to the Court for approval. Under the terms of this agreement, the settlement will be funded entirely by certain of the Company's insurance carriers and the defendants will continue to deny any liability or wrongdoing. The final settlement hearing is scheduled for February 27, 2018.
Based upon information presently known to management, the Company believes that the potential liability, if any, will not have a material adverse effect on its financial condition, cash flows or results of operations.
Shareholder Derivative Lawsuit
On March 20, 2014, a purported shareholder derivative lawsuit captioned
Wessels v. Read, et al.
, Case No. 1:14-cv-262486 (Wessels) was filed against the Company (as a nominal defendant only) and certain of the Company’s directors and officers in the Santa Clara County Superior Court of the State of California. The complaint purports to assert claims against the Company and certain individual directors and officers for breach of fiduciary duty, waste of corporate assets and unjust enrichment. The complaint seeks damages allegedly caused by alleged materially misleading statements and/or material omissions by the Company and the individual directors and officers regarding its 32nm technology and “Llano” product, which statements and omissions, the plaintiffs claim, allegedly operated to artificially inflate the price paid for the Company’s common stock during the period. On April 27, 2015, a similar purported shareholder derivative lawsuit captioned
Christopher Hamilton and David Hamilton v. Barnes, et al.
, Case No. 5:15-cv-01890 (Hamilton) was filed against the Company (as a nominal defendant only) and certain of the Company’s directors and officers in the United States District Court for the Northern District of California. The case was transferred to the judge handling the Hatamian Lawsuit and is now Case No. 4:15-cv-01890.
On September 29, 2015, a similar purported shareholder derivative lawsuit captioned
Jake Ha v Caldwell, et al.,
Case No. 3:15-cv-04485 (Ha) was filed against the Company (as a nominal defendant only) and certain of its directors and officers in the United States District Court for the Northern District of California. The lawsuit also seeks a court order voiding the shareholder vote on AMD’s 2015 proxy. The case was transferred to the judge handling the Hatamian Lawsuit and is now Case No. 4:15-cv-04485. The Wessels, Hamilton, and Ha shareholder derivative lawsuits were stayed pending resolution of the Hatamian Lawsuit. On January 30, 2018, the Wessels and Hamilton plaintiffs amended their complaints. On February 2, 2018, the Ha plaintiff filed his amended complaint. On February 22, 2018, the Company filed motions to dismiss the Hamilton and Ha plaintiffs’ amended complaints.
Based upon information presently known to management, the Company believes that the potential liability, if any, will not have a material adverse effect on its financial condition, cash flows or results of operations.
95
Dickey Litigation
On October 26, 2015, a putative class action complaint captioned
Dickey et al. v. AMD
, No. 15-cv-04922 was filed against the Company in the United States District Court for the Northern District of California. Plaintiffs allege that the Company misled consumers by using the term "eight cores" in connection with the marketing of certain AMD FX CPUs that are based on the Company's “Bulldozer” core architecture. The plaintiffs allege these products cannot perform eight calculations simultaneously, without restriction. The plaintiffs seek to obtain damages under several causes of action for a nationwide class of consumers who allegedly were deceived into purchasing certain Bulldozer-based CPUs that were marketed as containing eight cores. The plaintiffs also seek attorneys' fees. On December 21, 2015, the Company filed a motion to dismiss the complaint, which was granted on April 7, 2016. The plaintiffs then filed an amended complaint with a narrowed putative class definition, which the Court dismissed upon the Company's motion on October 31, 2016. The plaintiffs subsequently filed a second amended complaint, and the Company filed a motion to dismiss the second amended complaint. On June 14, 2017, the Court issued an order granting in part and denying in part the Company's motion to dismiss, and allowing the plaintiffs to move forward with a portion of their complaint. Discovery is underway. The putative class definition does not encompass the Company's Ryzen
TM
or EPYC
TM
processors.
Based upon information presently known to management, the Company believes that the potential liability, if any, will not have a material adverse effect on its financial condition, cash flows or results of operations.
Kim Securities Litigation
On January 16, 2018, a putative class action lawsuit captioned
Kim et al. v. AMD, et al.
, Case No. 3:18-cv-00321 was filed against the Company in the United States District Court for the Northern District of California. The complaint purports to assert claims against the Company and certain individual officers for alleged violations of Sections 10(b) and 20(a) of the Exchange Act, and Rule 10b-5 of the Exchange Act. The plaintiff seeks to represent a proposed class of all persons who purchased or otherwise acquired the Company's common stock during the period February 21, 2017 through January 11, 2018. The complaint seeks damages allegedly caused by alleged materially misleading statements and/or material omissions by the Company and the individual officers regarding a security vulnerability (Spectre), which statements and omissions, the plaintiff claims, allegedly caused the Company's common stock price to be artificially inflated during the purported class period. The complaint seeks unspecified compensatory damages, attorneys’ fees and costs.
Based upon information presently known to management, the Company believes that the potential liability, if any, will not have a material adverse effect on its financial condition, cash flows or results of operations.
Hauck Litigation
On January 19, 2018, a putative class action complaint captioned
Diana Hauck et al. v. AMD, Inc.,
Case No. 5:18-cv-0047 was filed against the Company in the United States District Court for the Northern District of California. The plaintiff alleges that the Company misled consumers in connection with the marketing of AMD processors. Specifically, the plaintiff alleges that the Company's processors cannot perform at their advertised processing speeds without exposing consumers to the Spectre security vulnerability. The plaintiff seeks to obtain damages under several causes of action for a nationwide class of consumers who allegedly were misled into purchasing or leasing AMD processors (and devices containing AMD processors), as well as attorneys’ fees, punitive damages, and restitution.
Based upon information presently known to management, the Company believes that the potential liability, if any, will not have a material adverse effect on its financial condition, cash flows or results of operations.
Speck Litigation
On February 4, 2018, a putative class action complaint captioned
Brian Speck et al. v. AMD, Inc.
, Case No. 5:18-cv-0744 was filed against the Company in the United States District Court for the Northern District of California. The plaintiff alleges that the Company misled consumers in connection with the design and marketing of AMD processors. Specifically, the plaintiff alleges that the Company's processors are subject to the Spectre security vulnerability, and that any "patches" to remedy this security vulnerability will result in degradation of processor performance. The plaintiff seeks to obtain damages under several causes of action for a nationwide class of consumers and a subclass of Ohio residents who allegedly were misled into purchasing AMD processors (and devices containing AMD processors), as well as attorneys' fees, equitable relief, and restitution.
Based upon information presently known to management, the Company believes that the potential liability, if any, will not have a material adverse effect on its financial condition, cash flows or results of operations.
96
Barnes and Caskey-Medina Litigation
On February 9, 2018, a putative class action complaint captioned
Nathan Barnes and Jonathan Caskey-Medina, et al. v. AMD, Inc.
, Case No. 5:18-cv-00883, was filed against the Company in the United States District Court for the Northern District of California. The plaintiffs allege that the Company misled consumers in connection with the marketing of AMD processors. Specifically, the plaintiffs allege that the Company touted the speed and reliability of its processors even though these processors are subject to the Spectre security vulnerability. The plaintiffs seek to obtain damages under several causes of action for a nationwide class of consumers who allegedly were misled into purchasing or leasing AMD processors (and devices containing AMD processors), as well as attorneys' fees, equitable relief, and restitution.
Based upon information presently known to management, the Company believes that the potential liability, if any, will not have a material adverse effect on its financial condition, cash flows or results of operations.
Environmental Matters
The Company is named as a responsible party on Superfund clean-up orders for
three
sites in Sunnyvale, California that are on the National Priorities List. Since 1981, the Company has discovered hazardous material releases to the groundwater from former underground tanks and proceeded to investigate and conduct remediation at these
three
sites. The chemicals released into the groundwater were commonly used in the semiconductor industry in the United States in the wafer fabrication process prior to 1979.
In 1991, the Company received Final Site Clean-up Requirements Orders from the California Regional Water Quality Control Board relating to the
three
sites. The Company has entered into settlement agreements with other responsible parties on two of the orders. During the term of such agreements, other parties have agreed to assume most of the foreseeable costs as well as the primary role in conducting remediation activities under the orders. The Company remains responsible for additional costs beyond the scope of the agreements as well as all remaining costs in the event that the other parties do not fulfill their obligations under the settlement agreements.
To address anticipated future remediation costs under the orders, the Company has computed and recorded an estimated environmental liability of approximately
$3 million
and has not recorded any potential insurance recoveries in determining the estimated costs of the cleanup. The progress of future remediation efforts cannot be predicted with certainty and these costs may change. The Company believes that any amount in addition to what has already been accrued would not be material.
Other Legal Matters
The Company is a defendant or plaintiff in various actions that arose in the normal course of business. With respect to these matters, based on the management’s current knowledge, the Company believes that the amount or range of reasonably possible loss, if any, will not, either individually or in the aggregate, have a material adverse effect on the Company’s financial position, results of operations, or cash flows.
2015 Restructuring Plan
In the third quarter of 2015, the Company implemented a restructuring plan (2015 Restructuring Plan) focused on its ongoing efforts to simplify its business and better align resources around its priorities and business outlook. The 2015 Restructuring Plan involved a reduction of global headcount by approximately
5%
and included organizational actions such as outsourcing certain IT services and application development. During 2015, the Company recorded a
$37 million
restructuring charge, which consisted of
$27 million
for severance and benefit costs,
$1 million
for facilities-related costs and
$9 million
for intangible asset-related charges. The actions associated with the 2015 Restructuring Plan were completed during the first quarter of 2017. The liabilities related to the 2015 Restructuring Plan recorded in Other current liabilities and Other long-term liabilities on the Company's consolidated balance sheets as of
December 30, 2017
and
December 31, 2016
were
zero
and
$3 million
, respectively.
2014 Restructuring Plan
In the fourth quarter of 2014, the Company implemented a restructuring plan (2014 Restructuring Plan) designed to improve operating efficiencies. The 2014 Restructuring Plan involved a reduction of global headcount by approximately
6%
and an alignment of its real estate footprint with its reduced headcount. The Company recorded a
$57 million
restructuring charge in the fourth quarter of 2014, which consisted of
$44 million
for severance and costs related to the continuation of certain employee benefits,
$6 million
for contract or program termination costs,
$1 million
for facilities-related costs and
$6 million
for asset impairments, a non-cash charge. During 2015, the Company recorded a
$16 million
restructuring charge which consisted of
$5 million
non-cash charge related to asset impairments,
$2 million
for severance and related benefits and
$9 million
for facilities-related costs.
97
The 2014 Restructuring Plan was completed during the third quarter of 2015. The liabilities related to the 2014 Restructuring Plan recorded in Other current liabilities and Other long-term liabilities on the Company's consolidated balance sheets as of
December 30, 2017
and
December 31, 2016
were
zero
and
$4 million
, respectively.
Dense Server Systems Business Exit
As a part of the Company’s strategy to simplify and sharpen its investment focus, the Company exited the dense server systems business, formerly SeaMicro, in the first quarter of 2015. As a result, the Company recorded a charge of
$76 million
in Restructuring and other special charges, net on the Company’s consolidated statements of operations during 2015. This charge consisted of an impairment charge of
$62 million
related to the acquired intangible assets. The Company concluded that the carrying value of the acquired intangible assets associated with its dense server systems business was fully impaired as the Company did not have plans to utilize the related freedom fabric technology in any of its future products nor did it have any plans at that time to monetize the associated intellectual property. In addition, the exit charge consisted of a
$7 million
non-cash charge related to asset impairments,
$4 million
of severance and related benefits and
$3 million
for contract or program termination costs. The Company substantially completed this exit activity during the second quarter of 2016.
As discussed in Note 2, the Company elected to adopt ASC 606, using the full retrospective method, which requires retrospective application of the standard to prior reporting periods. The most significant impacts of the adoption of ASC 606 to the Company relate to (1) the acceleration of revenue recognition for sales of custom products subject to a non-cancellable customer purchase order, (2) the acceleration of revenue recognition for sales to distributors, and (3) the timing and financial statement classification of certain development and intellectual property licensing agreements.
Custom products which are associated with the Company’s Enterprise, Embedded, and Semi-Custom segment (semi-custom products), under non-cancellable purchases orders, which are manufactured to customers’ specifications, and cannot be re-sold to another customer, will be recognized as revenue, based on the value of the inventory and expected margin, over the time of production of the products by the Company, rather than upon shipment. Revenue from sales to the Company's distributors will be recognized as revenue upon shipment of the product to the distributors (sell-in), instead of the current revenue recognition upon reported resale of the product by the distributors to their customers (sell-through). For a development and intellectual property licensing agreement executed in 2017, the Company will recognize revenue for the entire consideration upon transfer of control of the intellectual property (IP) license to the customer in a future period. Previously, the agreement resulted in the reduction to research and development expenses in 2017 for development work as the expenses were incurred and would have resulted in licensing revenue to be recognized in periods beyond 2017 upon completion of the deliverables, based on a fair value allocation of the consideration received. Revenue recognition related to the Company’s other revenue streams will remain substantially unchanged.
The adoption of the new standard has an impact on the Company’s Consolidated Statements of Operations and Consolidated Balance Sheets, but has no impact on cash provided by or used in operating, financing, or investing activities on the Consolidated Statements of Cash Flows.
98
The impact on the Company’s 2017 and 2016 Consolidated Statement of Operations as a result of the adoption of the new standard is as follows:
|
|
Year Ended
|
||||||||||||||||||||||
|
|
December 30,
2017 |
December 31,
2016 |
|||||||||||||||||||||
|
As reported
|
Adjustment
|
As adjusted
|
As reported
|
Adjustment
|
As adjusted
|
||||||||||||||||||
|
|
(In millions, except per share amounts)
|
||||||||||||||||||||||
|
Net revenue
(1)
|
$
|
5,329
|
|
$
|
(76
|
)
|
$
|
5,253
|
|
$
|
4,272
|
|
$
|
47
|
|
$
|
4,319
|
|
|||||
|
Cost of sales
(1)
|
3,506
|
|
(40
|
)
|
3,466
|
|
3,274
|
|
42
|
|
3,316
|
|
|||||||||||
|
Gross margin
|
1,823
|
|
(36
|
)
|
1,787
|
|
998
|
|
5
|
|
1,003
|
|
|||||||||||
|
Research and development
(2)
|
1,160
|
|
36
|
|
1,196
|
|
1,008
|
|
—
|
|
1,008
|
|
|||||||||||
|
Marketing, general and administrative
|
511
|
|
5
|
|
516
|
|
460
|
|
6
|
|
466
|
|
|||||||||||
|
Restructuring and other special charges, net
|
—
|
|
—
|
|
—
|
|
(10
|
)
|
—
|
|
(10
|
)
|
|||||||||||
|
Licensing gain
|
(52
|
)
|
—
|
|
(52
|
)
|
(88
|
)
|
—
|
|
(88
|
)
|
|||||||||||
|
Operating income (loss)
|
204
|
|
(77
|
)
|
127
|
|
(372
|
)
|
(1
|
)
|
(373
|
)
|
|||||||||||
|
Interest expense
|
(126
|
)
|
—
|
|
(126
|
)
|
(156
|
)
|
—
|
|
(156
|
)
|
|||||||||||
|
Other income (expense), net
|
(9
|
)
|
—
|
|
(9
|
)
|
80
|
|
—
|
|
80
|
|
|||||||||||
|
Income (loss) before equity loss and income taxes
|
69
|
|
(77
|
)
|
(8
|
)
|
(448
|
)
|
(1
|
)
|
(449
|
)
|
|||||||||||
|
Provision for income taxes
|
19
|
|
(1
|
)
|
18
|
|
39
|
|
—
|
|
39
|
|
|||||||||||
|
Equity loss in investee
|
(7
|
)
|
—
|
|
(7
|
)
|
(10
|
)
|
—
|
|
(10
|
)
|
|||||||||||
|
Net income (loss)
|
$
|
43
|
|
$
|
(76
|
)
|
$
|
(33
|
)
|
$
|
(497
|
)
|
$
|
(1
|
)
|
$
|
(498
|
)
|
|||||
|
Earnings (loss) per share
|
|||||||||||||||||||||||
|
Basic
|
$
|
0.04
|
|
$
|
(0.07
|
)
|
$
|
(0.03
|
)
|
$
|
(0.60
|
)
|
$
|
—
|
|
$
|
(0.60
|
)
|
|||||
|
Diluted
|
$
|
0.04
|
|
$
|
(0.07
|
)
|
$
|
(0.03
|
)
|
$
|
(0.60
|
)
|
$
|
—
|
|
$
|
(0.60
|
)
|
|||||
|
Shares used in per share calculation
|
|||||||||||||||||||||||
|
Basic
|
952
|
|
952
|
|
835
|
|
835
|
|
|||||||||||||||
|
Diluted
|
1,039
|
|
952
|
|
835
|
|
835
|
|
|||||||||||||||
|
(1)
|
2017 and 2016 revenue and cost of sales changes were due to a net drain (decrease in revenue) or net build (increase in revenue) in channel and semi-custom product inventories.
|
|
(2)
|
2017 Research and development expenses increased due to the absence of credits to research and development expenses recognized for a development and intellectual property licensing agreement under the “As reported” standard, which will be recognized as revenue for the entire consideration upon transfer of control of the IP license to the customer under the new standard.
|
The impact on the Company’s affected 2017 and 2016 Consolidated Balance Sheets line items, as a result of the adoption of the new standard is as follows:
|
Year Ended
|
|||||||||||||||||||||||
|
December 30,
2017 |
December 31,
2016 |
||||||||||||||||||||||
|
As reported
|
Adjustment
|
As adjusted
|
As reported
|
Adjustment
|
As adjusted
|
||||||||||||||||||
|
|
(In millions)
|
||||||||||||||||||||||
|
Accounts receivable, net
(1)
|
$
|
400
|
|
$
|
54
|
|
$
|
454
|
|
$
|
311
|
|
$
|
61
|
|
$
|
372
|
|
|||||
|
Inventories, net
(2)
|
739
|
|
(45
|
)
|
694
|
|
751
|
|
(60
|
)
|
691
|
|
|||||||||||
|
Other current assets
|
188
|
|
3
|
|
191
|
|
109
|
|
6
|
|
115
|
|
|||||||||||
|
Accrued liabilities
|
541
|
|
14
|
|
555
|
|
391
|
|
9
|
|
400
|
|
|||||||||||
|
Other current liabilities
(3)
|
57
|
|
35
|
|
92
|
|
69
|
|
—
|
|
69
|
|
|||||||||||
|
Deferred income on shipments to distributors
(4)
|
22
|
|
(22
|
)
|
—
|
|
63
|
|
(63
|
)
|
—
|
|
|||||||||||
|
Accumulated deficit
|
(7,760
|
)
|
(15
|
)
|
(7,775
|
)
|
(7,803
|
)
|
61
|
|
(7,742
|
)
|
|||||||||||
99
|
(1)
|
2017 and 2016 Accounts receivable, net increased primarily due to the acceleration in timing of semi-custom product revenue.
|
|
(2)
|
2017 and 2016 Inventories, net decreased primarily due to the acceleration in timing of semi-custom product revenue.
|
|
(3)
|
2017 Other current liabilities adjusted primarily due to the absence of credits to research and development expenses recognized for a development and intellectual property licensing agreement under the “As reported” standard, which will be recognized as revenue for the entire consideration upon transfer of control of the IP license to the customer under the new standard. The credits are recorded as deferred revenue under the new standard.
|
|
(4)
|
2017 and 2016 deferred income on shipments to distributors is eliminated due to the change in the revenue recognition model for sales to distributors, whereby revenue is recognized upon the shipment of the product to the distributors (sell-in), instead of upon reported resale of the product by the distributors to their customers (sell-through).
|
The impact on the Company’s 2017 and 2016 net revenue and operating income (loss) by segments as a result of the adoption of the new standard is as follows:
|
Year Ended
|
|||||||||||||||||||||||
|
December 30,
2017 |
December 31,
2016 |
||||||||||||||||||||||
|
As reported
|
Adjustment
|
As adjusted
|
As reported
|
Adjustment
|
As adjusted
|
||||||||||||||||||
|
(In millions)
|
|||||||||||||||||||||||
|
Net revenue:
|
|||||||||||||||||||||||
|
Computing and Graphics
(1)
|
$
|
3,029
|
|
$
|
(52
|
)
|
$
|
2,977
|
|
$
|
1,967
|
|
$
|
21
|
|
$
|
1,988
|
|
|||||
|
Enterprise, Embedded and Semi-Custom
(2)
|
2,300
|
|
(24
|
)
|
2,276
|
|
2,305
|
|
26
|
|
2,331
|
|
|||||||||||
|
Total net revenue
|
$
|
5,329
|
|
$
|
(76
|
)
|
$
|
5,253
|
|
$
|
4,272
|
|
$
|
47
|
|
$
|
4,319
|
|
|||||
|
Operating income (loss):
|
|||||||||||||||||||||||
|
Computing and Graphics
(3)
|
$
|
147
|
|
$
|
(55
|
)
|
$
|
92
|
|
$
|
(238
|
)
|
$
|
(5
|
)
|
$
|
(243
|
)
|
|||||
|
Enterprise, Embedded and Semi-Custom
(4)
|
154
|
|
(22
|
)
|
132
|
|
283
|
|
4
|
|
287
|
|
|||||||||||
|
All Other
|
(97
|
)
|
—
|
|
(97
|
)
|
(417
|
)
|
—
|
|
(417
|
)
|
|||||||||||
|
Total operating income (loss)
|
$
|
204
|
|
$
|
(77
|
)
|
$
|
127
|
|
$
|
(372
|
)
|
$
|
(1
|
)
|
$
|
(373
|
)
|
|||||
|
(1)
|
2017 and 2016 Computing and Graphics revenue changes were due to a net drain (decrease in revenue) or net build (increase in revenue) in channel inventory.
|
|
(2)
|
2017 and 2016 Enterprise, Embedded and Semi-Custom revenue changes were due to a net drain (decrease in revenue) or net build (increase in revenue) in semi-custom product inventory.
|
|
(3)
|
2017 Computing and Graphics operating income decreased primarily due to the lower revenue from sales to distributors. In addition, 2017 is lower due to the absence of credits to research and development expenses recognized for a development and intellectual property licensing agreement under the “As Reported” standard, which will be recognized as revenue for the entire consideration upon transfer of control of the IP license to the customer under the new standard. 2016 Computing and Graphics operating loss increased due to slightly higher operating expenses.
|
|
(4)
|
2017 Enterprise, Embedded and Semi-Custom operating income decreased primarily due to lower revenue from sales of semi-custom products. In addition, 2017 is lower due to the absence of credits to research and development expenses recognized for a certain development and intellectual property licensing agreement under the “As reported” standard, which will be recognized as revenue for the entire consideration upon transfer of control of the IP license to the customer under the new standard. 2016 Enterprise, Embedded and Semi-Custom operating income increased due to higher revenue from sales of semi-custom products.
|
100
Report of Independent Registered Public Accounting Firm
To the Stockholders and Board of Directors of Advanced Micro Devices, Inc.
Opinion on the Financial Statements
We have audited the accompanying consolidated balance sheets of Advanced Micro Devices, Inc. (the Company) as of December 30, 2017 and December 31, 2016, the related consolidated statements of operations, comprehensive income (loss), stockholders’ equity and cash flows for each of the three years in the period ended December 30, 2017, and the related notes (collectively referred to as the “consolidated financial statements”). In our opinion, the consolidated financial statements present fairly, in all material respects, the financial position of the Company as of December 30, 2017 and December 31, 2016, and the results of its operations and its cash flows for each of the three years in the period ended December 30, 2017, in conformity with U.S. generally accepted accounting principles.
We have also audited, in accordance with the standards of the Public Company Accounting Oversight Board (United States) (PCAOB), the Company’s internal control over financial reporting as of December 30, 2017, based on criteria established in Internal Control-Integrated Framework issued by the Committee of Sponsoring Organizations of the Treadway Commission (2013 framework) and our report dated February 27, 2018 expressed an unqualified opinion thereon.
Basis for Opinion
These financial statements are the responsibility of the Company’s management. Our responsibility is to express an opinion on the Company’s financial statements based on our audits. We are a public accounting firm registered with the PCAOB and are required to be independent with respect to the Company in accordance with the U.S. federal securities laws and the applicable rules and regulations of the Securities and Exchange Commission and the PCAOB.
We conducted our audits in accordance with the standards of the PCAOB. Those standards require that we plan and perform the audit to obtain reasonable assurance about whether the financial statements are free of material misstatement, whether due to error or fraud. Our audits included performing procedures to assess the risks of material misstatement of the financial statements, whether due to error or fraud, and performing procedures that respond to those risks. Such procedures include examining, on a test basis, evidence regarding the amounts and disclosures in the financial statements. Our audits also included evaluating the accounting principles used and significant estimates made by management, as well as evaluating the overall presentation of the financial statements. We believe that our audits provide a reasonable basis for our opinion.
/s/ Ernst & Young LLP
We have served as the Company’s auditor since 1970.
Redwood City, California
February 27, 2018
101
Report of Independent Registered Public Accounting Firm
To the Stockholders and Board of Directors of Advanced Micro Devices, Inc.
Opinion on Internal Control over Financial Reporting
We have audited Advanced Micro Devices, Inc.’s internal control over financial reporting as of December 30, 2017, based on criteria established in Internal Control-Integrated Framework issued by the Committee of Sponsoring Organizations of the Treadway Commission (2013 framework) (the COSO criteria). In our opinion, Advanced Micro Devices, Inc. (the Company) maintained, in all material respects, effective internal control over financial reporting as of December 30, 2017, based on the COSO criteria.
We also have audited, in accordance with the standards of the Public Company Accounting Oversight Board (United States) (“PCAOB”), the consolidated balance sheets of the Company as of December 30, 2017 and December 31, 2016, the related consolidated statements of operations, comprehensive income (loss), stockholders’ equity and cash flows for each of the three years in the period ended December 30, 2017, and the related notes and our report dated February 27, 2018 expressed an unqualified opinion thereon.
Basis for Opinion
The Company’s management is responsible for maintaining effective internal control over financial reporting and for its assessment of the effectiveness of internal control over financial reporting included in the accompanying Management’s Report on Internal Control over Financial Reporting. Our responsibility is to express an opinion on the Company’s internal control over financial reporting based on our audit. We are a public accounting firm registered with the PCAOB and are required to be independent with respect to the Company in accordance with U.S. federal securities laws and the applicable rules and regulations of the Securities and Exchange Commission and the PCAOB.
We conducted our audit in accordance with the standards of the PCAOB. Those standards require that we plan and perform the audit to obtain reasonable assurance about whether effective internal control over financial reporting was maintained in all material respects.
Our audit included obtaining an understanding of internal control over financial reporting, assessing the risk that a material weakness exists, testing and evaluating the design and operating effectiveness of internal control based on the assessed risk, and performing such other procedures as we considered necessary in the circumstances. We believe that our audit provides a reasonable basis for our opinion.
Definition and Limitations of Internal Control Over Financial Reporting
A company’s internal control over financial reporting is a process designed to provide reasonable assurance regarding the reliability of financial reporting and the preparation of financial statements for external purposes in accordance with generally accepted accounting principles. A company’s internal control over financial reporting includes those policies and procedures that (1) pertain to the maintenance of records that, in reasonable detail, accurately and fairly reflect the transactions and dispositions of the assets of the company; (2) provide reasonable assurance that transactions are recorded as necessary to permit preparation of financial statements in accordance with generally accepted accounting principles, and that receipts and expenditures of the company are being made only in accordance with authorizations of management and directors of the company; and (3) provide reasonable assurance regarding prevention or timely detection of unauthorized acquisition, use, or disposition of the company’s assets that could have a material effect on the financial statements.
Because of its inherent limitations, internal control over financial reporting may not prevent or detect misstatements. Also, projections of any evaluation of effectiveness to future periods are subject to the risk that controls may become inadequate because of changes in conditions, or that the degree of compliance with the policies or procedures may deteriorate.
/s/ Ernst & Young LLP
Redwood City, California
February 27, 2018
102
Supplementary Financial Information (unaudited)
The Company uses a 52 or 53 week fiscal year ending on the last Saturday in December. All quarters of
2017
and
2016
except the fourth quarter of 2016 consisted of 13 weeks; the fourth quarter of 2016 consisted of 14 weeks.
|
|
(In millions, except per share amounts)
|
||||||||||||||||||||||||||||||
|
|
2017
|
2016
|
|||||||||||||||||||||||||||||
|
|
Dec. 30
|
|
Sep. 30
|
July 1
|
April 1
|
Dec. 31
|
|
Sep. 24
|
Jun. 25
|
Mar. 26
|
|||||||||||||||||||||
|
Net revenue
|
$
|
1,480
|
|
|
$
|
1,643
|
|
$
|
1,222
|
|
$
|
984
|
|
$
|
1,106
|
|
|
$
|
1,307
|
|
$
|
1,027
|
|
$
|
832
|
|
|||||
|
Cost of sales
(1)
|
965
|
|
|
1,070
|
|
818
|
|
653
|
|
755
|
|
|
1,248
|
|
708
|
|
563
|
|
|||||||||||||
|
Gross margin
|
515
|
|
|
573
|
|
404
|
|
331
|
|
351
|
|
|
59
|
|
319
|
|
269
|
|
|||||||||||||
|
Research and development
|
300
|
|
|
315
|
|
279
|
|
266
|
|
264
|
|
|
259
|
|
243
|
|
242
|
|
|||||||||||||
|
Marketing, general and administrative
|
133
|
|
|
132
|
|
125
|
|
121
|
|
121
|
|
|
117
|
|
117
|
|
105
|
|
|||||||||||||
|
Restructuring and other special charges (reversals), net
|
—
|
|
|
—
|
|
—
|
|
—
|
|
—
|
|
—
|
|
(7
|
)
|
(3
|
)
|
||||||||||||||
|
Licensing gain
|
—
|
|
—
|
|
(25
|
)
|
(27
|
)
|
(31
|
)
|
(24
|
)
|
(26
|
)
|
(7
|
)
|
|||||||||||||||
|
Operating income (loss)
|
82
|
|
|
126
|
|
25
|
|
(29
|
)
|
(3
|
)
|
|
(293
|
)
|
(8
|
)
|
(68
|
)
|
|||||||||||||
|
Interest expense
|
(31
|
)
|
|
(31
|
)
|
(32
|
)
|
(32
|
)
|
(34
|
)
|
|
(41
|
)
|
(41
|
)
|
(40
|
)
|
|||||||||||||
|
Other income (expense), net
(2)
|
2
|
|
|
(3
|
)
|
(3
|
)
|
(5
|
)
|
(7
|
)
|
|
(63
|
)
|
150
|
|
—
|
|
|||||||||||||
|
Income (loss) before income taxes
|
53
|
|
|
92
|
|
(10
|
)
|
(66
|
)
|
(44
|
)
|
|
(397
|
)
|
101
|
|
(108
|
)
|
|||||||||||||
|
Provision for income taxes
|
(8
|
)
|
|
19
|
|
3
|
|
5
|
|
5
|
|
|
4
|
|
29
|
|
1
|
|
|||||||||||||
|
Equity loss in investee
|
—
|
|
|
(2
|
)
|
(3
|
)
|
(2
|
)
|
(2
|
)
|
|
(5
|
)
|
(3
|
)
|
—
|
|
|||||||||||||
|
Net income (loss)
|
61
|
|
|
71
|
|
(16
|
)
|
(73
|
)
|
(51
|
)
|
|
(406
|
)
|
69
|
|
(109
|
)
|
|||||||||||||
|
Earnings (loss) per share
|
|||||||||||||||||||||||||||||||
|
Basic
|
$
|
0.06
|
|
$
|
0.07
|
|
$
|
(0.02
|
)
|
$
|
(0.08
|
)
|
$
|
(0.06
|
)
|
$
|
(0.50
|
)
|
$
|
0.09
|
|
$
|
(0.14
|
)
|
|||||||
|
Diluted
|
$
|
0.06
|
|
$
|
0.07
|
|
$
|
(0.02
|
)
|
$
|
(0.08
|
)
|
$
|
(0.06
|
)
|
$
|
(0.50
|
)
|
$
|
0.08
|
|
$
|
(0.14
|
)
|
|||||||
|
Shares used in per share calculation
|
|||||||||||||||||||||||||||||||
|
Basic
|
965
|
|
|
957
|
|
945
|
|
939
|
|
931
|
|
|
815
|
|
794
|
|
793
|
|
|||||||||||||
|
Diluted
|
1,037
|
|
|
1,042
|
|
945
|
|
939
|
|
931
|
|
|
815
|
|
821
|
|
793
|
|
|||||||||||||
|
(1)
|
During the third quarter of
2016
, the Company recorded a charge of
$340 million
, consisting of the
$100 million
payment under the Sixth Amendment and the
$240 million
value of the warrant under the Warrant Agreement issued in consideration of the Sixth Amendment.
|
|
(2)
|
The Company recorded a pre-tax gain of
$150 million
on the sale of its
85%
equity interest in ATMP JV
during the second quarter of 2016. During the third quarter of 2016, as a result of certain purchase price adjustments, the Company recognized a charge of
$4 million
. During the fourth quarter of 2017, the Company recorded a
$3 million
pre-tax gain for final settlement related to the sale of
85%
of the equity interest in ATMP facilities
.
|
103
|
ITEM 9.
|
CHANGES IN AND DISAGREEMENTS WITH ACCOUNTANTS ON ACCOUNTING AND FINANCIAL DISCLOSURE
|
None.
|
ITEM 9A.
|
CONTROLS AND PROCEDURES
|
Disclosure Controls and Procedures
We maintain disclosure controls and procedures that are designed with the objective of providing reasonable assurance that information required to be disclosed in our reports filed under the Exchange Act, such as this Annual Report on Form 10-K is recorded, processed, summarized and reported within the time periods specified in the SEC’s rules and forms, and that such information is accumulated and communicated to our management, including our Chief Executive Officer and Chief Financial Officer, as appropriate, to allow timely decisions regarding required disclosure. In designing and evaluating our disclosure controls and procedures, our management recognizes that any controls and procedures, no matter how well designed and operated, can provide only reasonable assurance of achieving the desired control objectives, and our management is required to apply its judgment in evaluating the cost-benefit relationship of possible controls and procedures.
As of
December 30, 2017
, the end of the period covered by this report, we carried out an evaluation, under the supervision and with the participation of our management, including our Chief Executive Officer and Chief Financial Officer, of the effectiveness of the design and operation of our disclosure controls and procedures pursuant to Exchange Act Rules 13a-15(e) and 15d-15(e). This type of evaluation is performed on a quarterly basis so that conclusions of management, including our Chief Executive Officer and Chief Financial Officer, concerning the effectiveness of the disclosure controls can be reported in our periodic reports on Form 10-Q and Form 10-K. The overall goals of these evaluation activities are to monitor our disclosure controls and to modify them as necessary. We intend to maintain the disclosure controls as dynamic systems that we adjust as circumstances merit. Based on the foregoing, our Chief Executive Officer and Chief Financial Officer concluded that our disclosure controls and procedures were effective at the reasonable assurance level as of the end of the period covered by this report.
Management’s Report on Internal Control over Financial Reporting
Internal control over financial reporting refers to the process designed by, or under the supervision of, our Chief Executive Officer and Chief Financial Officer, and effected by our Board of Directors, management and other personnel, to provide reasonable assurance regarding the reliability of financial reporting and the preparation of financial statements for external purposes in accordance with U.S. generally accepted accounting principles, and includes those policies and procedures that:
(1) Pertain to the maintenance of records that in reasonable detail accurately and fairly reflect the transactions and dispositions of the assets of the Company;
(2) Provide reasonable assurance that transactions are recorded as necessary to permit preparation of financial statements in accordance with U.S. generally accepted accounting principles, and that receipts and expenditures of the Company are being made only in accordance with authorizations of management and directors of the Company; and
(3) Provide reasonable assurance regarding prevention or timely detection of unauthorized acquisition, use or disposition of the Company’s assets that could have a material effect on the financial statements.
Internal control over financial reporting cannot provide absolute assurance of achieving financial reporting objectives because of its inherent limitations. Internal control over financial reporting is a process that involves human diligence and compliance and is subject to lapses in judgment and breakdowns resulting from human failures. Internal control over financial reporting also can be circumvented by collusion or improper management override. Because of such limitations, there is a risk that material misstatements may not be prevented or detected on a timely basis by internal control over financial reporting. However, these inherent limitations are known features of the financial reporting process. Therefore, it is possible to design into the process safeguards to reduce, though not eliminate, this risk. Management is responsible for establishing and maintaining adequate internal control over financial reporting for the Company.
Management has used the 2013 framework set forth in the report entitled “Internal Control—Integrated Framework” published by the Committee of Sponsoring Organizations of the Treadway Commission to evaluate the effectiveness of the Company’s internal control over financial reporting. Management has concluded that the Company’s internal control over financial reporting was effective as of
December 30, 2017
at the reasonable assurance level. Our independent registered public accounting firm, Ernst & Young LLP, has issued an attestation report on the Company’s internal control over financial reporting as of
December 30, 2017
, which is included in Part II, Item 8, above.
104
Changes in Internal Control over Financial Reporting
There has been no change in our internal controls over financial reporting during our most recently completed fiscal quarter that has materially affected, or is reasonably likely to materially affect, our internal controls over financial reporting.
|
ITEM 9B.
|
OTHER INFORMATION
|
None.
105
|
ITEM 10.
|
DIRECTORS, EXECUTIVE OFFICERS AND CORPORATE GOVERNANCE
|
The information under the captions “Item 1—Election of Directors” (including “Consideration of Stockholder Nominees for Director”), “Corporate Governance,” “Meetings and Committees of the Board of Directors,” “Executive Officers” and “Section 16(a) Beneficial Ownership Reporting Compliance” in our proxy statement for our 2018 annual meeting of stockholders (our 2018 Proxy Statement) is incorporated herein by reference. There were no material changes to the procedures by which stockholders may recommend nominees to our board of directors. See also, “Part 1, Item 1-Website Access to Company Reports and Corporate Governance Documents,” above.
|
ITEM 11.
|
EXECUTIVE COMPENSATION
|
The information under the captions “Directors’ Compensation and Benefits” (including “2017 Non-Employee Director Compensation”), “Compensation Discussion and Analysis,” “Compensation Policies and Practices,” “Executive Compensation” (including “2017 Summary Compensation Table,” “2017 Nonqualified Deferred Compensation,” “Outstanding Equity Awards at 2017 Fiscal Year-End,” “Grants of Plan-Based Awards in 2017” and “Option Exercises and Stock Vested in 2017”) and “Severance and Change in Control Arrangements” in our 2018 Proxy Statement is incorporated herein by reference.
|
ITEM 12.
|
SECURITY OWNERSHIP OF CERTAIN BENEFICIAL OWNERS AND MANAGEMENT AND RELATED STOCKHOLDER MATTERS
|
The information under the captions “Principal Stockholders,” “Security Ownership of Directors and Executive Officers” and “Equity Compensation Plan Information” in our 2018 Proxy Statement is incorporated herein by reference.
|
ITEM 13.
|
CERTAIN RELATIONSHIPS AND RELATED TRANSACTIONS AND DIRECTOR INDEPENDENCE
|
The information under the captions “Corporate Governance—Independence of Directors” and “Certain Relationships and Related Transactions” in our 2018 Proxy Statement is incorporated herein by reference.
|
ITEM 14.
|
PRINCIPAL ACCOUNTING FEES AND SERVICES
|
The information under the captions “Item 2—Ratification of Appointment of Independent Registered Public Accounting Firm—Independent Registered Public Accounting Firm’s Fees” in our 2018 Proxy Statement is incorporated herein by reference.
With the exception of the information specifically incorporated by reference in Part III of this Annual Report on Form 10-K from our 2018 Proxy Statement, our 2018 Proxy Statement will not be deemed to be filed as part of this report. Without limiting the foregoing, the information under the captions “Compensation Committee Report” and “Audit Committee Report” in our 2018 Proxy Statement is not incorporated by reference in this Annual Report on Form 10-K.
106
|
ITEM 15.
|
EXHIBITS, FINANCIAL STATEMENT SCHEDULES
|
1. Financial Statements
The financial statements of AMD are set forth in Item 8 of this Annual Report on Form 10-K.
All schedules have been omitted because the required information is not present or is not present in amounts sufficient to require submission of the schedules or because the information required is included in the Consolidated Financial Statements or related notes.
2. Exhibits
The exhibits listed in the accompanying Index to Exhibits are filed as part of, or incorporated by reference into, this Annual Report on Form 10-K. The following is a list of such Exhibits:
|
Exhibit
|
Description of Exhibits
|
||||
|
3.1
|
|
||||
|
3.2
|
|
||||
|
4.1
|
|
AMD hereby agrees to file on request of the SEC a copy of all instruments not otherwise filed with respect to AMD’s long-term debt or any of its subsidiaries for which the total amount of securities authorized under such instruments does not exceed 10 percent of the total assets of AMD and its subsidiaries on a consolidated basis.
|
|||
|
4.2
|
|
||||
|
4.3
|
|
||||
|
4.4
|
|
||||
|
4.5
|
|
||||
|
4.6
|
|
||||
|
4.7
|
|
||||
|
4.8
|
|
||||
107
|
4.9
|
|
|||
|
4.10
|
|
|||
|
4.11
|
|
|||
|
*10.1
|
|
|||
|
*10.2
|
|
|||
|
*10.3
|
|
|||
|
*10.4
|
|
|||
|
*10.5
|
|
|||
|
*10.6
|
|
|||
|
*10.7
|
|
|||
|
*10.8
|
|
|||
|
*10.9
|
|
|||
|
*10.10
|
|
|||
|
*10.11
|
|
|||
|
*10.12
|
|
|||
|
*10.13
|
|
|||
|
*10.14
|
|
|||
|
*10.15
|
|
|||
108
|
*10.16
|
|
|||
|
*10.17
|
|
|||
|
*10.18
|
|
|||
|
*10.19
|
|
|||
|
*10.20
|
|
|||
|
*10.21
|
|
|||
|
*10.22
|
|
|||
|
*10.23
|
|
|||
|
*10.24
|
|
|||
|
*10.25
|
|
|||
|
*10.26
|
|
|||
|
*10.27
|
|
|||
|
*10.28
|
|
|||
|
*10.29
|
|
|||
|
*10.30
|
|
|||
|
*10.31
|
|
|||
|
*10.32
|
|
|||
109
|
*10.33
|
|
|||
|
*10.34
|
|
|||
|
*10.35
|
|
|||
|
*10.36
|
|
|||
|
*10.37
|
|
|||
|
*10.38
|
|
|||
|
*10.39
|
|
|||
|
*10.40
|
|
|||
|
*10.41
|
|
|||
|
*10.42
|
|
|||
|
10.43
|
|
|||
|
10.44
|
|
|||
|
10.45
|
|
|||
|
**10.46
|
|
|||
|
**10.47
|
|
|||
110
|
**10.48
|
|
|||
|
**10.49
|
|
|||
|
10.50
|
|
|||
|
**10.51
|
|
|||
|
10.52
|
|
|||
|
10.53
|
|
|||
|
10.54
|
|
|||
|
10.55
|
|
|||
|
10.56
|
|
|||
|
10.57
|
|
|||
|
**10.58
|
|
|||
|
*10.59
|
|
|||
|
*10.60
|
|
|||
|
*10.61
|
|
|||
|
*10.62
|
|
|||
111
|
*10.63
|
|
|||
|
10.64
|
|
|||
|
*10.65
|
|
|||
|
*10.66
|
|
|||
|
*10.67
|
|
|||
|
10.68
|
|
|||
|
10.69
|
|
|||
|
*10.70
|
|
|||
|
*10.71
|
|
|||
|
*10.72
|
|
|||
|
*10.73
|
|
|||
|
*10.74
|
|
|||
|
10.75
|
|
|||
|
**10.76
|
|
|||
|
*10.77
|
|
|||
112
|
*10.78
|
|
|||
|
*10.79
|
|
|||
|
10.80
|
|
|||
|
10.81
|
|
|||
|
10.82
|
|
|||
|
10.83
|
|
|||
|
10.84
|
|
|||
|
**10.85
|
|
|||
|
10.86
|
|
|||
|
*10.87
|
|
|||
|
*10.88
|
|
|||
|
*10.89
|
|
|||
|
10.90
|
|
|||
|
*10.91
|
|
|||
|
*10.92
|
|
|||
113
|
*10.93
|
|
|||
|
*10.94
|
|
|||
|
10.95
|
|
|||
|
10.96
|
|
|||
|
10.97
|
|
|||
|
*10.98
|
|
|||
|
*10.99
|
|
|||
|
*10.100
|
|
|||
|
*10.101
|
|
|||
|
21
|
|
|||
|
23
|
|
|||
|
24
|
|
|||
|
31.1
|
|
|||
|
31.2
|
|
|||
|
32.1
|
|
|||
|
32.2
|
|
|||
|
101.INS
|
|
XBRL Instance Document
|
||
|
101.SCH
|
|
XBRL Taxonomy Extension Schema Document
|
||
|
101.CAL
|
|
XBRL Taxonomy Extension Calculation Linkbase Document
|
||
|
101.DEF
|
|
XBRL Taxonomy Extension Definition Linkbase Document
|
||
|
101.LAB
|
|
XBRL Taxonomy Extension Label Linkbase Document
|
||
|
101.PRE
|
|
XBRL Taxonomy Extension Presentation Linkbase Document
|
||
_____________________
* Management contracts and compensatory plans or arrangements.
114
** Portions of this exhibit have been omitted pursuant to a request for confidential treatment, which has been granted. These portions have been filed separately with the SEC.
AMD will furnish a copy of any exhibit on request and payment of AMD’s reasonable expenses of furnishing such exhibit.
115
|
ITEM 16.
|
FORM 10-K SUMMARY
|
Not applicable.
SIGNATURES
Pursuant to the requirements of Section 13 or 15(d) of the Securities Exchange Act of 1934, the registrant has duly caused this report to be signed on its behalf by the undersigned, thereunto duly authorized.
|
February 27, 2018
|
A
DVANCED
M
ICRO
D
EVICES
, I
NC
.
|
|
|
By:
|
/s/ Devinder Kumar
|
|
|
Devinder Kumar
|
||
|
Senior Vice President, Chief Financial Officer, and Treasurer
|
||
Pursuant to the requirements of the Securities Exchange Act of 1934, this report has been signed below by the following persons, on behalf of the registrant and in the capacities and on the dates indicated.
116
|
Signature
|
|
Title
|
|
Date
|
|
/s/Lisa T. Su
|
President and Chief Executive Officer
(Principal Executive Officer), Director
|
February 27, 2018
|
||
|
Lisa T. Su
|
|
|||
|
/s/Devinder Kumar
|
Senior Vice President, Chief Financial Officer and Treasurer
(Principal Financial Officer)
|
February 27, 2018
|
||
|
Devinder Kumar
|
|
|||
|
/s/Darla Smith
|
Corporate Vice President, Chief Accounting Officer (Principal Accounting Officer)
|
February 27, 2018
|
||
|
Darla Smith
|
||||
|
*
|
Director, Chairman of the Board
|
February 27, 2018
|
||
|
John E. Caldwell
|
|
|||
|
*
|
Director
|
February 27, 2018
|
||
|
Nora M. Denzel
|
|
|||
|
*
|
Director
|
February 27, 2018
|
||
|
Nicolas M. Donofrio
|
|
|||
|
*
|
||||
|
Mark Durcan
|
Director
|
February 27, 2018
|
||
|
*
|
Director
|
February 27, 2018
|
||
|
Michael J. Inglis
|
||||
|
*
|
Director
|
February 27, 2018
|
||
|
Joseph A. Householder
|
||||
|
*
|
Director
|
February 27, 2018
|
||
|
John W. Marren
|
||||
|
*
|
Director
|
February 27, 2018
|
||
|
Abhi Y. Talwalkar
|
|
|
||
|
*
|
Director
|
February 27, 2018
|
||
|
Ahmed Yahia
|
|
|
||
|
*By:
|
/s/Devinder Kumar
|
|
|
Devinder Kumar, Attorney-in-Fact
|
117
TABLE OF CONTENTS
Part IItem 1. BusinessItem 1A. Risk FactorsItem 1B. Unresolved Staff CommentsItem 2. PropertiesItem 3. Legal ProceedingsItem 4. Mine Safety DisclosuresPart IIItem 5. Market For Registrant S Common Equity, Related Stockholder Matters and Issuer Purchases Of Equity SecuritiesItem 6. Selected Financial DataItem 7. Management S Discussion and Analysis Of Financial Condition and Results Of OperationsItem 7A. Quantitative and Qualitative Disclosure About Market RiskItem 8. Financial Statements and Supplementary DataNote 1: Nature Of OperationsNote 2: Summary Of Significant Accounting PoliciesNote 3: GlobalfoundriesNote 4: Equity Interest Purchase Agreement - Atmp Joint VentureNote 5. Equity Joint VentureNote 6: Supplemental Balance Sheet InformationNote 7: Goodwill and Acquired Intangible AssetsNote 8: Financial InstrumentsNote 9: Concentrations Of Credit and Operation RiskNote 10: Income TaxesNote 11: Debt and Other ObligationsNote 12: Other Income (expense), NetNote 13: Segment ReportingNote 14: Common Stock and Stock-based Incentive Compensation PlansNote 15: Defined Contribution PlansNote 16: Commitments and GuaranteesNote 17: ContingenciesNote 18: Restructuring and Other Special Charges, NetNote 19: Impact To Reported Results Of The Adoption Of Asc 606, Revenue From Contracts with CustomersItem 9. Changes in and Disagreements with Accountants on Accounting and Financial DisclosureItem 9A. Controls and ProceduresItem 9B. Other InformationPart IIIItem 10. Directors, Executive Officers and Corporate GovernanceItem 11. Executive CompensationItem 12. Security Ownership Of Certain Beneficial Owners and Management and Related Stockholder MattersItem 13. Certain Relationships and Related Transactions and Director IndependenceItem 14. Principal Accounting Fees and ServicesPart IVItem 15. Exhibits, Financial Statement SchedulesItem 16. Form 10-k Summary