AFFILIATED MANAGERS GROUP, INC.
10-Ks and 10-Qs
|
|
|
|
|
|
|
|
|
|
|
|
|
|
|
|
|
|
|
|
|
|
|
|
|
|
|
|
|
|
|
|
|
|
|
|
|
|
|
|
|
|
|
|
|
|
|
|
|
|
|
|
|
|
|
|
QuickLinks
-- Click here to rapidly navigate through this document
UNITED STATES
SECURITIES AND EXCHANGE COMMISSION
WASHINGTON, DC 20549
FORM 10-Q
|
(Mark One)
|
|
|
|
ý
|
|
QUARTERLY REPORT PURSUANT TO SECTION 13 OR 15(d) OF THE SECURITIES EXCHANGE ACT OF 1934
|
For the quarterly period ended
March 31, 2019
OR
|
o
|
|
TRANSITION REPORT PURSUANT TO SECTION 13 OR 15(d) OF THE SECURITIES EXCHANGE ACT OF 1934
|
For the transition period from to
Commission File Number 001-13459

Affiliated Managers Group, Inc.
(Exact name of registrant as specified in its charter)
|
Delaware
|
|
04-3218510
|
|
(State or other jurisdiction
of incorporation or organization)
|
|
(IRS Employer Identification Number)
|
777 South Flagler Drive, West Palm Beach, Florida 33401
(Address of principal executive offices)
(800) 345-1100
(Registrant’s telephone number, including area code)
Indicate by check mark whether the registrant (1) has filed all reports required to be filed by Section 13 or 15(d) of the Securities Exchange Act of 1934 during the preceding 12 months (or for such shorter period that the registrant was required to file such reports), and (2) has been subject to such filing requirements for the past 90 days. Yes
ý
No
o
Indicate by check mark whether the registrant has submitted electronically, every Interactive Data File required to be submitted pursuant to Rule 405 of Regulation S-T (§232.405 of this chapter) during the preceding 12 months (or for such shorter period that the registrant was required to submit such files). Yes
ý
No
o
QuickLinks
-- Click here to rapidly navigate through this document
Indicate by check mark whether the registrant is a large accelerated filer, an accelerated filer, a non-accelerated filer, a smaller reporting company, or an emerging growth company. See the definitions of “large accelerated filer,” “accelerated filer,” “smaller reporting company,” and “emerging growth company” in Rule 12b-2 of the Exchange Act.
|
Large accelerated filer
ý
|
|
Accelerated filer
o
|
|
Non-accelerated filer
o
|
|
Smaller reporting company
o
|
Emerging growth company
o
|
|
If an emerging growth company, indicate by check mark if the registrant has elected not to use the extended transition period for complying with any new or revised financial accounting standards provided pursuant to Section 13(a) of the Exchange Act.
o
Indicate by check mark whether the registrant is a shell company (as defined in Rule 12b-2 of the Exchange Act). Yes
o
No
ý
Securities registered pursuant to Section 12(b) of the Act:
|
Title of each class
|
Trading Symbol(s)
|
Name of each exchange on which registered
|
||
|
Common Stock ($0.01 par value)
|
AMG
|
New York Stock Exchange
|
||
|
5.875% Junior Subordinated Notes due 2059
|
MGR
|
New York Stock Exchange
|
||
There were
51,199,344
shares of the registrant’s common stock outstanding on May 7, 2019.
PART I—FINANCIAL INFORMATION
|
Item 1.
|
Financial Statements
|
AFFILIATED MANAGERS GROUP, INC.
CONSOLIDATED STATEMENTS OF INCOME
(in millions, except per share data)
(unaudited)
|
|
For the Three Months Ended March 31,
|
||||||
|
|
2018
|
2019
|
|||||
|
Consolidated revenue
|
$
|
612.4
|
|
$
|
543.1
|
|
|
|
Consolidated expenses:
|
|||||||
|
Compensation and related expenses
|
266.7
|
|
228.2
|
|
|||
|
Selling, general and administrative
|
106.4
|
|
95.6
|
|
|||
|
Intangible amortization and impairments
|
23.2
|
|
29.6
|
|
|||
|
Interest expense
|
21.6
|
|
18.2
|
|
|||
|
Depreciation and other amortization
|
5.5
|
|
5.2
|
|
|||
|
Other expenses (net)
|
12.0
|
|
11.0
|
|
|||
|
Total consolidated expenses
|
435.4
|
|
387.8
|
|
|||
|
Equity method income (loss) (net)
|
96.3
|
|
(358.1
|
)
|
|||
|
Investment and other income
|
14.2
|
|
8.0
|
|
|||
|
Income (loss) before income taxes
|
287.5
|
|
(194.8
|
)
|
|||
|
Income tax expense (benefit)
|
63.5
|
|
(61.8
|
)
|
|||
|
Net income (loss)
|
224.0
|
|
(133.0
|
)
|
|||
|
Net income (non-controlling interests)
|
(71.0
|
)
|
(67.8
|
)
|
|||
|
Net income (loss) (controlling interest)
|
$
|
153.0
|
|
$
|
(200.8
|
)
|
|
|
Average shares outstanding (basic)
|
54.6
|
|
51.9
|
|
|||
|
Average shares outstanding (diluted)
|
57.0
|
|
51.9
|
|
|||
|
Earnings (loss) per share (basic)
|
$
|
2.80
|
|
$
|
(3.87
|
)
|
|
|
Earnings (loss) per share (diluted)
|
$
|
2.77
|
|
$
|
(3.87
|
)
|
|
The accompanying notes are an integral part of the Consolidated Financial Statements.
2
AFFILIATED MANAGERS GROUP, INC.
CONSOLIDATED STATEMENTS OF COMPREHENSIVE INCOME
(in millions)
(unaudited)
|
|
For the Three Months Ended March 31,
|
||||||
|
|
2018
|
2019
|
|||||
|
Net income (loss)
|
$
|
224.0
|
|
$
|
(133.0
|
)
|
|
|
Other comprehensive income, net of tax:
|
|
|
|||||
|
Foreign currency translation gain
|
29.1
|
|
7.5
|
|
|||
|
Change in net realized and unrealized gain on derivative financial instruments
|
0.3
|
|
1.2
|
|
|||
|
Other comprehensive income, net of tax
|
29.4
|
|
8.7
|
|
|||
|
Comprehensive income (loss)
|
253.4
|
|
(124.3
|
)
|
|||
|
Comprehensive income (non-controlling interests)
|
(79.5
|
)
|
(74.4
|
)
|
|||
|
Comprehensive income (loss) (controlling interest)
|
$
|
173.9
|
|
$
|
(198.7
|
)
|
|
The accompanying notes are an integral part of the Consolidated Financial Statements.
3
AFFILIATED MANAGERS GROUP, INC.
CONSOLIDATED BALANCE SHEETS
(in millions)
(unaudited)
|
December 31,
2018 |
March 31,
2019 |
||||||
|
Assets
|
|
|
|||||
|
Cash and cash equivalents
|
$
|
565.5
|
|
$
|
305.2
|
|
|
|
Receivables
|
400.6
|
|
535.5
|
|
|||
|
Investments in marketable securities
|
119.3
|
|
36.4
|
|
|||
|
Goodwill
|
2,633.4
|
|
2,642.4
|
|
|||
|
Acquired client relationships (net)
|
1,309.9
|
|
1,289.5
|
|
|||
|
Equity method investments in Affiliates (net)
|
2,791.0
|
|
2,318.5
|
|
|||
|
Fixed assets (net)
|
104.3
|
|
102.3
|
|
|||
|
Other investments
|
201.1
|
|
207.5
|
|
|||
|
Other assets
|
94.0
|
|
239.7
|
|
|||
|
Total assets
|
$
|
8,219.1
|
|
$
|
7,677.0
|
|
|
|
Liabilities and Equity
|
|
||||||
|
Payables and accrued liabilities
|
$
|
746.6
|
|
$
|
576.5
|
|
|
|
Debt
|
1,829.6
|
|
1,780.7
|
|
|||
|
Deferred income tax liability (net)
|
511.6
|
|
418.5
|
|
|||
|
Other liabilities
|
162.7
|
|
386.2
|
|
|||
|
Total liabilities
|
3,250.5
|
|
3,161.9
|
|
|||
|
Commitments and contingencies (Note 8)
|
|
|
|
|
|||
|
Redeemable non-controlling interests
|
833.7
|
|
754.8
|
|
|||
|
Equity:
|
|
||||||
|
Common stock ($0.01 par value, 153.0 shares authorized; 58.5 shares outstanding in 2018 and 2019)
|
0.6
|
|
0.6
|
|
|||
|
Additional paid-in capital
|
835.6
|
|
804.4
|
|
|||
|
Accumulated other comprehensive loss
|
(109.0
|
)
|
(106.9
|
)
|
|||
|
Retained earnings
|
3,876.8
|
|
3,652.6
|
|
|||
|
4,604.0
|
|
4,350.7
|
|
||||
|
Less: Treasury stock, at cost (6.5 shares in 2018 and 7.1 shares in 2019)
|
(1,146.6
|
)
|
(1,210.3
|
)
|
|||
|
Total stockholders' equity
|
3,457.4
|
|
3,140.4
|
|
|||
|
Non-controlling interests
|
677.5
|
|
619.9
|
|
|||
|
Total equity
|
4,134.9
|
|
3,760.3
|
|
|||
|
Total liabilities and equity
|
$
|
8,219.1
|
|
$
|
7,677.0
|
|
|
The accompanying notes are an integral part of the Consolidated Financial Statements.
4
AFFILIATED MANAGERS GROUP, INC.
CONSOLIDATED STATEMENTS OF CHANGES IN EQUITY
(in millions)
(unaudited)
|
|
Total Stockholders’ Equity
|
|
|
|||||||||||||||||||||||||||
|
|
Shares Outstanding
|
Common
Stock
|
Additional
Paid-In
Capital
|
Accumulated
Other
Comprehensive
Income (Loss)
|
Retained
Earnings
|
Treasury
Stock at
Cost
|
Non-
controlling
Interests
|
Total
Equity
|
||||||||||||||||||||||
|
December 31, 2017
|
58.5
|
|
$
|
0.6
|
|
$
|
808.6
|
|
$
|
(21.8
|
)
|
$
|
3,698.5
|
|
$
|
(663.7
|
)
|
$
|
756.3
|
|
$
|
4,578.5
|
|
|||||||
|
Net income
|
—
|
|
—
|
|
—
|
|
—
|
|
153.0
|
|
—
|
|
71.0
|
|
224.0
|
|
||||||||||||||
|
Other comprehensive income
|
—
|
|
—
|
|
—
|
|
20.9
|
|
—
|
|
—
|
|
8.5
|
|
29.4
|
|
||||||||||||||
|
Share-based compensation
|
—
|
|
—
|
|
10.7
|
|
—
|
|
—
|
|
—
|
|
—
|
|
10.7
|
|
||||||||||||||
|
Common stock issued under share-based incentive plans
|
—
|
|
—
|
|
(2.2
|
)
|
—
|
|
—
|
|
(7.3
|
)
|
—
|
|
(9.5
|
)
|
||||||||||||||
|
Share repurchases
|
—
|
|
—
|
|
—
|
|
—
|
|
—
|
|
(150.8
|
)
|
—
|
|
(150.8
|
)
|
||||||||||||||
|
Dividends ($0.30 per share)
|
—
|
|
—
|
|
—
|
|
—
|
|
(16.6
|
)
|
—
|
|
—
|
|
(16.6
|
)
|
||||||||||||||
|
Affiliate equity activity:
|
||||||||||||||||||||||||||||||
|
Affiliate equity compensation
|
—
|
|
—
|
|
2.6
|
|
—
|
|
—
|
|
—
|
|
16.8
|
|
19.4
|
|
||||||||||||||
|
Issuances
|
—
|
|
—
|
|
(1.4
|
)
|
—
|
|
—
|
|
—
|
|
8.4
|
|
7.0
|
|
||||||||||||||
|
Repurchases
|
—
|
|
—
|
|
14.4
|
|
—
|
|
—
|
|
—
|
|
—
|
|
14.4
|
|
||||||||||||||
|
Changes in redemption value of Redeemable non-controlling interests
|
—
|
|
—
|
|
(168.5
|
)
|
—
|
|
—
|
|
—
|
|
—
|
|
(168.5
|
)
|
||||||||||||||
|
Transfers to Redeemable non-controlling interests
|
—
|
|
—
|
|
—
|
|
—
|
|
—
|
|
—
|
|
(4.9
|
)
|
(4.9
|
)
|
||||||||||||||
|
Capital contributions by Affiliate equity holders
|
—
|
|
—
|
|
—
|
|
—
|
|
—
|
|
—
|
|
1.9
|
|
1.9
|
|
||||||||||||||
|
Distributions to non-controlling interests
|
—
|
|
—
|
|
—
|
|
—
|
|
—
|
|
—
|
|
(112.4
|
)
|
(112.4
|
)
|
||||||||||||||
|
March 31, 2018
|
58.5
|
|
$
|
0.6
|
|
$
|
664.2
|
|
$
|
(0.9
|
)
|
$
|
3,834.9
|
|
$
|
(821.8
|
)
|
$
|
745.6
|
|
$
|
4,422.6
|
|
|||||||
5
AFFILIATED MANAGERS GROUP, INC.
CONSOLIDATED STATEMENTS OF CHANGES IN EQUITY (Continued)
(in millions)
(unaudited)
|
|
Total Stockholders’ Equity
|
|
|
|||||||||||||||||||||||||||
|
|
Shares Outstanding
|
Common
Stock
|
Additional
Paid-In
Capital
|
Accumulated
Other
Comprehensive
Income (Loss)
|
Retained
Earnings
|
Treasury
Stock at
Cost
|
Non-
controlling
Interests
|
Total
Equity
|
||||||||||||||||||||||
|
December 31, 2018
|
58.5
|
|
$
|
0.6
|
|
$
|
835.6
|
|
$
|
(109.0
|
)
|
$
|
3,876.8
|
|
$
|
(1,146.6
|
)
|
$
|
677.5
|
|
$
|
4,134.9
|
|
|||||||
|
Impact of adoption of new accounting standards (see Note 19)
|
—
|
|
—
|
|
—
|
|
—
|
|
(6.6
|
)
|
—
|
|
—
|
|
(6.6
|
)
|
||||||||||||||
|
Net income (loss)
|
—
|
|
—
|
|
—
|
|
—
|
|
(200.8
|
)
|
—
|
|
67.8
|
|
(133.0
|
)
|
||||||||||||||
|
Other comprehensive income
|
—
|
|
—
|
|
—
|
|
2.1
|
|
—
|
|
—
|
|
6.6
|
|
8.7
|
|
||||||||||||||
|
Share-based compensation
|
—
|
|
—
|
|
8.8
|
|
—
|
|
—
|
|
—
|
|
—
|
|
8.8
|
|
||||||||||||||
|
Common stock issued under share-based incentive plans
|
—
|
|
—
|
|
(33.0
|
)
|
—
|
|
—
|
|
26.9
|
|
—
|
|
(6.1
|
)
|
||||||||||||||
|
Share repurchases
|
—
|
|
—
|
|
—
|
|
—
|
|
—
|
|
(90.6
|
)
|
—
|
|
(90.6
|
)
|
||||||||||||||
|
Dividends ($0.32 per share)
|
—
|
|
—
|
|
—
|
|
—
|
|
(16.8
|
)
|
—
|
|
—
|
|
(16.8
|
)
|
||||||||||||||
|
Affiliate equity activity:
|
|
|
|
|
|
|
|
|
|
|
|
|
|
|
|
|
||||||||||||||
|
Affiliate equity compensation
|
—
|
|
—
|
|
2.2
|
|
—
|
|
—
|
|
—
|
|
8.5
|
|
10.7
|
|
||||||||||||||
|
Issuances
|
—
|
|
—
|
|
(0.9
|
)
|
—
|
|
—
|
|
—
|
|
11.0
|
|
10.1
|
|
||||||||||||||
|
Repurchases
|
—
|
|
—
|
|
4.6
|
|
—
|
|
—
|
|
—
|
|
—
|
|
4.6
|
|
||||||||||||||
|
Changes in redemption value of Redeemable non-controlling interests
|
—
|
|
—
|
|
(12.9
|
)
|
—
|
|
—
|
|
—
|
|
—
|
|
(12.9
|
)
|
||||||||||||||
|
Transfers to Redeemable non-controlling interests
|
—
|
|
—
|
|
—
|
|
—
|
|
—
|
|
—
|
|
(47.3
|
)
|
(47.3
|
)
|
||||||||||||||
|
Capital contributions by Affiliate equity holders
|
—
|
|
—
|
|
—
|
|
—
|
|
—
|
|
—
|
|
0.4
|
|
0.4
|
|
||||||||||||||
|
Distributions to non-controlling interests
|
—
|
|
—
|
|
|
|
—
|
|
—
|
|
—
|
|
(104.6
|
)
|
(104.6
|
)
|
||||||||||||||
|
March 31, 2019
|
58.5
|
|
$
|
0.6
|
|
$
|
804.4
|
|
$
|
(106.9
|
)
|
$
|
3,652.6
|
|
$
|
(1,210.3
|
)
|
$
|
619.9
|
|
$
|
3,760.3
|
|
|||||||
The accompanying notes are an integral part of the Consolidated Financial Statements.
6
AFFILIATED MANAGERS GROUP, INC.
CONSOLIDATED STATEMENTS OF CASH FLOWS
(in millions)
(unaudited)
|
|
For the Three Months Ended March 31,
|
||||||
|
|
2018
|
2019
|
|||||
|
Cash flow from (used in) operating activities:
|
|||||||
|
Net income (loss)
|
$
|
224.0
|
|
$
|
(133.0
|
)
|
|
|
Adjustments to reconcile Net income (loss) to cash flow from (used in) operating activities:
|
|
||||||
|
Intangible amortization and impairments
|
23.2
|
|
29.6
|
|
|||
|
Depreciation and other amortization
|
5.5
|
|
5.2
|
|
|||
|
Deferred income tax expense (benefit)
|
13.4
|
|
(86.0
|
)
|
|||
|
Equity method (income) loss (net)
|
(96.3
|
)
|
358.1
|
|
|||
|
Distributions of earnings received from equity method investments
|
225.7
|
|
96.5
|
|
|||
|
Share-based compensation and Affiliate equity expense
|
30.1
|
|
19.5
|
|
|||
|
Other non-cash items
|
1.2
|
|
(4.4
|
)
|
|||
|
Changes in assets and liabilities:
|
|
||||||
|
Purchases of securities by consolidated Affiliate sponsored investment products
|
(9.9
|
)
|
—
|
|
|||
|
Sales of securities by consolidated Affiliate sponsored investment products
|
12.5
|
|
1.5
|
|
|||
|
Increase in receivables
|
(92.4
|
)
|
(131.3
|
)
|
|||
|
Increase in other assets
|
(4.0
|
)
|
(0.7
|
)
|
|||
|
Decrease in payables, accrued liabilities and other liabilities
|
(128.0
|
)
|
(172.9
|
)
|
|||
|
Cash flow from (used in) operating activities
|
205.0
|
|
(17.9
|
)
|
|||
|
Cash flow from (used in) investing activities:
|
|
||||||
|
Investments in Affiliates
|
—
|
|
(34.1
|
)
|
|||
|
Divestments of Affiliates
|
—
|
|
28.8
|
|
|||
|
Purchase of fixed assets
|
(5.5
|
)
|
(3.0
|
)
|
|||
|
Purchase of investment securities
|
(5.0
|
)
|
(8.7
|
)
|
|||
|
Sale of investment securities
|
6.6
|
|
16.9
|
|
|||
|
Cash flow used in investing activities
|
(3.9
|
)
|
(0.1
|
)
|
|||
|
Cash flow from (used in) financing activities:
|
|
||||||
|
Borrowings of debt
|
440.0
|
|
336.3
|
|
|||
|
Repayments of debt
|
(435.0
|
)
|
(385.0
|
)
|
|||
|
Repurchases of common stock (net)
|
(170.1
|
)
|
(71.0
|
)
|
|||
|
Dividends paid on common stock
|
(16.4
|
)
|
(17.0
|
)
|
|||
|
Distributions to non-controlling interests
|
(112.4
|
)
|
(104.6
|
)
|
|||
|
Affiliate equity issuances and repurchases (net)
|
(8.3
|
)
|
(6.0
|
)
|
|||
|
Other financing items
|
(10.9
|
)
|
3.6
|
|
|||
|
Cash flow used in financing activities
|
(313.1
|
)
|
(243.7
|
)
|
|||
|
Effect of foreign currency exchange rate changes on cash and cash equivalents
|
6.7
|
|
4.0
|
|
|||
|
Net decrease in cash and cash equivalents
|
(105.3
|
)
|
(257.7
|
)
|
|||
|
Cash and cash equivalents at beginning of period
|
439.5
|
|
565.5
|
|
|||
|
Effect of deconsolidation of Affiliate sponsored investment products
|
—
|
|
(2.6
|
)
|
|||
|
Cash and cash equivalents at end of period
|
$
|
334.2
|
|
$
|
305.2
|
|
|
The accompanying notes are an integral part of the Consolidated Financial Statements.
7
AFFILIATED MANAGERS GROUP, INC.
NOTES TO CONSOLIDATED FINANCIAL STATEMENTS (unaudited)
|
1.
|
Basis of Presentation and Use of Estimates
|
The Consolidated Financial Statements of Affiliated Managers Group, Inc. (the “Company”) have been prepared in accordance with accounting principles generally accepted in the United States of America (“GAAP”) for interim financial information and with the instructions to Form 10-Q and Rule 10-01 of Regulation S-X. Accordingly, they do not include all of the information and footnotes required by GAAP for full year financial statements. In the opinion of management, all normal and recurring adjustments considered necessary for a fair statement of the Company’s interim financial position and results of operations have been included and all intercompany balances and transactions have been eliminated. Certain reclassifications have been made to the prior period’s financial statements to conform to the current period’s presentation. Operating results for interim periods are not necessarily indicative of the results that may be expected for any other period or for the full year. The Company’s Annual Report on Form 10-K for the fiscal year ended
December 31, 2018
includes additional information about its operations, financial position and accounting policies, and should be read in conjunction with this Quarterly Report on Form 10-Q.
The preparation of financial statements in conformity with GAAP requires management to make estimates and assumptions that affect the reported amounts and disclosures in the financial statements. Actual results could differ from those estimates.
All amounts in these notes, except per share data in the text and tables herein, are stated in millions unless otherwise indicated.
|
2.
|
Accounting Standards and Policies
|
Recently Adopted Accounting Standards
Effective January 1, 2019, the Company adopted the following new Accounting Standard Updates (“ASUs”):
|
•
|
ASU 2016-02, Leases (and related ASUs);
|
|
•
|
ASU 2018-02, Income Statement - Reporting Comprehensive Income: Reclassification of Certain Tax Effects from Accumulated Other Comprehensive Income; and
|
|
•
|
ASU 2014-09, Revenue from Contracts with Customers (and related ASUs, effective for the Company’s equity method Affiliates)
|
The adoption of ASU 2016-02 was the only ASU that had a significant impact on the Company’s Consolidated Financial Statements.
The Company adopted ASU 2016-02 using a modified retrospective method and, as a result, recorded a lease liability of
$190.8 million
and after certain reclassifications, primarily related to accrued lease payments and unamortized lease incentives, a right-of-use asset of
$163.6 million
as of January 1, 2019. Additionally, the Company elected the transition practical expedients provided by ASU 2016-02, which allowed the Company to carryforward its historical lease classification. Having adopted ASU 2016-02, the Company updated its leases accounting policy as described below. For a complete list of significant accounting policies, see the Company’s Annual Report on Form 10-K for the fiscal year ended
December 31, 2018
.
Leases
Leases are classified as either operating leases or finance leases. The Company and its Affiliates currently lease office space and equipment primarily under operating lease arrangements. As these leases expire, it is expected that, in the normal course of business, they will be renewed or replaced. Whether a lease is classified as an operating lease or a finance lease, the Company and its Affiliates must record a right-of-use asset and a lease liability for all leases at the commencement date of the lease, other than for leases with an initial term of 12 months or less. As permitted under ASU 2016-02, the Company and its Affiliates elect not to record short-term leases with an initial lease term less than 12 months on the Company’s Consolidated Balance Sheets. Right-of-use assets and lease liabilities are reported in Other assets and Other liabilities, respectively, on the Consolidated Balance Sheets. A lease liability is initially and subsequently reported at the present value of the outstanding lease payments determined by discounting those lease payments over the remaining lease term using the incremental borrowing rate of the legal entity entering into the lease as of the commencement date. A right-of-use asset is initially reported at the present value of the corresponding lease liability plus any prepaid lease payments and initial direct costs of entering into the lease, and reduced by any lease incentives. Subsequently, a right-of-use asset is reported at the present value of the lease
8
AFFILIATED MANAGERS GROUP, INC.
NOTES TO CONSOLIDATED FINANCIAL STATEMENTS (unaudited)
liability adjusted for any prepaid or accrued lease payments, remaining balances of any lease incentives received, unamortized initial direct costs of entering into the lease and any impairments of the right-of-use asset. The Company and its Affiliates test for possible impairments of right-of-use assets annually or more frequently whenever events or changes in circumstances indicate that the carrying value of a right-of-use asset may exceed its fair value. If the carrying value of the right-of-use asset exceeds its fair value, then the carrying value of the right-of-use asset is reduced to its fair value and the expense is recorded in Other expenses (net) on the Consolidated Statements of Income. Subsequent to an impairment, the carrying value of the right-of-use asset is amortized on a straight-line basis over the remaining lease term.
Lease liabilities and right-of-use assets based on variable lease payments that depend on an index or rate are initially measured using the index or rate at the commencement date with any subsequent changes in variable lease payments reported in Other expenses (net) as incurred. Most lease agreements for office space that are classified as operating leases contain renewal options, rent escalation clauses or other lease incentives provided by the lessor. Lease expense is accrued to recognize lease escalation provisions and renewal options that are reasonably certain to be exercised, as well as lease incentives provided by the lessor, on a straight-line basis over the lease term and is reported in Other expenses (net). If a right-of-use asset is impaired, the lease expense is subsequently reported in Other expenses (net) as the straight-line amortization of the right-of-use asset and the accretion of the lease liability, thereby transitioning to a front-loaded expense recognition profile for the associated lease.
The Company and its Affiliates combine lease and non-lease components for their office space leases and separate non-lease components for their equipment leases in calculating their lease liabilities. Sublease income is reported in Investment and other income on the Consolidated Statements of Income.
|
3.
|
Investments in Marketable Securities
|
The following is a summary of the cost, gross unrealized gains, and losses and fair value of Investments in marketable securities:
|
|
December 31,
2018 |
March 31,
2019 |
|||||
|
Cost
|
$
|
126.8
|
|
$
|
35.0
|
|
|
|
Unrealized gains
|
1.1
|
|
1.6
|
|
|||
|
Unrealized losses
|
(8.6
|
)
|
(0.2
|
)
|
|||
|
Fair value
|
$
|
119.3
|
|
$
|
36.4
|
|
|
For the three months ended
March 31, 2018
and
2019
, the Company received proceeds of
$13.8 million
and
$15.1 million
, respectively, from the sale of investments in marketable securities, and recorded net gains of
$2.8 million
and
$0.5 million
, respectively.
For the three months ended
March 31, 2019
, the Company deconsolidated an Affiliate sponsored investment product with a fair value of
$84.3 million
.
|
4.
|
Investments in Affiliates and Affiliate Sponsored Investment Products
|
In evaluating whether an investment must be consolidated, the Company evaluates the risk, rewards and significant terms of each of its Affiliates and other investments to determine if an investment is considered a voting rights entity (“VRE”) or a variable interest entity (“VIE”). An entity is a VRE when the total equity investment at risk is sufficient to enable the entity to finance its activities independently, and when the equity holders have the obligation to absorb losses, the right to receive residual returns and the right to direct the activities of the entity that most significantly impact its economic performance. An entity is a VIE when it lacks one or more of the characteristics of a VRE, which, for the Company, are Affiliate investments structured as partnerships (or similar entities) where the Company is a limited partner and lacks substantive kick-out or substantive participation rights over the general partner. Assessing whether an entity is a VRE or VIE involves judgment. Upon the occurrence of certain events, management reviews and reconsiders its previous conclusion regarding the status of an entity as a VRE or a VIE.
The Company consolidates VREs when it has control over significant operating, financial and investing decisions of the entity. When the Company lacks such control, but is deemed to have significant influence, the Company accounts for the entity under the equity method. Other investments in which the Company does not have rights to exercise significant influence are
9
AFFILIATED MANAGERS GROUP, INC.
NOTES TO CONSOLIDATED FINANCIAL STATEMENTS (unaudited)
recorded at fair value, with changes in fair value reflected within Investment and other income on the Consolidated Statements of Income.
The Company consolidates VIEs when it is the primary beneficiary of the entity, which is defined as having the power to direct the activities that most significantly impact the VIE’s economic performance and the obligation to absorb losses of, or the right to receive benefits from, the entity that could potentially be significant to the VIE. Substantially all of the Company’s consolidated Affiliates considered VIEs are controlled because the Company holds a majority of the voting interests or it is the managing member or general partner. Furthermore, an Affiliates’ assets can be used for purposes other than the settlement of the respective Affiliate’s obligations. The Company applies the equity method of accounting to VIEs where the Company is not the primary beneficiary, but has the ability to exercise significant influence over operating and financial matters of the VIE.
Investments in Affiliates
Substantially all of the Company’s Affiliates are considered VIEs and are either consolidated or accounted for under the equity method. A limited number of the Company’s Affiliates are considered VREs and most of these are accounted for under the equity method.
When an Affiliate is consolidated, the portion of the earnings attributable to Affiliate management’s equity ownership is included in Net income (non-controlling interests) in the Consolidated Statements of Income. Undistributed earnings attributable to Affiliate managements’ equity ownership, along with their share of any tangible or intangible net assets, are presented within Non-controlling interests on the Consolidated Balance Sheets. Affiliate equity interests where the holder has certain rights to demand settlement are presented, at their current redemption values, as Redeemable non-controlling interests on the Consolidated Balance Sheets. The Company periodically issues, sells and repurchases the equity of its consolidated Affiliates. Because these transactions take place between entities that are under common control, any gains or losses attributable to these transactions are required to be included within Additional paid-in capital in the Consolidated Balance Sheets, net of any related income tax effects in the period the transaction occurs.
When an Affiliate is accounted for under the equity method, the Company’s share of an Affiliate’s earnings or losses, net of amortization and impairments, is included in Equity method income (loss) (net) in the Consolidated Statements of Income and the carrying value of the Affiliate is reported in Equity method investments in Affiliates (net) in the Consolidated Balance Sheets. Any deferred taxes recorded upon acquisition of an equity method Affiliate are presented on a gross basis within Equity method investments in Affiliates (net) and Deferred income tax liability (net) in the Consolidated Balance Sheets. The Company’s share of income taxes incurred directly by Affiliates accounted for under the equity method is recorded within Income tax expense (benefit) in the Consolidated Statements of Income.
The Company periodically evaluates its equity method Affiliates for impairment. In such impairment evaluations, the Company assesses whether or not the fair value of the investment has declined below its carrying value for a period considered to be other-than-temporary. If the Company determines that a decline in fair value below the carrying value of the investment is other-than-temporary, then the carrying value of the investment is reduced to its fair value and the expense is recorded in Equity method income (loss) (net).
The unconsolidated assets, net of liabilities and non-controlling interests of equity method Affiliates considered VIEs, and the Company’s carrying value and maximum exposure to loss, were as follows:
|
|
December 31, 2018
|
March 31, 2019
|
|||||||||||||
|
Unconsolidated
VIE Net Assets |
Carrying Value and
Maximum Exposure to Loss |
Unconsolidated
VIE Net Assets |
Carrying Value and
Maximum Exposure to Loss |
||||||||||||
|
Affiliates accounted for under the equity method
|
$
|
1,102.9
|
|
$
|
2,277.8
|
|
$
|
1,167.6
|
|
$
|
1,822.9
|
|
|||
As of
December 31, 2018
and
March 31, 2019
, the carrying value and maximum exposure to loss for all of the Company’s equity method Affiliates was
$2,791.0 million
and
$2,318.5 million
, respectively, including equity method Affiliates considered VREs of
$513.2 million
and
$495.6 million
, respectively.
10
AFFILIATED MANAGERS GROUP, INC.
NOTES TO CONSOLIDATED FINANCIAL STATEMENTS (unaudited)
Affiliate Sponsored Investment Products
The Company’s Affiliates sponsor various investment products where they also act as the investment adviser. These investment products are typically owned primarily by third-party investors; however, certain products are funded with general partner and seed capital investments from the Company and its Affiliates.
Third-party investors in Affiliate sponsored investment products are generally entitled to substantially all of the economics of these products, except for the asset and performance based fees earned by the Company’s Affiliates or any gains or losses attributable to the Company’s or its Affiliates’ investments in these products. As a result, the Company does not generally consolidate these products unless the Company’s or its consolidated Affiliate’s interest in the product is considered substantial. When the Company’s or its consolidated Affiliates’ interests are considered substantial and the products are consolidated, the Company retains the specialized investment company accounting principles of the underlying products, and all of the underlying investments are carried at fair value in Investments in marketable securities in the Consolidated Balance Sheets, with corresponding changes in the investments’ fair values reflected in Investment and other income. Purchases and sales of securities are presented within purchases and sales by consolidated Affiliate sponsored investment products in the Consolidated Statements of Cash Flows and the third-party investors’ interests are recorded in Redeemable non-controlling interests. When the Company or its consolidated Affiliates no longer control these products, due to a reduction in ownership or other reasons, the products are deconsolidated with only the Company’s or its consolidated Affiliate’s investment in the product reported from the date of deconsolidation.
The Company’s carrying value, and maximum exposure to loss from unconsolidated Affiliate sponsored investment products, is its or its consolidated Affiliate’s interest in the unconsolidated net assets of the respective products. The net assets of unconsolidated VIEs attributable to Affiliate sponsored investment products, and the Company’s carrying value and maximum exposure to loss, were as follows:
|
|
December 31, 2018
|
March 31, 2019
|
|||||||||||||
|
|
Unconsolidated
VIE Net Assets
|
Carrying Value and
Maximum Exposure
to Loss
|
Unconsolidated
VIE Net Assets
|
Carrying Value and
Maximum Exposure
to Loss
|
|||||||||||
|
Affiliate sponsored investment products
|
$
|
2,216.5
|
|
$
|
1.1
|
|
$
|
2,208.5
|
|
$
|
0.6
|
|
|||
|
5.
|
Debt
|
The Company’s Debt consisted of the following:
|
December 31,
2018 |
March 31,
2019 |
||||||
|
Senior bank debt
|
$
|
779.7
|
|
$
|
459.7
|
|
|
|
Senior notes
|
742.5
|
|
742.8
|
|
|||
|
Junior convertible securities
|
307.4
|
|
308.2
|
|
|||
|
Junior subordinated notes
|
—
|
|
270.0
|
|
|||
|
Debt
|
$
|
1,829.6
|
|
$
|
1,780.7
|
|
|
Long-term debt is carried at amortized cost. Unamortized discounts and debt issuance costs related to long-term debt are presented in the Consolidated Balance Sheets as an adjustment to the carrying value of the associated long-term debt.
Senior Bank Debt
On January 18, 2019, the Company amended and restated its existing credit facilities to provide for a
$1.25 billion
senior unsecured multicurrency revolving credit facility (the “revolver”) and a
$450.0 million
senior unsecured term loan facility (the “term loan” and, together with the revolver, the “credit facilities”). The revolver matures on January 18, 2024, and the term loan matures on January 18, 2023. Subject to certain conditions, the Company may increase the commitments under the revolver by up to an additional
$500.0 million
and may borrow up to an additional
$75.0 million
under the term loan. The Company pays interest on any outstanding obligations under the credit facilities at specified rates, based either on an applicable LIBOR or prime rate, plus a marginal rate determined based on its credit rating. For the three months ended March 31, 2019, the interest rate for substantially all of the Company’s borrowings under the credit facilities was LIBOR plus
1.10%
for the revolver and LIBOR plus
0.875%
for the term loan.
11
AFFILIATED MANAGERS GROUP, INC.
NOTES TO CONSOLIDATED FINANCIAL STATEMENTS (unaudited)
Junior Subordinated Notes
On March 27, 2019, the Company issued
$280.0 million
of junior subordinated notes with a maturity date of March 30, 2059. The junior subordinated notes bear interest at a fixed rate of
5.875%
per annum, payable quarterly in cash, commencing on June 30, 2019, subject to the Company’s right to defer interest payments in accordance with the terms of the junior subordinated notes. The junior subordinated notes were issued at
100%
of the principal amount and rank junior and subordinate in right of payment and upon liquidation to all of the Company’s current and future senior indebtedness. On or after March 30, 2024, at the Company’s option, the junior subordinated notes may be redeemed in whole or in part, at
100%
of the principal amount, plus any accrued and unpaid interest. Prior to March 30, 2024, at the Company’s option, the junior subordinated notes may be redeemed in whole but not in part, at
100%
of the principal amount, plus any accrued and unpaid interest, if certain changes in tax laws, regulations or interpretations occur; or at
102%
of the principal amount, plus any accrued and unpaid interest, if a rating agency makes certain changes relating to the equity credit criteria for securities with features similar to the junior subordinated notes.
On April 8, 2019, the Company issued an additional
$20.0 million
of junior subordinated notes pursuant to the underwriters’ exercise of an overallotment option, which increased the total amount issued to
$300.0 million
.
|
6.
|
Equity Distribution Program
|
On March 27, 2019, the Company entered into equity distribution and forward equity agreements with several major securities firms under which it may, from time to time, issue and sell shares of its common stock (immediately or on a forward basis) having an aggregate sales price of up to
$500.0 million
(the “equity distribution program”). This equity distribution program superseded and replaced the Company’s prior equity distribution program. As of
March 31, 2019
,
no
sales had occurred under the new or prior equity distribution program.
7. Derivative Financial Instruments
The Company and its Affiliates may use derivative financial instruments to offset exposure to changes in interest rates, foreign currency exchange rates and markets.
The Company has
two
separate pound sterling-denominated forward foreign currency contracts (the “forward contracts”) with a large financial institution (the “counterparty”). Concurrent to entering into each of the forward contracts, the Company also entered into
two
separate collar contracts (the “collar contracts”) with the same counterparty for the same notional amounts and expiration dates as the forward contracts. Under one of the forward contracts, the Company will deliver
£285.8 million
for
$400.0 million
in 2024 and under the other forward contract, the Company will deliver
£325.3 million
for
$450.0 million
in 2021. Under one of the collar contracts, the Company sold a put option with a lower strike price of
1.288
U.S. dollars per one pound sterling and purchased a call option with an upper strike price of
1.535
U.S. dollars per one pound sterling. Under the other collar contract, the Company sold a put option with a lower strike price of
1.318
U.S. dollars per one pound sterling and purchased a call option with an upper strike price of
1.448
U.S. dollars per one pound sterling.
The combination of the forward contracts and the collar contracts were designated as net investment hedges against fluctuations in foreign currency exchange rates on certain of the Company’s investments in Affiliates with the pound sterling as their functional currency.
Changes in the fair values of the effective net investment hedges are reported in Foreign currency translation gain (loss) in the Consolidated Statements of Comprehensive Income. The Company assesses hedge effectiveness on a quarterly basis.
The Company’s Affiliates use forward foreign currency contracts to hedge the risk of foreign exchange rate movements, which were not significant for the three months ended
March 31, 2018
and
2019
.
Derivative financial instruments are presented in Other assets when in an unrealized gain position and in Other liabilities when in an unrealized loss position. When a right to offset exists between derivative financial instruments they are presented net in the Consolidated Balance Sheets. The following table summarizes the Company’s and its Affiliates’ derivative financial instruments measured at fair value on a recurring basis:
12
AFFILIATED MANAGERS GROUP, INC.
NOTES TO CONSOLIDATED FINANCIAL STATEMENTS (unaudited)
|
December 31, 2018
|
March 31, 2019
|
|||||||||||||||
|
Assets
|
Liabilities
|
Assets
|
Liabilities
|
|||||||||||||
|
Forward contracts
|
$
|
32.0
|
|
$
|
(1.4
|
)
|
$
|
17.2
|
|
$
|
(0.0
|
)
|
||||
|
Put options
|
—
|
|
(60.3
|
)
|
—
|
|
(42.4
|
)
|
||||||||
|
Call options
|
34.1
|
|
—
|
|
26.6
|
|
—
|
|
||||||||
|
Total
|
$
|
66.1
|
|
$
|
(61.7
|
)
|
$
|
43.8
|
|
$
|
(42.4
|
)
|
||||
The following table summarizes the effect of the derivative financial instruments on the Consolidated Statements of Comprehensive Income and the Consolidated Statements of Income. For the three months ended
March 31, 2018
, the Company and its Affiliates did not have any significant derivative financial instruments.
|
For the Three Months Ended March 31, 2019
|
||||||||
|
Gain (Loss) Recognized in Other Comprehensive Income
|
Gain Recognized in Earnings from Excluded Components
(1)
|
|||||||
|
Forward contracts
|
$
|
(16.8
|
)
|
$
|
3.5
|
|
||
|
Put options
|
17.9
|
|
—
|
|
||||
|
Call options
|
(7.5
|
)
|
—
|
|
||||
|
Total
|
$
|
(6.4
|
)
|
$
|
3.5
|
|
||
|
(1)
|
The excluded components of the forward contracts are recognized in earnings on a straight-line basis over the respective period of the contracts as a reduction to Interest expense on the Consolidated Statements of Income.
|
As of
March 31, 2019
, the Company and its Affiliates did not have any significant gains (losses) reclassified from Accumulated other comprehensive loss into earnings.
The terms of the Company’s forward contracts and collar contracts provide net settlement rights and require the Company and the counterparty to post cash collateral in certain circumstances throughout the duration of the contracts. As of
March 31, 2019
, the Company did
no
t hold any cash collateral from the counterpary and the counterparty held
$14.9 million
of cash collateral from the Company.
The derivative contracts are governed by an International Swaps and Derivative Association (“ISDA”) Master Agreement with the counterparty, which provides for settlement netting and close-out netting between the Company and the counterparty, which are legally enforceable rights to setoff. The Company also actively monitors its counterparty credit risk related to derivative financial instruments. The Company’s derivative contracts include provisions to protect against counterparty rating downgrades, which in certain cases may result in the counterparty posting additional collateral to the Company or give the Company a termination right. The Company considers set-off rights and counterparty credit risk in the valuation of its positions and recognizes a credit valuation adjustment as appropriate. The Company’s forward contracts and collar contracts include contingent features that could require the Company or the counterparty to post additional collateral or give rise to termination rights, if certain specified rating downgrades were to occur. As of
March 31, 2019
, there were
no
derivative arrangements with a contingent feature that were in a net liability position.
|
8.
|
Commitments and Contingencies
|
From time to time, the Company and its Affiliates may be subject to claims, legal proceedings and other contingencies in the ordinary course of their business activities. Any such matters are subject to various uncertainties, and it is possible that some of these matters may be resolved in a manner unfavorable to the Company or its Affiliates. The Company and its Affiliates establish accruals, as necessary, for matters for which the outcome is probable and the amount of the liability can be reasonably estimated.
The Company has committed to co-invest in certain Affiliate sponsored investment products. As of
March 31, 2019
, these unfunded commitments were
$146.6 million
and may be called in future periods.
13
AFFILIATED MANAGERS GROUP, INC.
NOTES TO CONSOLIDATED FINANCIAL STATEMENTS (unaudited)
As of
March 31, 2019
, the Company was contingently liable, upon the achievement by certain Affiliates of specified financial targets, to make payments of
$152.5 million
through 2020 related to the Company’s investments in these Affiliates. As of
March 31, 2019
, the Company expected to make no significant payments for contingent payment arrangements.
Affiliate equity interests provide holders with a conditional right to put their interests to the Company over time. See Note 16 for additional information. In addition, in connection with one of the Company’s investments in a non-U.S. alternative Affiliate accounted for under the equity method, the Company entered into an arrangement with a minority owner of the Affiliate that gives such owner the right to elect to sell a portion of its
19%
ownership interest in the Affiliate to the Company annually. The purchase price of these conditional purchases will be at fair market value. During the three months ended
March 31, 2019
, the Company was notified by the minority owner that it had elected to sell a
5%
ownership interest in the Affiliate to the Company. The Company will pay
$25.7 million
for the interest, and the sale is expected to be completed in the second quarter of 2019. The Company will continue to account for the Affiliate under the equity method.
The Company and certain of its consolidated Affiliates operate under regulatory authorities that require the maintenance of minimum financial or capital requirements. Management is not aware of any significant violations of such requirements.
|
9.
|
Fair Value Measurements
|
The following tables summarize the Company’s financial assets and liabilities that are measured at fair value on a recurring basis:
|
|
|
Fair Value Measurements
|
|||||||||||||
|
|
December 31,
2018 |
||||||||||||||
|
|
Quoted Prices in Active Markets for Identical Assets (Level 1)
|
Significant Other Observable Inputs (Level 2)
|
Significant Unobservable Inputs (Level 3)
|
||||||||||||
|
Financial Assets
|
|
|
|
|
|||||||||||
|
Investments in marketable securities
|
$
|
119.3
|
|
$
|
119.3
|
|
$
|
—
|
|
$
|
—
|
|
|||
|
Derivative financial instruments
(1)
|
5.8
|
|
—
|
|
5.8
|
|
—
|
|
|||||||
|
Financial Liabilities
(2)
|
|
|
|
|
|||||||||||
|
Contingent payment arrangements
|
$
|
1.9
|
|
$
|
—
|
|
$
|
—
|
|
$
|
1.9
|
|
|||
|
Affiliate equity repurchase obligations
|
36.2
|
|
—
|
|
—
|
|
36.2
|
|
|||||||
|
Derivative financial instruments
|
1.4
|
|
—
|
|
1.4
|
|
—
|
|
|||||||
|
|
|
Fair Value Measurements
|
|||||||||||||
|
|
March 31,
2019 |
||||||||||||||
|
|
Quoted Prices in Active Markets for Identical Assets (Level 1)
|
Significant Other Observable Inputs (Level 2)
|
Significant Unobservable Inputs (Level 3)
|
||||||||||||
|
Financial Assets
|
|
|
|
|
|||||||||||
|
Investments in marketable securities
|
$
|
36.4
|
|
$
|
36.4
|
|
$
|
—
|
|
$
|
—
|
|
|||
|
Derivative financial instruments
(1)
|
1.4
|
|
—
|
|
1.4
|
|
—
|
|
|||||||
|
Financial Liabilities
(2)
|
|
|
|
|
|||||||||||
|
Contingent payment arrangements
|
$
|
2.0
|
|
$
|
—
|
|
$
|
—
|
|
$
|
2.0
|
|
|||
|
Affiliate equity repurchase obligations
|
75.4
|
|
—
|
|
—
|
|
75.4
|
|
|||||||
|
Derivative financial instruments
|
0.0
|
|
—
|
|
0.0
|
|
—
|
|
|||||||
__________________________
|
(1)
|
Amounts are presented within Other assets.
|
|
(2)
|
Amounts are presented within Other liabilities.
|
Level 3 Financial Assets and Liabilities
14
AFFILIATED MANAGERS GROUP, INC.
NOTES TO CONSOLIDATED FINANCIAL STATEMENTS (unaudited)
The following table presents the changes in level 3 liabilities:
|
|
For the Three Months Ended March 31,
|
||||||||||||||
|
2018
|
2019
|
||||||||||||||
|
Contingent Payment Arrangements
|
Affiliate Equity Repurchase Obligations
|
Contingent Payment Arrangements
|
Affiliate Equity Repurchase Obligations
|
||||||||||||
|
Balance, beginning of period
|
$
|
9.4
|
|
$
|
49.2
|
|
$
|
1.9
|
|
$
|
36.2
|
|
|||
|
Net realized and unrealized losses
(1)
|
0.4
|
|
—
|
|
0.1
|
|
—
|
|
|||||||
|
Purchases and issuances
(2)
|
—
|
|
45.6
|
|
—
|
|
54.6
|
|
|||||||
|
Settlements and reductions
|
—
|
|
(15.4
|
)
|
—
|
|
(15.4
|
)
|
|||||||
|
Balance, end of period
|
$
|
9.8
|
|
$
|
79.4
|
|
$
|
2.0
|
|
$
|
75.4
|
|
|||
|
Net change in unrealized losses relating to instruments still held at the reporting date
|
$
|
0.4
|
|
$
|
—
|
|
$
|
0.3
|
|
$
|
—
|
|
|||
___________________________
|
(1)
|
Accretion expense for these arrangements is recorded in Interest expense.
|
|
(2)
|
Includes transfers from Redeemable non-controlling interests.
|
The following table presents certain quantitative information about the significant unobservable inputs used in valuing the Company’s level 3 fair value measurements:
|
|
Quantitative Information About Level 3 Fair Value Measurements
|
||||||||||||||||||
|
December 31, 2018
|
March 31, 2019
|
||||||||||||||||||
|
|
Valuation
Techniques
|
Unobservable
Input
|
Fair Value
|
Range
|
Weighted Average
|
Fair Value
|
Range
|
Weighted Average
|
|||||||||||
|
Contingent payment arrangements
|
Discounted cash flow
|
Growth rates
|
$
|
1.9
|
|
7%
|
7%
|
$
|
2.0
|
|
7%
|
7%
|
|||||||
|
|
Discount rates
|
|
|
15%
|
15%
|
|
|
15%
|
15%
|
||||||||||
|
Affiliate equity repurchase obligations
|
Discounted cash flow
|
Growth rates
|
36.2
|
|
(4)% - 9%
|
3%
|
75.4
|
|
(4)% - 9%
|
5%
|
|||||||||
|
|
Discount rates
|
|
|
14% - 16%
|
15%
|
|
|
13% - 17%
|
15%
|
||||||||||
Contingent payment arrangements represent the present value of the expected future settlement amounts related to the Company’s investments in consolidated Affiliates. As of
March 31, 2019
, there were
no
changes to growth rates or discount rates that had a significant impact to contingent payment arrangements.
Affiliate equity repurchase obligations include agreements to repurchase Affiliate equity. As of
March 31, 2019
, there were
no
changes to growth or discount rates that had a significant impact to Affiliate equity repurchase obligations recorded in prior periods.
Investments Measured at NAV as a Practical Expedient
The Company’s Affiliates sponsor investment products in which the Company and its Affiliates may make general partner and seed capital investments. The Company uses the net asset value (“NAV”) of these investments as a practical expedient for their fair values and reports these investments within Other investments. The following table summarizes the fair values of these investments and unfunded commitments:
15
AFFILIATED MANAGERS GROUP, INC.
NOTES TO CONSOLIDATED FINANCIAL STATEMENTS (unaudited)
|
|
December 31, 2018
|
March 31, 2019
|
|||||||||||||
|
Category of Investment
|
Fair Value
|
Unfunded
Commitments
|
Fair Value
|
Unfunded
Commitments
|
|||||||||||
|
Private equity funds
(1)
|
$
|
193.2
|
|
$
|
131.0
|
|
$
|
198.5
|
|
$
|
146.6
|
|
|||
|
Other funds
(2)
|
7.9
|
|
—
|
|
9.0
|
|
—
|
|
|||||||
|
Other investments
(3)
|
$
|
201.1
|
|
$
|
131.0
|
|
$
|
207.5
|
|
$
|
146.6
|
|
|||
___________________________
|
(1)
|
The Company uses NAV as a practical expedient one quarter in arrears (adjusted for current period calls and distributions) to determine the fair value. These funds primarily invest in a broad range of private equity funds, as well as making direct investments. Distributions will be received as the underlying assets are liquidated over the life of the funds, which is generally up to
15 years
.
|
|
(2)
|
These are multi-disciplinary funds that invest across various asset classes and strategies, including long/short equity, credit and real estate. Investments are generally redeemable on a daily, monthly or quarterly basis.
|
|
(3)
|
Fair value attributable to the controlling interest was
$123.2 million
and
$131.3 million
as of
December 31, 2018
and
March 31, 2019
, respectively.
|
Other Financial Assets and Liabilities Not Carried at Fair Value
The Company has other financial assets and liabilities, which are not required to be carried at fair value, but the Company is required to disclose their fair values. The carrying amount of Cash and cash equivalents, Receivables, and Payables and accrued liabilities approximates fair value because of the short-term nature of these instruments. The carrying value of notes receivable, which is reported in Other assets, approximates fair value because interest rates and other terms are at market rates. The carrying value of the credit facilities approximates fair value because the credit facilities have variable interest based on selected short-term rates. The following table summarizes the Company’s other financial liabilities not carried at fair value:
|
|
December 31, 2018
|
March 31, 2019
|
|||||||||||||||
|
Carrying Value
|
Fair Value
|
Carrying Value
|
Fair Value
|
Fair Value Hierarchy
|
|||||||||||||
|
Senior notes
|
$
|
746.2
|
|
$
|
747.5
|
|
$
|
746.4
|
|
$
|
760.6
|
|
Level 2
|
||||
|
Junior convertible securities
|
312.5
|
|
391.5
|
|
313.2
|
|
436.7
|
|
Level 2
|
||||||||
|
Junior subordinated notes
|
—
|
|
—
|
|
271.3
|
|
275.3
|
|
Level 2
|
||||||||
|
10.
|
Goodwill and Acquired Client Relationships
|
The following tables present the changes in the Company’s consolidated Affiliates’ Goodwill and components of Acquired client relationships (net):
|
Goodwill
|
||||
|
Balance, as of December 31, 2018
|
$
|
2,633.4
|
|
|
|
Foreign currency translation
|
9.0
|
|
||
|
Balance, as of March 31, 2019
|
$
|
2,642.4
|
|
|
|
|
Acquired Client Relationships (Net)
|
||||||||||||||||||
|
|
Definite-lived
|
Indefinite-lived
|
Total
|
||||||||||||||||
|
|
Gross Book
Value
|
Accumulated
Amortization
|
Net Book
Value
|
Net Book
Value
|
Net Book
Value
|
||||||||||||||
|
Balance, as of December 31, 2018
|
$
|
1,292.5
|
|
$
|
(988.9
|
)
|
$
|
303.6
|
|
$
|
1,006.3
|
|
$
|
1,309.9
|
|
||||
|
Intangible amortization and impairments
|
—
|
|
(29.6
|
)
|
(29.6
|
)
|
—
|
|
(29.6
|
)
|
|||||||||
|
Foreign currency translation
|
1.0
|
|
—
|
|
1.0
|
|
8.2
|
|
9.2
|
|
|||||||||
|
Balance, as of March 31, 2019
|
$
|
1,293.5
|
|
$
|
(1,018.5
|
)
|
$
|
275.0
|
|
$
|
1,014.5
|
|
$
|
1,289.5
|
|
||||
Definite-lived acquired client relationships are amortized over their expected period of economic benefit. The Company recorded amortization expense within Intangible amortization and impairments in the Consolidated Statements of Income for
16
AFFILIATED MANAGERS GROUP, INC.
NOTES TO CONSOLIDATED FINANCIAL STATEMENTS (unaudited)
these relationships of
$23.2 million
and
$29.6 million
for the three months ended
March 31, 2018
and
2019
, respectively. Based on relationships existing as of
March 31, 2019
, the Company estimates that its consolidated annual amortization expense will be approximately
$120 million
in 2019, approximately
$90 million
in 2020, and approximately
$65 million
in each of 2021, 2022 and 2023.
|
11.
|
Equity Method Investments in Affiliates
|
The following table presents the change in Equity method investments in Affiliates (net):
|
Equity Method Investments in Affiliates (Net)
|
|||
|
Balance, as of December 31, 2018
|
$
|
2,791.0
|
|
|
Earnings
|
80.1
|
|
|
|
Intangible amortization and impairments
|
(438.2
|
)
|
|
|
Distributions of earnings
|
(96.5
|
)
|
|
|
Foreign currency translation
|
(16.9
|
)
|
|
|
Investments in Affiliates
|
34.1
|
|
|
|
Divestments of Affiliates
|
(28.8
|
)
|
|
|
Other
|
(6.3
|
)
|
|
|
Balance, as of March 31, 2019
|
$
|
2,318.5
|
|
Definite-lived acquired relationships at the Company’s equity method Affiliates are amortized over their expected period of economic benefit. The Company recognized amortization expense for these relationships of
$30.0 million
and
$23.2 million
for the three months ended
March 31, 2018
and
2019
, respectively. Based on relationships existing as of
March 31, 2019
, the Company estimates the annual amortization expense attributable to its equity method Affiliates will be approximately
$90 million
in each of 2019 and 2020, and approximately
$85 million
in each of 2021, 2022 and 2023.
During the three months ended March 31, 2019, the Company recognized a
$415.0 million
expense to reduce the carrying value of one of its equity method Affiliates to its fair value. A series of precipitating events led the Company to conclude in March 2019 that the growth expectations of a U.S. credit alternative Affiliate of the Company had declined significantly, which the Company determined constituted a triggering event. The Affiliate’s flagship product has underperformed. The cumulative effect of associated redemptions and scaled-down fundraising expectations reduced expected asset and performance based fees and operating margin at the Affiliate. This led to a significant decrease in projected operating cash flows available to fund the Affiliate’s growth strategy, prompting a change in the strategic objectives of the Affiliate, including exiting the systematic equity business and reducing the number of new investment strategies being pursued. The Company determined that the estimated fair value of the Affiliate had declined meaningfully. Therefore, the Company performed a valuation to determine whether the fair value of the Affiliate had declined below its carrying value using a discounted cash flow analysis, a level 3 fair value measurement. The Company assumed projected compounded asset based fee growth over the first
five
years of
(13)%
, discount rates of
11%
and
20%
for asset and performance based fees, respectively, and a market participant tax rate of
25%
. Based on the discounted cash flow analysis, the Company concluded that the fair value of its investment had declined below its carrying value and that the decline was other-than-temporary.
12. Lease Commitments
The Company and its Affiliates currently lease office space and equipment under various operating leasing arrangements. The following table presents total lease costs (net):
|
For the Three Months Ended March 31, 2019
|
||||
|
Operating lease costs
|
$
|
9.0
|
|
|
|
Short-term lease costs
|
0.5
|
|
||
|
Variable lease costs
|
0.1
|
|
||
|
Sublease income
|
(1.0
|
)
|
||
|
Total lease costs (net)
|
$
|
8.6
|
|
|
17
AFFILIATED MANAGERS GROUP, INC.
NOTES TO CONSOLIDATED FINANCIAL STATEMENTS (unaudited)
For the three months ended
March 31, 2019
, cash flows for operating leases were
$8.9 million
and there were
no
significant right-of-use assets obtained in exchange for new operating leases. As of March 31, 2019, the Company’s and its Affiliates’ weighted average operating lease term was
7.9
years and the weighted average operating lease discount rate was
4.1%
.
As of March 31, 2019, the maturity of lease liabilities were as follows:
|
Operating Leases
|
||||
|
Remainder of 2019
|
$
|
25.0
|
|
|
|
2020
|
37.0
|
|
||
|
2021
|
35.9
|
|
||
|
2022
|
27.9
|
|
||
|
2023
|
23.6
|
|
||
|
Thereafter
|
76.6
|
|
||
|
Total undiscounted lease liabilities
(1)
|
$
|
226.0
|
|
|
|
(1)
|
Total undiscounted lease liabilities were
$42.3 million
greater than the operating leases recorded in Other liabilities primarily due to present value discounting. Both amounts exclude leases with initial terms of 12 months or less and leases that have not yet commenced.
|
In connection with the Company’s adoption of ASU 2016-02, the Company was not required, and did not, update prior period disclosures from the Company’s Annual Report on Form 10-K for the fiscal year ended
December 31, 2018
. The Company’s reported aggregate required minimum payments for operating leases having initial or non-cancelable lease terms greater than one year under the old standard as of December 31, 2018 were as follows:
|
Year
|
Required Minimum
Payments
|
|||
|
2019
|
$
|
35.5
|
|
|
|
2020
|
36.9
|
|
||
|
2021
|
34.8
|
|
||
|
2022
|
27.7
|
|
||
|
2023
|
23.4
|
|
||
|
Thereafter
|
75.2
|
|
||
13. Related Party Transactions
A prior owner of one of the Company’s consolidated Affiliates retained interests in certain of the Affiliate’s private equity partnerships and, as a result, is a related party of the Company. The prior owner’s interests are presented in Other liabilities and were
$49.7 million
and
$46.1 million
as of
December 31, 2018
and
March 31, 2019
, respectively.
The Company and its Affiliates earn asset and performance based fees and incur distribution and other expenses for services provided to Affiliate sponsored investment products. In addition, Affiliate management owners and the Company’s officers may serve as trustees or directors of certain investment vehicles from which the Company or an Affiliate earns fees.
The Company has related party transactions in association with its Affiliate equity transactions, as more fully described in Notes 15 and 16.
The Company’s executive officers and directors may invest from time to time in funds advised by its Affiliates on substantially the same terms as other investors.
14. Share-Based Compensation
18
AFFILIATED MANAGERS GROUP, INC.
NOTES TO CONSOLIDATED FINANCIAL STATEMENTS (unaudited)
The following table presents share-based compensation expense:
|
For the Three Months Ended March 31,
|
|||||||
|
2018
|
2019
|
||||||
|
Share-based compensation
|
$
|
10.7
|
|
$
|
8.8
|
|
|
|
Tax benefit
|
2.7
|
|
1.8
|
|
|||
As of
December 31, 2018
, the Company had unrecognized share-based compensation expense of
$54.1 million
. As of
March 31, 2019
, the Company had unrecognized share-based compensation expense of
$77.9 million
, which will be recognized over a weighted average period of approximately
two
years (assuming no forfeitures).
Stock Options
The following table summarizes transactions in the Company’s stock options:
|
Stock Options
|
Weighted Average
Exercise Price
|
Weighted Average
Remaining
Contractual Life
(Years)
|
||||||
|
Unexercised options outstanding - December 31, 2018
|
0.5
|
|
$
|
130.81
|
|
|
||
|
Options granted
|
0.0
|
|
110.02
|
|
||||
|
Options exercised
|
(0.0)
|
|
107.63
|
|
||||
|
Options forfeited
|
(0.0)
|
|
122.67
|
|
|
|||
|
Unexercised options outstanding - March 31, 2019
|
0.5
|
|
130.54
|
|
3.7
|
|||
|
Exercisable at March 31, 2019
|
0.4
|
|
129.01
|
|
3.4
|
|||
For the three months ended
March 31, 2018
and 2019, the Company granted stock options with fair values of
$0.5 million
in each period. Stock options generally vest over a period of
three
to
four
years and expire
seven
years after the grant date. All options have been granted with exercise prices equal to the closing price of the Company’s common stock on the grant date. In certain circumstances, option awards also require certain performance conditions to be satisfied in order for the options to be exercised.
The fair value of options granted was estimated using the Black-Scholes option pricing model and were
$53.81
and
$33.58
, per option, for the three months ended
March 31, 2018
and
2019
, respectively. The weighted average grant date assumptions used to estimate the fair value of options granted were as follows:
|
For the Three Months Ended March 31,
|
||||||
|
2018
|
2019
|
|||||
|
Dividend yield
|
0.7
|
%
|
1.2
|
%
|
||
|
Expected volatility
|
24.6
|
%
|
31.9
|
%
|
||
|
Risk-free interest rate
|
2.6
|
%
|
2.6
|
%
|
||
|
Expected life of options (in years)
|
5.7
|
|
5.7
|
|
||
|
Forfeiture rate
|
—
|
%
|
—
|
%
|
||
Restricted Stock
The following table summarizes transactions in the Company’s restricted stock units:
19
AFFILIATED MANAGERS GROUP, INC.
NOTES TO CONSOLIDATED FINANCIAL STATEMENTS (unaudited)
|
Restricted
Stock Units
|
Weighted
Average
Grant Date
Value
|
|||||
|
Unvested units - December 31, 2018
|
0.6
|
|
$
|
172.74
|
|
|
|
Units granted
|
0.3
|
|
110.02
|
|
||
|
Units vested
|
(0.2
|
)
|
169.93
|
|
||
|
Units forfeited
|
(0.0)
|
|
156.63
|
|
||
|
Unvested units - March 31, 2019
|
0.7
|
|
145.80
|
|
||
For the three months ended
March 31, 2018
and
2019
, the Company granted restricted stock unit awards with fair values of
$36.7 million
and
$32.6 million
, respectively. These awards were valued based on the closing price of the Company’s common stock on the grant date and the number of awards expected to be delivered. Awards containing vesting conditions generally require service over a period of
three
to
four
years and may also require the satisfaction of certain performance conditions. In certain cases, awards with performance conditions may use structures whereby the number of shares of the Company’s common stock that an employee ultimately receives at vesting will be equal to the base number of restricted stock units granted, multiplied by a predetermined percentage determined in accordance with the Company’s attainment of certain pre-established performance measures and could be higher or lower than the original restricted stock unit grant. During the three months ended March 31, 2019, there were no changes in the Company’s estimate of the number of shares expected to be delivered.
15. Redeemable Non-Controlling Interests
Affiliate equity interests provide holders with an equity interest in one of the Company’s Affiliates, consistent with the structured partnership interests in place at the respective Affiliate. Affiliate equity holders generally have a conditional right to put their interests to the Company at certain intervals (between
five
and
15
years from the date the equity interest is received or on an annual basis following an Affiliate equity holder’s departure). Prior to becoming redeemable, the value of the Company’s Affiliate equity is presented within Non-controlling interests. Upon becoming redeemable, the value of these interests is reclassified and the current redemption value of these interests is presented as Redeemable non-controlling interests. Changes in the current redemption value are recorded to Additional paid-in capital. When the Company receives a put notice, and, therefore, has an unconditional obligation to repurchase Affiliate equity interests, they are reclassified to Other liabilities. The following table presents the changes in Redeemable non-controlling interests:
|
Redeemable Non-controlling Interests
|
||||
|
Balance, as of December 31, 2018
(1)
|
$
|
833.7
|
|
|
|
Changes attributable to consolidated Affiliate sponsored investment products
|
(84.5
|
)
|
||
|
Transfers to Other liabilities
|
(54.6
|
)
|
||
|
Transfers from Non-controlling interests
|
47.3
|
|
||
|
Changes in redemption value
|
12.9
|
|
||
|
Balance, as of March 31, 2019
(1)
|
$
|
754.8
|
|
|
|
(1)
|
As of
December 31, 2018
and
March 31, 2019
, Redeemable non-controlling interests includes consolidated Affiliate sponsored investment products primarily attributable to third-party investors of
$91.0 million
and
$6.5 million
, respectively.
|
16. Affiliate Equity
Affiliate equity interests are allocated income in a manner that is consistent with the structured partnership interests in place at the respective Affiliate. The Company’s Affiliates generally pay quarterly distributions to Affiliate equity holders. For the three months ended
March 31, 2018
and
2019
, distributions paid to Affiliate equity holders (non-controlling interests) were
$112.4 million
and
$104.6 million
, respectively.
The Company periodically repurchases Affiliate equity interests from and issues Affiliate equity interests to its Affiliate partners and its officers. For the three months ended
March 31, 2018
and
2019
, the amount of cash paid for repurchases was
20
AFFILIATED MANAGERS GROUP, INC.
NOTES TO CONSOLIDATED FINANCIAL STATEMENTS (unaudited)
$14.5 million
and
$15.4 million
, respectively. For the three months ended
March 31, 2018
and
2019
, the total amount of cash received for issuances was
$6.2 million
and
$9.4 million
, respectively.
Sales and repurchases of Affiliate equity generally occur at fair value; however, the Company also grants Affiliate equity to its Affiliate partners and its officers as a form of compensation. If the equity is issued for consideration below the fair value of the equity, or repurchased for consideration above the fair value of the equity, the difference is recorded as compensation expense in Compensation and related expenses in the Consolidated Statements of Income over the requisite service period.
The following table presents Affiliate equity compensation expense:
|
For the Three Months Ended March 31,
|
|||||||
|
2018
|
2019
|
||||||
|
Controlling interest
|
$
|
2.6
|
|
$
|
2.2
|
|
|
|
Non-controlling interests
|
16.8
|
|
8.5
|
|
|||
|
Total
|
$
|
19.4
|
|
$
|
10.7
|
|
|
The following table presents unrecognized Affiliate equity compensation expense:
|
|
Controlling Interest
|
Remaining Life
|
Non-controlling Interests
|
Remaining Life
|
|||||||
|
December 31, 2018
|
$
|
38.7
|
|
5 years
|
$
|
118.3
|
|
6 years
|
|||
|
March 31, 2019
|
41.0
|
|
5 years
|
123.4
|
|
6 years
|
|||||
The Company records amounts receivable from and payable to Affiliate equity holders in connection with the transfer of Affiliate equity interests that have not settled at the end of the period. The total receivable was
$16.2 million
and
$15.0 million
as of
December 31, 2018
and
March 31, 2019
, respectively, and was included in Other assets. The total payable was
$36.2 million
and
$75.4 million
as of
December 31, 2018
and
March 31, 2019
, respectively, and was included in Other liabilities.
Effects of Changes in the Company’s Ownership in Affiliates
The Company periodically acquires interests from, and transfers interests to, Affiliate equity holders. Because these transactions do not result in a change of control, any gain or loss related to these transactions is recorded to Additional paid-in capital, which increases or decreases the controlling interest’s equity. No gain or loss related to these transactions is recognized in the Consolidated Statements of Income or the Consolidated Statements of Comprehensive Income.
While the Company presents the current redemption value of Affiliate equity within Redeemable non-controlling interests, with changes in the current redemption value increasing or decreasing the controlling interest’s equity over time, the following table presents the cumulative effect that ownership changes had on the controlling interest’s equity related only to Affiliate equity transactions that settled during the applicable periods:
|
|
For the Three Months Ended March 31,
|
||||||
|
|
2018
|
2019
|
|||||
|
Net income (loss) (controlling interest)
|
$
|
153.0
|
|
$
|
(200.8
|
)
|
|
|
Decrease in controlling interest paid-in capital from Affiliate equity issuances
|
(1.0
|
)
|
(0.7
|
)
|
|||
|
Decrease in controlling interest paid-in capital from Affiliate equity repurchases
|
(33.1
|
)
|
(17.3
|
)
|
|||
|
Net income (loss) (controlling interest) including the net impact of Affiliate equity transactions
|
$
|
118.9
|
|
$
|
(218.8
|
)
|
|
17. Income Taxes
The Company’s consolidated income tax provision includes taxes attributable to the controlling interest and, to a lesser extent, taxes attributable to the non-controlling interests.
The following table presents the consolidated provision for income taxes:
21
AFFILIATED MANAGERS GROUP, INC.
NOTES TO CONSOLIDATED FINANCIAL STATEMENTS (unaudited)
|
|
For the Three Months Ended March 31,
|
||||||
|
|
2018
|
2019
|
|||||
|
Controlling interest:
|
|
|
|||||
|
Current taxes
|
$
|
47.3
|
|
$
|
21.1
|
|
|
|
Intangible-related deferred taxes
|
13.2
|
|
(93.8
|
)
|
|||
|
Other deferred taxes
|
0.3
|
|
7.9
|
|
|||
|
Total controlling interest
|
60.8
|
|
(64.8
|
)
|
|||
|
Non-controlling interests:
|
|
|
|||||
|
Current taxes
|
$
|
2.8
|
|
$
|
3.1
|
|
|
|
Deferred taxes
|
(0.1
|
)
|
(0.1
|
)
|
|||
|
Total non-controlling interests
|
2.7
|
|
3.0
|
|
|||
|
Income tax expense (benefit)
|
$
|
63.5
|
|
$
|
(61.8
|
)
|
|
|
Income (loss) before income taxes (controlling interest)
|
$
|
213.8
|
|
$
|
(265.6
|
)
|
|
|
Effective tax rate (controlling interest)
(1)
|
28.4
|
%
|
24.4
|
%
|
|||
__________________________
|
(1)
|
Taxes attributable to the controlling interest divided by Income (loss) before income taxes (controlling interest).
|
|
18.
|
Earnings Per Share
|
The calculation of Earnings (loss) per share (basic) is based on the weighted average number of shares of the Company’s common stock outstanding during the period. Earnings (loss) per share (diluted) is similar to Earnings (loss) per share (basic), but adjusts for the dilutive effect of the potential issuance of incremental shares of the Company’s common stock. The following is a reconciliation of the numerator and denominator used in the calculation of basic and diluted earnings per share available to common stockholders:
|
|
For the Three Months Ended March 31,
|
||||||
|
|
2018
|
2019
|
|||||
|
Numerator
|
|
|
|||||
|
Net income (loss) (controlling interest)
|
$
|
153.0
|
|
$
|
(200.8
|
)
|
|
|
Interest expense on junior convertible securities, net of taxes
|
4.7
|
|
—
|
|
|||
|
Net income (loss) (controlling interest), as adjusted
|
$
|
157.7
|
|
$
|
(200.8
|
)
|
|
|
Denominator
|
|
|
|||||
|
Average shares outstanding (basic)
|
54.6
|
|
51.9
|
|
|||
|
Effect of dilutive instruments:
|
|
|
|||||
|
Stock options and restricted stock units
|
0.2
|
|
—
|
|
|||
|
Junior convertible securities
|
2.2
|
|
—
|
|
|||
|
Average shares outstanding (diluted)
|
57.0
|
|
51.9
|
|
|||
Average shares outstanding (diluted) in the table above excludes share-based awards that have not satisfied performance conditions and the anti-dilutive effect of the following:
|
|
For the Three Months Ended March 31,
|
||||
|
|
2018
|
2019
|
|||
|
Stock options and restricted stock units
|
0.1
|
|
0.6
|
|
|
|
Junior convertible securities
|
—
|
|
2.2
|
|
|
22
AFFILIATED MANAGERS GROUP, INC.
NOTES TO CONSOLIDATED FINANCIAL STATEMENTS (unaudited)
The Company may settle portions of its Affiliate equity purchases in shares of its common stock. Because it is the Company’s intention to settle these potential purchases in cash, the calculation of Average shares outstanding (diluted) excludes any potential dilutive effect from possible share settlements of Affiliate equity purchases.
For the three months ended
March 31, 2019
, the Company repurchased
0.9 million
shares of its common stock at an average price per share of
$106.09
.
|
19.
|
Comprehensive Income
|
The following tables present the tax effects allocated to each component of Other comprehensive income (loss):
|
For the Three Months Ended March 31,
|
|||||||||||||||||||||||
|
2018
|
2019
|
||||||||||||||||||||||
|
Pre-Tax
|
Tax Benefit
(Expense) |
Net of Tax
|
Pre-Tax
|
Tax Benefit
(Expense) |
Net of Tax
|
||||||||||||||||||
|
Foreign currency translation adjustment
|
$
|
29.1
|
|
$
|
—
|
|
$
|
29.1
|
|
$
|
(5.5
|
)
|
$
|
13.0
|
|
$
|
7.5
|
|
|||||
|
Change in net realized and unrealized gain on derivative financial instruments
|
0.3
|
|
—
|
|
0.3
|
|
1.2
|
|
—
|
|
1.2
|
|
|||||||||||
|
Other comprehensive income (loss)
|
$
|
29.4
|
|
$
|
—
|
|
$
|
29.4
|
|
$
|
(4.3
|
)
|
$
|
13.0
|
|
$
|
8.7
|
|
|||||
The components of accumulated other comprehensive loss, net of taxes, were as follows:
|
Foreign
Currency
Translation
Adjustment
|
Realized and
Unrealized Gains (Losses)
on Derivative
Securities
|
Total
|
|||||||||
|
Balance, as of December 31, 2018
|
$
|
(188.0
|
)
|
$
|
(0.5
|
)
|
$
|
(188.5
|
)
|
||
|
Other comprehensive income before reclassifications
|
7.5
|
|
1.1
|
|
8.6
|
|
|||||
|
Amounts reclassified
|
—
|
|
0.1
|
|
0.1
|
|
|||||
|
Net other comprehensive income
|
7.5
|
|
1.2
|
|
8.7
|
|
|||||
|
Balance, as of March 31, 2019
|
$
|
(180.5
|
)
|
$
|
0.7
|
|
$
|
(179.8
|
)
|
||
In connection with the adoption of ASU 2018-02, the Company elected to reclassify to Retained earnings
$6.6 million
of tax effects stranded in Accumulated other comprehensive loss as a result of the enactment of the Tax Cuts and Jobs Act on December 22, 2017.
|
20.
|
Subsequent Events
|
On May 6, 2019, the Company announced that it will acquire a minority equity interest in Garda Capital Partners LP, which is expected to close in the third quarter of 2019.
23
|
Item 2.
|
Management’s Discussion and Analysis of Financial Condition and Results of Operations
|
Forward-Looking Statements
Certain matters discussed in this Quarterly Report on Form 10-Q, in our other filings with the Securities and Exchange Commission, in our press releases and in oral statements made with the approval of an executive officer may constitute “forward-looking statements” within the meaning of the Private Securities Litigation Reform Act of 1995. These statements include, but are not limited to, statements related to our expectations regarding the performance of our business, our financial results, our liquidity and capital resources and other non-historical statements, and may be prefaced with words such as “outlook,” “guidance,” “believes,” “expects,” “potential,” “preliminary,” “continues,” “may,” “will,” “should,” “seeks,” “approximately,” “predicts,” “projects,” “positioned,” “prospects,” “intends,” “plans,” “estimates,” “pending investments,” “anticipates” or the negative version of these words or other comparable words. Such statements are subject to certain risks and uncertainties, including, among others, the factors discussed under the caption “Item 1A. Risk Factors” in our Annual Report on Form 10-K for the year ended December 31, 2018.
These factors (among others) could affect our financial performance and cause actual results to differ materially from historical earnings and those presently anticipated and projected. Forward-looking statements speak only as of the date they are made, and we will not undertake and we specifically disclaim any obligation to release publicly the result of any revisions that may be made to any forward-looking statements to reflect events or circumstances after the date of such statements or to reflect the occurrence of events, whether or not anticipated. In that respect, we caution readers not to place undue reliance on any such forward-looking statements.
Management’s Discussion and Analysis of Financial Condition and Results of Operations should be read in conjunction with our Consolidated Financial Statements and the notes thereto contained elsewhere in this Quarterly Report on Form 10-Q.
Executive Overview
We are a global asset management company with equity investments in leading boutique investment management firms, which we refer to as our “Affiliates.” Our innovative partnership approach allows each Affiliate’s management team to own significant equity in their firm and maintain operational autonomy. Our strategy is to generate shareholder value through the growth of our existing Affiliates, as well as through investments in new Affiliates and additional investments in our existing Affiliates. In addition, we provide centralized assistance to our Affiliates in strategic matters, marketing, distribution, product development and operations. As of
March 31, 2019
, our aggregate assets under management were
$774.2
billion (approximately $778 billion pro forma for a pending investment), in more than 500 investment products across a broad range of active, return-oriented strategies.
Under accounting principles generally accepted in the U.S. (“GAAP”), we are required to consolidate certain of our Affiliates and use the equity method of accounting for others. Whether we consolidate an Affiliate or use the equity method of accounting, we maintain the same partnership approach and provide support and assistance in substantially the same manner for all of our Affiliates. Furthermore, all of our Affiliates are boutique investment managers and are impacted by similar marketplace factors and industry trends. Therefore, our key aggregate operating performance measures, which include the assets under management and fees of all of our Affiliates whether consolidated or accounted for under the equity method, are important in providing management with a more comprehensive view of the operating performance and material trends across our entire business.
The following table presents our key operating performance measures:
|
As of and for the Three Months Ended March 31,
|
|||||||||||
|
(in billions, except as noted)
|
2018
|
2019
|
% Change
|
||||||||
|
Assets under management
|
$
|
830.9
|
|
$
|
774.2
|
|
(7
|
)%
|
|||
|
Average assets under management
|
839.7
|
|
772.6
|
|
(8
|
)%
|
|||||
|
Aggregate fees (in millions)
(1)
|
1,648.7
|
|
1,252.0
|
|
(24
|
)%
|
|||||
__________________________
|
(1)
|
Aggregate fees is provided in addition to, but not as a substitute for, Consolidated revenue or other GAAP performance measures.
|
24
Assets under management is presented on a current basis without regard to the timing of the inclusion of an Affiliate’s results in our operating performance measures and Consolidated Financial Statements. Average assets under management provides a more meaningful relationship to our operating performance measures and financial results, as it reflects both the particular billing patterns of Affiliate sponsored investment products and client accounts and corresponds with the timing of the inclusion of an Affiliate's financial results in our operating performance measures and Consolidated Financial Statements. For certain of our equity method Affiliates, we report aggregate fees and the Affiliate’s financial results in our Consolidated Financial Statements one quarter in arrears.
Assets Under Management
Through our Affiliates, we provide a comprehensive and diverse range of active, return-oriented strategies designed to assist institutional, retail and high net worth clients worldwide in achieving their investment objectives. We continue to see demand for active, return-oriented strategies, particularly in illiquid alternatives and multi-asset and fixed income strategies, reflecting continued investor demand for returns that are less correlated to traditional equity markets. In addition, investor demand for passively-managed products has continued, and we have experienced outflows in U.S. equity strategies, consistent with this industry-wide trend. We believe the best-performing active equity managers (whether global-, regional- or country-specific) will continue to have significant opportunities to grow from net client cash inflows. We believe we are well-positioned to benefit from these trends.
The following charts present information regarding the composition of our assets under management by active, return-oriented strategy and client type as of
March 31, 2019
:
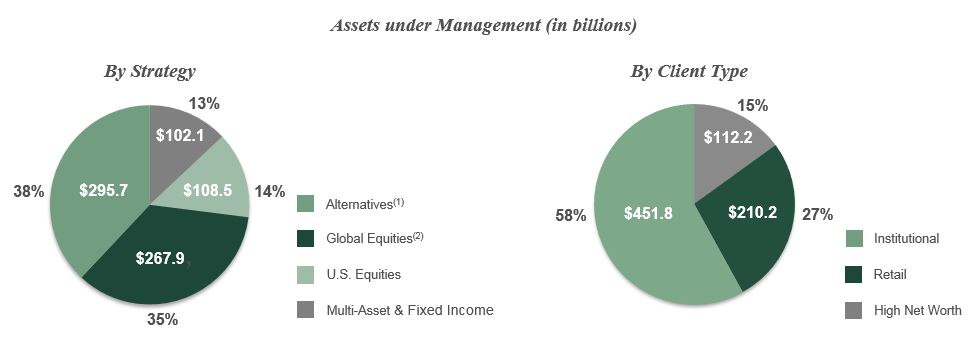
___________________
|
(1)
|
Alternatives primarily include assets under management in liquid and illiquid alternatives strategies. Alternatives strategies generate earnings from (i) asset based fees from products subject to lock-ups or similar restrictions, (ii) asset based fees from products not subject to such restrictions and/or (iii) performance based fees and carried interest.
|
|
(2)
|
Global equities include emerging markets strategies, which accounted for 8% of our assets under management as of
March 31, 2019
.
|
The following tables present changes in our assets under management by active, return-oriented strategy and client type for the three months ended
March 31, 2019
:
25
|
(in billions)
|
Alternatives
|
Global Equities
|
U.S. Equities
|
Multi-Asset & Fixed Income
|
Total
|
||||||||||||||
|
December 31, 2018
|
$
|
293.5
|
|
$
|
243.8
|
|
$
|
97.6
|
|
$
|
101.1
|
|
$
|
736.0
|
|
||||
|
Client cash inflows and commitments
|
11.5
|
|
9.7
|
|
4.4
|
|
5.3
|
|
30.9
|
|
|||||||||
|
Client cash outflows
|
(14.4
|
)
|
(13.1
|
)
|
(5.8
|
)
|
(5.0
|
)
|
(38.3
|
)
|
|||||||||
|
Net client cash flows
|
(2.9
|
)
|
(3.4
|
)
|
(1.4
|
)
|
0.3
|
|
(7.4
|
)
|
|||||||||
|
Market changes
|
6.5
|
|
26.9
|
|
12.9
|
|
5.0
|
|
51.3
|
|
|||||||||
|
Foreign exchange
(1)
|
1.0
|
|
1.4
|
|
0.1
|
|
0.3
|
|
2.8
|
|
|||||||||
|
Realizations and distributions (net)
|
(2.0
|
)
|
(0.1
|
)
|
—
|
|
—
|
|
(2.1
|
)
|
|||||||||
|
Other
(2)
|
(0.4
|
)
|
(0.7
|
)
|
(0.7
|
)
|
(4.6
|
)
|
(6.4
|
)
|
|||||||||
|
March 31, 2019
|
$
|
295.7
|
|
$
|
267.9
|
|
$
|
108.5
|
|
$
|
102.1
|
|
$
|
774.2
|
|
||||
|
(in billions)
|
Institutional
|
Retail
|
High Net Worth
|
Total
|
|||||||||||
|
December 31, 2018
|
$
|
432.9
|
|
$
|
195.4
|
|
$
|
107.7
|
|
$
|
736.0
|
|
|||
|
Client cash inflows and commitments
|
11.9
|
|
13.6
|
|
5.4
|
|
30.9
|
|
|||||||
|
Client cash outflows
|
(16.8
|
)
|
(17.2
|
)
|
(4.3
|
)
|
(38.3
|
)
|
|||||||
|
Net client cash flows
|
(4.9
|
)
|
(3.6
|
)
|
1.1
|
|
(7.4
|
)
|
|||||||
|
Market changes
|
26.5
|
|
17.1
|
|
7.7
|
|
51.3
|
|
|||||||
|
Foreign exchange
(1)
|
1.6
|
|
1.0
|
|
0.2
|
|
2.8
|
|
|||||||
|
Realizations and distributions (net)
|
(2.0
|
)
|
(0.1
|
)
|
—
|
|
(2.1
|
)
|
|||||||
|
Other
(2)
|
(2.3
|
)
|
0.4
|
|
(4.5
|
)
|
(6.4
|
)
|
|||||||
|
March 31, 2019
|
$
|
451.8
|
|
$
|
210.2
|
|
$
|
112.2
|
|
$
|
774.2
|
|
|||
________________________
|
(1)
|
Foreign exchange reflects the impact of translating into U.S. dollars the assets under management of our Affiliates whose functional currency is not the U.S. dollar.
|
|
(2)
|
Other primarily includes the assets under management attributable to Affiliate product transitions and transfers of our interests in our Affiliates. For the three months ended
March 31, 2019
, other primarily represents the divestment of a U.S. wealth Affiliate accounted for under the equity method.
|
In addition to assets under management, we also report average assets under management. This measure provides a more meaningful relationship to aggregate fees as it reflects both the particular billing patterns of Affiliate sponsored investment products and client accounts and corresponds with the timing of the inclusion of an Affiliate’s financial results in our operating performance measures and Consolidated Financial Statements. Average assets under management were
$772.6
billion for the three months ended
March 31, 2019
, a decrease of
$67.1
billion or
8%
, compared to the three months ended
March 31, 2018
.
Aggregate Fees
Aggregate fees consists of the total asset and performance based fees earned by all of our Affiliates. Asset based fees include advisory and other fees earned by our Affiliates for services provided to their clients and are typically determined as a percentage of the value of a client’s assets under management. Performance based fees are based on investment performance, typically on an absolute basis or relative to a benchmark, and are recognized when they are earned (i.e., when they become billable to customers and are not subject to claw-back). Performance based fees are generally billed less frequently than asset based fees, and although performance based fees inherently depend on investment performance and will vary from period to period, we anticipate performance based fees will be a recurring component of our aggregate fees.
Aggregate fees are generally determined by the level of our average assets under management, the composition of these assets across our active, return oriented strategies that realize different asset based fee ratios, and performance based fees. Our asset based fee ratio is calculated as asset based fees divided by average assets under management.
26
Aggregate fees were
$1,252.0 million
for the three months ended
March 31, 2019
, a decrease of $
396.7 million
or
24%
as compared to the three months ended
March 31, 2018
. The decrease in our aggregate fees was due to a $254.1 million or 15% decrease from performance based fees and a $142.6 million or 9% decrease from asset based fees. The $142.6 million decrease in asset based fees for the three months ended
March 31, 2019
represented an 11% decline as compared to asset based fees for the three months ended March 31, 2018. The decrease in asset based fees was due to an
8%
decrease in our average assets under management, primarily in global equity strategies and U.S. equity strategies, and a 3% decline in our asset based fee ratio principally due to a change in the composition of our average assets under management.
Financial and Supplemental Financial Performance Measures
The following table presents our key financial and supplemental financial performance measures:
|
For the Three Months Ended March 31,
|
|
||||||||||
|
(in millions)
|
2018
|
2019
|
% Change
|
||||||||
|
Net income (loss) (controlling interest)
|
$
|
153.0
|
|
$
|
(200.8
|
)
|
N.M.
(1)
|
|
|||
|
Adjusted EBITDA (controlling interest)
(2)
|
286.5
|
|
215.6
|
|
(25
|
)%
|
|||||
|
Economic net income (controlling interest)
(2)
|
215.2
|
|
169.0
|
|
(21
|
)%
|
|||||
__________________________
|
(1)
|
Percentage change is not meaningful.
|
|
(2)
|
Adjusted EBITDA (controlling interest) and Economic net income (controlling interest) are non-GAAP performance measures and are discussed in “Supplemental Financial Performance Measures.”
|
Adjusted EBITDA (controlling interest) is an important supplemental financial performance measure for management as it provides a comprehensive view of our share of the financial performance of our business before interest, taxes, depreciation, amortization, impairments and adjustments to our contingent payment arrangements. Our Adjusted EBITDA (controlling interest) decreased
$70.9 million
or
25%
primarily due to a
$396.7 million
or
24%
decrease in aggregate fees, particularly at certain equity method Affiliates in which we share in the Affiliate’s revenue less agreed-upon expenses. The expense bases of these Affiliates are generally less variable and, therefore, short-term declines in fees have a greater percentage impact on the Affiliate’s earnings relative to the impact on the Affiliate’s revenue. The decrease in Adjusted EBITDA (controlling interest) was also due to a decline in Investment and other income attributable to the controlling interest.
While Adjusted EBITDA (controlling interest) decreased
$70.9 million
for the three months ended
March 31, 2019
, our Net income (loss) (controlling interest) decreased
$353.8 million
. This decrease in Net income (loss) (controlling interest) as compared to Adjusted EBITDA (controlling interest) was primarily due to a $415.0 million expense to reduce the carrying value to fair value of a U.S. credit alternative Affiliate accounted for under the equity method. See Note 11 of our Consolidated Financial Statements for additional information. This decrease in Net income (loss) (controlling interest) was partially offset by a reduction in Income tax expense of $125.6 million.
We believe Economic net income (controlling interest) is an important measure because it represents our performance before non-cash expenses relating to the acquisition of interests in Affiliates and improves comparability of performance between periods. While Adjusted EBITDA (controlling interest) decreased
$70.9 million
or
25%
for the three months ended
March 31, 2019
, our Economic net income (controlling interest) decreased
$46.2 million
or
21%
. Economic net income (controlling interest) decreased less on percentage terms than Adjusted EBITDA (controlling interest) primarily due to a decrease in Income tax expense.
Results of Operations
The following discussion includes the key performance measures and financial results of our consolidated and equity method Affiliates. Our consolidated Affiliates’ financial results are included in our Consolidated revenue, Consolidated expenses, and Investment and other income, and our share of our equity method Affiliates’ financial results is reported, net of intangible amortization and impairments, in Equity method income (loss) (net).
Consolidated Revenue
The following table presents our consolidated Affiliate average assets under management and Consolidated revenue:
27
|
|
For the Three Months Ended March 31,
|
|||||||||
|
(in millions, except as noted)
|
2018
|
2019
|
% Change
|
|||||||
|
Consolidated Affiliate average assets under management (in billions)
|
$
|
433.3
|
|
$
|
399.0
|
|
(8
|
)%
|
||
|
Consolidated revenue
|
$
|
612.4
|
|
$
|
543.1
|
|
(11
|
)%
|
||
Our Consolidated revenue decreased
$69.3 million
or
11%
for the three months ended
March 31, 2019
, due to a $62.2 million or 10% decrease from asset based fees and a $7.1 million or 1% decrease from performance based fees. The $62.2 million decrease in asset based fees represented a 10% decline as compared to asset based fees for the three months ended March 31, 2018. The decrease in asset based fees was primarily due to an 8% decrease in consolidated Affiliate average assets under management, primarily in U.S. equity strategies and global equity strategies. The decrease in asset based fees was also due to a 3% decline in our consolidated Affiliate asset based fee ratio principally due to a change in the composition of our average assets under management.
Consolidated Expenses
The following table presents our Consolidated expenses:
|
|
For the Three Months Ended March 31,
|
|
||||||||
|
|
% Change
|
|||||||||
|
(in millions)
|
2018
|
2019
|
||||||||
|
Compensation and related expenses
|
$
|
266.7
|
|
$
|
228.2
|
|
(14
|
)%
|
||
|
Selling, general and administrative
|
106.4
|
|
95.6
|
|
(10
|
)%
|
||||
|
Intangible amortization and impairments
|
23.2
|
|
29.6
|
|
28
|
%
|
||||
|
Interest expense
|
21.6
|
|
18.2
|
|
(16
|
)%
|
||||
|
Depreciation and other amortization
|
5.5
|
|
5.2
|
|
(5
|
)%
|
||||
|
Other expenses (net)
|
12.0
|
|
11.0
|
|
(8
|
)%
|
||||
|
Total consolidated expenses
|
$
|
435.4
|
|
$
|
387.8
|
|
(11
|
)%
|
||
Our Consolidated expenses are primarily attributable to the non-controlling interests of our consolidated Affiliates in which we share in revenue without regard to expenses. For these Affiliates, the amount of expenses attributable to the non-controlling interests, including compensation, is generally determined by the percentage of revenue allocated to expenses as part of the structured partnership interests in place at the respective Affiliate. Accordingly, increases in revenue generally will increase a consolidated Affiliate’s expenses attributable to the non-controlling interest and decreases in revenue will generally decrease a consolidated Affiliate’s expenses attributable to the non-controlling interest.
Compensation and related expenses decreased
$38.5 million
or
14%
for the three months ended
March 31, 2019
, primarily due to a $25.3 million or 9% decrease from compensation expenses at Affiliates and an $8.5 million or 3% decrease from compensation expenses associated with Affiliate equity transactions, both primarily attributable to the non-controlling interests. The decrease in Compensation and related expenses was also due to a $5.2 million or 2% decrease from compensation expenses attributable to the controlling interest.
Selling, general and administrative expenses decreased
$10.8 million
or
10%
for the three months ended
March 31, 2019
, primarily due to a $6.5 million or 6% decrease from sub-advisory and distribution expenses related to a decrease in consolidated Affiliate average assets under management and a $5.3 million or 5% decrease from Affiliate-related expenses. These changes were primarily attributable to the controlling interest.
Intangible amortization and impairments increased
$6.4 million
or
28%
for the three months ended
March 31, 2019
, primarily due to a $7.0 million or 30% increase from a change in the pattern of economic benefit for certain assets. This change was primarily attributable to the controlling interest.
Interest expense decreased
$3.4 million
or
16%
for the three months ended
March 31, 2019
, primarily due to a $3.5 million or 16% decrease due to our pound sterling-denominated forward foreign currency contracts. See Note 7 of our Consolidated Financial Statements for additional information. This change was attributable to the controlling interest.
There were no significant changes in Depreciation and other amortization or Other expenses (net)
for the three months ended
March 31, 2019
.
28
Equity Method Income (Loss) (Net)
For a majority of our equity method Affiliates, we use structured partnership interests in which we contractually share in the Affiliate’s revenue less agreed-upon expenses. We also use structured partnership interests in which we contractually share in the Affiliate’s revenue without regard to expenses. Our share of earnings or losses from equity method Affiliates, net of amortization and impairments, is included in Equity method income (loss) (net).
The following table presents equity method Affiliate average assets under management and equity method revenue, as well as equity method earnings and equity method intangible amortization and impairments, which in aggregate form Equity method income (loss) (net):
_________________________
|
|
For the Three Months Ended March 31,
|
|
||||||||
|
(in millions, except as noted)
|
2018
|
2019
|
% Change
|
|||||||
|
Operating Performance Measures
|
||||||||||
|
Equity method Affiliate average assets under management (in billions)
|
$
|
406.4
|
|
$
|
373.6
|
|
(8
|
)%
|
||
|
Equity method revenue
|
$
|
1,036.3
|
|
$
|
708.9
|
|
(32
|
)%
|
||
|
Financial Performance Measures
|
||||||||||
|
Equity method earnings
|
$
|
126.3
|
|
$
|
80.1
|
|
(37
|
)%
|
||
|
Equity method intangible amortization and impairments
|
(30.0
|
)
|
(438.2
|
)
|
N.M.
(1)
|
|
||||
|
Equity method income (loss) (net)
|
$
|
96.3
|
|
$
|
(358.1
|
)
|
N.M.
(1)
|
|
||
|
(1)
|
Percentage change is not meaningful.
|
Our equity method revenue decreased
$327.4 million
or
32%
for the three months ended
March 31, 2019
, due to a $247.0 million or 24% decrease from performance based fees and an $80.4 million or 8% decrease from asset based fees. The $80.4 million decrease in asset based fees represented a 13% decline as compared to asset based fees for the three months ended March 31, 2018. The decrease in asset based fees was due to an 8% decrease in equity method Affiliate average assets under management and a 5% decline in our asset based fee ratio due to a change in the composition of our average assets under management and fee rate reductions at certain Affiliate products.
While equity method revenue decreased
$327.4 million
or
32%
for the three months ended
March 31, 2019
, equity method earnings decreased
$46.2 million
or
37%
.
Equity method earnings decreased more than equity method revenue on a percentage basis due to decreases in revenue at certain equity method Affiliates in which we share in the Affiliate’s revenue less agreed-upon expenses. The expense bases of these Affiliates are generally less variable and, therefore, short-term declines in fees have a greater percentage impact on the Affiliate’s earnings relative to the impact on the Affiliate’s revenue.
Equity method intangible amortization and impairments increased
$408.2 million
for the three months ended
March 31, 2019
, primarily from a $415.0 million expense to reduce the carrying value to fair value of a U.S. credit alternative Affiliate. See Note 11 of our Consolidated Financial Statements for additional information.
Investment and Other Income
The following table presents our Investment and other income:
|
|
For the Three Months Ended March 31,
|
|
||||||||
|
(in millions)
|
2018
|
2019
|
% Change
|
|||||||
|
Investment and other income
|
$
|
14.2
|
|
$
|
8.0
|
|
(44
|
)%
|
||
Investment and other income decreased
$6.2 million
or
44%
for the three months ended
March 31, 2019
, primarily due to a $12.1 million or 85% decrease from the valuation of Other investments, primarily attributable to the controlling interest. This decrease was partially offset by a $5.7 million or 40% increase from the valuation of and realized gains on the sale of Investments in marketable securities, primarily attributable to the non-controlling interest.
Income Tax Expense (Benefit)
29
The following table presents our Income tax expense (benefit):
__________________________
|
|
For the Three Months Ended March 31,
|
|
|||||||
|
(in millions)
|
2018
|
2019
|
% Change
|
||||||
|
Income tax expense (benefit)
|
$
|
63.5
|
|
$
|
(61.8
|
)
|
N.M.
(1)
|
||
|
(1)
|
Percentage change is not meaningful.
|
Income tax expense decreased $
125.3 million
for the three months ended
March 31, 2019
, primarily due to a decrease in Income before taxes (controlling interest) principally due to a $415.0 million expense to reduce the carrying value to fair value of a U.S. credit alternative Affiliate accounted for under the equity method.
Net Income (Loss)
The previously discussed changes in revenue and expenses had the following effect on Net income (loss):
|
|
For the Three Months Ended March 31,
|
|
||||||||
|
(in millions)
|
2018
|
2019
|
% Change
|
|||||||
|
Net income (loss)
|
$
|
224.0
|
|
$
|
(133.0
|
)
|
N.M.
(1)
|
|
||
|
Net income (non-controlling interests)
|
71.0
|
|
67.8
|
|
(5
|
)%
|
||||
|
Net income (loss) (controlling interest)
|
153.0
|
|
(200.8
|
)
|
N.M.
(1)
|
|
||||
__________________________
|
(1)
|
Percentage change is not meaningful.
|
Supplemental Financial Performance Measures
Adjusted EBITDA (controlling interest)
As supplemental information, we provide a non-GAAP measure that we refer to as Adjusted EBITDA (controlling interest). Adjusted EBITDA (controlling interest) is an important supplemental financial performance measure for management as it provides a comprehensive view of our share of the financial performance of our business before interest, taxes, depreciation, amortization, impairments and adjustments to our contingent payment arrangements. We believe that many investors use this measure when assessing the financial performance of companies in the investment management industry. This non-GAAP performance measure is provided in addition to, but not as a substitute for, Net income (loss) (controlling interest) or other GAAP performance measures.
The following table presents a reconciliation of Net income (loss) (controlling interest) to Adjusted EBITDA (controlling interest):
|
For the Three Months Ended March 31,
|
|||||||
|
(in millions)
|
2018
|
2019
|
|||||
|
Net income (loss) (controlling interest)
|
$
|
153.0
|
|
$
|
(200.8
|
)
|
|
|
Interest expense
|
21.6
|
|
18.2
|
|
|||
|
Income taxes
|
60.8
|
|
(64.8
|
)
|
|||
|
Intangible amortization and impairments
(1)
|
47.6
|
|
459.8
|
|
|||
|
Other items
(2)
|
3.5
|
|
3.2
|
|
|||
|
Adjusted EBITDA (controlling interest)
|
$
|
286.5
|
|
$
|
215.6
|
|
|
|
(1)
|
Our consolidated Intangible amortization and impairments includes amortization attributable to our non-controlling interests. For our equity method Affiliates, we do not separately report intangible amortization and impairments in our Consolidated Statements of Income. Our share of these Affiliates’ amortization is reported in Equity method income (loss) (net).
|
The following table presents the Intangible amortization and impairments shown above:
30
|
|
For the Three Months Ended March 31,
|
||||||
|
(in millions)
|
2018
|
2019
|
|||||
|
Consolidated intangible amortization and impairments
|
$
|
23.2
|
|
$
|
29.6
|
|
|
|
Consolidated intangible amortization (non-controlling interests)
|
(5.6
|
)
|
(8.0
|
)
|
|||
|
Equity method intangible amortization and impairments
|
30.0
|
|
438.2
|
|
|||
|
Total
|
$
|
47.6
|
|
$
|
459.8
|
|
|
For the three months ended
March 31, 2019
, equity method intangible amortization and impairments includes a $415.0 million non-cash expense to reduce the carrying value to fair value of a U.S. credit alternative Affiliate accounted for under the equity method. See Note 11 of our Consolidated Financial Statements for additional information.
|
(2)
|
Other items include depreciation and adjustments to contingent payment arrangements.
|
Economic Net Income (controlling interest) and Economic Earnings Per Share
As supplemental information, we also provide non-GAAP performance measures that we refer to as Economic net income (controlling interest) and Economic earnings per share. We believe Economic net income (controlling interest) and Economic earnings per share are important measures because they represent our performance before non-cash expenses relating to the acquisition of interests in Affiliates and improve comparability of performance between periods. Economic net income (controlling interest) and Economic earnings per share are used by our management and Board of Directors as our principal performance benchmarks, including as one of the measures for aligning executive compensation with stockholder value. These non-GAAP performance measures are provided in addition to, but not as substitutes for, Net income (loss) (controlling interest) and Earnings (loss) per share (diluted) or other GAAP performance measures.
We adjust Net income (loss) (controlling interest) to calculate Economic net income (controlling interest) by adding back our share of pre-tax intangible amortization and impairments attributable to intangible assets because these expenses do not correspond to the changes in the value of these assets, which do not diminish predictably over time. We also add back the deferred taxes attributable to intangible assets because we believe it is unlikely these accruals will be used to settle material tax obligations. Further, we add back other economic items to improve comparability of performance between periods.
Economic earnings per share represents Economic net income (controlling interest) divided by the Average shares
outstanding (adjusted diluted). In this calculation, the potential share issuance in connection with our junior convertible securities is measured using a “treasury stock” method. Under this method, only the net number of shares of common stock equal to the value of these junior convertible securities in excess of par, if any, is deemed to be outstanding. We believe the inclusion of net shares under a treasury stock method best reflects the benefit of the increase in available capital resources (which could be used to repurchase shares of common stock) that occurs when these securities are converted and we are relieved of our debt obligation. This method does not take into account any increase or decrease in our cost of capital in an assumed conversion.
The following table presents a reconciliation of Net income (loss) (controlling interest) to Economic net income (controlling interest):
31
|
|
For the Three Months Ended March 31,
|
||||||
|
(in millions, except per share data)
|
2018
|
2019
|
|||||
|
Net income (loss) (controlling interest)
|
$
|
153.0
|
|
$
|
(200.8
|
)
|
|
|
Intangible amortization and impairments
(1)
|
47.6
|
|
459.8
|
|
|||
|
Intangible-related deferred taxes
(2)
|
13.2
|
|
(93.8
|
)
|
|||
|
Other economic items
(3)
|
1.4
|
|
3.8
|
|
|||
|
Economic net income (controlling interest)
|
$
|
215.2
|
|
$
|
169.0
|
|
|
|
Average shares outstanding (diluted)
|
57.0
|
|
51.9
|
|
|||
|
Stock options and restricted stock units
|
—
|
|
0.0
|
|
|||
|
Assumed issuance of junior convertible securities shares
|
(2.2
|
)
|
—
|
|
|||
|
Average shares outstanding (adjusted diluted)
|
54.8
|
|
51.9
|
|
|||
|
Economic earnings per share
|
$
|
3.92
|
|
$
|
3.26
|
|
|
____________________________
|
(1)
|
See note (1) to the table in “Adjusted EBITDA (controlling interest).”
|
|
(2)
|
For the three months ended
March 31, 2019
, we recorded a $415.0 million non-cash expense to reduce the carrying value to fair value of a U.S. credit alternative Affiliate accounted for under the equity method, which reduced intangible-related deferred taxes by $103.8 million.
|
|
(3)
|
For the three months ended March 31, 2018 and 2019, other economic items were net of income tax expense of $0.2 million in each period. Beginning with the three months ended March 31, 2019, other economic items include tax windfalls and shortfalls from share-based compensation. Prior periods have not been revised as the amounts were not significant.
|
Liquidity and Capital Resources
For the three months ended
March 31, 2019
, we met our cash requirements through cash generated by operating activities. Our principal uses of cash during the quarter were, and for the foreseeable future are expected to be, for repurchases of common stock, distributions to Affiliate equity holders, repayments of debt, the payment of cash dividends on our common stock, repurchases of Affiliate equity interests and general working capital purposes. We also expect that principal uses of cash will be for investments in new and existing Affiliates. We anticipate that cash flows from operations, together with borrowings under our revolver, will be sufficient to support our cash flow needs for the foreseeable future. In addition, we may draw funding from the debt and equity capital markets, and our credit ratings, among other factors, allow us to access these sources of funding on favorable terms. We are currently rated A3 by Moody’s Investors Service and A- by S&P Global Ratings.
Cash and cash equivalents as of December 31, 2018 and
March 31, 2019
were
$565.5 million
and
$305.2 million
, respectively. The following table summarizes our operating, investing and financing cash flow activities:
|
For the Three Months Ended March 31,
|
|||||||
|
(in millions)
|
2018
|
2019
|
|||||
|
Operating cash flow
|
$
|
205.0
|
|
$
|
(17.9
|
)
|
|
|
Investing cash flow
|
(3.9
|
)
|
(0.1
|
)
|
|||
|
Financing cash flow
|
(313.1
|
)
|
(243.7
|
)
|
|||
Operating Cash Flow
Operating cash flows decreased
$222.9 million
for the three months ended
March 31, 2019
, primarily due to a $129.2 million decrease in distributions received from equity method investments, which was attributable to the controlling interest. The decrease in operating cash flows was also due to a decrease in Net income as adjusted for non-cash items.
Investing Cash Flow
32
Investing cash flows increased
$3.8 million
for the three months ended
March 31, 2019
, primarily due to a $6.6 million increase in net sales of investment securities and a $2.5 million decrease in the purchase of fixed assets, partially offset by a $5.3 million increase in net investments in Affiliates.
Financing Cash Flow
Financing cash flows decreased
$69.4 million
for the three months ended
March 31, 2019
,
primarily due to a $101.9 million decrease in net repurchases of our common stock, a $10.4 million decrease in note and contingent payments, and a $7.8 million decrease in distributions to non-controlling interests. These increases were partially offset by a $53.7 million, net change in debt activity (from $5.0 million of net borrowings for the three months ended March 31, 2018 to $48.7 million of net repayments for the three months ended March 31, 2019). All of these changes were attributable to the controlling interest.
Debt
The following table presents the carrying value of our outstanding indebtedness:
|
(in millions)
|
December 31, 2018
|
March 31, 2019
|
|||||
|
Senior bank debt
|
$
|
780.0
|
|
$
|
460.0
|
|
|
|
Senior notes
|
746.2
|
|
746.4
|
|
|||
|
Junior convertible securities
|
312.5
|
|
313.2
|
|
|||
|
Junior subordinated notes
|
—
|
|
271.3
|
|
|||
The carrying value of long-term debt differs from the amount reported in Note 5 to our Consolidated Financial Statements, as the carrying value of the long-term debt in the table above is not reduced for debt issuance costs.
Senior Bank Debt
On January 18, 2019, we amended and restated our existing credit facilities to provide for a
$1.25 billion
senior unsecured multicurrency revolving credit facility (the “revolver”) and a
$450.0 million
senior unsecured term loan facility (the “term loan” and, together with the revolver, the “credit facilities”). The revolver matures on January 18, 2024, and the term loan matures on January 18, 2023. Subject to certain conditions, we may increase the commitments under the revolver by up to an additional
$500.0 million
and may borrow up to an additional
$75.0 million
under the term loan. We pay interest on any outstanding obligations under the credit facilities at specified rates, based either on an applicable LIBOR or prime rate, plus a marginal rate determined based on our credit rating. For the three months ended March 31, 2019, the interest rate for substantially all of our borrowings under the credit facilities was LIBOR plus 1.10% for the revolver and LIBOR plus 0.875% for the term loan.
The credit facilities contain financial covenants with respect to leverage and interest coverage, as well as customary affirmative and negative covenants, including limitations on priority indebtedness, asset dispositions and fundamental corporate changes, and certain customary events of default. As of
March 31, 2019
, we were in compliance with all terms of our credit facilities and had approximately $1.2 billion of remaining capacity under our revolver, all of which we could borrow and remain in compliance with our credit facilities.
Junior Subordinated Notes
On March 27, 2019, we issued $280.0 million of junior subordinated notes with a maturity date of March 30, 2059. The junior subordinated notes bear interest at a fixed rate of 5.875% per annum, payable quarterly in cash, commencing on June 30, 2019, subject to our right to defer interest payments in accordance with the terms of the junior subordinated notes. The junior subordinated notes were issued at 100% of the principal amount and rank junior and subordinate in right of payment and upon liquidation to all of our current and future senior indebtedness. On or after March 30, 2024, at our option, the junior subordinated notes may be redeemed in whole or in part, at 100% of the principal amount, plus any accrued and unpaid interest. Prior to March 30, 2024, at our option, the junior subordinated notes may be redeemed in whole but not in part, at 100% of the principal amount, plus any accrued and unpaid interest, if certain changes in tax laws, regulations or interpretations occur; or at 102% of the principal amount, plus any accrued and unpaid interest, if a rating agency makes certain changes relating to the equity credit criteria for securities with features similar to the junior subordinated notes
On April 8, 2019, we issued an additional
$20.0 million
of junior subordinated notes pursuant to the underwriters’ exercise of an overallotment option, which increased the total amount issued to $300.0 million.
33
We used a majority of the net proceeds from the junior subordinated notes offering to repay outstanding indebtedness under the revolver, with the remaining proceeds used for other general corporate purposes.
Equity Distribution Program
On March 27, 2019, we entered into equity distribution and forward equity agreements with several major securities firms under which we may, from time to time, issue and sell shares of our common stock (immediately or on a forward basis) having an aggregate sales price of up to $500.0 million (the “equity distribution program”). This equity distribution program superseded and replaced our prior equity distribution program. As of
March 31, 2019
, no sales had occurred under the new or prior equity distribution program.
Derivatives
We have two separate pound sterling-denominated forward foreign currency contracts (the “forward contracts”) with a large financial institution (the “counterparty”) to access lower interest rates. In order to limit our exposure to both gains and losses on the forward contracts, we concurrently entered into two separate collar contracts (the “collar contracts”) with the same counterparty for the same notional amounts and expiration dates as the forward contracts. Under one of the forward contracts, we will deliver £285.8 million for $400.0 million in 2024, and under the other forward contract, we will deliver £325.3 million for $450.0 million in 2021. Under one of the collar contracts, we sold a put option with a lower strike price of 1.288 U.S. dollars per one pound sterling and purchased a call option with an upper strike price of 1.535 U.S. dollars per one pound sterling. Under the other collar contract, we sold a put option with a lower strike price of 1.318 U.S. dollars per one pound sterling and purchased a call option with an upper strike price of 1.448 U.S. dollars per one pound sterling. The forward contracts and the collar contracts provide net settlement rights and require the parties to post collateral throughout the term of the contracts.
The combination of the forward contracts and the collar contracts were designated as net investment hedges against fluctuations in foreign currency exchange rates on certain of our investments in Affiliates with the pound sterling as their functional currency. See Note 7 of our Consolidated Financial Statements for additional information.
Affiliate Equity
Many of our consolidated Affiliate agreements provide us with a conditional right to call and Affiliate equity holders with the conditional right to put their Affiliate equity interests to us at certain intervals. For equity method Affiliates, we do not typically have such put and call arrangements. The purchase price of these conditional purchases is generally calculated based upon a multiple of the Affiliate’s cash flow distributions, which is intended to represent fair value. Affiliate equity holders are also permitted to sell their equity interests to other individuals or entities in certain cases, subject to our approval or other restrictions.
As of
March 31, 2019
, our current redemption value of
$754.8 million
for these interests (including
$6.5 million
of consolidated Affiliate sponsored investment products primarily attributable to third-party investors) has been presented as Redeemable non-controlling interests. Although the timing and amounts of these purchases are difficult to predict, we paid
$15.4 million
for repurchases and received
$9.4 million
for issuances of Affiliate equity during the three months ended
March 31, 2019
, and expect to repurchase a total of approximately
$150 million
of Affiliate equity in
2019
. In the event of a repurchase, we become the owner of the cash flow associated with the repurchased equity.
Commitments
See Note 8 of our Consolidated Financial Statements.
Share Repurchases
During the three months ended
March 31, 2019
, we repurchased
0.9 million
shares of our common stock at an average price per share of
$106.09
. As of
March 31, 2019
, we had
4.1 million
shares remaining under our authorized share repurchase programs, which have no expiry.
Contractual Obligations
The following table summarizes our contractual obligations as of
March 31, 2019
. Contractual debt obligations include the cash payment of fixed interest.
34
|
|
|
Payments Due
|
|||||||||||||||||
|
(in millions)
|
Total
|
Remainder of 2019
|
2020-2021
|
2022-2023
|
Thereafter
|
||||||||||||||
|
Contractual Obligations
|
|
|
|
|
|
||||||||||||||
|
Senior bank debt
|
$
|
460.0
|
|
$
|
—
|
|
$
|
—
|
|
$
|
450.0
|
|
$
|
10.0
|
|
||||
|
Senior notes
|
914.6
|
|
14.6
|
|
58.5
|
|
58.5
|
|
783.0
|
|
|||||||||
|
Junior convertible securities
|
846.8
|
|
16.6
|
|
44.4
|
|
44.4
|
|
741.4
|
|
|||||||||
|
Junior subordinated notes
|
946.4
|
|
12.5
|
|
32.9
|
|
32.9
|
|
868.1
|
|
|||||||||
|
Leases
(1)
|
227.8
|
|
25.8
|
|
73.8
|
|
51.6
|
|
76.6
|
|
|||||||||
|
Affiliate equity repurchase obligations
|
75.4
|
|
75.4
|
|
—
|
|
—
|
|
—
|
|
|||||||||
|
Total contractual obligations
|
$
|
3,471.0
|
|
$
|
144.9
|
|
$
|
209.6
|
|
$
|
637.4
|
|
$
|
2,479.1
|
|
||||
___________________________
|
(1)
|
The controlling interest portion is
$10.0 million
through 2019,
$24.5 million
in 2020-2021,
$19.6 million
in 2022-2023 and
$15.9 million
thereafter.
|
This table does not include liabilities for commitments to co-invest in certain Affiliate sponsored investment products or uncertain tax positions of
$146.6 million
and
$34.2 million
, respectively. This table also does not include potential obligations relating to our derivative financial instruments (see Note 7 of our Consolidated Financial Statements for additional information). These items are excluded as we cannot predict the amount or timing of when such obligations will be paid.
During the three months ended
March 31, 2019
, we were notified by the minority owner of a non-U.S. credit alternative Affiliate accounted for under the equity method that it had elected to sell to us a
5%
ownership interest in the Affiliate. We will pay
$25.7 million
for the interest, and the sale is expected to be completed in the second quarter of 2019. See Note 8 of our Consolidated Financial Statements for additional information.
Recent Accounting Developments
None.
Critical Accounting Estimates and Judgments
Our 2018 Annual Report on Form 10‑K includes additional information about our Critical Accounting Estimates and Judgments, and should be read in conjunction with this Quarterly Report on Form 10‑Q.
Equity Method Investments in Affiliates
We make judgments to determine fair value when we test our equity method investments for impairment, and use valuation techniques that include discounted cash flow analyses, where we make assumptions about growth rates of projected assets under management, client attrition, asset and performance based fees, expenses and profitability. In these analyses, we also make judgments about tax benefits, credit risk, interest rates, tax rates, discount rates and discounts for lack of marketability. We consider the reasonableness of our assumptions by comparing our valuation conclusions to observed market transactions and, in certain instances, by consulting with third-party valuation firms. Changes in these assumptions could significantly impact the respective fair value of an equity method investment in an Affiliate.
We perform equity method investment impairment tests annually, or more frequently should circumstances suggest that fair value may have declined below the related carrying value. Impairments are recognized when the fair value of the Affiliate has declined below its carrying value for a period we consider other-than-temporary. If we determine that a decline in fair value below our carrying value is other-than-temporary, the expense recognized reduces the carrying value of the Affiliate to its fair value.
During the three months ended March 31, 2019, the Company recognized a $415.0 million expense to reduce the carrying value to fair value of a U.S. credit alternative Affiliate accounted for under the equity method. See Note 11 of our Consolidated Financial Statements for additional information. Changes in the assumptions used could significantly impact the fair value of this Affiliate.
For our remaining equity method investments in Affiliates, no triggering events were identified during the three months ended March 31, 2019 that would indicate an increased risk of impairment.
35
|
Item 3.
|
Quantitative and Qualitative Disclosures About Market Risk
|
There have been no material changes to our Quantitative and Qualitative Disclosures About Market Risk for the three months ended
March 31, 2019
. Please refer to the below as well as the additional disclosures in Item 7A of our
2018
Annual Report on Form 10-K.
Foreign Currency Exchange Risk
To illustrate the effect of possible changes in foreign currency exchange rates, we estimate a 1% change in the pound sterling and Canadian dollar to U.S. dollar exchange rates would have resulted in changes to stockholders’ equity of
$3.7 million
and
$2.0 million
, respectively, based on the
March 31, 2019
carrying value of Affiliates whose functional currency is pound sterling or the Canadian dollar, and of our and our Affiliates’ pound sterling-denominated derivative financial instruments. For the three months ended March 31, 2019, we estimate a 1% change in the pound sterling and Canadian dollar to U.S. dollar exchange rates would have resulted in annual changes to Income (loss) before income taxes (controlling interest) of
$1.1 million
and
$0.3 million
, respectively.
|
Item 4.
|
Controls and Procedures
|
We carried out an evaluation under the supervision and with the participation of our management, including our Chief Executive Officer and Chief Financial Officer, of the effectiveness of the design and operation of our disclosure controls and procedures during the quarter covered by this Quarterly Report on Form 10-Q. Based upon that evaluation, our Chief Executive Officer and Chief Financial Officer concluded that, as of the end of the quarter covered by this Quarterly Report on Form 10-Q, our disclosure controls and procedures are effective in ensuring that (i) the information required to be disclosed by us in the reports that we file or submit under the Securities Exchange Act of 1934, as amended (the “Exchange Act”), is recorded, processed, summarized and reported within the time periods specified in the Securities and Exchange Commission’s rules and forms, and (ii) such information is accumulated and communicated to our management, including our principal executive officer and principal financial officer, as appropriate, to allow timely decisions regarding required disclosure. In designing and evaluating our disclosure controls and procedures, we recognize that any controls and procedures, no matter how well designed and operated, can provide only reasonable assurance of achieving the desired control objectives, and our management necessarily was required to apply its judgment in evaluating and implementing possible controls and procedures. Our disclosure controls and procedures were designed to provide reasonable assurance of achieving their stated objectives, and our principal executive officer and principal financial officers concluded that our disclosure controls and procedures were effective at the reasonable assurance level. We review on an ongoing basis and document our disclosure controls and procedures, and our internal control over financial reporting, and we may from time to time make changes in an effort to enhance their effectiveness and ensure that our systems evolve with our business.
No change in our internal control over financial reporting (as defined in Rules 13a-15(f) and 15d-15(f) under the Exchange Act) occurred during the quarter covered by this Quarterly Report on Form 10-Q that has materially affected, or is reasonably likely to materially affect, our internal control over financial reporting.
PART II—OTHER INFORMATION
|
Item 2.
|
Unregistered Sales of Equity Securities and Use of Proceeds
|
|
(a)
|
None.
|
|
(b)
|
None.
|
|
(c)
|
Purchases of Equity Securities by the Issuer:
|
36
|
Period
|
Total Number of Shares Purchased
(1)
|
Average Price Paid Per Share
|
Total Number of Shares Purchased as Part of Publicly Announced Plans or Programs
|
Average Price Paid Per Share
|
Maximum Number of Shares that May Yet Be Purchased Under Outstanding Plans or Programs
(2)
|
||||||||||||
|
January 1-31, 2019
|
—
|
|
$
|
—
|
|
—
|
|
$
|
—
|
|
4,993,328
|
|
|||||
|
February 1-28, 2019
|
101,541
|
|
110.31
|
|
101,541
|
|
110.31
|
|
4,891,787
|
|
|||||||
|
March 1-31, 2019
|
752,630
|
|
105.52
|
|
752,630
|
|
105.52
|
|
4,139,157
|
|
|||||||
|
Total
|
854,171
|
|
106.09
|
|
854,171
|
|
106.09
|
|
|||||||||
____________________________
|
(1)
|
Includes shares surrendered, if any, to the Company to satisfy tax withholding and/or option exercise price obligations in connection with stock swap option exercise transactions.
|
|
(2)
|
Our Board of Directors authorized share repurchase programs in January 2019 and January 2018, authorizing us to repurchase up to 3.3 million and 3.4 million shares of our common stock, respectively, and these authorizations have no expiry. Purchases may be made from time to time, at management’s discretion, in the open market or in privately negotiated transactions, including through the use of derivative financial instruments and accelerated share repurchase programs. As of
March 31, 2019
, there were a total of
4.1 million
shares remaining available for repurchase under our January 2019 and January 2018 programs.
|
|
Item 6.
|
Exhibits
|
The exhibits are listed on the Exhibit Index and are included elsewhere in this Quarterly Report on Form 10-Q.
37
EXHIBIT INDEX
|
Exhibit No.
|
Description
|
||
|
4.1
|
|
||
|
4.2
|
|
||
|
10.1
|
|
||
|
10.2†
|
|
||
|
10.3†
|
|
||
|
31.1
|
|
||
|
31.2
|
|
||
|
32.1
|
|
||
|
32.2
|
|
||
|
101
|
|
The following financial statements from the Registrant’s Quarterly Report on Form 10-Q for the quarter ended March 31, 2019 are filed herewith, formatted in XBRL (eXtensible Business Reporting Language): (i) the Consolidated Statements of Income for the three-month periods ended March 31, 2019 and 2018, (ii) the Consolidated Statements of Comprehensive Income for the three-month periods ended March 31, 2019 and 2018, (iii) the Consolidated Balance Sheets at March 31, 2019 and December 31, 2018, (iv) the Consolidated Statements of Changes in Equity for the three-month periods ended March 31, 2019 and 2018, (v) the Consolidated Statements of Cash Flows for the three-month periods ended March 31, 2019 and 2018, and (vi) the Notes to the Consolidated Financial Statements
|
|
|
†
|
Indicates a management contract or compensatory plan
|
|
*
|
Filed herewith
|
|
**
|
Furnished herewith
|
38
SIGNATURES
Pursuant to the requirements of the Securities Exchange Act of 1934, the Registrant has duly caused this report to be signed on its behalf by the undersigned, thereunto duly authorized.
|
|
AFFILIATED MANAGERS GROUP, INC.
(Registrant)
|
|
May 9, 2019
|
/s/ JAY C. HORGEN
|
|
Jay C. Horgen
on behalf of the Registrant as President, Chief Financial Officer and Treasurer (and also as Principal Financial and Principal Accounting Officer)
|
|
39
|
QuickLinks
|
TABLE OF CONTENTS
Part I Financial InformationItem 1. Financial StatementsItem 2. Management S Discussion and Analysis Of Financial Condition and Results Of OperationsItem 3. Quantitative and Qualitative Disclosures About Market RiskItem 4. Controls and ProceduresPart II Other InformationItem 2. Unregistered Sales Of Equity Securities and Use Of ProceedsItem 6. Exhibits