AMGEN INC
10-Ks and 10-Qs
|
|
|
|
|
|
|
|
|
|
|
|
|
|
|
|
|
|
|
|
|
|
|
|
|
|
|
|
|
|
|
|
|
|
|
|
|
|
|
|
|
|
|
|
|
|
|
|
|
|
|
|
|
|
|
|
|
|
|
UNITED STATES
SECURITIES AND EXCHANGE COMMISSION
Washington, D.C. 20549
Form 10-K
(Mark One)
|
ý
|
ANNUAL REPORT PURSUANT TO SECTION 13 OR 15(d) OF THE SECURITIES EXCHANGE ACT OF 1934
|
For the fiscal year ended
December 31, 2016
OR
|
¨
|
TRANSITION REPORT PURSUANT TO SECTION 13 OR 15(d) OF THE SECURITIES EXCHANGE ACT OF 1934
|
Commission file number 001-37702
Amgen Inc.
(Exact name of registrant as specified in its charter)
|
Delaware
|
95-3540776
|
|
|
(State or other jurisdiction of
incorporation or organization)
|
(I.R.S. Employer
Identification No.)
|
|
|
One Amgen Center Drive,
|
91320-1799
|
|
|
Thousand Oaks, California
|
(Zip Code)
|
|
|
(Address of principal executive offices)
|
||
(805) 447-1000
(Registrant’s telephone number, including area code)
Securities registered pursuant to Section 12(b) of the Act:
|
Title of Each Class
|
Name of Each Exchange on Which Registered
|
|
|
Common stock, $0.0001 par value
|
The NASDAQ Global Select Market
|
|
Securities registered pursuant to Section 12(g) of the Act: None
Indicate by check mark if the registrant is a well-known seasoned issuer, as defined in Rule 405 of the Securities Act.
Yes
ý
No
¨
Indicate by check mark if the registrant is not required to file reports pursuant to Section 13 or Section 15(d) of the Act.
Yes
¨
No
ý
Indicate by check mark whether the registrant (1) has filed all reports required to be filed by Section 13 or Section 15(d) of the Securities Exchange Act of 1934 during the preceding 12 months (or for such shorter period that the registrant was required to file such reports), and (2) has been subject to such filing requirements for the past 90 days.
Yes
ý
No
¨
Indicate by check mark whether the registrant has submitted electronically and posted on its corporate Web site, if any, every Interactive Data File required to be submitted and posted pursuant to Rule 405 of Regulation S-T (§ 232.405 of this chapter) during the preceding 12 months (or for such shorter period that the registrant was required to submit and post such files).
Yes
ý
No
¨
Indicate by check mark if disclosure of delinquent filers pursuant to Item 405 of Regulation S-K (§ 229.405 of this chapter) is not contained herein, and will not be contained, to the best of registrant’s knowledge, in definitive proxy or information statements incorporated by reference in Part III of this Form 10-K or any amendment to this Form 10-K.
¨
Indicate by check mark whether the registrant is a large accelerated filer, an accelerated filer, a non-accelerated filer, or a smaller reporting company. See definitions of “large accelerated filer,” “accelerated filer” and “smaller reporting company” in Rule 12b-2 of the Exchange Act.
|
Large accelerated filer
x
|
Accelerated filer
¨
|
Non-accelerated filer
¨
|
Smaller reporting company
¨
|
|
(Do not check if a smaller reporting company)
|
|||
Indicate by check mark whether the registrant is a shell company (as defined in Rule 12b-2 of the Act)
Yes
¨
No
ý
The approximate aggregate market value of voting and non-voting stock held by non-affiliates of the registrant was $101,183,706,509 as of June 30,
2016
.
(A)
|
(A)
|
Excludes 83,869,173 shares of common stock held by directors and executive officers, and any stockholders whose ownership exceeds ten percent of the shares outstanding, at June 30, 2016. Exclusion of shares held by any person should not be construed to indicate that such person possesses the power, directly or indirectly, to direct or cause the direction of the management or policies of the registrant, or that such person is controlled by or under common control with the registrant.
|
736,452,791
(Number of shares of common stock outstanding as of
February 9, 2017
)
DOCUMENTS INCORPORATED BY REFERENCE
Specified portions of the registrant’s Proxy Statement with respect to the 2017 Annual Meeting of stockholders to be held
May 19, 2017
, are incorporated by reference into Part III of this annual report.
INDEX
|
Page No.
|
||
|
Item 1.
|
||
|
Item 1A.
|
||
|
Item 1B.
|
||
|
Item 2.
|
||
|
Item 3.
|
||
|
Item 4.
|
||
|
Item 5.
|
||
|
Item 6.
|
||
|
Item 7.
|
||
|
Item 7A.
|
||
|
Item 8.
|
||
|
Item 9.
|
||
|
Item 9A.
|
||
|
Item 9B.
|
||
|
Item 10.
|
||
|
Item 11.
|
||
|
Item 12.
|
||
|
Item 13.
|
||
|
Item 14.
|
||
|
Item 15.
|
||
i
|
Item 1.
|
BUSINESS
|
Amgen Inc. (including its subsidiaries, referred to as “Amgen,” “the Company,” “we,” “our” or “us”) is committed to unlocking the potential of biology for patients suffering from serious illnesses by discovering, developing, manufacturing and delivering innovative human therapeutics. This approach begins by using tools like advanced human genetics to unravel the complexities of disease and understand the fundamentals of human biology.
Amgen focuses on areas of high unmet medical need and leverages its expertise to strive for solutions that improve health outcomes and dramatically improve people’s lives. A biotechnology pioneer, Amgen has grown to be one of the world’s leading independent biotechnology companies, has reached millions of patients around the world and is developing a pipeline of medicines with breakaway potential.
Our strategy is to develop innovative medicines in six focused therapeutic areas that meet important unmet medical needs in addressing serious illness. We have a presence in approximately 100 countries worldwide focusing on: oncology/hematology, cardiovascular disease, inflammation, bone health, nephrology and neuroscience.
Amgen was incorporated in California in 1980 and became a Delaware corporation in 1987. Amgen operates in one business segment: human therapeutics.
Significant Developments
Following is a summary of significant developments affecting our business that have occurred and that we have reported since the filing of our Annual Report on Form 10-K for the year ended December 31, 2015, and in early 2017.
Products/Pipeline
Bone health
EVENITY
™
(romosozumab)*
|
•
|
In February 2016, we and UCB, our global collaboration partner in the development of EVENITY
™
, announced that the phase 3 FRAME (FRActure study in postmenopausal woMen with ostEoporosis) study met its co-primary endpoints.
|
|
•
|
In March 2016, we and UCB announced that the phase 3 BRIDGE (placeBo-contRolled study evaluatIng the efficacy anD safety of EVENITY
™
in treatinG mEn with osteoporosis) study met its primary endpoint.
|
|
•
|
In September 2016, we and UCB announced that the U.S. Food and Drug Administration (FDA) accepted for review the Biologics License Application (BLA) for EVENITY
™
for the treatment of osteoporosis in postmenopausal women at increased risk for fracture. The FDA has set a Prescription Drug User Fee Act (PDUFA) target action date of July 19, 2017.
|
|
•
|
In December 2016, we and UCB announced that we submitted an application to the Pharmaceuticals and Medical Devices Agency in Japan, together with our joint venture partner Astellas Pharma, Inc., seeking marketing approval for EVENITY
™
for the treatment of osteoporosis for those at high risk of fracture.
|
Prolia
®
(denosumab)
|
•
|
In August 2016, we announced that the phase 3 randomized, double-blind, double-dummy, active-controlled study evaluating the safety and efficacy of Prolia
®
compared with risedronate in patients receiving glucocorticoid treatment met all primary and secondary endpoints at 12 months.
|
XGEVA
®
(denosumab)
|
•
|
In October 2016, we announced that the phase 3 study evaluating XGEVA
®
versus Zometa
®
(zoledronic acid) in the prevention of skeletal-related events (SREs) in patients with multiple myeloma met its primary endpoint of non-inferiority in delaying the time to first on-study SRE. The secondary endpoints of superiority in delaying time to first SRE and delaying time to first-and-subsequent SREs were not met.
|
1
Cardiovascular
Repatha
®
(evolocumab)
|
•
|
In July 2016, we announced that the FDA approved the Repatha
®
Pushtronex
™
system (on-body infusor with prefilled cartridge), a new, monthly single-dose administration option. The
Pushtronex
™
system is a hands-free device designed to provide 420 mg of Repatha
®
in a single dose.
|
|
•
|
In September 2016, we announced that the phase 3 GLAGOV (GLobal Assessment of Plaque ReGression with a PCSK9 AntibOdy as Measured by IntraVascular Ultrasound) study evaluating the effect of Repatha
®
on coronary artery disease met its primary and secondary endpoints.
|
|
•
|
In December 2016, we announced that the Committee for Medicinal Products for Human Use (CHMP) of the European Medicines Agency (EMA) adopted a positive opinion for an extension to the marketing authorization of a new 420 mg single-dose delivery option for Repatha
®
.
|
|
•
|
In January 2017, the United States District Court in Delaware granted Amgen’s request for a permanent injunction prohibiting Sanofi, Sanofi-Aventis U.S. LLC, Aventisub LLC, formerly doing business as Aventis Pharmaceuticals Inc. (collectively, Sanofi) and Regeneron Pharmaceuticals, Inc. (Regeneron) from infringing two patents that Amgen holds for Repatha
®
by manufacturing, using, selling or offering alirocumab for sale in the United States. Sanofi and Regeneron subsequently appealed the case to the U.S. Court of Appeals for the Federal Circuit (the Federal Circuit Court), and following a motion by Sanofi and Regeneron, in February 2017 the Federal Circuit Court entered a stay of the permanent injunction during the pendency of the appeal. See Part IV—Note 18, Contingencies and commitments, to the Consolidated Financial Statements.
|
|
•
|
In February 2017, we announced that the phase 3 FOURIER (Further Cardiovascular OUtcomes Research with PCSK9 Inhibition in Subjects with Elevated Risk) study evaluating the effects of Repatha
®
on cardiovascular outcomes met its primary composite endpoint (cardiovascular death, non-fatal myocardial infarction (MI), non-fatal stroke, hospitalization for unstable angina or coronary revascularization) and key secondary composite endpoint (cardiovascular death, non-fatal MI or non-fatal stroke). No new safety issues were observed.
|
|
•
|
In February 2017, we announced that the phase 3 EBBINGHAUS (Evaluating PCSK9 Binding antiBody Influence oN coGnitive HeAlth in high cardiovascUlar risk Subjects) cognitive function study achieved its primary endpoint.
|
Inflammation
Enbrel
®
(etanercept)
|
•
|
In November 2016, we announced that the FDA approved the supplemental Biologics License Application (sBLA) for the expanded use of ENBREL, making it the first and only systemic therapy to treat pediatric patients (ages 4-17) with chronic moderate-to-severe plaque psoriasis.
|
Nephrology
Parsabiv
™
(etelcalcetide)*
|
•
|
In November 2016, we announced that the European Commission (EC) granted marketing authorization for Parsabiv
™
for the treatment of secondary hyperparathyroidism (sHPT) in adult patients with chronic kidney disease (CKD) who are on hemodialysis.
|
|
•
|
In February 2017, we announced that the FDA approved Parsabiv
™
for the treatment of sHPT in adult patients with CKD who are on hemodialysis.
|
Neuroscience
Erenumab (formerly AMG 334)
|
•
|
In June 2016, we announced that the global phase 2 study evaluating the efficacy and safety of erenumab in chronic migraine prevention met its primary endpoint. Erenumab is being developed jointly with Novartis AG (Novartis).
|
|
•
|
In September 2016, we announced that the phase 3 ARISE (A phase 3, RandomIzed, double-blind, placebo-controlled Study to Evaluate the efficacy and safety of erenumab in migraine prevention) study evaluating the efficacy of erenumab in episodic migraine prevention met its primary endpoint.
|
|
•
|
In November 2016, we announced the positive top-line results of the global phase 3, randomized, double-blind, placebo-controlled STRIVE (STudy to evaluate the efficacy and safety of erenumab in migRaIne preVEntion) study. The study met its primary endpoint.
|
2
Oncology/Hematology
BLINCYTO
®
(blinatumomab)
|
•
|
In September 2016, we announced that the FDA approved the sBLA for BLINCYTO
®
to include new data supporting the treatment of pediatric patients with Philadelphia chromosome-negative (Ph-) relapsed or refractory (R/R) B-cell precursor acute lymphoblastic leukemia (ALL).
|
|
•
|
In February 2017, we announced the submission of a sBLA to the FDA to include overall survival data from the Phase 3 TOWER study, supporting the conversion of BLINCYTO
®
’s accelerated approval to full approval. The sBLA also includes new data supporting the treatment of patients with Philadelphia chromosome-positive (Ph+) R/R B-cell precursor ALL.
|
KYPROLIS
®
(carfilzomib)
|
•
|
In June 2016, the EC approved a variation to the marketing authorization for KYPROLIS
®
to include use in combination with dexamethasone alone for adult patients with multiple myeloma who have received at least one prior therapy. The EC approved the extended indication for KYPROLIS
®
based on data from the phase 3 head-to-head ENDEAVOR (RandomizEd, OpeN Label, Phase 3 Study of Carfilzomib Plus DExamethAsone Vs Bortezomib Plus DexamethasOne in Patients With Relapsed Multiple Myeloma) study.
|
|
•
|
In September 2016, we announced the top-line results of the phase 3 CLARION (Carfilzomib, Melphalan, Prednisone vs Bortezomib, Melphalan, Prednisone in Newly Diagnosed Multiple Myeloma) study, which evaluated an investigational regimen of KYPROLIS
®
, melphalan and prednisone versus VELCADE
®
(bortezomib), melphalan and prednisone for 54 weeks in patients with newly diagnosed multiple myeloma who were ineligible for hematopoietic stem-cell transplant. The study did not meet the primary endpoint of superiority in progression-free survival (PFS).
|
Nplate
®
(romiplostim)
|
•
|
In April 2016, we announced that the phase 3 study of Nplate
®
in children with symptomatic immune thromobocytopenia met its primary endpoint.
|
Biosimilars
AMJEVITA
™
(adalimumab-atto) /ABP 501
|
•
|
In September 2016, we announced that the FDA approved AMJEVITA
™
across all eligible indications of the reference product, HUMIRA
®
(adalimumab), including treatment of psoriatic arthritis, ankylosing spondylitis and moderate-to-severe rheumatoid arthritis, polyarticular juvenile idiopathic arthritis in patients four years of age or older, chronic plaque psoriasis, adult Crohn’s disease and ulcerative colitis. For discussion of ongoing, related litigation, see Part IV—Note 18, Contingencies and commitments, to the Consolidated Financial Statements.
|
|
•
|
In January 2017, we announced that the CHMP of the EMA adopted a positive opinion for the marketing authorization of ABP 501, recommending approval for all available indications.
|
ABP 215
|
•
|
In November 2016, we and Allergan plc (Allergan), our collaboration partner in the development and commercialization of certain biosimilar candidates, announced the submission of a BLA to the FDA for ABP 215, a biosimilar candidate to Avastin
®
(bevacizumab). The FDA has accepted the BLA and set the Biosimilar User Fee Act target action date of September 14, 2017.
|
|
•
|
In December 2016, we and Allergan announced the submission of a Marketing Authorization Application (MAA) to the EMA for ABP 215.
|
ABP 980
|
•
|
In July 2016, we and Allergan announced the results from a phase 3 study evaluating the efficacy and safety of ABP 980 compared with trastuzumab (Herceptin
®
) in patients with human epidermal growth factor receptor 2-positive early breast cancer. The results ruled out inferiority compared to trastuzumab but could not rule out superiority based on its primary efficacy endpoint of the difference of the percentage of patients with a pathologic complete response.
|
* FDA provisionally approved trade name
3
Marketing, Distribution and Selected Marketed Products
The largest concentration of our sales and marketing forces is based in the United States and Europe. Additionally, we continue to expand the commercialization and marketing of our products into other geographic territories, including parts of Latin America, the Middle East and Asia. This expansion is occurring by either establishing our own affiliate, acquiring existing third- party businesses or product rights or in partnering with third parties. Use of our own sales and marketing forces versus a third-party’s varies across these markets. Such use typically depends on several factors including the nature of entry into the new market, the size of opportunity and the operational capabilities. Together with our partners, we market our products to healthcare providers, including physicians or their clinics, dialysis centers, hospitals and pharmacies.
In the United States, we sell primarily to pharmaceutical wholesale distributors that we utilize as the principal means of distributing our products to healthcare providers. We also market certain products directly to consumers through direct-to-consumer print and television advertising, as well as through multi-channel marketing. For further discussion, see Government Regulation—Regulation of Product Marketing and Promotion. Outside the United States, we sell principally to healthcare providers and/or pharmaceutical wholesale distributors depending on the distribution practice in each country.
Our product sales to three large wholesalers, AmerisourceBergen Corporation, McKesson Corporation and Cardinal Health, Inc., each accounted for more than 10% of total revenues for each of the years ended
December 31, 2016
, 2015 and 2014. On a combined basis, these wholesalers accounted for approximately 96%, 97% and 94% of our U.S. gross product sales, respectively, and approximately 81%, 81% and 77% of our worldwide gross revenues, respectively. We monitor the financial condition of our larger customers and limit our credit exposure by setting credit limits and, in certain circumstances, by requiring letters of credit.
For financial information related to our one business segment, see Part IV—Consolidated Statements of Income, Consolidated Balance Sheets, and Note 19, Segment information, to the Consolidated Financial Statements.
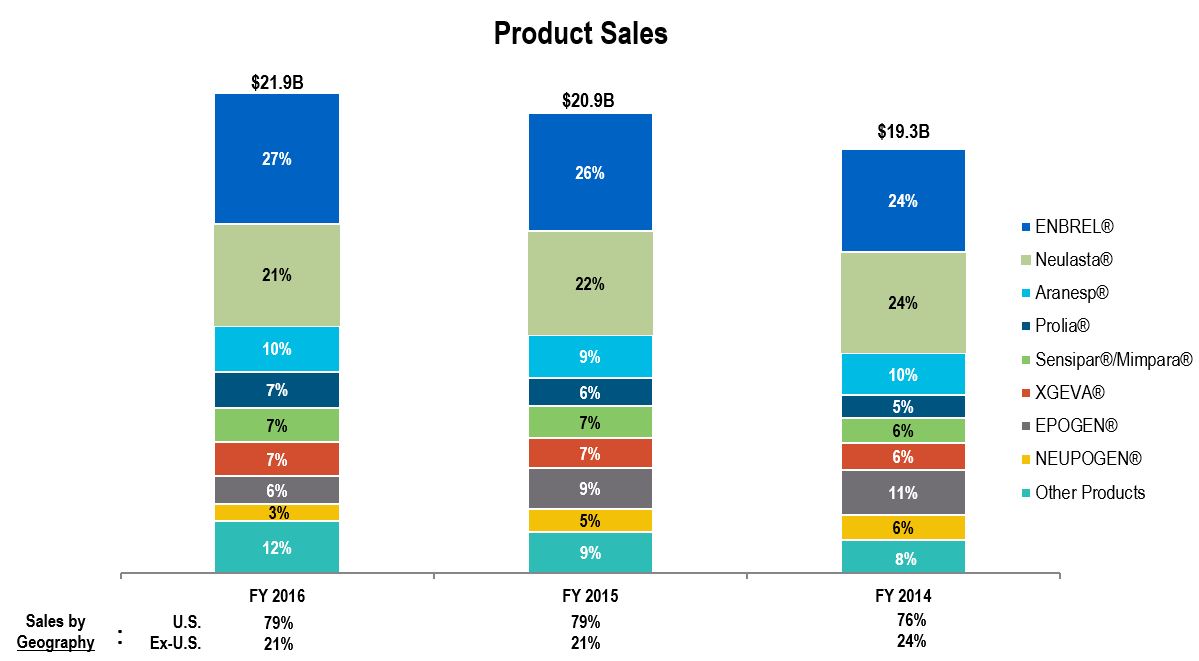
Our products are marketed around the world with the United States being our largest market. The following chart shows our product sales by principal product and by geography for the years ended December 31, 2016, 2015 and 2014.
4
Enbrel
®
(etanercept)
We market ENBREL primarily in the United States. It was launched in 1998 and is used primarily in indications for the treatment of adult patients with the following conditions:
|
•
|
moderately to severely active rheumatoid arthritis,
|
|
•
|
chronic moderate-to-severe plaque psoriasis patients who are candidates for systemic therapy or phototherapy, and
|
|
•
|
active psoriatic arthritis.
|
Neulasta
®
(pegfilgrastim)
We market Neulasta
®
, a pegylated protein based on the filgrastim molecule, primarily in the United States and Europe. Neulasta
®
was launched in 2002, and is used primarily in the indication to help reduce the chance of infection due to a low white blood cell count, in people with certain types of cancer (non-myeloid) who receive anti-cancer medicines (chemotherapy) that can cause fever and a low blood cell count. In 2015, the Neulasta
®
Onpro
®
kit became available in the United States.
Aranesp
®
(darbepoetin alfa)
We market Aranesp
®
primarily in Europe and the United States. It was launched in 2001, and is indicated to treat a lower-than-normal number of red blood cells (anemia) caused by CKD (in both patients on dialysis and patients not on dialysis). Aranesp
®
is also indicated for the treatment of anemia due to concomitant myelosuppressive chemotherapy in patients with non-myeloid malignancies, and when chemotherapy will be used for at least two months after starting Aranesp
®
.
Aranesp
®
and EPOGEN
®
compete with each other in the United States, primarily in the dialysis setting.
Prolia
®
(denosumab)
We market Prolia
®
primarily in the United States and Europe. It contains the same active ingredient as XGEVA
®
but is approved for different indications, patient populations, doses and frequencies of administration. Prolia
®
was launched in the United States and Europe in 2010. In the United States, it is used primarily in the indication for the treatment of postmenopausal women with osteoporosis at high risk for fracture, defined as a history of osteoporotic fracture, or multiple risk factors for fracture, or patients who have failed or are intolerant to other available osteoporosis therapy. In Europe, Prolia
®
is used primarily for the treatment of osteoporosis in postmenopausal women at increased risk of fracture.
Sensipar
®
/Mimpara
®
(cinacalcet)
We market cinacalcet as Sensipar
®
primarily in the United States and as Mimpara
®
primarily in Europe. It was launched in 2004 and is used primarily in the indication for the treatment of sHPT in adult patients with CKD who are on dialysis.
XGEVA
®
(denosumab)
We market XGEVA
®
primarily in the United States and Europe. XGEVA
®
was launched in the United States in 2010, and is used primarily in the indication for the prevention of SREs (pathological fracture, radiation to bone, spinal cord compression or surgery to bone) in patients with bone metastases from solid tumors. It is not indicated for the prevention of SREs in patients with multiple myeloma. XGEVA
®
was launched in Europe in 2011, and is used primarily in the indication for the prevention of SREs in adults with bone metastases from solid tumors.
EPOGEN
®
(epoetin alfa)
We market EPOGEN
®
in the United States for dialysis patients. EPOGEN
®
was launched in 1989, and we market it for the indication to treat anemia caused by CKD in patients on dialysis to lessen the need for red blood cell transfusions. The majority of our sales are to two large dialysis providers.
NEUPOGEN
®
(filgrastim)
We market NEUPOGEN
®
, a recombinant-methionyl human granulocyte colony-stimulating factor (G-CSF), primarily in the United States, Canada and Europe. NEUPOGEN
®
was launched in 1991 and is used primarily in the indication to help reduce the chance of infection due to a low white blood cell count in people with certain types of cancer (non-myeloid) who receive anti-cancer medicines (chemotherapy) that can cause fever and a low blood cell count.
Other Marketed Products
We market several other products, including KYPROLIS
®
(carfilzomib), Vectibix
®
(panitumumab), Nplate
®
(romiplostim), Repatha
®
(evolocumab), BLINCYTO
®
(blinatumomab), IMLYGIC
®
(talimogene laherparepvec) and Corlanor
®
(ivabradine).
5
Patents
The following table describes our outstanding material patents for the indicated product by territory, general subject matter and latest expiry date. Certain of the European patents are the subject of supplemental protection certificates that provide additional protection for the product in certain European countries beyond the dates listed in the table (see footnotes).
One or more patents with the same or earlier expiry date may fall under the same “general subject matter” and are not listed separately.
|
Product
|
Territory
|
General Subject Matter
|
Expiration
|
|||
|
Enbrel
®
(etanercept)
|
U.S.
|
Methods of treating psoriasis
|
8/13/2019
|
|||
|
U.S.
|
Aqueous formulation and methods of treatment using the formulation
|
6/8/2023
|
||||
|
U.S.
|
Fusion protein, and pharmaceutical compositions
|
11/22/2028
|
||||
|
U.S.
|
DNA encoding fusion protein, and methods of making fusion protein
|
4/24/2029
|
||||
|
Neulasta
®
(pegfilgrastim)
|
Europe
|
Pegylated G-CSF
(1)
|
2/8/2015
|
|||
|
Aranesp
®
(darbepoetin alfa)
|
U.S.
|
Glycosylation analogs of erythropoietin proteins
|
5/15/2024
|
|||
|
Prolia
®
/
XGEVA ® (denosumab) |
U.S.
|
RANKL antibodies; and methods of use
(2)
|
12/22/2017
|
|||
|
U.S.
|
Methods of treatment
|
6/25/2022
|
||||
|
U.S.
|
Nucleic acids encoding RANKL antibodies, and methods of producing RANKL antibodies
|
11/30/2023
|
||||
|
U.S.
|
RANKL antibodies including sequences
|
2/19/2025
|
||||
|
Europe
|
RANKL antibodies
(1)
|
12/22/2017
|
||||
|
Europe
|
Medical use of RANKL antibodies
(1)
|
4/15/2018
|
||||
|
Europe
|
RANKL antibodies including epitope binding
|
2/23/2021
|
||||
|
Europe
|
RANKL antibodies including sequences
(1)
|
6/25/2022
|
||||
|
Sensipar
®
/
Mimpara ® (cinacalcet) |
U.S.
|
Calcium receptor-active molecules
|
3/8/2018
|
|||
|
U.S.
|
Formulation
|
9/22/2026
|
||||
|
Europe
|
Calcium receptor-active molecules
(1)
|
10/23/2015
|
||||
|
KYPROLIS
®
(carfilzomib)
|
U.S.
|
Compositions and compounds
|
12/7/2027
|
|||
|
U.S.
|
Methods of treatment
|
4/14/2025
|
||||
|
Europe
|
Compositions, compounds and methods of treatment
(1)
|
8/8/2025
|
||||
|
Vectibix
®
(panitumumab)
|
U.S.
|
Human monoclonal antibodies to epidermal growth factor receptor (EGFr)
|
4/8/2020
|
|||
|
Europe
|
Human monoclonal antibodies to EGFr
(1)
|
5/5/2018
|
||||
|
Nplate
®
(romiplostim)
|
U.S.
|
Thrombopoietic compounds
|
1/19/2022
|
|||
|
U.S.
|
Formulation
|
2/12/2028
|
||||
|
Europe
|
Thrombopoietic compounds
(1)
|
10/22/2019
|
||||
|
Europe
|
Formulation
|
4/20/2027
|
||||
|
Repatha
®
(evolocumab)
|
U.S.
|
Antibodies
(3)
|
10/25/2029
|
|||
|
U.S.
|
Methods of treatment
|
10/8/2030
|
||||
|
Europe
|
Compositions and method of treatment
|
8/22/2028
|
||||
|
BLINCYTO
®
(blinatumomab)
|
U.S.
|
Bifunctional polypeptides
(3)
|
4/21/2019
|
|||
|
U.S.
|
Method of administration
|
9/28/2027
|
||||
|
Europe
|
Bifunctional polypeptides
|
11/26/2024
|
||||
|
Europe
|
Method of administration
|
11/29/2026
|
||||
|
IMLYGIC
®
(talimogene laherparepvec)
|
U.S.
|
Compositions and method of treatment
(3)
|
1/22/2021
|
|||
|
Europe
|
Composition and uses
|
1/22/2021
|
||||
|
Parsabiv
™
(etelcalcetide)
|
U.S.
|
Compound and pharmaceutical composition
|
7/29/2030
|
|||
|
Europe
|
Compound and pharmaceutical composition
|
7/29/2030
|
||||
6
|
(1)
|
A European patent with this subject matter may also be entitled to supplemental protection in one or more countries in Europe, and the length of any such extension will vary by country. For example, supplementary protection certificates have been issued related to the indicated products for patents in at least the following countries:
|
|
•
|
pegfilgrastim — France, Germany, Italy, Spain, and the United Kingdom, expiring in August 2017
|
|
•
|
denosumab
—
France, Italy, Spain and the United Kingdom
, expiring in
2025
|
|
•
|
cinacalcet — France, Germany, Italy, Spain, and the United Kingdom, expiring in 2019
|
|
•
|
panitumumab — France, Germany, Italy, Spain, and the United Kingdom, expiring in 2022
|
|
•
|
romiplostim — France, Italy, Spain, and the United Kingdom, expiring in 2024
|
|
•
|
carfilzomib — France and Germany, expiring in 2028
|
|
(2)
|
The U.S. Patent and Trademark Office has issued a Notice of Final Determination that a patent with this subject matter is eligible for patent term extension with an expiry of September 17, 2021.
|
|
(3)
|
A patent with this subject matter may be entitled to patent term extension in the United States.
|
Competition
We operate in a highly competitive environment. Our products compete with other products or treatments for diseases for which our products may be indicated. Our competitors market products or are actively engaged in research and development (R&D) in areas in which we have products or in which we are developing product candidates or new indications for existing products. Our competitive positions may be based on, among other things, safety, efficacy, reliability, availability, patient convenience/delivery devices, price, reimbursement, access to and timing of market entry and patent position and expiration.
Certain of the existing patents on our principal products have expired, and we face new and increasing competition, including from biosimilars. We may also compete against biosimilar or generic versions of our competitors’ products. A biosimilar is another version of a biological product for which marketing approval is sought or has been obtained based on a demonstration that it is “highly similar” to the original reference product. See Government Regulation. We expect the adverse impact from biosimilars to be more like branded biologics than generic small molecules. Although we expect biosimilars to compete on price, we believe many patients, providers and payers will continue to place high value on the reputation, reliability and safety of our products. Zarxio
®
, a biosimilar version of NEUPOGEN
®
from Sandoz, a Novartis company (Sandoz), which launched in the United States in 2015, was the first biosimilar entrant into the U.S. market. Companies have pending applications with the FDA for biosimilar versions of EPOGEN
®
and Neulasta
®
, along with additional biosimilar versions of NEUPOGEN
®
. We are well positioned to compete and will leverage the experience we have had in the United States versus branded competition, as well as our considerable experience in competing against epoetin alfa and filgrastim biosimilars in Europe.
The introduction of new products, the development of new processes or technologies by competitors or the emergence of new information about existing products may result in increased competition for our marketed products, even for those protected by patents, or in reductions in the prices we receive from selling our products. In addition, the development of new treatment options or standards of care may reduce the use of our products or may limit the utility and application of ongoing clinical trials for our product candidates (as used in this document, clinical trials may include prospective clinical trials, observational studies, registries and other studies). See Item 1A. Risk Factors—Our products face substantial competition and Item 1A. Risk Factors—We currently face competition from biosimilars and expect to face increasing competition in the future.
7
The following table reflects our significant competitors and is not exhaustive.
|
Product
|
Territory
|
Competitor Marketed Product
|
Competitors
|
|||
|
ENBREL
|
U.S. & Canada
|
REMICADE
®
*
|
Janssen Biotech, Inc. (Janssen)
(1)
/Merck & Company, Inc. (Merck)
|
|||
|
U.S. & Canada
|
HUMIRA
®
|
AbbVie Inc.
|
||||
|
U.S. & Canada
|
STELARA
®(2)
|
Janssen
(1)
|
||||
|
Neulasta
®
|
Europe
|
Filgrastim biosimilars
|
Various
|
|||
|
Aranesp
®
|
U.S.
|
PROCRIT
®(3)
|
Janssen
(1)
|
|||
|
U.S.
|
MIRCERA
®(4)
|
Galenica Group (Galenica)/F. Hoffmann-La Roche Ltd. (Roche)
|
||||
|
Europe
|
Epoetin alfa biosimilars
|
Various
|
||||
|
Prolia
®
|
U.S. & Europe
|
Alendronate, raloxifene and zoledronate generics
|
Various
|
|||
|
Sensipar
®(5)
/
Mimpara
®
|
U.S. & Europe
|
Active Vitamin D analogs
|
Various
|
|||
|
XGEVA
®
|
U.S. & Europe
|
Zoledronate generics
|
Various
|
|||
|
EPOGEN
®
|
U.S.
|
MIRCERA
®(4)
|
Galenica/Roche
|
|||
|
NEUPOGEN
®
|
U.S.
|
Granix
®
|
Teva Pharmacueticals Industries Ltd. (Teva)
|
|||
|
U.S.
|
Zarxio
®
|
Sandoz
|
||||
|
Europe
|
Filgrastim biosimilars
|
Various
|
||||
|
KYPROLIS
®(7)
|
U.S.
|
VELCADE
®
|
Millennium Pharmaceuticals, Inc.
(6)
|
|||
|
U.S.
|
REVLIMID
®
|
Celgene Corporation (Celgene)
|
||||
|
U.S.
|
POMALYST
®
|
Celgene
|
||||
|
Repatha
®
|
U.S. & Europe
|
PRALUENT
®
|
Regeneron
Sanofi
|
|||
|
*
|
Approved biosimilar available
|
|
(1)
|
A subsidiary of Johnson & Johnson (J&J).
|
|
(2)
|
Dermatology only.
|
|
(3)
|
PROCRIT
®
competes with Aranesp
®
in the supportive cancer care and pre-dialysis settings.
|
|
(4)
|
MIRCERA
®
competes with Aranesp
®
in the nephrology segment only.
|
|
(5)
|
Teva and Barr Pharmaceuticals have received tentative approval from the FDA for generic versions of Sensipar
®
that could compete with Sensipar
®
in the future. There is an injunction prohibiting them from commercializing in the United States until expiration of the Sensipar
®
patents.
|
|
(6)
|
A wholly owned subsidiary of Takeda Pharmaceutical Company Limited.
|
|
(7)
|
KYPROLIS
®
is facing increased competition from several recently approved products.
|
8
Reimbursement
Sales of our principal products are dependent on the availability and extent of coverage and reimbursement from third-party payers. In many markets around the world, these payers, including government health systems, private health insurers and other organizations, continue to be focused on reducing the cost of healthcare. Their efforts have intensified as a result of rising healthcare costs and economic challenges. Drugs, and in particular specialty drugs such as our products, remain a focus for cost containment by these parties. As a result, payers around the world are being more restrictive regarding the use of biopharmaceutical products while requiring a higher level of clinical evidence to support the benefit such products bring to patients and the broader healthcare system.
The scrutiny of biopharmaceutical pricing in the United States remains intense and a point of focus in the discussion of rising healthcare costs. The pricing practices of certain companies have increased public media and government scrutiny of the biopharmaceutical industry, providing greater incentive for governments and private payers to limit or regulate the price of drug products and services. At the same time, value assessments of new technology, previously used predominantly outside the United States, are having an impact in the U.S. healthcare environment. Healthcare provider organizations and independent organizations are creating their own value assessments of biopharmaceutical drugs for comparison with manufacturer pricing. Although these organizations do not set drug prices, they seek to influence pricing as well as payer and provider decision making by publicly disclosing their assessments, often making assertions around what they believe to be the appropriate price to charge for a product. These developments put greater pressure on access to, pricing of and sales of our products.
In the United States, healthcare providers are reimbursed for covered services and products they deliver through Medicare, Medicaid and other government healthcare programs, as well as through private payers. Pharmacies are also reimbursed in a similar manner for drug products they dispense. We are required to provide specified rebates or discounts on the products we sell to certain government funded programs, including Medicare and Medicaid, and those rebates or discounts have increased over time. The Patient Protection and Affordable Care Act (ACA), enacted in 2010, increased many of the mandatory discounts and rebates required of us and imposed a new Branded Prescription Pharmaceutical Manufacturers and Importers fee payable each year by us and other manufacturers. The new U.S. presidential administration has identified repealing and replacing the ACA as a priority. The timing and method of repeal and replacement legislation is uncertain but changes could include the number of patient lives covered, the quality of the insurance, Medicaid eligibility and the level of patient protections provided.
Further efforts by government agencies and state legislatures in the United States could also affect us and our industry. For example, a recently enacted Vermont law requires manufacturers to submit price increase justifications to the state attorney general if certain price increase and state spending thresholds are met. Examples of other proposals that have been discussed and debated, but not yet enacted, include state ballot initiatives that would place a maximum price ceiling, or cap, on pharmaceutical products purchased by state agencies and state legislative efforts to cap pharmaceutical prices for commercial payers. Other legislative and regulatory actions that would have a significant impact on Amgen include: changes to how the Medicare program covers and reimburses current and future drugs, including for patients with End-Stage Renal Disease; changes in the Federal payment rate or new rebate requirements for covered drugs and policies for payment in Medicare or Medicaid; and changes to coverage and payment for biosimilars, including the current Medicare biosimilar coverage and payment policies intended to encourage biosimilar adoption, or other policies that provide easier substitution or reimbursement advantages.
In the U.S. private sector, healthcare providers and payers continue to institute cost reduction and containment measures that lower drug spending altogether or shift a greater portion of the costs to patients. Such measures include more limited benefit plan designs, higher tier formulary placement that increases the level of patient out of pocket costs and stricter utilization criteria before a patient may get access to a drug. In the retail pharmacy sector, in which the majority of our sales for ENBREL, Sensipar
®
and Repatha
®
occur, the use of such measures by Pharmacy Benefit Managers (PBMs) and insurers has continued to intensify which have limited Amgen product usage and revenues. PBMs are third-party organizations tasked with administrating prescription drug programs for large employers, health plans and government programs. Consolidation has resulted in a smaller number of PBMs and insurers overseeing a large portion of total covered lives in the United States; for example three PBMs oversee approximately 75% of covered lives in the United States. As a result, PBMs and insurers have greater market power and negotiating leverage to exclude drugs from their formularies in favor of competitor drugs or alternative treatments, and/or to mandate stricter utilization criteria. Formulary exclusion effectively encourages patients and providers to seek alternative treatments or pay 100% of the cost of a drug. Recent experience with Repatha
®
underscores that utilization management requirements continue to be onerous for patients and physicians, limiting access to appropriate usage. In highly competitive treatment markets such as with ENBREL, PBMs are also able to exert negotiating leverage by requiring incremental rebates from manufacturers in order to maintain their formulary position. A drug’s favorable position on formulary is essential to ensure patients have access.
In general, in countries outside the United States, government-sponsored healthcare systems are the primary payers for drugs and biologics. With increased budgetary constraints, payers in many countries apply a variety of measures to exert downward price pressure. These measures can include mandatory price controls, price referencing, therapeutic reference pricing, increases in mandates or incentives for generic substitution and biosimilar usage, and government-mandated price cuts. We expect that
9
countries will continue to take aggressive actions to reduce expenditures on drugs and biologics. Similarly, fiscal constraints may also impact the extent to which countries are willing to approve new and innovative therapies and/or allow access to new technologies. For example, many Health Technology Assessment (HTA) organizations use formal economic metrics such as cost-effectiveness to determine coverage and reimbursement of new therapies, and these organizations are proliferating in established and emerging markets.
The dynamics and developments discussed above serve to create pressure on the pricing and potential usage of our products, and the industry as a whole. We remain focused on delivering breakthrough treatments for unmet medical needs. Amgen is committed to working with the entire healthcare community to ensure continued innovation and to enable patient access to needed medicines. We do this by:
•
investing billions of dollars annually in research and development;
•
developing more affordable therapeutic choices in the form of high-quality and reliably-supplied biosimilars;
•
pricing our medicines to reflect the value they provide;
•
partnering with payers to share risk and accountability for health outcomes;
•
providing patient support and education programs and helping patients in financial need access our medicines; and
|
•
|
working with policymakers, patients and other stakeholders to establish a sustainable healthcare system with access to affordable care and where patients and their healthcare professionals are the primary decision makers.
|
See Item 1A. Risk Factors—Our sales depend on coverage and reimbursement from third-party payers, and pricing and reimbursement pressures may affect our profitability and Item 1A. Risk Factors—Guidelines and recommendations published by various organizations can reduce the use of our products.
Manufacturing, Distribution and Raw Materials
Manufacturing
We believe we are a leader in the manufacturing of biologics and that our manufacturing capabilities represent a competitive advantage. The products we manufacture consist of both biologics and small molecule drugs. The majority of our products are biologics that are produced in living cells and that are inherently complex due to naturally-occurring molecular variations. Highly specialized knowledge and extensive process and product characterization are required to transform laboratory-scale processes into reproducible commercial manufacturing processes. For additional information regarding manufacturing facilities, see Item 2. Properties.
We perform most of our bulk manufacturing, formulation, and/or fill and finish activities in our Puerto Rico, Rhode Island, California and Ireland facilities and also conduct finish activities in the Netherlands. In addition, we utilize third-party contract manufacturers to supplement our commercial manufacturing requirements.
We manufacture products to support our clinical trials primarily in our California and Rhode Island locations. We also utilize third-party contract manufacturers for certain clinical products.
See Item 1A. Risk Factors for a discussion of the factors that could adversely impact our manufacturing operations and the global supply of our products.
Distribution
We operate distribution centers in Kentucky, California and the Netherlands for worldwide distribution of the majority of our commercial and clinical products. We also use third-party distributors to supplement distribution of our products worldwide.
Other
In addition to the manufacturing and distribution activities noted above, our operations in the United States, the U.S. territory of Puerto Rico and the Netherlands include key manufacturing support functions, including quality control, process development, procurement, production scheduling and warehousing. Certain of those manufacturing and distribution activities are highly regulated by the FDA as well as other international regulatory agencies. See Government Regulation—Regulation in the United States—Regulation of Manufacturing Standards.
10
Manufacturing Initiatives
We have multiple ongoing initiatives that are designed to extend our manufacturing advantage by optimizing our manufacturing network and/or mitigating manufacturing risks while continuing to ensure adequate supply of our products. We have initiated the bulk process qualification campaign to facilitate licensure at our biologics manufacturing facility in Singapore. Upon licensure, this facility will expand our capability to manufacture cell culture products utilizing new technology and innovation. The facility will be fully reconfigurable, providing efficient manufacturing capabilities to help ensure supply of our products worldwide. Our first product to be manufactured in the facility will be denosumab. We are also constructing an additional new facility at the site in Singapore to enable the manufacture of the active pharmaceutical ingredient for KYPROLIS
®
.
In addition to these initiatives, we have projects designed to optimize manufacturing asset utilization, to continue our use of third-party contract manufacturers and to maintain a state of regulatory compliance. This includes manufacturing network consolidation initiatives as well as process improvements surrounding manufacturing. See Item 1A. Risk Factors—Manufacturing difficulties, disruptions or delays could limit supply of our products and limit our product sales.
Raw Materials and Medical Devices
Certain raw materials, medical devices, including companion diagnostics, and components necessary for the commercial and/or clinical manufacturing of our products are provided by and are the proprietary products of unaffiliated third-party suppliers, certain of which may be our only sources for such materials. We currently attempt to manage the risk associated with such suppliers by inventory management, relationship management and evaluation of alternative sources when feasible. We also monitor the financial condition of certain suppliers and their ability to supply our needs. See Item 1A. Risk Factors—We rely on third-party suppliers for certain of our raw materials, medical devices and components.
We perform various procedures to assist us in authenticating the source of raw materials, including intermediary materials used in the manufacture of our products, which include verification of the country of origin. The procedures are incorporated into the manufacturing processes we and our third-party contract manufacturers perform.
Government Regulation
Regulation by government authorities in the United States and other countries is a significant factor in the production and marketing of our products and our ongoing R&D activities. In order to clinically test, manufacture and market products for therapeutic use, we must satisfy mandatory procedures and safety and effectiveness standards established by various regulatory bodies. Compliance with these standards is complex and failure to comply with any of these standards can result in significant implications. See Item 1A. Risk Factors for a discussion of factors that can adversely impact our development and marketing of commercial products including global regulatory implications.
Regulation in the United States
In the United States, the Public Health Service Act, the Federal Food, Drug, and Cosmetic Act (FDCA) and the regulations promulgated thereunder, as well as other federal and state statutes and regulations govern, among other things, the production, research, development, testing, manufacture, quality control, labeling, storage, record keeping, approval, advertising and promotion, and distribution of our products, as well as the reporting of certain payments and other transfers of value to healthcare professionals and teaching hospitals.
Clinical Development and Product Approval.
Drug development in our industry is complex, challenging and risky; and failure rates are high. Product development cycles are typically very long—approximately 10 to 15 years from discovery to market. A potential new medicine must undergo many years of preclinical and clinical testing to establish its safety and efficacy for use in humans at appropriate dosing levels and with an acceptable risk-benefit profile.
After laboratory analysis and preclinical testing in animals, we file an Investigational New Drug Application (IND) with the FDA to begin human testing. Typically, we undertake an FDA-designated three-phase human clinical testing program.
|
•
|
In phase 1, we conduct small clinical trials to investigate the safety and proper dose ranges of our product candidates in a small number of human subjects.
|
|
•
|
In phase 2, we conduct clinical trials to investigate side effect profiles and the efficacy of our product candidates in a large number of patients who have the disease or condition under study.
|
|
•
|
In phase 3, we conduct clinical trials to investigate the safety and efficacy of our product candidates in a large number of patients who have the disease or condition under study.
|
The FDA monitors the progress of each trial conducted under an IND and may, at its discretion, re-evaluate, alter, suspend or terminate the testing based on the data accumulated to that point and the FDA’s risk-benefit assessment with regard to the
11
patients enrolled in the trial. The results of preclinical and clinical trials are submitted to the FDA in the form of a BLA for biologic products or an NDA for small molecule products. We are not permitted to market or promote a new product until the FDA has approved our marketing application.
Approval of Biosimilars
.
The ACA authorized the FDA to approve biosimilars via a separate, abbreviated pathway. The pathway allows sponsors of a biosimilar to seek and obtain regulatory approval based in part on the non-clinical and clinical trial data of an originator product to which the biosimilar has been demonstrated to be “highly similar” and to have no clinically meaningful differences in terms of safety, purity, and potency. The relevance of demonstrating “similarity” is that in many cases, biosimilars can be brought to market without conducting the full suite of clinical trials typically required of originators, as risk-benefit has previously been established. In order to preserve incentives for future innovation, the law establishes a period of exclusivity for originators’ products, which in general prohibits biosimilars from gaining FDA approval based in part on reliance on or reference to the originator’s data in their application to the FDA for 12 years after FDA approval of the originator product. The law does not change the duration of patents granted on biologic products. The FDA has released a number of guidance documents as part of the implementation of the abbreviated approval pathway for biosimilars, some of which remain in draft form. As of the end of 2016, four biosimilar applications have been approved by the FDA, including AMJEVITA
™
.
A number of manufacturers have announced the filing of marketing applications to the FDA under the biosimilar pathway, some of which are for biosimilars of our products.
Regulation of Product Marketing and Promotion
. The FDA regulates the marketing and promotion of products. Our product promotion for approved product indications must comply with the statutory standards of the FDCA, and the FDA’s implementing regulations and standards. The FDA’s review of marketing and promotional activities encompasses, but is not limited to, direct-to-consumer advertising, healthcare provider-directed advertising and promotion, sales representative communications to healthcare professionals, promotional programming and promotional activities involving electronic media. The FDA may also review industry-sponsored scientific and educational activities that make representations regarding product safety or efficacy in a promotional context. The FDA may take enforcement action against a company for promoting unapproved uses of a product or for other violations of its advertising and labeling laws and regulations. Enforcement action may include product seizures, injunctions, civil or criminal penalties or regulatory letters, which may require corrective advertising or other corrective communications to healthcare professionals. Failure to comply with the FDA’s regulations also can result in adverse publicity or increased scrutiny of company activities by the U.S. Congress or other legislators. Additionally, as described below, such failure may lead to additional liability under U.S. health care fraud and abuse laws.
Regulation of Manufacturing Standards
. The FDA regulates and inspects equipment, facilities, laboratories and processes used in the manufacturing and testing of products prior to providing approval to market products. If after receiving approval from the FDA, we make a material change in manufacturing equipment, location or process, additional regulatory review may be required. We also must adhere to current Good Manufacturing Practice regulations and product-specific regulations enforced by the FDA through its facilities inspection program. The FDA conducts regular, periodic visits to re-inspect our equipment, facilities, laboratories and processes following an initial approval.
Regulation of Combination Products
. Combination products are defined by the FDA to include products composed of two or more regulated components (e.g., a biologic and/or drug and a device). Biologics/Drugs and devices each have their own regulatory requirements, and combination products may have additional requirements. A number of our marketed products meet this definition and are regulated under this framework, and we expect that a number of our pipeline product candidates will be evaluated for regulatory approval under this framework as well.
Regulation Outside the United States
In the European Union (EU) countries as well as Switzerland, Canada,
Australia and Japan
, regulatory requirements and approval processes are similar in principle to those in the United States.
In the EU, there are currently two potential tracks for seeking marketing approval for a product which is not authorized in any Member State; a decentralized procedure; and a centralized procedure. In the decentralized procedure, identical applications for marketing authorization are submitted simultaneously to the national regulatory agencies.
Regulatory review is led by one Member State (the Reference Member State) and its assessment
—
based on safety, quality and efficacy
—
is reviewed and approved (assuming there are no concerns that the product poses a serious risk to public health) by the other Member States from which the applicant is seeking approval (the Concerned Member States). The decentralized procedure leads to a series of single national approvals in all relevant countries. In the centralized procedure, which is required of all products derived from biotechnology, a company submits a single MAA to the EMA, which conducts an evaluation of the dossier, drawing upon its scientific resources across Europe. If the drug product is proven to fulfill the requirements for quality, safety and efficacy, the EMA’s CHMP adopts a positive opinion, which is transmitted to the EC for final decision on grant of the marketing authorization. While the EC generally follows the CHMP
’
s opinion, it is not bound to do so. Subsequent commercialization is enabled by country-by-country reimbursement approval.
12
In the EU, biosimilars are approved under a specialized pathway of the centralized procedure. As with the U.S. pathway, applicants seek and obtain regulatory approval for a biosimilar once the data exclusivity period for the original reference product has expired relying in part on the data submitted for the originator product together with data evidencing that the biosimilar is “highly similar” in terms of quality, safety and efficacy to the original reference product authorized in the European Economic Area.
Other countries such as Russia, Turkey and those in Latin America and the Middle East have review processes and data requirements similar to those of the EU, and in some cases rely on prior marketing approval from U.S. or EU regulatory authorities. The regulatory process in these countries may include manufacturing/testing facility inspections, testing of drug product upon importation and other domestic requirements.
In Asia Pacific, a number of countries such as China, Japan, South Korea and Taiwan may require local clinical trial data for bridging purposes as part of the drug registration process in addition to global clinical trials, which can add to overall drug development and registration timelines. In most of the Asian markets, registration timelines depend on marketing approval in the United States or the EU. In some markets in Asia, such as China, Thailand, and Indonesia, the regulatory timelines can be less predictable. The regulatory process may also include manufacturing/testing facility inspections, testing of drug product upon importation and other domestic requirements. Countries such as Australia and Japan have more mature systems that would allow for submissions in more competitive timeframes. Regarding biosimilars, several of these countries have pathways to register biosimilars (e.g., South Korea, India, Australia, Singapore and Taiwan) and biosimilar products are already present on the markets (e.g., Australia and South Korea).
In some countries, such as Japan and those in the EU, medical devices may be subject to regulatory regimes whereby the manufacturer must establish that its medical device conforms to essential requirements set out in the law for the particular device category. For example, in the EU, with limited exceptions, medical devices placed on the market must bear the
Conformité Européenne
marking to indicate their conformity with legal requirements.
Post-approval Phase
After approval, we continue to monitor adverse events reported following the use of our products through post marketing routine pharmacovigilance surveillance and studies when applicable. We report such events to the appropriate regulatory agencies, as required per local regulations for individual cases and aggregate reports. We proactively monitor (according to good pharmacovigilance practices) and ensure implementation of signal detection, assessment and the communication of adverse events that may be associated with the use of our products. We may also be required by regulatory agencies to conduct further clinical trials on our marketed products as a condition of their approval or to provide additional information on safety and efficacy. Health authorities, including the FDA, have authority to mandate labeling changes to products at any point in a product’s lifecycle based on new safety information or as part of an evolving label change to a particular class of products.
Health authorities, including the FDA, also have the authority, before or after approval, to require companies to implement a risk management program for a product to ensure that the benefits of the drug outweigh the risks. Each risk management program is unique and varies depending on the specific factors required. In the United States, a risk management program is known as a risk evaluation and mitigation strategy (REMS) and we currently have REMS for Prolia
®
, Nplate
®
and BLINCYTO
®
, as well as for our erythropoiesis-stimulating agents (ESAs), which includes EPOGEN
®
and Aranesp
®
.
Other Regulation
We are also subject to various laws pertaining to healthcare “fraud and abuse,” including anti-kickback laws and false claims laws. Anti-kickback laws make it illegal to solicit, offer, receive or pay any remuneration in exchange for or to induce the referral of business, including the purchase or prescription of a particular drug that is reimbursed by a state or federal program. False claims laws prohibit knowingly and willingly presenting, or causing to be presented for payment to third-party payers (including Medicare and Medicaid) any claims for reimbursed drugs or services that are false or fraudulent, claims for items or services not provided as claimed or claims for medically unnecessary items or services. Violations of fraud and abuse laws may be punishable by criminal and/or civil sanctions, including fines and civil monetary penalties, as well as by the possibility of exclusion from federal healthcare programs (including Medicare and Medicaid). Liability under the false claims laws may also arise when a violation of certain laws or regulations related to the underlying products (e.g., violations regarding improper promotional activity or unlawful payments) contributes to the submission of a false claim.
In 2012, Amgen announced it had finalized a settlement agreement with the U.S. government and various other parties regarding allegations that Amgen’s promotional, contracting, sales and marketing activities and arrangements caused the submission of various false claims under the Federal Civil False Claims Act and various State False Claims Acts. In connection with entering into the settlement agreement, Amgen also entered into a corporate integrity agreement with the Office of Inspector General (OIG) of the U.S. Department of Health and Human Services that requires Amgen to maintain its corporate compliance program and to undertake a set of defined corporate integrity obligations for a period of five years. Due to the breadth of the
13
statutory provisions and the absence of guidance in the form of regulations or court decisions addressing some of our practices, it is possible that in the future our practices might be further challenged under anti-kickback or similar laws.
Additionally, the U.S. Foreign Corrupt Practices Act (FCPA) prohibits U.S. corporations and their representatives from offering, promising, authorizing or making payments to any foreign government official, government staff member, political party or political candidate in an attempt to obtain or retain business abroad. The scope of the FCPA includes interactions with certain healthcare professionals in many countries. Other countries have enacted similar anti-corruption laws and/or regulations.
Our business has been and will continue to be subject to various other U.S. and foreign laws, rules and/or regulations.
Research and Development and Selected Product Candidates
We focus our R&D on novel human therapeutics for the treatment of serious illness in the areas of oncology/hematology, cardiovascular disease, inflammation, bone health, nephrology and neuroscience. We take a modality-independent approach to R&D with a focus on biologics. We use cutting-edge science and technology to study the subtle biological mechanisms in search of therapies that will improve the lives of those who suffer from diseases. Our discovery research programs may therefore yield targets that lead to the development of human therapeutics delivered as large molecules, small molecules, or other combination or new modalities. Human genetic validation is used whenever possible to enhance the likelihood of success. For the years ended December 31,
2016
,
2015
and
2014
, our R&D expenses were
$3.8 billion
,
$4.1 billion
and
$4.3 billion
, respectively.
We have major R&D centers in several locations throughout the United States (including Thousand Oaks and San Francisco, California and Cambridge, Massachusetts), in Iceland and in the United Kingdom, as well as smaller research centers and development facilities globally. See Item 2. Properties.
We conduct clinical trial activities by using both our internal staff and third-party contract clinical trial service providers. To increase the number of patients available for enrollment in our clinical trials, we have opened clinical sites and will continue opening clinical sites and enrolling patients in a number of geographic locations. See Government Regulation—Clinical Development and Product Approval for a discussion of government regulation over clinical development. Also see Item 1A. Risk Factors—We must conduct clinical trials in humans before we can commercialize and sell any of our product candidates or existing products for new indications.
Some of our competitors are actively engaged in R&D in areas where we have products or where we are developing product candidates or new indications for existing products. For example, we compete with other clinical trials for eligible patients, which may limit the number of available patients who meet the criteria for certain clinical trials. The competitive marketplace for our product candidates is significantly dependent on the timing of entry into the market. Early entry may have important advantages in gaining product acceptance, thereby contributing to a product’s eventual success and profitability. Accordingly, we expect that in some cases, the relative speed with which we can develop products, complete clinical testing, receive regulatory approval and supply commercial quantities of a product to the market will be important to our competitive position.
In addition to product candidates and marketed products generated from our internal R&D efforts, we acquire companies, acquire and license certain product and R&D technology rights and establish R&D arrangements with third parties to enhance our strategic position within our industry by strengthening and diversifying our R&D capabilities, product pipeline and marketed product base. In pursuing these R&D arrangements and licensing or acquisition activities, we face competition from other pharmaceutical and biotechnology companies that also seek to license or acquire technologies, product candidates or marketed products from those entities performing the R&D.
The following table is a selection of certain of our product candidates by phase of development in our therapeutic areas of focus as of February 13, 2017, unless otherwise indicated. Additional product candidate information can be found on our website at www.amgen.com. The website address is not intended to function as a hyperlink, and the information contained on our website is not intended to be a part of this filing. The information in this section does not include other, non-registrational clinical trials that we may conduct for purposes other than for submission to regulatory agencies for their approval of a new product indication. We may conduct non-registrational clinical trials for various reasons including to evaluate real-world outcomes or to collect additional safety information with the use of our products. In addition, the table does not include the biosimilar products we are developing, which are discussed later in this section.
14
|
Molecule
|
Disease/Condition
|
|
|
Phase 3 Programs
|
||
|
Aranesp
®
|
Myelodysplastic syndromes
|
|
|
BLINCYTO
®
|
ALL
|
|
|
ENBREL
|
Psoriatic arthritis;
Rheumatoid arthritis remission
|
|
|
Erenumab
|
Episodic migraine
|
|
|
EVENITY
™
|
Postmenopausal osteoporosis;
Male osteoporosis
|
|
|
IMLYGIC
®
|
Metastatic melanoma
|
|
|
KYPROLIS
®
|
Multiple myeloma
|
|
|
Omecamtiv mecarbil
|
Chronic heart failure
|
|
|
Prolia
®
|
Glucocorticoid-induced osteoporosis
|
|
|
Repatha
®
|
Hyperlipidemia
|
|
|
Vectibix
®
|
Metastatic colorectal cancer (mCRC)
|
|
|
XGEVA
®
|
Delay or prevention of bone metastases in breast cancer;
Cancer-related bone damage in patients with multiple myeloma
|
|
|
Phase 2 Programs
|
||
|
BLINCYTO
®
|
Diffuse Large B-Cell Lymphoma (DLBCL);
R/R Ph+ and minimal residual disease of ALL
|
|
|
Erenumab
|
Chronic migraine
|
|
|
AMG 157
|
Asthma;
Atopic dermatitis
|
|
|
AMG 520
|
Alzheimer’s disease
|
|
|
AMG 899
|
Dyslipidemia
|
|
|
Phase 1 Programs
|
||
|
IMLYGIC
®
|
Various cancer types
|
|
|
KYPROLIS
®
|
Small-cell lung cancer
|
|
|
Oprozomib
|
Multiple myeloma
|
|
|
AMG 176
|
Various cancer types
|
|
|
AMG 211
|
Various cancer types
|
|
|
AMG 224
|
Multiple myeloma
|
|
|
AMG 301
|
Migraine
|
|
|
AMG 330
|
Acute myeloid leukemia
|
|
|
AMG 420
|
Multiple myeloma
|
|
|
AMG 557
|
Systemic lupus erythematosus
|
|
|
AMG 570
|
Systemic lupus erythematosus
|
|
|
AMG 592
|
Inflammatory diseases
|
|
|
AMG 820
|
Various cancer types
|
|
|
AMG 986
|
Heart failure
|
|
|
Phase 3
|
clinical trials investigate the safety and efficacy of product candidates in a large number of patients who have the disease or condition under study; typically performed with registrational intent.
|
|
Phase 2
|
clinical trials investigate side effect profiles and efficacy of product candidates in a large number of patients who have the disease or condition under study.
|
|
Phase 1
|
clinical trials investigate safety and proper dose ranges of product candidates in a small number of human subjects.
|
15
Phase 3 Product Candidate Program Changes
As of February 15, 2016, we had 15 phase 3 programs. As of February 13, 2017, we also had 15 phase 3 programs, as omecamtiv mecarbil for the treatment of chronic heart failure advanced from phase 2 trials to phase 3 trials and Parsabiv
™
was approved by the EC and FDA for the treatment of sHPT in patients with CKD on hemodialysis.
Phase 3 Product Candidate Patent Information
The following table describes our outstanding composition of matter patents that have issued thus far for our product candidates in phase 3 development that have yet to be approved for any indication. Patents for products already approved for one or more indications but currently undergoing phase 3 clinical trials for additional indications are previously described. See Marketing, Distribution and Selected Marketed Products—Patents.
|
Molecule
|
Territory
|
General Subject Matter
|
Estimated Expiration*
|
|||
|
Erenumab
|
U.S.
|
Polypeptides
|
2031
|
|||
|
EVENITY
™
|
U.S.
|
Polypeptides
|
2026
|
|||
|
Europe
|
Polypeptides
|
2026
|
||||
|
Omecamtiv mecarbil
|
U.S.
|
Compound
|
2027
|
|||
* Patent expiration estimates are based on issued patents, which may be challenged, invalidated, or circumvented by competitors. The patent expiration estimates do not include any term adjustments, extensions or supplemental protection certificates that may be obtained in the future and extend these dates. Corresponding patent applications are pending in other jurisdictions. Additional patents may be filed or issued and may provide additional exclusivity for the product candidate or its use.
Phase 3 and 2 Program Descriptions
The following text provides additional information about selected product candidates that have advanced into human clinical trials.
Aranesp
®
Aranesp
®
is a recombinant human protein agonist of the erythropoietin receptor.
In February 2016, we announced that the randomized, double-bind, placebo controlled phase 3 ARCADE trial met its primary endpoint of reducing the incidence of red blood cell transfusions in anemic patients with low and intermediate-1 risk myelodysplastic syndromes.
BLINCYTO
®
BLINCYTO
®
is an anti-CD19 x anti-CD3 (BiTE
®
) bispecific antibody construct.
A phase 3 study in pediatric patients with high-risk first relapse B-precursor ALL is ongoing. Phase 2 studies in adult patients with R/R Ph+ and minimal residual disease of ALL are ongoing. A phase 2/3 study in patients with R/R DLBCL is ongoing.
In February 2017, we announced the submission of a sBLA to the FDA to include overall survival data from the Phase 3 TOWER study, supporting the conversion of BLINCYTO
®
’s accelerated approval to full approval. The sBLA also includes new data supporting the treatment of patients with Ph+ R/R B-cell precursor ALL.
Denosumab
Denosumab is a human monoclonal antibody that inhibits RANKL.
Prolia
®
In August 2016, we announced that the phase 3 randomized, double-blind, double-dummy, active controlled study evaluating the safety and efficacy of Prolia
®
compared with risedronate in patients receiving glucocorticoid treatment met all primary and secondary endpoints at 12 months.
XGEVA
®
In October 2016, we announced that a phase 3 study evaluating XGEVA
®
versus Zometa
®
in the prevention of SRE in patients with multiple myeloma met its primary endpoint of non-inferiority in delaying the time to first on-study SRE. The secondary endpoints of superiority in delaying time to first SRE and delaying time to first-and-subsequent SRE were not met.
16
A phase 3 study for the delay or prevention of bone metastases in patients with adjuvant breast cancer is ongoing.
ENBREL
ENBREL is a fusion protein that inhibits tumor necrosis factor.
A phase 3 study to evaluate ENBREL as a monotherapy for psoriatic arthritis treatment is ongoing. A phase 3 study to evaluate ENBREL as a monotherapy in maintaining remission in rheumatoid arthritis is ongoing.
Erenumab (formerly AMG 334)
Erenumab is a human monoclonal antibody that inhibits the receptor for calcitonin gene-related peptide. It is being evaluated for the prophylaxis of migraine. Erenumab is being developed jointly with Novartis.
In June 2016, we announced that the global phase 2 study evaluating the efficacy and safety of erenumab in chronic migraine prevention met its primary endpoint.
In September 2016, we announced that the phase 3 ARISE study evaluating the efficacy of erenumab in episodic migraine prevention, met its primary endpoint. Patients enrolled in ARISE study were randomized to receive either placebo, or erenumab 70 mg subcutaneously, once monthly for three months.
In November 2016, we announced that the global phase 3 STRIVE study evaluating the efficacy of erenumab in episodic migraine prevention, met its primary endpoint. Patients enrolled in STRIVE were randomized to receive either placebo, or one of two erenumab doses—70 mg or 140 mg—subcutaneously, once monthly for six months.
EVENITY
™
EVENITY
™
is a humanized monoclonal antibody that inhibits the action of sclerostin. It is being evaluated as a treatment for osteoporosis. EVENITY
™
is being developed in collaboration with UCB.
In February 2016, we and UCB announced that the phase 3 FRAME study met its co-primary endpoints.
In March 2016, we and UCB announced that the phase 3 BRIDGE study met its primary endpoint.
In September 2016, we and UCB announced that the FDA accepted for review the BLA for EVENITY
™
for the treatment of osteoporosis in postmenopausal women at increased risk for fracture. The FDA has set a PDUFA target action date of July 19, 2017. Phase 3 studies for the treatment of postmenopausal women with osteoporosis are ongoing.
IMLYGIC
®
IMLYGIC
®
is an oncolytic immunotherapy derived from HSV-1.
A phase 1b/3 study to evaluate IMLYGIC
®
in combination with Merck’s anti-PD-1 therapy, KEYTRUDA
®
(pembrolizumab), in patients with mid- to late-stage metastatic melanoma is ongoing.
KYPROLIS
®
KYPROLIS
®
is a proteasome inhibitor.
A phase 3 study, ARROW (RAndomized, Open-label, Phase 3 Study in Subjects with Relapsed and Refractory Multiple Myeloma Receiving Carfilzomib in Combination with Dexamethasone, Comparing Once-Weekly versus Twice-weekly Carfilzomib Dosing), with weekly dosing in relapsed and refractory multiple myeloma is ongoing.
Omecamtiv mecarbil
Omecamtiv mecarbil is a small molecule activator of cardiac myosin. It is being evaluated for the treatment of chronic heart failure. Omecamtiv mecarbil is being developed by Amgen in collaboration with Cytokinetics, Inc. and in an alliance with Servier for certain territories.
A phase 3 cardiovascular outcomes study for the treatment of chronic heart failure is ongoing.
Repatha
®
Repatha
®
is a human monoclonal antibody that inhibits PCSK9.
In September 2016, we announced that the phase 3 GLAGOV study evaluating the effect of Repatha
®
on coronary artery disease met its primary and secondary endpoints.
17
In February 2017, we announced that the phase 3 FOURIER study evaluating the effects of Repatha
®
on cardiovascular outcomes met its primary composite endpoint and key secondary composite endpoint. No new safety issues were observed.
In February 2017, we announced that the phase 3 EBBINGHAUS cognitive function study achieved its primary endpoint.
Additional phase 3 studies to evaluate Repatha
®
in diabetes, statin intolerant subjects, with coronary imaging, and to reduce the need for future apheresis are ongoing.
Vectibix
®
Vectibix
®
is a human monoclonal antibody antagonist of the EGFr.
In June 2015, we announced that results of a phase 3 study evaluating Vectibix
®
and best supportive care (BSC) met its primary endpoint, demonstrating a statistically significant improvement in overall survival in patients with chemorefractory wild-type KRAS (exon2) mCRC compared to those patients treated with BSC alone.
AMG 157
AMG 157 is a human monoclonal antibody that inhibits the action of TSLP. It is being evaluated as a treatment for asthma and atopic dermatitis, with phase 2 studies ongoing. AMG 157 is being jointly developed in collaboration with AstraZeneca plc (AstraZeneca).
AMG 520
AMG 520 is a small molecule inhibitor of BACE. It is being evaluated for the prevention of Alzheimer’s disease, with phase 2 studies ongoing. AMG 520 is being jointly developed in collaboration with Novartis.
AMG 899
AMG 899 is a small molecule CETP inhibitor. It is being evaluated for the treatment of dyslipidemia and has completed certain phase 2 studies. Development of AMG 899 is delayed pending competitor clinical trials in the class.
Amgen Development of Biosimilars
We continue to develop and commercialize biosimilar medicines. Our biosimilar product candidates are in varying stages of commercialization and clinical development as described in the following table:
|
Program
|
Reference product
|
Status
|
|
|
AMJEVITA
™
/ ABP 501
|
adalimumab (HUMIRA
®
)
|
Approved by FDA across all eligible indications of reference product and MAA submitted to EMA
|
|
|
ABP 215
*
|
bevacizumab (Avastin
®
)
|
BLA and MAA submitted to FDA and EMA, respectively
|
|
|
ABP 710
|
infliximab (REMICADE
®
)
|
Phase 3 rheumatoid arthritis study ongoing
|
|
|
ABP 798
*
|
rituximab (Rituxan
®
/ Mabthera
®
)
|
Phase 3 rheumatoid arthritis study ongoing
Phase 3 non-Hodgkin’s lymphoma study ongoing
|
|
|
ABP 959
|
eculizumab (Soliris
®
)
|
Phase 1 ongoing
|
|
|
ABP 980
*
|
trastuzumab (Herceptin
®
)
|
Phase 3 breast cancer study completed
|
|
* Developed in collaboration with Allergan
Business Relationships
From time to time, we enter into business relationships, including joint ventures and collaborative arrangements, for the R&D, manufacture and/or commercialization of products and/or product candidates. In addition, we also acquire product and R&D technology rights and establish R&D collaborations with third parties to enhance our strategic position within our industry by strengthening and diversifying our R&D capabilities, product pipeline and marketed product base. These arrangements generally provide for non-refundable, upfront license fees; development and commercial performance milestone payments; cost sharing; royalty payments and/or profit sharing. The activities under these collaboration agreements are performed with no guarantee of either technological or commercial success, and each is unique in nature.
18
Trade secret protection for our unpatented confidential and proprietary information is important to us. To protect our trade secrets, we generally require counterparties to execute confidentiality agreements upon the commencement of the business relationship with us. However, others could either develop independently the same or similar information or unlawfully obtain access to our information.
Kirin-Amgen, Inc.
Kirin-Amgen, Inc. (K-A) is a 50-50 joint venture with Kirin Holdings Company, Limited (Kirin). K-A develops and then out-licenses to third parties certain product rights which have been transferred to this joint venture from Amgen and Kirin.
K-A has given us exclusive licenses to manufacture and market: (i) G-CSF and pegfilgrastim in the United States, Europe, Canada, Australia, New Zealand, all Central American, South American, Middle Eastern and African countries and certain countries in Asia; (ii) darbepoetin alfa and romiplostim in the United States, Europe, Canada, Australia, New Zealand, Mexico, all Central and South American countries and certain countries in Central Asia, Africa and the Middle East; and (iii) recombinant human erythropoietin in the United States. We currently market pegfilgrastim, G-CSF, darbepoetin alfa, recombinant human erythropoietin and romiplostim under the brand names Neulasta
®
, NEUPOGEN
®
/GRANULOKINE
®
, Aranesp
®
, EPOGEN
®
and Nplate
®
, respectively. Under these agreements, we pay K-A royalties based on product sales. In addition, we also receive payments from K-A for milestones earned and for conducting certain R&D activities on its behalf. See Part IV—Note 8, Related party transactions, to the Consolidated Financial Statements.
K-A has also given Kirin exclusive licenses to manufacture and market: (i) G-CSF and pegfilgrastim in Japan, Taiwan and South Korea; (ii) darbepoetin alfa, romiplostim and brodalumab in Japan, China, Taiwan, South Korea and in certain other countries and/or regions in Asia; and (iii) recombinant human erythropoietin in Japan. K-A also gave Kirin and Amgen co-exclusive licenses to manufacture and market G-CSF, pegfilgrastim and recombinant human erythropoietin in China, which Amgen subsequently assigned to Kirin, and as a result, Kirin now exclusively manufactures and markets G-CSF and recombinant human erythropoietin in China. Kirin markets G-CSF, pegfilgrastim, darbepoetin alfa, romiplostim, recombinant human erythropoietin, and brodalumab under the brand names GRAN
®
/Grasin
®
, Peglasta
®
/Neulasta
®
/G-Lasta
®
, NESP
®
/Aranesp
®
, ROMIPLATE
®
, ESPO
®
, and LUMICEF
®
, respectively. Under these agreements, Kirin pays K-A royalties based on product sales. In addition, Kirin also receives payments from K-A for conducting certain R&D activities on its behalf.
K-A has also given J&J exclusive licenses to manufacture and market recombinant human erythropoietin for all geographic areas of the world outside the United States, China and Japan. Under this agreement, J&J pays royalties to K-A based on product sales.
Pfizer Inc.
The co-promotion term of our ENBREL collaboration agreement with Pfizer Inc. (Pfizer) in the United States and Canada expired on October 31, 2013. Under this agreement, we paid Pfizer a profit share until October 31, 2013, and residual royalties from November 1, 2013 to October 31, 2016, which were significantly less than the profit share payments. In 2016, the residual royalty payments were 10% of the annual net ENBREL sales in the United States and Canada. Effective November 1, 2016, there are no further royalty payments.
UCB
We are in a collaboration with UCB for the development and commercialization of EVENITY
™
. In 2016, we amended the commercialization rights and responsibilities of the parties. Under the amended agreement, we have the rights to commercialize EVENITY
™
for all indications in the United States and Japan. UCB has the rights for Europe, China, and Brazil. The rest of the countries have been allocated to Amgen. Generally, development costs and future worldwide commercialization profits and losses related to the collaboration after accounting for expenses are shared equally.
Bayer HealthCare Pharmaceuticals Inc.
We are in a collaboration with Bayer HealthCare Pharmaceuticals Inc. (Bayer) to jointly develop and commercialize Nexavar
®
(sorafenib). In 2015, we amended the terms of our collaboration agreement with Bayer, which terminated the co-promotion agreement in the United States, and transferred all U.S. operational responsibilities to Bayer, including commercial and medical affairs activities. Prior to the termination of the co-promotion agreement, we co-promoted Nexavar
®
with Bayer and shared equally in the profits in the United States. In lieu of this profit share, Bayer now pays us a royalty on U.S. sales of Nexavar
®
at a percentage rate in the high 30s. Outside of the United States, excluding Japan, Bayer manages all commercialization activities and incurs all of the sales and marketing expenditures and mutually agreed R&D expenses, and we reimburse Bayer for half of those expenditures. In all countries outside of the United States, except Japan, we receive 50% of net profits on sales of Nexavar
®
after deducting certain Bayer-related costs. The rights to develop and market Nexavar
®
in Japan are reserved to Bayer.
19
DaVita Inc.
In January 2017, we entered into a new six-year supply agreement with DaVita Inc. (DaVita), which supercedes the existing seven-year supply agreement that commenced in 2012. Pursuant to the new agreements, we will supply EPOGEN
®
and Aranesp
®
in amounts necessary to meet specified annual percentages of DaVita’s and its affiliates’ requirements for ESAs used in providing dialysis services in the United States and Puerto Rico. Such percentage varies during the term of the agreement, but each year is at least 90%. The new agreement expires in 2022. The agreement may be terminated by either party before expiration of its term in the event of certain breaches of the agreement by the other party.
Human Resources
As of
December 31, 2016
, Amgen had approximately 19,200 staff members. We consider our staff relations to be good.
Executive Officers of the Registrant
The executive officers of the Company as of February
7,
2017, are set forth below.
Mr. Robert A. Bradway, age 54, has served as a director of the Company since October 2011 and Chairman of the Board of Directors since January 1, 2013. Mr. Bradway has been the Company’s President since May 2010 and Chief Executive Officer since May 2012. From May 2010 to May 2012, Mr. Bradway served as the Company’s President and Chief Operating Officer. Mr. Bradway joined the Company in 2006 as Vice President, Operations Strategy and served as Executive Vice President and Chief Financial Officer from April 2007 to May 2010. Prior to joining the Company, he was a Managing Director at Morgan Stanley in London where, beginning in 2001, he had responsibility for the firm’s banking department and corporate finance activities in Europe.
Mr. Bradway has been a director of Norfolk Southern Corporation, a transportation company, since July 2011, and The Boeing Company, an aerospace company and manufacturer of commercial airplanes, defense, space and securities systems, since October 2016. He has served on the board of trustees of the University of Southern California since April 2014, and on the advisory board of the Leonard D. Schaeffer Center for Health Policy and Economics at that university since 2012.
Mr. Jonathan P. Graham, age 56, became Senior Vice President, General Counsel and Secretary in July 2015. From July 2006 to May 2015, Mr. Graham was Senior Vice President and General Counsel at Danaher Corporation. From October 2004 to June 2006, Mr. Graham was Vice President, Litigation and Legal Policy at General Electric Company (GE). Prior to GE, Mr. Graham was a partner at Williams & Connolly LLP.
Dr. Sean E. Harper, age 54, became Executive Vice President, Research and Development in February 2012. Dr. Harper joined the Company in 2002, and has held leadership roles in early development, medical sciences and global regulatory and safety. Dr. Harper served as Senior Vice President, Global Development and Corporate Chief Medical Officer from March 2007 to February 2012. Prior to joining the Company, Dr. Harper worked for five years at Merck Research Laboratories.
Mr. Anthony C. Hooper, age 62, became Executive Vice President, Global Commercial Operations in October 2011. From March 2010 to October 2011, Mr. Hooper was Senior Vice President, Commercial Operations and President, U.S., Japan and Intercontinental of BMS. From January 2009 to March 2010, Mr. Hooper was President, Americas of BMS. From January 2004 to January 2009, Mr. Hooper was President, U.S. Pharmaceuticals, Worldwide Pharmaceuticals Group, a division of BMS. Prior to this, Mr. Hooper held various senior leadership positions at BMS. Prior to joining BMS, Mr. Hooper was Assistant Vice President of Global Marketing for Wyeth Laboratories.
Ms. Lori A. Johnston, age 52, became Senior Vice President in December 2016. From October 2012 to December 2016, Ms. Johnston was Executive Vice President and Chief Administrative Officer of Celanese Corporation. From February 2006 to September 2012, Ms. Johnston served in a series of progressive leadership roles at Amgen, with her last position being Vice President, Human Resources. Prior to joining the Company, Ms. Johnston held human resources and other positions at Dell Inc.
Mr. Brian McNamee, age 60, became Executive Vice President, Full Potential Initiatives in October 2013. Mr. McNamee joined the Company in June 2001 as Senior Vice President, Human Resources. From November 1999 to June 2001, Mr. McNamee served as Vice President of Human Resources at Dell Computer Corp. From 1998 to 1999, Mr. McNamee served as Senior Vice President, Human Resources for the National Broadcasting Corporation, a division of the GE. From July 1988 to November 1999, Mr. McNamee held human resources positions at GE.
20
Mr. David W. Meline, age 59, became Executive Vice President and Chief Financial Officer in July 2014. From April 2011 to July 2014, Mr. Meline served as Senior Vice President and Chief Financial Officer at 3M Company (3M). From September 2008 to March 2011, Mr. Meline served as Vice President, Corporate Controller and Chief Accounting Officer of 3M. Prior to 2008, Mr. Meline served in a variety of senior leadership roles for General Motors Company for over 20 years, with his last position being Vice President and Chief Financial Officer, North America. Mr. Meline has been a director of ABB Ltd., a global industrial technology company based in Switzerland, since February 2016, serving as a member of the Finance, Audit and Compliance Committee. Mr. Meline was a director of TRW Automotive Holdings, Corp., a supplier of automotive systems, modules and components, from February 2014 until its acquisition by ZF Friedrichshafen AG in May 2015.
Ms. Cynthia M. Patton, age 55, became Senior Vice President and Chief Compliance Officer in October 2012. Ms. Patton joined the Company in 2005. From July 2005 to September 2010, Ms. Patton was Associate General Counsel. From September 2010 to October 2012, Ms. Patton was Vice President, Law. Previously, Ms. Patton served as Senior Vice President, General Counsel and Secretary of SCAN Health Plan from 1999 to 2005.
Mr. David A. Piacquad, age 60, became Senior Vice President, Business Development in March 2014. Mr. Piacquad joined the Company in June 2010 and, until January 2014, served as Vice President, Strategy and Corporate Development. From January 2014 to March 2014, Mr. Piacquad served as Vice President, Business Development. Prior to joining the Company, from December 2009 to June 2010, Mr. Piacquad was Principal of David A. Piacquad Consulting LLC. From March 2006 to December 2009, Mr. Piacquad served as Senior Vice President, Business Development and Licensing for Schering-Plough Corporation. Prior to Schering-Plough, Mr. Piacquad served in a series of leadership roles in finance and business development at J&J, with his last position being Vice President, Ventures and Business Development.
Mr. Esteban Santos, age 49, became Executive Vice President, Operations in July 2016. Mr. Santos joined the Company in 2007 as Executive Director, Manufacturing Technologies. From October 2008 to May 2013, Mr. Santos held a number of Vice President roles at the Company in engineering, manufacturing, site operations and drug product. From May 2013 to July 2016, Mr. Santos was Senior Vice President, Manufacturing. Prior to joining the Company, Mr. Santos served as Site General Manager for J&J’s Cordis operation in Puerto Rico. Prior to J&J, Mr. Santos held several management positions in GE’s industrial and transportation businesses.
Geographic Area Financial Information
For financial information concerning the geographic areas in which we operate, see Part IV—Note 19, Segment information—Geographic information, to the Consolidated Financial Statements.
Investor Information
Financial and other information about us is available on our website at www.amgen.com. We make available on our website, free of charge, copies of our Annual Report on Form 10-K, Quarterly Reports on Form 10-Q, current reports on Form 8-K and amendments to those reports filed or furnished pursuant to Section 13(a) or 15(d) of the Exchange Act as soon as reasonably practicable after we electronically file such material with, or furnish it to, the U.S. Securities and Exchange Commission (SEC). In addition, we have previously filed registration statements and other documents with the SEC. Any document we file may be inspected, without charge, at the SEC’s public reference room at 100 F Street NE, Washington, DC 20549, or at the SEC’s website at www.sec.gov. These website addresses are not intended to function as hyperlinks, and the information contained in our website and in the SEC’s website is not intended to be a part of this filing. Information related to the operation of the SEC’s public reference room may be obtained by calling the SEC at 800-SEC-0330.
|
Item 1A.
|
RISK FACTORS
|
This report and other documents we file with the SEC contain forward-looking statements that are based on current expectations, estimates, forecasts and projections about us, our future performance, our business, our beliefs and our management’s assumptions. The statements are not guarantees of future performance and involve certain risks, uncertainties and assumptions that are difficult to predict. You should carefully consider the risks and uncertainties our business faces. The risks described below are not the only ones we face. Our business is also subject to the risks that affect many other companies, such as employment relations, general economic conditions, geopolitical events and international operations. Further, additional risks not currently known to us or that we currently believe are immaterial may in the future materially and adversely affect our business, operations, liquidity and stock price.
21
Our sales depend on coverage and reimbursement from third-party payers, and pricing and reimbursement pressures may affect our profitability.
Sales of our products depend on the availability and extent of coverage and reimbursement from third-party payers, including government healthcare programs and private insurance plans. Governments and private payers continue to pursue aggressive initiatives to contain costs and manage drug utilization and are increasingly focused on the effectiveness, benefits and costs of similar treatments, which could result in lower reimbursement rates for our products or narrower populations for whom our products will be reimbursed by payers. Public scrutiny of the price of drugs and other healthcare costs is increasing and greater focus on pricing and price increases may limit our ability to set or increase the price of our products based on their value, which could have a material adverse effect on our product sales, business and results of operations.
A substantial portion of our U.S. business relies on reimbursement from U.S. federal government healthcare programs and private insurance plans regulated by the U.S. federal government. See Item 1. Business—Reimbursement. Changes to U.S. federal reimbursement policy may come through legislative actions. U.S. President Donald Trump and other U.S. lawmakers have made statements about potentially repealing and/or replacing the ACA, although specific legislation for such a repeal or replacement has not yet been introduced. While we are unable to predict what changes may ultimately be enacted, to the extent that future changes affect how our products are paid for and reimbursed by government and private payers our business could be adversely impacted. For example, discussions continue about proposals that would allow the U.S. federal government to directly negotiate drug prices with pharmaceutical manufacturers or require manufacturers to pay higher rebates in the Medicare Part D setting. Changes in U.S. federal reimbursement policy may also arise as a result of regulations or demonstration projects implemented by the Centers for Medicare & Medicaid Services (CMS), the federal agency responsible for administering Medicare, Medicaid and the Health Insurance Marketplaces. CMS has substantial power to quickly implement policy changes that can significantly affect how our products are covered and reimbursed.
State government actions or ballot initiatives can also affect how our products are covered and reimbursed or create additional pressure on how our products are priced. Many states have discussed and debated and are considering new pricing legislation, including state proposals designed to require biopharmaceutical manufacturers to publicly report proprietary pricing information or to place a maximum price ceiling, or cap, on pharmaceutical products purchased by state agencies. For example, Ohio voters are expected to consider in their November 2017 election a ballot proposition that would prohibit the state from paying a greater price for drugs than the lowest price paid by the U.S. Department of Veterans Affairs. Passage of this proposition could lead to the introduction of additional ballot initiatives in other states. Legislative or regulatory changes or other government initiatives that decrease the coverage or reimbursement available for our products, require that we pay increased rebates, limit our ability to offer co-pay payment assistance to commercial patients or limit the pricing of pharmaceutical products could have a material adverse effect on our business and results of operations.
Payers, including healthcare insurers, PBMs and group purchasing organizations, increasingly seek price discounts or rebates in connection with the placement of our products on their formularies or those they manage. Consolidation in the health insurance industry has resulted in a few large insurers and PBMs exerting greater pressure in pricing and usage negotiations with drug manufacturers, significantly increasing such discounts and rebates and limiting patient access and usage. Three PBMs currently oversee approximately 75% of total covered lives in the United States. Payers continue to adopt benefit plan changes that shift a greater portion of prescription costs to patients, and some payers may attempt to limit the use of programs assisting commercial patients with their co-payments. Payers also control costs by imposing restrictions on access to our products, such as by requiring prior authorizations or step therapy, and may choose to exclude certain indications for which our products are approved or even choose to exclude coverage entirely. For example, since the launch of Repatha
®
in August 2015, the application of utilization management criteria by some payers, including PBMs, has resulted in denials of coverage for a significant number of patients for whom Repatha
®
has been prescribed, slowing Repatha
®
sales. In early February 2017, we announced that our phase 3 outcomes study evaluating the ability of Repatha
®
to prevent cardiovascular events met its primary composite endpoint and key secondary composite endpoint. See Item 1. Business—Significant Developments. However, in the current competitive environment, the application of restrictive utilization management criteria by some payers may continue until the clinical data is reflected in approved product labeling, or even thereafter. Ultimately, further discounts, rebates, coverage or plan changes, restrictions or exclusions as described above could have a material adverse effect on sales of our affected products.
We also face risks relating to the reporting of pricing data that affects the reimbursement of and discounts provided for our products to U.S. government healthcare programs. Pricing data that we submit impacts the payment rates for providers, rebates we pay, and discounts we are required to provide under Medicare, Medicaid and other government drug programs. Government price reporting regulations are complex and may require a manufacturer to update certain previously submitted data. Our price reporting data calculations are reviewed monthly and quarterly, and based on such reviews we have on occasion restated previously reported pricing data to reflect changes in calculation methodology, reasonable assumptions and/or underlying data. If our submitted pricing data are incorrect, we may become subject to substantial fines and penalties or other government enforcement actions, which could have a material adverse effect on our business and results of operations. In addition, as a result of restating previously reported price data, we also may be required to pay additional rebates and provide additional discounts.
22
Outside the United States, we expect countries will continue to take aggressive actions to reduce their healthcare expenditures. See Item 1. Business—Reimbursement. For example, international reference pricing (IRP) is widely used by a large number of countries to control costs based on an external benchmark of a product’s price in other countries. IRP policies can quickly and frequently change and may not reflect differences in the burden of disease, indications, market structures, or affordability differences across countries or regions. Any deterioration in the coverage and reimbursement available for our products or in the timeliness or certainty of payment by payers to physicians and other providers could negatively impact the ability or willingness of healthcare providers to prescribe our products for their patients or could otherwise negatively affect the use of our products or the prices we receive for them. Such changes could have a material adverse effect on our product sales, business and results of operations.
Our products face substantial competition.
We operate in a highly competitive environment. See Item 1. Business—Marketing, Distribution and Selected Marketed Products—Competition. We expect that our products will compete with new drugs currently in development, drugs currently approved for other indications that may later be approved for the same indications as those of our products and drugs approved for other indications that are used off-label. Large pharmaceutical companies and generics manufacturers of pharmaceutical products are expanding into the biotechnology field, and some pharmaceutical companies and generics manufacturers have formed partnerships to pursue biosimilars. In addition, some of our competitors may have technical, competitive or other advantages over us for the development of technologies and processes or greater experience in particular therapeutic areas, and consolidation among pharmaceutical and biotechnology companies can enhance such advantages. These advantages may make it difficult for us to compete with them to successfully discover, develop and market new products and for our current products to compete with new products or new product indications they may bring to market. As a result, our products may compete against products that have lower prices, equivalent or superior performance, better safety profiles, easier administration, earlier market availability or other competitive features. If we are unable to compete effectively, this could reduce sales, which could have a material adverse effect on our business and results of operations.
We currently face competition from biosimilars and expect to face increasing competition in the future.
We currently face competition from biosimilars in both Europe and the United States, and we expect to face increasing biosimilar competition in the next year and beyond. Expiration or successful challenge of applicable patent rights could accelerate such competition, and we could face more litigation regarding the validity and/or scope of our patents. Our products may also experience greater competition from lower-cost biosimilars or generics that come to market when branded products that compete with our products lose their own patent protection. To the extent that governments adopt more permissive approval frameworks and competitors are able to obtain broader or expedited marketing approval for biosimilars, the rate of increased competition for our products could accelerate.
In the EU, biosimilars are evaluated and authorized pursuant to a set of general and product class-specific guidelines. In addition, in an effort to spur biosimilar utilization and/or increase potential healthcare savings, some EU countries have adopted or are attempting to adopt biosimilar uptake measures such as requiring physician prescribing quotas or promoting switching or pharmacy substitution of biosimilars for the corresponding reference products, and other countries may adopt similar measures. Some EU countries may impose automatic price reductions upon market entry of the second or third biosimilar competitor.
In the United States, the ACA authorized the FDA to approve biosimilars via a separate, abbreviated pathway. See Item 1. Business—Government Regulation—Regulation in the United States—Approval of Biosimilars. The first biosimilar entrant into the U.S. market, Sandoz’s Zarxio
®
, is a biosimilar version of NEUPOGEN
®
, and was launched in the United States in 2015. Since then, the FDA has approved additional biosimilars, including a biosimilar version of ENBREL. In addition, a growing number of companies have announced that they are in varying stages of development of biosimilar versions of existing biotechnology products, including biosimilars that would compete with our products. Companies pursuing development of biosimilar versions of our products have challenged and may continue to, challenge our patents well in advance of the expiration of our material patents. For information related to our biosimilars patent litigation, including our litigation regarding ENBREL, see Part IV—Note 18, Contingencies and commitments, to the Consolidated Financial Statements. See also Our intellectual property positions may be challenged, invalidated or circumvented, or we may fail to prevail in present and future intellectual property litigation. The U.S. pathway includes the option for biosimilar products that meet certain criteria to be approved as interchangeable with their reference products. Some companies currently developing biosimilars may seek to register their products as interchangeable biologics, which could make it easier for pharmacists to substitute those biosimilars for our products or could encourage prescribers who are inclined to select the interchangeable biosimilar over our innovative products. In addition, critics of the 12-year exclusivity period in the biosimilar pathway law will likely continue to seek to shorten the data exclusivity period and/or to encourage the FDA to interpret narrowly the law’s provisions regarding which new products receive data exclusivity, which could expose us to biosimilar competition at an earlier time. While we are unable to predict the precise impact of biosimilars on our products, we are currently facing and expect to face greater competition in the United States and Europe in the next year and beyond as a result of biosimilars and downward pressure on our product prices and sales. This biosimilar competition has had and could increasingly have a material adverse effect on our business and results of operations.
23
Our current products and products in development cannot be sold without regulatory approval.
Our business is subject to extensive regulation by numerous state and federal government authorities in the United States, including the FDA, and by foreign regulatory authorities, including the EMA. We are required in the United States and in foreign countries to obtain approval from regulatory authorities before we manufacture, market and sell our products. Once our products are approved, the FDA and other U.S. and foreign regulatory agencies have substantial authority to require additional testing and reporting, perform inspections, change product labeling or mandate withdrawals of our products. Failure to comply with applicable regulatory requirements may subject us to administrative and/or judicially imposed sanctions or monetary penalties as well as reputational and other harms. The sanctions could include the FDA’s or foreign regulatory authorities’ refusals to approve pending applications, delays in obtaining or withdrawals of approvals, delays or suspensions of clinical trials, warning letters, product recalls or seizures, total or partial suspensions of our operations, injunctions, fines, civil penalties and/or criminal prosecutions.
Obtaining and maintaining regulatory approval have been, and will continue to be, increasingly difficult, time-consuming and costly. Legislative bodies or regulatory agencies could enact new laws or regulations, change existing laws or regulations, or change their interpretations of laws or regulations at any time, which could affect our ability to obtain or maintain approval of our products or product candidates. The rate and degree of change in existing laws and regulations and regulatory expectations have accelerated in established markets, and regulatory expectations continue to evolve in emerging markets.
We are unable to predict whether and when any further changes to laws or regulatory policies affecting our business could occur, such as changes to regulations governing manufacturer communications concerning drug products and drug product candidates, and whether such changes could have a material adverse effect on our business and results of operations.
Regulatory authorities may also question the sufficiency for approval of the endpoints we select for our clinical trials. A number of our products and product candidates have been evaluated in clinical trials using surrogate endpoints that measure an effect that is known to correlate with an ultimate clinical endpoint. For example, a therapeutic oncology product candidate may be evaluated for its ability to extend the length of time during and after the treatment that a patient lives without the disease worsening PFS. Demonstrating that the product candidate produces a statistically significant improvement in PFS does not necessarily mean that the product candidate will show a statistically significant improvement in overall survival or the time that the patients remain alive. In the cardiovascular setting, a heart disease therapeutic candidate may be evaluated for its ability to reduce LDL-C levels, as elevated LDL-C level has been a surrogate endpoint for cardiovascular events such as death, heart attack and stroke. The use of surrogate endpoints such as PFS and LDL-C reduction, in the absence of other measures of clinical benefit, may not be sufficient for broad usage or approval even when such results are statistically significant. Regulatory authorities could also add new requirements, such as the completion of enrollment in a confirmatory study or the completion of an outcomes study or a meaningful portion of an outcomes study, as conditions for obtaining approval or obtaining an indication. For example, our initial FDA application for Repatha
®
sought approval for a broader patient population based on data demonstrating that Repatha
®
reduced LDL-C levels. However, the FDA ultimately approved Repatha
®
only for a subset of those patients, citing among other things the absence of positive outcomes data showing that Repatha
®
prevents cardiovascular events. We subsequently announced that our phase 3 outcomes study evaluating the ability of Repatha
®
to prevent cardiovascular events met its primary composite endpoint and key secondary composite endpoint. See Item 1. Business—Significant Developments. However, we cannot predict the degree to which the results of this study will be incorporated into the Repatha
®
label by regulators. There may also be situations in which demonstrating the efficacy and safety of a product candidate may not be sufficient to gain regulatory approval unless superiority to comparative products can be shown. The imposition of additional requirements or our inability to meet them in a timely fashion or at all may delay our clinical development and regulatory filing efforts, delay or prevent us from obtaining regulatory approval for new product candidates or new indications for existing products, or prevent us from maintaining our current labels.
Some of our products have been approved by U.S. and foreign regulatory authorities on a conditional basis with full approval conditioned upon fulfilling the requirements of regulators. For example, in December 2014, we received accelerated approval for BLINCYTO
®
for the treatment of patients with Ph- relapsed or refractory B-cell precursor ALL in the United States, with continued approval contingent upon clinical benefit in subsequent trials. BLINCYTO
®
also received conditional marketing authorization for the treatment of patients with Ph- relapsed or refractory B-cell precursor ALL from the EC in November 2015. Regulatory authorities are placing greater focus on monitoring products originally approved on an accelerated or conditional basis and on whether the sponsors of such products have met the conditions of the accelerated or conditional approvals. If we are unable to fulfill the regulators’ requirements that were conditions of a product’s accelerated or conditional approval and/or if regulators re-evaluate the data or risk-benefit profile of our product, the conditional approval may not result in full approval or may be revoked or not renewed. Alternatively, we may be required to change the product’s labeled indications or even withdraw the product from the market.
Safety problems or signals can arise as our products and product candidates are evaluated in clinical trials, including investigator sponsored studies, or as our marketed products are used in clinical practice. We are required to continuously collect and assess adverse events reported to us and to communicate to regulatory agencies these adverse events and safety signals regarding
24
our products. Regulatory agencies periodically perform inspections of our pharmacovigilance processes, including our adverse event reporting. In 2012, pharmacovigilance legislation became effective in the EU that enhanced the authority of European regulators to require companies to conduct additional post-approval clinical efficacy and safety studies and increased the requirements on sponsor companies to analyze and evaluate the risk-benefit profiles of their products.
Similarly, for our products with approved REMS (see Item 1. Business—Government Regulation—Post-Approval Phase) we are required to submit periodic assessment reports to the FDA to demonstrate that the goals of the REMS are being met. REMS and other risk management programs are designed to ensure that a drug’s benefits outweigh the risks, and vary in the elements they contain. For example, our ESA REMS requires applicable healthcare providers and institutions to enroll in the program, receive education about the product and the REMS and document and report certain information to us over time. We are responsible for tracking and documenting certain elements of healthcare provider and institution compliance with the ESA REMS, and we use third-party service providers to assist in the administration of certain portions of our REMS. If the FDA is not satisfied with the results of the periodic assessment reports we submit for any of our REMS, the FDA may also modify our REMS or take other regulatory actions, such as implementing revised or restrictive labeling. If regulatory agencies determine that we or other parties (including our clinical trial investigators, those operating our patient support programs or licensees of our products) have not complied with the applicable reporting or other pharmacovigilance requirements, we may become subject to additional inspections, warning letters or other enforcement actions, including fines, marketing authorization withdrawal and other penalties. Our product candidates and marketed products can also be affected by safety problems or signals occurring with respect to products that are similar to ours and that implicate an entire class of products. Further, as a result of clinical trials, including sub-analyses or meta-analyses of earlier clinical trials (a meta-analysis involves the use of various statistical methods to combine results from previous separate but related studies) performed by us or others, concerns may arise about the sufficiency of the data or studies underlying a product’s approved label. Such actual or perceived safety problems or concerns can lead to:
|
•
|
revised or restrictive labeling for our products, or the potential for restrictive labeling that may result in our decision not to commercialize a product candidate;
|
|
•
|
requirement of risk management activities or other regulatory agency compliance actions related to the promotion and sale of our products;
|
•
mandated post-marketing commitments or pharmacovigilance programs for our approved products;
•
product recalls of our approved products;
|
•
|
revocation of approval for our products from the market completely, or within particular therapeutic areas or patient types;
|
•
increased timelines or delays in being approved by the FDA or other regulatory bodies; and/or
•
fewer treatments or product candidates being approved by regulatory bodies.
For example, since 2006, when adverse safety results involving ESAs were observed, ESAs continue to be the subject of ongoing review and scrutiny. Reviews by regulatory authorities of the risk-benefit profile of ESAs have resulted in, and may continue to result in, changes to ESA labeling, our ESA REMS and usage in both the oncology and nephrology clinical settings.
In addition to our innovative products, we are working to develop and commercialize biosimilar versions of a number of products currently manufactured, marketed and sold by other pharmaceutical companies. In some markets, there is not yet a legislative or regulatory pathway for the approval of biosimilars. In the United States, the ACA provided for such a pathway; while the FDA continues to implement it, questions remain as to the evidence needed to demonstrate biosimilarity or interchangeability for specific products and what information can be included in biosimilar labeling. See We currently face competition from biosimilars and expect to face increasing competition in the future. Delays or uncertainties in the development of such pathways could result in delays or difficulties in getting our biosimilar products approved by regulatory authorities, subject us to unanticipated development costs or otherwise reduce the value of the investments we have made in the biosimilars area. Further, we cannot predict whether any repeal or reform of the ACA would affect the biosimilar pathway or have a material adverse effect on our development of biosimilars. In addition, if we are unable to bring our biosimilar products to market on a timely basis, and secure “first-to-market” positions, our future biosimilar sales and results of operations could be materially and adversely affected.
We may not be able to develop commercial products despite significant investments in R&D.
Amgen invests heavily in R&D. Successful product development in the biotechnology industry is highly uncertain, and very few R&D projects produce commercial products. Product candidates, including biosimilar product candidates, or new indications
25
for existing products (collectively, product candidates) that appear promising in the early phases of development may fail to reach the market for a number of reasons, such as:
|
•
|
the product candidate did not demonstrate acceptable clinical trial results even though it demonstrated positive preclinical trial results, for reasons that could include changes in the standard of care of medicine;
|
|
•
|
the product candidate was not effective or not more effective than currently available therapies in treating a specified condition or illness;
|
•
the product candidate was not cost effective in light of existing therapeutics;
•
the product candidate had harmful side effects in humans or animals;
•
the necessary regulatory bodies, such as the FDA or EMA, did not approve the product candidate for an intended use;
•
the product candidate was not economical for us to manufacture and commercialize;
|
•
|
the biosimilar product candidate failed to demonstrate the requisite biosimilarity to the applicable reference product, or was otherwise determined by a regulatory authority to not meet applicable standards for approval;
|
|
•
|
other parties had or may have had proprietary rights relating to our product candidate, such as patent rights, and did not let us sell it on reasonable terms, or at all;
|
|
•
|
we and certain of our licensees, partners or independent investigators may have failed to effectively conduct clinical development or clinical manufacturing activities; and
|
•
the pathway to regulatory approval or reimbursement for product candidates was uncertain or not well-defined.
A number of our product candidates have failed or been discontinued at various stages in the product development process. For example, in May 2015, we terminated our participation in the co-development and commercialization of brodalumab with AstraZeneca. The decision was based on events of suicidal ideation and behavior in the brodalumab program, which we believed likely would necessitate restrictive labeling that would limit the appropriate patient population. Inability to bring a product to market or a significant delay in the expected approval and related launch date of a new product for any of the reasons discussed could potentially have a negative impact on our product sales and earnings and could result in a significant impairment of in-process research and development (IPR&D) or other intangible assets.
We must conduct clinical trials in humans before we commercialize and sell any of our product candidates or existing products for new indications.
Before we sell any products, we must conduct clinical trials to demonstrate that our product candidates are safe and effective for use in humans. The results of those clinical trials are used as the basis to obtain approval from regulatory authorities such as the FDA and EMA. See Our current products and products in development cannot be sold without regulatory approval. We are required to conduct clinical trials using an appropriate number of trial sites and patients to support the product label claims. The length of time, number of trial sites and number of patients required for clinical trials vary substantially and therefore, we may spend several years and incur substantial expense in completing certain clinical trials. In addition, we may have difficulty finding a sufficient number of clinical trial sites and patients to participate in our clinical trials, particularly if competitors are conducting clinical trials in similar patient populations. Patients may withdraw from clinical trials at any time, and privacy laws and/or other restrictions in certain countries may restrict the ability of clinical trial investigators to conduct further follow-up on such patients, which may adversely affect the interpretation of study results. Delays and complications in planned clinical trials can result in increased development costs, associated delays in regulatory approvals and in product candidates reaching the market and revisions to existing product labels.
Further, to increase the number of patients available for enrollment in our clinical trials, we have and will continue to open clinical sites and enroll patients in a number of locations where our experience conducting clinical trials is limited, including Russia, India, China, South Korea, the Philippines, Singapore and some Central and South American countries, either through utilization of third-party contract clinical trial providers entirely or in combination with local staff. Conducting clinical trials in locations where we have limited experience requires substantial time and resources to understand the unique regulatory environments of individual countries. Further, we must ensure the timely production, distribution and delivery of the clinical supply of our product candidates to numerous and varied clinical trial sites. If we fail to adequately manage the design, execution and diverse regulatory aspects of our large and complex clinical trials or to manage the production or distribution of our clinical supply, corresponding regulatory approvals may be delayed or we may fail to gain approval for our product candidates or could lose our ability to market existing products in certain therapeutic areas or altogether. If we are unable to market and sell our products or product candidates or to obtain approvals in the timeframe needed to execute our product strategies, our business and results of operations could be materially and adversely affected.
26
We rely on independent third-party clinical investigators to recruit patients and conduct clinical trials on our behalf in accordance with applicable study protocols, laws and regulations. Further, we rely on unaffiliated third-party vendors to perform certain aspects of our clinical trial operations. We also may acquire companies that have ongoing clinical trials. These trials may not have been conducted to the same standards as ours; however, once an acquisition has been completed we assume responsibility for the conduct of these trials, including any potential risks and liabilities associated with the past and prospective conduct of those trials. If regulatory authorities determine that we or others, including our licensees or the independent investigators selected by us or by a company we have acquired, have not complied with regulations applicable to the clinical trials, those authorities may refuse or reject some or all of the clinical trial data or take other actions that could negatively impact our ability to obtain or maintain marketing approval of the product or indication. If we were unable to market and sell our products or product candidates, our business and results of operations could be materially and adversely affected.
In addition, some of our clinical trials involve drugs manufactured and marketed by other pharmaceutical companies. These drugs may be administered in clinical trials in combination with one of our products or product candidates or in a head-to-head study comparing the products’ or product candidates’ relative efficacy and safety. In the event that any of these vendors or pharmaceutical companies have unforeseen issues that negatively impact the quality of their work or create a shortage of supply or if we are otherwise unable to obtain an adequate supply of these other drugs, our ability to complete our applicable clinical trials and/or evaluate clinical results may also be negatively impacted. As a result, this could adversely affect our ability to timely file for, gain or maintain regulatory approvals worldwide.
Clinical trials must be designed based on the current standard of medical care. However, in certain diseases, such as cancer, the standard of care is evolving rapidly. In such diseases, the duration of time needed to complete certain clinical trials may result in the design of such clinical trials being based on standards of medical care that are no longer the current standards by the time such trials are completed, limiting the utility and application of such trials. We may not obtain favorable clinical trial results and therefore may not be able to obtain regulatory approval for new product candidates or new indications for existing products and/or maintain our current product labels. Participants in clinical trials of our products and product candidates may also suffer adverse medical events or side effects that could, among other factors, delay or terminate clinical trial programs and/or require additional or longer trials to gain approval.
Even after a product is on the market, safety concerns may require additional or more extensive clinical trials as part of a risk management plan for our product or for approval of a new indication. For example, in connection with the June 2011 ESA label changes, we agreed to conduct additional clinical trials examining the use of ESAs in CKD. Additional clinical trials we initiate, including those required by the FDA, could result in substantial additional expense and the outcomes could result in further label restrictions or the loss of regulatory approval for an approved indication, each of which could have a material adverse effect on our business and results of operations. Additionally, any negative results from such trials could materially affect the extent of approvals, the use, reimbursement and sales of our products, our business and results of operations.
Some of our products are used with drug delivery or companion diagnostic devices that have their own regulatory, manufacturing and other risks.
Many of our products and product candidates may be used in combination with a drug delivery device, such as an injector or other delivery system. In addition, Vectibix
®
is used in combination with a test kit (which is a companion diagnostic device), and some of our product candidates may also be used in combination with a companion diagnostic device. Our product candidates or expanded indications of our products used with such devices may not be approved or may be substantially delayed in receiving regulatory approval if such devices do not also gain or maintain regulatory approval or clearance. When approval of the product and device is sought under a single marketing drug application, the increased complexity of the review process may delay receipt of regulatory approval. In addition, some of these devices may be provided by single-source unaffiliated third-party companies. We are dependent on the sustained cooperation and effort of those third-party companies both to supply the devices and, in some cases, to conduct the studies required for approval or clearance by the applicable regulatory agencies. We are also dependent on those third-party companies continuing to meet applicable regulatory or other requirements. Failure to successfully develop or supply the devices, delays in or failures of the Amgen or third-party studies, or failure of us or the third-party companies to obtain or maintain regulatory approval or clearance of the devices could result in increased development costs; delays in, or failure to obtain, regulatory approval; and/or associated delays in a product candidate reaching the market or in the addition of new indications for existing products. Actual or perceived safety problems or concerns with a device used with our product can lead to regulatory actions and impacts to our products. See
Our current products and products in development cannot be sold without regulatory approval
.
Loss of regulatory approval or clearance of a device that is used with our product may also result in the removal of our product from the market. Further, failure to successfully develop, supply, or gain or maintain approval for these devices could adversely affect sales of the related, approved products.
27
Our intellectual property positions may be challenged, invalidated or circumvented, or we may fail to prevail in present and future intellectual property litigation.
Our success depends in part on our ability to obtain and defend patent rights and other intellectual property rights that are important to the commercialization of our products and product candidates. The patent positions of pharmaceutical and biotechnology companies can be highly uncertain and often involve complex legal, scientific and factual questions. Third parties may challenge, invalidate or circumvent our patents and patent applications relating to our products, product candidates and technologies. Challenges to patents may come from potential competitors or from parties other than those who seek to market a potentially-infringing product. In addition, our patent positions might not protect us against competitors with similar products or technologies because competing products or technologies may not infringe our patents. For certain of our product candidates, there are third parties who have patents or pending patent applications that they may claim necessitate payment of a royalty or prevent us from commercializing these product candidates in certain territories. Patent disputes are frequent, costly and can preclude, delay or increase the cost of commercialization of products. We have been in the past, and are currently and may be in the future, involved in patent litigation. These matters have included and may in the future include litigation with manufacturers of products that purport to be biosimilars of certain of our products for patent infringement and for failure to comply with certain provisions of the Biologics Price Competition and Innovation Act, including the requirement to provide 180 days’ notice in advance of commercial marketing. A determination made by a court, agency or tribunal concerning infringement, validity, enforceability, injunctive or economic remedy, or the right to patent protection, for example, are typically subject to appellate or administrative review. Upon review, such initial determinations may be afforded little or no deference by the reviewing tribunal and may be affirmed, reversed, or made the subject of reconsideration through further proceedings. A patent dispute or litigation may not discourage a potential violator from bringing the allegedly-infringing product to market prior to a final resolution of the dispute or litigation. The period from inception until resolution of a patent dispute or litigation is subject to the availability and schedule of the court, agency or tribunal before which the dispute or litigation is pending. We may be subject to competition during this period and may not be able to fully recover from the losses, damages, and harms we incur from infringement by the competitor product even if we prevail. Moreover, if we lose or settle current or future litigations at certain stages or entirely, we could be subject to competition and/or significant liabilities, be required to enter into third-party licenses for the infringed product or technology or be required to cease using the technology or product in dispute. In addition, we cannot guarantee that such licenses will be available on terms acceptable to us, or at all.
Further, under the Hatch-Waxman Act, our products approved by the FDA under the FDCA may be the subject of patent litigation with generics competitors before expiry of the five-year period of data exclusivity provided for under the Hatch-Waxman Act and prior to the expiration of the patents listed for the product. Likewise, our innovative biologic products may be the subject of patent litigation prior to the expiration of our patents and, with respect to competitors seeking approval as a biosimilar or interchangeable version of our products, prior to the 12-year exclusivity period provided under the ACA. In addition, we may face additional patent litigation involving claims that the biosimilar product candidates we are working to develop infringe the patents of other companies that manufacture, market or sell the applicable reference products. While we may attempt to challenge such patents, our efforts may be unsuccessful. For information related to our biosimilars patent litigation, see Part IV—Note 18, Contingencies and commitments, to the Consolidated Financial Statements.
Certain of the existing patents on our products have recently expired. See Item 1. Business—Marketing, Distribution and Selected Marketed Products—Patents. As our patents expire, competitors are able to legally produce and market similar products or technologies, including biosimilars, which may have a material adverse effect on our product sales, business and results of operations. In addition, competitors may be able to invalidate, design around or otherwise circumvent our patents and sell competing products.
Guidelines and recommendations published by various organizations can reduce the use of our products.
Government agencies promulgate regulations and guidelines directly applicable to us and to our products. However, professional societies, practice management groups, insurance carriers, physicians groups, private health and science foundations and organizations involved in various diseases also publish guidelines and recommendations to healthcare providers, administrators and payers, as well as patient communities. Recommendations by government agencies or other groups and organizations may relate to such matters as usage, dosage, route of administration and use of related therapies, and a growing number of organizations are providing assessments of the value and pricing of pharmaceutical products. These assessments may come from private organizations, such as the Institute for Clinical and Economic Review, which publish their findings and offer recommendations relating to the products’ reimbursement by government and private payers. In addition, government HTA organizations, such as the National Institute for Health and Clinical Excellence in the United Kingdom and the Canadian Agency for Drugs and Technologies in Health, make reimbursement recommendations to payers in their jurisdictions based on the clinical effectiveness, cost-effectiveness and service impact of new, emerging and existing medicines and treatments. Such HTA organizations may recommend reimbursement for our product for a narrower indication than was approved by applicable regulatory agencies, or may recommend against reimbursement entirely. Such recommendations or guidelines may affect our reputation, and any
28
recommendations or guidelines that result in decreased use, dosage or reimbursement of our products could have a material adverse effect on our product sales, business and results of operations. In addition, the perception by the investment community or stockholders that such recommendations or guidelines will result in decreased use and dosage of our products could adversely affect the market price of our common stock.
The adoption of new tax legislation or exposure to additional tax liabilities could affect our profitability.
We are subject to income and other taxes in the United States and other jurisdictions in which we do business. As a result, our provision for income taxes is derived from a combination of applicable tax rates in the various places we operate. Significant judgment is required for determining our provision for income tax. Our tax returns are routinely examined by tax authorities in the United States and other jurisdictions in which we do business, and a number of audits are currently underway. Tax authorities are becoming more aggressive in their audits and are particularly focused on the allocations of income and expense among tax jurisdictions. We believe our accrual for income tax liabilities is appropriate based on past experience, interpretations of tax law, and judgments about potential actions by tax authorities; however, due to the complexity of the provision for income taxes, the ultimate resolution of any tax matters may result in payments greater or less than amounts accrued. See Part IV—Note 5, Income Taxes, to the Consolidated Financial Statements. Our provision for income taxes and results of operations in the future could be adversely affected by changes to our operating structure, changes in the mix of income and expenses in countries with differing tax rates, changes in the valuation of deferred tax assets and liabilities, and changes in applicable tax laws, regulations or administrative interpretations thereof. President Trump has indicated that U.S. corporate tax reform is a high priority for his Administration, and the U.S. Congress is expected to propose sweeping changes to the U.S. tax system including changes to corporate tax rates, the taxation of income earned outside the U.S. (including the taxation of previously unrepatriated foreign earnings), as well as a potential destination-based tax system. A change to the U.S. tax system, a change to the tax system in a jurisdiction where we have significant operations, such as the U.S. territory of Puerto Rico, or a change in tax law in other jurisdictions where we do business, could have a material and adverse effect on our business and on the results of our operations.
We rely on third-party suppliers for certain of our raw materials, medical devices and components.
We rely on unaffiliated third-party suppliers for certain raw materials, medical devices and components necessary for the manufacturing of our commercial and clinical products. Certain of those raw materials, medical devices and components are proprietary products of those unaffiliated third-party suppliers and are specifically cited in our drug applications with regulatory agencies so that they must be obtained from that specific sole source or sources and could not be obtained from another supplier unless and until the regulatory agency approved such supplier. For example, Insulet Corporation is our single source of the on-body injector for our Neulasta
®
Onpro
®
kit. Also, certain of the raw materials required in the commercial and clinical manufacturing of our products are sourced from other countries and/or derived from biological sources, including mammalian tissues, bovine serum and human serum albumin.
Among the reasons we may be unable to obtain these raw materials, medical devices and components include:
•
regulatory requirements or action by regulatory agencies or others;
•
adverse financial or other strategic developments at or affecting the supplier, including bankruptcy;
•
unexpected demand for or shortage of raw materials, medical devices or components;
|
•
|
failure to comply with our quality standards which results in quality and product failures, product contamination and/or recall;
|
|
•
|
a material shortage, contamination, recall and/or restrictions on the use of certain biologically derived substances or other raw materials;
|
|
•
|
discovery of previously unknown or undetected imperfections in raw materials, medical devices or components; and
|
•
labor disputes or shortages, including from the effects of health emergencies and natural disasters.
These events could negatively impact our ability to satisfy demand for our products or conduct clinical trials, which could have a material adverse effect on our product use and sales and our business and results of operations. For example, in prior years we have experienced shortages in certain components necessary for the formulation, fill and finish of certain of our products in our Puerto Rico facility. Further quality issues that result in unexpected additional demand for certain components may lead to shortages of required raw materials or components (such as we have experienced with EPOGEN
®
glass vials). We may experience or continue to experience these or other shortages in the future resulting in delayed shipments, supply constraints, clinical trial delays, contract disputes and/or stock-outs of our products.
29
Manufacturing difficulties, disruptions or delays could limit supply of our products and limit our product sales.
Manufacturing biologic human therapeutic products is difficult, complex and highly regulated. We currently are involved in the manufacture of many of our products and plan to manufacture many of our product candidates. In addition, we currently use third-party contract manufacturers to produce, or assist in the production of, a number of our products, and we currently use contract manufacturers to produce, or assist in the production of, a number of our late-stage product candidates and drug delivery devices. See Item 1. Business—Manufacturing, Distribution and Raw Materials—Manufacturing. Our ability to adequately and timely manufacture and supply our products and product candidates is dependent on the uninterrupted and efficient operation of our facilities and those of our third-party contract manufacturers, which may be impacted by:
•
capacity of manufacturing facilities;
•
contamination by microorganisms or viruses, or foreign particles from the manufacturing process;
•
natural or other disasters, including hurricanes, earthquakes, volcanoes or fires;
•
labor disputes or shortages, including the effects of health emergencies or natural disasters;
•
compliance with regulatory requirements;
•
changes in forecasts of future demand;
•
timing and actual number of production runs and production success rates and yields;
•
updates of manufacturing specifications;
•
contractual disputes with our suppliers and contract manufacturers;
•
timing and outcome of product quality testing;
•
power failures and/or other utility failures; and/or
•
breakdown, failure, substandard performance or improper installation or operation of equipment.
If the efficient manufacture and supply of our products or product candidates is interrupted, we may experience delayed shipments, delays in our clinical trials, supply constraints, stock-outs, adverse event trends, contract disputes and/or recalls of our products. From time to time we have initiated voluntary recalls of certain lots of our products. For example, in July 2014, we initiated a voluntary recall of an Aranesp
®
lot distributed in the EU after particles were detected in a quality control sample following distribution of that lot. If we are at any time unable to provide an uninterrupted supply of our products to patients, we may lose patients and physicians may elect to prescribe competing therapeutics instead of our products, which could have a material adverse effect on our product sales, business and results of operations.
Our manufacturing processes and those of our third-party contract manufacturers must undergo regulatory approval processes and are subject to continued review by the FDA and other regulatory authorities. It can take longer than five years to build, validate and license another manufacturing plant and it can take longer than three years to qualify and license a new contract manufacturer. We have initiated the drug substance process qualification campaign to facilitate licensure at our biologics manufacturing facility in Singapore. This Singapore facility will utilize a novel manufacturing technology that has not been previously approved by the FDA or other regulatory authorities. In addition, we are in the process of commercially validating and licensing a new facility at the site in Singapore to enable the manufacture of the active pharmaceutical ingredient for KYPROLIS
®
. If we are unable to obtain needed licenses for either of these facilities on a timely basis, it could adversely affect our ability to achieve our planned risk mitigation and cost reductions which, as a result, could have a material adverse effect on our product sales, business and results of operations.
If regulatory authorities determine that we or our third-party contract manufacturers or certain of our third-party service providers have violated regulations or if authorities restrict, suspend or revoke our prior approvals, they could prohibit us from manufacturing our products or conducting clinical trials or selling our marketed products until we or the affected third-party contract manufacturers or third-party service providers comply, or indefinitely. Such issues may also delay the approval of product candidates we have submitted for regulatory review, even if such product candidates are not directly related to the products, devices or processes at issue with regulators. Because our third-party contract manufacturers and certain of our third-party service providers are subject to the FDA and foreign regulatory authorities, alternative qualified third-party contract manufacturers and third-party service providers may not be available on a timely basis or at all. If we or our third-party contract manufacturers or third-party service providers cease or interrupt production or if our third-party contract manufacturers and third-party service providers fail to supply materials, products or services to us, we may experience delayed shipments, supply constraints, stock-outs and/or recalls of our products. Additionally, we distribute a substantial volume of our commercial products through our primary distribution centers in Louisville, Kentucky for the United States and in Breda, Netherlands for Europe and much of the rest of the world. We also conduct all the labeling and packaging of our products distributed in Europe and much of the rest of the world in Breda. Our
30
ability to timely supply products is dependent on the uninterrupted and efficient operations of our distribution and logistics centers, our third-party logistics providers and our labeling and packaging facility in Breda. Further, we rely on commercial transportation, including air freight, for the distribution of our products to our customers, which may be negatively impacted by natural disasters or security threats.
We perform a substantial majority of our commercial manufacturing activities at our facility in the U.S. territory of Puerto Rico and substantially all of our clinical manufacturing activities at our facility in Thousand Oaks, California; if significant disruptions or production failures occur at the Puerto Rico facility, we may not be able to supply these products or, at the Thousand Oaks facility, we may not be able to continue our clinical trials.
We currently perform a substantial majority of our commercial manufacturing activities at our facility in the U.S. territory of Puerto Rico and substantially all of our clinical manufacturing activities at our facility in Thousand Oaks, California. The global supply of our products and product candidates for commercial sales and for use in our clinical trials is significantly dependent on the uninterrupted and efficient operation of these facilities. See Manufacturing difficulties, disruptions or delays could limit supply of our products and limit our product sales.
The operation of our manufacturing facility in Puerto Rico is also subject to local economic challenges. Since June 2015, when the Governor of Puerto Rico announced that the government (including certain government entities) was unable to pay its roughly $72 billion in debt, the government’s liquidity position has continued to deteriorate and public reports indicate that the Puerto Rico government is not making certain payments with respect to its obligations. On June 30, 2016, President Obama signed into law the Puerto Rico Oversight, Management, and Economic Stability Act (PROMESA) to provide a mechanism for Puerto Rico to restructure its debt, achieve fiscal responsibility, and gain access to capital markets. PROMESA established a federal Financial Oversight and Management Board (Oversight Board) to provide fiscal oversight through the development and approval of fiscal plans and budgets for Puerto Rico and to assist in the debt restructuring. The establishment of the Oversight Board initially provided for an automatic stay of creditor actions against the Puerto Rico government until February 15, 2017, and recently extended the automatic stay until May 1, 2017. The Puerto Rico government is expected to submit a fiscal plan to the Oversight Board by February 28, 2017. Additionally, on January 29, 2017, the Puerto Rico government signed into law the Puerto Rico Fiscal Emergency and Fiscal Responsibility Act (the Act), which is intended to facilitate and encourage a voluntary negotiation process under PROMESA between the Puerto Rico government and its creditors. The Act declares a state of financial emergency in Puerto Rico until May 1, 2017, and authorizes the Governor to designate certain services as essential services, and other services as non-essential in order to prioritize the use of available resources to satisfy Puerto Rico’s obligations. While PROMESA and the actions above continue to be important factors in moving Puerto Rico toward economic stability, there is still a risk that Puerto Rico’s economic situation could impact the territorial government’s provision of utilities or other services in Puerto Rico that we use in the operation of our business, create the potential for increased taxes or fees to operate in Puerto Rico, result in a migration of workers from Puerto Rico to the mainland United States, and/or make it more expensive or difficult for us to operate in Puerto Rico.
Concentration of sales at certain of our wholesaler distributors and free-standing dialysis clinic businesses and consolidation of private payers may negatively impact our business.
Certain of our distributors, customers and payers have substantial purchasing leverage, due to the volume of our products they purchase or the number of patient lives for which they provide coverage. The substantial majority of our U.S. product sales is made to three pharmaceutical product wholesaler distributors: AmerisourceBergen Corporation, McKesson Corporation and Cardinal Health, Inc. These distributors, in turn, sell our products to their customers, which include physicians or their clinics, dialysis centers, hospitals and pharmacies. One of our products, EPOGEN
®
, is sold primarily to free-standing dialysis clinics. Two organizations, DaVita and Fresenius Medical Care North America, own or manage a large number of the outpatient dialysis facilities located in the United States and account for approximately 75% of all EPOGEN
®
sales. Similarly, as discussed above, there has been significant consolidation in the health insurance industry, including that three PBMs now oversee approximately 75% of total covered lives in the United States. See Item 1A. Risk Factors—Our sales depend on coverage and reimbursement from third-party payers, and pricing and reimbursement pressures may affect our profitability. The concentration of purchasing and negotiating power by these entities may put pressure on our pricing due to their ability to extract price discounts on our products, fees for other services or rebates, negatively impacting our bargaining position, sales and/or profit margins. In addition, decisions by these entities to purchase or cover less or none of our products in favor of competitive products could have a material adverse effect on our business and results of operations due to their purchasing volume.
We may not be able to access the capital and credit markets on terms that are favorable to us, or at all.
The capital and credit markets may experience extreme volatility and disruption which may lead to uncertainty and liquidity issues for both borrowers and investors. We expect to access the capital markets to supplement our existing funds and cash generated from operations in satisfying our needs for working capital; capital expenditure and debt service requirements; our plans to pay dividends and repurchase stock; and other business initiatives we plan to strategically pursue, including acquisitions and licensing
31
activities. In the event of adverse capital and credit market conditions, we may be unable to obtain capital market financing on similar favorable terms, or at all, which could have a material adverse effect on our business and results of operations. Changes in credit ratings issued by nationally recognized credit-rating agencies could adversely affect our ability to obtain capital market financing and the cost of such financing and have an adverse effect on the market price of our securities.
Our efforts to acquire other companies or products and to integrate their operations may not be successful, and may result in unanticipated costs, delays or failures to realize the benefits of the transactions.
We have an ongoing process of evaluating potential merger, acquisition, partnering and in-license opportunities that we expect will contribute to our future growth and expand our geographic footprint, product offerings and/or our R&D pipeline. Acquisitions may result in unanticipated costs, delays or other operational or financial problems related to integrating the acquired company and business with our company, which may result in the diversion of our management’s attention from other business issues and opportunities. Failures or difficulties in integrating or retaining new personnel or in integrating the operations of the businesses we acquire (including their technology, compliance programs, distribution and general business operations and procedures), while preserving important R&D, distribution, marketing, promotion and other relationships, may affect our ability to grow and may result in our incurring asset impairment or restructuring charges. For example, on October 1, 2013, we acquired Onyx Pharmaceuticals, Inc. (Onyx), a biopharmaceutical company with several currently marketed products as well as pipeline candidates progressing through the development process, and failures or difficulties in the integration of Onyx could result in a material adverse impact on our business and results of operations.
Our sales and operations are subject to the risks of doing business in emerging markets.
As we continue our expansion efforts in emerging markets around the world, through acquisitions and licensing transactions as well as through the development and introduction of our products in new markets, we face numerous risks to our business. There is no guarantee that our efforts and strategies to expand sales in emerging markets will succeed. Emerging market countries may be especially vulnerable to periods of global political, legal, regulatory and financial instability, including sovereign debt issues and/or the imposition of international sanctions in response to certain state actions. As we expand internationally, we are subject to fluctuations in foreign currency exchange rates relative to the U.S. dollar. While we have a program in place that is designed to reduce our exposure to foreign currency exchange rate fluctuations through foreign currency hedging arrangements, our hedging efforts do not completely offset the effect of these fluctuations on our revenues and earnings. We may also be required to increase our reliance on third-party agents and unfamiliar operations and arrangements previously utilized by companies we partner with or acquire in emerging markets. See We must conduct clinical trials in humans before we commercialize and sell any of our product candidates or existing products for new indications. Our international operations and business may also be subject to less protective intellectual property or other applicable laws, diverse data privacy and protection requirements, changing tax laws and tariffs, far-reaching anti-bribery and anti-corruption laws and regulations and/or evolving legal and regulatory environments. These legal and operational challenges along with government controls, the challenges of attracting and retaining qualified personnel and obtaining and/or maintaining necessary regulatory or pricing approvals of our products may result in a material adverse impact on our international product sales, business and results of operations.
Our business may be affected by litigation and government investigations.
We and certain of our subsidiaries are involved in legal proceedings. See Part IV—Note 18, Contingencies and commitments, to the Consolidated Financial Statements. Civil and criminal litigation is inherently unpredictable, and the outcome can result in costly verdicts, fines and penalties, exclusion from federal healthcare programs and/or injunctive relief that affect how we operate our business. Defense of litigation claims can be expensive, time-consuming and distracting, and it is possible that we could incur judgments or enter into settlements of claims for monetary damages or change the way we operate our business, which could have a material adverse effect on our business and results of operations. In addition, product liability is a major risk in testing and marketing biotechnology and pharmaceutical products. We may face substantial product liability exposure in human clinical trials and for products we sell after regulatory approval. Product liability claims, regardless of their merits, could be costly and divert management’s attention and could adversely affect our reputation and the demand for our products. We and certain of our subsidiaries have previously been named as defendants in product liability actions for certain of our products.
We are also involved in government investigations that arise in the ordinary course of our business. In recent years, there has been a trend of increasing government investigations and litigations against companies operating in our industry, both in the United States and around the world. Our business activities outside of the United States are subject to the FCPA and similar anti-bribery or anti-corruption laws, regulations or rules of other countries in which we operate, including the UK Bribery Act. As we announced on December 19, 2012, we finalized a settlement agreement with the U.S. government and various other parties to settle certain allegations regarding our sales and marketing practices. In connection with that settlement, we are now operating under a Corporate Integrity Agreement (CIA) with the OIG of the U.S. Department of Health and Human Services that requires us to maintain our corporate compliance program and to undertake a set of defined corporate integrity obligations until December 2017. The CIA also provides for an independent third-party review organization to assess and report on our compliance
32
program. While we expect to fully comply with all of our obligations under the CIA, failure to do so could result in substantial penalties and our being excluded from government healthcare programs. We may also be subject to actions by government entities, including those not participating in the settlement, and may in the future become subject to claims by other parties, in each case with respect to the alleged conduct that is the subject of the settlement. We may see new government investigations of or actions against us citing novel theories of recovery. Any of these results could have a material adverse effect on our business and results of operations.
We are increasingly dependent on information technology systems, infrastructure, network connected control systems and data security.
We are increasingly dependent on information technology systems, infrastructure, network connected control systems and data security. The breadth, complexity and business process integration of our computer systems and the potential value of our data make these systems targets of service interruption, destruction, malicious intrusion and attack. Likewise, data privacy or security breaches by employees, contractors or others may pose risks that sensitive data including intellectual property, trade secrets or personal information belonging us, our patients, customers and/or other business partners may be exposed to unauthorized persons or the public. As a global biotechnology company, our systems are subject to frequent cyber-attacks. Moreover, these attacks are growing in frequency, sophistication and intensity, and are becoming increasingly difficult to detect. As the cyber-threat landscape evolves, such attacks are also increasingly difficult to detect when carried out by motivated, well-resourced, skilled and persistent actors including nation states and organized crime groups. Such attacks could include the deployment of harmful malware, key loggers, a denial-of-service, a delivery of malware through malicious websites, the use of social engineering and/or other means to affect the confidentiality, integrity and availability of our information technology systems, processes, infrastructure and data. Key business partners, third-party service and product providers and any companies we may acquire face similar risks and any security breaches of their systems could adversely affect our security and resiliency posture. Although in the past we have experienced cyber-attacks and intrusions into our computer systems, we do not believe such attacks have had a material adverse effect on our operations. While we continue to invest in the protection and monitoring of our critical or sensitive data and information technology, there can be no assurance that our efforts will prevent service interruptions or detect all breaches to our systems that could adversely affect our business and operations and/or result in the loss of critical or sensitive information, which could result in financial, legal, business or reputational harm to us.
Global economic conditions may negatively affect us and may magnify certain risks that affect our business.
Our operations and performance have been, and may continue to be, affected by global economic conditions. Financial pressures may cause government or other third-party payers to more aggressively seek cost containment measures. See Our sales depend on coverage and reimbursement from third-party payers, and pricing and reimbursement pressures may affect our profitability. As a result of global economic conditions, some third-party payers may delay or be unable to satisfy their reimbursement obligations. Job losses or other economic hardships may also affect patients’ ability to afford health care as a result of increased co-pay or deductible obligations, greater cost sensitivity to existing co-pay or deductible obligations, lost healthcare insurance coverage or for other reasons. We believe such conditions have led and could continue to lead to reduced demand for our products, which could have a material adverse effect on our product sales, business and results of operations. Economic conditions may also adversely affect the ability of our distributors, customers and suppliers to obtain the liquidity required to buy inventory or raw materials and to perform their obligations under agreements with us, which could disrupt our operations. Although we monitor our distributors’, customers’ and suppliers’ financial condition and their liquidity to mitigate our business risks, some of our distributors, customers and suppliers may become insolvent, which could have a material adverse effect on our product sales, business and results of operations.
We maintain a significant portfolio of investments disclosed as cash equivalents and marketable securities on our Consolidated Balance Sheets. The value of our investments may be adversely affected by interest rate fluctuations, downgrades in credit ratings, illiquidity in the capital markets and other factors that may result in other-than-temporary declines in the value of our investments. Any of those events could cause us to record impairment charges with respect to our investment portfolio or to realize losses on sales of investments.
Our stock price is volatile.
Our stock price, like that of our peers in the biotechnology and pharmaceutical industries, is volatile. Our revenues and operating results may fluctuate from period to period for a number of reasons. Events such as a delay in product development, changes to our expectations or strategy or even a relatively small revenue shortfall may cause financial results for a period to be below our expectations or projections. As a result, our revenues and operating results and, in turn, our stock price may be subject to significant fluctuations. Announcements or discussions of possible restrictive actions by government or private payers that would impact our business or industry if ultimately enacted or adopted may also cause our stock price to fluctuate, whether or not such restrictive actions ever actually occur. Similarly, actual or perceived safety issues with our products or similar products or unexpected clinical trial results can have an immediate and rapid impact on our stock price, whether or not our operating results are materially impacted.
33
|
Item 1B.
|
UNRESOLVED STAFF COMMENTS
|
None.
|
Item 2.
|
PROPERTIES
|
As of
December 31, 2016
, we owned or leased approximately 190 properties. The locations and primary functions of significant properties are summarized in the following tables:
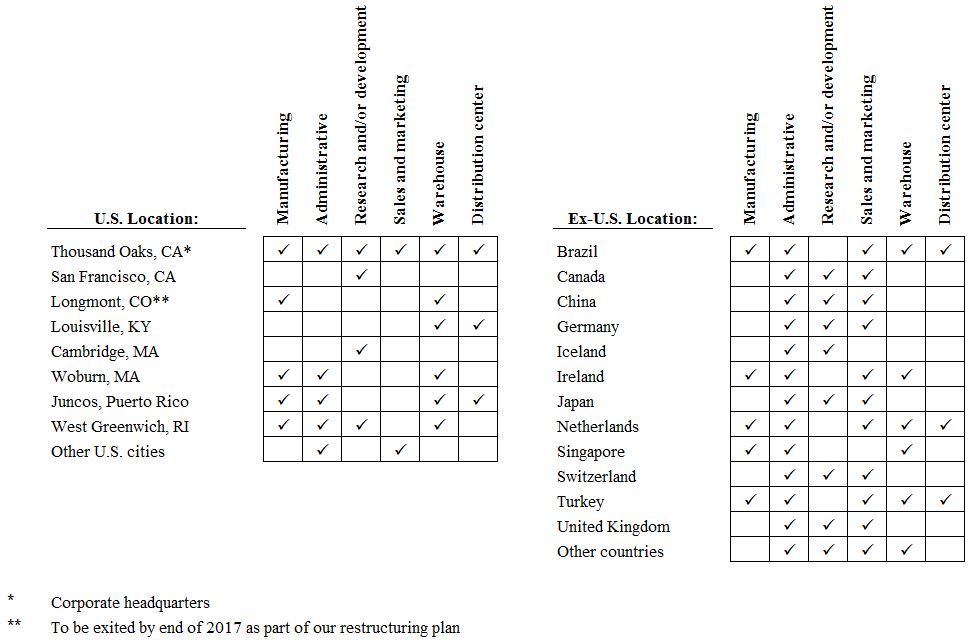
Excluded from the tables above are undeveloped land and leased properties that have been abandoned and certain buildings that we still own but are no longer used in our business. There are no material encumbrances on our owned properties.
We believe that our facilities are suitable for their intended use and, in conjunction with our third-party contracting manufacturing agreements, provide adequate capacity and are sufficient to meet our expected needs. See Item 1A. Risk Factors for a discussion on the factors that could adversely impact our manufacturing operations and the global supply of our products.
See Item 1. Business—Manufacturing, Distribution and Raw Materials.
34
|
Item 3.
|
LEGAL PROCEEDINGS
|
Certain of the legal proceedings in which we are involved are discussed in Part IV—Note 18, Contingencies and commitments, to the Consolidated Financial Statements and are hereby incorporated by reference.
|
Item 4.
|
MINE SAFETY DISCLOSURES
|
Not applicable.
35
|
Item 5.
|
MARKET FOR REGISTRANT’S COMMON EQUITY, RELATED STOCKHOLDER MATTERS AND ISSUER PURCHASES OF EQUITY SECURITIES
|
Common stock
Our common stock trades on the NASDAQ Global Select Market under the symbol AMGN. As of
February 9, 2017
, there were approximately 6,444 holders of record of our common stock.
The following table sets forth, for the periods indicated, the range of high and low quarterly closing sales prices of the common stock as quoted on the NASDAQ Global Select Market:
|
Year ended December 31, 2016
|
High
|
Low
|
||||||
|
Fourth quarter
|
$
|
168.31
|
|
$
|
135.22
|
|
||
|
Third quarter
|
$
|
175.62
|
|
$
|
154.27
|
|
||
|
Second quarter
|
$
|
164.35
|
|
$
|
144.58
|
|
||
|
First quarter
|
$
|
158.34
|
|
$
|
140.90
|
|
||
|
Year ended December 31, 2015
|
||||||||
|
Fourth quarter
|
$
|
164.58
|
|
$
|
140.23
|
|
||
|
Third quarter
|
$
|
176.59
|
|
$
|
132.24
|
|
||
|
Second quarter
|
$
|
169.17
|
|
$
|
151.60
|
|
||
|
First quarter
|
$
|
170.10
|
|
$
|
150.01
|
|
||
36
Performance graph
The following graph shows the value of an investment of $100 on December 31, 2011, in each of Amgen common stock, the Amex Biotech Index, the Amex Pharmaceutical Index and Standard & Poor’s 500 Index (S&P 500). All values assume reinvestment of the pretax value of dividends and are calculated as of December 31 of each year. The historical stock price performance of the Company’s common stock shown in the performance graph is not necessarily indicative of future stock price performance.
|
Amgen vs. Amex Biotech, Amex Pharmaceutical and S&P 500 Indices
|
|
Comparison of Five-Year Cumulative Total Return
|
|
Value of Investment of $100 on December 31, 2011
|
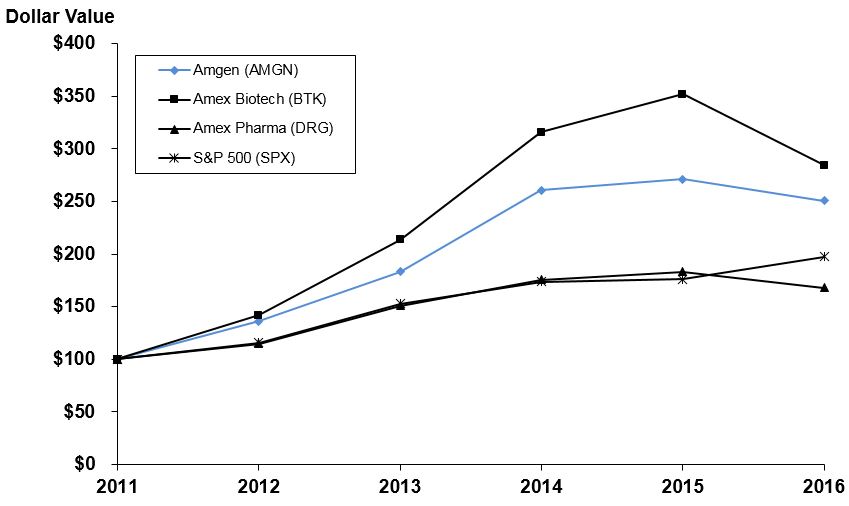
|
12/31/2011
|
12/31/2012
|
12/31/2013
|
12/31/2014
|
12/31/2015
|
12/31/2016
|
||||||
|
Amgen (AMGN)
|
$100.00
|
$136.26
|
$183.30
|
$260.87
|
$271.23
|
$250.75
|
|||||
|
Amex Biotech (BTK)
|
$100.00
|
$141.60
|
$213.50
|
$315.79
|
$351.76
|
$284.40
|
|||||
|
Amex Pharmaceutical (DRG)
|
$100.00
|
$114.09
|
$150.77
|
$175.77
|
$183.11
|
$167.84
|
|||||
|
S&P 500 (SPX)
|
$100.00
|
$115.80
|
$152.90
|
$173.82
|
$176.21
|
$197.27
|
|||||
The material in this performance graph is not soliciting material, is not deemed filed with the SEC, and is not incorporated by reference in any filing of the Company under the Securities Act or the Exchange Act, whether made on, before or after the date of this filing and irrespective of any general incorporation language in such filing.
37
Stock repurchase program
During the three months and year ended December 31, 2016, we had one outstanding stock repurchase program, under which the repurchasing activity was as follows:
|
Total
number of
shares
purchased
|
Average
price paid
per share
(1)
|
Total number
of shares
purchased as
publicly
announced
program
|
Maximum dollar
value that may
yet be purchased
under the
program
(2)
|
|||||||||||
|
October 1 - October 31
|
1,302,682
|
|
$
|
159.91
|
|
1,302,682
|
|
$
|
4,865,695,995
|
|
||||
|
November 1 - November 30
|
2,296,195
|
|
$
|
144.14
|
|
2,296,195
|
|
$
|
4,534,720,376
|
|
||||
|
December 1 - December 31
|
3,150,296
|
|
$
|
145.71
|
|
3,150,296
|
|
$
|
4,075,684,217
|
|
||||
|
6,749,173
|
|
$
|
147.92
|
|
6,749,173
|
|
||||||||
|
January 1 - December 31
|
19,693,193
|
|
$
|
153.68
|
|
19,693,193
|
|
|||||||
|
(1)
|
Average price paid per share includes related expenses.
|
|
(2)
|
In October 2016, our Board of Directors authorized an increase that resulted in a total of $5.0 billion available under the stock repurchase program.
|
Dividends
For the years ended
December 31, 2016
and
2015
, we paid quarterly dividends. We expect to continue to pay quarterly dividends, although the amount and timing of any future dividends are subject to approval by our Board of Directors. Additional information required by this item is incorporated herein by reference to Part IV—Note 15, Stockholders’ equity, to the Consolidated Financial Statements.
Securities Authorized for Issuance Under Existing Equity Compensation Plans
Information about securities authorized for issuance under existing equity compensation plans is incorporated by reference from Item 12—Securities Authorized for Issuance Under Existing Equity Compensation Plans.
38
|
Item 6.
|
SELECTED FINANCIAL DATA
|
|
|
Years ended December 31,
|
||||||||||||||||||
|
Consolidated Statement of Income Data:
|
2016
|
2015
|
2014
|
2013
|
2012
|
||||||||||||||
|
|
(In millions, except per share data)
|
||||||||||||||||||
|
Revenues:
|
|||||||||||||||||||
|
Product sales
|
$
|
21,892
|
|
$
|
20,944
|
|
$
|
19,327
|
|
$
|
18,192
|
|
$
|
16,639
|
|
||||
|
Other revenues
|
1,099
|
|
718
|
|
736
|
|
484
|
|
626
|
|
|||||||||
|
Total revenues
|
$
|
22,991
|
|
$
|
21,662
|
|
$
|
20,063
|
|
$
|
18,676
|
|
$
|
17,265
|
|
||||
|
Operating expenses:
|
|||||||||||||||||||
|
Cost of sales
|
$
|
4,162
|
|
$
|
4,227
|
|
$
|
4,422
|
|
$
|
3,346
|
|
$
|
3,199
|
|
||||
|
Research and development
|
$
|
3,840
|
|
$
|
4,070
|
|
$
|
4,297
|
|
$
|
4,083
|
|
$
|
3,380
|
|
||||
|
Selling, general and administrative
|
$
|
5,062
|
|
$
|
4,846
|
|
$
|
4,699
|
|
$
|
5,184
|
|
$
|
4,814
|
|
||||
|
Net income
|
$
|
7,722
|
|
$
|
6,939
|
|
$
|
5,158
|
|
$
|
5,081
|
|
$
|
4,345
|
|
||||
|
Diluted earnings per share
|
$
|
10.24
|
|
$
|
9.06
|
|
$
|
6.70
|
|
$
|
6.64
|
|
$
|
5.52
|
|
||||
|
Dividends paid per share
|
$
|
4.00
|
|
$
|
3.16
|
|
$
|
2.44
|
|
$
|
1.88
|
|
$
|
1.44
|
|
||||
|
|
As of December 31,
|
||||||||||||||||||
|
Consolidated Balance Sheet Data:
|
2016
|
2015
|
2014
|
2013
|
2012
|
||||||||||||||
|
|
(In millions)
|
||||||||||||||||||
|
Total assets
|
$
|
77,626
|
|
$
|
71,449
|
|
$
|
68,882
|
|
$
|
65,974
|
|
$
|
54,180
|
|
||||
|
Total debt
(1)
|
$
|
34,596
|
|
$
|
31,429
|
|
$
|
30,588
|
|
$
|
31,977
|
|
$
|
26,411
|
|
||||
|
Total stockholders’ equity
(2)
|
$
|
29,875
|
|
$
|
28,083
|
|
$
|
25,778
|
|
$
|
22,096
|
|
$
|
19,060
|
|
||||
In addition to the following notes, see Item 7. Management’s Discussion and Analysis of Financial Condition and Results of Operations and the Consolidated Financial Statements and accompanying notes and previously filed Annual Reports on Form 10-K for further information regarding our consolidated results of operations and financial position for periods reported therein and for known factors that will impact comparability of future results. Also, see Part IV—Note 15, Stockholders’ equity, to the Consolidated Financial Statements, for information regarding cash dividends declared per share of common stock for each of the four quarters of 2016, 2015, and 2014, respectively. In addition, our Board of Directors declared dividends per share of $0.47 and $0.36 that were paid in each of the four quarters of 2013 and 2012, respectively.
(1)
See Part IV—Note 14, Financing arrangements, to the Consolidated Financial Statements for discussion of our financing arrangements. In 2013, we issued long-term debt of $8.1 billion and repaid an aggregate amount of $3.4 billion. In 2012, we issued $5.0 billion aggregate principal amount of notes.
(2)
Throughout the five years ended December 31, 2016, we had a stock repurchase program authorized by the Board of Directors through which we repurchased
$3.0 billion
,
$1.9 billion
,
$0.2 billion
, $0.8 billion and $4.7 billion, respectively, of Amgen common stock.
39
|
Item 7.
|
MANAGEMENT’S DISCUSSION AND ANALYSIS OF FINANCIAL CONDITION AND RESULTS OF OPERATIONS
|
The following management’s discussion and analysis (MD&A) is intended to assist the reader in understanding Amgen’s business. MD&A is provided as a supplement to, and should be read in conjunction with, our consolidated financial statements and accompanying notes. Our results of operations discussed in MD&A are presented in conformity with U.S. generally accepted accounting principles (GAAP). Amgen operates in one business segment: human therapeutics. Therefore, our results of operations are discussed on a consolidated basis.
Forward-looking statements
This report and other documents we file with the SEC contain forward-looking statements that are based on current expectations, estimates, forecasts and projections about us, our future performance, our business, our beliefs and our management’s assumptions. In addition, we, or others on our behalf, may make forward-looking statements in press releases or written statements, or in our communications and discussions with investors and analysts in the normal course of business through meetings, webcasts, phone calls and conference calls. Such words as “expect,” “anticipate,” “outlook,” “could,” “target,” “project,” “intend,” “plan,” “believe,” “seek,” “estimate,” “should,” “may,” “assume,” and “continue,” as well as variations of such words and similar expressions are intended to identify such forward-looking statements. These statements are not guarantees of future performance and they involve certain risks, uncertainties and assumptions that are difficult to predict. We describe our respective risks, uncertainties and assumptions that could affect the outcome or results of operations in Item 1A. Risk Factors. We have based our forward-looking statements on our management’s beliefs and assumptions based on information available to our management at the time the statements are made. We caution you that actual outcomes and results may differ materially from what is expressed, implied or forecast by our forward-looking statements. Reference is made in particular to forward-looking statements regarding product sales, regulatory activities, clinical trial results, reimbursement, expenses, earnings per share (EPS), liquidity and capital resources, trends, planned dividends, stock repurchases and restructuring plans. Except as required under the federal securities laws and the rules and regulations of the SEC, we do not have any intention or obligation to update publicly any forward-looking statements after the distribution of this report, whether as a result of new information, future events, changes in assumptions or otherwise.
40
Overview
Amgen is committed to unlocking the potential of biology for patients suffering from serious illnesses by discovering, developing, manufacturing and delivering innovative human therapeutics. This approach begins by using tools like advanced human genetics to unravel the complexities of disease and understand the fundamentals of human biology.
Amgen focuses on areas of high unmet medical need and leverages its expertise to strive for solutions that improve health outcomes and dramatically improve people’s lives. A biotechnology pioneer since 1980, Amgen has grown to be one of the world’s leading independent biotechnology companies, has reached millions of patients around the world and is developing a pipeline of medicines with breakaway potential.
Our strategy is to develop innovative medicines in six focused therapeutic areas that meet important unmet medical needs in addressing serious illness. We have a presence in approximately 100 countries worldwide focusing on: oncology/hematology, cardiovascular disease, inflammation, bone health, nephrology and neuroscience. Our principal products include ENBREL, Neulasta
®
,
Aranesp
®
, Prolia
®
, Sensipar
®
/Mimpara
®
, XGEVA
®
, EPOGEN
®
, and NEUPOGEN
®
. For additional information about our products, see Part I, Item 1. Business—Marketing, Distribution and Selected Marketed Products.
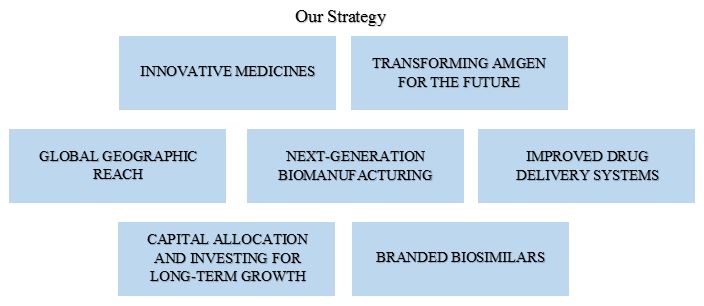
In 2016, we made substantial progress on our strategic priorities with strong execution across the business.
|
•
|
Over the past year, our financial performance was strong, as total revenues increased 6%. Net income increased 11% and diluted EPS increased by 13% driven by higher total revenues and continued improvement in operating leverage enabled by the transformation initiatives.
|
|
•
|
Our pipeline continued to advance with the U.S. regulatory filing for EVENITY
™
, approval of Parsabiv
™
in the EU, and in early 2017, approval in the United States. We announced positive phase 2 and phase 3 results for erenumab for chronic and episodic migraine, respectively, and positive phase 3 results for XGEVA
®
for the prevention of SREs in patients with multiple myeloma. We also announced positive phase 3 results for Repatha
®
for the treatment of coronary artery disease and in early 2017, positive top-line results in our phase 3 cardiovascular outcomes and cognitive function trials. We received new indications for KYPROLIS
®
, Nplate
®
, BLINCYTO
®
and ENBREL. Additionally, we continued to advance our biosimilar program, including the U.S. approval and EU regulatory submission for AMJEVITA
™
/ ABP 501, global regulatory submission of ABP 215, and phase 3 data for ABP 980. Throughout the course of the year, we invested in external early-stage innovation to augment our internal research efforts.
|
|
•
|
We built the foundation for long-term growth through our product launches in new parts of the world, as seen by our ability to secure 94 country product launches.
|
|
•
|
We made investments in next-generation biomanufacturing that build on our expertise in manufacturing, including our new Singapore facility for which licensure is under way. We believe that our next-generation biomanufacturing will reduce the scale and cost of making biologics while retaining a reliable, high-quality, compliant supply of medicines.
|
41
|
•
|
We continue to innovate with patient- and provider-friendly delivery systems to differentiate our products, as seen by our U.S. launch of the Repatha
®
Pushtronex
™
system, a new monthly single-dose administration option, and the continued growth of the Neulasta
®
OnPro
®
kit in the United States.
|
|
•
|
Cash flows from operating activities grew 6% to $10.4 billion, enabling us to invest for the future and return capital to shareholders, consistent with our expectations for long-term growth. We increased our dividend 27% to $1.00 per share of common stock in each of the four quarters of 2016. In December 2016, the Board of Directors declared a cash dividend of $1.15 per share of common stock for the first quarter of 2017, an increase of 15% for this period, to be paid in March 2017. We also repurchased 19.7 million shares of our common stock throughout 2016 at an aggregate cost of $3.0 billion.
|
|
•
|
We have focused our business and operating model through significant transformation and process improvement efforts. Our transformation has established a foundation for longer-term growth and we are approaching the development of promising new medicines with greater understanding, speed and confidence.
|
While 2016 execution was strong, we expect 2017 to be an increasingly challenging environment. Our long-term success depends to a great extent on our ability to continue to discover, develop and commercialize innovative products and acquire or collaborate on therapies currently in development by other companies. We must develop new products over time in order to provide for revenue growth and to offset revenue losses when products lose their exclusivity or competing products are launched. Certain of our products will face increasing pressure from competitive product launches, including from biosimilars. For additional information, including information on the expiration of patents for various products, see Part I, Item 1. Business—Marketing, Distribution and Selected Marketed Products—Patents and see Part I, Item 1. Business—Marketing, Distribution and Selected Marketed Products—Competition. We devote considerable resources to R&D activities. However, successful product development in the biotechnology industry is highly uncertain. We are also confronted by increasing regulatory scrutiny of safety and efficacy both before and after products launch.
Rising healthcare costs and economic conditions also continue to pose challenges to our business, including continued pressure by third-party payers, such as governments and private payers, to reduce healthcare expenditures. As a result of public and private health care provider focus, the industry continues to experience significant pricing pressures and other cost containment measures.
Finally, wholesale and end-user buying patterns can affect our product sales. These effects can cause fluctuations in quarterly product sales and have generally not been significant when comparing full-year product performance to the prior year. See Part I, Item 1. Business—Marketing, Distribution and Selected Marketed Products and Part I, Item 1A. Risk Factors for further discussion of certain of the factors that could impact our future product sales.
We believe we are well positioned for the challenges and opportunities in the coming year. Challenges and opportunities led us to begin our transformation at Amgen, which will continue to be an important part of our strategy and execution. We have enthusiasm for the future and long-term growth based on innovative medicines that make a difference for patients suffering from serious illness. We are focused on executing our strategy and delivering results.
42
Selected financial information
The following is an overview of our results of operations (in millions, except percentages and per share data):
|
Year ended December 31,
|
Year ended December 31,
|
|||||||||
|
2016
|
Change
|
2015
|
||||||||
|
Product sales:
|
||||||||||
|
U.S.
|
$
|
17,325
|
|
5
|
%
|
$
|
16,523
|
|
||
|
Rest of world (ROW)
|
4,567
|
|
3
|
%
|
4,421
|
|
||||
|
Total product sales
|
21,892
|
|
5
|
%
|
20,944
|
|
||||
|
Other revenues
|
1,099
|
|
53
|
%
|
718
|
|
||||
|
Total revenues
|
$
|
22,991
|
|
6
|
%
|
$
|
21,662
|
|
||
|
Operating expenses
|
$
|
13,197
|
|
—
|
%
|
$
|
13,192
|
|
||
|
Operating income
|
$
|
9,794
|
|
16
|
%
|
$
|
8,470
|
|
||
|
Net income
|
$
|
7,722
|
|
11
|
%
|
$
|
6,939
|
|
||
|
Diluted EPS
|
$
|
10.24
|
|
13
|
%
|
$
|
9.06
|
|
||
|
Diluted shares
|
754
|
|
(2
|
)%
|
766
|
|
||||
In the following discussion of changes in product sales, any reference to unit demand growth or decline refers to changes in the purchases of our products by healthcare providers, such as physicians or their clinics, dialysis centers, hospitals and pharmacies.
U.S. product sales for 2016 increased across the portfolio except for EPOGEN
®
and NEUPOGEN
®
, which declined by 31% and 33%, respectively. The U.S. increase was driven primarily by increases in net selling prices. The increase in ROW product sales for 2016 was driven primarily by higher unit demand from new product launches, offset by unfavorable changes in foreign exchange rates and declines in net selling prices.
Operating expenses for 2016 were flat as the savings from transformation and process improvement efforts were offset by increased support for launch products
.
Although changes in foreign currency exchange rates result in increases or decreases in our reported international product sales, the benefit or detriment that such movements have on our international product sales is offset partially by corresponding increases or decreases in our international operating expenses and our related foreign currency hedging activities. Our hedging activities seek to offset the impacts, both positive and negative, that foreign currency exchange rate changes may have on our net income by hedging our net foreign currency exposure, primarily with respect to product sales denominated in euros. The net impact from changes in foreign currency exchange rates was not material in 2016, 2015 or 2014.
43
Results of Operations
Product sales
Worldwide product sales were as follows (dollar amounts in millions):
|
Year ended December 31,
|
Year ended December 31,
|
Year ended December 31,
|
|||||||||||||||
|
2016
|
Change
|
2015
|
Change
|
2014
|
|||||||||||||
|
ENBREL
|
$
|
5,965
|
|
11
|
%
|
$
|
5,364
|
|
14
|
%
|
$
|
4,688
|
|
||||
|
Neulasta
®
|
4,648
|
|
(1
|
)%
|
4,715
|
|
3
|
%
|
4,596
|
|
|||||||
|
Aranesp
®
|
2,093
|
|
7
|
%
|
1,951
|
|
1
|
%
|
1,930
|
|
|||||||
|
Prolia
®
|
1,635
|
|
25
|
%
|
1,312
|
|
27
|
%
|
1,030
|
|
|||||||
|
Sensipar
®
/Mimpara
®
|
1,582
|
|
12
|
%
|
1,415
|
|
22
|
%
|
1,158
|
|
|||||||
|
XGEVA
®
|
1,529
|
|
9
|
%
|
1,405
|
|
15
|
%
|
1,221
|
|
|||||||
|
EPOGEN
®
|
1,282
|
|
(31
|
)%
|
1,856
|
|
(9
|
)%
|
2,031
|
|
|||||||
|
NEUPOGEN
®
|
765
|
|
(27
|
)%
|
1,049
|
|
(9
|
)%
|
1,159
|
|
|||||||
|
Other products
|
2,393
|
|
27
|
%
|
1,877
|
|
24
|
%
|
1,514
|
|
|||||||
|
Total product sales
|
$
|
21,892
|
|
5
|
%
|
$
|
20,944
|
|
8
|
%
|
$
|
19,327
|
|
||||
|
Total U.S.
|
$
|
17,325
|
|
5
|
%
|
$
|
16,523
|
|
12
|
%
|
$
|
14,732
|
|
||||
|
Total ROW
|
4,567
|
|
3
|
%
|
4,421
|
|
(4
|
)%
|
4,595
|
|
|||||||
|
Total product sales
|
$
|
21,892
|
|
5
|
%
|
$
|
20,944
|
|
8
|
%
|
$
|
19,327
|
|
||||
Future sales of our products will depend, in part, on the factors discussed in the Overview, Part I, Item 1. Business—Marketing, Distribution and Selected Marketed Products—Competition, in Part I, Item 1A. Risk Factors and any additional factors discussed in the individual product sections below. In addition, for a list of our products’ significant competitors, see Part I, Item 1. Business—Marketing, Distribution and Selected Marketed Products—Competition.
ENBREL
Total ENBREL sales by geographic region were as follows (dollar amounts in millions):
|
Year ended December 31,
|
Year ended December 31,
|
Year ended December 31,
|
|||||||||||||||
|
2016
|
Change
|
2015
|
Change
|
2014
|
|||||||||||||
|
ENBREL — U.S.
|
$
|
5,719
|
|
12
|
%
|
$
|
5,099
|
|
16
|
%
|
$
|
4,404
|
|
||||
|
ENBREL — Canada
|
246
|
|
(7
|
)%
|
265
|
|
(7
|
)%
|
284
|
|
|||||||
|
Total ENBREL
|
$
|
5,965
|
|
11
|
%
|
|
$
|
5,364
|
|
14
|
%
|
$
|
4,688
|
|
|||
The increases in ENBREL sales for 2016 and 2015 were driven primarily by an increase in net selling price, offset partially by the impact of competition.
In 2017, we expect intensifying competition and relatively little benefit from net selling price changes.
Neulasta
®
Total Neulasta
®
sales by geographic region were as follows (dollar amounts in millions):
|
Year ended December 31,
|
Year ended December 31,
|
Year ended December 31,
|
|||||||||||||||
|
2016
|
Change
|
2015
|
Change
|
2014
|
|||||||||||||
|
Neulasta
®
— U.S.
|
$
|
3,925
|
|
1
|
%
|
$
|
3,891
|
|
7
|
%
|
$
|
3,649
|
|
||||
|
Neulasta
®
— ROW
|
723
|
|
(12
|
)%
|
824
|
|
(13
|
)%
|
947
|
|
|||||||
|
Total Neulasta
®
|
$
|
4,648
|
|
(1
|
)%
|
|
$
|
4,715
|
|
3
|
%
|
$
|
4,596
|
|
|||
The decrease in global Neulasta
®
sales for 2016 was driven primarily by lower unit demand, offset by an increase in net selling price in the United States. As of the end of December 2016, utilization of the Neulasta
®
Onpro
®
kit continues to grow in the United States.
44
The increase in global Neulasta
®
sales for 2015 was driven primarily by an increase in net selling price in the United States, offset partially by unfavorable changes in foreign currency exchange rates.
Our final material U.S. patent for pegfilgrastim (Neulasta
®
) expired in October 2015. Therefore, we expect to face competition in the United States, which over time may have a material adverse impact on future sales of Neulasta
®
. Apotex, Inc. (Apotex), Sandoz and Coherus BioSciences, Inc., announced that the FDA has accepted their applications for proposed biosimilar versions of Neulasta
®
. Novartis indicated that it received a Complete Response Letter from the FDA. For discussion of ongoing litigation between us and Apotex and Sandoz, see Part IV—Note 18, Contingencies and commitments, to the Consolidated Financial Statements.
In addition, supplementary protection certificates issued by certain countries, including France, Germany, Italy, Spain, and the United Kingdom, relating to our European patent for pegfilgrastim (Neulasta
®
) will expire in August 2017. For further information regarding our patents, see Part I, Item 1. Business—Marketing, Distribution and Selected Marketed Products—Patents.
Future Neulasta
®
sales will also depend, in part, on the development of new protocols, tests and/or treatments for cancer and/or new chemotherapy treatments or alternatives to chemotherapy that may have reduced and may continue to reduce the use of chemotherapy in some patients.
Aranesp
®
Total Aranesp
®
sales by geographic region were as follows (dollar amounts in millions):
|
Year ended December 31,
|
Year ended December 31,
|
Year ended December 31,
|
|||||||||||||||
|
2016
|
Change
|
2015
|
Change
|
2014
|
|||||||||||||
|
Aranesp
®
— U.S.
|
$
|
1,082
|
|
20
|
%
|
$
|
900
|
|
13
|
%
|
$
|
794
|
|
||||
|
Aranesp
®
— ROW
|
1,011
|
|
(4
|
)%
|
1,051
|
|
(7
|
)%
|
1,136
|
|
|||||||
|
Total Aranesp
®
|
$
|
2,093
|
|
7
|
%
|
|
$
|
1,951
|
|
1
|
%
|
$
|
1,930
|
|
|||
The increases in global Aranesp
®
sales for 2016 and 2015
were driven by unit demand growth, including a shift from EPOGEN
®
in the United States, offset partially by
a decrease in net selling
price in ROW.
Prolia
®
Total Prolia
®
sales by geographic region were as follows (dollar amounts in millions):
|
Year ended December 31,
|
Year ended December 31,
|
Year ended December 31,
|
|||||||||||||||
|
2016
|
Change
|
2015
|
Change
|
2014
|
|||||||||||||
|
Prolia
®
— U.S.
|
$
|
1,049
|
|
25
|
%
|
$
|
837
|
|
34
|
%
|
$
|
625
|
|
||||
|
Prolia
®
— ROW
|
586
|
|
23
|
%
|
475
|
|
17
|
%
|
405
|
|
|||||||
|
Total Prolia
®
|
$
|
1,635
|
|
25
|
%
|
|
$
|
1,312
|
|
27
|
%
|
$
|
1,030
|
|
|||
The increases in global Prolia
®
sales for 2016 and 2015 were driven primarily by unit demand growth.
Sensipar
®
/Mimpara
®
Total Sensipar
®
/Mimpara
®
sales by geographic region were as follows (dollar amounts in millions):
|
Year ended December 31,
|
Year ended December 31,
|
Year ended December 31,
|
|||||||||||||||
|
2016
|
Change
|
2015
|
Change
|
2014
|
|||||||||||||
|
Sensipar
®
— U.S.
|
$
|
1,240
|
|
16
|
%
|
$
|
1,069
|
|
34
|
%
|
$
|
796
|
|
||||
|
Sensipar
®
/Mimpara
®
— ROW
|
342
|
|
(1
|
)%
|
346
|
|
(4
|
)%
|
362
|
|
|||||||
|
Total Sensipar
®
/Mimpara
®
|
$
|
1,582
|
|
12
|
%
|
|
$
|
1,415
|
|
22
|
%
|
$
|
1,158
|
|
|||
The increase in global Sensipar
®
/Mimpara
®
sales for 2016 was driven primarily by an increase in net selling price in the United States and unit demand growth.
45
The increase in global Sensipar
®
/Mimpara
®
sales for 2015 was driven primarily by unit demand growth and an increase in net selling price in the United States. ROW Sensipar
®
/Mimpara
®
sales were negatively impacted by changes in foreign currency exchange rates.
XGEVA
®
Total XGEVA
®
sales by geographic region were as follows (dollar amounts in millions):
|
Year ended December 31,
|
Year ended December 31,
|
Year ended December 31,
|
|||||||||||||||
|
2016
|
Change
|
2015
|
Change
|
2014
|
|||||||||||||
|
XGEVA
®
— U.S.
|
$
|
1,115
|
|
11
|
%
|
$
|
1,006
|
|
17
|
%
|
$
|
857
|
|
||||
|
XGEVA
®
— ROW
|
414
|
|
4
|
%
|
399
|
|
10
|
%
|
364
|
|
|||||||
|
Total XGEVA
®
|
$
|
1,529
|
|
9
|
%
|
|
$
|
1,405
|
|
15
|
%
|
$
|
1,221
|
|
|||
The increases in global XGEVA
®
sales for 2016 and 2015 were driven primarily by unit demand growth.
EPOGEN
®
Total EPOGEN
®
sales were as follows (dollar amounts in millions):
|
Year ended December 31,
|
Year ended December 31,
|
Year ended December 31,
|
|||||||||||||||
|
2016
|
Change
|
2015
|
Change
|
2014
|
|||||||||||||
|
EPOGEN
®
— U.S.
|
$
|
1,282
|
|
(31
|
)%
|
$
|
1,856
|
|
(9
|
)%
|
$
|
2,031
|
|
||||
The decrease in EPOGEN
®
sales for 2016 was driven by a decline in unit demand resulting from competition and a shift in dialysis sales
to A
ranesp
®
.
The decrease in EPOGEN
®
sales for 2015 was driven by a decline in unit demand resulting from competition and a shift in dialysis sales
to A
ranesp
®
, offset partially by an increase in net selling price.
Our final material U.S. patent for EPOGEN
®
expired in May 2015.
There is competition in the United States, which has had, and will continue to have, a material adverse impact on EPOGEN
®
sales.
Further in
December 2014, Hospira, Inc. (Hospira), a subsidiary of Pfizer, submitted a BLA to the FDA for Retacrit
™
, a proposed biosimilar to EPOGEN
®
. For discussion of ongoing litigation between us and Hospira, see Part IV—Note 18, Contingencies and commitments, to the Consolidated Financial Statements.
NEUPOGEN
®
Total NEUPOGEN
®
sales by geographic region were as follows (dollar amounts in millions):
|
Year ended December 31,
|
Year ended December 31,
|
Year ended December 31,
|
|||||||||||||||
|
2016
|
Change
|
2015
|
Change
|
2014
|
|||||||||||||
|
NEUPOGEN
®
— U.S.
|
$
|
534
|
|
(33
|
)%
|
$
|
793
|
|
(5
|
)%
|
$
|
839
|
|
||||
|
NEUPOGEN
®
— ROW
|
231
|
|
(10
|
)%
|
256
|
|
(20
|
)%
|
320
|
|
|||||||
|
Total NEUPOGEN
®
|
$
|
765
|
|
(27
|
)%
|
|
$
|
1,049
|
|
(9
|
)%
|
$
|
1,159
|
|
|||
The decreases in global NEUPOGEN
®
sales for 2016 and 2015 were driven by a decline in unit demand due primarily to the impact of short-acting competition in the United States.
There is competition, which has intensified and will continue to have a material adverse impact on sales of NEUPOGEN
®
. We expect competitive trends to continue into 2017 from existing branded and new and existing biosimilar competition. See Part I, Item 1. Business—Marketing, Distribution and Selected Marketed Products—Competition and Part IV—Note 18, Contingencies and commitments, to the Consolidated Financial Statements for discussion of ongoing litigation.
Future NEUPOGEN
®
sales will also depend, in part, on the development of new protocols, tests and/or treatments for cancer and/or new chemotherapy treatments or alternatives to chemotherapy that may have reduced and may continue to reduce the use of chemotherapy in some patients.
46
Other products
Other product sales by geographic region were as follows (dollar amounts in millions):
|
Year ended December 31,
|
Year ended December 31,
|
Year ended December 31,
|
|||||||||||||||
|
2016
|
Change
|
2015
|
Change
|
2014
|
|||||||||||||
|
KYPROLIS
®
— U.S.
|
$
|
554
|
|
19
|
%
|
$
|
467
|
|
53
|
%
|
$
|
306
|
|
||||
|
KYPROLIS
®
— ROW
|
138
|
|
*
|
|
45
|
|
80
|
%
|
25
|
|
|||||||
|
Vectibix
®
— U.S.
|
229
|
|
12
|
%
|
204
|
|
21
|
%
|
168
|
|
|||||||
|
Vectibix
®
— ROW
|
382
|
|
11
|
%
|
345
|
|
2
|
%
|
337
|
|
|||||||
|
Nplate
®
— U.S.
|
350
|
|
10
|
%
|
317
|
|
22
|
%
|
260
|
|
|||||||
|
Nplate
®
— ROW
|
234
|
|
13
|
%
|
208
|
|
—
|
%
|
209
|
|
|||||||
|
Repatha
®
— U.S.
|
101
|
|
*
|
|
7
|
|
*
|
|
—
|
|
|||||||
|
Repatha
®
— ROW
|
40
|
|
*
|
|
3
|
|
*
|
|
—
|
|
|||||||
|
BLINCYTO
®
— U.S.
|
85
|
|
27
|
%
|
67
|
|
*
|
|
3
|
|
|||||||
|
BLINCYTO
®
— ROW
|
30
|
|
*
|
|
10
|
|
*
|
|
—
|
|
|||||||
|
Other
— U.S.
|
60
|
|
*
|
|
10
|
|
*
|
|
—
|
|
|||||||
|
Other — ROW
|
190
|
|
(2
|
)%
|
194
|
|
(6
|
)%
|
206
|
|
|||||||
|
Total other product sales
|
$
|
2,393
|
|
27
|
%
|
$
|
1,877
|
|
24
|
%
|
$
|
1,514
|
|
||||
|
Total U.S. — other products
|
$
|
1,379
|
|
|
|
$
|
1,072
|
|
|
|
$
|
737
|
|
||||
|
Total ROW — other products
|
1,014
|
|
|
|
805
|
|
|
|
777
|
|
|||||||
|
Total other product sales
|
$
|
2,393
|
|
|
|
$
|
1,877
|
|
|
|
$
|
1,514
|
|
||||
* Change in excess of 100%
Operating expenses
Operating expenses were as follows (dollar amounts in millions):
|
Year ended December 31,
|
Year ended December 31,
|
Year ended December 31,
|
|||||||||||||||
|
2016
|
Change
|
2015
|
Change
|
2014
|
|||||||||||||
|
Operating expenses:
|
|||||||||||||||||
|
Cost of sales
|
$
|
4,162
|
|
(2
|
)%
|
$
|
4,227
|
|
(4
|
)%
|
$
|
4,422
|
|
||||
|
% of product sales
|
19.0
|
%
|
20.2
|
%
|
22.9
|
%
|
|||||||||||
|
% of total revenues
|
18.1
|
%
|
19.5
|
%
|
22.0
|
%
|
|||||||||||
|
Research and development
|
$
|
3,840
|
|
(6
|
)%
|
$
|
4,070
|
|
(5
|
)%
|
$
|
4,297
|
|
||||
|
% of product sales
|
17.5
|
%
|
19.4
|
%
|
22.2
|
%
|
|||||||||||
|
% of total revenues
|
16.7
|
%
|
18.8
|
%
|
21.4
|
%
|
|||||||||||
|
Selling, general and administrative
|
$
|
5,062
|
|
4
|
%
|
$
|
4,846
|
|
3
|
%
|
$
|
4,699
|
|
||||
|
% of product sales
|
23.1
|
%
|
23.1
|
%
|
24.3
|
%
|
|||||||||||
|
% of total revenues
|
22.0
|
%
|
22.4
|
%
|
23.4
|
%
|
|||||||||||
|
Other
|
$
|
133
|
|
*
|
|
$
|
49
|
|
(89
|
)%
|
$
|
454
|
|
||||
* Change in excess of 100%
47
Transformation and process improvement
During 2014, we announced transformation and process improvement initiatives that we continue to execute on. As part of these efforts, we committed to a more agile and efficient operating model. Our transformation and process improvement efforts across the Company are enabling us to reallocate resources to fund many of our innovative pipeline and growth opportunities that deliver value to patients and stockholders.
The transformation includes a restructuring plan that will result in pre-tax accounting charges in the range of
$800 million
to
$900 million
. As of December 31, 2016, restructuring costs incurred to date were $709 million. During the years ended December 31, 2016, 2015 and 2014, we incurred restructuring costs of $37 million, $114 million and $558 million, respectively. We expect that we will incur most of the remaining estimated costs in 2017 in order to support our ongoing transformation and process improvement efforts. Since 2014, we have realized approximately $1.2 billion of transformation and process improvement savings. Net savings were not significant in 2016, 2015 and 2014 as savings were reinvested in product launches, clinical programs and external business development. Additional information required for our restructuring plan is incorporated herein by reference to Part IV—Note 2, Restructuring, to the Consolidated Financial Statements.
Cost of sales
Cost of sales decreased to 18.1% of total revenues for 2016, driven primarily by manufacturing efficiencies.
Cost of sales decreased to 19.5% of total revenues for 2015, driven primarily by lower royalties, higher net selling prices, manufacturing efficiencies and lower costs related to our restructuring plan. The year ended December 31, 2014, also had a $99 million charge related to the termination of the supply contract with Roche as a result of acquiring the licenses to filgrastim and pegfilgrastim effective January 1, 2014.
The excise tax imposed by Puerto Rico on the gross intercompany purchase price of goods and services from our manufacturer in Puerto Rico (Puerto Rico excise tax) is recorded as a cost of sales expense. Excluding the impact of the Puerto Rico excise tax, cost of sales would have been 16.5%, 17.8% and 20.1% of total revenues for
2016
,
2015
and
2014
, respectively. See Part IV—Note 5, Income taxes, to the Consolidated Financial Statements.
Research and development
The Company groups all of its R&D activities and related expenditures into three categories: (1) Discovery Research and Translational Sciences (DRTS), (2) later-stage clinical programs and (3) marketed products. These categories include the Company’s R&D activities as set forth in the following table:
|
Category
|
Description
|
|
|
DRTS
|
R&D expenses incurred in activities substantially in support of early research through the completion of phase 1 clinical trials. These activities encompass our DRTS functions, including drug discovery, toxicology, pharmacokinetics and drug metabolism, and process development.
|
|
|
Later-stage clinical programs
|
R&D expenses incurred in or related to phase 2 and phase 3 clinical programs intended to result in registration of a new product or a new indication for an existing product in the United States or the EU.
|
|
|
Marketed products
|
R&D expenses incurred in support of the Company’s marketed products that are authorized to be sold in the United States or the EU. Includes clinical trials designed to gather information on product safety (certain of which may be required by regulatory authorities) and their product characteristics after regulatory approval has been obtained, as well as the costs of obtaining regulatory approval of a product in a new market after approval in either the United States or the EU has been obtained.
|
|
R&D expense by category was as follows (in millions):
|
Years ended December 31,
|
|||||||||||
|
2016
|
2015
|
2014
|
|||||||||
|
DRTS
|
$
|
1,039
|
|
$
|
997
|
|
$
|
1,212
|
|
||
|
Later-stage clinical programs
|
1,054
|
|
1,876
|
|
2,287
|
|
|||||
|
Marketed products
|
1,747
|
|
1,197
|
|
798
|
|
|||||
|
Total R&D expense
|
$
|
3,840
|
|
$
|
4,070
|
|
$
|
4,297
|
|
||
48
The decreases in R&D expenses for 2016 and 2015 were driven primarily by decreased costs associated with later-stage clinical programs support of $822 million and $411 million, respectively, offset partially by increased costs associated with marketed products support of $550 million and $399 million, respectively. All categories of R&D spend benefited from savings from transformation and process improvement efforts. The decreases were offset partially by reinvestment for the long-term benefit of the company, including increases in DRTS for up-front milestone payments related to several collaboration transactions. Prior to approval, costs related to our launch products were categorized largely as later-stage clinical programs.
Selling, general and administrative
The increase in Selling, general and administrative (SG&A) expense for 2016 was driven primarily by further investments in product launches, offset partially by the expiration of the ENBREL residual royalty payments on October 31, 2016.
The increase in SG&A expense for 2015 was driven primarily by new product launches, offset partially by savings from transformation and process improvement efforts under our restructuring plan.
The ENBREL co-promotion term expired in October 2013, and we were required to pay Pfizer residual royalties on a declining percentage of net ENBREL sales in the United States and Canada. Effective November 2016, there were no further residual royalty payments. The residual royalty percentage ranged from 10% to 12% in 2014, 2015, and 2016.
Other
Other operating expenses for 2016 included $105 million of charges related to legal proceedings.
Other operating expenses for 2015 included $91 million of charges related to legal proceedings, certain charges related to our restructuring initiatives, including separation costs of $49 million, $31 million of write-offs of non-key assets acquired in a prior year business combination, and $111 million of gains from the sale of assets related to our site closures.
Other operating expenses for 2014 included certain charges related to our restructuring plan, primarily separation costs of $377 million. It also included a $46 million write-off of a non-key IPR&D program acquired in a prior year business combination.
Non-operating expenses/income and provision for income taxes
Non-operating expenses/income and provision for income taxes were as follows (dollar amounts in millions):
|
Years ended December 31,
|
|||||||||||
|
2016
|
2015
|
2014
|
|||||||||
|
Interest expense, net
|
$
|
1,260
|
|
$
|
1,095
|
|
$
|
1,071
|
|
||
|
Interest and other income, net
|
$
|
629
|
|
$
|
603
|
|
$
|
465
|
|
||
|
Provision for income taxes
|
$
|
1,441
|
|
$
|
1,039
|
|
$
|
427
|
|
||
|
Effective tax rate
|
15.7
|
%
|
13.0
|
%
|
7.6
|
%
|
|||||
Interest expense, net
The increases in interest expense, net in 2016 and 2015 were due primarily to a higher average amount of debt outstanding compared with the respective prior year.
Interest and other income, net
The increase in interest and other income, net for 2016 compared with 2015 was due primarily to higher interest income as a result of higher average cash and investment balances in 2016, offset partially by higher gains on strategic equity investments in 2015. The increase in interest and other income, net for 2015 compared with 2014 was due primarily to higher interest income as a result of higher average cash and investment balances with a modestly higher portfolio yield, offset partially by higher net losses on sales of interest bearing securities in 2015.
Income taxes
The increase in our effective tax rate for 2016 compared with 2015 was due primarily to the unfavorable tax impact of changes in jurisdictional mix of income and expenses, offset partially by the adoption of a new accounting standard that amends certain aspects of the accounting for employee share-based compensation payments. One aspect of the standard requires that excess tax benefits and deficiencies that arise upon vesting or exercise of share-based payments be recognized as an income tax benefit and expense in the income statement.
49
The increase in our effective tax rate for 2015 compared with 2014 was due primarily to the unfavorable tax impact of changes in the jurisdictional mix of income and expenses and lower domestic restructuring costs in 2015.
The effective tax rates for 2016, 2015 and 2014 would have been approximately 18.6%, 16.4% and 12.8%, respectively, without the impact of the tax credits associated with the Puerto Rico excise tax.
As permitted under GAAP, we do not provide for U.S. income taxes on undistributed earnings of our foreign operations that are intended to be invested indefinitely outside the United States.
See Summary of Critical Accounting Policies—Income taxes and Part IV—Note 5, Income taxes, to the Consolidated Financial Statements.
Financial Condition, Liquidity and Capital Resources
Selected financial data was as follows (in millions):
|
December 31,
|
|||||||
|
2016
|
2015
|
||||||
|
Cash, cash equivalents and marketable securities
|
$
|
38,085
|
|
$
|
31,382
|
|
|
|
Total assets
|
$
|
77,626
|
|
$
|
71,449
|
|
|
|
Current portion of long-term debt
|
$
|
4,403
|
|
$
|
2,247
|
|
|
|
Long-term debt
|
$
|
30,193
|
|
$
|
29,182
|
|
|
|
Stockholders’ equity
|
$
|
29,875
|
|
$
|
28,083
|
|
|
We intend to continue to return capital to stockholders through the payment of cash dividends and stock repurchases reflecting our confidence in the future cash flows of our business. The timing and amount of future dividends and stock repurchases will vary based on a number of factors, including future capital requirements for strategic transactions, the availability of financing on acceptable terms, debt service requirements, our credit rating, changes to applicable tax laws or corporate laws, changes to our business model and periodic determination by our Board of Directors that cash dividends and/or stock repurchases are in the best interests of stockholders and are in compliance with applicable laws and agreements of the Company. In addition, the timing and amount of stock repurchases may also be affected by the stock price and blackout periods, during which we are restricted from repurchasing stock. The manner of stock repurchases may include private block purchases, tender offers and market transactions.
The Board of Directors declared quarterly cash dividends of $0.61 per share of common stock in 2014, increased our quarterly cash dividend by 30% to $0.79 per share of common stock in 2015, and increased our quarterly cash dividend by 27% to $1.00 per share of common stock in 2016. In December 2016, the Board of Directors declared a cash dividend of $1.15 per share of common stock for the first quarter of 2017, an increase of 15% for this period, to be paid in March 2017.
We have also returned capital to stockholders through our stock repurchase program. During 2016 and 2015, we repurchased
$3.0 billion
and $1.9 billion of our common stock, respectively. During the fourth quarter of 2014, we repurchased $153 million of our common stock, of which $138 million was paid in cash by December 31, 2014. As of December 31, 2016,
$4.1 billion
remained available under the stock repurchase program.
We believe that existing funds, cash generated from operations and existing sources of and access to financing are adequate to satisfy our needs for working capital; capital expenditure and debt service requirements; our plans to pay dividends and repurchase stock; and other business initiatives we plan to strategically pursue, including acquisitions and licensing activities. We anticipate that our liquidity needs can be met through a variety of sources, including cash provided by operating activities, sales of marketable securities, borrowings through commercial paper and/or our syndicated credit facilities and access to other domestic and foreign debt markets and equity markets. With respect to our U.S. operations, we believe that existing funds intended for use in the United States; cash generated from our U.S. operations, including intercompany payments and receipts; and existing sources of and access to financing (collectively, U.S. funds) are adequate to continue meeting our U.S. obligations, including our plans to pay dividends and repurchase stock with U.S. funds, for the foreseeable future. See Part I, Item 1A. Risk Factors—Global economic conditions may negatively affect us and may magnify certain risks that affect our business.
Cash, cash equivalents, and marketable securities
Of our cash, cash equivalents and marketable securities totaling
$38.1 billion
as of
December 31, 2016
, approximately $35.9 billion was generated from operations in foreign tax jurisdictions and is intended to be invested indefinitely outside the United States. Under current tax laws, if these funds were repatriated for use in our U.S. operations, we would be required to pay additional income taxes at the tax rates then in effect.
50
The primary objective of our investment portfolio is to enhance overall returns in an efficient manner while maintaining safety of principal, prudent levels of liquidity and acceptable levels of risk. Our investment policy limits interest-bearing security investments to certain types of debt and money market instruments issued by institutions with primarily investment-grade credit ratings and places restrictions on maturities and concentration by asset class and issuer.
Financing arrangements
The current and noncurrent portions of our long-term borrowings at December 31,
2016
, were $
4.4
billion and $
30.2
billion, respectively. The current and noncurrent portions of our long-term borrowings at December 31,
2015
, were $
2.2
billion and $
29.2
billion, respectively. As of December 31, 2016, Standard & Poor’s Financial Services LLC (S&P), Moody’s Investor Service, Inc. (Moody’s) and Fitch Ratings Inc. assigned credit ratings to our outstanding senior notes of A with a stable outlook, Baa1 with a stable outlook and BBB with a stable outlook, respectively, which are considered investment grade. Unfavorable changes to these ratings may have an adverse impact on future financings.
During the years ended December 31,
2016
, 2015 and 2014, we issued debt with aggregate principal amounts of $7.3 billion, $3.5 billion and
$4.5 billion, respectively. During the
years ended December 31,
2016
, 2015 and 2014, we
repaid debt
of $3.7 billion, $2.4 billion and
$5.6 billion, respectively. For information regarding specific issuances and repayments of debt, see
Part IV—
Note 14, Financing arrangements, to the Consolidated Financial Statements.
To achieve a desired mix of fixed and floating interest rate debt, we entered into interest rate swap contracts that effectively converted a fixed-rate interest coupon for certain of our debt issuances to a floating London Interbank Offered Rates (LIBOR)-based coupon over the life of the respective note. These interest rate swap contracts qualified and are designated as fair value hedges. As of December 31, 2016 and 2015, we had interest rate swap contracts with aggregate notional amounts of $6.65 billion. See Part IV—Note 14, Financing arrangements, and Note 17, Derivative instruments, to the Consolidated Financial Statements.
To hedge our exposure to foreign currency exchange rate risk associated with certain of our long-term notes denominated in foreign currencies, we entered into cross-currency swap contracts, which effectively convert the interest payments and principal repayment of the respective notes from euros, pounds sterling and Swiss francs to U.S. dollars. These cross-currency swap contracts qualified and are designated as cash flow hedges. As of
December 31, 2016 and 2015
, we had cross-currency swap contracts with aggregate notional amounts of $5.6 billion and $2.7 billion, respectively. See Part IV—Note 17, Derivative instruments, to the Consolidated Financial Statements.
As of
December 31, 2016
, we had a commercial paper program that allows us to issue up to $2.5 billion of unsecured commercial paper to fund our working capital needs. At
December 31, 2016 and 2015
, we had no amounts outstanding under our commercial paper program, although we anticipate utilizing the commercial paper program in 2017.
In 2014, we entered into a $2.5 billion syndicated, unsecured, revolving credit agreement which is available for general corporate purposes or as a liquidity backstop to our commercial paper program. The commitments under the revolving credit agreement may be increased by up to $500 million with the agreement of the banks. Each bank which is a party to the agreement has an initial commitment term of five years. We extended this term by one year during 2016 and may extend the term for an additional year with the agreement of the banks. Annual commitment fees for this agreement are 0.09% of the unused portion of the facility based on our current credit rating. Generally, we would be charged interest at LIBOR plus 1% for any amounts borrowed under this facility. As of
December 31, 2016 and 2015
, no amounts were outstanding under this facility.
In 2014, we filed a shelf registration statement with the SEC that allows us to issue unspecified amounts of debt securities; common stock; preferred stock; warrants to purchase debt securities, common stock, preferred stock or depositary shares; rights to purchase common stock or preferred stock; securities purchase contracts; securities purchase units; and depositary shares. Under this shelf registration statement, all of the securities available for issuance may be offered from time to time with terms to be determined at the time of issuance. This shelf registration statement expires on February 23, 2017, and is expected to be renewed before its expiration date.
In 1997, we established a $400 million medium-term note program under which medium-term debt securities may be offered from time to time with terms to be determined at the time of issuance. As of
December 31, 2016 and 2015
, no securities were outstanding under this medium-term note program.
Certain of our financing arrangements contain non-financial covenants. In addition, our revolving credit agreement includes a financial covenant with respect to the level of our borrowings in relation to our equity, as defined. We were in compliance with all applicable covenants under this arrangement as of
December 31, 2016
. See Part IV—Note 14, Financing arrangements, to the Consolidated Financial Statements.
51
Cash flows
A summary of our cash flow activity was as follows (in millions):
|
Years ended December 31,
|
|||||||||||
|
2016
|
2015
|
2014
|
|||||||||
|
Net cash provided by operating activities
|
$
|
10,354
|
|
$
|
9,731
|
|
$
|
8,952
|
|
||
|
Net cash used in investing activities
|
$
|
(8,658
|
)
|
$
|
(5,547
|
)
|
$
|
(5,752
|
)
|
||
|
Net cash used in financing activities
|
$
|
(2,599
|
)
|
$
|
(3,771
|
)
|
$
|
(3,274
|
)
|
||
Operating
Cash provided by operating activities has been and is expected to continue to be our primary recurring source of funds. Cash provided by operating activities increased during 2016 due primarily to an improved operating margin and the timing of customer payments, offset partially by inventory build, the monetization of foreign currency forward contracts in 2015 and the timing of tax payments. Cash provided by operating activities increased during 2015 due primarily to improvement in our operating margin and the monetization of foreign currency contracts that resulted in the receipt of $340 million in cash, offset by the timing of payments to vendors and cash received from customers.
Investing
Capital expenditures, which were associated primarily with manufacturing capacity expansions in Singapore, Puerto Rico and Ireland, as well as other site developments, totaled $
738
million, $
594
million and $
718
million in
2016
,
2015
and
2014
, respectively. We currently estimate 2017 spending on capital projects and equipment to be consistent with 2016 spend.
Cash used in investing activities during the years ended December 31, 2015 and 2014, also included the cost of acquiring certain businesses, net of cash acquired, which totaled $
359 million
and $
165 million
, respectively.
Net cash invested in marketable securities was
$7.7 billion
,
$4.4 billion
and
$5.0 billion
in 2016,
2015
and 2014, respectively. In addition, restricted investments provided
$533 million
in 2014.
Financing
Cash used in financing activities during 2016 was due primarily to the repayment of debt of
$3.7 billion
, the payment of dividends of
$3.0 billion
, repurchases of our common stock of $
3.0 billion
and withholding taxes arising from shares withheld for share-based payments of $
260 million
, offset partially by net proceeds from the issuance of debt of
$7.3 billion
. Cash used in financing activities during 2015 was due primarily to the repayment of long-term debt of
$2.4 billion
, the payment of dividends of
$2.4 billion
, repurchases of our common stock of
$1.9 billion
, withholding taxes arising from shares withheld for share-based payments of $
401 million
and the settlement of contingent consideration obligations incurred in connection with the acquisition of a business of
$253 million
. These payments were offset partially by net proceeds from the issuance of long-term debt of
$3.5 billion
. Cash used in financing activities during 2014 was due primarily to the repayment of long-term debt of
$5.6 billion
, the payment of dividends of
$1.9 billion
, withholding taxes arising from shares withheld for share-based payments of
$225 million
and repurchases of our common stock of
$138 million
. These payments were offset partially by net proceeds from the issuance of long-term debt of
$4.5 billion
and net proceeds from the issuance of common stock in connection with the Company’s equity award programs of
$186 million
.
See Part IV—Note 14, Financing arrangements, and Note 15, Stockholders’ equity, to the Consolidated Financial Statements.
Off-Balance Sheet Arrangements
We do not have any off-balance sheet arrangements that are material or reasonably likely to become material to our consolidated financial position or consolidated results of operations.
Contractual Obligations
Contractual obligations represent future cash commitments and liabilities under agreements with third parties, and exclude contingent liabilities for which we cannot reasonably predict future payment. Additionally, the expected timing of payment of the obligations presented below is estimated based on current information. Timing of payments and actual amounts paid may be different depending on the timing of receipt of goods or services or changes to agreed-upon terms or amounts for some obligations.
52
The following table represents our contractual obligations aggregated by type (in millions):
|
|
Payments due by period as of December 31, 2016
|
||||||||||||||||||
|
|
|
Year
|
Years
|
Years
|
Years
|
||||||||||||||
|
Contractual obligations
|
Total
|
1
|
2 and 3
|
4 and 5
|
6 and beyond
|
||||||||||||||
|
Long-term debt obligations
(1) (2) (3) (4)
|
$
|
57,297
|
|
$
|
5,741
|
|
$
|
7,009
|
|
$
|
7,612
|
|
$
|
36,935
|
|
||||
|
Operating lease obligations
(5)
|
787
|
|
156
|
|
284
|
|
231
|
|
116
|
|
|||||||||
|
Purchase obligations
(6)
|
2,914
|
|
1,592
|
|
540
|
|
285
|
|
497
|
|
|||||||||
|
Unrecognized tax benefits (UTBs)
(7)
|
—
|
|
—
|
|
—
|
|
—
|
|
—
|
|
|||||||||
|
Total contractual obligations
|
$
|
60,998
|
|
$
|
7,489
|
|
$
|
7,833
|
|
$
|
8,128
|
|
$
|
37,548
|
|
||||
|
(1)
|
Long-term debt obligations include future interest payments on our fixed rate obligations at the contractual coupon rates. To achieve a desired mix of fixed and floating interest rate debt, we entered into interest rate swap contracts that effectively converted a fixed rate interest coupon for certain of our debt issuances to a floating LIBOR-based coupon over the life of the respective note. We used an interest rate forward curve at
December 31, 2016
, in computing net amounts to be paid or received under our interest rate swap contracts which resulted in an aggregate net decrease in future interest payments of $39 million. See Part IV—Note 14, Financing arrangements,
to the Consolidated Financial Statements.
|
|
(2)
|
Long-term debt obligations include future interest payments on our LIBOR-based variable rate obligations. We used an interest rate forward curve at
December 31, 2016
, in computing the LIBOR-based portion of interest payments on these debt obligations. See Part IV—Note 14, Financing arrangements,
to the Consolidated Financial Statements.
|
|
(3)
|
Long-term debt obligations include contractual interest payments and principal repayment of our foreign-denominated debt obligations. In order to hedge our exposure to foreign currency exchange rate risk associated with certain of our pound sterling and euro denominated long-term debt, we entered into cross-currency swap contracts that effectively convert interest payments and principal repayment on this debt from euros/pounds sterling to U.S. dollars. For purposes of this table, we used the contracted exchange rates in the cross-currency swap contracts to compute the net amounts of future interest payments and principal repayments on this debt. See Part IV—Note 17, Derivative instruments, to the Consolidated Financial Statements.
|
|
(4)
|
Interest payments and the repayment of principal on our 4.375% 2018 euro Notes were translated into U.S. dollars at the foreign currency exchange rate in effect at
December 31, 2016
. See Part IV—Note 14, Financing arrangements, to the Consolidated Financial Statements.
|
|
(5)
|
Operating lease obligations exclude $228 million of future receipts under noncancelable subleases of abandoned facilities.
|
|
(6)
|
Purchase obligations relate primarily to: (i) R&D commitments (including those related to clinical trials) for new and existing products; (ii) capital expenditures; and (iii) open purchase orders for the acquisition of goods and services in the ordinary course of business. Our obligation to pay certain of these amounts may be reduced based on certain future events.
|
|
(7)
|
Liabilities for UTBs (net of foreign tax credits and federal tax benefit of state taxes) and related accrued interest and penalties totaling approximately $2.5 billion at
December 31, 2016
, are not included in the table above because, due to their nature, there is a high degree of uncertainty regarding the timing of future cash outflows and other events that extinguish these liabilities.
|
In addition to amounts in the table above, we are contractually obligated to pay additional amounts, which in the aggregate are significant, upon the achievement of various development, regulatory and commercial milestones for agreements we have entered into with third parties, including contingent consideration incurred in the acquisitions of Dezima Pharma B.V. (Dezima) and Biovex Group Inc. (BioVex). These payments are contingent upon the occurrence of various future events, substantially all of which have a high degree of uncertainty of occurring. These contingent payments have not been included in the table above, and, except with respect to the fair value of the contingent consideration obligations, are not recorded on our Consolidated Balance Sheets. As of
December 31, 2016
, the maximum amount that may be payable in the future for agreements we have entered into with third parties is approximately $7.5 billion, including $1.6 billion of contingent consideration payments in connection with the acquisitions of Dezima and BioVex. See Part IV—Note 16, Fair value measurement to the Consolidated Financial Statements.
Summary of Critical Accounting Policies
The preparation of our consolidated financial statements in conformity with GAAP requires management to make estimates and assumptions that affect the amounts reported in the financial statements and the notes to the financial statements. Some of those judgments can be subjective and complex, and therefore, actual results could differ materially from those estimates under different assumptions or conditions.
53
Product sales and sales deductions
Revenues from sales of our products are recognized when the products are shipped and title and risk of loss have passed. Product sales are recorded net of accruals for estimated rebates, wholesaler chargebacks, cash discounts and other deductions (collectively, sales deductions) and returns, which are established at the time of sale.
We analyze the adequacy of our accruals for sales deductions quarterly. Amounts accrued for sales deductions are adjusted when trends or significant events indicate that adjustment is appropriate. Accruals are also adjusted to reflect actual results. Amounts recorded in Accrued liabilities in the Consolidated Balance Sheets for sales deductions were as follows (in millions):
|
Rebates
|
Chargebacks
|
Other deductions
|
Total
|
||||||||||||
|
Balance as of January 1, 2014
|
$
|
895
|
|
$
|
251
|
|
$
|
102
|
|
$
|
1,248
|
|
|||
|
Amounts charged against product sales
|
2,499
|
|
3,399
|
|
688
|
|
6,586
|
|
|||||||
|
Payments
|
(2,274
|
)
|
(3,454
|
)
|
(727
|
)
|
(6,455
|
)
|
|||||||
|
Balance as of December 31, 2014
|
1,120
|
|
196
|
|
63
|
|
1,379
|
|
|||||||
|
Amounts charged against product sales
|
2,734
|
|
4,275
|
|
732
|
|
7,741
|
|
|||||||
|
Payments
|
(2,735
|
)
|
(4,198
|
)
|
(701
|
)
|
(7,634
|
)
|
|||||||
|
Balance as of December 31, 2015
|
1,119
|
|
273
|
|
94
|
|
1,486
|
|
|||||||
|
Amounts charged against product sales
|
3,479
|
|
5,270
|
|
905
|
|
9,654
|
|
|||||||
|
Payments
|
(3,181
|
)
|
(5,201
|
)
|
(884
|
)
|
(9,266
|
)
|
|||||||
|
Balance as of December 31, 2016
|
$
|
1,417
|
|
$
|
342
|
|
$
|
115
|
|
$
|
1,874
|
|
|||
For the years ended December 31,
2016
,
2015
and
2014
, total sales deductions were 31%, 27% and 25% of gross product sales, respectively. Included in the amounts are immaterial net adjustments related to prior-year sales due to changes in estimates. Such amounts represent less than 1% of the aggregate sales deductions charged against product sales in each of the three years ended
December 31, 2016
.
In the United States, we utilize wholesalers as the principal means of distributing our products to healthcare providers, such as physicians or their clinics, dialysis centers, hospitals and pharmacies. Products we sell in Europe are distributed principally to hospitals and/or wholesalers depending on the distribution practice in each country where the product is sold. We monitor the inventory levels of our products at our wholesalers by using data from our wholesalers and other third parties, and we believe wholesaler inventories have been maintained at appropriate levels (generally two to three weeks) given end-user demand. Accordingly, historical fluctuations in wholesaler inventory levels have not significantly impacted our method of estimating sales deductions and returns.
Accruals for sales deductions are based primarily on estimates of the amounts earned or to be claimed on the related sales. These estimates take into consideration current contractual and statutory requirements, specific known market events and trends, internal and external historical data and forecasted customer buying patterns. Sales deductions are substantially product-specific and, therefore, for any given year, can be impacted by the mix of products sold.
Rebates include primarily amounts paid to payers and providers in the United States, including those paid to state Medicaid programs, and are based on contractual arrangements or statutory requirements which vary by product, by payer and by individual payer plans. As we sell product, we estimate the amount of rebate we will pay based on the product sold, contractual terms, estimated patient population, historical experience and wholesaler inventory levels and accrue these rebates in the period the related sale is recorded. We then adjust the rebate accruals as more information becomes available and to reflect actual claims experience. Estimating such rebates is complicated, in part because of the time delay between the date of sale and the actual settlement of the liability. We believe the methodology we use to accrue for rebates is reasonable and appropriate given current facts and circumstances, but actual results may differ.
Wholesaler chargebacks relate to our contractual agreements to sell products to healthcare providers in the United States at fixed prices that are lower than the prices we charge wholesalers. When healthcare providers purchase our products through wholesalers at these reduced prices, wholesalers charge us for the difference between their purchase price and the contractual price between Amgen and the healthcare providers. The provision for chargebacks is based on the expected sales by our wholesaler customers to healthcare providers. Accruals for wholesaler chargebacks are less difficult to estimate than rebates and closely approximate actual results since chargeback amounts are fixed at the date of purchase by the healthcare providers, and we generally settle the liability for these deductions within a few weeks.
54
Product returns
Returns are estimated through comparison of historical return data to their related sales on a production lot basis. Historical rates of return are determined for each product and are adjusted for known or expected changes in the marketplace specific to each product, when appropriate. In each of the past three years, sales return provisions have amounted to less than 1% of gross product sales. Changes in estimates for prior-year sales return provisions have historically been insignificant.
Income taxes
We provide for income taxes based on pretax income and applicable tax rates available in the various jurisdictions in which we operate.
We recognize the tax benefit from an uncertain tax position only if it is more likely than not that the tax position will be sustained on examination by the taxing authorities based on the technical merits of the position. The tax benefits recognized in the financial statements on a particular tax position are measured based on the largest benefit that is more likely than not to be realized. The amount of UTBs is adjusted as appropriate for changes in facts and circumstances, such as significant amendments to existing tax law, new regulations or interpretations by the taxing authorities, new information obtained during a tax examination, or resolution of an examination. We believe our estimates for uncertain tax positions are appropriate and sufficient for any assessments that may result from examinations of our tax returns. We recognize both accrued interest and penalties, where appropriate, related to UTBs in income tax expense.
Certain items are included in our tax return at different times than they are reflected in the financial statements and cause temporary differences between the tax bases of assets and liabilities and their reported amounts. Such temporary differences create deferred tax assets and liabilities. Deferred tax assets are generally items that can be used as a tax deduction or credit in the tax return in future years but for which we have already recorded the tax benefit in the financial statements. We establish valuation allowances against our deferred tax assets when the amount of expected future taxable income is not likely to support the use of the deduction or credit. Deferred tax liabilities are either: (i) tax expenses recognized in the financial statements for which payment has been deferred; (ii) expenses for which we have already taken a deduction on the tax return, but have not yet recognized the expense in the financial statements; or (iii) liabilities for the difference between the book basis and tax basis of the intangible assets acquired in many business combinations, as future expenses associated with these assets most often will not be tax deductible.
We are a vertically integrated enterprise with operations in the United States and various foreign jurisdictions. We are subject to income tax in the foreign jurisdictions where we conduct activities based on the tax laws and principles of such jurisdictions and the functions, risks and activities performed therein. Our pretax income is therefore attributed to domestic or foreign sources based on the operations performed and risks assumed in each location and the tax laws and principles of the respective taxing jurisdictions. For example, we conduct significant operations in Puerto Rico, a territory of the United States that is treated as a foreign jurisdiction for U.S. tax purposes, pertaining to manufacturing, distribution and other related functions to meet our worldwide product demand. Income from our operations in Puerto Rico is subject to tax incentive grants through 2035.
Our effective tax rate reflects the impact of undistributed foreign earnings for which no U.S. income taxes or foreign withholding taxes have been provided because such earnings are intended to be invested indefinitely outside the United States. Substantially all of this benefit is attributable to our foreign income associated with our operations conducted in Puerto Rico.
If future events, including material changes in cash, working capital and long-term investment requirements necessitate that certain assets associated with these earnings be repatriated to the United States, under current tax laws an additional tax provision and related liability would be required at the applicable income tax rates which could have a material adverse effect on both our future effective tax rate and our financial results.
Our operations are subject to the tax laws, regulations and administrative practices of the United States, U.S. state jurisdictions and other countries in which we do business. Significant changes in these rules could have a material adverse effect on our results of operations. See Part I, Item 1A. Risk Factors —The adoption of new tax legislation or exposure to additional tax liabilities could affect our profitability.
Contingencies
In the ordinary course of business, we are involved in various legal proceedings and other matters such as intellectual property disputes, contractual disputes, governmental investigations and class action suits which are complex in nature and have outcomes that are difficult to predict. (Certain of these proceedings are discussed in Part IV—Note 18, Contingencies and commitments, to the Consolidated Financial Statements.) We record accruals for loss contingencies to the extent that we conclude that it is probable that a liability has been incurred and the amount of the related loss can be reasonably estimated. We consider all relevant factors when making assessments regarding these contingencies.
55
While it is not possible to accurately predict or determine the eventual outcomes of these items, an adverse determination in one or more of these items currently pending could have a material adverse effect on our consolidated results of operations, financial position or cash flows.
Valuation of assets and liabilities in connection with business combinations
We have acquired and continue to acquire intangible assets in connection with business combinations. These intangible assets consist primarily of technology associated with currently marketed human therapeutic products and IPR&D product candidates. Discounted cash flow models are typically used to determine the fair values of these intangible assets for purposes of allocating consideration paid to the net assets acquired in a business combination. These models require the use of significant estimates and assumptions, including, but not limited to:
|
•
|
determining the timing and expected costs to complete in-process projects taking into account the stage of completion at the acquisition date;
|
|
•
|
projecting the probability and timing of obtaining marketing approval from the FDA and other regulatory agencies for product candidates;
|
|
•
|
estimating the timing of and future net cash flows from product sales resulting from completed products and in-process projects; and
|
|
•
|
developing appropriate discount rates to calculate the present values of the cash flows.
|
Significant estimates and assumptions are also required to determine the acquisition date fair values of any contingent consideration obligations incurred in connection with business combinations. In addition, we must revalue these obligations each subsequent reporting period until the related contingencies are resolved and record changes in their fair values in earnings. The acquisition date fair values of various contingent consideration obligations incurred or assumed in the acquisitions of businesses (see Part IV—Note 3, Business combinations, and Note 16, Fair value measurement, to the Consolidated Financial Statements.) were determined using a combination of valuation techniques. Significant estimates and assumptions required for these valuations included, but were not limited to, the probability of achieving regulatory milestones, product sales projections under various scenarios and discount rates used to calculate the present value of the required payments. These estimates and assumptions are required to be updated in order to revalue these contingent consideration obligations each reporting period. Accordingly, subsequent changes in underlying facts and circumstances could result in changes in these estimates and assumptions, which could have a material impact on the estimated future fair values of these obligations.
We believe the fair values used to record intangible assets acquired and contingent consideration obligations incurred in connection with business combinations are based upon reasonable estimates and assumptions given the facts and circumstances as of the related valuation dates.
Impairment of long-lived assets
We review the carrying value of our property, plant and equipment and our finite-lived intangible assets for impairment whenever events or changes in circumstances indicate that the carrying amount of an asset may not be recoverable. If such circumstances exist, an estimate of undiscounted future cash flows to be generated by the long-lived asset is compared to the carrying value to determine whether an impairment exists. If an asset is determined to be impaired, the loss is measured based on the difference between the asset’s fair value and its carrying value.
Indefinite-lived intangible assets, composed of IPR&D projects acquired in a business combination which have not reached technological feasibility or lack regulatory approval at the time of acquisition, are reviewed for impairment annually, whenever events or changes in circumstances indicate that the carrying amount may not be recoverable and upon establishment of technological feasibility or regulatory approval. We determine impairment by comparing the fair value of the asset to its carrying value. If the asset’s carrying value exceeds its fair value, an impairment charge is recorded for the difference and its carrying value is reduced accordingly.
Estimating future cash flows of an IPR&D product candidate for purposes of an impairment analysis requires us to make significant estimates and assumptions regarding the amount and timing of costs to complete the project and the amount, timing and probability of achieving revenues from the completed product similar to how the acquisition date fair value of the project was determined, as described above. There are often major risks and uncertainties associated with IPR&D projects as we are required to obtain regulatory approvals in order to be able to market these products. Such approvals require completing clinical trials that demonstrate a product candidate is safe and effective. Consequently, the eventual realized value of the acquired IPR&D project may vary from its estimated fair value at the date of acquisition, and IPR&D impairment charges may occur in future periods which could have a material adverse effect on our results of operations.
56
We believe our estimations of future cash flows used for assessing impairment of long-lived assets are based on reasonable assumptions given the facts and circumstances as of the related dates of the assessments.
|
Item 7A.
|
QUANTITATIVE AND QUALITATIVE DISCLOSURES ABOUT MARKET RISK
|
We are exposed to market risks that may result from changes in interest rates, foreign currency exchange rates and prices of equity instruments as well as changes in general economic conditions in the countries where we conduct business. To reduce certain of these risks, we enter into various types of foreign currency and interest rate derivative hedging transactions as part of our risk management program. We do not use derivatives for speculative trading purposes.
In the discussion that follows, we have assumed a hypothetical change in interest rates of 100 basis points from those at
December 31, 2016
and
2015
. We have also assumed a hypothetical 20% change in foreign currency exchange rates against the U.S. dollar based on its position relative to other currencies as of
December 31, 2016
and
2015
.
Interest rate sensitive financial instruments
Our portfolio of available-for-sale interest-bearing securities at
December 31, 2016
and
2015
, was composed of: U.S. Treasury securities and other government-related debt securities; corporate debt securities; residential mortgage-backed and other mortgage- and asset-backed securities; money market mutual funds; and other short-term interest-bearing securities, composed principally of commercial paper. The fair values of our investment portfolio of interest-bearing securities were $37.6 billion and $31.0 billion at
December 31, 2016
and
2015
, respectively. Duration is a sensitivity measure that can be used to approximate the change in the value of a security that will result from a 100 basis point change in interest rates. Applying a duration model, a hypothetical 100 basis point increase in interest rates at
December 31, 2016
and
2015
, would have resulted in a reduction in the fair values of these securities of approximately $900 million and $840 million, respectively, on these dates. In addition, a hypothetical 100 basis point decrease in interest rates at
December 31, 2016
and
2015
, would not result in a material effect on income in the respective ensuing year.
As of
December 31, 2016
, we had outstanding debt with a carrying value of $34.6 billion and a fair value of $36.5 billion. As of
December 31, 2015
, we had outstanding debt with a carrying value of $31.4 billion and a fair value of $33.1 billion. Our outstanding debt was composed primarily of debt with fixed interest rates as the carrying values of variable rate debt were $1.5 billion and $2.8 billion at
December 31, 2016
and
2015
, respectively. Changes in interest rates do not affect interest expense on fixed-rate debt. Changes in interest rates would, however, affect the fair values of fixed-rate debt. A hypothetical 100 basis point decrease in interest rates relative to interest rates at
December 31, 2016
and 2015, would have resulted in an increase of approximately $3.0 billion and $2.5 billion, respectively, in the aggregate fair value of our outstanding debt on each of these dates. The analysis for the debt does not consider the impact that hypothetical changes in interest rates would have on the related interest rate swap contracts and cross-currency swap contracts, discussed below.
To achieve a desired mix of fixed and floating interest rate debt, we entered into interest rate swap contracts which qualified and were designated for accounting purposes as fair value hedges, for certain of our fixed-rate debt. These interest rate swap contracts effectively converted a fixed-rate interest coupon to a floating-rate LIBOR-based coupon over the life of the respective note. Interest rate swap contracts with an aggregate notional amount of $6.65 billion were outstanding at
December 31, 2016
and
2015
. A hypothetical 100 basis point increase in interest rates relative to interest rates at
December 31, 2016
and
2015
, would have resulted in reductions in fair values of approximately $240 million and $290 million, respectively, on our interest rate swap contracts on these dates and would not result in a material effect on the related income in the respective ensuing years. The analysis for the interest rate swap contracts does not consider the impact that hypothetical changes in interest rates would have on the related fair values of debt that these interest rate sensitive instruments were designed to offset.
As of
December 31, 2016
and
2015
, we had outstanding cross-currency swap contracts with aggregate notional amounts of $5.6 billion and $2.7 billion, respectively, that hedge certain of our foreign currency denominated debt and related interest payments. These contracts effectively convert interest payments and principal repayment of this debt to U.S. dollars from euros/pounds sterling and are designated for accounting purposes as cash flow hedges. A hypothetical 100 basis point adverse movement in interest rates relative to interest rates at
December 31, 2016
and
2015
, would have resulted in reductions in the fair values of our cross-currency swap contracts of approximately $450 million and $210 million, respectively.
Foreign currency sensitive financial instruments
Our international operations are affected by fluctuations in the value of the U.S. dollar as compared to foreign currencies, predominantly the euro. Increases and decreases in our international product sales from movements in foreign currency exchange rates are offset partially by the corresponding increases or decreases in our international operating expenses. Increases and decreases in our foreign currency denominated assets from movements in foreign currency exchange rates are offset partially by the corresponding increases or decreases in our foreign currency denominated liabilities. To further reduce our net exposure to foreign
57
currency exchange rate fluctuations on our results of operations, we enter into foreign currency forward, option and cross-currency swap contracts.
As of
December 31, 2016
, we had outstanding euro, pound sterling and Swiss franc denominated debt with a carrying value and fair value of $5.5 billion. As of
December 31, 2015
, we had euro and pound sterling denominated debt with a carrying value and fair value of $3.0 billion and $3.3 billion, respectively. A hypothetical 20% adverse movement in foreign currency exchange rates compared with the U.S. dollar relative to exchange rates at
December 31, 2016
, would have resulted in an increase in fair value of this debt of approximately $1.2 billion on this date and a reduction in income in the ensuing year of approximately $1.1 billion. A hypothetical 20% adverse movement in foreign currency exchange rates compared with the U.S. dollar relative to exchange rates at
December 31, 2015
, would have resulted in an increase in fair value of this debt of approximately $660 million on this date and a reduction in income in the ensuing year of approximately $610 million. The impact on income from these hypothetical changes in foreign currency exchange rates would be substantially offset by the impact such changes would have on related cross-currency swap contracts, which are in place for the majority of the foreign currency denominated debt.
We have cross-currency swap contracts that are designated as cash flow hedges of certain of our debt denominated in euros, pounds sterling and Swiss francs with aggregate notional amounts of $5.6 billion and $2.7 billion, as of
December 31, 2016
and
2015
, respectively. A hypothetical 20% adverse movement in foreign currency exchange rates compared with the U.S. dollar relative to exchange rates on these dates, would have resulted in a reduction in the fair values of these contracts of approximately $1.2 billion and $610 million on these dates, respectively. The impact on income in the ensuing years from these contracts of this hypothetical adverse movement in foreign currency exchange rates would be fully offset by the corresponding hypothetical changes in the carrying amounts of the related hedged debt.
We enter into foreign currency forward and options contracts that are designated for accounting purposes as cash flow hedges of certain anticipated foreign currency transactions. As of
December 31, 2016
, we had open foreign currency forward and options contracts, primarily euro-based, with notional amounts of
$3.4 billion
and
$608 million
, respectively. As of
December 31, 2015
, we had open foreign currency forward and options contracts, primarily euro-based, with notional amounts of
$3.3 billion
and
$225 million
, respectively. As of
December 31, 2016
and 2015, the fair values of these contracts were approximately $200 million and $140 million, respectively. With regard to foreign currency forward and option contracts that were open at
December 31, 2016
, a hypothetical 20% adverse movement in foreign currency exchange rates compared with the U.S. dollar relative to exchange rates at
December 31, 2016
, would have resulted in a reduction in fair value of these contracts of approximately $650 million on this date and, in the ensuing year, a reduction in income of approximately $300 million. With regard to contracts that were open at
December 31, 2015
, a hypothetical 20% adverse movement in foreign currency exchange rates compared with the U.S. dollar relative to exchange rates at
December 31, 2015
, would have resulted in a reduction in fair value of these contracts of approximately $650 million on this date and, in the ensuing year, a reduction in income of approximately $320 million. The analysis does not consider the impact that hypothetical changes in foreign currency exchange rates would have on anticipated transactions that these foreign currency sensitive instruments were designed to offset.
As of
December 31, 2016
and
2015
, we had open foreign currency forward contracts with notional amounts totaling
$666 million
and
$911 million
, respectively, that hedged fluctuations of certain assets and liabilities denominated in foreign currencies but were not designated as hedges for accounting purposes. These contracts had no material net unrealized gains or losses at
December 31, 2016
and
2015
. With regard to these foreign currency forward contracts that were open at
December 31, 2016
and
2015
, a hypothetical 20% adverse movement in foreign currency exchange rates compared with the U.S. dollar relative to exchange rates on these dates would not have a material effect on the fair values of these contracts or related income in the respective ensuing years. The analysis does not consider the impact that hypothetical changes in foreign currency exchange rates would have on assets and liabilities that these foreign currency sensitive instruments were designed to offset.
Market price sensitive financial instruments
As of
December 31, 2016
and
2015
, we were also exposed to price risk on equity securities included in our portfolio of investments, which were acquired primarily for the promotion of business and strategic objectives. These investments are generally in small capitalization stocks in the biotechnology industry sector. Price risk relative to our equity investment portfolio as of
December 31, 2016
and
2015
, was not material.
Counterparty credit risks
Our financial instruments, including derivatives, are subject to counterparty credit risk which we consider as part of the overall fair value measurement. Our financial risk management policy limits derivative transactions by requiring transactions to be with institutions with minimum credit ratings of A- or equivalent by S&P and Moody’s and requires placing exposure limits on the amount with any individual counterparty. In addition, we have an investment policy that limits investments to certain types of debt and money market instruments issued by institutions primarily with investment-grade credit ratings and places restriction on maturities and concentrations by asset class and issuer.
58
|
Item 8.
|
FINANCIAL STATEMENTS AND SUPPLEMENTARY DATA
|
The information required by this item is incorporated herein by reference to the financial statements and schedule listed in Item 15(a)1 and (a)2 of Part IV and included in this Annual Report on Form 10-K.
|
Item 9.
|
CHANGES IN AND DISAGREEMENTS WITH ACCOUNTANTS ON ACCOUNTING AND FINANCIAL DISCLOSURES
|
None.
|
Item 9A.
|
CONTROLS AND PROCEDURES
|
We maintain “disclosure controls and procedures,” as such term is defined under Exchange Act Rule 13a-15(e), that are designed to ensure that information required to be disclosed in Amgen’s Exchange Act reports is recorded, processed, summarized and reported within the time periods specified in the SEC’s rules and forms, and that such information is accumulated and communicated to Amgen’s management, including its Chief Executive Officer and Chief Financial Officer, as appropriate, to allow timely decisions regarding required disclosures. In designing and evaluating the disclosure controls and procedures, Amgen’s management recognized that any controls and procedures, no matter how well designed and operated, can provide only reasonable assurance of achieving the desired control objectives and in reaching a reasonable level of assurance Amgen’s management necessarily was required to apply its judgment in evaluating the cost-benefit relationship of possible controls and procedures. We have carried out an evaluation under the supervision and with the participation of our management, including Amgen’s Chief Executive Officer and Chief Financial Officer, of the effectiveness of the design and operation of Amgen’s disclosure controls and procedures. Based upon their evaluation and subject to the foregoing, the Chief Executive Officer and Chief Financial Officer concluded that our disclosure controls and procedures were effective as of
December 31, 2016
.
Management determined that, as of
December 31, 2016
, there were no changes in our internal control over financial reporting that occurred during the fiscal quarter then ended that have materially affected, or are reasonably likely to materially affect, our internal control over financial reporting.
Management’s Report on Internal Control over Financial Reporting
Management of the Company is responsible for establishing and maintaining adequate internal control over financial reporting, as such term is defined in Rule 13a-15(f) under the Securities Exchange Act of 1934. The Company’s internal control over financial reporting is designed to provide reasonable assurance regarding the reliability of financial reporting and the preparation of financial statements for external purposes in accordance with generally accepted accounting principles in the United States. However, all internal control systems, no matter how well designed, have inherent limitations. Therefore, even those systems determined to be effective can provide only reasonable assurance with respect to financial statement preparation and reporting.
Management assessed the effectiveness of the Company’s internal control over financial reporting as of
December 31, 2016
. In making this assessment, management used the criteria set forth by the Committee of Sponsoring Organizations of the Treadway Commission (COSO) in Internal Control-Integrated Framework (2013 framework). Based on our assessment, management believes that the Company maintained effective internal control over financial reporting as of
December 31, 2016
, based on the COSO criteria.
The effectiveness of the Company’s internal control over financial reporting has been audited by Ernst & Young LLP, an independent registered public accounting firm, as stated in their attestation report appearing below, which expresses an unqualified opinion on the effectiveness of the Company’s internal control over financial reporting as of
December 31, 2016
.
59
Report of Independent Registered Public Accounting Firm
The Board of Directors and Stockholders of Amgen Inc.
We have audited Amgen Inc.’s (the “Company”) internal control over financial reporting as of
December 31, 2016
, based on criteria established in Internal Control — Integrated Framework issued by the Committee of Sponsoring Organizations of the Treadway Commission (2013 framework) (the “COSO criteria”). Amgen Inc.’s management is responsible for maintaining effective internal control over financial reporting, and for its assessment of the effectiveness of internal control over financial reporting included in the accompanying Management’s Report on Internal Control over Financial Reporting. Our responsibility is to express an opinion on the Company’s internal control over financial reporting based on our audit.
We conducted our audit in accordance with the standards of the Public Company Accounting Oversight Board (United States). Those standards require that we plan and perform the audit to obtain reasonable assurance about whether effective internal control over financial reporting was maintained in all material respects. Our audit included obtaining an understanding of internal control over financial reporting, assessing the risk that a material weakness exists, testing and evaluating the design and operating effectiveness of internal control based on the assessed risk, and performing such other procedures as we considered necessary in the circumstances. We believe that our audit provides a reasonable basis for our opinion.
A company’s internal control over financial reporting is a process designed to provide reasonable assurance regarding the reliability of financial reporting and the preparation of financial statements for external purposes in accordance with generally accepted accounting principles. A company’s internal control over financial reporting includes those policies and procedures that (1) pertain to the maintenance of records that, in reasonable detail, accurately and fairly reflect the transactions and dispositions of the assets of the company; (2) provide reasonable assurance that transactions are recorded as necessary to permit preparation of financial statements in accordance with generally accepted accounting principles, and that receipts and expenditures of the company are being made only in accordance with authorizations of management and directors of the company; and (3) provide reasonable assurance regarding prevention or timely detection of unauthorized acquisition, use or disposition of the company’s assets that could have a material effect on the financial statements.
Because of its inherent limitations, internal control over financial reporting may not prevent or detect misstatements. Also, projections of any evaluation of effectiveness to future periods are subject to the risk that controls may become inadequate because of changes in conditions, or that the degree of compliance with the policies or procedures may deteriorate.
In our opinion, Amgen Inc. maintained, in all material respects, effective internal control over financial reporting as of
December 31, 2016
, based on the COSO criteria.
We also have audited, in accordance with the standards of the Public Company Accounting Oversight Board (United States), the Consolidated Balance Sheets as of December 31, 2016 and 2015, and the related Consolidated Statements of Income, Comprehensive Income, Stockholders’ Equity and Cash Flows for each of the three years in the period ended December 31, 2016 of Amgen Inc. and our report dated
February 14, 2017
, expressed an unqualified opinion thereon.
/s/ Ernst & Young LLP
Los Angeles, California
February 14, 2017
|
Item 9B.
|
OTHER INFORMATION
|
Not applicable.
60
|
Item 10.
|
DIRECTORS, EXECUTIVE OFFICERS AND CORPORATE GOVERNANCE
|
Information about our Directors is incorporated by reference from the section entitled ITEM 1—ELECTION OF DIRECTORS in our Proxy Statement for the
2017
Annual Meeting of Stockholders to be filed with the SEC within 120 days of
December 31, 2016
(the Proxy Statement). Information about compliance with Section 16(a) of the Securities Exchange Act of 1934 is incorporated by reference from the section entitled OTHER MATTERS—Section 16(a) Beneficial Ownership Reporting Compliance in our Proxy Statement. Information about the procedures by which stockholders may recommend nominees for the Board of Directors is incorporated by reference from APPENDIX A—AMGEN INC. BOARD OF DIRECTORS GUIDELINES FOR DIRECTOR QUALIFICATIONS AND EVALUATIONS and OTHER MATTERS—Stockholder Proposals for the 2018 Annual Meeting in our Proxy Statement. Information about our Audit Committee, members of the committee and our Audit Committee financial experts is incorporated by reference from the section entitled CORPORATE GOVERNANCE—Board Committees and Charters—Audit Committee in our Proxy Statement. Information about our executive officers is contained in the discussion entitled Item 1. Business—Executive Officers of the Registrant.
Code of Ethics
We maintain a code of ethics applicable to our principal executive officer, principal financial officer, principal accounting officer or controller, and other persons performing similar functions. To view this code of ethics free of charge, please visit our website at www.amgen.com. This website address is not intended to function as a hyperlink, and the information contained in our website is not intended to be a part of this filing. We intend to satisfy the disclosure requirements under Item 5.05 of Form 8-K regarding an amendment to, or waiver from, a provision of this code of ethics, if any, by posting such information on our website as set forth above.
|
Item 11.
|
EXECUTIVE COMPENSATION
|
Information about director and executive compensation is incorporated by reference from the section entitled EXECUTIVE COMPENSATION in our Proxy Statement. Information about compensation committee matters is incorporated by reference from the sections entitled CORPORATE GOVERNANCE—Board Committees and Charters—Compensation and Management Development Committee and CORPORATE GOVERNANCE—Compensation Committee Report in our Proxy Statement.
61
|
Item 12.
|
SECURITY OWNERSHIP OF CERTAIN BENEFICIAL OWNERS AND MANAGEMENT AND RELATED STOCKHOLDER MATTERS
|
Securities Authorized for Issuance Under Existing Equity Compensation Plans
The following table sets forth certain information as of
December 31, 2016
, concerning the shares of our Common Stock that may be issued under any form of award granted under our equity compensation plans in effect as of
December 31, 2016
, (including upon the exercise of options, the vesting of awards of restricted stock units, or RSUs, or when performance units are earned, and related dividend equivalents have been granted).
|
|
(a)
|
(b)
|
(c)
|
|||||||
|
Plan Category
|
Number of Securities to be Issued Upon Exercise of Outstanding Options and Rights
|
Weighted Average Exercise Price Outstanding Options and Rights
|
Number of Securities Remaining Available for Future Issuance Under Equity Compensation Plans (Excluding Securities Reflected in Column (a))
|
|||||||
|
Equity compensation plans approved by Amgen security holders:
|
||||||||||
|
Amended and Restated 2009 Equity Incentive Plan
(1)
|
10,161,872
|
|
$
|
100.21
|
|
41,053,578
|
|
|||
|
Amended and Restated 1991 Equity Incentive Plan
(2)
|
26,691
|
|
$
|
—
|
|
—
|
|
|||
|
Amended and Restated Employee Stock Purchase Plan
|
—
|
|
—
|
|
4,899,973
|
|
||||
|
Total Approved Plans
|
10,188,563
|
|
$
|
100.21
|
|
45,953,551
|
|
|||
|
Equity compensation plan not approved by Amgen security holders:
|
||||||||||
|
Amgen Profit Sharing Plan for Employees in Ireland
(3)
|
—
|
|
—
|
|
121,250
|
|
||||
|
Total Unapproved Plans
|
—
|
|
$
|
—
|
|
121,250
|
|
|||
|
Total All Plans
|
10,188,563
|
|
$
|
100.21
|
|
46,074,801
|
|
|||
|
(1)
|
The Amended and Restated 2009 Equity Incentive Plan employs a fungible share counting formula for determining the number of shares available for issuance under the plan. In accordance with this formula, each option or stock appreciation right counts as one share, while each restricted stock unit, performance unit or dividend equivalent counts as 1.9 shares. The number under column (a) represents the actual number of shares issuable under our outstanding awards without giving effect to the fungible share counting formula. The number under column (c) represents the number of shares available for issuance under this plan based on each such available share counting as one share. Commencing with the grants made in April 2012, RSUs and performance units accrue dividend equivalents that are payable in shares only to the extent and when the underlying RSUs vest or underlying performance units have been earned and the related shares are issued to the grantee. The performance units granted under this plan are earned based on the accomplishment of specified performance goals at the end of their respective three-year performance periods; the number of performance units granted represent target performance and the maximum number of units that could be earned based on our performance is 150% of the performance units granted prior to 2016 and 200% of performance units granted in 2016.
|
As of December 31, 2016, the number of outstanding awards under column (a) includes: (i) 3,137,900 shares issuable upon the exercise of outstanding options with a weighted-average exercise price of approximately $100.21; (ii) 4,161,174 shares issuable upon the vesting of outstanding RSUs (including 197,371 related dividend equivalents); and (iii)
2,862,798
shares subject to outstanding 2014, 2015 and 2016 performance units (including 126,398 related dividend equivalents). The weighted-average exercise price shown in column (b) is for the outstanding options only. The number of available shares under column (c) represents the number of shares that remain available for future issuance under this plan as of December 31, 2016, employing the fungible share formula and presumes the issuance of target shares under the performance units granted in 2014, 2015 and 2016 and related dividend equivalents. The numbers under columns (a) and (c) do not give effect to the additional shares that could be issuable in the event above target on the performance goals under these outstanding performance units are achieved. Maximum performance under these goals could result in 150% of target shares being awarded for performance units granted in 2014 and 2015 and 200% of target shares being awarded for performance units granted in 2016.
62
|
(2)
|
This plan has terminated as to future grants. The number under column (a) with respect to this plan includes 26,691 shares issuable upon the vesting of outstanding RSUs (including 4,236 related dividend equivalents).
|
|
(3)
|
The Amgen Profit Sharing Plan for Employees in Ireland (the Profit Sharing Plan) was approved by the Board of Directors on July 28, 2011. The Profit Sharing Plan permits eligible employees of the Company’s subsidiaries located in Ireland, which participate in the Profit Sharing Plan, to apply a portion of their qualifying bonus and salary to the purchase the Company’s Common Stock on the open market at the market price by a third-party trustee as described in the Profit Sharing Plan.
|
Security Ownership of Directors and Executive Officers and Certain Beneficial Owners
Information about security ownership of certain beneficial owners and management is incorporated by reference from the sections entitled SECURITY OWNERSHIP OF DIRECTORS AND EXECUTIVE OFFICERS and SECURITY OWNERSHIP OF CERTAIN BENEFICIAL OWNERS in our Proxy Statement.
|
Item 13.
|
CERTAIN RELATIONSHIPS AND RELATED TRANSACTIONS AND DIRECTOR INDEPENDENCE
|
Information about certain relationships and related transactions and director independence is incorporated by reference from the sections entitled CERTAIN RELATIONSHIPS AND RELATED TRANSACTIONS and CORPORATE GOVERNANCE—Director Independence in our Proxy Statement.
|
Item 14.
|
PRINCIPAL ACCOUNTING FEES AND SERVICES
|
Information about the fees for professional services rendered by our independent registered public accountants is incorporated by reference from the section entitled AUDIT MATTERS—Independent Registered Public Accountants in our Proxy Statement.
63
|
Item 15.
|
EXHIBITS, FINANCIAL STATEMENT SCHEDULES
|
|
(a)1.
|
Index to Financial Statements
|
The following Consolidated Financial Statements are included herein:
|
|
Page
number
|
|
Report of Independent Registered Public Accounting Firm
|
|
|
Consolidated Statements of Income for each of the three years in the period ended December 31, 2016
|
|
|
Consolidated Statements of Comprehensive Income for each of the three years in the period ended December 31, 2016
|
|
|
Consolidated Balance Sheets at December 31, 2016 and 2015
|
|
|
Consolidated Statements of Stockholders’ Equity for each of the three years in the period ended December 31, 2016
|
|
|
Consolidated Statements of Cash Flows for each of the three years in the period ended December 31, 2016
|
|
|
Notes to Consolidated Financial Statements
|
|
|
(a)2.
|
Index to Financial Statement Schedules
|
The following Schedule is filed as part of this Annual Report on Form 10-K:
|
|
Page
number
|
|
II. Valuation and Qualifying Accounts
|
|
All other schedules are omitted because they are not applicable, not required or because the required information is included in the consolidated financial statements or notes thereto.
|
(a)3.
|
Exhibits
|
|
Exhibit No.
|
Description
|
|
|
3.1
|
Restated Certificate of Incorporation of Amgen Inc. (As Restated March 6, 2013.) (Filed as an exhibit to Form 10-Q for the quarter ended March 31, 2013 on May 3, 2013 and incorporated herein by reference.)
|
|
|
3.2
|
Amended and Restated Bylaws of Amgen Inc. (As Amended and Restated February 15, 2016.) (Filed as an exhibit to Form 8-K on February 17, 2016 and incorporated herein by reference.)
|
|
|
4.1
|
Form of stock certificate for the common stock, par value $.0001 of the Company. (Filed as an exhibit to Form 10-Q for the quarter ended March 31, 1997 on May 13, 1997 and incorporated herein by reference.)
|
|
|
4.2
|
Form of Indenture, dated January 1, 1992. (Filed as an exhibit to Form S-3 Registration Statement filed on December 19, 1991 and incorporated herein by reference.)
|
|
|
4.3
|
Agreement of Resignation, Appointment and Acceptance dated February 15, 2008. (Filed as an exhibit to Form 10-K for the year ended December 31, 2007 on February 28, 2008 and incorporated herein by reference.)
|
|
|
4.4
|
First Supplemental Indenture, dated February 26, 1997. (Filed as an exhibit to Form 8-K on March 14, 1997 and incorporated herein by reference.)
|
|
|
4.5
|
8-1/8% Debentures due April 1, 2097. (Filed as an exhibit to Form 8-K on April 8, 1997 and incorporated herein by reference.)
|
|
|
4.6
|
Officer’s Certificate of Amgen Inc., dated January 1, 1992, as supplemented by the First Supplemental Indenture, dated February 26, 1997, establishing a series of securities entitled “8 1/8% Debentures due April 1, 2097.” (Filed as an exhibit to Form 8-K on April 8, 1997 and incorporated herein by reference.)
|
|
64
|
4.7
|
Indenture, dated August 4, 2003. (Filed as an exhibit to Form S-3 Registration Statement on August 4, 2003 and incorporated herein by reference.)
|
|
|
4.8
|
Corporate Commercial Paper - Master Note between and among Amgen Inc., as Issuer, Cede & Co., as Nominee of The Depository Trust Company, and Citibank, N.A., as Paying Agent. (Filed as an exhibit to Form 10-Q for the quarter ended March 31, 1998 on May 13, 1998 and incorporated herein by reference.)
|
|
|
4.9
|
Officers’ Certificate of Amgen Inc., dated May 30, 2007, including forms of the Company’s Senior Floating Rate Notes due 2008, 5.85% Senior Notes due 2017 and 6.375% Senior Notes due 2037. (Filed as an exhibit to Form 8-K on May 30, 2007 and incorporated herein by reference.)
|
|
|
4.10
|
Officers’ Certificate of Amgen Inc., dated May 23, 2008, including forms of the Company’s 6.15% Senior Notes due 2018 and 6.90% Senior Notes due 2038. (Filed as exhibit to Form 8-K on May 23, 2008 and incorporated herein by reference.)
|
|
|
4.11
|
Officers’ Certificate of Amgen Inc., dated January 16, 2009, including forms of the Company’s 5.70% Senior Notes due 2019 and 6.40% Senior Notes due 2039. (Filed as exhibit to Form 8-K on January 16, 2009 and incorporated herein by reference.)
|
|
|
4.12
|
Officers’ Certificate of Amgen Inc., dated March 12, 2010, including forms of the Company’s 4.50% Senior Notes due 2020 and 5.75% Senior Notes due 2040. (Filed as exhibit to Form 8-K on March 12, 2010 and incorporated herein by reference.)
|
|
|
4.13
|
Officers’ Certificate of Amgen Inc., dated September 16, 2010, including forms of the Company’s 3.45% Senior Notes due 2020 and 4.95% Senior Notes due 2041. (Filed as an exhibit to Form 8-K on September 17, 2010 and incorporated herein by reference.)
|
|
|
4.14
|
Officers’ Certificate of Amgen Inc., dated June 30, 2011, including forms of the Company’s 2.30% Senior Notes due 2016, 4.10% Senior Notes due 2021 and 5.65% Senior Notes due 2042. (Filed as an exhibit to Form 8-K on June 30, 2011 and incorporated herein by reference.)
|
|
|
4.15
|
Officers’ Certificate of Amgen Inc., dated November 10, 2011, including forms of the Company’s 1.875% Senior Notes due 2014, 2.50% Senior Notes due 2016, 3.875% Senior Notes due 2021 and 5.15% Senior Notes due 2041. (Filed as an exhibit to Form 8-K on November 10, 2011 and incorporated herein by reference.)
|
|
|
4.16
|
Officers’ Certificate of Amgen Inc., dated December 5, 2011, including forms of the Company’s 4.375% Senior Notes due 2018 and 5.50% Senior Notes due 2026. (Filed as an exhibit to Form 8-K on December 5, 2011 and incorporated herein by reference.)
|
|
|
4.17
|
Officers’ Certificate of Amgen Inc., dated May 15, 2012, including forms of the Company’s 2.125% Senior Notes due 2017, 3.625% Senior Notes due 2022 and 5.375% Senior Notes due 2043. (Filed as an exhibit to Form 8-K on May 15, 2012 and incorporated herein by reference.)
|
|
|
4.18
|
Officers’ Certificate of Amgen Inc., dated September 13, 2012, including forms of the Company’s 2.125% Senior Notes due 2019 and 4.000% Senior Notes due 2029. (Filed as an exhibit to Form 8-K on September 13, 2012 and incorporated herein by reference.)
|
|
|
4.19
|
Indenture, dated May 22, 2014, between Amgen Inc. and The Bank of New York Mellon Trust Company, N.A., as Trustee. (Filed as an exhibit to Form 8-K on May 22, 2014 and incorporated herein by reference.)
|
|
|
4.20
|
Officers’ Certificate of Amgen Inc., dated May 22, 2014, including forms of the Company’s Senior Floating Rate Notes due 2017, Senior Floating Rate Notes due 2019, 1.250% Senior Notes due 2017, 2.200% Senior Notes due 2019 and 3.625% Senior Notes due 2024. (Filed as an exhibit to Form 8-K on May 22, 2014 and incorporated herein by reference.)
|
|
|
4.21
|
Officer’s Certificate of Amgen Inc., dated May 1, 2015, including forms of the Company’s 2.125% Senior Notes due 2020, 2.700% Senior Notes due 2022, 3.125% Senior Notes due 2025 and 4.400% Senior Notes due 2045. (Filed as an exhibit on Form 8-K on May 1, 2015 and incorporated herein by reference.)
|
|
|
4.22
|
Officer’s Certificate of Amgen Inc., dated as of February 25, 2016, including forms of the Company’s 1.250% Senior Notes due 2022 and 2.000% Senior Notes due 2026. (Filed as an exhibit on Form 8-K on February 26, 2016 and incorporated herein by reference.)
|
|
|
4.23
|
Form of Permanent Global Certificate for the Company’s 0.410% bonds due 2023. (Filed as an exhibit on Form 8-K on March 8, 2016 and incorporated herein by reference.)
|
|
|
4.24
|
Terms of the Bonds for the Company’s 0.410% bonds due 2023. (Filed as an exhibit on Form 8-K on March 8, 2016 and incorporated herein by reference.)
|
|
65
|
4.25
|
Officer’s Certificate of Amgen Inc., dated as of June 14, 2016, including forms of the Company’s 4.563% Senior Notes due 2048 and 4.663% Senior Notes due 2051. (Filed as an exhibit to Form 8-K on June 14, 2016 and incorporated herein by reference.)
|
|
|
4.26
|
Registration Rights Agreement, dated as of June 14, 2016, by and among Amgen Inc., Credit Suisse Securities (USA) LLC, J.P. Morgan Securities LLC, Citigroup Global Markets Inc. and Mizuho Securities USA Inc., as lead dealer managers, and Drexel Hamilton, LLC and The Williams Capital Group, L.P., as co-dealer managers. (Filed as an exhibit to Form 8-K on June 14, 2016 and incorporated herein by reference.)
|
|
|
4.27
|
Officer’s Certificate of Amgen Inc., dated as of August 19, 2016, including forms of the Company’s 1.850% Senior Notes due 2021, 2.250% Senior Notes due 2023 and 2.600% Senior Notes due 2026. (Filed as an exhibit to Form 8-K on August 19, 2016 and incorporated herein by reference.)
|
|
|
10.1+
|
Amgen Inc. Amended and Restated 2009 Equity Incentive Plan. (Filed as Appendix C to the Definitive Proxy Statement on Schedule 14A on April 8, 2013 and incorporated herein by reference.)
|
|
|
10.2+
|
First Amendment to Amgen Inc. Amended and Restated 2009 Equity Incentive Plan, effective March 4, 2015. (Filed as an exhibit to Form 10-Q for the quarter ended March 31, 2015 on April 27, 2015 and incorporated herein by reference.)
|
|
|
10.3+
|
Second Amendment to Amgen Inc. Amended and Restated 2009 Equity Incentive Plan, effective March 2, 2016. (Filed as an exhibit to Form 10-Q for the quarter ended March 31, 2016 on May 2, 2016 and incorporated herein by reference.)
|
|
|
10.4+*
|
Form of Stock Option Agreement for the Amgen Inc. Amended and Restated 2009 Equity Incentive Plan. (As Amended on December 20, 2016.)
|
|
|
10.5+*
|
Form of Restricted Stock Unit Agreement for the Amgen Inc. Amended and Restated 2009 Equity Incentive Plan. (As Amended on December 20, 2016.)
|
|
|
10.6+
|
Amgen Inc. 2009 Performance Award Program. (As Amended on March 2, 2016.) (Filed as an exhibit to Form 10-Q for the quarter ended March 31, 2016 on May 2, 2016 and incorporated herein by reference.)
|
|
|
10.7+*
|
Form of Performance Unit Agreement for the Amgen Inc. 2009 Performance Award Program. (As Amended on December 20, 2016.)
|
|
|
10.8+
|
Amgen Inc. 2009 Director Equity Incentive Program. (As Amended on March 6, 2013.) (Filed as an exhibit to Form 10-Q for the quarter ended March 31, 2013 on May 3, 2013 and incorporated herein by reference.)
|
|
|
10.9+
|
Form of Grant of Non-Qualified Stock Option Agreement for the Amgen Inc. 2009 Director Equity Incentive Program. (Filed as an exhibit to Form 8-K on May 8, 2009 and incorporated herein by reference.)
|
|
|
10.10+
|
Form of Restricted Stock Unit Agreement for the Amgen Inc. 2009 Director Equity Incentive Program. (As Amended on March 6, 2013.) (Filed as an exhibit to Form 10-Q for the quarter ended March 31, 2013 on May 3, 2013 and incorporated herein by reference.)
|
|
|
10.11+
|
Amgen Inc. Supplemental Retirement Plan. (As Amended and Restated effective October 16, 2013.) (Filed as an exhibit to Form 10-K for the year ended December 31, 2013 on February 24, 2014 and incorporated herein by reference.)
|
|
|
10.12+
|
First Amendment to the Amgen Inc. Supplemental Retirement Plan, effective October 14, 2016. (Filed as an exhibit to Form 10-Q for the quarter ended September 30, 2016 on October 28, 2016 and incorporated herein by reference.)
|
|
|
10.13+
|
Amended and Restated Amgen Change of Control Severance Plan. (As Amended and Restated effective December 9, 2010 and subsequently amended effective March 2, 2011.) (Filed as an exhibit to Form 10-Q for the quarter ended March 31, 2011 on May 10, 2011 and incorporated herein by reference.)
|
|
|
10.14+
|
Amgen Inc. Executive Incentive Plan. (As Amended and Restated effective January 1, 2009.) (Filed as an exhibit to Form 10-Q for the quarter ended September 30, 2008 on November 7, 2008 and incorporated herein by reference.)
|
|
|
10.15+
|
First Amendment to the Amgen Inc. Executive Incentive Plan, effective December 13, 2012. (Filed as an exhibit to Form 10-K for the year ended December 31, 2012 on February 27, 2013 and incorporated herein by reference.)
|
|
|
10.16+
|
Amgen Nonqualified Deferred Compensation Plan. (As Amended and Restated effective October 16, 2013.) (Filed as an exhibit to Form 10-K for the year ended December 31, 2013 on February 24, 2014 and incorporated herein by reference.)
|
|
66
|
10.17+
|
First Amendment to the Amgen Nonqualified Deferred Compensation Plan, effective October 14, 2016. (Filed as an exhibit to Form 10-Q for the quarter ended September 30, 2016 on October 28, 2016 and incorporated herein by reference.)
|
|
|
10.18+
|
Agreement between Amgen Inc. and David W. Meline, effective July 21, 2014. (Filed as an exhibit to Form 10-Q for the quarter ended September 30, 2014 on October 29, 2014 and incorporated herein by reference.)
|
|
|
10.19+
|
Agreement between Amgen Inc. and Jonathan Graham, dated May 11, 2015. (Filed as an exhibit to Form 10-Q/A for the quarter ended June 30, 2015 on August 6, 2015 and incorporated herein by reference.)
|
|
|
10.20+*
|
Agreement between Amgen Inc. and Lori Johnston dated October 25, 2016.
|
|
|
10.21
|
Shareholders’ Agreement, dated May 11, 1984, among Amgen, Kirin Brewery Company, Limited and Kirin-Amgen, Inc. (Filed as an exhibit to Form 10-K for the year ended December 31, 2000 on March 7, 2001 and incorporated herein by reference.)
|
|
|
10.22
|
Amendment No. 1 dated March 19, 1985, Amendment No. 2 dated July 29, 1985 (effective July 1, 1985), and Amendment No. 3, dated December 19, 1985, to the Shareholders’ Agreement dated May 11, 1984. (Filed as an exhibit to Form 10-Q for the quarter ended June 30, 2000 on August 1, 2000 and incorporated herein by reference.)
|
|
|
10.23
|
Amendment No. 4 dated October 16, 1986 (effective July 1, 1986), Amendment No. 5 dated December 6, 1986 (effective July 1, 1986), Amendment No. 6 dated June 1, 1987, Amendment No. 7 dated July 17, 1987 (effective April 1, 1987), Amendment No. 8 dated May 28, 1993 (effective November 13, 1990), Amendment No. 9 dated December 9, 1994 (effective June 14, 1994), Amendment No. 10 effective March 1, 1996, and Amendment No. 11 effective March 20, 2000 to the Shareholders’ Agreement, dated May 11, 1984. (Filed as exhibits to Form 10-K for the year ended December 31, 2000 on March 7, 2001 and incorporated herein by reference.)
|
|
|
10.24
|
Amendment No. 12 to the Shareholders’ Agreement, dated January 31, 2001. (Filed as an exhibit to Form 10-Q for the quarter ended June 30, 2005 on August 8, 2005 and incorporated herein by reference.)
|
|
|
10.25
|
Amendment No. 13 to the Shareholders’ Agreement, dated June 28, 2007 (portions of the exhibit have been omitted pursuant to a request for confidential treatment). (Filed as an exhibit to Form 10-Q for the quarter ended June 30, 2007 on August 9, 2007 and incorporated herein by reference.)
|
|
|
10.26
|
Amendment No. 14 to the Shareholders’ Agreement, dated March 26, 2014. (Filed as an exhibit to Form 10-Q for the quarter ended March 31, 2014 on April 30, 2014 and incorporated herein by reference.)
|
|
|
10.27
|
Assignment and License Agreement, dated October 16, 1986 (effective July 1, 1986), between Amgen and Kirin-Amgen, Inc. (Filed as an exhibit to Form 10-K for the year ended December 31, 2000 on March 7, 2001 and incorporated herein by reference.)
|
|
|
10.28
|
G-CSF United States License Agreement, dated June 1, 1987 (effective July 1, 1986), Amendment No. 1, dated October 20, 1988, and Amendment No. 2, dated October 17, 1991 (effective November 13, 1990), between Kirin-Amgen, Inc. and Amgen Inc. (Filed as exhibits to Form 10-K for the year ended December 31, 2000 on March 7, 2001 and incorporated herein by reference.)
|
|
|
10.29
|
G-CSF European License Agreement, dated December 30, 1986, between Kirin-Amgen and Amgen, Amendment No. 1 to Kirin-Amgen, Inc. / Amgen G-CSF European License Agreement, dated June 1, 1987, Amendment No. 2 to Kirin-Amgen, Inc. / Amgen G-CSF European License Agreement, dated March 15, 1998, Amendment No. 3 to Kirin-Amgen, Inc. / Amgen G-CSF European License Agreement, dated October 20, 1988, and Amendment No. 4 to Kirin-Amgen, Inc. / Amgen G-CSF European License Agreement, dated December 29, 1989, between Kirin-Amgen, Inc. and Amgen Inc. (Filed as exhibits to Form 10-K for the year ended December 31, 2000 on March 7, 2001 and incorporated herein by reference.)
|
|
|
10.30
|
Amended and Restated Credit Agreement, dated July 30, 2014, among Amgen Inc., the Banks therein named, Citibank, N.A., as administrative agent, and JPMorgan Chase Bank, N.A., as syndication agent (Filed as an exhibit to Form 8-K on July 30, 2014 and incorporated herein by reference.)
|
|
|
10.31
|
Collaboration and License Agreement between Amgen Inc. and Celltech R&D Limited dated May 10, 2002 (portions of the exhibit have been omitted pursuant to a request for confidential treatment) and Amendment No. 1, effective June 9, 2003, to Collaboration and License Agreement between Amgen Inc. and Celltech R&D Limited (portions of the exhibit have been omitted pursuant to a request for confidential treatment). (Filed as an exhibit to Form 10-K/A for the year ended December 31, 2012 on July 31, 2013 and incorporated herein by reference.)
|
|
|
10.32*
|
Amendment No. 2 to Collaboration and License Agreement, effective November 14, 2016, between Amgen Inc. and Celltech R&D Limited (portions of the exhibit have been omitted pursuant to a request for confidential treatment).
|
|
67
|
10.33
|
Collaboration Agreement, dated April 22, 1994, by and between Bayer Corporation (formerly Miles, Inc.) and Onyx Pharmaceuticals, Inc. (Filed as an exhibit to Form 10-Q for the quarter ended March 31, 2011 by Onyx Pharmaceuticals, Inc. on May 10, 2011 and incorporated herein by reference.)
|
|
|
10.34
|
Amendment to Collaboration Agreement, dated April 24, 1996, by and between Bayer Corporation and Onyx Pharmaceuticals, Inc. (Filed as an exhibit to Form 10-Q for the quarter ended March 31, 2006 by Onyx Pharmaceuticals, Inc. on May 10, 2006 and incorporated herein by reference.)
|
|
|
10.35
|
Amendment to Collaboration Agreement, dated February 1, 1999, by and between Bayer Corporation and Onyx Pharmaceuticals, Inc. (Filed as an exhibit to Form 10-Q for the quarter ended March 31, 2006 by Onyx Pharmaceuticals, Inc. on May 10, 2006 and incorporated herein by reference.)
|
|
|
10.36
|
Settlement Agreement and Release, dated October 11, 2011, by and between Bayer Corporation, Bayer AG, Bayer HealthCare LLC and Bayer Pharma AG and Onyx Pharmaceuticals, Inc. (Filed as an exhibit to Form 10-K for the year ended December 31, 2011 by Onyx Pharmaceuticals, Inc. on February 27, 2012 and incorporated herein by reference.)
|
|
|
10.37
|
Fourth Amendment to Collaboration Agreement, dated October 11, 2011, by and between Bayer Corporation and Onyx Pharmaceuticals, Inc. (Filed as an exhibit to Form 10-K for the year ended December 31, 2011 by Onyx Pharmaceuticals, Inc. on February 27, 2012 and incorporated herein by reference.)
|
|
|
10.38
|
Side Letter Regarding Collaboration Agreement, dated May 29, 2015, by and between Bayer HealthCare LLC and Onyx Pharmaceuticals, Inc. (Filed as an exhibit to Form 10-Q for the quarter ended June 30, 2015 on August 5, 2015 and incorporated herein by reference.)
|
|
|
21*
|
Subsidiaries of the Company
|
|
|
23
|
Consent of the Independent Registered Public Accounting Firm. The consent is set forth on page 70 of this Annual Report on Form 10-K.
|
|
|
24
|
Power of Attorney. The Power of Attorney is set forth on page 71 of this Annual Report on Form 10-K.
|
|
|
31*
|
Rule 13a-14(a) Certifications.
|
|
|
32**
|
Section 1350 Certifications.
|
|
|
101.INS*
|
XBRL Instance Document.
|
|
|
101.SCH*
|
XBRL Taxonomy Extension Schema Document.
|
|
|
101.CAL*
|
XBRL Taxonomy Extension Calculation Linkbase Document.
|
|
|
101.DEF*
|
XBRL Taxonomy Extension Definition Linkbase Document.
|
|
|
101.LAB*
|
XBRL Taxonomy Extension Label Linkbase Document.
|
|
|
101.PRE*
|
XBRL Taxonomy Extension Presentation Linkbase Document.
|
|
____________________________
(* = filed herewith)
(** = furnished herewith and not “filed” for purposes of Section 18 of the Securities Exchange Act of 1934, as amended)
(+ = management contract or compensatory plan or arrangement)
68
SIGNATURES
Pursuant to the requirements of the Securities Exchange Act of 1934, the registrant has duly caused this Annual Report to be signed on its behalf by the undersigned, thereunto duly authorized.
|
AMGEN INC.
|
||||
|
(Registrant)
|
||||
|
Date:
|
February 14, 2017
|
By:
|
|
/
S
/ DAVID W. MELINE
|
|
|
David W. Meline
|
|||
|
|
Executive Vice President and Chief Financial Officer
|
|||
|
|
||||
69
EXHIBIT 23
CONSENT OF INDEPENDENT REGISTERED PUBLIC ACCOUNTING FIRM
We consent to the incorporation by reference in the following Registration Statements:
|
•
|
Registration Statement (Form S-8 No. 333-159377) pertaining to the Amgen Inc. 2009 Equity Incentive Plan;
|
|
•
|
Registration Statement (Form S-8 No. 33-39183) pertaining to the Amended and Restated Employee Stock Purchase Plan;
|
|
•
|
Registration Statements (Form S-8 No. 33-39104, as amended by Form S-8 No. 333-144581) pertaining to the Amended and Restated Amgen Retirement and Savings Plan (formerly known as the Amgen Retirement and Savings Plan);
|
|
•
|
Registration Statements (Form S-8 Nos. 33-42072 and 333-144579) pertaining to the Amgen Inc. Amended and Restated 1991 Equity Incentive Plan;
|
|
•
|
Registration Statements (Form S-8 Nos. 33-47605 and 333-144580) pertaining to the Retirement and Savings Plan for Amgen Manufacturing, Limited (formerly known as the Retirement and Savings Plan for Amgen Manufacturing, Inc.);
|
|
•
|
Registration Statements (Form S-8 Nos. 333-81284 and 333-177868) pertaining to the Amgen Nonqualified Deferred Compensation Plan;
|
|
•
|
Registration Statements (Form S-8 Nos. 333-132932 and 333-133002) pertaining to the Amgen Inc. Amended and Restated 1999 Incentive Stock Plan (formerly known as Abgenix, Inc. 1999 Nonstatutory Stock Option Plan, as amended and restated);
|
|
•
|
Registration Statement (Form S-3 No. 333-194103) relating to debt securities, common stock, preferred stock, warrants to purchase debt securities, common stock, preferred stock or depositary shares, rights to purchase common stock or preferred stock, securities purchase contracts, securities purchase units and depositary shares of Amgen Inc. and in the related Prospectus; and
|
|
•
|
Registration Statement (Form S-8 No. 333-176240) pertaining to the Amgen Profit Sharing Plan for Employees in Ireland;
|
of our reports dated
February 14, 2017
, with respect to the consolidated financial statements and schedule of Amgen Inc. and the effectiveness of internal control over financial reporting of Amgen Inc. included in this Annual Report (Form 10-K) of Amgen Inc. for the year ended December 31, 2016.
/s/ Ernst & Young LLP
Los Angeles, California
February 14, 2017
70
EXHIBIT 24
POWER OF ATTORNEY
KNOW ALL MEN AND WOMEN BY THESE PRESENTS, that each person whose signature appears below constitutes and appoints David W. Meline, his or her attorney-in-fact, with the power of substitution, for him or her in any and all capacities, to sign any amendments to this Report, and to file the same, with exhibits thereto and other documents in connection therewith, with the Securities and Exchange Commission, hereby ratifying and confirming that said attorney-in-fact, or his or her substitute or substitutes, may do or cause to be done by virtue hereof.
Pursuant to the requirements of the Securities Exchange Act of 1934, this report has been signed below by the following persons on behalf of the registrant and in the capacities and on the dates indicated:
|
Signature
|
Title
|
Date
|
||
|
/S/ ROBERT A. BRADWAY
|
Chairman of the Board, Chief Executive Officer
and President, and Director (Principal Executive Officer) |
2/14/2017
|
||
|
Robert A. Bradway
|
||||
|
/S/ DAVID W. MELINE
|
Executive Vice President and
Chief Financial Officer
(Principal Financial Officer)
|
2/14/2017
|
||
|
David W. Meline
|
||||
|
/S/ ANNETTE SUCH
|
Vice President and
Chief Accounting Officer
(Principal Accounting Officer)
|
2/14/2017
|
||
|
Annette Such
|
||||
|
/S/ DAVID BALTIMORE
|
Director
|
2/14/2017
|
||
|
David Baltimore
|
||||
|
/S/ FRANK J. BIONDI, JR.
|
Director
|
2/14/2017
|
||
|
Frank J. Biondi, Jr.
|
||||
|
/S/ FRANÇOIS DE CARBONNEL
|
Director
|
2/14/2017
|
||
|
François de Carbonnel
|
||||
|
/S/ ROBERT A. ECKERT
|
Director
|
2/14/2017
|
||
|
Robert A. Eckert
|
||||
|
/S/ GREG C. GARLAND
|
Director
|
2/14/2017
|
||
|
Greg C. Garland
|
||||
|
/S/ FRED HASSAN
|
Director
|
2/14/2017
|
||
|
Fred Hassan
|
||||
|
/S/ REBECCA M. HENDERSON
|
Director
|
2/14/2017
|
||
|
Rebecca M. Henderson
|
||||
|
/S/ FRANK C. HERRINGER
|
Director
|
2/14/2017
|
||
|
Frank C. Herringer
|
||||
|
/S/ CHARLES M. HOLLEY, JR.
|
Director
|
2/14/2017
|
||
|
Charles M. Holley, Jr.
|
||||
|
/S/ TYLER JACKS
|
Director
|
2/14/2017
|
||
|
Tyler Jacks
|
||||
|
/S/ ELLEN J. KULLMAN
|
Director
|
2/14/2017
|
||
|
Ellen J. Kullman
|
||||
|
/S/ JUDITH C. PELHAM
|
Director
|
2/14/2017
|
||
|
Judith C. Pelham
|
||||
|
/S/ RONALD D. SUGAR
|
Director
|
2/14/2017
|
||
|
Ronald D. Sugar
|
||||
|
/S/ R. SANDERS WILLIAMS
|
Director
|
2/14/2017
|
||
|
R. Sanders Williams
|
||||
71
Report of Independent Registered Public Accounting Firm
The Board of Directors and Stockholders of Amgen Inc.
We have audited the accompanying Consolidated Balance Sheets of Amgen Inc. (the “Company”) as of
December 31, 2016
and
2015
, and the related Consolidated Statements of Income, Comprehensive Income, Stockholders’ Equity and Cash Flows for each of the three years in the period ended
December 31, 2016
. Our audits also included the financial statement schedule listed in the Index at Item 15(a) 2. These financial statements and schedule are the responsibility of the Company’s management. Our responsibility is to express an opinion on these financial statements and schedule based on our audits.
We conducted our audits in accordance with the standards of the Public Company Accounting Oversight Board (United States). Those standards require that we plan and perform the audit to obtain reasonable assurance about whether the financial statements are free of material misstatement. An audit includes examining, on a test basis, evidence supporting the amounts and disclosures in the financial statements. An audit also includes assessing the accounting principles used and significant estimates made by management, as well as evaluating the overall financial statement presentation. We believe that our audits provide a reasonable basis for our opinion.
In our opinion, the financial statements referred to above present fairly, in all material respects, the consolidated financial position of Amgen Inc. at
December 31, 2016
and
2015
, and the consolidated results of its operations and its cash flows for each of the three years in the period ended
December 31, 2016
, in conformity with U.S. generally accepted accounting principles. Also, in our opinion, the related financial statement schedule, when considered in relation to the basic financial statements taken as a whole, presents fairly in all material respects the information set forth therein.
We also have audited, in accordance with the standards of the Public Company Accounting Oversight Board (United States), Amgen Inc.’s internal control over financial reporting as of
December 31, 2016
, based on criteria established in Internal Control — Integrated Framework issued by the Committee of Sponsoring Organizations of the Treadway Commission (2013 framework) and our report dated
February 14, 2017
, expressed an unqualified opinion thereon.
/s/ Ernst & Young LLP
Los Angeles, California
February 14, 2017
F-1
AMGEN INC.
Years ended
December 31, 2016
,
2015
and
2014
(In millions, except per share data)
|
2016
|
2015
|
2014
|
|||||||||
|
Revenues:
|
|||||||||||
|
Product sales
|
$
|
21,892
|
|
$
|
20,944
|
|
$
|
19,327
|
|
||
|
Other revenues
|
1,099
|
|
718
|
|
736
|
|
|||||
|
Total revenues
|
22,991
|
|
21,662
|
|
20,063
|
|
|||||
|
Operating expenses:
|
|||||||||||
|
Cost of sales
|
4,162
|
|
4,227
|
|
4,422
|
|
|||||
|
Research and development
|
3,840
|
|
4,070
|
|
4,297
|
|
|||||
|
Selling, general and administrative
|
5,062
|
|
4,846
|
|
4,699
|
|
|||||
|
Other
|
133
|
|
49
|
|
454
|
|
|||||
|
Total operating expenses
|
13,197
|
|
13,192
|
|
13,872
|
|
|||||
|
Operating income
|
9,794
|
|
8,470
|
|
6,191
|
|
|||||
|
Interest expense, net
|
1,260
|
|
1,095
|
|
1,071
|
|
|||||
|
Interest and other income, net
|
629
|
|
603
|
|
465
|
|
|||||
|
Income before income taxes
|
9,163
|
|
7,978
|
|
5,585
|
|
|||||
|
Provision for income taxes
|
1,441
|
|
1,039
|
|
427
|
|
|||||
|
Net income
|
$
|
7,722
|
|
$
|
6,939
|
|
$
|
5,158
|
|
||
|
Earnings per share:
|
|||||||||||
|
Basic
|
$
|
10.32
|
|
$
|
9.15
|
|
$
|
6.80
|
|
||
|
Diluted
|
$
|
10.24
|
|
$
|
9.06
|
|
$
|
6.70
|
|
||
|
Shares used in the calculation of earnings per share:
|
|||||||||||
|
Basic
|
748
|
|
758
|
|
759
|
|
|||||
|
Diluted
|
754
|
|
766
|
|
770
|
|
|||||
See accompanying notes.
F-2
AMGEN INC.
CONSOLIDATED STATEMENTS OF COMPREHENSIVE INCOME
Years ended
December 31, 2016
,
2015
and
2014
(In millions)
|
2016
|
2015
|
2014
|
|||||||||
|
Net income
|
$
|
7,722
|
|
$
|
6,939
|
|
$
|
5,158
|
|
||
|
Other comprehensive income (loss), net of reclassification adjustments and taxes:
|
|
|
|
|
|
|
|||||
|
Foreign currency translation losses
|
(99
|
)
|
(247
|
)
|
(196
|
)
|
|||||
|
Effective portion of cash flow hedges
|
(15
|
)
|
7
|
|
323
|
|
|||||
|
Net unrealized gains (losses) on available-for-sale securities
|
122
|
|
(241
|
)
|
24
|
|
|||||
|
Other
|
1
|
|
9
|
|
2
|
|
|||||
|
Other comprehensive income (loss), net of tax
|
9
|
|
(472
|
)
|
153
|
|
|||||
|
Comprehensive income
|
$
|
7,731
|
|
$
|
6,467
|
|
$
|
5,311
|
|
||
See accompanying notes.
F-3
AMGEN INC.
December 31, 2016
and
2015
(In millions, except per share data)
|
2016
|
2015
|
||||||
|
ASSETS
|
|||||||
|
Current assets:
|
|||||||
|
Cash and cash equivalents
|
$
|
3,241
|
|
$
|
4,144
|
|
|
|
Marketable securities
|
34,844
|
|
27,238
|
|
|||
|
Trade receivables, net
|
3,165
|
|
2,995
|
|
|||
|
Inventories
|
2,745
|
|
2,435
|
|
|||
|
Other current assets
|
2,015
|
|
1,703
|
|
|||
|
Total current assets
|
46,010
|
|
38,515
|
|
|||
|
Property, plant and equipment, net
|
4,961
|
|
4,907
|
|
|||
|
Intangible assets, net
|
10,279
|
|
11,641
|
|
|||
|
Goodwill
|
14,751
|
|
14,787
|
|
|||
|
Other assets
|
1,625
|
|
1,599
|
|
|||
|
Total assets
|
$
|
77,626
|
|
$
|
71,449
|
|
|
|
LIABILITIES AND STOCKHOLDERS’ EQUITY
|
|||||||
|
Current liabilities:
|
|||||||
|
Accounts payable
|
$
|
917
|
|
$
|
965
|
|
|
|
Accrued liabilities
|
5,884
|
|
5,452
|
|
|||
|
Current portion of long-term debt
|
4,403
|
|
2,247
|
|
|||
|
Total current liabilities
|
11,204
|
|
8,664
|
|
|||
|
Long-term debt
|
30,193
|
|
29,182
|
|
|||
|
Long-term deferred tax liability
|
2,436
|
|
2,239
|
|
|||
|
Long-term tax liabilities
|
2,419
|
|
1,973
|
|
|||
|
Other noncurrent liabilities
|
1,499
|
|
1,308
|
|
|||
|
Contingencies and commitments
|
|
|
|
|
|||
|
Stockholders’ equity:
|
|||||||
|
Common stock and additional paid-in capital; $0.0001 par value; 2,750.0 shares authorized; outstanding — 738.2 shares in 2016 and 754.0 shares in 2015
|
30,784
|
|
30,649
|
|
|||
|
Accumulated deficit
|
(438
|
)
|
(2,086
|
)
|
|||
|
Accumulated other comprehensive loss
|
(471
|
)
|
(480
|
)
|
|||
|
Total stockholders’ equity
|
29,875
|
|
28,083
|
|
|||
|
Total liabilities and stockholders’ equity
|
$
|
77,626
|
|
$
|
71,449
|
|
|
See accompanying notes.
F-4
AMGEN INC.
CONSOLIDATED STATEMENTS OF STOCKHOLDERS’ EQUITY
Years ended
December 31, 2016
,
2015
and
2014
(In millions)
|
Number
of shares
of common
stock
|
Common
stock and
additional
paid-in capital
|
Accumulated
deficit
|
Accumulated
other
comprehensive
income (loss)
|
Total
|
||||||||||||||
|
Balance at December 31, 2013
|
754.6
|
|
$
|
29,891
|
|
$
|
(7,634
|
)
|
$
|
(161
|
)
|
$
|
22,096
|
|
||||
|
Net income
|
—
|
|
—
|
|
5,158
|
|
—
|
|
5,158
|
|
||||||||
|
Other comprehensive income, net of tax
|
—
|
|
—
|
|
—
|
|
153
|
|
153
|
|
||||||||
|
Dividends
|
—
|
|
—
|
|
(1,995
|
)
|
—
|
|
(1,995
|
)
|
||||||||
|
Issuance of common stock in connection with the Company’s equity award programs
|
6.7
|
|
186
|
|
—
|
|
—
|
|
186
|
|
||||||||
|
Stock-based compensation
|
—
|
|
404
|
|
—
|
|
—
|
|
404
|
|
||||||||
|
Tax impact related to employee stock-based compensation
|
—
|
|
(71
|
)
|
—
|
|
—
|
|
(71
|
)
|
||||||||
|
Repurchases of common stock
|
(0.9
|
)
|
—
|
|
(153
|
)
|
—
|
|
(153
|
)
|
||||||||
|
Balance at December 31, 2014
|
760.4
|
|
30,410
|
|
(4,624
|
)
|
(8
|
)
|
25,778
|
|
||||||||
|
Net income
|
—
|
|
—
|
|
6,939
|
|
—
|
|
6,939
|
|
||||||||
|
Other comprehensive loss, net of tax
|
—
|
|
—
|
|
—
|
|
(472
|
)
|
(472
|
)
|
||||||||
|
Dividends
|
—
|
|
—
|
|
(2,548
|
)
|
—
|
|
(2,548
|
)
|
||||||||
|
Issuance of common stock in connection with the Company’s equity award programs
|
5.6
|
|
82
|
|
—
|
|
—
|
|
82
|
|
||||||||
|
Stock-based compensation
|
—
|
|
319
|
|
—
|
|
—
|
|
319
|
|
||||||||
|
Tax impact related to employee stock-based compensation
|
—
|
|
(162
|
)
|
—
|
|
—
|
|
(162
|
)
|
||||||||
|
Repurchases of common stock
|
(12.0
|
)
|
—
|
|
(1,853
|
)
|
—
|
|
(1,853
|
)
|
||||||||
|
Balance at December 31, 2015
|
754.0
|
|
30,649
|
|
(2,086
|
)
|
(480
|
)
|
28,083
|
|
||||||||
|
Net income
|
—
|
|
—
|
|
7,722
|
|
—
|
|
7,722
|
|
||||||||
|
Other comprehensive income, net of tax
|
—
|
|
—
|
|
—
|
|
9
|
|
9
|
|
||||||||
|
Dividends
|
—
|
|
—
|
|
(3,120
|
)
|
—
|
|
(3,120
|
)
|
||||||||
|
Issuance of common stock in connection with the Company’s equity award programs
|
3.9
|
|
55
|
|
—
|
|
—
|
|
55
|
|
||||||||
|
Stock-based compensation
|
—
|
|
342
|
|
—
|
|
—
|
|
342
|
|
||||||||
|
Tax impact related to employee stock-based compensation
|
—
|
|
(262
|
)
|
73
|
|
—
|
|
(189
|
)
|
||||||||
|
Repurchases of common stock
|
(19.7
|
)
|
—
|
|
(3,027
|
)
|
—
|
|
(3,027
|
)
|
||||||||
|
Balance at December 31, 2016
|
738.2
|
|
$
|
30,784
|
|
$
|
(438
|
)
|
$
|
(471
|
)
|
$
|
29,875
|
|
||||
See accompanying notes.
F-5
AMGEN INC.
Years ended
December 31, 2016
,
2015
and
2014
(In millions)
|
2016
|
2015
|
2014
|
|||||||||
|
Cash flows from operating activities:
|
|||||||||||
|
Net income
|
$
|
7,722
|
|
$
|
6,939
|
|
$
|
5,158
|
|
||
|
Depreciation and amortization
|
2,105
|
|
2,108
|
|
2,092
|
|
|||||
|
Stock-based compensation expense
|
311
|
|
322
|
|
408
|
|
|||||
|
Deferred income taxes
|
183
|
|
(607
|
)
|
(108
|
)
|
|||||
|
Other items, net
|
32
|
|
(146
|
)
|
56
|
|
|||||
|
Changes in operating assets and liabilities, net of acquisitions:
|
|
|
|
||||||||
|
Trade receivables, net
|
(214
|
)
|
(420
|
)
|
136
|
|
|||||
|
Inventories
|
(80
|
)
|
481
|
|
327
|
|
|||||
|
Other assets
|
(128
|
)
|
155
|
|
(1
|
)
|
|||||
|
Accounts payable
|
(44
|
)
|
(12
|
)
|
228
|
|
|||||
|
Accrued income taxes
|
(301
|
)
|
509
|
|
(103
|
)
|
|||||
|
Other liabilities
|
768
|
|
402
|
|
759
|
|
|||||
|
Net cash provided by operating activities
|
10,354
|
|
9,731
|
|
8,952
|
|
|||||
|
Cash flows from investing activities:
|
|||||||||||
|
Purchases of property, plant and equipment
|
(738
|
)
|
(594
|
)
|
(718
|
)
|
|||||
|
Cash paid for acquisitions, net of cash acquired
|
—
|
|
(359
|
)
|
(165
|
)
|
|||||
|
Purchases of intangible assets
|
(99
|
)
|
(55
|
)
|
(285
|
)
|
|||||
|
Purchases of marketable securities
|
(28,094
|
)
|
(25,977
|
)
|
(25,878
|
)
|
|||||
|
Proceeds from sales of marketable securities
|
17,958
|
|
18,029
|
|
16,697
|
|
|||||
|
Proceeds from maturities of marketable securities
|
2,459
|
|
3,527
|
|
4,199
|
|
|||||
|
Proceeds from sale of property, plant and equipment
|
78
|
|
274
|
|
3
|
|
|||||
|
Change in restricted investments, net
|
—
|
|
—
|
|
533
|
|
|||||
|
Other
|
(222
|
)
|
(392
|
)
|
(138
|
)
|
|||||
|
Net cash used in investing activities
|
(8,658
|
)
|
(5,547
|
)
|
(5,752
|
)
|
|||||
|
Cash flows from financing activities:
|
|||||||||||
|
Net proceeds from issuance of debt
|
7,318
|
|
3,465
|
|
4,476
|
|
|||||
|
Repayment of debt
|
(3,725
|
)
|
(2,400
|
)
|
(5,605
|
)
|
|||||
|
Repurchases of common stock
|
(2,965
|
)
|
(1,867
|
)
|
(138
|
)
|
|||||
|
Dividends paid
|
(2,998
|
)
|
(2,396
|
)
|
(1,851
|
)
|
|||||
|
Net proceeds from issuance of common stock in connection with the Company’s equity award programs
|
55
|
|
82
|
|
186
|
|
|||||
|
Settlement of contingent consideration obligations
|
—
|
|
(253
|
)
|
(92
|
)
|
|||||
|
Withholding taxes arising from shares withheld for share-based payments
|
(260
|
)
|
(401
|
)
|
(225
|
)
|
|||||
|
Other
|
(24
|
)
|
(1
|
)
|
(25
|
)
|
|||||
|
Net cash used in financing activities
|
(2,599
|
)
|
(3,771
|
)
|
(3,274
|
)
|
|||||
|
(Decrease) increase in cash and cash equivalents
|
(903
|
)
|
413
|
|
(74
|
)
|
|||||
|
Cash and cash equivalents at beginning of period
|
4,144
|
|
3,731
|
|
3,805
|
|
|||||
|
Cash and cash equivalents at end of period
|
$
|
3,241
|
|
$
|
4,144
|
|
$
|
3,731
|
|
||
See accompanying notes.
F-6
AMGEN INC.
NOTES TO CONSOLIDATED FINANCIAL STATEMENTS
December 31, 2016
1. Summary of significant accounting policies
Business
Amgen Inc. (including its subsidiaries, referred to as “Amgen,” “the Company,” “we,” “our” or “us”) is a global biotechnology pioneer that discovers, develops, manufactures and delivers innovative human therapeutics. We operate in
one
business segment: human therapeutics.
Principles of consolidation
The consolidated financial statements include the accounts of Amgen as well as its majority-owned subsidiaries. We do not have any significant interests in any variable interest entities. All material intercompany transactions and balances have been eliminated in consolidation.
Use of estimates
The preparation of consolidated financial statements in conformity with accounting principles generally accepted in the United States requires management to make estimates and assumptions that affect the amounts reported in the consolidated financial statements and accompanying notes. Actual results may differ from those estimates.
Product sales
Sales of our products are recognized when shipped and title and risk of loss have passed. Product sales are recorded net of accruals for estimated rebates, wholesaler chargebacks, discounts and other deductions (collectively, sales deductions) and returns. Taxes collected from customers and remitted to government authorities related to the sales of the Company’s products, primarily in Europe, are excluded from revenues.
Other revenues
Other revenues consist primarily of royalty income and corporate partner revenues. Royalties from licensees are based on third-party sales of licensed products and are recorded in accordance with contract terms when third-party results are reliably measurable and collectability is reasonably assured. Royalty estimates are made in advance of amounts collected using historical and forecasted trends. Corporate partner revenues are composed mainly of license fees and milestones earned, our share of commercial profits generated from collaborations and amounts earned for certain research and development (R&D) services performed for others including Kirin-Amgen, Inc. (K-A), which are recognized as the R&D services are performed. See Multiple-deliverable revenue arrangements, discussed below, Note 7, Collaborative arrangements, and Note 8, Related party transactions.
Multiple-deliverable revenue arrangements
From time to time, we enter into arrangements for the R&D, manufacture and/or commercialization of products and product candidates. These arrangements may require us to deliver various rights, services and/or goods across the entire life cycle of a product or product candidate, including (i) intellectual property rights/licenses; (ii) R&D services; (iii) manufacturing services; and/or (iv) commercialization services. The underlying terms of these arrangements generally provide for consideration to Amgen in the form of non-refundable upfront license payments, R&D and commercial performance milestone payments, cost sharing and/or royalty payments.
In arrangements involving the delivery of more than one element, each required deliverable is evaluated to determine whether it qualifies as a separate unit of accounting. For Amgen, this determination is generally based on whether the deliverable has “stand-alone value” to the customer. The arrangement’s consideration that is fixed and determinable is then allocated to each separate unit of accounting based on the relative selling price of each deliverable. The estimated selling price of each deliverable is determined using the following hierarchy of values: (i) vendor-specific objective evidence of fair value; (ii) third-party evidence of selling price; and (iii) best estimate of selling price (BESP). The BESP reflects our best estimate of what the selling price would be if the deliverable was regularly sold by us on a stand-alone basis. In general, the consideration allocated to each unit of accounting is recognized as the related goods or services are delivered, limited to the consideration that is not contingent upon future deliverables. Consideration associated with at-risk substantive performance milestones is recognized as revenue upon the achievement of the related milestone, as defined in the respective contracts.
F-7
Research and development costs
R&D costs are expensed as incurred and include primarily salaries, benefits and other staff-related costs; facilities and overhead costs; clinical trial and related clinical manufacturing costs; contract services and other outside costs; information systems’ costs and amortization of acquired technology used in R&D with alternative future uses. R&D expenses also include costs and cost recoveries associated with third-party R&D arrangements such as with K-A, including upfront fees and milestones paid to third parties in connection with technologies which had not reached technological feasibility and did not have an alternative future use. Net payment or reimbursement of R&D costs is recognized when the obligations are incurred or as we become entitled to the cost recovery. See Note 7, Collaborative arrangements, and Note 8, Related party transactions.
Selling, general and administrative costs
Selling, general and administrative (SG&A) costs are composed primarily of salaries, benefits and other staff-related costs associated with sales and marketing, finance, legal and other administrative personnel; facilities and overhead costs; outside marketing, advertising and legal expenses; the U.S. healthcare reform federal excise fee on Branded Prescription Pharmaceutical Manufacturers and Importers; and other general and administrative costs. Advertising costs are expensed as incurred. SG&A expenses also include costs and cost recoveries associated with marketing and promotion efforts under certain collaboration arrangements. Net payment or reimbursement of SG&A costs is recognized when the obligations are incurred or we become entitled to the cost recovery. See Note 7, Collaborative arrangements.
Stock-based compensation
We have stock-based compensation plans under which various types of equity-based awards are granted, including restricted stock units (RSUs), performance units and stock options. The estimated fair values of RSUs and stock option awards which are subject only to service conditions with graded vesting are generally recognized as compensation expense on a straight-line basis over the service period, net of estimated forfeitures. The estimated fair values of performance unit awards are generally recognized as compensation expense ratably from the grant date to the end of the performance period. See Note 4, Stock-based compensation.
Income taxes
We provide for income taxes based on pretax income and applicable tax rates available in the various jurisdictions in which we operate. Deferred income taxes are recorded for the expected tax consequences of temporary differences between the bases of assets and liabilities for financial reporting purposes and amounts recognized for income tax purposes. We record a valuation allowance to reduce our deferred tax assets to the amount of future tax benefit that is more likely than not to be realized.
We recognize the tax benefit from an uncertain tax position only if it is more likely than not that the tax position will be sustained upon examination by the taxing authorities based on the technical merits of the position. The tax benefit recognized in the financial statements for a particular tax position is based on the largest benefit that is more likely than not to be realized. The amount of unrecognized tax benefits (UTBs) is adjusted as appropriate for changes in facts and circumstances, such as significant amendments to existing tax law, new regulations or interpretations by the taxing authorities, new information obtained during a tax examination, or resolution of an examination. We recognize both accrued interest and penalties, where appropriate, related to UTBs in income tax expense. See Note 5, Income taxes.
Business combinations
Business combinations are accounted for using the acquisition method of accounting. Under the acquisition method, assets acquired, including in-process research and development (IPR&D) projects, and liabilities assumed are recorded at their respective fair values as of the acquisition date in our consolidated financial statements. The excess of the fair value of consideration transferred over the fair value of the net assets acquired is recorded as goodwill. Contingent consideration obligations incurred in connection with a business combination (including the assumption of an acquiree’s liability arising from a business combination it consummated prior to our acquisition) are recorded at their fair values on the acquisition date and remeasured at their fair values each subsequent reporting period until the related contingencies are resolved. The resulting changes in fair values are recorded in earnings. See Note 3, Business combinations, and Note 16, Fair value measurement.
Cash equivalents
We consider cash equivalents to be only those investments which are highly liquid, readily convertible to cash and which mature within three months from the date of purchase.
F-8
Available-for-sale investments
We consider our investment portfolio available-for-sale and, accordingly, these investments are recorded at fair value with unrealized gains and losses generally recorded in other comprehensive income. Investments with maturities beyond one year may be classified as short-term marketable securities in the Consolidated Balance Sheets due to their highly liquid nature and because they represent the Company’s investments that are available for current operations. See Note 9, Available-for-sale investments, and Note 16, Fair value measurement.
Inventories
Inventories are stated at the lower of cost or market. Cost, which includes amounts related to materials, labor and overhead, is determined in a manner that approximates the first-in, first-out method. See Note 10, Inventories.
Derivatives
We recognize all of our derivative instruments as either assets or liabilities at fair value in the Consolidated Balance Sheets. The accounting for changes in the fair value of a derivative instrument depends upon whether the derivative has been formally designated and qualifies as part of a hedging relationship under the applicable accounting standards and, further, on the type of hedging relationship. For derivatives formally designated as hedges, we assess both at inception and quarterly thereafter, whether the hedging derivatives are highly effective in offsetting changes in either the fair value or cash flows of the hedged item. Our derivatives that are not designated and do not qualify as hedges are adjusted to fair value through current earnings. See Note 16, Fair value measurement, and Note 17, Derivative instruments.
Property, plant and equipment, net
Property, plant and equipment is recorded at historical cost, net of accumulated depreciation, amortization and, if applicable, impairment charges. We review our property, plant and equipment assets for impairment whenever events or changes in circumstances indicate that the carrying amount of an asset may not be recoverable. Depreciation is provided over the assets’ useful lives on a straight-line basis. Leasehold improvements are amortized on a straight-line basis over the shorter of their estimated useful lives or lease terms. See Note 11, Property, plant and equipment.
Goodwill and other intangible assets
Finite-lived intangible assets are recorded at cost, net of accumulated amortization and, if applicable, impairment charges. Amortization of finite-lived intangible assets is provided over their estimated useful lives on a straight-line basis or the pattern in which economic benefits are consumed, if reliably determinable. We review our finite-lived intangible assets for impairment whenever events or changes in circumstances indicate that the carrying amount of an asset may not be recoverable. See Note 12, Goodwill and other intangible assets.
The estimated fair values of IPR&D projects acquired in a business combination which are not complete are capitalized and accounted for as indefinite-lived intangible assets until completion or abandonment of the related R&D efforts. Upon successful completion of the project, the capitalized amount is amortized over its estimated useful life. If a project is abandoned, all remaining capitalized amounts are written-off immediately. There are often major risks and uncertainties associated with IPR&D projects as we are required to obtain regulatory approvals in order to be able to market the resulting products. Such approvals require completing clinical trials that demonstrate a product candidate is safe and effective. Consequently, the eventual realized value of the acquired IPR&D project may vary from its estimated fair value at the date of acquisition, and IPR&D impairment charges may occur in future periods.
Capitalized IPR&D projects are tested for impairment annually and whenever events or changes in circumstances indicate that the carrying amount may not be recoverable. We consider various factors for potential impairment, including the current legal and regulatory environment and the competitive landscape. Adverse clinical trial results, significant delays in obtaining marketing approval, the inability to bring a product to market and the introduction or advancement of competitors’ products could result in partial or full impairment of the related intangible assets.
We perform an impairment test of goodwill annually and whenever events or changes in circumstances indicate that the carrying amount may not be recoverable. To date, an impairment of goodwill has not been recorded. See Note 12, Goodwill and other intangible assets.
F-9
Contingencies
In the ordinary course of business, we are involved in various legal proceedings and other matters such as intellectual property disputes, contractual disputes, governmental investigations and class action suits which are complex in nature and have outcomes that are difficult to predict. (Certain of these proceedings are discussed in Note 18, Contingencies and commitments.) We record accruals for loss contingencies to the extent that we conclude that it is probable that a liability has been incurred and the amount of the related loss can be reasonably estimated. We consider all relevant factors when making assessments regarding these contingencies.
Foreign currency translation
The net assets of international subsidiaries where the local currencies have been determined to be the functional currencies are translated into U.S. dollars using current exchange rates. The U.S. dollar effects that arise from translating net assets of these subsidiaries at changing rates are recognized in other comprehensive income. The earnings of these subsidiaries are translated into U.S. dollars using average exchange rates.
Recent accounting pronouncements
In 2016, we retrospectively adopted a new accounting standard that amends the presentation of debt issuance costs. Such costs are now presented as a direct deduction from the carrying amount of the debt liability and not as deferred charges presented as assets on our Consolidated Balance Sheets. As a result of adopting this new accounting standard, our Consolidated Balance Sheet as of December 31, 2015, was restated to reflect this impact, which reduced both Other current assets and the Current portion of long-term debt by
$3 million
and both Other assets and Long-term debt by
$124 million
.
In 2016, we adopted a new accounting standard that amends certain aspects of the accounting for employee share-based payments. One aspect of the standard requires that excess tax benefits and deficiencies that arise upon vesting or exercise of share-based payments be recognized as income tax benefits and expenses in the income statement. See Note 5, Income taxes. Previously, such amounts were recognized as increases and decreases in common stock and additional paid-in capital. This aspect of the standard was adopted prospectively
,
and accordingly, the Provision for income taxes for the year ended December 31, 2016, includes
$122 million
of excess tax benefits arising from share-based payments. The new standard also amends the presentation of employee share-based payment-related items in the statement of cash flows by requiring (i) that excess income tax benefits and deficiencies be classified in Cash flows from operating activities (such amounts were previously included in Cash flows from financing activities) and (ii) that cash paid to taxing authorities arising from the withholding of shares from employees be classified in Cash flows from financing activities (such amounts were previously included in Cash flows from operating activities). We adopted the aspects of the standard affecting the cash flow presentation retrospectively, and accordingly, to conform to the current year presentation, in the Consolidated Statement of Cash Flows for the years ended December 31, 2015 and 2014, we reclassified: (i)
$253 million
and
$172 million
, respectively, of excess tax benefits from Net cash used in financing activities to Net cash provided by operating activities and (ii)
$401 million
and
$225 million
, respectively, of cash paid to taxing authorities arising from withholding of shares from employees from Net cash provided by operating activities to Net cash used in financing activities.
In May 2014, the Financial Accounting Standards Board (FASB) issued a new accounting standard that amends the guidance for the recognition of revenue from contracts with customers to transfer goods and services. The FASB has subsequently issued additional, clarifying standards to address issues arising from implementation of the new revenue standard. The new revenue standard and clarifying standards are effective for interim and annual periods beginning January 1, 2018, and may be adopted earlier, but not before January 1, 2017. The new standards are required to be adopted using either a full retrospective or a modified retrospective approach. We expect to adopt this standard using the modified retrospective approach beginning in 2018. We have substantially completed our impact assessment and do not currently anticipate a material impact to our Total revenues. We continue to review the impact that this new standard will have on collaboration and license arrangements as well our financial statement disclosures.
In January 2016, the FASB issued a new accounting standard that amends the accounting and disclosures of financial instruments, including a provision that requires equity investments (except for investments accounted for under the equity method of accounting) to be measured at fair value with changes in fair value recognized in current earnings. The new standard is effective for interim and annual periods beginning on January 1, 2018. The impact that this new standard will have on our consolidated financial statements is dependent on the fair value of available-for-sale equity securities in our portfolio in the future. See
Note 9, Available-for-sale investments for the fair value of equity securities as of December 31, 2016.
In February 2016, the FASB issued a new accounting standard that amends the guidance for the accounting and disclosure of leases. This new standard requires that lessees recognize the assets and liabilities that arise from leases on the balance sheet and
F-10
disclose qualitative and quantitative information about their leasing arrangements. The new standard is effective for interim and annual periods beginning on January 1, 2019, and may be adopted earlier. We continue to evaluate the impact that this new standard will have on our consolidated financial statements. We do not expect that this standard will have a material impact to our Consolidated Statements of Income but expect that this standard will have a material impact to assets and liabilities on our Consolidated Balance Sheets upon adoption.
In June 2016, the FASB issued a new accounting standard that amends the guidance for measuring and recording credit losses on financial assets measured at amortized cost by replacing the “incurred loss” model with an “expected loss” model. Accordingly, these financial assets will be presented at the net amount expected to be collected. The new standard also requires that credit losses related to available-for-sale debt securities be recorded through an allowance for such losses rather than reducing the carrying amount under the current, other-than-temporary-impairment model. The new standard is effective for interim and annual periods beginning on January 1, 2020. We are currently evaluating the impact that this new standard will have on our consolidated financial statements.
In January 2017, the FASB issued a new accounting standard that changes the definition of a business to assist entities with evaluating when a set of assets acquired or disposed of should be considered a business. The new standard requires an entity to evaluate if substantially all the fair value of the gross assets acquired is concentrated in a single identifiable asset or a group of similar identifiable assets; if so, the set would not be considered a business. The new standard also requires a business to include at least one substantive process and narrows the definition of outputs. We expect that these provisions will reduce the number of transactions that will be considered a business. The new standard is effective for interim and annual periods beginning on January 1, 2018, and may be adopted earlier. The standard would be applied prospectively to any transaction occurring on or after the adoption date. We are currently evaluating the impact that this new standard will have on our consolidated financial statements.
2. Restructuring
In 2014, we initiated a restructuring plan to invest in continuing innovation and the launch of our new pipeline molecules, while improving our cost structure. As part of the plan, we have closed facilities in Washington state and Colorado and are reducing the number of buildings we occupy at our headquarters in Thousand Oaks, California, as well as at other locations.
We continue to estimate that we will incur
$800 million
to
$900 million
of pre-tax charges in connection with our restructuring plan, including: (i) separation and other headcount-related costs of
$535 million
to
$585 million
with respect to staff reductions, and (ii) asset-related charges of
$265 million
to
$315 million
consisting primarily of asset impairments, accelerated depreciation and other related costs resulting from the consolidation of our worldwide facilities. We have incurred a total of
$477 million
of separation and other headcount-related costs and
$232 million
of net asset-related charges through December 31, 2016. In order to support our ongoing transformation and process improvement efforts, we expect that we will incur most of the remaining estimated costs in 2017.
The charges recorded in 2016 were not material for all types of activities presented below. The following tables summarize the 2015 and 2014 charges recorded related to the restructuring plan by type of activity and the locations recognized within the Consolidated Statements of Income (in millions):
|
During the year ended December 31, 2015
|
||||||||||||||||||||
|
Separation Costs
|
Asset Impairments/
Disposals
|
Accelerated Depreciation
|
Other
|
Total
|
||||||||||||||||
|
Cost of sales
|
$
|
—
|
|
$
|
—
|
|
$
|
50
|
|
$
|
2
|
|
$
|
52
|
|
|||||
|
Research and development
|
—
|
|
—
|
|
36
|
|
28
|
|
64
|
|
||||||||||
|
Selling, general and administrative
|
—
|
|
—
|
|
14
|
|
42
|
|
56
|
|
||||||||||
|
Other
|
49
|
|
(111
|
)
|
—
|
|
4
|
|
(58
|
)
|
||||||||||
|
Total
|
$
|
49
|
|
$
|
(111
|
)
|
$
|
100
|
|
$
|
76
|
|
$
|
114
|
|
|||||
F-11
|
During the year ended December 31, 2014
|
||||||||||||||||||||
|
Separation Costs
|
Asset Impairments
|
Accelerated Depreciation
|
Other
|
Total
|
||||||||||||||||
|
Cost of sales
|
$
|
—
|
|
$
|
81
|
|
$
|
23
|
|
$
|
—
|
|
$
|
104
|
|
|||||
|
Research and development
|
—
|
|
—
|
|
28
|
|
21
|
|
49
|
|
||||||||||
|
Selling, general and administrative
|
—
|
|
—
|
|
4
|
|
5
|
|
9
|
|
||||||||||
|
Other
|
377
|
|
6
|
|
—
|
|
13
|
|
396
|
|
||||||||||
|
Total
|
$
|
377
|
|
$
|
87
|
|
$
|
55
|
|
$
|
39
|
|
$
|
558
|
|
|||||
We recognized asset impairment and accelerated depreciation charges in connection with our decision to exit Boulder and Longmont, Colorado, and Bothell and Seattle, Washington, and in connection with the consolidation of facilities in Thousand Oaks, California. The decision to close these manufacturing and R&D facilities was based principally on optimizing the utilization of our sites in the United States, which includes an expansion of our presence in the key U.S. biotechnology hubs of South San Francisco, California, and Cambridge, Massachusetts. During the year ended December 31, 2015, we recognized gains from the sale of assets related to these site closures.
The following table summarizes the expenses (excluding non-cash charges) and payments related to the restructuring plan (in millions):
|
During the years ended December 31,
|
|||||||||||
|
Separation Costs
|
Other
|
Total
|
|||||||||
|
Restructuring liabilities as of December 31, 2013
|
$
|
—
|
|
$
|
—
|
|
$
|
—
|
|
||
|
Expense
|
353
|
|
32
|
|
385
|
|
|||||
|
Payments
|
(132
|
)
|
(9
|
)
|
(141
|
)
|
|||||
|
Restructuring liabilities as of December 31, 2014
|
221
|
|
23
|
|
244
|
|
|||||
|
Expense
|
52
|
|
80
|
|
132
|
|
|||||
|
Payments
|
(178
|
)
|
(80
|
)
|
(258
|
)
|
|||||
|
Restructuring liabilities as of December 31, 2015
|
95
|
|
23
|
|
118
|
|
|||||
|
Expense
|
6
|
|
13
|
|
19
|
|
|||||
|
Payments
|
(90
|
)
|
(27
|
)
|
(117
|
)
|
|||||
|
Restructuring liabilities as of December 31, 2016
|
$
|
11
|
|
$
|
9
|
|
$
|
20
|
|
||
3. Business combinations
Dezima Pharma B.V.
In 2015, we acquired all of the outstanding stock of Dezima Pharma B.V. (Dezima), a privately-held, Netherlands-based biotechnology company focused on developing innovative treatments for dyslipidemia. Dezima’s lead molecule is AMG 899 (formerly TA-8995), an oral, once-daily cholesteryl ester transfer protein inhibitor that has completed certain phase 2 trials. This transaction was accounted for as a business combination. Upon its acquisition, Dezima became a wholly owned subsidiary of Amgen, and its operations have been included in our consolidated financial statements commencing on the acquisition date.
The aggregate acquisition date consideration to acquire Dezima consisted of (in millions):
|
Total cash paid to former shareholders of Dezima
|
$
|
300
|
|
|
Fair value of contingent consideration obligations
|
110
|
|
|
|
Total consideration
|
$
|
410
|
|
In connection with this acquisition, we are obligated to make additional payments to the former shareholders of Dezima of up to
$1.25 billion
contingent upon the achievement of certain development and sales-related milestones. In addition, low single-digit royalties will be paid on net product sales above a certain threshold. The estimated fair values of the contingent consideration obligations aggregated to
$110 million
as of the acquisition date. See Note 16, Fair value measurement for information regarding the estimated fair values of these obligations as of December 31, 2016. The contingent consideration obligations relating to payments for regulatory milestones were valued based on assumptions regarding the probability of achieving the milestones and making the related payments, with such amounts discounted to present value based on our credit risk. The contingent consideration
F-12
obligations relating to sales milestones were valued based on assumptions regarding the probability of achieving specified product sales thresholds to determine the required payments, with such amounts discounted to present value based on our credit risk.
The fair values of assets acquired and liabilities assumed primarily included IPR&D of
$400 million
, goodwill of
$108 million
and deferred tax liabilities of
$100 million
. This valuation reflects delayed development pending competitor clinical trials in this class, expected in 2017. The estimated fair value of acquired IPR&D related to AMG 899 was determined using a probability-weighted income approach, which discounts expected future cash flows to present value using a discount rate that represents the estimated rate that market participants would use to value the assets. The projected cash flows were based on certain assumptions, including estimates of future revenues and expenses, the time and resources needed to complete development and the probabilities of obtaining marketing approval from regulatory agencies. The excess of the acquisition date consideration over the fair values assigned to the assets acquired and the liabilities assumed of
$108 million
was recorded as goodwill, which is not deductible for tax purposes. Goodwill is attributable primarily to the expected synergies and other benefits that we believe will result from expanding our cardiovascular portfolio with AMG 899; and the deferred tax consequences of acquired IPR&D recorded for financial statement purposes.
Pro forma results of operations for this acquisition have not been presented because this acquisition is not material to our consolidated results of operations.
For the IPR&D project discussed above, there are major risks and uncertainties associated with the timely and successful completion of development and commercialization of the product candidate, including our ability to confirm safety and efficacy based on data from clinical trials, our ability to obtain necessary regulatory approvals and our ability to successfully complete these tasks within budgeted costs. We are not able to market a human therapeutic without obtaining regulatory approvals, and such approvals require completing clinical trials that demonstrate a product candidate is safe and effective. Consequently, the eventual realized value, if any, of the acquired IPR&D project may vary from its estimated fair value at the date of acquisition.
4. Stock-based compensation
Our Amended and Restated 2009 Equity Incentive Plan (the Amended 2009 Plan) authorizes for issuance, shares of our common stock pursuant to grants of equity-based awards, including RSUs, stock options and performance units to employees and consultants of Amgen, its subsidiaries and non-employee members of our Board of Directors. The pool of shares available under the Amended 2009 Plan is reduced by
one
share for each stock option granted and by
1.9
shares for other types of awards granted, including RSUs and performance units (full-value awards). In general, if any shares subject to an award granted under the Amended 2009 Plan expire, or are forfeited, terminated or canceled without the issuance of shares, the shares subject to such awards are added back into the authorized pool on the same basis that they were removed. In addition, under the Amended 2009 Plan, shares withheld to pay for minimum statutory tax obligations with respect to full value awards are added back into the authorized pool on the basis of
1.9
shares. As of
December 31, 2016
, the Amended 2009 Plan provides for future grants and/or issuances of up to approximately
41 million
shares of our common stock. Stock-based awards under our employee compensation plans are made with newly issued shares reserved for this purpose.
The following table reflects the components of stock-based compensation expense recognized in our Consolidated Statements of Income (in millions):
|
Years ended December 31,
|
|||||||||||
|
2016
|
2015
|
2014
|
|||||||||
|
RSUs
|
$
|
177
|
|
$
|
190
|
|
$
|
219
|
|
||
|
Performance units
|
123
|
|
132
|
|
171
|
|
|||||
|
Stock options
|
11
|
|
—
|
|
18
|
|
|||||
|
Total stock-based compensation expense, pretax
|
311
|
|
322
|
|
408
|
|
|||||
|
Tax benefit from stock-based compensation expense
|
(112
|
)
|
(120
|
)
|
(152
|
)
|
|||||
|
Total stock-based compensation expense, net of tax
|
$
|
199
|
|
$
|
202
|
|
$
|
256
|
|
||
Restricted stock units and stock options
Eligible employees generally receive an annual grant of RSUs and, for certain executive level employees, stock options, with the size and type of award generally determined by the employee’s salary grade and performance level. In 2016, we reinstated the practice of granting stock options to eligible employees annually, which had been suspended from 2012 through 2015. In addition, certain management and professional-level employees typically receive RSU grants upon commencement of employment. Non-employee members of our Board of Directors also receive an annual grant of RSUs.
F-13
Our RSU and stock option grants provide for accelerated or continued vesting in certain circumstances as defined in the plans and related grant agreements, including upon death, disability, termination in connection with a change in control and the retirement of employees who meet certain service and/or age requirements.
RSUs and stock options generally vest in approximately equal amounts on the second, third and fourth anniversaries of the grant date. RSUs
accrue dividend equivalents which are typically payable in shares only when and to the extent the underlying RSUs vest and are issued to the recipient.
Restricted stock units
The grant date fair value of an RSU equals the closing price of our common stock on the grant date, as RSUs accrue dividend equivalents during their vesting period. The weighted-average grant date fair values of RSUs granted in
2016
,
2015
and
2014
were
$156.76
,
$166.74
and
$115.63
, respectively. The following summarizes select information regarding our RSUs:
|
During the year ended December 31, 2016
|
||||||
|
Units
(in millions)
|
Weighted-average
grant date
fair value
|
|||||
|
Balance nonvested at December 31, 2015
|
5.0
|
|
$
|
118.89
|
|
|
|
Granted
|
1.3
|
|
$
|
156.76
|
|
|
|
Vested
|
(2.0
|
)
|
$
|
96.91
|
|
|
|
Forfeited
|
(0.4
|
)
|
$
|
131.43
|
|
|
|
Balance nonvested at December 31, 2016
|
3.9
|
|
$
|
141.07
|
|
|
The total grant date fair values of shares associated with RSUs that vested during the years ended
December 31, 2016
,
2015
and
2014
, were
$193 million
,
$206 million
and
$191 million
, respectively.
As of
December 31, 2016
, there were approximately
$303 million
of unrecognized compensation costs related to nonvested RSU awards, which are expected to be recognized over a weighted-average period of
1.7
years.
Stock options
The exercise price for stock options is set as the closing price of our common stock on the date of grant and the related number of shares granted is fixed at that point in time. Awards expire
10 years
from the date of grant. We use a Black-Scholes option valuation model to estimate the grant date fair values of stock options. The weighted-average assumptions used in the option valuation model and the resulting weighted-average estimated grant date fair value of stock options granted during the year ended December 31, 2016, were as follows:
|
Closing price of our common stock on grant date
|
$156.35
|
|
|
Expected volatility (average of implied and historical volatility)
|
24.3
|
%
|
|
Expected life (in years)
|
5.8
|
|
|
Risk-free interest rate
|
1.5
|
%
|
|
Expected dividend yield
|
2.6
|
%
|
|
Fair value of stock options granted
|
$27.55
|
|
F-14
The following summarizes select information regarding our stock options:
|
During the year ended December 31, 2016
|
||||||||||||
|
Options
(in millions)
|
Weighted-
average
exercise price
|
Weighted-
average
remaining
contractual
life (years)
|
Aggregate
intrinsic
value
(in millions)
|
|||||||||
|
Balance unexercised at December 31, 2015
|
2.8
|
|
$
|
56.19
|
|
|||||||
|
Granted
|
1.4
|
|
$
|
156.35
|
|
|||||||
|
Exercised
|
(1.0
|
)
|
$
|
52.98
|
|
|||||||
|
Expired/forfeited
|
(0.1
|
)
|
$
|
150.70
|
|
|||||||
|
Balance unexercised at December 31, 2016
|
3.1
|
|
$
|
100.21
|
|
6.1
|
$
|
158
|
|
|||
|
Vested or expected to vest at December 31, 2016
|
3.0
|
|
$
|
96.92
|
|
6.0
|
$
|
158
|
|
|||
|
Exercisable at December 31, 2016
|
1.8
|
|
$
|
57.95
|
|
3.7
|
$
|
158
|
|
|||
The total intrinsic values of options exercised during the years ended
December 31, 2016
,
2015
and
2014
, were
$102 million
,
$150 million
and
$228 million
, respectively. The actual tax benefits realized from tax deductions from option exercises during the three years ended
December 31, 2016
,
2015
and
2014
, were
$37 million
,
$55 million
and
$83 million
, respectively.
Performance units
Certain management-level employees also receive annual grants of performance units, which give the recipient the right to receive common stock that is contingent upon achievement of specified pre-established goals over the performance period, which is generally
three years
. The performance goals for the units granted in 2016, 2015 and 2014, which are accounted for as equity awards, are based upon Amgen’s stockholder return compared with a comparator group of companies, which are considered market conditions and are reflected in the grant date fair values of the units, and for units granted in 2016, Amgen’s standalone financial performance measures, which are considered performance conditions. The expense recognized for awards granted in 2016 is based on the grant date fair value of a unit multiplied by the number of units expected to be earned with respect to the performance conditions, net of estimated forfeitures. The expense recognized for the awards granted in 2015 and 2014 is based on the grant date fair value of a unit multiplied by the number of units granted, net of estimated forfeitures. Depending on the outcome of these performance goals, a recipient may ultimately earn a number of units greater or less than the number of units granted. Shares of our common stock are issued on a
one-for-one basis
for each performance unit earned. In general, performance unit awards vest at the end of the performance period. The performance award program provides for accelerated or continued vesting in certain circumstances as defined in the plan, including upon death, disability, a change in control and retirement of employees who meet certain service and/or age requirements. Performance units accrue dividend equivalents which are typically payable in shares only when and to the extent the underlying performance units vest and are issued to the recipient, including with respect to market and performance conditions that affect the number of performance units earned.
We used payout simulation models to estimate the grant date fair value of performance units granted in
2016
,
2015
and
2014
. The weighted-average assumptions used in these models and the resulting weighted-average grant date fair values of our performance units were as follows:
|
Years ended December 31,
|
|||||||||||
|
2016
|
2015
|
2014
|
|||||||||
|
Closing price of our common stock on grant date
|
$
|
156.35
|
|
$
|
164.26
|
|
$
|
112.43
|
|
||
|
Volatility
|
25.8
|
%
|
24.3
|
%
|
23.8
|
%
|
|||||
|
Risk-free interest rate
|
0.9
|
%
|
0.8
|
%
|
0.8
|
%
|
|||||
|
Fair value of unit
|
$
|
170.56
|
|
$
|
182.55
|
|
$
|
104.47
|
|
||
The payout simulation models also assumed correlations of returns of the stock prices of our common stock and the common stocks of the comparator groups of companies and stock price volatilities of the comparator groups of companies.
F-15
As of
December 31, 2016
and
2015
, a total of
2.8 million
and
3.8 million
performance units were outstanding with weighted-average grant date fair values of
$144.43
and
$121.34
per unit, respectively. During the year ended
December 31, 2016
,
0.8 million
performance units with a weighted-average grant date fair value of
$170.56
were granted and
0.2 million
performance units with a weighted-average grant date fair value of
$140.31
were forfeited.
The total fair values of performance units that vested during 2016 and
2014
were
$347 million
and
$587 million
, respectively based upon the number of performance units earned multiplied by the closing stock price of our common stock on the last day of the performance period.
No
performance units vested during the year ended December 31, 2015.
As of
December 31, 2016
, there was approximately
$144 million
of unrecognized compensation cost related to the
2016
and
2015
performance unit grants that is expected to be recognized over a weighted-average period of approximately
one
year.
5. Income taxes
Income before income taxes included the following (in millions):
|
Years ended December 31,
|
|||||||||||
|
2016
|
2015
|
2014
|
|||||||||
|
Domestic
|
$
|
4,478
|
|
$
|
3,532
|
|
$
|
1,456
|
|
||
|
Foreign
|
4,685
|
|
4,446
|
|
4,129
|
|
|||||
|
Total income before income taxes
|
$
|
9,163
|
|
$
|
7,978
|
|
$
|
5,585
|
|
||
The provision for income taxes included the following (in millions):
|
Years ended December 31,
|
|||||||||||
|
2016
|
2015
|
2014
|
|||||||||
|
Current provision:
|
|||||||||||
|
Federal
|
$
|
984
|
|
$
|
1,129
|
|
$
|
251
|
|
||
|
State
|
65
|
|
40
|
|
58
|
|
|||||
|
Foreign
|
176
|
|
272
|
|
194
|
|
|||||
|
Total current provision
|
1,225
|
|
1,441
|
|
503
|
|
|||||
|
Deferred provision (benefit):
|
|||||||||||
|
Federal
|
372
|
|
(290
|
)
|
(22
|
)
|
|||||
|
State
|
(69
|
)
|
(78
|
)
|
(4
|
)
|
|||||
|
Foreign
|
(87
|
)
|
(34
|
)
|
(50
|
)
|
|||||
|
Total deferred provision (benefit)
|
216
|
|
(402
|
)
|
(76
|
)
|
|||||
|
Total provision
|
$
|
1,441
|
|
$
|
1,039
|
|
$
|
427
|
|
||
Deferred income taxes reflect the tax effect of temporary differences between the carrying amounts of assets and liabilities for financial reporting purposes and the amounts used for income tax purposes, tax credit carryforwards and the tax effects of net operating loss (NOL) carryforwards.
F-16
Significant components of our deferred tax assets and liabilities were as follows (in millions):
|
December 31,
|
|||||||
|
2016
|
2015
|
||||||
|
Deferred income tax assets:
|
|||||||
|
NOL and credit carryforwards
|
$
|
688
|
|
$
|
620
|
|
|
|
Expense accruals
|
562
|
|
706
|
|
|||
|
Expenses capitalized for tax
|
255
|
|
199
|
|
|||
|
Stock-based compensation
|
167
|
|
179
|
|
|||
|
Undistributed earnings of foreign subsidiaries
|
—
|
|
144
|
|
|||
|
Other
|
117
|
|
161
|
|
|||
|
Total deferred income tax assets
|
1,789
|
|
2,009
|
|
|||
|
Valuation allowance
|
(381
|
)
|
(327
|
)
|
|||
|
Net deferred income tax assets
|
1,408
|
|
1,682
|
|
|||
|
Deferred income tax liabilities:
|
|||||||
|
Acquired intangibles
|
(3,139
|
)
|
(3,633
|
)
|
|||
|
Debt
|
(345
|
)
|
—
|
|
|||
|
Other
|
(307
|
)
|
(227
|
)
|
|||
|
Total deferred income tax liabilities
|
(3,791
|
)
|
(3,860
|
)
|
|||
|
Total deferred income taxes, net
|
$
|
(2,383
|
)
|
$
|
(2,178
|
)
|
|
Valuation allowances are provided to reduce the amounts of our deferred tax assets to an amount that is more likely than not to be realized based on an assessment of positive and negative evidence, including estimates of future taxable income necessary to realize future deductible amounts.
The valuation allowance increased in 2016 due primarily to the Company’s expectation that some state R&D credits will not be utilized. This increase was offset partially by valuation allowance releases due to sufficient positive evidence to conclude that it is more likely than not that certain foreign NOL carryforwards are realizable. The valuation allowance decreased in 2015 due primarily to the release of valuation allowances against U.S. and foreign deferred tax assets due to the existence of sufficient taxable temporary differences that enable the use of the tax benefit of existing deferred tax assets.
At
December 31, 2016
, we had
$20 million
of federal tax credit carryforwards available to reduce future federal income taxes and have provided
no
valuation allowance for those federal tax credit carryforwards. The federal tax credit carryforwards expire between 2026 and 2034. We had
$385 million
of state tax credit carryforwards available to reduce future state income taxes and have provided a valuation allowance for
$363 million
of those state tax credit carryforwards. The state credits for which
no
valuation allowance has been provided expire between 2022 and 2030.
At December 31, 2016, we had
$147 million
of NOL carryforwards available to reduce future federal income taxes and have provided a valuation allowance for
$6 million
of those federal NOL carryforwards. The federal NOL carryforwards, for which no valuation allowance has been provided, expire between 2020 and 2035. We had
$469 million
of NOL carryforwards available to reduce future state income taxes and have provided a valuation allowance for
$445 million
of those state NOL carryforwards. The state NOLs for which no valuation allowance has been provided expire between 2017 and 2032. We had
$1.8 billion
of NOL carryforwards available to reduce future foreign income taxes and have provided a valuation allowance for
$587 million
of those foreign NOL carryforwards.
$594 million
of the foreign NOLs for which no valuation allowance has been provided have no expiry; the remaining NOLs for which no valuation allowance has been provided will expire between 2017 and 2023.
F-17
The reconciliations of the total gross amounts of UTBs (excluding interest, penalties, foreign tax credits and the federal tax benefit of state taxes related to UTBs) were as follows (in millions):
|
During the years ended December 31,
|
|||||||||||
|
2016
|
2015
|
2014
|
|||||||||
|
Balance at beginning of year
|
$
|
2,114
|
|
$
|
1,772
|
|
$
|
1,415
|
|
||
|
Additions based on tax positions related to the current year
|
425
|
|
413
|
|
379
|
|
|||||
|
Additions based on tax positions related to prior years
|
18
|
|
9
|
|
37
|
|
|||||
|
Reductions for tax positions of prior years
|
(7
|
)
|
(32
|
)
|
(45
|
)
|
|||||
|
Reductions for expiration of statute of limitations
|
—
|
|
—
|
|
(12
|
)
|
|||||
|
Settlements
|
(7
|
)
|
(48
|
)
|
(2
|
)
|
|||||
|
Balance at end of year
|
$
|
2,543
|
|
$
|
2,114
|
|
$
|
1,772
|
|
||
Substantially all of the UTBs as of
December 31, 2016
, if recognized, would affect our effective tax rate. During the year ended December 31, 2016, we settled various examinations with state tax authorities for prior tax years. As a result of these developments, we remeasured our UTBs accordingly. As of December 31, 2016, we believe it is reasonably possible that our gross liabilities for UTBs may decrease by approximately
$63 million
within the succeeding 12 months due to the resolution of state audits.
Interest and penalties related to UTBs are included in our provision for income taxes. During
2016
,
2015
and
2014
, we recognized income tax expense of approximately
$125 million
,
$17 million
and
$35 million
, respectively, of interest and penalties through the income tax provision in the Consolidated Statements of Income. At
December 31, 2016
and
2015
, accrued interest and penalties associated with UTBs totaled approximately
$276 million
and
$151 million
, respectively.
The reconciliations between the federal statutory tax rate applied to income before income taxes and our effective tax rate were as follows:
|
Years ended December 31,
|
||||||||
|
2016
|
2015
|
2014
|
||||||
|
Federal statutory tax rate
|
35.0
|
%
|
35.0
|
%
|
35.0
|
%
|
||
|
Foreign earnings, including earnings invested indefinitely
|
(15.5
|
)%
|
(18.1
|
)%
|
(22.4
|
)%
|
||
|
Credits, Puerto Rico Excise Tax
|
(2.3
|
)%
|
(2.5
|
)%
|
(4.4
|
)%
|
||
|
Share-based payments
|
(1.3
|
)%
|
—
|
%
|
—
|
%
|
||
|
Credits, primarily federal R&D
|
(0.7
|
)%
|
(1.4
|
)%
|
(1.5
|
)%
|
||
|
State taxes
|
0.1
|
%
|
0.1
|
%
|
0.7
|
%
|
||
|
Audit settlements (federal, state, foreign)
|
—
|
%
|
(0.5
|
)%
|
—
|
%
|
||
|
Other, net
|
0.4
|
%
|
0.4
|
%
|
0.2
|
%
|
||
|
Effective tax rate
|
15.7
|
%
|
13.0
|
%
|
7.6
|
%
|
||
The effective tax rates for the years ended December 31, 2016, 2015 and 2014, are different from the federal statutory rates primarily as a result of indefinitely invested earnings of our foreign operations. We do not provide for U.S. income taxes on undistributed earnings of our foreign operations that are intended to be invested indefinitely outside the United States. Substantially all of the benefit from foreign earnings on our effective tax rate results from foreign income associated with the Company’s operation conducted in Puerto Rico, a territory of the United States that is treated as a foreign jurisdiction for U.S. tax purposes, and is subject to tax incentive grants through 2035. At
December 31, 2016
, the cumulative amount of these earnings was approximately
$36.6 billion
. If these earnings were repatriated to the United States, we would be required to recognize and pay approximately
$12.8 billion
of additional income taxes based on the current tax rates in effect.
Puerto Rico imposes an excise tax on the gross intercompany purchase price of goods and services from our manufacturer in Puerto Rico. The rate of
4%
was recently extended and is now set to expire December 31, 2027. We account for the excise tax as a manufacturing cost that is capitalized in inventory and expensed in cost of sales when the related products are sold. For U.S. income tax purposes, the excise tax results in foreign tax credits that are generally recognized in our provision for income taxes when the excise tax is incurred.
F-18
Income taxes paid during the years ended
December 31, 2016
,
2015
and
2014
, totaled
$1.1 billion
,
$919 million
and
$269 million
, respectively.
One or more of our legal entities file income tax returns in the U.S. federal jurisdiction, various U.S. state jurisdictions and certain foreign jurisdictions. Our income tax returns are routinely audited by the tax authorities in those jurisdictions. Significant disputes may arise with these tax authorities involving issues of the timing and amount of deductions, the use of tax credits and allocations of income and expense among various tax jurisdictions because of differing interpretations of tax laws, regulations and the interpretation of the relevant facts. We are no longer subject to U.S. federal income tax examinations for tax years ended on or before December 31, 2009, or to California state income tax examinations for tax years ended on or before December 31, 2008. We are currently under audit by the IRS for tax years ended December 31, 2010, 2011 and 2012.
6. Earnings per share
The computation of basic earnings per share (EPS) is based on the weighted-average number of our common shares outstanding. The computation of diluted EPS is based on the weighted-average number of our common shares outstanding and dilutive potential common shares, which include primarily shares that may be issued under our stock option, restricted stock and performance unit award programs, as determined using the treasury stock method (collectively, dilutive securities).
The computation for basic and diluted EPS was as follows (in millions, except per share data):
|
Years ended December 31,
|
|||||||||||
|
2016
|
2015
|
2014
|
|||||||||
|
Income (Numerator):
|
|||||||||||
|
Net income for basic and diluted EPS
|
$
|
7,722
|
|
$
|
6,939
|
|
$
|
5,158
|
|
||
|
Shares (Denominator):
|
|||||||||||
|
Weighted-average shares for basic EPS
|
748
|
|
758
|
|
759
|
|
|||||
|
Effect of dilutive securities
|
6
|
|
8
|
|
11
|
|
|||||
|
Weighted-average shares for diluted EPS
|
754
|
|
766
|
|
770
|
|
|||||
|
Basic EPS
|
$
|
10.32
|
|
$
|
9.15
|
|
$
|
6.80
|
|
||
|
Diluted EPS
|
$
|
10.24
|
|
$
|
9.06
|
|
$
|
6.70
|
|
||
For each of the three years ended
December 31, 2016
, the number of anti-dilutive employee stock-based awards excluded from the computation of diluted EPS was not significant.
7. Collaborative arrangements
A collaborative arrangement is a contractual arrangement that involves a joint operating activity. These arrangements involve two or more parties who are both: (i) active participants in the activity and (ii) exposed to significant risks and rewards dependent on the commercial success of the activity.
From time to time, we enter into collaborative arrangements for the R&D, manufacture and/or commercialization of products and/or product candidates. These collaborations generally provide for non-refundable upfront license fees, development and commercial performance milestone payments, cost sharing, royalty payments and/or profit sharing. Our collaboration agreements are performed with no guarantee of either technological or commercial success and each is unique in nature. Our significant arrangements are discussed below.
Pfizer Inc.
The co-promotion term of our Enbrel
®
collaboration agreement with Pfizer Inc. (Pfizer) in the United States and Canada expired on October 31, 2013. Under this agreement, we paid Pfizer a profit share until October 31, 2013, and residual royalties from November 1, 2013 to October 31, 2016, which were significantly less than the profit share payments. In 2016, the residual royalty payments were
10%
of the annual net ENBREL sales in the United States and Canada. Effective November 1, 2016, there are no further royalty payments.
F-19
During the years ended December 31, 2016, 2015 and 2014, residual royalties due to Pfizer on ENBREL sales were
$470 million
,
$561 million
, and
$509 million
respectively. These amounts are included in Selling, general and administrative expense in the Consolidated Statements of Income.
UCB
We are in a collaboration with UCB for the development and commercialization of EVENITY
™
. In 2016, we amended the commercialization rights and responsibilities of the parties. Under the amended agreement, we have the rights to commercialize EVENITY
™
for all indications in the United States and Japan. UCB has the rights for Europe, China and Brazil. The rest of the countries have been allocated to Amgen. Generally, development costs and future worldwide commercialization profits and losses related to the collaboration after accounting for expenses are shared equally. The collaboration agreement will continue in effect unless terminated earlier in accordance with its terms. During the years ended
December 31, 2016
,
2015
and
2014
, the net costs recovered from UCB were
$48 million
,
$60 million
and
$96 million
, respectively, which are included primarily in Research and development expense in the Consolidated Statements of Income.
Bayer HealthCare Pharmaceuticals Inc.
We are in a collaboration with Bayer HealthCare Pharmaceuticals Inc. (Bayer) to jointly develop and commercialize Nexavar
®
worldwide, except in Japan. The rights to develop and market Nexavar
®
in Japan are reserved to Bayer. Nexavar
®
is currently marketed and sold in more than
100
countries around the world for the treatment of unresectable liver cancer and advanced kidney cancer. In the United States, Nexavar
®
is also approved for the treatment of patients with locally recurrent or metastatic, progressive, differentiated thyroid carcinoma refractory to radioactive iodine treatment.
In 2015, we amended the terms of our collaboration agreement with Bayer, which terminated the co-promotion agreement in the United States, and transferred all U.S. operational responsibilities to Bayer, including commercial and medical affairs activities. Prior to the termination of the co-promotion agreement, we co-promoted Nexavar
®
with Bayer and shared equally in the profits or losses in the United States. In lieu of this profit share, Bayer now pays Amgen a royalty on U.S. sales of Nexavar
®
at a percentage rate in the
high 30
s. Amgen no longer contributes sales force personnel or medical liaisons to support Nexavar
®
in the United States. There are no changes to the global research and development or non-U.S. profit share arrangements in the original agreement, as discussed below.
In all countries outside the United States, excluding Japan, Bayer manages all commercialization activities and incurs all of the sales and marketing expenditures and mutually agreed R&D expenses, for which we continue to reimburse Bayer for half. In these countries, we continue to receive
50%
of net profits on sales of Nexavar
®
after deducting certain Bayer-related costs.
The agreement with Bayer will terminate at the later of the date when patents expire that were issued in connection with product candidates discovered under the agreement, or on the last day when we or Bayer market or sell products commercialized under the agreement anywhere in the world.
During the years ended December 31, 2016, 2015 and 2014, Amgen recorded Nexavar
®
net profits of
$167 million
,
$257 million
and
$324 million
, respectively, which were recognized as Other revenues in the Consolidated Statements of Income. Pursuant to the 2015 amendment to the agreement, Amgen recorded royalty income on the U.S. sales of Nexavar
®
subsequent to the termination of the co-promotion. During the years ended December 31, 2016 and 2015, Amgen recorded royalty income of
$137 million
and
$72 million
, respectively, in Other revenues in the Consolidated Statements of Income. In addition, during the years ended December 31, 2016, 2015, and 2014, net R&D expenses related to the agreement were not material.
Other
In addition to the collaborations discussed above, we have various others that are not individually significant to our business at this time. Pursuant to the terms of those agreements, we may be required to pay or we may receive additional amounts upon the achievement of various development and commercial milestones which in the aggregate could be significant. We may also incur or have reimbursed to us significant R&D costs if the related product candidate were to advance to late stage clinical trials. In addition, if any products related to these collaborations are approved for sale, we may be required to pay or we may receive significant royalties on future sales. The payment of these amounts, however, is contingent upon the occurrence of various future events, which have a high degree of uncertainty of occurrence.
F-20
8. Related party transactions
We own a
50%
interest in K-A, a corporation formed in 1984 with Kirin Holdings Company, Limited (Kirin) for the development and commercialization of certain products based on advanced biotechnology. All of our rights to manufacture and market certain products including pegfilgrastim, granulocyte colony-stimulating factor, darbepoetin alfa, recombinant human erythropoietin and romiplostim are pursuant to exclusive licenses from K-A, which we currently market under the brand names Neulasta
®
, NEUPOGEN
®
/GRANULOKINE
®
, Aranesp
®
, EPOGEN
®
, and Nplate
®
, respectively.
We account for our interest in K-A using the equity method and include our share of K-A’s profits or losses in Selling, general and administrative expense in the Consolidated Statements of Income. For the years ended
December 31, 2016
,
2015
and
2014
, our share of K-A’s profits were
$58 million
,
$65 million
and
$30 million
, respectively. The carrying value of our equity method investment in K-A was approximately
$501 million
and
$443 million
as of
December 31, 2016
and
2015
, respectively, and is included in noncurrent Other assets in the Consolidated Balance Sheets.
K-A’s revenues consist of royalty income related to its licensed technology rights. K-A receives royalty income from us, as well as from Kirin and Johnson & Johnson under separate product license contracts for certain geographic areas outside the United States. During the years ended
December 31, 2016
,
2015
and
2014
, K-A earned royalties from us of
$239 million
,
$264 million
and
$301 million
, respectively. These amounts are included in Cost of sales in the Consolidated Statements of Income.
K-A’s expenses consist primarily of costs related to R&D activities conducted on its behalf by Amgen and Kirin. K-A pays Amgen and Kirin for such services at negotiated rates. During the years ended
December 31, 2016
,
2015
and
2014
, we earned revenues from K-A of
$31 million
,
$65 million
and
$119 million
, respectively, for certain R&D activities performed on K-A’s behalf. These amounts are recognized as Other revenues in the Consolidated Statements of Income. During the years ended
December 31, 2016
,
2015
and
2014
, we recorded cost recoveries from K-A of
$7 million
,
$90 million
and
$108 million
, respectively, related to certain third-party costs. These amounts are included in Research and development expense in the Consolidated Statements of Income.
As of
December 31, 2016
and
2015
, we owed K-A
$69 million
and
$34 million
, respectively, which is included in Accrued liabilities in the Consolidated Balance Sheets.
F-21
9. Available-for-sale investments
The amortized cost, gross unrealized gains, gross unrealized losses and estimated fair values of available-for-sale investments by type of security were as follows (in millions):
|
Type of security as of December 31, 2016
|
Amortized
cost
|
Gross
unrealized
gains
|
Gross
unrealized
losses
|
Estimated
fair value
|
|||||||||||
|
U.S. Treasury securities
|
$
|
6,681
|
|
$
|
1
|
|
$
|
(68
|
)
|
$
|
6,614
|
|
|||
|
Other government-related debt securities:
|
|||||||||||||||
|
U.S.
|
302
|
|
—
|
|
(3
|
)
|
299
|
|
|||||||
|
Foreign and other
|
1,784
|
|
9
|
|
(34
|
)
|
1,759
|
|
|||||||
|
Corporate debt securities:
|
|||||||||||||||
|
Financial
|
8,476
|
|
21
|
|
(37
|
)
|
8,460
|
|
|||||||
|
Industrial
|
8,793
|
|
59
|
|
(63
|
)
|
8,789
|
|
|||||||
|
Other
|
1,079
|
|
5
|
|
(7
|
)
|
1,077
|
|
|||||||
|
Residential mortgage-backed securities
|
1,968
|
|
1
|
|
(29
|
)
|
1,940
|
|
|||||||
|
Other mortgage- and asset-backed securities
|
1,731
|
|
1
|
|
(13
|
)
|
1,719
|
|
|||||||
|
Money market mutual funds
|
2,782
|
|
—
|
|
—
|
|
2,782
|
|
|||||||
|
Other short-term interest-bearing securities
|
4,188
|
|
—
|
|
—
|
|
4,188
|
|
|||||||
|
Total interest-bearing securities
|
37,784
|
|
97
|
|
(254
|
)
|
37,627
|
|
|||||||
|
Equity securities
|
127
|
|
31
|
|
(4
|
)
|
154
|
|
|||||||
|
Total available-for-sale investments
|
$
|
37,911
|
|
$
|
128
|
|
$
|
(258
|
)
|
$
|
37,781
|
|
|||
|
Type of security as of December 31, 2015
|
Amortized
cost
|
Gross
unrealized
gains
|
Gross
unrealized
losses
|
Estimated
fair value
|
|||||||||||
|
U.S. Treasury securities
|
$
|
4,298
|
|
$
|
—
|
|
$
|
(24
|
)
|
$
|
4,274
|
|
|||
|
Other government-related debt securities:
|
|||||||||||||||
|
U.S.
|
536
|
|
—
|
|
(2
|
)
|
534
|
|
|||||||
|
Foreign and other
|
1,768
|
|
7
|
|
(36
|
)
|
1,739
|
|
|||||||
|
Corporate debt securities:
|
|||||||||||||||
|
Financial
|
7,904
|
|
7
|
|
(40
|
)
|
7,871
|
|
|||||||
|
Industrial
|
7,961
|
|
11
|
|
(136
|
)
|
7,836
|
|
|||||||
|
Other
|
905
|
|
1
|
|
(21
|
)
|
885
|
|
|||||||
|
Residential mortgage-backed securities
|
1,484
|
|
1
|
|
(15
|
)
|
1,470
|
|
|||||||
|
Other mortgage- and asset-backed securities
|
2,524
|
|
—
|
|
(55
|
)
|
2,469
|
|
|||||||
|
Money market mutual funds
|
3,370
|
|
—
|
|
—
|
|
3,370
|
|
|||||||
|
Other short-term interest-bearing securities
|
528
|
|
—
|
|
—
|
|
528
|
|
|||||||
|
Total interest-bearing securities
|
31,278
|
|
27
|
|
(329
|
)
|
30,976
|
|
|||||||
|
Equity securities
|
88
|
|
48
|
|
—
|
|
136
|
|
|||||||
|
Total available-for-sale investments
|
$
|
31,366
|
|
$
|
75
|
|
$
|
(329
|
)
|
$
|
31,112
|
|
|||
F-22
The fair values of available-for-sale investments by classification in the Consolidated Balance Sheets were as follows (in millions):
|
December 31,
|
|||||||
|
Classification in the Consolidated Balance Sheets
|
2016
|
2015
|
|||||
|
Cash and cash equivalents
|
$
|
2,783
|
|
$
|
3,738
|
|
|
|
Marketable securities
|
34,844
|
|
27,238
|
|
|||
|
Other assets — noncurrent
|
154
|
|
136
|
|
|||
|
Total available-for-sale investments
|
$
|
37,781
|
|
$
|
31,112
|
|
|
Cash and cash equivalents in the table above excludes bank account cash of
$458 million
and
$406 million
as of
December 31, 2016
and
2015
, respectively.
The fair values of available-for-sale interest-bearing security investments by contractual maturity, except for mortgage- and asset-backed securities that do not have a single maturity date, were as follows (in millions):
|
December 31,
|
|||||||
|
Contractual maturity
|
2016
|
2015
|
|||||
|
Maturing in one year or less
|
$
|
8,393
|
|
$
|
4,578
|
|
|
|
Maturing after one year through three years
|
10,404
|
|
9,370
|
|
|||
|
Maturing after three years through five years
|
12,157
|
|
9,932
|
|
|||
|
Maturing after five years through ten years
|
2,974
|
|
3,087
|
|
|||
|
Maturing after ten years
|
40
|
|
70
|
|
|||
|
Mortgage- and asset-backed securities
|
3,659
|
|
3,939
|
|
|||
|
Total interest-bearing securities
|
$
|
37,627
|
|
$
|
30,976
|
|
|
For the years ended
December 31, 2016
,
2015
and
2014
, realized gains totaled
$306 million
,
$132 million
and
$149 million
, respectively, and realized losses totaled
$367 million
,
$208 million
and
$150 million
, respectively. The cost of securities sold is based on the specific identification method.
The unrealized losses on available-for-sale investments and their related fair values were as follows (in millions):
|
Less than 12 months
|
12 months or greater
|
|||||||||||||||
|
Type of security as of December 31, 2016
|
Fair value
|
Unrealized losses
|
Fair value
|
Unrealized losses
|
||||||||||||
|
U.S. Treasury securities
|
$
|
5,774
|
|
$
|
(68
|
)
|
$
|
—
|
|
$
|
—
|
|
||||
|
Other government-related debt securities:
|
||||||||||||||||
|
U.S.
|
201
|
|
(3
|
)
|
—
|
|
—
|
|
||||||||
|
Foreign and other
|
1,192
|
|
(34
|
)
|
17
|
|
—
|
|
||||||||
|
Corporate debt securities:
|
||||||||||||||||
|
Financial
|
3,975
|
|
(37
|
)
|
44
|
|
—
|
|
||||||||
|
Industrial
|
3,913
|
|
(61
|
)
|
149
|
|
(2
|
)
|
||||||||
|
Other
|
486
|
|
(7
|
)
|
7
|
|
—
|
|
||||||||
|
Residential mortgage-backed securities
|
1,631
|
|
(26
|
)
|
158
|
|
(3
|
)
|
||||||||
|
Other mortgage- and asset-backed securities
|
1,087
|
|
(10
|
)
|
118
|
|
(3
|
)
|
||||||||
|
Equity securities
|
22
|
|
(4
|
)
|
—
|
|
—
|
|
||||||||
|
Total
|
$
|
18,281
|
|
$
|
(250
|
)
|
$
|
493
|
|
$
|
(8
|
)
|
||||
F-23
|
Less than 12 months
|
12 months or greater
|
|||||||||||||||
|
Type of security as of December 31, 2015
|
Fair value
|
Unrealized losses
|
Fair value
|
Unrealized losses
|
||||||||||||
|
U.S. Treasury securities
|
$
|
4,196
|
|
$
|
(24
|
)
|
$
|
—
|
|
$
|
—
|
|
||||
|
Other government-related debt securities:
|
||||||||||||||||
|
U.S.
|
494
|
|
(2
|
)
|
20
|
|
—
|
|
||||||||
|
Foreign and other
|
1,306
|
|
(32
|
)
|
56
|
|
(4
|
)
|
||||||||
|
Corporate debt securities:
|
||||||||||||||||
|
Financial
|
5,988
|
|
(38
|
)
|
228
|
|
(2
|
)
|
||||||||
|
Industrial
|
5,427
|
|
(108
|
)
|
679
|
|
(28
|
)
|
||||||||
|
Other
|
807
|
|
(19
|
)
|
39
|
|
(2
|
)
|
||||||||
|
Residential mortgage-backed securities
|
804
|
|
(8
|
)
|
304
|
|
(7
|
)
|
||||||||
|
Other mortgage- and asset-backed securities
|
1,834
|
|
(19
|
)
|
561
|
|
(36
|
)
|
||||||||
|
Total
|
$
|
20,856
|
|
$
|
(250
|
)
|
$
|
1,887
|
|
$
|
(79
|
)
|
||||
The primary objective of our investment portfolio is to enhance overall returns in an efficient manner while maintaining safety of principal, prudent levels of liquidity and acceptable levels of risk. Our investment policy limits interest-bearing security investments to certain types of debt and money market instruments issued by institutions with primarily investment-grade credit ratings, and it places restrictions on maturities and concentration by asset class and issuer.
We review our available-for-sale investments for other-than-temporary declines in fair value below our cost basis each quarter and whenever events or changes in circumstances indicate that the cost basis of an asset may not be recoverable. The evaluation is based on a number of factors, including the length of time and the extent to which the fair value has been below our cost basis and adverse conditions related specifically to the security, including any changes to the credit rating of the security, and the intent to sell, or whether we will more likely than not be required to sell, the security before recovery of its amortized cost basis. Our assessment of whether a security is other-than-temporarily impaired could change in the future based on new developments or changes in assumptions related to that particular security. As of December 31, 2016 and 2015, we believe the cost bases for our available-for-sale investments were recoverable in all material aspects.
10. Inventories
Inventories consisted of the following (in millions):
|
December 31,
|
|||||||
|
2016
|
2015
|
||||||
|
Raw materials
|
$
|
225
|
|
$
|
201
|
|
|
|
Work in process
|
1,608
|
|
1,529
|
|
|||
|
Finished goods
|
912
|
|
705
|
|
|||
|
Total inventories
|
$
|
2,745
|
|
$
|
2,435
|
|
|
F-24
11. Property, plant and equipment
Property, plant and equipment consisted of the following (dollar amounts in millions):
|
December 31,
|
||||||||||
|
Useful life (in years)
|
2016
|
2015
|
||||||||
|
Land
|
—
|
|
$
|
295
|
|
$
|
319
|
|
||
|
Buildings and improvements
|
10-40
|
|
3,640
|
|
3,638
|
|
||||
|
Manufacturing equipment
|
8-12
|
|
2,275
|
|
2,051
|
|
||||
|
Laboratory equipment
|
8-12
|
|
1,092
|
|
1,140
|
|
||||
|
Other
|
3-15
|
|
4,380
|
|
4,278
|
|
||||
|
Construction in progress
|
—
|
|
745
|
|
746
|
|
||||
|
Property, plant and equipment, gross
|
12,427
|
|
12,172
|
|
||||||
|
Less accumulated depreciation and amortization
|
(7,466
|
)
|
(7,265
|
)
|
||||||
|
Property, plant and equipment, net
|
$
|
4,961
|
|
$
|
4,907
|
|
||||
During the years ended
December 31, 2016
,
2015
and
2014
, we recognized depreciation and amortization charges associated with our property, plant and equipment of
$619 million
,
$727 million
and
$716 million
, respectively.
12. Goodwill and other intangible assets
Goodwill
Changes in the carrying amounts of goodwill were as follows (in millions):
|
During the years ended December 31,
|
|||||||
|
2016
|
2015
|
||||||
|
Beginning balance
|
$
|
14,787
|
|
$
|
14,788
|
|
|
|
Goodwill related to acquisitions of businesses
(1)
|
2
|
|
108
|
|
|||
|
Currency translation adjustments
|
(38
|
)
|
(109
|
)
|
|||
|
Ending balance
|
$
|
14,751
|
|
$
|
14,787
|
|
|
|
(1)
|
Consists of goodwill recognized on the acquisition dates of business combinations and subsequent adjustments to these amounts resulting from changes to the acquisition date fair values of net assets acquired in the business combinations recorded during their respective measurement periods.
|
Identifiable intangible assets
Identifiable intangible assets consisted of the following (in millions):
|
December 31,
|
|||||||||||||||||||||||
|
|
2016
|
2015
|
|||||||||||||||||||||
|
|
Gross
carrying
amount
|
Accumulated
amortization
|
Intangible
assets, net
|
Gross
carrying
amount
|
Accumulated
amortization
|
Intangible
assets, net
|
|||||||||||||||||
|
Finite-lived intangible assets:
|
|||||||||||||||||||||||
|
Developed product technology rights
|
$
|
12,534
|
|
$
|
(5,947
|
)
|
$
|
6,587
|
|
$
|
12,310
|
|
$
|
(4,996
|
)
|
$
|
7,314
|
|
|||||
|
Licensing rights
|
3,275
|
|
(1,300
|
)
|
1,975
|
|
3,275
|
|
(998
|
)
|
2,277
|
|
|||||||||||
|
Marketing-related rights
|
1,333
|
|
(793
|
)
|
540
|
|
1,186
|
|
(650
|
)
|
536
|
|
|||||||||||
|
R&D technology rights
|
1,122
|
|
(704
|
)
|
418
|
|
1,134
|
|
(635
|
)
|
499
|
|
|||||||||||
|
Total finite-lived intangible assets
|
18,264
|
|
(8,744
|
)
|
9,520
|
|
17,905
|
|
(7,279
|
)
|
10,626
|
|
|||||||||||
|
Indefinite-lived intangible assets:
|
|||||||||||||||||||||||
|
IPR&D
|
759
|
|
—
|
|
759
|
|
1,015
|
|
—
|
|
1,015
|
|
|||||||||||
|
Total identifiable intangible assets
|
$
|
19,023
|
|
$
|
(8,744
|
)
|
$
|
10,279
|
|
$
|
18,920
|
|
$
|
(7,279
|
)
|
$
|
11,641
|
|
|||||
F-25
Developed product technology rights consist of rights related to marketed products acquired in business combinations. Licensing rights consist primarily of contractual rights acquired in business combinations to receive future milestones, royalties and profit sharing payments, capitalized payments to third parties for milestones related to regulatory approvals to commercialize products and up-front payments associated with royalty obligations for marketed products. Marketing-related intangible assets consist primarily of rights related to the sale and distribution of marketed products. R&D technology rights consist of technology used in R&D with alternative future uses.
IPR&D consists of R&D projects acquired in a business combination that are not complete at the time of acquisition due to remaining technological risks and/or lack of receipt of the required regulatory approvals. As of December 31, 2016, the projects include primarily AMG 899, acquired in the acquisition of Dezima (see Note 3, Business combinations) and oprozomib, acquired in the acquisition of Onyx Pharmaceuticals, Inc. (Onyx) in 2013.
In November 2016, we announced that the European Commission (EC) granted marketing authorization for Parsabiv
™
acquired in the acquisition of KAI Pharmaceuticals in 2012, for the treatment of secondary hyperparathyroidism (sHPT) in adult patients with chronic kidney disease on hemodialysis. As a result, the
$240 million
carrying value of Parsabiv
™
was reclassified from IPR&D to Developed product technology rights during 2016 and is being amortized over its useful life.
All IPR&D projects have major risks and uncertainties associated with the timely and successful completion of development and commercialization of these product candidates, including our ability to confirm their safety and efficacy based on data from clinical trials, our ability to obtain necessary regulatory approvals and our ability to successfully complete these tasks within budgeted costs. We are not permitted to market a human therapeutic without obtaining regulatory approvals, and such approvals require our completing clinical trials that demonstrate a product candidate is safe and effective. In addition, the availability and extent of coverage and reimbursement from third-party payers, including government healthcare programs and private insurance plans, as well as competitive product launches, impact the revenues a product can generate. Consequently, the eventual realized value, if any, of these acquired IPR&D projects may vary from their estimated fair values. We review IPR&D projects for impairment annually, whenever events or changes in circumstances indicate that the carrying amount may not be recoverable and upon the establishment of technological feasibility or regulatory approval.
During the years ended
December 31, 2016
,
2015
and
2014
, we recognized amortization charges associated with our finite-lived intangible assets, included primarily in Cost of sales in the Consolidated Statements of Income, of
$1.5 billion
,
$1.4 billion
and
$1.4 billion
, respectively. The total estimated amortization for each of the next five years for our intangible assets is
$1.3 billion
,
$1.2 billion
,
$1.1 billion
,
$1.1 billion
and
$0.9 billion
in
2017
,
2018
,
2019
,
2020
and
2021
, respectively.
13. Accrued liabilities
Accrued liabilities consisted of the following (in millions):
|
December 31,
|
|||||||
|
2016
|
2015
|
||||||
|
Sales deductions
|
$
|
1,874
|
|
$
|
1,486
|
|
|
|
Employee compensation and benefits
|
920
|
|
916
|
|
|||
|
Dividends payable
|
849
|
|
754
|
|
|||
|
Clinical development costs
|
395
|
|
491
|
|
|||
|
Sales returns reserve
|
437
|
|
390
|
|
|||
|
Other
|
1,409
|
|
1,415
|
|
|||
|
Total accrued liabilities
|
$
|
5,884
|
|
$
|
5,452
|
|
|
F-26
14. Financing arrangements
The carrying values and the fixed contractual coupon rates of our borrowings were as follows (in millions):
|
December 31,
|
|||||||
|
2016
|
2015
|
||||||
|
2.30% notes due 2016 (2.30% 2016 Notes)
|
$
|
—
|
|
$
|
750
|
|
|
|
2.50% notes due 2016 (2.50% 2016 Notes)
|
—
|
|
1,000
|
|
|||
|
Short-term loan
|
605
|
|
—
|
|
|||
|
2.125% notes due 2017 (2.125% 2017 Notes)
|
1,250
|
|
1,250
|
|
|||
|
Floating Rate Notes due 2017
|
600
|
|
600
|
|
|||
|
1.25% notes due 2017 (1.25% 2017 Notes)
|
850
|
|
850
|
|
|||
|
5.85% notes due 2017 (5.85% 2017 Notes)
|
1,100
|
|
1,100
|
|
|||
|
6.15% notes due 2018 (6.15% 2018 Notes)
|
500
|
|
500
|
|
|||
|
Term Loan due 2018
|
—
|
|
1,975
|
|
|||
|
4.375% €550 million notes due 2018 (4.375% 2018 euro Notes)
|
577
|
|
599
|
|
|||
|
5.70% notes due 2019 (5.70% 2019 Notes)
|
1,000
|
|
1,000
|
|
|||
|
Floating Rate Notes due 2019
|
250
|
|
250
|
|
|||
|
2.20% notes due 2019 (2.20% 2019 Notes)
|
1,400
|
|
1,400
|
|
|||
|
2.125% €675 million notes due 2019 (2.125% 2019 euro Notes)
|
710
|
|
733
|
|
|||
|
4.50% notes due 2020 (4.50% 2020 Notes)
|
300
|
|
300
|
|
|||
|
2.125% notes due 2020 (2.125% 2020 Notes)
|
750
|
|
750
|
|
|||
|
3.45% notes due 2020 (3.45% 2020 Notes)
|
900
|
|
900
|
|
|||
|
4.10% notes due 2021 (4.10% 2021 Notes)
|
1,000
|
|
1,000
|
|
|||
|
1.85% notes due 2021 (1.85% 2021 Notes)
|
750
|
|
—
|
|
|||
|
3.875% notes due 2021 (3.875% 2021 Notes)
|
1,750
|
|
1,750
|
|
|||
|
1.25% €1,250 million notes due 2022 (1.25% 2022 euro Notes)
|
1,315
|
|
—
|
|
|||
|
2.70% notes due 2022 (2.70% 2022 Notes)
|
500
|
|
500
|
|
|||
|
3.625% notes due 2022 (3.625% 2022 Notes)
|
750
|
|
750
|
|
|||
|
0.41% CHF700 million bonds due 2023 (0.41% 2023 Swiss franc Bonds)
|
687
|
|
—
|
|
|||
|
2.25% notes due 2023 (2.25% 2023 Notes)
|
750
|
|
—
|
|
|||
|
3.625% notes due 2024 (3.625% 2024 Notes)
|
1,400
|
|
1,400
|
|
|||
|
3.125% notes due 2025 (3.125% 2025 Notes)
|
1,000
|
|
1,000
|
|
|||
|
2.00% €750 million notes due 2026 (2.00% 2026 euro Notes)
|
789
|
|
—
|
|
|||
|
2.60% notes due 2026 (2.60% 2026 notes)
|
1,250
|
|
—
|
|
|||
|
5.50% £475 million notes due 2026 (5.50% 2026 pound sterling Notes)
|
586
|
|
700
|
|
|||
|
4.00% £700 million notes due 2029 (4.00% 2029 pound sterling Notes)
|
864
|
|
1,032
|
|
|||
|
6.375% notes due 2037 (6.375% 2037 Notes)
|
552
|
|
900
|
|
|||
|
6.90% notes due 2038 (6.90% 2038 Notes)
|
291
|
|
500
|
|
|||
|
6.40% notes due 2039 (6.40% 2039 Notes)
|
466
|
|
1,000
|
|
|||
|
5.75% notes due 2040 (5.75% 2040 Notes)
|
412
|
|
700
|
|
|||
|
4.95% notes due 2041 (4.95% 2041 Notes)
|
600
|
|
600
|
|
|||
|
5.15% notes due 2041 (5.15% 2041 Notes)
|
974
|
|
2,250
|
|
|||
|
5.65% notes due 2042 (5.65% 2042 Notes)
|
487
|
|
1,250
|
|
|||
|
5.375% notes due 2043 (5.375% 2043 Notes)
|
261
|
|
1,000
|
|
|||
|
4.40% notes due 2045 (4.40% 2045 Notes)
|
2,250
|
|
1,250
|
|
|||
|
4.563% notes due 2048 (4.563% 2048 Notes)
|
1,415
|
|
—
|
|
|||
|
4.663% notes due 2051 (4.663% 2051 Notes)
|
3,541
|
|
—
|
|
|||
|
Other notes due 2097
|
100
|
|
100
|
|
|||
|
Unamortized bond discounts, premiums and issuance costs, net
|
(936
|
)
|
(210
|
)
|
|||
|
Total carrying value of debt
|
34,596
|
|
31,429
|
|
|||
|
Less current portion
|
(4,403
|
)
|
(2,247
|
)
|
|||
|
Total noncurrent debt
|
$
|
30,193
|
|
$
|
29,182
|
|
|
F-27
There are no material differences between the effective interest rates and coupon rates of any of our borrowings, except for the
4.563%
2048 Notes and the
4.663%
2051 Notes, which have effective interest rates of approximately
6.3%
and
5.6%
, respectively.
Under the terms of all of our outstanding notes (including debt exchange issuances discussed below), except our Other notes, in the event of a change-in-control triggering event, we may be required to purchase all or a portion of these debt securities at a price equal to
101%
of the principal amount of the notes plus accrued and unpaid interest. In addition, all of our outstanding notes, except for our floating rate notes,
0.41%
2023 Swiss franc Bonds and Other notes, may be redeemed at any time at our option, in whole or in part, at the principal amount of the notes being redeemed plus accrued and unpaid interest and, except as discussed below, a make-whole amount, which is defined by the terms of the notes. Redeemable notes that were issued during 2016, 2015 and 2014 (discussed below), except the
1.25%
2017 Notes, may be redeemed without payment of the make-whole amount if redemption occurs during a specified period of time immediately prior to the maturity dates of the notes. Such time periods range from one to six months prior to the maturity date.
Debt repayments
In 2016, we repaid
$3.7 billion
of debt, including the remaining
$1.975 billion
of principal on our Term Loan Credit Facility (Term Loan), the
$750 million
aggregate principal amount of the
2.30%
2016 Notes and the
$1.0 billion
aggregate principal amount of the
2.50%
2016 Notes. In 2015, we repaid
$2.4 billion
of principal on our Term Loan. In 2014, we repaid
$5.6 billion
of debt, including
$500 million
of principal on our Term Loan.
Debt issuances
We issued debt and debt securities in various offerings during the years ended
December 31, 2016
, 2015 and 2014 including:
|
•
|
In 2016, we issued
$6.7 billion
principal amount of notes, consisting of the
1.85%
2021 Notes,
1.25%
2022 euro Notes,
0.41%
2023 Swiss franc Bonds,
2.25%
2023 Notes,
2.00%
2026 euro Notes,
2.60%
2026 Notes and
$1.0 billion
of the
4.40%
2045 Notes. We received a
$79 million
premium on the
4.40%
2045 Notes. In addition, we borrowed
$605 million
under a short-term floating rate loan,
which was repaid in January 2017.
|
|
•
|
In 2015, we issued
$3.5 billion
aggregate principal amount of notes, consisting of the
2.125%
2020 Notes, the
2.70%
2022 Notes, the
3.125%
2025 Notes and
$1.25 billion
of the
4.40%
2045 Notes.
|
|
•
|
In 2014, we issued
$4.5 billion
aggregate principal amount of notes, composed of the Floating Rate Notes due 2017, the
1.25%
2017 Notes, the Floating Rate Notes due 2019, the
2.20%
2019 Notes and the
3.625%
2024 Notes. The Floating Rate Notes due in 2017 and 2019 bear interest equal to three-month London Interbank Offered Rates (LIBOR) plus
0.38%
and three-month LIBOR plus
0.60%
, respectively, and are not subject to redemption at our option.
|
Debt exchange
During 2016, we completed a private offering to exchange portions of certain outstanding senior notes due 2037 through 2043 (collectively, the Old Notes), listed below, for new senior notes, consisting of principal amounts of
$1.4 billion
of
4.563%
2048 Notes and
$3.5 billion
of
4.663%
2051 Notes (collectively, the New Notes).
The following principal amounts of each series of Old Notes were validly tendered and subsequently canceled (in millions):
|
Principal Amount Exchanged
|
||||||
|
6.375% 2037 Notes
|
$
|
348
|
|
|||
|
6.90% 2038 Notes
|
209
|
|
||||
|
6.40% 2039 Notes
|
534
|
|
||||
|
5.75% 2040 Notes
|
288
|
|
||||
|
5.15% 2041 Notes
|
1,276
|
|
||||
|
5.65% 2042 Notes
|
763
|
|
||||
|
5.375% 2043 Notes
|
739
|
|
||||
The New Notes bear lower fixed coupon rates while requiring higher principal repayments on extended maturity dates, compared with the Old Notes that were exchanged. There were no other significant changes to the terms between the Old Notes and the New Notes. The exchange was accounted for as a debt modification, and there were no cash payments to or cash receipts from the note holders as a result of the exchange. Existing deferred financing costs associated with the Old Notes, as well as
F-28
discounts associated with the New Notes aggregating
$801 million
, are being accreted over the term of the New Notes and recorded as Interest expense, net. Transaction costs of
$24 million
incurred for the exchange were expensed immediately in Interest and other income, net.
Term Loan Credit Facility
In 2013, we borrowed
$5.0 billion
under a Term Loan which bears interest at a floating rate based on
LIBOR
plus additional interest, initially
1%
, which could have varied based on the credit ratings assigned to our long-term debt by Standard & Poor’s Financial Services LLC (S&P) and Moody’s Investor Service, Inc. (Moody’s). A minimum of
$125 million
of the principal amount of the loan was to be repaid at the end of each quarter, with the balance due on October 1, 2018. The outstanding balance of this loan was repaid in whole during 2016 without penalty.
Interest rate swaps
To achieve a desired mix of fixed and floating interest rate debt, we entered into interest rate swap contracts that effectively converted a fixed-rate interest coupon for certain of our debt issuances to a floating LIBOR-based coupon over the life of the respective note. These interest rate swap contracts qualified and are designated as fair value hedges. As of December 31, 2016 and 2015, we had
$6.65 billion
aggregate notional amount of interest rate swap contracts outstanding. The effective interest rates on these notes after giving effect to the related interest rate swap contracts and the related notional amounts of the contracts were as follows as of December 31, 2016 (dollar amounts in millions):
|
Notes
|
Effective interest rate
|
Notional amount
|
|||
|
1.25% 2017 Notes
|
LIBOR + 0.4%
|
$
|
850
|
|
|
|
2.20% 2019 Notes
|
LIBOR + 0.6%
|
1,400
|
|
||
|
3.45% 2020 Notes
|
LIBOR + 1.1%
|
900
|
|
||
|
4.10% 2021 Notes
|
LIBOR + 1.7%
|
1,000
|
|
||
|
3.875% 2021 Notes
|
LIBOR + 2.0%
|
1,750
|
|
||
|
3.625% 2022 Notes
|
LIBOR + 1.6%
|
750
|
|
||
|
$
|
6,650
|
|
|||
Cross-currency swaps
In order to hedge our exposure to foreign currency exchange rate risk associated with certain of our long-term notes denominated in foreign currencies, we entered into cross-currency swap contracts. The terms of these contracts effectively convert the interest payments and principal repayment on our
2.125%
2019 euro Notes,
1.25%
2022 euro Notes,
0.41%
2023 Swiss franc Bonds,
2.00%
2026 euro Notes,
5.50%
2026 pound sterling Notes and
4.00%
2029 pound sterling Notes from euros, pounds sterling and Swiss francs to U.S. dollars. These cross-currency swap contracts have been designated as cash flow hedges. For information regarding the terms of these contracts, see Note 17, Derivative instruments.
Shelf registration statements and other facilities
As of
December 31, 2016
, we have a commercial paper program that allows us to issue up to
$2.5 billion
of unsecured commercial paper to fund our working capital needs. At
December 31, 2016
and
2015
, we had
no
amounts outstanding under our commercial paper program.
In 2014, we entered into a
$2.5 billion
syndicated, unsecured, revolving credit agreement which is available for general corporate purposes or as a liquidity backstop to our commercial paper program. The commitments under the revolving credit agreement may be increased by up to
$500 million
with the agreement of the banks. Each bank which is a party to the agreement has an initial commitment term of
five
years. We extended this term by
one
year during 2016 and may extend the term for an additional year with the agreement of the banks. Annual commitment fees for this agreement are
0.09%
of the unused portion of the facility based on our current credit rating. Generally, we would be charged interest at LIBOR plus
1%
for any amounts borrowed under this facility. As of
December 31, 2016
and
2015
,
no
amounts were outstanding under this facility.
In 2014, we filed a shelf registration statement with the SEC that allows us to issue unspecified amounts of debt securities; common stock; preferred stock; warrants to purchase debt securities, common stock, preferred stock or depositary shares; rights to purchase common stock or preferred stock; securities purchase contracts; securities purchase units; and depositary shares. Under this shelf registration statement, all of the securities available for issuance may be offered from time to time with terms to be determined at the time of issuance. This shelf registration statement expires on February 23, 2017, and is expected to be renewed before its expiration date.
F-29
In 1997, we established a
$400 million
medium-term note program under which medium-term debt securities may be offered from time to time with terms to be determined at the time of issuance. As of
December 31, 2016
and
2015
,
no
securities were outstanding under this medium-term note program.
Certain of our financing arrangements contain non-financial covenants. In addition, our revolving credit agreement includes a financial covenant with respect to the level of our borrowings in relation to our equity, as defined. We were in compliance with all applicable covenants under these arrangements as of
December 31, 2016
.
Contractual maturities of debt obligations
The aggregate contractual maturities of all borrowings due subsequent to
December 31, 2016
, are as follows (in millions):
|
Maturity date
|
Amount
|
||
|
2017
|
$
|
4,405
|
|
|
2018
|
1,076
|
|
|
|
2019
|
3,360
|
|
|
|
2020
|
1,950
|
|
|
|
2021
|
3,500
|
|
|
|
Thereafter
|
21,241
|
|
|
|
Total
|
$
|
35,532
|
|
Interest costs
Interest costs are expensed as incurred, except to the extent such interest is related to construction in progress, in which case interest is capitalized. Interest expense, net, for the years ended
December 31, 2016
,
2015
and
2014
, was
$1.3 billion
,
$1.1 billion
and
$1.1 billion
, respectively. Interest costs capitalized for the years ended
December 31, 2016
,
2015
and
2014
, were not material. Interest paid, including the ongoing impact and settlements of interest rate and cross-currency swap contracts, during the years ended
December 31, 2016
,
2015
and
2014
, totaled
$1.2 billion
,
$1.0 billion
and
$1.1 billion
, respectively.
15. Stockholders’ equity
Stock repurchase program
Activity under our stock repurchase program, on a trade date basis, was as follows (in millions):
|
During the years ended December 31,
|
||||||||||||||||||||
|
2016
|
2015
|
2014
|
||||||||||||||||||
|
Shares
|
Dollars
|
Shares
|
Dollars
|
Shares
|
Dollars
|
|||||||||||||||
|
First quarter
|
4.7
|
|
$
|
690
|
|
2.9
|
|
$
|
451
|
|
—
|
|
$
|
—
|
|
|||||
|
Second quarter
|
3.9
|
|
591
|
|
3.3
|
|
515
|
|
—
|
|
—
|
|
||||||||
|
Third quarter
|
4.4
|
|
747
|
|
4.6
|
|
703
|
|
—
|
|
—
|
|
||||||||
|
Fourth quarter
|
6.7
|
|
999
|
|
1.2
|
|
184
|
|
0.9
|
|
153
|
|
||||||||
|
Total stock repurchases
|
19.7
|
|
$
|
3,027
|
|
12.0
|
|
$
|
1,853
|
|
0.9
|
|
$
|
153
|
|
|||||
As of December 31, 2016,
$4.1 billion
, remained available under our stock repurchase program.
Dividends
Our Board of Directors declared quarterly dividends per share of
$1.00
,
$0.79
, and
$0.61
that were paid in each of the four quarters of 2016, 2015, and 2014, respectively.
Historically, each year we have declared dividends in December that were paid in the first quarter of the following fiscal year, and in March, July and October that were paid in the second, third and fourth quarters, respectively, of the same fiscal year.
Additionally, on December 20, 2016, the Board of Directors declared a quarterly cash dividend of
$1.15
per share of common stock, which will be paid on March 8, 2017, to all stockholders of record as of the close of business on February 15, 2017.
F-30
Accumulated other comprehensive income
The components of accumulated other comprehensive income/(loss) (AOCI) were as follows (in millions):
|
Foreign
currency
translation
|
Cash flow
hedges
|
Available-for-sale
securities
|
Other
|
AOCI
|
|||||||||||||||
|
Balance as of December 31, 2013
|
$
|
(68
|
)
|
$
|
(33
|
)
|
$
|
(43
|
)
|
$
|
(17
|
)
|
$
|
(161
|
)
|
||||
|
Foreign currency translation adjustments
|
(218
|
)
|
—
|
|
—
|
|
—
|
|
(218
|
)
|
|||||||||
|
Unrealized gains
|
—
|
|
298
|
|
37
|
|
1
|
|
336
|
|
|||||||||
|
Reclassification adjustments to income
|
—
|
|
203
|
|
1
|
|
—
|
|
204
|
|
|||||||||
|
Other
|
—
|
|
—
|
|
—
|
|
1
|
|
1
|
|
|||||||||
|
Income taxes
|
22
|
|
(178
|
)
|
(14
|
)
|
—
|
|
(170
|
)
|
|||||||||
|
Balance as of December 31, 2014
|
(264
|
)
|
290
|
|
(19
|
)
|
(15
|
)
|
(8
|
)
|
|||||||||
|
Foreign currency translation adjustments
|
(257
|
)
|
—
|
|
—
|
|
—
|
|
(257
|
)
|
|||||||||
|
Unrealized gains (losses)
|
—
|
|
150
|
|
(299
|
)
|
8
|
|
(141
|
)
|
|||||||||
|
Reclassification adjustments to income
|
—
|
|
(143
|
)
|
76
|
|
—
|
|
(67
|
)
|
|||||||||
|
Other
|
—
|
|
—
|
|
—
|
|
1
|
|
1
|
|
|||||||||
|
Income taxes
|
10
|
|
—
|
|
(18
|
)
|
—
|
|
(8
|
)
|
|||||||||
|
Balance as of December 31, 2015
|
(511
|
)
|
297
|
|
(260
|
)
|
(6
|
)
|
(480
|
)
|
|||||||||
|
Foreign currency translation adjustments
|
(93
|
)
|
—
|
|
—
|
|
—
|
|
(93
|
)
|
|||||||||
|
Unrealized (losses) gains
|
—
|
|
(176
|
)
|
63
|
|
—
|
|
(113
|
)
|
|||||||||
|
Reclassification adjustments to income
|
—
|
|
139
|
|
61
|
|
—
|
|
200
|
|
|||||||||
|
Other
|
—
|
|
—
|
|
—
|
|
1
|
|
1
|
|
|||||||||
|
Income taxes
|
(6
|
)
|
22
|
|
(2
|
)
|
—
|
|
14
|
|
|||||||||
|
Balance as of December 31, 2016
|
$
|
(610
|
)
|
$
|
282
|
|
$
|
(138
|
)
|
$
|
(5
|
)
|
$
|
(471
|
)
|
||||
Income tax expenses/benefits for unrealized gains and losses and the related reclassification adjustments to income for cash flow hedges were a
$68 million
benefit and
$46 million
expense in
2016
, a
$53 million
expense and
$53 million
benefit in
2015
and a
$104 million
expense and
$74 million
expense in
2014
, respectively. Income tax expenses/benefits for unrealized gains and losses and the related reclassification adjustments to income for available-for-sale securities were a
$9 million
benefit and
$11 million
expense for
2016
, a
$0 million
and
$18 million
expense in
2015
and a
$14 million
expense and
$0 million
in
2014
, respectively.
The reclassifications out of AOCI to earnings were as follows (in millions):
|
Year ended December 31,
|
||||||||||||||
|
Components of AOCI
|
2016
|
2015
|
2014
|
Line item affected in the
Consolidated Statements of Income
|
||||||||||
|
Cash flow hedges:
|
||||||||||||||
|
Foreign currency contract gains
|
$
|
308
|
|
$
|
326
|
|
$
|
28
|
|
Product sales
|
||||
|
Cross-currency swap contract losses
|
(446
|
)
|
(182
|
)
|
(230
|
)
|
Interest and other income, net
|
|||||||
|
Forward interest rate contract losses
|
(1
|
)
|
(1
|
)
|
(1
|
)
|
Interest expense, net
|
|||||||
|
(139
|
)
|
143
|
|
(203
|
)
|
Income before income taxes
|
||||||||
|
46
|
|
(53
|
)
|
74
|
|
Provision for income taxes
|
||||||||
|
$
|
(93
|
)
|
$
|
90
|
|
$
|
(129
|
)
|
Net income
|
|||||
|
Available-for-sale securities:
|
||||||||||||||
|
Net realized losses
|
$
|
(61
|
)
|
$
|
(76
|
)
|
$
|
(1
|
)
|
Interest and other income, net
|
||||
|
11
|
|
18
|
|
—
|
|
Provision for income taxes
|
||||||||
|
$
|
(50
|
)
|
$
|
(58
|
)
|
$
|
(1
|
)
|
Net income
|
|||||
F-31
Other
In addition to common stock, our authorized capital includes
5 million
shares of preferred stock,
$0.0001
par value. As of
December 31, 2016
and
2015
,
no
shares of preferred stock were issued or outstanding.
16. Fair value measurement
To estimate the fair value of our financial assets and liabilities, we use valuation approaches within a hierarchy that maximizes the use of observable inputs and minimizes the use of unobservable inputs by requiring that observable inputs be used when available. Observable inputs are inputs that market participants would use in pricing an asset or liability based on market data obtained from sources independent of the Company. Unobservable inputs are inputs that reflect the Company’s assumptions about the inputs that market participants would use in pricing an asset or liability and are developed based on the best information available in the circumstances. The fair value hierarchy is divided into three levels based on the source of inputs as follows:
|
Level 1
|
—
|
Valuations based on unadjusted quoted prices in active markets for identical assets or liabilities that the Company has the ability to access
|
|
Level 2
|
—
|
Valuations for which all significant inputs are observable, either directly or indirectly, other than level 1 inputs
|
|
Level 3
|
—
|
Valuations based on inputs that are unobservable and significant to the overall fair value measurement
|
The availability of observable inputs can vary among the various types of financial assets and liabilities. To the extent that the valuation is based on models or inputs that are less observable or unobservable in the market, the determination of fair value requires more judgment. In certain cases, the inputs used for measuring fair value may fall into different levels of the fair value hierarchy. In such cases, for financial statement disclosure purposes, the level in the fair value hierarchy within which the fair value measurement is categorized is based on the lowest level of input used that is significant to the overall fair value measurement.
F-32
The fair value of each major class of the Company’s financial assets and liabilities measured at fair value on a recurring basis was as follows (in millions):
|
Fair value measurement as of December 31, 2016, using:
|
Quoted prices in
active markets for
identical assets
(Level 1)
|
Significant other
observable
inputs
(Level 2)
|
Significant
unobservable
inputs
(Level 3)
|
Total
|
||||||||||||
|
Assets:
|
||||||||||||||||
|
Available-for-sale investments:
|
||||||||||||||||
|
U.S. Treasury securities
|
$
|
6,614
|
|
$
|
—
|
|
$
|
—
|
|
$
|
6,614
|
|
||||
|
Other government-related debt securities:
|
||||||||||||||||
|
U.S.
|
—
|
|
299
|
|
—
|
|
299
|
|
||||||||
|
Foreign and other
|
—
|
|
1,759
|
|
—
|
|
1,759
|
|
||||||||
|
Corporate debt securities:
|
||||||||||||||||
|
Financial
|
—
|
|
8,460
|
|
—
|
|
8,460
|
|
||||||||
|
Industrial
|
—
|
|
8,789
|
|
—
|
|
8,789
|
|
||||||||
|
Other
|
—
|
|
1,077
|
|
—
|
|
1,077
|
|
||||||||
|
Residential mortgage-backed securities
|
—
|
|
1,940
|
|
—
|
|
1,940
|
|
||||||||
|
Other mortgage- and asset-backed securities
|
—
|
|
1,719
|
|
—
|
|
1,719
|
|
||||||||
|
Money market mutual funds
|
2,782
|
|
—
|
|
—
|
|
2,782
|
|
||||||||
|
Other short-term interest-bearing securities
|
—
|
|
4,188
|
|
—
|
|
4,188
|
|
||||||||
|
Equity securities
|
154
|
|
—
|
|
—
|
|
154
|
|
||||||||
|
Derivatives:
|
|
|
|
|
||||||||||||
|
Foreign currency contracts
|
—
|
|
203
|
|
—
|
|
203
|
|
||||||||
|
Interest rate swap contracts
|
—
|
|
41
|
|
—
|
|
41
|
|
||||||||
|
Total assets
|
$
|
9,550
|
|
$
|
28,475
|
|
$
|
—
|
|
$
|
38,025
|
|
||||
|
Liabilities:
|
||||||||||||||||
|
Derivatives:
|
||||||||||||||||
|
Foreign currency contracts
|
$
|
—
|
|
$
|
4
|
|
$
|
—
|
|
$
|
4
|
|
||||
|
Cross-currency swap contracts
|
—
|
|
523
|
|
—
|
|
523
|
|
||||||||
|
Interest rate swap contracts
|
—
|
|
7
|
|
—
|
|
7
|
|
||||||||
|
Contingent consideration obligations in connection with business combinations
|
—
|
|
—
|
|
179
|
|
179
|
|
||||||||
|
Total liabilities
|
$
|
—
|
|
$
|
534
|
|
$
|
179
|
|
$
|
713
|
|
||||
F-33
|
Fair value measurement as of December 31, 2015, using:
|
Quoted prices in
active markets for
identical assets
(Level 1)
|
Significant other
observable
inputs
(Level 2)
|
Significant
unobservable
inputs
(Level 3)
|
Total
|
||||||||||||
|
Assets:
|
||||||||||||||||
|
Available-for-sale investments:
|
||||||||||||||||
|
U.S. Treasury securities
|
$
|
4,274
|
|
$
|
—
|
|
$
|
—
|
|
$
|
4,274
|
|
||||
|
Other government-related debt securities:
|
||||||||||||||||
|
U.S.
|
—
|
|
534
|
|
—
|
|
534
|
|
||||||||
|
Foreign and other
|
—
|
|
1,739
|
|
—
|
|
1,739
|
|
||||||||
|
Corporate debt securities:
|
||||||||||||||||
|
Financial
|
—
|
|
7,871
|
|
—
|
|
7,871
|
|
||||||||
|
Industrial
|
—
|
|
7,836
|
|
—
|
|
7,836
|
|
||||||||
|
Other
|
—
|
|
885
|
|
—
|
|
885
|
|
||||||||
|
Residential mortgage-backed securities
|
—
|
|
1,470
|
|
—
|
|
1,470
|
|
||||||||
|
Other mortgage- and asset-backed securities
|
—
|
|
2,469
|
|
—
|
|
2,469
|
|
||||||||
|
Money market mutual funds
|
3,370
|
|
—
|
|
—
|
|
3,370
|
|
||||||||
|
Other short-term interest-bearing securities
|
—
|
|
528
|
|
—
|
|
528
|
|
||||||||
|
Equity securities
|
136
|
|
—
|
|
—
|
|
136
|
|
||||||||
|
Derivatives:
|
|
|
|
|
||||||||||||
|
Foreign currency contracts
|
—
|
|
142
|
|
—
|
|
142
|
|
||||||||
|
Interest rate swap contracts
|
—
|
|
71
|
|
—
|
|
71
|
|
||||||||
|
Total assets
|
$
|
7,780
|
|
$
|
23,545
|
|
$
|
—
|
|
$
|
31,325
|
|
||||
|
Liabilities:
|
||||||||||||||||
|
Derivatives:
|
||||||||||||||||
|
Foreign currency contracts
|
$
|
—
|
|
$
|
8
|
|
$
|
—
|
|
$
|
8
|
|
||||
|
Cross-currency swap contracts
|
—
|
|
250
|
|
—
|
|
250
|
|
||||||||
|
Interest rate swap contracts
|
—
|
|
3
|
|
—
|
|
3
|
|
||||||||
|
Contingent consideration obligations in connection with business combinations
|
—
|
|
—
|
|
188
|
|
188
|
|
||||||||
|
Total liabilities
|
$
|
—
|
|
$
|
261
|
|
$
|
188
|
|
$
|
449
|
|
||||
The fair values of our U.S. Treasury securities, money market mutual funds and equity securities are based on quoted market prices in active markets with no valuation adjustment.
Most of our other government-related and corporate debt securities are investment grade with maturity dates of
five
years or less from the balance sheet date. Our other government-related debt securities portfolio is composed of securities with weighted-average credit ratings of A- or equivalent by S&P, Moody’s or Fitch Ratings Inc. (Fitch); and our corporate debt securities portfolio has a weighted-average credit rating of BBB+ or equivalent by S&P or Moody’s and A- by Fitch. We estimate the fair values of these securities by taking into consideration valuations obtained from third-party pricing services. The pricing services utilize industry standard valuation models, including both income- and market-based approaches, for which all significant inputs are observable, either directly or indirectly, to estimate fair value. These inputs include reported trades of and broker/dealer quotes on the same or similar securities; issuer credit spreads; benchmark securities; and other observable inputs.
Our residential mortgage-, other mortgage- and asset-backed securities portfolio is composed entirely of senior tranches, with credit ratings of AAA by S&P, Moody’s or Fitch. We estimate the fair values of these securities by taking into consideration valuations obtained from third-party pricing services. The pricing services utilize industry standard valuation models, including both income- and market-based approaches, for which all significant inputs are observable, either directly or indirectly, to estimate fair value. These inputs include reported trades of and broker/dealer quotes on the same or similar securities; issuer credit spreads; benchmark securities; prepayment/default projections based on historical data; and other observable inputs.
F-34
We value our other short-term interest-bearing securities at amortized cost, which approximates fair value given their near- term maturity dates.
All of our foreign currency forward and option derivatives contracts have maturities of
three years
or less and all are with counterparties that have minimum credit ratings of A- or equivalent by S&P or Moody’s. We estimate the fair values of these contracts by taking into consideration valuations obtained from a third-party valuation service that utilizes an income-based industry standard valuation model for which all significant inputs are observable, either directly or indirectly. These inputs include foreign currency exchange rates, LIBOR, swap rates and obligor credit default swap rates. In addition, inputs for our foreign currency option contracts include implied volatility measures. These inputs, where applicable, are at commonly quoted intervals. See Note 17, Derivative instruments.
Our cross-currency swap contracts are with counterparties that have minimum credit ratings of A- or equivalent by S&P or Moody’s. We estimate the fair values of these contracts by taking into consideration valuations obtained from a third-party valuation service that utilizes an income-based industry standard valuation model for which all significant inputs are observable either directly or indirectly. These inputs include foreign currency exchange rates, LIBOR, swap rates, obligor credit default swap rates and cross-currency basis swap spreads. See Note 17, Derivative instruments.
Our interest rate swap contracts are with counterparties that have minimum credit ratings of A- or equivalent by S&P or Moody’s. We estimate the fair values of these contracts by using an income-based industry standard valuation model for which all significant inputs were observable either directly or indirectly. These inputs included LIBOR, swap rates and obligor credit default swap rates.
Contingent consideration obligations
As a result of our business acquisitions, we incurred contingent consideration obligations, as discussed below. These contingent consideration obligations are recorded at their estimated fair values, and we revalue these obligations each reporting period until the related contingencies are resolved. The fair value measurements of these obligations are based on significant unobservable inputs related to product candidates acquired in business combinations and are reviewed quarterly by management in our R&D and commercial sales organizations. These inputs include, as applicable, estimated probabilities and timing of achieving specified regulatory and commercial milestones and estimated annual sales. Significant changes that increase or decrease the probabilities of achieving the related regulatory and commercial events, shorten or lengthen the time required to achieve such events, or increase or decrease estimated annual sales would result in corresponding increases or decreases in the fair values of these obligations, as applicable. Changes in the fair values of contingent consideration obligations are recognized in Other operating expenses in the Consolidated Statements of Income.
Changes in the carrying amounts of contingent consideration obligations were as follows (in millions):
|
During the years ended December 31,
|
|||||||
|
2016
|
2015
|
||||||
|
Beginning balance
|
$
|
188
|
|
$
|
215
|
|
|
|
Additions from Dezima acquisition
|
—
|
|
110
|
|
|||
|
Payment to former BioVex Group, Inc. shareholders
|
—
|
|
(125
|
)
|
|||
|
Net changes in valuation
|
(9
|
)
|
(12
|
)
|
|||
|
Ending balance
|
$
|
179
|
|
$
|
188
|
|
|
As a result of our acquisition of Dezima in 2015, we are obligated to pay its former shareholders up to
$1.25 billion
of additional consideration contingent upon achieving certain development and sales-related milestones and low single-digit royalties on net product sales above a certain threshold. The estimated fair values of the contingent consideration obligations had an aggregate value of
$110 million
at acquisition. See Note 3, Business combinations.
As a result of our acquisition of Biovex Group Inc. (BioVex) in 2011, we are obligated to pay its former shareholders additional consideration contingent upon achieving separate regulatory and sales-related milestones with regard to IMLYGIC
®
, including a
$125 million
milestone payment made in 2015 as a result of the first commercial sale of this product in the United States following marketing approval. The remaining milestone payments of up to
$325 million
will become payable if certain sales thresholds are achieved within specified periods of time.
F-35
We estimate the fair values of the obligations to the former shareholders of Dezima and BioVex by using probability-adjusted discounted cash flows and we review underlying key assumptions on a quarterly basis. There were no significant changes in the estimated aggregate fair values of the contingent consideration obligations for the years ended
December 31, 2016 and 2015
.
During the years ended
December 31, 2016
and
2015
, there were no transfers of assets or liabilities between fair value measurement levels, and there were no material remeasurements to the fair values of assets and liabilities that are not measured at fair value on a recurring basis.
Summary of the fair values of other financial instruments
Cash equivalents
The estimated fair values of cash equivalents approximate their carrying values due to the short-term nature of such financial instruments.
Borrowings
We estimated the fair value of our long-term debt (Level 2) by taking into consideration indicative prices obtained from a third-party financial institution that utilizes industry standard valuation models, including both income- and market-based approaches, for which all significant inputs are observable either directly or indirectly. These inputs include reported trades of and broker/dealer quotes on the same or similar securities; credit spreads; benchmark yields; foreign currency exchange rates, as applicable; and other observable inputs. As of
December 31, 2016
and
2015
, the aggregate fair values of our long-term debt were
$36.5 billion
and
$33.1 billion
, respectively, and the carrying values were
$34.6 billion
and
$31.4 billion
, respectively.
17. Derivative instruments
The Company is exposed to foreign currency exchange rate and interest rate risks related to its business operations. To reduce our risks related to these exposures, we utilize or have utilized certain derivative instruments, including foreign currency forward, foreign currency option, cross-currency swap, forward interest rate and interest rate swap contracts. We do not use derivatives for speculative trading purposes.
Cash flow hedges
We are exposed to possible changes in the values of certain anticipated foreign currency cash flows resulting from changes in foreign currency exchange rates, associated primarily with our euro-denominated international product sales. Increases and decreases in the cash flows associated with our international product sales due to movements in foreign currency exchange rates are offset partially by corresponding increases and decreases in the cash flows from our international operating expenses resulting from these foreign currency exchange rate movements. To further reduce our exposure to foreign currency exchange rate fluctuations on our international product sales, we enter into foreign currency forward and option contracts to hedge a portion of our projected international product sales primarily
over a three-year time horizon
, with, at any given point in time, a higher percentage of nearer-term projected product sales being hedged than in successive periods.
As of
December 31, 2016
,
2015
and
2014
, we had open foreign currency forward contracts with notional amounts of
$3.4 billion
,
$3.3 billion
and
$3.8 billion
, respectively, and open foreign currency option contracts with notional amounts of
$608 million
,
$225 million
and
$271 million
, respectively. We have designated these foreign currency forward and foreign currency option contracts, which are primarily euro based, as cash flow hedges; and accordingly, we report the effective portions of the unrealized gains and losses on these contracts in AOCI in the Consolidated Balance Sheets, and we reclassify them to earnings in the same periods during which the hedged transactions affect earnings.
To manage counterparty risk resulting from favorable movements in U.S. dollar/foreign currency exchange rates, we effectively terminated outstanding foreign currency forward and option contracts with a notional amount of
$2.3 billion
during the year ended December 31, 2015. We received
$340 million
from the counterparties, which was included in Net cash provided by operating activities in the Consolidated Statement of Cash Flows. This amount was recorded in AOCI and is being recognized in Product sales in the Consolidated Statements of Income when the related international product sales affect earnings. In addition, during the year ended December 31, 2015, we entered into new foreign currency forward and option contracts that hedge these forecasted international product sales.
To hedge our exposure to foreign currency exchange rate risk associated with certain of our long-term debt denominated in foreign currencies, including long-term debt issued during the year ended December 31, 2016, (see Note 14, Financing arrangements), we entered into cross-currency swap contracts. Under the terms of these contracts, we paid euros/pounds sterling
F-36
and Swiss francs and received U.S. dollars for the notional amounts at the inception of the contracts; and based on these notional amounts, we exchange interest payments at fixed rates over the lives of the contracts by paying U.S. dollars and receiving euros, pounds sterling and Swiss francs. In addition, we will pay U.S. dollars to and receive euros, pounds sterling and Swiss francs from the counterparties at the maturities of the contracts for these same notional amounts. The terms of these contracts correspond to the related hedged debt, effectively converting the interest payments and principal repayment on the debt from euros, pounds sterling and Swiss francs to U.S. dollars. We have designated these cross-currency swap contracts as cash flow hedges, and accordingly, the effective portions of the unrealized gains and losses on these contracts are reported in AOCI in the Consolidated Balance Sheets and reclassified to earnings in the same periods during which the hedged debt affects earnings.
The notional amounts and interest rates of our cross-currency swaps are as follows (notional amounts in millions):
|
Foreign currency
|
U.S. dollars
|
|||||||||||||
|
Hedged notes
|
Notional amount
|
Interest rate
|
Notional amount
|
Interest rate
|
||||||||||
|
2.125% 2019 euro Notes
|
€
|
675
|
|
2.125
|
%
|
$
|
864
|
|
2.6
|
%
|
||||
|
1.25% 2022 euro Notes
|
€
|
1,250
|
|
1.25
|
%
|
$
|
1,388
|
|
3.2
|
%
|
||||
|
0.41 % 2023 Swiss franc Bonds
|
CHF
|
700
|
|
0.41
|
%
|
$
|
704
|
|
3.4
|
%
|
||||
|
2.00% 2026 euro Notes
|
€
|
750
|
|
2.00
|
%
|
$
|
833
|
|
3.9
|
%
|
||||
|
5.50% 2026 pound sterling Notes
|
£
|
475
|
|
5.50
|
%
|
$
|
747
|
|
6.0
|
%
|
||||
|
4.00% 2029 pound sterling Notes
|
£
|
700
|
|
4.00
|
%
|
$
|
1,111
|
|
4.5
|
%
|
||||
In connection with the anticipated issuance of long-term fixed-rate debt, we occasionally enter into forward interest rate contracts in order to hedged the variability in cash flows due to changes in the applicable Treasury rate between the time we enter into these contracts and the time the related debt is issued. Gains and losses realized on such contracts, which were designated as cash flow hedges, are recognized in AOCI and amortized into earnings over the lives of the associated debt issuances.
The effective portions of the unrealized gain/(loss) recognized in other comprehensive income for our derivative instruments designated as cash flow hedges were as follows (in millions):
|
Years ended December 31,
|
||||||||||||||
|
Derivatives in cash flow hedging relationships
|
2016
|
2015
|
2014
|
|||||||||||
|
Foreign currency contracts
|
$
|
115
|
|
$
|
425
|
|
$
|
452
|
|
|||||
|
Cross-currency swap contracts
|
(281
|
)
|
(275
|
)
|
(154
|
)
|
||||||||
|
Forward interest rate contracts
|
(10
|
)
|
—
|
|
—
|
|
||||||||
|
Total
|
$
|
(176
|
)
|
$
|
150
|
|
$
|
298
|
|
|||||
The locations in the Consolidated Statements of Income and the effective portions of the gain/(loss) reclassified out of AOCI into earnings for our derivative instruments designated as cash flow hedges were as follows (in millions):
|
Years ended December 31,
|
||||||||||||||
|
Derivatives in cash flow hedging relationships
|
Statements of Income location
|
2016
|
2015
|
2014
|
||||||||||
|
Foreign currency contracts
|
Product sales
|
$
|
308
|
|
$
|
326
|
|
$
|
28
|
|
||||
|
Cross-currency swap contracts
|
Interest and other income, net
|
(446
|
)
|
(182
|
)
|
(230
|
)
|
|||||||
|
Forward interest rate contracts
|
Interest expense, net
|
(1
|
)
|
(1
|
)
|
(1
|
)
|
|||||||
|
Total
|
$
|
(139
|
)
|
$
|
143
|
|
$
|
(203
|
)
|
|||||
No portions of our cash flow hedge contracts are excluded from the assessment of hedge effectiveness, and the gains and losses of the ineffective portions of these hedging instruments were not material for the years ended
December 31, 2016
,
2015
and
2014
. As of
December 31, 2016
, the amounts expected to be reclassified out of AOCI into earnings over the next 12 months are approximately
$80 million
of net gains on our foreign currency and cross-currency swap contracts and approximately
$2 million
of losses on forward interest rate contracts.
F-37
Fair value hedges
To achieve a desired mix of fixed and floating interest rates on our long-term debt, we entered into interest rate swap contracts that qualified and are designated as fair value hedges. The terms of these interest rate swap contracts correspond to the related hedged debt instruments and effectively convert a fixed interest rate coupon to a floating LIBOR-based coupon over the lives of the respective notes. As of December 31, 2016, 2015 and 2014, we had interest rate swap agreements with aggregate notional amounts of
$6.65 billion
that hedge certain of our long-term debt issuances (see Note 14, Financing arrangements — Interest rate swaps). These contracts have rates that range from three-month LIBOR plus
0.4%
to three-month LIBOR plus
2.0%
.
For derivative instruments that qualify for and are designated as fair value hedges, we recognize in current earnings the unrealized gain or loss on the derivative resulting from the change in fair value during the period as well as the offsetting unrealized loss or gain of the hedged item resulting from the change in fair value during the period attributable to the hedged risk. During the year ended
December 31, 2016
, we included the unrealized
gains on the hedged debt
of
$34 million
in the same line item, Interest expense, net, in the Consolidated Statement of Income, as the offsetting unrealized
losses
of
$34 million
on the related interest rate swap agreements. During the years ended
December 31, 2015 and 2014
, we included the unrealized
losses on the hedged debt
of
$48 million
and
$181 million
in the same line item, Interest expense, net, in the Consolidated Statements of Income, as the offsetting unrealized
gains
of
$48 million
and
$181 million
on the related interest rate swap agreements.
Derivatives not designated as hedges
To reduce our exposure to foreign currency fluctuations of certain assets and liabilities denominated in foreign currencies, we enter into foreign currency forward contracts that are not designated as hedging transactions. These exposures are hedged on a month-to-month basis. As of
December 31, 2016
,
2015
and
2014
, the total notional amounts of these foreign currency forward contracts were
$666 million
,
$911 million
and
$875 million
, respectively.
The location in the Consolidated Statements of Income and the amount of gain/(loss) recognized in earnings for our derivative instruments not designated as hedging instruments were as follows (in millions):
|
Years ended December 31,
|
||||||||||||||
|
Derivatives not designated as hedging instruments
|
Statements of Income location
|
2016
|
2015
|
2014
|
||||||||||
|
Foreign currency contracts
|
Interest and other income, net
|
$
|
(56
|
)
|
$
|
(16
|
)
|
$
|
(10
|
)
|
||||
F-38
The fair values of derivatives included on the Consolidated Balance Sheets were as follows (in millions):
|
|
Derivative assets
|
Derivative liabilities
|
|||||||||
|
December 31, 2016
|
Balance Sheet location
|
Fair value
|
Balance Sheet location
|
Fair value
|
|||||||
|
Derivatives designated as hedging instruments:
|
|||||||||||
|
Foreign currency contracts
|
Other current assets/ Other noncurrent assets
|
$
|
203
|
|
Accrued liabilities/ Other noncurrent liabilities
|
$
|
4
|
|
|||
|
Cross-currency swap contracts
|
Other current assets/ Other noncurrent assets
|
—
|
|
Accrued liabilities/ Other noncurrent liabilities
|
523
|
|
|||||
|
Interest rate swap contracts
|
Other current assets/ Other noncurrent assets
|
41
|
|
Accrued liabilities/ Other noncurrent liabilities
|
7
|
|
|||||
|
Total derivatives designated as hedging instruments
|
244
|
|
534
|
|
|||||||
|
Derivatives not designated as hedging instruments:
|
|||||||||||
|
Foreign currency contracts
|
Other current assets
|
—
|
|
Accrued liabilities
|
—
|
|
|||||
|
Total derivatives not designated as hedging instruments
|
—
|
|
—
|
|
|||||||
|
Total derivatives
|
$
|
244
|
|
$
|
534
|
|
|||||
|
|
Derivative assets
|
Derivative liabilities
|
|||||||||
|
December 31, 2015
|
Balance Sheet location
|
Fair value
|
Balance Sheet location
|
Fair value
|
|||||||
|
Derivatives designated as hedging instruments:
|
|||||||||||
|
Foreign currency contracts
|
Other current assets/ Other noncurrent assets
|
$
|
142
|
|
Accrued liabilities/ Other noncurrent liabilities
|
$
|
7
|
|
|||
|
Cross-currency swap contracts
|
Other current assets/ Other noncurrent assets
|
—
|
|
Accrued liabilities/ Other noncurrent liabilities
|
250
|
|
|||||
|
Interest rate swap contracts
|
Other current assets/ Other noncurrent assets
|
71
|
|
Accrued liabilities/ Other noncurrent liabilities
|
3
|
|
|||||
|
Total derivatives designated as hedging instruments
|
213
|
|
260
|
|
|||||||
|
Derivatives not designated as hedging instruments:
|
|||||||||||
|
Foreign currency contracts
|
Other current assets
|
—
|
|
Accrued liabilities
|
1
|
|
|||||
|
Total derivatives not designated as hedging instruments
|
—
|
|
1
|
|
|||||||
|
Total derivatives
|
$
|
213
|
|
$
|
261
|
|
|||||
Our derivative contracts that were in liability positions as of
December 31, 2016
, contain certain credit-risk-related contingent provisions that would be triggered if: (i) we were to undergo a change in control and (ii) our or the surviving entity’s creditworthiness deteriorates, which is generally defined as having either a credit rating that is below investment grade or a materially weaker creditworthiness after the change in control. If these events were to occur, the counterparties would have the right, but not the obligation, to close the contracts under early-termination provisions. In such circumstances, the counterparties could request immediate settlement of these contracts for amounts that approximate the then current fair values of the contracts. In addition, our derivative contracts are not subject to any type of master netting arrangement, and amounts due to or from a counterparty under these contracts may only be offset against other amounts due to or from the same counterparty if an event of default or termination, as defined, were to occur.
The cash flow effects of our derivative contracts for each of the three years ended
December 31, 2016
, are included within Net cash provided by operating activities in the Consolidated Statements of Cash Flows.
F-39
18. Contingencies and commitments
Contingencies
In the ordinary course of business, we are involved in various legal proceedings, government investigations and other matters that are complex in nature and have outcomes that are difficult to predict. (See Part I, Item 1A. Risk Factors—Our business may be affected by litigation and government investigations.) We describe our legal proceedings and other matters that are significant or that we believe could become significant in this Note.
We record accruals for loss contingencies to the extent that we conclude it is probable that a liability has been incurred and the amount of the related loss can be reasonably estimated. We evaluate, on a quarterly basis, developments in legal proceedings and other matters that could cause an increase or decrease in the amount of the liability that has been accrued previously.
Our legal proceedings range from cases brought by a single plaintiff to class actions with thousands of putative class members. These legal proceedings, as well as other matters, involve various aspects of our business and a variety of claims—including but not limited to patent infringement, marketing, pricing and trade practices and securities law—some of which present novel factual allegations and/or unique legal theories.
In each of the matters described in this filing, plaintiffs seek an award of a not-yet-quantified amount of damages or an amount that is not material. In addition, a number of the matters pending against us are at very early stages of the legal process (which in complex proceedings of the sort faced by us often extend for several years). As a result, none of the matters pending against us described in this filing have progressed sufficiently through discovery and/or development of important factual information and legal issues to enable us to estimate a range of possible loss, if any, or such amounts are not material.
While it is not possible to accurately predict or determine the eventual outcomes of these matters, an adverse determination in one or more of these matters currently pending could have a material adverse effect on our consolidated results of operations, financial position or cash flows.
Certain of our legal proceedings and other matters are discussed below:
PCSK9 Antibody Patent Litigation
U.S. Patent Litigation—Sanofi/Regeneron
On October 17, 2014, Amgen initiated a series of lawsuits in the U.S. District Court of Delaware (the Delaware District Court) against Sanofi, Aventisub LLC, formerly doing business as Aventis Pharmaceuticals Inc., and Regeneron Pharmaceuticals, Inc. (Regeneron) for patent infringement. On December 15, 2014, these lawsuits were consolidated by the Delaware District Court into a single case against Sanofi, Sanofi-Aventis U.S. LLC and Aventisub LLC, formerly doing business as Aventis Pharmaceuticals Inc. (collectively, Sanofi) and Regeneron, addressing
seven
of our patents: U.S. Patent Nos. 8,563,698; 8,829,165 (the ‘165 Patent); 8,859,741 (the ‘741 Patent); 8,871,913; 8,871,914; 8,883,983; and 8,889,834. These patents describe and claim monoclonal antibodies to proprotein convertase subtilisin/kexin type 9 (PCSK9). By its complaints, Amgen sought an injunction to prevent the infringing manufacture, use and sale of Sanofi and Regeneron’s alirocumab, a monoclonal antibody targeting PCSK9. On January 29, 2016, the Delaware District Court granted Amgen’s motion to amend the complaint to add Amgen Manufacturing, Limited and Amgen USA Inc. as plaintiffs and to add the allegation that defendants’ infringement of Amgen’s patents is willful.
On February 22, 2016, the Delaware District Court entered a stipulated order finding alirocumab and the drug product containing it, PRALUENT
®
, infringe certain of Amgen’s patents, including claims 2, 7, 9, 15, 19 and 29 of the ‘165 Patent and claim 7 of the ‘741 Patent. On March 18, 2016, the Delaware District Court entered judgment in favor of Amgen following a five-day jury trial and a unanimous jury verdict that these patent claims from the ‘165 Patent and the ‘741 Patent are all valid. On April 15, 2016, Sanofi and Regeneron filed post-trial motions seeking a new trial and judgment as a matter of law. On January 3, 2017, the Delaware District Court denied Sanofi and Regeneron’s post-trial motions seeking a new trial and for judgment as a matter of law, and on January 5, 2017, granted Amgen’s motion for a permanent injunction prohibiting the infringing manufacture, use, sale, offer for sale or import of alirocumab in the United States. On January 9, 2017, the Delaware District Court denied Sanofi and Regeneron’s motion to stay the injunction pending appeal, but ordered that the injunction will not take effect for forty-five days (until February 21, 2017) to give Sanofi and Regeneron an opportunity to seek a stay from the U.S. Court of Appeals for the Federal Circuit (the “Federal Circuit Court”).
On January 12, 2017, Sanofi and Regeneron filed an appeal of the judgment and the permanent injunction to the Federal Circuit Court. Following a motion by Sanofi and Regeneron, the Federal Circuit Court ordered an expedited briefing schedule for the appeal and, on February 8, 2017, entered a stay of the permanent injunction during the pendency of the appeal.
F-40
Patent Disputes in the European Region
On February 24, 2016, the European Patent Office (EPO) granted European Patent No. 2,215,124 (EP 2,215,124) to Amgen. This patent describes and claims monoclonal antibodies to PCSK9 and methods of treatment. On February 24, 2016, Sanofi filed an opposition to the patent in the EPO seeking to invalidate it. In November 2016, Sanofi-Aventis Deutschland GmbH, Sanofi-Aventis Groupe S.A. and Sanofi Winthrop Industrie S.A. filed a joint opposition against Amgen’s patent, and each of Eli Lilly and Company, Regeneron, and Strawman Ltd., also filed oppositions to Amgen’s patent. Amgen’s response is due by May 10, 2017.
On March 24, 2016, Amgen was served with a patent revocation action in the Patent Court of the Chancery Division of the High Court of Justice of England and Wales by Pfizer seeking to revoke European Patent (UK) No. 2,215,124, the patent issuing in the United Kingdom from EP 2,215,124. On November 16, 2016, following Pfizer’s announcement that it was terminating its PCSK9 program, the court entered an order staying the case by consent of the parties.
We are also involved in and expect future involvement in additional disputes regarding our PCSK9 patents in other jurisdictions and regions, including matters filed against us and that we have filed in the United Kingdom, Germany and France.
AMJEVITA
™
Patent Litigation
On August 4, 2016, AbbVie Inc. and AbbVie Biotechnology Ltd. (collectively, AbbVie) filed a lawsuit in the Delaware District Court against Amgen Inc. and Amgen Manufacturing, Ltd. (collectively, Amgen), alleging infringement of U.S Patent Nos. 8,663,945; 8,911,964; 8,916,157; 8,961,973; 8,986,693; 9,096,666; 9,220,781; 9,272,041; 9,359,434; and 9,365,645. AbbVie seeks an injunction prohibiting Amgen from commercializing ABP 501 (also known as AMJEVITA
™
, a biosimilar to AbbVie’s HUMIRA
®
) prior to the expiration of the patents-in-suit and compelling Amgen to provide AbbVie with at least 180 days-notice of first commercial marketing. On September 13, 2016, Amgen responded to the complaint denying AbbVie’s allegations and counterclaimed, seeking judgment that the patents-in-suit are invalid and/or not infringed by Amgen. On September 23, 2016, the FDA approved AMJEVITA
™
. On October 7, 2016, AbbVie responded to Amgen’s counterclaims. Trial is scheduled to begin November 4, 2019.
Sensipar
®
Patent Litigation
Amgen filed
13
separate lawsuits in the Delaware District Court for infringement of our U.S. Patent No. 9,375,405 (the ‘405 Patent) against: (1) Aurobindo Pharma Ltd. and Aurobindo Pharma USA, Inc., (2) MicroLabs Ltd. and Micro Labs USA, Inc., (3) Watson Laboratories, Inc., Actavis, Inc. and Actavis Pharma, Inc., and (4) Cipla Limited and Cipla USA, Inc. (collectively, Cipla), each on September 22, 2016; (5) Strides Pharma Global PTE Limited and Strides Pharma, Inc., and (6) Sun Pharma Global FZE and Sun Pharmaceutical Industries, Inc., each on September 29, 2016; (7) Dr. Reddy’s Laboratories, Ltd., and Dr. Reddy’s Laboratories, Inc., and (8) Ajanta Pharma Limited and Ajanta Pharma USA, Inc., each on October 5, 2016; (9) Amneal Pharmaceuticals LLC, Amneal Pharmaceuticals of New York, LLC, and Amneal Pharmaceuticals Co. India Private Limited, (10) Apotex Inc. and Apotex Corp., (collectively, Apotex), (11) Hetero USA Inc., Hetero Labs Ltd. and Hetero Labs Ltd. Unit V, and (12) Breckenridge Pharmaceutical, Inc., each on October 11, 2016; and (13) Mylan Pharmaceuticals Inc. and Mylan Inc. (collectively, Mylan) on February 3, 2017. The ’405 Patent is entitled “Rapid Dissolution Formulation of a Calcium Receptor-Active Compound” and expires in 2026. In each of the
13
lawsuits, Amgen seeks an order of the Delaware District Court making any U.S. Food and Drug Administration (FDA) approval of the defendants’ generic versions of Sensipar
®
effective no earlier than the expiration of the ‘405 Patent. In each lawsuit, all defendants except Mylan have responded to the complaint denying infringement and seeking judgment that the ‘405 Patent is invalid and/or not infringed.
KYPROLIS
®
Patent Litigation
Our subsidiary Onyx Therapeutics, Inc. (Onyx Therapeutics), filed
four
separate lawsuits in the Delaware District Court against: Cipla, on October 24, 2016; Sagent Pharmaceuticals, Inc., on October 26, 2016; Breckenridge Pharmaceutical, Inc., on October 27, 2016; and Fresenius Kabi, USA LLC, Fresenius Kabi USA, Inc., Fresenius Pharmaceuticals Holding, Inc., and Fresenius Kabi Oncology Limited, on November 1, 2016; each for infringing U.S. Patent Nos. 7,232,818; 7,417,042; 7,491,704; 7,737,112; 8,129,346; 8,207,125; 8,207,126; 8,207,127; and 8,207,297. By joint stipulation of the parties, Fresenius Pharmaceuticals Holding, Inc. and Fresenius Kabi Oncology Limited were subsequently dismissed from that lawsuit. Onyx Therapeutics also filed
four
separate lawsuits in the Delaware District Court against: MSN Laboratories Private Limited and MSN Pharmaceuticals, Inc., on October 26, 2016; Dr. Reddy’s Laboratories, Inc. and Dr. Reddy’s Laboratories, Ltd., on November 1, 2016; Qilu Pharma, Inc. and Qilu Pharmaceutical Co. Ltd. (collectively, Qilu) on November 1, 2016; and Apotex, on November 8, 2016; each for infringing U.S. Patent No. 7,737,112. Onyx Therapeutics also filed a separate lawsuit in the Delaware District Court against InnoPharma, Inc. on November 7, 2016 for infringement of U.S. Patent Nos. 7,417,042; 7,737,112; and 8,207,297. These lawsuits are based on Abbreviated New Drug Applications (ANDAs) that seek approval to market generic versions of KYPROLIS
®
before expiration
F-41
of the asserted patent or patents. In each lawsuit, Onyx Therapeutics seeks an order of the Delaware District Court making any FDA approval of the defendant’s ANDA effective no earlier than the expiration of all asserted patents. Responses to the complaints have been filed by defendants alleging non-infringement and invalidity of the patents in all the lawsuits.
Other Biosimilars Patent Litigations
We have filed a number of lawsuits against manufacturers of products that purport to be biosimilars of certain of our products. In each case, our complaint alleges that the manufacturer’s actions infringe certain patents we hold and that the manufacturer has failed to comply with certain provisions of the Biologics Price Competition and Innovation Act (BPCIA).
Sandoz Pegfilgrastim Litigation
On May 12, 2016, Amgen filed a lawsuit in the U.S. District Court for the Northern District of California (the California Northern District Court) against Sandoz Inc., Sandoz International GmbH and Sandoz GmbH (collectively Sandoz) and Lek Pharmaceuticals d.d. for infringement of U.S. Patent Nos. 8,940,878 and 5,824,784 in accordance with the patent provisions of the BPCIA. On June 23, 2016, Sandoz responded to the complaint, denying infringement and seeking judgment that the patents-in-suit are invalid and/or not infringed. On December 7, 2016, by joint stipulation of the parties, the California Northern District Court dismissed from the case all claims and counterclaims related to U.S. Patent No. 5,824,784. Trial is scheduled to begin December 18, 2017.
Sandoz Filgrastim Litigation
On October 24, 2014, Amgen and Amgen Manufacturing, Limited (collectively Amgen) filed a lawsuit in the California Northern District Court against Sandoz for infringement of our U.S. Patent No. 6,162,427 (the ‘427 Patent) and various state law claims. The lawsuit stems from Sandoz filing an application for FDA licensure of a filgrastim product as biosimilar to NEUPOGEN
®
under the BPCIA, while having deliberately failed to comply with the BPCIA’s disclosure requirement to Amgen as the reference product sponsor. By its complaint, Amgen sought, among other remedies, an injunction to cease Sandoz’s unauthorized reliance on Amgen’s BLA for filgrastim, including an order compelling Sandoz to suspend FDA review of their application until there is restitution for its non-compliance with the BPCIA, an injunction to prevent Sandoz from commercially marketing the biosimilar product until Amgen is restored to the position it would have been in had Sandoz met their obligations under the BPCIA and an injunction to prevent Sandoz from infringing, or inducing any infringing use of, filgrastim.
On March 19, 2015, the California Northern District Court issued an order dismissing with prejudice Amgen’s state law claims, and entered judgment in favor of Sandoz Inc. on its cross-motion for partial judgment on the pleadings. The order also denied Amgen’s motion for a preliminary injunction, as well as Amgen’s motion for partial judgment on the pleadings. On a joint motion of the parties, on March 25, 2015, the California Northern District Court entered final judgment on the claims and counterclaims decided by the court’s March 19 order. The remaining patent infringement claim, counterclaim and defenses were stayed by the court pending appeal. On March 25, 2015, Amgen appealed both the judgment in favor of Sandoz Inc. and the denial of Amgen’s motion for preliminary injunction to the Federal Circuit Court. On May 5, 2015, the Federal Circuit Court entered an injunction prohibiting Sandoz Inc. from marketing, selling, offering for sale, or importing into the United States Sandoz’s FDA-approved Zarxio
®
biosimilar product until the Federal Circuit Court resolved the appeal.
On July 21, 2015, the Federal Circuit Court affirmed the district court’s dismissal of Amgen’s state law claims and directed the California Northern District Court to enter judgment on Sandoz’s counter-claims consistent with the Federal Circuit’s interpretation of the BPCIA. The Federal Circuit Court concluded that the only remedies available for a biosimilar applicant’s failure to provide its BLA by the statutory deadline is to bring a patent infringement claim and seek those patent remedies provided by the statute. The Federal Circuit Court also concluded that a biosimilar applicant must give 180-day advance notice of first commercial marketing after the FDA has licensed the biosimilar product. Accordingly, the Federal Circuit Court entered an order that its previously entered injunction be extended through September 2, 2015 (180 days from Sandoz Inc.’s notice given after FDA approval), and remanded for the district court to consider the patent infringement claim and counterclaims. Sandoz launched Zarxio
®
in the United States on September 3, 2015.
On August 20, 2015, Amgen and Sandoz each petitioned the Federal Circuit Court requesting rehearing en banc of various aspects of the Federal Circuit Court opinion on which the other had prevailed. On October 16, 2015, the Federal Circuit Court denied each of Amgen’s and Sandoz’s petitions for rehearing en banc.
On September 8, 2015, the California Northern District Court granted the parties’ joint motion to lift the stay of the case, allowing the remaining patent infringement claim, counterclaim and defenses to proceed. Amgen filed a first supplemental and amended complaint on October 15, 2015, adding to the lawsuit Sandoz’s infringement of U.S. Patent No. 8,940,878, which covers
F-42
methods of purifying proteins. On August 4, 2016, the California Northern District Court entered an order construing patent claim terms of the ‘427 Patent and our U.S. Patent No 8,940,878. Trial is scheduled to begin December 18, 2017.
On February 16, 2016, Sandoz filed a petition for certiorari with the U.S. Supreme Court seeking review of the Federal Circuit Court ruling concluding that a biosimilar applicant must give 180-day advance notice of first marketing and that notice can be given only after the FDA has licensed the biosimilar product. On March 21, 2016, Amgen filed a brief in opposition to Sandoz’s petition and a conditional cross-petition for certiorari requesting that the U.S. Supreme Court also review the Federal Circuit Court’s ruling that the only remedy available when a biosimilar applicant refuses to provide its BLA is to bring a patent infringement claim. On January 13, 2017, the U.S. Supreme Court granted certiorari on both Sandoz’s petition and Amgen’s conditional cross-petition.
Sandoz Etanercept Litigation
On February 26, 2016, two affiliates of Amgen Inc. (Immunex Corporation and Amgen Manufacturing, Limited (collectively Amgen)), along with Hoffmann-La Roche Inc. (Roche), filed a lawsuit in U.S. District Court for the District of New Jersey (the New Jersey District Court) against Sandoz. This lawsuit stems from Sandoz’s submission of an application for FDA licensure of an etanercept product as biosimilar to Amgen’s ENBREL. Amgen and Roche have asserted infringement of
five
patents: U.S. Patent Nos. 8,063,182; 8,163,522; 7,915,225; 8,119,605; and 8,722,631. By its complaint, Amgen and Roche are seeking an injunction to prohibit Sandoz from commercializing its biosimilar etanercept product in the United States prior to the expiry of such patents. Responses have been filed by all Sandoz defendants denying infringement and/or asserting that the patents at issue are valid.
On August 11, 2016, and subject to the terms of a confidential stipulation, the New Jersey District Court entered a preliminary injunction prohibiting Sandoz from making, using, importing, selling or offering for sale Sandoz’s etanercept product. Trial is scheduled to start on April 17, 2018. On August 30, 2016, the FDA approved Sandoz’s Erelzi
™
, a biosimilar to ENBREL.
Apotex Pegfilgrastim/Filgrastim Litigation
On August 6, 2015, Amgen filed a lawsuit in the U.S. District Court for the Southern District of Florida (the Florida Southern District Court) against Apotex for infringement of our U.S. Patent Nos. 8,952,138 (the ‘138 Patent) and 5,824,784 (the ‘784 Patent) in accordance with the patent provisions of the BPCIA and for a declaration that Apotex’s pre-licensure notice of commercial marketing is legally ineffective. This lawsuit stems from Apotex’s submission of an application for FDA licensure of a pegfilgrastim product as biosimilar to Amgen’s Neulasta
®
. By its complaint, Amgen seeks, among other remedies, an injunction prohibiting Apotex from infringing the ‘138 and ‘784 patents and enjoining Apotex from commencing commercial marketing of any biosimilar pegfilgrastim product until a date that is at least 180 days after Apotex provides legally effective notice to Amgen. Apotex answered the complaint on October 5, 2015, denying patent infringement, alleging that the patents are invalid, alleging sham litigation in violation of the Sherman Antitrust Act, seeking a declaration that the ‘138 patent is unenforceable for patent misuse and seeking a declaration on the interpretation of the BPCIA commercial notice provision.
On October 2, 2015, Amgen filed a second lawsuit in the Florida Southern District Court against Apotex for infringement of the ‘138 Patent and the ‘427 Patent and in accordance with the patent provisions of the BPCIA and for a declaration that Apotex’s pre-licensure notice of commercial marketing is legally ineffective. This lawsuit stems from Apotex’s submission of an application for FDA licensure of a filgrastim product as biosimilar to NEUPOGEN
®
. By its complaint, Amgen seeks, amongst other remedies, an injunction prohibiting Apotex from infringing the ‘138 and ‘427 patents and enjoining Apotex from commencing commercial marketing of any biosimilar filgrastim product until a date that is at least 180 days after Apotex provides legally effective notice to Amgen. On November 3, 2015, the Florida Southern District Court consolidated the
two
lawsuits into a single case.
On December 9, 2015, the Florida Southern District Court granted Amgen’s motion for preliminary injunction prohibiting Apotex from commercializing its biosimilar pegfilgrastim product until a date that is at least 180 days after Apotex provides legally effective commercial notice to Amgen. On July 5, 2016, the Federal Circuit Court affirmed the Florida Southern District Court injunction, holding that the 180-day notice of commercial marketing is mandatory under the BPCIA and can be given only post-FDA licensure of the biosimilar product. On September 9, 2016, Apotex petitioned the U.S. Supreme Court for certiorari, seeking review of the Federal Circuit Court holding. On December 12, 2016, the U.S. Supreme Court denied Apotex’s petition for certiorari.
On June 24,
2016, the Florida Southern District Court issued a further claim construction decision granting the motion for summary judgment of no literal infringement of the ‘138 Patent filed by Apotex and denying the motion with respect to no infringement under the doctrine of equivalents. On June 15, 2016, the Florida Southern District Court dismissed without prejudice all claims and counterclaims related to the ‘427 Patent and the ‘784 Patent on the parties’ joint stipulation of dismissal. In a separate order that same day, the Florida Southern District Court also dismissed without prejudice all counterclaims related to unlawful
F-43
monopolization in violation of the Sherman Antitrust Act on the parties’ joint stipulation of dismissal. On July 11, 2016, trial began on infringement of the ‘138 Patent and Apotex’s counterclaims and defenses. On September 16, 2016, the Florida Southern District Court entered final judgment that Apotex’s process of manufacturing its filgrastim and pegfilgrastim products do not infringe the ’138 Patent, dismissing without prejudice Apotex’s remaining invalidity counterclaim for patent invalidity, and making permanent the injunction compelling Apotex to provide 180-day advance notice of first commercial marketing of its filgrastim and pegfilgrastim products if and when the FDA approves these products. On October 3, 2016, Amgen filed an appeal of the final judgment to the Federal Circuit Court.
Hospira Epoetin Alfa Litigation
On September 18, 2015, Amgen filed a lawsuit in the Delaware District Court against Hospira, Inc. (Hospira), a subsidiary of Pfizer, for infringement of Amgen’s U.S. Patent Nos. 5,856,298 (the ‘298 Patent) and 5,756,349 (the ‘349 Patent) in accordance with the patent provisions of the BPCIA and for a declaration that Hospira has failed to comply with certain requirements of the BPCIA. This lawsuit stems from the submission by Hospira under the BPCIA of an application for FDA licensure of an epoetin product as biosimilar to Amgen’s EPOGEN
®
. Amgen seeks a declaration that the BPCIA requires that Hospira provide Amgen with notice of commercial marketing 180 days before it first begins commercial marketing of any biosimilar epoetin product and that this notice can be given only after the FDA has licensed Hospira’s biosimilar product. By its complaint, Amgen seeks, among other remedies, an injunction prohibiting Hospira from using or selling infringing cells and/or product manufactured during the ‘298 or the ‘349 patent terms and enjoining Hospira from commencing commercial marketing of any biosimilar epoetin product until a date that is at least 180 days after Hospira provides legally effective notice to Amgen.
On November 12, 2015, Hospira filed a motion to dismiss the
one
count of Amgen’s complaint which seeks a declaration that Hospira has failed to comply with the notice requirements of the BPCIA. On August 5, 2016, the Delaware District Court denied the motion filed by Hospira to dismiss Amgen’s complaint. On August 19, 2016, Hospira responded to the complaint denying the allegations of the First Amended Complaint and seeking judgment that the patents-in-suit are invalid and not infringed by Hospira. On August 15, 2016, Amgen moved to amend the First Amended Complaint to add additional bases for infringement of our ‘349 Patent and to add
three
additional third-party defendants. On October 3, 2016, the Delaware District Court granted-in-part and denied-in-part Amgen’s motion to amend, permitting Amgen to add the additional bases for infringement but not the additional parties to the existing lawsuit. On January 23, 2017, the Delaware District Court entered an order construing the claims of the ‘349 patent and the ‘298 patent and holding that
two
claims of the ‘298 patent are invalid for failure to properly narrow the claim from which they depend. The Delaware District Court has set a September 18, 2017 trial date.
On June 3, 2016, Amgen filed a notice of appeal seeking review of the Delaware District Court’s order that Hospira need not provide Amgen discovery of certain of its manufacturing processes that Hospira withheld during the BPCIA dispute resolution process. On August 5, 2016, the Federal Circuit Court denied Hospira’s motion to dismiss Amgen’s appeal.
Onyx Litigation
Between August 28, 2013 and September 16, 2013,
nine
plaintiffs filed purported class action lawsuits against Onyx, its directors, Amgen and Arena Acquisition Company (Arena), and unnamed “John Doe” defendants in connection with Amgen’s acquisition of Onyx.
Seven
of those purported class actions were brought in the Superior Court of the State of California for the County of San Mateo (the San Mateo County Superior Court), captioned
Lawrence I. Silverstein and Phil Rosen v. Onyx Pharmaceuticals, Inc., et al.
(August 28, 2013) (“
Silverstein
”),
Laura Robinson v. Onyx Pharmaceuticals, Inc., et al.
(originally filed in the Superior Court for the County of San Francisco on August 28, 2013, and re-filed in the San Mateo County Superior Court on August 29, 2013) (“
Robinson
”),
John Solak v. Onyx Pharmaceuticals, Inc., et al.
(August 30, 2013) (“
John Solak
”),
Louisiana Municipal Police Employees’ Retirement System and Hubert Chow v. Onyx Pharmaceuticals, Inc., et al.
(September 3, 2013) (“
Louisiana Municipal
”),
Laurine Jonopulos v. Onyx Pharmaceuticals, Inc., et al.
(September 4, 2013) (“
Jonopulos
”),
Clifford G. Martin v. Onyx Pharmaceuticals, Inc., et al
. (September 9, 2013) (“
Martin
”) and
Merrill L. Magowan v. Onyx Pharmaceuticals, Inc. et al.
(September 9, 2013) (“
Magowan
”). The eighth and ninth purported class actions were brought in the Court of Chancery of the State of Delaware, captioned
Mark D. Smilow, IRA v. Onyx Pharmaceuticals Inc., et al.
(August 29, 2013) (“
Smilow
”) and
William L. Fitzpatric v. Onyx Pharmaceuticals, Inc., et al.
(September 16, 2013) (“
Fitzpatric
”). On September 5, 2013, the plaintiff in the
John Solak
case dismissed his case. On September 10, 2013, the plaintiff in the
Smilow
case dismissed his case. On September 10, 2013, plaintiffs in the
Silverstein
and
Louisiana Municipal
cases filed an amended complaint alleging substantially the same claims and seeking substantially the same relief as in their individual purported class action lawsuits. Each of the lawsuits alleges that the Onyx director defendants breached their fiduciary duties to Onyx shareholders, and that the other defendants aided and abetted such breaches, by seeking to sell Onyx through an allegedly unfair process and for an unfair price and on unfair terms. The
Magowan
and
Fitzpatric
complaints and the amended complaint filed in the
Silverstein
and
Louisiana Municipal
cases also alleged that the individual defendants breached their fiduciary duties with respect to the contents of the tender
F-44
offer solicitation material. Each of the lawsuits sought, among other things,
rescission of the merger agreement and attorneys’ fees and costs, and certain of the lawsuits sought other relief. The
Silverstein
,
Robinson
,
Louisiana
Municipal
and
Jonopulos
cases were designated as “complex” and assigned to the Honorable Marie S. Weiner of the San Mateo County Superior Court, who subsequently entered an order consolidating the
Silverstein
,
Robinson
,
Louisiana
Municipal
,
Jonopulos
,
Martin
and
Magowan
cases (the Consolidated Cases). On October 31, 2013, the plaintiffs in the Consolidated Cases filed a consolidated class action complaint seeking certification of a class and alleging breach of fiduciary duties of loyalty and good faith against the Onyx directors and aiding and abetting breach of fiduciary duties against Onyx. The complaint sought certification of a class of all Onyx shareholders, damages (including pre- and post-judgment interest), attorneys’ fees and expenses plus other relief. The plaintiffs in the Consolidated Cases simultaneously filed a notice of dismissal without prejudice of Amgen and Arena. On January 9, 2014, the court sustained a demurrer without leave to amend as to Onyx. The plaintiff in the
Fitzpatric
case dismissed his case on August 22, 2014. On January 30, 2015, the court granted class certification and appointed Mr. Rosen as class representative in the Consolidated Cases. Following a March 2, 2016, notice of settlement filed by the plaintiffs and the Onyx director defendants, on November 21, 2016, the San Mateo Superior Court entered an order granting final approval of the settlement for an amount immaterial to Amgen.
State Derivative Litigation
The
three
state stockholder derivative complaints filed against Amgen, Kevin W. Sharer, George J. Morrow, Dennis M. Fenton, Brian M. McNamee, Roger M. Perlmutter, David Baltimore, Gilbert S. Omenn, Judith C. Pelham, Frederick W. Gluck, Jerry D. Choate, J. Paul Reason, Frank J. Biondi, Jr., Leonard D. Schaeffer, Frank C. Herringer, Richard D. Nanula, Willard H. Dere, Edward V. Fritzky, Franklin P. Johnson, Jr. and Donald B. Rice as defendants (the State Defendants) on May 1, 2007 (
Larson v. Sharer, et al.
, &
Anderson v. Sharer, et al.
), and August 13, 2007 (
Weil v. Sharer, et al.
) in the Superior Court of the State of California, Ventura County (the Ventura County Superior Court) were consolidated by the Ventura County Superior Court under
one
action captioned
Larson v. Sharer, et al
. The consolidated complaint was filed on July 5, 2007. The complaint alleges that the State Defendants breached their fiduciary duties, wasted corporate assets, were unjustly enriched and violated the California Corporations Code. Plaintiffs allege that the State Defendants failed to disclose and/or misrepresented results of Aranesp
®
clinical studies, marketed both Aranesp
®
and EPOGEN
®
for off-label uses and that these actions or inactions caused stockholders to suffer damages. The complaints also allege insider trading by the State Defendants. The plaintiffs seek treble damages based on various causes of action, reformed corporate governance, equitable and/or injunctive relief, restitution, disgorgement of profits, benefits and other compensation, and legal costs.
An amended consolidated complaint was filed on March 13, 2008, adding Anthony Gringeri as a State Defendant and removing the causes of action for insider selling and misappropriation of information, violation of California Corporations Code Section 25402 and violation of California Corporations Code Section 25403. On July 14, 2008, the Ventura County Superior Court dismissed without prejudice the consolidated state derivative class action. On July 24, 2013, the plaintiffs filed an amended complaint asserting additional grounds for the defendants’ alleged breaches of fiduciary duty. By stipulation of the parties, the case was stayed pending resolution of the
In re Amgen Inc. Securities Litigation
action. Final settlement by the parties of the
In re Amgen Inc. Securities Litigation
action
was approved by the court in October 2016, and on February 10, 2017, the Ventura County Superior Court lifted the stay in
Larson v. Sharer, et al
.
Federal Derivative Litigation
On May 7, 2007, the stockholder derivative lawsuit of
Durgin v. Sharer, et al.
, was filed in the U.S. District Court for the Central District of California (the California Central District Court) and named Amgen, Kevin W. Sharer, George J. Morrow, Dennis M. Fenton, Brian M. McNamee, Roger M. Perlmutter, David Baltimore, Gilbert S. Omenn, Judith C. Pelham, Frederick W. Gluck, Jerry D. Choate, J. Paul Reason, Frank J. Biondi, Jr., Leonard D. Schaeffer, Frank C. Herringer, Richard D. Nanula, Edward V. Fritzky and Franklin P. Johnson, Jr. as defendants. The complaint alleges the same claims and requests the same relief as in the
three
state stockholder derivative complaints now consolidated as
Larson v. Sharer, et al
. On October 10, 2016, the parties filed a joint stipulation with the California Central District Court lift the stay in of
Durgin v. Sharer, et al.
On Amgen’s motion, the court dismissed the complaint with prejudice on January 10, 2017.
ERISA Litigation
On August 20, 2007, the Employee Retirement Income Security Act (ERISA) class action lawsuit of
Harris v. Amgen Inc., et al.
, was filed in the California Central District Court and named Amgen, Kevin W. Sharer, Frank J. Biondi, Jr., Jerry Choate, Frank C. Herringer, Gilbert S. Omenn, David Baltimore, Judith C. Pelham, Frederick W. Gluck, Leonard D. Schaeffer, Jacqueline Allred, Raul Cermeno, Jackie Crouse, Lori Johnston, Michael Kelly and Charles Bell as defendants. Plaintiffs claim that Amgen and the individual defendants breached their fiduciary duties and their duty of loyalty by continuing to offer the Amgen stock fund as an investment option in the Amgen Retirement and Savings Plan and the Retirement and Savings Plan for Amgen Manufacturing, Limited (the Plans) despite the alleged off-label promotion of both Aranesp
®
and EPOGEN
®
and despite a number of allegedly
F-45
undisclosed study results that allegedly demonstrated safety concerns in patients using ESAs. Plaintiffs also allege that defendants breached their obligations under ERISA by not disclosing to plan participants the alleged off-label marketing and study results. On February 4, 2008, the California Central District Court dismissed the complaint with prejudice as to plaintiff Harris, who had filed claims against Amgen. The claims alleged by the second plaintiff, Ramos, were also dismissed but the court granted the plaintiff leave to amend his complaint. On February 1, 2008, the plaintiffs appealed the decision by the California Central District Court to dismiss the claims of both plaintiffs Harris and Ramos to the U.S. Court of Appeals for the Ninth Circuit (the Ninth Circuit Court). On May 19, 2008, plaintiff Ramos in the
Harris v. Amgen Inc., et al.
, action filed another lawsuit captioned
Ramos v. Amgen Inc., et al.
,
in the California Central District Court. The lawsuit is another ERISA class action. The
Ramos v. Amgen Inc., et al
.
,
matter names the same defendants in the
Harris v. Amgen Inc., et al.,
matter plus
four
new defendants: Amgen Manufacturing, Limited; Richard Nanula; Dennis Fenton; and the Fiduciary Committee of the Plans. On July 14, 2009, the Ninth Circuit Court reversed the California Central District Court’s decision in the
Harris
matter and remanded the case back to the California Central District Court. In the meantime, a third ERISA class action was filed by Don Hanks on June 2, 2009 in the California Central District Court alleging the same ERISA violations as in the
Harris
and
Ramos
lawsuits.
On August 10, 2009, the
Harris
,
Ramos
and
Hanks
matters were consolidated by the California Central District Court into
one
action captioned
Harris, et. al. v. Amgen Inc.
Plaintiffs filed an amended complaint on November 11, 2009 and added
two
additional plaintiffs, Jorge Torres and Albert Cappa. Amgen filed a motion to dismiss the amended/consolidated complaint, and on March 2, 2010, the California Central District Court dismissed the entire lawsuit without prejudice. Plaintiffs filed an amended complaint on March 23, 2010. Amgen then filed another motion to dismiss on April 20, 2010. On June 16, 2010, the California Central District Court entered an order dismissing the entire lawsuit with prejudice. On June 24, 2010, the plaintiffs filed a notice of appeal with the Ninth Circuit Court. On June 4, 2013, the Ninth Circuit Court reversed the decision of the California Central District Court and remanded the case back to the California Central District Court for further proceedings. On June 18, 2013, Amgen petitioned the Ninth Circuit Court for rehearing and/or rehearing
en banc
. The Ninth Circuit Court issued an amended opinion and denied Amgen’s petition for rehearing and rehearing
en banc
on October 23, 2013.
On June 30, 2014, the U.S. Supreme Court granted a petition for certiorari filed by Amgen and the other named defendants, vacated the judgment of the Ninth Circuit Court and remanded this case to the Ninth Circuit Court for reconsideration in light of the U.S. Supreme Court’s decision in
Fifth Third Bancorp v. Dudenhoeffer
, decided June 25, 2014. On October 23, 2014, the Ninth Circuit Court reaffirmed its earlier decision of June 4, 2013. On November 13, 2014, Amgen filed a petition for rehearing
en banc
with the Ninth Circuit Court. On May 26, 2015, the Ninth Circuit Court denied Amgen’s petition for rehearing
en banc.
On January 25, 2016, the U.S. Supreme Court granted Amgen’s petition for certiorari, reversed the judgment of the Ninth Circuit Court and remanded the case back to the California Central District Court for further proceedings. On June 27, 2016, the parties reached an agreement in principle to settle this case for an immaterial amount. On November 29, 2016, the California Central District Court entered an order granting preliminary approval of the settlement.
Commitments
We lease certain facilities and equipment related primarily to administrative, R&D, sales and marketing activities under noncancelable operating leases that expire through 2032. The following table summarizes the minimum future rental commitments under noncancelable operating leases as of
December 31, 2016
, (in millions):
|
2017
|
$
|
156
|
|
|
2018
|
149
|
|
|
|
2019
|
135
|
|
|
|
2020
|
123
|
|
|
|
2021
|
108
|
|
|
|
Thereafter
|
116
|
|
|
|
Total minimum operating lease commitments
|
$
|
787
|
|
Included in the table above are future rental commitments for abandoned leases in the amount of
$309 million
. There were no material charges for lease abandonments related to the restructuring plan that commenced in 2014 (see Note 2, Restructuring). We expect to receive total future rental income of
$228 million
relating to noncancelable subleases of abandoned facilities. Rental expense on operating leases for the years ended
December 31, 2016
,
2015
and
2014
, was
$134 million
,
$133 million
and
$126 million
, respectively.
F-46
19. Segment information
We operate in
one
business segment—human therapeutics. Therefore, results of our operations are reported on a consolidated basis for purposes of segment reporting, consistent with internal management reporting. Enterprise-wide disclosures about product sales; revenues and long-lived assets by geographic area; and revenues from major customers are presented below.
Revenues
Revenues were as follows (in millions):
|
Years ended December 31,
|
|||||||||||
|
2016
|
2015
|
2014
|
|||||||||
|
Product sales:
|
|||||||||||
|
ENBREL
|
$
|
5,965
|
|
$
|
5,364
|
|
$
|
4,688
|
|
||
|
Neulasta
®
|
4,648
|
|
4,715
|
|
4,596
|
|
|||||
|
Aranesp
®
|
2,093
|
|
1,951
|
|
1,930
|
|
|||||
|
Prolia
®
|
1,635
|
|
1,312
|
|
1,030
|
|
|||||
|
Sensipar
®
/Mimpara
®
|
1,582
|
|
1,415
|
|
1,158
|
|
|||||
|
XGEVA
®
|
1,529
|
|
1,405
|
|
1,221
|
|
|||||
|
EPOGEN
®
|
1,282
|
|
1,856
|
|
2,031
|
|
|||||
|
NEUPOGEN
®
|
765
|
|
1,049
|
|
1,159
|
|
|||||
|
KYPROLIS
®
|
692
|
|
512
|
|
331
|
|
|||||
|
Vectibix
®
|
611
|
|
549
|
|
505
|
|
|||||
|
Nplate
®
|
584
|
|
525
|
|
469
|
|
|||||
|
Repatha
®
|
141
|
|
10
|
|
—
|
|
|||||
|
BLINCYTO
®
|
115
|
|
77
|
|
3
|
|
|||||
|
Other
|
250
|
|
204
|
|
206
|
|
|||||
|
Total product sales
|
21,892
|
|
20,944
|
|
19,327
|
|
|||||
|
Other revenues
|
1,099
|
|
718
|
|
736
|
|
|||||
|
Total revenues
|
$
|
22,991
|
|
$
|
21,662
|
|
$
|
20,063
|
|
||
Geographic information
Outside the United States, we sell products principally in Europe. The geographic classification of product sales was based on the location of the customer. The geographic classification of all other revenues was based on the domicile of the entity from which the revenues were earned.
F-47
Certain geographic information with respect to revenues and long-lived assets (consisting of property, plant and equipment, net) was as follows (in millions):
|
|
Years ended December 31,
|
||||||||||
|
|
2016
|
2015
|
2014
|
||||||||
|
Revenues:
|
|||||||||||
|
United States
|
$
|
18,326
|
|
$
|
17,167
|
|
$
|
15,396
|
|
||
|
Rest of the world (ROW)
|
4,665
|
|
4,495
|
|
4,667
|
|
|||||
|
Total revenues
|
$
|
22,991
|
|
$
|
21,662
|
|
$
|
20,063
|
|
||
|
|
December 31,
|
||||||
|
|
2016
|
2015
|
|||||
|
Long-lived assets:
|
|||||||
|
United States
|
$
|
2,328
|
|
$
|
2,275
|
|
|
|
Puerto Rico
|
1,591
|
|
1,679
|
|
|||
|
ROW
|
1,042
|
|
953
|
|
|||
|
Total long-lived assets
|
$
|
4,961
|
|
$
|
4,907
|
|
|
Major customers
In the United States, we sell primarily to pharmaceutical wholesale distributors that we utilize as the principal means of distributing our products to healthcare providers. Outside the United States, we sell principally to healthcare providers and/or pharmaceutical wholesale distributors depending on the distribution practice in each country. We monitor the financial condition of our larger customers and limit our credit exposure by setting credit limits and, in certain circumstances, by requiring letters of credit.
We had product sales to
three
customers each accounting for more than
10%
of total revenues for each of the years ended
December 31, 2016
,
2015
and
2014
. For 2016, on a combined basis, these customers accounted for
81%
and
96%
of total gross revenues and U.S. gross product sales, respectively, as noted in the following table. Certain information with respect to these customers was as follows (dollar amounts in millions):
|
Years ended December 31,
|
|||||||||||
|
2016
|
2015
|
2014
|
|||||||||
|
AmerisourceBergen Corporation:
|
|||||||||||
|
Gross product sales
|
$
|
10,100
|
|
$
|
10,038
|
|
$
|
9,142
|
|
||
|
% of total gross revenues
|
31
|
%
|
34
|
%
|
34
|
%
|
|||||
|
% of U.S. gross product sales
|
38
|
%
|
42
|
%
|
43
|
%
|
|||||
|
McKesson Corporation:
|
|||||||||||
|
Gross product sales
|
$
|
9,710
|
|
$
|
8,766
|
|
$
|
8,011
|
|
||
|
% of total gross revenues
|
30
|
%
|
30
|
%
|
30
|
%
|
|||||
|
% of U.S. gross product sales
|
34
|
%
|
34
|
%
|
35
|
%
|
|||||
|
Cardinal Health, Inc.:
|
|||||||||||
|
Gross product sales
|
$
|
6,520
|
|
$
|
5,045
|
|
$
|
3,407
|
|
||
|
% of total gross revenues
|
20
|
%
|
17
|
%
|
13
|
%
|
|||||
|
% of U.S. gross product sales
|
24
|
%
|
21
|
%
|
16
|
%
|
|||||
At
December 31, 2016
and
2015
, amounts due from these
three
customers each
exceeded 10%
of gross trade receivables and accounted for
76%
and
75%
, respectively, of net trade receivables on a combined basis. At
December 31, 2016
and
2015
,
21%
and
23%
, respectively, of trade receivables, net, were due from customers located outside the United States, primarily in Europe. Our total allowance for doubtful accounts as of
December 31, 2016
and
2015
was not material.
F-48
20. Quarterly financial data (unaudited)
|
2016 Quarters ended
|
|||||||||||||||
|
(In millions, except per share data)
|
December 31
|
September 30
|
June 30
|
March 31
|
|||||||||||
|
Product sales
|
$
|
5,663
|
|
$
|
5,516
|
|
$
|
5,474
|
|
$
|
5,239
|
|
|||
|
Gross profit from product sales
|
$
|
4,596
|
|
$
|
4,489
|
|
$
|
4,424
|
|
$
|
4,221
|
|
|||
|
Net income
|
$
|
1,935
|
|
$
|
2,017
|
|
$
|
1,870
|
|
$
|
1,900
|
|
|||
|
Earnings per share:
|
|||||||||||||||
|
Basic
|
$
|
2.61
|
|
$
|
2.70
|
|
$
|
2.49
|
|
$
|
2.52
|
|
|||
|
Diluted
|
$
|
2.59
|
|
$
|
2.68
|
|
$
|
2.47
|
|
$
|
2.50
|
|
|||
|
2015 Quarters ended
|
|||||||||||||||
|
(In millions, except per share data)
|
December 31
|
September 30
|
June 30
|
March 31
|
|||||||||||
|
Product sales
|
$
|
5,329
|
|
$
|
5,516
|
|
$
|
5,225
|
|
$
|
4,874
|
|
|||
|
Gross profit from product sales
|
$
|
4,258
|
|
$
|
4,482
|
|
$
|
4,136
|
|
$
|
3,841
|
|
|||
|
Net income
|
$
|
1,800
|
|
$
|
1,863
|
|
$
|
1,653
|
|
$
|
1,623
|
|
|||
|
Earnings per share:
|
|||||||||||||||
|
Basic
|
$
|
2.39
|
|
$
|
2.46
|
|
$
|
2.18
|
|
$
|
2.13
|
|
|||
|
Diluted
|
$
|
2.37
|
|
$
|
2.44
|
|
$
|
2.15
|
|
$
|
2.11
|
|
|||
F-49
SCHEDULE II
AMGEN INC.
VALUATION AND QUALIFYING ACCOUNTS
Years ended December 31, 2016, 2015 and 2014
(In millions)
|
Allowance for doubtful accounts
|
Balance at
beginning
of period
|
Additions
charged to
costs and
expenses
|
Other
additions
|
Deductions
|
Balance
at end
of
period
|
||||||||||||||
|
Year ended December 31, 2016
|
$
|
55
|
|
$
|
11
|
|
$
|
—
|
|
$
|
15
|
|
$
|
51
|
|
||||
|
Year ended December 31, 2015
|
$
|
50
|
|
$
|
18
|
|
$
|
—
|
|
$
|
13
|
|
$
|
55
|
|
||||
|
Year ended December 31, 2014
|
$
|
59
|
|
$
|
3
|
|
$
|
—
|
|
$
|
12
|
|
$
|
50
|
|
||||
F-50
TABLE OF CONTENTS
Part IItem 1. BusinessItem 1A. Risk FactorsItem 1B. Unresolved Staff CommentsItem 2. PropertiesItem 3. Legal ProceedingsItem 4. Mine Safety DisclosuresPart IIItem 5. Market For Registrant S Common Equity, Related Stockholder Matters and Issuer Purchases Of Equity SecuritiesPart OfItem 6. Selected Financial DataItem 7. Management S Discussion and Analysis Of Financial Condition and Results Of OperationsPart IVNote 14, Financing Arrangements, To The Consolidated Financial StatementsItem 7A. Quantitative and Qualitative Disclosures About Market RiskItem 8. Financial Statements and Supplementary DataItem 9. Changes in and Disagreements with Accountants on Accounting and Financial DisclosuresItem 9A. Controls and ProceduresItem 9B. Other InformationPart IIIItem 10. Directors, Executive Officers and Corporate GovernanceItem 11. Executive CompensationItem 12. Security Ownership Of Certain Beneficial Owners and Management and Related Stockholder MattersItem 13. Certain Relationships and Related Transactions and Director IndependenceItem 14. Principal Accounting Fees and ServicesItem 15. Exhibits, Financial Statement SchedulesNote 9, Available-for-sale Investments For The Fair Value Of Equity Securities As Of December 31, 2016