AMKOR TECHNOLOGY, INC.
10-Ks and 10-Qs
|
|
|
|
|
|
|
|
|
|
|
|
|
|
|
|
|
|
|
|
|
|
|
|
|
|
|
|
|
|
|
|
|
|
|
|
|
|
|
|
|
|
|
|
|
|
|
|
|
|
|
|
|
|
|
|
UNITED STATES
SECURITIES AND EXCHANGE COMMISSION
Washington, D.C. 20549
Form 10-K
ANNUAL REPORT PURSUANT TO SECTION 13 OR 15(d)
OF THE SECURITIES EXCHANGE ACT OF 1934
For the Fiscal Year Ended
December 31, 2016
Commission File Number 000-29472
Amkor Technology, Inc.
(Exact name of registrant as specified in its charter)
|
Delaware
(State of incorporation)
|
23-1722724
(I.R.S. Employer Identification Number)
|
|||
2045 East Innovation Circle
Tempe, AZ 85284
(480) 821-5000
(Address of principal executive offices and zip code)
Securities registered pursuant to Section 12(b) of the Act:
|
Title of Each Class
|
Name of Each Exchange on Which Registered
|
|||
|
Common Stock, $0.001 par value
|
The NASDAQ Global Select Market
|
|||
Securities registered pursuant to Section 12(g) of the Act:
None
Indicate by check mark if the registrant is a well-known seasoned issuer, as defined in Rule 405 of the Securities Act. Yes
þ
No
o
Indicate by check mark if the registrant is not required to file reports pursuant to Section 13 or Section 15(d) of the Act. Yes
o
No
þ
Indicate by check mark whether the registrant (1) has filed all reports required to be filed by Section 13 or 15(d) of the Securities Exchange Act of 1934, as amended, during the preceding 12 months (or for such shorter period that the registrant was required to file such reports), and (2) has been subject to such filing requirements for the past 90 days. Yes
þ
No
o
Indicate by check mark whether the registrant has submitted electronically and posted on its corporate Web site, if any, every Interactive Data File required to be submitted and posted pursuant to Rule 405 of Regulation S-T during the preceding 12 months (or for such shorter period that the registrant was required to submit and post such files). Yes
þ
No
o
Indicate by check mark if disclosure of delinquent filers pursuant to Item 405 of Regulation S-K is not contained herein, and will not be contained, to the best of registrant’s knowledge, in definitive proxy or information statements incorporated by reference in Part III of this Form 10-K or any amendment to this Form 10-K.
o
Indicate by check mark whether the registrant is a large accelerated filer, an accelerated filer, a non-accelerated filer, or a smaller reporting company. See the definitions of “large accelerated filer,” “accelerated filer” and “smaller reporting company” in Rule 12b-2 of the Exchange Act. (Check one):
|
Large accelerated filer
þ
|
Accelerated filer
o
|
Non-accelerated filer
o
|
Smaller reporting company
o
|
|
(Do not check if a smaller reporting company)
|
|||
Indicate by check mark whether the registrant is a shell company (as defined in Rule 12b-2 of the Exchange Act). Yes
o
No
þ
The aggregate market value of the voting and non-voting common equity held by non-affiliates of the registrant as of
June 30, 2016
, based upon the closing price of the common stock as reported by the NASDAQ Global Select Market on that date, was approximately
$569.1 million
.
The number of shares outstanding of each of the issuer’s classes of common equity, as of
February 17, 2017
, was as follows:
238,788,413
shares of Common Stock, $0.001 par value.
DOCUMENTS INCORPORATED BY REFERENCE:
Portions of the registrant’s Proxy Statement relating to its
2017
Annual Meeting of Stockholders, to be filed subsequently, are incorporated by reference into Part III of this Report where indicated.
TABLE OF CONTENTS
|
Page
|
||
All references in this Annual Report on Form 10-K to “Amkor,” “we,” “us,” “our” or the “company” are to Amkor Technology, Inc. and its subsidiaries. We refer to the Republic of Korea, which is also commonly known as South Korea, as “Korea”. All references to "J-Devices", "Toshiba" and "Qualcomm" are to J-Devices Corporation, our wholly owned subsidiary in Japan, Toshiba Corporation and Qualcomm Incorporated, respectively. We also refer to our new factory and research and development facility in Incheon, Korea as "K5". Amounts preceded by ¥ are in Japanese yen, and amounts preceded by ₩ are in Korean won. Amkor
®
, Amkor Technology
®
, ChipArray
®
, FusionQuad
®
, J-Devices
TM
,
Micro
LeadFrame
®
, TMV
®
, SWIFT
TM
, and SLIM
TM
, among others, are trademarks of Amkor Technology, Inc. All other trademarks appearing herein are held by their respective owners. Subsequent use of the above trademarks in this report may occur without the respective superscript symbol (
®
and
TM
) in order to facilitate the readability of the report and are not a waiver of any rights that may be associated with the relevant trademarks.
1
This report contains forward-looking statements within the meaning of the federal securities laws, including but not limited to statements regarding: (1) the amount, timing and focus of our expected capital investments in 2017 including expenditures in support of advanced packaging and test equipment and expenditures related to our K5 factory and research and development facility in Korea, (2) our ability to fund our operating activities and financial requirements for the next twelve months, (3) the effect of changes in capacity utilization on our gross margin, (4) the focus of our research and development activities, (5) the expiration of tax holidays in jurisdictions in which we operate and expectations regarding our effective tax rate and the availability of tax incentives, (6) the creation or release of valuation allowances related to taxes in the future, (7) our repurchase or repayment of outstanding debt or the conversion of debt in the future, (8) payment of dividends, (9) compliance with our covenants, (10) expected contributions to foreign pension plans, (11) liability for unrecognized tax benefits and the potential impact of our unrecognized tax benefits on our effective tax rate, (12) the effect of foreign currency exchange rate exposure on our financial results, (13) the volatility of the trading price of our common stock, (14) changes to our internal controls related to integration of acquired operations and implementation of an enterprise resource planning system, (15) our efforts to enlarge our customer base in certain geographic areas and markets, (16) demand for advanced packages in mobile devices and our technology leadership and potential growth in this market, (17) our expected forfeiture rate for outstanding stock options and restricted shares, (18) our expected rate of return for pension plan assets, (19) the impact of the recent earthquakes in Kumamoto, Japan, (20) the sale of our K1 factory in Korea and the anticipated gain from the transaction, and our plan to consolidate our factory operations in Korea and (21) other statements that are not historical facts. In some cases, you can identify forward-looking statements by terminology such as “may,” “will,” “should,” “expects,” “plans,” “anticipates,” “believes,” “estimates,” “predicts,” “potential,” “continue,” “intend” or the negative of these terms or other comparable terminology. Because such statements include risks and uncertainties, actual results may differ materially from those anticipated in such forward-looking statements as a result of various factors, including those set forth in the following report as well as in Part I, Item 1A of this Annual Report on Form 10-K.
2
|
Item 1.
|
Business
|
OVERVIEW
Amkor is one of the world’s leading providers of outsourced semiconductor packaging and test services. Amkor pioneered the outsourcing of semiconductor packaging and test services through a predecessor corporation in 1968, and over the years we have built a leading position by:
|
•
|
Designing and developing innovative packaging and test technologies;
|
|
•
|
Offering a broad portfolio of cost-effective solutions and services;
|
|
•
|
Focusing on strategic end markets that offer solid growth potential;
|
|
•
|
Cultivating long-standing relationships with our customers, which include many of the world’s leading semiconductor companies;
|
|
•
|
Collaborating with customers, original equipment manufacturers (“OEMs”) and equipment and material suppliers;
|
|
•
|
Developing a competitive cost structure with disciplined capital investment;
|
|
•
|
Building expertise in high-volume manufacturing processes and developing a reputation for high quality and solid execution and
|
|
•
|
Providing a geographically diverse operating base, with research and development, engineering support and production capabilities at various facilities in China, Japan, Korea, Malaysia, the Philippines and Taiwan.
|
Our packaging and test services are designed to meet application and chip specific requirements including the required type of interconnect technology; size; thickness and electrical, mechanical and thermal performance. We are able to provide turnkey packaging and test services including semiconductor wafer bump, wafer probe, wafer back-grind, package design, packaging, system-level and final test and drop shipment services. Our customers use us for one or more of these services.
We provide our services to integrated device manufacturers (“IDMs”), “fabless” semiconductor companies and contract foundries. IDMs generally design, manufacture, package and test semiconductors in their own facilities. However, the availability of technologically advanced outsourced manufacturing services has encouraged IDMs to outsource a portion of their manufacturing. Fabless semiconductor companies do not have factories and focus exclusively on the semiconductor design process and outsource virtually every step of the manufacturing process. Fabless semiconductor companies utilize contract foundries to manufacture their semiconductors in wafer form, and companies such as Amkor for their packaging and test needs. Some companies will engage a contract foundry to manage the complete semiconductor manufacturing process, and in turn, the contract foundry will outsource some of its packaging and test needs.
Our IDM customers include: Intel Corporation; Renesas Electronics Corporation; STMicroelectronics N.V.; Texas Instruments Incorporated and Toshiba Corporation. Our fabless customers include: Broadcom Limited and Qualcomm Incorporated. Our contract foundry customers include: GlobalFoundries Inc. and Taiwan Semiconductor Manufacturing Company Limited.
J-Devices Corporation
On
December 30, 2015
, we increased our ownership in J-Devices Corporation to 100%. As a result, our accounting for J-Devices changed from the equity method to the consolidation method and the operating results of J-Devices were consolidated beginning in 2016. J-Devices is the largest provider of outsourced semiconductor packaging and test services in Japan, which are primarily focused on the automotive, industrial and consumer end markets. In 2016, approximately 90% of J-Devices' net sales were generated from mainstream products and related test services.
3
AVAILABLE INFORMATION
Amkor files annual, quarterly and current reports, proxy statements and other information with the U.S. Securities and Exchange Commission (the “SEC”). You may read and copy any document we file at the SEC’s Public Reference Room, 100 F Street, NE, Washington, D.C. 20549. Please call the SEC at 1-800-SEC-0330 for information on the Public Reference Room. The SEC maintains a web site that contains annual, quarterly and current reports, proxy statements and other information that issuers (including Amkor) file electronically with the SEC. The SEC’s web site is
http://www.sec.gov
.
Amkor’s web site is
http://www.amkor.com.
Amkor makes available free of charge through its web site, our annual reports on Form 10-K; quarterly reports on Form 10-Q; current reports on Form 8-K; Forms 3, 4 and 5 filed on behalf of directors and executive officers and any amendments to those reports filed or furnished pursuant to the Securities Exchange Act of 1934, as amended, as soon as reasonably practicable after such material is electronically filed with, or furnished to, the SEC. We also make available, free of charge, through our web site, our Corporate Governance Guidelines, the charters of the Audit Committee, Nominating and Governance Committee and Compensation Committee of our Board of Directors, our Code of Business Conduct, our Code of Ethics for Directors and other information and materials. The information on Amkor’s web site is not incorporated by reference into this report.
INDUSTRY BACKGROUND
Semiconductor devices are the essential building blocks used in most electronic products. As electronic and semiconductor devices have evolved, several important trends have emerged that have fueled the growth of the overall semiconductor industry, as well as the market for outsourced semiconductor packaging and test services. These trends include:
|
•
|
An increasing demand for mobile and internet-connected devices, including the world-wide adoption of “smart” phones, tablets and other consumer electronic devices that can access the internet and provide multimedia capabilities.
|
|
•
|
An increase in mobility and connectivity capabilities and growing digital content driving demand for new broadband wired and wireless networking equipment.
|
|
•
|
The proliferation of semiconductor devices into well-established end products such as automotive systems due to increased use of electronics for safety, navigation, fuel efficiency, emission reduction and entertainment systems.
|
|
•
|
An overall increase in the semiconductor content within electronic products to provide greater functionality and higher levels of performance.
|
|
•
|
The growth of advanced System-in-Package ("SiP") modules where multiple semiconductor and other electronic components with different functionalities are combined into a single package. The increasing demand for miniaturization and higher functionality at competitive cost is driving the adoption of advanced SiP in new products.
|
As a supplier in the semiconductor industry, our business is cyclical by nature and impacted by broad economic factors, such as world-wide gross domestic product and consumer spending. Historical trends indicate there has been a strong correlation between world-wide gross domestic product levels, consumer spending and semiconductor industry cycles.
4
Outsourcing Trends in Semiconductor Manufacturing
Semiconductor companies outsource their packaging and test needs to service providers such as Amkor for the following reasons:
Packaging and test service providers have developed expertise in advanced technologies.
The increasing demands for miniaturization, greater functionality, lower power consumption and improved thermal and electrical performance are driving the continuous development of semiconductor packaging and test technologies that are more sophisticated, complex and customized. This trend has led many semiconductor companies and OEMs to view packaging and test as enabling technologies requiring the kind of leading-edge expertise for technological innovation found in the leading outsourced assembly and test companies. At the same time, these companies are often looking to reduce the internal manufacturing and research and development costs in packaging and test. As a result, many of these companies are increasingly relying on packaging and test
service providers as key sources for new package designs and advanced interconnect technologies.
Packaging and test service providers offer a cost effective solution in a highly cyclical, capital intensive industry.
The semiconductor industry is cyclical by nature and impacted by broad economic factors, such as changes in worldwide gross domestic product and consumer spending. Semiconductor packaging and test are complex processes requiring substantial investment in specialized equipment, factories and human resources. As a result of this cyclicality and the large investments required, manufacturing facilities must operate at consistently high levels of utilization to be cost effective. Shorter product life cycles, coupled with the need to update or replace packaging and test equipment to accommodate new package types, make it more difficult for integrated semiconductor companies to maintain cost effective utilization of their packaging and test assets throughout semiconductor industry cycles. Packaging and test service providers, on the other hand, can typically use their assets to support a broad range of customers, potentially generating more efficient use of their production assets and a more cost effective solution.
Packaging and test service providers can facilitate a more efficient supply chain and help shorten time-to-market for new products.
We believe that semiconductor companies, together with their customers, are seeking to shorten the time-to-market for their new products, and that having an effective supply chain is a critical factor in facilitating timely and successful product introductions. Packaging and test service providers have the resources and expertise to timely develop their capabilities and implement new packaging technology in volume. For this reason, semiconductor companies and OEMs are leveraging the capabilities of packaging and test service providers to deliver their new products to market more quickly.
High quality packaging and test service providers enable semiconductor manufacturers to focus their resources on semiconductor design and wafer fabrication.
As semiconductor process technology migrates to larger wafers and smaller feature sizes, the cost of building a state-of-the-art wafer fabrication factory has risen significantly and can now be several billions of dollars. The high cost of investing in next generation silicon technology and equipment is causing many semiconductor companies to adopt or maintain a “fabless” or “fab-lite” strategy to reduce or eliminate their investment in wafer fabrication and associated packaging and test operations. As a result, these companies are increasing their reliance on outsourced providers of semiconductor manufacturing services, including packaging and test.
5
STRATEGY AND COMPETITIVE STRENGTHS
Strategy
Our financial goals are sales growth and improved profitability, and we are focusing on the following strategies to achieve these goals:
Leverage Our Investment in Services for Advanced Technologies
We are an industry leader in developing and commercializing cost-effective advanced packaging and test technologies. These advanced technology solutions provide increased value to our customers while typically generating gross margins above our corporate average. An important factor for success in the advanced packaging and test area is to generate reasonably quick returns on investments made in support of customers seeking leading-edge technologies.
In recent years we have made significant investments in state-of-the-art facilities and equipment to provide services for the industry’s most complex devices. With approximately
650
employees engaged in research and development of new semiconductor packaging and test technologies, we are a technology leader in areas such as fine pitch bumping, advanced flip chip and wafer-level processing. During 2016, we had success capitalizing on our advanced technology to achieve design wins and new product introductions in areas such as chips fabricated at 14 and 16 nanometer geometries and advanced SiP products including radio frequency ("RF"), front end modules and micro-electro-mechanical systems ("MEMS") devices.
We work closely with our customers to develop cost-effective leading-edge packages for the next generation of devices, and we are making substantial progress in a number of areas. These include integrated technologies such as advanced SiP, wafer-level fan-out, Silicon Wafer Integrated Fan-out Technology ("SWIFT") and Silicon-Less Integrated Module ("SLIM") solutions which enable very thin, very small products combining application processors, memory, baseband and other peripheral integrated circuits ("IC’s"). They also include packages utilizing Through Silicon Via ("TSV") interconnects and silicon interposers which enable the integration of high performance chips such as high bandwidth memory and graphics processors into a single package.
We believe that advanced packaging services will continue to grow as our customers and leading electronics OEMs strive for smaller device geometries, higher levels of speed and performance and lower power consumption. We intend to continue to leverage our investment in advanced technology to meet the demand for these services.
Improve Utilization of Existing Assets and Broaden Our Customer Base
Another key to our success is to improve the utilization of our existing assets. The transition by leading edge customers to newer packaging and test equipment platforms typically frees up capacity in existing, previously installed equipment. As part of our strategy, we are focused on developing a second wave of customers to more effectively utilize these assets over a longer period of time.
In particular, we are devoting substantial resources to increasing our sales to Chinese and Taiwanese fabless chip companies which have a significant portion of the fast-growing mid-tier and entry-level segments of the mobile device market where much of the growth is occurring.
A key element of our Greater China strategy is our world-class factory in Shanghai. In 2016, we expanded our clean room space at this facility by nearly 45%, to a total of about 625,000 square feet. Our Shanghai facility serves both international and local customers, with a heavy emphasis on wafer-level packaging, wafer bumping, stacked die packaging and advanced test services.
A portion of our expanded Shanghai facility houses Qualcomm Communication Technologies (Shanghai) Co. Ltd., Qualcomm’s new semiconductor test facility. This new test center combines Amkor’s extensive test services experience and state-of-the-art cleanroom facilities with Qualcomm's industry leadership in cutting-edge product engineering and development. The co-location of the test center at our Shanghai factory helps to strengthen our close business relationship with a key customer.
6
As part of our plan to consolidate factory operations in Korea, we entered into an agreement in November 2016 to sell the land and buildings comprising our K1 factory for a purchase price of approximately
$135 million
. The transaction is expected to close during the second quarter of 2017 and result in a pre-tax gain of approximately
$100 million
.
We also plan to consolidate several factories in Japan to better align our manufacturing footprint with the demand environment and reduce our fixed costs.
Balanced Growth
Revenue growth is a significant objective for Amkor. We strive to grow in a balanced way and avoid over-reliance on any single market or customer. Our goal is to achieve more consistent financial performance through all phases of the business cycle. Our balanced growth strategy has four components, as follows:
|
•
|
First, we are increasing our revenue in markets other than smartphones and tablets, such as automotive. Revenue from these markets tends to be more stable, with less pronounced highs and lows from year to year. With the acquisition of J-Devices, sales in these other markets now account for 56% of our overall revenue, up from 45% in 2015.
|
|
•
|
Second, we are expanding our customer base in the smartphone and tablet market, primarily by engaging with fabless companies in Greater China. This allows us to more fully utilize our existing assets and broadens our participation in all tiers of the mobile device market.
|
|
•
|
Third, we continue to make share gains in the iOS and high-end Android ecosystems, leveraging our expertise in advanced SiP, MEMS and other advanced packages to expand our content in flagship phones.
|
|
•
|
Finally, we are focused on building and utilizing manufacturing lines which support multiple customers, and increasing factory utilization through more sophisticated planning processes and more intensive efficiency improvement activities.
|
Selectively Grow Our Scale and Scope through Strategic Investments
From time to time we see attractive opportunities to grow our customer base and expand markets through strategic investments. For example, in 2015 we completed the acquisition of 100% of J-Devices, our outsourced semiconductor assembly and test ("OSAT") joint venture in Japan. We believe that with this acquisition we have become the largest OSAT by revenue for the automotive market, with nearly $1 billion in combined automotive-based revenues in 2016. In addition, Renesas agreed to transfer most of its Singapore-based automotive microcontroller production to J-Devices’ factories. That transfer began in 2015 and was completed in 2016.
We believe that selective growth through joint ventures, acquisitions and other strategic investments can help diversify our revenue streams, improve our profits and maintain our technological leadership.
Competitive Strengths
The outsourced semiconductor packaging and test market is very competitive. We also compete with the internal semiconductor packaging and test capabilities of many of our customers and foundries. We believe we are well-positioned in the outsourced packaging and test services market. The following competitive strengths allow us to build upon our industry position and to remain one of the preferred providers of semiconductor packaging and test services.
Leading Technology Innovator
We are a leader in developing advanced semiconductor packaging and test solutions. We have designed and developed several state-of-the-art package formats and technologies including our Package-on-Package (“PoP”) platform with Through Mold Via (“TMV”) technology, molded embedded packages, FusionQuad, flip chip ball grid array, multi-chip modules with a silicon interposer placed between the module chips and substrate, copper pillar bumping and fine pitch copper pillar flip chip packaging technologies. In addition, we believe that as semiconductor technology continues to achieve smaller device geometries with higher levels of speed and performance, packages will increasingly require wafer-level chip scale packaging,
7
wafer-level fan-out, flip chip and advanced integrated and modular interconnect solutions that combine multiple active chips and other elements in a single package. We have been investing in our technology leadership in wafer bumping, wafer-level processing, wafer-level fan-out, advanced SiP, SLIM and SWIFT packaging technologies. We have also been a leader in developing environmentally friendly IC packaging, which involves the elimination of lead and certain other materials.
The semiconductor industry is now in a period of packaging development where integrated wafer-level fan-out and TSV interconnect technologies will be used to create the next generation of advanced packages. We continue to invest in developing the key processes and packaging and test technologies required for our customers to deliver advanced integrated and modular solutions to market. We are a leader in wafer thinning, micro-bumping, die stacking, hybrid packaging and TSV-based flip chip innovation, and we are leveraging our technology development relationships with key customers in diverse applications to develop and deploy these packaging and test solutions.
Long-Standing Relationships and Collaboration with Prominent Semiconductor Companies
Our customers include most of the world’s largest semiconductor companies and over the last four decades, we have developed long-standing relationships with many of these companies. We believe that our production excellence has been a key factor in our success in attracting and retaining customers. We work with our customers and our suppliers to develop proprietary process technologies to enhance our existing capabilities, reduce time-to-market, increase quality and lower costs.
We believe that our focus on research and product development will enable us to enter new markets early, capture market share and promote the adoption of our new package designs as industry standards. We collaborate with customers and leading OEMs to develop comprehensive packaging solutions that make it easier for next-generation semiconductors to be designed into next-generation end products. By collaborating with leading semiconductor companies and OEM electronic companies, we gain access to technology roadmaps for next generation semiconductor designs and obtain the opportunity to develop new packages that satisfy their future requirements.
Broad Offering of Semiconductor Package Design, Packaging and Test Services
Creating successful interconnect solutions for advanced semiconductor devices often poses unique thermal, electrical and mechanical design challenges, and we employ a large number of engineers to solve these challenges. We provide services for a wide variety of products. This wide variety of packaging offerings is necessary to meet the diverse needs of our customers for the optimal combination of performance, size and cost attributes. Our solutions enable our customers to focus on semiconductor design and wafer fabrication while utilizing Amkor as their turnkey design, packaging and test services provider and, in many cases, their packaging technology innovator.
We also offer an extensive line of advanced probe and final test services for analog, digital, logic, mixed signal and RF semiconductor devices. We believe that the breadth of our design, packaging and test services is important to customers seeking to limit the number of their suppliers.
Geographically Diversified Operating Base
We have a broad and geographically diversified operating footprint strategically located in six countries in many of the world’s important electronics manufacturing regions. We believe that our scale and scope allow us to provide cost effective solutions to our customers by:
|
•
|
Offering capacity to absorb large orders and accommodate quick turn-around times;
|
|
•
|
Obtaining favorable pricing on materials and equipment, where possible, by using our purchasing power and leading industry position;
|
|
•
|
Qualifying production of customer devices at multiple manufacturing sites to mitigate the risks of supply disruptions and
|
|
•
|
Providing capabilities and solutions for customer-specific requirements.
|
8
For financial information about geographic areas, see
Note 18
to our Consolidated Financial Statements in Part II, Item 8 of this Annual Report on Form 10-K.
Competitive Cost Structure and Disciplined Capital Investment
There is a continuous push throughout the entire semiconductor supply chain for lower cost solutions. We work to maintain a competitive cost structure and make disciplined capital investment decisions so that we can provide cost-competitive solutions to our customers and achieve sustainable profitability and cash flow. Some of our cost control efforts have included: (1) improving the utilization of our existing assets; (2) utilizing flexible manufacturing lines that can accommodate a variety of products and customers; (3) increasing strip densities to drive higher throughput; (4) implementing more cost-effective materials; (5) utilizing our scale to drive world-wide purchasing leverage and (6) increasing labor productivity.
We operate in a cyclical industry. During an industry downturn we seek to reduce our costs and drive greater factory and administrative efficiencies. Cost control efforts can include reducing labor costs by temporarily lowering compensation, reducing employee and contractor headcount, shortening work weeks and obtaining labor-related foreign government subsidies where available.
PACKAGING AND TEST SERVICES
Overview of Semiconductor Manufacturing Process
In general, the semiconductor manufacturing process consists of IC design, wafer fabrication, wafer probe, packaging and final test.
Integrated circuit design involves the laying out of electronic components, such as transistors, resistors, capacitors and the metallic interconnect of these components, to achieve the desired device functionality. Wafer fabrication is a multiple-step sequence of photolithographic and chemical processing steps during which the IC's are gradually created on semiconductor material, typically a silicon wafer. Individual IC's are generally known as a “chip” or “die”, and a single wafer will contain many die. Wafers are fabricated by two types of companies - IDMs which design and fabricate wafers using their own in-house manufacturing facilities, and contract foundries which manufacture wafers that are designed by fabless companies or other customers.
The packaging and test services we provide occur subsequent to wafer fabrication. The wafers that we receive from our customers are generally consigned to us; we do not own the consigned wafers or record their value in our financial statements. During wafer probe, each individual die is electrically tested, or probed, for defects. Packaging is the processing of bare die to facilitate electrical connections and heat dissipation and protect the die. The wafer is separated into individual die. Each good die is then assembled into a package that typically encapsulates the die for protection and creates the electrical connections used to connect the package to a printed circuit board, module or other part of the electronic device. In some packages, chips are attached to a substrate or leadframe carrier through wirebonding or flip chip interconnects and then encased in a protective material. Or, for a wafer-level package, the electrical interconnections are created directly on the surface of the die (while the wafer is still intact) so that the chip may be attached directly to other parts of an electronic device without a substrate or leadframe. The packages are then tested using sophisticated equipment to ensure that each packaged chip meets its design and performance specifications.
Packaging and Test Technologies and Processes
Our packages employ wirebond, flip chip, copper clip and other interconnect technologies. We use leadframe and substrate package carriers, and we perform a variety of test services.
Interconnect Technologies
Wirebond:
In packages that employ wirebond interconnect technology, the die is mounted face up on the package carrier and the interconnections between the die and package carrier are made through very fine gold, silver or copper wires which are attached from the bond pads of the die to the package carrier. The interconnections are placed along the perimeter of
9
the die. Wirebonding is generally considered to be the most cost-effective and flexible interconnect technology and is used to assemble the majority of semiconductor packages.
Flip Chip:
In packages that employ flip chip interconnect technology, the interconnections between the die and package carrier are made through conductive “bumps” that are placed directly on the die surface utilizing a process called wafer bumping. The bumped die is then “flipped over” and placed face down, with the bumps connecting directly to the package carrier. Flip chip allows a higher number of interconnects than wirebond as it uses the entire surface area of the die, and sometimes the perimeter as well, instead of just the perimeter as used by most wirebond packages. Flip chip also provides enhanced thermal and electrical performance, and enables smaller die and thinner, smaller form factors (or physical package dimensions).
The wafer bumping process consists of preparing the wafer for bumping and forming or placing the bumps. Preparation may include cleaning, removing insulating oxides and providing a pad metallurgy that will protect the interconnections while making good mechanical and electrical connection between the bump and the wafer.
Copper Clip
: Copper clip interconnect technology uses a solid copper bridge or “clip” to connect the die to the package carrier. The clip allows a higher level of current flow than a wire and also provides a better method of heat transfer from the die. The clip is either spot welded, or more often re-flow soldered, to the die pads and the package carrier pads.
Package Carriers
Leadframe:
A leadframe is a miniature sheet of metal, generally made of copper and silver alloys, on which a pattern of electrical connections (or “leads”) has been cut. The leads are generally placed around the perimeter of the leadframe and are used to connect the package to the system board. The number of leads on an individual leadframe is limited as electrical shorting can occur if the leads are placed too close together.
Substrate:
A substrate is a laminate of either single or multiple layers of epoxy resin, woven glass fibers and metal conductors. Solder bumps provide the electrical connection to the system board. The bumps are typically distributed evenly across the bottom surface of the substrate (called a “ball grid array” format). This allows less distance between individual leads and a higher number of interconnects than leadframe packages.
Test Services
Amkor provides a complete range of semiconductor testing services including wafer testing or probe and final test. We offer a full range of test software, hardware, integration and product engineering services, and we support a range of business models and test capabilities. Substantially all of our test business is derived from testing packages that we assemble.
Wafer Test Services:
Wafer test, also referred to as wafer probe, is performed after wafer fabrication or wafer bumping to screen out defective devices prior to packaging. We offer a range of wafer test coverage that can be tailored based on the cost and complexity of the die, the package and the product. These services range from coarse level screening for major defects all the way up to probing at high digital speeds and can include full radio frequency transmit and receive as well as testing at multiple temperatures. Wafer testing can also involve a range of wafer mapping and inspection operations.
Final Test Services:
After the packaging process, final test is performed to ensure that the packaged device meets the customer’s requirements. Final test spans a range of rigor and complexity depending on the device and end market application. More rigorous types of final test include testing multiple times under different electrical and temperature conditions and before and after device reliability stresses, such as burn-in. In addition to electrical testing, specialized solutions are required for packages that also process non-electric stimuli.
The electrical tests are a mix of functional, structural and system-level tests depending on the customer’s requirements and cost and reliability parameters. The electrical test equipment we use includes commercially available automated test equipment, customized and proprietary system level test equipment and innovative types of low cost test equipment developed by Amkor.
10
Advanced Products and Mainstream Products
We offer a broad range of advanced and mainstream packaging and test services to our customers. We refer to our flip chip, wafer-level processing and related test services as “Advanced Products”, and our wirebond packaging and related test services as “Mainstream Products”. The following table sets forth, for the periods indicated, the amount of advanced and mainstream packaging and test net sales and the percentage of such net sales:
|
Year Ended December 31,
|
||||||||||||||||||||
|
2016
|
2015
|
2014
|
||||||||||||||||||
|
(In millions, except percentage of net sales)
|
||||||||||||||||||||
|
Advanced Products
|
$
|
1,680
|
|
43.1
|
%
|
$
|
1,433
|
|
49.7
|
%
|
$
|
1,553
|
|
49.6
|
%
|
|||||
|
Mainstream Products
|
2,214
|
|
56.9
|
%
|
1,452
|
|
50.3
|
%
|
1,576
|
|
50.4
|
%
|
||||||||
|
Total net sales
|
$
|
3,894
|
|
100.0
|
%
|
$
|
2,885
|
|
100.0
|
%
|
$
|
3,129
|
|
100.0
|
%
|
|||||
We began consolidating J-Devices in 2016 and approximately 90% of J-Devices'
$913.7 million
of net sales in 2016 were generated from Mainstream Products.
Advanced Products
Our advanced products include flip chip chip scale packages, wafer-level chip scale packages and flip chip ball grid array packages. These package families use flip chip interconnect technology so that the die can be connected to a substrate package carrier or, in the case of wafer-level chip scale packages, directly to a printed circuit board.
Flip Chip Chip Scale Package ("FC CSP") Products
: FC CSP packages are small form factor packages where the substrate size is not much larger than the die itself. The size advantage provided by chip scale packaging technologies has made FC CSP an attractive choice for a wide variety of applications that require very small form factors such as smartphones, tablets and other mobile consumer electronic devices.
Flip chip stacked chip scale packages ("FC SCSP") stack a second die on top of the original flip-chip die. The top die is typically a memory device, and wirebond interconnects are used to attach it to the substrate. FC SCSP is frequently used to stack memory on top of digital baseband and applications processors for use in mobile devices.
We continue to drive thinner package solutions for our PoP technology through the development of ultra-thin substrates and enhancing our pre-stacking and thin die handling capabilities.
We developed fine pitch copper pillar flip chip interconnect technology, which creates interconnections at finer pitches using a plating process to reduce the number of substrate layers to facilitate very thin packages. This innovative solution is also an enabling technology for 2.5D and 3D package stacking with TSVs.
Wafer-level Chip Scale Package ("WL CSP") Products
: WL CSP packages (also known as fan-in wafer-level packages) do not utilize a package carrier. The bumped wafer is singulated into individual die, and the wafer-level package is then attached directly to the system board. WL CSP offers one of the lowest total system costs, enabling higher semiconductor content while leveraging the smallest form factor and one of the highest performing, most reliable, semiconductor package platforms on the market today. We have seen significant growth in our WL CSP business, particularly for power management, RF, and integrated connectivity applications.
Flip Chip Ball Grid Array ("FC BGA") Products
: FC BGA packages are large form factor substrate-based packages which are used where processing power and speed are needed, and small form factors are not required. Our FC BGA packages are assembled around state-of-the-art substrates. Utilizing multiple high density routing layers, laser drilled vias, and ultra-fine line and space metallization, FC BGA substrates have the highest routing density available. The variety of FC BGA package options allows package selection to be tailored to the specific thermal needs of the end product. We offer FC BGA packaging in a variety of product formats to fit a wide range of end application requirements, including networking, storage, computing and consumer applications.
11
Mainstream Products
Our mainstream products include leadframe packages, substrate-based wirebond packages and MEMS packages. These package families use wirebond interconnect technology to connect a die to a leadframe or substrate package carrier.
Leadframe Packages:
Leadframe packages use wirebond or flip chip technology to interconnect a die to a leadframe package carrier. Leadframe packages are used in many electronic devices and remain the most practical and cost-effective solution for many low to medium pin count applications.
Traditional leadframe packages support a wide variety of device types and applications. Two of our most popular traditional leadframe package types are small outline integrated circuit and quad flat package, commonly known as “dual” and “quad” products, respectively, based upon the number of sides from which the leads extend. The traditional leadframe package family has evolved from “through hole design,” where the leads are plugged into holes on the circuit board to “surface mount design,” where the leads are soldered to the surface of the circuit board. We offer a wide range of lead counts and body sizes to satisfy variations in the size of customers’ semiconductor devices.
Through a process of continuous engineering and customization, we have designed several leadframe package types that are thinner and smaller than traditional leadframe packages, and which have the ability to accommodate more leads on the perimeter of the package. These leadframe packages typically have superior thermal and electrical characteristics, which allow them to dissipate heat generated by high-powered semiconductor devices while providing enhanced electrical connectivity. We are developing increasingly smaller versions of these packages to keep pace with continually shrinking semiconductor device sizes and demand for miniaturization of portable electronic products. One of our more successful leadframe package offerings is the
Micro
LeadFrame family of quad flat no lead packages.
Power discrete devices use a leadframe as the package carrier and primarily use wirebond interconnect technology. However, power applications that require improved thermal and electrical performance will use packaging with copper clip interconnect technology.
Substrate-based Wirebond Packages
: Substrate-based wirebond packages use wirebond technology to connect a die to a substrate. Some of our packages in this category include stacked chip scale packages ("CSP"), wirebond ball grid array packages and plastic ball grid array ("PBGA") packages.
Stacked CSP technology enables the stacking of a wide range of different semiconductor devices to deliver high levels of silicon integration and area efficiency. Stacked CSP utilizes high density thin core substrates and advanced materials, along with leading-edge wafer thinning, die attach, and molding capabilities to stack multiple die on a substrate. Stacked CSP is ideal for memory, including NAND, NOR and DRAM memory, and mixed signal applications.
Wirebond ball grid array packages offer a broad selection of ball array pitches, ball counts and body sizes, single and multi-die layouts, stacked die and passive component integration. They are applicable for a wide range of semiconductors requiring a smaller package size than conventional PBGAs or leadframe packages.
Plastic ball grid array packages are used in applications requiring higher pin count than leadframe packages, but typically have lower pin counts than flip chip. PBGA packages are designed for low inductance, improved thermal operation and enhanced surface-mount technology ability. Custom performance enhancements, like ground and power planes, are also available.
Micro-Electro-Mechanical Systems Packages
: MEMS are miniaturized mechanical and electro-mechanical devices that can sense and provide information about the physical world and sometimes trigger a response. Examples of MEMS devices include microphones, accelerometers, airbag deployment sensors, gyrometers, magnetometers, and humidity, temperature and pressure sensors. We also specialize in sensor fusion products which utilize our cavity MEMS platform and combine multiple sensors into a single package. MEMS packages leverage our expertise in wafer thinning, die stacking, wirebonding and flip chip interconnect to deliver sophisticated products with a very small form factor.
12
Advanced System-in-Package Modules
Advanced SiP modules combine multiple semiconductor and other electronic components with different functionalities into a single package. These modules use wirebond, flip chip or wafer-level interconnect technologies. Components can include passive devices (inductors, capacitors, resistors, filters and diplexers), antennas and mechanical parts.
The increasing demand for miniaturization and higher functionality at competitive cost is driving the adoption of SiP in new products. Advanced SiP modules are used for many applications such as RF and front end modules, baseband processing, connectivity, fingerprint sensors, display and touch screen drivers, sensors and MEMS, NAND memory and solid state drives. Advanced SiP modules are found in many products including smartphones and tablets, automobiles, wearable electronics, high-performance gaming systems, computers and network systems.
In 2016 and 2015, we had net sales of approximately $775 million and $725 million, respectively, from our advanced SiP modules which are included in either advanced products or mainstream products depending upon the interconnect technology used in the module.
End Markets
The following table lists the end markets that use our products and sets forth, for the periods indicated, the percentage of net sales in each end market:
|
2016
|
2015
|
2014
|
||||||
|
End Market Distribution Data
(an approximation including representative devices and applications based on a sampling of our largest customers):
|
||||||||
|
Communications (smart phones, tablets, handheld devices, wireless LAN)
|
44
|
%
|
55
|
%
|
56
|
%
|
||
|
Automotive, industrial and other (infotainment, safety, performance, comfort)
|
25
|
%
|
14
|
%
|
11
|
%
|
||
|
Consumer (television, set top boxes, gaming, portable media, digital cameras)
|
14
|
%
|
12
|
%
|
13
|
%
|
||
|
Networking (servers, routers, switches)
|
10
|
%
|
11
|
%
|
11
|
%
|
||
|
Computing (PCs, hard disk drive, printers, peripherals, servers)
|
7
|
%
|
8
|
%
|
9
|
%
|
||
|
Total
|
100
|
%
|
100
|
%
|
100
|
%
|
||
RESEARCH AND DEVELOPMENT
Our research efforts focus on developing new packaging solutions and test services, and improving the efficiency and capabilities of our existing production processes. We believe that technology development is one of the keys to success in the semiconductor packaging and test industry. By concentrating our research and development on our customers’ needs for innovative packages, increased performance and lower cost, we gain opportunities to enter markets early, capture market share and promote our new package offerings as industry standards.
One of our top priorities is developing low-cost packaging solutions for the next generation of mobile devices, which minimize material and processing costs, while maximizing yields and reliability. This development effort is particularly important for customers seeking cost-effective alternatives to further silicon-level integration. Another important focus area is the development of wafer-level packages for larger chips. These wafer-level chip-scale packages and wafer-level fan-out (low density) packages are increasingly the preferred package type for many chips used in mobile devices. They provide a very low-profile product at a competitive cost. We are also developing integrated (high density) wafer-level fan-out solutions called SWIFT and SLIM which enable very thin, very small products combining application processors, memory, baseband and other peripheral IC’s.
Our research and development employees are located throughout Asia and in the United States. In
2016
, we had approximately
650
employees engaged in research and development activities. In
2016
,
2015
and
2014
, we incurred
$117.2 million
,
$82.0 million
and
$76.9 million
, respectively, of research and development expense.
13
SALES AND MARKETING
Our sales offices are located throughout Asia, Europe and North America. Our support personnel manage and promote our packaging and test services and provide key customer and technical support. To provide comprehensive sales and customer service, we typically assign our customers a direct support team consisting of an account manager, technical program manager, test program manager and both field and factory customer support representatives. We also support our largest multinational customers from multiple office locations to ensure that we are aligned with their global operational and business requirements.
Our direct support teams are further supported by an extended staff of product, process, quality and reliability engineers, as well as marketing and advertising specialists, information systems technicians and factory personnel. Together, these direct and extended support teams deliver an array of services to our customers.
SEASONALITY
Our sales have generally been higher in the second half of the year than in the first half due to the effect of consumer buying patterns in the U.S., Europe and Asia and the timing of flagship mobile device launches. In addition, semiconductor companies generally reduce their production during the holidays at the end of December which generally results in a decrease in packaging and test services during the first quarter. Generally soft economic conditions and a lack of compelling new mobile products constrained overall demand during 2015. The high-end smartphone market was a particular issue for us in 2015, in part due to the lackluster general market conditions, and in part because of changes in the supply chain which impacted one of our major customers. As a result, we did not see our normal seasonal revenue patterns in 2015.
We began to see a recovery during the second half of 2016 and saw notable strength in the mobile communication market. These factors contributed to the return of our normal seasonal revenue patterns in 2016.
CUSTOMERS
In
2016
, we had approximately 250 customers, including many of the largest semiconductor companies in the world. Our ten largest customers accounted for
67%
of our net sales in 2016. Toshiba and Qualcomm each accounted for more than 10% of our net sales in 2016.
MATERIALS AND EQUIPMENT
Materials
Our materials are used primarily for packaging activities. Our packaging operations depend upon obtaining adequate supplies of materials on a timely basis. The principal materials used in our packaging process are leadframes, laminate substrates, gold and copper wire, mold compound, epoxy, tubes and trays. The silicon wafer is generally consigned from the customer. We do not take ownership of the customer consigned wafer, and title and risk of loss remains with the customer for these materials. Test materials constitute a very small portion of our total test cost. We purchase materials based on customer forecasts, and our customers are generally responsible for any unused materials which we purchased based on such forecasts.
We obtain the materials required for packaging services from various suppliers. We source most of our materials, including critical materials such as leadframes, laminate substrates and gold wire, from a limited group of suppliers. We work closely with our primary material suppliers in an effort to ensure consistent quality and that materials are available and delivered on time. We also negotiate world-wide pricing agreements with our major suppliers to take advantage of the scale of our operations.
Equipment
Our ability to meet the changing demand from our customers for manufacturing capacity depends upon obtaining packaging and test equipment in a timely manner. We work closely with our main equipment suppliers to coordinate the ordering and delivery of equipment to meet our expected capacity needs.
14
The primary types of equipment used in providing our packaging services are wirebonders and die bonders. In addition, we maintain a variety of other packaging equipment, including mold, singulation, die attach, ball attach and wafer backgrind, along with numerous other types of manufacturing equipment. A substantial portion of our packaging equipment base can generally be used and adapted to support the manufacture of many of our packages through the use of relatively low cost tooling, although equipment used in advanced packaging can be more difficult to redeploy than equipment used in traditional wirebond packaging.
We also purchase wafer bumping equipment to facilitate our flip chip and wafer level packaging services. Wafer bump equipment includes sputter and spin coaters, electroplating equipment, reflow ovens and other types of equipment. This equipment tends to have longer lead times for delivery and installation than other packaging equipment and is sold in relatively larger increments of capacity.
The primary equipment used in the testing process includes testers, handlers and probers. Handlers are used to transfer individual or small groups of packaged IC's to a tester. Test equipment is generally a more capital intensive portion of the process and tends to have longer delivery lead times than most types of packaging equipment. We focus our capital expenditures on standardized tester platforms in order to maximize test equipment utilization where possible. In some cases, our customers will consign test equipment to us. In those cases, we operate the equipment on their behalf but do not own it.
ENVIRONMENTAL MATTERS
The semiconductor packaging process uses chemicals, materials and gases and generates byproducts that are subject to extensive governmental regulations. For example, we produce liquid waste when semiconductor wafers are diced into chips with the aid of diamond saws, then cooled with running water. In addition, semiconductor packages have historically utilized metallic alloys containing lead (Pb) within the interconnect terminals typically referred to as leads, pins or balls. The usage of lead (Pb) has decreased over the past few years, as we have ramped volume production of alternative lead (Pb)-free processes. Our operations are subject to numerous laws and regulations governing the protection of the environment, disposal of waste, discharges into water, emissions into the atmosphere and the protection of employee health and safety. Future regulations may impose stricter environmental requirements on the semiconductor packaging and test industry and may require additional capital investment.
We are engaged in a continuing program to assure compliance with federal, state and local environmental laws and regulations. We do not expect that capital expenditures or other costs attributable to compliance with environmental laws and regulations will have a material adverse effect on our business, liquidity, results of operations, financial condition or cash flows.
COMPETITION
The outsourced semiconductor packaging and test market is very competitive. We face substantial competition from established packaging and test service providers primarily located in Asia, including companies with significant manufacturing capacity, financial resources, research and development operations, marketing and other capabilities. These companies include Advanced Semiconductor Engineering, Inc., Siliconware Precision Industries Co., Ltd. and Jiangsu Changjiang Electronics Technology Co., Ltd.
Such companies also have developed relationships with most of the world’s largest semiconductor companies, including current or potential customers of Amkor. We also compete with the internal semiconductor packaging and test capabilities of many of our customers and the contract foundries. Our IDM customers continually evaluate the attractiveness of outsourced services against their own in-house packaging and test services and at times may decide to shift some or all of their outsourced packaging and test services to internally sourced capacity. We also compete with contract foundries, such as Taiwan Semiconductor Manufacturing Company Limited and Samsung Electronics Co., Ltd., which offer full turnkey services from silicon wafer fabrication through packaging and final test. In addition, we compete with companies that offer only test services and not packaging.
15
The principal elements of competition in the semiconductor packaging and test services market include:
|
•
|
technical competence;
|
|
•
|
quality;
|
|
•
|
price;
|
|
•
|
breadth of packaging and test services offered, including turnkey services;
|
|
•
|
new package and test design, technology innovation and implementation;
|
|
•
|
cycle times;
|
|
•
|
customer service and
|
|
•
|
available capacity and ability to invest in capacity, geographic location and scale of manufacturing.
|
We believe that we compete favorably with respect to each of these elements.
INTELLECTUAL PROPERTY
We maintain an active program to protect and derive value from our investment in technology and the associated intellectual property rights. Intellectual property rights that apply to our various products and services include patents, copyrights, trade secrets and trademarks. We have filed and obtained a number of patents in the U.S. and abroad, and their durations vary depending on the jurisdiction in which each patent is filed. Although our patents are an important element of our intellectual property strategy as a whole, we are not materially dependent on any one patent or any one technology. We expect to continue to file patent applications when appropriate to protect our proprietary technologies, but we cannot assure you that we will receive patents from pending or future applications. In addition, any patents we obtain may be challenged, invalidated or circumvented and may not provide meaningful protection or other commercial advantage to us.
We also protect and maintain the confidentiality of certain information about our processes, products and strategies which we believe provides us with a competitive advantage. We have ongoing programs designed to maintain the confidentiality of such information. Further, to distinguish our products from our competitors’ products, we have obtained certain trademarks and service marks and may promote our particular brands through advertising and other marketing techniques.
EMPLOYEES
In
2016
, Amkor had approximately 27,900 full-time employees. We believe that our relations with our employees are good, and we have not experienced a work stoppage in any of our factories. Our employees in Europe, the Philippines, Taiwan and the U.S. are not represented by any union. Certain employees at our factories in China, Japan, Korea and Malaysia are members of a union, and we operate subject to collective bargaining agreements that we have entered into with these unions.
16
|
Item 1A.
|
Risk Factors
|
The factors discussed below are cautionary statements that identify important factors and risks that could cause actual results to differ materially from those anticipated by the forward-looking statements contained in this report. For more information regarding the forward-looking statements contained in this report, see the Table of Contents of this Annual Report on Form 10-K. You should carefully consider the risks and uncertainties described below, together with all of the other information included in this report, in considering our business and prospects. The risks and uncertainties described below are not the only ones facing Amkor. Additional risks and uncertainties not presently known to us may also impair our business operations. The occurrence of any of the following risks could affect our business, liquidity, results of operations, financial condition or cash flows.
Dependence on the Highly Cyclical Semiconductor Industry - We Operate in Volatile Industries and Industry Downturns and Declines in Global Economic and Financial Conditions Could Harm Our Performance.
Our business is impacted by market conditions in the semiconductor industry, which is cyclical by nature and impacted by broad economic factors, such as world-wide gross domestic product and consumer spending. The semiconductor industry has experienced significant and sometimes sudden and prolonged downturns in the past. For example, the financial crisis and global recession in 2008 and 2009 resulted in a downturn in the semiconductor industry that adversely affected our business and results of operations during those periods. The economic recovery since that time has been slow and uneven. If the industry or markets we compete in experience slower, or even negative growth, our business and results of operations may be adversely affected.
Since our business is, and will continue to be, dependent on the requirements of semiconductor companies for outsourced packaging and test services, any downturn in the semiconductor industry or any other industry that uses a significant number of semiconductor devices, such as telecommunications, consumer electronics, or computing, could have a material adverse effect on our business and operating results. During downturns we have experienced, among other things, reduced demand, excess capacity and reduced sales. For example, generally soft economic conditions and a lack of compelling new mobile products constrained overall demand during 2015. Macroeconomic uncertainties and a cautious business climate are also expected to constrain the revenue growth in our business. It is difficult to predict the timing, strength or duration of any economic slowdown or subsequent economic recovery, which, in turn, makes it more challenging for us to forecast our operating results, make business decisions and identify risks that may affect our business, sources and uses of cash, financial condition and results of operations. Additionally, if industry conditions deteriorate, we could suffer significant losses, as we have in the past, which could materially impact our business, liquidity, results of operations, financial condition and cash flows.
Fluctuations in Operating Results and Cash Flows - Our Operating Results and Cash Flows Have Varied and May Vary Significantly as a Result of Factors That We Cannot Control.
Many factors, including the impact of adverse economic conditions, could have a material adverse effect on our net sales, gross profit, operating results and cash flows, or lead to significant variability of quarterly or annual operating results. Our profitability and ability to generate cash from operations is principally dependent upon demand for semiconductors, the utilization of our capacity, semiconductor package mix, the average selling price of our services, our ability to manage our capital expenditures and our ability to control our costs including labor, material, overhead and financing costs.
Our net sales, gross profit, operating income and cash flows have historically fluctuated significantly from quarter to quarter as a result of many of the following factors, over which we have little or no control and which we expect to continue to impact our business:
|
•
|
fluctuation in demand for semiconductors and conditions in the semiconductor industry generally, as well as by specific customers, such as inventory reductions by our customers impacting demand in key markets;
|
|
•
|
our ability to achieve our major growth objectives, including: transitioning second-wave customers to advanced packages; expanding our sales to customers in Greater China and, in particular, in the mid-level and entry-level tiers of the mobile device market; and increasing our share of the automotive market;
|
|
•
|
changes in our capacity and capacity utilization rates;
|
17
|
•
|
changes in average selling prices which can occur quickly due to the absence of long term agreements on price;
|
|
•
|
changes in the mix of the semiconductor packaging and test services that we sell;
|
|
•
|
the development, transition and ramp to high volume manufacture of more advanced silicon nodes and evolving wafer, packaging and test technologies, may cause production delays, lower manufacturing yields and supply constraints for new wafers and other materials;
|
|
•
|
absence of backlog, the short-term nature of our customers’ commitments, double bookings by customers and deterioration in customer forecasts and the impact of these factors, including the possible delay, rescheduling and cancellation of large orders, or the timing and volume of orders relative to our production capacity;
|
|
•
|
changes in costs, quality, availability and delivery times of raw materials, components and equipment;
|
|
•
|
changes in labor costs to perform our services;
|
|
•
|
wage inflation and fluctuations in commodity prices, including gold, copper and other precious metals;
|
|
•
|
the timing of expenditures in anticipation of future orders;
|
|
•
|
changes in effective tax rates;
|
|
•
|
the availability and cost of financing;
|
|
•
|
intellectual property transactions and disputes;
|
|
•
|
high leverage and restrictive covenants;
|
|
•
|
warranty and product liability claims and the impact of quality excursions and customer disputes and returns;
|
|
•
|
costs associated with legal claims, indemnification obligations, judgments and settlements;
|
|
•
|
international events, such as the United Kingdom's vote to leave the European Union, political instability, civil disturbances or environmental or natural events, such as earthquakes like the recent ones in Japan, that impact our operations;
|
|
•
|
pandemic illnesses that may impact our labor force and our ability to travel;
|
|
•
|
costs of acquisitions and divestitures and difficulties integrating acquisitions;
|
|
•
|
our ability to attract and retain qualified personnel to support our global operations;
|
|
•
|
fluctuations in foreign exchange rates;
|
|
•
|
fluctuations in our manufacturing yields;
|
|
•
|
our ability to penetrate new end markets or expand our business in existing end markets;
|
|
•
|
dependence on key customers or concentration of customers in certain end markets, such as mobile communications and automotive and
|
|
•
|
restructuring charges, asset write-offs and impairments.
|
It is often difficult to predict the impact of these factors upon our results for a particular period. The downturn in the global economy and the semiconductor industry in 2009 increased the risks associated with the foregoing factors as customer forecasts became more volatile, and there was less visibility regarding future demand and significantly increased uncertainty regarding the economy, credit markets and consumer demand. The slow rate of economic growth in the U.S. and elsewhere and economic uncertainty worldwide could continue to cause volatility in customer forecasts and reduce our visibility regarding future demand in the semiconductor industry. These factors may have a material and adverse effect on our business, liquidity, results of operations, financial condition and cash flows or lead to significant variability of quarterly or
18
annual operating results. In addition, these factors may adversely affect our credit ratings which could make it more difficult and expensive for us to raise capital and could adversely affect the price of our securities.
Absence of Backlog - The Lack of Contractually Committed Customer Demand May Adversely Affect Our Sales.
Our packaging and test business does not typically operate with any material backlog. Our quarterly net sales from packaging and test services are substantially dependent upon our customers’ demand in that quarter. None of our customers have committed to purchase any significant amount of packaging or test services or to provide us with binding forecasts of demand for packaging and test services for any future period, in any material amount. In addition, we sometimes experience double booking by customers and our customers often reduce, cancel or delay their purchases of packaging and test services for a variety of reasons including industry-wide, customer-specific and Amkor-specific reasons. This makes it difficult for us to forecast our capacity utilization and net sales in future periods. Since a large portion of our costs is fixed and our expense levels are based in part on our expectations of future sales, we may not be able to adjust costs in a timely manner to compensate for any sales shortfall. If we are unable to adjust costs in a timely manner, our margins, operating results, financial condition and cash flows would be adversely affected.
High Fixed Costs - Due to Our High Percentage of Fixed Costs, We Will Be Unable to Maintain Satisfactory Gross Margins if We Are Unable to Achieve Relatively High Capacity Utilization Rates.
Our operations are characterized by relatively high fixed costs. Our profitability depends in part not only on pricing levels for our packaging and test services, but also on the efficient utilization of our human resources and packaging and test equipment. Increases or decreases in our capacity utilization can significantly affect gross margins. In periods of low demand, we experience relatively low capacity utilization in our operations, which leads to reduced margins during that period. Transitions between different packaging technologies, such as the transition from gold wirebond to flip chip and copper wirebond packages, can also impact our capacity utilization if we do not efficiently redeploy our equipment for other packaging and test opportunities. For example, in 2011 the migration of some customer demand from wirebond to flip chip packages resulted in under-utilized wirebond assets which negatively impacted our capacity utilization and gross margin. We cannot assure you that we will be able to achieve consistently high capacity utilization, and if we fail to do so, our gross margins will be negatively impacted. If our gross margins decrease, our business, liquidity, results of operations, financial condition and cash flows could be materially adversely affected.
In addition, our fixed operating costs have increased in recent years in part as a result of our efforts to expand our capacity through significant capital expenditures. Forecasted customer demand for which we have made capital investments may not materialize, especially if industry conditions deteriorate. As a result, our sales may not adequately cover fixed costs resulting in reduced profit levels or causing significant losses, both of which may adversely impact our business, liquidity, results of operations, financial condition and cash flows.
Guidance - Our Failure to Meet Our Guidance or Analyst Projections Could Adversely Impact the Trading Prices of Our Securities.
We periodically provide guidance to investors with respect to certain financial information for future periods. Securities analysts also periodically publish their own projections with respect to our future operating results. As discussed above under “Fluctuations in Operating Results and Cash Flows - Our Operating Results and Cash Flows Have Varied and May Vary Significantly as a Result of Factors That We Cannot Control,” our operating results and cash flows vary significantly and are difficult to accurately predict. Volatility in customer forecasts and fluctuations in global consumer demand make it particularly difficult to predict future results. To the extent we fail to meet or exceed our own guidance or the analyst projections for any reason, the trading prices of our securities may be adversely impacted. Moreover, even if we do meet or exceed that guidance or those projections, if analysts and investors do not react favorably, or if analysts were to discontinue providing coverage of our company, the trading prices of our securities may be adversely impacted.
Declining Average Selling Prices - Historically There Has Been Downward Pressure on the Prices of Our Packaging and Test Services.
Prices for packaging and test services have generally declined over time, and sometimes prices can change significantly in relatively short periods of time. We expect downward pressure on average selling prices for our packaging and test services
19
to continue in the future, and this pressure may intensify during downturns in business. If we are unable to offset a decline in average selling prices by developing and marketing new packages with higher prices, reducing our purchasing costs, recovering more of our material cost increases from our customers and reducing our manufacturing costs, our business, liquidity, results of operations, financial condition and cash flows could be materially adversely affected.
Decisions by Our Integrated Device Manufacturer and Foundry Customers to Curtail Outsourcing May Adversely Affect Our Business.
Historically, we have been dependent on the trend in outsourcing of packaging and test services by IDM customers. Our IDM and foundry customers continually evaluate the need for outsourced services against their own in-house packaging and test services. As a result, at any time and for a variety of reasons, IDMs and foundries may decide to shift some or all of their outsourced packaging and test services to internally sourced capacity.
The reasons IDMs and foundries may shift their outsourced business to internal capacity include:
|
•
|
their desire to realize higher utilization of their existing packaging and test capacity, especially during downturns in the semiconductor industry;
|
|
•
|
their unwillingness to disclose proprietary technology;
|
|
•
|
their possession of more advanced packaging and test technologies and
|
|
•
|
the guaranteed availability of their own packaging and test capacity.
|
In addition, to the extent we limit capacity commitments for certain customers, these customers may increase their level of in-house packaging and test capabilities, which could make it more difficult for us to regain their business when we have available capacity.
In a downturn in the semiconductor industry, IDMs and foundries could respond by shifting some or all outsourced packaging and test services to internally serviced capacity on a short term basis. Also, the IDMs and foundries could curtail or reverse the trend of outsourcing packaging and test services. If we experience a significant loss of IDM or foundry business, it could have a material adverse effect on our business, liquidity, results of operations, financial condition and cash flows, especially during a prolonged industry downturn.
Our Substantial Indebtedness Could Adversely Affect Our Financial Condition and Prevent Us from Fulfilling Our Obligations.
We have a significant amount of indebtedness, and the terms of the agreements governing our indebtedness allow us and our subsidiaries to incur more debt, subject to certain limitations. As of December 31, 2016, our total debt balance was
$1,474.8 million
, of which
$35.2 million
was classified as a current liability and
$523.8 million
was collateralized indebtedness at our subsidiaries. We may consider investments in joint ventures, increased capital expenditures or acquisitions which may increase our indebtedness. If new debt is added to our consolidated debt level, the related risks that we face could intensify.
Our substantial indebtedness could:
|
•
|
make it more difficult for us to satisfy our obligations with respect to our indebtedness, including our obligations under our indentures to purchase notes tendered as a result of a change in control of Amkor;
|
|
•
|
increase our vulnerability to general adverse economic and industry conditions;
|
|
•
|
limit our ability to fund future working capital, capital expenditures, research and development and other business opportunities, including joint ventures and acquisitions;
|
|
•
|
require us to dedicate a substantial portion of our cash flow from operations to service payments of interest and principal on our debt, thereby reducing the availability of our cash flow to fund future working capital, capital expenditures, research and development expenditures and other general corporate requirements;
|
20
|
•
|
increase the volatility of the price of our common stock;
|
|
•
|
limit our flexibility to react to changes in our business and the industry in which we operate;
|
|
•
|
place us at a competitive disadvantage to any of our competitors that have less debt;
|
|
•
|
limit, along with the financial and other restrictive covenants in our indebtedness, among other things, our ability to borrow additional funds;
|
|
•
|
limit our ability to refinance our existing indebtedness, particularly during periods of adverse credit market conditions when refinancing indebtedness may not be available under interest rates and other terms acceptable to us or at all and
|
|
•
|
increase our cost of borrowing.
|
We May Have Difficulty Funding Liquidity Needs.
We assess our liquidity based on our current expectations regarding sales, operating expenses, capital spending and debt service requirements and other funding needs. Our liquidity is affected by, among other things, the performance of our business, our capital expenditure and other investment levels and our ability to repay debt and other long-term obligations out of our operating cash flows or with the proceeds of debt or equity financings.
We operate in a capital intensive industry. We had capital expenditures of
$650.0 million
in 2016. Servicing our current and future customers requires that we incur significant operating expenses and continue to make significant capital expenditures and other investments, which are generally made in advance of the related revenues and without firm customer commitments. Ultimately the actual amount of our capital expenditures for
2017
and thereafter may vary materially and will depend on several factors. These factors include, among others, the amount, timing and implementation of our capital projects, including those under review and those not yet planned, the performance of our business, economic and market conditions, the cash needs and investment opportunities for the business, the need for additional capacity and facilities and the availability of cash flows from operations or financing.
In addition, we have a significant level of debt, which requires significant scheduled principal and interest payments in the coming years. The sources funding our operations, including making capital expenditures and other investments and servicing principal and interest obligations with respect to our debt, are cash flows from our operations, existing cash and cash equivalents, borrowings under available debt facilities, or proceeds from any additional debt or equity financing.
The health of the worldwide banking system and capital markets affects our liquidity. If financial institutions that have extended credit commitments to us are adversely affected by the conditions of the U.S., foreign or international banking system and capital markets, they may refuse or be unable to fund borrowings under their credit commitments to us. Volatility in the banking system and capital markets could also make it difficult or more expensive for us to maintain our existing credit facilities or refinance our debt.
The trading price of our common stock has been, and is likely to continue to be, highly volatile and could be subject to wide fluctuations. Such fluctuations could impact our decision or ability to utilize the equity markets as a potential source of our funding needs in the future.
In addition, there is a risk that we could fail to generate the necessary net income or operating cash flows to meet the funding needs of our business due to a variety of factors, including the other factors discussed in this "Risk Factors" section. If we fail to generate the necessary cash flows or we are unable to access the capital markets when needed, our liquidity may be adversely impacted.
Restrictive Covenants in the Indentures and Agreements Governing Our Current and Future Indebtedness.
The indentures and agreements governing our existing debt, and debt we may incur in the future, contain, or may contain, affirmative and negative covenants that materially limit our ability to take certain actions, including our ability to incur debt, pay dividends and repurchase stock, make certain investments and other payments, enter into certain mergers and
21
consolidations, engage in sale leaseback transactions and encumber and dispose of assets. In addition, our future debt agreements may contain financial covenants and ratios.
The breach of any of these covenants by us or the failure by us to meet any of the financial ratios or conditions could result in a default under any or all of such indebtedness. If a default occurs under any such indebtedness, all of the outstanding obligations thereunder could become immediately due and payable, which could result in a default under our other outstanding debt and could lead to an acceleration of obligations related to other outstanding debt. The existence of such a default or event of default could also preclude us from borrowing funds under our revolving credit facilities. Our ability to comply with the provisions of the indentures, credit facilities and other agreements governing our outstanding debt and indebtedness we may incur in the future can be affected by events beyond our control and a default under any debt instrument, if not cured or waived, could have a material adverse effect on us.
We Have Significant Severance Plan Obligations Associated With Our Manufacturing Operations in Korea Which Could Reduce Our Cash Flow and Negatively Impact Our Financial Condition.
Our subsidiary in Korea maintains an unfunded severance plan under which we have an accrued liability of
$136.2 million
as of
December 31, 2016
. The plan covers certain employees that were employed prior to August 1, 2015. In the event of a significant layoff or other reduction in our labor force in Korea, our subsidiary in Korea would be required to make lump-sum severance payments under the plan, which could have a material adverse effect on our liquidity, financial condition and cash flows. See
Note 14
to our Consolidated Financial Statements in Part II, Item 8 of this Annual Report on Form 10-K.
If We Fail to Maintain an Effective System of Internal Controls, We May Not be Able to Accurately Report Financial Results or Prevent Fraud.
Effective internal controls are necessary to provide reliable financial reports and to assist in the effective prevention of fraud. We must annually evaluate our internal procedures to satisfy the requirements of Section 404 of the Sarbanes-Oxley Act of 2002, which requires management and our independent registered public accounting firm to assess the effectiveness of internal control over financial reporting.
Internal controls may not prevent or detect misstatements because of their inherent limitations, including the possibility of human error, the circumvention or overriding of controls, fraud or corruption. Therefore, even effective internal controls can provide only reasonable assurance with respect to the preparation and fair presentation of financial statements. In addition, projections of any evaluation of effectiveness of internal controls to future periods are subject to the risk that the internal controls may become inadequate because of changes in conditions, or that the degree of compliance with the policies or procedures may deteriorate.
We assess our internal controls and systems on an ongoing basis, and from time-to-time, we update and make modifications to our global enterprise resource planning system. We have implemented several significant enterprise resource planning modules and expect to implement additional enterprise resource planning modules in the future. In addition, we have implemented new shop floor management systems in certain of our factories and integrated the acquired operations of Amkor Technology Malaysia Sdn. Bhd. into our overall internal control over financial reporting. In December 2015, we acquired the operations of J-Devices, and we integrated those operations into our overall internal control over financial reporting. Although we continue to monitor and assess our internal controls for these systems and operations, there is a risk that deficiencies may occur that could constitute significant deficiencies or, in the aggregate, a material weakness.
If we fail to remedy any deficiencies or maintain the adequacy of our internal controls, we could be subject to regulatory scrutiny, civil or criminal penalties or shareholder litigation. In addition, failure to maintain adequate internal controls could result in financial statements that do not accurately reflect our operating results or financial condition.
We Face Warranty Claims, Product Return and Liability Risks, the Risk of Economic Damage Claims and the Risk of Negative Publicity if Our Packages Fail.
Our packages are incorporated into a number of end products, and our business is exposed to warranty claims, product return and liability risks, the risk of economic damage claims and the risk of negative publicity if our packages fail.
22
We receive warranty claims from our customers which occur from time to time in the ordinary course of our business. If we were to experience an unusually high incidence of warranty claims, we could incur significant costs and our business could be adversely affected. In addition, we are exposed to the product and economic liability risks and the risk of negative publicity affecting our customers. Our sales may decline if any of our customers are sued on a product liability claim. We also may suffer a decline in sales from the negative publicity associated with such a lawsuit or with adverse public perceptions in general regarding our customers’ products. Further, if our packages are delivered with defects, we could incur additional development, repair or replacement costs or suffer other economic losses, and our credibility and the market’s acceptance of our packages could be harmed.
Risks Associated with International Operations - We Depend on Our Factories and Operations in China, Japan, Korea, Malaysia, the Philippines and Taiwan. Many of Our Customers’ and Vendors’ Operations Are Also Located Outside of the U.S.
We provide packaging and test services through our factories and other operations located in China, Japan, Korea, Malaysia, the Philippines and Taiwan. Substantially all of our property, plant and equipment is located outside of the United States. Moreover, many of our customers and the vendors in our supply chain are located outside the U.S. The following are some of the risks we face in doing business internationally:
|
•
|
changes in consumer demand resulting from deteriorating conditions in local economies;
|
|
•
|
regulations and policies imposed by U.S. or foreign governments, such as tariffs, customs, duties and other restrictive trade barriers, antitrust and competition, tax, currency and banking, privacy, labor, environmental, health and safety;
|
|
•
|
laws, rules, regulations and policies within China and other countries that may favor domestic companies over non-domestic companies, including customer- or government-supported efforts to promote the development and growth of local competitors;
|
|
•
|
the payment of dividends and other payments by non-U.S. subsidiaries may be subject to prohibitions, limitations or taxes in local jurisdictions;
|
|
•
|
fluctuations in currency exchange rates, particularly with the recent acquisition of J-Devices;
|
|
•
|
political and social conditions, such as civil unrest and terrorism;
|
|
•
|
disruptions or delays in shipments caused by customs brokers or government agencies;
|
|
•
|
difficulties in attracting and retaining qualified personnel and managing foreign operations, including foreign labor disruptions;
|
|
•
|
difficulty in enforcing contractual rights and protecting our intellectual property rights;
|
|
•
|
potentially adverse tax consequences resulting from tax laws in the U.S. and in foreign jurisdictions in which we operate and
|
|
•
|
local business and cultural factors that differ from our normal standards and practices, including business practices that we are prohibited from engaging in by the Foreign Corrupt Practices Act and other anti-corruption laws and regulations.
|
In particular, we have significant facilities and other investments in South Korea, and there have been heightened security concerns in recent years stemming from North Korea’s nuclear weapon and long-range missile programs as well as its military actions in the region. Furthermore, there has been a history of conflict and a recent rise in tensions among other countries in the region.
23
We Face Risks in Connection with the Continuing Development and Implementation of Changes to, and Maintenance and Security of, Our Management Information Systems.
We depend on our management information systems for many aspects of our business. Some of our key software has been developed by our own programmers, and this software may not be easily integrated with other software and systems. Our systems may be susceptible to damage, disruptions or shutdowns due to failures during the process of upgrading, replacing or maintaining software, databases or components thereof, power outages, hardware failures, computer viruses, attacks by computer hackers, telecommunication failures, user errors, malfeasance or catastrophic events. In addition, security breaches could result in unauthorized disclosure of confidential information. From time to time we make additions or changes to our management information systems. For example, we have implemented new shop floor systems in certain of our factories, and we are integrating J-Devices' management information systems with our existing systems and processes. We face risks in connection with current and future projects to install or integrate new management information systems or upgrade our existing systems. These risks include:
|
•
|
we may face delays in the design and implementation of the system;
|
|
•
|
the cost of the systems may exceed our plans and expectations and
|
|
•
|
disruptions resulting from the implementation or integration of the systems may impact our ability to process transactions and delay shipments to customers, impact our results of operations or financial condition or harm our control environment.
|
Our business could be materially and adversely affected if our management information systems are disrupted or if we are unable to successfully install new systems or improve, upgrade, integrate or expand upon our existing systems.
We Face Risks Trying to Attract and Retain Qualified Employees to Support Our Operations.
Our success depends to a significant extent upon the continued service of our key senior management, sales and technical personnel, any of whom may be difficult to replace. Competition for qualified employees is intense, and our business could be adversely affected by the loss of the services of any of our existing key personnel, including senior management, as a result of competition or for any other reason. We do not have employment agreements with our key employees, including senior management or other contracts that would prevent our key employees from working for our competitors in the event they cease working for us. We cannot assure you that we will be successful in our efforts to retain key employees or in hiring and properly training sufficient numbers of qualified personnel and in effectively managing our growth. Our inability to attract, retain, motivate and train qualified new personnel could have a material adverse effect on our business.
Difficulties Consolidating and Integrating Our Operations - We Face Challenges as We Integrate Diverse Operations.
We have experienced, and expect to continue to experience, change in the scope and complexity of our operations resulting primarily from existing and future facility consolidations, strategic acquisitions, joint ventures and other partnering arrangements. Some of the risks from these activities include those associated with the following:
|
•
|
increasing the scope, geographic diversity and complexity of our operations;
|
|
•
|
conforming an acquired company's standards, practices, systems and controls with our operations;
|
|
•
|
increasing complexity from combining recent acquisitions of an acquired business;
|
|
•
|
unexpected losses of key employees or customers of an acquired business; other difficulties in the assimilation of acquired operations, technologies or products and
|
|
•
|
diversion of management and other resources from other parts of our operations and adverse effects on existing business relationships with customers.
|
In connection with these activities, we may:
|
•
|
use a significant portion of our available cash;
|
24
|
•
|
issue equity securities, which may dilute the ownership of current stockholders;
|
|
•
|
incur substantial debt;
|
|
•
|
incur or assume known or unknown contingent liabilities and
|
|
•
|
incur large, immediate accounting write offs and face antitrust or other regulatory inquiries or actions.
|
For example, the businesses we have acquired had, at the time of acquisition, multiple systems for managing their own production, sales, inventory and other operations. Migrating these businesses to our systems typically is a slow, expensive process requiring us to divert significant resources from other parts of our operations. We may continue to face these challenges in the future. For example, on July 31, 2013, we completed the purchase of Amkor Technology Malaysia Sdn. Bhd. Additionally, we increased our investment in J-Devices to
100%
in 2015 through the exercise of additional options, and as a result, we are now integrating J-Devices with our existing operations. As a result of the risks discussed above, the anticipated benefits of the increase in our investment in J-Devices or other future acquisitions, consolidations and partnering arrangements may not be fully realized, if at all, and these activities could have a material adverse effect on our business, financial condition and results of operations.
Dependence on Materials and Equipment Suppliers - Our Business May Suffer If the Cost, Quality or Supply of Materials or Equipment Changes Adversely Including Any Disruption that May Occur in the Supply of Certain Materials due to Regulations and Customer Requirements.
We obtain from various vendors the materials and equipment required for the packaging and test services performed by our factories. We source most of our materials, including critical materials such as leadframes, laminate substrates and gold wire, from a limited group of suppliers. A disruption to the operations of one or more of our suppliers could have a negative impact on our business. For example, the severe earthquake and tsunami in Japan in 2011 had a significant adverse effect on the electronics industry supply chain by impacting the supply of specialty chemicals, substrates, silicon wafers, equipment and other supplies to the electronics industry. In addition, we purchase the majority of our materials on a purchase order basis. Our business may be harmed if we cannot obtain materials and other supplies from our vendors in a timely manner, in sufficient quantities, at acceptable quality or at competitive prices. Some of our customers are also dependent on a limited number of suppliers for certain materials and silicon wafers. Shortages or disruptions in our customers' supply channels could have a material adverse effect on our business, financial condition, results of operations and cash flows. For example, the shortage in the supply of 28 nanometer wafers to some of our customers in 2012 delayed or otherwise adversely impacted the demand for certain of our advanced packaging and test services.
Rules adopted by the SEC implementing the Dodd-Frank Wall Street Reform and Consumer Protection Act impose diligence and disclosure requirements regarding the use of certain minerals originating from the conflict zones of the Democratic Republic of Congo and adjoining countries in our products. Industry associations and many of our customers have implemented initiatives to improve transparency and accountability concerning the supply of these materials and, in some cases, requiring us to certify that the covered materials we use in our packages do not come from the conflict areas. We may incur additional costs associated with complying with these requirements and customer initiatives. These requirements and customer initiatives could affect the pricing, sourcing and availability of materials used in the manufacture of semiconductor devices, and we cannot assure you that we will be able to obtain conflict-free materials in sufficient quantities and at competitive prices or that we will be able to verify the origin of all of the materials we use in our manufacturing process. If we are unable to meet these requirements and customer initiatives, it could adversely affect our business as some customers may move their business to other suppliers. Our reputation could also be adversely affected.
We purchase new packaging and test equipment to maintain and expand our operations. From time to time, increased demand for new equipment may cause lead times to extend beyond those normally required by equipment vendors. For example, in the past, increased demand for equipment caused some equipment suppliers to only partially satisfy our equipment orders in the normal time frame or to increase prices during market upturns for the semiconductor industry. The unavailability of equipment or failures to deliver equipment on a timely basis could delay or impair our ability to meet customer orders. If we are unable to meet customer orders, we could lose potential and existing customers. Generally, we acquire our equipment on a purchase order basis and do not enter into long-term equipment agreements. As a result, we could experience adverse changes in pricing, currency risk and potential shortages in equipment in a strong market, which could have a material adverse effect on our results of operations.
25
We are a large buyer of gold and other commodity materials including substrates and copper. The prices of gold and other commodities used in our business fluctuate. Historically, we have been able to partially offset the effect of commodity price increases through price adjustments to some customers and changes in our product designs that reduce the material content and cost, such as the use of shorter, thinner, gold wire and migration to copper wire. However, we typically do not have long-term contracts that permit us to impose price adjustments, and market conditions may limit our ability to do so. Significant price increases may adversely impact our gross margin in future periods to the extent we are unable to pass along past or future commodity price increases to our customers.
Customer Concentration and Loss of Customers - The Loss of Certain Customers or Reduced Orders or Pricing from Existing Customers May Have a Significant Adverse Effect on Our Operations and Financial Results.
We have derived and expect to continue to derive a large portion of our revenues from a small group of customers during any particular period due in part to the concentration of market share in the semiconductor industry. Our ten largest customers together accounted for
67%
of our net sales for the year ended December 31, 2016, and two customers each accounted for more than 10% of our consolidated net sales during the period. In addition, we have significant customer concentration within our end markets. The loss of a significant customer, a business combination among our customers, a reduction in orders or decrease in price from a significant customer or disruption in any of our significant strategic partnerships or other commercial arrangements may result in a decline in our sales and profitability and could have a material adverse effect on our business, liquidity, results of operations, financial condition and cash flows.
The demand for our services from each customer is directly dependent upon that customer’s financial health, level of business activity and purchasing decisions, the quality and price of our services, our cycle time and delivery performance, the customer's qualification of additional competitors on products we package or test and a number of other factors. Each of these factors could vary significantly from year to year resulting in the loss or reduction of customer orders. Our business is likely to remain subject to this variability in order levels, and we cannot assure you that our key customers or any other customers will continue to place orders with us in the future at the same levels as in past periods.
For example, if a key customer decides to purchase wafers from a semiconductor foundry that provides packaging and test services, our business could be reduced if the customer also engages that foundry for related packaging and test services. We cannot assure that customer decisions regarding the purchase of semiconductor wafers will not significantly and adversely impact customer demand for our packaging and test services.
In addition, from time to time we may acquire or build new facilities, such as K5, or migrate existing business among our facilities. In connection with these facility changes, our customers require us to re-qualify the new facilities even though we have already qualified to perform the services at our other facilities. We cannot assure that we will successfully re-qualify or that our customers will not qualify our competitors and move the business for such services.
Capital Expenditures - We Make Substantial Investments in Equipment and Facilities To Support the Demand Of Our Customers, Which May Adversely Affect Our Business If the Demand Of Our Customers Does Not Develop As We Expect or Is Adversely Affected.
We make significant investments in equipment and facilities in order to service the demand of our customers. For example, we had capital expenditures of
$650.0 million
in 2016,
$538.0 million
in 2015 and
$681.1 million
in 2014. The amount of our capital expenditures depends on several factors, including the performance of our business, our assessment of future industry and customer demand, our capacity utilization levels and availability, our liquidity position and the availability of financing. Our ongoing capital expenditure requirements may strain our cash and short-term asset balances, and, in periods when we are expanding our capital base, we expect that depreciation expense and factory operating expenses associated with our capital expenditures to increase production capacity will put downward pressure on our gross margin, at least over the near term. From time to time, we also make significant capital expenditures based on specific business opportunities with one or a few key customers, and the additional equipment purchased may not be readily usable to support other customers. If demand is insufficient to fill our capacity, or we are unable to efficiently redeploy such equipment, our capacity utilization and gross margin could be negatively impacted. Our capital expenditures or cost per square foot may increase as we transition to new or more advanced packaging and test technologies because, among other things, new equipment
26
used for these technologies is generally more expensive and often our existing equipment cannot be redeployed in whole or part for these technologies.
Furthermore, if we cannot generate or raise additional funds to pay for capital expenditures, particularly in some of the advanced packaging and bumping areas, as well as research and development activities, our growth and future profitability may be adversely affected. Our ability to obtain external financing in the future is subject to a variety of uncertainties, including:
|
•
|
our future financial condition, results of operations and cash flows;
|
|
•
|
general market conditions for financing;
|
|
•
|
volatility in fixed income, credit and equity markets and
|
|
•
|
economic, political and other global conditions.
|
The lead time needed to order, install and put into service various capital investments is often significant, and, as a result, we often need to commit to capital expenditures in advance of our receipt of firm orders or advance deposits based on our view of anticipated future demand with only very limited visibility. Although we seek to limit our exposure in this regard, in the past we have from time to time expended significant capital for additional equipment or facilities for which the anticipated demand did not materialize for a variety of reasons, many of which were outside of our control. To the extent this occurs in the future, our business, liquidity, results of operations, financial condition and cash flows could be materially adversely affected.
In addition, during periods where customer demand exceeds our capacity, customers may transfer some or all of their business to other suppliers who are able to support their needs. To the extent this occurs, our business, liquidity, results of operations, financial condition and cash flows could be materially adversely affected.
In September 2014, we started the construction of K5. The land purchase agreement includes various construction, investment, hiring, regulatory and other compliance obligations. While we completed the initial phase of construction in December 2016, there can be no assurance regarding when K5 will be fully utilized, or that the actual scope, costs, timeline or benefits of the project will be consistent with our current expectations.
Impairment Charges - Any Impairment Charges Required Under U.S. GAAP May Have a Material Adverse Effect on Our Net Income.
Under U.S. GAAP, we review our long-lived assets including property, plant and equipment, intellectual property, goodwill and other intangibles for impairment when events or changes in circumstances indicate the carrying value may not be recoverable. In addition, we review goodwill for impairment annually during the fourth quarter of each year. Factors we consider include significant under-performance relative to expected historical or projected future operating results, significant negative industry or economic trends and our market capitalization relative to net book value. We may be required in the future to record a significant charge to earnings in our financial statements during the period in which any impairment of our long-lived assets is determined. Such charges have had and could have a significant adverse impact on our results of operations and our operating flexibility under our debt covenants.
Litigation Incident to Our Business Could Adversely Affect Us.
We have been a party to various legal proceedings, including those described from time to time in our reports filed with the SEC, and may be a party to legal proceedings in the future. These proceedings could require significant management time and resources and, if an unfavorable ruling or outcome were to occur in these legal proceedings, there could be a material adverse impact on our business, liquidity, results of operations, financial condition, cash flows and the trading price of our securities.
27
We Could Suffer Adverse Tax and Other Financial Consequences if There Are Changes in Tax Laws or Taxing Authorities Do Not Agree with Our Interpretation of Applicable Tax Laws, Including Whether We Continue to Qualify for Our Tax Holidays, or if We Are Required to Establish or Adjust Valuation Allowances on Deferred Tax Assets.
Our operations are subject to tax in multiple jurisdictions with complicated and varied tax regimes. Tax laws and income tax rates in these jurisdictions are subject to change due to economic and political conditions. Changes in U.S. or foreign tax laws could have a material adverse impact on our liquidity, results of operations, financial condition and cash flows. For example, in the U.S., there have been proposals to change U.S. tax laws that would significantly impact how U.S. corporations are taxed on foreign earnings. We earn a substantial portion of our income in foreign countries. In addition, changes in tax laws or regulations enacted in response to guidelines proposed by organizations such as the Organisation for Economic Co-operation and Development regarding transfer pricing and other international tax matters relating to multinational companies like Amkor could also adversely impact our future liability for income taxes in the jurisdictions where we operate. Although we cannot predict whether or in what form any of these proposals might be enacted into law, if adopted they could have a material adverse impact.
Our corporate structure and operations are based, in part, on interpretations of various U.S. and foreign tax laws, including withholding tax, compliance with tax holiday requirements, application of changes in tax law to our operations and other relevant laws of applicable taxing jurisdictions. From time to time, the taxing authorities of the relevant jurisdictions may conduct examinations of our income tax returns and other regulatory filings. We cannot assure you that the taxing authorities will agree with our interpretations, including whether we continue to qualify for our tax holidays. To the extent they do not agree, we may seek to enter into settlements with the taxing authorities which require significant payments or otherwise adversely affect our results of operations or financial condition. We may also appeal the taxing authorities’ determinations to the appropriate governmental authorities, but we cannot be sure we will prevail. If we do not prevail, we may have to make significant payments or otherwise record charges (or reduce tax assets) that adversely affect our results of operations, financial condition and cash flows. Additionally, certain of our subsidiaries operate under tax holidays, which will expire in whole or in part at various dates in the future. As those tax holidays expire, our tax expense will increase as income from those jurisdictions becomes subject to higher statutory income tax rates, thereby reducing our liquidity and cash flow.
We monitor on an ongoing basis our ability to utilize our deferred tax assets and whether there is a need for a related valuation allowance. In evaluating our ability to recover our deferred tax assets, in the jurisdiction from which they arise, we consider all available positive and negative evidence, including scheduled reversals of deferred tax liabilities, projected future taxable income, tax-planning strategies and results of recent operations. For most of our foreign deferred tax assets, we consider it more likely than not that we will have sufficient taxable income to allow us to realize these deferred tax assets. In the event taxable income falls short of current expectations, we may need to establish a valuation allowance against such deferred tax assets, which could materially affect our results of operations.
Intellectual Property - Our Business Will Suffer if We Are Not Able to Develop New Proprietary Technology, Protect Our Proprietary Technology and Operate Without Infringing the Proprietary Rights of Others.
The complexity and breadth of semiconductor packaging and test services are rapidly increasing. As a result, we expect that we will need to develop, acquire and implement new manufacturing processes and packaging technologies and tools in order to respond to competitive industry conditions and customer requirements. Technological advances also typically lead to rapid and significant price erosion and may make our existing packages less competitive or our existing inventories obsolete. If we cannot achieve advances in packaging design or obtain access to advanced packaging designs developed by others, our business could suffer.
The need to develop and maintain advanced packaging capabilities and equipment could require significant research and development, capital expenditures and acquisitions in future years. In addition, converting to new packaging designs or process methodologies could result in delays in producing new package types, which could adversely affect our ability to meet customer orders and adversely impact our business.
The process of seeking patent protection takes a long time and is expensive. There can be no assurance that patents will issue from pending or future applications or that, if patents are issued, the rights granted under the patents will provide us with meaningful protection or any commercial advantage. Any patents we do obtain will eventually expire, may be challenged, invalidated or circumvented and may not provide meaningful protection or other commercial advantage to us.
28
Some of our technologies are not covered by any patent or patent application. The confidentiality agreements on which we rely to protect these technologies may be breached and may not be adequate to protect our proprietary technologies. There can be no assurance that other countries in which we market our services will protect our intellectual property rights to the same extent as the U.S.
Our competitors may develop, patent or gain access to know-how and technology similar or superior to our own. In addition, many of our patents are subject to cross licenses, several of which are with our competitors. The semiconductor industry is characterized by frequent claims regarding the infringement of patent and other intellectual property rights. If any third party makes an enforceable infringement claim against us or our customers, we could be required to:
|
•
|
discontinue the use of certain processes or cease to provide the services at issue, which could curtail our business;
|
|
•
|
pay substantial damages;
|
|
•
|
develop non-infringing technologies, which may not be feasible or
|
|
•
|
acquire licenses to such technology, which may not be available on commercially reasonable terms or at all.
|
We may need to enforce our patents or other intellectual property rights, including our rights under patent and intellectual property licenses with third parties, or defend ourselves against claimed infringement of the rights of others through litigation, which could result in substantial cost and diversion of our resources. Furthermore, if we fail to obtain necessary licenses, our business could suffer, and we could be exposed to claims for damages and injunctions from third parties, as well as claims from our customers for indemnification. In the past, we have been involved in legal proceedings involving the acquisition and license of intellectual property rights, the enforcement of our existing intellectual property rights or the enforcement of the intellectual property rights of others, including settled legal proceedings described in more detail in
Note 17
to our Consolidated Financial Statements in Part II, Item 8 of this Annual Report on Form 10-K. Unfavorable outcomes in any legal proceedings involving intellectual property could result in significant liabilities and could have a material adverse effect on our business, liquidity, results of operations, financial condition and cash flows. The potential impact from the legal proceedings referred to in this Annual Report on Form 10-K on our results of operations, financial condition and cash flows could change in the future.
Packaging and Test Processes Are Complex and Our Production Yields and Customer Relationships May Suffer from Defects in the Services We Provide or if We do Not Successfully Implement New Technologies.
Semiconductor packaging and test services are complex processes that require significant technological and process expertise. Defective packages primarily result from:
|
•
|
contaminants in the manufacturing environment;
|
|
•
|
human error;
|
|
•
|
equipment malfunction;
|
|
•
|
changing processes to address environmental requirements;
|
|
•
|
defective raw materials or
|
|
•
|
defective plating services.
|
Test is also complex and involves sophisticated equipment and software. Similar to many software programs, these software programs are complex and may contain programming errors or “bugs.” The test equipment is also subject to malfunction. In addition, the test process is subject to operator error.
These and other factors have, from time to time, contributed to lower production yields. They may also do so in the future, particularly as we adjust our capacity, change our processing steps or ramp new technologies. In addition, we must continue to develop and implement new packaging and test technologies, and expand our offering of packages to be competitive. Our production yields on new packages, particularly those packages which are based on new technologies, typically are significantly lower than our production yields on our more established packages.
29
Our failure to maintain quality standards or acceptable production yields, if significant and prolonged, could result in loss of customers, increased costs of production, delays, substantial amounts of returned goods and claims by customers relating thereto. Any of these problems could have a material adverse effect on our business, liquidity, results of operations, financial condition and cash flows.
In addition, in line with industry practice, new customers usually require us to pass a lengthy and rigorous qualification process that may take several months. If we fail to qualify packages with potential customers or existing customers, such failure could have a material adverse effect on our business, results of operations, financial condition and cash flows.
Competition - We Compete Against Established Competitors in the Packaging and Test Business as Well as Internal Customer Capabilities and May Face Competition from New Competitors, Including Foundries.
The outsourced semiconductor packaging and test market is very competitive. We face substantial competition from established and emerging packaging and test service providers primarily located in Asia, including companies with significantly greater processing capacity, financial resources, local presence, research and development operations, marketing, technology and other capabilities. We also may face increased competition from domestic companies located in the People’s Republic of China, or the PRC, where there are government-supported efforts to promote the development and growth of the local semiconductor industry. For example, STATS ChipPAC was acquired in 2015 by Jiangsu Electronics Technology Co., Ltd., a local PRC company. Our competitors may also have established relationships, or enter into new strategic relationships, with one or more of the large semiconductor companies that are our current or potential customers, or key suppliers to these customers. Consolidation among our competitors could also strengthen their competitive position. For example, in 2016, Advanced Semiconductor Engineering, Inc. and Siliconware Precision Industries Co., Ltd. announced their intention to become sister companies under a new joint holding company.
We also face competition from the internal capabilities and capacity of many of our current and potential IDM and foundry customers. In addition, we compete with contract foundries, such as Taiwan Semiconductor Manufacturing Company Limited and Samsung Electronics Co., Ltd., which offer full turnkey services from silicon wafer fabrication through packaging and final test. These semiconductor foundries, which are substantially larger and have greater financial resources than we do, have expanded their operations to include packaging and test services, and may continue to expand these capabilities in the future.
We cannot assure you that we will be able to compete successfully in the future against our existing or potential competitors or that our customers will not rely on internal sources for packaging and test services, or that our business, liquidity, results of operations, financial condition and cash flows will not be adversely affected by such increased competition.
Environmental, Health & Safety Laws and Initiatives - Future Environmental, Health & Safety Laws and Initiatives Could Place Additional Burdens on Our Manufacturing Operations.
The semiconductor packaging process generates by-products that are subject to extensive governmental regulations. For example, at our foreign facilities we produce liquid waste when semiconductor wafers are diced into chips with the aid of diamond saws, then cooled with running water. In addition, semiconductor packages have historically utilized metallic alloys containing lead (Pb) within the interconnect terminals typically referred to as leads, pins or balls. Environmental, health and safety laws and regulations in places we do business, impose various controls on the use, storage, handling, discharge and disposal of chemicals used in our production processes and on the factories we occupy and are increasingly imposing restrictions on the materials contained in semiconductor products. We may become liable under these environmental, health and safety laws and regulations for the cost of compliance and cleanup of any disposal or release of hazardous materials arising out of our former or current operations, or otherwise as a result of the existence of hazardous materials on our properties. In such an event, we could be held liable for damages, including fines, penalties and the cost of investigations and remedial actions, and could also be subject to revocation of permits negatively affecting our operations.
Public attention has focused on the environmental impact of semiconductor operations and the risk to neighbors of chemical releases from such operations and to the materials contained in semiconductor products. For example, the European Union’s Restriction of Use of Certain Hazardous Substances in Electrical and Electronic Equipment Directive and similar laws in other jurisdictions impose strict restrictions on the use of lead and other hazardous substances in electrical and electronic
30
equipment. In addition, increasing climate change and environmental concerns could result in our customers requesting that we and our suppliers exceed regulatory standards. Complying with existing and possible future environmental, health and safety laws or related customer requests may impose upon us the need for additional equipment or other process requirements, restrict our ability to expand our operations, disrupt our operations, increase costs, subject us to liability or cause us to curtail our operations. Furthermore, energy costs in general could increase significantly due to climate change and other regulations.
Our Business and Financial Condition Could be Adversely Affected by Natural Disasters and Other Calamities.
We have significant packaging and test and other operations in locations which are subject to natural disasters, such as earthquakes, tsunamis, typhoons, floods, droughts, volcanoes and other severe weather and geological events, and other calamities, such as fire; the outbreak of infectious diseases (such as Ebola, SARs or flu); industrial strikes; breakdowns of equipment; difficulties or delays in obtaining materials, equipment, utilities and services; political events; acts of war and terrorist incidents; industrial accidents and other events, that could disrupt or even shutdown our operations. In addition, our suppliers and customers also have significant operations in such locations. In the event of such a disruption or shutdown, we may be unable to reallocate production to other facilities in a timely or cost-effective manner (if at all) and we may not have sufficient capacity to service customer demands in our other facilities. A natural disaster or other calamity that results in a prolonged disruption to our operations, or the operations of our customers or suppliers, could have a material adverse effect on our business, financial condition, results of operations and cash flows.
For example, in April 2016, our Kumamoto factory was damaged by earthquakes in Japan. While production was restored at Kumamoto in the second quarter, our sales in the second quarter were reduced due to the temporary disruption in operations. We also incurred earthquake related costs for damaged inventory, buildings and equipment.
Also, Japan experienced a severe earthquake and tsunami in 2011 that resulted in significant disruption in the electronics industry supply chain and adversely affected Japan's economy and consumer spending. In addition, in October 2011, Thailand experienced substantial flooding which affected the facilities and operations of customers and suppliers in our industry. In addition, some of the processes that we utilize in our operations place us at risk of fire and other damage. For example, highly flammable gases are used in the preparation of wafers holding semiconductor devices for flip chip packaging.
Although we maintain insurance policies for various types of property, casualty and other risks, we do not carry insurance for all the above referred risks, and with regard to the insurance we do maintain, we cannot assure you that it would be sufficient to cover all of our potential losses. As a result, our business, financial condition, results of operations and cash flows could be adversely affected by natural disasters and other calamities.
Mr. James J. Kim and Members of His Family Can Effectively Determine or Substantially Influence The Outcome of All Matters Requiring Stockholder Approval.
As of
December 31, 2016
, Mr. James J. Kim, the Executive Chairman of our Board of Directors, members of Mr. Kim’s immediate family and affiliates owned approximately
137.6 million
shares, or approximately
58%
, of our outstanding common stock. The Kim family also has options to acquire approximately
0.4 million
shares. If the options are exercised, the Kim family's total ownership would be an aggregate of approximately
138.0 million
shares of our outstanding common stock or approximately
58%
of our outstanding common stock.
In June 2013, the Kim family exchanged their convertible notes issued by Amkor for approximately
49.6 million
shares of common stock (the "Convert Shares"). The Convert Shares are subject to a voting agreement. The agreement requires the Kim family to vote these shares in a “neutral manner” on all matters submitted to our stockholders for a vote, so that such Convert Shares are voted in the same proportion as all of the other outstanding securities (excluding the other shares owned by the Kim family) that are actually voted on a proposal submitted to Amkor’s stockholders for approval. The Kim family is not required to vote in a “neutral manner” any Convert Shares that, when aggregated with all other voting shares held by the Kim family, represent
41.6%
or less of the total then-outstanding voting shares of our common stock. The voting agreement for the Convert Shares terminates upon the earliest of (i) such time as the Kim family no longer beneficially owns any of the Convert Shares, (ii) consummation of a change of control (as defined in the voting agreement) or (iii) the mutual agreement of the Kim family and Amkor.
31
Mr. James J. Kim and his family and affiliates, acting together, have the ability to effectively determine or substantially influence matters submitted for approval by our stockholders by voting their shares or otherwise acting by written consent, including the election of our Board of Directors. There is also the potential, through the election of members of our Board of Directors, that the Kim family could substantially influence matters decided upon by our Board of Directors. This concentration of ownership may also have the effect of impeding a merger, consolidation, takeover or other business consolidation involving us, or discouraging a potential acquirer from making a tender offer for our shares, and could also negatively affect our stock’s market price or decrease any premium over market price that an acquirer might otherwise pay. Concentration of ownership also reduces the public float of our common stock. There may be less liquidity and higher price volatility for the stock of companies with a smaller public float compared to companies with broader public ownership. Also, the sale or the prospect of the sale of a substantial portion of the Kim family shares may adversely affect the market price of our stock.
|
Item 1B.
|
Unresolved Staff Comments
|
None.
32
|
Item 2.
|
Properties
|
The location and size of our manufacturing and research and development facilities are set forth in the table below. All facilities are owned unless otherwise specified.
|
Approximate
Facility Size
(Square Feet)
|
|||
|
China
|
|||
|
Shanghai, China (1)
|
1,267,000
|
|
|
|
Japan
|
|||
|
Usuki, Japan
|
460,000
|
|
|
|
Hakodate, Japan (2)
|
438,000
|
|
|
|
Kumamoto, Japan (2)
|
376,000
|
|
|
|
Fukuoka, Japan
|
308,000
|
|
|
|
Fukui, Japan
|
269,000
|
|
|
|
Kitsuki, Japan
|
201,000
|
|
|
|
Miyagi, Japan
|
171,000
|
|
|
|
Aizu, Japan (3)
|
166,000
|
|
|
|
Oita, Japan (3)
|
117,000
|
|
|
|
Neagari, Japan (3)
|
89,000
|
|
|
|
Kitakami, Japan (3)
|
50,000
|
|
|
|
Korea
|
|||
|
Incheon, Korea
|
1,336,000
|
|
|
|
Gwangju, Korea
|
1,154,000
|
|
|
|
Seoul, Korea
|
666,000
|
|
|
|
Pupyong, Korea (4)
|
448,000
|
|
|
|
Malaysia
|
|||
|
Telok Panglima Garang, Malaysia (1)
|
385,000
|
|
|
|
Philippines
|
|||
|
Muntinlupa, Philippines (5)
|
661,000
|
|
|
|
Province of Laguna, Philippines (5)
|
660,000
|
|
|
|
Taiwan
|
|||
|
Hsinchu, Taiwan
|
511,000
|
|
|
|
Lung Tan, Taiwan
|
353,000
|
|
|
|
Total all facilities
|
10,086,000
|
|
|
|
(1)
|
Land is leased.
|
|
(2)
|
Includes leased support facilities at a nearby location.
|
|
(3)
|
Leased facility.
|
|
(4)
|
Includes a lease for
44,000
square feet of building space.
|
|
(5)
|
As a result of foreign ownership restrictions in the Philippines, the land is leased. A portion of the land we lease is owned by realty companies in which we own a
40%
interest. We also lease
661,000
square feet of building space.
|
Our corporate headquarters is located in Tempe, Arizona.
33
We believe that our existing properties are in good condition and suitable for the conduct of our business and that the productive capacity of such properties is substantially being utilized or we have plans to utilize it.
|
Item 3.
|
Legal Proceedings
|
From time to time, we may become involved in various disputes and litigation matters that arise in the ordinary course of our business. These include disputes and lawsuits related to intellectual property, acquisitions, licensing, contracts, tax, regulatory, employee relations and other matters. For a discussion of “Legal Proceedings,” see
Note 17
to our Consolidated Financial Statements in Part II, Item 8 of this Annual Report on Form 10-K.
|
Item 4.
|
Mine Safety Disclosures
|
Not applicable.
|
Item 5.
|
Market for Registrant’s Common Equity, Related Stockholder Matters and Issuer Purchases of Equity Securities
|
LISTING ON THE NASDAQ GLOBAL SELECT MARKET
Our common stock is traded on the NASDAQ Global Select Market under the symbol “AMKR.” The following table sets forth, for the periods indicated, the high and low sale prices per share of our common stock as quoted on the NASDAQ Global Select Market.
|
High
|
Low
|
||||||||||
|
2016
|
|||||||||||
|
First Quarter
|
$
|
6.14
|
|
$
|
4.13
|
|
|||||
|
Second Quarter
|
6.44
|
|
5.37
|
|
|||||||
|
Third Quarter
|
9.72
|
|
5.60
|
|
|||||||
|
Fourth Quarter
|
12.32
|
|
9.19
|
|
|||||||
|
2015
|
|||||||||||
|
First Quarter
|
$
|
9.91
|
|
$
|
6.35
|
|
|||||
|
Second Quarter
|
8.79
|
|
5.90
|
|
|||||||
|
Third Quarter
|
5.93
|
|
4.14
|
|
|||||||
|
Fourth Quarter
|
6.93
|
|
4.44
|
|
|||||||
There were approximately
136
holders of record of our common stock as of
February 17, 2017
.
DIVIDEND POLICY
Since our public offering in 1998, we have never paid a dividend to our stockholders, and we do not have any present plans for doing so. In addition, our U.S. revolving credit agreement and the indentures governing our senior notes limit our ability to pay dividends. Refer to the
Liquidity and Capital Resources
section in Item 7 of this Annual Report on Form 10-K.
RECENT SALES OF UNREGISTERED SECURITIES
None.
34
EQUITY COMPENSATION PLANS
The information required by this item regarding equity compensation plans is set forth in Part III, Item 12 of this Annual Report on Form 10-K.
PURCHASES OF EQUITY SECURITIES BY THE ISSUER AND AFFILIATED PURCHASERS
The following table provides information regarding repurchases of our common stock during the three months ended
December 31, 2016
.
|
Period
|
Total Number of Shares Purchased (a)
|
Average Price Paid Per Share ($)
|
Total Number of Shares Purchased as part of Publicly Announced Plans or Programs (b)
|
Approximate Dollar Value of Shares that May Yet Be Purchased Under the Plans or Programs ($) (b)
|
||||||
|
October 1-October 31
|
—
|
|
$
|
—
|
|
—
|
|
$
|
91,586,032
|
|
|
November 1-November 30
|
25,754
|
|
11.08
|
|
—
|
|
91,586,032
|
|
||
|
December 1-December 31
|
—
|
|
—
|
|
—
|
|
91,586,032
|
|
||
|
Total
|
25,754
|
|
$
|
11.08
|
|
—
|
|
|||
|
(a)
|
Represents shares of common stock surrendered to us to satisfy tax withholding obligations associated with the vesting of restricted shares issued to employees.
|
|
(b)
|
Our Board of Directors previously authorized the repurchase of up to
$300.0 million
of our common stock,
$150.0 million
in August 2011 and
$150.0 million
in February 2012, exclusive of any fees, commissions or other expenses. During 2015 and
2016
, we made no common stock purchases, and at
December 31, 2016
, approximately
$91.6 million
was available pursuant to the stock repurchase program.
|
35
PERFORMANCE GRAPH (1)
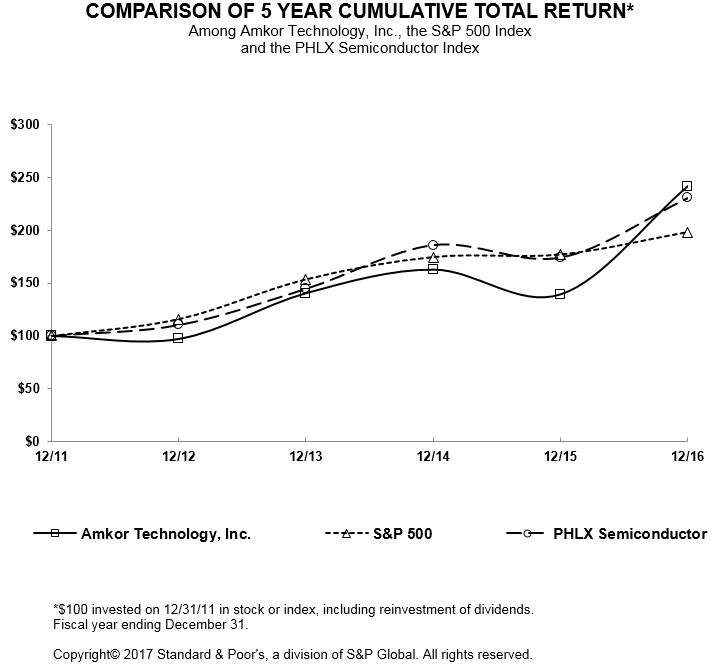
|
(1)
|
The preceding Stock Performance Graph is not deemed filed with the Securities and Exchange Commission and shall not be incorporated by reference in any of our filings under the Securities Act of 1933 or the Securities Exchange Act of 1934, as amended, whether made before or after the date hereof and irrespective of any general incorporation language in any such filing.
|
|
Year Ended December 31,
|
|||||||||||||||||||||||
|
2011
|
2012
|
2013
|
2014
|
2015
|
2016
|
||||||||||||||||||
|
Amkor Technology, Inc.
|
$
|
100.00
|
|
$
|
97.27
|
|
$
|
140.60
|
|
$
|
162.84
|
|
$
|
139.45
|
|
$
|
241.97
|
|
|||||
|
S&P 500
|
100.00
|
|
116.00
|
|
153.58
|
|
174.60
|
|
177.01
|
|
198.18
|
|
|||||||||||
|
PHLX Semiconductor
|
100.00
|
|
110.42
|
|
144.83
|
|
186.15
|
|
174.42
|
|
230.82
|
|
|||||||||||
36
|
Item 6.
|
Selected Consolidated Financial Data
|
The following selected consolidated financial data as of
December 31, 2016
and
2015
, and for the years ended
December 31, 2016
,
2015
and
2014
, have been derived from our audited Consolidated Financial Statements included in this Annual Report on Form 10-K. The following selected consolidated financial data as of
December 31, 2014
,
2013
and
2012
, and for the years ended
December 31, 2013
and
2012
, have been derived from audited financial statements not included herein. You should read the selected consolidated financial data in conjunction with Management’s Discussion and Analysis of Financial Condition and Results of Operations and our Consolidated Financial Statements in Part II, Item 7 and Item 8, respectively, of this Annual Report on Form 10-K.
SELECTED HISTORICAL CONSOLIDATED FINANCIAL DATA
|
For the Year Ended December 31,
|
|||||||||||||||||||
|
2016 (d)
|
2015 (d) (f)
|
2014 (c) (f)
|
2013 (e) (f)
|
2012 (f)
|
|||||||||||||||
|
(In thousands, except per share data)
|
|||||||||||||||||||
|
Income Statement Data:
|
|||||||||||||||||||
|
Net sales
|
$
|
3,893,635
|
|
$
|
2,884,603
|
|
$
|
3,129,440
|
|
$
|
2,956,450
|
|
$
|
2,759,546
|
|
||||
|
Gross profit (a)
|
695,477
|
|
479,265
|
|
552,822
|
|
544,513
|
|
423,810
|
|
|||||||||
|
Operating income
|
293,940
|
|
164,839
|
|
221,460
|
|
232,109
|
|
152,692
|
|
|||||||||
|
Loss on debt retirement (b)
|
—
|
|
9,560
|
|
757
|
|
12,330
|
|
1,199
|
|
|||||||||
|
Income tax expense
|
47,853
|
|
28,035
|
|
33,845
|
|
22,646
|
|
17,001
|
|
|||||||||
|
Equity in earnings of J-Devices (c)
|
—
|
|
14,016
|
|
31,007
|
|
9,452
|
|
5,220
|
|
|||||||||
|
Net income (a) (c)
|
167,304
|
|
53,893
|
|
133,240
|
|
110,793
|
|
42,330
|
|
|||||||||
|
Net income attributable to Amkor
|
164,190
|
|
51,098
|
|
129,739
|
|
108,432
|
|
41,446
|
|
|||||||||
|
Net income attributable to Amkor per common share:
|
|||||||||||||||||||
|
Basic
|
$
|
0.69
|
|
$
|
0.22
|
|
$
|
0.56
|
|
$
|
0.58
|
|
$
|
0.26
|
|
||||
|
Diluted
|
$
|
0.69
|
|
$
|
0.22
|
|
$
|
0.55
|
|
$
|
0.50
|
|
$
|
0.24
|
|
||||
|
Other Financial Data:
|
|||||||||||||||||||
|
Depreciation and amortization
|
$
|
555,186
|
|
$
|
494,200
|
|
$
|
464,706
|
|
$
|
410,346
|
|
$
|
370,479
|
|
||||
|
Payments for property, plant and equipment
|
650,038
|
|
537,975
|
|
681,120
|
|
566,256
|
|
533,512
|
|
|||||||||
|
Balance Sheet Data:
|
|||||||||||||||||||
|
Cash and cash equivalents
|
$
|
549,518
|
|
$
|
523,172
|
|
$
|
449,946
|
|
$
|
610,442
|
|
$
|
413,048
|
|
||||
|
Working capital
|
404,035
|
|
299,296
|
|
497,358
|
|
541,480
|
|
438,781
|
|
|||||||||
|
Total assets
|
4,092,086
|
|
4,026,428
|
|
3,633,918
|
|
3,426,166
|
|
3,024,892
|
|
|||||||||
|
Non-current liabilities, including debt
|
1,683,021
|
|
1,790,708
|
|
1,803,879
|
|
1,771,422
|
|
1,705,794
|
|
|||||||||
|
Total Amkor stockholders’ equity
|
1,383,588
|
|
1,200,286
|
|
1,114,748
|
|
952,608
|
|
657,632
|
|
|||||||||
|
(a)
|
In January 2015, we reached a resolution to a patent license dispute and entered into a settlement agreement. During 2014, 2013 and 2012 we recorded charges of $75.3 million, $10.0 million and $50.0 million, respectively, to cost of sales and $13.7 million, $1.8 million, and $6.0 million, respectively, to interest expense relating to this patent license dispute.
|
|
(b)
|
During 2015, we recorded a loss on debt retirement of $8.9 million relating to the early repayment of our 7.375% Senior Notes due May 2018. During 2013, we exchanged debt for shares of our common stock and a cash payment and recorded a charge of $11.6 million.
|
|
(c)
|
On June 30, 2014, we sold
100%
of the shares of our then wholly-owned subsidiary in Japan to J-Devices, our then unconsolidated equity-method joint venture in Japan. Subsequent to June 30, 2014, the results of the divested entity are included in J-Devices' financial results and in our corresponding equity in earnings of J-Devices. We recognized a net gain on the sale of
$9.2 million
in other (income) expense, net. In addition, J-Devices recognized a gain on the transaction, which increased our equity in earnings of J-Devices by
$8.8 million
. The combined net gain we recognized was
$18.0 million
.
|
37
|
(d)
|
We increased our investment in J-Devices to
60%
in 2013 and to
100%
on December 30, 2015 through the exercise of additional options. As a result, our accounting for J-Devices changed from the equity method to the consolidation method effective December 30, 2015. Our balance sheet data as of December 31, 2015 reflects the consolidation of J-Devices. We began consolidating the operating results of J-Devices in 2016. We recognized a net loss of
$13.5 million
in other (income) expense, net in connection with the acquisition in 2015. The net loss resulted from a loss of
$29.6 million
related to the release of certain accumulated foreign currency translation adjustments related to J-Devices, offset by a gain of
$16.1 million
related to the step-up to fair value of our previous investments in J-Devices.
|
|
(e)
|
On July 31, 2013, we completed the purchase of Amkor Technology Malaysia Sdn. Bhd. Their financial results have been included in our Consolidated Financial Statements from the date of acquisition.
|
|
(f)
|
In the second quarter of 2016, we identified an error in the provision for income taxes in the financial statements for J-Devices for the periods beginning in 2012 through the fourth quarter of 2015. We have revised our previously issued consolidated financial statements to correct our equity in earnings for J-Devices during the impacted periods. See
Note 1
and
Note 19
to our Consolidated Financial Statements included in Part II, Item 8 of this Annual Report on Form 10-K for additional information.
|
|
Item 7.
|
Management’s Discussion and Analysis of Financial Condition and Results of Operations
|
Overview
Amkor is one of the world’s leading providers of outsourced semiconductor packaging and test services. Our financial goals are sales growth and improved profitability. To achieve these goals, we are focused on generating increased value from our investments in advanced technologies, improving utilization of existing assets and selectively growing our scale and scope through strategic investments.
We are an industry leader in developing and commercializing cost-effective advanced packaging and test technologies. These advanced technology solutions provide increased value to our customers while typically generating gross margins above our corporate average. This is particularly true in the mobile device market, where growth has outpaced the semiconductor industry rate. Advanced packages are now the preferred choice in both the high-end and the mid-range segments of the smartphone market, which together account for a high portion of mobile phone semiconductor value. The demand for advanced packages is also being driven by second-wave mobile device customers, who are transitioning out of wirebond into wafer-level and flip-chip packages. We believe that our technology leadership and this technology transition create significant growth opportunities for us.
We typically look for opportunities in the advanced packaging and test area where we can generate reasonably quick returns on investments made for customers seeking leading edge technologies. We also focus on developing a second wave of customers to fill the capacity that becomes available when leading edge customers transition to newer packaging and test equipment and platforms. For example, we are currently working to expand our sales to Chinese and Taiwanese fabless chip companies that make up a significant portion of the mid-tier and entry-level segments of the mobile device market where much of the growth is occurring. In addition, we are seeking out new customers and deepening our engagement with existing customers. This includes an expanded emphasis on the automotive market where semiconductor content continues to grow and in the analog area for our mainstream wirebond technologies.
From time to time, we identify attractive opportunities to grow our customer base and expand the markets we serve. For example, in 2009 we invested in J-Devices, a joint venture to provide semiconductor packaging and test services in Japan. We increased our investment in J-Devices to
60%
in 2013 and to
100%
in 2015 through the exercise of additional options. Also, in 2013, we acquired Toshiba’s power discrete semiconductor packaging and test factory in Malaysia. We believe that selective growth through joint ventures, acquisitions and other strategic investments can help diversify our revenue streams, improve our profits, broaden our portfolio of services and continue our technological leadership.
Our IDM customers include: Intel Corporation; Renesas Electronics Corporation; STMicroelectronics N.V.; Texas Instruments Incorporated and Toshiba Corporation. Our fabless customers include: Broadcom Limited and Qualcomm Incorporated. Our contract foundry customers include: GlobalFoundries Inc. and Taiwan Semiconductor Manufacturing Company Limited.
38
As a supplier in the semiconductor industry, our business is cyclical and impacted by broad economic factors, such as world-wide gross domestic product and consumer spending. Historically, there has been a strong correlation between world-wide gross domestic product levels, consumer spending and semiconductor industry cycles. The semiconductor industry has experienced significant and sometimes prolonged cyclical upturns and downturns in the past. We cannot predict the timing, strength or duration of any economic slowdown or subsequent economic recovery.
Our net sales, gross profit, operating income, cash flows, liquidity and capital resources have historically fluctuated significantly from quarter to quarter as a result of many factors, including the seasonality of our business, the cyclical nature of the semiconductor industry and other factors discussed in Part 1, Item 1A of this Annual Report on Form 10-K.
We operate in a capital intensive industry and have a significant level of debt. Servicing our current and future customers requires that we incur significant operating expenses and continue to make significant capital expenditures, which are generally made in advance of the related revenues and without firm customer commitments. We fund our operations, including capital expenditures and debt service requirements, with cash flows from operations, existing cash and cash equivalents, borrowings under available credit facilities and proceeds from any additional financing. Maintaining an appropriate level of liquidity is important to our business and depends on, among other things, the performance of our business, our capital expenditure levels and our ability to repay debt out of our operating cash flows or proceeds from debt or equity financings.
2016 Financial Highlights
On December 30, 2015, we increased our ownership in J-Devices to 100%. As a result, our accounting for J-Devices changed from the equity method to the consolidation method. Our operating results for
2016
include the fully consolidated results of J-Devices. Our operating results for 2015 and prior years include only our equity in earnings of J-Devices.
Our net sales increased
$1,009.0 million
or
35.0%
to
$3,893.6 million
in
2016
from
$2,884.6 million
in
2015
primarily due to the consolidation of J-Devices. J-Devices contributed
$913.7 million
of net sales in the current year. Excluding J-Devices, net sales in 2016 increased by
$95.3 million
compared to 2015 due to
higher sales in the automotive and mobile communications markets
.
Gross profit increased
$216.2 million
in 2016 compared to 2015, primarily attributable to
$137.9 million
contributed by J-Devices. The remainder of the increase was primarily
due to the increase in net sales and favorable foreign currency movements
.
In
2016
, our capital expenditures totaled
$650.0 million
, or
16.7%
of net sales, including
$169.6 million
for construction of our K5 facility in Korea. In 2015 our capital expenditures totaled
$538.0 million
, or
18.6%
of net sales.
Net cash provided by operating activities was
$729.4 million
for the year ended
December 31, 2016
, which includes
$120.0 million
contributed by J-Devices. Net cash provided by operating activities was
$585.0 million
for the year ended
December 31, 2015
. Excluding J-Devices, our operating cash flow increased in 2016 primarily due to higher sales and gross profit.
39
Results of Operations
The following table sets forth certain operating data as a percentage of net sales for the periods indicated:
|
Year Ended December 31,
|
||||||||
|
2016
|
2015
|
2014
|
||||||
|
Net sales
|
100.0
|
%
|
100.0
|
%
|
100.0
|
%
|
||
|
Materials
|
37.2
|
%
|
36.6
|
%
|
36.8
|
%
|
||
|
Labor
|
15.3
|
%
|
15.1
|
%
|
14.0
|
%
|
||
|
Other manufacturing costs
|
29.6
|
%
|
31.7
|
%
|
29.1
|
%
|
||
|
Patent license litigation
|
—
|
%
|
—
|
%
|
2.4
|
%
|
||
|
Gross margin
|
17.9
|
%
|
16.6
|
%
|
17.7
|
%
|
||
|
Operating income
|
7.5
|
%
|
5.7
|
%
|
7.1
|
%
|
||
|
Net income attributable to Amkor (1)
|
4.2
|
%
|
1.8
|
%
|
4.1
|
%
|
||
|
(1)
|
In the second quarter of 2016, we identified an error in the provision for income taxes in the financial statements for J-Devices for the periods beginning in 2012 through the fourth quarter of 2015. We have revised our previously issued consolidated financial statements to correct our equity in earnings for J-Devices during the impacted periods. See
Note 1
and
Note 19
to our Consolidated Financial Statements included in Part II, Item 8 of this Annual Report on Form 10-K for additional information.
|
Net Sales
|
Change
|
|||||||||||||||||||||||||
|
2016
|
2015
|
2014
|
2016 over 2015
|
2015 over 2014
|
|||||||||||||||||||||
|
(In thousands, except percentages)
|
|||||||||||||||||||||||||
|
Net sales
|
$
|
3,893,635
|
|
$
|
2,884,603
|
|
$
|
3,129,440
|
|
$
|
1,009,032
|
|
35.0
|
%
|
$
|
(244,837
|
)
|
(7.8
|
)%
|
||||||
The increase in net sales in 2016 compared to 2015 was primarily attributable to the consolidation of J-Devices. J-Devices contributed
$913.7 million
of net sales for the year ended December 31, 2016. Excluding J-Devices, net sales increased by
$95.3 million
primarily due to
higher sales in the automotive and mobile communications markets
. The increase in the automotive market was driven by increased market share with existing customers and increasing semiconductor content in vehicles. The increase in the mobile communications market was attributable to strength in smartphones across multiple tiers.
The decrease in net sales in 2015 compared to 2014 was primarily attributable to changes in the supply chain for high-end smartphones which impacted one of our major customers and generally soft economic conditions and a lack of compelling new mobile products during 2015. The sale of our Japanese subsidiary to J-Devices in June 2014 also reduced our 2015 net sales. We benefitted from growth in our advanced SiP business, particularly for radio frequency and front end module applications for smartphones and tablets, as well as higher sales to customers in Greater China.
Gross Profit and Gross Margin
|
Change
|
|||||||||||||||||||
|
2016
|
2015
|
2014
|
2016 over 2015
|
2015 over 2014
|
|||||||||||||||
|
(In thousands, except percentages)
|
|||||||||||||||||||
|
Gross profit
|
$
|
695,477
|
|
$
|
479,265
|
|
$
|
552,822
|
|
$
|
216,212
|
|
$
|
(73,557
|
)
|
||||
|
Gross margin
|
17.9
|
%
|
16.6
|
%
|
17.7
|
%
|
1.3
|
%
|
(1.1
|
)%
|
|||||||||
Our cost of sales consists principally of materials, labor, depreciation and manufacturing overhead. Since a substantial portion of the costs at our factories is fixed, there tends to be a direct relationship between our revenue levels and gross margin where relatively modest increases or decreases can have a significant effect.
40
Gross profit for 2016 increased compared to 2015, primarily
due to the increase in net sales and favorable foreign currency movements
. J-Devices contributed
$137.9 million
in gross profit for the year ended December 31, 2016. Gross margin increased for 2016 compared to 2015, primarily due to higher net sales and favorable foreign currency movements. The increase is partially offset by higher net sales generated from mainstream packages, which have lower gross margin, as a result of the consolidation of J-Devices.
Gross margin in 2015 decreased due to lower net sales, higher employee compensation costs at our factories, and increased depreciation expense from our continued investments in property, plant and equipment. The decrease is partially offset by favorable foreign currency exchange rate movements and lower costs for gold, which is used in many of our wirebond products.
Selling, General and Administrative Expenses
|
Change
|
|||||||||||||||||||||||||
|
2016
|
2015
|
2014
|
2016 over 2015
|
2015 over 2014
|
|||||||||||||||||||||
|
(In thousands, except percentages)
|
|||||||||||||||||||||||||
|
Selling, general and administrative
|
$
|
284,331
|
|
$
|
232,409
|
|
$
|
254,498
|
|
$
|
51,922
|
|
22.3
|
%
|
$
|
(22,089
|
)
|
(8.7
|
)%
|
||||||
Selling, general and administrative expenses increased in 2016 compared to 2015 as a result of the consolidation of J-Devices, which accounted for $56.3 million in selling, general and administrative expenses. Excluding J-Devices, selling, general and administrative expenses for 2016 decreased primarily due to general cost savings and lower depreciation expense. These decreases were partially offset by higher employee incentive compensation costs.
Selling, general and administrative expenses decreased in 2015 compared to 2014 due to lower employee incentive compensation costs and professional fees, as well as favorable foreign currency exchange rate movements.
Research and Development
|
Change
|
|||||||||||||||||||||||||
|
2016
|
2015
|
2014
|
2016 over 2015
|
2015 over 2014
|
|||||||||||||||||||||
|
(In thousands, except percentages)
|
|||||||||||||||||||||||||
|
Research and development
|
$
|
117,206
|
|
$
|
82,017
|
|
$
|
76,864
|
|
$
|
35,189
|
|
42.9
|
%
|
$
|
5,153
|
|
6.7
|
%
|
||||||
Research and development activities are focused on developing new packaging solutions and test services and improving the efficiency and capabilities of our existing production processes. The costs related to our technology and product development projects are included in research and development expense until the project moves into production. Once production begins, the costs related to production become part of the cost of goods sold, including ongoing depreciation for the equipment previously held for research and development activities. Research and development expenses were up in 2016 over 2015, and 2015 over 2014, primarily due to increases in development activities and the related employee compensation costs and depreciation resulting from continued investments in equipment, in each of those periods. The increase in each period was partially offset by the reduction in costs for projects that moved into production. In addition, the consolidation of J-Devices added $18.3 million in research and development expenses for the year ended December 31, 2016.
41
Other Income and Expense
|
Change
|
|||||||||||||||||||||||||
|
2016
|
2015
|
2014
|
2016 over 2015
|
2015 over 2014
|
|||||||||||||||||||||
|
(In thousands, except percentages)
|
|||||||||||||||||||||||||
|
Interest expense, including related party
|
$
|
84,637
|
|
$
|
86,376
|
|
$
|
109,925
|
|
$
|
(1,739
|
)
|
(2.0
|
)%
|
$
|
(23,549
|
)
|
(21.4
|
)%
|
||||||
|
Foreign currency (gain) loss, net
|
(3,592
|
)
|
(7,849
|
)
|
(9,808
|
)
|
4,257
|
|
(54.2
|
)%
|
1,959
|
|
(20.0
|
)%
|
|||||||||||
|
Other (income) expense, net
|
(2,262
|
)
|
18,400
|
|
(14,735
|
)
|
(20,662
|
)
|
>100%
|
|
33,135
|
|
>(100)%
|
|
|||||||||||
|
Total other expense, net
|
$
|
78,783
|
|
$
|
96,927
|
|
$
|
85,382
|
|
$
|
(18,144
|
)
|
(18.7
|
)%
|
$
|
11,545
|
|
13.5
|
%
|
||||||
Interest expense decreased in 2016 over 2015, and 2015 over 2014, primarily due to the repayment in full of our 7.375% Senior Notes due May 2018 with proceeds from lower cost debt in June 2015. In 2016, 2015 and 2014, we capitalized a portion of the interest on our outstanding debt in the amount of $4.4 million, $10.1 million and $6.9 million, respectively, in connection with the construction of our K5 facility in Korea. We ceased capitalizing interest in the first quarter of 2016, which resulted in an increase in interest expense in the remaining quarters of 2016. This increase partially offset the decrease in interest expense from 2015.
In 2015, other (income) expense, net included a net loss of $13.9 million on the acquisition of the remaining interest of J-Devices and a loss on debt retirement of $8.9 million relating to the repayment in full of our 7.375% Senior Notes due May 2018 with proceeds from lower cost debt in June 2015. We also recognized net foreign currency gains as a result of favorable exchange rate movements and the associated impact on our net monetary exposure at our foreign subsidiaries. In 2014, other (income) expense, net included a $9.2 million net gain on the sale of a subsidiary to J-Devices, and we recognized net foreign currency gains at various Asian subsidiaries due to favorable exchange rate movements.
Income Tax Expense
|
Change
|
|||||||||||||||||||
|
2016
|
2015
|
2014
|
2016 over 2015
|
2015 over 2014
|
|||||||||||||||
|
(In thousands, except percentages)
|
|||||||||||||||||||
|
Income tax expense
|
$
|
47,853
|
|
$
|
28,035
|
|
$
|
33,845
|
|
$
|
19,818
|
|
$
|
(5,810
|
)
|
||||
|
Effective tax rate
|
22.2
|
%
|
41.3
|
%
|
24.9
|
%
|
|
|
|
|
|||||||||
Generally, our effective tax rate is below the U.S. federal tax rate of 35% because the majority of our income is taxed in foreign jurisdictions where we operate and benefit from tax holidays or tax rates lower than the U.S. statutory rate. Foreign withholding taxes and minimum taxes cause our effective tax rate to increase. The effective income tax rate in 2015 was higher than 2016 and 2014 primarily attributable to losses in jurisdictions where there was no associated tax benefit.
Our income tax expense reflects the applicable tax rates in effect in the various countries in which our income is earned and is subject to volatility depending on the relative mix of earnings in each location. During 2016, 2015 and 2014, our subsidiaries in Korea, Malaysia, the Philippines and Taiwan operated under tax holidays, which will expire in whole or in part at various dates through
2025
. We expect our effective tax rate to increase as the tax holidays expire because income earned in these jurisdictions will be subject to higher statutory income tax rates.
See
Note 6
to our Consolidated Financial Statements included in Part II, Item 8 of this Annual Report on Form 10-K for additional information about our income tax expense.
42
Equity in Earnings of J-Devices
|
Change
|
|||||||||||||||||||||||||
|
2016
|
2015
|
2014
|
2016 over 2015
|
2015 over 2014
|
|||||||||||||||||||||
|
(In thousands, except percentages)
|
|||||||||||||||||||||||||
|
Equity in earnings of J-Devices
|
$
|
—
|
|
$
|
14,016
|
|
$
|
31,007
|
|
$
|
(14,016
|
)
|
(100.0
|
)%
|
$
|
(16,991
|
)
|
(54.8
|
)%
|
||||||
In January 2015, we increased our ownership interest in J-Devices from 60% to 65.7%. On December 30, 2015, we increased our ownership in J-Devices from
65.7%
to
100%
through the exercise of existing options. As a result, our accounting for J-Devices changed from the equity method to the consolidation method effective at the time of acquisition on December 31, 2015. In June 2014, J-Devices acquired our Japanese subsidiary, which resulted in
$8.8 million
of additional equity in earnings due to the gain on J-Devices' purchase. The decrease from 2014 is also due to a lower settlement of a take-or-pay arrangement under a manufacturing services agreement.
Quarterly Results
The following table sets forth our unaudited consolidated financial data for the last eight quarters ended
December 31, 2016
. Our results of operations have varied and may continue to vary from quarter to quarter and are not necessarily indicative of the results of any future period. Our net sales, gross profit and operating income are generally lower in the first quarter of the year as compared to the fourth quarter of the preceding year primarily due to the effect of consumer buying patterns in Asia, Europe and the U.S. In 2015, generally soft economic conditions and a lack of compelling new mobile products constrained overall demand, and as a result, we did not see our normal seasonal revenue patterns.
We began to see a recovery during the second half of 2016 and saw notable strength in the mobile communication market. These factors contributed to the return of our normal seasonal revenue patterns in 2016.
We believe that we have included all adjustments, consisting only of normal recurring adjustments necessary for a fair statement of our selected quarterly data. You should read our selected quarterly data in conjunction with our Consolidated Financial Statements and the related notes, included in Part II, Item 8 of this Annual Report on Form 10-K.
On December 30, 2015, we increased our ownership in J-Devices from
65.7%
to
100%
through the exercise of existing options. As a result, our accounting for J-Devices changed from the equity method to the consolidation method effective at the time of acquisition. We recognized a net loss of
$13.5 million
in other (income) expense, net resulting from a loss of
$29.6 million
related to the release of our interest in J-Devices' accumulated foreign currency translation adjustments, which was partially offset by a gain of
$16.1 million
related to the step-up of fair value of our previous investments in J-Devices.
The calculation of basic and diluted per share amounts for each quarter is based on the weighted-average shares outstanding for that period; consequently, the sum of the quarters may not necessarily be equal to the full year basic and diluted net income per share.
43
|
For the Quarter Ended
|
|||||||||||||||||||||||||||||||
|
Dec. 31, 2016
|
Sept. 30, 2016
|
June 30, 2016
|
Mar. 31, 2016
|
Dec. 31, 2015
(a)
|
Sept. 30, 2015
(a)
|
June 30, 2015
(a)
|
Mar. 31, 2015
(a)
|
||||||||||||||||||||||||
|
(In thousands, except per share data)
|
|||||||||||||||||||||||||||||||
|
Net sales
|
$
|
1,021,613
|
|
$
|
1,086,014
|
|
$
|
917,326
|
|
$
|
868,682
|
|
$
|
670,644
|
|
$
|
734,362
|
|
$
|
736,722
|
|
$
|
742,875
|
|
|||||||
|
Gross profit
|
227,187
|
|
213,800
|
|
131,606
|
|
122,884
|
|
102,620
|
|
126,600
|
|
115,098
|
|
134,947
|
|
|||||||||||||||
|
Operating income
|
126,689
|
|
114,615
|
|
30,542
|
|
22,094
|
|
20,922
|
|
51,295
|
|
38,643
|
|
53,979
|
|
|||||||||||||||
|
Loss on debt retirement, net
|
—
|
|
—
|
|
—
|
|
—
|
|
—
|
|
—
|
|
9,349
|
|
211
|
|
|||||||||||||||
|
Income tax expense
|
18,534
|
|
24,086
|
|
3,360
|
|
1,873
|
|
837
|
|
16,568
|
|
4,631
|
|
5,999
|
|
|||||||||||||||
|
Equity in earnings of J-Devices
|
—
|
|
—
|
|
—
|
|
—
|
|
3,429
|
|
1,217
|
|
5,315
|
|
4,055
|
|
|||||||||||||||
|
Net income (loss)
|
101,202
|
|
61,141
|
|
5,366
|
|
(405
|
)
|
(10,153
|
)
|
28,582
|
|
7,950
|
|
27,514
|
|
|||||||||||||||
|
Net income (loss) attributable to Amkor
|
100,263
|
|
60,089
|
|
4,713
|
|
(875
|
)
|
(10,562
|
)
|
27,735
|
|
7,327
|
|
26,598
|
|
|||||||||||||||
|
Net income (loss) attributable to Amkor per common share:
|
|||||||||||||||||||||||||||||||
|
Basic
|
$
|
0.42
|
|
$
|
0.25
|
|
$
|
0.02
|
|
$
|
—
|
|
$
|
(0.04
|
)
|
$
|
0.12
|
|
$
|
0.03
|
|
$
|
0.11
|
|
|||||||
|
Diluted
|
$
|
0.42
|
|
$
|
0.25
|
|
$
|
0.02
|
|
$
|
—
|
|
$
|
(0.04
|
)
|
$
|
0.12
|
|
$
|
0.03
|
|
$
|
0.11
|
|
|||||||
|
(a)
|
In the second quarter of 2016, we identified an error in the provision for income taxes in the financial statements for J-Devices for the periods beginning in 2012 through the fourth quarter of 2015. We have revised our previously issued consolidated financial statements to correct our equity in earnings for J-Devices during the impacted periods. See
Note 1
and
Note 19
to our Consolidated Financial Statements included in Part II, Item 8 of this Annual Report on Form 10-K for more information.
|
Liquidity and Capital Resources
We assess our liquidity based on our current expectations regarding sales, operating expenses, capital spending, debt service requirements and other funding needs. Based on this assessment, we believe that our cash flow from operating activities, together with existing cash and cash equivalents and availability under our credit facilities, will be sufficient to fund our working capital, capital expenditure, debt service and other financial requirements for at least the next twelve months. Our liquidity is affected by, among other things, volatility in the global economy and credit markets, the performance of our business, our capital expenditure levels, other uses of our cash including any purchases of stock under our stock repurchase program, any acquisitions or investments in joint ventures and our ability to either repay debt out of operating cash flow or refinance it at or prior to maturity with the proceeds of debt or equity offerings. There can be no assurance that we will generate the necessary net income or operating cash flows, or be able to borrow sufficient funds, to meet the funding needs of our business beyond the next twelve months due to a variety of factors, including the cyclical nature of the semiconductor industry and other factors discussed in Part I, Item 1A of this Annual Report on Form 10-K.
Our primary source of cash and the source of funds for our operations are cash flows from operations, current cash and cash equivalents, borrowings under available credit facilities and proceeds from any additional debt or equity financings. As of
December 31, 2016
, we had cash and cash equivalents of
$549.5 million
. Included in our cash balance as of
December 31, 2016
, is
$401.6 million
held offshore by our foreign subsidiaries. We have the ability to access cash held offshore by our foreign subsidiaries primarily through the repayment of intercompany debt facilities. Consequently, we would not expect to incur a significant amount of income tax if we were to remit cash currently held offshore to the U.S. through these facilities. If we were to distribute this offshore cash to the U.S. as dividends from our foreign subsidiaries, we would be subject to withholding taxes and income taxes of approximately $23.6 million.
As of
December 31, 2016
, we had availability of
$199.5 million
under our
$200.0 million
first lien senior secured revolving credit facility. The borrowing base for the revolving credit facility is limited to the amount of our eligible accounts receivable which was
$217.8 million
as of
December 31, 2016
. Our foreign subsidiaries had
$119.0 million
available to be drawn under secured revolving credit facilities and
$118.7 million
available to be borrowed under secured term loan credit facilities for working capital purposes and capital expenditures. In January 2017, we borrowed $50.0 million under our term loan due December 2019.
44
As of
December 31, 2016
, we had
$1,474.8 million
of debt. Our scheduled principal repayments on debt include
$35.2 million
due in
2017
,
$126.5 million
due in
2018
,
$135.0 million
due in
2019
,
$256.0 million
due in
2020
,
$400.0 million
due in
2021
and
$525.0 million
due thereafter. We were in compliance with all of our debt covenants at
December 31, 2016
, and we expect to remain in compliance with these covenants for at least the next twelve months.
In certain foreign locations, we use non-recourse factoring arrangements with third party financial institutions to manage our working capital and cash flows. Under this program, we sell receivables to a financial institution for cash at a discount to the face amount. Available capacity under these programs is dependent on the level of our trade accounts receivable eligible to be sold, the financial institutions' willingness to purchase such receivables and the limits provided by the financial institutions. As such, these factoring arrangements can be reduced or eliminated at any time due to market conditions and changes in the credit worthiness of customers. For the year ended
December 31, 2016
and
2015
, we sold accounts receivable totaling
$574.1 million
and
$323.5 million
, respectively, for a discount, plus fees, of
$2.5 million
and
$1.5 million
in 2016 and 2015, respectively. At
December 31, 2016
and
2015
, there were outstanding receivables of
$184.6 million
and
$141.9 million
, respectively, which had been sold to financial institutions under these arrangements.
In order to reduce our debt and future cash interest payments, we may from time to time repurchase our outstanding notes for cash or exchange shares of our common stock for our outstanding notes. Any such transaction may be made in the open market, through privately negotiated transactions or otherwise and is subject to the terms of our indentures and other debt agreements, market conditions and other factors.
Certain debt agreements have restrictions on dividend payments and the repurchase of stock and subordinated securities. These restrictions are determined in part by calculations based upon cumulative net income. We have never paid a dividend to our stockholders, and we do not have any present plans for doing so. From time to time, Amkor Technology, Inc. also guarantees certain debt of our subsidiaries.
Our subsidiary in Korea maintains an unfunded severance plan that covers certain employees that were employed prior to August 1, 2015. As of
December 31, 2016
, the severance liability was
$136.2 million
. For service periods subsequent to August 1, 2015, employees participate in either a defined benefit pension plan or a defined contribution pension plan.
In January 2015, we settled our patent license litigation with Tessera. Under the terms of the settlement, Amkor agreed to pay Tessera a total of
$155.0 million
in 16 equal quarterly recurring payments commencing in the first quarter of 2015 and continuing through the fourth quarter of 2018. As of
December 31, 2016
, we owe
$77.5 million
to Tessera.
In April 2016, our Kumamoto factory was damaged by the earthquakes in Japan. While production was restored at Kumamoto in the second quarter, our sales in the second quarter were reduced by approximately $15 million due to the temporary disruption in operations. In 2016, we incurred
$20.0 million
of earthquake related costs for damaged inventory, buildings and equipment. We received insurance proceeds of
$26.9 million
for property damage and business interruption losses, which was recognized as a reduction to cost of sales.
We operate in a capital intensive industry. Servicing our current and future customers may require that we incur significant operating expenses and make significant investments in equipment and facilities, which are generally made in advance of the related revenues and without firm customer commitments.
Our Board of Directors previously authorized the repurchase of up to
$300.0 million
of our common stock, exclusive of any fees, commissions or other expenses. At
December 31, 2016
, approximately
$91.6 million
was available to repurchase common stock pursuant to the stock repurchase program. The purchase of stock may be made in the open market or through privately negotiated transactions. The timing, manner, price and amount of any repurchases will be determined by us at our discretion and will depend upon a variety of factors including economic and market conditions, the cash needs and investment opportunities for the business, the current market price of our stock, applicable legal requirements and other factors. We have not purchased any stock under the plan since 2012.
45
Investments
We make significant capital expenditures in order to service the demand of our customers, which is primarily focused on investments in advanced packaging and test equipment. In
2016
, our capital expenditures totaled
$650.0 million
or approximately
16.7%
of net sales, including
$169.6 million
for our new K5 facility in Korea.
We expect that our
2017
capital expenditures will be approximately
$500 million
. Ultimately, the amount of our
2017
capital expenditures will depend on several factors including, among others, the timing and implementation of any capital projects under review, the performance of our business, economic and market conditions, the cash needs and investment opportunities for the business, the need for replacement or additional capacity to service anticipated customer demand and the availability of cash flows from operations or financing.
In addition, we are subject to risks associated with our capital expenditures, including those discussed in Part I, Item 1A of this Annual Report on Form 10-K under the caption "
Capital Expenditures - We Make Substantial Investments in Equipment and Facilities To Support the Demand Of Our Customers, Which May Adversely Affect Our Business If the Demand Of Our Customers Does Not Develop As We Expect or Is Adversely Affected.
"
Cash Flows
Net cash provided by (used in) operating, investing and financing activities for each of the three years ended
December 31, 2016
was as follows:
|
For the Year Ended December 31,
|
|||||||||||
|
2016
|
2015
|
2014
|
|||||||||
|
(In thousands)
|
|||||||||||
|
Operating activities
|
$
|
729,402
|
|
$
|
584,975
|
|
$
|
614,666
|
|
||
|
Investing activities
|
(589,427
|
)
|
(514,990
|
)
|
(694,589
|
)
|
|||||
|
Financing activities
|
(112,179
|
)
|
2,613
|
|
(80,752
|
)
|
|||||
Operating activities:
Our cash flows provided by operating activities for the year ended
December 31, 2016
,
increased
by
$144.4 million
compared to the year ended
December 31, 2015
. J-Devices contributed
$120.0 million
of operating cash flow for the year ended
December 31, 2016
. Excluding J-Devices, our operating cash flow increased in 2016 primarily due to higher sales and gross profit. Our cash provided by operating activities for the year ended
December 31, 2015
,
decreased
by
$29.7 million
compared to the year ended
December 31, 2014
. The decrease was primarily due to settlement payments for patent license litigation.
Investing activities:
Our cash flows used in investing activities are principally for payments for property, plant and equipment, which increased compared to the prior year primarily due to payments for construction of K5 and capital expenditures at J-Devices, our newly consolidated subsidiary. The net cash used in investing activities for the year ended December 31, 2015, included payment for our incremental investment in J-Devices in January 2015, partially offset by net cash received on acquisition of J-Devices in December 2015 and the receipt of the final payment for the sale of our subsidiary to J-Devices.
Financing activities:
The net cash
used in
financing activities for the year ended
December 31, 2016
was primarily driven by repayments, offset by borrowings in Japan and Korea, as well as the repayment of our revolving credit facility. The net cash provided by financing activities during
2015
primarily resulted from new borrowings, offset by the repayment of our 7.375% Senior Notes due 2018 and other borrowings.
We provide the following supplemental data to assist our investors and analysts in understanding our liquidity and capital resources. We define free cash flow as net cash provided by operating activities, less payments for property, plant and equipment, plus proceeds from the sale of and insurance recovery for property, plant and equipment. Free cash flow is not defined by U.S. GAAP. We believe free cash flow to be relevant and useful information to our investors because it provides them with additional information in assessing our liquidity, capital resources and financial operating results. Our management uses free cash flow in evaluating our liquidity, our ability to service debt and our ability to fund capital expenditures.
46
However, free cash flow has certain limitations, including that it does not represent the residual cash flow available for discretionary expenditures since other, non-discretionary expenditures, such as mandatory debt service, are not deducted from the measure. The amount of mandatory versus discretionary expenditures can vary significantly between periods. This measure should be considered in addition to, and not as a substitute for, or superior to, other measures of liquidity or financial performance prepared in accordance with U.S. GAAP, such as net cash provided by operating activities. Furthermore, our definition of free cash flow may not be comparable to similarly titled measures reported by other companies.
|
For the Year Ended December 31,
|
|||||||||||
|
2016
|
2015
|
2014
|
|||||||||
|
(In thousands)
|
|||||||||||
|
Net cash provided by operating activities
|
$
|
729,402
|
|
$
|
584,975
|
|
$
|
614,666
|
|
||
|
Payments for property, plant and equipment
|
(650,038
|
)
|
(537,975
|
)
|
(681,120
|
)
|
|||||
|
Proceeds from sale of and insurance recovery for property, plant and equipment
|
60,801
|
|
6,945
|
|
2,815
|
|
|||||
|
Free cash flow
|
$
|
140,165
|
|
$
|
53,945
|
|
$
|
(63,639
|
)
|
||
Contractual Obligations
The following table summarizes our contractual obligations at
December 31, 2016
, and the effect such obligations are expected to have on our liquidity and cash flow in future periods.
|
Payments Due for Year Ending December 31,
|
|||||||||||||||||||||||||||
|
Total
|
2017
|
2018
|
2019
|
2020
|
2021
|
Thereafter
|
|||||||||||||||||||||
|
(In thousands)
|
|||||||||||||||||||||||||||
|
Total debt
|
$
|
1,477,661
|
|
$
|
35,192
|
|
$
|
126,498
|
|
$
|
135,000
|
|
$
|
256,000
|
|
$
|
400,000
|
|
$
|
524,971
|
|
||||||
|
Scheduled interest payment obligations (1)
|
367,385
|
|
77,409
|
|
74,701
|
|
71,868
|
|
63,223
|
|
46,717
|
|
33,467
|
|
|||||||||||||
|
Purchase obligations (2)
|
124,455
|
|
107,777
|
|
5,731
|
|
2,088
|
|
1,727
|
|
1,469
|
|
5,663
|
|
|||||||||||||
|
Operating lease obligations
|
59,726
|
|
20,079
|
|
11,893
|
|
9,783
|
|
5,321
|
|
4,054
|
|
8,596
|
|
|||||||||||||
|
Severance obligations (3)
|
136,214
|
|
14,053
|
|
12,599
|
|
11,298
|
|
10,151
|
|
9,105
|
|
79,008
|
|
|||||||||||||
|
Settlement payments (4)
|
77,500
|
|
38,750
|
|
38,750
|
|
—
|
|
—
|
|
—
|
|
—
|
|
|||||||||||||
|
Total contractual obligations
|
$
|
2,242,941
|
|
$
|
293,260
|
|
$
|
270,172
|
|
$
|
230,037
|
|
$
|
336,422
|
|
$
|
461,345
|
|
$
|
651,705
|
|
||||||
|
(1)
|
Scheduled interest payment obligations were calculated using stated coupon rates for fixed rate debt and interest rates applicable at
December 31, 2016
, for variable rate debt.
|
|
(2)
|
Represents off-balance sheet purchase obligations for capital expenditures and long-term supply contracts outstanding at
December 31, 2016
.
|
|
(3)
|
Represents estimated benefit payments for our Korean subsidiary severance plan.
|
|
(4)
|
Represents settlement payments for patent license litigation. At December 31, 2016, the total obligation is
$77.5 million
of which
$35.3 million
is a current liability,
$37.8 million
is a non-current liability and
$4.4 million
will be imputed into interest over time.
|
In addition to the obligations identified in the table above, other non-current liabilities recorded in our Consolidated Balance Sheet at
December 31, 2016
, include:
|
•
|
$39.9 million
of net foreign pension plan obligations, for which the timing and actual amount of impact on our future cash flow is uncertain.
|
|
•
|
$21.3 million
net liability associated with unrecognized tax benefits. Due to the uncertainty regarding the amount and the timing of any future cash outflows associated with our unrecognized tax benefits, we are unable to reasonably estimate the amount and period of ultimate settlement, if any, with the various taxing authorities.
|
47
Off-Balance Sheet Arrangements
As of
December 31, 2016
, we had no off-balance sheet guarantees or other off-balance sheet arrangements as defined in Item 303(a)(4)(ii) of SEC Regulation S-K.
Other Contingencies
We refer you to
Note 17
to our Consolidated Financial Statements in Part II, Item 8 of this Annual Report on Form 10-K for a discussion of our contingencies related to litigation and other legal matters. If an unfavorable ruling were to occur in these matters, there exists the possibility of a material adverse impact on our business, liquidity, results of operations, financial position and cash flows in the period in which the ruling occurs. The potential impact from legal proceedings on our business, liquidity, results of operations, financial position and cash flows could change in the future.
Critical Accounting Policies and Use of Estimates
We have identified the policies below as critical to our business operations and the understanding of our results of operations. A summary of our significant accounting policies used in the preparation of our Consolidated Financial Statements appears in
Note 1
to our Consolidated Financial Statements included in Part II, Item 8 of this Annual Report on Form 10-K. Our preparation of this Annual Report on Form 10-K requires us to make estimates and assumptions that affect the reported amount of assets and liabilities, disclosure of contingent assets and liabilities at the date of our financial statements and the reported amounts of revenue and expenses during the reporting period. There can be no assurance that actual results will not differ from those estimates.
We believe the following critical accounting estimates and policies, which have been reviewed with the Audit Committee of our Board of Directors, affect our more significant judgments and estimates used in the preparation of our Consolidated Financial Statements.
Acquisitions.
We account for businesses we acquire using the acquisition method of accounting and record the underlying net assets at their respective acquisition-date fair values. The accounting for acquisitions requires us to make significant estimates and assumptions, including those with respect to future cash flows, discount rates and asset lives, and therefore requires considerable judgment. These determinations affect the amount of depreciation and amortization expense recognized in future periods. Our estimates of fair value are based upon assumptions believed to be reasonable; however, they are inherently uncertain and unpredictable.
Revenue Recognition.
We recognize revenue from our packaging and test services, net of value-added or other similar taxes, when there is evidence of an arrangement, delivery has occurred or services have been rendered, fees are fixed or determinable and collectibility is reasonably assured. Generally, these criteria are met and revenue is recognized upon shipment or, in some cases, customer acceptance. If the revenue recognition criteria are not met, we defer the revenue. Deferred revenue generally results from two types of transactions: contractual invoicing at interim points in the packaging and test process prior to shipment of the finished product and customer advances for supply agreements with customers where we commit capacity in exchange for customer prepayment of services. These prepayments are deferred and recorded as customer advances within accrued expenses and other non-current liabilities.
We generally do not take ownership of customer-supplied semiconductor wafers. Title and risk of loss remains with the customer for these materials at all times. Accordingly, the cost of the customer-supplied materials is not included in our Consolidated Financial Statements.
48
An allowance for sales credits is recorded as a reduction to sales and accounts receivable during the period of sale such that accounts receivable is reported at its estimated net realizable value. The allowance for sales credits is an estimate of the future credits we will issue for billing adjustments primarily for invoicing corrections and miscellaneous customer claims and is estimated based upon recent credit issuance, historical experience and specific identification of known or expected sales credits at the end of the reporting period. Additionally, provisions are made for doubtful accounts when there is doubt as to the collectibility of accounts receivable. The allowance for doubtful accounts is recorded as bad debt expense and is classified as selling, general and administrative expense. The allowance for doubtful accounts is based upon specific identification of doubtful accounts considering the age of the receivable balance, the customer’s historical payment history and current credit worthiness as well as specific identification of any known or expected collectibility issues. Historically, our allowance for doubtful accounts has been immaterial.
Income Taxes.
We operate in and file income tax returns in various U.S. and non-U.S. jurisdictions which are subject to examination by tax authorities. The tax returns for years where the statute of limitations remains open in all jurisdictions in which we do business are subject to change upon examination. We believe that we have estimated and provided adequate accruals for potential additional taxes and related interest expense that may ultimately result from such examinations. We believe that any additional taxes or related interest over the amounts accrued will not have a material effect on our financial condition, results of operations or cash flows. However, resolution of these matters involves uncertainties and there can be no assurance that the outcomes will be favorable. In addition, changes in the mix of income from our foreign subsidiaries, expiration of tax holidays or changes in tax laws or regulations could result in increased effective tax rates in the future.
Additionally, we monitor on an ongoing basis our ability to utilize our deferred tax assets and whether there is a need for a related valuation allowance. In evaluating our ability to recover our deferred tax assets in the jurisdictions from which they arise, we consider all available positive and negative evidence, including scheduled reversals of deferred tax liabilities, projected future taxable income, tax planning strategies and results of recent operations. For most of our foreign deferred tax assets, we consider it more likely than not that we will have sufficient taxable income to allow us to realize these deferred tax assets. However, in the event taxable income falls short of current expectations, we may need to establish a valuation allowance against such deferred tax assets. We have valuation allowances on select deferred tax assets in certain foreign jurisdictions. We also maintain a valuation allowance on all of our U.S. net deferred tax assets, including our U.S. net operating loss carryforwards. Such valuation allowances are released as the related tax benefits are realized or when sufficient evidence exists to conclude that it is more likely than not that the deferred tax assets will be realized.
Valuation of Inventory.
We order raw materials based on customers’ forecasted demand. If our customers change their forecasted requirements and we are unable to cancel our raw materials order or if our vendors require that we order a minimum quantity that exceeds the current forecasted demand, we will experience a build-up in raw material inventory. We will either seek to recover the cost of the materials from our customers or utilize the inventory in production. However, we may not be successful in recovering the cost from our customers or be able to use the inventory in production and, accordingly, if we believe that it is probable that we will not be able to recover such costs, we reduce the carrying value of our inventory. Additionally, we reduce the carrying value of our inventories for the cost of inventory we estimate is excess and obsolete based on the age of our inventories. When a determination is made that the inventory will not be utilized in production or is not saleable, it is written-off.
Inventories are stated at the lower of cost or market (net realizable value). Cost is principally determined by standard cost or the weighted moving average method, both of which approximate actual cost. For inventory valued using the standard cost method, we review and set our standard costs as needed, but at a minimum on an annual basis.
Valuation of Long-lived Assets.
We review long-lived assets, which include property, plant and equipment and goodwill, for impairment whenever events or changes in circumstances indicate that the carrying amount may not be recoverable. Factors we consider important which could trigger an impairment review include the following:
|
•
|
significant under-performance relative to expected historical or projected future operating results;
|
|
•
|
significant changes in the manner of our use of the asset;
|
|
•
|
significant negative industry or economic trends and
|
|
•
|
our market capitalization relative to net book value.
|
49
Recoverability of a long-lived asset group to be held and used in operations is measured by a comparison of the carrying amount to the sum of the undiscounted cash flows expected to result from the use and eventual disposition of the asset group. If such asset group is considered to be impaired, the impairment loss is measured as the amount by which the carrying amount of the asset group exceeds its fair value. Long-lived assets to be disposed of are carried at the lower of cost or fair value less the costs of disposal.
We review goodwill for impairment annually during the fourth quarter of each year and whenever events or changes in circumstances indicate that an impairment may exist. Impairment losses are recorded when the carrying amount of goodwill exceeds its implied fair value.
Legal Contingencies.
We may be subject to certain legal proceedings, lawsuits and other claims. We accrue for a loss contingency, including legal proceedings, lawsuits, pending claims and other legal matters, when we conclude that the likelihood of a loss is probable and the amount of the loss can be reasonably estimated. When the reasonable estimate of the loss is within the range of amounts, and no amount in the range constitutes a better estimate than any other amount, we accrue for the amount at the low end of the range. We adjust our accruals from time to time as we receive additional information, but the loss we incur may be significantly greater than or less than the amount we have accrued. We disclose loss contingencies if we believe they are material and there is at least a reasonable possibility that a loss has been incurred.
Our assessment of required reserves may change in the future due to new developments in each matter. The present legislative and litigation environment is substantially uncertain, and it is possible that our liquidity, results of operations, financial position and cash flows could be materially and adversely affected by an unfavorable outcome or settlement of pending litigation and other claims.
Recently Adopted and Recently Issued Standards
For information regarding recently adopted and recently issued accounting standards, see
Note 2
to our Consolidated Financial Statements included in Part II, Item 8 of this Annual Report on Form 10-K.
|
Item 7A.
|
Quantitative and Qualitative Disclosures about Market Risk
|
Market Risk Sensitivity
We are exposed to market risks, primarily related to foreign currency and interest rate fluctuations. In the normal course of business, we employ established policies and procedures to manage the exposure to fluctuations in foreign currency values and changes in interest rates. Our use of derivative instruments, including forward exchange contracts, has been historically insignificant; however, we continue to evaluate the use of hedging instruments to manage currency and other risks.
Foreign Currency Risk
In order to reduce our exposure to foreign currency gains and losses, we generally use natural hedging techniques to reduce foreign currency rate risk. The U.S. dollar is our reporting and functional currency and the functional currency for our subsidiaries, except for J-Devices, where the Japanese Yen is the functional currency.
We have foreign currency exchange rate risk associated with the remeasurement of monetary assets and liabilities on our Consolidated Balance Sheets that are denominated in currencies other than the functional currency. We performed a sensitivity analysis of our foreign currency exposure as of
December 31, 2016
, to assess the potential impact of fluctuations in exchange rates for all foreign denominated assets and liabilities. Assuming that all foreign currencies appreciated 10% against the U.S. dollar as of
December 31, 2016
, our income before taxes would have been approximately $17 million lower, due to the remeasurement of monetary assets and liabilities. We have a significant net monetary liability at our subsidiary in Korea, principally driven by our Korean severance plan.
In addition, we have foreign currency exchange rate exposure on our results of operations. For the year ended
December 31, 2016
, approximately 72% of our net sales were denominated in U.S. dollars. Our remaining net sales were principally denominated in Japanese Yen for local country sales. For the year ended
December 31, 2016
, approximately 50% of our
50
cost of sales and operating expenses were denominated in U.S. dollars and were largely for raw materials and depreciation. The remaining portion of our cost of sales and operating expenses was principally denominated in the Asian currencies where our production facilities are located and largely consisted of labor. To the extent that the U.S. dollar weakens against these Asian based currencies, similar foreign currency denominated income and expenses in the future will result in higher sales, higher cost of sales and operating expenses, with cost of sales and operating expenses having the greater impact on our financial results. Similarly, our sales, cost of sales and operating expenses will decrease if the U.S. dollar strengthens against these foreign currencies. We performed a sensitivity analysis of our foreign currency exposure as of
December 31, 2016
, to assess the potential impact of fluctuations in exchange rates for all foreign denominated sales and operating expenses. Assuming that all foreign currencies appreciated 10% against the U.S. dollar, our operating income for the year ended
December 31, 2016
would have been approximately $78 million lower.
There are inherent limitations in the sensitivity analysis presented, primarily the assumption that foreign exchange rate movements across multiple jurisdictions would change instantaneously in an equal fashion. As a result, the analysis is unable to reflect the potential effects of more complex market or other changes that could arise which may positively or negatively affect our results of operations.
Our Consolidated Financial Statements are impacted by changes in exchange rates at entities where the local currency is the functional currency. The effect of foreign exchange rate translation for these entities for the years ended
December 31, 2016
and
2015
, was a net foreign translation loss of
$5.8 million
and
$0.5 million
, respectively, and was recognized as an adjustment to equity through other comprehensive income.
Interest Rate Risk
We have interest rate risk with respect to our debt. Our fixed and variable rate debt includes foreign borrowings and revolving credit facilities. Our fixed rate debt also consists of senior notes. Changes in interest rates have different impacts on the fixed and variable rate portions of our debt portfolio. A change in interest rates on the fixed portion of the debt portfolio impacts the fair value of the debt instrument but has no impact on interest expense or cash flows. A change in interest rates on the variable portion of the debt portfolio impacts the interest incurred and cash flows but does not generally impact the fair value of the instrument.
The table below presents the interest rates, maturities and fair value of our fixed and variable rate debt as of
December 31, 2016
.
|
2017
|
2018
|
2019
|
2020
|
2021
|
Thereafter
|
Total
|
Fair Value
|
||||||||||||||||||||||||
|
($ in thousands)
|
|||||||||||||||||||||||||||||||
|
Debt
|
|||||||||||||||||||||||||||||||
|
Fixed rate debt
|
$
|
12,962
|
|
$
|
6,498
|
|
$
|
—
|
|
$
|
—
|
|
$
|
400,000
|
|
$
|
524,971
|
|
$
|
944,431
|
|
$
|
974,207
|
|
|||||||
|
Average interest rate
|
0.5
|
%
|
0.5
|
%
|
—
|
%
|
—
|
%
|
6.6
|
%
|
6.4
|
%
|
6.4
|
%
|
|||||||||||||||||
|
Variable rate debt
|
$
|
22,230
|
|
$
|
120,000
|
|
$
|
135,000
|
|
$
|
256,000
|
|
$
|
—
|
|
$
|
—
|
|
$
|
533,230
|
|
$
|
532,351
|
|
|||||||
|
Average interest rate
|
0.3
|
%
|
3.5
|
%
|
3.6
|
%
|
3.3
|
%
|
—
|
%
|
—
|
%
|
3.3
|
%
|
|||||||||||||||||
|
Total debt
|
$
|
35,192
|
|
$
|
126,498
|
|
$
|
135,000
|
|
$
|
256,000
|
|
$
|
400,000
|
|
$
|
524,971
|
|
$
|
1,477,661
|
|
$
|
1,506,558
|
|
|||||||
For information regarding the fair value of our long-term debt, see
Note 16
to our Consolidated Financial Statements in Part II, Item 8 of this Annual Report on Form 10-K.
51
|
Item 8.
|
Financial Statements and Supplementary Data
|
We present the information required by Item 8 of Form 10-K here in the following order:
|
Page
|
|
52
REPORT OF INDEPENDENT REGISTERED PUBLIC ACCOUNTING FIRM
To the Board of Directors and Stockholders of Amkor Technology, Inc.
In our opinion, the consolidated financial statements listed in the accompanying index present fairly, in all material respects, the financial position of Amkor Technology, Inc. and its subsidiaries at
December 31, 2016
and
2015
, and the results of their operations and their cash flows for each of the three years in the period ended
December 31, 2016
in conformity with accounting principles generally accepted in the United States of America. In addition, in our opinion, the financial statement schedule listed in the accompanying index presents fairly, in all material respects, the information set forth therein when read in conjunction with the related consolidated financial statements. Also in our opinion, the Company maintained, in all material respects, effective internal control over financial reporting as of
December 31, 2016
, based on criteria established in Internal Control - Integrated Framework (2013) issued by the Committee of Sponsoring Organizations of the Treadway Commission (COSO). The Company’s management is responsible for these financial statements and financial statement schedule, for maintaining effective internal control over financial reporting and for its assessment of the effectiveness of internal control over financial reporting, included in Management’s Report on Internal Control Over Financial Reporting appearing under Item 9A. Our responsibility is to express opinions on these financial statements, on the financial statement schedule, and on the Company’s internal control over financial reporting based on our integrated audits. We conducted our audits in accordance with the standards of the Public Company Accounting Oversight Board (United States). Those standards require that we plan and perform the audits to obtain reasonable assurance about whether the financial statements are free of material misstatement and whether effective internal control over financial reporting was maintained in all material respects. Our audits of the financial statements included examining, on a test basis, evidence supporting the amounts and disclosures in the financial statements, assessing the accounting principles used and significant estimates made by management, and evaluating the overall financial statement presentation. Our audit of internal control over financial reporting included obtaining an understanding of internal control over financial reporting, assessing the risk that a material weakness exists, and testing and evaluating the design and operating effectiveness of internal control based on the assessed risk. Our audits also included performing such other procedures as we considered necessary in the circumstances. We believe that our audits provide a reasonable basis for our opinions.
A company’s internal control over financial reporting is a process designed to provide reasonable assurance regarding the reliability of financial reporting and the preparation of financial statements for external purposes in accordance with generally accepted accounting principles. A company’s internal control over financial reporting includes those policies and procedures that (i) pertain to the maintenance of records that, in reasonable detail, accurately and fairly reflect the transactions and dispositions of the assets of the company; (ii) provide reasonable assurance that transactions are recorded as necessary to permit preparation of financial statements in accordance with generally accepted accounting principles, and that receipts and expenditures of the company are being made only in accordance with authorizations of management and directors of the company; and (iii) provide reasonable assurance regarding prevention or timely detection of unauthorized acquisition, use, or disposition of the company’s assets that could have a material effect on the financial statements.
Because of its inherent limitations, internal control over financial reporting may not prevent or detect misstatements. Also, projections of any evaluation of effectiveness to future periods are subject to the risk that controls may become inadequate because of changes in conditions, or that the degree of compliance with the policies or procedures may deteriorate.
/s/ PricewaterhouseCoopers LLP
Phoenix, Arizona
February 24, 2017
53
|
For the Year Ended December 31,
|
|||||||||||
|
2016
|
2015
|
2014
|
|||||||||
|
(In thousands, except per share data)
|
|||||||||||
|
Net sales
|
$
|
3,893,635
|
|
$
|
2,884,603
|
|
$
|
3,129,440
|
|
||
|
Cost of sales
|
3,198,158
|
|
2,405,338
|
|
2,576,618
|
|
|||||
|
Gross profit
|
695,477
|
|
479,265
|
|
552,822
|
|
|||||
|
Selling, general and administrative
|
284,331
|
|
232,409
|
|
254,498
|
|
|||||
|
Research and development
|
117,206
|
|
82,017
|
|
76,864
|
|
|||||
|
Total operating expenses
|
401,537
|
|
314,426
|
|
331,362
|
|
|||||
|
Operating income
|
293,940
|
|
164,839
|
|
221,460
|
|
|||||
|
Interest expense
|
79,668
|
|
81,407
|
|
104,956
|
|
|||||
|
Interest expense, related party
|
4,969
|
|
4,969
|
|
4,969
|
|
|||||
|
Other (income) expense, net
|
(5,854
|
)
|
10,551
|
|
(24,543
|
)
|
|||||
|
Total other expense, net
|
78,783
|
|
96,927
|
|
85,382
|
|
|||||
|
Income before taxes and equity in earnings of unconsolidated affiliate
|
215,157
|
|
67,912
|
|
136,078
|
|
|||||
|
Income tax expense
|
47,853
|
|
28,035
|
|
33,845
|
|
|||||
|
Income before equity in earnings of unconsolidated affiliate
|
167,304
|
|
39,877
|
|
102,233
|
|
|||||
|
Equity in earnings of J-Devices
|
—
|
|
14,016
|
|
31,007
|
|
|||||
|
Net income
|
167,304
|
|
53,893
|
|
133,240
|
|
|||||
|
Net income attributable to noncontrolling interests
|
(3,114
|
)
|
(2,795
|
)
|
(3,501
|
)
|
|||||
|
Net income attributable to Amkor
|
$
|
164,190
|
|
|
$
|
51,098
|
|
$
|
129,739
|
|
|
|
Net income attributable to Amkor per common share:
|
|||||||||||
|
Basic
|
$
|
0.69
|
|
$
|
0.22
|
|
$
|
0.56
|
|
||
|
Diluted
|
$
|
0.69
|
|
$
|
0.22
|
|
$
|
0.55
|
|
||
|
Shares used in computing per common share amounts:
|
|||||||||||
|
Basic
|
237,416
|
|
236,850
|
|
230,710
|
|
|||||
|
Diluted
|
238,034
|
|
237,170
|
|
236,731
|
|
|||||
The accompanying notes are an integral part of these statements.
54
|
For the Year Ended December 31,
|
|||||||||||
|
2016
|
2015
|
2014
|
|||||||||
|
(In thousands)
|
|||||||||||
|
Net income
|
$
|
167,304
|
|
$
|
53,893
|
|
$
|
133,240
|
|
||
|
Other comprehensive income (loss), net of tax:
|
|||||||||||
|
Adjustments to unrealized components of defined benefit pension plans, net of tax
|
2,563
|
|
1,100
|
|
(1,512
|
)
|
|||||
|
Foreign currency translation adjustment
|
5,783
|
|
(146
|
)
|
(11,964
|
)
|
|||||
|
Equity interest in J-Devices' other comprehensive income (loss), net of tax
|
—
|
|
29,433
|
|
(18,844
|
)
|
|||||
|
Total other comprehensive income (loss)
|
8,346
|
|
30,387
|
|
(32,320
|
)
|
|||||
|
Comprehensive income
|
175,650
|
|
84,280
|
|
100,920
|
|
|||||
|
Comprehensive income attributable to noncontrolling interests
|
(3,114
|
)
|
(2,795
|
)
|
(3,501
|
)
|
|||||
|
Comprehensive income attributable to Amkor
|
$
|
172,536
|
|
$
|
81,485
|
|
$
|
97,419
|
|
||
The accompanying notes are an integral part of these statements.
55
|
December 31,
|
|||||||
|
2016
|
2015
|
||||||
|
(In thousands,
except per share data)
|
|||||||
|
ASSETS
|
|||||||
|
Current assets:
|
|||||||
|
Cash and cash equivalents
|
$
|
549,518
|
|
$
|
523,172
|
|
|
|
Restricted cash
|
2,000
|
|
2,000
|
|
|||
|
Accounts receivable, net of allowances of $9,902 and $3,158
|
563,107
|
|
526,143
|
|
|||
|
Inventories
|
267,990
|
|
238,205
|
|
|||
|
Other current assets
|
27,081
|
|
27,960
|
|
|||
|
Total current assets
|
1,409,696
|
|
1,317,480
|
|
|||
|
Property, plant and equipment, net
|
2,564,648
|
|
2,579,017
|
|
|||
|
Goodwill
|
24,122
|
|
23,409
|
|
|||
|
Restricted cash
|
3,977
|
|
2,176
|
|
|||
|
Other assets
|
89,643
|
|
104,346
|
|
|||
|
Total assets
|
$
|
4,092,086
|
|
$
|
4,026,428
|
|
|
|
LIABILITIES AND EQUITY
|
|||||||
|
Current liabilities:
|
|||||||
|
Short-term borrowings and current portion of long-term debt
|
$
|
35,192
|
|
$
|
76,770
|
|
|
|
Trade accounts payable
|
487,430
|
|
434,222
|
|
|||
|
Capital expenditures payable
|
144,370
|
|
242,980
|
|
|||
|
Accrued expenses
|
338,669
|
|
264,212
|
|
|||
|
Total current liabilities
|
1,005,661
|
|
1,018,184
|
|
|||
|
Long-term debt
|
1,364,638
|
|
1,435,269
|
|
|||
|
Long-term debt, related party
|
75,000
|
|
75,000
|
|
|||
|
Pension and severance obligations
|
166,701
|
|
167,197
|
|
|||
|
Other non-current liabilities
|
76,682
|
|
113,242
|
|
|||
|
Total liabilities
|
2,688,682
|
|
2,808,892
|
|
|||
|
Commitments and contingencies (Note 17)
|
|
|
|
|
|||
|
Amkor stockholders’ equity:
|
|||||||
|
Preferred stock, $0.001 par value, 10,000 shares authorized, designated Series A, none issued
|
—
|
|
—
|
|
|||
|
Common stock, $0.001 par value, 500,000 shares authorized, 284,479 and 282,724 shares issued, and 238,665 and 237,005 shares outstanding, in 2016 and 2015, respectively
|
284
|
|
283
|
|
|||
|
Additional paid-in capital
|
1,895,089
|
|
1,883,592
|
|
|||
|
Accumulated deficit
|
(303,557
|
)
|
(467,747
|
)
|
|||
|
Accumulated other comprehensive income (loss)
|
6,262
|
|
(2,084
|
)
|
|||
|
Treasury stock, at cost, 45,814 and 45,719 shares in 2016 and 2015, respectively
|
(214,490
|
)
|
(213,758
|
)
|
|||
|
Total Amkor stockholders’ equity
|
1,383,588
|
|
1,200,286
|
|
|||
|
Noncontrolling interests in subsidiaries
|
19,816
|
|
17,250
|
|
|||
|
Total equity
|
1,403,404
|
|
1,217,536
|
|
|||
|
Total liabilities and equity
|
$
|
4,092,086
|
|
$
|
4,026,428
|
|
|
The accompanying notes are an integral part of these statements.
56
|
Additional Paid-
In Capital
|
Accumulated
Deficit
|
Accumulated
Other
Comprehensive
Income (Loss)
|
Total Amkor
Stockholders'
Equity
|
Noncontrolling
Interest in
Subsidiaries
|
Total
Equity
|
||||||||||||||||||||||||||||||||
|
Common Stock
|
Treasury Stock
|
||||||||||||||||||||||||||||||||||||
|
Shares
|
Par Value
|
Shares
|
Cost
|
||||||||||||||||||||||||||||||||||
|
(In thousands)
|
|||||||||||||||||||||||||||||||||||||
|
Balance at December 31, 2013
|
262,109
|
|
$
|
262
|
|
$
|
1,812,530
|
|
$
|
(648,584
|
)
|
$
|
(151
|
)
|
(45,407
|
)
|
$
|
(211,449
|
)
|
$
|
952,608
|
|
$
|
11,200
|
|
$
|
963,808
|
|
|||||||||
|
Net income
|
—
|
|
—
|
|
—
|
|
129,739
|
|
—
|
|
—
|
|
—
|
|
129,739
|
|
3,501
|
|
133,240
|
|
|||||||||||||||||
|
Other comprehensive income (loss)
|
—
|
|
—
|
|
—
|
|
—
|
|
(32,320
|
)
|
—
|
|
—
|
|
(32,320
|
)
|
—
|
|
(32,320
|
)
|
|||||||||||||||||
|
Conversion of debt to common stock
|
18,632
|
|
19
|
|
56,331
|
|
—
|
|
—
|
|
—
|
|
—
|
|
56,350
|
|
—
|
|
56,350
|
|
|||||||||||||||||
|
Treasury stock acquired through surrender of shares for tax withholding
|
—
|
|
—
|
|
—
|
|
—
|
|
—
|
|
(197
|
)
|
(1,579
|
)
|
(1,579
|
)
|
—
|
|
(1,579
|
)
|
|||||||||||||||||
|
Issuance of stock through share-based compensation plans
|
1,490
|
|
1
|
|
6,249
|
|
—
|
|
—
|
|
—
|
|
—
|
|
6,250
|
|
—
|
|
6,250
|
|
|||||||||||||||||
|
Share-based compensation
|
—
|
|
—
|
|
3,700
|
|
—
|
|
—
|
|
—
|
|
—
|
|
3,700
|
|
—
|
|
3,700
|
|
|||||||||||||||||
|
Balance at December 31, 2014
|
282,231
|
|
$
|
282
|
|
$
|
1,878,810
|
|
$
|
(518,845
|
)
|
$
|
(32,471
|
)
|
(45,604
|
)
|
$
|
(213,028
|
)
|
$
|
1,114,748
|
|
$
|
14,701
|
|
$
|
1,129,449
|
|
|||||||||
|
Net income
|
—
|
|
—
|
|
—
|
|
51,098
|
|
—
|
|
—
|
|
—
|
|
51,098
|
|
2,795
|
|
53,893
|
|
|||||||||||||||||
|
Other comprehensive income (loss)
|
—
|
|
—
|
|
—
|
|
—
|
|
30,387
|
|
—
|
|
—
|
|
30,387
|
|
—
|
|
30,387
|
|
|||||||||||||||||
|
Treasury stock acquired through surrender of shares for tax withholding
|
—
|
|
—
|
|
—
|
|
—
|
|
—
|
|
(115
|
)
|
(730
|
)
|
(730
|
)
|
—
|
|
(730
|
)
|
|||||||||||||||||
|
Issuance of stock through share-based compensation plans
|
493
|
|
1
|
|
930
|
|
—
|
|
—
|
|
—
|
|
—
|
|
931
|
|
—
|
|
931
|
|
|||||||||||||||||
|
Share-based compensation
|
—
|
|
—
|
|
3,852
|
|
—
|
|
—
|
|
—
|
|
—
|
|
3,852
|
|
—
|
|
3,852
|
|
|||||||||||||||||
|
Subsidiary dividends paid to noncontrolling interest
|
—
|
|
—
|
|
—
|
|
—
|
|
—
|
|
—
|
|
—
|
|
—
|
|
(246
|
)
|
(246
|
)
|
|||||||||||||||||
|
Balance at December 31, 2015
|
282,724
|
|
$
|
283
|
|
$
|
1,883,592
|
|
$
|
(467,747
|
)
|
$
|
(2,084
|
)
|
(45,719
|
)
|
$
|
(213,758
|
)
|
$
|
1,200,286
|
|
$
|
17,250
|
|
$
|
1,217,536
|
|
|||||||||
|
Net income
|
—
|
|
—
|
|
—
|
|
164,190
|
|
—
|
|
—
|
|
—
|
|
164,190
|
|
3,114
|
|
167,304
|
|
|||||||||||||||||
|
Other comprehensive income (loss)
|
—
|
|
—
|
|
—
|
|
—
|
|
8,346
|
|
—
|
|
—
|
|
8,346
|
|
—
|
|
8,346
|
|
|||||||||||||||||
|
Treasury stock acquired through surrender of shares for tax withholding
|
—
|
|
—
|
|
—
|
|
—
|
|
—
|
|
(95
|
)
|
(732
|
)
|
(732
|
)
|
—
|
|
(732
|
)
|
|||||||||||||||||
|
Issuance of stock through share-based compensation plans
|
1,755
|
|
1
|
|
8,246
|
|
—
|
|
—
|
|
—
|
|
—
|
|
8,247
|
|
—
|
|
8,247
|
|
|||||||||||||||||
|
Share-based compensation
|
—
|
|
—
|
|
3,251
|
|
—
|
|
—
|
|
—
|
|
—
|
|
3,251
|
|
—
|
|
3,251
|
|
|||||||||||||||||
|
Subsidiary dividends paid to noncontrolling interest
|
—
|
|
—
|
|
—
|
|
—
|
|
—
|
|
—
|
|
—
|
|
—
|
|
(548
|
)
|
(548
|
)
|
|||||||||||||||||
|
Balance at December 31, 2016
|
284,479
|
|
$
|
284
|
|
$
|
1,895,089
|
|
$
|
(303,557
|
)
|
$
|
6,262
|
|
(45,814
|
)
|
$
|
(214,490
|
)
|
$
|
1,383,588
|
|
$
|
19,816
|
|
$
|
1,403,404
|
|
|||||||||
The accompanying notes are an integral part of these statements.
57
|
For the Year Ended December 31,
|
|||||||||||
|
2016
|
2015
|
2014
|
|||||||||
|
(In thousands)
|
|||||||||||
|
Cash flows from operating activities:
|
|||||||||||
|
Net income
|
$
|
167,304
|
|
$
|
53,893
|
|
$
|
133,240
|
|
||
|
Adjustments to reconcile net income to net cash provided by operating activities:
|
|||||||||||
|
Depreciation and amortization
|
555,186
|
|
494,200
|
|
464,706
|
|
|||||
|
Amortization of deferred debt issuance costs and premiums
|
1,403
|
|
1,665
|
|
2,237
|
|
|||||
|
Deferred income taxes
|
(1,746
|
)
|
(697
|
)
|
(17,190
|
)
|
|||||
|
Equity in earnings of unconsolidated affiliate
|
—
|
|
(14,016
|
)
|
(31,007
|
)
|
|||||
|
Loss on debt retirement
|
—
|
|
9,560
|
|
757
|
|
|||||
|
Loss (gain) on disposal of fixed assets, net
|
1,390
|
|
1,190
|
|
1,276
|
|
|||||
|
Share-based compensation
|
3,251
|
|
3,852
|
|
3,700
|
|
|||||
|
Loss from acquisition of J-Devices
|
—
|
|
13,501
|
|
—
|
|
|||||
|
Gain on sale of subsidiary to J-Devices
|
—
|
|
—
|
|
(9,155
|
)
|
|||||
|
Proceeds from insurance recovery for property, plant and equipment
|
(15,166
|
)
|
—
|
|
—
|
|
|||||
|
Other, net
|
2,858
|
|
4,014
|
|
869
|
|
|||||
|
Changes in assets and liabilities, net of acquisitions:
|
|||||||||||
|
Accounts receivable
|
(29,126
|
)
|
122,840
|
|
(80,775
|
)
|
|||||
|
Inventories
|
(28,397
|
)
|
27,677
|
|
(27,817
|
)
|
|||||
|
Other current assets
|
1,124
|
|
(3,309
|
)
|
(8,747
|
)
|
|||||
|
Other assets
|
1,037
|
|
333
|
|
954
|
|
|||||
|
Trade accounts payable
|
48,581
|
|
(48,368
|
)
|
55,693
|
|
|||||
|
Accrued expenses
|
56,465
|
|
(42,042
|
)
|
16,720
|
|
|||||
|
Pension and severance obligations
|
1,625
|
|
(7,321
|
)
|
(509
|
)
|
|||||
|
Other non-current liabilities
|
(36,387
|
)
|
(31,997
|
)
|
109,714
|
|
|||||
|
Net cash provided by (used in) operating activities
|
729,402
|
|
584,975
|
|
614,666
|
|
|||||
|
Cash flows from investing activities:
|
|||||||||||
|
Payments for property, plant and equipment
|
(650,038
|
)
|
(537,975
|
)
|
(681,120
|
)
|
|||||
|
Proceeds from sale of property, plant and equipment
|
45,635
|
|
6,945
|
|
2,815
|
|
|||||
|
Proceeds from insurance recovery for property, plant and equipment
|
15,166
|
|
—
|
|
—
|
|
|||||
|
Acquisition of business, net of cash acquired
|
—
|
|
22,577
|
|
—
|
|
|||||
|
Investment in J-Devices
|
—
|
|
(12,908
|
)
|
—
|
|
|||||
|
Disposition of business to J-Devices, net of cash transferred
|
—
|
|
8,355
|
|
(15,774
|
)
|
|||||
|
Purchase of short-term investment
|
—
|
|
—
|
|
(20,000
|
)
|
|||||
|
Proceeds from short-term investment
|
—
|
|
—
|
|
20,000
|
|
|||||
|
Other investing activities
|
(190
|
)
|
(1,984
|
)
|
(510
|
)
|
|||||
|
Net cash provided by (used in) investing activities
|
(589,427
|
)
|
(514,990
|
)
|
(694,589
|
)
|
|||||
|
Cash flows from financing activities:
|
|||||||||||
|
Borrowings under revolving credit facilities
|
125,000
|
|
290,000
|
|
—
|
|
|||||
|
Payments under revolving credit facilities
|
(255,000
|
)
|
(150,000
|
)
|
—
|
|
|||||
|
Borrowings under short-term debt
|
49,131
|
|
—
|
|
—
|
|
|||||
|
Payments of short-term debt
|
(49,500
|
)
|
—
|
|
—
|
|
|||||
|
Proceeds from issuance of long-term debt
|
46,000
|
|
400,000
|
|
80,000
|
|
|||||
|
Payments of long-term debt
|
(32,078
|
)
|
(530,000
|
)
|
(145,000
|
)
|
|||||
|
Payments for debt issuance costs
|
(156
|
)
|
(312
|
)
|
(903
|
)
|
|||||
|
Payments for retirement of debt
|
—
|
|
(7,030
|
)
|
(757
|
)
|
|||||
|
Payments for capital lease obligations
|
(2,543
|
)
|
—
|
|
—
|
|
|||||
|
Payment of deferred consideration for an acquisition
|
—
|
|
—
|
|
(18,763
|
)
|
|||||
|
Proceeds from issuance of stock through share-based compensation plans
|
8,247
|
|
931
|
|
6,250
|
|
|||||
|
Payments of tax withholding for restricted shares
|
(732
|
)
|
(730
|
)
|
(1,579
|
)
|
|||||
|
Payments of subsidiary dividends to noncontrolling interests
|
(548
|
)
|
(246
|
)
|
—
|
|
|||||
|
Net cash provided by (used in) financing activities
|
(112,179
|
)
|
2,613
|
|
(80,752
|
)
|
|||||
|
Effect of exchange rate fluctuations on cash, cash equivalents and restricted cash
|
351
|
|
—
|
|
68
|
|
|||||
|
Net increase (decrease) in cash, cash equivalents and restricted cash
|
28,147
|
|
72,598
|
|
(160,607
|
)
|
|||||
|
Cash, cash equivalents and restricted cash, beginning of period
|
527,348
|
|
454,750
|
|
615,357
|
|
|||||
|
Cash, cash equivalents and restricted cash, end of period
|
$
|
555,495
|
|
$
|
527,348
|
|
$
|
454,750
|
|
||
|
Supplemental disclosures of cash flow information:
|
|
|
|
|
|
|
|||||
|
Cash paid during the period for:
|
|||||||||||
|
Interest
|
$
|
86,777
|
|
$
|
96,227
|
|
$
|
100,650
|
|
||
|
Income taxes
|
32,174
|
|
35,084
|
|
37,315
|
|
|||||
|
Non-cash investing and financing activities:
|
|||||||||||
|
Property, plant and equipment included in capital expenditures payable
|
146,080
|
|
242,980
|
|
127,568
|
|
|||||
|
Equipment acquired through capital lease
|
6,358
|
|
—
|
|
—
|
|
|||||
|
Common stock issuance for conversion and exchange in 2014 of 6.0% convertible senior subordinated notes due April 2014
|
—
|
|
—
|
|
56,350
|
|
|||||
The accompanying notes are an integral part of these statements.
58
|
1.
|
Description of Business and Summary of Significant Accounting Policies
|
Description of Business
Amkor is one of the world’s leading providers of outsourced semiconductor packaging and test services. Amkor pioneered the outsourcing of semiconductor packaging and test services through a predecessor corporation in 1968, and over the years we have built a leading position by:
|
•
|
Designing and developing innovative packaging and test technologies;
|
|
•
|
Offering a broad portfolio of cost-effective solutions and services;
|
|
•
|
Focusing on strategic end markets that offer solid growth potential;
|
|
•
|
Cultivating long-standing relationships with our customers, which include many of the world’s leading semiconductor companies;
|
|
•
|
Collaborating with customers, original equipment manufacturers ("OEMs") and equipment and material suppliers;
|
|
•
|
Developing a competitive cost structure with disciplined capital investment;
|
|
•
|
Building expertise in high-volume manufacturing processes and developing a reputation for high quality and solid execution and
|
|
•
|
Providing a geographically diverse operating base, with research and development, engineering support and production capabilities at various facilities throughout China, Japan, Korea, Malaysia, the Philippines and Taiwan.
|
Basis of Presentation
Our Consolidated Financial Statements include the accounts of Amkor Technology, Inc. and our subsidiaries (“Amkor”). Our Consolidated Financial Statements reflect the elimination of all significant inter-company accounts and transactions. On June 30, 2014, we completed the sale of our Japanese subsidiary to J-Devices (
Note 3
). The financial results of the divested entity were included in our Consolidated Financial Statements up to the date of sale and have subsequently been included in the results of J-Devices. On
December 30, 2015
, we increased our investment in J-Devices to
100%
(
Note 3
). As a result, our accounting for J-Devices changed from the equity method to the consolidation method effective December 30, 2015. The operating results of J-Devices were consolidated beginning in 2016. Our investments in variable interest entities in which we are the primary beneficiary are consolidated. We reflect the remaining portion of variable interest entities and foreign subsidiaries that are not wholly owned as noncontrolling interests.
The preparation of financial statements in conformity with U.S. generally accepted accounting principles requires management to make estimates and assumptions that affect the amounts reported in the financial statements and accompanying notes. On an ongoing basis, we evaluate our estimates, including those related to acquisitions, revenue recognition, income taxes, inventory, long lived assets and contingencies. These estimates are based on management’s best knowledge of current events, historical experience, actions that we may undertake in the future and on various other assumptions that are believed to be reasonable under the circumstances. As a result, actual results could differ materially from these estimates and assumptions.
Beginning with the year ended December 31, 2016, we changed the presentation of net sales by country in our segment footnote (
Note 18
) from customer location to customer headquarters location for all periods presented. The revision had no impact on net sales.
59
Consolidation of Variable Interest Entities
We have variable interests in certain Philippine realty corporations in which we have a
40%
ownership. We lease land and buildings in the Philippines from these entities and we are the primary beneficiary of these arrangements. As of
December 31, 2016
, the combined book value of the assets and liabilities associated with these Philippine realty corporations included in our Consolidated Balance Sheet was
$16.8 million
and
$0.4 million
, respectively. The impact of consolidating these variable interest entities on our Consolidated Statements of Income was not significant, and other than our lease payments, we have not provided any significant assistance or other financial support to these variable interest entities for the years ended
December 31, 2016
,
2015
or
2014
. The creditors of the Philippine realty corporations have no recourse to our general credit.
Foreign Currency Translation
The U.S. dollar is the functional currency of our subsidiaries other than J-Devices, and the foreign currency asset and liability amounts at these subsidiaries are remeasured into U.S. dollars at end-of-period exchange rates, except for nonmonetary items which are remeasured at historical rates. Foreign currency income and expenses are remeasured at daily exchange rates, except for expenses related to balance sheet amounts which are remeasured at historical exchange rates. Exchange gains and losses arising from remeasurement of foreign currency-denominated monetary assets and liabilities are included in other (income) expense, net in the period in which they occur.
The Japanese Yen is the functional currency of J-Devices. The asset and liability amounts of J-Devices are translated into U.S. dollars at end-of-period exchange rates. Income and expenses are translated into U.S. dollars at average exchange rates in effect during the period. The resulting translation adjustments are reported as a component of accumulated other comprehensive income in the stockholders’ equity section of the balance sheet. Assets and liabilities denominated in a currency other than the functional currency are remeasured into the functional currency prior to translation into U.S. dollars, and the resulting transaction exchange gains or losses are included in other expense (income) in the period in which they occur.
Risks and Concentrations
The semiconductor industry is characterized by rapid technological change, competitive pricing pressures and cyclical market patterns. Our financial results are affected by a wide variety of factors, including general economic conditions worldwide, economic conditions specific to the semiconductor industry, the timely implementation of new package and test technologies, the ability to safeguard patents and intellectual property in a rapidly evolving market and reliance on materials and equipment suppliers. In addition, the semiconductor market has historically been cyclical and subject to significant economic downturns at various times. Our profitability and ability to generate cash from operations is principally dependent upon demand for semiconductors, the utilization of our capacity, semiconductor package mix, the average selling price of our services, our ability to manage our capital expenditures and our ability to control our costs including labor, material, overhead and financing costs.
A significant portion of our revenues is concentrated with a small group of customers (
Note 18
). The loss of a significant customer, a business combination among customers, a reduction in orders or decrease in price from a significant customer or disruption in any of our significant strategic partnerships or other commercial arrangements could have a material adverse effect on our business, liquidity, results of operations, financial condition and cash flows.
Financial instruments, for which we are subject to credit risk, consist principally of accounts receivable and cash and cash equivalents. With respect to accounts receivable, we mitigate our credit risk by selling primarily to well-established companies, performing ongoing credit evaluations and making frequent contact with customers. In addition, we may utilize non-recourse factoring to mitigate credit risk when considered appropriate. We have historically mitigated our credit risk with respect to cash and cash equivalents through diversification of our holdings into various high quality money market funds and bank deposit accounts. At
December 31, 2016
, our cash and cash equivalents were maintained in various U.S. and foreign bank operating and time deposit accounts and invested in U.S. money market funds.
60
Contingencies and Litigation
We may be subject to certain legal proceedings, lawsuits and other claims, as discussed in
Note 17
. We accrue for a loss contingency, including legal proceedings, lawsuits, pending claims and other legal matters, when we conclude that the likelihood of a loss is probable and the amount of the loss can be reasonably estimated. When the reasonable estimate of the loss is within a range of amounts, and no amount in the range constitutes a better estimate than any other amount, we accrue for the amount at the low end of the range. We adjust our accruals from time to time as we receive additional information, but the loss we incur may be significantly greater than or less than the amount we have accrued. We disclose loss contingencies if we believe they are material and there is at least a reasonable possibility that a loss has been incurred. Attorney fees related to legal matters are expensed as incurred.
Cash and Cash Equivalents
We consider all highly liquid investments with a maturity of three months or less when purchased to be cash equivalents. Our cash and cash equivalents are maintained in various U.S. and foreign bank operating and time deposit accounts and invested in U.S. money market funds.
Restricted Cash
Restricted cash, current, consists of short-term cash equivalents used to collateralize our daily banking services. Restricted cash, non-current, mainly consists of collateral to fulfill foreign trade compliance requirements.
The following table provides a reconciliation of cash, cash equivalents and restricted cash reported within our Consolidated Balance Sheets to our Consolidated Statements of Cash Flows.
|
December 31,
|
|||||||||||||||
|
2016
|
2015
|
2014
|
2013
|
||||||||||||
|
(In thousands)
|
|||||||||||||||
|
Cash and cash equivalents
|
$
|
549,518
|
|
$
|
523,172
|
|
$
|
449,946
|
|
$
|
610,442
|
|
|||
|
Restricted cash - current
|
2,000
|
|
2,000
|
|
2,681
|
|
2,681
|
|
|||||||
|
Restricted cash - non-current
|
3,977
|
|
2,176
|
|
2,123
|
|
2,234
|
|
|||||||
|
Total cash, cash equivalents and restricted cash
|
$
|
555,495
|
|
$
|
527,348
|
|
$
|
454,750
|
|
$
|
615,357
|
|
|||
Inventories
Inventories are stated at the lower of cost or market (net realizable value). Cost is principally determined by standard cost or the weighted moving average method, both of which approximate actual cost. We review and set our standard costs as needed, but at a minimum on an annual basis. We reduce the carrying value of our inventories for the cost of inventory we estimate is excess and obsolete based on the age of our inventories. When a determination is made that the inventory will not be utilized in production or is not saleable, it is written-off.
Other Current Assets
Other current assets consist principally of prepaid assets and an investment in government securities by a foreign subsidiary to satisfy local regulatory requirements, which is recorded at amortized cost.
61
Property, Plant and Equipment
Property, plant and equipment are stated at cost. Depreciation is calculated by the straight-line method over the estimated useful lives of depreciable assets which are as follows:
|
Land use rights
|
50 to 90 years
|
|
Buildings and improvements
|
10 to 40 years
|
|
Machinery and equipment
|
2 to 7 years
|
|
Software and computer equipment
|
3 to 5 years
|
|
Furniture, fixtures and other equipment
|
4 to 10 years
|
Cost and accumulated depreciation for property retired or disposed of are removed from the accounts, and any resulting gain or loss is included in earnings. Expenditures for maintenance and repairs are charged to expense as incurred.
We review long-lived assets for impairment whenever events or changes in circumstances indicate that the carrying amount may not be recoverable. Recoverability of a long-lived asset group to be held and used in operations is measured by a comparison of the carrying amount to the sum of the undiscounted cash flows expected to result from the use and eventual disposition of the asset group. If such asset group is considered to be impaired, the impairment loss is measured as the amount by which the carrying amount of the asset group exceeds its fair value. Long-lived assets to be disposed of are carried at the lower of cost or fair value less the costs of disposal.
Goodwill
Goodwill is recorded when the cost of an acquisition exceeds the fair value of the net tangible and identifiable intangible assets acquired. We review goodwill for impairment annually during the fourth quarter of each year and whenever events or changes in circumstances indicate that an impairment may exist. Impairment losses are recorded when the carrying amount of goodwill exceeds its implied fair value.
Other Assets
Other assets consist principally of deferred tax assets and refundable security deposits.
Other Non-current Liabilities
Other non-current liabilities consist primarily of liabilities associated with the settlement of patent license litigation and uncertain income tax positions.
See Note 17
for additional information on the settlement.
Fair Value Measurements
We apply fair value accounting for assets and liabilities that are recognized or disclosed at fair value in the financial statements on a recurring or nonrecurring basis. We define fair value as the price that would be received from selling an asset or paid to transfer a liability in the principal or most advantageous market for the asset or liability in an orderly transaction between market participants at the measurement date. See
Note 16
for further discussion of fair value measurements.
62
Revenue Recognition
We recognize revenue from our packaging and test services, net of value-added or other similar taxes, when there is evidence of an arrangement, delivery has occurred or services have been rendered, fees are fixed or determinable and collectibility is reasonably assured. Generally, these criteria are met and revenue is recognized upon shipment or, in some cases, customer acceptance. If the revenue recognition criteria are not met, we defer the revenue. Deferred revenue generally results from two types of transactions: contractual invoicing at interim points in the packaging and test process prior to shipment of the finished product and customer advances for supply agreements with customers where we commit capacity in exchange for customer prepayment of services. These prepayments are deferred and recorded as customer advances within accrued expenses and other non-current liabilities.
We generally do not take ownership of customer-supplied semiconductor wafers. Title and risk of loss remains with the customer for these materials at all times. Accordingly, the cost of the customer-supplied materials is not included in our Consolidated Financial Statements.
An allowance for sales credits is recorded as a reduction to sales and accounts receivable during the period of sale such that accounts receivable is reported at its estimated net realizable value. The allowance for sales credits is an estimate of the future credits we will issue for billing adjustments primarily for invoicing corrections and miscellaneous customer claims and is estimated based upon recent credit issuance, historical experience and specific identification of known or expected sales credits at the end of the reporting period. Additionally, provisions are made for doubtful accounts when there is doubt as to the collectibility of accounts receivable. The allowance for doubtful accounts is recorded as bad debt expense and is classified as selling, general and administrative expense. The allowance for doubtful accounts is based upon specific identification of doubtful accounts considering the age of the receivable balance, the customer’s historical payment history and current credit worthiness as well as specific identification of any known or expected collectibility issues. Historically, our allowance for doubtful accounts has been immaterial.
Shipping and Handling Fees and Costs
Amounts billed to customers for shipping and handling are presented in net sales. Costs incurred for shipping and handling are included in cost of sales.
Research and Development Costs
Research and development expenses include costs attributable to the conduct of research and development programs primarily related to the development of new package designs or technologies and improving the efficiency and capabilities of our existing production processes. Such costs include salaries, payroll taxes, employee benefit costs, materials, supplies, depreciation and maintenance of research equipment, services provided by outside contractors and the allocable portions of facility costs such as rent, utilities, insurance, repairs and maintenance, depreciation and general support services. All costs associated with research and development are expensed as incurred.
Income Taxes
Income taxes are accounted for using the asset and liability method. Under this method, deferred income tax assets and liabilities are recognized for the future tax consequences attributable to temporary differences between the financial statement carrying amounts of existing assets and liabilities and their respective tax basis as well as for net operating loss and tax credit carryforwards. Deferred income tax assets and liabilities are measured using enacted tax rates expected to apply to taxable income in the years in which these temporary differences are expected to be recovered or settled. The effect on deferred tax assets and liabilities of a change in tax rates is recognized in income in the period that includes the enactment date. A valuation allowance is provided for those deferred tax assets for which it is more likely than not that the related tax benefits will not be realized.
We monitor on an ongoing basis our ability to utilize our deferred tax assets and whether there is a need for a related valuation allowance. In evaluating our ability to recover our deferred tax assets in the jurisdictions from which they arise, we consider
63
all available positive and negative evidence, including scheduled reversals of deferred tax liabilities, projected future taxable income, tax-planning strategies and results of recent operations. For most of our foreign deferred tax assets, we consider it more likely than not that we will have sufficient taxable income to allow us to realize these deferred tax assets. However, in the event taxable income falls short of current expectations, we may need to establish a valuation allowance against such deferred tax assets.
We recognize in our Consolidated Financial Statements the impact of an income tax position, if that position is more likely than not of being sustained on audit, based on the technical merits of the position. Related interest and penalties are classified as income taxes in the financial statements. See
Note 6
for more information regarding unrecognized income tax benefits.
Revision to Previously Reported Financial Information
In the second quarter of 2016, we identified an error in the provision for income taxes in the financial statements for J-Devices for the periods beginning in 2012 through the fourth quarter of 2015. We believe that the error is not material to Amkor for the periods impacted and have elected to revise our previously issued consolidated financial statements. Periods presented herein are based on the revised financial results. See
Note 19
for additional information.
|
2.
|
New Accounting Standards
|
Recently Adopted Standards
In April 2015, the Financial Accounting Standards Board ("FASB") issued Accounting Standards Update ("ASU") 2015-03,
Interest-Imputation of Interest (Subtopic 835-30) - Simplifying the Presentation of Debt Issuance Costs
. ASU 2015-03 requires debt issuance costs related to a recognized debt liability be presented in the balance sheet as a direct deduction from the carrying amount of that debt liability, consistent with debt discounts. In August 2015, the FASB issued ASU 2015-15,
Interest - Imputation of Interest (Subtopic 835-30): Presentation and Subsequent Measurement of Debt Issuance Costs Associated with Line-of-Credit Arrangements - Amendments to SEC Paragraphs Pursuant to Staff Announcement at June 18, 2015 EITF Meeting (SEC Update)
, which clarifies that companies may continue to present unamortized debt issuance costs associated with line of credit arrangements as an asset. ASU 2015-03 and ASU 2015-15 are effective for interim and annual reporting periods beginning after December 15, 2015, and require retrospective application. We adopted ASU 2015-03 and ASU 2015-15 on January 1, 2016. The guidance was applied retrospectively and the consolidated balance sheet as of December 31, 2015 was adjusted to reclassify
$8.8 million
of debt issuance costs from other assets to a reduction in the carrying amount of the related debt liability.
In March 2016, the FASB issued ASU 2016-09,
Compensation - Stock Compensation (Topic 718) - Improvements to Employee Share-Based Payment Accounting
. ASU 2016-09 involves several aspects of the accounting for share-based transactions, including income tax consequences, classification of awards as either equity or liabilities, forfeitures and classification on the statement of cash flows. ASU 2016-09 is effective for reporting periods beginning after December 15, 2016 and early adoption is permitted. We adopted ASU 2016-09 on July 1, 2016. The adoption of ASU 2016-09 did not have a significant impact on our financial statements or disclosure.
In August 2016, the FASB issued ASU 2016-15,
Statement of Cash Flows (Topic 230) - Classification of Certain Cash Receipts and Cash Payments
. ASU 2016-15 provides guidance on eight specific cash flow issues with the objective of reducing diversity in practice in regard to how cash receipts and cash payments are presented and classified in the statement of cash flows. ASU 2016-15 is effective for reporting periods beginning after December 15, 2017 and is applied retrospectively. Early adoption is permitted. We adopted ASU 2016-15 at September 30, 2016. The guidance was applied retrospectively and the consolidated statement of cash flows for the years ended December 31, 2015 and 2014 was adjusted to reclassify
$7.0 million
and
$0.8 million
, respectively, of payments for debt retirement from operating activities to financing activities.
In November 2016, the FASB issued ASU 2016-18,
Statement of Cash Flows (Topic 230) - Restricted Cash
. ASU 2016-18 requires that a statement of cash flows explain the change during the period in the total of cash, cash equivalents, and amounts generally described as restricted cash or restricted cash equivalents. Therefore, amounts generally described as
64
restricted cash should be included with cash and cash equivalents when reconciling the beginning-of-period and end-of-period total amounts shown on the statement of cash flows. ASU 2016-18 is effective for reporting periods beginning after December 15, 2017, and interim periods within those fiscal years. Early adoption is permitted. We adopted ASU 2016-18 at December 31, 2016. The guidance was applied retrospectively. The adoption of ASU 2016-18 did not have a significant impact on our cash flows. See Note 1 for a reconciliation of cash, cash equivalents and restricted cash reported within our Consolidated Balance Sheets to our Consolidated Statements of Cash Flows.
Recently Issued Standards
In May 2014, the FASB issued ASU 2014-09,
Revenue from Contracts with Customers (Topic 606)
. ASU 2014-09 is based on the principle that revenue is recognized to depict the transfer of promised goods or services to customers in an amount that reflects the consideration to which the entity expects to be entitled in exchange for those goods or services. This ASU also requires additional disclosure about the nature, amount, timing and uncertainty of revenue and cash flows arising from contracts with customers, including significant judgments and changes in judgments. ASU 2014-09 permits the use of either full retrospective or modified retrospective methods of adoption. In August 2015, the FASB issued ASU 2015-14,
Revenue from Contracts with Customers (Topic 606): Deferral of the Effective Date
, which defers the effective date by one year to December 15, 2017,
for interim and annual reporting periods beginning after that date
. In March, April, May and December 2016, the FASB issued ASU 2016-08
,
ASU 2016-10, ASU 2016-12 and ASU 2016-20, respectively, which provide supplemental guidance and clarification to ASU 2014-09. Early adoption is permitted, but not before the original effective date of December 15, 2016. We do not plan to adopt this standard early. We are currently evaluating the impact that this guidance will have on our financial statements and disclosure and have not yet selected a transition method.
In July 2015, the FASB issued ASU 2015-11,
Inventory - Simplifying the Measurement of Inventory (Topic 330)
. ASU 2015-11 requires inventory to be subsequently measured using the lower of cost and net realizable value, thereby eliminating the market value approach. Net realizable value is defined as the “estimated selling prices in the ordinary course of business, less reasonably predictable costs of completion, disposal and transportation.” ASU 2015-11 is effective for reporting periods beginning after December 15, 2016 and is applied prospectively. Early adoption is permitted. ASU 2015-11 is not expected to have a significant impact on our financial statements or disclosure.
In February 2016, the FASB issued ASU 2016-02,
Leases (Topic 842)
. ASU 2016-02 requires a dual approach for lessee accounting under which a lessee would account for leases as finance leases or operating leases. Both finance leases and operating leases will result in the lessee recognizing a right-of-use asset and a corresponding lease liability. For finance leases the lessee would recognize interest expense and amortization of the right-of-use asset, and for operating leases the lessee would recognize a straight-line lease expense. ASU 2016-02 is effective for reporting periods beginning after December 15, 2018 using a modified retrospective approach. Early adoption is permitted. We are currently evaluating the impact that this guidance may have on our financial statements and disclosure.
In January 2017, the FASB issued ASU 2017-04,
Intangible - Goodwill and Other (Topic 350) - Simplifying the Test for Goodwill Impairment
. ASU 2017-04 simplifies the goodwill impairment test by eliminating the second step of the current two-step impairment test. ASU 2017-04 is effective for interim and annual goodwill impairment tests in fiscal years beginning after December 15, 2019 and is applied prospectively. Early adoption is permitted for interim or annual goodwill impairment tests performed on testing dates after January 1, 2017. ASU 2017-04 may affect our financial statements to the extent that a goodwill impairment test results in impairment charges.
In February 2017, the FASB issued ASU 2017-05,
Other Income - Gains and Losses from the Derecognition of Nonfinancial Assets (Subtopic 610-20): Clarifying the Scope of Asset Derecognition Guidance and Accounting for Partial Sales of Nonfinancial Assets
. ASU 2017-05 clarifies the scope of ASC Subtopic 610-20 and provides guidance for partial sales of nonfinancial assets. ASU 2017-05 is effective for reporting periods beginning after December 15, 2017 and permits the use of either retrospective or modified retrospective methods of adoption. In addition, an entity is required to apply the amendments in this update at the same time that it applies the amendments in ASU 2014-09. We are currently evaluating the impact that this guidance will have on our financial statements and disclosure.
65
|
3.
|
Acquisition and Divestiture
|
Step-acquisition of J-Devices
On December 30, 2015, through the exercise of additional options, we increased our ownership interest in J-Devices from
65.7%
to
100%
for a purchase price of
$105.4 million
. As a result, our accounting for J-Devices changed from the equity method to the consolidation method effective December 30, 2015. The operating results of J-Devices were consolidated beginning in 2016. The acquisition of the remaining interest expands our presence in Japan and our business worldwide by capitalizing on our leadership position in the automotive market. Since there were no material transactions from December 30, 2015 to December 31, 2015, and for the convenience of reporting the acquisition for accounting purposes, December 31, 2015 was designated as the acquisition date.
During the three months ended June 30, 2016, we updated the purchase price allocation of J-Devices for a previously unrecognized tax provision liability at J-Devices of
$11.6 million
. We also revised the loss from the release of accumulated foreign currency translation adjustments, the combined net loss and the pro forma information disclosed below. See
Note 1
and
Note 19
for additional information.
The following table presents the initial purchase price allocation and subsequent adjustments to the consideration transferred to acquire J-Devices and the amounts of identifiable assets acquired and liabilities assumed at the acquisition date:
|
Initial Allocation
|
Adjustments
|
Revised Allocation
|
|||||||||
|
(In thousands)
|
|||||||||||
|
Fair value of consideration transferred:
|
|
||||||||||
|
Cash
|
$
|
105,391
|
|
$
|
—
|
|
$
|
105,391
|
|
||
|
Fair value of our previously held equity interest in J-Devices
|
167,684
|
|
(7,597
|
)
|
160,087
|
|
|||||
|
Total
|
$
|
273,075
|
|
$
|
(7,597
|
)
|
$
|
265,478
|
|
||
|
|
|
||||||||||
|
Recognized amounts of identifiable assets acquired and liabilities assumed:
|
|
||||||||||
|
Cash
|
$
|
127,968
|
|
$
|
—
|
|
$
|
127,968
|
|
||
|
Accounts receivable
|
180,177
|
|
—
|
|
180,177
|
|
|||||
|
Inventory
|
42,502
|
|
—
|
|
42,502
|
|
|||||
|
Other current assets
|
2,363
|
|
—
|
|
2,363
|
|
|||||
|
Property, plant and equipment
|
230,319
|
|
—
|
|
230,319
|
|
|||||
|
Other assets
|
9,268
|
|
—
|
|
9,268
|
|
|||||
|
Short-term borrowings and current portion of long-term debt
|
(36,770
|
)
|
—
|
|
(36,770
|
)
|
|||||
|
Other current liabilities
|
(251,405
|
)
|
—
|
|
(251,405
|
)
|
|||||
|
Long-term debt
|
(18,885
|
)
|
—
|
|
(18,885
|
)
|
|||||
|
Pension obligations
|
(22,250
|
)
|
—
|
|
(22,250
|
)
|
|||||
|
Other non-current liabilities
|
(9,655
|
)
|
(11,563
|
)
|
(21,218
|
)
|
|||||
|
Total identifiable net assets
|
253,632
|
|
(11,563
|
)
|
242,069
|
|
|||||
|
Goodwill
|
19,443
|
|
3,966
|
|
23,409
|
|
|||||
|
Total
|
$
|
273,075
|
|
$
|
(7,597
|
)
|
$
|
265,478
|
|
||
The goodwill is attributable to the workforce of J-Devices, as well as cost savings and synergies expected from combining the operations of J-Devices. It is not deductible for tax purposes.
66
As a result of obtaining control over J-Devices, our previously held equity interest of
65.7%
was remeasured to fair value, resulting in a gain of
$16.1 million
. Additionally, our previously held equity interest in J-Devices' accumulated foreign currency translation adjustments was released upon consolidation of J-Devices, resulting in a loss of
$29.6 million
(
Note 15
). The combined net loss of
$13.5 million
was recognized in other (income) expense, net (
Note 5
) in our Consolidated Financial Statements.
The fair value of our previously held equity interest in J-Devices was estimated by applying an income approach using the discounted cash flow method. The fair value measurement is based on significant inputs not observable in the market and thus represents a Level 3 fair value measurement. Key assumptions include our estimates of J-Devices’ financial projections, a terminal value based on its expected long-term growth rate and a discount rate based on the weighted-average cost of capital of comparable companies.
The following unaudited pro forma consolidated results of operations have been prepared as if the acquisition of J-Devices had occurred on January 1, 2014. The pro forma results include adjustments related to alignment to our accounting policies, the effect of fair value adjustments on property, plant and equipment and the related income tax effect. We also eliminated inter-company activity between the parties in the consolidated results. The pro forma results include the activities that are nonrecurring and not representative of future activities, including the gain of
$16.2 million
from reversal of a deferred tax asset valuation allowance and the gain of
$12.6 million
from release of accumulated foreign currency translation adjustments associated with merging our subsidiary into J-Devices in 2014, offset by the loss on acquisition of J-Devices of
$13.5 million
in 2014.
This pro forma data is presented for informational purposes only and does not purport to be indicative of the results of future operations or of the results that would have occurred had the 2015 acquisition taken place on January 1, 2014. The pro forma information does not include any potential revenue enhancements, cost synergies or other operating efficiencies that could result from the acquisition.
|
For the Year Ended December 31,
|
|||||||
|
2015
|
2014
|
||||||
|
(unaudited)
|
(unaudited)
|
||||||
|
(In thousands, except per share data)
|
|||||||
|
Net sales
|
$
|
3,696,495
|
|
$
|
4,051,076
|
|
|
|
Net income
|
88,190
|
|
153,049
|
|
|||
|
Net income attributable to Amkor
|
85,394
|
|
149,548
|
|
|||
|
Basic earnings per share
|
0.36
|
|
0.65
|
|
|||
|
Diluted earnings per share
|
0.36
|
|
0.63
|
|
|||
Sale of Subsidiary to J-Devices
On June 30, 2014, we sold
100%
of the shares of our wholly-owned subsidiary engaged in semiconductor packaging and test operations in Japan to J-Devices (our previously held equity method investee) for
¥1.1 billion
. We received
¥0.1 billion
(
$1.0 million
) in cash from J-Devices at closing and received the remaining
¥1.0 billion
(
$8.4 million
) on June 30, 2015. We recognized a net gain on the sale of
$9.2 million
in our Consolidated Financial Statements in other (income) expense, net, which includes a gain of
$12.6 million
from the release of accumulated foreign currency translation adjustments associated with the entity (
Note 15
). J-Devices recognized a gain of
$14.7 million
on the transaction in its Consolidated Financial Statements as the fair value of the net assets acquired exceeded the purchase price. The gain recognized by J-Devices increased our equity in earnings of J-Devices by
$8.8 million
. The combined net gain we recognized was
$18.0 million
.
67
|
4.
|
Share-Based Compensation Plans
|
Our share-based compensation is measured at fair value and expensed over the service period (generally the vesting period). The amount of compensation expense to be recognized is adjusted for an estimated forfeiture rate which is based on historical data. For the years ended
December 31, 2016
, 2015 and 2014, we recognized share-based compensation attributable to stock options and restricted shares of
$3.3 million
,
$3.9 million
and
$3.7 million
, respectively, primarily in selling, general and administrative expenses. There were no corresponding deferred income tax benefits for stock options or restricted shares.
Equity Incentive Plan
Amended and Restated 2007 Equity Incentive Plan.
The Amended and Restated 2007 Equity Incentive Plan, (the “2007 Plan”) provides for the grant of the following types of incentive awards: (i) stock options, (ii) restricted stock, (iii) restricted stock units, (iv) stock appreciation rights, (v) performance units and performance shares and (vi) other stock or cash awards. Those eligible for awards include employees, directors and consultants who provide services to Amkor and its subsidiaries. The 2007 Plan is effective through 2022 and can be terminated at the discretion of the Board of Directors. There were originally
17.0 million
shares of our common stock reserved for issuance under the 2007 Plan and at
December 31, 2016
there were
11.0 million
shares available for grant.
Stock options
Stock options are generally granted with an exercise price equal to the market price of the stock at the date of grant. Substantially all of the options granted are exercisable pursuant to a
one
to
four
year vesting schedule and the term of the options granted is no longer than
ten
years. Upon option exercise, we may issue new shares of common or treasury stock.
In order to calculate the fair value of stock options at the date of grant, we use the Black-Scholes option pricing model. Expected volatilities are based on historical performance of our stock. We also use historical data to estimate the timing and amount of option exercises and forfeitures within the valuation model. The expected term of the options is based on evaluations of historical and expected future employee exercise behavior and represents the period of time that options granted are expected to be outstanding. The risk-free interest rate for periods within the contractual life of the option is based on the U.S. Treasury yield curve in effect at the time of grant.
The following table summarizes our stock option activity for the year ended
December 31, 2016
:
|
Number of
Shares
(In thousands)
|
Weighted-Average
Exercise Price
per Share
|
Weighted-Average
Remaining
Contractual Term
(Years)
|
Aggregate
Intrinsic
Value
(In thousands)
|
||||||||
|
Outstanding at December 31, 2015
|
3,727
|
$
|
6.49
|
|
|||||||
|
Granted
|
460
|
6.08
|
|
||||||||
|
Exercised
|
(1,470)
|
5.61
|
|
||||||||
|
Forfeited or expired
|
(274)
|
6.63
|
|
||||||||
|
Outstanding at December 31, 2016
|
2,443
|
$
|
6.93
|
|
5.99
|
$
|
9,174
|
|
|||
|
Fully vested at December 31, 2016 and expected to vest thereafter
|
2,416
|
$
|
6.94
|
|
5.96
|
$
|
9,066
|
|
|||
|
Exercisable at December 31, 2016
|
1,531
|
$
|
7.53
|
|
4.57
|
$
|
4,963
|
|
|||
68
The following assumptions were used to calculate the weighted-average fair values of the options granted:
|
For the Year Ended December 31,
|
|||||||||||
|
2016
|
2015
|
2014
|
|||||||||
|
Expected life (in years)
|
6.5
|
|
5.8
|
|
6.1
|
|
|||||
|
Risk-free interest rate
|
1.5
|
%
|
1.8
|
%
|
2.0
|
%
|
|||||
|
Volatility
|
48
|
%
|
45
|
%
|
57
|
%
|
|||||
|
Dividend yield
|
—
|
|
—
|
|
—
|
|
|||||
|
Weighted-average grant date fair value per option granted
|
$
|
2.89
|
|
$
|
3.14
|
|
$
|
4.46
|
|
||
Total unrecognized compensation expense from stock options was
$2.0 million
as of
December 31, 2016
, which is expected to be recognized over a weighted-average period of approximately
1.9
years beginning January 1, 2017.
Restricted Shares
We grant restricted shares to directors and employees under the 2007 Plan. Restricted shares granted to directors vest on the earlier of the
one
year anniversary of the grant date or the date of the next annual meeting of stockholders. All other restricted shares vest ratably over
four
years, with
25%
of the shares vesting at the end of the first year and the remainder vesting quarterly thereafter such that
100%
of the shares will become vested on the fourth anniversary of the award, subject to the recipient’s continued employment with us on the applicable vesting dates. In addition, provided that the restricted shares have not been forfeited earlier, for certain grants, the restricted shares will vest upon the recipient’s death or disability, or upon a change in control of Amkor. The value of the restricted shares is determined based on the fair market value of the underlying shares on the date of the grant and is recognized ratably over the vesting period. Upon vesting of restricted stock awards, we may issue new shares of common or treasury stock.
The following table summarizes our restricted share activity for the year ended
December 31, 2016
:
|
Number of
Shares
(In thousands)
|
Weighted- average
Grant Date
Fair Value
(Per Share)
|
|||||
|
Nonvested at December 31, 2015
|
385
|
|
$
|
4.78
|
|
|
|
Awards granted
|
50
|
|
5.66
|
|
||
|
Awards vested
|
(285
|
)
|
4.82
|
|
||
|
Awards forfeited
|
(5
|
)
|
4.43
|
|
||
|
Nonvested at December 31, 2016
|
145
|
|
$
|
5.02
|
|
|
Total unrecognized compensation cost from restricted shares was
$0.4 million
as of
December 31, 2016
, which is expected to be recognized over a weighted-average period of approximately
0.4
years beginning January 1, 2017.
69
|
5.
|
Other Income and Expense
|
Other income and expense consists of the following:
|
For the Year Ended December 31,
|
|||||||||||
|
2016
|
2015
|
2014
|
|||||||||
|
(In thousands)
|
|||||||||||
|
Interest income
|
$
|
(1,326
|
)
|
$
|
(2,539
|
)
|
$
|
(3,359
|
)
|
||
|
Foreign currency (gain) loss, net
|
(3,592
|
)
|
(7,849
|
)
|
(9,808
|
)
|
|||||
|
Loss on debt retirement
|
—
|
|
9,560
|
|
757
|
|
|||||
|
Loss from acquisition of J-Devices (Note 3)
|
—
|
|
13,501
|
|
—
|
|
|||||
|
Gain on sale of subsidiary to J-Devices (Note 3)
|
—
|
|
—
|
|
(9,155
|
)
|
|||||
|
Other (income) expense, net
|
(936
|
)
|
(2,122
|
)
|
(2,978
|
)
|
|||||
|
Total other (income) expense, net
|
$
|
(5,854
|
)
|
$
|
10,551
|
|
$
|
(24,543
|
)
|
||
|
6.
|
Income Taxes
|
Geographic sources of income (loss) before income taxes are as follows:
|
|
For the Year Ended December 31,
|
||||||||||
|
2016
|
2015
|
2014
|
|||||||||
|
(In thousands)
|
|||||||||||
|
United States
|
$
|
(12,385
|
)
|
$
|
(39,684
|
)
|
$
|
16,571
|
|
||
|
Foreign
|
227,542
|
|
107,596
|
|
119,507
|
|
|||||
|
Total income before income taxes
|
$
|
215,157
|
|
$
|
67,912
|
|
$
|
136,078
|
|
||
The provision for income taxes includes current federal, state and foreign taxes payable and those deferred because of temporary differences between the financial statement and the tax bases of assets and liabilities.
The components of the provision (benefit) for income taxes are as follows:
|
For the Year Ended December 31,
|
|||||||||||
|
2016
|
2015
|
2014
|
|||||||||
|
(In thousands)
|
|||||||||||
|
Current
|
|||||||||||
|
Federal
|
$
|
—
|
|
$
|
—
|
|
$
|
—
|
|
||
|
State
|
22
|
|
11
|
|
(46
|
)
|
|||||
|
Foreign
|
49,577
|
|
28,721
|
|
51,081
|
|
|||||
|
49,599
|
|
28,732
|
|
51,035
|
|
||||||
|
Deferred
|
|||||||||||
|
Federal
|
—
|
|
—
|
|
—
|
|
|||||
|
State
|
—
|
|
—
|
|
—
|
|
|||||
|
Foreign
|
(1,746
|
)
|
(697
|
)
|
(17,190
|
)
|
|||||
|
(1,746
|
)
|
(697
|
)
|
(17,190
|
)
|
||||||
|
Total provision
|
$
|
47,853
|
|
$
|
28,035
|
|
$
|
33,845
|
|
||
70
The reconciliation between the U.S. federal statutory income tax rate of
35%
and our income tax provision is as follows:
|
For the Year Ended December 31,
|
|||||||||||
|
2016
|
2015
|
2014
|
|||||||||
|
(In thousands)
|
|||||||||||
|
U.S. federal tax at 35%
|
$
|
75,305
|
|
$
|
23,769
|
|
$
|
47,627
|
|
||
|
State taxes, net of federal benefit
|
836
|
|
2,622
|
|
1,940
|
|
|||||
|
Foreign income taxed at different rates
|
(17,907
|
)
|
(11,756
|
)
|
6,579
|
|
|||||
|
Foreign exchange (loss) gain
|
(1,127
|
)
|
(5,680
|
)
|
(17,321
|
)
|
|||||
|
Change in valuation allowance
|
(7,362
|
)
|
18,259
|
|
(13,527
|
)
|
|||||
|
Adjustments related to prior years
|
(2,648
|
)
|
(912
|
)
|
3,643
|
|
|||||
|
Income tax credits generated
|
(40,301
|
)
|
(1,919
|
)
|
(2,557
|
)
|
|||||
|
Repatriation of foreign earnings and profits
|
25,604
|
|
91
|
|
3,958
|
|
|||||
|
Expiration of net operating losses and credits
|
15,092
|
|
74
|
|
2,534
|
|
|||||
|
Non-deductible loss on acquisition of J-Devices (Note 3)
|
—
|
|
4,725
|
|
—
|
|
|||||
|
Other
|
361
|
|
(1,238
|
)
|
969
|
|
|||||
|
Total
|
$
|
47,853
|
|
$
|
28,035
|
|
$
|
33,845
|
|
||
The change in valuation allowance for 2016, 2015 and 2014 is primarily the result of changes in net operating loss and tax credit carryforwards for which no tax expense or benefit has been recognized. In 2016, we recognized taxable income and associated foreign income tax credits from the repatriation of current year foreign earnings and profits in connection with the merger of our Japanese subsidiaries. In 2015, we recognized a loss in connection with our increased ownership interest in J-Devices which is not deductible for income tax purposes. The 2014 change in foreign income taxed at different rates was due to a change in the geographic income mix which resulted in a lower tax benefit.
71
The following is a summary of the components of our deferred tax assets and liabilities:
|
December 31,
|
|||||||
|
2016
|
2015
|
||||||
|
(In thousands)
|
|||||||
|
Deferred tax assets:
|
|||||||
|
Net operating loss carryforwards
|
$
|
111,899
|
|
$
|
147,056
|
|
|
|
Income tax credits
|
41,900
|
|
27,212
|
|
|||
|
Property, plant and equipment
|
21,860
|
|
21,921
|
|
|||
|
Accrued liabilities
|
68,563
|
|
62,016
|
|
|||
|
Unrealized foreign exchange loss
|
531
|
|
869
|
|
|||
|
Other
|
14,583
|
|
16,659
|
|
|||
|
Total deferred tax assets
|
259,336
|
|
275,733
|
|
|||
|
Valuation allowance
|
(165,367
|
)
|
(168,105
|
)
|
|||
|
Total deferred tax assets net of valuation allowance
|
93,969
|
|
107,628
|
|
|||
|
Deferred tax liabilities:
|
|||||||
|
Property, plant and equipment
|
20,407
|
|
31,345
|
|
|||
|
Deferred gain
|
2,655
|
|
3,716
|
|
|||
|
Other
|
5,826
|
|
6,713
|
|
|||
|
Total deferred tax liabilities
|
28,888
|
|
41,774
|
|
|||
|
Net deferred tax assets
|
$
|
65,081
|
|
$
|
65,854
|
|
|
|
Recognized as:
|
|||||||
|
Other assets
|
66,831
|
|
70,784
|
|
|||
|
Other non-current liabilities
|
(1,750
|
)
|
(4,930
|
)
|
|||
|
Total
|
$
|
65,081
|
|
$
|
65,854
|
|
|
As a result of certain income tax accounting realization requirements with respect to accounting for share-based compensation, the table of deferred tax assets and liabilities does not include
$4.6 million
of deferred tax assets as of December 31, 2015 that arose directly from tax deductions related to equity compensation greater than compensation recognized for financial reporting. As a result of the adoption of ASU 2016-09 on July 1, 2016, deferred tax assets now include the impact of tax deductions related to equity compensation greater than compensation recognized for financial reporting.
As a result of certain capital investments, export commitments and employment levels, income from operations in Korea, Malaysia, the Philippines and Taiwan was subject to reduced income tax rates and, in some cases, was exempt from income taxes. The reduced tax rates or tax exemptions expire at various dates through
2025
. We recognized
$5.6 million
,
$3.3 million
and
$0.9 million
in tax benefits as a result of the tax holidays in
2016
,
2015
and
2014
, respectively. The benefit of the tax holidays on diluted earnings per share was approximately
$0.02
,
$0.01
and
$0.00
for
2016
,
2015
and
2014
, respectively.
72
Our net operating loss carryforwards (“NOL’s”) are as follows:
|
December 31,
|
|||||||||
|
2016
|
2015
|
Expiration
|
|||||||
|
(In thousands)
|
|||||||||
|
U.S. Federal NOL’s
|
$
|
292,715
|
|
$
|
363,648
|
|
2021-2036
|
||
|
U.S. State NOL’s
|
138,218
|
|
182,420
|
|
2017-2036
|
||||
|
Foreign NOL’s
|
3,378
|
|
64,999
|
|
2017-2025
|
||||
We monitor on an ongoing basis our ability to utilize our deferred tax assets and whether there is a need for a related valuation allowance. In evaluating our ability to recover our deferred tax assets in the jurisdictions from which they arise, we consider all available positive and negative evidence, including scheduled reversals of deferred tax liabilities, projected future taxable income, tax-planning strategies and results of recent operations. For most of our foreign deferred tax assets, we consider it more likely than not that we will have sufficient taxable income to allow us to realize these deferred tax assets.
The deferred tax assets associated with our U.S. federal and state net operating losses available for carryforward have been fully reserved with valuation allowances at December 31,
2016
and
2015
. Also, our ability to utilize our U.S. net operating loss carryforwards may be limited in the future if we experience an ownership change as defined by the Internal Revenue Code.
At
December 31, 2016
, we have various tax credits available to be carried forward including U.S. foreign income tax credits totaling
$31.5 million
which expire in 2026. The deferred tax assets associated with the U.S. foreign income tax credits have been fully reserved with a valuation allowance. Income tax credits generated by certain of our foreign subsidiaries in
2016
,
2015
and
2014
have been recognized in our income tax provision.
Income taxes have not been provided on approximately
$917.0 million
of the undistributed earnings of our foreign subsidiaries at
December 31, 2016
, over which we have sufficient influence to control the distribution of such earnings and have determined that substantially all such earnings have been reinvested indefinitely. These earnings could become subject to either or both U.S. federal income tax and foreign withholding tax if they are remitted as dividends, if foreign earnings are loaned to any of our domestic companies, or if we sell our investment in certain subsidiaries. We estimate that repatriation of these foreign earnings would generate withholding taxes and income taxes of approximately
$42.1 million
.
We operate in and file income tax returns in various U.S. and foreign jurisdictions which are subject to examination by tax authorities. We have tax returns that are open to examination in various jurisdictions for tax years 2010-2016. The open years contain matters that could be subject to differing interpretations of applicable tax laws and regulations related to the amount and/or timing of income, deductions and tax credits. There can be no assurance that the outcome of examinations will be favorable. Our unrecognized tax benefits are subject to change as examinations of specific tax years are completed in the respective jurisdictions. Current examinations include our 2012 and 2013 Philippine income tax returns and 2010-2014 Malaysian income tax returns.
73
A reconciliation of the beginning and ending gross amount of unrecognized tax benefits is as follows:
|
For the Year Ended December 31,
|
|||||||||||
|
2016
|
2015
|
2014
|
|||||||||
|
(In thousands)
|
|||||||||||
|
Balance at January 1
|
$
|
23,332
|
|
$
|
12,670
|
|
$
|
27,128
|
|
||
|
Additions based on tax positions related to the current year
|
1,822
|
|
12,727
|
|
6,032
|
|
|||||
|
Additions for tax positions of prior years
|
689
|
|
3,341
|
|
1,240
|
|
|||||
|
Reductions for tax positions of prior years
|
(2,589
|
)
|
(4,815
|
)
|
(15,433
|
)
|
|||||
|
Reductions related to settlements with tax authorities
|
—
|
|
—
|
|
(6,297
|
)
|
|||||
|
Reductions from lapse of statutes of limitations
|
(105
|
)
|
(591
|
)
|
—
|
|
|||||
|
Balance at December 31
|
$
|
23,149
|
|
$
|
23,332
|
|
$
|
12,670
|
|
||
The net decrease in our unrecognized tax benefits was
$0.2 million
from
December 31, 2015
to
December 31, 2016
. Our unrecognized tax benefits decreased by
$2.0 million
as a result of the positive ruling on the tax treatment of an expense. The decrease was offset by increases primarily related to income attribution and income characterization. At
December 31, 2016
, all of our gross unrecognized tax benefits would reduce our effective tax rate, if recognized.
The liability related to our unrecognized tax benefits is
$21.3 million
as of
December 31, 2016
, and is reported as a component of other non-current liabilities. The unrecognized tax benefits presented in the table above include positions that have reduced deferred tax assets, which are not included in the liability reported as a component of other non-current liabilities. The balance of accrued and unpaid interest and penalties is
$2.5 million
as of
December 31, 2016
and is included as a component in other non-current liabilities in connection with our unrecognized tax benefits.
74
|
7.
|
Earnings Per Share
|
Basic earnings per share (“EPS”) is computed by dividing net income attributable to Amkor common stockholders by the weighted-average number of common shares outstanding during the period. The weighted-average number of common shares outstanding includes restricted shares held by retirement eligible recipients and is reduced for treasury stock.
Diluted EPS is computed on the basis of the weighted-average number of shares of common stock plus the effect of dilutive potential common shares outstanding during the period. Dilutive potential common shares include outstanding stock options, unvested restricted shares and convertible debt. The following table summarizes the computation of basic and diluted EPS:
|
For the Year Ended December 31,
|
|||||||||||
|
2016
|
2015
|
2014
|
|||||||||
|
(In thousands, except per share data)
|
|||||||||||
|
Net income attributable to Amkor
|
$
|
164,190
|
|
$
|
51,098
|
|
$
|
129,739
|
|
||
|
Income allocated to participating securities
|
—
|
|
(59
|
)
|
(370
|
)
|
|||||
|
Net income available to Amkor common stockholders — basic
|
164,190
|
|
51,039
|
|
129,369
|
|
|||||
|
Adjustment for dilutive securities on net income:
|
|||||||||||
|
Net income reallocated to participating securities
|
—
|
|
—
|
|
6
|
|
|||||
|
Interest on 6.0% convertible notes due 2014, net of tax
|
—
|
|
—
|
|
1,039
|
|
|||||
|
Net income attributable to Amkor — diluted
|
$
|
164,190
|
|
$
|
51,039
|
|
$
|
130,414
|
|
||
|
Weighted-average shares outstanding — basic
|
237,416
|
|
236,850
|
|
230,710
|
|
|||||
|
Effect of dilutive securities:
|
|||||||||||
|
Stock options and restricted share awards
|
618
|
|
320
|
|
712
|
|
|||||
|
6.0% convertible notes due 2014
|
—
|
|
—
|
|
5,309
|
|
|||||
|
Weighted-average shares outstanding — diluted
|
238,034
|
|
237,170
|
|
236,731
|
|
|||||
|
Net income attributable to Amkor per common share:
|
|||||||||||
|
Basic
|
$
|
0.69
|
|
$
|
0.22
|
|
$
|
0.56
|
|
||
|
Diluted
|
0.69
|
|
0.22
|
|
0.55
|
|
|||||
The following table summarizes the potential shares of common stock that were excluded from diluted EPS, because the effect of including these potential shares was anti-dilutive:
|
For the Year Ended December 31,
|
||||||||
|
2016
|
2015
|
2014
|
||||||
|
(In thousands)
|
||||||||
|
Stock options and restricted share awards
|
1,135
|
|
1,858
|
|
1,303
|
|
||
75
|
8.
|
Factoring of Accounts Receivable
|
In certain foreign locations, we use non-recourse factoring arrangements with third party financial institutions to manage our working capital and cash flows. Under this program, we sell receivables to a financial institution for cash at a discount to the face amount. As part of the factoring arrangements, we perform certain collection and administrative functions for the receivables sold. For the year ended
December 31, 2016
and
2015
, we sold accounts receivable totaling
$574.1 million
and
$323.5 million
, respectively, for a discount, plus fees, of
$2.5 million
and
$1.5 million
, respectively.
|
9.
|
Inventories
|
Inventories consist of the following:
|
December 31,
|
|||||||
|
2016
|
2015
|
||||||
|
(In thousands)
|
|||||||
|
Raw materials and purchased components
|
$
|
173,035
|
|
$
|
163,024
|
|
|
|
Work-in-process
|
94,955
|
|
75,181
|
|
|||
|
Total inventories
|
$
|
267,990
|
|
$
|
238,205
|
|
|
|
10.
|
Property, Plant and Equipment
|
Property, plant and equipment consist of the following:
|
December 31,
|
|||||||
|
2016
|
2015
|
||||||
|
(In thousands)
|
|||||||
|
Land
|
$
|
240,719
|
|
$
|
237,815
|
|
|
|
Land use rights
|
26,845
|
|
26,845
|
|
|||
|
Buildings and improvements
|
1,362,007
|
|
1,010,201
|
|
|||
|
Machinery and equipment
|
4,483,523
|
|
4,226,401
|
|
|||
|
Software and computer equipment
|
205,969
|
|
197,266
|
|
|||
|
Furniture, fixtures and other equipment
|
21,313
|
|
21,259
|
|
|||
|
Construction in progress
|
87,037
|
|
352,607
|
|
|||
|
Total property, plant and equipment
|
6,427,413
|
|
6,072,394
|
|
|||
|
Less accumulated depreciation and amortization
|
(3,862,765
|
)
|
(3,493,377
|
)
|
|||
|
Total property, plant and equipment, net
|
$
|
2,564,648
|
|
$
|
2,579,017
|
|
|
The following table summarizes our depreciation expense:
|
For the Year Ended December 31,
|
|||||||||||
|
|
2016
|
2015
|
2014
|
||||||||
|
|
(In thousands)
|
||||||||||
|
Depreciation expense
|
$
|
552,989
|
|
$
|
492,458
|
|
$
|
463,540
|
|
||
In December 2016, we completed the initial phase of construction of K5 and transferred
$325.8 million
from construction in progress to building and improvements and machinery and equipment. We had
$44.8 million
and
$312.1 million
of costs for K5 in construction in progress as of
December 31, 2016
and 2015, respectively.
76
As part of our plan to consolidate factory operations in Korea, we entered into an agreement in November 2016 to sell the land and buildings comprising our K1 factory for a sale price of
₩162.1 billion
(approximately
$135 million
). We received
10%
of the purchase price at signing and the balance is due at closing. The transaction is expected to close during the second quarter of 2017 at which time we expect to recognize a pre-tax gain of approximately
$100 million
.
|
11.
|
Goodwill
|
The following table presents the changes in the carrying amount of goodwill:
|
Goodwill
|
|||
|
(In thousands)
|
|||
|
Balance as of December 31, 2014
|
$
|
—
|
|
|
Goodwill acquired
|
23,409
|
|
|
|
Balance as of December 31, 2015
|
$
|
23,409
|
|
|
Translation adjustments
|
713
|
|
|
|
Balance as of December 31, 2016
|
$
|
24,122
|
|
Goodwill relates to the increase in our ownership interest in J-Devices to
100%
on
December 30, 2015
(
Note 3
). No goodwill impairment has been identified in any of the years presented.
|
12.
|
Accrued Expenses
|
Accrued expenses consist of the following:
|
December 31,
|
|||||||
|
2016
|
2015
|
||||||
|
(In thousands)
|
|||||||
|
Payroll and benefits
|
$
|
117,636
|
|
$
|
95,011
|
|
|
|
Deferred revenue and customer advances
|
65,653
|
|
49,243
|
|
|||
|
Income taxes payable
|
37,961
|
|
21,448
|
|
|||
|
Accrued settlement costs
|
35,304
|
|
32,987
|
|
|||
|
Accrued severance plan obligations (Note 14)
|
14,053
|
|
14,306
|
|
|||
|
Accrued interest
|
13,046
|
|
12,920
|
|
|||
|
Other accrued expenses
|
55,016
|
|
38,297
|
|
|||
|
Total accrued expenses
|
$
|
338,669
|
|
$
|
264,212
|
|
|
77
|
13.
|
|
Following is a summary of short-term borrowings and long-term debt:
|
December 31,
|
|||||||
|
2016
|
2015
|
||||||
|
(In thousands)
|
|||||||
|
Debt of Amkor Technology, Inc.:
|
|||||||
|
Senior secured credit facilities:
|
|||||||
|
$200 million revolving credit facility, LIBOR plus 1.25%-1.75%, due December 2019 (1)
|
$
|
—
|
|
$
|
100,000
|
|
|
|
Senior notes:
|
|||||||
|
6.625% Senior notes, due June 2021, $75 million related party
|
400,000
|
|
400,000
|
|
|||
|
6.375% Senior notes, due October 2022
|
524,971
|
|
525,000
|
|
|||
|
Debt of subsidiaries:
|
|||||||
|
Amkor Technology Korea, Inc.:
|
|||||||
|
$100 million revolving credit facility, foreign currency funding-linked base rate plus 1.60%, due June 2017 (2)
|
—
|
|
40,000
|
|
|||
|
Term loan, LIBOR plus 2.60%, due May 2018
|
120,000
|
|
120,000
|
|
|||
|
Term loan, LIBOR plus 2.70%, due December 2019
|
55,000
|
|
70,000
|
|
|||
|
Term loan, foreign currency funding-linked base rate plus 1.32%, due May 2020
|
150,000
|
|
150,000
|
|
|||
|
Term loan, foreign currency funding-linked base rate plus 1.33%, due May 2020
|
80,000
|
|
80,000
|
|
|||
|
Term loan, fund floating rate plus 1.60%, due June 2020 (3)
|
86,000
|
|
40,000
|
|
|||
|
J-Devices Corporation:
|
|||||||
|
Short-term term loans, variable rate (4)
|
22,230
|
|
15,582
|
|
|||
|
Term loans, fixed rate at 0.53%, due April 2018
|
19,460
|
|
31,465
|
|
|||
|
Short-term term loans, fixed rate at 0.50%
|
—
|
|
5,808
|
|
|||
|
Term loans, TIBOR plus 1.00%
|
—
|
|
2,800
|
|
|||
|
Other:
|
|||||||
|
Revolving credit facility, TAIFX plus a bank-determined spread, due November 2020 (Taiwan) (5)
|
20,000
|
|
10,000
|
|
|||
|
Term loan, LIBOR plus 1.80%, due December 2019 (China) (6)
|
—
|
|
—
|
|
|||
|
1,477,661
|
|
1,590,655
|
|
||||
|
Less: Unamortized premium and deferred debt costs, net
|
(2,831
|
)
|
(3,616
|
)
|
|||
|
Less: Short-term borrowings and current portion of long-term debt
|
(35,192
|
)
|
(76,770
|
)
|
|||
|
Long-term debt (including related party)
|
$
|
1,439,638
|
|
$
|
1,510,269
|
|
|
|
(1)
|
Our
$200.0 million
senior secured revolving credit facility has a letter of credit sub-limit of
$25.0 million
. Principal is payable at maturity.
The availability for the revolving credit facility is based on the amount of our eligible accounts receivable, which exceeded $200.0 million
as of
December 31, 2016
. Additionally, we had
$0.5 million
of standby letters of credit outstanding, resulting in
$199.5 million
available to be drawn.
|
|
(2)
|
In June 2012, we entered into a
$41.0 million
revolving credit facility. In March 2016, we increased the facility to
$100.0 million
. In June 2016, we amended the maturity date to June 2017. Principal is payable at maturity. As of
December 31, 2016
,
$100.0 million
was available to be drawn.
|
78
|
(3)
|
In May 2015, we entered into a term loan agreement pursuant to which we may borrow up to
$150.0 million
for capital expenditures. In November 2016, the loan agreement was amended to extend the period for which we may borrow to June 2020. Principal is payable at maturity. At
December 31, 2016
,
$64.0 million
was available to be borrowed.
|
|
(4)
|
We entered into various short-term loans which mature semi-annually. Principle is payable in monthly installments. As of
December 31, 2016
,
$4.7 million
was available to be drawn.
|
|
(5)
|
In November 2015, we entered into a
$39.0 million
revolving credit facility. Principal is payable at maturity. As of
December 31, 2016
,
$19.0 million
was available to be drawn.
|
|
(6)
|
In December 2016, we entered into a
$50.0 million
term loan agreement. Principal is payable in semiannual installments of
$0.5 million
, with the remaining balance due at maturity. In January 2017, we borrowed
$50.0 million
.
|
Our foreign debt is generally collateralized by the land, buildings and equipment in the respective locations. The carrying value of the collateral exceeds the carrying amount of the debt.
Interest Rates
Interest is payable semiannually on our senior notes and quarterly or monthly on our other variable and fixed rate debt. Refer to the table above for the interest rates on our fixed rate debt and to the table below for the interest rates on our variable rate debt.
|
Variable Interest Rates at December 31,
|
|||||
|
2016
|
2015
|
||||
|
Amkor Technology, Inc.:
|
|||||
|
$200 million revolving credit facility, LIBOR plus 1.25%-1.75%, due December 2019
|
—
|
%
|
2.13
|
%
|
|
|
Amkor Technology Korea, Inc.:
|
|||||
|
$100 million revolving credit facility, foreign currency funding-linked base rate plus 1.60%, due June 2017
|
—
|
%
|
3.32
|
%
|
|
|
Term loan, LIBOR plus 2.60%, due May 2018
|
3.49
|
%
|
2.99
|
%
|
|
|
Term loan, LIBOR plus 2.70%, due December 2019
|
3.54
|
%
|
3.02
|
%
|
|
|
Term loan, foreign currency funding-linked base rate plus 1.32%, due May 2020
|
3.58
|
%
|
3.19
|
%
|
|
|
Term loan, foreign currency funding-linked base rate plus 1.33%, due May 2020
|
3.59
|
%
|
3.19
|
%
|
|
|
Term Loan, fund floating rate plus 1.60%, due June 2020
|
2.79
|
%
|
2.32
|
%
|
|
|
J-Devices Corporation:
|
|||||
|
Short-term credit facilities, variable rate
|
0.32
|
%
|
0.46
|
%
|
|
|
Term loans, TIBOR plus 1.00%
|
—
|
%
|
1.13
|
%
|
|
|
Amkor Technology Taiwan Ltd.:
|
|||||
|
Revolving credit facility, TAIFX plus a bank-determined spread, due November 2020
|
2.78
|
%
|
1.66
|
%
|
|
Compliance with Debt Covenants
The debt of Amkor Technology, Inc. is structurally subordinated in right of payment to all existing and future debt and other liabilities of our subsidiaries. The agreements governing our indebtedness contain a number of affirmative and negative covenants which restrict our ability to pay dividends and could restrict our operations. We have never paid a dividend to our stockholders and we do not have any present plans for doing so. We were in compliance with all of our covenants at
December 31, 2016
and
2015
.
79
Maturities
|
Total Debt
|
|||
|
(In thousands)
|
|||
|
Payments due for the year ending December 31,
|
|||
|
2017
|
$
|
35,192
|
|
|
2018
|
126,498
|
|
|
|
2019
|
135,000
|
|
|
|
2020
|
256,000
|
|
|
|
2021
|
400,000
|
|
|
|
Thereafter
|
524,971
|
|
|
|
Total debt
|
$
|
1,477,661
|
|
14.
Pension and Severance Plans
Korean Severance Plan
Our subsidiary in Korea maintains an unfunded severance plan that covers certain employees that were employed prior to August 1, 2015. To the extent eligible employees are terminated, our subsidiary in Korea would be required to make lump-sum severance payments on behalf of these eligible employees for service provided prior to August 1, 2015. Factors used to determine severance benefits include employees' length of service, seniority and rate of pay. The employees' length of service and seniority are fixed as of July 31, 2015. The employees' rate of pay is adjusted to the rate of pay at the time of termination. Accrued severance benefits are estimated assuming all eligible employees were to terminate their employment at the balance sheet date. Our contributions to the National Pension Plan of the Republic of Korea are deducted from accrued severance benefit liabilities. On August 1, 2015, our subsidiary in Korea began sponsoring a defined benefit pension plan and a defined contribution plan. Existing employees at that time were given the option of choosing either a defined benefit pension plan or a defined contribution plan for their future benefits and new employees since that date are enrolled in a defined contribution plan.
The changes to the balance of our severance accrual are as follows:
|
For the Year Ended December 31,
|
|||||||||||
|
2016
|
2015
|
2014
|
|||||||||
|
(In thousands)
|
|||||||||||
|
Balance at the beginning of year
|
$
|
143,151
|
|
$
|
146,880
|
|
$
|
145,373
|
|
||
|
Provision of severance benefits
|
6,746
|
|
21,088
|
|
17,593
|
|
|||||
|
Severance payments
|
(9,429
|
)
|
(15,021
|
)
|
(10,160
|
)
|
|||||
|
(Gain) loss on foreign currency
|
(4,072
|
)
|
(9,796
|
)
|
(5,926
|
)
|
|||||
|
136,396
|
|
143,151
|
|
146,880
|
|
||||||
|
Payments remaining with the National Pension Fund
|
(182
|
)
|
(192
|
)
|
(219
|
)
|
|||||
|
Total severance obligation balance at the end of year
|
136,214
|
|
142,959
|
|
146,661
|
|
|||||
|
Less current portion of accrued severance obligation (Note 12)
|
14,053
|
|
14,306
|
|
13,226
|
|
|||||
|
Non-current portion of severance obligation
|
$
|
122,161
|
|
$
|
128,653
|
|
$
|
133,435
|
|
||
80
Foreign Defined Benefit Pension Plans
Our subsidiaries in Japan, Korea, Malaysia, the Philippines and Taiwan sponsor defined benefit plans (the “Plans”). Charges to expense are based upon actuarial analyses.
The following table summarizes the Plans’ benefit obligations, fair value of the Plans’ assets and the funded status of the Plans at
December 31, 2016
and
2015
.
|
For the Year Ended
December 31,
|
|||||||
|
2016
|
2015
|
||||||
|
(In thousands)
|
|||||||
|
Change in projected benefit obligation:
|
|||||||
|
Projected benefit obligation at beginning of year
|
$
|
109,695
|
|
$
|
74,009
|
|
|
|
Service cost
|
33,854
|
|
12,481
|
|
|||
|
Interest cost
|
3,641
|
|
2,954
|
|
|||
|
Benefits paid
|
(8,499
|
)
|
(3,924
|
)
|
|||
|
Actuarial (gain) loss
|
(2,801
|
)
|
(2,631
|
)
|
|||
|
Acquisition (Note 3)
|
—
|
|
31,859
|
|
|||
|
Settlement
|
(1,165
|
)
|
—
|
|
|||
|
Foreign exchange (gain) loss
|
(3,309
|
)
|
(5,053
|
)
|
|||
|
Projected benefit obligation at end of year
|
131,416
|
|
109,695
|
|
|||
|
Change in plan assets:
|
|||||||
|
Fair value of plan assets at beginning of year
|
76,042
|
|
54,771
|
|
|||
|
Actual gain (loss) on plan assets
|
2,876
|
|
1,564
|
|
|||
|
Employer contributions
|
25,114
|
|
12,190
|
|
|||
|
Acquisition (Note 3)
|
—
|
|
13,935
|
|
|||
|
Settlement
|
(1,165
|
)
|
—
|
|
|||
|
Benefits paid
|
(8,499
|
)
|
(3,924
|
)
|
|||
|
Foreign exchange gain (loss)
|
(2,897
|
)
|
(2,494
|
)
|
|||
|
Fair value of plan assets at end of year
|
91,471
|
|
76,042
|
|
|||
|
Funded status of the Plans at end of year
|
$
|
(39,945
|
)
|
$
|
(33,653
|
)
|
|
The accrued benefit liability, included in pension and severance obligations in the Consolidated Balance Sheets, as of
December 31, 2016
and
2015
was
$39.9 million
and
$33.7 million
, respectively. The accumulated benefit obligation as of
December 31, 2016
and
2015
was
$94.5 million
and
$77.6 million
, respectively.
81
The following table summarizes, by component, the change in accumulated other comprehensive income (loss) related to our Plans:
|
Prior Service
Cost
|
Actuarial Net Gain (Loss)
|
Total
|
|||||||||
|
(In thousands)
|
|||||||||||
|
Balance at December 31, 2014, net of tax
|
$
|
540
|
|
$
|
(3,065
|
)
|
$
|
(2,525
|
)
|
||
|
Amortization included in net periodic pension cost
|
20
|
|
68
|
|
88
|
|
|||||
|
Net gain (loss) arising during period
|
—
|
|
1,012
|
|
1,012
|
|
|||||
|
Adjustments to unrealized components of defined benefit pension plan included in other comprehensive income (loss)
|
20
|
|
1,080
|
|
1,100
|
|
|||||
|
Balance at December 31, 2015, net of tax
|
$
|
560
|
|
$
|
(1,985
|
)
|
$
|
(1,425
|
)
|
||
|
Amortization included in net periodic pension cost
|
22
|
|
73
|
|
95
|
|
|||||
|
Net gain (loss) arising during period
|
—
|
|
2,468
|
|
2,468
|
|
|||||
|
Adjustments to unrealized components of defined benefit pension plan included in other comprehensive income (loss)
|
22
|
|
2,541
|
|
2,563
|
|
|||||
|
Balance at December 31, 2016, net of tax
|
$
|
582
|
|
$
|
556
|
|
$
|
1,138
|
|
||
|
Estimated amortization of cost to be included in 2017 net periodic pension cost
|
$
|
30
|
|
$
|
84
|
|
$
|
114
|
|
||
Information for pension plans with benefit obligations in excess of plan assets are as follows:
|
December 31,
|
|||||||
|
2016
|
2015
|
||||||
|
(In thousands)
|
|||||||
|
Plans with underfunded or non-funded projected benefit obligation:
|
|||||||
|
Aggregate projected benefit obligation
|
$
|
131,416
|
|
$
|
101,832
|
|
|
|
Aggregate fair value of plan assets
|
91,471
|
|
67,622
|
|
|||
|
Plans with underfunded or non-funded accumulated benefit obligation:
|
|||||||
|
Aggregate accumulated benefit obligation
|
49,285
|
|
40,428
|
|
|||
|
Aggregate fair value of plan assets
|
16,811
|
|
13,944
|
|
|||
The following table summarizes net periodic pension costs:
|
For the Year Ended December 31,
|
|||||||||||
|
2016
|
2015
|
2014
|
|||||||||
|
(In thousands)
|
|||||||||||
|
Components of net periodic pension cost and total pension expense:
|
|||||||||||
|
Service cost
|
$
|
33,854
|
|
$
|
12,481
|
|
$
|
5,042
|
|
||
|
Interest cost
|
3,641
|
|
2,954
|
|
3,051
|
|
|||||
|
Expected return on plan assets
|
(3,788
|
)
|
(3,330
|
)
|
(3,094
|
)
|
|||||
|
Amortization of prior service cost
|
35
|
|
34
|
|
116
|
|
|||||
|
Recognized actuarial (gain) loss
|
94
|
|
91
|
|
141
|
|
|||||
|
Net periodic pension cost
|
33,836
|
|
12,230
|
|
5,256
|
|
|||||
|
Settlement (gain) loss
|
128
|
|
27
|
|
97
|
|
|||||
|
Total pension expense
|
$
|
33,964
|
|
$
|
12,257
|
|
$
|
5,353
|
|
||
82
As a result of the adoption of a defined benefit pension plan in Korea beginning on August 1, 2015, and the acquisition of J-Devices on December 30, 2015, our net periodic pension cost has increased from the prior periods.
The following table summarizes the weighted-average assumptions used in computing the net periodic pension cost and projected benefit obligation at
December 31, 2016
,
2015
and
2014
:
|
For the Year Ended December 31,
|
||||||||
|
2016
|
2015
|
2014
|
||||||
|
Discount rate for determining net periodic pension cost
|
3.3
|
%
|
4.2
|
%
|
3.9
|
%
|
||
|
Discount rate for determining benefit obligations at year end
|
3.1
|
%
|
3.3
|
%
|
4.2
|
%
|
||
|
Rate of compensation increase for determining net periodic
pension cost
|
3.9
|
%
|
4.7
|
%
|
4.1
|
%
|
||
|
Rate of compensation increase for determining benefit obligations
at year end
|
3.8
|
%
|
3.9
|
%
|
4.7
|
%
|
||
|
Expected rate of return on plan assets for determining net periodic
pension cost
|
5.0
|
%
|
6.2
|
%
|
6.2
|
%
|
||
The measurement date for determining the Plans’ assets and benefit obligations is December 31, each year. Discount rates are generally derived from yield curves constructed from high-quality corporate or foreign government bonds, for which the timing and amount of cash outflows approximate the estimated payouts.
The expected rate of return assumption is based on weighted-average expected returns for each asset class. Expected returns reflect a combination of historical performance analysis and the forward-looking views of the financial markets and include input from our actuaries. We have no control over the direction of our investments in our defined benefit plans in Taiwan as the local Labor Standards Law Fund mandates such contributions into a cash account balance at the Bank of Taiwan. One of our defined benefit pension plans in Japan and our defined benefit pension plan in Malaysia are non-funded plans, and as such, no assets exist related to these plans. Our investment strategies for our other defined benefit plan in Japan and our defined benefit plans in Korea and the Philippines, are based on long-term, sustained asset growth through low to medium risk investments. The current rate of return assumption targets are based on asset allocation strategies as follows:
|
Allocation
|
||||||||
|
Debt
|
Equity
|
Other
|
||||||
|
Japan defined benefit plan
|
59
|
%
|
39
|
%
|
2
|
%
|
||
|
Korea defined benefit plan
|
40
|
%
|
50
|
%
|
10
|
%
|
||
|
Philippine defined benefit plan
|
40
|
%
|
56
|
%
|
4
|
%
|
||
Philippine plan assets included Amkor common stock of
$0.6 million
at December 31, 2015. The common stock was sold in 2016.
83
The fair value of our pension plan assets, by asset category utilizing the fair value hierarchy as discussed in
Note 16
, is as follows:
|
December 31,
|
|||||||
|
2016
|
2015
|
||||||
|
(In thousands)
|
|||||||
|
Cash and cash equivalents (Level 1)
|
$
|
10,419
|
|
$
|
14,944
|
|
|
|
Equity securities
|
|||||||
|
U.S. securities (Level 1)
|
12,602
|
|
19,501
|
|
|||
|
Foreign securities (Level 1)
|
8,825
|
|
10,689
|
|
|||
|
Foreign mutual funds (Level 1)
|
12,718
|
|
—
|
|
|||
|
34,145
|
|
30,190
|
|
||||
|
Fixed income funds (Level 1)
|
—
|
|
3,492
|
|
|||
|
Debt securities
|
|||||||
|
U.S. government bonds (Level 1)
|
2,859
|
|
2,187
|
|
|||
|
U.S. corporate bonds (Level 1)
|
1,980
|
|
—
|
|
|||
|
Foreign government bonds (Level 1)
|
11,001
|
|
880
|
|
|||
|
Foreign government bonds (Level 2)
|
7,727
|
|
8,092
|
|
|||
|
Foreign corporate bonds (Level 2)
|
1,693
|
|
—
|
|
|||
|
Foreign treasury notes (Level 1)
|
—
|
|
6,665
|
|
|||
|
Foreign mutual funds (Level 1)
|
10,044
|
|
—
|
|
|||
|
35,304
|
|
17,824
|
|
||||
|
Foreign guaranteed investment contracts (Level 3)
|
2,445
|
|
842
|
|
|||
|
Taiwan retirement fund (Level 1)
|
8,972
|
|
8,621
|
|
|||
|
Other (Level 2)
|
186
|
|
129
|
|
|||
|
Total
|
$
|
91,471
|
|
$
|
76,042
|
|
|
The Taiwan retirement fund category of our plan assets represents accounts that our subsidiaries in Taiwan have in a government labor retirement fund in the custody of the Bank of Taiwan. The accounts earn a minimum guaranteed rate of return and are invested in a mix of cash, domestic and foreign equity securities and domestic and foreign debt securities.
We expect to make contributions of approximately
$23 million
during
2017
. We closely monitor the funded status of the Plans with respect to legislative requirements. We intend to make at least the minimum contribution required by law each year.
The estimated future benefit payments related to our foreign defined benefit plans are as follows:
|
Payments
|
|||
|
(In thousands)
|
|||
|
2017
|
$
|
6,884
|
|
|
2018
|
5,748
|
|
|
|
2019
|
7,638
|
|
|
|
2020
|
9,579
|
|
|
|
2021
|
11,540
|
|
|
|
2022 to 2026
|
91,261
|
|
|
84
Defined Contribution Plans
We sponsor defined contribution plans in Korea, Malaysia, Taiwan and the U.S. Total defined contribution expense was
$8.8 million
,
$8.6 million
and
$6.8 million
for
2016
,
2015
and
2014
, respectively.
|
15.
|
Accumulated Other Comprehensive Income (Loss)
|
The following table reflects the changes in accumulated other comprehensive income (loss), net of tax:
|
Defined Benefit Pension
|
Foreign Currency Translation
|
Equity Interest in J-Devices' Other Comprehensive Income (Loss)
|
Total
|
||||||||||||
|
(In thousands)
|
|||||||||||||||
|
Accumulated other comprehensive income (loss) at December 31, 2014
|
$
|
(2,525
|
)
|
$
|
(513
|
)
|
$
|
(29,433
|
)
|
$
|
(32,471
|
)
|
|||
|
Other comprehensive income (loss) before reclassifications
|
1,012
|
|
(146
|
)
|
(154
|
)
|
712
|
|
|||||||
|
Amounts reclassified from accumulated other comprehensive income (loss)
|
88
|
|
—
|
|
29,587
|
|
29,675
|
|
|||||||
|
Other comprehensive income (loss)
|
1,100
|
|
(146
|
)
|
29,433
|
|
30,387
|
|
|||||||
|
Accumulated other comprehensive income (loss) at December 31, 2015
|
$
|
(1,425
|
)
|
$
|
(659
|
)
|
$
|
—
|
|
$
|
(2,084
|
)
|
|||
|
Other comprehensive income (loss) before reclassifications
|
2,468
|
|
5,783
|
|
—
|
|
8,251
|
|
|||||||
|
Amounts reclassified from accumulated other comprehensive income (loss)
|
95
|
|
—
|
|
—
|
|
95
|
|
|||||||
|
Other comprehensive income (loss)
|
2,563
|
|
5,783
|
|
—
|
|
8,346
|
|
|||||||
|
Accumulated other comprehensive income (loss) at December 31, 2016
|
$
|
1,138
|
|
$
|
5,124
|
|
$
|
—
|
|
$
|
6,262
|
|
|||
Amounts reclassified out of accumulated other comprehensive income (loss) are included as a component of net periodic pension cost (
Note 14
) or other (income) expense, net. In 2014, the amount reclassified out of accumulated other comprehensive income (loss) and included in other (income) expense, net was a result of the release of accumulated foreign currency translation adjustments associated with the sale of our subsidiary in Japan (
Note 3
). In 2015, the amount reclassified out of accumulated other comprehensive income (loss) and included in other (income) expense, net was due to the release of our previously held equity interest in J-Devices' accumulated foreign currency translation upon consolidation of J-Devices (
Note 3
).
|
16.
|
Fair Value Measurements
|
The accounting framework for determining fair value includes a hierarchy for ranking the quality and reliability of the information used to measure fair value, which enables the reader of the financial statements to assess the inputs used to develop those measurements. The fair value hierarchy consists of three tiers as follows: Level 1, defined as quoted market prices in active markets for identical assets or liabilities; Level 2, defined as inputs other than Level 1 that are observable, either directly or indirectly, such as quoted prices for similar assets or liabilities, quoted prices in markets that are not active, model-based valuation techniques for which all significant assumptions are observable in the market or other inputs that are observable or can be corroborated by observable market data for substantially the full term of the assets or liabilities and Level 3, defined as unobservable inputs that are not corroborated by market data.
The fair values of cash, accounts receivable, trade accounts payable, capital expenditures payable, and certain other current assets and accrued expenses approximate carrying values because of their short-term nature. The carrying value of certain
85
other non-current liabilities approximates fair value. Our assets and liabilities recorded at fair value on a recurring basis include cash equivalent money market funds and restricted cash money market funds. We also review goodwill for impairment annually during the fourth quarter of each year. Cash equivalent money market funds and restricted cash money market funds are invested in U.S. money market funds and various U.S. and foreign bank operating and time deposit accounts, which are due on demand or carry a maturity date of less than three months when purchased. No restrictions have been imposed on us regarding withdrawal of balances with respect to our cash equivalents as a result of liquidity or other credit market issues affecting the money market funds we invest in or the counterparty financial institutions holding our deposits. Money market funds are valued using quoted market prices in active markets for identical assets.
Our recurring fair value measurements consist of the following:
|
December 31,
|
|||||||
|
2016
|
2015
|
||||||
|
(In thousands)
|
|||||||
|
Cash equivalent money market funds (Level 1)
|
$
|
39,548
|
|
$
|
81,473
|
|
|
|
Restricted cash money market funds (Level 1)
|
2,000
|
|
2,000
|
|
|||
We also measure certain assets and liabilities, including property, plant and equipment and goodwill, at fair value on a nonrecurring basis.
We measure the fair value of our debt for disclosure purposes. The following table presents the fair value of financial instruments that are not recorded at fair value on a recurring basis:
|
December 31, 2016
|
December 31, 2015
|
||||||||||||||
|
Fair
Value
|
Carrying
Value
|
Fair
Value
|
Carrying
Value
|
||||||||||||
|
(In thousands)
|
|||||||||||||||
|
Senior notes (Level 1)
|
$
|
954,765
|
|
$
|
922,140
|
|
$
|
902,563
|
|
$
|
921,384
|
|
|||
|
Revolving credit facilities and term loans (Level 2)
|
551,793
|
|
552,690
|
|
664,085
|
|
665,655
|
|
|||||||
|
Total debt
|
$
|
1,506,558
|
|
$
|
1,474,830
|
|
$
|
1,566,648
|
|
$
|
1,587,039
|
|
|||
The estimated fair value of our senior notes is based primarily on quoted market prices reported on or near the respective balance sheet dates. The estimated fair value of our revolving credit facilities and term loans was calculated using a discounted cash flow analysis, which utilized market based assumptions including forward interest rates adjusted for credit risk.
|
17.
|
Commitments and Contingencies
|
We have a letter of credit sub-facility of
$25.0 million
under our
$200.0 million
senior secured revolving credit facility that matures in December 2019. As of
December 31, 2016
, we had
$0.5 million
of standby letters of credit outstanding. Such standby letters of credit are used in the ordinary course of our business and are collateralized by our cash balances.
We generally warrant that our services will be performed in a professional and workmanlike manner and in compliance with our customers’ specifications. We accrue costs for known warranty issues. Historically, our warranty costs have been immaterial.
Legal Proceedings
We are involved in claims and legal proceedings and may become involved in other legal matters arising in the ordinary course of our business. We evaluate these claims and legal matters on a case-by-case basis to make a determination as to the impact, if any, on our business, liquidity, results of operations, financial condition or cash flows. Although the outcome of these matters is uncertain, we believe that the ultimate outcome of these claims and proceedings, individually and in the
86
aggregate, will not have a material adverse impact to us. Our evaluation of the potential impact of these claims and legal proceedings on our business, liquidity, results of operations, financial condition or cash flows could change in the future.
Settlement of Patent License Litigation
In January 2015, we settled our patent license litigation with Tessera. Under the terms of the settlement, Amkor agreed to pay Tessera a total of
$155.0 million
in
16
equal quarterly recurring payments commencing in the first quarter of 2015, and continuing through the fourth quarter of 2018. During the three months ended December 31, 2014, we recorded a pre-tax charge of
$87.1 million
, of which
$75.3 million
was charged to cost of sales and
$11.8 million
was charged to interest expense. This charge reflected the aggregate amount due under the settlement agreement, net of amounts previously reserved.
At
December 31, 2016
, the remaining amount we owe Tessera under our settlement agreement was
$77.5 million
. The current portion of this liability is recorded in accrued expenses (
Note 12
) and the non-current portion is recorded in other non-current liabilities in our Consolidated Financial Statements. We will also charge
$4.4 million
of the amount owed to interest expense over the remaining two year term of the arrangement.
Leases
Future minimum lease payments under operating leases that have initial or remaining noncancelable lease terms in excess of one year are:
|
Lease Payments
|
|||
|
(In thousands)
|
|||
|
2017
|
$
|
20,079
|
|
|
2018
|
11,893
|
|
|
|
2019
|
9,783
|
|
|
|
2020
|
5,321
|
|
|
|
2021
|
4,054
|
|
|
|
Thereafter
|
8,596
|
|
|
|
Total
|
$
|
59,726
|
|
Rent expense amounted to
$43.8 million
,
$24.5 million
and
$28.5 million
for
2016
,
2015
and
2014
, respectively.
In order to provide packaging and test services, we purchase materials under various long-term supply contracts. Future minimum payments to be made under these contracts for the period 2017 through 2025 are
$14.3 million
.
|
18.
|
Business Segments, Customer Concentrations and Geographic Information
|
We operate as a single operating segment as managed by our Chief Executive Officer, who is considered our chief operating decision maker ("CODM"). The CODM bears the ultimate responsibility for, and is actively engaged in, the allocation of resources and the evaluation of our operating and financial results. We have concluded that we have a single operating segment based on the following:
|
•
|
We are managed under a functionally-based organizational structure with the head of each function reporting directly to the CODM;
|
|
•
|
We assess performance, including incentive compensation, based on consolidated operating performance and financial results;
|
|
•
|
Our CODM allocates resources and makes other operating decisions based on specific customer business opportunities and
|
87
|
•
|
We have an integrated process for the design, development and manufacturing services we provide to all of our customers. We also have centralized sales and administrative functions.
|
The following table presents net sales by product group:
|
Net Sales for the Year Ended December 31,
|
|||||||||||
|
2016
|
2015
|
2014
|
|||||||||
|
(In thousands)
|
|||||||||||
|
Advanced products
|
$
|
1,679,529
|
|
$
|
1,432,493
|
|
$
|
1,552,948
|
|
||
|
Mainstream products
|
2,214,106
|
|
1,452,110
|
|
1,576,492
|
|
|||||
|
Total net sales
|
$
|
3,893,635
|
|
$
|
2,884,603
|
|
$
|
3,129,440
|
|
||
The following table presents net sales by country based on customer headquarters location:
|
Net Sales for the Year Ended December 31,
|
|||||||||||
|
2016
|
2015
|
2014
|
|||||||||
|
(In thousands)
|
|||||||||||
|
Japan
|
$
|
1,158,318
|
|
$
|
372,810
|
|
$
|
472,152
|
|
||
|
Asia Pacific (excluding Japan)
|
627,177
|
|
609,409
|
|
614,909
|
|
|||||
|
Europe, Middle East and Africa
|
487,584
|
|
489,842
|
|
426,969
|
|
|||||
|
Total foreign countries
|
2,273,079
|
|
1,472,061
|
|
1,514,030
|
|
|||||
|
United States
|
1,620,556
|
|
1,412,542
|
|
1,615,410
|
|
|||||
|
Total net sales
|
$
|
3,893,635
|
|
$
|
2,884,603
|
|
$
|
3,129,440
|
|
||
One customer accounted for
15.8%
,
11.0%
, and
13.2%
and a second customer accounted for
12.7%
,
14.4%
and
17.5%
of net sales in
2016
,
2015
and
2014
, respectively.
The following table presents property, plant and equipment, net, based on the physical location of the asset:
|
Property, Plant and Equipment, Net
at December 31,
|
|||||||
|
2016
|
2015
|
||||||
|
(In thousands)
|
|||||||
|
China
|
$
|
500,319
|
|
$
|
513,175
|
|
|
|
Japan
|
245,233
|
|
230,436
|
|
|||
|
Korea
|
1,130,147
|
|
1,124,435
|
|
|||
|
Malaysia
|
36,248
|
|
39,037
|
|
|||
|
Philippines
|
313,885
|
|
328,604
|
|
|||
|
Taiwan
|
326,614
|
|
330,604
|
|
|||
|
Other foreign countries
|
243
|
|
261
|
|
|||
|
Total foreign countries
|
2,552,689
|
|
2,566,552
|
|
|||
|
United States
|
11,959
|
|
12,465
|
|
|||
|
Total property, plant and equipment, net
|
$
|
2,564,648
|
|
$
|
2,579,017
|
|
|
88
|
19.
|
Revision of Previously Reported Financial Information
|
In the second quarter of 2016, during our post-acquisition integration of J-Devices, we identified an error in the provision for income taxes in the financial statements for J-Devices for the periods beginning in 2012 through the fourth quarter of 2015. During those periods we did not control J-Devices and, accordingly, we accounted for our investment in J-Devices using the equity method. As a result of the J-Devices error, our equity in earnings of J-Devices was overstated by the cumulative amount of
$8.0 million
. We believe that the error is not material to Amkor for the periods impacted and have elected to revise our previously issued consolidated financial statements. We have also recorded the impact of the revision in our purchase accounting for the acquisition of J-Devices on December 30, 2015 (Note 3). Periods presented herein are based on the revised financial results.
The following table presents the effect of the aforementioned revisions on our Consolidated Balance Sheet as of December 31, 2015:
|
December 31, 2015
|
|||||||||||
|
As Reported
|
Adjustments
|
As Revised
|
|||||||||
|
(In thousands)
|
|||||||||||
|
Goodwill
|
$
|
19,443
|
|
$
|
3,966
|
|
$
|
23,409
|
|
||
|
Total assets
|
4,022,462
|
|
3,966
|
|
4,026,428
|
|
|||||
|
Other non-current liabilities
|
101,679
|
|
11,563
|
|
113,242
|
|
|||||
|
Total liabilities
|
2,797,329
|
|
11,563
|
|
2,808,892
|
|
|||||
|
Accumulated deficit
|
(460,150
|
)
|
(7,597
|
)
|
(467,747
|
)
|
|||||
|
Total Amkor stockholders’ equity
|
1,207,883
|
|
(7,597
|
)
|
1,200,286
|
|
|||||
|
Total equity
|
1,225,133
|
|
(7,597
|
)
|
1,217,536
|
|
|||||
|
Total liabilities and equity
|
4,022,462
|
|
3,966
|
|
4,026,428
|
|
|||||
The following tables present the effect of the aforementioned revisions on our Consolidated Statements of Income for the years ended December 31, 2015 and 2014:
|
For the Year Ended December 31, 2015
|
For the Year Ended December 31, 2014
|
||||||||||||||||||||||
|
As Reported
|
Adjustments
|
As Revised
|
As Reported
|
Adjustments
|
As Revised
|
||||||||||||||||||
|
(In thousands, except per share data)
|
|||||||||||||||||||||||
|
Other (income) expense, net
|
$
|
10,928
|
|
$
|
(377
|
)
|
$
|
10,551
|
|
$
|
(24,543
|
)
|
$
|
—
|
|
$
|
(24,543
|
)
|
|||||
|
Equity in earnings of J-Devices
|
20,107
|
|
(6,091
|
)
|
14,016
|
|
31,654
|
|
(647
|
)
|
31,007
|
|
|||||||||||
|
Net income
|
59,607
|
|
(5,714
|
)
|
53,893
|
|
133,887
|
|
(647
|
)
|
133,240
|
|
|||||||||||
|
Net income attributable to Amkor
|
56,812
|
|
(5,714
|
)
|
51,098
|
|
130,386
|
|
(647
|
)
|
129,739
|
|
|||||||||||
|
Net income attributable to Amkor per common share:
|
|
|
|
|
|
|
|
|
|
|
|
|
|||||||||||
|
Basic
|
$
|
0.24
|
|
$
|
(0.02
|
)
|
$
|
0.22
|
|
$
|
0.56
|
|
$
|
—
|
|
$
|
0.56
|
|
|||||
|
Diluted
|
0.24
|
|
(0.02
|
)
|
0.22
|
|
0.55
|
|
—
|
|
0.55
|
|
|||||||||||
89
The following tables present the effect of the aforementioned revisions on our Consolidated Statements of Comprehensive Income for the years ended December 31, 2015 and 2014, and the three months ended March 31, 2016:
|
For the Year Ended December 31, 2015
|
For the Year Ended December 31, 2014
|
||||||||||||||||||||||
|
As Reported
|
Adjustments
|
As Revised
|
As Reported
|
Adjustments
|
As Revised
|
||||||||||||||||||
|
(In thousands)
|
|||||||||||||||||||||||
|
Net income
|
$
|
59,607
|
|
$
|
(5,714
|
)
|
$
|
53,893
|
|
$
|
133,887
|
|
$
|
(647
|
)
|
$
|
133,240
|
|
|||||
|
Equity interest in J-Devices' other comprehensive income (loss), net of tax
|
29,829
|
|
(396
|
)
|
29,433
|
|
(19,136
|
)
|
292
|
|
(18,844
|
)
|
|||||||||||
|
Total other comprehensive income (loss)
|
30,783
|
|
(396
|
)
|
30,387
|
|
(32,612
|
)
|
292
|
|
(32,320
|
)
|
|||||||||||
|
Comprehensive income
|
90,390
|
|
(6,110
|
)
|
84,280
|
|
101,275
|
|
(355
|
)
|
100,920
|
|
|||||||||||
|
Comprehensive income attributable to Amkor
|
87,595
|
|
(6,110
|
)
|
81,485
|
|
97,774
|
|
(355
|
)
|
97,419
|
|
|||||||||||
|
For the Three Months Ended March 31, 2016
|
|||||||||||
|
As Reported
|
Adjustments
|
As Revised
|
|||||||||
|
(In thousands)
|
|||||||||||
|
Foreign currency translation adjustment
|
$
|
19,864
|
|
$
|
(541
|
)
|
$
|
19,323
|
|
||
|
Total other comprehensive income (loss)
|
19,888
|
|
(541
|
)
|
19,347
|
|
|||||
|
Comprehensive income
|
19,483
|
|
(541
|
)
|
18,942
|
|
|||||
|
Comprehensive income attributable to Amkor
|
19,013
|
|
(541
|
)
|
18,472
|
|
|||||
The following table presents the effect of the aforementioned revisions on our Consolidated Statements of Cash Flows for the years ended December 31, 2015 and 2014:
|
For the Year Ended December 31, 2015
|
For the Year Ended December 31, 2014
|
||||||||||||||||||||||
|
As Reported
|
Adjustments
|
As Revised
|
As Reported
|
Adjustments
|
As Revised
|
||||||||||||||||||
|
(In thousands)
|
|||||||||||||||||||||||
|
Net income
|
$
|
59,607
|
|
$
|
(5,714
|
)
|
$
|
53,893
|
|
$
|
133,887
|
|
$
|
(647
|
)
|
$
|
133,240
|
|
|||||
|
Equity in earnings of unconsolidated affiliate
|
(20,107
|
)
|
6,091
|
|
(14,016
|
)
|
(31,654
|
)
|
647
|
|
(31,007
|
)
|
|||||||||||
|
Loss from acquisition of J-Devices
|
13,878
|
|
(377
|
)
|
13,501
|
|
—
|
|
—
|
|
—
|
|
|||||||||||
|
20.
|
Subsequent Event
|
On February 1, 2017, we entered into a definitive agreement to acquire
100%
of the shares of NANIUM S.A., a provider of wafer-level fan-out semiconductor packaging solutions. The transaction is expected to close in the first quarter of 2017, subject to customary closing conditions and regulatory approvals.
90
SCHEDULE II — VALUATION AND QUALIFYING ACCOUNTS
|
Balance at
Beginning of
Period
|
Additions (Credited) Charged to Expense
|
Write-offs
|
(a)
Other
|
Balance at
End of Period
|
||||||||||||
|
(In thousands)
|
||||||||||||||||
|
Deferred tax asset valuation allowance:
|
||||||||||||||||
|
Year ended December 31, 2014
|
$
|
179,183
|
|
(10,838
|
)
|
(2,534
|
)
|
(15,964
|
)
|
$
|
149,847
|
|
||||
|
Year ended December 31, 2015
|
$
|
149,847
|
|
18,507
|
|
(248
|
)
|
(1
|
)
|
$
|
168,105
|
|
||||
|
Year ended December 31, 2016
|
$
|
168,105
|
|
7,729
|
|
(15,091
|
)
|
4,624
|
|
$
|
165,367
|
|
||||
|
(a)
|
Column represents adjustments to the deferred tax asset valuation allowance directly through stockholders’ equity for changes in accumulated other comprehensive income (loss) related to our foreign defined benefit pension plans, the sale of a subsidiary in 2014 and the adoption of ASU 2016-09 on July 1, 2016.
|
91
|
Item 9.
|
Changes In and Disagreements with Accountants on Accounting and Financial Disclosure
|
None.
|
Item 9A.
|
Controls and Procedures
|
Evaluation of Disclosure Controls and Procedures
We maintain disclosure controls and procedures that are designed to ensure that information required to be disclosed in our periodic reports to the Securities and Exchange Commission (“SEC”) is recorded, processed, summarized and reported within the time periods specified in the SEC’s rules and forms, and that such information is accumulated and communicated to our management, including the Chief Executive Officer and the Chief Financial Officer, as appropriate, to allow timely decisions regarding required disclosure, based on the definition of “disclosure controls and procedures” in Rule 13a-15(e) and Rule 15d-15(e) under the Securities Exchange Act of 1934, as amended. In designing and evaluating the disclosure controls and procedures, management recognizes that any disclosure controls and procedures, no matter how well designed and operated, can provide only reasonable assurance of achieving the desired control objectives, and management necessarily is required to apply its judgment in evaluating the cost-benefit relationship of possible disclosure controls and procedures.
We carried out an evaluation, under the supervision and with the participation of management, including our Chief Executive Officer and our Chief Financial Officer, of the effectiveness of the design and operation of our disclosure controls and procedures as of
December 31, 2016
, and concluded those disclosure controls and procedures were effective as of that date.
Management’s Report on Internal Control Over Financial Reporting
Management is responsible for establishing and maintaining adequate internal control over financial reporting, as such term is defined in Exchange Act Rules 13a-15(f) and 15d-15(f). Internal control over financial reporting is a process designed to provide reasonable assurance regarding the reliability of financial reporting and the preparation of financial statements for external purposes in accordance with generally accepted accounting principles.
Internal control over financial reporting includes those policies and procedures that (i) pertain to the maintenance of records that, in reasonable detail, accurately and fairly reflect the transactions and dispositions of the assets of the company; (ii) provide reasonable assurance that transactions are recorded as necessary to permit preparation of financial statements in accordance with generally accepted accounting principles, and that receipts and expenditures of the company are being made only in accordance with authorizations of management and directors of the company and (iii) provide reasonable assurance regarding prevention or timely detection of unauthorized acquisition, use, or disposition of the company’s assets that could have a material effect on the financial statements.
Because of its inherent limitations, internal control over financial reporting may not prevent or detect misstatements. Projections of any evaluation of effectiveness to future periods are subject to the risk that controls may become inadequate because of changes in conditions, or that the degree of compliance with the policies and procedures may deteriorate.
Management conducted an assessment of the effectiveness of our internal control over financial reporting as of
December 31, 2016
, based on the framework established in Internal Control — Integrated Framework issued by the Committee of Sponsoring Organizations of the Treadway Commission (“COSO”). Based on the results of this evaluation, our management concluded that our internal control over financial reporting was effective as of
December 31, 2016
, based on criteria in Internal Control — Integrated Framework (2013) issued by the COSO.
The effectiveness of our internal control over financial reporting as of
December 31, 2016
, has been audited by PricewaterhouseCoopers LLP, an independent registered public accounting firm, as stated in their report which appears under Item 8 of this Annual Report on Form 10-K.
92
Changes in Internal Control Over Financial Reporting
We are implementing an enterprise resource planning module in a multi-year program in certain of our factories. There were no changes in our internal control over financial reporting that occurred during the three months ended
December 31, 2016
that have materially affected, or are reasonably likely to materially affect, our internal control over financial reporting.
|
Item 9B.
|
Other Information
|
None.
|
Item 10.
|
Directors, Executive Officers and Corporate Governance
|
The information required by this Item 10, with the exception of information relating to the Code of Business Conduct as disclosed below, is incorporated herein by reference from the material included under the captions “Election of Directors,” “Executive Officers,” and “Section 16(a) Beneficial Ownership Reporting Compliance” in our definitive proxy statement (to be filed pursuant to Regulation 14A) for our
2017
Annual Meeting of Stockholders.
Additionally, our Code of Business Conduct, Code of Ethics for Directors, Corporate Governance Guidelines, and the charters of the Audit Committee, Nominating and Governance Committee and Compensation Committee of our Board of Directors are available and maintained on our web site (http://www.amkor.com). We intend to disclose on our web site future amendments or waivers of our Code of Business Conduct required to be disclosed pursuant to applicable rules and regulations.
|
Item 11.
|
Executive Compensation
|
The information required by this Item 11 is incorporated herein by reference from the material included under the captions “Executive Compensation,” “Compensation Committee Interlocks and Insider Participation” and “Report of the Compensation Committee of the Board of Directors” in our definitive proxy statement (to be filed pursuant to Regulation 14A) for our
2017
Annual Meeting of Stockholders.
|
Item 12.
|
Security Ownership of Certain Beneficial Owners and Management and Related Stockholder Matters
|
The information required by this Item 12, with the exception of the equity compensation plan information presented below, is incorporated herein by reference to our definitive proxy statement (to be filed pursuant to Regulation 14A) for our
2017
Annual Meeting of Stockholders.
EQUITY COMPENSATION PLAN
The following table summarizes our equity compensation plan as of
December 31, 2016
:
|
(a)
Number of
Securities to be
Issued Upon
Exercise of
Outstanding
Options
(In thousands)
|
(b)
Weighted
Average
Exercise Price of
Outstanding
Options
|
(c)
Number of Securities
Remaining Available
for Future Issuance
Under Equity
Compensation Plans
(Excluding Securities
Reflected in Column(a)
(In thousands)
|
|||||||
|
Equity compensation plan approved by stockholders (1)
|
2,443
|
|
$
|
6.93
|
|
11,035
|
|
||
|
Equity compensation plans not approved by stockholders
|
—
|
|
—
|
|
—
|
|
|||
|
Total equity compensation plans
|
2,443
|
|
11,035
|
|
|||||
|
(1)
|
As of
December 31, 2016
, a total of
11.0 million
shares were reserved for issuance under the 2007 Plan. Shares available for issuance under our 2007 Plan can be granted pursuant to stock options, restricted stock, restricted stock units, stock appreciation rights, performance units and performance shares.
|
93
|
Item 13.
|
Certain Relationships and Related Transactions, and Director Independence
|
The information required by this Item 13 is incorporated herein by reference from the material included under the captions “Certain Relationships and Related Transactions” and “Proposal One — Election of Directors” in our definitive proxy statement (to be filed pursuant to Regulation 14A) for our
2017
Annual Meeting of Stockholders.
|
Item 14.
|
Principal Accountant Fees and Services
|
The information required by this Item 14 is incorporated herein by reference from the material included under the proposal “Ratification of Appointment of Independent Registered Public Accounting Firm” in our definitive proxy statement (to be filed pursuant to Regulation 14A) for our
2017
Annual Meeting of Stockholders.
|
Item 15.
|
Exhibits and Financial Statement Schedules
|
(a)
Financial Statements, Financial Statement Schedules and Exhibits
The financial statements and schedules filed as part of this Annual Report on Form 10-K are listed in the index under Part II, Item 8 of this Annual Report.
The exhibits required by Item 601 of Regulation S-K which are filed with this report or incorporated by reference herein, are set forth in the Exhibit Index. Management contracts or compensatory plans or arrangements are identified by an asterisk.
|
Item 16.
|
Form 10-K Summary
|
None.
94
SIGNATURES
Pursuant to the requirements of Section 13 or 15(d) of the Securities Exchange Act of 1934, as amended, the registrant has duly caused this Annual Report on Form 10-K to be signed, on its behalf by the undersigned, thereunto duly authorized.
AMKOR TECHNOLOGY, INC.
|
By:
|
/s/ Stephen D. Kelley
|
|
|
Stephen D. Kelley
President and Chief Executive Officer
|
||
|
Date:
|
February 24, 2017
|
|
POWER OF ATTORNEY
KNOW ALL PERSONS BY THESE PRESENTS, that each person whose signature appears below constitutes and appoints Stephen D. Kelley and Megan Faust, and each of them, his attorneys-in-fact, and agents, each with the power of substitution, for him and in his name, place and stead, in any and all capacities, to sign any and all amendments to this Report on Form 10-K, and all documents in connection therewith, with the Securities and Exchange Commission, granting unto said attorneys-in-fact and agents, and each of them, full power and authority to do and perform each and every act and thing requisite and necessary to be done in and about the premises, as fully to all intents and purposes as he might or could do in person, hereby ratifying and conforming all that said attorneys-in-fact and agents of any of them, or his or their substitute or substitutes, may lawfully do or cause to be done by virtue hereof.
Pursuant to the requirements of the Securities Exchange Act of 1934, as amended, this report has been signed below by the following persons on behalf of the registrant and in the capacities and on the dates indicated.
|
Name
|
Title
|
Date
|
||
|
/s/ Stephen D. Kelley
|
President and Chief Executive Officer
|
February 24, 2017
|
||
|
Stephen D. Kelley
|
||||
|
/s/ Megan Faust
|
Corporate Vice President and Chief Financial Officer
|
February 24, 2017
|
||
|
Megan Faust
|
||||
|
/s/ James J. Kim
|
Executive Chairman
|
February 24, 2017
|
||
|
James J. Kim
|
||||
|
/s/ John T. Kim
|
Executive Vice Chairman
|
February 24, 2017
|
||
|
John T. Kim
|
||||
|
/s/ Susan Y. Kim
|
Director
|
February 24, 2017
|
||
|
Susan Y. Kim
|
||||
|
/s/ Roger A. Carolin
|
Director
|
February 24, 2017
|
||
|
Roger A. Carolin
|
||||
|
/s/ Winston J. Churchill
|
Director
|
February 24, 2017
|
||
|
Winston J. Churchill
|
||||
95
|
Name
|
Title
|
Date
|
||
|
/s/ Robert R. Morse
|
Director
|
February 24, 2017
|
||
|
Robert R. Morse
|
||||
|
/s/ John F. Osborne
|
Director
|
February 24, 2017
|
||
|
John F. Osborne
|
||||
|
/s/ David N. Watson
|
Director
|
February 24, 2017
|
||
|
David N. Watson
|
||||
|
/s/ James W. Zug
|
Director
|
February 24, 2017
|
||
|
James W. Zug
|
||||
96
EXHIBIT INDEX
|
2.1
|
|
Sales Contract of Commodity Premises between Shanghai Waigaoqiao Free Trade Zone Xin Development Co., Ltd. and Amkor Assembly & Test (Shanghai) Co., Ltd. dated May 7, 2004.(4)
|
|
|
3.1
|
|
Certificate of Incorporation.(1)
|
|
|
3.2
|
|
Certificate of Correction to Certificate of Incorporation.(3)
|
|
|
3.3
|
|
Restated Bylaws as amended on November 5, 2013.(19)
|
|
|
4.1
|
|
Specimen Common Stock Certificate.(2)
|
|
|
4.2
|
|
Indenture, dated May 20, 2011, by and between Amkor Technology, Inc. and U.S. Bank National Association, as trustee, regarding the 6.625% Senior Notes due 2021.(10)
|
|
|
4.3
|
|
Letter Agreement, dated May 17, 2011, between Amkor Technology, Inc., James J. Kim and 915 Investments, LP.(10)
|
|
|
4.4
|
|
Indenture, dated September 21, 2012, by and between Amkor Technology, Inc. and U.S. Bank National Association, as trustee, regarding the 6.375% Senior Notes due 2022.(14)
|
|
|
10.1
|
|
Form of Indemnification Agreement for directors and officers.(2)
|
|
|
10.2
|
|
1998 Stock Plan, as amended.(7)*
|
|
|
10.3
|
|
Form of Stock Option Agreement under the 1998 Stock Plan.(5)*
|
|
|
10.4
|
|
Contract of Lease between Corinthian Commercial Corporation and Amkor/Anam Pilipinas Inc., dated October 1, 1990.(1)
|
|
|
10.5
|
|
Contract of Lease between Salcedo Sunvar Realty Corporation and Automated Microelectronics, Inc., dated May 6, 1994.(1)
|
|
|
10.6
|
|
Lease Contract between AAPI Realty Corporation and Amkor/Anam Advanced Packaging, Inc., dated November 6, 1996.(1)
|
|
|
10.7
|
|
2003 Nonstatutory Inducement Grant Stock Plan, as amended.(7)*
|
|
|
10.8
|
|
Amended and Restated 2007 Equity Incentive Plan.(11)*
|
|
|
10.9
|
|
Form of Stock Option Award Agreement under the Amended and Restated 2007 Equity Incentive Plan.(21)*
|
|
|
10.10
|
|
Form of Restricted Stock Award Agreement under the Amended and Restated 2007 Equity Incentive Plan. (13)*
|
|
|
10.11
|
|
Executive Incentive Bonus Plan.(11)*
|
|
|
10.12
|
|
Kun-Mortgage Agreement, dated March 30, 2007, between Woori Bank and Amkor Technology Korea, Inc.(6)
|
|
|
10.13
|
|
2009 Voting Agreement, dated as of March 26, 2009, between Amkor Technology, Inc., James J. Kim and 915 Investments, LP.(8)
|
|
|
10.14
|
|
Second Amended and Restated Loan and Security Agreement, dated as of June 28, 2012, among Amkor Technology, Inc., its subsidiaries from time to time party thereto, the lending institutions from time to time party thereto and Bank of America, N.A., as administrative agent.(12)
|
|
|
10.15
|
|
First Amendment, dated December 24, 2014, to Second Amended and Restated Loan and Security Agreement, dated as of June 28, 2012, among Amkor Technology, Inc., its subsidiaries from time to time party thereto, the lending institutions from time to time party thereto and Bank of America, N.A., as administrative agent.(20)
|
|
|
10.16
|
|
Amendment to Kun-Mortgage Agreement, dated May 24, 2010, by and between Amkor Technology Korea, Inc. and Woori Bank.(9)
|
|
|
10.17
|
|
Loan Agreement, dated November 23, 2012, by and between Amkor Technology Korea, Inc. and The Korea Development Bank.(15)
|
|
|
10.18
|
|
Form of Amendment to Factory Mortgage Agreement, dated November 23, 2012, by and between The Korea Development Bank and Amkor Technology Korea, Inc.(15)
|
|
|
10.19
|
|
Amendment to Loan Agreement, dated November 22, 2013, by and between Amkor Technology Korea, Inc. and The Korea Development Bank.(19)
|
|
|
10.20
|
|
Amendment to Kun Mortgage Agreement, dated April 19, 2013, by and between Amkor Technology Korea, Inc. and Woori Bank.(18)
|
|
97
|
10.21
|
|
Employment Offer Letter, dated April 30, 2013, between Amkor Technology, Inc. and Stephen D. Kelley.(16)*
|
|
|
10.22
|
|
Retirement Agreement and Release, dated May 8, 2013, between Amkor Technology, Inc. and Kenneth T. Joyce.(17)*
|
|
|
10.23
|
|
Separation and Consulting Agreement, dated July 17, 2013, between Amkor Technology, Inc. and Michael J. Lamble.(18)*
|
|
|
10.24
|
|
Amendment No. 1 to Amended and Restated 2007 Equity Incentive Plan.(22)*
|
|
|
10.25
|
|
Form of Outside Director Stock Option Award Agreement under the Amended and Restated 2007 Equity Incentive Plan.(23)*
|
|
|
10.26
|
|
Separation Agreement and Release, dated February 11, 2015, between Amkor Technology, Inc. and JooHo Kim.(21)*
|
|
|
10.27
|
|
Amendment No. 2 to Amended and Restated 2007 Equity Incentive Plan.(24)*
|
|
|
10.28
|
|
Agreement and Release, dated September 12, 2016, between Amkor Technology, Inc. and Joanne Solomon.(25)*
|
|
|
12.1
|
|
Computation of Ratio of Earnings to Fixed Charges
|
|
|
21.1
|
|
List of subsidiaries of the Registrant.
|
|
|
23.1
|
|
Consent of PricewaterhouseCoopers LLP.
|
|
|
31.1
|
|
Certification of Stephen D. Kelley, Chief Executive Officer of Amkor Technology, Inc., Pursuant to Rule 13a-14(a) under the Securities Exchange Act of 1934, as amended.
|
|
|
31.2
|
|
Certification of Megan Faust, Chief Financial Officer of Amkor Technology, Inc., Pursuant to Rule 13a-14(a) under the Securities Exchange Act of 1934, as amended.
|
|
|
32.1
|
|
Certification of Chief Executive Officer and Chief Financial Officer Pursuant to 18 U.S.C. Section 1350, as Adopted Pursuant to Section 906 of the Sarbanes-Oxley Act of 2002.
|
|
|
101.INS
|
|
XBRL Instance Document
|
|
|
101.SCH
|
|
XBRL Taxonomy Extension Schema Document
|
|
|
101.CAL
|
|
XBRL Taxonomy Extension Calculation Linkbase Document
|
|
|
101.LAB
|
|
XBRL Taxonomy Extension Label Linkbase Document
|
|
|
101.PRE
|
|
XBRL Taxonomy Extension Presentation Linkbase Document
|
|
|
101.DEF
|
|
XBRL Taxonomy Extension Definition Linkbase Document
|
|
|
*
|
|
Indicates management compensatory plan, contract or arrangement.
|
|
98
|
(1)
|
Incorporated by reference to the Company’s Registration Statement on Form S-1 filed October 6, 1997 (File No. 333-37235).
|
|
|
(2)
|
Incorporated by reference to the Company’s Registration Statement on Form S-1 filed on October 6, 1997, as amended on March 31, 1998 (File No. 333-37235).
|
|
|
(3)
|
Incorporated by reference to the Company’s Registration Statement on Form S-1 filed on April 8, 1998, as amended on August 26, 1998 (File No. 333-49645).
|
|
|
(4)
|
Incorporated by reference to the Company’s Quarterly Report on Form 10-Q filed August 6, 2004 (File No. 000-29472).
|
|
|
(5)
|
Incorporated by reference to the 1998 Stock Plan as amended and restated and form of agreement thereunder in the Company’s Annual Report on Form 10-K filed on March 16, 2006 (File No. 000-29472).
|
|
|
(6)
|
Incorporated by reference to the Company’s Quarterly Report on Form 10-Q filed May 4, 2007 (File No. 000-29472).
|
|
|
(7)
|
Incorporated by reference to the Company's Quarterly Report on Form 10-Q filed August 7, 2008 (File No. 000-29472).
|
|
|
(8)
|
Incorporated by reference to the Company’s Current Report on Form 8-K filed on April 1, 2009 (File No. 000-29472).
|
|
|
(9)
|
Incorporated by reference to the Company’s Current Report on Form 8-K filed May 27, 2010 (File No. 000-29472).
|
|
|
(10)
|
Incorporated by reference to the Company's Current Report on Form 8-K filed May 20, 2011 (File No. 000-29472).
|
|
|
(11)
|
Incorporated by reference to the Company's Proxy Statement on Schedule 14A filed April 5, 2012 (File No. 000-29472).
|
|
|
(12)
|
Incorporated by reference to the Company's Current Report on Form 8-K filed on July 2, 2012 (File No. 000-29472).
|
|
|
(13)
|
Incorporated by reference to the Company's Quarterly Report on Form 10-Q filed August 2, 2012 (File No. 000-29472).
|
|
|
(14)
|
Incorporated by reference to the Company's Current Report on Form 8-K filed September 21, 2012 (File No. 000-29472).
|
|
|
(15)
|
Incorporated by reference to the Company's Current Report on Form 8-K filed November 27, 2012 (File No. 000-29472).
|
|
|
(16)
|
Incorporated by reference to the Company's Current Report on Form 8-K filed May 3, 2013 (File No. 000-29472).
|
|
|
(17)
|
Incorporated by reference to the Company's Current Report on Form 8-K filed May 10, 2013 (File No. 000-29472).
|
|
|
(18)
|
Incorporated by reference to the Company's Quarterly Report on Form 10-Q filed August 2, 2013 (File No. 000-29472).
|
|
|
(19)
|
Incorporated by reference to the Company's Annual Report on Form 10-K filed February 28, 2014 (File No. 000-29472).
|
|
|
(20)
|
Incorporated by reference to the Company's Current Report on Form 8-K filed December 24, 2014 (File No. 000-29472).
|
|
|
(21)
|
Incorporated by reference to the Company's Quarterly Report on Form 10-Q filed April 30, 2015 (File No. 000-29472).
|
|
|
(22)
|
Incorporated by reference to the Company's Quarterly Report on Form 10-Q filed October 30, 2015 (File No. 000-29472).
|
|
|
(23)
|
Incorporated by reference to the Company's Quarterly Report on Form 10-Q filed May 5, 2016 (File No. 000-29472).
|
|
|
(24)
|
Incorporated by reference to the Company's Quarterly Report on Form 10-Q filed August 8, 2016 (File No. 000-29472).
|
|
|
(25)
|
Incorporated by reference to the Company's Quarterly Report on Form 10-Q filed November 4, 2016 (File No. 000-29472).
|
|
99
TABLE OF CONTENTS
Part IItem 1. BusinessItem 1A. Risk FactorsItem 1B. Unresolved Staff CommentsItem 2. PropertiesItem 3. Legal ProceedingsItem 4. Mine Safety DisclosuresPart IIItem 5. Market For Registrant S Common Equity, Related Stockholder Matters and Issuer Purchases Of Equity SecuritiesItem 6. Selected Consolidated Financial DataItem 7. Management S Discussion and Analysis Of Financial Condition and Results Of OperationsItem 7A. Quantitative and Qualitative Disclosures About Market RiskItem 8. Financial Statements and Supplementary DataItem 9. Changes in and Disagreements with Accountants on Accounting and Financial DisclosureItem 9A. Controls and ProceduresItem 9B. Other InformationPart IIIItem 10. Directors, Executive Officers and Corporate GovernanceItem 11. Executive CompensationItem 12. Security Ownership Of Certain Beneficial Owners and Management and Related Stockholder MattersItem 13. Certain Relationships and Related Transactions, and Director IndependenceItem 14. Principal Accountant Fees and ServicesPart IVItem 15. Exhibits and Financial Statement SchedulesItem 16. Form 10-k Summary