AMN HEALTHCARE SERVICES INC
10-Ks and 10-Qs
|
|
|
|
|
|
|
|
|
|
|
|
|
|
|
|
|
|
|
|
|
|
|
|
|
|
|
|
|
|
|
|
|
|
|
|
|
|
|
|
|
|
|
|
|
|
|
|
|
|
|
|
|
|
|
|
|
|
|
UNITED STATES SECURITIES AND EXCHANGE COMMISSION
Washington, D.C. 20549
FORM 10-K
(Mark One)
|
x
|
ANNUAL REPORT PURSUANT TO SECTION 13 OR 15(d) OF THE SECURITIES EXCHANGE ACT OF 1934
|
|
|
For the fiscal year ended December 31, 2016
|
|
¨
|
TRANSITION REPORT PURSUANT TO SECTION 13 OR 15(d) OF THE SECURITIES EXCHANGE ACT OF 1934
|
|
|
For the transition period from
to
|
Commission File No.: 001-16753

AMN HEALTHCARE SERVICES, INC.
(Exact Name of Registrant as Specified in Its Charter)
|
Delaware
|
|
06-1500476
|
|
(State or Other Jurisdiction of
Incorporation or Organization)
|
|
(I.R.S. Employer
Identification No.)
|
|
12400 High Bluff Drive, Suite 100
San Diego, California
|
|
92130
|
|
(Address of principal executive offices)
|
|
(Zip Code)
|
Registrant’s Telephone Number, Including Area Code: (866) 871-8519
Securities registered pursuant to Section 12(b) of the Act:
|
Title of Each Class
|
|
Name of each exchange on which registered
|
|
Common Stock, $0.01 par value
|
|
New York Stock Exchange
|
Securities registered pursuant to Section 12(g) of the Act:
None.
Indicate by check mark if the registrant is a well-known seasoned issuer, as defined in Rule 405 of the Securities Act. Yes
x
No
¨
Indicate by check mark if the registrant is not required to file reports pursuant to Section 13 or Section 15(d) of the Exchange Act. Yes
¨
No
x
Indicate by check mark whether the registrant: (1) has filed all reports required to be filed by Section 13 or 15(d) of the Securities Exchange Act of 1934 during the preceding 12 months (or for such shorter period that the registrant was required to file such reports), and (2) has been subject to such filing requirements for the past 90 days. Yes
x
No
¨
Indicate by check mark whether the registrant has submitted electronically and posted on its corporate Web site, if any, every Interactive Data File required to be submitted and posted pursuant to Rule 405 of Regulation S-T during the preceding 12 months (or for such shorter period that the registrant was required to submit and post such files). Yes
x
No
¨
Indicate by check mark if disclosure of delinquent filers pursuant to Item 405 of Regulation S-K (§ 229.405 of this chapter) is not contained herein, and will not be contained, to the best of registrant’s knowledge, in definitive proxy or information statements incorporated by reference in Part III of this Form 10-K or any amendment to this Form 10-K.
x
Indicate by check mark whether the registrant is a large accelerated filer, an accelerated filer, a non-accelerated filer, or a smaller reporting company. See the definitions of “large accelerated filer,” “accelerated filer” and “smaller reporting company” in Rule 12b-2 of the Exchange Act. (Check one):
|
Large accelerated filer
x
|
|
Accelerated filer
o
|
|
Non-accelerated filer
o
|
|
Smaller reporting company
o
|
Indicate by check mark whether the registrant is a shell company (as defined in Rule 12b-2 of the Exchange Act). Yes
¨
No
x
The aggregate market value of the voting and non-voting common equity held by non-affiliates computed by reference to the price at which the common equity was last sold, or the average bid and asked price of such common equity, as of
June 30, 2016
, was
$1,892,328,216
based on a closing sale price of
$39.97
per share.
As of
February 15, 2017
, there were
47,724,130
shares of common stock, $0.01 par value, outstanding.
Documents Incorporated By Reference: Portions of the registrant’s definitive proxy statement for the annual meeting of stockholders scheduled to be held on April 19, 2017 have been incorporated by reference into Part III of this Form 10-K.
TABLE OF CONTENTS
|
Item
|
|
Page
|
|
PART I
|
||
|
1.
|
||
|
1A.
|
||
|
1B.
|
||
|
2.
|
||
|
3.
|
||
|
4.
|
||
|
PART II
|
||
|
5.
|
||
|
6.
|
||
|
7.
|
||
|
7A.
|
||
|
8.
|
||
|
9.
|
||
|
9A.
|
||
|
9B.
|
||
|
PART III
|
||
|
10.
|
||
|
11.
|
||
|
12.
|
||
|
13.
|
||
|
14.
|
||
|
PART IV
|
||
|
15.
|
||
References in this Annual Report on Form 10-K to “AMN Healthcare,” the “Company,” “we,” “us” and “our” refer to AMN Healthcare Services, Inc. and its wholly owned subsidiaries. This Annual Report contains references to our trademarks and service marks. For convenience, trademarks, service marks and trade names referred to in this Annual Report do not appear with the ®,
TM
, or
SM
symbols, but the lack of references is not intended to indicate that we will not assert our right to these trademarks, service marks and trade names.
10-K Introduction & Summary
This section provides an overview of AMN Healthcare Services, Inc. It does not contain all of the information you should consider. Please read the entire Annual Report on Form 10-K carefully before voting or making an investment decision.
Index of frequently requested 10-K information
|
Item 1.
|
Business
|
Overview of Our Company and Business Strategy
We are the leader and innovator in healthcare workforce solutions and staffing services in the United States. Our mission is to deliver the best talent and insights to help healthcare organizations optimize their workforce, provide healthcare professionals opportunities to do their best work toward quality patient care, and create a values-based culture of innovation in which our team members can achieve their goals. As the leader and innovator in workforce solutions, we enable our clients to optimize their workforce to successfully reduce staffing complexity, increase efficiency and enhance the patient experience. Through our comprehensive suite of solutions we provide technology, analytics, and services to build and manage all or a portion of our clients’ healthcare workforce needs, from nurses, doctors, and allied health professionals to healthcare leaders and executives, both on a temporary and permanent basis.
Over the past several years, we have evolved from a traditional healthcare staffing provider into a strategic healthcare workforce solutions partner to our clients. We expanded our portfolio to serve a diverse and growing set of talent-related needs.
1
This includes managed services programs (MSP), vendor management systems (VMS), predictive analytics, workforce optimization consulting, recruitment process outsourcing (RPO), permanent placement, interim and executive leadership, and remote medical coding. Our clients look to us to help them build and develop high quality, flexible workforces that deliver great outcomes and an engaged patient experience. Our network of talented clinicians and leaders trusts us to ensure we find them a great fitting team and environment that helps them grow and leverage their skills and expertise.
When expanding our services and products, we consider the following key criteria: (1) addressing the most pressing current and future needs of our customers, (2) alignment with our core operations, expertise, and access to healthcare professionals, (3) strengthening and broadening of our client relationships, (4) reduction in exposure to economic cycles and (5) enhancement of our long-term sustainable, differentiated business model. To supplement our clinical staffing solutions, we have expanded our suite of offerings to include MSP and RPO offerings. Since 2010, we have supplemented, developed or acquired the following offerings:
|
•
|
Managed Services Programs
. We acquired Medfinders, one of the nation’s leading providers of clinical workforce MSP, accelerating our growth in this area and clearly establishing AMN Healthcare as the nation’s largest provider of clinical workforce management solutions.
|
|
•
|
Vendor Management Systems
. Through our acquisitions of ShiftWise and Medefis, we offer two industry-leading SaaS-based, vendor neutral management systems, which allows our clients to utilize a technology-based approach to more efficiently manage their contingent staffing needs.
|
|
•
|
Interim Leadership Staffing and Executive Search Services
. We acquired B.E. Smith (“BES”), The First String Healthcare (“TFS”) and MillicanSolutions (“Millican”), which we believe made us the nation’s largest provider of interim healthcare leadership staffing, including clinical leaders and executive leaders, healthcare executive search services and other related advisory services.
|
|
•
|
Workforce Optimization Services
.
Through our acquisition of Avantas, we offer workforce optimization services, including consulting, data analytics, predictive modeling and SaaS-based scheduling technology. We believe Avantas’ proprietary scheduling software helps create more cost effective staffing plans for our clients as compared to traditional methodologies.
|
|
•
|
Recruitment Process Outsourcing
. In 2016, we continued to invest in our RPO service line, adding technologies and other capabilities to meet our clients’ growing needs for core staff recruitment expertise and services and to capitalize on the market opportunity.
|
|
•
|
Health Information Management.
Through our acquisition of Peak Provider Solutions (“Peak”), we offer remote medical coding and related health information management auditing and consulting solutions to hospitals and physician medical groups nationwide.
|
|
•
|
Expanded Our Network of Qualified Healthcare Professionals
. Through our Onward Healthcare acquisition, we increased our supply of healthcare professionals and recruiting capabilities in our traditional healthcare staffing areas of nurse, allied and locum tenens.
|
|
•
|
Per Diem Staffing
. Our acquisition of Medfinders provided us an entry point into the local, or per diem, staffing market. We provide per diem staffing, often in conjunction with our larger MSP clients.
|
As a core component of our growth strategy and profitability, we also seek to strengthen and create efficiencies in our operational and technology capabilities. As a result, in 2015, we embarked on a multi-year investment in the modernization of our front office, back office and infrastructure domains. We have also increased our efforts to integrate technology-based solutions in our recruitment efforts through continued investment in our digital capabilities, mobile applications and data analytics. These efforts will provide a more seamless and efficient workflow for our team members, our clinicians, and our clients. Further, it will help us realize greater scale and cost efficiencies when fully implemented.
Moving forward, we believe our strategy will enable us to continue to grow the number of customers and segments of the market we serve, while enhancing our profitability and operating leverage. This means driving increased adoption of our existing workforce solutions and staffing services through cross selling and deepening our customer relationships as they grow and expand. We intend to continue to innovate and develop new, adjacent solutions to our portfolio by investing and partnering with best-in-class tools and services to optimize our clients’ workforce and engage our talent networks. We expect this will help us expand our strategic customer relationships to help them address their workforce pain points, while driving more recurring revenue, with an improved margin mix that, similar to our evolution to MSPs, will be less sensitive to economic cycles.
The successful implementation of our strategy relies in large part upon the superior execution of our key initiatives by our management, sales and operations teams. Accordingly, we offer a differentiated employment value proposition to attract and retain team members that focuses on fostering a growth-oriented, values-driven culture, talented leadership, and a collegial
2
work environment that challenges us to develop and meet our personal and professional goals. During 2016 and for the fourth consecutive year, we were awarded a spot on Achievers’ 50 Most Engaged Workplaces, which honors the top 50 employers in North America that are using leadership and innovation in engaging employees and making their workplaces more productive. Additionally, AMN was honored with several awards highlighting our operational strength, including the Exemplary Compensation Discussion and Analysis award by the NYSE Governance Services and an HRO Today Partnership in Staffing Excellence for MSP. We were also named to the 2016 list of “150 Great Places to Work in Healthcare” by Becker’s Hospital Review.
Our Services
In
2016
, we conducted our business through three reportable segments: (1) nurse and allied solutions, (2) locum tenens solutions and (3) other workforce solutions. We set forth each segment’s revenue and operating income under “Management’s Discussion and Analysis of Financial Condition and Results of Operations—Results of Operations.” Through our business segments, we provide our healthcare clients with a wide range of workforce solutions and staffing services as set forth below.
(1)
Travel Nurse Staffing
.
We provide clients with nurses, most of them registered nurses, to work temporary assignments under our flagship brand, American Mobile, as well as under our Onward Healthcare and Nurses Rx brands. Assignments in acute-care hospitals, including teaching institutions, trauma centers and community hospitals, comprise the majority of our assignments. The length of the assignment varies with a typical travel nurse assignment of 13 weeks. Under our O’Grady-Peyton brand, we also recruit nurses internationally from English speaking countries who immigrate to the United States under a permanent resident visa (Green Card) and who typically work for us for a period of 24 months.
|
(2)
|
Rapid Response Nurse Staffing and Labor Disruption Services
.
We provide a shorter-term staffing solution of typically up to eight weeks under our NurseChoice brand to address hospitals’ urgent need for registered nurses, including electronic medical records conversion projects. NurseChoice is targeted to recruit and staff nurses who can begin assignments within one to two weeks in acute-care facilities in contrast to the three to five week lead time that may be required for travel nurses. We also provide labor disruption services for clients involved in strikes of nurses and allied professional staff through our HealthSource Global Staffing subsidiary.
|
|
(3)
|
Local, or Per Diem, Staffing
.
Primarily through our Nursefinders brand, we provide our clients local staffing, often in conjunction with our larger MSP clients. Local staffing involves the placement of locally-based healthcare professionals on daily shift work on an as-needed basis. Hospitals and healthcare facilities often give only a few hours’ notice of their local staffing assignments that require a turnaround from their staffing agencies of generally less than 24 hours.
|
|
(4)
|
Locum Tenens Staffing
. We place physicians of all specialties, advanced practice clinicians and dentists on an independent contractor basis on temporary assignments with all types of healthcare organizations throughout the United States, including hospitals, health systems, medical groups, occupational medical clinics, psychiatric facilities, government institutions and insurance companies. We recruit these professionals nationwide and typically place them on assignment lengths ranging from a few days up to one year. We market these services through our Staff Care and Locum Leaders brands.
|
|
(5)
|
Allied Staffing
.
We provide allied health professionals, both on a travel and local staffing basis, under the Med Travelers and Club Staffing brands to acute-care hospitals and other healthcare facilities such as skilled nursing facilities, rehabilitation clinics, and retail and mail-order pharmacies. Allied health professionals include such disciplines as physical therapists, respiratory therapists, occupational therapists, medical and radiology technologists, lab technicians, speech pathologists, rehabilitation assistants and pharmacists.
|
|
(6)
|
Physician Permanent Placement Services
. We provide physician permanent placement services to hospitals, healthcare facilities and physician practice groups throughout the United States. Using a distinct consultative approach that we believe is particularly client-oriented, we perform the vast majority of these services on a retained basis through our Merritt Hawkins and MillicanSolutions
brands. To a smaller degree, we also perform these services on a contingent basis through our Kendall & Davis brand. We also provide physician and executive leadership search services focused on serving academic medical centers and children’s hospitals nationwide through our MillicanSolutions brand. Our broad specialty offerings include over 70 specialist and sub-specialist opportunities such as internal medicine, family practice and surgery.
|
|
(7)
|
Interim Leadership Staffing and Executive Search Services
.
Through our recent acquisitions of BES and TFS, we provide executive and clinical leadership interim staffing, healthcare executive search services and advisory services. Practice areas include senior healthcare executives, physician executives, chief nursing officers and other clinical and operational leaders. This business line provides us greater access to the “C-suite” of our
|
3
clients and prospective clients, which we believe helps improve our visibility as a strategic partner to them and helps provide us with cross-selling opportunities.
|
(8)
|
Managed Services Programs
.
Many of our clients and prospective clients use a number of healthcare staffing agencies to fulfill their nurse, allied and locum tenens staffing needs. We offer a comprehensive managed services program, in which we manage all or a portion of a client’s contingent staffing needs. This service includes both the placement of our own healthcare professionals and the utilization of other staffing agencies to fulfill the client’s staffing needs. We believe an MSP reduces redundancies for our clients and allows them to optimize their staffing utilization. We often use our own VMS technology as part of our MSP, which we believe further enhances the value of our service offering. In
2016
, we had approximately $1.0 billion in annualized gross billings under management under our MSP and approximately one-third of our consolidated revenue flowed through MSP relationships compared to approximately 1% in 2008.
|
|
(9)
|
Vendor Management Systems
.
Some clients and prospective clients wish to utilize a vendor-neutral VMS technology that allows them to self-manage the procurement of their contingent clinical labor. We provide two VMS technologies, ShiftWise and Medefis, to clients that desire this option. Our VMS technology provides, among other things, control over a wide variety of tasks via a single system and consolidated reporting. In
2016
, we had approximately $1.2 billion in annualized gross billings flow through our VMS programs, for which we typically earn a 4% fee.
|
|
(10)
|
Recruitment Process Outsourcing
. We offer our clients RPO services, customized to their particular needs, pursuant to which we recruit, hire and/or onboard permanent clinical and nonclinical positions on behalf of the client. Our RPO program leverages our expertise and support systems to replace or complement a client’s existing internal recruitment function for permanent staffing needs, providing flexibility to our clients to determine how to best garner the recruiting resources necessary to fill their permanent staffing needs.
|
|
(11)
|
Workforce Optimization Services
.
We provide workforce optimization services, including consulting, data analytics, predictive modeling and SaaS-based scheduling technology. Through the acquisition of Avantas, we acquired proprietary scheduling software, Smart Square, which utilizes predictive analytics to create better, more accurate and timely staffing plans for a client, which we believe effectively reduces the client’s aggregate clinical labor spend.
|
|
(12)
|
Health Information Management.
Through our recent acquisition of Peak, we offer remote medical coding and related health information management consulting solutions to hospitals and physician medical groups nationwide.
|
Our Healthcare Professionals
The recruitment and retention of a sufficient number of qualified healthcare professionals to work temporary assignments on our behalf is critical to the success of our business. Healthcare professionals choose temporary assignments for a variety of reasons that include seeking flexible work opportunities, exploring diverse practice settings, building skills and experience by working at prestigious healthcare facilities, avoiding the demands and political environment of working as permanent staff, working through life and career transitions, and as a means of access into a permanent staff position.
We recruit our healthcare professionals, depending on the particular service line, under the following brands: American Mobile, Nursefinders, NurseChoice, NursesRx, HealthSource Global Staffing, Med Travelers, Club Staffing, Onward Healthcare, B.E. Smith, The First String Healthcare, O’Grady Peyton International, Staff Care and Locum Leaders. We believe that our multi-brand recruiting strategy, together with our innovative and effective marketing programs that focus on lead management, including our digital presence on websites, social media, and mobile applications, and our word-of-mouth referrals from the thousands of current and former healthcare professionals who we have placed enhances our effectiveness at reaching a larger number of healthcare professionals. While we are committed to this multi-brand strategy, we regularly assess our brands to drive brand clarity and maximize efficiencies. As a result of this evaluation, during 2016 we consolidated our Linde Healthcare brand into the Locum Leaders brand that we acquired in 2015.
When recruiting for healthcare professionals, in addition to other recruitment and staffing firms, we also compete with hospital systems that have developed their own recruitment departments and interim staffing pools. We believe that we attract and retain healthcare professionals because of our (1) large selection of assignment locations, settings and opportunities providing career development, (2) attractive compensation packages, (3) passionate, knowledgeable recruiters and service professionals who understand the needs of our healthcare professionals and provide a personalized approach and (4) excellent reputation. The attractive compensation package that we provide our healthcare professionals includes a competitive wage, professional development opportunities, professional liability insurance, 401(k) plan and health insurance. In addition, we may
4
provide reimbursements for meals and incidentals, travel and housing, or we may provide company housing if a healthcare professional elects not to receive reimbursement.
Our Geographic Markets and Client Base
During each of the past three years, (1) we generated all of our revenue in the United States and (2) all of our long-lived assets were located in the United States. We typically generate revenue in all 50 states. During
2016
, the largest percentages of our revenue were concentrated in California, Texas and New York.
Over half of our temporary healthcare professional assignments occur at acute-care hospitals. In addition to acute-care hospitals, we provide services to sub-acute healthcare facilities, physician groups, rehabilitation centers, dialysis clinics, pharmacies, home health service providers and ambulatory surgery centers. Our clients, many of the largest and most prestigious and progressive health care systems in the country, include Kaiser Foundation Hospitals, New York Presbyterian Health System, MedStar Health, HCA, Stanford Hospital and Clinics, Johns Hopkins Health System, Providence Health, PeaceHealth and Partners Healthcare. Kaiser Foundation Hospitals (and its affiliates), to whom we provide clinical managed services, comprised approximately 11% of our consolidated revenue and 18% of our nursing and allied solutions segment’s revenue for the
twelve months ended December 31, 2016
. No other client healthcare system comprised more than 5% of our consolidated revenue and no single client facility comprised more than 3% of our consolidated revenue for the
twelve months ended December 31, 2016
. Our success in winning MSP contracts means some larger health systems have grown and may continue to grow more significantly relative to our other revenue sources. The dynamics could lead to a greater client concentration than we have historically experienced.
Our Industry
The primary market in which we compete is the U.S. temporary healthcare staffing market. Staffing Industry Analysts (“SIA”) estimates that the segments of the target market in which we primarily operate have an aggregate 2017 estimated market size of $15.5 billion, of which travel nurse, per diem nurse, locum tenens and allied healthcare comprise $4.6 billion, $3.3 billion, $3.5 billion and $4.0 billion, respectively. We also operate within the interim leadership, permanent placement, RPO, VMS, workforce optimization services, medical coding and consulting services markets.
Industry Demand Drivers
Many factors affect the demand for temporary and permanent healthcare staffing, which, accordingly, affects the size of the markets in which we primarily operate. Of these many factors, we believe the following serve as some of the most significant drivers of demand.
|
•
|
Economic Environment and Unemployment Rate
. The demand for our services is affected by growth in the U.S. economy, which impacts the unemployment rate. Growth in real U.S. gross domestic product generally correlates to declining unemployment rates. When these macro-drivers are positive, it typically results in increased demand for our services and vice versa. Generally, we believe a positive economic environment and declining unemployment leads to an increasing demand for healthcare services and also reflects that healthcare facilities, like employers in many industries, experience higher levels of employee attrition and have a relatively more difficult time finding permanent staffing to fill their needs.
|
|
•
|
Supply of Healthcare Professionals
. While there are differing reports of the existence and extent of current and future healthcare professional shortages, many regions of the United States are experiencing a shortage of physicians and nurses that we believe will persist in the future. According to the Association of American Medical Colleges, the physician shortage is expected to range from 61,700 to 94,700 physicians by 2025. In nursing, geographic and specialty-based shortages are also expected through 2025. The demand for our services is correlated with activity in the permanent labor market. When nurse vacancy rates increase, temporary nurse staffing order levels typically increase as well.
|
|
•
|
General Demand for Healthcare Services
. Changes in demand for healthcare services, particularly at acute healthcare hospitals and inpatient facilities, affect the demand for our services. According to the U.S. Department of Health and Human Services, 20 million people have gained insurance coverage between the passage of the Affordable Care Act in 2010 and early 2016. The increase contributed to a relatively sharp increase in national healthcare expenditures beginning in 2014 after remaining fairly flat for several years. Additionally, the U.S. population continues to age and medical technological advances are contributing to longer life expectancy. According to the United States Census Bureau, the number of adults age 65 or older, who are three times more likely to have a hospital stay and twice as likely to visit a physician office compared to the rest of the population, is on pace to grow an estimated 36% between 2015 and 2025. This may place upward pressure on demand for the services we provide in the coming years.
|
5
|
•
|
Adoption of Workforce Solutions
. We believe healthcare organizations are increasingly seeking sophisticated, innovative and economically beneficial workforce solutions that improve patient outcomes. We believe the prevalence of workforce solutions, such as MSP, VMS, RPO and workforce optimization tools, in the healthcare industry is still underpenetrated in comparison with non-healthcare sectors. During 2016, approximately 35% of our consolidated revenues were generated through MSP relationships, which we believe is higher than the industry average. The changes in reimbursement methodologies, coupled with clinical labor representing a significant portion of a healthcare facility’s cost structure, may accelerate the adoption of strategic outsourced workforce solutions, which would likely place upward pressure on the demand for the services we provide.
|
Industry Competition
The healthcare temporary staffing and workforce solutions industry is highly competitive. We compete in national, regional and local markets for healthcare facility clients. Our comprehensive suite of workforce solutions, our commitment to quality and service excellence, our execution capabilities, our national footprint and our access to a wide network of quality healthcare professionals comprise our value proposition, which we believe resonates with clients and prospective clients. We believe that our size, geographic scope, broad spectrum of workforce solutions, talented and passionate team members and brand reputation give us distinct, scalable advantages over smaller, local and regional competitors and companies whose service offerings, sales and execution capabilities are not as robust. The breadth of our services allows us to provide even greater value through a more strategic, consultative and solution-oriented approach to our clients. Larger firms, such as us, also generally have a deeper, more comprehensive infrastructure with a more established operating model and processes that provide the long-term stability and foundation for quality standards recognition, such as the Joint Commission staffing agency certification and National Committee for Quality Assurance Credentials Verification Organization certification. With respect to our recruitment and placement businesses, our size and scale generally give us access to a larger pool of available candidates than our competitors and substantial word-of-mouth referral networks and recognizable brand names, enabling us to attract a consistent flow of new applicants.
We are the largest provider of nurse and allied healthcare staffing in the United States. In the nurse and allied healthcare staffing business, we compete with a few national competitors together with numerous smaller, more regional and local companies, particularly in the per diem business. We believe we are the third largest provider of locum tenens staffing services in the United States. The locum tenens staffing market consists of many small- to mid-sized companies with only a relatively small number of national competitors of which we are one. The physician permanent placement services market where we believe we hold a strong leading position is also highly fragmented and consists of many small- to mid-sized companies that do not have a national footprint. Our competitors vary by segment and include CHG Healthcare Services, Cross Country Healthcare, RightSourcing, Jackson Healthcare and Parallon Workforce Management Solutions.
Licensure For Our Business
Some states require state licensure for businesses that employ, assign and/or place healthcare professionals. We believe we are currently licensed in all states that require such licenses and take measures to ensure compliance with all state licensure requirements. In addition, the healthcare professionals who we employ or independently contract with are required to be individually licensed or certified under applicable state laws. We believe we take appropriate and reasonable steps to validate that our healthcare professionals possess all necessary licenses and certifications. We design our internal processes to ensure that the healthcare professionals that we directly place with clients have the appropriate experience, credentials and skills. Our travel nurse and allied healthcare staffing divisions, all of our locum tenens brands and all of our local staffing offices have received Joint Commission certification. We have also obtained our Credentials Verification Organization certification from the National Committee for Quality Assurance.
Employees
As of
December 31, 2016
, we had approximately 2,990 corporate employees. During the fourth quarter of
2016
, we had an average of (1) 8,764 nurses, allied and other clinical healthcare professionals, (2) 340 executive and clinical leadership interim staff, and (3) 444 medical coding professionals contracted to work for us. This does not include our locum tenens, all of whom are independent contractors and not our employees.
Additional Information
We incorporated in the state of Delaware on November 10, 1997. We maintain a corporate website at www.amnhealthcare.com. We make available our annual reports on Form 10-K, quarterly reports on Form 10-Q, current reports on Form 8-K and amendments to these reports, as well as proxy statements and other information free of charge through our website as soon as reasonably practicable after being filed with or furnished to the Securities and Exchange Commission
6
(“SEC”). The information found on our website is not part of this Annual Report on Form 10-K or any other report we file with or furnish to the SEC.
Special Note Regarding Forward-Looking Statements
This Annual Report on Form 10-K, including the section entitled “Management’s Discussion and Analysis of Financial Condition and Results of Operations,” contains “forward-looking statements” within the meaning of Section 27A of the Securities Act of 1933, as amended (the “Securities Act”), and Section 21E of the Securities Exchange Act of 1934, as amended (the “Exchange Act”), that are subject to safe harbors under the Securities Act and the Exchange Act. We base these forward-looking statements on our current expectations, estimates, forecasts and projections about future events and the industry in which we operate. Forward-looking statements are identified by words such as “believe,” “anticipate,” “expect,” “intend,” “plan,” “will,” “should,” “would,” “project,” “may,” variations of such words and other similar expressions. In addition, statements that refer to projections of financial items; anticipated growth; future growth and revenue; future economic conditions and performance; plans, objectives and strategies for future operations; and other characterizations of future events or circumstances, are forward-looking statements. Our actual results could differ materially from those discussed in, or implied by, these forward-looking statements. Factors that could cause actual results to differ from those implied by the forward-looking statements in this Annual Report on Form 10-K are described below, elsewhere in this Annual Report on Form 10-K and in our other filings with the SEC.
|
Item 1A.
|
Risk Factors
|
You should carefully read the following risk factors in connection with evaluating us and the forward-looking statements contained in this Annual Report on Form 10-K. Any of the following risks could materially adversely affect our business or our consolidated operating results, financial condition or cash flows, which, in turn, could cause the price of our common stock to decline. The risk factors described below and elsewhere in this Annual Report on Form 10-K are not the only risks we face. Factors we currently do not know, factors that we currently consider immaterial or factors that are not specific to us, such as general economic conditions, may also materially adversely affect our business or our consolidated operating results, financial condition or cash flows. The risk factors described below qualify all forward-looking statements we make, including forward-looking statements within this section entitled “Risk Factors.”
Risk Factors that May Affect the Demand for Our Services
Economic downturns and slow recoveries could result in less demand from clients and pricing pressure that could negatively impact
our financial condition.
Demand for staffing services is sensitive to changes in economic activity. As economic activity slows, hospitals and other healthcare entities typically experience decreased attrition and reduce their use of temporary employees before undertaking layoffs of their regular employees, which results in decreased demand for our services. In times of economic downturn and high unemployment rates, permanent full-time and part-time healthcare facility staff are generally inclined to work more hours and overtime, resulting in fewer available vacancies and less demand for our services. Fewer placement opportunities for our temporary clinicians and physicians also impairs our ability to recruit and place them both on a temporary and permanent basis.
Many healthcare facilities utilize temporary healthcare professionals to accommodate an increase in hospital admissions. Alternatively, when hospital admissions decrease, due to reduced consumer spending, general unemployment causing an increase in under- and uninsured patients and other factors, the demand for our temporary healthcare professionals typically declines. This may have an even greater negative effect on demand for physicians in certain specialties such as surgery, radiology and anesthesiology. In addition, we may experience more competitive pricing pressure during periods of decreased patient occupancy and hospital admissions, negatively affecting our revenue and profitability.
During challenging economic times, our clients, in particular those that rely on state government funding, may face issues gaining access to sufficient credit, which could result in an impairment of their ability to make payments to us, timely or otherwise, for services rendered. If that were to occur, we may increase our allowance for doubtful accounts and our days sales outstanding would be negatively affected.
7
Intermediary organizations may impede our ability to secure new and profitable contracts with our clients.
Our business depends upon our ability to maintain our existing contracts and secure new, profitable contracts. Outside of our managed services contracts, our client contracts are not typically exclusive and our clients are generally free to offer temporary staffing assignments to our competitors. Additionally, our clients may choose to purchase these services through intermediaries such as group purchasing organizations, with whom we establish relationships in order to continue to provide our staffing services to certain of our healthcare facilities. These intermediary organizations may negatively affect our ability to obtain new clients and maintain our existing client relationships by impeding our ability to access and contract directly with clients and may also negatively affect the profitability of these client relationships. In addition, our inability to establish relationships with these intermediaries may result in us losing our ability to work with certain healthcare facilities.
Consolidation and concentration in buyers of healthcare workforce solutions and staffing services could negatively affect pricing of our services and increase our concentration risk.
Our success in winning managed services contracts means revenues from some larger health systems have grown and may continue to grow substantially relative to our other revenue sources. In addition, we have seen an increase in our clients’ use of intermediaries such as vendor management service companies and group purchasing organizations as well as consolidation of healthcare systems, which may provide these organizations enhanced bargaining power. These dynamics could lead to a greater concentration of buyers of healthcare staffing services and less diversification of our customer base, which could negatively affect pricing for our services. One of our clients within our nurse and allied solutions segment comprised approximately
11%
of our consolidated revenue in
2016
. If we were to lose that client or were unable to provide a significant amount of services to that client, whether directly or as a subcontractor, such loss may have a material adverse effect on our revenue, results of operations and cash flows.
If we are unable to anticipate and quickly respond to changing marketplace conditions, such as alternative modes of healthcare delivery, reimbursement and client needs, we may not remain competitive.
The settings for the delivery of patient services continually evolve and implicate alternative modes of healthcare delivery, such as retail medicine, telemedicine and home health. Changes in reimbursement models, government mandates, and the public’s adoption and demand for such new modes of healthcare delivery may negatively affect our clients’ demand for our services, which, in turn, could negatively affect our revenue, results of operations and cash flows.
Our success depends upon our ability to develop innovative workforce solutions and quickly adapt to changing marketplace conditions and client needs, come into compliance with new federal or state regulations, and differentiate our services and abilities from those of our competitors. The markets in which we compete are highly competitive and our competitors may respond more quickly to new or emerging client needs and marketplace conditions. The development of new service lines and business models requires close attention to emerging trends and proposed federal and state legislation related to the healthcare industry. If we are unable to anticipate changing marketplace conditions, adapt our current business model to adequately meet changing conditions in the healthcare industry and develop and successfully implement innovative services, we may not remain competitive.
The ability of our clients to retain and increase the productivity of their permanent staff or their ability to increase the efficiency and effectiveness of their internal recruiting efforts, through online recruiting or otherwise, may affect the demand for our services, which could negatively affect our revenue, results of operations and cash flows.
If our clients retain and increase the productivity of their permanent clinical staff, their need for our recruitment and placement services for temporary and permanent positions may decline. Higher permanent staff retention rates and increased productivity of permanent staff members could result in increased efficiencies, thereby reducing the demand for both our recruitment and placement services for temporary and permanent positions, which could negatively affect our revenue, results of operation and cash flows. Additionally, many of our clients maintain internal recruitment functions of various degrees of sophistication for their staffing needs, including utilization of online recruitment technologies. If such clients are able to successfully increase the efficiency and effectiveness of their internal recruiting efforts, through more effective internet- or social media-based recruiting or otherwise, it could reduce the demand for our permanent and temporary staffing services, which could negatively affect our revenue, results of operations and cash flows.
8
The repeal of the Patient Protection and Affordable Care Act without a corresponding replacement, or such a repeal with a corresponding replacement that significantly reduces the number of individuals who maintain health insurance, may negatively affect the demand for our services.
In 2010, significant reforms to the health care system were adopted as law in the United States. The law (the “ACA”) includes provisions that, among other things, require all individuals to have health insurance (with limited exceptions). As a result of the ACA, the number of individuals covered under health insurance has increased by an estimated 20 million through 2016. The Trump administration and many members of Congress seem to support the repeal of the ACA. There remains a number of uncertainties surrounding the ACA, including whether it will be repealed or repealed and replaced, and, if repealed and replaced, the nature of the replacement and how long this entire process will take. If members of the investor community believe that a repeal of, or significant changes to, the ACA are forthcoming and that such actions may significantly reduce the number of insured or the demand for our services, it may have a negative effect on the price of our common stock. If the effect of any repeal and replacement of the ACA (or simply a repeal) actually leads to a significant reduction in demand for the healthcare services provided by our clients, in turn, the demand for our services may decline. Accordingly, although it is too early to understand and predict the ultimate impact of the uncertainty surrounding the ACA on our business, a repeal of the ACA and new legislation and resulting regulations could have a significant adverse effect on our business, cash flows, financial condition and results of operations.
Regulatory and Legal Risk Factors
We are subject to federal and state healthcare industry regulation including conduct of operations, costs and payment for services and payment for referrals as well as laws regarding employment practices and government contracting.
The healthcare industry is subject to extensive and complex federal and state laws and regulations related to conduct of operations, costs and payment for services and payment for referrals. We provide workforce solutions and services on a contract basis to our clients, who pay us directly. Accordingly, Medicare, Medicaid and insurance reimbursement policy changes generally do not directly impact us. Nevertheless, reimbursement changes in government programs, particularly Medicare and Medicaid, can and do indirectly affect the demand and the prices paid for our services. For example, our clients could receive reduced or no reimbursements because of a change in the rates or conditions set by federal or state governments, which would negatively affect the demand and the prices for our services. Moreover, our hospital, healthcare facility and physician practice group clients could suffer civil and criminal penalties, and be excluded from participating in Medicare, Medicaid and other healthcare programs for failure to comply with applicable laws and regulations, which may negatively affect our profitability.
A portion of our hospital and healthcare facility clients are state and federal government agencies, where our ability to compete for new contracts and orders, and the profitability of these contracts and orders, may be affected by government legislation, regulation or policy. Additionally, in providing services to state and federal government clients and to clients who participate in state and federal programs, we are also subject to specific laws and regulations, which government agencies have broad latitude to enforce. If we were to be excluded from participation in these programs or should there be regulatory or policy changes or modification of application of existing regulations adverse to us, it would likely materially adversely affect our business, results of operations and cash flows.
The success of our business depends on our ability to quickly and efficiently assist in obtaining licenses and privileges for our healthcare professionals. The costs to provide these credentialing services impact the revenue and profitability of our business.
We are also subject to certain laws and regulations applicable to recruitment and placement agencies. Like all employers, we must also comply with various laws and regulations relating to employment and pay practices. There is a risk that we could be subject to payment of additional wages, insurance and employment and payroll-related taxes. Because of the nature of our business, the impact of these employment and payroll laws and regulations may have a more pronounced effect on our business. These laws and regulations may also impede our ability to grow the size and profitability of our operations.
The challenge to the classification of certain of our healthcare professionals as independent contractors could adversely affect our profitability.
We treat physicians and certain advanced practitioners, such as certified nurse anesthetists, nurse practitioners and physician assistants, as independent contractors. Federal or state taxing authorities may take the position that such professionals are employees exposing us to additional wage and insurance claims and employment and payroll-related taxes. A reclassification of our locum tenens clinicians and physicians to employees from independent contractors could result in liability that would have a significant negative impact on our profitability for the period in which such reclassification was
9
implemented, and would require changes to our payroll and related business processes, which could be costly. In addition, many states have laws that prohibit non-physician owned companies from employing physicians, referred to as the “corporate practice of medicine.” If our independent contractor physicians were classified as employees in states that prohibit the corporate practice of medicine, we may be prohibited from conducting our locum tenens staffing business in those states under our current business model, which may have a substantial negative effect on our revenue, results of operations and profitability.
Investigations, claims and legal proceedings alleging medical malpractice, violation of employment and wage regulations and other theories of liability asserted against us could subject us to substantial liabilities.
We, along with our clients and healthcare professionals, are subject to investigations, claims and legal actions alleging malpractice or related legal theories. At times, plaintiffs name us in these lawsuits and actions regardless of our contractual obligations, the competency of the healthcare professionals, the standard of care provided by the healthcare professionals, the quality of service that we provided or our actions. In certain instances, we are contractually required to indemnify our clients against some or all of these potential legal actions. Additionally, we may be subject to various employment claims, including wage and hour claims, by our corporate employees and our employed healthcare professionals. We are also subject to possible claims alleging discrimination, sexual harassment and other similar activities in which we or our hospital and healthcare facility clients and their agents have allegedly engaged. We also face challenges to our business practices arising from our agreements with our employees, contractors, clients and vendors.
The nature of our business requires us to place our healthcare professionals in the workplaces of other businesses. Many of these individuals have access to client proprietary information systems and confidential information. An inherent risk of such activity includes possible claims of intentional misconduct, release, misuse or misappropriation of client intellectual property, confidential information, funds or other property, cybersecurity breaches affecting our clients or us, criminal activity, torts or other claims. Such claims may result in negative publicity, injunctive relief, criminal investigations or charges, civil litigation, payment by us of monetary damages or fines, or other adverse effects on our business, which may be material.
We maintain various types of insurance coverage for these types of claims, including professional liability and employment practices, through commercial insurance carriers and a wholly-owned captive insurance company. However, the cost of defending such claims, even if groundless, could be substantial and the associated negative publicity could adversely affect our ability to attract, retain and place qualified employees and healthcare professionals in the future. We may also experience increased insurance premiums and retention and deductible accruals that we may not be able to pass on to our clients, thereby reducing our profitability. Moreover, our insurance coverage and reserve accruals may not be sufficient to cover all claims against us.
We are also subject to examination of our payroll practices from various federal and state taxation authorities from time to time and an unforeseen negative outcome from such an exam could have a negative impact on our financial position, results of operations and cash flows.
Security breaches and other disruptions could compromise our information and expose us to liability, which would cause our business and reputation to suffer and could subject us to substantial liabilities.
In the ordinary course of our business, we collect and store sensitive data, such as our proprietary business information and that of our clients as well as personally identifiable information of our healthcare professionals and employees, including full names, social security numbers, addresses, birth dates and payroll-related information, in our data centers and on our networks. Our employees may also have access to, receive and use personal health information in the ordinary course of our business. The secure processing, maintenance and transmission of this information is critical to our operations. Despite our security measures and business controls, our information technology and infrastructure may be vulnerable to attacks by hackers, breached due to employee error, malfeasance or other disruptions or subject to the inadvertent or intentional unauthorized release of information. Any such occurrence could compromise our networks and the information stored thereon could be accessed, publicly disclosed, lost or stolen. Any such access, disclosure or other loss of information could (1) result in legal claims or proceedings, liability under laws that protect the privacy of personal information and regulatory penalties, (2) disrupt our operations and the services we provide to our clients and (3) damage our reputation, any of which could adversely affect our profitability, revenue and competitive position.
Additionally, the possession and use of personal information and data in conducting our business subjects us to legislative and regulatory burdens. We may be required to incur significant costs to comply with mandatory privacy and security standards and protocols imposed by law, regulation, industry standards or contractual obligations with our clients.
10
Risk Factors Related to Our Operations, Personnel and Information Systems
Our inability to implement new infrastructure and technology systems and technology disruptions may adversely affect our operating results and ability to manage our business effectively.
We have technology, operations and human capital infrastructures to support our existing business. Our ability to deliver services to our clients and to manage our internal systems depends largely upon our access to and the performance of our management information and communications systems, including our VMS, client relationship management systems and client/healthcare professional-facing self-service websites. These technology systems also maintain accounting and financial information upon which we depend to fulfill our financial reporting obligations. We must continue to invest in this infrastructure and we have embarked on a multi-year plan to upgrade and convert our infrastructure, back office and front office network platforms to support our growth and improve our efficiency. The majority of the upgrades are expected to be completed by the end of 2018. Implementing new systems is costly and involves risks inherent in the conversion to a new technology platform, including loss of information, disruption to our normal operations, changes in accounting procedures and internal control over financial reporting, as well as problems achieving accuracy in the conversion of electronic data. Failure to properly or adequately address these issues could result in increased costs, the diversion of management’s and employees’ attention and resources and could materially adversely affect our operating results, internal controls over financial reporting and ability to manage our business effectively.
Although we have risk mitigation measures, these systems, and our access to these systems, are not impervious to floods, fire, storms, or other natural disasters, or service interruptions. There also is a potential for intentional and deliberate attacks to our systems, which may lead to service interruptions, data corruption or data theft. Additionally, these systems are subject to other non-environmental risks, including technological obsolescence and lack of strategic alignment with our evolving business. If our current or planned systems do not adequately support our operations, are damaged or disrupted or if we are unable to replace, repair, maintain or expand them, it may adversely affect our business operations and our profitability.
Disruption to or failures of our SaaS-based technology within certain of our service offerings or our inability to adequately protect our intellectual property rights with respect to such technology could reduce client satisfaction, harm our reputation and negatively affect our business.
The performance and reliability of the SaaS-based technology within our VMS (including in connection with MSP for our clients) and workforce optimization service offerings are critical to such offerings’ operations, reputation and ability to attract new clients. Some of our clients rely on our SaaS-based technology to perform certain of their operational functions. Accordingly, any errors, defects, disruptions or other performance problems with our SaaS-based technology could damage our or our clients’ reputations and negatively affect our ability to attract new clients. If any of these problems occur, our clients may, among other things, terminate their agreements with us or make indemnification or other claims against us, which may also negatively affect us.
Additionally, if we fail to protect our intellectual property rights adequately with respect to our SaaS-based technology, our competitors might gain access to it, and our business might be harmed. Moreover, any of our intellectual property rights protecting our SaaS-based technology may be challenged by others or invalidated through litigation, and defending our intellectual property rights might also entail significant expense. Accordingly, despite our efforts, we may be unable to prevent third parties from using or infringing upon or misappropriating our intellectual property with respect to our SaaS-based technology, which may negatively affect our business as it relates to our SaaS-based offerings.
We are increasingly dependent on third parties for the execution of certain critical functions.
We have outsourced certain critical applications or business processes to external providers including cloud-based services. We exercise care in the selection and oversight of these providers. However, the failure or inability to perform on the part of one or more of these critical suppliers could cause significant disruptions and increased costs to our business.
Cybersecurity risks and cyber incidents could adversely affect our business and disrupt operations.
Cyber incidents can result from deliberate attacks or unintentional events. These incidents can include, but are not limited to, gaining unauthorized access to digital systems for purposes of misappropriating assets or sensitive information, corrupting data, or causing operational disruption. Because the techniques used to obtain unauthorized access, disable or degrade service, or sabotage systems change frequently and may not immediately produce signs of intrusion, we may be unable to anticipate these incidents or techniques, timely discover them, or implement adequate preventative measures. Our information technology may not provide sufficient protection, and as a result we may lose significant information about us or our employees or clients. Other results of these incidents could include, but are not limited to, disrupted operations, liability for stolen assets or the
11
disclosure of personally identifiable information of our employees or independent contractors, misstated financial data, increased cybersecurity protection costs, litigation and reputational damage adversely affecting customer or investor confidence.
If we do not continue to recruit and retain sufficient quality healthcare professionals at reasonable costs, it could increase our operating costs and negatively affect our business and our profitability.
We rely significantly on our ability to recruit and retain a sufficient number of healthcare professionals who possess the skills, experience and licenses necessary to meet the requirements of our clients. We compete with healthcare staffing companies, recruitment and placement agencies, including online staffing and recruitment agencies, and with hospitals, healthcare facilities and physician practice groups to attract healthcare professionals based on the quantity, diversity and quality of assignments offered, compensation packages and the benefits that we provide. We rely on our human capital intensive, relationship-oriented approach and national infrastructure to enable us to compete in all aspects of our business. We must continually evaluate and expand our temporary and permanent healthcare professional network to serve the needs of our clients.
In addition, with a current shortage of certain qualified nurses and physicians in many areas of the United States, competition for the hiring of these professionals remains intense. Our ability to recruit and retain temporary and permanent healthcare professionals depends on several factors, including our ability to provide our healthcare professionals with assignments and placements that they view as attractive and to provide competitive compensation packages. The costs of attracting healthcare professionals and providing them with attractive compensation packages may be higher than we anticipate, or we may be unable to pass these costs on to our hospital and healthcare facility clients, which may reduce our profitability. Moreover, if we are unable to recruit temporary and permanent healthcare professionals, our service execution may deteriorate and, as a result, we could lose clients.
The inability to properly screen and match quality healthcare professionals with suitable placements may negatively affect demand for our services.
Our success depends on the quality of our healthcare professionals. A quality or licensure issue could adversely affect our business, client demand for our services and potential for growth. Our ability to ensure the quality of our healthcare professionals relies heavily on the effectiveness of our data and communication systems as well as properly trained and competent operational employees that screen and match healthcare professionals in suitable placements. An inability to properly screen, match, and monitor healthcare professionals for acceptable credentials, experience and performance may cause clients to lose confidence in our services, which may damage our reputation and result in clients opting to utilize competitors’ services or rely on their own internal resources.
Our operations may deteriorate if we are unable to continue to attract, develop and retain our sales and operations team members.
Our success depends heavily upon the recruitment, performance and retention of our sales and operations team members who share our values, passion and commitment to customer focus. The number of individuals who meet our qualifications for these positions is limited, and we may experience difficulty in attracting qualified candidates, especially as we diversify our offerings and our business becomes more complex. In addition, we commit substantial resources to the training, development and support of our team members. Competition for qualified sales and operational team members in the line of business in which we operate is strong, and we may not be able to retain a sufficient number of team members after we have expended the time and expense to recruit and train them.
The loss of key officers and management personnel could adversely affect our business and operating results.
We believe that the success of our business strategy and our ability to maintain our recent levels of profitability depends on the continued employment of our senior executive team. We have an employment agreement with Susan R. Salka, our President and Chief Executive Officer, through May 4, 2018, which is renewable on an annual basis. Other senior members of the management team are employees at will with standard severance agreements. If members of our senior executive team become unable or unwilling to continue in their present positions, our business and financial results could be adversely affected.
12
Our inability to maintain our positive brand awareness and identity may adversely affect our results of operations.
We have invested substantial amounts in acquiring, developing and maintaining our brands, and our success depends on our ability to maintain positive brand awareness identities for existing services and effectively building up brand awareness and image for new services. We cannot assure that additional expenditures and our continuing commitment to marketing and improving our brands will have the desired effect on our brands’ value, which may adversely affect our results of operations. In addition, our brands may suffer reputational damage that could negatively affect our short- and long-term financial results.
Our inability to consummate and effectively incorporate acquisitions into our business operations may adversely affect our results of operations.
We invest time and resources in carefully assessing opportunities for acquisitions, and we have made acquisitions in the past several years to broaden the scope and depth of our workforce solutions and bolster our workforce services. Despite diligence and integration planning, acquisitions still present certain risks, including the time and economic costs of integrating an acquisition’s technology, control and financial systems, unforeseen liabilities, and the difficulties in bringing together different work cultures and personnel. Difficulties in integrating our acquisitions, including attracting and retaining talent to grow and manage these acquired businesses, may adversely affect our results of operations.
In addition, we may not be able to consummate acquisitions in the future on terms acceptable to us, or at all. Future acquisitions are accompanied by the risk that the obligations and liabilities of an acquired company may not be adequately reflected in the historical financial statements of that company and the risk that those historical financial statements may be based on assumptions that are incorrect or inconsistent with our assumptions or approach to accounting policies. Any of these material obligations, liabilities or incorrect or inconsistent assumptions could adversely impact our results of operations and financial condition.
We maintain a substantial amount of goodwill and indefinite-lived intangibles on our balance sheet that may decrease our earnings or increase our losses if we recognize an impairment to goodwill or indefinite-lived intangibles.
We maintain goodwill on our balance sheet, which represents the excess of the total purchase price of our acquisitions over the fair value of the net assets and indefinite-lived intangibles we acquired. We evaluate goodwill and indefinite-lived intangibles for impairment annually, or when evidence of potential impairment exists. If we identify an impairment, we record a charge to earnings. An impairment charge to goodwill or indefinite-lived intangibles would decrease our earnings or increase our losses, as the case may be.
Risk Factors Related to Our Indebtedness and Other Liabilities
Our significant indebtedness could adversely affect our ability to raise additional capital to fund our operations, limit our ability to react to changes in the economy or our industry, and expose us to interest rate risk to the extent of any variable rate debt.
We have a significant amount of indebtedness. As of
December 31, 2016
, our total indebtedness, less unamortized fees, equaled $362.9 million. Our substantial indebtedness could have important consequences, including:
|
•
|
increasing our vulnerability to adverse economic, industry or competitive developments,
|
|
•
|
requiring a substantial portion of our cash flows from operations to be dedicated to the payment of principal and interest on our indebtedness, therefore reducing our ability to use our cash flows to fund operations, capital expenditures and future business opportunities,
|
|
•
|
making it more difficult for us to satisfy our obligations with respect to our indebtedness,
|
|
•
|
restricting us from making strategic acquisitions or causing us to make non-strategic divestitures,
|
|
•
|
limiting our ability to obtain additional financing for working capital, capital expenditures, product and service development, debt service requirements, acquisitions, and general corporate or other purposes, and
|
|
•
|
limiting our flexibility in planning for, or reacting to, changes in our business or market conditions and placing us at a competitive disadvantage compared to our competitors who are less highly leveraged and who, therefore, may be able to take advantage of opportunities that our substantial indebtedness may prevent us from exploiting.
|
Our ability to service our indebtedness will depend on our ability to generate cash in the future. We cannot provide assurance that our business will generate sufficient cash flow from operations or that future borrowings will be available in an amount sufficient to enable us to service our indebtedness or to fund other liquidity needs. Additionally, if we are not in compliance with the covenants and obligations under our debt instruments, we would be in default, and the lenders could call the debt, which would have a material adverse effect on our business.
13
The terms of our debt instruments impose restrictions on us that may affect our ability to successfully operate our business.
Our debt instruments contain various covenants that could adversely affect our ability to finance our future operations or capital needs and to engage in other business activities that may be in our best interest. These covenants limit our ability to, among other things:
|
•
|
incur or guarantee additional indebtedness or issue certain preferred equity,
|
|
•
|
pay dividends on, redeem, repurchase, or make distributions in respect of our capital stock, prepay, redeem, or repurchase certain debt or make other restricted payments,
|
|
•
|
make certain investments,
|
|
•
|
create, or permit to exist, certain liens,
|
|
•
|
sell assets,
|
|
•
|
enter into sale/leaseback transactions,
|
|
•
|
enter into agreements restricting restricted subsidiaries’ ability to pay dividends or make other payments,
|
|
•
|
consolidate, merge, sell, or otherwise dispose of all or substantially all of our assets,
|
|
•
|
enter into certain transactions with affiliates, and
|
|
•
|
designate restricted subsidiaries as unrestricted subsidiaries.
|
Our ability to comply with these covenants may be affected by events beyond our control, such as prevailing economic conditions and changes in regulations, and if such events occur, we cannot be sure that we will be able to comply. A breach of these covenants could result in a default under our debt instruments (including as a result of cross-default provisions) and, in the case of our revolver under our credit agreement, permit the lenders thereunder to cease making loans to us. If there were an event of default under any of our debt instruments, holders of such defaulted debt could cause all amounts borrowed under the applicable instrument to be due and payable immediately. Our assets or cash flow may not be sufficient to repay borrowings under our outstanding debt instruments in the event of a default thereunder.
In addition, the restrictive covenants in our credit agreement require us to maintain specified financial ratios and satisfy other financial condition tests. Although we were in compliance with the financial ratios and financial condition tests set forth in our credit agreement on December 31, 2016, we cannot provide assurance that we will continue to be. Our ability to meet those financial ratios and tests will depend on our ongoing financial and operating performance, which, in turn, will be subject to economic conditions and to financial, market, and competitive factors, many of which are beyond our control. A breach of any of these covenants could result in a default under our credit agreement (and our other debt instruments to the extent the default triggers a cross default provision) and, in the case of the revolver under our credit agreement, permit the lenders thereunder to cease making loans to us. Upon the occurrence of an event of default under the credit agreement, the lenders could elect to declare all amounts outstanding thereunder to be immediately due and payable and terminate all commitments to extend further credit. Such action by the lenders could cause cross-defaults under our other debt instruments.
We have substantial insurance-related accruals on our balance sheet, and any significant adverse adjustments in these accruals may decrease our earnings or increase our losses and negatively impact our cash flows.
We maintain accruals related to our captive insurance company and self-insured retentions for various lines of insurance coverage, including professional liability, employment practices, health insurance and workers compensation on our balance sheet. We determine the adequacy of our accruals by evaluating our historical experience and trends, related to both insurance claims and payments, information provided to us by our insurance brokers, attorneys, third-party administrators and actuarial firms as well as industry experience and trends. If such information collectively indicates that our accruals are understated, we provide for additional accruals; a significant increase to these accruals would decrease our earnings.
|
Item 1B.
|
Unresolved Staff Comments
|
None.
14
Item 2.
Properties
We lease all of our properties, which consist of office-type facilities. We believe that our leased space is adequate for our current needs and that we can obtain adequate space to meet our foreseeable business needs. We have pledged substantially all of our leasehold interests to our lenders under our credit agreement to secure our obligations thereunder. We set forth below our principal leased office spaces as of
December 31, 2016
together with our business segments that utilize them:
|
Location
|
Square Feet
|
|
|
San Diego, California (corporate headquarters and all segments)
|
199,418
|
|
|
Dallas, Texas (all segments)
|
108,502
|
|
|
Item 3.
|
Legal Proceedings
|
From time to time, we are involved in various lawsuits, claims, investigations and proceedings that arise in the ordinary course of business. These matters typically relate to professional liability, tax, payroll, contract, competitor disputes and employee-related matters and include individual and collective lawsuits, as well as inquiries and investigations by governmental agencies regarding our employment practices. Additionally, some of our clients may also become subject to claims, governmental inquiries and investigations and legal actions relating to services provided by our healthcare professionals. Depending upon the particular facts and circumstances, we may also be subject to indemnification obligations under our contracts with such clients relating to these matters. We record a liability when management believes an adverse outcome from a loss contingency is both probable and the amount, or a range, can be reasonably estimated. Significant judgment is required to determine both probability of loss and the estimated amount. We review our loss contingencies at least quarterly and adjust our accruals and/or disclosures to reflect the impact of negotiations, settlements, rulings, advice of legal counsel or other new information, as deemed necessary. The most significant matters for which we have established loss contingencies are class actions related to wage and hour claims. Management currently believes the probable loss related to these wage and hour claims is not significant and the amount accrued by us for such claims is not material as of
December 31, 2016
. However, losses ultimately incurred for such claims could materially differ from amounts already accrued by us.
With regard to outstanding loss contingencies as of
December 31, 2016
, we believe that such matters will not, either individually or in the aggregate, have a material adverse effect on our business, consolidated financial position, results of operations or cash flows.
|
Item 4.
|
Mine Safety Disclosures
|
Not applicable.
15
|
Item 5.
|
Market For Registrant’s Common Equity, Related Stockholder Matters and Issuer Purchases of Equity Securities
|
Our common stock trades on the New York Stock Exchange under the symbol “AMN.” The last reported sale of our common stock on February 14, 2017 on the New York Stock Exchange was $38.90 per share. The following table sets forth, for the periods indicated, the high and low sales prices reported by the New York Stock Exchange.
|
|
Sales Price
|
||||||
|
|
High
|
Low
|
|||||
|
Year Ended December 31, 2015
|
|||||||
|
First Quarter
|
$
|
23.75
|
|
$
|
17.92
|
|
|
|
Second Quarter
|
$
|
31.95
|
|
$
|
22.65
|
|
|
|
Third Quarter
|
$
|
37.47
|
|
$
|
28.39
|
|
|
|
Fourth Quarter
|
$
|
33.98
|
|
$
|
23.07
|
|
|
|
Year Ended December 31, 2016
|
|||||||
|
First Quarter
|
$
|
34.10
|
|
$
|
21.24
|
|
|
|
Second Quarter
|
$
|
41.38
|
|
$
|
33.02
|
|
|
|
Third Quarter
|
$
|
44.99
|
|
$
|
30.96
|
|
|
|
Fourth Quarter
|
$
|
40.40
|
|
$
|
26.00
|
|
|
As of February 14, 2017, there were 19 stockholders of record of our common stock, one of which was Cede & Co., a nominee for The Depository Trust Company. All of our common stock held by brokerage firms, banks and other financial institutions as nominees for beneficial owners are considered to be held of record by Cede & Co., which is considered to be one stockholder of record. A substantially greater number of holders of our common stock are “street name” or beneficial holders, whose shares are held of record by banks, brokers and other financial institutions. Because such shares are held on behalf of stockholders, and not by the stockholders directly, and because a stockholder can have multiple positions with different brokerage firms, banks and other financial institutions, we are unable to determine the total number of stockholders we have without undue burden and expense.
During the fiscal year ended
December 31, 2016
, we did not sell any equity securities that were not registered under the Securities Act.
From time to time, we may repurchase our common stock in the open market pursuant to programs approved by our Board. We may repurchase our common stock for a variety of reasons, such as acquiring shares to offset dilution related to equity-based incentives and optimizing our capital structure. On November 1, 2016, our Board authorized us to repurchase up to $150.0 million of our outstanding common stock in the open market. Under the repurchase program announced on November 1, 2016 (the “Company Repurchase Program”), share purchases may be made from time to time beginning in the fourth quarter of 2016, depending on prevailing market conditions and other considerations. The Company Repurchase Program has no expiration date and may be discontinued or suspended at any time.
During the fourth quarter of 2016, we repurchased 443,353 shares of our common stock at an average price of $29.88 per share, resulting in an aggregate purchase price of $13.3 million. See “Item 8. Financial Statements and Supplementary Data—Notes to Consolidated Financial Statements—Note (10)(b), Capital Stock—Treasury Stock.” The following table presents the detail of shares repurchased during the fourth quarter of 2016, which was the only quarter during which we repurchased shares during 2016. All share repurchases reflected in the table below were made under the Company Repurchase Program, which is the sole repurchase program of the Company currently in effect.
16
|
Period
|
Total
Number of
Shares (or
Units)
Purchased
|
Average
Price Paid
per Share
(or Unit)
|
Total Number of
Shares (or Units)
Purchased as Part of
Publicly Announced
Plans or Programs
|
Maximum Number (or
Approximate Dollar
Value) of Shares (or Units)
that May Yet Be
Purchased Under the Plans
or Programs
|
||
|
November 1 - 30, 2016
|
438,253
|
|
$29.85
|
438,253
|
|
$136,907,167
|
|
December 1 - 31, 2016
|
5,100
|
|
$33.00
|
5,100
|
|
$136,738,729
|
|
|
|
|
|
|
|
|
|
Total
|
443,353
|
|
$29.88
|
443,353
|
|
$136,738,729
|
We have not paid any dividends on our common stock in the past and currently do not expect to pay cash dividends or make any other distributions on common stock in the future. We expect to retain our future earnings, if any, for use in the operation and expansion of our business, to pay down debt and potentially for share repurchases. Any future determination to pay dividends on common stock will be at the discretion of our board of directors and will depend upon our financial condition, results of operations, capital requirements and such other factors as the board deems relevant. In addition, our ability to declare and pay dividends on our common stock is subject to covenants restricting such actions in the instruments governing our debt. See “Item 7. Management’s Discussion and Analysis of Financial Condition and Results of Operations—Liquidity and Capital Resources” and “Item 8. Financial Statements and Supplementary Data—Notes to Consolidated Financial Statements—Note (8), Notes Payable and Credit Agreement.”
The information required by Item 201(d) of Regulation S-K is incorporated by reference to the 2017 Annual Meeting Proxy Statement (as defined in Item 10 below) under the heading “Equity Compensation Plan Information at December 31, 2016.”
17
Performance Graph
This performance graph shall not be deemed “filed” with the SEC or subject to Section 18 of the Exchange Act, nor shall it be deemed incorporated by reference in any of our filings under the Exchange Act or the Securities Act.
The graph below compares the total return on our common stock with the total return of (i) the NYSE Composite Index, and (ii) the Dow Jones US Business Training & Employment Agencies Index (“BTEA”), assuming an investment of $100 on December 31, 2011 in our common stock, the stocks comprising the NYSE Composite Index, and the stocks comprising the BTEA.
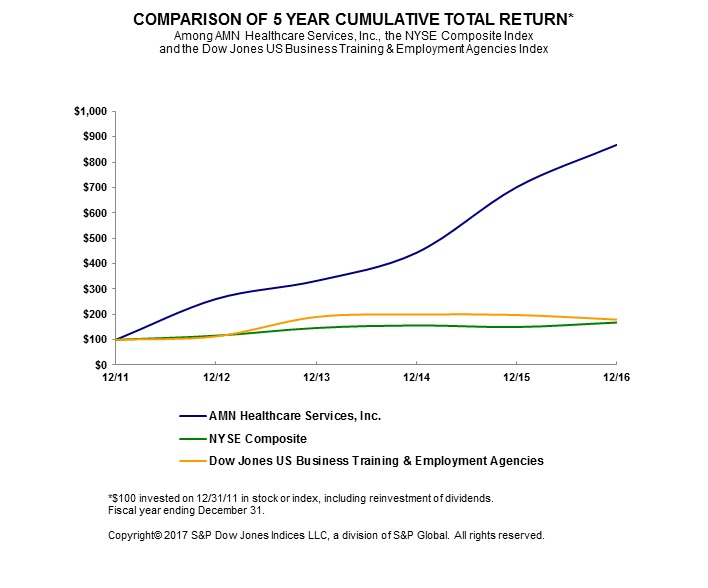
|
12/31/11
|
12/31/12
|
12/31/13
|
12/31/14
|
12/31/15
|
12/31/16
|
||||||||||||
|
AMN Healthcare Services, Inc.
|
100.00
|
|
260.72
|
|
331.83
|
|
442.44
|
|
700.90
|
|
867.95
|
|
|||||
|
NYSE Composite
|
100.00
|
|
115.99
|
|
146.47
|
|
156.36
|
|
149.97
|
|
167.87
|
|
|||||
|
BTEA
|
100.00
|
|
113.04
|
|
189.86
|
|
199.47
|
|
197.64
|
|
179.30
|
|
|||||
18
|
Item 6.
|
Selected Financial Data
|
You should read the selected financial and operating data presented below in conjunction with “Item 7. Management’s Discussion and Analysis of Financial Condition and Results of Operations” and “Item 8. Financial Statements and Supplementary Data” below. We derive our statements of operations data for the years ended
December 31, 2016
,
2015
and
2014
, and the balance sheet data at
December 31, 2016
and
2015
from the audited financial statements included elsewhere in this Annual Report on Form 10-K. We derive the statements of operations data for the years ended
December 31, 2013
and
2012
and the balance sheet data at
December 31, 2014
,
2013
and
2012
from audited financial statements of ours that do not appear herein.
During the fourth quarter of 2011, we decided to divest our home healthcare services segment and we sold the segment in 2012. Accordingly, we classified its results of operations as discontinued operations for the year ended December 31, 2012.
We completed our acquisition of (1) ShiftWise on November 20, 2013, (2) Avantas on December 22, 2014, (3) Onward Healthcare, including its two wholly-owned subsidiaries, Locum Leaders and Medefis (collectively “OH”), on January 7, 2015, (4) TFS on September 15, 2015, (5) Millican on October 5, 2015, (6) BES on January 4, 2016, (7) HSG on January 11, 2016 and (8) Peak on June 3, 2016. Our acquisitions affect the comparability of the selected financial data of the applicable pre-acquisition and post-acquisition time periods.
We have not paid any cash dividends during the past five fiscal years.
19
|
|
Fiscal Years Ended December 31,
|
||||||||||||||||||
|
|
2016
|
2015
|
2014
|
2013
|
2012
|
||||||||||||||
|
|
( in thousands, except per share data)
|
||||||||||||||||||
|
|
|||||||||||||||||||
|
Revenue
|
$
|
1,902,225
|
|
$
|
1,463,065
|
|
$
|
1,036,027
|
|
$
|
1,011,816
|
|
$
|
953,951
|
|
||||
|
Cost of revenue
|
1,282,501
|
|
993,702
|
|
719,910
|
|
714,536
|
|
683,554
|
|
|||||||||
|
Gross profit
|
619,724
|
|
469,363
|
|
316,117
|
|
297,280
|
|
270,397
|
|
|||||||||
|
Operating expenses:
|
|||||||||||||||||||
|
Selling, general and administrative
|
398,472
|
|
319,531
|
|
232,221
|
|
218,233
|
|
202,904
|
|
|||||||||
|
Depreciation and amortization
|
29,620
|
|
20,953
|
|
15,993
|
|
13,545
|
|
14,151
|
|
|||||||||
|
Total operating expenses
|
428,092
|
|
340,484
|
|
248,214
|
|
231,778
|
|
217,055
|
|
|||||||||
|
Income from operations
|
191,632
|
|
128,879
|
|
67,903
|
|
65,502
|
|
53,342
|
|
|||||||||
|
Interest expense, net, and other
|
15,465
|
|
7,790
|
|
9,237
|
|
9,665
|
|
26,019
|
|
|||||||||
|
Income from continuing operations before income taxes
|
176,167
|
|
121,089
|
|
58,666
|
|
55,837
|
|
27,323
|
|
|||||||||
|
Income tax expense
|
70,329
|
|
39,198
|
|
25,449
|
|
22,904
|
|
11,010
|
|
|||||||||
|
Income from continuing operations
|
105,838
|
|
81,891
|
|
33,217
|
|
32,933
|
|
16,313
|
|
|||||||||
|
Income from discontinued operations, net of tax
|
—
|
|
—
|
|
—
|
|
—
|
|
823
|
|
|||||||||
|
Net income
|
$
|
105,838
|
|
$
|
81,891
|
|
$
|
33,217
|
|
$
|
32,933
|
|
$
|
17,136
|
|
||||
|
Basic income per common share from:
|
|||||||||||||||||||
|
Continuing operations
|
$
|
2.21
|
|
$
|
1.72
|
|
$
|
0.71
|
|
$
|
0.72
|
|
$
|
0.36
|
|
||||
|
Discontinued operations
|
—
|
|
—
|
|
—
|
|
—
|
|
0.02
|
|
|||||||||
|
Net income
|
$
|
2.21
|
|
$
|
1.72
|
|
$
|
0.71
|
|
$
|
0.72
|
|
$
|
0.38
|
|
||||
|
Diluted income per common share from:
|
|||||||||||||||||||
|
Continuing operations
|
$
|
2.15
|
|
$
|
1.68
|
|
$
|
0.69
|
|
$
|
0.69
|
|
$
|
0.35
|
|
||||
|
Discontinued operations
|
—
|
|
—
|
|
—
|
|
—
|
|
0.02
|
|
|||||||||
|
Net income
|
$
|
2.15
|
|
$
|
1.68
|
|
$
|
0.69
|
|
$
|
0.69
|
|
$
|
0.37
|
|
||||
|
Weighted average common shares outstanding:
|
|||||||||||||||||||
|
Basic
|
47,946
|
|
47,525
|
|
46,504
|
|
45,963
|
|
41,632
|
|
|||||||||
|
Diluted
|
49,267
|
|
48,843
|
|
48,086
|
|
47,787
|
|
46,709
|
|
|||||||||
|
|
As of December 31,
|
||||||||||||||||||
|
|
2016
|
2015
|
2014
|
2013
|
2012
|
||||||||||||||
|
|
(in thousands)
|
||||||||||||||||||
|
|
|||||||||||||||||||
|
Cash and cash equivalents
|
$
|
10,622
|
|
$
|
9,576
|
|
$
|
13,073
|
|
$
|
15,580
|
|
$
|
5,681
|
|
||||
|
Total assets
|
1,186,881
|
|
880,432
|
|
680,731
|
|
604,288
|
|
517,386
|
|
|||||||||
|
Total notes payable, including current portion, less unamortized discount and fees
|
362,942
|
|
135,990
|
|
143,190
|
|
147,347
|
|
156,219
|
|
|||||||||
|
Total stockholders’ equity
|
449,383
|
|
347,860
|
|
256,581
|
|
217,742
|
|
182,111
|
|
|||||||||
20
|
Item 7.
|
Management’s Discussion and Analysis of Financial Condition and Results of Operation
s
|
You should read the following discussion in conjunction with our consolidated financial statements and the notes thereto and other financial information included elsewhere in this Annual Report on Form 10-K. Certain statements in this “Management’s Discussion and Analysis (“MD&A”) of Financial Condition and Results of Operations” are “forward-looking statements.” See “Special Note Regarding Forward-Looking Statements” under Item 1, “Business.” We intend this MD&A section to provide you with a narrative from the perspective of our management on our financial condition, results of operations, liquidity and certain other factors that may affect our future results. The following sections comprise this MD&A:
•
Changes to Our Reportable Segments
•
Overview of Our Business
•
Acquisitions During the Year Ended December 31, 2016
•
Recent Trends
•
Results of Operations
•
Liquidity and Capital Resources
•
Off-Balance Sheet and Other Financing Arrangements
•
Contractual Obligations
•
Critical Accounting Policies and Estimates
•
Recent Accounting Pronouncements
Changes to Our Reportable Segments
Effective as of January 1, 2016, we modified our reportable segments. We previously utilized three reportable segments,which we identified as follows: (1) nurse and allied healthcare staffing, (2) locum tenens staffing, and (3) physician permanent placement services. In light of our acquisitions over the past several years as well as our transition to a healthcare workforce solutions company, our management renamed our three reportable segments and also placed several of our business lines that were in our nurse and allied healthcare staffing segment into a different segment to better reflect how the business is evaluated by our chief operating decision maker. As of January 1, 2016, we began to disclose the following three reportable segments: (1) nurse and allied solutions, (2) locum tenens solutions, and (3) other workforce solutions. The nurse and allied solutions segment consists of our nurse, allied, local and labor disruption and rapid response staffing businesses. The locum tenens solutions segment consists of our locum tenens staffing business. The other workforce solutions segment consists of our (i) physician permanent placement services business, (ii) healthcare interim leadership staffing and executive search services business, (iii) vendor management systems business, (iv) recruitment process outsourcing business, (v) education business, (vi) medical coding and related consulting business, and (vii) workforce optimization services business. Prior period data in this “Management’s Discussion and Analysis of Financial Condition and Results of Operations” has been reclassified to conform to the new segment reporting structure.
Overview of Our Business
We provide healthcare workforce solutions and staffing services to healthcare facilities across the nation. As an innovative workforce solutions partner, our managed services programs, or “MSP,” vendor management systems, or “VMS,” recruitment process outsourcing, or “RPO,” workforce consulting services, predictive modeling, staff scheduling, remote medical coding and the placement of physicians, nurses, allied healthcare professionals and healthcare executives into temporary and permanent positions enable our clients to successfully reduce staffing complexity, increase efficiency and lead their organizations within the rapidly evolving healthcare environment.
For the year ended
December 31, 2016
, we recorded revenue of
$1,902.2 million
, as compared to
$1,463.1 million
for
2015
. We recorded net income of
$105.8 million
for
2016
, as compared to
$81.9 million
for
2015
. Nurse and allied solutions segment revenue comprised
62%
and
65%
of total consolidated revenue for the years ended
December 31, 2016
and
2015
, respectively. Locum tenens solutions segment revenue comprised
22%
and
26%
of total consolidated revenue for the years ended
December 31, 2016
and
2015
, respectively. Other workforce solutions segment revenue comprised
16%
and
9%
of total consolidated revenue for the years ended
December 31, 2016
and
2015
, respectively. For a description of the services we provide under each of our business segments, please see, “Item 1. Business—Our Services.”
21
We believe we have become recognized as the market-leading innovator in providing healthcare workforce solutions and staffing services in the United States. We seek to solidify our market-leading position through a number of management strategies that focus on market growth, increasing operational efficiency and scalability and increasing our supply of qualified healthcare professionals. Our growth strategy continues to focus on broadening and investing, both organically and through strategic acquisitions, in service offerings beyond our traditional temporary staffing and permanent placement services, to include more strategic and recurring revenue sources from innovative workforce solutions offerings such as MSP, VMS, RPO and workforce optimization services, which generally operate at higher margins than our traditional healthcare staffing businesses. We also seek strategic opportunities to expand into complementary service offerings to our staffing businesses that leverage our core capabilities of recruiting and credentialing healthcare professionals. Along those lines, we recently acquired Peak, which provides remote medical coding and related consulting services.
Operationally, our strategic initiatives focus on investing in and further developing our processes and systems to achieve market leading efficiency and scalability, which we believe will provide operating leverage as our revenue grows. From a healthcare professional supply perspective, we continue to invest in new candidate recruitment initiatives and technology infrastructure to access and utilize effectively our network of qualified healthcare professionals so that we can capitalize on the demand growth we are experiencing, which we expect to continue in the future due to the combined effects of healthcare reform, the aging population and labor shortages within certain regions and disciplines.
Over the last several years, we have worked to execute on our management strategies and intend to continue to do so in the future. Over the past five years, we have grown our business both organically and as a result of a number of acquisitions. Since November 2013, we have completed eight acquisitions, three of which occurred in 2016 and are described more fully below.
Additionally, in 2016, we experienced organic growth of 17
%
in consolidated revenue versus 2015 driven by double digit growth in each of our business segments.
Although inflation has not materially affected us over the past several years, the demand for temporary healthcare professionals increased significantly during most of 2016. This led to larger than typical bill rate increases for us to increase pay rates to attract an adequate supply of healthcare professionals to meet the demand, which contributed to the increase in organic revenue.
We typically experience modest seasonal fluctuations during our fiscal year and they tend to vary among our business segments. These fluctuations can vary slightly in intensity from year to year. Beginning in the third quarter of 2014 and throughout 2016, steadily and progressively increasing demand muted the effects of these quarterly fluctuations.
Acquisitions During the Year Ended December 31, 2016
During 2016, we completed the following three acquisitions:
•
On January 4, 2016, we completed the acquisition of BES, a full-service healthcare interim leadership placement and executive search firm that places interim leaders and executives across all healthcare settings, including acute care hospitals, academic medical hospitals, children’s hospitals, physician practices, and post-acute care providers. We believe the BES acquisition will provide us additional access to healthcare executives and enhance our integrated services to hospitals, health systems, and other healthcare facilities across the nation. We include the results of BES in our other workforce solutions segment.
•
On January 11, 2016, we completed the acquisition of HSG, which provides labor disruption and rapid response staffing. We include the results of HSG in our nurse and allied solutions segment.
•
On June 3, 2016, we completed the acquisition of Peak, which provides remote medical coding and related consulting solutions to hospitals and physician medical groups nationwide. We include the results of Peak in our other workforce solutions segment.
For 2016,
$170.9
million of revenue relating to BES, HSG and Peak, and $32.0 million of income before income taxes relating to BES, HSG and Peak were included in the consolidated statement of operations.
22
Recent Trends
The changing political landscape has caused uncertainty regarding the future of the Affordable Care Act. Notwithstanding this uncertainty, the healthcare staffing market environment, including demand for workforce solutions like MSP, remains strong. As a result, MSP revenue, which represents a longer term strategic relationship with clients, continues to increase faster than our traditional staffing revenue and represented approximately 51% and 43% of the nurse and allied solutions segment revenue for 2016 and 2015, respectively. As a natural outcome of the expansion of our workforce solution offerings, we are seeing certain larger health systems representing a greater portion of our revenue as these clients purchase multiple solutions from our suite of services.
The high demand for healthcare professionals has generally allowed us to negotiate increased bill rates and prioritize the demand based on a variety of criteria. In our travel nursing division, we have correspondingly passed a portion of our bill rates on to nurses through increased compensation in order to attract more nurses into our business. As a result, we have experienced some pressure on the gross margins in the nurse and allied solutions segment.
In our locum tenens solutions segment, demand trends remain favorable in most specialties. However, the primary constraint to faster growth in the business is the ability to recruit, credential and place an ample number of physicians to match the geographies of our demand.
The other workforce solutions segment along with our labor disruption management business, with its higher margin, are continuing to positively affect our consolidated gross and operating margins.
Results of Operations
The following table sets forth, for the periods indicated, certain statements of operations data as a percentage of revenue. Our results of operations include three reportable segments: (1) nurse and allied solutions, (2) locum tenens solutions, and (3) other workforce solutions. The acquisitions during 2016, 2015 and 2014 impact the comparability of the results between the years presented. See additional information in “Item 8. Financial Statements and Supplementary Data—Notes to Consolidated Financial Statements—Note (2), Business Combinations.” Our historical results are not necessarily indicative of our results of operations to be expected in the future.
|
|
Years Ended December 31,
|
|||||
|
|
2016
|
2015
|
2014
|
|||
|
Consolidated Statements of Operations:
|
||||||
|
Revenue
|
100.0
|
%
|
100.0
|
%
|
100.0
|
%
|
|
Cost of revenue
|
67.4
|
67.9
|
69.5
|
|||
|
Gross profit
|
32.6
|
32.1
|
30.5
|
|||
|
Selling, general and administrative
|
20.9
|
21.8
|
22.4
|
|||
|
Depreciation and amortization
|
1.6
|
1.4
|
1.5
|
|||
|
Income from operations
|
10.1
|
8.8
|
6.6
|
|||
|
Interest expense, net, and other
|
0.8
|
0.5
|
0.9
|
|||
|
Income before income taxes
|
9.3
|
8.3
|
5.7
|
|||
|
Income tax expense
|
3.7
|
2.7
|
2.5
|
|||
|
Net income
|
5.6
|
%
|
5.6
|
%
|
3.2
|
%
|
Comparison of Results for the Year Ended
December 31, 2016
to the Year Ended
December 31, 2015
Revenue
.
Revenue increased
30%
to
$1,902.2 million
for
2016
from
$1,463.1 million
for
2015
, due to additional revenue of approximately $194 million from our HSG, BES, Millican, TFS, OH and Peak acquisitions with the remainder of the increase driven by 17% organic growth.
Nurse and allied solutions segment revenue increased
24%
to
$1,185.1 million
for
2016
from
$953.3 million
for
2015
. Of the
$231.8 million
increase, $45.7 million was attributable to the additional revenue in connection with the HSG acquisition and $2.0 million was attributable to the prior year having one less week of revenue from the OH acquisition as it was consummated on January 7, 2015 (the “OH Stub Period”), with the remainder primarily attributable to a 13% increase in the average number of healthcare professionals on assignment and a 6% increase in the average bill rate during the year ended
December 31, 2016
.
23
Locum tenens solutions segment revenue increased
10%
to
$424.2 million
for
2016
from
$385.1 million
for
2015
. Of the
$39.2 million
increase, $0.6 million was attributable to the additional revenue of Locum Leaders over the OH Stub Period with the remainder primarily attributable to a 3% increase in the number of days filled and a 7% increase in the revenue per day filled during the year ended
December 31, 2016
.
Other workforce solutions segment revenue increased
135%
to
$292.9 million
for
2016
from
$124.7 million
for
2015
. Of the
$168.2 million
increase, $145.5 million was attributable to the additional revenue in connection with the BES, Millican, TFS, and Peak acquisitions and the additional revenue of Medefis over the OH Stub Period, with the remainder primarily attributable to an increase in billable active searches and the average placement value in the physician permanent placement business as well as growth in our VMS and workforce optimization services revenue during the year ended
December 31, 2016
.
Gross Profit
.
Gross profit increased
32%
to
$619.7 million
for
2016
from
$469.4 million
for
2015
, representing gross margins of
32.6%
and
32.1%
, respectively. The increase in consolidated gross margin was due to the growth in our higher margin other workforce solutions segment and higher bill-to-pay spreads in the locum tenens solutions segment, partially offset by higher direct costs in the nurse and allied solutions segment during the year ended
December 31, 2016
. Gross margin rate by reportable segment for
2016
and
2015
was 26.9% and
27.1%
for nurse and allied solutions, 31.1% and
30.2%
for locum tenens solutions, and 57.8% and
75.9%
for other workforce solutions, respectively. The other workforce solutions segment decrease was primarily due to the change in the sales mix resulting from the additions of BES, TFS and Peak during the year ended
December 31, 2016
.
Selling, General and Administrative Expenses
.
Selling, general and administrative (“SG&A”) expenses were
$398.5 million
, representing
20.9%
of revenue, for
2016
, as compared to
$319.5 million
, representing
21.8%
of revenue, for
2015
. The increase in SG&A expenses was primarily due to $35.1 million of additional SG&A expenses from the HSG, BES, Millican, TFS, and Peak acquisitions, and OH expenses over the OH Stub Period, as well as increased employee headcount, variable compensation, legal reserves, and other expenses associated with our revenue growth. SG&A expense increases as a result of acquisitions in the nurse and allied solutions, locum tenens solutions and other workforce solutions segments were $4.5 million, $0.1 million and $30.5 million, respectively. The increase in unallocated corporate overhead was primarily attributable to higher employee and variable expenses to support our growth, along with higher legal reserve costs. SG&A expenses broken down among the reportable segments, unallocated corporate overhead and share-based compensation are as follows:
|
|
(In Thousands)
Years Ended
December 31,
|
||||||
|
|
2016
|
2015
|
|||||
|
Nurse and allied solutions
|
$
|
156,676
|
|
$
|
134,570
|
|
|
|
Locum tenens solutions
|
73,126
|
|
68,096
|
|
|||
|
Other workforce solutions
|
91,936
|
|
54,327
|
|
|||
|
Unallocated corporate overhead
|
65,335
|
|
52,254
|
|
|||
|
Share-based compensation
|
11,399
|
|
10,284
|
|
|||
|
$
|
398,472
|
|
$
|
319,531
|
|
||
Depreciation and Amortization Expenses
.
Amortization expense increased 55% to
$18.3 million
for
2016
from
$11.8 million
for
2015
, primarily attributable to additional amortization expense related to the intangible assets acquired in the TFS, Millican, BES, HSG and Peak acquisitions. Depreciation expense increased 23% to
$11.3 million
for
2016
from
$9.2 million
for
2015
, primarily attributable to fixed assets acquired as part of the TFS, Millican, BES, HSG and Peak acquisitions and an increase in purchased and developed hardware and software for our ongoing front and back office information technology initiatives.
Interest Expense, Net, and Other
.
Interest expense, net, and other, was
$15.5 million
for
2016
as compared to
$7.8 million
for
2015
. The increase is primarily due to a higher average debt outstanding balance for the year ended
December 31, 2016
, which resulted from (1) borrowings under our credit facilities that we used primarily to finance the BES and Peak acquisitions and (2) the consummation of the issuance and sale of our Notes (as defined below in this Item 7) in October 2016.
Income Tax Expense
.
Income tax expense was
$70.3 million
for
2016
as compared to
$39.2 million
for
2015
, reflecting effective income tax rates of
39.9%
and
32.4%
for these periods, respectively. During 2015, we recorded a discrete federal income tax benefit of $12.2 million resulting from the IRS federal audit settlement. See additional information in “Item 8. Financial Statements and Supplementary Data—Notes to Consolidated Financial Statements—Note (7), Income Taxes.”
24
Comparison of Results for the Year Ended
December 31, 2015
to the Year Ended
December 31, 2014
Revenue
.
Revenue increased 41% to
$1,463.1 million
for
2015
from
$1,036.0 million
for
2014
, due to additional revenue of approximately $161.6 million from the acquisitions of OH, Avantas, TFS and Millican, with the remainder of the increase driven by 26% organic growth.
Nurse and allied solutions segment revenue increased 41% to
$953.3 million
for
2015
from
$674.1 million
for
2014
. Of the
$279.2 million
increase, approximately $99.8 million was attributable to the additional revenue in connection with the OH acquisition, with the remainder primarily attributable to increases in the average number of healthcare professionals on assignment, average bill rate charged to our clients and the average numbers of hours worked by our healthcare professionals during the year ended December 31, 2015.
Locum tenens solutions segment revenue increased 30% to
$385.1 million
for
2015
from
$296.2 million
for
2014
. Of the
$88.9 million
increase, $32.9 million was attributable to the additional revenue in connection with the OH acquisition, with the remainder primarily attributable to an increase in both the number of days filled and the average bill rate during the year ended December 31, 2015.
Other workforce solutions segment revenue increased 90% to
$124.7 million
for
2015
from
$65.8 million
for
2014
. The increase was primarily due to the increase in billable active searches and placements during the year ended December 31, 2015 and $28.9 million of additional revenue in connection with the OH, Avantas, TFS and Millican acquisitions.
Gross Profit
.
Gross profit increased 48% to
$469.4 million
for
2015
from
$316.1 million
for
2014
, representing gross margins of
32.1%
and
30.5%
, respectively. The increase in consolidated gross margin was due to an increase in gross margin in all of our reportable segments. The locum tenens solutions segment increase was primarily due to higher bill-to-pay spreads during the year ended December 31, 2015. The other workforce solutions segment increase was primarily due to the acquisitions of the higher margin Medefis and Avantas businesses, growth in our higher margin RPO and ShiftWise business lines and an increase in recruiter productivity during the year ended December 31, 2015. Gross margin rate by reportable segment for 2015 and 2014 was
27.1%
and 26.9% for nurse and allied solutions,
30.2%
and 29.3% for locum tenens solutions, and
75.9%
and 73.1% for other workforce solutions, respectively.
Selling, General and Administrative Expenses
.
SG&A expenses were
$319.5 million
, representing
21.8%
of revenue, for
2015
, as compared to
$232.2 million
, representing
22.4%
of revenue, for
2014
. The increase in SG&A expenses was primarily due to approximately $32.0 million of additional SG&A expenses from the OH, Avantas, TFS and Millican acquisitions, $5.1 million of acquisition and integration costs and higher expenses to support our growth, including additional sales and support headcount expenses, performance-based compensation and facilities and marketing expenses. SG&A expense increases in the nurse and allied solutions, locum tenens solutions and other workforce solutions segments were $14.7 million, $6.0 million and $10.7 million, respectively, with the additional SG&A expenses driven by the acquisitions and higher growth-related expenses. The increase in unallocated corporate overhead was primarily attributable to $5.1 million of acquisition and integration costs and higher employee and other expenses to support our growth. SG&A expenses broken down among the reportable segments, unallocated corporate overhead and share-based compensation are as follows:
|
|
(In Thousands)
Years Ended
December 31,
|
||||||
|
|
2015
|
2014
|
|||||
|
Nurse and allied solutions
|
$
|
134,570
|
|
$
|
98,682
|
|
|
|
Locum tenens solutions
|
68,096
|
|
55,876
|
|
|||
|
Other workforce solutions
|
54,327
|
|
33,510
|
|
|||
|
Unallocated corporate overhead
|
52,254
|
|
36,996
|
|
|||
|
Share-based compensation
|
10,284
|
|
7,157
|
|
|||
|
$
|
319,531
|
|
$
|
232,221
|
|
||
Depreciation and Amortization Expenses
.
Amortization expense increased 55% to
$11.8 million
for
2015
from $7.6 million for
2014
, primarily attributable to additional amortization expense related to the intangible assets acquired in the OH, Avantas, TFS and Millican acquisitions. Depreciation expense increased 10% to
$9.2 million
for
2015
from $8.4 million for
2014
, primarily attributable to fixed assets acquired as part of the OH, Avantas, TFS and Millican acquisitions and an increase in purchased and developed hardware and software placed in service for our ongoing front and back office information technology initiatives.
25
Interest Expense, Net, and Other
.
Interest expense, net, and other was
$7.8 million
for
2015
, as compared to
$9.2 million
for
2014
. The decrease is primarily due to a $3.1 million write-off of unamortized deferred financing fees and original issue discount in connection with the refinancing of our credit facilities during the year ended December 31, 2014, partially offset by a higher average outstanding debt balance for the year ended December 31, 2015, which resulted from our borrowings used to finance the OH acquisition.
Income Tax Expense
.
We recorded an income tax expense of
$39.2 million
for
2015
, as compared to
$25.4 million
for
2014
, reflecting effective income tax rates of
32.4%
and
43.4%
for these periods, respectively. During 2015, we recorded a discrete federal income tax benefit of $12.2 million resulting from the IRS federal audit settlement. See additional information in “Item 8. Financial Statements and Supplementary Data—Notes to Consolidated Financial Statements—Note (7), Income Taxes.”
Liquidity and Capital Resources
In summary, our cash flows were:
|
|
Year Ended December 31,
|
||||||||||
|
|
2016
|
2015
|
2014
|
||||||||
|
|
(in thousands)
|
||||||||||
|
Net cash provided by operating activities
|
$
|
131,851
|
|
$
|
56,313
|
|
$
|
27,678
|
|
||
|
Net cash used in investing activities
|
(257,362
|
)
|
(116,085
|
)
|
(28,228
|
)
|
|||||
|
Net cash provided by (used in) financing activities
|
126,290
|
|
56,200
|
|
(2,099
|
)
|
|||||
Historically, our primary liquidity requirements have been for acquisitions, working capital requirements, and debt service under our credit facilities. We have funded these requirements through internally generated cash flow and funds borrowed under our credit facilities. At
December 31, 2016
, (1) the total of our Second Term Loan (as defined below) outstanding (including both current and long-term portions), less unamortized fees, was $43.9 million, (2) zero was drawn with $264.2 million of available credit under our Revolver (as defined below), and (3) the total principal amount of our 5.125% Senior Notes due 2024 (the “Notes”) outstanding equaled $325.0 million. We describe in further detail our Credit Agreement (as defined below) under which our Revolver and Second Term Loan (and any other loans that may be made thereunder) are governed in “Item 8. Financial Statements and Supplementary Data—Notes to Consolidated Financial Statements—Note (8), Notes Payable and Credit Agreement.”
In April 2015, we entered into an interest rate swap agreement to minimize our exposure to interest rate fluctuations on $100 million of our outstanding variable rate debt under one of our Term Loans (as defined below in this Item 7) for which we pay a fixed rate of 0.983% per annum and receive a variable rate equal to floating one-month LIBOR. This agreement expires on March 30, 2018, and no initial investment was made to enter into this agreement. In connection with our issuance and sale of $325.0 million aggregate principal amount of the Notes and the use of a portion of the proceeds thereof to repay $138.4 million of our Term Loans on October 3, 2016, we reduced the interest rate swap notional amount to $40.0 million. See additional information in “Item 8. Financial Statements and Supplementary Data—Notes to Consolidated Financial Statements—Note (3), Derivative Instruments.”
We believe that cash generated from operations and available borrowings under our Revolver will be sufficient to fund our operations, including expected capital expenditures, for the next 12 months and beyond. We intend to finance potential future acquisitions with cash provided from operations, borrowings under our Revolver or other borrowing under our Credit Agreement, bank loans, debt or equity offerings, or some combination of the foregoing. The following discussion provides further details of our liquidity and capital resources.
Operating Activities
Net cash provided by operating activities for
2016
was
$131.9 million
, compared to
$56.3 million
for
2015
and
$27.7 million
for
2014
. The increase in net cash provided by operating activities for
2016
from
2015
was primarily attributable to (1) improved operating results, (2) a decrease in restricted cash, cash equivalents and investments attributable to cash payments made to our captive insurance entity, which are restricted for use by the captive for future claim payments and, to a lesser extent, its working capital needs, (3) a smaller increase in accounts receivable and subcontractor receivable in 2016 compared to the increase in these accounts in 2015 and (4) an increase in accrued compensation and benefits and other current liabilities between periods due to timing of collections. The overall increase was partially offset by a smaller increase in accounts payable and accrued expenses in 2016 compared to the increase in those accounts in 2015 due to timing of payments. Our Days Sales Outstanding was 64 days at each of
December 31, 2016
and
2015
.
26
Investing Activities
Net cash used in investing activities for
2016
,
2015
and
2014
were
$257.4 million
,
$116.1 million
and
$28.2 million
, respectively. The year-over-year increase in net cash used in investing activities was primarily attributable to (1) $216.5 million used for the acquisitions of BES and HSG in January 2016 and Peak in June 2016 as compared to $84.1 million used for acquisitions during 2015, and (2) a net $11.2 million restricted investment related to our captive insurance entity during 2016. Capital expenditures were
$22.0 million
,
$27.0 million
and
$19.1 million
for the years ended December 31,
2016
,
2015
and
2014
, respectively. Our capital expenditures in recent years were primarily to support the growth in the business and for investments made in conjunction with management initiatives to update our front and back office information technology platforms. We intend to continue our investment in these information technology initiatives, including investments of approximately $15 million in the next year, to standardize our staffing operations on PeopleSoft and Salesforce. We believe these investments will further differentiate our ability to deliver innovative workforce solutions in addition to delivering improved operating efficiency.
Financing Activities
Net cash provided by financing activities during the year ended
December 31, 2016
was
$126.3 million
, primarily due to $325.0 million of gross proceeds received in connection with the issuance and sale of the Notes, $124.0 million from the Revolver and $75.0 million of gross proceeds received under the Second Term Loan, which we used to fund our BES and Peak acquisitions, partially offset by (1) the repayments of $167.8 million under our Term Loans and $206.5 million under our Revolver, (2) $13.3 million paid in connection with the repurchase of our common stock, (3) $6.6 million of financing costs we incurred in connection with the issuance and sale of the Notes and amendments of the Credit Agreement, and (4) $5.8 million cash paid for shares withheld for payroll taxes resulting from the vesting of employee equity awards. Net cash provided by (used in) financing activities during the year ended
December 31, 2015
and
December 31, 2014
was
$56.2 million
and
$(2.1) million
, respectively.
Credit Agreement
We are party to a credit agreement (as amended to date, the “Credit Agreement”) with several lenders to provide for the following credit facilities: (A) a $275 million revolver facility (the “Revolver”), which includes a $40 million sublimit for the issuance of letters of credit and a $20 million sublimit for swingline loans, (B) a $150 million secured term loan credit facility (the “Original Term Loan”) and (C) a $75 million secured term loan facility (the “Second Term Loan,” and together with the Original Term Loan, the “Term Loans”). The Credit Agreement contains various customary affirmative and negative covenants, including restrictions on assumption of additional indebtedness, declaration and payment of dividends, dispositions of assets, consolidation into another entity and allowable investments. The Revolver and the Term Loans are secured by substantially all of our assets, including the common stock or equity interests of our domestic subsidiaries. For more detail regarding the terms of the Credit Agreement, including maturity dates, payment and interest terms, please see “Item 8. Financial Statements and Supplementary Data—Notes to Consolidated Financial Statements—Note (8), Notes Payable and Credit Agreement.”
As of
December 31, 2016
and
2015
, the total of our Term Loans outstanding (including both the current and long-term portions), less unamortized fees, was $43.9 million and $136.0 million, respectively. We repaid the entire Original Term Loan in 2016, and now only have amounts outstanding under the Second Term Loan. There was zero and $82.5 million outstanding under the Revolver at
December 31, 2016
and
2015
, respectively.
5.125% Senior Notes Due 2024
On October 3, 2016, AMN Healthcare, Inc., a wholly owned subsidiary of the Company, completed the issuance and sale of $325.0 million aggregate principal amount of the Notes. The Notes will mature on October 1, 2024. Interest on the Notes is payable semi-annually in arrears on April 1 and October 1 of each year, commencing April 1, 2017. The Notes are fully and unconditionally and jointly guaranteed on a senior unsecured basis by us and all of our subsidiaries that guarantee the Credit Agreement.
27
On and after October 1, 2019, we may redeem all or a portion of the Notes upon not less than 30 nor more than 60 days’ notice, at the redemption prices (expressed in percentages of principal amount on the redemption date) set forth below, plus accrued and unpaid interest, if any, to (but excluding) the redemption date, if redeemed during the twelve month period commencing on October 1 of the years set forth below:
|
Period
|
Redemption
Price |
||
|
2019
|
|
103.844
|
%
|
|
2020
|
|
102.563
|
%
|
|
2021
|
|
101.281
|
%
|
|
2022 and thereafter
|
|
100
|
%
|
Prior to October 1, 2019, we may also redeem Notes with the net cash proceeds of certain equity offerings in an aggregate principal amount not to exceed 40% of the aggregate principal amount of the Notes issued, at a redemption price (expressed as a percentage of principal amount) of 105.125% of the principal amount thereof plus accrued and unpaid interest to (but excluding) the applicable redemption date.
In addition, we may redeem some or all of the Notes prior to October 1, 2019 at a redemption price equal to 100% of the principal amount of the Notes redeemed, plus accrued and unpaid interest thereon, if any, to (but excluding) the applicable redemption date, plus a “make-whole” premium based on the applicable treasury rate plus 50 basis points.
Upon the occurrence of specified change of control events as defined in the indenture governing the Notes, we must offer to repurchase the Notes at 101% of the principal amount, plus accrued and unpaid interest, if any, to (but excluding) the purchase date.
The indenture governing the Notes contains covenants that, among other things, restrict our ability to:
•
sell assets,
•
pay dividends or make other distributions on capital stock or make payments in respect of subordinated indebtedness,
•
make investments,
•
incur additional indebtedness or issue preferred stock,
•
create, or permit to exist, certain liens,
•
enter into agreements that restrict dividends or other payments from our restricted subsidiaries,
•
consolidate, merge or transfer all or substantially all of our assets,
•
engage in transactions with affiliates, and
•
create unrestricted subsidiaries.
These covenants are subject to a number of important exceptions and qualifications. The indenture governing the Notes contains affirmative covenants and events of default that are customary for indentures governing high yield securities. The Notes and the guarantees are not subject to any registration rights agreement.
We used the proceeds from the issuance and sale of the Notes to (1) repay $131.3 million of our existing Original Term Loan indebtedness, (2) repay $7.2 million of our existing Second Term Loan indebtedness, (3) repay $182.5 million under our Revolver, and (4) pay fees and expenses related to the transaction.
Letters of Credit
At
December 31, 2016
, we maintained outstanding standby letters of credit totaling
$15.4
million as collateral in relation to our professional liability insurance agreements, workers compensation insurance agreements, and a corporate office lease agreement. Of the
$15.4 million
of outstanding letters of credit, we have collateralized
$4.6 million
in cash and cash equivalents and the remaining amount has been collateralized by the Revolver. Outstanding standby letters of credit at
December 31, 2015
totaled
$15.8 million
.
28
Off-Balance Sheet and Other Financing Arrangements
At
December 31, 2016
and
2015
, we did not have any off-balance sheet arrangement that has or is reasonably likely to have a current or future effect on our financial condition, changes in financial condition, revenues or expenses, results of operations, liquidity, capital expenditures, or capital resources that is material to investors.
Contractual Obligations
The following table summarizes our contractual obligations as of
December 31, 2016
(in thousands):
|
|
Fiscal Year
|
||||||||||||||||||||||||||
|
|
2017
|
2018
|
2019
|
2020
|
2021
|
Thereafter
|
Total
|
||||||||||||||||||||
|
Notes payable (1)
|
$
|
21,496
|
|
$
|
21,400
|
|
$
|
21,304
|
|
$
|
21,210
|
|
$
|
45,727
|
|
$
|
374,970
|
|
$
|
506,107
|
|
||||||
|
Operating lease obligations (2)
|
17,194
|
|
17,037
|
|
16,400
|
|
15,886
|
|
16,019
|
|
82,675
|
|
165,211
|
|
|||||||||||||
|
Total contractual obligations
|
$
|
38,690
|
|
$
|
38,437
|
|
$
|
37,704
|
|
$
|
37,096
|
|
$
|
61,746
|
|
$
|
457,645
|
|
$
|
671,318
|
|
||||||
|
(1)
|
Amounts represent contractual amounts due under the Second Term Loan and the Notes, including interest based on the rate in effect at
December 31, 2016
.
|
|
(2)
|
Amounts represent minimum contractual amounts, with initial or remaining lease terms and license terms in excess of one year. We have assumed no escalations in rent or changes in variable expenses other than as stipulated in lease contracts.
|
In addition to the above disclosed contractual obligations, the unrecognized income tax benefits, including interest and penalties, was
$8.5 million
at
December 31, 2016
. See additional information in “Item 8. Financial Statements and Supplementary Data—Notes to Consolidated Financial Statements—Note (7), Income Taxes.”
Critical Accounting Policies and Estimates
Our critical accounting policies are described in Note (1) to our audited consolidated financial statements contained in Item 8 of this Annual Report on Form 10-K. Critical accounting policies are those that we believe are both important to the portrayal of our financial condition and results and require our most difficult, subjective or complex judgments, often as a result of the need to make estimates about the effect of matters that are inherently uncertain. The preparation of our consolidated financial statements in conformity with United States generally accepted accounting principles requires us to make estimates and judgments that affect our reported amounts of assets and liabilities, revenue and expenses, and related disclosures of contingent assets and liabilities. On an ongoing basis, we evaluate our estimates and base them on the information that is currently available to us and on various other assumptions that we believe are reasonable under the circumstances. Actual results could vary from these estimates under different assumptions or conditions. We believe that the following critical accounting policies affect the more significant judgments and estimates used in the preparation of our consolidated financial statements:
Goodwill and Indefinite-lived Intangible Assets
Our business acquisitions typically result in the recording of goodwill and other intangible assets, and the recorded values of those assets may become impaired in the future. The determination of the value of such intangible assets requires management to make estimates and assumptions that affect our consolidated financial statements. For intangible assets purchased in a business combination, the estimated fair values of the assets received are used to establish their recorded values. In accordance with accounting guidance on goodwill and other intangible assets, we perform annual impairment analysis to assess the recoverability of goodwill and indefinite-lived intangible assets. We assess the impairment of goodwill of our reporting units and indefinite-lived intangible assets annually, or more often if events or changes in circumstances indicate that the carrying value may not be recoverable. We may first assess qualitative factors to determine whether it is more likely than not that the fair value of a reporting unit is less than its carrying amount. If, after assessing the totality of events and circumstances, we determine that it is more likely than not that the fair value of the reporting unit is greater than its carrying amount, the quantitative impairment test is unnecessary. If the reporting unit does not pass the qualitative assessment, then the reporting unit’s carrying value is compared to its fair value. The fair values of the reporting units are estimated using market and discounted cash flow approaches. Goodwill is considered impaired if the carrying value of the reporting unit exceeds its fair value. Application of the goodwill impairment test requires judgment, including the identification of reporting units,
29
assignment of assets and liabilities to reporting units, assignment of goodwill to reporting units, and determination of the fair value of each reporting unit. Valuation techniques consistent with the market approach and income approach are used to measure the fair value of each reporting unit. Significant judgments are required to estimate the fair value of reporting units including estimating future cash flows, and determining appropriate discount rates, growth rates, company control premium and other assumptions. Changes in these estimates and assumptions could materially affect the determination of fair value for each reporting unit. We perform our annual impairment test on October 31 of each year.
Intangible assets with estimable useful lives are required to be amortized over their respective estimated useful lives and reviewed for impairment whenever events or changes in circumstances indicate that the carrying amount may not be recoverable. An impairment evaluation is based on an undiscounted cash flow analysis at the lowest level at which cash flows of the long-lived assets are largely independent of other groups of assets and liabilities. We assess potential impairments to intangible assets when there is evidence that events or changes in circumstances indicate that the carrying amount of an asset or asset group may not be recovered. Our judgments regarding the existence of impairment indicators and future cash flows related to intangible assets are based on operational performance of our businesses, market conditions and other factors. Although there are inherent uncertainties in this assessment process, the estimates and assumptions we use, including estimates of future cash flows, volumes, market penetration and discount rates, are consistent with our internal planning. If these estimates or their related assumptions change in the future, we may be required to record an impairment charge on all or a portion of our long-lived intangible assets. Furthermore, we cannot predict the occurrence of future impairment-triggering events nor the impact such events might have on our reported asset values. Future events could cause us to conclude that impairment indicators exist and that long-lived intangible assets associated with our acquired businesses are impaired.
Professional Liability Reserve
We maintain an accrual for professional liability that we include in accounts payable and accrued expenses and other long-term liabilities in our consolidated balance sheets. We determine the adequacy of this accrual by evaluating our historical experience and trends, loss reserves established by our insurance carriers, management and third-party administrators, and our independent actuarial studies. We obtain actuarial studies on a semi-annual basis that use our historical claims data and industry data to assist us in determining the adequacy of our reserves each year. For periods between the actuarial studies, we record our accruals based on loss rates provided in the most recent actuarial study and management’s review of loss history.
Workers Compensation Reserve
We maintain an accrual for workers compensation, which we include in accrued compensation and benefits and other long-term liabilities in our consolidated balance sheets. We determine the adequacy of these accruals by evaluating our historical experience and trends, loss reserves established by our insurance carriers and third-party administrators, and our independent actuarial studies. We obtain updated actuarial studies on a semi-annual basis that use our payroll and historical claims data, as well as industry data, to determine the appropriate reserves for each policy year. For periods between the actuarial studies, we record our accruals based on loss rates provided in the most recent actuarial study.
Contingent Liabilities
From time to time, we are involved in various lawsuits, claims, investigations, and proceedings that arise in the ordinary course of business. Additionally, some of our clients may also become subject to claims, governmental inquiries and investigations and legal actions relating to services provided by our healthcare professionals. From time to time, and depending upon the particular facts and circumstances, we may be subject to indemnification obligations under our contracts with such clients relating to these matters. Certain of the above-referenced matters may include speculative claims for substantial or indeterminate amounts of damages. We record a liability when we believe that it is both probable that a loss has been incurred and the amount can be reasonably estimated. Significant judgment is required to determine both probability and the estimated amount. Where a range of loss can be reasonably estimated with no best estimate in the range, we record the minimum estimated liability. We review these provisions at least quarterly and adjust these provisions accordingly to reflect the impact of negotiations, settlements, rulings, advice of legal counsel, and updated information. We believe that the amount or estimable range of reasonably possible loss, will not, either individually or in the aggregate, have a material adverse effect on our business, consolidated financial position, results of operations, or cash flows with respect to loss contingencies for legal and other contingencies as of
December 31, 2016
. However, the outcome of litigation is inherently uncertain. Therefore, if one or more of these legal matters were resolved against us for amounts in excess of management’s expectations, our results of operations and financial condition, including in a particular reporting period, could be materially adversely affected.
30
Income Taxes
We evaluate our unrecognized tax benefits in accordance with the guidance for accounting for uncertainty in income taxes. We recognize the tax benefit from an uncertain tax position only if it is more likely than not that the tax position will be sustained on examination by the taxing authorities, based on the technical merits of the position. The tax benefits recognized in the financial statements from such a position are measured based on the largest benefit that has a greater than 50% likelihood of being realized upon ultimate settlement.
Recent Accounting Pronouncements
In May 2014, the Financial Accounting Standards Board (“FASB”) issued new accounting guidance related to revenue recognition. This new standard will replace all current U.S. GAAP guidance on this topic and eliminate all industry-specific guidance. The new revenue recognition standard provides a unified model to determine when and how revenue is recognized. The core principle is that a company should recognize revenue to depict the transfer of promised goods or services to customers in an amount that reflects the consideration for which the entity expects to be entitled in exchange for those goods or services. This guidance provides that the standard will be effective for us beginning January 1, 2017 and can be applied either retrospectively to each period presented (full retrospective) or as a cumulative-effect adjustment as of the date of adoption (modified retrospective). In July 2015, the FASB voted to amend the guidance by approving a one-year delay in the effective date of the new standard to 2018. We have a team in place to analyze the impact of this standard and to evaluate the impact on our consolidated financial statements. This includes reviewing current accounting policies and practices to identify potential differences that would result from applying the requirements under the new standard. We expect to complete the evaluation and validate results by the end of the second quarter of 2017. We expect to complete the evaluation of the impact of the accounting and disclosure requirements on our business processes, controls and systems by the end of the third quarter of 2017. A full assessment is expected to be completed by the end of 2017. We will adopt this standard in the first quarter of 2018, and apply the modified retrospective approach. We are currently evaluating the impact of adopting this new standard on our consolidated financial statements.
In February 2016, the FASB issued ASU 2016-02, “Leases.” This standard requires organizations that lease assets to recognize the assets and liabilities created by those leases. The standard also will require disclosures to help investors and other financial statement users better understand the amount, timing, and uncertainty of cash flows arising from leases. The ASU becomes effective for public companies for fiscal years, and interim periods within those fiscal years, beginning after December 15, 2018. We are required to adopt the guidance using a modified retrospective basis and can elect to apply optional practical expedients. We are currently evaluating the approach we will take and the impact of adopting this new standard on our consolidated financial statements and related disclosures.
In March 2016, the FASB issued ASU 2016-08, “Revenue from Contracts with Customers - Principal versus Agent Consideration (Reporting Revenue Gross versus Net).” The standard attempts to clarify the implementation guidance on principal versus agent considerations. When an entity that is a principal satisfies a performance obligation, the entity recognizes revenue in the gross amount of consideration to which it expects to be entitled in exchange for the specified good or service transferred to the customer. When an entity that is an agent satisfies a performance obligation, the entity recognizes revenue in the amount of any fee or commission to which it expects to be entitled in exchange for arranging for the specified good or service to be provided by the other party. The ASU affects the guidance in ASU 2014-09, Revenue from Contracts with Customers (Topic 606), which is not yet effective. The effective date and transition requirements for the amendments in this ASU are the same as the effective date and transition requirements of ASU 2014-09. ASU No. 2015-14, Revenue from Contracts with Customers (Topic 606): Deferral of the Effective Date, defers the effective date of ASU 2014-09 by one year to annual periods beginning after December 15, 2017. We will adopt this standard in the first quarter of 2018, and apply the modified retrospective approach. We are currently evaluating the impact of adopting this new standard on our consolidated financial statements.
In March 2016, the FASB issued ASU 2016-09, “Stock Compensation - Improvements to Employee Share-Based Payment Accounting.” The guidance attempts to simplify the accounting for share-based payment transactions in several areas, including the following: income tax consequences, classification of awards as either equity or liabilities, forfeitures, expected term, and statement of cash flows classification. For public entities, ASU 2016-09 is effective for fiscal years beginning after December 15, 2016, and interim periods within those annual periods. We will adopt this standard in the first quarter of 2017. The income tax benefit impact for the year ended December 31, 2016, if the standard had been adopted, would have been $3.1 million.
In August 2016, the FASB issued ASU 2016-15, “Statement of Cash Flows (Topic 230): Classification of Certain Cash Receipts and Cash Payments.” The standard provides guidance on how certain cash receipts and payments are presented and classified in the statement of cash flows. For public entities, ASU 2016-15 is effective for fiscal years beginning
31
after December 15, 2017, and interim periods within those annual periods, and requires a retrospective approach. Early adoption is permitted, including adoption in an interim period. We are currently evaluating the timing of this new standard’s adoption and the effect that adopting it will have on our financial statements and related disclosures.
In November 2016, the FASB issued ASU 2016-18, “Statement of Cash Flows (Topic 230): Restricted Cash.” The standard requires that a statement of cash flows explain the change during the period in the total of cash, cash equivalents, and amounts generally described as restricted cash or restricted cash equivalents. Therefore, amounts generally described as restricted cash and restricted cash equivalents should be included with cash and cash equivalents when reconciling the beginning-of-period and end-of-period total amounts shown on the statement of cash flows. The new guidance is effective for interim and annual periods beginning after December 15, 2017 and early adoption is permitted. The amendment should be adopted retrospectively. We are currently evaluating the timing of this new standard’s adoption and the effect that adopting it will have on our financial statements and related disclosures.
There have been no other new accounting pronouncements issued but not yet adopted that are expected to materially affect our consolidated financial condition or results of operations.
|
Item 7A.
|
Quantitative and Qualitative Disclosures about Market Risk
|
Market risk is the risk of loss arising from adverse changes in market rates and prices, such as interest rates, foreign currency exchange rates and commodity prices. During
2016
, our primary exposure to market risk was interest rate risk associated with our variable interest debt instruments. In April 2015, we entered into an interest rate swap agreement to minimize our exposure to interest rate fluctuations on $100 million of our outstanding variable rate debt under one of our Term Loans for which we pay a fixed rate of 0.983% per annum and receive a variable rate equal to floating one-month LIBOR. In connection with the issuance and sale of the Notes and repayment of a portion of the Term Loans, we reduced the interest rate swap notional amount to $40 million in the fourth quarter of 2016. This agreement expires on March 30, 2018, and no initial investment was made to enter into it. A 100 basis point increase in interest rates on our variable rate debt would not have resulted in a material effect on our consolidated financial statements for
2016
. During
2016
, we generated all of our revenue in the United States. Accordingly, our foreign currency risk is immaterial.
32
|
Item 8.
|
Financial Statements and Supplementary Data
|
INDEX TO CONSOLIDATED FINANCIAL STATEMENTS
|
|
Page
|
33
Report of Independent Registered Public Accounting Firm
The Board of Directors and Stockholders
AMN Healthcare Services, Inc.:
We have audited the accompanying consolidated balance sheets of AMN Healthcare Services, Inc. and subsidiaries (the Company) as of
December 31, 2016
and
2015
, and the related consolidated statements of comprehensive income, stockholders’ equity, and cash flows for each of the years in the three-year period ended
December 31, 2016
. These consolidated financial statements are the responsibility of the Company’s management. Our responsibility is to express an opinion on these consolidated financial statements based on our audits.
We conducted our audits in accordance with the standards of the Public Company Accounting Oversight Board (United States). Those standards require that we plan and perform the audit to obtain reasonable assurance about whether the financial statements are free of material misstatement. An audit includes examining, on a test basis, evidence supporting the amounts and disclosures in the financial statements. An audit also includes assessing the accounting principles used and significant estimates made by management, as well as evaluating the overall financial statement presentation. We believe that our audits provide a reasonable basis for our opinion.
In our opinion, the consolidated financial statements referred to above present fairly, in all material respects, the financial position of AMN Healthcare Services, Inc. and subsidiaries as of
December 31, 2016
and
2015
, and the results of their operations and their cash flows for each of the years in the three-year period ended
December 31, 2016
, in conformity with U.S. generally accepted accounting principles.
We also have audited, in accordance with the standards of the Public Company Accounting Oversight Board (United States), the Company’s internal control over financial reporting as of
December 31, 2016
, based on criteria established in
Internal Control - Integrated Framework (2013)
issued by the Committee of Sponsoring Organizations of the Treadway Commission (COSO), and our report dated
February 17, 2017
expressed an unqualified opinion on the effectiveness of the Company’s internal control over financial reporting.
|
/s/ KPMG LLP
|
San Diego, California
February 17, 2017
34
AMN HEALTHCARE SERVICES, INC.
CONSOLIDATED BALANCE SHEETS
(in thousands, except par value)
|
December 31, 2016
|
December 31, 2015
|
||||||
|
ASSETS
|
|||||||
|
Current assets:
|
|||||||
|
Cash and cash equivalents
|
$
|
10,622
|
|
$
|
9,576
|
|
|
|
Accounts receivable, net of allowances of $11,376 and $7,691 at December 31, 2016 and 2015, respectively
|
341,977
|
|
277,996
|
|
|||
|
Accounts receivable, subcontractor
|
49,233
|
|
50,807
|
|
|||
|
Prepaid expenses
|
14,189
|
|
13,526
|
|
|||
|
Other current assets
|
34,607
|
|
23,723
|
|
|||
|
Total current assets
|
450,628
|
|
375,628
|
|
|||
|
Restricted cash, cash equivalents and investments
|
31,287
|
|
27,352
|
|
|||
|
Fixed assets, net of accumulated depreciation of $84,865 and $76,680 at December 31, 2016 and 2015, respectively
|
59,954
|
|
50,134
|
|
|||
|
Other assets
|
57,534
|
|
47,569
|
|
|||
|
Goodwill
|
341,754
|
|
204,779
|
|
|||
|
Intangible assets, net of accumulated amortization of $72,057 and $53,747 at December 31, 2016 and 2015, respectively
|
245,724
|
|
174,970
|
|
|||
|
Total assets
|
$
|
1,186,881
|
|
$
|
880,432
|
|
|
|
LIABILITIES AND STOCKHOLDERS’ EQUITY
|
|||||||
|
Current liabilities:
|
|||||||
|
Accounts payable and accrued expenses
|
$
|
137,512
|
|
$
|
118,822
|
|
|
|
Accrued compensation and benefits
|
107,993
|
|
83,701
|
|
|||
|
Current portion of revolving credit facility
|
—
|
|
30,000
|
|
|||
|
Current portion of notes payable
|
3,750
|
|
7,500
|
|
|||
|
Deferred revenue
|
8,924
|
|
5,620
|
|
|||
|
Other current liabilities
|
16,611
|
|
5,374
|
|
|||
|
Total current liabilities
|
274,790
|
|
251,017
|
|
|||
|
Revolving credit facility
|
—
|
|
52,500
|
|
|||
|
Notes payable, less unamortized fees
|
359,192
|
|
128,490
|
|
|||
|
Deferred income taxes, net
|
21,420
|
|
22,431
|
|
|||
|
Other long-term liabilities
|
82,096
|
|
78,134
|
|
|||
|
Total liabilities
|
737,498
|
|
532,572
|
|
|||
|
Commitments and contingencies
|
|
|
|
|
|||
|
Stockholders’ equity:
|
|||||||
|
Preferred stock, $0.01 par value; 10,000 shares authorized; none issued and outstanding at December 31, 2016 and 2015
|
—
|
|
—
|
|
|||
|
Common stock, $0.01 par value; 200,000 shares authorized; 48,055 issued and 47,612 shares issued and outstanding, respectively, at December 31, 2016 and 47,709 shares issued and outstanding at December 31, 2015
|
481
|
|
477
|
|
|||
|
Additional paid-in capital
|
452,491
|
|
443,733
|
|
|||
|
Treasury stock, at cost (443 and 0 shares at December 31, 2016 and 2015, respectively)
|
(13,261
|
)
|
—
|
|
|||
|
Retained earnings (accumulated deficit)
|
9,671
|
|
(96,167
|
)
|
|||
|
Accumulated other comprehensive income (loss)
|
1
|
|
(183
|
)
|
|||
|
Total stockholders’ equity
|
449,383
|
|
347,860
|
|
|||
|
Total liabilities and stockholders’ equity
|
$
|
1,186,881
|
|
$
|
880,432
|
|
|
See accompanying notes to consolidated financial statements.
35
AMN HEALTHCARE SERVICES, INC.
CONSOLIDATED STATEMENTS OF COMPREHENSIVE INCOME
(in thousands, except per share amounts)
|
|
Years Ended December 31,
|
||||||||||
|
|
2016
|
2015
|
2014
|
||||||||
|
Revenue
|
$
|
1,902,225
|
|
$
|
1,463,065
|
|
$
|
1,036,027
|
|
||
|
Cost of revenue
|
1,282,501
|
|
993,702
|
|
719,910
|
|
|||||
|
Gross profit
|
619,724
|
|
469,363
|
|
316,117
|
|
|||||
|
Operating expenses:
|
|||||||||||
|
Selling, general and administrative
|
398,472
|
|
319,531
|
|
232,221
|
|
|||||
|
Depreciation and amortization
|
29,620
|
|
20,953
|
|
15,993
|
|
|||||
|
Total operating expenses
|
428,092
|
|
340,484
|
|
248,214
|
|
|||||
|
Income from operations
|
191,632
|
|
128,879
|
|
67,903
|
|
|||||
|
Interest expense, net (including loss on debt extinguishment of $3,113 for the year ended December 31, 2014), and other
|
15,465
|
|
7,790
|
|
9,237
|
|
|||||
|
Income before income taxes
|
176,167
|
|
121,089
|
|
58,666
|
|
|||||
|
Income tax expense
|
70,329
|
|
39,198
|
|
25,449
|
|
|||||
|
Net income
|
$
|
105,838
|
|
$
|
81,891
|
|
$
|
33,217
|
|
||
|
Other comprehensive income:
|
|||||||||||
|
Foreign currency translation
|
267
|
|
75
|
|
142
|
|
|||||
|
Unrealized gain (loss) on cash flow hedge, net of income taxes
|
(83
|
)
|
98
|
|
—
|
|
|||||
|
Other comprehensive income
|
184
|
|
173
|
|
142
|
|
|||||
|
Comprehensive income
|
$
|
106,022
|
|
$
|
82,064
|
|
$
|
33,359
|
|
||
|
Net income per common share:
|
|||||||||||
|
Basic
|
$
|
2.21
|
|
$
|
1.72
|
|
$
|
0.71
|
|
||
|
Diluted
|
$
|
2.15
|
|
$
|
1.68
|
|
$
|
0.69
|
|
||
|
Weighted average common shares outstanding:
|
|||||||||||
|
Basic
|
47,946
|
|
47,525
|
|
46,504
|
|
|||||
|
Diluted
|
49,267
|
|
48,843
|
|
48,086
|
|
|||||
See accompanying notes to consolidated financial statements.
AMN HEALTHCARE SERVICES, INC.
CONSOLIDATED STATEMENTS OF STOCKHOLDERS’ EQUITY
Years Ended
December 31, 2016
,
2015
and
2014
(in thousands)
|
|
Common Stock
|
Additional
Paid-in
Capital
|
Treasury Stock
|
Retained Earnings
(Accumulated
Deficit)
|
Accumulated
Other
Comprehensive
Gain (Loss)
|
Total
|
|||||||||||||||||||||||
|
|
Shares
|
Amount
|
Shares
|
Amount
|
|||||||||||||||||||||||||
|
Balance, December 31, 2013
|
46,011
|
|
$
|
460
|
|
$
|
429,055
|
|
—
|
|
$
|
—
|
|
$
|
(211,275
|
)
|
$
|
(498
|
)
|
$
|
217,742
|
|
|||||||
|
Equity awards vested and exercised, net of shares withheld for payroll taxes
|
628
|
|
6
|
|
(2,661
|
)
|
—
|
|
—
|
|
—
|
|
—
|
|
(2,655
|
)
|
|||||||||||||
|
Excess income tax benefits from equity awards vested and exercised
|
—
|
|
—
|
|
978
|
|
—
|
|
—
|
|
—
|
|
—
|
|
978
|
|
|||||||||||||
|
Share-based compensation
|
—
|
|
—
|
|
7,157
|
|
—
|
|
—
|
|
—
|
|
—
|
|
7,157
|
|
|||||||||||||
|
Comprehensive income
|
—
|
|
—
|
|
—
|
|
—
|
|
—
|
|
33,217
|
|
142
|
|
33,359
|
|
|||||||||||||
|
Balance, December 31, 2014
|
46,639
|
|
$
|
466
|
|
$
|
434,529
|
|
—
|
|
$
|
—
|
|
$
|
(178,058
|
)
|
$
|
(356
|
)
|
$
|
256,581
|
|
|||||||
|
Equity awards vested and exercised, net of shares withheld for payroll taxes
|
1,070
|
|
11
|
|
(8,256
|
)
|
—
|
|
—
|
|
—
|
|
—
|
|
(8,245
|
)
|
|||||||||||||
|
Excess income tax benefit from equity awards vested and exercised
|
—
|
|
—
|
|
7,176
|
|
—
|
|
—
|
|
—
|
|
—
|
|
7,176
|
|
|||||||||||||
|
Share-based compensation
|
—
|
|
—
|
|
10,284
|
|
—
|
|
—
|
|
—
|
|
—
|
|
10,284
|
|
|||||||||||||
|
Comprehensive income
|
—
|
|
—
|
|
—
|
|
—
|
|
—
|
|
81,891
|
|
173
|
|
82,064
|
|
|||||||||||||
|
Balance, December 31, 2015
|
47,709
|
|
$
|
477
|
|
$
|
443,733
|
|
—
|
|
$
|
—
|
|
$
|
(96,167
|
)
|
$
|
(183
|
)
|
$
|
347,860
|
|
|||||||
|
Repurchase of common stock into treasury
|
—
|
|
—
|
|
—
|
|
(443
|
)
|
(13,261
|
)
|
—
|
|
—
|
|
(13,261
|
)
|
|||||||||||||
|
Equity awards vested and exercised, net of shares withheld for payroll taxes
|
346
|
|
4
|
|
(5,785
|
)
|
—
|
|
—
|
|
—
|
|
—
|
|
(5,781
|
)
|
|||||||||||||
|
Excess income tax benefit from equity awards vested and exercised
|
—
|
|
—
|
|
3,144
|
|
—
|
|
—
|
|
—
|
|
—
|
|
3,144
|
|
|||||||||||||
|
Share-based compensation
|
—
|
|
—
|
|
11,399
|
|
—
|
|
—
|
|
—
|
|
—
|
|
11,399
|
|
|||||||||||||
|
Comprehensive income
|
—
|
|
—
|
|
—
|
|
—
|
|
—
|
|
105,838
|
|
184
|
|
106,022
|
|
|||||||||||||
|
Balance, December 31, 2016
|
48,055
|
|
$
|
481
|
|
$
|
452,491
|
|
(443
|
)
|
$
|
(13,261
|
)
|
$
|
9,671
|
|
$
|
1
|
|
$
|
449,383
|
|
|||||||
See accompanying notes to consolidated financial statements.
36
AMN HEALTHCARE SERVICES, INC.
(in thousands)
|
|
Years Ended December 31,
|
||||||||||
|
|
2016
|
2015
|
2014
|
||||||||
|
Cash flows from operating activities:
|
|||||||||||
|
Net income
|
$
|
105,838
|
|
$
|
81,891
|
|
$
|
33,217
|
|
||
|
Adjustments to reconcile net income to net cash provided by operating activities:
|
|||||||||||
|
Depreciation and amortization
|
29,620
|
|
20,953
|
|
15,993
|
|
|||||
|
Non-cash interest expense and other
|
2,416
|
|
1,934
|
|
1,392
|
|
|||||
|
Change in fair value of contingent consideration
|
(24
|
)
|
(330
|
)
|
—
|
|
|||||
|
Increase in allowances for doubtful accounts and sales credits
|
12,008
|
|
6,684
|
|
4,393
|
|
|||||
|
Provision for deferred income taxes
|
(9,424
|
)
|
12,677
|
|
11,779
|
|
|||||
|
Share-based compensation
|
11,399
|
|
10,284
|
|
7,157
|
|
|||||
|
Excess tax benefit from equity awards vested and exercised
|
(3,351
|
)
|
(7,449
|
)
|
(1,819
|
)
|
|||||
|
Loss on disposal or sale of fixed assets
|
69
|
|
4
|
|
60
|
|
|||||
|
Loss on debt extinguishment
|
—
|
|
—
|
|
3,113
|
|
|||||
|
Changes in assets and liabilities, net of effects from acquisitions:
|
|||||||||||
|
Accounts receivable
|
(58,700
|
)
|
(75,653
|
)
|
(41,958
|
)
|
|||||
|
Accounts receivable, subcontractor
|
1,542
|
|
(22,365
|
)
|
(10,172
|
)
|
|||||
|
Income taxes receivable
|
6,469
|
|
7,867
|
|
768
|
|
|||||
|
Prepaid expenses
|
(455
|
)
|
(2,915
|
)
|
(1,933
|
)
|
|||||
|
Other current assets
|
(13,938
|
)
|
(5,409
|
)
|
1,920
|
|
|||||
|
Other assets
|
(3,562
|
)
|
(4,785
|
)
|
(268
|
)
|
|||||
|
Accounts payable and accrued expenses
|
17,705
|
|
29,611
|
|
6,125
|
|
|||||
|
Accrued compensation and benefits
|
19,142
|
|
11,888
|
|
11,515
|
|
|||||
|
Other liabilities
|
8,147
|
|
(2,103
|
)
|
(4,488
|
)
|
|||||
|
Deferred revenue
|
732
|
|
1,313
|
|
(114
|
)
|
|||||
|
Restricted cash, cash equivalents and investments balance
|
6,218
|
|
(7,784
|
)
|
(9,002
|
)
|
|||||
|
Net cash provided by operating activities
|
131,851
|
|
56,313
|
|
27,678
|
|
|||||
|
Cash flows from investing activities:
|
|||||||||||
|
Purchase and development of fixed assets
|
(21,956
|
)
|
(27,010
|
)
|
(19,134
|
)
|
|||||
|
Purchase of investments
|
(13,152
|
)
|
—
|
|
—
|
|
|||||
|
Proceeds from maturity of investments
|
2,000
|
|
—
|
|
—
|
|
|||||
|
Change in restricted cash, cash equivalents and investments balance
|
999
|
|
—
|
|
12,550
|
|
|||||
|
Equity method investment
|
—
|
|
(1,000
|
)
|
(5,000
|
)
|
|||||
|
Payments to fund deferred compensation plan
|
(6,911
|
)
|
(3,004
|
)
|
(2,174
|
)
|
|||||
|
Cash paid for acquisitions, net of cash received
|
(216,494
|
)
|
(84,081
|
)
|
(14,470
|
)
|
|||||
|
Cash paid for working capital adjustments and holdback liability for prior year acquisitions
|
(1,848
|
)
|
(990
|
)
|
—
|
|
|||||
|
Net cash used in investing activities
|
(257,362
|
)
|
(116,085
|
)
|
(28,228
|
)
|
|||||
37
|
Cash flows from financing activities:
|
|||||||||||
|
Capital lease repayments
|
(7
|
)
|
(4
|
)
|
(529
|
)
|
|||||
|
Payments on term loans
|
(167,813
|
)
|
(7,500
|
)
|
(155,245
|
)
|
|||||
|
Proceeds from term loan
|
75,000
|
|
—
|
|
150,000
|
|
|||||
|
Payments on revolving credit facility
|
(206,500
|
)
|
(25,000
|
)
|
(39,500
|
)
|
|||||
|
Proceeds from revolving credit facility
|
124,000
|
|
89,500
|
|
47,500
|
|
|||||
|
Proceeds from senior notes
|
325,000
|
|
—
|
|
—
|
|
|||||
|
Repurchase of common stock
|
(13,261
|
)
|
—
|
|
—
|
|
|||||
|
Payment of financing costs
|
(6,561
|
)
|
—
|
|
(3,488
|
)
|
|||||
|
Earn-out payment for prior acquisition
|
(900
|
)
|
—
|
|
—
|
|
|||||
|
Payment on reduction of derivative contract
|
(238
|
)
|
—
|
|
—
|
|
|||||
|
Proceeds from exercise of equity awards
|
—
|
|
3,663
|
|
1,792
|
|
|||||
|
Cash paid for shares withheld for taxes
|
(5,781
|
)
|
(11,908
|
)
|
(4,448
|
)
|
|||||
|
Excess tax benefit from equity awards vested and exercised
|
3,351
|
|
7,449
|
|
1,819
|
|
|||||
|
Net cash provided by (used in) financing activities
|
126,290
|
|
56,200
|
|
(2,099
|
)
|
|||||
|
Effect of exchange rate changes on cash
|
267
|
|
75
|
|
142
|
|
|||||
|
Net change in cash and cash equivalents
|
1,046
|
|
(3,497
|
)
|
(2,507
|
)
|
|||||
|
Cash and cash equivalents at beginning of year
|
9,576
|
|
13,073
|
|
15,580
|
|
|||||
|
Cash and cash equivalents at end of year
|
$
|
10,622
|
|
$
|
9,576
|
|
$
|
13,073
|
|
||
|
Supplemental disclosures of cash flow information:
|
|||||||||||
|
Cash paid for interest (net of $174, $264 and $123 capitalized in 2016, 2015 and 2014, respectivel
y)
|
$
|
8,057
|
|
$
|
5,806
|
|
$
|
4,599
|
|
||
|
Cash paid for income taxes
|
$
|
73,366
|
|
$
|
33,132
|
|
$
|
17,880
|
|
||
|
Acquisitions:
|
|||||||||||
|
Fair value of tangible assets acquired in acquisitions, net of cash received
|
$
|
18,703
|
|
$
|
26,771
|
|
$
|
1,631
|
|
||
|
Goodwill
|
136,101
|
|
50,227
|
|
9,750
|
|
|||||
|
Intangible assets
|
89,064
|
|
34,237
|
|
9,960
|
|
|||||
|
Liabilities and deferred revenue assumed
|
(21,474
|
)
|
(22,954
|
)
|
(3,821
|
)
|
|||||
|
Holdback provision
|
(1,830
|
)
|
(1,500
|
)
|
(1,650
|
)
|
|||||
|
Earn-out liabilities
|
(4,070
|
)
|
(2,700
|
)
|
(1,400
|
)
|
|||||
|
Net cash paid for acquisitions
|
$
|
216,494
|
|
$
|
84,081
|
|
$
|
14,470
|
|
||
|
Supplemental disclosures of non-cash investing and financing activities:
|
|||||||||||
|
Purchase of fixed assets recorded in accounts payable and accrued expenses
|
$
|
2,134
|
|
$
|
3,337
|
|
$
|
4,618
|
|
||
See accompanying notes to consolidated financial statements.
38
AMN HEALTHCARE SERVICES, INC.
NOTES TO CONSOLIDATED FINANCIAL STATEMENTS
December 31, 2016
,
2015
and
2014
(in thousands, except per share amounts)
(1) Summary of Significant Accounting Policies
(a) General
AMN Healthcare Services, Inc. was incorporated in Delaware on November 10, 1997. AMN Healthcare Services, Inc. and its subsidiaries (collectively, the “Company”) provide healthcare workforce solutions and staffing services at acute and sub-acute care hospitals and other healthcare facilities throughout the United States.
(b) Principles of Consolidation
The accompanying consolidated financial statements include the accounts of AMN Healthcare Services, Inc. and its wholly-owned subsidiaries. All significant intercompany balances and transactions have been eliminated in consolidation.
(c) Use of Estimates
The preparation of financial statements in conformity with accounting principles generally accepted in the United States of America requires management to make a number of estimates and assumptions relating to the reporting of assets and liabilities and the disclosure of contingent assets and liabilities at the dates of the financial statements and the reported amounts of revenue and expenses during the reporting periods. On an ongoing basis, the Company evaluates its estimates, including those related to asset impairment, accruals for self-insurance and compensation and related benefits, contingencies and litigation, and income taxes. The Company bases these estimates on the information that is currently available and on various other assumptions that it believes are reasonable under the circumstances. Actual results could differ from those estimates under different assumptions or conditions.
(d) Cash and Cash Equivalents
The Company considers all highly liquid investments with an original maturity of three months or less to be cash equivalents. Cash and cash equivalents include currency on hand, deposits with financial institutions and highly liquid investments.
(e) Restricted Cash, Cash Equivalents and Investments
Restricted cash and cash equivalents primarily represent cash and money market funds on deposit with financial institutions and investments represents commercial paper that serves as collateral for the Company’s outstanding letters of credit and captive insurance subsidiary claim payments. See Note (4), “Fair Value Measurement” and Note (8), “Notes Payable and Credit Agreement” for additional information.
(f) Fixed Assets
The Company records furniture, equipment, leasehold improvements and internal-use software at cost less accumulated amortization and depreciation. The Company records equipment acquired under capital leases at the present value of the future minimum lease payments. The Company capitalizes major additions and improvements, and it expenses maintenance and repairs when incurred. The Company calculates depreciation on furniture, equipment and technology and software using the straight-line method based on the estimated useful lives of the related assets (
three
to
ten
years). The Company amortizes leasehold improvements and equipment obtained under capital leases over the shorter of the term of the lease or their estimated useful lives. The Company includes depreciation of equipment obtained under capital leases with depreciation expense in the accompanying consolidated financial statements.
The Company capitalizes costs it incurs to develop internal-use software during the application development stage. Application development stage costs generally include costs associated with internal-use software configuration, coding, installation and testing. The Company also capitalizes costs of significant upgrades and enhancements that result in additional functionality, whereas it expenses as incurred costs for maintenance and minor upgrades and enhancements. The Company amortizes capitalized costs using the straight-line method over
three
to
ten
years once the software is ready for its intended use.
The Company reviews long-lived assets for impairment whenever events or changes in circumstances indicate that the carrying amount of an asset may not be recoverable. Recoverability of assets to be held and used is measured by a comparison
39
of the carrying amount of an asset group to the future undiscounted net cash flows that are expected to be generated by the asset group. If such asset group is considered to be impaired, the impairment to be recognized is measured by the amount by which the carrying amount of the asset group exceeds the fair value of the asset group. The Company reports assets to be disposed of at the lower of the carrying amount or fair value less costs to sell.
(g) Goodwill
The Company records as goodwill the portion of the purchase price that exceeds the fair value of net assets of entities acquired. The Company evaluates goodwill annually for impairment at the reporting unit level and whenever circumstances occur indicating that goodwill may be impaired. The Company may first assess qualitative factors to determine whether it is more likely than not that the fair value of a reporting unit is less than its carrying amount. If, after assessing the totality of events and circumstances, the Company determines that it is more likely than not that the fair value of the reporting unit is greater than its carrying amount, the quantitative impairment test is unnecessary. The performance of the quantitative impairment test involves a two-step process. The first step of the test involves comparing the fair value of the Company’s reporting units with the reporting unit’s carrying amount, including goodwill. The Company generally determines the fair value of its reporting units using a combination of the income approach (using discounted future cash flows) and the market valuation approach. If the carrying amount of a Company’s reporting unit exceeds its fair value, the Company performs the second step of the test to determine the amount of impairment loss. The second step of the test involves comparing the implied fair value of the Company’s reporting unit’s goodwill with the carrying amount of that goodwill. The amount by which the carrying value of the goodwill exceeds its implied fair value, if any, is recognized as an impairment loss.
(h) Intangible Assets
Intangible assets consist of identifiable intangible assets acquired through acquisitions. Identifiable intangible assets include tradenames and trademarks, customer relationships, non-compete agreements, staffing databases and acquired technology. The Company amortizes intangible assets, other than tradenames and trademarks with an indefinite life, using the straight-line method over their useful lives. The Company amortizes non-compete agreements using the straight-line method over the lives of the related agreements. The Company reviews for impairment intangible assets with estimable useful lives whenever events or changes in circumstances indicate that the carrying amount may not be recoverable.
The Company does not amortize indefinite-lived tradenames and trademarks and instead reviews them for impairment annually
.
The Company may first perform a qualitative assessment to determine whether it is more likely than not that an indefinite-lived intangible asset is impaired. If, after assessing the totality of events and circumstances, the Company determines that it is more likely than not that the indefinite-lived intangible asset is not impaired, no quantitative fair value measurement is necessary. If a quantitative fair value measurement calculation is required for an indefinite-lived intangible asset, the Company compares its fair value with its carrying amount. If the carrying amount exceeds the fair value, the Company records the excess as an impairment loss.
(i) Insurance Reserves
The Company maintains an accrual for professional liability that is included in accounts payable and accrued expenses and other long-term liabilities in the consolidated balance sheets. The expense is included in the selling, general and administrative expenses in the consolidated statement of comprehensive income. The Company determines the adequacy of this accrual by evaluating its historical experience and trends, loss reserves established by the Company’s insurance carriers, management and third-party administrators, and independent actuarial studies. The Company obtains actuarial studies on a semi-annual basis that use the Company’s actual claims data and industry data to assist the Company in determining the adequacy of its reserves each year. For periods between the actuarial studies, the Company records its accruals based on loss rates provided in the most recent actuarial study and management’s review of loss history. In November 2012, the Company established a captive insurance subsidiary, which provides coverage, on an occurrence basis, for professional liability within its nurse and allied solutions segment. Liabilities include provisions for estimated losses incurred but not yet reported (“IBNR”), as well as provisions for known claims. IBNR reserve estimates involve the use of assumptions that are primarily based upon historical loss experience, industry data and other actuarial assumptions. The Company maintains excess insurance coverage through a commercial carrier for losses above the per occurrence retention.
The Company maintains an accrual for workers compensation, which is included in accrued compensation and benefits and other long-term liabilities in the consolidated balance sheets. The expense relating to healthcare professionals is included in cost of revenue, while the expense relating to corporate employees is included in the selling, general and administrative expenses in the consolidated statement of comprehensive income. The Company determines the adequacy of this accrual by evaluating its historical experience and trends, loss reserves established by the Company’s insurance carriers and third-party administrators, and independent actuarial studies. The Company obtains actuarial studies on a semi-annual basis that use the
40
Company’s payroll and historical claims data, as well as industry data, to determine the appropriate reserve for both reported claims and IBNR claims for each policy year. For periods between the actuarial studies, the Company records its accruals based on loss rates provided in the most recent actuarial study.
(j) Revenue Recognition
Revenue consists of fees earned from the temporary and permanent placement of healthcare professionals and executives as well as from the Company’s software-as-a-service (SaaS)-based technologies, including its vendor management systems (VMS) and its scheduling software. Revenue from temporary staffing services is recognized as the services are rendered by the healthcare professional. Under the Company’s managed services program arrangements, the Company manages all or a part of a customer’s supplemental workforce needs utilizing its own pool of healthcare professionals along with those of third-party subcontractors. When the Company uses subcontractors, revenue is recorded net of the related subcontractor’s expense. Revenue from recruitment and permanent placement services is recognized as the services are provided and upon successful placements. The Company’s SaaS-based revenue is recognized ratably over the applicable arrangement’s service period. Fees billed in advance of being earned are recorded as deferred revenue.
(k) Accounts Receivable
The Company records accounts receivable at the invoiced amount. Accounts receivable are non-interest bearing. The Company maintains an allowance for doubtful accounts based on the Company’s historical write-off experience and an assessment of its customers’ financial conditions. The Company also maintains a sales allowance to reserve for potential credits issued to customers, which is based on the Company’s historical experience. The Company has not experienced material bad debts or sales adjustments during the past three years.
(l) Concentration of Credit Risk
The majority of the Company’s business activity is with hospitals located throughout the United States. Credit is extended based on the evaluation of each entity’s financial condition. One customer within the Company’s nurse and allied solutions segment comprised approximately
11%
,
11%
and
10%
of the consolidated revenue of the Company for the fiscal years ended
December 31, 2016
,
2015
and
2014
, respectively.
The Company’s cash and cash equivalents and restricted cash, cash equivalents and investment accounts are financial instruments that are exposed to concentration of credit risk. The Company maintains most of its cash, cash equivalents and investment balances with high-credit quality and federally insured institutions. However, restricted cash equivalents and investment balances may be invested in a non-federally insured money market account and commercial paper. As of
December 31, 2016
and
2015
, there were
$31,287
and
$27,352
, respectively, of restricted cash, cash equivalents and investments, a portion of which was invested in a non-federally insured money market fund and commercial paper. See Note (4), “Fair Value Measurement,” for additional information.
(m) Income Taxes
The Company records income taxes using the asset and liability method. Deferred tax assets and liabilities are recognized for the future tax consequences attributable to differences between the financial statement carrying amounts of existing assets and liabilities and their respective tax basis. Deferred tax assets and liabilities are measured using enacted tax rates expected to apply to taxable income in the years in which those temporary differences are expected to be recovered or settled. The effect on deferred tax assets and liabilities of a change in tax rates is recognized in the period the changes are enacted. In assessing the realizability of deferred tax assets, the Company considers whether it is more likely than not that some portion or all of the deferred tax assets will not be realized. The ultimate realization of deferred tax assets is dependent upon the generation of future taxable income during the periods in which those temporary differences become deductible. The Company considers the scheduled reversal of deferred tax liabilities (including the impact of available carryback and carryforward periods), projected future taxable income, and tax-planning strategies in making this assessment. The Company recognizes the effect of income tax positions only if it is more likely than not that such positions will be sustained. Recognized income tax positions are measured at the largest amount that is greater than 50% likely of being realized. Changes in recognition or measurement are reflected in the period in which the change in judgment occurs. The Company records interest and penalties related to unrecognized tax benefits in income tax expense.
(n) Fair Value of Financial Instruments
The carrying amounts of the Company’s cash equivalents and restricted cash equivalents and investments approximate their respective fair values due to the short-term nature and liquidity of these financial instruments. The carrying amounts of the Company’s Notes (as defined in Note (3) below), Term Loans and Revolver (as defined in Note (8) below) approximate their
41
fair values. As it relates to the Term Loans and Revolver, the Company amended its credit facilities in January 2016 to increase the capacity of the Revolver and to secure an additional term loan, and the variable interest rate under the Revolver and the Term Loans (LIBOR plus
1.50%
to
2.25%
or a base rate plus a spread of
0.50%
to
1.25%
, at the Company’s option) has remained unchanged since the amendment. As it relates to the Notes issued in October 2016, they have a fixed rate of
5.125%
and there have been no changes in available rates for similar debt since the date of issuance.
See Note (8), “Notes Payable and Credit Agreement,” for additional information. The fair value of the long-term portion of the Company’s insurance accruals cannot be estimated because the Company cannot reasonably determine the timing of future payments.
(o) Share-Based Compensation
The Company accounts for its share-based employee compensation plans by expensing the estimated fair value of share-based awards on a straight-line basis over the requisite employee service period, which is the vesting period. Restricted stock units (“RSUs”) typically vest at the end of a
three
-year vesting period, however,
33%
of the awards may vest on the
13
th month anniversary of the grant date and
34%
on the second anniversary of the grant date if certain performance targets are met. Share-based compensation cost of RSUs is measured by the market value of the Company’s common stock on the date of grant, and the Company records share-based compensation expense only for those awards that are expected to vest. Performance restricted stock units (“PRSUs”) primarily consist of PRSUs that contain a performance condition dependent on the Company’s adjusted EBITDA margin during the third year of the
three
-year vesting period, with a range of
0%
to
175%
of the target amount granted to be issued under the award. Share-based compensation cost for these PRSUs is measured by the market value of the Company’s common stock on the date of grant, and the amount recognized is adjusted for estimated achievement of the performance conditions. A limited amount of PRSUs contain a market condition dependent upon the Company’s relative and absolute total shareholder return over a
three
-year period, with a range of
0%
to
175%
of the target amount granted to be issued under the award. Share-based compensation cost for these PRSUs is measured using the Monte-Carlo simulation valuation model and is not adjusted for the achievement, or lack thereof, of the performance conditions.
(p) Net Income per Common Share
Share-based awards to purchase
16
,
9
and
298
shares of common stock for the years ended
December 31, 2016
,
2015
and
2014
, respectively, were not included in the calculation of diluted net income per common share because the effect of these instruments was anti-dilutive.
The following table sets forth the computation of basic and diluted net income per common share for the years ended
December 31, 2016
,
2015
and
2014
, respectively:
|
|
Years Ended December 31,
|
||||||||||
|
|
2016
|
2015
|
2014
|
||||||||
|
Net income
|
$
|
105,838
|
|
$
|
81,891
|
|
$
|
33,217
|
|
||
|
Net income per common share - basic
|
$
|
2.21
|
|
$
|
1.72
|
|
$
|
0.71
|
|
||
|
Net income per common share - diluted
|
2.15
|
|
1.68
|
|
0.69
|
|
|||||
|
Weighted average common shares outstanding - basic
|
47,946
|
|
47,525
|
|
46,504
|
|
|||||
|
Plus dilutive effect of potential common shares
|
1,321
|
|
1,318
|
|
1,582
|
|
|||||
|
Weighted average common shares outstanding - diluted
|
49,267
|
|
48,843
|
|
48,086
|
|
|||||
(q) Segment Information
The Company’s operating segments are identified in the same manner as they are reported internally and used by the Company’s chief operating decision maker for the purpose of evaluating performance and allocating resources. Effective as of January 1, 2016, the Company modified its reportable segments. The Company previously utilized
three
reportable segments, which it identified as follows: (1) nurse and allied healthcare staffing, (2) locum tenens staffing, and (3) physician permanent placement services. In light of the Company’s acquisitions over the past several years as well as its transition to a provider of healthcare workforce solutions, the Company’s management renamed its
three
reportable segments and also placed several of its business lines that were in the nurse and allied healthcare staffing segment into a different segment to better reflect how the business is evaluated by the chief operating decision maker. As of January 1, 2016, the Company began to disclose the following
three
reportable segments: (1) nurse and allied solutions, (2) locum tenens solutions, and (3) other workforce solutions. The nurse and allied solutions segment consists of the Company’s nurse, allied, local and labor disruption and rapid
42
response staffing businesses. The locum tenens solutions segment consists of the Company’s locum tenens staffing business. The other workforce solutions segment consists of the following Company businesses (i) physician permanent placement services, (ii) healthcare interim leadership staffing and executive search services, (iii) vendor management systems, (iv) recruitment process outsourcing, (v) education, (vi) medical coding and related consulting, and (vii) workforce optimization services.
The Company’s chief operating decision maker relies on internal management reporting processes that provide revenue and operating income by reportable segment for making financial decisions and allocating resources. Segment operating income represents income before income taxes plus depreciation, amortization of intangible assets, share-based compensation, interest expense, net, and other, and unallocated corporate overhead. The Company’s management does not evaluate, manage or measure performance of segments using asset information; accordingly, asset information by segment is not prepared or disclosed.
The following table, which includes reclassified prior period data to conform to the new segment reporting structure, provides a reconciliation of revenue and operating income by reportable segment to consolidated results and was derived from each segment’s internal financial information as used for corporate management purposes:
|
|
Years Ended December 31,
|
||||||||||
|
|
2016
|
2015
|
2014
|
||||||||
|
Revenue
|
|||||||||||
|
Nurse and allied solutions
|
$
|
1,185,095
|
|
$
|
953,253
|
|
$
|
674,055
|
|
||
|
Locum tenens solutions
|
424,242
|
|
385,091
|
|
296,166
|
|
|||||
|
Other workforce solutions
|
292,888
|
|
124,721
|
|
65,806
|
|
|||||
|
$
|
1,902,225
|
|
$
|
1,463,065
|
|
$
|
1,036,027
|
|
|||
|
Segment operating income
|
|||||||||||
|
Nurse and allied solutions
|
$
|
161,779
|
|
$
|
123,969
|
|
$
|
82,498
|
|
||
|
Locum tenens solutions
|
58,757
|
|
48,011
|
|
30,985
|
|
|||||
|
Other workforce solutions
|
77,450
|
|
40,390
|
|
14,566
|
|
|||||
|
297,986
|
|
212,370
|
|
128,049
|
|
||||||
|
Unallocated corporate overhead
|
65,335
|
|
52,254
|
|
36,996
|
|
|||||
|
Depreciation and amortization
|
29,620
|
|
20,953
|
|
15,993
|
|
|||||
|
Share-based compensation
|
11,399
|
|
10,284
|
|
7,157
|
|
|||||
|
Interest expense, net (including loss on debt extinguishment of $3,113 for the year ended December 31, 2014), and other
|
15,465
|
|
7,790
|
|
9,237
|
|
|||||
|
Income before income taxes
|
$
|
176,167
|
|
$
|
121,089
|
|
$
|
58,666
|
|
||
(r) Reclassifications
Certain reclassifications have been made to certain of the prior years’ notes to the consolidated financial statements to conform to the current year presentation.
(s) Recently Adopted Accounting Pronouncements
In April 2015, the Financial Accounting Standards Board (“FASB”) issued ASU 2015-05, “Intangibles - Goodwill and Other - Internal-Use Software (Subtopic 350-40), Customer’s Accounting for Fees Paid in a Cloud Computing Arrangement.” This standard provides guidance about whether a cloud computing arrangement includes a software license. If a cloud computing arrangement includes a software license, then the software license element of the arrangement should be accounted for by the customer consistent with the acquisition of other software licenses. If a cloud computing arrangement does not include a software license, the customer should account for the arrangement as a service contract. The Company adopted this pronouncement prospectively beginning January 1, 2016, and the adoption did not have a material effect on the Company’s consolidated financial statements.
In September 2015, the FASB issued ASU 2015-16, “Business Combinations - Simplifying the Accounting for Measurement-Period Adjustments.” This standard requires that an acquirer recognize adjustments to provisional amounts that are identified during the measurement period in the reporting period in which the adjustment amounts are determined. The standard requires that the acquirer record, in the same period’s financial statements, the effect on earnings of changes in
43
depreciation, amortization, or other income effects, if any, as a result of the change to the provisional amounts, calculated as if the accounting had been completed at the acquisition date. The standard also requires an entity to present separately on the face of the income statement or disclose in the notes the portion of the amount recorded in current-period earnings by line item that would have been recorded in previous reporting periods if the adjustment to the provisional amounts had been recognized as of the acquisition date. The Company adopted this pronouncement prospectively beginning January 1, 2016, and the adoption did not have a material effect on the Company’s consolidated financial statements.
(2) Business Combinations
As set forth below, the Company completed
seven
acquisitions from January 1,
2014
through
December 31, 2016
. The Company accounted for each acquisition using the acquisition method of accounting. Accordingly, it recorded the tangible and intangible assets acquired and liabilities assumed at their estimated fair values as of the applicable date of acquisition. For each acquisition, the Company did not incur any material acquisition-related costs.
Peak Provider Solutions Acquisition
On June 3, 2016, the Company completed its acquisition of Peak Provider Solutions (“Peak”), which provides remote medical coding and consulting solutions to hospitals and physician medical groups nationwide. The addition of Peak has expanded the Company’s workforce solutions and enables the Company to offer services in coding diagnosis and procedure codes, which is critical to clinical quality reporting and the financial health of healthcare organizations. The initial purchase price of
$52,125
included (1)
$51,645
cash consideration paid upon acquisition, funded through cash-on-hand, net of cash received, and borrowings under the Company’s Revolver, and (2) a contingent earn-out payment of up to
$3,000
with an estimated fair value of
$480
as of the acquisition date. The contingent earn-out payment is based on the operating results of Peak for the year ended December 31, 2016. As the acquisition’s operations are not considered material, pro forma information is not provided. The results of Peak have been included in the Company’s other workforce solutions segment since the date of acquisition. During the third quarter of 2016, an additional
$275
of cash consideration was paid to the selling shareholders for the final working capital settlement.
The preliminary allocation of the
$52,400
purchase price, which included the additional cash consideration paid for the final working capital settlement, consisted of (1)
$5,658
of fair value of tangible assets acquired, (2)
$9,305
of liabilities assumed, (3)
$19,220
of identified intangible assets, and (4)
$36,827
of goodwill, none of which is deductible for tax purposes. The fair value of intangible assets primarily includes
$7,600
of trademarks and
$11,500
of customer relationships with a weighted average useful life of approximately
thirteen
years.
HealthSource Global Staffing Acquisition
On January 11, 2016, the Company completed its acquisition of HealthSource Global Staffing (“HSG”), which provides labor disruption and rapid response staffing. The acquisition enabled the Company to expand its service lines to include labor disruption services. The initial purchase price of
$8,511
included (1)
$2,799
cash consideration paid upon acquisition, funded through cash-on-hand, net of cash received, and settlement of the pre-existing relationship between AMN and HSG, (2)
$2,122
cash holdback for potential indemnification claims, and (3) a tiered contingent earn-out payment of up to
$4,000
with an estimated fair value of
$3,590
as of the acquisition date. The contingent earn-out payment is comprised of (A) up to
$2,000
based on the operating results of HSG for the year ended December 31, 2016, and (B) up to
$2,000
based on the operating results of HSG for the year ending December 31, 2017. As the acquisition is not considered material, pro forma information is not provided. The results of HSG have been included in the Company’s nurse and allied solutions segment since the date of acquisition. During the third quarter of 2016, the final working capital settlement resulted in
$292
due from the selling shareholders to the Company, which was settled through a reduction to a cash holdback.
The allocation of the
$8,219
purchase price, which was reduced by the final working capital settlement, consisted of (1)
$1,025
of fair value of tangible assets acquired, (2)
$4,897
of liabilities assumed, (3)
$3,944
of identified intangible assets, and (4)
$8,147
of goodwill, none of which is deductible for tax purposes. The intangible assets include the fair value of trademarks, customer relationships, staffing databases, and covenants not to compete with a weighted average useful life of approximately
eight
years.
B.E. Smith Acquisition
On January 4, 2016, the Company completed its acquisition of B.E. Smith (“BES”), a full-service healthcare interim leadership placement and executive search firm, for
$162,232
in cash, net of cash received, and settlement of the pre-existing relationship between AMN and BES. BES places interim leaders and executives across all healthcare settings, including acute care hospitals, academic medical and children’s hospitals, physician practices, and post-acute care providers. The acquisition provides the Company additional access to healthcare executives and enhances its integrated services to hospitals, health
44
systems, and other healthcare facilities across the nation. To help finance the acquisition, the Company entered into the First Amendment to the Credit Agreement (the “First Amendment”), which provided
$125,000
of additional available borrowings to the Company. The First Amendment is more fully described in Note (8), “Notes Payable and Credit Agreement.” The results of BES have been included in the Company’s other workforce solutions segment since the date of acquisition. During the second quarter of 2016,
$524
was returned to the Company for the final working capital settlement.
The allocation of the
$161,708
purchase price, which was reduced by the final working capital settlement, consisted of (1)
$11,953
of fair value of tangible assets acquired, (2)
$7,272
of liabilities assumed, (3)
$65,900
of identified intangible assets, and (4)
$91,127
of goodwill, most of which is deductible for tax purposes. The intangible assets acquired have a weighted average useful life of approximately
fifteen
years. The following table summarizes the fair value and useful life of each intangible asset acquired:
|
Fair Value
|
Useful Life
|
||||||
|
(in years)
|
|||||||
|
Identifiable intangible assets
|
|||||||
|
Tradenames and Trademarks
|
$
|
26,300
|
|
20
|
|||
|
Customer Relationships
|
25,700
|
|
12
|
||||
|
Staffing Database
|
13,000
|
|
10
|
||||
|
Non-Compete Agreements
|
900
|
|
5
|
||||
|
$
|
65,900
|
|
|||||
Approximately
$108,459
of revenue and
$16,491
of income before income taxes of BES were included in the consolidated statement of comprehensive income for the year ended
December 31, 2016
. The following summary presents unaudited pro forma consolidated results of operations of the Company for the year ended
December 31, 2015
as if the BES acquisition had occurred on January 1, 2015, which gives effect to certain adjustments, including the reduction of compensation expense related to non-recurring executive salary expense and the addition of acquisition-related costs and amortization of intangible assets. The pro forma financial information is not necessarily indicative of the operating results that would have occurred had the acquisition been consummated as of the date indicated, nor is it necessarily indicative of the Company’s future operating results.
|
Year Ended December 31,
|
|||
|
(Unaudited)
|
2015
|
||
|
Revenue
|
$
|
1,556,729
|
|
|
Income from operations
|
$
|
132,023
|
|
|
Net income
|
$
|
80,114
|
|
|
Net income per common share:
|
|||
|
Basic
|
$
|
1.69
|
|
|
Diluted
|
$
|
1.64
|
|
MillicanSolutions Acquisition
On October 5, 2015, the Company acquired MillicanSolutions (“Millican”), a physician and executive leadership search firm. The total purchase price of
$3,985
included (1)
$2,985
cash consideration paid upon acquisition, funded by cash-on-hand, (2)
$500
paid in December 2016, and (3)
$500
to be paid on December 31, 2017. The acquisition enhances the Company’s ability to respond to the specialized leadership needs within academic pediatrics and children’s medical centers and expands its expertise in serving academic medical centers and teaching hospitals in physician and leadership search. As the acquisition is not considered material, pro forma information is not provided. The results of operations of Millican have been included in the Company’s other workforce solutions segment since the date of acquisition.
The allocation of the
$3,985
purchase price consisted of (1)
$261
of fair value of tangible assets acquired, (2)
$287
of liabilities assumed, (3)
$645
of identified intangible assets and (4)
$3,366
of goodwill, a portion of which is deductible for tax purposes. The intangible assets include the fair value of tradenames and trademarks, staffing databases, customer relationships, and a covenant not to compete. The weighted average useful life of the acquired intangible assets subject to amortization is approximately
five years
.
45
The First String Healthcare Acquisition
On September 15, 2015, the Company completed its acquisition of The First String Healthcare (“TFS”), a leading provider of interim staffing and permanent placement of nurse leaders and executives. The total purchase price of
$7,653
included (1)
$4,453
cash consideration paid upon acquisition, funded by cash-on-hand, net of cash received, (2)
$500
to be paid on the first anniversary of the acquisition date, which was paid in September 2016, and (3) a contingent earn-out with a fair value of
$2,700
as of the acquisition date. Also, the purchase agreement included an additional
$1,000
payment to be paid on the second anniversary of the acquisition date conditioned upon, subject to certain exceptions, continued employment of the selling shareholders, which is being recorded as compensation expense for post-combination services. The acquisition enhances the Company’s capabilities to provide interim and permanent nursing leadership. As the acquisition is not considered material, pro forma information is not provided. The results of operations of TFS are included in the other workforce solutions segment since the date of acquisition.
The acquisition agreement provides for a tiered contingent earn-out payment of up to
$4,000
, of which (1)
$1,000
was paid to the sellers in March 2016 based on the operating results of TFS for the twelve months ended December 31, 2015, and (2) up to
$3,000
may be paid in 2017 based on the operating results of TFS for the twelve months ended December 31, 2016. The allocation of the
$7,653
purchase price consisted of (A)
$919
of fair value of tangible assets acquired, (B)
$891
of liabilities assumed, (C)
$3,373
of identified intangible assets and (D)
$4,252
of goodwill, which is deductible for tax purposes. The intangible assets include the fair value of tradenames and trademarks, customer relationships, a staffing database, and covenants not to compete. The weighted average useful life of the acquired intangible assets subject to amortization is approximately
seven years
.
Onward Healthcare Acquisition
On January 7, 2015, the Company completed its acquisition of Onward Healthcare, including its
two
wholly-owned subsidiaries, Locum Leaders and Medefis (collectively, “OH”), for approximately
$76,643
in cash, funded by cash-on-hand and borrowings under the Company’s Revolver. Onward Healthcare is a national nurse and allied healthcare staffing firm, Locum Leaders is a national locum tenens provider, and Medefis is a provider of a SaaS-based vendor management system for healthcare facilities. The acquisition helps the Company to expand its service lines and its supply and placement capabilities of healthcare professionals to its clients. The results of Onward Healthcare are included in the Company’s nurse and allied solutions segment, the results of Locum Leaders are included in the Company’s locum tenens solutions segment, and the results of Medefis are included in the Company’s other workforce solutions segment, in each case, since the date of acquisition.
The allocation of the
$76,643
purchase price consisted of (1)
$25,216
of fair value of tangible assets acquired (including
$21,313
of accounts receivable), (2)
$22,275
of liabilities assumed (including
$11,113
of accounts payable and accrued expenses), (3)
$30,219
of identified intangible assets, and (4)
$43,483
of goodwill, a portion of which is deductible for tax purposes. The intangible assets include the fair value of tradenames and trademarks, customer relationships, staffing database, acquired technologies, and non-compete agreements. The weighted average useful life of the acquired intangible assets is approximately
eleven
years. The following table summarizes the fair value and useful life of each intangible asset acquired:
|
Fair Value
|
Useful Life
|
||||||
|
(in years)
|
|||||||
|
Identifiable intangible assets
|
|||||||
|
Tradenames and Trademarks
|
$
|
8,100
|
|
3 - 15
|
|||
|
Customer Relationships
|
17,600
|
|
10 - 15
|
||||
|
Staffing Database
|
2,600
|
|
5
|
||||
|
Acquired Technologies
|
1,700
|
|
8
|
||||
|
Non-Compete Agreements
|
219
|
|
2
|
||||
|
$
|
30,219
|
|
|||||
Of the
$43,483
allocated to goodwill,
$23,032
,
$5,241
and
$15,210
were allocated to the Company’s nurse and allied solutions, locum tenens solutions and other workforce solutions segments, respectively.
46
Avantas Acquisition
On December 22, 2014, the Company acquired Avantas, LLC (“Avantas”), a provider of clinical workforce management services, including its proprietary SaaS-based scheduling technology. The initial purchase price of
$17,520
included (1)
$14,470
cash consideration paid at acquisition, funded through cash-on-hand and borrowings under the Company’s Revolver, (2)
$1,650
cash holdback for potential indemnification claims and (3) a tiered contingent earn-out of up to
$8,500
based on the operating performance of Avantas during the 12-month period ended June 30, 2016, with an estimated fair value at acquisition of
$1,400
. During the year ended December 31, 2015, the Company paid an additional
$165
to the selling shareholders for a working capital adjustment. The acquisition expanded the Company’s ability to provide workforce optimization services. The results of operations of Avantas are included in the Company’s other workforce solutions segment since the date of acquisition.
The allocation of the total
$17,685
purchase price (which gives effect to the
$165
working capital adjustment on the initial purchase price) consisted of (1)
$1,631
of fair value of tangible assets acquired, (2)
$3,821
of liabilities and deferred revenue assumed, (3)
$9,960
of identified intangible assets, including tradenames and trademarks, customer relationships and acquired technologies with a weighted average useful life of approximately
fourteen
years and (4)
$9,915
of goodwill, a portion of which is deductible for tax purposes.
(3) Derivative Instruments
In April 2015, the Company entered into an interest rate swap agreement to minimize its exposure to interest rate fluctuations on
$100,000
of its outstanding variable rate debt under one of its Term Loans whereby the Company pays a fixed rate of
0.983%
per annum and receives a variable rate equal to floating one-month LIBOR. The agreement expires on March 30, 2018.
In connection with the Company’s issuance of
$325,000
aggregate principal amount of
5.125%
Senior Notes due 2024 (the “Notes”) and the use of a portion of the proceeds thereof to repay
$138,438
of certain indebtedness under the Term Loans on October 3, 2016, the Company reduced the interest rate swap notional amount to
$40,000
in the fourth quarter of 2016. As a result,
$238
was recorded to interest expense reflecting the settlement amount with the counterparty to reduce the notional amount. See additional information in Note (8), “Notes Payable and Credit Agreement.”
At
December 31, 2016
, the interest rate swap had a fair value of
$24
, which is included in other assets in the consolidated balance sheet as of December 31, 2016. At
December 31, 2015
, the interest rate swap agreement had a fair value of
$165
, which is included in other assets in the audited consolidated balance sheet as of
December 31, 2015
. The Company has formally documented the hedging relationship and accounts for this arrangement as a cash flow hedge.
The Company recognizes all derivatives on the balance sheet at fair value based on quotes from an independent pricing service. Gains or losses resulting from changes in the values of the arrangement are recorded in other comprehensive income, net of tax, until the hedged item is recognized in earnings. The Company also formally assesses, both at the hedge’s inception and on an ongoing basis, whether the derivative instrument that is used in the hedging transaction is highly effective in offsetting changes in fair values or cash flows of the hedged item. When it is determined that a derivative instrument is not highly effective as a hedge or that it has ceased to be a highly effective hedge, the Company discontinues hedge accounting prospectively and recognizes subsequent changes in market value in earnings.
(4) Fair Value Measurement
Fair value represents the price that would be received for an asset or paid to transfer a liability (an exit price) in the principal or most advantageous market for the asset or liability in an orderly transaction between market participants on the measurement date. When determining fair value, the Company considers the principal or most advantageous market in which the Company would conduct a transaction, in addition to the assumptions that market participants would use when pricing the related assets or liabilities, including non-performance risk.
A three-level hierarchy prioritizes the inputs to valuation techniques used to measure fair value and requires an entity to maximize the use of observable inputs and minimize the use of unobservable inputs when measuring fair value. The three levels of the fair value hierarchy are as follows:
Level 1
—Quoted prices in active markets for identical assets or liabilities.
Level 2
—Observable inputs other than Level 1 prices such as quoted prices for similar assets or liabilities; quoted prices in markets that are not active; or other inputs that are observable or can be corroborated by observable market data for substantially the full term of the assets or liabilities.
47
Level 3
—Unobservable inputs that are supported by little or no market activity and that are significant to the fair value of the assets or liabilities.
Assets and Liabilities Measured on a Recurring Basis
The Company’s restricted cash equivalents that serve as collateral for the Company’s outstanding letters of credit typically consist of money market funds that are measured at fair value based on quoted prices, which are Level 1 inputs.
As of
December 31, 2016
, the Company’s restricted cash equivalents and investments that serve as collateral for the Company’s captive insurance company primarily consist of commercial paper that is measured at observable market prices for identical securities that are traded in less active markets, which are Level 2 inputs. Of the
$25,610
commercial paper as of
December 31, 2016
,
$11,152
had original maturities greater than three months, which were considered available for sale securities. The Company did not have commercial paper as of December 31, 2015.
The Company’s interest rate swap is measured at fair value using a discounted cash flow analysis that includes the contractual terms, including the period to maturity, and Level 2 observable market-based inputs, including interest rate curves. The fair value of the swap is determined by netting the discounted future fixed cash receipts payments and the discounted expected variable cash receipts. The variable cash receipts are based on an expectation of future interest rates (forward curves) derived from observable market interest rate yield curves. The valuation also considers credit risk adjustments that are necessary to reflect the probability of default by the counterparty or the Company, which are considered Level 3 inputs; however, as of
December 31, 2016
, the credit risk adjustments, including nonperformance risk, were considered insignificant to the total fair value of the interest rate swap.
The Company’s contingent consideration liabilities are measured at fair value using probability-weighted discounted cash flow analysis for the acquired companies, which are Level 3 inputs.
The following tables present information about assets and liabilities measured at fair value on a recurring basis and indicate the fair value hierarchy of the valuation techniques utilized to determine such fair value:
|
|
Fair Value Measurements as of December 31, 2016
|
||||||||||||||
|
Assets (Liabilities)
|
Total
|
Quoted Prices in
Active Markets
for Identical
Assets
(Level 1)
|
Significant Other Observable Inputs (Level 2)
|
Significant Unobservable Inputs (Level 3)
|
|||||||||||
|
Money market funds
|
$
|
4,627
|
|
$
|
4,627
|
|
$
|
—
|
|
$
|
—
|
|
|||
|
Commercial paper
|
25,610
|
|
—
|
|
25,610
|
|
—
|
|
|||||||
|
Interest rate swap asset
|
24
|
|
—
|
|
24
|
|
—
|
|
|||||||
|
Acquisition contingent consideration liabilities
|
(6,816
|
)
|
—
|
|
—
|
|
(6,816
|
)
|
|||||||
|
|
Fair Value Measurements as of December 31, 2015
|
||||||||||||||
|
Assets (Liabilities)
|
Total
|
Quoted Prices in
Active Markets
for Identical
Assets
(Level 1)
|
Significant Other Observable Inputs (Level 2)
|
Significant Unobservable Inputs (Level 3)
|
|||||||||||
|
Money market funds
|
$
|
5,627
|
|
$
|
5,627
|
|
$
|
—
|
|
$
|
—
|
|
|||
|
Interest rate swap asset
|
165
|
|
—
|
|
165
|
|
—
|
|
|||||||
|
Acquisition contingent consideration liabilities
|
(3,770
|
)
|
—
|
|
—
|
|
(3,770
|
)
|
|||||||
48
The following table sets forth a reconciliation of changes in the fair value of contingent consideration liabilities classified as Level 3 in the fair value hierarchy:
|
|
Years Ended December 31,
|
||||||
|
|
2016
|
2015
|
|||||
|
Balance as of January 1,
|
$
|
(3,770
|
)
|
$
|
(1,400
|
)
|
|
|
Contingent consideration earn-out liability from TFS acquisition on September 15, 2015
|
—
|
|
(2,700
|
)
|
|||
|
Settlement of TFS earn-out for year ended December 31, 2015
|
1,000
|
|
—
|
|
|||
|
Contingent consideration earn-out liability from HSG acquisition on January 11, 2016
|
(3,590
|
)
|
—
|
|
|||
|
Change in fair value of contingent consideration earn-out liability from Avantas acquisition
|
660
|
|
740
|
|
|||
|
Change in fair value of contingent consideration earn-out liability from TFS acquisition
|
(890
|
)
|
(410
|
)
|
|||
|
Change in fair value of contingent consideration earn-out liability from HSG acquisition
|
(226
|
)
|
—
|
|
|||
|
Contingent consideration earn-out liability from Peak acquisition on June 3, 2016
|
(480
|
)
|
—
|
|
|||
|
Change in fair value of contingent consideration earn-out liability from Peak acquisition
|
480
|
|
—
|
|
|||
|
Balance as of December 31,
|
$
|
(6,816
|
)
|
$
|
(3,770
|
)
|
|
Assets Measured on a Non-Recurring Basis
The Company applies fair value techniques on a non-recurring basis associated with valuing potential impairment losses related to its goodwill, indefinite-lived intangible assets, long-lived assets and equity method investment.
The Company evaluates goodwill and indefinite-lived intangible assets annually for impairment and whenever circumstances occur indicating that goodwill or indefinite-lived intangible assets might be impaired. The Company determines the fair value of its reporting units based on a combination of inputs, including the market capitalization of the Company, as well as Level 3 inputs such as discounted cash flows, which are not observable from the market, directly or indirectly. The Company determines the fair value of its indefinite-lived intangible assets using the income approach (relief-from-royalty method) based on Level 3 inputs.
There were
no
impairment charges recorded during the three years ended
December 31, 2016
requiring such measurements.
49
(5) Goodwill and Identifiable Intangible Assets
As of
December 31, 2016
and
2015
, the Company had the following acquired intangible assets:
|
|
As of December 31, 2016
|
As of December 31, 2015
|
|||||||||||||||||||||
|
|
Gross
Carrying
Amount
|
Accumulated
Amortization
|
Net
Carrying
Amount
|
Gross
Carrying
Amount
|
Accumulated
Amortization
|
Net
Carrying
Amount
|
|||||||||||||||||
|
Intangible assets subject to amortization:
|
|||||||||||||||||||||||
|
Staffing databases
|
$
|
19,826
|
|
$
|
(5,633
|
)
|
$
|
14,193
|
|
$
|
6,333
|
|
$
|
(3,592
|
)
|
$
|
2,741
|
|
|||||
|
Customer relationships
|
136,759
|
|
(50,309
|
)
|
86,450
|
|
96,829
|
|
(40,076
|
)
|
56,753
|
|
|||||||||||
|
Tradenames and trademarks
|
61,369
|
|
(12,139
|
)
|
49,230
|
|
26,853
|
|
(7,718
|
)
|
19,135
|
|
|||||||||||
|
Non-compete agreements
|
1,697
|
|
(678
|
)
|
1,019
|
|
572
|
|
(276
|
)
|
296
|
|
|||||||||||
|
Acquired technology
|
8,730
|
|
(3,298
|
)
|
5,432
|
|
8,730
|
|
(2,085
|
)
|
6,645
|
|
|||||||||||
|
$
|
228,381
|
|
$
|
(72,057
|
)
|
$
|
156,324
|
|
$
|
139,317
|
|
$
|
(53,747
|
)
|
$
|
85,570
|
|
||||||
|
Intangible assets not subject to amortization: tradenames and trademarks
|
$
|
89,400
|
|
$
|
89,400
|
|
|||||||||||||||||
|
$
|
245,724
|
|
$
|
174,970
|
|
||||||||||||||||||
Aggregate amortization expense for intangible assets was
$18,310
and
$11,784
for the years ended
December 31, 2016
and
2015
, respectively. Based on the current amount of intangibles subject to amortization, the estimated amortization expense as of
December 31, 2016
is as follows:
|
|
Amount
|
||
|
Year ending December 31, 2017
|
$
|
18,628
|
|
|
Year ending December 31, 2018
|
17,555
|
|
|
|
Year ending December 31, 2019
|
16,827
|
|
|
|
Year ending December 31, 2020
|
13,889
|
|
|
|
Year ending December 31, 2021
|
11,899
|
|
|
|
Thereafter
|
77,526
|
|
|
|
$
|
156,324
|
|
|
50
The following table summarizes the activity related to the carrying value of goodwill by reportable segment:
|
Nurse and Allied
Solutions
|
Locum Tenens
Solutions
|
Other Workforce Solutions
|
Total
|
||||||||||||
|
Balance, January 1, 2015
|
$
|
73,127
|
|
$
|
14,502
|
|
$
|
66,758
|
|
$
|
154,387
|
|
|||
|
Goodwill adjustment for Avantas acquisition
|
—
|
|
—
|
|
165
|
|
165
|
|
|||||||
|
Goodwill from OH acquisition
|
22,182
|
|
5,241
|
|
15,210
|
|
42,633
|
|
|||||||
|
Goodwill from TFS acquisition
|
—
|
|
—
|
|
4,228
|
|
4,228
|
|
|||||||
|
Goodwill from Millican acquisition
|
—
|
|
—
|
|
3,366
|
|
3,366
|
|
|||||||
|
Balance, December 31, 2015
|
95,309
|
|
19,743
|
|
89,727
|
|
204,779
|
|
|||||||
|
Goodwill from BES acquisition
|
—
|
|
—
|
|
91,127
|
|
91,127
|
|
|||||||
|
Goodwill from HSG acquisition
|
8,147
|
|
—
|
|
—
|
|
8,147
|
|
|||||||
|
Goodwill from Peak acquisition
|
—
|
|
—
|
|
36,827
|
|
36,827
|
|
|||||||
|
Goodwill adjustment for Onward acquisition
|
850
|
|
—
|
|
—
|
|
850
|
|
|||||||
|
Goodwill adjustment for TFS acquisition
|
—
|
|
—
|
|
24
|
|
24
|
|
|||||||
|
Balance, December 31, 2016
|
$
|
104,306
|
|
$
|
19,743
|
|
$
|
217,705
|
|
$
|
341,754
|
|
|||
|
Accumulated impairment loss as of
December 31, 2015 and 2016
|
$
|
154,444
|
|
$
|
53,940
|
|
$
|
6,555
|
|
$
|
214,939
|
|
|||
51
(6) Balance Sheet Details
The consolidated balance sheets detail is as follows as of
December 31, 2016
and
2015
:
|
|
As of December 31,
|
||||||
|
|
2016
|
2015
|
|||||
|
Other current assets:
|
|||||||
|
Restricted cash
|
20,271
|
|
11,995
|
|
|||
|
Income taxes receivable
|
361
|
|
3,687
|
|
|||
|
Other
|
13,975
|
|
8,041
|
|
|||
|
Other current assets
|
$
|
34,607
|
|
$
|
23,723
|
|
|
|
Fixed assets:
|
|||||||
|
Furniture and equipment
|
$
|
25,582
|
|
$
|
23,380
|
|
|
|
Technology and software
|
112,405
|
|
97,962
|
|
|||
|
Leasehold improvements
|
6,832
|
|
5,472
|
|
|||
|
144,819
|
|
126,814
|
|
||||
|
Accumulated depreciation
|
(84,865
|
)
|
(76,680
|
)
|
|||
|
Fixed assets, net
|
$
|
59,954
|
|
$
|
50,134
|
|
|
|
Accounts payable and accrued expenses:
|
|||||||
|
Trade accounts payable
|
$
|
33,392
|
|
$
|
28,761
|
|
|
|
Subcontractor payable
|
51,973
|
|
56,177
|
|
|||
|
Accrued expenses
|
37,251
|
|
24,502
|
|
|||
|
Professional liability reserve
|
10,254
|
|
7,962
|
|
|||
|
Other
|
4,642
|
|
1,420
|
|
|||
|
Accounts payable and accrued expenses
|
$
|
137,512
|
|
$
|
118,822
|
|
|
|
Accrued compensation and benefits:
|
|||||||
|
Accrued payroll
|
$
|
30,917
|
|
$
|
21,058
|
|
|
|
Accrued bonuses and commissions
|
26,992
|
|
24,476
|
|
|||
|
Accrued travel expense
|
2,972
|
|
2,740
|
|
|||
|
Accrued health insurance reserve
|
3,189
|
|
3,225
|
|
|||
|
Accrued workers compensation reserve
|
8,406
|
|
7,701
|
|
|||
|
Deferred compensation
|
32,690
|
|
23,044
|
|
|||
|
Other
|
2,827
|
|
1,457
|
|
|||
|
Accrued compensation and benefits
|
$
|
107,993
|
|
$
|
83,701
|
|
|
|
Other current liabilities:
|
|||||||
|
Acquisition related liabilities
|
6,921
|
|
3,485
|
|
|||
|
Other
|
9,690
|
|
1,889
|
|
|||
|
Other current liabilities
|
$
|
16,611
|
|
$
|
5,374
|
|
|
|
Other long-term liabilities:
|
|||||||
|
Workers compensation reserve
|
$
|
18,708
|
|
$
|
16,899
|
|
|
|
Professional liability reserve
|
37,338
|
|
37,369
|
|
|||
|
Deferred rent
|
13,274
|
|
11,826
|
|
|||
|
Unrecognized tax benefits
|
8,464
|
|
8,081
|
|
|||
|
Other
|
4,312
|
|
3,959
|
|
|||
|
Other long-term liabilities
|
$
|
82,096
|
|
$
|
78,134
|
|
|
52
(7) Income Taxes
The provision for income taxes from operations for the years ended
December 31, 2016
,
2015
and
2014
consists of the following:
|
|
Years Ended December 31,
|
||||||||||
|
|
2016
|
2015
|
2014
|
||||||||
|
Current income taxes:
|
|||||||||||
|
Federal
|
$
|
68,312
|
|
$
|
22,552
|
|
$
|
10,787
|
|
||
|
State
|
11,441
|
|
3,969
|
|
2,883
|
|
|||||
|
Total
|
79,753
|
|
26,521
|
|
13,670
|
|
|||||
|
Deferred income taxes:
|
|||||||||||
|
Federal
|
(9,115
|
)
|
8,896
|
|
10,430
|
|
|||||
|
State
|
(309
|
)
|
3,781
|
|
1,349
|
|
|||||
|
Total
|
(9,424
|
)
|
12,677
|
|
11,779
|
|
|||||
|
Provision for income taxes from operations
|
$
|
70,329
|
|
$
|
39,198
|
|
$
|
25,449
|
|
||
Total income tax expense for the years ended
December 31, 2016
,
2015
and
2014
was allocated as follows:
|
|
Years Ended December 31,
|
||||||||||
|
|
2016
|
2015
|
2014
|
||||||||
|
Provision for income taxes from operations
|
$
|
70,329
|
|
$
|
39,198
|
|
$
|
25,449
|
|
||
|
Shareholders’ equity, for compensation expense for tax purposes in excess of amounts recognized for financial reporting purposes
|
(3,144
|
)
|
(7,176
|
)
|
(978
|
)
|
|||||
|
$
|
67,185
|
|
$
|
32,022
|
|
$
|
24,471
|
|
|||
The Company’s income tax expense differs from the amount that would have resulted from applying the federal statutory rate of
35%
to pretax income from operations because of the effect of the following items during the years ended
December 31, 2016
,
2015
and
2014
:
|
|
Years Ended December 31,
|
||||||||||
|
|
2016
|
2015
|
2014
|
||||||||
|
Tax expense at federal statutory rate
|
$
|
61,658
|
|
$
|
42,381
|
|
$
|
20,533
|
|
||
|
State taxes, net of federal benefit
|
7,597
|
|
5,260
|
|
2,551
|
|
|||||
|
Non-deductible expenses
|
3,656
|
|
3,505
|
|
1,816
|
|
|||||
|
Unrecognized tax benefit
|
379
|
|
(11,464
|
)
|
971
|
|
|||||
|
Other, net
|
(2,961
|
)
|
(484
|
)
|
(422
|
)
|
|||||
|
Income tax expense from operations
|
$
|
70,329
|
|
$
|
39,198
|
|
$
|
25,449
|
|
||
53
The tax effects of temporary differences that give rise to significant portions of deferred tax assets and deferred tax liabilities are presented below as of the years ended
December 31, 2016
and
2015
:
|
|
Years Ended December 31,
|
||||||
|
|
2016
|
2015
|
|||||
|
Deferred tax assets:
|
|||||||
|
Stock compensation
|
$
|
11,954
|
|
$
|
10,170
|
|
|
|
Deferred compensation
|
13,079
|
|
9,153
|
|
|||
|
Accrued expenses
|
35,499
|
|
24,932
|
|
|||
|
Deferred rent
|
5,492
|
|
4,885
|
|
|||
|
Net operating losses
|
5,756
|
|
8,809
|
|
|||
|
Other
|
6,576
|
|
4,872
|
|
|||
|
Total deferred tax assets
|
$
|
78,356
|
|
$
|
62,821
|
|
|
|
Deferred tax liabilities:
|
|||||||
|
Intangibles
|
$
|
(78,201
|
)
|
$
|
(67,574
|
)
|
|
|
Fixed assets
|
(18,847
|
)
|
(15,155
|
)
|
|||
|
Other
|
(2,545
|
)
|
(1,480
|
)
|
|||
|
Total deferred tax liabilities
|
$
|
(99,593
|
)
|
$
|
(84,209
|
)
|
|
|
Valuation allowance
|
$
|
(183
|
)
|
$
|
(1,043
|
)
|
|
|
Net deferred tax liabilities
|
$
|
(21,420
|
)
|
$
|
(22,431
|
)
|
|
The deferred tax benefit of
$9,424
shown above is different from the change in net deferred tax liabilities primarily due to deferred tax balances recorded through acquisitions in 2016.
In assessing the realizability of deferred tax assets, management considers whether it is more likely than not that some portion or all of the deferred tax assets will not be realized. Management believes it is more likely than not that the Company will realize the benefits of its deferred tax assets, net of the recorded valuation allowance.
The amount of federal NOL carryforward that is available for use in years subsequent to
December 31, 2016
is
$13,920
, which is set to expire by
2029
. The amount of state NOL carryforward that is available for use in years subsequent to
December 31, 2016
is
$16,674
, which is set to expire at various dates between
2017
and
2032
.
A summary of the changes in the amount of unrecognized tax benefits (excluding interest and penalties) for
2016
,
2015
and
2014
is as follows:
|
2016
|
2015
|
2014
|
|||||||||
|
Beginning balance of unrecognized tax benefits
|
$
|
6,537
|
|
$
|
22,890
|
|
$
|
22,573
|
|
||
|
Additions based on tax positions related to the current year
|
—
|
|
—
|
|
317
|
|
|||||
|
Additions based on tax positions of prior years
|
868
|
|
395
|
|
—
|
|
|||||
|
Reductions due to lapse of applicable statute of limitation
|
(563
|
)
|
(214
|
)
|
—
|
|
|||||
|
Settlements
|
—
|
|
(16,534
|
)
|
—
|
|
|||||
|
Ending balance of unrecognized tax benefits
|
$
|
6,842
|
|
$
|
6,537
|
|
$
|
22,890
|
|
||
At
December 31, 2016
, if recognized, approximately
$6,752
would affect the effective tax rate (including interest).
The Company recognizes interest related to unrecognized tax benefits in income tax expense. The Company had approximately
$1,622
,
$1,544
and
$5,815
of accrued interest related to unrecognized tax benefits at
December 31, 2016
,
2015
and
2014
, respectively. The amount of interest expense (benefit) recognized in
2016
,
2015
and
2014
was
$78
,
$(4,272)
and
$1,211
, respectively.
The Company is subject to taxation in the U.S. and various states and foreign jurisdictions. With few exceptions, as of
December 31, 2016
, the Company is no longer subject to state, local or foreign examinations by tax authorities for tax years before 2006, and the Company is no longer subject to U.S. federal income or payroll tax examinations for tax years before 2011. The Company’s tax years 2007, 2008, 2009 and 2010 had been under audit by the Internal Revenue Service (“IRS”) for
54
several years and in 2014, the IRS issued the Company its Revenue Agent Report (“RAR”) and an Employment Tax Examination Report (“ETER”). The RAR proposed adjustments to the Company’s taxable income for 2007-2010 and net operating loss carryforwards for 2005 and 2006, resulting from the proposed disallowance of certain per diems paid to the Company’s healthcare professionals, and the ETER proposed assessments for additional payroll tax liabilities and penalties for tax years 2009 and 2010 related to the Company’s treatment of certain non-taxable per diem allowances and travel benefits.
The positions in the RAR and ETER were mutually exclusive, and contained multiple tax positions, some of which were contrary to each other. The Company filed a Protest Letter for both the RAR and ETER positions in 2014 and the Company received a final determination from the IRS in July 2015 on both the RAR adjustments and ETER assessments, effectively settling these audits with the IRS for
$7,200
(including interest) during the third quarter of 2015. As a result of the settlement, the Company recorded federal income tax benefits of approximately
$12,200
during the quarter ended September 30, 2015, state income tax benefits (net of federal tax impact) of
$568
for the year ended December 31, 2016, and expects to record the state income tax benefits (net of federal tax impact) of approximately
$1,200
by fiscal year 2019, when the various state statutes are projected to lapse.
The IRS conducted and completed a separate audit of the Company’s 2011 and 2012 tax years that focused on income and employment tax issues similar to those raised in the 2007 through 2010 examination. The IRS completed its audit during the quarter ended March 31, 2015, and issued its RAR and ETER to the Company with proposed adjustments to the Company’s taxable income for 2011 and 2012 and net operating loss carryforwards from 2010 and assessments for additional payroll tax liabilities and penalties for 2011 and 2012 related to the Company’s treatment of certain non-taxable per diem allowances and travel benefits. The positions in the RAR and ETER for the 2011 and 2012 years are mutually exclusive and contain multiple tax positions, some of which are contrary to each other. The Company filed a Protest Letter for both the RAR and ETER in April 2015 and the matter is currently at IRS Appeals. The Company recently held its first meeting with the IRS Appeals office and will continue to meet with the IRS Appeals office during the next twelve months. The Company cannot predict with certainty the timing of a resolution of such matter. The IRS began an audit of the Company’s 2013 tax year during the quarter ended June 30, 2015. The Company believes its reserve for unrecognized tax benefits and contingent tax issues is adequate with respect to all open years. Notwithstanding the foregoing, the Company could adjust its provision for income taxes and contingent tax liability based on future developments.
(8) Notes Payable and Credit Agreement
(a) The Company
’
s Credit Agreement and Related Credit Facilities
The Company is party to a credit agreement (as amended to date, the “Credit Agreement”) with several lenders in respect of
three
credit facilities (the “Credit Facilities”), including (A) a
$275,000
revolver facility (the “Revolver”), which includes a
$40,000
sublimit for the issuance of letters of credit and a
$20,000
sublimit for swingline loans, (B) a
$150,000
secured term loan facility (the “Original Term Loan”) and (C) a
$75,000
secured term loan facility (the “Second Term Loan,” and together with the Original Term Loan, the “Term Loans”). The Company used the proceeds from the Second Term Loan, which it obtained (along with an increase of
$50,000
to the Revolver) under the First Amendment, and draw downs of the Revolver to complete its acquisitions of BES and Peak, as more fully described in Note (2), “Business Combinations.” The maturity dates of the Revolver and the Original Term Loan, on the one hand, and the Second Term Loan, on the other hand, are April 18, 2019 and January 4, 2021, respectively. The Company fully repaid all amounts under the Original Term Loan in 2016.
On September 19, 2016, the Company entered into another amendment to the Credit Agreement (the “Second Amendment”), which, among other things, permits the Company to increase the commitments that may be obtained under the Credit Agreement by the amount of certain prepayments made thereunder. Accordingly, the Credit Agreement provides that the Company may from time to time obtain an increase in the Revolver or obtain additional term loans or both in an aggregate principal amount not to exceed
$125,000
plus the amount of certain prepayments of Credit Facilities (including
$138,438
of prepayments of the Term Loans made by the Company on October 3, 2016) subject to, among other conditions, the arrangement of additional commitments with financial institutions reasonably acceptable to the Company and the administrative agent.
The Revolver carries an unused fee of
0.25%
to
0.35%
per annum and each standby letter of credit issued under the Revolver is subject to a letter of credit fee ranging from
1.50%
to
2.25%
per annum of the average daily maximum amount available to be drawn under the standby letter of credit, in each case, depending on the Company’s consolidated leverage ratio, as calculated quarterly in accordance with the Credit Agreement. The Second Term Loan is subject to amortization of principal of
5.00%
per year of the original loan amount, which is
$3,750
per annum, and payable in equal quarterly installments. Borrowings under the Second Term Loan and Revolver bear interest at floating rates, at the Company’s option, based upon either LIBOR plus a spread of
1.50%
to
2.25%
or a base rate plus a spread of
0.50%
to
1.25%
. The applicable spread is determined quarterly based upon the Company’s consolidated leverage ratio. The interest rate for the outstanding Second Term Loan was
2.5%
on a LIBOR basis as of
December 31, 2016
.
55
The Credit Agreement contains various customary affirmative and negative covenants, including restrictions on incurrence of additional indebtedness, declaration and payment of dividends, dispositions of assets, consolidation into another entity, and allowable investments. Additionally, there are financial covenants based on the Company’s consolidated leverage ratio and interest coverage ratio as calculated in accordance with the Credit Agreement. The payment obligations under the Credit Agreement may be accelerated upon the occurrence of defined events of default. Additionally, the Credit Agreement no longer requires (as was originally set forth in the original Credit Agreement) the Company to make mandatory prepayments under any of the credit facilities provided thereunder with the proceeds of extraordinary receipts and excess cash flow when certain financial conditions were present. The Credit Facilities are secured by substantially all of the assets of the Company and the common stock or equity interests of its domestic subsidiaries.
In connection with obtaining the original
two
Credit Facilities (i.e., the Revolver and the Original Term Loan) in April 2014, the Company incurred
$3,488
in fees paid to lenders and other third parties, which were capitalized and are amortized to interest expense over the term of the original
two
Credit Facilities. In addition, the Company wrote off
$3,113
of unamortized financing fees and original issue discount, which was recorded as loss on debt extinguishment in the accompanying consolidated statement of comprehensive income for the year ended December 31, 2014. In connection with the First Amendment, the Company incurred
$632
in fees paid to lenders and other third parties, of which
$448
was capitalized and amortized to interest expense on a pro rata basis over the remaining term of the Revolver and the term of the Second Term Loan and the remaining amount was recorded as interest expense during the year ended
December 31, 2016
. The Company incurred de minimis costs in connection with the Second Amendment.
The Revolver is available for working capital, capital expenditures, permitted acquisitions and general corporate purposes of the Company. At
December 31, 2016
, with
$10,752
of outstanding letters of credit collateralized by the Revolver, there was
$264,248
of available credit under the Revolver.
(b) The Company
’s
5.125%
Senior Notes Due 2024
On October 3, 2016, the Company completed the issuance and sale of
$325,000
aggregate principal amount of the Notes, which mature on October 1, 2024. Interest on the Notes is fixed at
5.125%
and payable semi-annually in arrears on April 1 and October 1 of each year, commencing April 1, 2017. With the proceeds from the Notes and cash generated from operations, the Company (1) repaid
$131,250
of Original Term Loan indebtedness, (2) repaid
$7,188
of existing Second Term Loan indebtedness, (3) repaid
$182,500
under the Revolver, and (4) paid
$6,113
of fees and expenses related to the issuance and sale of the Notes, which were recorded as a reduction of the notes payable balance and are being amortized to interest expense over the term of the Notes.
The indenture governing the Notes contains covenants that, among other things, restrict the ability of the Company to:
•
sell assets,
•
pay dividends or make other distributions on capital stock or make payments in respect of subordinated indebtedness,
•
make investments,
•
incur additional indebtedness or issue preferred stock,
•
create, or permit to exist, certain liens,
•
enter into agreements that restrict dividends or other payments from restricted subsidiaries,
•
consolidate, merge or transfer all or substantially all of its assets,
•
engage in transactions with affiliates, and
•
create unrestricted subsidiaries.
These covenants are subject to a number of important exceptions and qualifications. The indenture governing the Notes contains affirmative covenants and events of default that are customary for indentures governing high yield securities. The Notes and the related guarantees thereof are not subject to any registration rights agreements.
56
Outstanding debt balances as of
December 31, 2016
and
2015
consisted of the following:
|
As of December 31,
|
|||||||
|
2016
|
2015
|
||||||
|
Revolver
|
$
|
—
|
|
$
|
82,500
|
|
|
|
Original Term Loan
|
—
|
|
136,875
|
|
|||
|
Second Term Loan
|
44,063
|
|
—
|
|
|||
|
Notes
|
325,000
|
|
—
|
|
|||
|
Total debt outstanding
|
369,063
|
|
219,375
|
|
|||
|
Less unamortized discount
|
(6,121
|
)
|
(885
|
)
|
|||
|
Less current portion of notes payable and Revolver
|
(3,750
|
)
|
(37,500
|
)
|
|||
|
Long-term portion of notes payable and Revolver
|
$
|
359,192
|
|
$
|
180,990
|
|
|
Annual principal maturities of the Second Term Loan and the Notes as of
December 31, 2016
are as follows:
|
Year ending December 31, 2017
|
$
|
3,750
|
|
|
Year ending December 31, 2018
|
3,750
|
|
|
|
Year ending December 31, 2019
|
3,750
|
|
|
|
Year ending December 31, 2020
|
3,750
|
|
|
|
Year ending December 31, 2021
|
29,063
|
|
|
|
Thereafter
|
325,000
|
|
|
|
$
|
369,063
|
|
|
(d) Letters of Credit
At
December 31, 2016
, the Company maintained outstanding standby letters of credit totaling
$15,379
as collateral in relation to its professional liability insurance agreements, workers compensation insurance agreements, and a corporate office lease agreement. Of the
$15,379
outstanding letters of credit, the Company has collateralized
$4,627
in cash and cash equivalents and the remaining amount has been collateralized by the Revolver. Outstanding standby letters of credit at
December 31, 2015
totaled
$15,788
.
(9) Retirement Plans
The Company maintains the AMN Services 401(k) Retirement Savings Plan (the “AMN Plan”), which the Company believes complies with the IRC Section 401(k) provisions. The AMN Plan covers all employees that meet certain age and other eligibility requirements. An annual discretionary matching contribution is determined by the Compensation and Stock Plan Committee of the Board of Directors each year. Employer contribution expenses incurred under the AMN Plan were
$5,010
,
$1,618
and
$544
for the years ended
December 31, 2016
,
2015
and
2014
, respectively.
The Company has a deferred compensation plan for certain executives and key employees (the “Plan”). The Plan is not intended to be tax qualified and is an unfunded plan. The Plan is composed of deferred compensation and all related income and losses attributable thereto. Discretionary matching contributions to the Plan are made that vest incrementally so that the employee is fully vested in the match following
five
years of employment with the Company. Under the Plan, participants can defer up to
80%
of their base salary,
90%
of their bonus and
100%
of their vested RSUs or vested PRSUs. An annual discretionary matching contribution is determined by the Compensation and Stock Plan Committee of the Board of Directors each year. Employer contributions under the Plan were
$3,032
,
$974
and
$595
for the years ended
December 31, 2016
,
2015
and
2014
, respectively. In connection with the administration of the Plan, the Company has purchased company-owned life insurance policies insuring the lives of certain officers and key employees. The cash surrender value of these policies was
$32,190
and
$23,005
at
December 31, 2016
and
2015
, respectively. The cash surrender value of these insurance policies is included in other assets in the consolidated balance sheets.
57
(10) Capital Stock
(a) Preferred Stock
The Company has
10,000
shares of preferred stock authorized for issuance in one or more series (including preferred stock designated as Series A Conditional Convertible Preferred Stock), at a par value of
$0.01
per share.
At
December 31, 2016
and
2015
,
no
shares of preferred stock were outstanding.
(b) Treasury Stock
On November 1, 2016, the Company’s Board of Directors approved a share repurchase program under which the Company may repurchase up to
$150,000
of its outstanding common stock. The amount and timing of the purchases will depend on a number of factors including the price of the Company’s shares, trading volume, Company performance, Company liquidity, general economic and market conditions and other factors that the Company’s management believes are relevant. The share repurchase program does not require the purchase of any minimum number of shares and may be suspended or discontinued at any time.
The Company intends to make all repurchases and to administer the plan in accordance with applicable laws and regulatory guidelines, including Rule 10b-18 of the Exchange Act, and in compliance with its debt instruments. Repurchases
may be made from cash on hand, free cash flow generated from the Company’s business or from the Company’s Revolver. Repurchases may be made from time to time through open market purchases or privately negotiated transactions. Repurchases may also be made pursuant to one or more plans established pursuant to Rule 10b5-1 under the Exchange Act, which would permit shares to be repurchased when the Company might otherwise be precluded from doing so under insider trading restrictions.
During the fourth quarter of 2016, the Company repurchased
443
shares of its common stock at an average price of
$29.88
per share, resulting in an aggregate purchase price of
$13,261
.
(11) Share-Based Compensation
(a) Equity Award Plans
Stock Option Plan
The Company established a stock option plan (the “Stock Option Plan”) to provide a means to attract and retain employees.
4,178
options were authorized for issuance to be granted under the Stock Option Plan. On April 12, 2006,
371
shares of common stock reserved for future issuance under the Stock Option Plan were rolled into the Equity Plan, which is discussed below. The Stock Option Plan has expired and
no
further equity awards have been granted from the Stock Option Plan since 2005. As of
December 31, 2016
and
2015
,
no
equity awards were outstanding under it.
Equity Plan
The Company established the AMN Healthcare Equity Plan (as amended or amended and restated from time to time, the “Equity Plan”), which has been approved by the Company’s stockholders. At the time of the Equity Plan’s original adoption in 2006, equity awards, based on the Company’s common stock, could be issued for a maximum of
723
shares plus the number of shares of common stock underlying any grants under the Stock Option Plan (under which there are no longer any outstanding awards) that were forfeited, canceled or terminated (other than by exercise) from and after the effective date of the Equity Plan. Pursuant to the Equity Plan, stock options and stock appreciation rights (“SARs”) granted have a maximum contractual life of
ten
years and have exercise prices that will be determined at the time of grant, which will be no less than fair market value of the underlying common stock on the date of grant. Any shares to be issued under the Equity Plan will be issued by the Company from authorized but unissued common stock or shares of common stock reacquired by the Company. On April 18, 2007, April 9, 2009 and April 18, 2012, the Company amended the Equity Plan, with stockholder approval, to increase the number of shares authorized under the Equity Plan by
3,000
,
1,850
and
2,400
, respectively. At
December 31, 2016
and
2015
, respectively,
1,933
and
2,128
shares of common stock were reserved for future grants under the Equity Plan.
Other Plans
From time to time, the Company grants, and has granted, key employees inducement awards outside of the Equity Plan (collectively, “Other Plans”), which have consisted of SARs, options or RSUs. Although these awards are not made under the Equity Plan, the key terms and conditions of the grant are typically the same as equity awards made under the Equity Plan.
58
Additionally, in February 2014, the Company established the 2014 Employment Inducement Plan, which reserves for issuance
200
shares of common stock for prospective employees of the Company. As of
December 31, 2016
,
200
shares of common stock remained available for future grants under the 2014 Employment Inducement Plan.
(b) Share-Based Compensation
Restricted Stock Units
RSUs and PRSUs (subject to a PRSU being earned) granted under the Equity Plan generally entitle the holder to receive, at the end of a vesting period, a specified number of shares of the Company’s common stock. The following table summarizes RSU and PRSU activity for non-vested awards for the years ended
December 31, 2016
,
2015
and
2014
:
|
Number of Shares
|
Weighted Average
Grant Date
Fair Value per
Share
|
|||||
|
Unvested at January 1, 2014
|
1,637
|
|
$
|
9.73
|
|
|
|
Granted—RSUs
|
361
|
|
$
|
13.76
|
|
|
|
Granted—PRSUs (1)
|
535
|
|
$
|
14.97
|
|
|
|
Vested
|
(838
|
)
|
$
|
8.63
|
|
|
|
Canceled/forfeited/expired
|
(120
|
)
|
$
|
12.16
|
|
|
|
Unvested at December 31, 2014
|
1,575
|
|
$
|
11.95
|
|
|
|
Granted—RSUs
|
203
|
|
$
|
22.43
|
|
|
|
Granted—PRSUs (1)
|
616
|
|
$
|
13.58
|
|
|
|
Vested
|
(1,081
|
)
|
$
|
9.13
|
|
|
|
Canceled/forfeited/expired
|
(76
|
)
|
$
|
15.45
|
|
|
|
Unvested at December 31, 2015
|
1,237
|
|
$
|
16.73
|
|
|
|
Granted—RSUs
|
180
|
|
$
|
32.65
|
|
|
|
Granted—PRSUs (1)
|
361
|
|
$
|
20.88
|
|
|
|
Vested
|
(641
|
)
|
$
|
14.90
|
|
|
|
Canceled/forfeited/expired
|
(62
|
)
|
$
|
22.57
|
|
|
|
Unvested at December 31, 2016
|
1,075
|
|
$
|
22.14
|
|
|
(1) PRSUs granted included both the PRSUs granted during the year at the target amount and the additional shares of prior period granted PRSUs vested during the year in excess of the target shares.
As of
December 31, 2016
, there was
$11,136
unrecognized compensation cost related to non-vested RSUs and PRSUs. The Company expects to recognize such cost over a period of
1.8
years. As of
December 31, 2016
and
2015
, the aggregate intrinsic value of the RSUs and PRSUs outstanding was
$41,317
and
$38,400
, respectively.
Stock Options and SARs
Stock options entitle the holder to purchase, at the end of a vesting period, a specified number of shares of the Company’s common stock at a price per share set at the date of grant. SARs entitle the holder to receive, at the end of a vesting period, shares of the Company’s common stock equal in value to the difference between the exercise price of the SAR, which is set at the date of grant, and the fair market value of the Company’s common stock on the date of exercise.
59
A summary of stock option and SAR activity under the Stock Option Plan and the Equity Plan and Other Plans are as follows:
|
|
Stock Option Plan
|
Equity Plan and Other Plans
|
|||||||||||
|
|
Number
Outstanding
|
Weighted-
Average
Exercise Price
per Share
|
Number
Outstanding
|
Weighted-
Average
Exercise Price
per Share
|
|||||||||
|
Outstanding at December 31, 2013
|
589
|
|
$
|
14.92
|
|
1,096
|
|
$
|
10.78
|
|
|||
|
Granted
|
—
|
|
$
|
—
|
|
—
|
|
$
|
—
|
|
|||
|
Exercised
|
(117
|
)
|
$
|
14.86
|
|
(142
|
)
|
$
|
11.53
|
|
|||
|
Canceled/forfeited/expired
|
(227
|
)
|
$
|
14.94
|
|
(6
|
)
|
$
|
19.69
|
|
|||
|
Outstanding at December 31, 2014
|
245
|
|
$
|
14.93
|
|
948
|
|
$
|
10.61
|
|
|||
|
Granted
|
—
|
|
$
|
—
|
|
—
|
|
$
|
—
|
|
|||
|
Exercised
|
(245
|
)
|
$
|
14.93
|
|
(615
|
)
|
$
|
10.79
|
|
|||
|
Canceled/forfeited/expired
|
—
|
|
$
|
—
|
|
(1
|
)
|
$
|
24.95
|
|
|||
|
Outstanding at December 31, 2015
|
—
|
|
$
|
—
|
|
332
|
|
$
|
10.26
|
|
|||
|
Granted
|
—
|
|
$
|
—
|
|
—
|
|
$
|
—
|
|
|||
|
Exercised
|
—
|
|
$
|
—
|
|
(44
|
)
|
$
|
13.69
|
|
|||
|
Canceled/forfeited/expired
|
—
|
|
$
|
—
|
|
(2
|
)
|
$
|
18.03
|
|
|||
|
Outstanding at December 31, 2016
|
—
|
|
$
|
—
|
|
286
|
|
$
|
9.67
|
|
|||
|
Vested and expected to vest at December 31, 2016
|
—
|
|
$
|
—
|
|
286
|
|
$
|
9.67
|
|
|||
|
Exercisable at December 31, 2016
|
—
|
|
$
|
—
|
|
286
|
|
$
|
9.67
|
|
|||
As of
December 31, 2016
, all SARs were fully vested, and there were
no
stock options outstanding. The total intrinsic value of stock options and SARs exercised was
$877
,
$10,505
and
$770
for
2016
,
2015
and
2014
, respectively. At
December 31, 2016
and
2015
, the total intrinsic value of stock options and SARs outstanding and exercisable was
$8,247
and
$7,013
, respectively.
Share-Based Compensation
Total share-based compensation expense for the years ended
December 31, 2016
,
2015
and
2014
was as follows:
|
|
Years Ended December 31,
|
||||||||||
|
|
2016
|
2015
|
2014
|
||||||||
|
Share-based employee compensation, before tax
|
$
|
11,399
|
|
$
|
10,284
|
|
$
|
7,157
|
|
||
|
Related income tax benefits
|
(4,423
|
)
|
(3,990
|
)
|
(2,783
|
)
|
|||||
|
Share-based employee compensation, net of tax
|
$
|
6,976
|
|
$
|
6,294
|
|
$
|
4,374
|
|
||
(12) Commitments and Contingencies
(a) Legal
From time to time, the Company is involved in various lawsuits, claims, investigations, and proceedings that arise in the
ordinary course of business. These matters typically relate to professional liability, tax, payroll, contract, competitor disputes and employee-related matters and include individual and collective lawsuits, as well as inquiries and investigations by governmental agencies regarding the Company’s employment practices. Additionally, some of the Company’s clients may also become subject to claims, governmental inquiries and investigations, and legal actions relating to services provided by the Company’s healthcare professionals. Depending upon the particular facts and circumstances, the Company may also be subject to indemnification obligations under its contracts with such clients relating to these matters. The Company records a liability when management believes an adverse outcome from a loss contingency is both probable and the amount, or a range, can be reasonably estimated. Significant judgment is required to determine both probability of loss and the estimated amount. The Company reviews its loss contingencies at least quarterly and adjusts its accruals and/or disclosures to reflect the impact of negotiations, settlements, rulings, advice of legal counsel, or other new information, as deemed necessary. During the first
60
quarter of 2014, the Company completed the settlement of a wage and hour class action (and a related action) for an immaterial amount. The most significant matters for which the Company has established loss contingencies are class actions related to wage and hour claims. Management currently believes the probable loss related to these wage and hour claims is not significant and the amount accrued by the Company for such claims is not material as of December 31, 2016. However, losses ultimately incurred for such claims could materially differ from amounts already accrued by the Company.
With regards to outstanding loss contingencies as of December 31, 2016, which are included in accounts payable and accrued expenses in the consolidated balance sheet, the Company believes that such matters will not, either individually or in the aggregate, have a material adverse effect on its business, consolidated financial position, results of operations, or cash flows.
(b) Leases
The Company leases certain office facilities and equipment under various operating leases. The Company recognizes rent expense on a straight-line basis over the lease term. Future minimum lease payments under noncancelable operating leases (with initial or remaining lease terms in excess of one year) as of
December 31, 2016
are as follows:
|
Operating
Leases
|
||||
|
Years ending December 31,
|
||||
|
2017
|
$
|
17,194
|
|
|
|
2018
|
17,037
|
|
||
|
2019
|
16,400
|
|
||
|
2020
|
15,886
|
|
||
|
2021
|
16,019
|
|
||
|
Thereafter
|
82,675
|
|
||
|
Total minimum lease payments
|
$
|
165,211
|
|
|
Rent expense under operating leases was
$18,793
,
$15,940
, and
$14,136
for the years ended
December 31, 2016
,
2015
and
2014
, respectively.
(13) Quarterly Financial Data (Unaudited)
|
|
Year Ended December 31, 2016
|
||||||||||||||||||
|
|
First
Quarter
|
Second
Quarter
|
Third
Quarter
|
Fourth
Quarter
|
Total Year
|
||||||||||||||
|
|
(In thousands, except per share data)
|
||||||||||||||||||
|
Revenue
|
$
|
468,002
|
|
$
|
473,729
|
|
$
|
472,636
|
|
$
|
487,858
|
|
$
|
1,902,225
|
|
||||
|
Gross profit
|
$
|
151,898
|
|
$
|
154,753
|
|
$
|
154,467
|
|
$
|
158,606
|
|
$
|
619,724
|
|
||||
|
Net income
|
$
|
25,869
|
|
$
|
26,322
|
|
$
|
27,296
|
|
$
|
26,351
|
|
$
|
105,838
|
|
||||
|
Net income per share from:
|
|||||||||||||||||||
|
Basic
|
$
|
0.54
|
|
$
|
0.55
|
|
$
|
0.57
|
|
$
|
0.55
|
|
$
|
2.21
|
|
||||
|
Diluted
|
$
|
0.53
|
|
$
|
0.53
|
|
$
|
0.55
|
|
$
|
0.54
|
|
$
|
2.15
|
|
||||
|
|
Year Ended December 31, 2015
|
||||||||||||||||||
|
|
First
Quarter
|
Second
Quarter
|
Third
Quarter
|
Fourth
Quarter
|
Total Year
|
||||||||||||||
|
|
(In thousands, except per share data)
|
||||||||||||||||||
|
Revenue
|
$
|
327,510
|
|
$
|
350,144
|
|
$
|
382,859
|
|
$
|
402,552
|
|
$
|
1,463,065
|
|
||||
|
Gross profit
|
$
|
101,432
|
|
$
|
110,118
|
|
$
|
126,009
|
|
$
|
131,804
|
|
$
|
469,363
|
|
||||
|
Net income
|
$
|
12,209
|
|
$
|
15,870
|
|
$
|
33,647
|
|
$
|
20,165
|
|
$
|
81,891
|
|
||||
|
Net income per share from:
|
|||||||||||||||||||
|
Basic
|
$
|
0.26
|
|
$
|
0.33
|
|
$
|
0.71
|
|
$
|
0.42
|
|
$
|
1.72
|
|
||||
|
Diluted
|
$
|
0.25
|
|
$
|
0.32
|
|
$
|
0.69
|
|
$
|
0.41
|
|
$
|
1.68
|
|
||||
61
|
Item 9.
|
Changes In and Disagreements With Accountants on Accounting and Financial Disclosure
|
None.
|
Item 9A.
|
Controls and Procedures
|
(1) Evaluation of Disclosure Controls and Procedures
We carried out an evaluation, under the supervision and with the participation of our management, including our principal executive officer and principal financial officer, of the effectiveness of our disclosure controls and procedures, as defined in Rules 13a-15(e) and 15d-15(e) of the Exchange Act. Based on that evaluation, our Chief Executive Officer and Chief Financial Officer have concluded that our disclosure controls and procedures as of
December 31, 2016
were effective to ensure that information required to be disclosed by us in reports that we file or submit under the Exchange Act is recorded, processed, summarized and reported within the time periods specified in the SEC’s rules and forms.
(2) Management’s Annual Report on Internal Control over Financial Reporting
Our management is responsible for establishing and maintaining adequate internal control over financial reporting, as such term is defined in Rule 13a-15(f) of the Exchange Act. Under the supervision and with the participation of our management, including our Chief Executive Officer and Chief Financial Officer, we conducted an evaluation of the effectiveness of our internal control over financial reporting based on the framework in
Internal Control—Integrated Framework (2013)
issued by the Committee of Sponsoring Organizations of the Treadway Commission (COSO). Because of its inherent limitations, internal control over financial reporting may not prevent or detect misstatements. Also, projections of any evaluation of effectiveness to future periods are subject to the risk that controls may become inadequate because of changes in conditions, or that the degree of compliance with the policies or procedures may deteriorate. Based on our evaluation under the framework set forth in
Internal Control—Integrated Framework (2013)
, management concluded that our internal control over financial reporting was effective as of
December 31, 2016
.
A registrant may omit an assessment of an acquired business’s internal control over financial reporting from the registrant’s assessment of its internal control; however, such an exclusion may not extend beyond one year from the date of the acquisition, nor may such assessment be omitted from more than one annual management report on internal control over financial reporting. We acquired B.E. Smith, Inc. and its subsidiary (the “acquired entity”) during
2016
, and we excluded from the assessment of the effectiveness of our internal control over financial reporting as of
December 31, 2016
, the acquired entity’s internal control over financial reporting associated with total assets of
$168.7
million (of which
$152.1
million represents goodwill and intangibles included within the scope of the assessment) and total revenues of $108.5 million included in our consolidated financial statements as of and for the year ended
December 31, 2016
.
The effectiveness of our internal control over financial reporting as of
December 31, 2016
has been audited by KPMG LLP, an independent registered public accounting firm, as stated in its report, which we include herein. KPMG’s audit of internal control over financial reporting of the Company also excluded an evaluation of internal control over financial reporting of the acquired entity.
(3) Changes in Internal Control Over Financial Reporting
There were no changes in our internal control over financial reporting that occurred during the quarter ended
December 31, 2016
that have materially affected, or are reasonably likely to materially affect, our internal control over financial reporting.
62
(4) Report of Independent Registered Public Accounting Firm
The Board of Directors and Stockholders
AMN Healthcare Services, Inc.:
We have audited AMN Healthcare Services, Inc. and subsidiaries’ (the Company) internal control over financial reporting as of
December 31, 2016
, based on criteria established in
Internal Control - Integrated Framework (2013)
issued by the Committee of Sponsoring Organizations of the Treadway Commission (COSO). The Company’s management is responsible for maintaining effective internal control over financial reporting and for its assessment of the effectiveness of internal control over financial reporting, included in the accompanying Management’s Annual Report on Internal Control over Financial Reporting. Our responsibility is to express an opinion on the Company’s internal control over financial reporting based on our audit.
We conducted our audit in accordance with the standards of the Public Company Accounting Oversight Board (United States). Those standards require that we plan and perform the audit to obtain reasonable assurance about whether effective internal control over financial reporting was maintained in all material respects. Our audit included obtaining an understanding of internal control over financial reporting, assessing the risk that a material weakness exists, and testing and evaluating the design and operating effectiveness of internal control based on the assessed risk. Our audit also included performing such other procedures as we considered necessary in the circumstances. We believe that our audit provides a reasonable basis for our opinion.
A company’s internal control over financial reporting is a process designed to provide reasonable assurance regarding the reliability of financial reporting and the preparation of financial statements for external purposes in accordance with generally accepted accounting principles. A company’s internal control over financial reporting includes those policies and procedures that (1) pertain to the maintenance of records that, in reasonable detail, accurately and fairly reflect the transactions and dispositions of the assets of the company; (2) provide reasonable assurance that transactions are recorded as necessary to permit preparation of financial statements in accordance with generally accepted accounting principles, and that receipts and expenditures of the company are being made only in accordance with authorizations of management and directors of the company; and (3) provide reasonable assurance regarding prevention or timely detection of unauthorized acquisition, use, or disposition of the company’s assets that could have a material effect on the financial statements.
Because of its inherent limitations, internal control over financial reporting may not prevent or detect misstatements. Also, projections of any evaluation of effectiveness to future periods are subject to the risk that controls may become inadequate because of changes in conditions, or that the degree of compliance with the policies or procedures may deteriorate.
In our opinion, AMN Healthcare Services, Inc. and subsidiaries maintained, in all material respects, effective internal control over financial reporting as of
December 31, 2016
, based on criteria established in
Internal Control - Integrated Framework (2013)
issued by the Committee of Sponsoring Organizations of the Treadway Commission (COSO).
The Company acquired B.E. Smith, Inc. and its subsidiary during
2016
, and management excluded from its assessment of the effectiveness of the Company’s internal control over financial reporting as of
December 31, 2016
, B.E. Smith, Inc. and its subsidiary’s internal control over financial reporting associated with total assets of
$168.7
million (of which
$152.1
million represents goodwill and intangibles included within the scope of the assessment) and total revenue of $108.5 million included in the consolidated financial statements of AMN Healthcare Services, Inc. and subsidiaries as of and for the year ended
December 31, 2016
. Our audit of internal control over financial reporting of AMN Healthcare Services, Inc. and subsidiaries also excluded an evaluation of the internal control over financial reporting of B.E. Smith, Inc. and its subsidiary.
We also have audited, in accordance with the standards of the Public Company Accounting Oversight Board (United States), the consolidated balance sheets of AMN Healthcare Services, Inc. and subsidiaries as of
December 31, 2016
and
2015
, and the related consolidated statements of comprehensive income, stockholders’ equity, and cash flows for each of the years in the three-year period ended
December 31, 2016
, and our report dated
February 17, 2017
expressed an unqualified opinion on those consolidated financial statements.
/s/ KPMG LLP
San Diego, California
February 17, 2017
63
|
Item 9B.
|
Other Information
|
None.
|
Item 10.
|
Directors, Executive Officers and Corporate Governance
|
Information required by this item, other than the information below concerning our Code of Ethics for Senior Financial Officers and stockholder recommended nominations, is incorporated by reference to the Proxy Statement to be distributed in connection with our Annual Meeting of Stockholders currently scheduled to be held on April 19, 2017 (the “2017 Annual Meeting Proxy Statement”) under the headings “Election of Directors—Nominees for the Board of Directors,” “Executive Compensation Disclosure—Non-Director Executive Officers,” “Security Ownership and Other Matters—Section 16(a) Beneficial Ownership Reporting Compliance,” the table set forth in “Corporate Governance—Committees of the Board” identifying, among other things, members of our Board committees, and “Corporate Governance—Committees of the Board.”
We have adopted a Code of Ethics for Senior Financial Officers that applies to our principal executive officer, principal financial officer, and principal accounting officer or any person performing similar functions, which we post on our website in the “Corporate Governance” link located at www.amnhealthcare.com/investors. We intend to publish any amendment to, or waiver from, the Code of Ethics for Senior Financial Officers on our website. We will provide any person, without charge, a copy of such Code of Ethics upon written request, which may be mailed to 12400 High Bluff Drive, Suite 100, San Diego, California 92130, Attn: Corporate Secretary.
There have been no material changes to the procedures by which stockholders may recommend nominees to our Board since we last disclosed information related to such procedures.
|
Item 11.
|
Executive Compensation
|
Information required by this item is incorporated by reference to the 2017 Annual Meeting Proxy Statement under the headings “Compensation, Discussion and Analysis,” “Executive Compensation Disclosure,” “Director Compensation and Stock Ownership Guidelines,” “Corporate Governance—Board Role In Risk Oversight,” “Corporate Governance—Committees of the Board—Compensation Committee—Compensation Committee Interlocks and Insider Participation,” and “Compensation Committee Report.”
|
Item 12.
|
Security Ownership of Certain Beneficial Owners and Management and Related Stockholder Matters
|
Information required by this item is incorporated by reference to the 2017 Annual Meeting Proxy Statement under the headings “Security Ownership and Other Matters—Security Ownership of Certain Beneficial Owners and Management” and “Equity Compensation Plan Information at December 31, 2016.”
|
Item 13.
|
Certain Relationships and Related Transactions, and Director Independence
|
Information required by this item is incorporated by reference to the 2017 Annual Meeting Proxy Statement under the headings “Corporate Governance—Board Policy on Conflicts of Interest and Related Party Transactions,” “Corporate Governance—Director Independence,” and “Corporate Governance—Committees of the Board.”
|
Item 14.
|
Principal Accounting Fees and Services
|
Information required by this item is incorporated by reference to the 2017 Annual Meeting Proxy Statement under the heading “Ratification of the Selection of Independent Registered Public Accounting Firm.”
64
|
Item 15.
|
Exhibits and Financial Statement Schedules
|
(a) Documents filed as part of the report.
(1) Consolidated Financial Statements
Report of Independent Registered Public Accounting Firm
Consolidated Balance Sheets as of
December 31, 2016
and
2015
Consolidated Statements of Comprehensive Income for the years ended
December 31, 2016
,
2015
and
2014
Consolidated Statements of Stockholders’ Equity for the years ended
December 31, 2016
,
2015
and
2014
Consolidated Statements of Cash Flows for the years ended
December 31, 2016
,
2015
and
2014
Notes to Consolidated Financial Statements
(2) Financial Statement Schedules
All schedules have been omitted because the required information is presented in the financial statements or notes thereto, the amounts involved are not significant or the schedules are not applicable.
(3) Exhibits
65
|
Exhibit
Number
|
Description
|
||
|
2.1
|
|
Agreement and Plan of Merger dated as of December 16, 2014 by and among Onward Healthcare, Inc., AMN Healthcare, Inc., Terrell Acquisition Corp., and OGH, LLC (Incorporated by reference to Exhibit 2.1 of the Registrant’s Current Report on Form 8-K dated January 7, 2015, filed with the SEC on January 9, 2015).
|
|
|
2.2
|
|
Stock Purchase Agreement among John D. Smith, Josem Holding, Inc. and AMN Healthcare, Inc. dated November 17, 2015 (Incorporated by reference to Exhibit 2.1 of the Registrant’s Current Report on Form 8-K dated January 4, 2016, filed with the SEC on January 4, 2016).
|
|
|
3.1
|
|
Amended and Restated Certificate of Incorporation of AMN Healthcare Services, Inc. (Incorporated by reference to Exhibit 3.1 of the Registrant’s Annual Report on Form 10-K for the fiscal year ended December 31, 2001, filed with the SEC on March 18, 2002).
|
|
|
3.2
|
|
Seventh Amended and Restated By-laws of AMN Healthcare Services, Inc., effective July 27, 2010 (Incorporated by reference to Exhibit 3.1 of the Registrant’s Quarterly Report on Form 10-Q for the quarter ended June 30, 2010, filed with the SEC on July 30, 2010).
|
|
|
3.3
|
|
Certificate of Designations of Series A Conditional Convertible Preferred Stock (Incorporated by reference to Exhibit 3.1 of the Registrant’s Current Report on Form 8-K dated August 29, 2010, filed with the SEC on September 1, 2010).
|
|
|
4.1
|
|
Specimen Stock Certificate (Incorporated by reference to Exhibit 4.1 of the Registrant’s Annual Report on Form 10-K for the fiscal year ended December 31, 2001, filed with the SEC on March 18, 2002).
|
|
|
4.2
|
|
Indenture, dated as of October 3, 2016, by and among AMN Healthcare, Inc., the guarantors party thereto, and U.S. Bank National Association (Incorporated by reference to Exhibit 4.1 of the Registrant’s Quarterly Report on Form 10-Q for the quarter ended September 30, 2016, filed with the SEC on November 4, 2016).
|
|
|
10.1
|
|
Credit Agreement, dated as of April 18, 2014, by and among AMN Healthcare, Inc., as borrower, AMN Healthcare Services, Inc., AMN Services, LLC, O’Grady-Peyton International (USA), Inc., AMN Staffing Services, LLC, Merritt, Hawkins & Associates, LLC, AMN Healthcare Allied, Inc., Staff Care, Inc., AMN Allied Services, LLC, Rx Pro Health, LLC, Nursefinders, LLC, Linde Health Care Staffing, Inc., and Shiftwise, Inc., as guarantors, the lenders identified on the signature pages thereto, as lenders, and SunTrust Bank, as administrative agent (Incorporated by reference to Exhibit 4.1 of the Registrant’s Quarterly Report on Form 10-Q for the quarter ended June 30, 2014, filed with the SEC on August 1, 2014).
|
|
|
10.2
|
|
First Amendment to Credit Agreement, dated as of January 4, 2016, by and among AMN Healthcare, Inc., as borrower, AMN Healthcare Services, Inc., AMN Services, LLC, O’Grady-Peyton International (USA), Inc., AMN Staffing Services, LLC, Merritt, Hawkins & Associates, LLC, AMN Healthcare Allied, Inc., Staff Care, Inc., AMN Allied Services, LLC, Rx Pro Health, LLC, Nursefinders, LLC, Linde Health Care Staffing, Inc., Shiftwise, Inc., The First String Healthcare, Inc., MillicanSolutions, LLC, Avantas, LLC, Onward Healthcare, LLC, Locum Leaders, Inc., and Medefis, Inc., as guarantors, the lenders identified on the signature pages thereto, as lenders, and SunTrust Bank, as administrative agent (Incorporated by reference to Exhibit 10.2 of the Registrant’s Annual Report on Form 10-K for the year ended December 31, 2015, filed with the SEC on February 24, 2016).
|
|
|
10.3
|
|
Second Amendment to Credit Agreement, dated as of September 19, 2016, by and among the Registrant, AMN
Healthcare, Inc., the subsidiary guarantors party thereto, and SunTrust Bank, as administrative agent
(Incorporated by reference to Exhibit 10.1 of the Registrant’s Current Report on Form 8-K dated September 19,
2016, filed with the SEC on September 23, 2016).
|
|
|
10.4
|
|
Office Lease, dated as of April 2, 2002, between Kilroy Realty, L.P. and AMN Healthcare, Inc. (Incorporated by reference to Exhibit 10.45 of the Registrant’s Registration Statement on Form S-1 (File No. 333-86952), filed with the SEC on April 25, 2002).
|
|
|
10.5
|
|
Third Amendment to Office Lease, dated as of June 30, 2014, between Kilroy Realty, L.P. and AMN Healthcare, Inc. (Incorporated by reference to Exhibit 10.1 of the Registrant’s Quarterly Report on Form 10-Q for the quarter ended June 30, 2014, filed with the SEC on August 1, 2014).
|
|
|
10.6
|
|
AMN Healthcare Equity Plan, as Amended and Restated (Management Contract or Compensatory Plan or Arrangement) (Incorporated by reference to Exhibit 10.1 of the Registrant’s Quarterly Report on Form 10-Q for the quarter ended March 31, 2014, filed with the SEC on May 2, 2014).
|
|
|
10.7
|
|
Form of AMN Healthcare Equity Plan Stock Appreciation Right Agreement—Director (Management Contract or Compensatory Plan or Arrangement).**
|
|
|
10.8
|
|
Form of AMN Healthcare Equity Plan Restricted Stock Unit Agreement—Director (Management Contract or Compensatory Plan or Arrangement).**
|
|
66
|
Exhibit
Number
|
Description
|
||
|
10.9
|
|
Form of AMN Healthcare Equity Plan Stock Appreciation Right Agreement—Officer (Management Contract or Compensatory Plan or Arrangement).**
|
|
|
10.10
|
|
Form of AMN Healthcare Equity Plan Restricted Stock Unit Agreement—Officer (Management Contract or Compensatory Plan or Arrangement).**
|
|
|
10.11
|
|
Form of AMN Healthcare Equity Plan Restricted Stock Unit Agreement—Officer (Management Contract or Compensatory Plan or Arrangement) (Incorporated by reference to Exhibit 10.1 of the Registrant’s Quarterly Report on Form 10-Q for the quarter ended March 31, 2010, filed with the SEC on May 7, 2010).
|
|
|
10.12
|
|
Form of AMN Healthcare Equity Plan Performance Restricted Stock Unit Agreement—Officer (TSR) (Management Contract or Compensatory Plan or Arrangement) (Incorporated by reference to Exhibit 10.1 of the Registrant’s Quarterly Report on Form 10-Q for the quarter ended March 31, 2011, filed with the SEC on May 6, 2011).
|
|
|
10.13
|
|
Form of AMN Healthcare Equity Plan Restricted Stock Unit Agreement—Director (One Year Vesting and Settlement) (Management Contract or Compensatory Plan or Arrangement) (Incorporated by reference to Exhibit 10.2 of the Registrant’s Quarterly Report on Form 10-Q for the quarter ended June 30, 2012, filed with the SEC on August 7, 2012).
|
|
|
10.14
|
|
Form of AMN Healthcare Equity Plan Performance Restricted Stock Unit Agreement—Officer (Adjusted EBITDA Margin) (Management Contract or Compensation Plan or Arrangement) (Incorporated by reference to Exhibit 10.1 of the Registrant’s Quarterly Report on Form 10-Q for the quarter ended March 31, 2013, filed with the SEC on May 3, 2013).
|
|
|
10.15
|
|
Form of AMN Healthcare Equity Plan Restricted Stock Unit Agreement—Officer (Management Contract or Compensatory Plan or Arrangement) (Incorporated by reference to Exhibit 10.2 of the Registrant’s Quarterly Report on Form 10-Q for the quarter ended March 31, 2014, filed with the SEC on May 2, 2014).
|
|
|
10.16
|
|
Form of AMN Healthcare Equity Plan Performance Restricted Stock Unit Agreement—Officer (TSR) (Management Contract or Compensatory Plan or Arrangement) (Incorporated by reference to Exhibit 10.3 of the Registrant’s Quarterly Report on Form 10-Q for the quarter ended March 31, 2014, filed with the SEC on May 2, 2014).
|
|
|
10.17
|
|
Form of AMN Healthcare Equity Plan Restricted Stock Unit Agreement—Director (One Year Vesting with Deferral) (Management Contract or Compensatory Plan or Arrangement) (Incorporated by reference to Exhibit 10.4 of the Registrant’s Quarterly Report on Form 10-Q for the quarter ended March 31, 2014, filed with the SEC on May 2, 2014).
|
|
|
10.18
|
|
Form of AMN Healthcare Equity Plan Performance Restricted Stock Unit Agreement—Officer (TSR) (Management Contract or Compensatory Plan or Arrangement) (Incorporated by reference to Exhibit 10.2 of the Registrant’s Quarterly Report on Form 10-Q for the quarter ended March 31, 2016, filed with the SEC on May 6, 2016).
|
|
|
10.19
|
|
Form of AMN Healthcare Equity Plan Performance Restricted Stock Unit Agreement—Officer (Adjusted EBITDA Margin) (Management Contract or Compensatory Plan or Arrangement) (Incorporated by reference to Exhibit 10.3 of the Registrant’s Quarterly Report on Form 10-Q for the quarter ended March 31, 2016, filed with the SEC on May 6, 2016).
|
|
|
10.20
|
|
Form of AMN Healthcare Equity Plan Restricted Stock Unit Agreement—Officer (Management Contract or Compensatory Plan or Arrangement) (Incorporated by reference to Exhibit 10.4 of the Registrant’s Quarterly Report on Form 10-Q for the quarter ended March 31, 2016, filed with the SEC on May 6, 2016).
|
|
|
10.21
|
|
Form of AMN Healthcare Equity Plan Restricted Stock Unit Agreement—Officer (Management Contract or Compensatory Plan or Arrangement) (Incorporated by reference to Exhibit 10.17 of the Registrant’s Annual Report on Form 10-K for the year ended December 31, 2015, filed with the SEC on February 24, 2016)
|
|
|
10.22
|
|
AMN Healthcare Services, Inc. Senior Management Bonus Plan, as Amended and Restated (Management Contract or Compensatory Plan or Arrangement) (Incorporated by reference to Appendix A of the Registrant’s Definitive Proxy Statement on Schedule 14A, filed on March 9, 2012).
|
|
|
10.23
|
|
The 2005 Amended and Restated Executive Nonqualified Excess Plan of AMN Healthcare, Inc., effective January 1, 2009 (Management Contract or Compensatory Plan or Arrangement) (Incorporated by reference to Exhibit 10.2 of the Registrant’s Quarterly Report on Form 10-Q for the quarter ended September 30, 2008, filed with the SEC on November 7, 2008).
|
|
|
10.24
|
|
Employment Agreement, dated as of May 4, 2005, between AMN Healthcare, Inc. and Susan R. Nowakowski (aka Susan R. Salka) (Management Contract or Compensatory Plan or Arrangement) (Incorporated by reference to Exhibit 10.3 of the Registrant’s Quarterly Report on Form 10-Q for the quarter ended March 31, 2005, filed with the SEC on May 9, 2005).
|
|
67
|
Exhibit
Number
|
Description
|
||
|
10.25
|
|
First Amendment to Employment Agreement, dated as of February 6, 2008, between AMN Healthcare, Inc. and Susan R. Nowakowski (aka Susan R. Salka) (Management Contract or Compensatory Plan or Arrangement).***
|
|
|
10.26
|
|
Executive Severance Agreement between AMN Healthcare, Inc. and Denise L. Jackson, dated February 6, 2008 (Management Contract or Compensatory Plan or Arrangement).***
|
|
|
10.27
|
|
Executive Severance Agreement between AMN Healthcare, Inc. and Ralph Henderson, dated February 6, 2008 (Management Contract or Compensatory Plan or Arrangement).***
|
|
|
10.28
|
|
Executive Severance Agreement between AMN Healthcare, Inc. and Brian M. Scott, effective as of January 24, 2011 (Management Contract or Compensatory Plan or Arrangement) (Incorporated by reference to Exhibit 99.3 of the Registrant’s Current Report on Form 8-K dated January 3, 2011, filed with the SEC on January 5, 2011).
|
|
|
10.29
|
|
Form of Indemnification Agreement—Officer and Director (Incorporated by reference to Exhibit 10.14 of the Registrant’s Annual Report on Form 10-K for the fiscal year ended December 31, 2009, filed with the SEC on March 5, 2010).
|
|
|
21.1
|
|
Subsidiaries of the Registrant.*
|
|
|
23.1
|
|
Consent of Independent Registered Public Accounting Firm.*
|
|
|
31.1
|
|
Certification by Susan R. Salka pursuant to Rule 13a-14(a) of the Securities Exchange Act of 1934.*
|
|
|
31.2
|
|
Certification by Brian M. Scott pursuant to Rule 13a-14(a) of the Securities Exchange Act of 1934.*
|
|
|
32.1
|
|
Certification by Susan R. Salka pursuant to 18 U.S.C. Section 1350, as adopted pursuant to Section 906 of the Sarbanes-Oxley Act of 2002.*
|
|
|
32.2
|
|
Certification by Brian M. Scott pursuant to 18 U.S.C. Section 1350, as adopted pursuant to Section 906 of the Sarbanes-Oxley Act of 2002.*
|
|
|
101.INS
|
|
XBRL Instance Document.*
|
|
|
101.SCH
|
|
XBRL Taxonomy Extension Schema Document.*
|
|
|
101.CAL
|
|
XBRL Taxonomy Extension Calculation Linkbase Document.*
|
|
|
101.DEF
|
|
XBRL Taxonomy Extension Definition Linkbase Document.*
|
|
|
101.LAB
|
|
XBRL Taxonomy Extension Label Linkbase Document.*
|
|
|
101.PRE
|
|
XBRL Taxonomy Extension Presentation Linkbase Document.*
|
|
|
*
|
Filed herewith.
|
|
|
**
|
Incorporated by reference to the applicable exhibit of the Registrant’s Current Report on Form 8-K dated April 12, 2006, filed with the SEC on April 14, 2006.
|
|
|
***
|
Incorporated by reference to the applicable exhibit of the Registrant’s Current Report on Form 8-K dated February 12, 2008, filed with the SEC on February 12, 2008.
|
|
68
SIGNATURES
Pursuant to the requirements of Section 13 or 15(d) of the Securities Exchange Act of 1934, the registrant has duly caused this report to be signed on its behalf by the undersigned, thereunto duly authorized.
|
AMN HEALTHCARE SERVICES, INC.
|
||
|
/
S
/ S
USAN
R. S
ALKA
|
||
|
Susan R. Salka
President and Chief Executive Officer
|
||
Date:
February 17, 2017
Pursuant to the requirements of the Securities Exchange Act of 1934, this report has been signed below by the following persons on behalf of the registrant and in the capacities indicated and on
February 17, 2017
.
|
/
S
/ S
USAN
R. S
ALKA
|
|
Susan R. Salka
Director, President and Chief Executive Officer
(Principal Executive Officer)
|
|
/
S
/ B
RIAN
M. S
COTT
|
|
Brian M. Scott
Chief Accounting Officer,
Chief Financial Officer and Treasurer
(Principal Accounting and Financial Officer)
|
|
/
S
/ D
OUGLAS
D. W
HEAT
|
|
Douglas D. Wheat
Director and Chairman of the Board
|
|
/
S
/ M
ARK
G. F
OLETTA
|
|
Mark G. Foletta
Director
|
|
/
S
/ R. J
EFFREY
H
ARRIS
|
|
R. Jeffrey Harris
Director
|
|
/
S
/ M
ICHAEL
M.E. J
OHNS
|
|
Michael M.E. Johns
Director
|
|
/
S
/ M
ARTHA
H. M
ARSH
|
|
Martha H. Marsh
Director
|
|
/
S
/ A
NDREW
M. S
TERN
|
|
Andrew M. Stern
Director
|
|
/
S
/ P
AUL
E. W
EAVER
|
|
Paul E. Weaver
Director
|
69
TABLE OF CONTENTS
Part IItem 1. BusinessItem 1A. Risk FactorsItem 1B. Unresolved Staff CommentsItem 2. PropertiesItem 3. Legal ProceedingsItem 4. Mine Safety DisclosuresPart IIItem 5. Market For Registrant S Common Equity, Related Stockholder Matters and Issuer Purchases Of Equity SecuritiesItem 6. Selected Financial DataItem 7. Management S Discussion and Analysis Of Financial Condition and Results Of OperationsItem 7A. Quantitative and Qualitative Disclosures About Market RiskItem 8. Financial Statements and Supplementary DataItem 9. Changes in and Disagreements with Accountants on Accounting and Financial DisclosureItem 9A. Controls and ProceduresItem 9B. Other InformationPart IIIItem 10. Directors, Executive Officers and Corporate GovernanceItem 11. Executive CompensationItem 12. Security Ownership Of Certain Beneficial Owners and Management and Related Stockholder MattersItem 13. Certain Relationships and Related Transactions, and Director IndependenceItem 14. Principal Accounting Fees and ServicesPart IVItem 15. Exhibits and Financial Statement Schedules