AMERIPRISE FINANCIAL INC
10-Ks and 10-Qs
|
|
|
|
|
|
|
|
|
|
|
|
|
|
|
|
|
|
|
|
|
|
|
|
|
|
|
|
|
|
|
|
|
|
|
|
|
|
|
|
|
|
|
|
|
|
|
|
|
|
|
|
|
|
|
|
UNITED STATES
SECURITIES AND EXCHANGE COMMISSION
WASHINGTON, D.C. 20549
FORM 10-K
|
x
|
ANNUAL REPORT PURSUANT TO SECTION 13 OR 15(d) OF THE SECURITIES EXCHANGE ACT OF 1934
|
For the Fiscal Year Ended
December 31, 2017
OR
|
o
|
TRANSITION REPORT PURSUANT TO SECTION 13 OR 15(d) OF THE SECURITIES EXCHANGE ACT OF 1934
|
For the Transition Period from_______________________to_______________________
Commission File No. 1-32525
AMERIPRISE FINANCIAL, INC.
(Exact name of registrant as specified in its charter)
|
Delaware
|
|
13-3180631
|
|
(State or other jurisdiction of incorporation or organization)
|
(I.R.S. Employer Identification No.)
|
|
|
1099 Ameriprise Financial Center, Minneapolis, Minnesota
|
55474
|
|
|
(Address of principal executive offices)
|
(Zip Code)
|
|
Registrant’s telephone number, including area code: (612) 671-3131
Securities registered pursuant to Section 12(b) of the Act:
|
Title of each class
|
|
Name of each exchange on which registered
|
|
Common Stock (par value $.01 per share)
|
The New York Stock Exchange, Inc.
|
|
Securities registered pursuant to Section 12(g) of the Act: None
Indicate by check mark if the registrant is a well-known seasoned issuer, as defined in Rule 405 of the Securities Act. Yes
x
No
o
Indicate by check mark if the registrant is not required to file reports pursuant to Section 13 or Section 15(d) of the Exchange Act. Yes
o
No
x
Indicate by check mark whether the registrant (1) has filed all reports required to be filed by Section 13 or 15(d) of the Securities
Exchange Act of 1934 during the preceding 12 months (or for such shorter period that the registrant was required to file such
reports), and (2) has been subject to such filing requirements for the past 90 days. Yes
x
No
o
Indicate by check mark whether the registrant has submitted electronically and posted on its corporate Web site, if any, every
Interactive Data File required to be submitted and posted pursuant to Rule 405 of Regulation S-T (§ 232.405 of this chapter)
during the preceding 12 months (or for such shorter period that the registrant was required to submit and post such files). Yes
x
No
o
Indicate by check mark if disclosure of delinquent filers pursuant to Item 405 of Regulation S-K is not contained herein, and will not
be contained, to the best of registrant’s knowledge, in definitive proxy or information statements incorporated by reference in Part III of this Form 10-K or any amendment to this Form 10-K.
o
|
Indicate by check mark whether the registrant is a large accelerated filer, an accelerated filer, a non-accelerated filer, smaller reporting company, or an emerging growth company. See the definitions of “large accelerated filer,” “accelerated filer,” “smaller reporting company,” and “emerging growth company” in Rule 12b-2 of the Exchange Act.
|
||
|
Large Accelerated Filer
x
|
Accelerated Filer
o
|
|
|
Non-Accelerated Filer
o
(Do not check if a smaller reporting company)
|
Smaller reporting company
o
|
|
|
Emerging growth company
o
|
||
|
If an emerging growth company, indicate by check mark if the registrant has elected not to use the extended transition period for complying with any new or revised financial accounting standards provided pursuant to Section 13(a) of the Exchange Act.
o
|
||
Indicate by check mark whether the registrant is a shell company (as defined in Rule 12b-2 of the Exchange Act). Yes
o
No
x
The aggregate market value, as of June 30, 2017, of voting shares held by non-affiliates of the registrant was approximately $19.1 billion.
Indicate the number of shares outstanding of each of the registrant’s classes of common stock, as of the latest practicable date.
|
Class
|
|
Outstanding at February 9, 2018
|
|
|
Common Stock (par value $.01 per share)
|
146,332,164 shares
|
||
DOCUMENTS INCORPORATED BY REFERENCE
Part III: Portions of the registrant’s Proxy Statement to be filed with the Securities and Exchange Commission in connection with the Annual Meeting of Shareholders to be held on April 25, 2018 (“Proxy Statement”).
AMERIPRISE FINANCIAL, INC.
FORM 10-K
INDEX
|
PART I.
|
||
|
Item 1. Business
|
||
|
Item 1A. Risk Factors
|
||
|
Item 1B. Unresolved Staff Comments
|
||
|
Item 2. Properties
|
||
|
Item 3. Legal Proceedings
|
||
|
Item 4. Mine Safety Disclosures
|
||
|
PART II.
|
||
|
Item 5. Market for Registrant’s Common Equity, Related Stockholder Matters and Issuer Purchases of Equity Securities
|
||
|
Item 6. Selected Financial Data
|
||
|
Item 7. Management’s Discussion and Analysis of Financial Condition and Results of Operations
|
||
|
Item 7A. Quantitative and Qualitative Disclosures About Market Risk
|
||
|
Item 8. Financial Statements and Supplementary Data
|
||
|
Item 9. Changes in and Disagreements With Accountants on Accounting and Financial Disclosure
|
||
|
Item 9A. Controls and Procedures
|
||
|
Item 9B. Other Information
|
||
|
PART III.
|
||
|
Item 10. Directors, Executive Officers and Corporate Governance
|
||
|
Item 11. Executive Compensation
|
||
|
Item 12. Security Ownership of Certain Beneficial Owners and Management and Related Stockholder Matters
|
||
|
Item 13. Certain Relationships and Related Transactions, and Director Independence
|
||
|
Item 14. Principal Accountant Fees and Services
|
||
|
PART IV.
|
||
|
Item 15. Exhibits and Financial Statement Schedules
|
||
|
Item 16. Form 10-K Summary
|
||
|
Signatures
|
||
|
Schedule I - Condensed Financial Information of Registrant
|
||
2
Overview
Ameriprise Financial, Inc. is a diversified financial services company with a more than 120 year history of providing solutions to help clients confidently achieve their financial objectives. Ameriprise is a holding company incorporated in Delaware that primarily engages in business through its subsidiaries. Accordingly, references to “Ameriprise,” “Ameriprise Financial,” the “Company,” “we,” “us,” and “our” may refer to Ameriprise Financial, Inc. exclusively, to our entire family of companies, or to one or more of our subsidiaries. Our headquarters is located at 55 Ameriprise Financial Center, Minneapolis, Minnesota 55474. We also maintain executive offices in New York City.
We are America’s leader in financial planning and a leading global financial institution with $897 billion in assets under management and administration as of December 31, 2017. We offer a broad range of products and services designed to achieve the financial objectives of individual and institutional clients. Our strategy is centered on helping our clients confidently achieve their goals by providing advice and by managing and protecting their assets and income. We utilize two go-to-market approaches in carrying out this strategy: Wealth Management and Asset Management.
Wealth Management
Our wealth management capabilities are centered on the long-term, personal relationships between our clients and our financial advisors (our “advisors”). Through our advisors, we offer financial planning, products and services designed to be used as solutions for our clients’ cash and liquidity, asset accumulation, income, protection, and estate and wealth transfer needs. The financial product solutions we offer through our advisors include both our own products and services and the products of other companies. Our advisor network is the primary channel through which we offer our own life and disability income insurance and annuity products and services. Our focus on personal relationships, as demonstrated by our exclusive
Confident Retirement
®
approach to financial planning, allows us to address the evolving financial and retirement-related needs of our clients. Over the years we have evolved our target market to move more upmarket as we respond to the needs of our clients. We currently view our primary target market segment as the mass affluent and affluent (which we define as households with investable assets of more than $100,000), and increasingly those with $500,000 to $5,000,000 in investable assets.
Our network of approximately 9,900 advisors is the primary means through which we engage in our wealth management activities. We offer our advisors training, tools, leadership, marketing programs and other field and centralized support to assist them in serving their clients. Our nationally recognized brand and practice vision, local marketing and field support, integrated operating platform, practice expansion and succession opportunities and comprehensive set of products and solutions constitute a compelling value proposition for financial advisors, as evidenced by our strong advisor retention rate and our ability to attract and retain experienced and productive advisors. We continuously invest in and develop capabilities and tools designed to maximize advisor productivity and client satisfaction.
We are in a compelling position to capitalize on significant demographic and market trends driving increased demand for financial advice and solutions. In the U.S., the ongoing transition of baby boomers into retirement continues to drive demand for financial advice and solutions. In addition, the amount of investable assets held by mass affluent and affluent households (our target market) has grown and accounts for over half of U.S. investable assets. We believe our differentiated financial planning model, broad range of products and solutions, and demonstrated financial strength throughout the economic and market uncertainty of recent years, will help us capitalize on these trends and best serve our clients.
Asset Management
Our asset management capabilities (represented by the
Columbia Threadneedle Investments
®
brand) are global in scale. We offer a broad spectrum of investment advice and products to individual, institutional and high-net worth investors. These investment products are primarily provided through third parties, though we also provide our asset management products through our advisor channel. Our underlying asset management philosophy is based on delivering consistently strong, competitive investment performance. The quality and breadth of our asset management capabilities are demonstrated by 114 of our mutual funds being rated as four- and five-star funds by Morningstar.
We are positioned to continue to grow our assets under management and strengthen our asset management offerings to existing and new clients. Our asset management capabilities are well positioned to address mature markets in the U.S. and Europe. We also have the capability to leverage our existing strengths in order to effectively expand into new global and emerging markets. In the past few years, we have expanded beyond our traditional strengths in the U.S. and UK to gather assets in Continental Europe, Asia, Australia, the Middle East, South America and Africa. In addition, we continue to pursue opportunities to leverage the collective capabilities of our global asset management business in order to enhance our current range of investment solutions, develop new solutions and investment management strategies that are responsive to client demand in an increasingly complex marketplace and maximize the distribution capabilities of our global business.
Financial markets and macroeconomic conditions have had and will continue to have a significant impact on our operating and performance results. In addition, the business and regulatory environment in which we operate is subject to elevated uncertainty and
3
substantial and frequent change. To succeed, we expect to continue focusing on our key strategic objectives and obtaining operational and strategic leverage from our core capabilities. The success of these and other strategies may be affected by the factors discussed below in Item 1A of this Annual Report on Form 10-K - “Risk Factors”, and other factors as discussed herein.
The financial results from the businesses underlying our go-to-market approaches are reflected in our five operating segments:
|
•
|
Advice & Wealth Management;
|
|
•
|
Asset Management;
|
|
•
|
Annuities;
|
|
•
|
Protection; and
|
|
•
|
Corporate & Other.
|
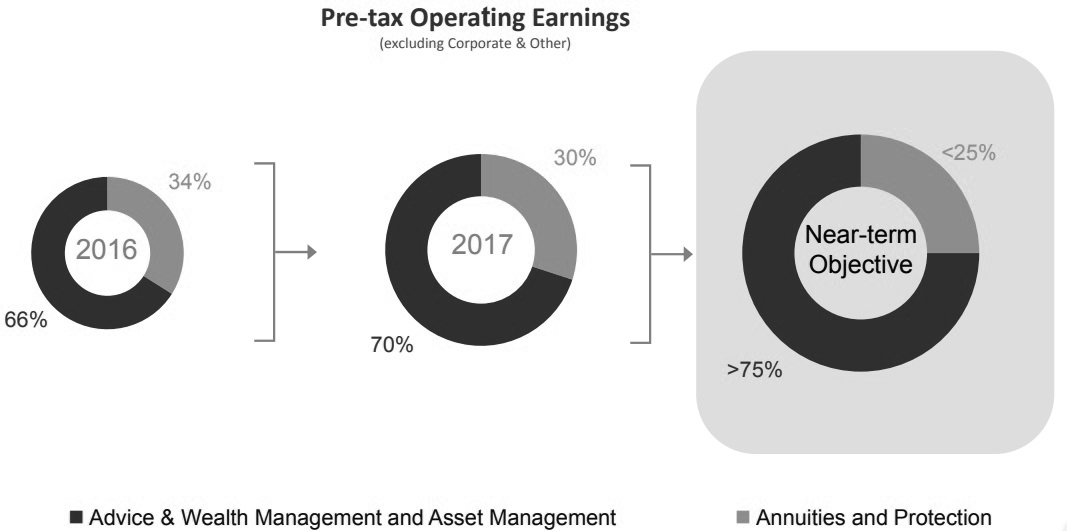
As a diversified financial services firm, we believe our ability to gather assets across the enterprise is best measured by our assets under management and administration metric. At December 31, 2017, we had $897.0 billion in assets under management and administration compared to $787.4 billion as of December 31, 2016. For a more detailed discussion of assets under management and administration see “Management’s Discussion and Analysis of Financial Condition and Results of Operations” included in Part II, Item 7 of this Annual Report on Form 10-K. The following chart shows our current business mix through the contributions of each segment to our pretax operating earnings (excluding Corporate & Other segment) as well as a historical comparison that reflects how we have executed on our strategy to shift our business mix toward lower capital, fee-based business that are higher growth areas in Advice & Wealth Management and Asset Management.
Our Principal Brands
We utilize multiple brands for the products and services offered by our businesses. We believe that using distinct brands for these products and services allows us to differentiate them in the marketplace.

|
We use the
Ameriprise Financial
®
brand as our enterprise brand, as well as the name of our advisor network and certain of our retail products and services. The retail products and services that use the
Ameriprise Financial
brand include those that we provide through our advisors (e.g., financial planning, investment advisory accounts and retail brokerage services) and products and services that we market directly to consumers or through affinity groups (e.g., personal auto and home insurance).
|

|
Columbia Threadneedle Investments
®
brand is our global brand that represents the combined capabilities, resources and reach of Columbia Management and Threadneedle. This brand reinforces the strength of both firms in their established markets of the UK, Europe and the U.S. and helps us grow our presence in key markets including Asia Pacific, Latin America, Africa and the Middle East.
|
4

|
We use our
RiverSource
®
brand for our annuity and protection products issued by the RiverSource Life companies, including our life and disability income insurance products.
|
History and Development
Our company has a more than 120 year history of providing solutions to help clients confidently achieve their financial objectives. Our earliest predecessor company, Investors Syndicate, was founded in 1894 to provide face-amount certificates to consumers with a need for conservative investments. By 1937, Investors Syndicate had expanded its product offerings through Federal Housing Authority mortgages, and later, mutual funds, by establishing Investors Mutual, one of the pioneers in the mutual fund industry. In 1949, Investors Syndicate was renamed Investors Diversified Services, Inc., or IDS. In 1957, IDS added life insurance products, and later, annuity products, through IDS Life Insurance Company (now known as “RiverSource Life Insurance Company”). In 1972, IDS began to expand its network by delivering investment products directly to clients of unaffiliated financial institutions. IDS also introduced its comprehensive financial planning processes to clients, integrating the identification of client needs with the products and services to address those needs in the 1970s, and it introduced fee-based planning in the 1980s.
In 1979, IDS became a wholly owned subsidiary of Alleghany Corporation pursuant to a merger. In 1983, our company was formed as a Delaware corporation in connection with American Express’ acquisition of IDS Financial Services from Alleghany Corporation in 1984. We changed our name to “American Express Financial Corporation” (“AEFC”) and began marketing our products and services under the American Express brand in 1994. To provide retail clients with a more comprehensive set of products and services, we significantly expanded our offering of non-proprietary mutual funds in the late 1990s. And in 2003, we acquired the business of Threadneedle Asset Management Holdings.
On September 30, 2005, American Express consummated a distribution of the shares of AEFC to American Express shareholders, at which time we became an independent, publicly traded company and changed our name to “Ameriprise Financial, Inc.” In 2008, we completed the acquisitions of H&R Block Financial Advisors, Inc. and J. & W. Seligman & Co. Incorporated. In 2010, we completed the acquisition of the long-term asset management business of Columbia Management from Bank of America, which significantly enhanced the scale and performance of our retail mutual fund and institutional asset management businesses. In 2016, we completed the acquisition of Emerging Global Advisors, LLC, a registered investment advisor and provider of strategic beta portfolios based on emerging markets. In 2017, we acquired Investment Professionals, Inc. (“IPI”) (an independent broker-dealer specializing in the on-site delivery of investment programs for financial institutions, including banks and credit unions that gives us scale entry into the bank channel) and Lionstone Partners, LLC (“Lionstone Investments”) (a leading national real estate investment firm, specializing in investment strategies based upon proprietary analytics that expands our real estate capabilities). Our inorganic growth has allowed us to significantly enhance the scale, performance, and product offerings of our brokerage, financial planning, retail mutual funds and institutional asset management business in order to best serve our clients.
In 2006, we sold our large-scale retirement plan recordkeeping business to Wachovia Bank, N.A. (now Wells Fargo Bank, N.A.). We initiated the disposition of our institutional trust and custody business in 2008 to J.P. Morgan Chase Bank, N.A. and completed that restructuring in early 2009. In 2011, we completed the sale of Securities America Financial Corporation and its subsidiaries (“Securities America”) to Ladenburg Thalmann Financial Services, Inc.
In January 2013, we completed the conversion of our federal savings bank subsidiary, Ameriprise Bank, FSB (“Ameriprise Bank”), to a limited powers national trust bank now known as Ameriprise National Trust Bank. In connection with this conversion, we terminated deposit-taking and credit-originating activities of Ameriprise Bank.
5
Our Organization
The following is a depiction of the organizational structure for our company, showing the primary subsidiaries through which we operate our businesses. The current legal entity names are provided for each subsidiary.
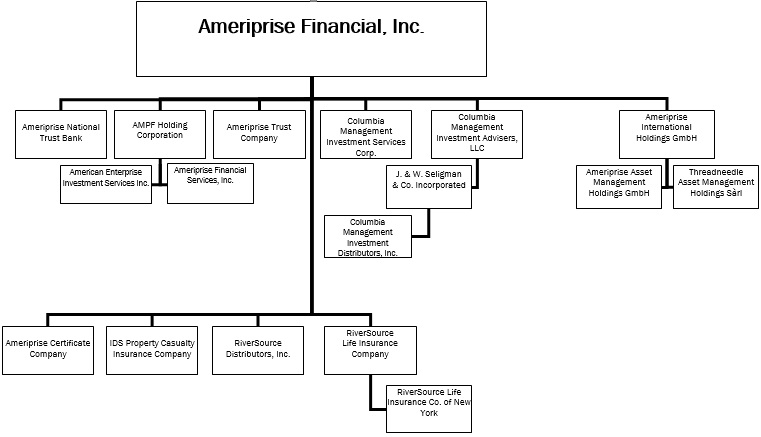
The following is a brief description of the business conducted by each subsidiary noted above.
|
Subsidiary Name
|
Description of Business
|
|
Ameriprise International Holdings GmbH
|
A holding company based in Switzerland for various companies engaged in our overseas business, including our Threadneedle group of companies (defined below)
|
|
Threadneedle Asset Management Holdings Sàrl
|
A holding company based in Luxembourg for the EMEA region group of companies that provide investment management products and services
|
|
Ameriprise Asset Management Holdings GmbH
|
A holding company based in Switzerland for our non-EMEA region group of companies that provide investment management products and services. We refer to the group of companies in this entity and Threadneedle Asset Management Holdings Sarl as “Threadneedle” and Threadneedle is our primary provider of non-U.S. investment management products and services.
|
|
Columbia Management Investment Advisers, LLC
(“Columbia Management”)
|
The investment adviser for the majority of funds in the
Columbia Management
family of funds (“
Columbia Management
®
funds”) and to U.S. and non-U.S. institutional accounts and private funds
|
|
J. & W. Seligman & Co. Incorporated
(“Seligman”)
|
A holding company for Columbia Management Investment Distributors, Inc. and certain other subsidiaries within our Asset Management segment
|
|
Columbia Management Investment Distributors, Inc.
|
Broker-dealer subsidiary that serves as the principal underwriter and distributor for
Columbia Management
funds
|
|
Columbia Management Investment Services Corp.
|
A transfer agent that processes client transactions for
Columbia Management
funds and Ameriprise face-amount certificates
|
|
AMPF Holding Corporation
|
A holding company for certain of our retail brokerage and advisory subsidiaries, including AFSI (defined below) and AEIS (defined below)
|
6
|
American Enterprise Investment Services Inc.
(“AEIS”)
|
Our registered clearing broker-dealer subsidiary, brokerage transactions for accounts introduced by AFSI are executed, cleared and settled through AEIS
|
|
Ameriprise Financial Services, Inc.
(“AFSI”)
|
A registered broker-dealer and registered investment adviser, and our primary financial planning and retail distribution subsidiary
|
|
RiverSource Distributors, Inc.
(“RiverSource Distributors”)
|
A broker-dealer subsidiary that serves as the principal underwriter and/or distributor for our
RiverSource
annuities and insurance products sold through AFSI and third-party channels
|
|
RiverSource Life Insurance Company
(“RiverSource Life”)
|
Conducts its insurance and annuity business in states other than New York
|
|
RiverSource Life Insurance Co. of New York
(“RiverSource Life of NY”)
|
Conducts its insurance and annuity businesses in the State of New York.
RiverSource Life of NY is a wholly owned subsidiary of RiverSource Life. We refer to RiverSource Life and RiverSource Life of NY as the “RiverSource Life companies.”
|
|
IDS Property Casualty Insurance Company
(“IDS Property Casualty” or “Ameriprise Auto & Home”)
|
Provides personal auto, home and umbrella insurance products. Ameriprise Insurance Company, a wholly owned subsidiary of IDS Property Casualty, is also licensed to provide these products.
|
|
Ameriprise Certificate Company
|
Issues a variety of face-amount certificates
|
|
Ameriprise Trust Company
(“ATC”)
|
Provides trust services to individuals and businesses
|
|
Ameriprise National Trust Bank
(formerly Ameriprise Bank, FSB)
|
Offers personal trust and related services
|
Our Segments - Advice & Wealth Management
Our Advice & Wealth Management segment provides financial planning and advice, as well as full-service brokerage services, primarily to retail clients through our financial advisors. These services are centered on long-term, personal relationships between our advisors and our clients and focus on helping clients confidently achieve their financial goals. Our financial advisors provide a distinctive approach to financial planning and have access to a broad selection of both affiliated and non-affiliated products to help clients meet their financial needs.
A
significant portion of revenues in this segment is fee-based, driven by the level of client assets, which is impacted by both market movements and net asset flows. We also earn net investment income on owned assets primarily from certificate products. This segment earns revenues (distribution fees) for providing non-affiliated products and intersegment revenues (distribution fees) for providing our affiliated products and services to our retail clients. Intersegment expenses for this segment include expenses for investment management services provided by our Asset Management segment. All intersegment activity is eliminated in our consolidated results.
Our Financial Advisor Platform
We provide financial planning, advice and brokerage services to clients through our nationwide financial advisor network. Advisors can choose to affiliate with us in multiple ways, with each affiliation offering different levels of support and compensation. The affiliation options are:
|
•
|
Employee Advisors (Ameriprise Advisor Group).
Under this option, an advisor is an employee of our company and receives a higher level of support, including leadership, training, office space and staff support. We pay compensation that is competitive with other employee advisor models, which is generally lower than that of our franchisee advisors given the higher level of support we provide our employee advisors. Employee advisors are also employed in the Ameriprise Advisor Center (“AAC”), our dedicated platform for remote-based sales and service to Ameriprise retail customers through a team model.
|
|
•
|
Franchisee Advisors (Ameriprise Franchise Group).
Under this option, an advisor is an independent contractor franchisee who affiliates with our company and has the right to use the Ameriprise brand. We pay our franchisee advisors a higher payout rate than our employee advisors as they are responsible for paying their own overhead, staff compensation and other business expenses. In addition, our franchisee advisors pay a franchise association fee and other fees in exchange for the support we offer and the right to use our brand name. The support we offer to our franchisee advisors includes generalist and specialist leadership support, technology platforms and tools, training and marketing programs.
|
|
•
|
Bank Channel Advisors (Ameriprise Financial Institutions Group)
. Our acquisition of IPI added a new capability where we specialize in the on-site delivery of investment programs for financial institutions including banks and credit unions. Within this channel, we have different types of relationships with our financial institution partners as well as a variety of ways for advisors to affiliate with us.
|
We
are committed to providing our advisors with the resources and support necessary to manage and grow their practices. Our platform offers advisors (and therefore clients) the flexibility of operating on a commission-based brokerage basis as well as on a fee-based advisory basis. Advisors have access to training and materials reflecting our differentiated financial planning model and
7
Confident Retirement
planning approach, our nationally recognized brand and
“Be Brilliant
®
”
advertising campaign, local marketing support capabilities and our full range of proprietary and non-proprietary product solutions. Our demonstrated financial strength as well as our dedication to our clients also benefits our advisor practices. We expect to continue to invest in the capabilities of and support provided to our advisor platform, with the goal of continuing to best serve our clients, increase advisor productivity and improve our ability to attract and retain advisors.
Our
nationwide advisor network consisted of approximately 9,900 advisors as of December 31, 2017, which includes approximately
2,200
employee advisors and advisors in our bank channel as well as approximately 7,700 independent franchisees or employees or contractors of franchisees. Of these advisors (and excluding AAC advisors and the bank channel advisors acquired in our recent acquisition of IPI), roughly 54% have been with us for more than 10 years, with an average tenure of over 20 years. Among advisors who have been with us for more than 10 years, we have a retention rate of nearly 95%. We believe our strong advisor retention rate, as well as our ability to recruit experienced advisors, speaks to the value proposition we offer our advisors.
Our
advisors offer clients a diversified set of cash and liquidity management, asset accumulation, income, protection, and estate and wealth transfer products and services, as well as a broad selection of financial products from other unaffiliated companies (as described below).
Brokerage and Investment Advisory Services
Individual and Family Financial Services
Our
personalized financial planning approach is designed to focus on all aspects of our clients’ finances. After understanding our clients’ needs, our advisors seek to identify solutions to address those needs across four cornerstones: cash and liabilities, investments, protection and taxes. We believe this approach helps our clients build a solid financial foundation, persevere through difficult economies and challenging markets, and ultimately achieve their financial goals. We offer a broad array of products and services in each of these categories, including those carrying the Ameriprise Financial, Columbia Management or RiverSource name, as well as solutions offered by unaffiliated firms.
Our
advisors deliver financial solutions to our advisory clients principally by building long-term personal relationships through financial planning that is responsive to clients’ evolving needs, priorities and goals, in part through our exclusive
Confident Retirement
approach, which involves a comprehensive assessment of retirement income sources and assets, a client’s plans and goals for retirement and an analysis of what is needed to fund the four principal types of expenses and liabilities encountered during retirement: covering essentials, ensuring lifestyle, preparing for the unexpected and leaving a legacy. Once we identify a financial planning client’s objectives, we then recommend a solution set consisting of actions and offer products to address these objectives with clients accepting what they determine to be an appropriate range and level of market risk. Our financial planning relationships with our clients are characterized by an ability to understand their specific needs, which enables us to help them meet those needs, achieve high overall client satisfaction and retention, hold more products in their accounts and increase our assets under management.
Our
financial planning clients pay a fee for the receipt of financial planning services. This fee is based on the complexity of a client’s financial and life situation and his or her advisor’s experience. Some of our clients may elect to pay a consolidated, asset-based advisory fee for financial planning and managed account services and administration. If clients elect to implement their financial plan with our company, we and our advisors generally receive a sales commission and/or sales load and other revenues for the products that they purchase from us. These commissions, sales loads and other revenues are separate from, and in addition to, the financial planning and advisory fees we and our advisors may receive.
Brokerage
and Other Products and Services
We
offer our retail and institutional clients a variety of brokerage and other investment products and services.
Our
Ameriprise ONE
®
Financial Account is a single integrated financial management brokerage account that enables clients to access a single cash account to fund a variety of financial transactions, including investments in mutual funds, individual securities, alternative investments, cash products and margin and securities-based lending.
We
provide securities execution and clearing services for our retail and institutional clients through our registered broker-dealer subsidiaries. Clients can use our online brokerage service to purchase and sell securities, obtain proprietary and independent research and information about a wide variety of securities, and use self-directed asset allocation and other financial planning tools. We offer exchange traded mutual funds, 529 plans, public non-exchange traded real estate investment trusts, structured notes, private equity and other alternative investments issued by unaffiliated companies. We also offer trading and portfolio strategy services across a number of fixed income categories, including treasuries, municipals, corporate, mortgage- and asset-backed securities on both a proprietary and agency basis.
From
time-to-time, Ameriprise may participate in syndicate offerings of closed-end funds and preferred securities. Syndicates are groups of investment banks and broker-dealers that jointly underwrite and distribute new security offerings to the investing public. Our clients may purchase for their own account the closed-end fund shares and preferred stock of such primary offerings in which we participate. In addition, qualified clients may purchase certain privately placed securities as distributed through Ameriprise.
Fee
-based Investment Advisory Accounts
In
addition to purchases of mutual funds and other securities on a stand-alone basis, clients may purchase mutual funds and other securities in connection with investment advisory fee-based account programs or services. We currently offer both discretionary and
8
non-discretionary investment advisory accounts. In a discretionary advisory account, we (or an unaffiliated investment advisor) choose the underlying investments in the portfolio on behalf of the client, whereas in a non-discretionary advisory account, clients choose the underlying investments in the portfolio based on their financial advisor’s recommendation. Investors in discretionary and non-discretionary advisory accounts generally pay a fee (for investment advice and other services) based on the assets held in that account as well as any related fees or costs associated with the underlying securities held in that account. A significant portion of our affiliated mutual fund sales are made through advisory accounts. Client assets held in affiliated mutual funds in an advisory account generally produce higher revenues to us than client assets held in affiliated mutual funds on a stand-alone basis because, as noted above, we receive an investment advisory fee based on the asset values of the assets held in an advisory account in addition to revenues we normally receive for investment management and/or distribution of the funds included in the account.
We
offer several types of investment advisory accounts. For example, we sponsor (i) Ameriprise Strategic Portfolio Service (“SPS”) Advantage, a non-discretionary investment advisory account service, (ii) SPS - Advisor, a discretionary investment advisory account service, (iii) Ameriprise Select Separate Accounts (a separately managed account (“SMA”) program), a discretionary investment advisory account service through which clients invest in strategies managed by affiliated and non-affiliated investment managers, and (iv)
Active Portfolios
®
investments, a discretionary investment advisory account service that offers a number of strategic target allocations based on different risk profiles and tax sensitivities. Additionally, we offer discretionary investment advisory account services (Vista Separate Accounts, Investor Separate Accounts and Access Separate Accounts) through which clients may invest in SMAs, mutual funds and exchange traded funds. We also offer a discretionary investment advisory account service as an accommodation program where client accounts are held and serviced by a third-party asset management provider and its affiliates.
Mutual
Fund Offerings (Unaffiliated and Affiliated)
In
addition to the
Columbia Management
family of funds (discussed below in “Our Segments - Asset Management - Product and Service Offerings - U.S. Registered Funds”), we offer mutual funds from approximately 160 unaffiliated mutual fund families representing more than 2,200 mutual funds on our brokerage platform and as part of our investment advisory accounts to provide our clients a broad choice of investment products. In 2017, retail sales of other companies’ mutual funds accounted for the substantial majority of our total retail mutual fund sales.
Mutual
fund families of other companies generally pay us a portion of the revenue generated from the sales of those funds and from the ongoing management of fund assets attributable to our clients’ ownership of shares of those funds. These payments enable us to offer a broad and robust product set to our clients and provide beneficial client services, tools and infrastructure such as our website and online brokerage platform. We also receive administrative services fees from most mutual funds sold through our advisor network.
Insurance
and Annuities
We
offer insurance and annuities issued by the RiverSource Life companies (discussed below in “Business - Our Segments - Annuities” and in “Business - Our Segments - Protection”). The
RiverSource
insurance solutions available to our retail clients include universal life insurance, indexed universal life insurance, variable universal life insurance, traditional term life insurance and disability income insurance.
RiverSource
annuities include fixed annuities and fixed index annuities, as well as variable annuities that allow our clients to choose from a number of underlying investment options, including volatility management options, and to purchase certain guaranteed benefit riders. In addition to
RiverSource
insurance and annuity products, our advisors offer products of unaffiliated carriers on a limited basis, including variable annuities, life insurance and long term care insurance products issued by a select number of unaffiliated insurance companies. Our affiliate IPI currently offers certain additional fixed and variable insurance and annuity products available only through the bank channel.
We
receive a portion of the revenue generated from the sale of life and disability insurance policies of unaffiliated insurance companies. We are paid distribution fees on annuities sales of unaffiliated insurance companies based on a portion of the revenue generated from such sales and asset levels. These insurance companies may also pay us an administrative service fee in connection with the sale of their products.
Banking
Products
While
we have changed our banking operations and products in recent years (as discussed above in “Business - History and Development”), we continue to offer consumer deposit and credit products through relationships with well-known and respected financial services companies. In connection with the sale of the Ameriprise Bank credit card account portfolio to Barclays in 2012, we entered into a co-branding agreement with Barclays pursuant to which Barclays continues to issue
Ameriprise
-branded credit cards. In addition, the cash management features of the
Ameriprise ONE
Financial Account remain supported by our brokerage platform, and our clients continue to have access to a variety of other cash solutions, including Ameriprise Certificates, FDIC-insured Brokered CDs issued by third-party banks and deposits placed at third-party banks through Ameriprise Insured Money Market Account (AIMMA) brokerage sweep accounts.
Ameriprise
National Trust Bank provides personal trust, custodial, agency and investment management services to help meet estate and wealth transfer needs of our advisors’ individual and corporate clients. The performance of such personal trust services may involve our investment products. Ameriprise National Trust Bank generally receives an asset-based fee for investment advice and other services based on assets managed or custodied, as well as related fees and costs.
Face
-Amount Certificates
We
issue different types of face-amount certificates through Ameriprise Certificate Company, a wholly-owned subsidiary of
9
Ameriprise Financial. Ameriprise Certificate Company is registered as an investment company under the Investment Company Act of 1940 (“Investment Company Act”). Owners of our certificates invest funds and are entitled to receive at maturity or at the end of a stated term, a determinable amount of money equal to their aggregate investments in the certificate plus interest at rates we determine, less any withdrawals and early withdrawal penalties. For certain types of certificate products, the rate of interest is calculated in whole or in part based on any upward movement in a broad-based stock market index up to a maximum return, where the maximum is a fixed rate for a given term, but can be changed at our discretion for prospective terms.
At
December 31, 2017, we had $6.4 billion in total certificate reserves underlying our certificate products. Our earnings are based upon the difference, or “spread,” between the interest rates credited to certificate holders and the interest earned on the certificate assets invested. A portion of these earnings is used to compensate the various affiliated entities that provide management, administrative and other services to our company for these products. In times of weak performance in the equity markets, certificate sales are generally stronger.
Financial
Wellness Program
We
provide workplace financial planning and educational programs to employees of major corporations, small businesses and school district employees through our Financial Wellness Program. In addition, we provide training and support to financial advisors working on-site at company locations to present educational seminars, conduct one-on-one meetings and participate in client educational events. We also provide financial advice service offerings, such as financial planning and executive financial services, tailored to discrete employee segments.
Strategic
Alliances and Other Marketing Arrangements
We
use strategic marketing alliances, local marketing programs for our advisors, and on-site workshops through our Business Alliances group to generate new clients for our financial planning and other financial services. An important aspect of our strategy is to create alliances that help us generate new financial services clients within our target market segment - the mass affluent and affluent, and increasingly those with $500,000 to $5,000,000 in investable assets. Our alliance arrangements are generally for a limited duration of one to five years with an option to renew. Additionally, these types of marketing arrangements typically provide that either party may terminate the agreements on short notice, usually within sixty days. We compensate our alliance partners for providing opportunities to market to their clients.
Our Segments - Asset Management
Our
Asset Management segment provides investment management and advice and investment products to retail, high net worth and institutional clients on a global scale through Columbia Threadneedle Investments.
Columbia
Management primarily provides products and services in the U.S., and Threadneedle primarily provides products and services internationally. As noted above, we refer to the group of companies in Ameriprise Asset Management Holdings GmbH and Threadneedle Asset Management Holdings Sarl as “Threadneedle.” “Columbia Threadneedle Investments” refers to both Columbia Management and Threadneedle and reflects the global manner in which we think about and operate our asset management business in line with the
Columbia Threadneedle Investments
brand. We provide U.S. retail clients with products through unaffiliated third-party financial institutions and through our Advice & Wealth Management segment, and we provide institutional products and services through our institutional sales force. Retail products for non-U.S. retail investors are primarily distributed through third-party financial institutions and unaffiliated financial advisors. Retail products include U.S. mutual funds and their non-U.S. equivalents, exchange-traded funds (“ETFs”) and variable product funds underlying insurance and annuity separate accounts. Institutional asset management services are designed to meet specific client objectives and may involve a range of products, including those that focus on traditional asset classes, separately managed accounts, collateralized loan obligations (“CLOs”), hedge fund or alternative strategies, collective funds and property funds. CLOs, hedge fund or alternative strategies and certain private funds are often classified as alternative assets. Our Asset Management segment also provides all intercompany asset management services for Ameriprise Financial subsidiaries. The fees for such services are reflected within the Asset Management segment results through intersegment transfer pricing. Intersegment expenses for this segment include distribution expenses for services provided by our Advice & Wealth Management, Annuities and Protection segments. All intersegment activity is eliminated in our consolidated results.
Revenues
in the Asset Management segment are primarily earned as fees based on managed asset balances, which are impacted by market movements, net asset flows, asset allocation and product mix. We may also earn performance fees from certain accounts where investment performance meets or exceeds certain pre-identified targets. At December 31, 2017, our Asset Management segment had $494.6 billion in managed assets worldwide.
Managed
assets include managed external client assets and managed owned assets. Managed external client assets include client assets for which we provide investment management services, such as the assets of the
Columbia Threadneedle Investments
fund families and the assets of institutional clients. Managed external client assets also include assets managed by sub-advisers we select. Our external client assets are not reported on our Consolidated Balance Sheets, although certain investment funds marketed to investors may be consolidated at certain times. See Note 2 to our Consolidated Financial Statements included in Part II, Item 8 of this Annual Report on Form 10-K for additional information on consolidation principles. Managed owned assets include certain assets on our Consolidated Balance Sheets (such as the assets of the general account and the variable product funds held in the separate accounts of our life insurance subsidiaries) for which the Asset Management segment provides management services and receives management
10
fees. For additional details regarding our assets under management and administration, see “Management’s Discussion and Analysis of Financial Condition and Results of Operations” included in Part II, Item 7 of this Annual Report on Form 10-K.
Investment
Management Capabilities
The
investment management activities of Columbia Threadneedle Investments are conducted through investment management teams located in multiple locations, including Boston, Chicago, Houston, Kuala Lumpur, Los Angeles, London, Minneapolis, New York, Menlo Park, Portland and Singapore. Each investment management team may focus on particular investment strategies, asset types, products and on services offered and distribution channels utilized. Within the global asset management business, we deploy our investment teams across multiple jurisdictions pursuant to sub-advisory and personnel sharing arrangements on an intercompany basis.
Our
investment management capabilities span a broad range of asset classes and investment styles. The portfolios underlying our product and service offerings may focus on providing solutions to investors through one or more U.S. or non-U.S. equity, fixed income, bank loan, property, multi-asset allocation, alternative (including real estate and liquid alternatives) or other asset classes, and the strategies utilized in the management of such portfolios varies depending on the needs and desired outcomes or objectives of individual and institutional investors. We continually assess these capabilities to help ensure our ability to provide product and services offerings that are responsive to the evolving needs of our clients.
Product and Service Offerings
We
offer a broad spectrum of investment management and advice and products to individual, institutional and high-net worth investors. In an effort to address changing market conditions and the evolving needs of investors, we may from time to time develop and offer new retail and institutional investment products with new and/or innovative investment strategies, including U.S. mutual funds and their non-U.S. equivalents, ETFs, separately managed accounts, hedge or alternative funds and other private funds, CLOs, and collective funds. The following is an overview of our Asset Management offerings.
U.S
. Registered Funds
We
provide investment advisory, distribution and other services to the
Columbia Management
family of funds. The
Columbia Management
family of funds includes retail mutual funds, exchange-listed ETFs and U.S. closed-end funds and variable product funds. Retail mutual funds are available through unaffiliated third-party financial institutions and the
Ameriprise
®
financial advisor network. Variable product funds are available as underlying investment options in variable annuity and variable life insurance products, including
RiverSource
®
products. The
Columbia Management
family of funds includes domestic and international equity funds, fixed income funds, cash management funds, balanced funds, specialty funds, absolute return and other alternative funds and asset allocation funds, including fund-of-funds, with a variety of investment objectives. The
Columbia Management
family of funds also uses sub-advisers to diversify the product offerings it makes available to investors on its variable product platform. At December 31, 2017, our U.S. retail mutual funds, ETFs and U.S. closed-end funds had total managed assets of $160.5 billion in 141 funds. The variable insurance trust funds (“VIT Funds”) that we manage had total managed assets at December 31, 2017 of $76.5 billion in 70 funds.
Columbia
Management serves as investment manager for most of our U.S. mutual funds as well as our exchange-listed ETFs and U.S. closed-end funds. Columbia Wanger Asset Management, LLC (“Columbia Wanger”), a subsidiary of Columbia Management, also serves as investment manager for certain funds, which are included in the totals noted in the preceding paragraph. In addition, several of our subsidiaries perform related services for the funds, including distribution, accounting, administrative and transfer agency services. Columbia Management and Columbia Wanger perform investment management services pursuant to contracts with the U.S. registered funds that are subject to renewal by the fund boards within two years after initial implementation, and thereafter, on an annual basis.
We earn management fees for managing the assets of the
Columbia Management
family of mutual funds based on the underlying asset values. We also earn fees by providing related services to the
Columbia Management
family of funds.
Non
-U.S. Funds
Threadneedle
offers a fund product range that includes different risk-return options across regions, markets, asset classes and product structures, which include retail funds that are similar to U.S. mutual funds. These funds are marketed to non-U.S. persons and the majority are often referred to as UCITS products (Undertakings for Collective Investment in Transferable Securities). UCITS and other funds offered by Threadneedle typically are structured as Open Ended Investment Companies (“OEICs”) in the UK, Société d'investissement à Capital Variable (“SICAVs”) in Luxembourg, as well as unit trusts. Threadneedle also sponsors, manages and offers UK property funds that invest in UK real estate. The majority of our non-U.S. fund offerings are registered in and distributed across multiple jurisdictions. For example, our OEICs are offered in many jurisdictions outside of the UK and a majority of our non-UK client AUM is invested in our OEICs; however, we also may have a SICAV equivalent or close equivalent to our OEICs. At December 31, 2017, our non-U.S. retail funds had total managed assets of $50.8 billion in 182 funds.
Threadneedle
Asset Management Ltd. serves as investment manager for most of our non-U.S. fund products and earns management fees based on underlying asset values for managing the assets of these funds. Certain Threadneedle affiliates also earn fees by providing ancillary services to the funds. In addition, certain non-U.S. funds or portions of the portfolios underlying such funds may receive sub-advisory services, including services provided by both Columbia Threadneedle Investments personnel and other unaffiliated advisers.
11
Separately
Managed Accounts
We provide investment management services to a range of clients globally, including pension, profit-sharing, employee savings, sovereign wealth funds and endowment funds, accounts of large- and medium-sized businesses and governmental clients, as well as the accounts of high-net-worth individuals and smaller institutional clients, including tax-exempt and not-for-profit organizations. Our services include investment of funds on a discretionary or non-discretionary basis and related services including trading, cash management and reporting. We offer various fixed income, equity and alternative investment strategies for our institutional clients with separately managed accounts. Columbia Management and Threadneedle distribute products of the other under the
Columbia Threadneedle Investments
brand, including Threadneedle’s offering various investment strategies of Columbia Management to non-U.S. clients and Columbia Management’s offering of certain investment strategies of Threadneedle to U.S. clients.
For
our investment management services, we generally receive fees based on the market value of managed assets pursuant to contracts the client can terminate on short notice. Clients may also pay us fees based on the performance of their portfolio. At December 31, 2017, within our
Columbia Threadneedle Investments
asset management business we managed a total of $133.6 billion in assets under this range of services.
Management
of Owned Assets
We
provide investment management services and recognize management fees for certain assets on our Consolidated Balance Sheets, such as the assets held in the general account of our RiverSource Life companies and assets held by Ameriprise Certificate Company. Our fixed income team manages the general account assets to produce a consolidated and targeted rate of return on investments based on a certain level of risk. Our fixed income and equity teams also manage separate account assets. The Asset Management segment’s management of owned assets for Ameriprise Financial subsidiaries is reviewed by the boards of directors and staff functions of the applicable subsidiaries consistent with regulatory investment requirements. At December 31, 2017, the Asset Management segment managed $36.7 billion of owned assets.
Management
of Collateralized Loan Obligations (“CLOs”)
Columbia
Threadneedle Investments has a dedicated team of investment professionals who provide collateral management services to special purpose vehicles which primarily invest in syndicated bank loans and issue multiple tranches of securities collateralized by the assets of each pool to provide investors with various maturity and credit risk characteristics. For collateral management of CLOs, we earn fees based on the par value of assets and, in certain instances, we may also receive performance-based fees. At December 31, 2017, we managed $4.8 billion of assets related to CLOs.
Private
Funds
We
also provide investment management and related services to private, pooled investment vehicles organized as limited partnerships, limited liability companies or foreign (non-U.S.) entities. These funds are currently exempt from registration under the Investment Company Act under either Section 3(c)(1) or Section 3(c)(7) or related interpretative relief and are organized as U.S. and non-U.S. funds. These funds are subject to local regulation in the jurisdictions where they are formed or marketed. For investment management services, we generally receive fees based on the market value of assets under management, and we may also receive performance-based fees. As of December 31, 2017, we managed $6.4 billion in private fund assets.
Lionstone
Investments, a subsidiary
of Columbia Management, also serves as investment manager for certain private funds (in addition to separate accounts), which are included in the totals noted in the preceding paragraph.
Ameriprise
Trust Company - Collective Funds and Separately Managed Accounts
Collective
funds are investment funds sponsored by ATC (our Minnesota-chartered trust company); these funds are exempt from registration with the Securities and Exchange Commission (“SEC”) and offered to certain qualified institutional clients such as retirement, pension and profit-sharing plans. Columbia Management currently serves as investment adviser to ATC with respect to a series of ATC collective funds covering a broad spectrum of investment strategies for which ATC serves as trustee. ATC receives fees for its investment management services to the collective funds and Columbia Management receives fees from ATC pursuant to an agreement with ATC for the investment advisory services provided by Columbia Management. The fees payable to ATC and Columbia Management are generally based upon a percentage of assets under management. In addition to its collective funds, ATC serves as investment manager to separately managed accounts for qualified institutional clients.
As
of December 31, 2017, we managed $6.3 billion of ATC Funds and separate accounts for ATC clients. This amount does not include the
Columbia Management
family of funds held in other retirement plans because these assets are included under assets managed for institutional and retail clients and within the “Product and Service Offerings - U.S. Registered Funds” section above.
Sub
-advised Accounts
In
addition, we act as sub-adviser for certain U.S. and non-U.S. funds, private banking individually managed accounts, common trust funds and other portfolios sponsored or advised by other firms. As with our affiliated funds, we earn management fees for these sub-advisory services based on the underlying asset value of the funds and accounts we sub-advise. As of December 31, 2017, we managed nearly $19 billion in assets in a sub-advisory capacity.
Distribution
We
maintain distribution teams and capabilities that support the sales, marketing and support of the products and services of our global asset management business. These distribution activities are generally organized into two major categories: retail distribution and
12
institutional/high net worth distribution.
Retail
Distribution
Columbia
Management Investment Distributors, Inc. acts as the principal underwriter and distributor of our
Columbia Management
family of funds. Pursuant to distribution agreements with the funds, we offer and sell fund shares on a continuous basis and pay certain costs associated with the marketing and selling of shares. We earn commissions for distributing the
Columbia Management
funds through sales charges (front-end or back-end loads) on certain classes of shares and distribution (12b-1) and servicing-related fees based on a percentage of fund assets, and receive intersegment allocation payments. This revenue is impacted by overall asset levels and mix of the funds.
Columbia
Management
fund shares are sold through both our Advice & Wealth Management segment and through unaffiliated third-party financial intermediaries, including U.S. Trust and Bank of America from whom we acquired Columbia Management in 2010. Fees and reimbursements paid to such intermediaries may vary based on sales, redemptions, asset values, asset allocation, product mix, and marketing and support activities provided by the intermediary. Intersegment distribution expenses for services provided by our Advice & Wealth Management Segment are eliminated in our consolidated results.
Threadneedle
funds are sold primarily through financial intermediaries and institutions, including banks, life insurance companies, independent financial advisers, wealth managers and platforms offering a variety of investment products. Threadneedle also distributes directly to certain clients. Various Threadneedle affiliates serve as the distributors of these fund offerings and are authorized to engage in such activities in numerous countries across Europe, the Middle East, the Asia-Pacific region and Africa. Certain
Threadneedle
fund offerings, such as its UCITS products, may be distributed on a cross-border basis while others are distributed exclusively in local markets.
Institutional
and High Net Worth Distribution
We
offer separately managed account services and certain funds to high net worth clients and to a variety of institutional clients, including pension plans, employee savings plans, foundations, sovereign wealth funds, endowments, corporations, banks, trusts, governmental entities, high-net-worth individuals and not-for-profit organizations. We provide investment management services for insurance companies, including our insurance subsidiaries. We also provide, primarily through ATC and one of our broker-dealer subsidiaries, a variety of services for our institutional clients that sponsor retirement plans. We have dedicated institutional and sub-advisory sales teams that market directly to such institutional clients. We concentrate on establishing strong relationships with institutional clients and leading global and national consultancy firms across North America, Europe, the Middle East, Asia and Australia.
Our Segments - Annuities
Our Annuities segment provides
RiverSource
variable and fixed annuity products to individual clients. Our solutions in this segment and our Protection segment help us deliver on our
Confident Retirement
approach as well as provide certain products to unaffiliated advisors and financial institutions.
The RiverSource Life companies provide variable annuity products through our advisors, and our fixed annuity products are distributed through both affiliated and unaffiliated advisors and financial institutions. These products are designed to help individuals address their asset accumulation and income goals. Revenues for our variable annuity products are primarily earned as fees based on underlying account balances, which are impacted by both market movements and net asset flows. Revenues for our fixed deferred annuity products are primarily earned as net investment income on assets supporting fixed account balances, with profitability significantly impacted by the spread between net investment income earned and interest credited on the fixed account balances. We also earn net investment income on owned assets supporting reserves for immediate annuities with a non-life contingent feature and for certain guaranteed benefits offered with variable annuities and on capital supporting the business. Revenues for our immediate annuities with a life contingent feature are earned as premium revenue. Intersegment revenues for this segment reflect fees paid by our Asset Management segment for marketing support and other services provided in connection with the availability of VIT Funds under the variable annuity contracts. Intersegment expenses for this segment include distribution expenses for services provided by our Advice & Wealth Management segment, as well as expenses for investment management services provided by our Asset Management segment. All intersegment activity is eliminated in our consolidated results.
Our annuity products include deferred variable and fixed annuities as well as immediate annuities. The relative proportion between fixed and variable annuity sales is generally driven by the relative performance of the equity and fixed income markets. Fixed sales are generally stronger when yields available in the fixed income markets are relatively high than when yields are relatively low. Variable sales are generally stronger in times of superior performance in equity markets than in times of weak performance in equity markets. The relative proportion between fixed and variable annuity sales is also influenced by product design and other factors. In addition to the revenues we generate on these products, we also receive fees charged on assets allocated to our separate accounts to cover administrative costs and a portion of the management fees from the underlying investment accounts in which assets are invested, as discussed below under “Variable Annuities.” Investment management performance is critical to the profitability of our
RiverSource
annuity business.
13
Variable Annuities
A variable annuity provides a contractholder with investment returns linked to underlying investment accounts of the contractholder’s choice. The underlying investment account options may include the VIT Funds previously discussed (see “Business - Our Segments - Asset Management - Product and Service Offerings - U.S. Registered Funds,” above), as well as variable portfolio funds offered through unaffiliated companies.
Contract purchasers can choose to add optional benefits to their contracts for an additional fee, including but not limited to, certain guaranteed minimum death benefits (individually, “GMDB”), a guaranteed minimum withdrawal benefit (“GMWB”) and a guaranteed minimum accumulation benefit (“GMAB”). Approximately 99% of RiverSource Life's overall variable annuity assets include an optional GMDB and approximately 62% of RiverSource Life's overall variable annuity assets include an optional GMWB or GMAB. In general, these features can help protect contractholders and beneficiaries from a shortfall in death benefits, accumulation value or lifetime income due to a decline in the value of their underlying investment accounts.
The general account assets of our life insurance subsidiaries support the contractual obligations under the guaranteed benefit the Company offers (see “Business - Our Segments - Asset Management - Product and Service Offerings - Management of Owned Assets” above). As a result, we bear the risk that protracted under-performance of the financial markets could result in guaranteed benefit payments being higher than what current account values would support. Our exposure to risk from guaranteed benefits generally will increase when equity markets decline. Similarly, our guaranteed benefit reserves will generally increase when interest rates decline.
RiverSource
variable annuities provide us with fee-based revenue in the form of mortality and expense risk fees, marketing support and administrative fees, fees charged for optional benefits and features elected by the contractholder, and other contract charges. We receive marketing support payments from the VIT Funds underlying our variable annuity products as well as Rule 12b-1 distribution and servicing-related fees from the VIT Funds and the underlying funds of other companies. In addition, we receive marketing support payments from other companies’ funds included as investment options in our
RiverSource
variable annuity products.
Fixed Annuities
RiverSource
fixed deferred annuity products provide a contractholder with contract value that increases by a fixed or indexed interest rate. We periodically reset rates at our discretion subject to certain contract terms establishing guaranteed minimum interest crediting rates. Our earnings from fixed deferred annuities are based upon the spread between rates earned on assets purchased with fixed deferred annuity deposits and the rates at which interest is credited to our
RiverSource
fixed deferred annuity contracts. New contracts issued provide guaranteed minimum interest rates in compliance with state laws. Immediate annuity products provide a contractholder a guaranteed fixed income payment for life or the term of the contract.
Distribution
Our RiverSource Distributors subsidiary is a registered broker-dealer that serves both as the principal underwriter and distributor of
RiverSource
variable and fixed annuities through AFSI and as the distributor of fixed annuities through third-party channels such as banks and broker-dealer networks. Our advisors are the largest distributors of
RiverSource
annuity products, although they can offer variable annuities from selected unaffiliated insurers as well.
In 2017, we had total sales for fixed annuity products through third-party channels of $9 million. As of December 31, 2017, we had distribution agreements for
RiverSource
fixed annuity products in place with more than 110 third-party firms.
Liabilities and Reserves for Annuities
We maintain adequate financial reserves to cover the risks associated with guaranteed benefit provisions added to variable annuity contracts in addition to liabilities arising from fixed and variable annuity base contracts. You can find a discussion of liabilities and reserves related to our annuity products in Part II, Item 7A of this Annual Report on Form 10-K - “Quantitative and Qualitative Disclosures About Market Risk”, as well as in Note 2, Note 10, Note 11 and Note 16 to our Consolidated Financial Statements included in Part II, Item 8 of this Annual Report on Form 10-K.
Financial Strength Ratings
Our insurance company subsidiaries that issue
RiverSource
annuity products receive ratings from independent rating organizations. Ratings are important to maintain public confidence in our insurance subsidiaries and our protection and annuity products. For a discussion of the financial strength ratings of our insurance company subsidiaries, see the “Our Segments - Protection - Financial Strength Ratings” section, below.
Our Segments - Protection
Our Protection segment provides a variety of products to address the protection and risk management needs of our retail clients, including life, disability income and property casualty insurance. These products are designed to provide a lifetime of solutions that allow clients to protect income, grow assets and give to loved ones or charity.
Life and disability income products are primarily provided through our advisors. Our property casualty products are sold primarily through affinity relationships. We issue insurance policies through our life insurance subsidiaries and the Property Casualty companies
14
(as defined below under “Ameriprise Auto & Home Insurance Products”). The primary sources of revenues for this segment are premiums, fees and charges we receive to assume insurance-related risk. We earn net investment income on owned assets supporting insurance reserves and capital supporting the business. We also receive fees based on the level of assets supporting variable universal life separate account balances. This segment earns intersegment revenues from fees paid by our Asset Management segment for marketing support and other services provided in connection with the availability of VIT Funds under the variable universal life contracts. Intersegment expenses for this segment include distribution expenses for services provided by our Advice & Wealth Management segment, as well as expenses for investment management services provided by our Asset Management segment. All intersegment activity is eliminated in consolidation.
RiverSource
Insurance Products
Through the RiverSource Life companies, we issue universal life insurance, indexed universal life insurance, variable universal life insurance, traditional life insurance and disability income insurance. Universal life insurance is a form of permanent life insurance characterized by flexible premiums, flexible death benefits and unbundled pricing factors (i.e., mortality, interest and expenses). Variable universal life insurance combines the premium and death benefit flexibility of universal life with underlying fund investment flexibility and the risks associated therewith. Traditional life insurance refers to whole and term life insurance policies. Traditional life insurance typically pays a specified sum to a beneficiary upon death of the insured for a fixed premium. We also offer our clients various riders and alternatives, such as an accelerated benefit rider for chronic illness on our new permanent insurance products and a universal life insurance product with long term care benefits.
Our
sales of
RiverSource
individual life insurance in 2017, as measured by scheduled annual premiums, lump sum and excess premiums and single premiums, consisted of 82% universal life, 16% variable universal life and 2% traditional life. Our RiverSource Life companies issue only non-participating life insurance policies that do not pay dividends to policyholders from the insurer’s earnings.
Assets
supporting policy values associated with fixed account life insurance products, as well as those assets associated with fixed account investment options under variable insurance products (collectively referred to as the “fixed accounts”), are part of the RiverSource Life companies’ general accounts. Under fixed accounts, the RiverSource Life companies bear the investment risk. More information on the RiverSource Life companies’ general accounts is found under “Business - Our Segments - Asset Management - Product and Service Offerings - Management of Owned Assets” above.
Variable
Universal Life Insurance
Variable
universal life insurance provides life insurance coverage along with investment returns linked to underlying investment accounts of the policyholder’s choice. Investment options may include VIT Funds discussed above, Portfolio Navigator and Portfolio Stabilizer funds of funds, an index-linked option, as well as variable portfolio funds offered through unaffiliated companies.
Universal
Life Insurance and Traditional Whole Life Insurance
Universal
life and traditional whole life insurance policies do not subject the policyholder to the investment risks associated with variable universal life insurance.
RiverSource
universal life insurance products provide life insurance coverage and cash value that increases by a fixed interest rate. The rate is periodically reset at the discretion of the issuing company subject to certain policy terms relative to minimum interest crediting rates. Certain universal life policies offered by RiverSource Life provide secondary guarantee benefits. The secondary guarantee ensures that, subject to specified conditions, the policy will not terminate and will continue to provide a death benefit even if there is insufficient policy value to cover the monthly deductions and charges.
RiverSource
indexed universal life insurance (“IUL”) provides lifetime insurance protection and asset growth through index-linked interest crediting. IUL is similar to universal life insurance in that it provides life insurance coverage and cash value that increases as a result of credited interest as well as a minimum guaranteed credited rate of interest.
We
previously discontinued new sales of traditional whole life insurance, however, we continue to service existing policies. Our in-force traditional whole life insurance policies combine a death benefit with a cash value that generally increases gradually over a period of years.
Term
Life Insurance
Term life insurance provides a death benefit, but it does not build up cash value. The policyholder chooses the term of coverage with guaranteed premiums at the time of issue. During the chosen term, we cannot raise premium rates even if claims experience deteriorates. At the end of the chosen term, coverage may continue with higher premiums until the maximum age is attained, or the policy expires with no value.
Disability
Income Insurance
Disability
income insurance provides monthly benefits to individuals who are unable to earn income either at their occupation at time of disability (“own occupation”) or at any suitable occupation (“any occupation”) for premium payments that are guaranteed not to change. Depending upon occupational and medical underwriting criteria, applicants for disability income insurance can choose “own occupation” and “any occupation” coverage for varying benefit periods. In some states, applicants may also choose various benefit
15
provisions to help them integrate individual disability income insurance benefits with Social Security or similar benefit plans and to help them protect their disability income insurance benefits from the risk of inflation.
Ameriprise Auto & Home Insurance Products
We
offer personal auto, home and umbrella insurance products through IDS Property Casualty and its subsidiary, Ameriprise Insurance Company (the “Property Casualty companies”). We offer a range of coverage options under each product category. Our Property Casualty companies provide personal auto, home and umbrella coverage to clients in 43 states and the District of Columbia.
Distribution and Marketing Channels
Our
Property Casualty companies do not have field agents - we use a co-branded direct marketing strategy to sell our personal auto, home and umbrella insurance products through alliances with commercial institutions and affinity groups, and directly to our clients and the general public. We also receive referrals through our financial advisor network. Our Property Casualty companies’ multi-year contract with Costco Wholesale Corporation and Costco’s affiliated insurance agency expires on March 31, 2020. Costco members represented 93% of all new policy sales of our Property Casualty companies in 2017.
We offer
RiverSource
life insurance products almost exclusively through our advisors. Our advisors offer insurance products issued predominantly by the RiverSource Life companies, though they may also offer insurance products of unaffiliated carriers, subject to certain qualifications.
Reinsurance
We
reinsure a portion of the insurance risks associated with our life, disability income, long term care and property casualty insurance products through reinsurance agreements with unaffiliated reinsurance companies. We use reinsurance to limit losses, reduce exposure to large and catastrophic risks and provide additional capacity for future growth. To manage exposure to losses from reinsurer insolvencies, we evaluate the financial condition of reinsurers prior to entering into new reinsurance treaties and on a periodic basis during the terms of the treaties. Our insurance companies remain primarily liable as the direct insurers on all risks reinsured.
See Note 7 to our Consolidated Financial Statements included in Part II, Item 8 of this Annual Report on Form 10-K for additional information on reinsurance.
Liabilities and Reserves
We
maintain adequate financial reserves to cover the insurance risks associated with the insurance products we issue. Generally, reserves represent estimates of the invested assets that our insurance companies need to hold to provide adequately for future benefits and expenses and applicable state insurance laws generally require us to assess and submit an opinion regarding the adequacy of our statutory-based reserves on an annual basis. For a discussion of the statutory-based financial statements related to our insurance products, see Note 20 to our Consolidated Financial Statements included in Part II, Item 8 of this Annual Report on Form 10-K.
Financial Strength Ratings
Independent
rating organizations evaluate the financial soundness and claims-paying ability of insurance companies continually, and they base their ratings on a number of different factors, including market position in core products and market segments, risk-adjusted capitalization and the quality of the company’s investment portfolios. More specifically, the ratings assigned are developed from an evaluation of a company’s balance sheet strength, operating performance and business profile. Balance sheet strength reflects a company’s ability to meet its current and ongoing obligations to its contractholders and policyholders and includes analysis of a company’s capital adequacy. The evaluation of operating performance centers on the stability and sustainability of a company’s sources of earnings. The business profile component of the rating considers a company’s mix of business, market position and depth and experience of management.
Our insurance subsidiaries’ ratings are important to maintain public confidence in our protection and annuity products. We list our ratings on our website at ir.ameriprise.com. For the most current ratings information, please see the individual rating agency’s website.
Our Segments - Corporate & Other
Our
Corporate & Other segment consists of the long term care business and net investment income or loss on corporate level assets, including excess capital held in our subsidiaries and other unallocated equity and other revenues as well as unallocated corporate expenses.
Closed
Block Long Term Care Insurance
Prior to December 31, 2002, the RiverSource Life companies underwrote stand-alone long term care (“LTC”) insurance. We discontinued offering LTC insurance as of December 31, 2002. A large majority of our closed block LTC is comprised of nursing home indemnity LTC or comprehensive reimbursement LTC. Generally, our insureds are eligible for LTC benefits when they are cognitively impaired or unable to perform certain activities of daily living.
Nursing
home indemnity LTC policies provide a predefined daily benefit when the insured is confined to a nursing home, subject to various maximum benefit periods, regardless of actual expenses of the policyholder. The nursing home indemnity LTC policies were primarily sold from 1989 through 1998. As of December 31, 2017, the nursing home indemnity LTC block had approximately
16
$84 million in in-force annual premium and future policyholder benefits and claim reserves of approximately $1.5 billion, net of reinsurance.
Our
comprehensive reimbursement LTC policies provide a predefined maximum daily benefit when the insured is confined to a nursing home covering a variety of LTC expenses including assisted living, home and community care, adult day care and similar placement programs, subject to various maximum total benefit payment pools, on a cost-reimbursement basis. The comprehensive reimbursement LTC policies were primarily sold from 1997 through 2002. As of December 31, 2017, the comprehensive reimbursement LTC block had approximately $118 million in in-force annual premium and future policyholder benefits and claim reserves of approximately $1.1 billion, net of reinsurance.
Our
closed block LTC was sold on a guaranteed renewable basis which allows us to re-price in-force policies, subject to regulatory approval. Premium rates for LTC policies vary by age, benefit period, elimination period, home care coverage, and benefit increase option and are based on assumptions concerning morbidity, mortality, persistency, administrative expenses, investment income, and profit. We develop our assumptions based on our own claims and persistency experience. We have pursued nationwide premium rate increases for many years and expect to continue to pursue rate increases over the next several years. In general, since very little of our LTC business is subject to rate stability regulation, we have followed a policy of pursuing smaller, more frequent increases rather than single large increases in order to align policyholder and shareholder objectives. We also provide policyholders with options to reduce their coverage to lessen or eliminate the additional financial outlay that would otherwise result.
For existing LTC policies, RiverSource Life has continued ceding 50% of the risk on a coinsurance basis to subsidiaries of Genworth Financial, Inc. (“Genworth”) and retains the remaining risk. For RiverSource Life of NY, this reinsurance arrangement applies for 1996 and later issues only. Under these agreements, we have the right, but never the obligation, to recapture some, or all, of the risk ceded to Genworth.
For
all policies, we hold active life reserves. These reserves reflect future benefits and expenses we expect to pay, net of the future premiums we expect to collect. In addition, a claim reserve is established when a claim is incurred. The claim reserve reflects our best estimate of the present value of the liability for future claim payments and claim adjustment expenses. A claim reserve is based on actual known facts regarding the claim, coverage considerations, and uses assumptions derived from our actual historical claim experience.
We undertake an extensive review of active life future policy benefit reserve adequacy annually during the third quarter of each year, or more frequently if appropriate, using current best estimate assumptions as of the date of the review. Our annual review process includes an analysis of our key reserve assumptions, including, at this time, those for morbidity, terminations (mortality and lapses), premium rate increases, and investment yields. Because we have a rigorous annual review of all key reserve assumptions, we believe we are materially less exposed to large one-time reserve adjustments.
|
•
|
Morbidity - A comprehensive morbidity experience study is performed annually using all company historical claim information, including paid claims and claim reserves. The experience study is split between age, duration, policy form series, nursing home, home care and lifetime and non-lifetime benefit periods. The results of these experience studies are used to adjust the morbidity assumption used in determining reserve adequacy. Recent experience studies support the observation that the morbidity for nursing home indemnity LTC policies, with an average policyholder attained age of 80, has stabilized as the data has become more statistically credible at older ages. The more recently issued comprehensive reimbursement LTC block, with an average policyholder attained age of 74, has somewhat less credible experience (that is, fewer claims). In 2017, we adjusted our claims expectations for the comprehensive reimbursement LTC block upward based on trending emerging experience.
|
|
•
|
Terminations - Termination, or mortality and lapse, experience studies are performed annually using all company historical death and lapse information and are evaluated considering issue age, duration, and lifetime and non-lifetime benefit periods. The termination assumptions have been stable for the last several years.
|
|
•
|
Premium Rate Increases - Future premium rate increases are considered in determining our reserve adequacy. For premium rate increases that we have initiated nationwide but have not yet been fully approved in all states, we review each policy form on a state-by-state basis to estimate the timing and amount we expect to be approved based on the historical experience of each state. Additionally, our analysis reflects management’s current best estimate assumption of one to two additional rate increases being pursued over the next four years with an estimate of varying success rates based on historical state approvals, regulatory restrictions and future anticipated state reaction. We are closely monitoring the industry and regulators to keep informed of possible changes to premium rate increase regulations. Given the current regulatory environment, management’s best estimate assumptions of future rate increase approvals are not overly aggressive and we believe are reasonable to support our benefit obligations.
|
|
•
|
Investment Yields - Current and projected investment yields are also evaluated and updated annually. Projected investment yields reflect management’s best estimate of future interest rates (consistent with all other GAAP projections) as well as our investment strategy.
|
As a result of our 2017 review of our reserve assumptions, our active life reserve was increased in the third quarter 2017 by $57 million, an increase of less than 3% when compared to our LTC reserves, net of reinsurance. These new assumptions will remain locked in as the basis for our reserve calculations as long as our annual review process indicates that the reserves are adequate.
17
Competition
We
operate in a highly competitive global industry. As a diversified financial services firm, we compete directly with a variety of financial institutions, including registered investment advisors, securities brokers, asset managers, banks and insurance companies. Our competitors may have greater financial resources, broader and deeper distribution capabilities and products and services than we do. We compete directly with these for the provision of products and services to clients, as well as for our financial advisors and investment management personnel. Certain of our competitors offer web-based financial services and discount brokerage services, usually with lower levels of service, to individual clients.
Our
Advice & Wealth Management segment competes with securities broker-dealers, independent broker-dealers, financial planning firms, registered investment advisors, insurance companies and other financial institutions to attract and retain financial advisors and their clients. Competitive factors influencing our ability to attract and retain financial advisors include compensation structures, brand recognition and reputation, product offerings and technology and service capabilities and support. Further, our financial advisors compete for clients with a range of other advisors, broker-dealers and direct channels, including wirehouses, regional broker-dealers, independent broker-dealers, insurers, banks, asset managers, registered investment advisers and direct distributors. Competitive factors influencing our ability to attract and retain clients include quality of advice provided, price, reputation, advertising and brand recognition, product offerings and technology and service quality.
Our
Asset Management segment competes on a global basis to acquire and retain managed and administered assets against a substantial number of firms, including those in the categories listed above. Such competitors may have achieved greater economies of scale, offer a broader array of products and services, offer products with a stronger performance record and have greater distribution capabilities. Competitive factors influencing our performance in this industry include investment performance, product offerings and innovation, product ratings, fee structures, advertising, service quality, brand recognition and reputation and the ability to attract and retain investment personnel. Furthermore, changes in investment preferences or investment management strategy (for example, “active” or “passive” investing styles) and downward pressure on fees presents various challenges to our business and may favor different competitors that focus more on “passive” investing styles. The ability to create and maintain and deepen relationships with distributors and clients also plays a significant role in our ability to acquire and retain managed and administered assets. The impact of these factors on our business may vary from country to country and certain competitors may have certain competitive advantage in certain jurisdictions. As an example, the timing and implementation of the British exit from the EU (commonly known as “Brexit”) and other regulatory or political impacts may ultimately favor certain types of asset managers in the EU.
Competitors of our Annuities and Protection segments consist of both stock and mutual insurance companies. Competitive factors affecting the sale of annuity and insurance products (including property casualty insurance products) include distribution capabilities, price, product features, hedging capability, investment performance, commission structure, perceived financial strength, claims-paying ratings, service, advertising, brand recognition and financial strength ratings from rating agencies such as A.M. Best.
Technology
We
have an integrated customer management system that serves as the hub of our technology platform. In addition, we have specialized product engines that manage various accounts and over the years, we have updated our platform to include new product lines. We also use a proprietary suite of processes, methods and tools for our financial planning services. We update our technological capabilities regularly to help maintain an adaptive platform design that aims to enhance the productivity of our advisors to allow for faster, lower-cost responses to emerging business opportunities, compliance requirements and marketplace trends.
We
have developed and maintain a comprehensive business continuity plan that utilizes an all-hazards approach to cover different potential business disruptions to centrally controlled systems, platforms and facilities of varying severity and scope. This plan addresses, among other things, the loss of an entire geographic area, corporate buildings, staff, data systems and/or telecommunications capabilities regardless of their cause (e.g., flood, fire or terrorism). We review and test our business continuity plan periodically and update it as necessary. We require our key technology vendors and service providers that provide corporate-wide services and solutions to do the same and we require our franchise advisors to create plans to cover such events for their locally controlled systems, data, staff and facilities.
Geographic Presence
For
years ended December 31, 2017, 2016 and 2015, approximately 91%, 91% and 89%, respectively, of our long-lived assets were
located
in the United States and approximately 94%, 94% and 91%, respectively, of our net revenues were generated in the United States. The majority of our foreign operations are conducted through Columbia Threadneedle, as described in this Annual Report on Form 10-K under “Business - Our Segments - Asset Management.”
Employees
At
December 31, 2017, we had over 13,000 employees, including approximately 2,200 employee advisors (which does not include our franchisee advisors, who are not employees of our company, but includes advisors employed in the AAC and in our bank channel). We are not subject to collective bargaining agreements, and we believe that our employee relations are strong.
Intellectual Property
We
rely on a combination of contractual rights and copyright, trademark, patent and trade secret laws to establish and protect our intellectual property. In the United States and other jurisdictions, we have established and registered, or filed applications to register
18
certain trademarks and service marks that we consider important to the marketing of our products and services, including but not limited to Ameriprise Financial, Columbia Management, Threadneedle, RiverSource and Columbia Threadneedle Investments. We have in the past and will in the future take action to establish and protect our intellectual property.
Regulation
Virtually
all aspects of our business, including the activities of the parent company and our subsidiaries, are subject to various federal, state and foreign laws and regulations. These laws and regulations provide broad regulatory, administrative and enforcement powers to supervisory agencies and other bodies, including U.S. federal and state regulatory agencies, foreign government agencies or regulatory bodies and U.S. and foreign securities exchanges. The costs of complying with such laws and regulations can be significant, and the consequences for the failure to comply may include civil or criminal charges, fines, censure, the suspension of individual employees, restrictions on or prohibitions from engaging in certain lines of business (or in certain states or countries), revocation of certain registrations as well as reputational damage. We have made and expect to continue to make significant investments in our compliance processes, enhancing policies, procedures and oversight to monitor our compliance with the numerous legal and regulatory requirements applicable to our business.
The
regulatory environment in which our businesses operate remains subject to change and heightened regulatory scrutiny. Regulatory developments, both in and outside of the U.S., have resulted or are expected to result in greater regulatory oversight and internal compliance obligations for firms across the financial services industry. In addition, we continue to see enhanced legislative and regulatory interest regarding retirement investing, and we will continue to closely review and monitor any legislative or regulatory proposals and changes. These legal and regulatory changes have impacted and may in the future impact the manner in which we are regulated and the manner in which we operate and govern our businesses.
The
discussion and overview set forth below provides a general framework of the primary laws and regulations impacting our businesses. Certain of our subsidiaries may be subject to one or more elements of this regulatory framework depending on the nature of their business, the products and services they provide and the geographic locations in which they operate. To the extent the discussion includes references to statutory and regulatory provisions, it is qualified in its entirety by reference to these statutory and regulatory provisions and is current only as of the date of this report.
19
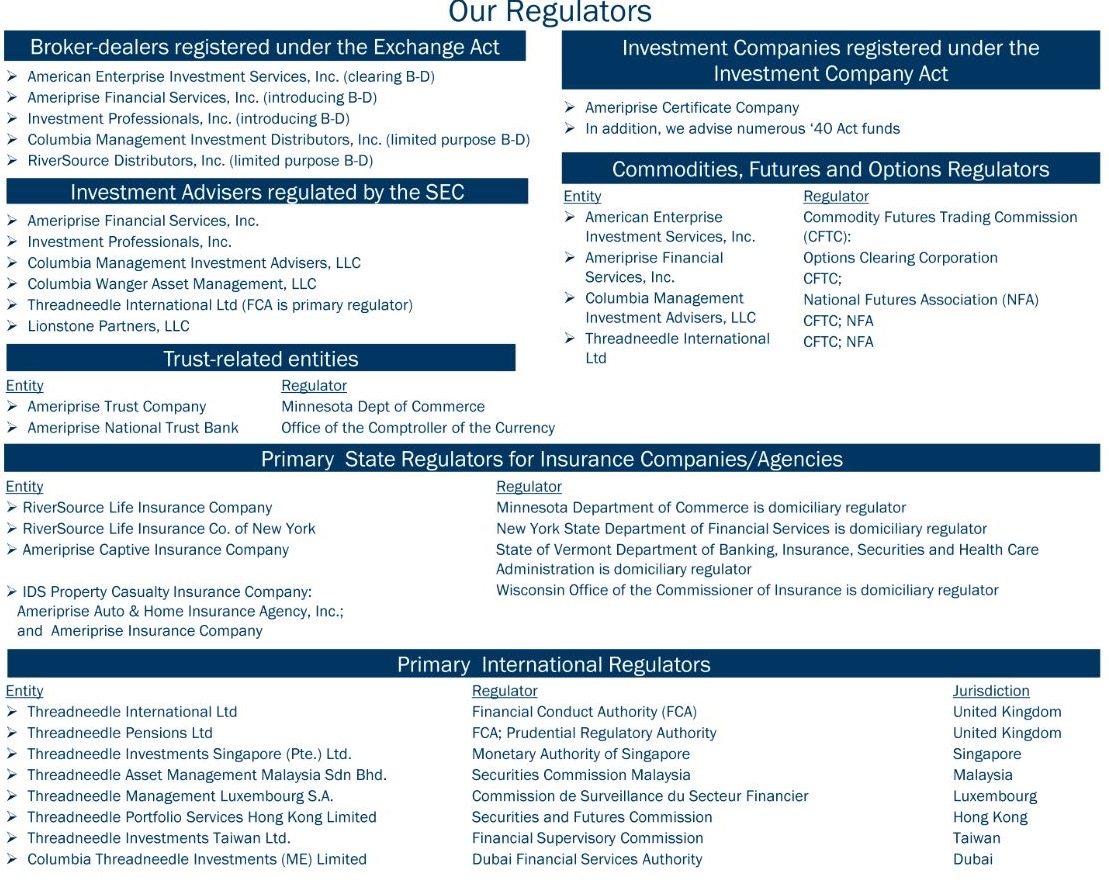
In addition to the regulators summarized above, we are also subject to regulation by self-regulatory organizations such as the Financial Industry Regulatory Authority (“FINRA”), as well as various federal and state securities, insurance and financial regulators (such as regulatory agencies and bodies like the U.S. Department of Labor) in the U.S. and foreign jurisdictions where we do business.
Advice and Wealth Management Regulation
Certain of our subsidiaries are registered with the SEC as broker-dealers under the Securities Exchange Act of 1934 (“Exchange Act”) and with certain states, the District of Columbia and other U.S. territories. Our broker-dealer subsidiaries are also members of self-regulatory organizations, including FINRA, and are subject to the regulations of these organizations. The SEC and FINRA have stringent rules with respect to the net capital requirements and the marketing and trading activities of broker-dealers. Our broker-dealer subsidiaries, as well as our financial advisors and other personnel, must obtain all required state and FINRA licenses and registrations to engage in the securities business and take certain steps to maintain such registrations in good standing. SEC regulations also impose notice requirements and capital limitations on the payment of dividends by a broker-dealer to a parent.
Our financial advisors are representatives of a dual registrant that is registered both as an investment adviser under the Investment Advisers Act of 1940 (“Advisers Act”) and as a broker-dealer. Our advisors are subject to various regulations that impact how they operate their practices, including those related to supervision, sales methods, trading practices, record-keeping and financial reporting. In addition, because our independent contractor advisor platform is structured as a franchise system, we are also subject to Federal Trade Commission and state franchise requirements. As noted earlier, we continue to see enhanced legislative and regulatory interest regarding retirement investing and financial advisors, including proposed rules, regulatory priorities or general discussion around transparency and disclosure in advisor compensation and recruiting, identifying and managing conflicts of interest and enhanced data collection.
Our financial advisors serve clients who hold assets in IRAs and employer-sponsored retirement plan accounts. The Department of Labor published regulations in April 2016 that expanded the scope of who is considered an ERISA fiduciary and these regulations focus in large part on investment recommendations made by financial advisors, registered investment advisors, and other investment
20
professionals to retirement investors, how financial advisors are able to discuss IRA rollovers, as well as how financial advisors and affiliates can transact with retirement investors. Tax qualified accounts, particularly IRAs, make up a significant portion of our assets under management and administration. The first phase of the regulations went into effect on June 9, 2017 and requires financial advisors to make recommendations related to assets held in IRAs and employer sponsored retirement plans in accordance with the following impartial conduct standards: recommendations must be in the best interest of the client, compensation paid for the recommendations must be reasonable and the financial advisor must not make any misleading statements. We adopted policies and procedures designed to comply with the impartial conduct standards and communicated those policies and procedures to our advisors and staff. The second phase of the regulation pertaining to a new “best interest contract exemption” would put into place a number of additional requirements including entering into a best interest contract with clients, enhanced disclosure of fees and conflicts of interest, limits on differential commissions within a product category, the adoption of policies and procedures to ensure the best interest standard is met, and findings related to platforms that are limited to products that pay third-party payments and/or include proprietary products. The second phase of the regulation is currently scheduled to become effective on July 1, 2019. However, these regulations are currently under review by the Department of Labor to determine if further revisions to the regulations are advisable. As a result, it is unclear whether the Department of Labor will substantially rescind or revise the regulations as adopted in 2016.
In addition, the Securities and Exchange Commission is also working on developing its own fiduciary standard that would apply to recommendations made by financial advisors who work on a commission basis and would apply regardless of the type of account (IRA or non-qualified) an investor holds. Furthermore, several states have either issued their own fiduciary rules or are considering doing so and those rules may extend to certain types of products (e.g. insurance and annuities, financial planning, etc.) or may broadly cover all recommendations made by financial advisors. We are also seeing self-regulatory bodies like the Certified Financial Planner Board working on a fiduciary standard that would apply to financial advisors who hold a Certified Financial Planner designation. Currently, Ameriprise has approximately 4,100 financial advisors that hold a Certified Financial Planner designation. In light of the various fiduciary rules and regulations that have been proposed or finalized, we continue to exert significant efforts to evaluate and prepare to comply with each rule. Depending on the span and substance of any rules and regulations and timing of their applicability, the scope of any implementation could impact the way we compensate our advisors, particularly with respect to the sale of commission-based products, the access that representatives of affiliated and unaffiliated product manufacturers could have to our advisors and clients, and the manner and degree to which we and our advisors could have selling and marketing costs reimbursed by product manufacturers. We have incurred infrastructure costs in anticipation of compliance with these new regulations, and ongoing costs will be driven by how these regulations may evolve over the course of time. Other agencies, exchanges and self-regulatory organizations of which certain of our broker-dealer subsidiaries are members, and subject to applicable rules and regulations of, include the Commodities Futures Trading Commission (“CFTC”) and the National Futures Association (“NFA”). Effective in August 2014, AFSI changed its registration from a Futures Commission Merchant to a Commodity Trading Advisor with the CFTC. In addition, certain subsidiaries may also be registered as insurance agencies and subject to the regulations described in the following sections.
Asset
Management Regulation
U.S. Regulation
In the U.S., certain of our asset management subsidiaries are registered as investment advisers under the Advisers Act and subject to regulation by the SEC. The Advisers Act imposes numerous obligations on registered investment advisers, including fiduciary duties, disclosure obligations and record-keeping, and operational and marketing restrictions. Our registered investment advisers may also be subject to certain obligations of the Investment Company Act based on their status as investment advisers to investment companies that we, or third parties, sponsor. In October 2016, the SEC issued a final rule requiring the implementation of fund board approved liquidity risk management programs for mutual funds (other than money market funds) and ETFs. Full compliance with this rule is required by December 1, 2018. As noted earlier, we continue to see enhanced legislative and regulatory interest regarding financial services in the U.S. through rules (and those yet to be implemented), regulatory priorities or general discussion around risk retention requirements, expanded reporting requirements and transfer agent regulation. This trend is also true globally. As one example, the Financial Stability Board (“FSB”), an international body that can make its own recommendations but not enact regulations, provided 14 policy recommendations to address what they see as the following structural vulnerabilities from asset management activities that could potentially present financial stability risks: (i) liquidity mismatch between fund investments and redemption terms and conditions for open-ended fund units; (ii) leverage within investment funds; (iii) operational risk and challenges at asset managers in stressed conditions; and (iv) securities lending activities of asset managers and funds. We believe many of the recommendations with respect to individual funds and firms outlined by the FSB are addressed by our existing robust risk management practices for our global asset management business, including with respect to liquidity risk management. However, any future regulations could potentially require new or different approaches which increase our regulatory burdens and costs.
Aspects of the regulation that would apply to our Advice & Wealth Management segment would also apply to our Asset Management segment. For example, Columbia Management Investment Distributors, Inc. is registered with the CFTC and NFA as well as registered as a broker-dealer for the limited purpose of acting as the principal underwriter and distributor for
Columbia Management
funds. Additionally, ERISA and the Department of Labor’s fiduciary regulations (as well as other fiduciary rules or standards) would be relevant to our global asset management business and we continue to review and analyze the potential impact of these regulations on our clients, prospective clients and distribution channels, as well as the potential impact on our business across each of our business lines.
21
In connection with rules adopted by the CFTC, certain of our subsidiaries are registered with the CFTC as a commodity trading advisor and commodity pool operator and are also members of the NFA. These rules adopted by the CFTC eliminated or limited previously available exemptions and exclusions from many CFTC requirements and impose additional registration and reporting requirements for operators of certain registered investment companies and certain other pooled vehicles that use or trade in futures, swaps and other derivatives that are subject to CFTC regulation.
Non-U.S. Regulation
UK Regulation
Outside of the U.S., Columbia Threadneedle Investments is primarily authorized to conduct its financial services business in the UK under the Financial Services and Markets Act 2000. Threadneedle is currently regulated by the Financial Conduct Authority (“FCA”) and the Prudential Regulation Authority (“PRA”). FCA and PRA rules impose certain capital, operational and compliance requirements and allow for disciplinary action in the event of noncompliance. As with the U.S. environment, we continue to see enhanced legislative and regulatory interest regarding financial services outside the U.S. through rules (and those yet to be implemented). Key UK regulatory developments or trends include the following:
|
•
|
The UK financial service sector continues to face uncertainty over the final relationship with the EU as a result of Brexit. In the event of no arrangements as part of final negotiations, the UK would become a third country from the EU’s perspective (largely in the same way that the US is currently) which places restrictions on cross-border marketing of financial products. We continue to monitor developments in place and have an ongoing project to ensure we can continue to service our EU clients.
|
|
•
|
The FCA has published the final Asset Management market study and Columbia Threadneedle
Investments
provided a response. The focus is on enhancing competition for regulated funds and delivering value for the end investor. The FCA will consult throughout 2018 on proposed further measures. We welcome the review and firmly believe it is in everyone’s interest for our industry to continue providing value to our customers within a framework of transparency, good governance and healthy competition.
|
|
•
|
In 2018 the FCA’s asset management focus will include: (i) implementation of Markets in Financial Instruments recast Directive and new regulation (“MiFID II”), (ii) cyber resilience, (iii) firm’s culture and governance, (iv) firm’s financial crime and AML systems and controls; and (v) innovation, big data, technology and competition. We also expect the FCA to review investments firms approaches to fund liquidity in 2018.
|
|
•
|
We expect the FCA to extend the new accountability regime to almost all regulated firms in 2019; this is an evolution of current requirements, with changes including: (i) a requirement that senior managers take all reasonable steps to prevent a breach in their area of responsibility, (ii) nearly all employees being subject to enforceable conduct rules; and, (iii) new FCA powers to take enforcement action directly against nearly all employees of a regulated firm. Once implemented this will be an evolution of the FCA’s approach to conduct risk regulation.
|
Pan-European and Other Non-U.S. Regulation
In addition to the above, certain of our asset management subsidiaries, such as Columbia Threadneedle Investment’s UK and other European subsidiaries, are required to comply with pan-European directives issued by the European Commission, as adopted by EU member states. Certain of these directives also impact our global asset management business. For example, Columbia Threadneedle Investments and certain of our other asset management subsidiaries are required to comply with
MiFID II
, Alternative Investment Fund Managers Directive (“AIFMD”), European Market Infrastructure Regulation (“EMIR”) and the Undertakings for Collective Investment in Transferable Securities Directive (“UCITS”). These regulations impact the way we manage assets and place, settle and report on trades for our clients, as well as market to clients and prospects. EMIR provides a framework for the regulation of over the counter and exchange-traded derivative markets, and is being implemented in a number of phases that began in August 2012 and is nearing completion. UCITS V amended the UCITS IV Directive and introduced changes relating to the depositary function, manager remuneration and sanctions for those funds that are publicly offered as UCITS products. UCITS V was implemented in March 2016. Similar to the developments in the U.S., we continue to see enhanced legislative and regulatory interest regarding financial services through international markets, including in the European Union (“EU”) where we have a substantial asset management business. These non-U.S. rules (and those yet to be implemented), proposed rules, regulatory priorities or general discussions may impact us directly or indirectly, including as a regulated entity or as a service provider to, or a business receiving services from or engaging in transactions with, regulated entities. For example, within the EU and the UK we have been, or will be, addressing regulatory reforms including:
|
•
|
Brexit,
|
|
•
|
MiFID II,
|
|
•
|
FCA’s Asset Management Market Study,
|
|
•
|
Solvency II,
|
|
•
|
Packaged Retail and Insurance-based Investment Products (“PRIIPs”),
|
|
•
|
General Data Protection Regulation (“GDPR”),
|
|
•
|
Market Abuse Regulation (“MAR”),
|
|
•
|
Transparency Directive II (“TD II”),
|
22
|
•
|
UCITS V,
|
|
•
|
European Market Infrastructure Regulation II,
|
|
•
|
Fourth Money Laundering Directive (“MLDIV),
|
|
•
|
EU Benchmarks Regulation,
|
|
•
|
Money Market Fund Regulation (“MMFR”),
|
|
•
|
Insurance Distribution Directive (“IDD”),
|
|
•
|
Shareholder Rights Directive (“SRD”),
|
|
•
|
Investment Firms Review,
|
|
•
|
Securitisation Regulation,
|
|
•
|
Criminal Finance Act, and
|
|
•
|
The Review of the European Supervisory Authorities and new powers over delegation.
|
MiFID II came into effect on January 3, 2018. MiFID II is the most significant regulatory change EU investment firms have faced since the EU financial service action plan in 2006 which sought to establish the EU single market for financial services. MiFID II strengthens the requirement for investment firms to act in the client’s best interest, in many areas including conflicts of interest (specifically, inducements and a prohibition on free research), strengthening of best execution requirements and increased costs and charges disclosure, in relation to all services provided to clients. Firms are also subject to an increase in scope of transactions which must be reported to both the regulator and the market. In response to MiFID II, Columbia Threadneedle Investments has implemented wide ranging changes to systems, policies and operating procedures across its business including (i) increased transparency and reporting to our clients over costs impacting their investments; (ii) publishing detailed information on a near real-time basis for some trades, and reporting all transactions to the regulator the next business day; (iii) strengthening rules on requirements and reporting of best execution of our trades; and (iv) moving from clients paying for investment research as part of a bundled transaction fee to Columbia Threadneedle Investments paying for the research.
GDPR replaces the 1995 Directive on which the Data Protection Act of 1998 is based and which was inconsistently applied in the EU and did not fully contemplate developments in technology. GDPR seeks to harmonize data protection legislation and introduce changes in areas such as (i) governance and oversight; (ii) processing of personal data; (iii) enhancements around consent and data subject rights; and (iv) international data transfers. GDPR is a step change in the way personal data is regulated in Europe as well as outside of Europe to the extent that goods or services are being provided to EU citizens and their personal information is collected and processed in the course of that interaction. Coming into effect in May 2018, our GDPR governance program is well underway in light of this effective date, while simultaneously considering other upcoming regulatory change (including Brexit) and the data privacy impact that this will have on our current business model post-Brexit.
In March 2017 the UK invoked article 50 of the Treaty of Lisbon in serving its relevant notice to leave the European Union on March 30, 2019. Having voted to leave the EU, the UK and others will need to negotiate the terms of multiple new relationships and this will take some time. The full impact of Brexit remains uncertain as there is a significant degree of uncertainty about how negotiations relating to the UK’s withdrawal and new trade agreements will be conducted, as well as the potential consequences and precise timeframe for Brexit. We already have an established fund range domiciled in Luxembourg (both UCITS and AIF) along with a UCITS Management Company. We are therefore well placed to continue to serve investors in Europe. We are assessing whether it would be advisable to expand the scope of our Luxembourg-based management company to enable us to establish an asset management presence in the EU post-Brexit. We will seek to replicate appropriate funds from our UK-based OEIC range within our Luxembourg SICAV platform. We have a well-resourced and experienced product development team with the capacity to ensure the needs of our clients are met in an efficient and transparent manner.
In Singapore, our asset management subsidiary Threadneedle Investments Singapore (Pte.) Ltd. (“Threadneedle Singapore”) is regulated by the Monetary Authority of Singapore (“MAS”) under the Securities and Futures Act. Threadneedle Singapore holds a capital markets services license with MAS, and employees of Threadneedle Singapore engaging in regulated activities are also required to be licensed. MAS rules impose certain capital, operational and compliance requirements and allow for disciplinary action in the event of noncompliance.
Threadneedle companies and activities are also subject to other local country regulations in Europe, Dubai, Hong Kong, Malaysia, Taiwan, the U.S., South Korea, South America and Australia. Additionally, many of our subsidiaries, including Columbia Management, are also subject to foreign, state and local laws with respect to advisory services that are offered and provided by these subsidiaries, including services provided to government pension plans.
Other
Securities Regulation
Ameriprise Certificate Company is regulated as an investment company under the Investment Company Act. As a registered investment company, Ameriprise Certificate Company must observe certain governance, disclosure, record-keeping, operational and marketing requirements. Ameriprise Certificate Company pays dividends to the parent company and is subject to capital requirements under applicable law and understandings with the SEC and the Minnesota Department of Commerce (Banking Division).
ATC is primarily regulated by the Minnesota Department of Commerce (Banking Division) and is subject to capital adequacy requirements under Minnesota law. It may not accept deposits or make personal or commercial loans. As a provider of products and
23
services to tax-qualified retirement plans and IRAs, certain aspects of our business, including the activities of our trust company, fall within the compliance oversight of the U.S. Departments of Labor and Treasury, particularly regarding the enforcement of ERISA, and the tax reporting requirements applicable to such accounts. ATC, as well as our investment adviser subsidiaries, may be subject to ERISA, and the regulations thereunder, insofar as they act as a “fiduciary” under ERISA with respect to certain ERISA clients.
Protection
and Annuities Regulation
Our insurance subsidiaries are subject to supervision and regulation by states and other territories where they are domiciled or otherwise licensed to do business. The primary purpose of this regulation and supervision is to protect the interests of contractholders and policyholders. In general, state insurance laws and regulations govern standards of solvency, capital requirements, the licensing of insurers and their agents, premium rates, policy forms, the nature of and limitations on investments, periodic reporting requirements and other matters. In addition, state regulators conduct periodic examinations into insurer market conduct and compliance with insurance and securities laws. The Minnesota Department of Commerce, the Wisconsin Office of the Commissioner of Insurance, and the New York State Department of Financial Services (the “Domiciliary Regulators”) regulate certain of the RiverSource Life companies, and the Property Casualty companies depending on each company’s state of domicile. In addition to being regulated by their Domiciliary Regulators, our RiverSource Life companies and Property Casualty companies are regulated by each of the insurance regulators in the states where each is authorized to transact business. Financial regulation of our RiverSource Life companies and Property Casualty companies is extensive, and their financial transactions (such as intercompany dividends and investment activity) may be subject to pre-approval and/or continuing evaluation by the Domiciliary Regulators.
Aspects of the regulation applicable to our Advice & Wealth Management segment would also apply to our Annuities and Protection segments. For example, RiverSource Distributors is registered with the CFTC and NFA as well as registered as a broker-dealer for the limited purpose of acting as the principal underwriter and/or distributor for our
RiverSource
annuities and insurance products sold through AFSI and third-party channels. Additionally, ERISA and the U.S. Department of Labor’s fiduciary regulations (as well as other fiduciary rules or standards) are relevant to our insurance business and we continue to review and analyze the potential impact of these regulations on our clients, prospective clients and distribution channels, as well as the potential impact on our business across each of our business lines.
All states require participation in insurance guaranty associations, which assess fees to insurance companies in order to fund claims of policyholders and contractholders of insolvent insurance companies subject to statutory limits. These assessments are generally based on a member insurer’s proportionate share of all premiums written by member insurers in the state during a specified period prior to an insurer’s insolvency. See Note 23 to our Consolidated Financial Statements included in Part II, Item 8 of this Annual Report on Form 10-K for additional information regarding guaranty association assessments.
Certain variable annuity and variable life insurance policies offered by the RiverSource Life companies constitute and are registered as securities under the Securities Act of 1933, as amended. As such, these products are subject to regulation by the SEC and FINRA. Securities regulators have recently increased their focus on the adequacy of disclosure regarding complex investment products, including variable annuities and life insurance products, and have announced that they will continue to review actions by life insurers to improve profitability and reduce risks under in force annuity and insurance products with guaranteed benefits.
The 2010 Dodd-Frank Wall Street Reform and Consumer Protection Act (“Dodd-Frank Act”), created the Federal Insurance Office (“FIO”) within the Department of Treasury. The FIO does not have substantive regulatory responsibilities, though it is tasked with monitoring the insurance industry and the effectiveness of its regulatory framework and providing periodic reports to the President and Congress.
Until late 2017, RiverSource Life owned a block of residential mortgage loans. As such, it was required to comply with applicable federal and state lending and foreclosure laws and was subject to the jurisdiction of the federal Consumer Finance Protection Bureau and certain state regulators relative to these mortgage loans. These regulatory obligations are largely terminated, with only trailing and immaterial requirements remaining.
24
Each of our insurance subsidiaries is subject to risk-based capital (“RBC”) requirements designed to assess the adequacy of an insurance company’s total adjusted capital in relation to its investment, insurance and other risks. The National Association of Insurance Commissioners (“NAIC”) has established RBC standards that all state insurance departments have adopted. The RBC requirements are used by the NAIC and state insurance regulators to identify companies that merit regulatory actions designed to protect policyholders. Our RiverSource Life companies and Property Casualty companies are subject to various levels of regulatory intervention should their total adjusted statutory capital fall below defined RBC action levels. At the “company action level,” defined as total adjusted capital level between 100% and 75% of the RBC requirement, an insurer must submit a plan for corrective action with its primary state regulator. The level of regulatory intervention is greater at lower levels of total adjusted capital relative to the RBC requirement. RiverSource Life, RiverSource Life of NY, IDS Property Casualty and Ameriprise Insurance Company maintain capital levels well in excess of the company action level required by state insurance regulators as noted below as of December 31, 2017:
|
Entity
|
Company Action Level RBC
|
Total
Adjusted Capital
|
% of Company Action Level RBC
|
||||||||
|
(in millions, except percentages)
|
|||||||||||
|
RiverSource Life
|
$
|
562
|
|
$
|
2,451
|
|
437
|
%
|
|||
|
RiverSource Life of NY
|
36
|
|
269
|
|
739
|
|
|||||
|
IDS Property Casualty
|
134
|
|
781
|
|
583
|
|
|||||
|
Ameriprise Insurance Company
|
1
|
|
48
|
|
8,553
|
|
|||||
Ameriprise Financial, as a direct and indirect owner of its insurance subsidiaries, is subject to the insurance holding companies laws of the states where its insurance subsidiaries are domiciled. These laws generally require insurance holding companies to register with the insurance department of the insurance company’s state of domicile and to provide certain financial and other information about the operations of the companies within the holding company structure.
As part of its Solvency Modernization Initiative, in 2010 the NAIC adopted revisions to its Insurance Holding Company System Regulatory Act (“Holding Company Act”) to enhance insurer group supervision and create a new Risk Management and Own Risk and Solvency Assessment (“ORSA”) Model Act. The Holding Company Act revisions focus on the overall insurance holding company system, establish a framework of regulator supervisory colleges, enhancements to corporate governance, and require the annual filing of an Enterprise Risk Management Report. The ORSA Model Act requires that an insurer create and file, annually, its Own Risk Solvency Assessment, which is a complete self-assessment of its risk management functions and capital adequacy. These laws have now been enacted by the domiciliary states of RiverSource Life and the Property Casualty companies: Minnesota, New York and Wisconsin. The reports have been completed and filed as required by the laws and regulations of those states.
Federal
Banking Regulation
In January 2013, Ameriprise Bank received approval for and completed the conversion from a federal savings bank to a limited powers national trust bank, which was renamed Ameriprise National Trust Bank. As a limited powers national association, Ameriprise National Trust Bank remains subject to supervision under various laws and regulations enforced by the OCC, including those related to capital adequacy, liquidity and conflicts of interest, and to a limited extent, by the FDIC.
Following the conversion of Ameriprise Bank, Ameriprise Financial deregistered as a savings and loan holding company and is no longer subject to consolidated regulation or supervision by the Federal Reserve System (“Federal Reserve”) as such, nor is it subject to the additional Federal Reserve requirements applicable to financial holding companies.
Parent
Company Regulation
Ameriprise Financial is a publicly traded company that is subject to SEC and New York Stock Exchange (“NYSE”) rules and regulations regarding public disclosure, financial reporting, internal controls and corporate governance. The adoption of the Sarbanes-Oxley Act of 2002 as well as the implementation of the Dodd-Frank Act have significantly enhanced these rules and regulations. In June 2017, the U.S. House of Representatives passed the Financial CHOICE Act of 2017 (the “CHOICE Act”) that would make sweeping changes to the financial regulatory system by amending, repealing and replacing certain portions of Dodd-Frank. The prospects of this in the Senate are unclear and the CHOICE Act is not yet law and may not become law. However, the CHOICE Act is reflective of aspects of the current U.S. regulatory environment and the Trump Administration has indicated it intends to advance of a variety of financial regulatory relief measures through Executive Branch action and to effect a potentially significant shift in the supervisory approach of agencies. This has wide-ranging implications for our business lines as well as parent company regulation.
We have operations in a number of geographical regions outside of the U.S. through Threadneedle and certain of our other subsidiaries. We monitor developments in EU legislation, as well as in the other markets in which we operate, to ensure that we comply with all applicable legal requirements, including EU directives applicable to financial institutions as implemented in the various member states. Because of the mix of business activities we conduct, we assess the impact of, and monitor our status under, the EU Financial Conglomerates Directive, which contemplates that certain financial conglomerates involved in banking, insurance and investment activities among other things, implement measures to prevent excessive leverage and multiple leveraging of capital and maintain internal control processes to address risk concentrations as well as risks arising from significant intragroup transactions.
25
Privacy
, Environmental Laws and USA Patriot Act
Many aspects of our business are subject to comprehensive legal requirements by a multitude of different functional regulators concerning the use and protection of personal information, including client and employee information. This includes rules adopted pursuant to the Gramm-Leach-Bliley Act, the Fair and Accurate Credit Transactions Act, the Health Insurance Portability and Accountability Act (“HIPAA”), the Health Information Technology for Economic and Clinical Health (“HITECH”) Act, an ever increasing number of state laws, EU data protection legislation as domestically implemented in the respective EU member states, and data protection rules in the other regions outside the U.S. and the EU in which we operate (including GDPR). We have also implemented policies and procedures in response to such requirements. We continue our efforts to safeguard the data entrusted to us in accordance with applicable laws and our internal data protection policies, including taking steps to reduce the potential for identity theft or other improper use or disclosure of personal information, while seeking to collect only the data that is necessary to properly achieve our business objectives and to best serve our clients.
As the owner and operator of real property, we are subject to federal, state and local environmental laws and regulations. We periodically conduct environmental reviews on our own real estate as well as investment real estate to assess and ensure our compliance with these laws and regulations.
The Uniting and Strengthening America by Providing Appropriate Tools Required to Intercept and Obstruct Terrorism Act, commonly referred to as the USA Patriot Act, was enacted in October 2001 in the wake of the September 11th terrorist attacks. The USA Patriot Act broadened existing anti-money laundering legislation and the extraterritorial jurisdiction of the United States substantially. In response, we enhanced our existing anti-money laundering programs and developed new procedures and programs. For example, we implemented a customer identification program applicable to many of our businesses and enhanced our “know your customer” and “due diligence” programs. In addition, we will continue to comply with anti-money laundering legislation in the UK derived from applicable EU directives and international initiatives adopted in other jurisdictions in which we conduct business.
Securities Exchange Act Reports and Additional Information
We maintain an Investor Relations website at ir.ameriprise.com. Investors can also access the website through our main website at ameriprise.com by clicking on the “Investor Relations” link located at the bottom of our homepage. We use our Investor Relations website to announce financial and other information to investors and to make available SEC filings, press releases, public conference calls and webcasts. Investors and others interested in the company are encouraged to visit the investor relations website from time to time, as information is updated and new information is posted. The website also allows users to sign up for automatic notifications in the event new materials are posted. The information found on the website is not incorporated by reference into this report or in any other report or document the Company furnishes or files with the SEC.
Segment Information and Classes of Similar Services
You can find financial information about our operating segments and classes of similar services in Note 25 to our Consolidated Financial Statements included in Part II, Item 8 of this Annual Report on Form 10-K.
Our operations and financial results are subject to various risks and uncertainties, including those described below, that could have a material adverse effect on our business, financial condition or results of operations and could cause the trading price of our common stock to decline. We believe that the following information identifies the material factors affecting our company based on the information we currently know. However, the risks and uncertainties our company faces are not limited to those described below. Additional risks and uncertainties not presently known to us or that we currently believe to be immaterial may also adversely affect our business.
Risks Relating to Our Business and Operations
Our financial condition and results of operations may be adversely affected by market fluctuations and by economic, political and other factors.
Our financial condition and results of operations may be materially affected by market fluctuations and by economic and other factors. Such factors, which can be global, regional, national or local in nature, include: (i) political, social, economic and market conditions; (ii) the availability and cost of capital; (iii) the level and volatility of equity prices, commodity prices and interest rates, currency values and other market indices; (iv) technological changes and events; (v) U.S. and foreign government fiscal and tax policies; (vi) U.S. and foreign government ability, real or perceived, to avoid defaulting on government securities; (vii) the availability and cost of credit; (viii) inflation; (ix) investor sentiment and confidence in the financial markets; (x) terrorism and armed conflicts; and (xi) natural disasters such as weather catastrophes and widespread health emergencies. Furthermore, changes in consumer economic variables, such as the number and size of personal bankruptcy filings, the rate of unemployment, decreases in property values, and the level of consumer confidence and consumer debt, may substantially affect consumer loan levels and credit quality, which, in turn, could impact client activity in all of our businesses. These factors also may have an impact on our ability to achieve our strategic objectives.
Declines and volatility in U.S. and global market conditions have impacted our businesses in the past and may do so again. Our businesses have been, and in the future may be, adversely affected by U.S. and global capital market and credit crises, the repricing of credit risk, equity market volatility and decline and stress or recession in the U.S. and global economies generally. Each of our
26
segments operates in these markets with exposure for us and our clients in securities, loans, derivatives, alternative investments, seed capital and other commitments. It is difficult to predict when, how long and to what extent the aforementioned adverse conditions may exist, which of our markets, products and businesses will be directly affected in terms of revenues, management fees and investment valuations and earnings, and to what extent our clients may seek to bring claims arising out of investment performance that is affected by these conditions. As a result, these factors could materially adversely impact our financial condition and results of operations.
Our revenues are largely dependent upon the level and mix of assets we have under management and administration, which are subject to fluctuation based on market conditions and client activity. Downturns and volatility in equity markets can have, and have had, an adverse effect on the revenues and returns from our asset management services, retail advisory accounts and variable annuity contracts. Because the profitability of these products and services depends on fees related primarily to the value of assets under management, declines in the equity markets will reduce our revenues because the value of the investment assets we manage will be reduced. In addition, market downturns and volatility may cause, and have caused, potential new purchasers of our products to limit purchases of or to refrain from purchasing products such as mutual funds, OEICs, variable annuities and variable universal life insurance. Downturns may also cause current shareholders in our mutual funds, OEICs, SICAVs, unit trusts and investment trusts, contractholders in our annuity products and policyholders in our protection products to withdraw cash values from those products.
Some of our variable annuity products contain guaranteed minimum death benefits and guaranteed minimum withdrawal and accumulation benefits. A significant equity market decline or volatility in equity markets could result in guaranteed minimum benefits being higher than what current account values would support, which would adversely affect our financial condition and results of operations. Although we have hedged a portion of the guarantees for the variable annuity contracts to mitigate the financial loss of equity market declines or volatility, there can be no assurance that such a decline or volatility would not materially impact the profitability of certain products or product lines or our financial condition or results of operations. Further, the cost of hedging our liability for these guarantees has increased as a result of low interest rates and volatility in the equity markets and broad-based market and regulatory-driven changes in the collateral requirements of hedge trading counterparties. In addition, heightened volatility creates greater uncertainty for future hedging effectiveness.
We believe that investment performance is an important factor in the success of many of our businesses. Poor investment performance could impair our revenues and earnings, as well as our prospects for growth. A significant portion of our revenue is derived from investment management agreements with the
Columbia Management
family of mutual funds that are terminable on 60 days’ notice. In addition, although some contracts governing investment management services are subject to termination for failure to meet performance benchmarks, institutional and individual clients can terminate their relationships with us or our financial advisors at will or on relatively short notice. Our clients can also reduce the aggregate amount of managed assets or shift their funds to other types of accounts with different rate structures, for any number of reasons, including investment performance, changes in prevailing interest rates, changes in investment preferences or investment management strategy (for example, “active” or “passive” investing styles), changes in our (or our advisors’) reputation in the marketplace, changes in client management or ownership, loss of key investment management personnel and financial market performance. A reduction in managed assets, and the associated decrease in revenues and earnings, could have a material adverse effect on our business. Moreover, if our money market funds experience a decline in market value, we may choose to contribute capital to those funds without consideration, which would result in a loss.
During periods of unfavorable or stagnating market or economic conditions, the level of individual investor participation in the global markets may also decrease, which would negatively impact the results of our retail businesses. Concerns about current market and economic conditions, declining real estate values and decreased consumer confidence have caused, and in the future may cause, some of our clients to reduce the amount of business they do with us. Fluctuations in global market activity could impact the flow of investment capital into or from assets under management and the way customers allocate capital among money market, equity, fixed maturity or other investment alternatives, which could negatively impact our Asset Management, Advice & Wealth Management and Annuities businesses. If we are unable to offer appropriate product alternatives which encourage customers to continue purchasing in the face of actual or perceived market volatility, our sales and management fee revenues could decline. Uncertain economic conditions and heightened market volatility may also increase the likelihood that clients or regulators present or threaten legal claims, that regulators may increase the frequency and scope of their examinations of us or the financial services industry generally, and that lawmakers may enact new requirements or taxation which can have a material impact on our revenues, expenses or statutory capital requirements.
Changes
in interest rates and prolonged periods of low interest rates may adversely affect our financial condition and results of operations.
Certain of our insurance and annuity products and certain of our investment products are sensitive to interest rate fluctuations, and future impacts associated with such variations may differ from our historical costs. In addition, interest rate fluctuations could result in fluctuations in the valuation of certain minimum guaranteed benefits contained in some of our variable annuity products. Although we typically hedge to mitigate some of the effect of such fluctuations, significant changes in interest rates could have a material adverse impact on our results of operations.
During periods of increasing market interest rates, we offer higher crediting rates on interest-sensitive products, such as universal life insurance, fixed annuities and face-amount certificates, and we increase crediting rates on in-force products to keep these products competitive. Because yields on invested assets may not increase as quickly as current interest rates, we may have to accept a lower spread and thus lower profitability or face a decline in sales and greater loss of existing contracts and related assets. In addition,
27
increases in market interest rates may cause increased policy surrenders, withdrawals from life insurance policies and annuity contracts and requests for policy loans, as policyholders and contractholders seek to shift assets to products with perceived higher returns. This process may lead to an earlier than expected outflow of cash from our business. These withdrawals and surrenders may require investment assets to be sold at a time when the prices of those assets are lower because of the increase in market interest rates, which may result in realized investment losses. Also, increases in market interest rates may result in extension of certain cash flows from structured mortgage assets. Increases in crediting rates, as well as surrenders and withdrawals, could have an adverse effect on our financial condition and results of operations. An increase in policy surrenders and withdrawals also may require us to accelerate amortization of deferred acquisition costs (“DAC”) or other intangibles or cause an impairment of goodwill, which would increase our expenses and reduce our net earnings.
During periods of falling interest rates or stagnancy of low interest rates, our spread may be reduced or could become negative, primarily because some of our products have guaranteed minimum crediting rates. Due to the long-term nature of the liabilities associated with certain of our businesses, such as long term care and universal life with secondary guarantees as well as fixed annuities and guaranteed benefits on variable annuities, sustained declines in or stagnancy of low long-term interest rates may subject us to reinvestment risks and increased hedging costs. In addition, reduced or negative spreads may require us to accelerate amortization of DAC, which would increase our expenses and reduce our net earnings.
Interest rate fluctuations also could have an adverse effect on the results of our investment portfolio. During periods of declining market interest rates or stagnancy of low interest rates, the interest we receive on variable interest rate investments decreases. In addition, during those periods, we are forced to reinvest the cash we receive as interest or return of principal on our investments in lower-yielding high-grade instruments or in lower-credit instruments to maintain comparable returns. Issuers of certain callable fixed income securities also may decide to prepay their obligations in order to borrow at lower market rates, which increases the risk that we may have to reinvest the cash proceeds of these securities in lower-yielding or lower-credit instruments.
Adverse
capital and credit market conditions may significantly affect our ability to meet liquidity needs, our access to capital and our cost of capital.
The capital and credit markets may experience, and have experienced, varying degrees of volatility and disruption. In some cases, the markets have exerted downward pressure on availability of liquidity and credit capacity for certain issuers. We need liquidity to pay our operating expenses, interest expenses and dividends on our capital stock. Without sufficient liquidity, we could be required to curtail our operations and our business would suffer.
Our liquidity needs are satisfied primarily through our reserves and the cash generated by our operations. We believe the level of cash and securities we maintain when combined with expected cash inflows from investments and operations, is adequate to meet anticipated short-term and long-term benefit and expense payment obligations. In the event current resources are insufficient to satisfy our needs, we may access financing sources such as bank debt. The availability of additional financing would depend on a variety of factors such as market conditions, the general availability of credit, the volume of trading activities, the overall availability of credit to the financial services industry, our credit ratings and credit capacity, as well as the possibility that our shareholders, customers or lenders could develop a negative perception of our long- or short-term financial prospects if we incur large investment losses or if the level of our business activity decreases due to a market downturn. Similarly, our access to funds may be rendered more costly or impaired if regulatory authorities or rating organizations take actions against us.
Disruptions, uncertainty or volatility in the capital and credit markets may also limit our access to capital required to operate our business. Such market conditions may limit our ability to satisfy statutory capital requirements, generate fee income and market-related revenue to meet liquidity needs and access the capital necessary to grow our business. As such, we may be forced to delay raising capital, issue different types of capital than we would otherwise, less effectively deploy such capital, or bear an unattractive cost of capital which could decrease our profitability and significantly reduce our financial flexibility.
A
downgrade or a potential downgrade in our financial strength or credit ratings could adversely affect our financial condition and results of operations.
Financial strength ratings, which various rating organizations publish as a measure of an insurance company’s ability to meet contractholder and policyholder obligations, are important to maintain public confidence in our products, the ability to market our products and our competitive position. A downgrade in our financial strength ratings, or the announced potential for a downgrade, could have a significant adverse effect on our financial condition and results of operations in many ways, including: (i) reducing new sales of insurance and annuity products and investment products; (ii) adversely affecting our relationships with our advisors and third-party distributors of our products; (iii) materially increasing the number or amount of policy surrenders and withdrawals by contractholders and policyholders; (iv) requiring us to reduce prices for many of our products and services to remain competitive; and (v) adversely affecting our ability to obtain reinsurance or obtain reasonable pricing on reinsurance.
A
downgrade in our credit ratings could also adversely impact our future cost and speed of borrowing and have an adverse effect on our financial condition, results of operations and liquidity.
In view of the difficulties experienced in recent years by many financial institutions, including our competitors in the insurance industry, the rating organizations have heightened the level of scrutiny that they apply to such institutions and have requested additional information from the companies that they rate. They may increase the frequency and scope of their credit reviews, adjust upward the capital and other requirements employed in the rating organizations’ models for maintenance of ratings levels, or
28
downgrade ratings applied to particular classes of securities or types of institutions.
Rating organizations may also become subject to tighter laws, regulations or scrutiny governing ratings, which may in turn impact ratings assigned to financial institutions.
We cannot predict what actions rating organizations may take, or what actions we may take in response to the actions of rating organizations, which could adversely affect our business. As with other companies in the financial services industry, our ratings could be changed at any time and without any notice by the rating organizations.
Intense
competition and the economics of changes in our product revenue mix and distribution channels could negatively impact our ability to maintain or increase our market share and profitability.
Our businesses operate in intensely competitive industry segments. We compete based on a number of factors, including name recognition, service, the quality of investment advice, investment performance, product offerings and features, price, perceived financial strength, claims-paying ability and credit ratings. Our competitors include broker-dealers, banks, asset managers, insurers and other financial institutions. Certain of our competitors offer web-based financial services and discount brokerage services to individual clients. Many of our businesses face competitors that have greater market share, offer a broader range of products, have greater financial resources, or have higher claims-paying ability or credit ratings than we do. Some of our competitors may possess or acquire intellectual property rights that could provide a competitive advantage to them in certain markets or for certain products, which could make it difficult for us to introduce new products and services. Some of our competitors’ proprietary products or technology could be similar to our own, and this could result in disputes that could impact our financial condition or results of operations. In addition, over time certain sectors of the financial services industry have become considerably more concentrated, as financial institutions involved in a broad range of financial services have been acquired by or merged into other firms, or distribution firms (including our own) are seeking to limit the breadth of product offerings in order to simplify their regulatory and risk management. This convergence could result in our competitors gaining greater resources, and we may experience downward pressures on our pricing and market share as a result of these factors and as some of our competitors seek to increase market share by reducing prices. Furthermore, the uncertain and new regulatory environment in the U.S. and around the world will cause various structural changes to the industry and other competitors may be better positioned to reap the benefits of that structural change and movement of assets around the industry depending on final regulations and trends among distributors and clients.
The offerings available to our advisor network include not only products issued by our RiverSource Life and Columbia Threadneedle Investments companies, but also products issued by unaffiliated insurance companies and asset managers. As a result of this and further openings of our advisor network to the products of other companies, we could experience lower sales of our companies’ products, higher surrenders or redemptions, or other developments which might not be fully offset by higher distribution revenues or other benefits, possibly resulting in an adverse effect on our results of operations. In addition, some of our products, such as certain products of our Property Casualty companies, are made available through alliances with unaffiliated third parties. We could experience lower sales or incur higher distribution costs or other developments which could have an adverse effect on our results of operations if alliance relationships are discontinued or if the terms of our alliances change.
We
face intense competition in attracting and retaining key talent.
Our continued success depends to a substantial degree on our ability to attract and retain qualified people. We are dependent on our network of advisors to drive growth and results in our wealth management business and also for a significant portion of the sales of our mutual funds, annuities, face-amount certificates and insurance products. In addition, the investment performance of our asset management products and services and the retention of our products and services by our clients are dependent upon the strategies and decisioning of our portfolio managers and analysts. The market for these financial advisors and portfolio managers is extremely competitive, as are the markets for qualified and skilled executives and marketing, finance, legal, compliance and other professionals. From time to time there are regulatory-driven or other trends and developments within the industry, such as the current uncertainty around the Protocol for Broker Recruiting, that could potentially impact the current competitive dynamics between us and our competitors. If we are unable to attract and retain qualified individuals or our recruiting and retention costs increase significantly, our financial condition and results of operations could be materially adversely impacted.
The
impairment or negative performance of other financial institutions could adversely affect us.
We have exposure to many different industries and counterparties, and we routinely execute transactions with counterparties in the financial services industry, including broker-dealers, commercial banks, investment banks, hedge funds, insurers, reinsurers, investment funds and other institutions. The operations of U.S. and global financial services institutions are interconnected and a decline in the financial condition of one or more financial services institutions may expose us to credit losses or defaults, limit our access to liquidity or otherwise disrupt the operations of our businesses. While we regularly assess our exposure to different industries and counterparties, the performance and financial strength of specific institutions are subject to rapid change, the timing and extent of which cannot be known.
Many transactions with and investments in the products and securities of other financial institutions expose us to credit risk in the event of default of our counterparty. With respect to secured transactions, our credit risk may be exacerbated when the collateral we hold cannot be realized upon or is liquidated at prices insufficient to recover the full amount of the loan or derivative exposure due to it. We also have exposure to financial institutions in the form of unsecured debt instruments, derivative transactions (including with respect to derivatives hedging our exposure on variable annuity contracts with guaranteed benefits), reinsurance, repurchase and
29
underwriting arrangements and equity investments. There can be no assurance that any such losses or impairments to the carrying value of these assets would not materially and adversely impact our business and results of operations.
Downgrades in the credit or financial strength ratings assigned to the counterparties with whom we transact or other adverse reputational impacts to such counterparties could create the perception that our financial condition will be adversely impacted as a result of potential future defaults by such counterparties. Additionally, we could be adversely affected by a general, negative perception of financial institutions caused by the downgrade or other adverse impact to the reputation of other financial institutions. Accordingly, ratings downgrades or other adverse reputational impacts for other financial institutions could affect our market capitalization and could limit access to or increase our cost of capital.
A number of the products and services we make available to our clients are those offered by third parties, for which we may generate revenue based on the level of assets under management, the number of client transactions or otherwise. The poor performance of such products and services, or negative perceptions of the firms offering such products and services, may adversely impact our sales of such products and services and reduce our revenue. In addition, such failures or poor performance of products and services offered by other financial institutions could adversely impact consumer confidence in products and services that we offer. Negative perceptions of certain financial products and services, or the financial industry in general, may increase the number of withdrawals and redemptions or reduce purchases made by our clients, which would adversely impact the levels of our assets under management, revenues and liquidity position.
A
drop in our investment performance as compared to that of our competitors could negatively impact our revenues and profitability.
Investment performance is a key competitive factor for our retail and institutional asset management products and services. Strong investment performance helps to ensure the retention of our products and services by our clients and creates new sales of products and services. It may also result in higher ratings by ratings services such as Morningstar or Lipper, which may compound the foregoing effects. Strong investment performance and its effects are important elements to our stated goals of growing assets under management and achieving economies of scale.
There can be no assurance as to how future investment performance will compare to our competitors or that historical performance will be indicative of future returns. Any drop or perceived drop in investment performance as compared to our competitors could cause a decline in sales of our mutual funds and other investment products, an increase in redemptions and the termination of institutional asset management relationships. These impacts may reduce our aggregate amount of assets under management and reduce management fees. Poor investment performance could also adversely affect our ability to expand the distribution of our products through unaffiliated third parties. Further, any drop in market share of mutual funds sales by our advisors may further reduce profits as sales of other companies’ mutual funds are less profitable than sales of our proprietary funds.
We
may not be able to maintain our unaffiliated third-party distribution channels or the terms by which unaffiliated third parties sell our products.
We distribute certain of our investment products and fixed annuities through unaffiliated third-party advisors and financial institutions. Maintaining and deepening relationships with these unaffiliated distributors is an important part of our growth strategy, as strong third-party distribution arrangements enhance our ability to market our products and to increase our assets under management, revenues and profitability. There can be no assurance that the distribution relationships we have established will continue, as our distribution partners may cease to operate or otherwise terminate their relationship with us. Any such reduction in access to third-party distributors may have a material adverse effect on our ability to market our products and to generate revenue in our Asset Management and Annuities segments.
Access to distribution channels is subject to intense competition due to the large number of competitors and products in the investment advisory and annuities industries as well as regulatory and consumer trends driving escalating compliance, disclosure and risk management requirements for distributors. Relationships with distributors are subject to periodic negotiation that may result in increased distribution costs and/or reductions in the amount of our products marketed, and the frequency or complexity of these negotiations is expected to increase in light of prevailing regulatory reforms and market volatility. Any increase in the costs to distribute our products or reduction in the type or amount of products made available for sale may have a material effect on our revenues and profitability.
We
face risks arising from acquisitions and divestitures.
We have made acquisitions and divestitures in the past and may pursue similar strategic transactions in the future. Risks in acquisition transactions include difficulties in the integration of acquired businesses into our operations and control environment (including our risk management policies and procedures), difficulties in assimilating and retaining employees and intermediaries, difficulties in retaining the existing customers of the acquired entities, assumed or unforeseen liabilities that arise in connection with the acquired businesses, the failure of counterparties to satisfy any obligations to indemnify us against liabilities arising from the acquired businesses, and unfavorable market conditions that could negatively impact our growth expectations for the acquired businesses. Fully integrating an acquired company or business into our operations (such as our recent acquisitions of Lionstone Investments and IPI) may take a significant amount of time. Risks in divestiture transactions include difficulties in the separation of the disposed business, retention or obligation to indemnify certain liabilities, the failure of counterparties to satisfy payment obligations, unfavorable market conditions that may impact any earnout or contingency payment due to us and unexpected difficulties in losing employees of the
30
disposed business. We cannot assure you that we will be successful in overcoming these risks or any other problems encountered with acquisitions, divestitures and other strategic transactions. These risks may prevent us from realizing the expected benefits from acquisitions or divestitures and could result in the failure to realize the full economic value of a strategic transaction or the impairment of goodwill and/or intangible assets recognized at the time of an acquisition. These risks could be heightened if we complete a large acquisition or multiple acquisitions within a short period of time.
Third
-party defaults, bankruptcy filings, legal actions and other events may limit the value of or restrict our access and our clients’ access to cash and investments.
Capital and credit market volatility can exacerbate, and has exacerbated, the risk of third-party defaults, bankruptcy filings, foreclosures, legal actions and other events that may limit the value of or restrict our access and our clients’ access to cash and investments. Although we are not required to do so, we have elected in the past, and we may elect in the future, to compensate clients for losses incurred in response to such events, provide clients with temporary credit or liquidity or other support related to products that we manage, or provide credit liquidity or other support to the financial products we manage. Any such election to provide support may arise from factors specific to our clients, our products or industry-wide factors. If we elect to provide additional support, we could incur losses from the support we provide and incur additional costs, including financing costs, in connection with the support. These losses and additional costs could be material and could adversely impact our results of operations. If we were to take such actions we may also restrict or otherwise utilize our corporate assets, limiting our flexibility to use these assets for other purposes, and may be required to raise additional capital.
Defaults
in our fixed maturity securities portfolio or consumer credit holdings could adversely affect our earnings.
Issuers of the fixed maturity securities that we own may default on principal and interest payments. As of December 31, 2017, 4.4% of our fixed maturity securities had ratings below investment-grade. Moreover, economic downturns and corporate malfeasance can increase the number of companies, including those with investment-grade ratings, which default on their debt obligations. Default-related declines in the value of our fixed maturity securities portfolio or consumer credit holdings could cause our net earnings to decline and could also cause us to contribute capital to some of our regulated subsidiaries, which may require us to obtain funding during periods of unfavorable market conditions.
Our
valuation of fixed maturity and equity securities may include methodologies, estimations and assumptions which are subject to differing interpretations and could result in changes to investment valuations that may materially adversely impact our results of operations or financial condition.
Fixed maturity, equity, trading securities and short-term investments, which are reported at fair value on the consolidated balance sheets, represent the majority of our total cash and invested assets. The determination of fair values by management in the absence of quoted market prices is based on: (i) valuation methodologies; (ii) securities we deem to be comparable; and (iii) assumptions deemed appropriate given the circumstances. The fair value estimates are made at a specific point in time, based on available market information and judgments about financial instruments, including estimates of the timing and amounts of expected future cash flows and the credit standing of the issuer or counterparty. Factors considered in estimating fair value include: coupon rate, maturity, estimated duration, call provisions, sinking fund requirements, credit rating, industry sector of the issuer, interest rates, credit spreads, and quoted market prices of comparable securities. The use of different methodologies and assumptions may have a material effect on the estimated fair value amounts.
During periods of market disruption, including periods of significantly rising or high interest rates and rapidly widening credit spreads or illiquidity, it may be difficult to value certain of our securities. There may be certain asset classes that were in active markets with significant observable data that become illiquid due to the financial environment. In such cases, the valuation of certain securities may require additional subjectivity and management judgment. As such, valuations may include inputs and assumptions that are less observable and may require greater estimation as well as valuation methods that are more sophisticated, which may result in values less than the value at which the investments may be ultimately sold. Further, rapidly changing and unexpected credit and equity market conditions could materially impact the valuation of securities as reported within our consolidated financial statements and the period-to-period changes in value could vary significantly. Decreases in value may have a material adverse effect on our results of operations or financial condition.
The
determination of the amount of allowances and impairments taken on certain investments is subject to management’s evaluation and judgment and could materially impact our results of operations or financial position.
The determination of the amount of allowances and impairments vary by investment type and is based upon our periodic evaluation and assessment of inherent and known risks associated with the respective asset class. Such evaluations and assessments are revised as conditions change and new information becomes available. Management updates its evaluations regularly and reflects changes in allowances and impairments in operations as such evaluations are revised. Historical trends may not be indicative of future impairments or allowances.
The assessment of whether impairments have occurred is based on management’s case-by-case evaluation of the underlying reasons for the decline in fair value that considers a wide range of factors about the security issuer or borrower, and management uses its best judgment in evaluating the cause of the decline in the estimated fair value of the security or loan and in assessing the prospects for recovery. Inherent in management’s evaluation of the security or loan are assumptions and estimates about the operations of the issuer and its future earnings potential.
31
Some
of our investments are relatively illiquid.
We invest a portion of our owned assets in certain privately placed fixed income securities, mortgage loans, policy loans and limited partnership interests, all of which are relatively illiquid. These asset classes represented 14.8% of the carrying value of our investment portfolio as of December 31, 2017. If we require significant amounts of cash on short notice in excess of our normal cash requirements, we may have difficulty selling these investments in a timely manner or be forced to sell them for an amount less than we would otherwise have been able to realize, or both, which could have an adverse effect on our financial condition and results of operations.
The
failure of other insurers could require us to pay higher assessments to state insurance guaranty funds.
Our insurance companies are required by law to be members of the guaranty fund association in every state where they are licensed to do business. In the event of insolvency of one or more unaffiliated insurance companies, our insurance companies could be adversely affected by the requirement to pay assessments to the guaranty fund associations. Uncertainty and volatility in the U.S. economy and financial markets in recent years, plus the repercussions of a heightened regulatory environment, have weakened or may weaken the financial condition of numerous insurers, including insurers currently in receiverships, increasing the risk of triggering guaranty fund assessments. For more information regarding assessments from guaranty fund associations, see Note 23 to our Consolidated Financial Statements included in Part II, Item 8 of this Annual Report on Form 10-K.
If
the counterparties to our reinsurance arrangements or to the derivative instruments we use to hedge our business risks default or otherwise fail to fulfill their obligations, we may be exposed to risks we had sought to mitigate, which could adversely affect our financial condition and results of operations.
We use reinsurance to mitigate our risks in various circumstances as described in Item 1 of this Annual Report on Form 10-K - “Business - Our Segments - Protection - Reinsurance.” Reinsurance does not relieve us of our direct liability to our policyholders and contractholders, even when the reinsurer is liable to us. Accordingly, we bear credit and performance risk with respect to our reinsurers, including Genworth Life Insurance Company with whom we finalized various confidential enhancements in July 2016 that have been shared, in the normal course of regular reviews, with our domiciliary regulator and rating agencies. A reinsurer’s insolvency or its inability or unwillingness to make payments under the terms of our reinsurance agreement could have a material adverse effect on our financial condition and results of operations. See Notes 2 and 7 to our Consolidated Financial Statements included in Part II, Item 8 of this Annual Report on Form 10-K for additional information regarding reinsurance.
In addition, we use a variety of derivative instruments (including options, forwards, and interest rate and currency swaps) with a number of counterparties to hedge business risks. The amount and breadth of exposure to derivative counterparties, as well as the cost of derivative instruments, have increased significantly in connection with our strategies to hedge guaranteed benefit obligations under our variable annuity products. If our counterparties fail to honor their obligations under the derivative instruments in a timely manner, our hedges of the related risk will be ineffective. That failure could have a material adverse effect on our financial condition and results of operations. This risk of failure of our hedge transactions from counterparty default may be increased by capital market volatility.
We provide investment securities as collateral to our derivative counterparties which they may sell, pledge, or rehypothecate. We have exposure, under the relevant arrangement, if the collateral is not returned to us to the extent that the fair value of the collateral exceeds our liability. Additionally, we may also accept investment securities as collateral from our derivative counterparties, which we may sell, pledge, or rehypothecate. If the counterparties that we pledge the collateral to are not able to return these investment securities under the terms of the relevant arrangements, we would be required to deliver alternative investments or cash to our derivative counterparty, which could impact our liquidity and could adversely impact our financial condition or results of operations.
If
our reserves for future policy benefits and claims or for future certificate redemptions and maturities are inadequate, we may be required to increase our reserve liabilities, which would adversely affect our results of operations and financial condition.
We establish reserves as estimates of our liabilities to provide for future obligations under our insurance policies, annuities and investment certificate contracts. Reserves do not represent an exact calculation of the liability but, rather, are estimates of contract benefits and related expenses we expect to incur over time. The assumptions and estimates we make in establishing reserves require certain judgments about future experience and, therefore, are inherently uncertain. We cannot determine with precision the actual amounts that we will pay for contract benefits, the timing of payments, or whether the assets supporting our stated reserves will increase to the levels we estimate before payment of benefits or claims. We monitor our reserve levels continually. If we were to conclude that our reserves are insufficient to cover actual or expected contract benefits, we would be required to increase our reserves and incur income statement charges for the period in which we make the determination, which would adversely affect our results of operations and financial condition. For more information on how we set our reserves, see Note 2 to our Consolidated Financial Statements included in Part II, Item 8 of this Annual Report on Form 10-K.
Morbidity
rates, mortality rates or the severity or frequency of other insurance claims that differ significantly from our pricing expectations could negatively affect profitability.
We have historically set, and continue to set, prices for
RiverSource
life disability insurance (and historically long term care insurance) as well as some annuity products based upon expected claim payment patterns, derived from assumptions we make about our policyholders and contractholders, including morbidity and mortality rates. The long-term profitability of these products depends upon how our actual experience compares with our pricing assumptions. For example, if morbidity rates are higher, or mortality rates are
32
lower, than our pricing assumptions, we could be required to make greater payments under disability income insurance policies, chronic care riders and immediate annuity contracts than we had projected. The same holds true for long term care policies we previously underwrote to the extent of the risks that we retained. If mortality rates are higher than our pricing assumptions, we could be required to make greater payments under our life insurance policies and annuity contracts with guaranteed minimum death benefits than we have projected.
The risk that our claims experience may differ significantly from our pricing assumptions is particularly significant for our long term care insurance products notwithstanding our ability to implement future price increases with regulatory approvals. As with life insurance, long term care insurance policies provide for long-duration coverage and, therefore, our actual claims experience will emerge over many years. However, as a relatively new product in the market, long term care insurance does not have the extensive claims experience history of life insurance and, as a result, our ability to forecast future claim rates for long term care insurance is more limited than for life insurance. We have sought to moderate these uncertainties to some extent by partially reinsuring long term care policies at the time the policies were underwritten and by limiting our present stand-alone long term care insurance offerings to policies underwritten fully by unaffiliated third-party insurers, and we have also implemented rate increases on certain in-force policies. Certain estimates and assumptions used in setting our long term care reserves (which is an inherently uncertain and complex process) are described in Item 1 of this Annual Report on Form 10-K - “Business - Our Segments - Corporate & Other - Closed Block Long Term Care Insurance.” We may be required to implement additional rate increases in the future and may or may not receive regulatory approval for the full extent and timing of any rate increases that we may seek.
Unexpected changes in the severity or frequency of claims may affect the profitability of our auto and home insurance business. Recorded claim reserves in the auto and home insurance business are based on our best estimates of losses, both reported and incurred but not reported ("IBNR") claims, after considering known facts and interpretations of circumstances. Internal factors are considered including our experience with similar cases, actual claims paid, historical trends involving claim payment patterns, pending levels of unpaid claims, loss management programs, product mix and contractual terms. External factors are also considered, such as court decisions and changes in law, regulatory requirements, litigation trends, and price levels of medical services, auto and home repairs, and other economic conditions. Because reserves are estimates of the unpaid portion of losses that have occurred, including IBNR losses, the establishment of appropriate reserves, including reserves for catastrophes, is an inherently uncertain and complex process. Increases in claim severity or frequency can also arise from unexpected events that are inherently difficult to predict. Although we pursue various loss management initiatives in our auto and home insurance business in order to mitigate future increases in claim severity, there can be no assurances that these initiatives will successfully identify or reduce the effect of future increases in claim severity or frequency. To address adverse trends in claims we may seek additional rate increases for our auto and home insurance business in the future and may or may not receive regulatory approval for the full extent and timing of any rate increases that we may seek.
We
may face losses if there are significant deviations from our assumptions regarding the future persistency of our insurance policies and annuity contracts.
The prices and expected future profitability of our life insurance and deferred annuity products are based in part upon assumptions related to persistency, which is the probability that a policy or contract will remain in force from one period to the next. Economic and market dislocations may occur and future consumer persistency behaviors could vary materially from the past. The effect of persistency on profitability varies for different products. For most of our life insurance and deferred annuity products, actual persistency that is lower than our persistency assumptions could have an adverse impact on profitability, especially in the early years of a policy or contract, primarily because we would be required to accelerate the amortization of expenses we deferred in connection with the acquisition of the policy or contract.
For our long term care insurance and universal life insurance policies with secondary guarantees, as well as variable annuities with guaranteed minimum withdrawal benefits, actual persistency that is higher than our persistency assumptions could have a negative impact on profitability. If these policies remain in force longer than we assumed, we could be required to make greater benefit payments than we had anticipated when we priced or partially reinsured these products. Some of our long term care insurance policies have experienced higher persistency and poorer morbidity experience than we had assumed, which led us to increase premium rates on certain policies.
Because our assumptions regarding persistency experience are inherently uncertain, reserves for future policy benefits and claims may prove to be inadequate if actual persistency experience is different from those assumptions. Although some of our products permit us to increase premiums during the life of the policy or contract, we cannot guarantee that these increases would be sufficient to maintain profitability. Additionally, some of these pricing changes require regulatory approval, which may not be forthcoming. Moreover, many of our products do not permit us to increase premiums or limit those increases during the life of the policy or contract, while premiums on certain other products (primarily long term care insurance) may not be increased without prior regulatory approval. Significant deviations in experience from pricing expectations regarding persistency could have an adverse effect on the profitability of our products.
We
may be required to accelerate the amortization of DAC, which would increase our expenses.
DAC represent the portion of costs which are incremental and direct to the acquisition of new or renewal business, principally direct sales commissions and other distribution and underwriting costs that have been deferred on the sale of annuity, life and disability income insurance and, to a lesser extent, direct marketing expenses for personal auto and home insurance, and distribution expenses
33
for certain mutual fund products. For annuity and universal life products, DAC are amortized based on projections of estimated gross profits over amortization periods equal to the approximate life of the business. For other insurance products, DAC are generally amortized as a percentage of premiums over amortization periods equal to the premium-paying period. For certain mutual fund products, we generally amortize DAC over fixed periods on a straight-line basis, adjusted for redemptions.
Our projections underlying the amortization of DAC for insurance and annuity products require the use of certain assumptions, including interest margins, mortality rates, persistency rates, maintenance expense levels and customer asset value growth rates for variable products. We periodically review and, where appropriate, adjust our assumptions. When we change our assumptions, we may be required to accelerate the amortization of DAC or to record a charge to increase benefit reserves.
For more information regarding DAC, see Part II, Item 7 of this Annual Report on Form 10-K under the heading “Management’s Discussion and Analysis of Financial Condition and Results of Operations - Critical Accounting Estimates - Deferred Acquisition Costs.”
Misconduct
by our employees and advisors is difficult to detect and deter and could harm our business, results of operations or financial condition.
Misconduct by our employees and advisors could result in violations of law, regulatory sanctions and/or serious reputational or financial harm. Misconduct can occur in each of our businesses and could include: (i) binding us to transactions that exceed authorized limits; (ii) hiding unauthorized or unsuccessful activities resulting in unknown and unmanaged risks or losses; (iii) improperly using, disclosing or otherwise compromising confidential information, including client confidential information; (iv) recommending transactions that are not suitable; (v) engaging in fraudulent or otherwise improper activity, including the misappropriation of funds; (vi) engaging in unauthorized or excessive trading to the detriment of customers; or (vii) otherwise not complying with laws, regulations or our control procedures.
We cannot always deter misconduct by our employees and advisors, and the precautions we take to prevent and detect this activity may not be effective in all cases. Preventing and detecting misconduct among our franchisee advisors who are not employees of our company presents additional challenges. We also cannot assure you that misconduct by our employees and advisors will not lead to a material adverse effect on our business, results of operations or financial condition.
A
failure to protect our reputation could adversely affect our businesses.
Our reputation is one of our most important assets. Our ability to attract and retain customers, investors, employees and advisors is highly dependent upon external perceptions of our company. Damage to our reputation could cause significant harm to our business and prospects and may arise from numerous sources, including litigation or regulatory actions, failing to deliver minimum standards of service and quality, compliance failures, any perceived or actual weakness in our financial strength or liquidity, technological, cybersecurity, or other security breaches (including attempted breaches) resulting in improper disclosure of client or employee personal information, unethical behavior and the misconduct of our employees, advisors and counterparties. Negative perceptions or publicity regarding these matters could damage our reputation among existing and potential customers, investors, employees and advisors. Reputations may take decades to build, and any negative incidents can quickly erode trust and confidence, particularly if they result in adverse mainstream and social media publicity, governmental investigations or litigation. Adverse developments with respect to our industry may also, by association, negatively impact our reputation or result in greater regulatory or legislative scrutiny or litigation against us.
Our reputation is also dependent on our continued identification of and mitigation against conflicts of interest. As we have expanded the scope of our businesses and our client base, we increasingly have to identify and address potential conflicts of interest, including those relating to our proprietary activities and those relating to our sales of non-proprietary products from manufacturers that have agreed to provide us marketing, sales and account maintenance support. For example, conflicts may arise between our position as a provider of financial planning services and as a manufacturer and/or distributor or broker of asset accumulation, income or insurance products that one of our advisors may recommend to a financial planning client. We have procedures and controls that are designed to identify, address and appropriately disclose perceived conflicts of interest. However, identifying and appropriately addressing conflicts of interest is complex, and our reputation could be damaged if we fail, or appear to fail, to address conflicts of interest appropriately.
In addition, the SEC and other federal and state regulators have increased their scrutiny of potential conflicts of interest. It is possible that potential or perceived conflicts could give rise to litigation or enforcement actions. It is possible also that the regulatory scrutiny of, and litigation in connection with, conflicts of interest will make our clients less willing to enter into transactions in which such a conflict may occur, and will adversely affect our businesses.
Our
operational systems and networks have been, and will continue to be, subject to evolving cybersecurity or other technological risks, which could result in the disclosure of confidential client information, loss of our proprietary information, damage to our reputation, additional costs to us, regulatory penalties and other adverse impacts. The same is true for systems, networks and operations that franchise advisors control locally.
Our business is reliant upon internal, third-party personnel, technology systems and networks to process, transmit and store information, including sensitive client and proprietary information, and to conduct many of our business activities and transactions with our clients, advisors, vendors and other third parties. Maintaining the security and integrity of this information and these systems and networks is critical to the success of our business operations, including our reputation, the retention of our advisors and clients,
34
and to the protection of our proprietary information and our clients’ personal information. To date, we have not experienced any material breaches of or interference with our centrally controlled systems and networks, however, we routinely face and address such threats. For example, in past years we and other financial institutions experienced distributed denial of service attacks intended to disrupt the centrally controlled systems that provide clients with access to online systems and information. While we have been able to detect and respond to these incidents to date without loss of client assets or information, we enhanced our corporate security capabilities and will continue to assess our ability to monitor for, detect, prevent, mitigate, respond to and recover from such threats. In addition to the foregoing, our (and our advisors’) experiences with cybersecurity and technology threats have included phishing scams, account takeovers, introductions of malware, attempts at electronic break-ins, and the submission of fraudulent payment requests. Any successful breaches or interference (as well as attempted breaches or interference) by third parties or by insiders that may occur in the future could have a material adverse impact on our business, reputation, financial condition or results of operations.
On a corporate basis, we are subject to international, federal and state regulations, and in some cases contractual obligations, that require us to establish and maintain corporate policies and procedures designed to protect sensitive client, employee, contractor and vendor information. We have implemented policies that require our franchisee advisors who control locally their own technology operations to do the same. We have implemented and maintain security measures designed to protect against breaches of corporate security and other interference with our corporate systems and networks resulting from attacks by third parties, including hackers, and from employee, advisor or service provider error or malfeasance. We also contractually require third-party vendors who, in the provision of services to us, are provided with access to our systems and information pertaining to our business or our clients, to meet certain information security standards. We recommend through policies that franchise advisors do the same with their third-party vendors. Changes in our client base, the mix of assets under management or administration and business model or technology platform changes, such as an evolution to accommodate mobile computing, virtual interface and multi-device functionality, may also require corresponding changes in our systems, networks and data security measures. While accessing our products and services, our customers may use computers and other devices that sit outside of our security control. In addition, the ever-increasing reliance on technology systems and networks and the occurrence and potential adverse impact of attacks on such systems and networks (including in recent well-publicized security breaches at other companies), both generally and in the financial services industry, have enhanced government and regulatory scrutiny of the measures taken by companies to protect against cybersecurity threats. As these threats, and government and regulatory oversight of associated risks, continue to evolve, we may be required to expend additional resources to enhance or expand upon the security measures we currently maintain or that we allow franchise advisors to maintain and control locally.
Despite the measures we have taken and may in the future take to address and mitigate cybersecurity and technology risks, we cannot assure you that our systems and networks will not be subject to successful attacks, breaches or interference. Nor can we always assure you that franchise advisors will do what we recommend in this regard. Any such event may result in operational disruptions (including for example, various delays or mistakes in materials provided to our clients and shareholders in the Columbia Threadneedle Investments funds, as well as impacts to pricing, calculation and trading operations for the Columbia Threadneedle Investments funds and various operations for our other businesses),
as
well
as
unauthorized
access
to
or
the
disclosure
or
loss
of,
our
proprietary
information
or
our
clients’
personal information, which in turn may result in legal claims, regulatory scrutiny and liability, reputational damage, the incurrence of costs to eliminate or mitigate further exposure, the loss of clients or advisors or other damage to our business. While we maintain cyber liability insurance that provides both third-party liability and first-party liability coverages, this insurance may not be sufficient to protect us against all cybersecurity-related losses. Furthermore, we may be subject to indemnification costs and liability to third parties if we breach any confidentiality obligations regarding vendor data or for losses related to the data. In addition, the trend toward broad consumer and general-public notification of such incidents could exacerbate the harm to our business, reputation, financial condition or results of operations. Even if we successfully protect our technology infrastructure and the confidentiality of sensitive data, we may incur
significant
expenses
in
connection
with our responses to
any
such
attacks,
as
well
as
the
adoption, implementation
and maintenance
of
appropriate
security
measures. In
addition, our regulators may seek to hold our company responsible for the acts or omissions of our franchise advisors even where they procure and control much of the technology infrastructure they use to operate their businesses locally. We could also suffer harm to our business and reputation if attempted security breaches are publicized regardless of whether or not harm was actually done to any client or client information. We cannot be certain that advances in criminal capabilities, discovery of new vulnerabilities, attempts to exploit vulnerabilities in our systems or third-party systems we or our franchise advisors use, data thefts, physical system or network break-ins or inappropriate access, or other developments will not compromise or breach the technology or other security measures protecting the networks and systems used in connection with our business.
Protection
from system interruptions and operating errors is important to our business. If we experience a sustained interruption to our telecommunications or data processing systems, or other failure in operational execution, it could harm our business.
Operating errors and system or network interruptions could delay and disrupt our ability to develop, deliver or maintain our products and services, or to operate compliance or risk management functions, causing harm to our business and reputation and resulting in loss of our advisors, clients or revenue. Interruptions could be caused by operational failures arising from service provider, employee or advisor error or malfeasance, interference by third parties, including hackers, our implementation of new technology, as well as from our maintenance of existing technology. Our financial, accounting, data processing or other operating systems and facilities may fail to operate or report data properly, experience connectivity disruptions or otherwise become disabled as a result of events that are wholly or partially beyond our control, adversely affecting our ability to process transactions or provide products and services to our clients. These interruptions can include fires, floods, earthquakes and other natural disasters, power losses, equipment failures, attacks by third
35
parties, failures of internal or vendor personnel, software, equipment or systems and other events beyond our control. Although we have developed and maintain a comprehensive business continuity plan that covers potential disruptions to centrally controlled systems and platforms and require our key technology vendors and service providers to do the same, there are inherent limitations in such plans and they might not, despite testing and monitoring, operate as designed in the event of an actual event or crisis. Further, we cannot control the execution of any business continuity plans implemented by our service providers or our franchise advisors.
We rely on third-party service providers and vendors for certain communications, technology and business functions and other services, and we face the risk of operational failure (including, without limitation, failure caused by an inaccuracy, untimeliness or other deficiency in data reporting), termination or capacity constraints of any of the clearing agents, exchanges, clearing houses or other third-party service providers that we use to facilitate or are component providers to our securities transactions and other product manufacturing and distribution activities. For example, most of our applications run on a technology infrastructure managed on an outsourced basis by IBM since 2002. Under this arrangement, IBM is responsible for all mainframe, mid-range, computing network and storage operations, which includes a portion of our web hosting operations, and we are subject to the risks of any operational failure, termination or other restraints in this arrangement. These risks are heightened by our deployment in response to both investor interest and evolution in the financial markets of increasingly sophisticated products, such as those which incorporate automatic asset re-allocation, long/short trading strategies or multiple portfolios or funds, and business-driven hedging, compliance and other risk management or investment or financial management strategies. Any such failure, termination or constraint could adversely impact our ability to effect transactions, service our clients, manage our exposure to risk, or otherwise achieve desired outcomes.
Risk
management policies and procedures may not be fully effective in identifying or mitigating risk exposure in all market environments or against all types of risk, including employee and financial advisor misconduct.
We have devoted significant resources to develop our risk management policies and procedures and will continue to do so. Nonetheless, our policies and procedures to identify, monitor and manage risks may not be fully effective in mitigating our risk exposure in all market environments or against all types of risk. Many of our methods of managing risk and the associated exposures are based upon our use of observed historical market behavior or statistics based on historical models. During periods of market volatility, or due to unforeseen events, the historically-derived correlations upon which these methods are based may not be valid. As a result, these methods may not predict future exposures accurately, which could be significantly greater than what our models indicate. This could cause us to incur investment losses or cause our hedging and other risk management strategies to be ineffective. Other risk management methods depend upon the evaluation of information regarding markets, clients, catastrophe occurrence or other matters that are publicly available or otherwise accessible to us, which may not always be accurate, complete, up-to-date or properly evaluated.
Moreover, we are subject to the risks of errors and misconduct by our employees and advisors, such as fraud, non-compliance with policies, recommending transactions that are not suitable, and improperly using or disclosing confidential information. These risks are difficult to detect in advance and deter, and could harm our business, results of operations or financial condition. We are further subject to the risk of nonperformance or inadequate performance of contractual obligations by third-party vendors of products and services that are used in our businesses. Management of operational, legal and regulatory risks requires, among other things, policies and procedures to record properly and verify a large number of transactions and events, and these policies and procedures may not be fully effective in mitigating our risk exposure in all market environments or against all types of risk. Insurance and other traditional risk-shifting tools may be held by or available to us in order to manage certain exposures, but they are subject to terms such as deductibles, coinsurance, limits and policy exclusions, as well as risk of counterparty denial of coverage, default or insolvency.
As
a holding company, we depend on the ability of our subsidiaries to transfer funds to us to pay dividends and to meet our obligations.
We act as a holding company for our subsidiaries, through which substantially all of our operations are conducted. Dividends from our subsidiaries and permitted payments to us under our intercompany arrangements with our subsidiaries are our principal sources of cash to pay shareholder dividends and to meet our other financial obligations. These obligations include our operating expenses and interest and principal on our borrowings. If the cash we receive from our subsidiaries pursuant to dividend payment and intercompany arrangements is insufficient for us to fund any of these obligations, we may be required to raise cash through the incurrence of additional debt, the issuance of additional equity or the sale of assets. If any of this happens, it could adversely impact our financial condition and results of operations.
Insurance and securities laws and regulations regulate the ability of many of our subsidiaries (such as our insurance and brokerage subsidiaries and our face-amount certificate company) to pay dividends or make other permitted payments. See Item 1 of this Annual Report on Form 10-K - “Regulation” as well as the information contained in Part II, Item 7 under the heading “Management’s Discussion and Analysis of Financial Condition and Results of Operations - Liquidity and Capital Resources.” In addition to the various regulatory restrictions and local law requirements that constrain our subsidiaries’ ability to pay dividends or make other permitted payments to our company, the rating organizations impose various capital requirements on our company and our insurance company subsidiaries in order for us to maintain our ratings and the ratings of our insurance subsidiaries. The value of assets on the company-level balance sheets of our subsidiaries is a significant factor in determining these restrictions and capital requirements. As asset values decline, our and our subsidiaries’ ability to pay dividends or make other permitted payments can be reduced. Additionally, the various asset classes held by our subsidiaries, and used in determining required capital levels, are weighted differently or are restricted as to the proportion in which they may be held depending upon their liquidity, credit risk and other factors. Volatility in
36
relative asset values among different asset classes can alter the proportion of our subsidiaries’ holdings in those classes, which could increase required capital and constrain our and our subsidiaries’ ability to pay dividends or make other permitted payments. The regulatory capital requirements and dividend-paying ability of our subsidiaries may also be affected by a change in the mix of products sold by such subsidiaries. For example, fixed annuities typically require more capital than variable annuities, and an increase in the proportion of fixed annuities sold in relation to variable annuities could increase the regulatory capital requirements of our life insurance subsidiaries. This may reduce the dividends or other permitted payments which could be made from those subsidiaries in the near term without the rating organizations viewing this negatively. Further, the capital requirements imposed upon our subsidiaries may be impacted by heightened regulatory scrutiny and intervention, which could negatively affect our and our subsidiaries’ ability to pay dividends or make other permitted payments. Additionally, in the past we have found it necessary and advisable to provide support to certain of our subsidiaries in order to maintain adequate capital for regulatory or other purposes and we may provide such support in the future. The provision of such support could adversely affect our excess capital, liquidity, and the dividends or other permitted payments received from our subsidiaries.
The
operation of our business in foreign markets and our investments in non-U.S. denominated securities and investment products subjects us to exchange rate and other risks in connection with international operations and earnings and income generated overseas.
While we are a U.S.-based company, a significant portion of our business operations occurs outside of the U.S. and some of our investments are not denominated in U.S. dollars. As a result, we are exposed to certain foreign currency exchange risks that could reduce U.S. dollar equivalent earnings as well as negatively impact our general account and other proprietary investment portfolios. Appreciation of the U.S. dollar could unfavorably affect net income from foreign operations, the value of non-U.S. dollar denominated investments and investments in foreign subsidiaries. In comparison, depreciation of the U.S. dollar could positively affect our net income from foreign operations and the value of non-U.S. dollar denominated investments, though such depreciation could also diminish investor, creditor and rating organizations’ perceptions of our company compared to peer companies that have a relatively greater proportion of foreign operations or investments.
We may seek to mitigate these risks by employing various hedging strategies including entering into derivative contracts. Currency fluctuations, including the effect of changes in the value of U.S. dollar denominated investments that vary from the amounts ultimately needed to hedge our exposure to changes in the U.S. dollar equivalent of earnings and equity of these operations, may adversely affect our results of operations, cash flows or financial condition.
In addition, conducting and increasing our international operations subjects us to new risks that, generally, we have not faced in the U.S., including: (i) unexpected changes in foreign regulatory requirements, (ii) difficulties in managing and staffing international operations, (iii) potentially adverse tax consequences, including the complexities of foreign value added tax systems and restrictions on the repatriation of earning, (iii) the localization of our solutions and related costs, (iv) the burdens of complying with a wide variety of foreign laws and different legal standards, including laws and regulations; (v) increased financial accounting and reporting burdens and complexities; and (vi) local, regional and global political, social and economic instability abroad. The occurrence of any one of these risks could negatively affect our international business and, consequently, our results of operations generally. Additionally, operating in international markets also requires significant management attention and financial resources. We cannot be certain that the investment and additional resources required in establishing, acquiring or integrating operations in other countries, or adjusting to changes in local or regional political environments (such as may result from Brexit) will produce desired levels of revenues or profitability.
As an example, with Brexit there is a significant degree of uncertainty about how negotiations relating to the UK’s withdrawal and new trade agreements will be conducted, as well as the potential consequences and precise timeframe for Brexit. While the UK invoked article 50 of the Treaty of Lisbon in serving its relevant notice to leave the European Union on March 30, 2019, the full impact remains uncertain. During this period and beyond, the impact of any partial or complete dissolution of the EU on the UK and European economies and the broader global economy could be significant, resulting in negative impacts on currency and financial markets generally, such as increased volatility and illiquidity, and potentially lower economic growth in markets in the UK, Europe and globally, which may adversely affect the value of the
Columbia Threadneedle Investments
fund’s portfolio investments. The UK has one of the largest economies in Europe, and member countries of the EU are substantial trading partners of the UK. The City of London’s economy is dominated by financial services, some of which may have to move outside of the UK postreferendum (e.g., currency trading, international settlement). Under the referendum, banks may be forced to move staff and comply with two separate sets of rules or lose business to banks in Europe. Furthermore, the referendum creates the potential for decreased trade, the possibility of capital outflows, devaluation of the pound sterling, the cost of higher corporate bond spreads due to uncertainty, and the risk that all the above could damage business and consumer spending as well as foreign direct investment. As a result of the referendum, the British economy and its currency may be negatively impacted by changes to its economic and political relations with the EU. Any further exits from the EU, or the possibility of such exits, would likely cause additional market disruption globally and introduce new legal and regulatory uncertainties. The impact of Brexit in the near- and long-term is still unknown and could have additional adverse effects on economies, financial markets, currencies and asset valuations around the world.
37
The
occurrence of natural or man-made disasters and catastrophes could adversely affect our results of operations and financial condition.
The occurrence of natural disasters and catastrophes, including earthquakes, hurricanes, floods, tornadoes, fires, blackouts, severe winter weather, explosions, pandemic disease and man-made disasters, including acts of terrorism, insurrections and military actions, could adversely affect our results of operations or financial condition. Such disasters and catastrophes may damage our facilities, preventing our employees and financial advisors from performing their roles or otherwise disturbing our ordinary business operations and by impacting insurance claims, as described below. These impacts could be particularly severe to the extent they affect our computer-based data processing, transmission, storage and retrieval systems and destroy or release valuable data. Such disasters and catastrophes may also impact us indirectly by changing the condition and behaviors of our customers, business counterparties and regulators, as well as by causing declines or volatility in the economic and financial markets.
The potential effects of natural and man-made disasters and catastrophes on certain of our businesses include but are not limited to the following: (i) a catastrophic loss of life may materially increase the amount of or accelerate the timing in which benefits are paid under our insurance policies; (ii) significant widespread property damage may materially increase the amount of claims submitted under our property casualty insurance policies; (iii) an increase in claims and any resulting increase in claims reserves caused by a disaster may harm the financial condition of our reinsurers, thereby impacting the cost and availability of reinsurance and the probability of default on reinsurance recoveries; and (iv) declines and volatility in the financial markets may decrease the value of our assets under management and administration, which could harm our financial condition and reduce our management fees.
We cannot predict the timing and frequency with which natural and man-made disasters and catastrophes may occur, nor can we predict the impact that changing climate conditions may have on the frequency and severity of natural disasters or on overall economic stability and sustainability. As such, we cannot be sure that our actions to identify and mitigate the risks associated with such disasters and catastrophes, including predictive modeling, establishing liabilities for expected claims, acquiring insurance and reinsurance and developing business continuity plans, will be effective.
Legal, Regulatory and Tax Risks
Legal
and regulatory actions are inherent in our businesses and could result in financial losses or harm our businesses.
We are, and in the future may be, subject to legal and regulatory actions in the ordinary course of our operations, both domestically and internationally. Actions brought against us may result in awards, settlements, penalties, injunctions or other adverse results, including reputational damage. In addition, we may incur significant expenses in connection with our defense against such actions regardless of their outcome. Various regulatory and governmental bodies have the authority to review our products and business practices and those of our employees and independent financial advisors and to bring regulatory or other legal actions against us if, in their view, our practices, or those of our employees or advisors, are improper. Pending legal and regulatory actions include proceedings relating to aspects of our businesses and operations that are specific to us and proceedings that are typical of the industries and businesses in which we operate. Some of these proceedings have been brought on behalf of various alleged classes of complainants. In certain of these matters, the plaintiffs are seeking large and/or indeterminate amounts, including punitive or exemplary damages. See Item 3 of this Annual Report on Form 10-K - “Legal Proceedings.” In or as a result of turbulent times, the volume of claims and amount of damages sought in litigation and regulatory proceedings generally increase.
Our
businesses are regulated heavily, and changes to the laws and regulations applicable to our businesses may have an adverse effect on our operations, reputation and financial condition.
Virtually all aspects of our business, including the activities of our parent company and our various subsidiaries, are subject to various federal, state and international laws and regulations. For a discussion of the regulatory framework in which we operate, see “Business - Regulation.” included in Part I, Item 1 of this Annual Report on Form 10-K. Compliance with these applicable laws and regulations is time-consuming and personnel-intensive, and we have invested and will continue to invest substantial resources to ensure compliance by our parent company and our subsidiaries, directors, officers, employees, registered representatives and agents. Any enforcement actions, investigations or other proceedings brought against us or our subsidiaries, directors, employees or advisors by our regulators may result in fines, injunctions or other disciplinary actions that could harm our reputation or impact our results of operations. Further, any changes to the laws and regulations applicable to our businesses, as well as changes to the interpretation and enforcement of such laws and regulations, may affect our operations and financial condition. Such changes may impact our operations and profitability and the practices of our advisors, including with respect to the scope of products and services provided, the manner in which products and services are marketed and sold and the incurrence of additional costs of doing business. Ongoing changes to regulation and oversight of the financial industry may produce results, the full impact of which cannot be immediately ascertained. In addition, we expect the worldwide demographic trend of population aging will cause policymakers to continue to focus on the framework of U.S. and non-U.S. retirement systems, which may drive additional changes regarding the manner in which individuals plan for and fund their retirement, the extent of government involvement in retirement savings and funding, the regulation of retirement products and services and the oversight of industry participants. For example, we continue to see enhanced legislative and regulatory interest regarding retirement investing, financial advisors and investment professionals, and we will continue to closely review and monitor any legislative or regulatory proposals and changes. Any incremental requirements, costs and risks imposed on us in connection with such current or future legislative or regulatory changes may constrain our ability to market our products and services to potential customers, and could negatively impact our profitability and make it more difficult for us to pursue our growth strategy.
38
Certain examples of legislative and regulatory changes that may impact our businesses are described below. Some of the changes could present operational challenges and increase costs. Ultimately these complexities and increased costs could have an impact on our ability to offer cost-effective and innovative insurance products to our clients.
The Department of Labor published regulations in April 2016 that expanded the scope of who is considered an ERISA fiduciary and these regulations focus in large part on investment recommendations made by financial advisors, registered investment advisors, and other investment professionals to retirement investors, how financial advisors are able to discuss IRA rollovers, as well as how financial advisors and affiliates can transact with retirement investors. Tax qualified accounts, particularly IRAs, make up a significant portion of our assets under management and administration. The first phase of the regulations went into effect on June 9, 2017 and requires financial advisors to make recommendations related to assets held in IRAs and employer sponsored retirement plans in accordance with the following impartial conduct standards: recommendations must be in the best interest of the client, compensation paid for the recommendations must be reasonable and the financial advisor must not make any misleading statements. We adopted policies and procedures designed to comply with the impartial conduct standards and communicated those policies and procedures to our advisors and staff. The second phase of the regulation pertaining to a new “best interest contract exemption” would put into place a number of additional requirements including entering into a best interest contract with clients, enhanced disclosure of fees and conflicts of interest, limits on differential commissions within a product category, the adoption of policies and procedures to ensure the best interest standard is met, and findings related to platforms that are limited to products that pay third-party payments and/or include proprietary products. The second phase of the regulation is currently scheduled to become effective on July 1, 2019. However, these regulations are currently under review by the Department of Labor to determine if further revisions to the regulations are advisable. As a result, it is unclear whether the Department of Labor will substantially rescind or revise the regulations as adopted in 2016.
In addition, the Securities and Exchange Commission is also working on developing its own fiduciary standard that would apply to recommendations made by financial advisors who work on a commission basis and would apply regardless of the type of account (IRA or non-qualified) an investor holds. Furthermore, several states have either issued their own fiduciary rules or are considering doing so and those rules may extend to certain types of products (e.g. insurance and annuities, financial planning, etc.) or may broadly cover all recommendations made by financial advisors. We are also seeing self-regulatory bodies like the Certified Financial Planner Board working on a fiduciary standard that would apply to financial advisors who hold a Certified Financial Planner designation. Currently, Ameriprise has approximately 4,100 financial advisors that hold a Certified Financial Planner designation. In light of the various fiduciary rules and regulations that have been proposed or finalized, we continue to exert significant efforts to evaluate and prepare to comply with each rule.
Depending on the span and substance of any fiduciary rules and regulations and timing of their applicability, the scope of any implementation could impact the way we compensate our advisors, particularly with respect to the sale of commission-based products, the access that representatives of affiliated and unaffiliated product manufacturers could have to our advisors and clients, and the manner and degree to which we and our advisors could have selling and marketing costs reimbursed by product manufacturers. We have incurred infrastructure costs in anticipation of compliance with these new regulations, and ongoing costs will be driven by how these regulations may evolve over the course of time. Depending on the final regulations, we could be subject to both increased litigation risk and the possibility of overlapping or competing requirements from other regulators. Our solutions may be different than some or all of our competitors which may lead us to having a competitive advantage or disadvantage as compared to our peers. How our advisors, prospective advisor recruits, distribution partners, competitors and the broader financial industry adapt to any final regulation, or how clients, prospective clients and regulators react to industry and business changes driven thereof, will evolve over the course of time.
MiFID II came into effect on January 3, 2018 and is the most significant regulatory change EU investment firms have faced since the EU financial service action plan in 2006 which sought to establish the EU single market for financial services. MiFID II strengthens the requirement for investment firms to act in the client’s best interest, in many areas including conflicts of interest (specifically, inducements and a prohibition on free research), strengthening of best execution requirements and increased costs and charges disclosure, in relation to all services provided to clients. In response to MiFID II, Columbia Threadneedle Investments has implemented wide ranging changes to systems, policies and operating procedures across its business. Implementation of our internal measures will have direct and indirect impacts on us and certain of our affiliates, including significant changes to client servicing models, distribution models, the fees we are able to charge to clients and the way that our affiliates execute investment decisions for client portfolios. MiFID II and similar regimes may result in existing flows of business moving to less profitable channels or even to competitors providing substitutable products outside the regime. The interpretation of the inducements rules has also resulted in major changes to how fund managers finance investment research with many firms opting to pay for third-party investment research for client accounts covered by MiFID II. There is no assurance we will continue to have access to the third-party broker-dealers, banks, investment advisers and other financial intermediaries that currently distribute our products, or continue to have the opportunity to offer all or some of our existing products through them. Any inability to access and successfully sell our products to clients through third-party distribution channels could have a negative effect on our level of AUM and overall business and financial condition.
Effective May 2018, the EU’s GDPR will strengthen and unify data protection rules for individuals within the EU. GDPR also addresses export of personal data outside the EU. Compliance with the stringent rules under GDPR will require an extensive review of all of our global data processing systems. A failure to comply with GDPR could result in fines up to 20 million Euros or 4% of annual global revenues, whichever is higher.
39
As a result of our deregistration as a savings and loan holding company, we are no longer subject to regulation, supervision and examination as such by the Board of Governors for the FRB. However, the Dodd-Frank Act authorizes the Financial Stability Oversight Committee (“FSOC”) to designate certain non-bank institutions as systemically important financial institutions subject to regulation as such by the FRB. In the event we are so designated in the future, we would again be subject to enhanced supervision and prudential standards, including requirements related to risk-based capital, leverage, liquidity, credit exposure, stress-testing, resolution plans, early remediation, and certain risk management requirements. Any such designation could cause us to alter our business practices or otherwise adversely impact our results of operation.
Any mandated reductions or restructuring of the fees we charge for our products and services resulting from regulatory initiatives or proceedings could reduce our revenues and/or earnings. Fees paid by mutual funds in accordance with plans and agreements of distribution adopted under Rule 12b-1 promulgated under the Investment Company Act and by other sources of managed products are commonly found as a means for product manufacturers and distribution platforms to address the costs of these products and investor education. The SEC has in the past and could again propose measures that would establish a new framework to repeal Rule 12b-1. Certain industry-wide reduction or restructuring of Rule 12b-1 fees, or other servicing fees, could impact our ability to distribute our own mutual funds and/or the fees we receive for distributing other companies’ mutual funds to our commission-based brokerage customers, which could, in turn, impact our revenues and/or earnings.
Our insurance companies are subject to state regulation and must comply with statutory reserve and capital requirements. State regulators, as well as the NAIC, continually review and update these requirements and other requirements relating to the business operations of insurance companies, including their underwriting and sales practices and their use of affiliated captive insurers. Changes in these requirements that are made for the benefit of the consumer sometimes lead to additional expense for the insurer and, thus, could have a material adverse effect on our financial condition and results of operations. In December 2012, the NAIC adopted a new reserve valuation manual that applies principles-based reserve standards to life insurance products. The valuation manual has been adopted by the required number of states and the percentage of U.S. insurance premium threshold has been reached, therefore, the valuation manual was effective for companies domiciled in adopted states on January 1, 2017. Minnesota adopted the valuation manual in 2016 and New York announced it will adopt the valuation manual in January 2018 (although New York has not adopted the valuation manual as of this date). The RiverSource Life companies have developed an implementation plan and expect to have the capability to complete principles-based reserve valuation in December 2018 for a selected product and continue implementation for all life insurance products throughout the three-year transition period ending in 2020. The requirement for principles-based life insurance reserves may result in statutory reserves being more sensitive to changes in interest rates, policyholder behavior and other market factors. It is not possible at this time to estimate the potential impact of future changes in statutory reserve and capital requirements on our insurance businesses. Further, we cannot predict the effect that proposed federal legislation may have on our businesses or competitors, such as the option of federally chartered insurers, a mandated federal systemic risk regulator, future initiatives of the FIO within the Department of the Treasury or by any of the Domiciliary Regulators or the International Association of Insurance Supervisors with respect to insurance holding company supervision, capital standards or systemic risk regulation. For additional discussion on the role and activities of the FIO, see the information provided under the heading “Regulation - Insurance Regulation” included in Part I, Item 1 of this Annual Report on Form 10-K.
Changes
in the supervision and regulation of the financial industry, both domestically and internationally, could materially impact our results of operations, financial condition and liquidity.
The Dodd-Frank Act, enacted into law in 2010 called for sweeping changes in the supervision and regulation of the financial services industry designed to provide for greater oversight of financial industry participants, reduce risk in banking practices and in securities and derivatives trading, enhance public company corporate governance practices and executive compensation disclosures, and provide greater protections to individual consumers and investors. In June 2017, the U.S. House of Representatives passed the CHOICE Act that would make sweeping changes to the financial regulatory system by amending, repealing and replacing certain portions of the Dodd-Frank Act. The prospects of this in the Senate are unclear and the CHOICE Act is not yet law and may not become law. However, the CHOICE Act is reflective of aspects of the current U.S. regulatory environment and the Trump Administration has indicated it intends to advance a variety of financial regulatory relief measures through Executive Branch action and to effect a potentially significant shift in the supervisory approach of agencies. This has wide-ranging implications for our business lines as well as parent company regulation.
Accordingly, while certain elements of these reforms have yet to be finalized and implemented (and implemented aspects of Dodd-Frank could be changed under the Trump administration though the CHOICE Act or otherwise), the Dodd-Frank Act has impacted and is expected to further impact the manner in which we market our products and services, manage our company and its operations and interact with regulators, all of which could materially impact our results of operations, financial condition and liquidity. Certain provisions of the Dodd-Frank Act that may impact our business include but are not limited to the establishment of a fiduciary standard for broker-dealers, the resolution authority granted to the FDIC, changes in regulatory oversight and greater oversight over derivatives instruments and trading. We will need to respond to changes to the framework for the supervision of U.S. financial institutions, including the actions of the FSOC. To the extent the Dodd-Frank Act, the CHOICE Act or other new regulation of the financial services industry impacts the operations, financial condition, liquidity and capital requirements of unaffiliated financial institutions with whom we transact business, those institutions may seek to pass on increased costs, reduce their capacity to transact, or otherwise present inefficiencies in their interactions with us.
40
It is uncertain whether the Dodd-Frank Act, the rules and regulations developed thereunder, or any future legislation designed to stabilize the financial markets, the economy generally, or provide better protections to consumers (including the CHOICE Act), will have the intended effect. Any new domestic or international legislation or regulatory changes could require us to change certain business practices, impose additional costs, or otherwise adversely affect our business operations, regulatory reporting relationships, results of operations or financial condition. Consequences may include substantially higher compliance costs as well as material effects on fee rates, interest rates and foreign exchange rates, which could materially impact our investments, results of operations and liquidity in ways that we cannot predict. In addition, prolonged government support for, and intervention in the management of, private
institutions
could
distort
customary
and
expected
commercial
behavior
on
the
part of those institutions, adversely
impacting us.
In recent years, other national and international authorities have also proposed measures intended to increase the intensity of regulation of financial institutions, requiring greater coordination among regulators and efforts to harmonize regulatory regimes. These measures have included enhanced risk-based capital requirements, leverage limits, liquidity and transparency requirements, single counterparty exposure limits, governance requirements for risk management, stress-test requirements, debt-to-equity limits for certain companies, early remediation procedures, resolution and recovery planning and guidance for maintaining appropriate risk culture. Our international operations and our worldwide consolidated operations are subject to the jurisdiction of certain of these non-U.S. authorities and may be materially adversely affected by their actions and decisions. Potential measures taken by foreign and international authorities also include the nationalization or expropriation of assets, the imposition of limits on foreign ownership of local companies, changes in laws (including tax laws and regulations) and in their application or interpretation, imposition of large fines, political instability, dividend limitations, price controls, changes in applicable currency, currency exchange controls, or other restrictions that prevent us from transferring funds from these operations out of the countries in which they operate or converting local currencies we hold to U.S. dollars or other currencies. Any of these changes or actions may negatively affect our business. A further result of our non-U.S. operations is that we are subject to regulation by non-U.S. regulators and U.S. regulators such as the Department of Justice and the SEC with respect to the Foreign Corrupt Practices Act of 1977. We expect the scope and extent of regulation outside the U.S., as well as general regulatory oversight, to continue to increase.
Changes
in corporate tax laws and regulations (including recent U.S. federal tax reform) and changes in the interpretation of such laws and regulations, as well as adverse determinations regarding the application of such laws and regulations, could adversely affect our earnings and could make some of our products less attractive to clients.
We are subject to the income tax laws of the U.S., its states and municipalities and those of the foreign jurisdictions in which we have significant business operations. These tax laws are complex and may be subject to different interpretations. We must make judgments and interpretations about the application of these inherently complex tax laws when determining the provision for income taxes and must also make estimates about when in the future certain items affect taxable income in the various tax jurisdictions. Disputes over interpretations of the tax laws may be settled with the taxing authority upon examination or audit. In addition, changes to the Internal Revenue Code, administrative rulings or court decisions could increase our provision for income taxes and reduce our earnings.
On December 22, 2017, the legislation commonly referred to as the Tax Cuts and Jobs Act (“Tax Act”) was enacted. The Tax Act is complex and materially changes U.S. corporate income tax rates, imposes significant additional limitations on the deductibility of interest and net operating losses, allows for the expensing of certain capital expenditures, and puts into effect a number of changes impacting operations outside of the United States to shift from a tax on worldwide income to a territorial system (along with certain rules designed to prevent erosion of the U.S. income tax base).
We continue to examine the impact the Tax Act may have on our business. The Tax Act has already had a material impact on our income tax expense and deferred tax balances (most notably a $320 million unfavorable impact in the fourth quarter of 2017 related to the remeasurement of net deferred tax assets using the lowered corporate tax rate, repatriation tax and lower future tax benefits from low income housing assets). Despite the beneficial impact in the corporate income tax rate, the full impact is uncertain and our business and financial condition could be adversely affected. For example, it is unclear what impact the Tax Act will have on our clients and competitors and therefore it is unclear how we may be advantaged or disadvantaged (such as investor demand for lower pricing or competitors that are better situated to respond or adjust to the evolving marketplace and investor sentiment). Furthermore, many of the products we issue or on which our businesses are based (including both insurance products and non-insurance products) receive favorable treatment under current U.S. federal income or estate tax law. Changes in U.S. federal income or estate tax law could reduce or eliminate the tax advantages of certain of our products and thus make such products less attractive to clients and the Tax Act will cause a change in client demand and activity.
We
may not be able to protect our intellectual property and may be subject to infringement claims.
We rely on a combination of contractual rights and copyright, trademark, patent and trade secret laws to establish and protect our intellectual property. Although we use a broad range of measures to protect our intellectual property rights, third parties may infringe or misappropriate our intellectual property. We may have to litigate to enforce and protect our copyrights, trademarks, patents, trade secrets and know-how or to determine their scope, validity or enforceability, which represents a diversion of resources that may be significant in amount and may not prove successful. The loss of intellectual property protection or the inability to secure or enforce the protection of our intellectual property assets could have a material adverse effect on our business and our ability to compete.
We also may be subject to costly litigation in the event that another party alleges our operations or activities infringe upon or constitute misappropriation of such other party’s intellectual property rights. Third parties may have, or may eventually be issued, patents or other protections that could be infringed by our products, methods, processes or services or could otherwise limit our ability
41
to offer certain product features. Any party that holds such a patent could make a claim of infringement against us. We may also be subject to claims by third parties for breach of copyright, trademark, license usage rights, or misappropriation of trade secret rights. Any such claims and any resulting litigation could result in significant liability for damages. If we were found to have infringed or misappropriated a third-party patent or other intellectual property rights, we could incur substantial liability, and in some circumstances could be enjoined from providing certain products or services to our customers or utilizing and benefiting from certain methods, processes, copyrights, trademarks, trade secrets or licenses, or alternatively could be required to enter into costly licensing arrangements with third parties, all of which could have a material adverse effect on our business, results of operations and financial condition.
Changes
in and the adoption of accounting standards or inaccurate estimates or assumptions in applying accounting policies could have a material impact on our financial statements and changes in the regulation of independent registered public accounting firms are present with increasing frequency in connection with broader market reforms.
Our accounting policies and methods are fundamental to how we record and report our financial condition and results of operations. Some of these policies require use of estimates and assumptions that may affect the reported value of our assets or liabilities and results of operations and are critical because they require management to make difficult, subjective, and complex judgments about matters that are inherently uncertain. If those assumptions, estimates or judgments were incorrectly made, we could be required to correct and restate prior period financial statements.
We prepare our financial statements in accordance with U.S. generally accepted accounting principles. The Financial Accounting Standards Board, the SEC and other regulators often change the financial accounting and reporting standards governing the preparation of our financial statements. In addition, the conduct of our independent registered public accounting firm is overseen by the Public Company Accounting Oversight Board (“PCAOB”). These and other regulators may make additional inquiries regarding, or change their application of, existing laws and regulations regarding our independent auditor, financial statements or other financial reports and the possibility of such additional inquiries or changes is increasing in frequency in connection with broader market reforms. These changes are difficult to predict, and could impose additional governance, internal control and disclosure demands. In some cases, we could be required to apply a new or revised standard retroactively, resulting in our restating prior period financial statements. It is possible that the changes could have a material adverse effect on our financial condition and results of operations. For example, PricewaterhouseCoopers LLP (“PwC”) informed us that it has identified a potential issue related to its independence under Rule 2-01(c)(1)(ii)(A) of Regulation S-X (referred to as the “Loan Rule”). The Loan Rule prohibits accounting firms, such as PwC, from being deemed independent if they have certain financial relationships with their audit clients or certain affiliates of those clients. Pursuant to the SEC’s application of the Loan Rule, PwC has advised us that certain relationships between PwC and its lenders who also are record owners of various funds in the
Columbia Threadneedle Investments
family of funds (collectively, the “
Columbia Threadneedle Investments
Funds”) or certain other entities within the Ameriprise Financial, Inc. investment company complex, may implicate the Loan Rule. On June 20, 2016, the Staff of the SEC issued a “no-action” letter confirming that it would not recommend that the SEC commence enforcement action against an unrelated fund that relied on audit services performed by an audit firm that was not in compliance with the Loan Rule in certain specified circumstances. The SEC Staff stated that the relief under the letter was temporary and would expire 18 months after the issuance of the letter and on September 22, 2017 the SEC subsequently issued a letter extending the no-action relief until the SEC amends the Loan Rule to address concerns expressed in the no-action letter. If it was determined that PwC was not independent, or we do not receive some form of exemptive relief, among other things, the financial statements audited by PwC and the interim financial statements reviewed by PwC may have to be audited and reviewed, respectively, by another independent registered public accounting firm. PwC has advised us that, based on its knowledge and analyses of our facts and circumstances, it is not aware of any facts that would preclude reliance by us, our affiliates and other entities within the Ameriprise Financial, Inc. investment company complex on the no-action letter. PwC has also affirmed to us that they are able to exercise objective and impartial judgment in their audits of us, our affiliates and the
Columbia Threadneedle Investments
Funds, are independent accountants within the meaning of PCAOB Rule 3520 and in their view can continue to serve as our independent registered public accounting firm. The Company has considered disclosures made to it by PwC of lending relationships described by PwC, PwC’s representation that it is independent within the meaning of the Public Company Accounting Oversight Board Rule 3520
Auditor Independence,
and representations made to the Company’s Audit Committee by PwC that PwC believes that a reasonable investor possessing all the facts regarding the lending relationships and audit relationships would conclude that PwC is able to exhibit the requisite objectivity and impartiality to report on the Company’s financial statements as the independent registered public accounting firm. Based on the foregoing, the Company does not believe that PwC is incapable of exercising objective and impartial judgment with respect to the audit services to us, our affiliates or the
Columbia Threadneedle Investments
Funds.
Risks Relating to Our Common Stock
The
market price of our shares may fluctuate.
The market price of our common stock may fluctuate widely, depending upon many factors, some of which may be beyond our control, including: (i) changes in expectations concerning our future financial performance and the future performance of the financial services industry in general, including financial estimates and recommendations by securities analysts; (ii) differences between our actual financial and operating results and those expected by investors and analysts; (iii) our strategic moves and those of our competitors, such as acquisitions, divestitures or restructurings; (iv) changes in the regulatory framework of the financial services industry and regulatory action; (v) changes in and the adoption of accounting standards and securities and insurance rating agency processes and standards applicable to our businesses and the financial services industry; and (vi) changes in general economic or
42
market conditions.
Stock markets in general have experienced volatility that has often been unrelated to the operating performance of a particular company. These broad market fluctuations may adversely affect the trading price of our common stock.
Provisions
in our certificate of incorporation and bylaws and of Delaware law may prevent or delay an acquisition of our company, which could decrease the market value of our common stock.
Our certificate of incorporation and bylaws and Delaware law contain provisions intended to deter coercive takeover practices and inadequate takeover bids by making them unacceptably expensive to the raider and to encourage prospective acquirers to negotiate with our board of directors rather than to attempt a hostile takeover. These provisions include, among others: (i) elimination of the right of our shareholders to act by written consent; (ii) rules regarding how shareholders may present proposals or nominate directors for election at shareholder meetings, either directly or through proxies; (iii) the right of our board of directors to issue preferred stock without shareholder approval; and (iv) limitations on the rights of shareholders to remove directors.
Delaware
law also imposes some restrictions on mergers and other business combinations between us and any holder of 15% or more of our outstanding common stock.
We believe these provisions protect our shareholders from coercive or otherwise unfair takeover tactics by requiring potential acquirers to negotiate with our board of directors and by providing our board of directors time to assess any acquisition proposal. They are not intended to make our company immune from takeovers. However, these provisions apply even if the offer may be considered beneficial by some shareholders and could delay or prevent an acquisition that our board of directors determines is not in the best interests of our company and our shareholders.
The
issuance of additional shares of our common stock or other equity securities may result in a dilution of interest or adversely affect the price of our common stock.
Our certificate of incorporation allows our directors to authorize the issuance of additional shares of our common stock, as well as other forms of equity or securities that may be converted into equity securities, without shareholder approval. We have in the past and may in the future issue additional equity or convertible securities in order to raise capital, in connection with acquisitions or for other purposes. Any such issuance may result in a significant dilution in the interests of our current shareholders and adversely impact the market price of our common stock.
None.
We operate our business from two principal locations, both of which are located in Minneapolis, Minnesota: the Ameriprise Financial Center, an 848,000 square foot building that we lease, and our 885,000 square foot Client Service Center, which we own. Generally, we lease the premises we occupy in other locations, including the executive offices that we maintain in New York City and branch offices for our employee advisors throughout the United States.
Our
principal
leases are in the following locations:
|
•
|
Columbia Threadneedle Investments leases offices in Boston containing approximately 156,000 square feet, leases approximately 65,000 square feet of a shared building in London (as well as a second location in Swindon, UK) and also leases property in a number of other cities to support its global operations, including in New York, Menlo Park, Chicago and Houston in the United States and Austria, Chile, Denmark, Dubai, France, Germany, Netherlands, Hong Kong, Italy, Luxembourg, Malaysia, Singapore, Spain, Switzerland, Taiwan and South Korea;
|
|
•
|
Ameriprise Auto and Home Insurance leases approximately 132,000 square feet at its corporate headquarters in DePere, Wisconsin and also leases space in Phoenix, Arizona; and
|
|
•
|
We also have leases in Las Vegas, Nevada (supporting aspects of our Advice & Wealth Management and Protection businesses) and
Gurugram and Noida
India (supporting our broader business in the United States).
|
We believe that the facilities owned or occupied by our company suit our needs and are well maintained.
For a discussion of material legal proceedings, see Note 23 to our Consolidated Financial Statements included in Part II, Item 8 of this Annual Report on Form 10-K, which is incorporated herein by reference.
Not applicable.
43
Our common stock trades principally on The New York Stock Exchange under the trading symbol AMP. As of
February 9, 2018
, we had approximately
14,059
common shareholders of record. Price and dividend information concerning our common shares may be found in Note 26 to our Consolidated Financial Statements included in Part II, Item 8 of this Annual Report on Form 10-K. Information regarding our equity compensation plans can be found in Part III, Item 12 of this Annual Report on Form 10-K. Information comparing the cumulative total shareholder return on our common stock to the cumulative total return for certain indices is set forth under the heading “Performance Graph” provided in our
2017
Annual Report to Shareholders and is incorporated herein by reference.
We are primarily a holding company and, as a result, our ability to pay dividends in the future will depend on receiving dividends from our subsidiaries. For information regarding our ability to pay dividends, see the information set forth under the heading “Management’s Discussion and Analysis of Financial Condition and Results of Operations — Liquidity and Capital Resources” contained in Part II, Item 7 of this Annual Report on Form 10-K.
Share Repurchases
The following table presents the information with respect to purchases made by or on behalf of Ameriprise Financial, Inc. or any “affiliated purchaser” (as defined in Rule 10b-18(a)(3) under the Securities Exchange Act of 1934), of our common stock during the fourth quarter of
2017
:
|
|
(a)
|
(b)
|
(c)
|
(d)
|
||||||||||
|
Period
|
Total Number of Shares Purchased
|
Average Price Paid Per Share
|
Total Number of Shares Purchased as part of Publicly Announced Plans or Programs
(1)
|
Approximate Dollar Value of Shares that May Yet Be Purchased Under the Plans or Programs
(1)
|
||||||||||
|
October 1 to October 31, 2017
|
|
|
|
|
|
|
|
|
||||||
|
Share repurchase program
(1)
|
617,734
|
|
$
|
153.50
|
|
617,734
|
|
$
|
2,292,351,613
|
|
||||
|
Employee transactions
(2)
|
134,185
|
|
$
|
156.80
|
|
N/A
|
|
N/A
|
|
|||||
|
November 1 to November 30, 2017
|
|
|
|
|
|
|
|
|
||||||
|
Share repurchase program
(1)
|
701,468
|
|
$
|
159.59
|
|
701,468
|
|
$
|
2,180,405,982
|
|
||||
|
Employee transactions
(2)
|
69,414
|
|
$
|
159.82
|
|
N/A
|
|
N/A
|
|
|||||
|
December 1 to December 31, 2017
|
|
|
|
|
|
|
|
|
||||||
|
Share repurchase program
(1)
|
568,695
|
|
$
|
168.55
|
|
568,695
|
|
$
|
2,084,552,158
|
|
||||
|
Employee transactions
(2)
|
107,467
|
|
$
|
168.56
|
|
N/A
|
|
N/A
|
|
|||||
|
Totals
|
|
|
|
|
|
|
||||||||
|
Share repurchase program
(1)
|
1,887,897
|
|
$
|
160.28
|
|
|
1,887,897
|
|
|
|
||||
|
Employee transactions
(2)
|
311,066
|
|
$
|
161.54
|
|
N/A
|
|
|
|
|||||
|
|
2,198,963
|
|
|
|
1,887,897
|
|
|
|
||||||
N/A Not applicable.
(1)
On April 24, 2017, we announced that our Board of Directors authorized an additional expenditure of up to $2.5 billion for the repurchase of our common stock through June 30, 2019. The share repurchase program does not require the purchase of any minimum number of shares, and depending on market conditions and other factors, these purchases may be commenced or suspended at any time without prior notice. Acquisitions under the share repurchase program may be made in the open market, through privately negotiated transactions or block trades or other means.
(2)
Includes restricted shares withheld pursuant to the terms of awards under the Company’s share-based compensation plans to offset tax withholding obligations that occur upon vesting and release of restricted shares. The value of the restricted shares withheld is the closing price of common stock of Ameriprise Financial, Inc. on the date the relevant transaction occurs. Also includes shares withheld pursuant to the net settlement of Non-Qualified Stock Option (“NQSO”) exercises to offset tax withholding obligations that occur upon exercise and to cover the strike price of the NQSO. The value of the shares withheld pursuant to the net settlement of NQSO exercises is the closing price of common stock of Ameriprise Financial, Inc. on the day prior to the date the relevant transaction occurs.
44
The following table sets forth selected consolidated financial information derived from our audited Consolidated Financial Statements as of
December 31, 2017
,
2016
,
2015
,
2014
and
2013
and for the five-year period ended
December 31, 2017
. The selected financial data presented below should be read in conjunction with our Consolidated Financial Statements and Notes included elsewhere in this report and “Management’s Discussion and Analysis of Financial Condition and Results of Operations.”
|
|
Years Ended December 31,
|
||||||||||||||||||
|
2017
|
2016
|
2015
|
2014
|
2013
|
|||||||||||||||
|
(in millions, except per share data)
|
|||||||||||||||||||
|
Income Statement Data:
|
|||||||||||||||||||
|
Total net revenues
|
$
|
12,027
|
|
$
|
11,696
|
|
$
|
12,170
|
|
$
|
12,268
|
|
$
|
11,199
|
|
||||
|
Total expenses
|
9,813
|
|
10,104
|
|
10,028
|
|
9,721
|
|
9,229
|
|
|||||||||
|
Income from continuing operations
|
$
|
1,480
|
|
$
|
1,314
|
|
$
|
1,687
|
|
$
|
2,002
|
|
$
|
1,478
|
|
||||
|
Loss from discontinued operations, net of tax
|
—
|
|
—
|
|
—
|
|
(2
|
)
|
(3
|
)
|
|||||||||
|
Net income
|
1,480
|
|
1,314
|
|
1,687
|
|
2,000
|
|
1,475
|
|
|||||||||
|
Less: Net income attributable to noncontrolling interests
|
—
|
|
—
|
|
125
|
|
381
|
|
141
|
|
|||||||||
|
Net income attributable to Ameriprise Financial
|
$
|
1,480
|
|
$
|
1,314
|
|
$
|
1,562
|
|
$
|
1,619
|
|
$
|
1,334
|
|
||||
|
Earnings Per Share Attributable to Ameriprise Financial, Inc. Common Shareholders:
|
|||||||||||||||||||
|
Basic
|
|||||||||||||||||||
|
Income from continuing operations
|
$
|
9.60
|
|
$
|
7.90
|
|
$
|
8.60
|
|
$
|
8.46
|
|
$
|
6.58
|
|
||||
|
Loss from discontinued operations
|
—
|
|
—
|
|
—
|
|
(0.01
|
)
|
(0.02
|
)
|
|||||||||
|
Net income
|
$
|
9.60
|
|
$
|
7.90
|
|
$
|
8.60
|
|
$
|
8.45
|
|
$
|
6.56
|
|
||||
|
Diluted
|
|||||||||||||||||||
|
Income from continuing operations
|
$
|
9.44
|
|
$
|
7.81
|
|
$
|
8.48
|
|
$
|
8.31
|
|
$
|
6.46
|
|
||||
|
Loss from discontinued operations
|
—
|
|
—
|
|
—
|
|
(0.01
|
)
|
(0.02
|
)
|
|||||||||
|
Net income
|
$
|
9.44
|
|
$
|
7.81
|
|
$
|
8.48
|
|
$
|
8.30
|
|
$
|
6.44
|
|
||||
|
Cash Dividends Declared Per Common Share
|
$
|
3.24
|
|
$
|
2.92
|
|
$
|
2.59
|
|
$
|
2.26
|
|
$
|
2.01
|
|
||||
|
|
December 31,
|
||||||||||||||||||
|
2017
|
2016
|
2015
|
2014
|
2013
|
|||||||||||||||
|
(in millions)
|
|||||||||||||||||||
|
Balance Sheet Data:
|
|||||||||||||||||||
|
Investments
(1)
|
$
|
35,925
|
|
$
|
35,834
|
|
$
|
34,144
|
|
$
|
35,582
|
|
$
|
35,735
|
|
||||
|
Separate account assets
|
87,368
|
|
80,210
|
|
80,349
|
|
83,256
|
|
81,223
|
|
|||||||||
|
Total assets
|
147,470
|
|
139,821
|
|
145,339
|
|
148,803
|
|
144,565
|
|
|||||||||
|
Policyholder account balances, future policy benefits and claims
|
29,904
|
|
30,202
|
|
29,699
|
|
30,350
|
|
29,620
|
|
|||||||||
|
Separate account liabilities
|
87,368
|
|
80,210
|
|
80,349
|
|
83,256
|
|
81,223
|
|
|||||||||
|
Customer deposits
|
10,303
|
|
10,036
|
|
8,634
|
|
7,664
|
|
7,062
|
|
|||||||||
|
Long-term debt
(1)
|
2,891
|
|
2,917
|
|
2,692
|
|
3,045
|
|
2,700
|
|
|||||||||
|
Short-term borrowings
|
200
|
|
200
|
|
200
|
|
200
|
|
500
|
|
|||||||||
|
Total liabilities
|
141,472
|
|
133,529
|
|
136,960
|
|
139,524
|
|
135,359
|
|
|||||||||
|
Total Ameriprise Financial, Inc. shareholders’ equity
|
5,998
|
|
6,292
|
|
7,191
|
|
8,098
|
|
8,166
|
|
|||||||||
|
Noncontrolling interests’ equity
|
—
|
|
—
|
|
1,188
|
|
1,181
|
|
1,040
|
|
|||||||||
|
(1)
Represents amounts before consolidated investment entities, as reported on our Consolidated Balance Sheets.
|
|||||||||||||||||||
45
The following discussion and analysis of our consolidated financial condition and results of operations should be read in conjunction with the “Forward-Looking Statements,” our Consolidated Financial Statements and Notes that follow and the “Consolidated Five-Year Summary of Selected Financial Data” and the “Risk Factors” included in our Annual Report on Form 10-K. References to “Ameriprise Financial,” “Ameriprise,” the “Company,” “we,” “us,” and “our” refer to Ameriprise Financial, Inc. exclusively, to our entire family of companies, or to one or more of our subsidiaries.
Overview
Ameriprise Financial is a diversified financial services company with a more than 120 year history of providing financial solutions. We are America’s leader in financial planning and a leading global financial institution with $897.0 billion in assets under management and administration as of
December 31, 2017
. We offer a broad range of products and services designed to achieve the financial objectives of individual and institutional clients. For additional discussion of our businesses, see Part I, Item 1 of this Annual Report on Form 10-K.
The products and services we provide retail clients and, to a lesser extent, institutional clients, are the primary source of our revenues and net income. Revenues and net income are significantly affected by investment performance and the total value and composition of assets we manage and administer for our retail and institutional clients as well as the distribution fees we receive from other companies. These factors, in turn, are largely determined by overall investment market performance and the depth and breadth of our individual client relationships.
Financial markets and macroeconomic conditions have had and will continue to have a significant impact on our operating and performance results. In addition, the business and regulatory environment in which we operate remains subject to elevated uncertainty and change. To succeed, we expect to continue focusing on our key strategic objectives. The success of these and other strategies may be affected by the factors discussed in Item 1A of this Annual Report on Form 10-K — “Risk Factors.”
Equity price, credit market and interest rate fluctuations can have a significant impact on our results of operations, primarily due to the effects they have on the asset management and other asset-based fees we earn, the “spread” income generated on our fixed deferred annuities, fixed insurance, deposit products and the fixed portion of variable annuities and variable insurance contracts, the value of deferred acquisition costs (“DAC”) and deferred sales inducement costs (“DSIC”) assets, the values of liabilities for guaranteed benefits associated with our variable annuities and the values of derivatives held to hedge these benefits.
Earnings, as well as operating earnings, will be negatively impacted by the ongoing low interest rate environment should it continue. In addition to continuing spread compression in our interest sensitive product lines, a sustained low interest rate environment may result in increases to our reserves and changes in various rate assumptions we use to amortize DAC and DSIC, which may negatively impact our operating earnings. For additional discussion on our interest rate risk, see Item 7A. “Quantitative and Qualitative Disclosures About Market Risk.”
In the third quarter of the year, we updated our market-related inputs and implemented model changes related to our living benefit valuation. In addition, we conducted our annual review of life insurance and annuity valuation assumptions relative to current experience and management expectations including modeling changes. These aforementioned changes are collectively referred to as unlocking. See our Consolidated and Segment Results of Operations sections for the pretax impacts on our revenues and expenses attributable to unlocking and discussion of the drivers of the unlocking impact.
We consolidate certain variable interest entities for which we provide asset management services. These entities are defined as consolidated investment entities (“CIEs”). While the consolidation of the CIEs impacts our balance sheet and income statement, our exposure to these entities is unchanged and there is no impact to the underlying business results. For further information on CIEs, see Note 4 to our Consolidated Financial Statements. The results of operations of the CIEs are reflected in the Corporate & Other segment. On a consolidated basis, the management fees we earn for the services we provide to the CIEs and the related general and administrative expenses are eliminated and the changes in the fair value of assets and liabilities related to the CIEs, primarily syndicated loans and debt, are reflected in net investment income. We continue to include the fees from these entities in the management and financial advice fees line within our Asset Management segment.
While our consolidated financial statements are prepared in accordance with U.S. generally accepted accounting principles (“GAAP”), management believes that operating measures, which exclude net realized investment gains or losses, net of the related DSIC and DAC amortization, unearned revenue amortization and the reinsurance accrual; the market impact on variable annuity guaranteed benefits, net of hedges and the related DSIC and DAC amortization; the market impact on indexed universal life (“IUL”) benefits, net of hedges and the related DAC amortization, unearned revenue amortization and the reinsurance accrual; the market impact on fixed index annuity benefits, net of hedges and the related DAC amortization; the market impact of hedges to offset interest rate changes on unrealized gains or losses for certain investments; integration and restructuring charges; and the impact of consolidating CIEs, best reflect the underlying performance of our core operations and facilitate a more meaningful trend analysis. Management uses certain of these non-GAAP measures to evaluate our financial performance on a basis comparable to that used by some securities analysts and investors. Also, certain of these non-GAAP measures are taken into consideration, to varying degrees, for purposes of business planning and analysis and for certain compensation-related matters. Throughout our Management’s Discussion and Analysis, these non-GAAP measures are referred to as operating measures. These non-GAAP measures should not be viewed as a substitute for U.S. GAAP measures.
46
It is management’s priority to increase shareholder value over a multi-year horizon by achieving our on-average, over-time financial targets.
Our financial targets are:
|
•
|
Operating total net revenue growth of 6% to 8%,
|
|
•
|
Operating earnings per diluted share growth of 12% to 15%, and
|
|
•
|
Operating return on equity excluding accumulated other comprehensive income (“AOCI”) of 19% to 23%.
|
The following tables reconcile our GAAP measures to operating measures:
|
|
Years Ended December 31,
|
||||||
|
2017
|
2016
|
||||||
|
(in millions)
|
|||||||
|
Total net revenues
|
$
|
12,027
|
|
$
|
11,696
|
|
|
|
Less: Revenue attributable to CIEs
|
94
|
|
128
|
|
|||
|
Less: Net realized investment gains
|
46
|
|
6
|
|
|||
|
Less: Market impact on indexed universal life benefits
|
1
|
|
24
|
|
|||
|
Less: Market impact of hedges on investments
|
(2
|
)
|
3
|
|
|||
|
Operating total net revenues
|
$
|
11,888
|
|
$
|
11,535
|
|
|
|
|
Years Ended December 31,
|
Per Diluted Share
Years Ended December 31, |
|||||||||||||
|
2017
|
2016
|
2017
|
2016
|
||||||||||||
|
(in millions, except per share amounts)
|
|||||||||||||||
|
Net income
|
$
|
1,480
|
|
$
|
1,314
|
|
$
|
9.44
|
|
$
|
7.81
|
|
|||
|
Less: Net income (loss) attributable to CIEs
|
1
|
|
(2
|
)
|
—
|
|
(0.01
|
)
|
|||||||
|
Add: Integration/restructuring charges
(1)
|
5
|
|
—
|
|
0.03
|
|
—
|
|
|||||||
|
Add: Market impact on variable annuity guaranteed benefits
(1)
|
232
|
|
216
|
|
1.48
|
|
1.28
|
|
|||||||
|
Add: Market impact on indexed universal life benefits
(1)
|
(4
|
)
|
(36
|
)
|
(0.02
|
)
|
(0.21
|
)
|
|||||||
|
Add: Market impact of hedges on investments
(1)
|
2
|
|
(3
|
)
|
0.01
|
|
(0.02
|
)
|
|||||||
|
Less: Net realized investment gains
(1)
|
44
|
|
6
|
|
0.28
|
|
0.03
|
|
|||||||
|
Tax effect of adjustments
(2)
|
(67
|
)
|
(60
|
)
|
(0.43
|
)
|
(0.36
|
)
|
|||||||
|
Operating earnings
|
$
|
1,603
|
|
$
|
1,427
|
|
$
|
10.23
|
|
$
|
8.48
|
|
|||
|
Weighted average common shares outstanding:
|
|
|
|
|
|
|
|
|
|||||||
|
Basic
|
154.1
|
|
166.3
|
|
|
|
|
|
|||||||
|
Diluted
|
156.7
|
|
168.2
|
|
|
|
|
|
|||||||
(1)
Pretax operating adjustments.
(2)
Calculated using the statutory tax rate of 35%.
47
The following table reconciles net income to operating earnings and the five-point average of quarter-end equity to operating equity:
|
|
Years Ended December 31,
|
||||||
|
2017
|
2016
|
||||||
|
(in millions)
|
|||||||
|
Net income
|
$
|
1,480
|
|
$
|
1,314
|
|
|
|
Less: Adjustments
(1)
|
(123
|
)
|
(113
|
)
|
|||
|
Operating earnings
|
$
|
1,603
|
|
$
|
1,427
|
|
|
|
Total Ameriprise Financial, Inc. shareholders’ equity
|
$
|
6,214
|
|
$
|
6,877
|
|
|
|
Less: AOCI, net of tax
|
251
|
|
426
|
|
|||
|
Total Ameriprise Financial, Inc. shareholders’ equity, excluding AOCI
|
5,963
|
|
6,451
|
|
|||
|
Less: Equity impacts attributable to CIEs
|
1
|
|
27
|
|
|||
|
Operating equity
|
$
|
5,962
|
|
$
|
6,424
|
|
|
|
Return on equity, excluding AOCI
|
24.8
|
%
|
20.4
|
%
|
|||
|
Operating return on equity, excluding AOCI
(2)
|
26.9
|
%
|
22.2
|
%
|
|||
|
(1)
|
Adjustments reflect the sum of after-tax net realized investment gains/losses, net of DSIC and DAC amortization, unearned revenue amortization and the reinsurance accrual; the market impact on variable annuity guaranteed benefits, net of hedges and related DSIC and DAC amortization; the market impact on indexed universal life benefits, net of hedges and the related DAC amortization, unearned revenue amortization, and the reinsurance accrual; the market impact on fixed index annuity benefits, net of hedges and the related DAC amortization; the market impact of hedges to offset interest rate changes on unrealized gains or losses for certain investments; integration and restructuring charges; and net income (loss) from consolidated investment entities. After-tax is calculated using the statutory tax rate of 35%.
|
|
(2)
|
Operating return on equity, excluding AOCI, is calculated using operating earnings in the numerator and
Ameriprise Financial
shareholders’ equity, excluding AOCI and the impact of consolidating investment entities using a five-point average of quarter-end equity in the denominator. After-tax is calculated using the statutory rate of 35%.
|
Critical Accounting Estimates
The accounting and reporting policies that we use affect our Consolidated Financial Statements. Certain of our accounting and reporting policies are critical to an understanding of our consolidated results of operations and financial condition and, in some cases, the application of these policies can be significantly affected by the estimates, judgments and assumptions made by management during the preparation of our Consolidated Financial Statements. The accounting and reporting policies and estimates we have identified as fundamental to a full understanding of our consolidated results of operations and financial condition are described below. See Note 2 to our Consolidated Financial Statements for further information about our accounting policies.
Valuation of Investments
The most significant component of our investments is our Available-for-Sale securities, which we carry at fair value within our Consolidated Balance Sheets. The fair value of our Available-for-Sale securities at December 31, 2017 was primarily obtained from third-party pricing sources. For a discussion on our accounting policies related to the valuation of our investments and other-than-temporary impairments, see Note 2 and Note 14 to our Consolidated Financial Statements.
Deferred Acquisition Costs
We incur costs in connection with acquiring new and renewal insurance and annuity businesses. The portion of these costs which are incremental and direct to the acquisition of a new or renewal insurance policy or annuity contract are deferred. Significant costs capitalized include sales based compensation related to the acquisition of new and renewal insurance policies and annuity contracts, medical inspection costs for successful sales, and a portion of employee compensation and benefit costs based upon the amount of time spent on successful sales. Sales based compensation paid to advisors and employees and third-party distributors is capitalized. Employee compensation and benefits costs which are capitalized relate primarily to sales efforts, underwriting and processing. All other costs which are not incremental direct costs of acquiring an insurance policy or annuity contract are expensed as incurred. See Note 2 to the Consolidated Financial Statements for further discussion of our DAC accounting policy.
Non-Traditional Long-Duration Products
For our non-traditional long-duration products (including variable and fixed deferred annuity contracts, universal life (“UL”) and variable universal life (“VUL”) insurance products), our DAC balance at any reporting date is based on projections that show management expects there to be estimated gross profits (“EGPs”) after that date to amortize the remaining balance. These projections are inherently uncertain because they require management to make assumptions about financial markets, mortality levels and contractholder and policyholder behavior over periods extending well into the future. Projection periods used for our annuity products are typically 30 to 50 years and for our UL insurance products 50 years or longer.
48
EGPs vary based on persistency rates (assumptions at which contractholders and policyholders are expected to surrender, make withdrawals from and make deposits to their contracts), mortality levels, client asset value growth rates (based on equity and bond market performance), variable annuity benefit utilization and interest margins (the spread between earned rates on invested assets and rates credited to contractholder and policyholder accounts). Changes in these assumptions can be offsetting and we are unable to predict their movement or offsetting impact over time. When assumptions are changed, the percentage of EGPs used to amortize DAC might also change. A change in the required amortization percentage is applied retrospectively; an increase in amortization percentage will result in a decrease in the DAC balance and an increase in DAC amortization expense, while a decrease in amortization percentage will result in an increase in the DAC balance and a decrease in DAC amortization expense. The effect on the DAC balance that would result from the realization of unrealized gains (losses) is recognized with an offset to accumulated other comprehensive income on the consolidated balance sheet.
The client asset value growth rates are the rates at which variable annuity and VUL insurance contract values invested in separate accounts are assumed to appreciate in the future. The rates used vary by equity and fixed income investments. The long-term client asset value growth rates are based on assumed gross annual returns of 9% for equity funds and 6.8% for fixed income funds. We typically use a five-year mean reversion process as a guideline in setting near-term equity fund growth rates based on a long-term view of financial market performance as well as recent actual performance. The suggested near-term equity fund growth rate is reviewed quarterly to ensure consistency with management’s assessment of anticipated equity market performance.
A decrease of 100 basis points in separate account fund growth rate assumptions is likely to result in an increase in DAC amortization and an increase in benefits and claims expense for variable annuity and VUL insurance contracts. The following table presents the estimated impact to current period pretax income:
|
Estimated Impact to Pretax Income
(1)
|
|||||||||||
|
DAC Amortization
|
Benefits and Claims Expense
|
Total
|
|||||||||
|
(in millions)
|
|||||||||||
|
Decrease in future near- and long-term fixed income fund growth returns by 100 basis points
|
$
|
(24
|
)
|
$
|
(61
|
)
|
$
|
(85
|
)
|
||
|
Decrease in future near-term equity fund growth returns by 100 basis points
|
$
|
(23
|
)
|
$
|
(39
|
)
|
$
|
(62
|
)
|
||
|
Decrease in future long-term equity fund growth returns by 100 basis points
|
(16
|
)
|
(30
|
)
|
(46
|
)
|
|||||
|
Decrease in future near- and long-term equity fund growth returns by 100 basis points
|
$
|
(39
|
)
|
$
|
(69
|
)
|
$
|
(108
|
)
|
||
|
(1)
An increase in the above assumptions by 100 basis points would result in an increase to pretax income for approximately the same amount.
|
|||||||||||
An assessment of sensitivity associated with changes in any single assumption would not necessarily be an indicator of future results.
Traditional Long-Duration Products
For our traditional long-duration products (including traditional life and disability income (“DI”) insurance products), our DAC balance at any reporting date is based on projections that show management expects there to be adequate premiums after the date to amortize the remaining balance. These projections are inherently uncertain because they require management to make assumptions over periods extending well into the future. These assumptions include interest rates, persistency rates and mortality and morbidity rates and are not modified (unlocked) unless recoverability testing deems to be inadequate. Projection periods used for our traditional life insurance are up to 30 years. Projection periods for our DI products can be up to 45 years. We may experience accelerated amortization of DAC if policies terminate earlier than projected or a slower rate of amortization of DAC if policies persist longer than projected.
For traditional life and DI insurance products, the assumptions provide for adverse deviations in experience and are revised only if management concludes experience will be so adverse that DAC are not recoverable. If management concludes that DAC are not recoverable, DAC are reduced to the amount that is recoverable based on best estimate assumptions.
Future Policy Benefits and Claims
We establish reserves to cover the risks associated with non-traditional and traditional long-duration products and short-duration products. Reserves for non-traditional long-duration products include the liabilities related to guaranteed benefit provisions added to variable annuity contracts, a portion of our UL and VUL policies and the embedded derivatives related to variable annuity contracts, indexed annuities and indexed universal life (“IUL”) insurance. Reserves for traditional long-duration products are established to provide adequately for future benefits and expenses for term life, whole life, DI and long term care (“LTC”) insurance products. Reserves for short-duration products are established to provide adequately for incurred losses primarily related to auto and home policies.
The establishment of reserves is an estimation process using a variety of methods, assumptions and data elements. If actual experience is better than or equal to the results of the estimation process, then reserves should be adequate to provide for future benefits and expenses. If actual experience is worse than the results of the estimation process, additional reserves may be required.
49
Non-Traditional Long-Duration Products
A portion of our UL and VUL policies have product features that result in profits followed by losses from the insurance component of the contract. These profits followed by losses can be generated by the cost structure of the product or secondary guarantees in the contract. The secondary guarantee ensures that, subject to specified conditions, the policy will not terminate and will continue to provide a death benefit even if there is insufficient policy value to cover the monthly deductions and charges. The liability for these future losses is determined using actuarial models to estimate the death benefits in excess of account value and the expected assessments (e.g. cost of insurance charges, contractual administrative charges, similar fees and investment margin). Significant assumptions made in projecting future benefits and assessments relate to customer asset value growth rates, mortality, persistency and investment margins and are consistent with those used for DAC valuation for the same contracts. See Note 11 to our Consolidated Financial Statements for information regarding the liability for contracts with secondary guarantees.
We have approximately $80 billion of variable annuity account value that has been issued over a period of more than fifty years. The diversified variable annuity block consists of $30 billion of account value with no living benefit guarantees and $50 billion of account value with living benefit guarantees, primarily guaranteed minimum withdrawal benefit (“GMWB”) provisions. The business is predominately issued through the Ameriprise Financial advisor network. The majority of the variable annuity contracts offered by us contain guaranteed minimum death benefit (“GMDB”) provisions. When market values of the customer’s accounts decline, the death benefit payable on a contract with a GMDB may exceed the contract accumulation value. We also offer variable annuities with death benefit provisions that gross up the amount payable by a certain percentage of contract earnings which are referred to as gain gross-up (“GGU”) benefits. In addition, we offer contracts with GMWB and guaranteed minimum accumulation benefit (“GMAB”) provisions and, until May 2007, we offered contracts containing guaranteed minimum income benefit (“GMIB”) provisions.
The GMDB and GGU liability is determined by estimating the expected value of death benefits in excess of the projected contract accumulation value and recognizing the excess over the estimated life based on expected assessments (e.g., mortality and expense fees, contractual administrative charges and similar fees).
If elected by the contract owner and after a stipulated waiting period from contract issuance, a GMIB guarantees a minimum lifetime annuity based on a specified rate of contract accumulation value growth and predetermined annuity purchase rates. The GMIB liability is determined each period by estimating the expected value of annuitization benefits in excess of the projected contract accumulation value at the date of annuitization and recognizing the excess over the estimated life based on expected assessments.
The liability for the life contingent benefits associated with GMWB provisions is determined by estimating the expected value of benefits that are contingent upon survival after the account value is equal to zero and recognizing the benefits over the estimated life based on expected assessments (e.g., mortality and expense fees, contractual administrative charges and similar fees).
In determining the liabilities for GMDB, GGU, GMIB and the life contingent benefits associated with GMWB, we project these benefits and contract assessments using actuarial models to simulate various equity market scenarios. Significant assumptions made in projecting future benefits and assessments relate to customer asset value growth rates, mortality, persistency, benefit utilization and investment margins and are consistent with those used for DAC valuation for the same contracts. As with DAC, management reviews, and where appropriate, adjusts its assumptions each quarter. Unless management identifies a material deviation over the course of quarterly monitoring, management reviews and updates these assumptions annually in the third quarter of each year.
Regarding the exposure to variable annuity living benefit guarantees, the source of behavioral risk is driven by changes in policyholder surrenders and utilization of guaranteed withdrawal benefits. We have extensive experience studies and analysis to monitor changes and trends in policyholder behavior. A significant volume of company-specific policyholder experience data is available and provides management with the ability to regularly analyze policyholder behavior. On a monthly basis, actual surrender and benefit utilization experience is compared to expectations. Experience data includes detailed policy information providing the opportunity to review impacts of multiple variables. The ability to analyze differences in experience, such as presence of a living benefit rider, existence of surrender charges, and tax qualifications provide us an effective approach in quickly detecting changes in policyholder behavior.
At least annually, we perform a thorough policyholder behavior analysis to validate the assumptions included in our benefit reserve, embedded derivative and DAC balances. The variable annuity assumptions and resulting reserve computations reflect multiple policyholder variables. Differentiation in assumptions by policyholder age, existence of surrender charges, guaranteed withdrawal utilization, and tax qualification are examples of factors recognized in establishing management’s assumptions used in reserve calculations. The extensive data derived from our variable annuity block highly informs management in confirming previous assumptions and revising the variable annuity behavior assumptions. Changes in assumptions are governed by a review and approval process to ensure an appropriate measurement of all impacted financial statement balances.
Additionally, our Corporate Actuarial Department calculates the fair value of the embedded derivatives on a monthly basis. During this process, control checks are performed to validate the completeness of the data. Actuarial management approves various components of the valuation along with the final results. The change in the fair value of the embedded derivatives is reviewed monthly with senior management.
See Note 11 to our Consolidated Financial Statements for further discussion of our variable annuity contracts.
50
See the table in the previous discussion of “Deferred Acquisition Costs” for the estimated impact to benefits and claims expense related to variable annuity and VUL insurance contracts resulting from a decrease of 100 basis points in separate account fund growth rate assumptions.
The fair value of embedded derivatives related to GMAB and the non-life contingent benefits associated with GMWB provisions, indexed annuities and IUL fluctuate based on equity, interest rate and credit markets which can cause these embedded derivatives to be either an asset or a liability. In addition, embedded derivatives are impacted by an estimate of our nonperformance risk adjustment. This estimate results in a spread over the LIBOR swap curve as of the balance sheet date. As our estimate of this spread over LIBOR widens or tightens, the liability will decrease or increase. See Note 14 to our Consolidated Financial Statements for information regarding the fair value measurement of embedded derivatives.
Traditional Long-Duration Products
Liabilities for unpaid amounts on reported DI and LTC claims include any periodic or other benefit amounts due and accrued, along with estimates of the present value of obligations for continuing benefit payments. These unpaid amounts are calculated using anticipated claim continuance rates based on established industry tables, adjusted as appropriate for our experience. The discount rates used to calculate present values are based on average interest rates earned on assets supporting the liability for unpaid amounts.
Liabilities for estimates of benefits that will become payable on future claims on term life, whole life and DI policies are based on the net level premium and LTC policies are based on a gross premium valuation reflecting management’s current best estimate assumptions. Both include anticipated premium payments, mortality and morbidity rates, policy persistency and interest rates earned on assets supporting the liability. Anticipated mortality and morbidity rates are based on established industry mortality and morbidity tables, with modifications based on our experience. Anticipated premium payments and persistency rates vary by policy form, issue age, policy duration and certain other pricing factors.
Short-Duration Products
The liabilities for short-duration products primarily include auto and home reserves comprised of amounts determined from loss reports on individual claims, as well as amounts based on historical loss experience for losses incurred but not yet reported. Such liabilities are based on estimates. Our methods for making such estimates and for establishing the resulting liabilities are continually reviewed, and any adjustments are reflected in earnings in the period such adjustments are made.
See Note 2 to our Consolidated Financial Statements for further discussion of our policyholder account balances, future policy benefits and claims accounting policy.
Derivative Instruments and Hedging Activities
We use derivative instruments to manage our exposure to various market risks. All derivatives are recorded at fair value. The fair value of our derivative instruments is determined using either market quotes or valuation models that are based upon the net present value of estimated future cash flows and incorporate current market observable inputs to the extent available.
For further details on the types of derivatives we use and how we account for them, see Note 2, Note 14 and Note 16 to our Consolidated Financial Statements. For discussion of our market risk exposures and hedging program and related sensitivity testing, see Item 7A. “Quantitative and Qualitative Disclosures About Market Risk.”
Income Tax Accounting
Inherent in the provision for income taxes are estimates and judgments regarding the tax treatment of certain items. Estimates and judgments are re-evaluated on a continual basis as regulatory and business factors change. In the event that the ultimate tax treatment of items differs from our estimates, we may be required to significantly change the provision for income taxes recorded in our Consolidated Financial Statements.
We
are required to establish a valuation allowance for any portion of our deferred tax assets that management believes will not be realized. Significant judgment is required in determining if a valuation allowance should be established, and the amount of such allowance if required. Factors used in making this determination include estimates relating to the performance of the business. Consideration is given to, among other things in making this determination, (i) future taxable income exclusive of reversing temporary differences and carryforwards, (ii) future reversals of existing taxable temporary differences, (iii) taxable income in prior carryback years, and (iv) tax planning strategies. Management may need to identify and implement appropriate planning strategies to ensure our ability to realize our deferred tax assets and reduce the likelihood of the establishment of a valuation allowance with respect to such assets.
See
Note 2 and Note 21 to our Consolidated Financial Statements for additional information on our accounting policies for income taxes and our valuation allowance.
Recent Accounting Pronouncements
For information regarding recent accounting pronouncements and their expected impact on our future consolidated results of operations and financial condition, see Note 3 to our Consolidated Financial Statements.
51
Sources of Revenues and Expenses
Management and Financial Advice Fees
Management and financial advice fees relate primarily to fees earned from managing mutual funds, private funds, separate account and wrap account assets and institutional investments, as well as fees earned from providing financial advice, administrative services (including transfer agent and administration fees earned from providing services to retail mutual funds) and other custodial services. Management and financial advice fees include performance-based incentive management fees, which we may receive on certain management contracts. Management and financial advice fees also include mortality and expense risk fees.
Distribution Fees
Distribution fees primarily include point-of-sale fees (such as mutual fund front-end sales loads) and asset-based fees (such as 12b-1 distribution and shareholder service fees). Distribution fees also include amounts received under marketing support arrangements for sales of mutual funds and other companies’ products, such as through our wrap accounts, as well as surrender charges on annuities and UL and VUL insurance.
Net Investment Income
Net investment income primarily includes interest income on fixed maturity securities classified as Available-for-Sale, mortgage loans, policy and certificate loans, other investments, cash and cash equivalents and investments of CIEs; the changes in fair value of trading securities, certain derivatives and certain assets and liabilities of CIEs; the pro rata share of net income or loss on equity method investments; and realized gains and losses on the sale of investments and charges for other-than-temporary impairments of investments related to credit losses.
Premiums
Premiums include premiums on auto and home insurance, traditional life, DI and LTC insurance and immediate annuities with a life contingent feature and are net of reinsurance premiums.
Other Revenues
Other
revenues primarily include variable annuity guaranteed benefit rider charges and UL and VUL insurance charges, which consist of cost of insurance charges (net of reinsurance premiums and cost of reinsurance for UL insurance products) and administrative charges.
For discussion of our accounting policies on revenue recognition, see Note 2 to our Consolidated Financial Statements.
Banking and Deposit Interest Expense
Banking and deposit interest expense primarily includes interest expense related to investment certificates. The changes in fair value of stock market certificate embedded derivatives and the derivatives hedging stock market certificates are included within banking and deposit interest expense.
Distribution Expenses
Distribution expenses primarily include compensation paid to our financial advisors, registered representatives, third-party distributors and wholesalers, net of amounts capitalized and amortized as part of DAC. The amounts capitalized and amortized are based on actual distribution costs. The majority of these costs, such as advisor and wholesaler compensation, vary directly with the level of sales. Distribution expenses also include marketing support and other distribution and administration related payments made to affiliated and unaffiliated distributors of products provided by our affiliates. The majority of these expenses vary with the level of sales, or assets held, by these distributors, and the remainder is fixed. Distribution expenses also include wholesaling costs.
Interest Credited to Fixed Accounts
Interest credited to fixed accounts represents amounts earned by contractholders and policyholders on fixed account values associated with UL and VUL insurance and annuity contracts. The changes in fair value of indexed annuity and IUL embedded derivatives and the derivatives hedging these products are included within interest credited to fixed accounts.
Benefits, Claims, Losses and Settlement Expenses
Benefits, claims, losses and settlement expenses consist of amounts paid and changes in liabilities held for anticipated future benefit payments under insurance policies and annuity contracts, along with costs to process and pay such amounts. Amounts are net of benefit payments recovered or expected to be recovered under reinsurance contracts. Benefits under variable annuity guarantees include the changes in fair value of GMWB and GMAB embedded derivatives and the derivatives hedging these benefits, as well as the changes in fair value of derivatives hedging GMDB provisions. Benefits, claims, losses and settlement expenses also include amortization of DSIC.
Amortization of DAC
Direct sales commissions and other costs capitalized as DAC are amortized over time. For annuity and UL contracts, DAC are amortized based on projections of estimated gross profits over amortization periods equal to the approximate life of the business. For other insurance products, DAC are generally amortized as a percentage of premiums over amortization periods equal to the premium-paying period.
52
Interest and Debt Expense
Interest and debt expense primarily includes interest on corporate debt and debt of CIEs, the impact of interest rate hedging activities and amortization of debt issuance costs.
General and Administrative Expense
General and administrative expense includes compensation, share-based awards and other benefits for employees (other than employees directly related to distribution, such as financial advisors), professional and consultant fees, information technology, facilities and equipment, advertising and promotion, legal and regulatory and corporate related expenses.
Assets Under Management and Administration
Assets under management (“AUM”) include external client assets for which we provide investment management services, such as the assets of the
Columbia Threadneedle Investments
funds, assets of institutional clients and assets of clients in our advisor platform held in wrap accounts as well as assets managed by sub-advisors selected by us. AUM also includes certain assets on our Consolidated Balance Sheets for which we provide investment management services and recognize management fees in our Asset Management segment, such as the assets of the general account and the variable product funds held in the separate accounts of our life insurance subsidiaries and CIEs. These assets do not include assets under advisement, for which we provide model portfolios but do not have full discretionary investment authority. Corporate & Other AUM primarily includes former bank assets that are managed within our Corporate & Other segment.
Assets under administration (“AUA”) include assets for which we provide administrative services such as client assets invested in other companies’ products that we offer outside of our wrap accounts. These assets include those held in clients’ brokerage accounts. We generally record revenues received from administered assets as distribution fees. We do not exercise management discretion over these assets and do not earn a management fee. These assets are not reported on our Consolidated Balance Sheets. AUA also includes certain assets on our Consolidated Balance Sheets for which we do not provide investment management services and do not recognize management fees, such as investments in non-affiliated funds held in the separate accounts of our life insurance subsidiaries. These assets do not include assets under advisement, for which we provide model portfolios but do not have full discretionary investment authority.
The following table presents detail regarding our AUM and AUA:
|
|
December 31,
|
Change
|
||||||||||||
|
2017
|
2016
|
|||||||||||||
|
(in billions)
|
||||||||||||||
|
Assets Under Management and Administration
|
||||||||||||||
|
Advice & Wealth Management AUM
|
$
|
246.7
|
|
$
|
199.7
|
|
$
|
47.0
|
|
24
|
%
|
|||
|
Asset Management AUM
|
494.6
|
|
454.4
|
|
40.2
|
|
9
|
|
||||||
|
Corporate & Other AUM
|
—
|
|
0.3
|
|
(0.3
|
)
|
NM
|
|
||||||
|
Eliminations
|
(27.0
|
)
|
(24.8
|
)
|
(2.2
|
)
|
(9
|
)
|
||||||
|
Total Assets Under Management
|
714.3
|
|
629.6
|
|
84.7
|
|
13
|
|
||||||
|
Total Assets Under Administration
|
182.7
|
|
157.8
|
|
24.9
|
|
16
|
|
||||||
|
Total AUM and AUA
|
$
|
897.0
|
|
$
|
787.4
|
|
$
|
109.6
|
|
14
|
%
|
|||
|
NM Not Meaningful.
|
||||||||||||||
Total AUM increased $84.7 billion, or 13%, to $714.3 billion as of
December 31, 2017
compared to $629.6 billion as of
December 31, 2016
primarily due to a $47.0 billion increase in Advice & Wealth Management AUM driven by wrap account net inflows and market appreciation and a $40.2 billion increase in Asset Management AUM driven by market appreciation and a positive impact of foreign currency translation, partially offset by net outflows and retail fund distributions. See our segment results of operations discussion below for additional information on changes in our AUM.
53
Consolidated Results of Operations
Year Ended
December 31, 2017
Compared to Year Ended
December 31, 2016
The following table presents our consolidated results of operations:
|
|
Years Ended December 31,
|
Change
|
||||||||||||
|
2017
|
2016
|
|||||||||||||
|
(in millions)
|
||||||||||||||
|
Revenues
|
||||||||||||||
|
Management and financial advice fees
|
$
|
6,392
|
|
$
|
5,778
|
|
$
|
614
|
|
11
|
%
|
|||
|
Distribution fees
|
1,770
|
|
1,795
|
|
(25
|
)
|
(1
|
)
|
||||||
|
Net investment income
|
1,509
|
|
1,576
|
|
(67
|
)
|
(4
|
)
|
||||||
|
Premiums
|
1,394
|
|
1,491
|
|
(97
|
)
|
(7
|
)
|
||||||
|
Other revenues
|
1,010
|
|
1,095
|
|
(85
|
)
|
(8
|
)
|
||||||
|
Total revenues
|
12,075
|
|
11,735
|
|
340
|
|
3
|
|
||||||
|
Banking and deposit interest expense
|
48
|
|
39
|
|
9
|
|
23
|
|
||||||
|
Total net revenues
|
12,027
|
|
11,696
|
|
331
|
|
3
|
|
||||||
|
Expenses
|
|
|
|
|
||||||||||
|
Distribution expenses
|
3,399
|
|
3,202
|
|
197
|
|
6
|
|
||||||
|
Interest credited to fixed accounts
|
656
|
|
623
|
|
33
|
|
5
|
|
||||||
|
Benefits, claims, losses and settlement expenses
|
2,233
|
|
2,646
|
|
(413
|
)
|
(16
|
)
|
||||||
|
Amortization of deferred acquisition costs
|
267
|
|
415
|
|
(148
|
)
|
(36
|
)
|
||||||
|
Interest and debt expense
|
207
|
|
241
|
|
(34
|
)
|
(14
|
)
|
||||||
|
General and administrative expense
|
3,051
|
|
2,977
|
|
74
|
|
2
|
|
||||||
|
Total expenses
|
9,813
|
|
10,104
|
|
(291
|
)
|
(3
|
)
|
||||||
|
Pretax income
|
2,214
|
|
1,592
|
|
622
|
|
39
|
|
||||||
|
Income tax provision
|
734
|
|
278
|
|
456
|
|
NM
|
|
||||||
|
Net income
|
$
|
1,480
|
|
$
|
1,314
|
|
$
|
166
|
|
13
|
%
|
|||
|
NM Not Meaningful.
|
||||||||||||||
Overall
Pretax income increased $622 million, or 39%, to $2.2 billion for the year ended
December 31, 2017
compared to $1.6 billion for the prior year primarily reflecting the impact of unlocking, market appreciation, wrap account net inflows, a positive impact from higher short-term interest rates and a $39 million increase in LTC reserves in the prior year primarily due to out-of-period corrections, partially offset by asset management net outflows, loss recognition of $57 million on LTC insurance products in 2017, higher performance-based compensation and a $51 million impairment of our investment in affordable housing partnerships from the enactment of the legislation commonly referred to as the Tax Cuts and Jobs Act (“Tax Act”).
The following market-related impacts were also significant drivers of the year-over-year change in pretax income:
|
•
|
The impact on DAC, DSIC and reserves for insurance features in non-traditional long-duration contracts from actual versus expected market performance based on our view of bond and equity performance was a benefit of $83 million ($36 million for DAC, $8 million for DSIC and $39 million for insurance features in non-traditional long duration contracts) for the year ended
December 31, 2017
reflecting favorable equity market and bond fund returns compared to a benefit of $18 million ($6 million for DAC, $2 million for DSIC and $10 million for insurance features in non-traditional long duration contracts) for the prior year.
|
|
•
|
Net realized investment gains (
net of the related DSIC and DAC amortization, unearned revenue amortization and the reinsurance accrual)
were $44 million for the year ended
December 31, 2017
compared to $6 million for the prior year.
|
|
•
|
The market impact on indexed universal life benefits (net of hedges and the related DAC amortization, unearned revenue amortization and the reinsurance accrual) was a benefit of $4 million for the year ended
December 31, 2017
compared to a benefit of $36 million for the prior year.
|
54
The following table presents the total pretax impacts on our revenues and expenses attributable to unlocking for the years ended December 31:
|
Pretax Increase (Decrease)
|
2017
|
2016
|
||||||
|
(in millions)
|
||||||||
|
Other revenues
|
$
|
(47
|
)
|
$
|
64
|
|
||
|
Total revenues
|
(47
|
)
|
64
|
|
||||
|
Distribution expenses
|
—
|
|
(27
|
)
|
||||
|
Benefits, claims, losses and settlement expenses
|
(139
|
)
|
229
|
|
||||
|
Amortization of DAC
|
(12
|
)
|
81
|
|
||||
|
Total expenses
|
(151
|
)
|
283
|
|
||||
|
Total
(1)
|
$
|
104
|
|
$
|
(219
|
)
|
||
(1)
Includes a $5 million and $16 million net benefit related to the market impact on variable annuity guaranteed benefits for the years ended December 31, 2017 and 2016, respectively.
The favorable unlocking impact in 2017 primarily reflected a positive impact from updates to market-related inputs to our living benefit valuation.
The unfavorable unlocking impact in 2016 primarily reflected low interest rates and higher persistency on living benefit contracts that more than offset benefits from persistency on annuity contracts without living benefits, an update to market-related inputs related to our living benefit valuation and other model updates. Our review of our LTC business in the third quarter of 2016 resulted in a loss recognition of $31 million due to low interest rates, higher morbidity and higher reinsurance expenses, slightly offset by premium increases. The $31 million, which is included in the unlocking impact, was comprised of $58 million of amortization of DAC and the release of the related deferred reinsurance liability of $27 million.
The following table presents the impact from the enactment of the Tax Act for the year ended
December 31, 2017
:
|
Increase (Decrease)
|
(in millions)
|
|||
|
Net investment income
(1)
|
$
|
(51
|
)
|
|
|
Pretax income
|
(51
|
)
|
||
|
Income tax provision
|
||||
|
Remeasurement of deferred tax assets and liabilities
|
221
|
|
||
|
Foreign tax provisions
|
57
|
|
||
|
Remeasurement of tax contingencies
|
8
|
|
||
|
Total prior to tax effect of affordable housing partnership impairment
|
286
|
|
||
|
Tax effect of affordable housing partnership impairment
|
(17
|
)
|
||
|
Total income tax provision
|
269
|
|
||
|
Net income
|
$
|
(320
|
)
|
|
(1)
Includes the impairment of our investment in affordable housing partnerships due to the Tax Act’s change in statutory tax rate to 21%.
Net Revenues
Net revenues increased $331 million, or 3%, to $12.0 billion for the year ended
December 31, 2017
compared to $11.7 billion for the prior year primarily due to market appreciation, wrap account net inflows,
higher performance fees
on property funds and hedge funds and
higher brokerage cash spread due to an increase in short-term interest rates,
partially offset by the impact of unlocking, a $189 million decrease in revenues from the net impact of transitioning advisory accounts to share classes without 12b-1 fees, asset management net outflows, a decrease in net investment income and higher ceded premiums for our auto and home business.
Management
and financial advice fees increased $614 million, or 11%, to $6.4 billion for the
year ended
December 31, 2017
compared to $5.8 billion for the prior year primarily due to an increase in AUM, as well as a $25 million increase in performance fees and higher fees on variable annuities driven by higher average separate account balances. Average AUM increased $48.2 billion, or 8%, compared to the prior year primarily due to market appreciation and wrap account net inflows, partially offset by asset management net outflows. See our discussion on the changes in AUM in our segment results of operations section.
55
Distribution
fees decreased $25 million, or 1%, to $1.8 billion for the
year ended
December 31, 2017
compared to the prior year primarily due to a $223 million decrease related to our transition to share classes without 12b-1 fees in advisory accounts, partially offset by market appreciation and higher brokerage cash spread due to an increase in short-term interest rates.
Net
investment income decreased $67 million, or 4%, to $1.5 billion for the
year ended
December 31, 2017
compared to $1.6 billion for the prior year primarily due to a $51 million impairment of our investment in affordable housing partnerships due to the enactment of the Tax Act, a $49 million decrease in net investment income of CIEs primarily due to a CLO unwind in late 2016 and a $19 million decrease in investment income on fixed maturities driven by low interest rates, partially offset by net realized investment gains of $46 million for the
year ended
December 31, 2017
compared to $6 million for the prior year.
Premiums
decreased $97 million, or 7%, to $1.4 billion for the
year ended
December 31, 2017
compared to $1.5 billion for the prior year primarily reflecting higher ceded premiums for our auto and home business due to new reinsurance arrangements we entered into at the beginning of the year to reduce risk.
Other
revenues decreased $85 million, or 8%, to $1.0 billion for the
year ended
December 31, 2017
compared to $1.1 billion for the prior year primarily due to the impact of unlocking and
the unearned revenue amortization and the reinsurance accrual offset to the market impact on indexed universal life benefits
, partially offset by higher fees from variable annuity guarantee sales in the prior year where the fees start on the first anniversary date and higher average fee rates on variable annuity riders.
The unearned revenue amortization and reinsurance accrual offset to the market impact on indexed universal life benefits was a benefit of $1 million for the year ended
December 31, 2017
compared to a benefit of $24 million for the prior year.
Other revenues for the
year ended
December 31, 2017
included a $47 million unfavorable impact from unlocking compared to a $64 million favorable impact in the prior year. The primary driver of the unlocking impact to other revenues for the
year ended
December 31, 2017
was a negative impact from lower projected gains on reinsurance contracts resulting from favorable mortality experience. The primary driver of the unlocking impact to other revenues for the prior year was a positive impact from higher projected gains on reinsurance contracts resulting from unfavorable mortality experience.
Expenses
Total
expenses decreased $291 million, or 3%, to $9.8 billion for the year ended
December 31, 2017
compared to $10.1 billion for the prior year primarily due to decreases in b
enefits, claims, losses and settlement expenses and amortization of DAC,
partially offset by higher distribution expenses and g
eneral
and administrative expense.
Distribution
expenses increased $197 million, or 6%, to $3.4 billion for the year ended
December 31, 2017
compared to $3.2 billion for the prior year reflecting higher advisor compensation due to market appreciation and wrap account net inflows, investments in recruiting experienced advisors and a $27 million benefit in the prior year related to the write-off of the deferred reinsurance liability in connection with loss recognition testing of LTC insurance products, partially offset by a $147 million decrease from changes related to our transition to share classes without 12b-1 fees in advisory accounts and lower compensation due to asset management net outflows.
Interest
credited to fixed accounts increased $33 million, or 5%, to $656 million for the year ended
December 31, 2017
compared to $623 million for the prior year primarily due to the market impact on indexed universal life benefits, net of hedges, which was a benefit of $3 million for the year ended
December 31, 2017
compared to a benefit of $30 million for the prior year.
Benefits, claims, losses and settlement expenses decreased $413 million, or 16%, to $2.2 billion for the
year ended
December 31, 2017
compared to $2.6 billion for the prior year primarily reflecting the following items:
|
•
|
The
year ended
December 31, 2017
included a $139 million benefit from unlocking compared to a $229 million expense in the prior year. The unlocking impact for the
year ended
December 31, 2017
primarily reflected a benefit from updates to market-related inputs to our living benefit valuation. The unlocking impact for the prior year primarily reflected low interest rates and an unfavorable impact from persistency on living benefit reserves, partially offset by a benefit from updates to withdrawal utilization and fee assumptions, as well as market-related inputs related to our living benefit valuation.
|
|
•
|
A $39 million increase in LTC reserves in the prior year, which included a $29 million out-of-period correction related to our claim utilization factor, a $5 million out-of-period correction related to our waiver of premium claim reserve and a $5 million impact from assumption changes for our active life reserve valuation as a result of loss recognition.
|
|
•
|
The impact on DSIC and reserves for insurance features in non-traditional long-duration contracts from actual versus expected market performance based on our view of bond and equity performance was a benefit of $47 million for the
year ended
December 31, 2017
reflecting favorable equity market and bond fund returns compared to a benefit of $12 million for the prior year.
|
|
•
|
A $64 million decrease in auto and home expenses reflecting the impact of new reinsurance arrangements and a lower non-catastrophe loss ratio, partially offset by higher gross catastrophe losses. Catastrophe losses, net of the impact of reinsurance, were $122 million for the
year ended
December 31, 2017
compared to $104 million for the prior year. The expanded reinsurance program resulted in ceded losses of approximately $104 million for the
year ended
December 31, 2017
.
|
|
•
|
A $57 million expense from loss recognition on the closed block LTC insurance products for the
year ended
December 31, 2017
primarily due to unfavorable morbidity experience, partially offset by premium increases reflecting the cumulative impact of updating reserve assumptions to management’s current best estimate assumptions.
|
56
|
•
|
A $31 million increase in expense related to higher reserve funding driven by the impact of higher fees from variable annuity guarantee sales in the prior year where the fees start on the first anniversary date.
|
|
•
|
A $21 million negative impact in 2017 from changes in assumptions in the prior year unlocking process that resulted in ongoing increases to living benefit reserves.
|
Amortization of DAC decreased $148 million, or 36%, to $267 million for the
year ended
December 31, 2017
compared to $415 million for the prior year primarily reflecting the following items:
|
•
|
The impact of unlocking was a benefit of $12 million for the
year ended
December 31, 2017
compared to an expense of $81 million for the prior year.
The impact of unlocking
for the
year ended
December 31, 2017
primarily reflected improved persistency and mortality on life insurance contracts and a $10 million benefit from a
correction related to a variable annuity model assumption
, partially offset by updates to market-related inputs to the living benefit valuation.
The impact of unlocking in the prior year primarily reflected low interest rates that more than offset benefits from persistency on annuity contracts without living benefits.
In addition, we wrote-off $58 million of DAC in connection with the loss recognition on LTC insurance products in the prior year.
|
|
•
|
The impact on DAC from actual versus expected market performance based on our view of bond and equity performance was a benefit of $36 million for the
year ended
December 31, 2017
reflecting favorable equity market and bond fund returns compared to a benefit of $6 million for the prior year.
|
|
•
|
The DAC offset to the market impact on
indexed universal life benefits (net of hedges, unearned revenue amortization and the reinsurance accrual)
was nil for
the
year ended
December 31, 2017
compared to an expense of $18 million for the prior year.
|
Interest
and debt expense decreased $34 million, or 14%, to $207 million for the year ended
December 31, 2017
compared to $241 million for the prior year due to lower interest expense on CIE debt
primarily due to a CLO unwind in late 2016
.
General
and administrative expense increased $74 million, or 2%, to $3.1 billion for the year ended
December 31, 2017
compared to $3.0 billion for the prior year primarily due to higher performance-based compensation and a $13 million increase in compensation related to higher performance fees, partially offset by a $23 million expense in the prior year from the resolution of a legacy legal matter related to the hedge fund business.
Income Taxes
Our effective tax rate was 33.1% for the year ended
December 31, 2017
compared to 17.4% for the prior year. The increase in our effective tax rate for the year ended
December 31, 2017
was primarily due to a $286 million expense in
2017
due to provisions of the Tax Act, including remeasurement of net deferred tax assets, a deemed repatriation tax of our total post-1986 earnings and profits and remeasurement of tax contingencies, partially offset by a $70 million benefit for net excess tax benefits related to the adoption of a new accounting standard for employee share-based payments.
Results of Operations by Segment
Year Ended
December 31, 2017
Compared to Year Ended
December 31, 2016
Operating earnings is the measure of segment profit or loss management uses to evaluate segment performance. Operating earnings should not be viewed as a substitute for GAAP pretax income. We believe the presentation of segment operating earnings as we measure it for management purposes enhances the understanding of our business by reflecting the underlying performance of our core operations and facilitating a more meaningful trend analysis. See Note 25 to the Consolidated Financial Statements for further information on the presentation of segment results and our definition of operating earnings.
Beginning in the first quarter of 2017, the long term care business, which had been reported as part of the Protection segment, is reflected in the Corporate & Other segment. We discontinued underwriting long term care insurance in 2002 and the transfer of this closed block to the Corporate & Other segment allows investors to better understand the performance of our on-going Protection businesses. Prior periods presented have been restated to reflect the change.
57
The following table presents summary financial information by segment:
|
|
Years Ended December 31,
|
||||||
|
2017
|
2016
|
||||||
|
(in millions)
|
|||||||
|
Advice & Wealth Management
|
|
|
|
|
|||
|
Net revenues
|
$
|
5,506
|
|
$
|
5,036
|
|
|
|
Expenses
|
4,343
|
|
4,125
|
|
|||
|
Operating earnings
|
$
|
1,163
|
|
$
|
911
|
|
|
|
Asset Management
|
|||||||
|
Net revenues
|
$
|
3,077
|
|
$
|
2,964
|
|
|
|
Expenses
|
2,337
|
|
2,343
|
|
|||
|
Operating earnings
|
$
|
740
|
|
$
|
621
|
|
|
|
Annuities
|
|||||||
|
Net revenues
|
$
|
2,499
|
|
$
|
2,463
|
|
|
|
Expenses
|
1,789
|
|
2,134
|
|
|||
|
Operating earnings
|
$
|
710
|
|
$
|
329
|
|
|
|
Protection
|
|||||||
|
Net revenues
|
$
|
2,044
|
|
$
|
2,241
|
|
|
|
Expenses
|
1,828
|
|
1,978
|
|
|||
|
Operating earnings
|
$
|
216
|
|
$
|
263
|
|
|
|
Corporate & Other
|
|||||||
|
Net revenues
|
$
|
173
|
|
$
|
237
|
|
|
|
Expenses
|
599
|
|
596
|
|
|||
|
Operating loss
|
$
|
(426
|
)
|
$
|
(359
|
)
|
|
The following table presents the segment pretax operating impacts on our revenues and expenses attributable to unlocking:
|
Segment Pretax Operating Increase (Decrease)
|
Years Ended December 31,
|
|||||||||||||||||||||||
|
2017
|
2016
|
|||||||||||||||||||||||
|
Annuities
|
Protection
|
Corporate
|
Annuities
|
Protection
|
Corporate
|
|||||||||||||||||||
|
(in millions)
|
||||||||||||||||||||||||
|
Other revenues
|
$
|
—
|
|
$
|
(47
|
)
|
$
|
—
|
|
$
|
—
|
|
$
|
64
|
|
$
|
—
|
|
||||||
|
Total revenues
|
—
|
|
(47
|
)
|
—
|
|
—
|
|
64
|
|
—
|
|
||||||||||||
|
Distribution expenses
|
—
|
|
—
|
|
—
|
|
—
|
|
—
|
|
(27
|
)
|
||||||||||||
|
Benefits, claims, losses and settlement expenses
|
(119
|
)
|
(14
|
)
|
1
|
|
197
|
|
40
|
|
6
|
|
||||||||||||
|
Amortization of DAC
|
(1
|
)
|
(13
|
)
|
—
|
|
18
|
|
7
|
|
58
|
|
||||||||||||
|
Total expenses
|
(120
|
)
|
(27
|
)
|
1
|
|
215
|
|
47
|
|
37
|
|
||||||||||||
|
Total
|
$
|
120
|
|
$
|
(20
|
)
|
$
|
(1
|
)
|
$
|
(215
|
)
|
$
|
17
|
|
$
|
(37
|
)
|
||||||
58
Advice & Wealth Management
The following table presents the changes in wrap account assets and average balances for the years ended December 31:
|
2017
|
2016
|
||||||
|
(in billions)
|
|||||||
|
Beginning balance
|
$
|
201.1
|
|
$
|
180.5
|
|
|
|
Inflows from acquisition
(1)
|
0.7
|
|
—
|
|
|||
|
Other net flows
|
18.8
|
|
10.2
|
|
|||
|
Net flows
|
19.5
|
|
10.2
|
|
|||
|
Market appreciation (depreciation) and other
|
27.6
|
|
10.4
|
|
|||
|
Ending balance
|
$
|
248.2
|
|
$
|
201.1
|
|
|
|
Advisory wrap account assets ending balance
(2)
|
$
|
245.8
|
|
$
|
198.9
|
|
|
|
Average advisory wrap account assets
(3)
|
$
|
222.1
|
|
$
|
187.3
|
|
|
|
(1)
|
Inflows associated with acquisition that closed during the period.
|
|
(2)
|
Advisory wrap account assets represent those assets for which clients receive advisory services and are the primary driver of revenue earned on wrap accounts. Clients may hold non-advisory investments in their wrap accounts that do not incur an advisory fee.
|
|
(3)
|
Average ending balances are calculated using an average of the prior period’s ending balance and all months in the current period.
|
Wrap account assets increased $47.1 billion, or 23%, during the year ended
December 31, 2017
due to net inflows of $19.5 billion and market appreciation and other of $27.6 billion. Wrap net inflows increased $9.3 billion, or 92%, compared to the prior year driven by client activity and a shift from commission-based business to fee-based advisory accounts. Average advisory wrap account assets increased $34.8 billion, or 19%, compared to the prior year reflecting net inflows and market appreciation.
In July 2017, we completed our acquisition of Investment Professionals, Inc. (“IPI”), an independent broker-dealer based in San Antonio, Texas specializing in the on-site delivery of investment programs for financial institutions, including banks and credit unions. The acquisition added 215 financial advisors and $8 billion in client assets (including $0.7 billion in assets under management and $7.3 billion in assets under administration).
The following table presents the results of operations of our Advice & Wealth Management segment on an operating basis:
|
Years Ended December 31,
|
Change
|
|||||||||||||
|
2017
|
2016
|
|||||||||||||
|
(in millions)
|
||||||||||||||
|
Revenues
|
||||||||||||||
|
Management and financial advice fees
|
$
|
3,148
|
|
$
|
2,707
|
|
$
|
441
|
|
16
|
%
|
|||
|
Distribution fees
|
2,085
|
|
2,109
|
|
(24
|
)
|
(1
|
)
|
||||||
|
Net investment income
|
239
|
|
186
|
|
53
|
|
28
|
|
||||||
|
Other revenues
|
82
|
|
73
|
|
9
|
|
12
|
|
||||||
|
Total revenues
|
5,554
|
|
5,075
|
|
479
|
|
9
|
|
||||||
|
Banking and deposit interest expense
|
48
|
|
39
|
|
9
|
|
23
|
|
||||||
|
Total net revenues
|
5,506
|
|
5,036
|
|
470
|
|
9
|
|
||||||
|
Expenses
|
|
|
|
|
|
|
||||||||
|
Distribution expenses
|
3,245
|
|
3,072
|
|
173
|
|
6
|
|
||||||
|
Interest and debt expense
|
9
|
|
8
|
|
1
|
|
13
|
|
||||||
|
General and administrative expense
|
1,089
|
|
1,045
|
|
44
|
|
4
|
|
||||||
|
Total expenses
|
4,343
|
|
4,125
|
|
218
|
|
5
|
|
||||||
|
Operating earnings
|
$
|
1,163
|
|
$
|
911
|
|
$
|
252
|
|
28
|
%
|
|||
Our Advice & Wealth Management segment pretax operating earnings, which exclude net realized investment gains or losses, increased $252 million, or 28%, to $1.2 billion for the year ended
December 31, 2017
compared to $911 million for the prior year reflecting wrap account net inflows, market appreciation and higher earnings on brokerage cash, partially offset by expenses associated with recruiting experienced advisors and higher performance-based compensation. Pretax operating margin was 21.1% for the year ended
December 31, 2017
compared to 18.1% for the prior year.
Net Revenues
Net revenues exclude net realized investment gains or losses. Net revenues increased $470 million, or 9%, to $5.5 billion for the year ended
December 31, 2017
compared to $5.0 billion for the prior year primarily due to growth in wrap account assets, higher earnings
59
on brokerage cash and increased transactional activity, partially offset by a $189 million decrease in revenues from the net impact of transitioning advisory accounts to share classes without 12b-1 fees. Operating net revenue per advisor increased to $564,000 for the year ended
December 31, 2017
, up 9%, from $518,000 for the prior year.
Management and financial fees increased $441 million, or 16%, to $3.1 billion for the year ended
December 31, 2017
compared to $2.7 billion for the prior year primarily due to growth in wrap account assets. Average advisory wrap account assets increased $34.8 billion, or 19%, compared to the prior year reflecting net inflows and market appreciation.
Distribution fees decreased $24 million, or 1%, to $2.1 billion for the year ended
December 31, 2017
compared to the prior year primarily due to a $223 million decrease related to our transition to share classes without 12b-1 fees in advisory accounts, partially offset by market appreciation, increased transactional activity and higher brokerage cash spread due to an increase in short-term interest rates.
Net investment income increased $53 million, or 28%, to $239 million for the year ended
December 31, 2017
compared to $186 million for the prior year primarily due to higher investment yields and an increase in invested balances driven by certificate net inflows.
Expenses
Total expenses increased $218 million, or 5%, to $4.3 billion for the year ended
December 31, 2017
compared to $4.1 billion for the prior year primarily due to increases in distribution expenses and general and administrative expense.
Distribution expenses increased $173 million, or 6%, to $3.2 billion for the year ended
December 31, 2017
compared to $3.1 billion for the prior year reflecting higher advisor compensation due to market appreciation and wrap account net inflows, increased transactional activity and investments in recruiting experienced advisors, partially offset by a $147 million decrease related to our transition to share classes without 12b-1 fees in advisory accounts.
General
and administrative expense increased $44 million, or 4%, to $1.1 billion for the year ended
December 31, 2017
compared to $1.0 billion for the prior year primarily due to higher performance-based compensation, expenses related to the IPI acquisition and higher national conference expenses.
Asset Management
Fee waivers have been provided to the Columbia Money Market Funds (the “Funds”) by Columbia Management and certain other subsidiaries performing services for the Funds for the purpose of reducing the expenses charged to a Fund in a given period to maintain or improve a Fund’s net yield in that period. Our subsidiaries may enter into contractual arrangements with the Funds identifying the specific fees to be waived and/or expenses to be reimbursed, as well as the time period for which such waivers will apply. Voluntary fee waivers we provided to the Columbia Money Market Funds were not material for the years ended
December 31, 2017
,
2016
and
2015
, respectively.
In November 2017, we completed our acquisition of Lionstone Partners, LLC (“Lionstone Investments”), a leading national real estate investment firm, specializing in investment strategies based upon proprietary analytics. The acquisition added $5.4 billion in assets under management. In 2016, we completed our acquisition of Emerging Global Advisors, LLC (“EGA”), a registered investment adviser and provider of strategic beta portfolios based on emerging markets. The acquisition added $1.0 billion in assets under management.
The following tables present the mutual fund performance of our retail C
olumbia Threadneedle Investments
funds as of December 31:
|
Columbia
Mutual Fund Rankings in top 2 Lipper Quartiles
|
2017
|
2016
|
|||||
|
Domestic Equity
|
Equal weighted
|
1 year
|
69
|
%
|
56
|
%
|
|
|
|
|
3 year
|
75
|
%
|
75
|
%
|
|
|
|
|
5 year
|
69
|
%
|
71
|
%
|
|
|
|
Asset weighted
|
1 year
|
73
|
%
|
41
|
%
|
|
|
|
|
3 year
|
83
|
%
|
81
|
%
|
|
|
|
|
5 year
|
80
|
%
|
75
|
%
|
|
|
International Equity
|
Equal weighted
|
1 year
|
75
|
%
|
20
|
%
|
|
|
|
|
3 year
|
60
|
%
|
55
|
%
|
|
|
|
|
5 year
|
70
|
%
|
70
|
%
|
|
|
|
Asset weighted
|
1 year
|
52
|
%
|
12
|
%
|
|
|
|
|
3 year
|
47
|
%
|
44
|
%
|
|
|
|
|
5 year
|
54
|
%
|
47
|
%
|
|
60
|
Taxable Fixed Income
|
Equal weighted
|
1 year
|
67
|
%
|
72
|
%
|
|
|
|
|
3 year
|
83
|
%
|
76
|
%
|
|
|
|
|
5 year
|
82
|
%
|
76
|
%
|
|
|
|
Asset weighted
|
1 year
|
69
|
%
|
75
|
%
|
|
|
|
|
3 year
|
89
|
%
|
83
|
%
|
|
|
|
|
5 year
|
89
|
%
|
86
|
%
|
|
|
Tax Exempt Fixed Income
|
Equal weighted
|
1 year
|
79
|
%
|
74
|
%
|
|
|
|
|
3 year
|
89
|
%
|
89
|
%
|
|
|
|
|
5 year
|
100
|
%
|
100
|
%
|
|
|
|
Asset weighted
|
1 year
|
76
|
%
|
59
|
%
|
|
|
|
|
3 year
|
93
|
%
|
86
|
%
|
|
|
|
|
5 year
|
100
|
%
|
100
|
%
|
|
|
Asset Allocation Funds
|
Equal weighted
|
1 year
|
62
|
%
|
31
|
%
|
|
|
|
|
3 year
|
80
|
%
|
100
|
%
|
|
|
|
|
5 year
|
78
|
%
|
75
|
%
|
|
|
|
Asset weighted
|
1 year
|
51
|
%
|
15
|
%
|
|
|
|
|
3 year
|
94
|
%
|
100
|
%
|
|
|
|
|
5 year
|
94
|
%
|
82
|
%
|
|
|
Number of funds with 4 or 5 Morningstar star ratings
|
|
Overall
|
52
|
|
51
|
|
|
|
|
|
3 year
|
56
|
|
45
|
|
|
|
|
|
5 year
|
50
|
|
44
|
|
|
|
Percent of funds with 4 or 5 Morningstar star ratings
|
|
Overall
|
51
|
%
|
54
|
%
|
|
|
|
|
3 year
|
55
|
%
|
48
|
%
|
|
|
|
|
5 year
|
51
|
%
|
47
|
%
|
|
|
Percent of assets with 4 or 5 Morningstar star ratings
|
|
Overall
|
60
|
%
|
64
|
%
|
|
|
|
|
3 year
|
63
|
%
|
64
|
%
|
|
|
|
|
5 year
|
59
|
%
|
53
|
%
|
|
Mutual fund performance rankings are based on the performance of Class Z fund shares for Columbia branded mutual funds. Only funds with Class Z shares are included.
Equal Weighted Rankings in Top 2 Quartiles: Counts the number of funds with above median ranking divided by the total number of funds. Asset size is not a factor.
Asset Weighted Rankings in Top 2 Quartiles: Sums the total assets of the funds with above median ranking divided by total assets of all funds. Funds with more assets will receive a greater share of the total percentage above or below median.
61
|
Threadneedle
Retail Fund Rankings in Top 2 Morningstar Quartiles or Above Index Benchmark
|
2017
|
2016
|
|||||
|
Equity
|
Equal weighted
|
1 year
|
59
|
%
|
26
|
%
|
|
|
|
|
3 year
|
64
|
%
|
58
|
%
|
|
|
|
|
5 year
|
63
|
%
|
72
|
%
|
|
|
|
Asset weighted
|
1 year
|
56
|
%
|
40
|
%
|
|
|
|
|
3 year
|
60
|
%
|
67
|
%
|
|
|
|
|
5 year
|
63
|
%
|
67
|
%
|
|
|
Fixed Income
|
Equal weighted
|
1 year
|
83
|
%
|
70
|
%
|
|
|
|
|
3 year
|
82
|
%
|
59
|
%
|
|
|
|
|
5 year
|
72
|
%
|
65
|
%
|
|
|
|
Asset weighted
|
1 year
|
93
|
%
|
68
|
%
|
|
|
|
|
3 year
|
95
|
%
|
74
|
%
|
|
|
|
|
5 year
|
88
|
%
|
69
|
%
|
|
|
Allocation (Managed) Funds
|
Equal weighted
|
1 year
|
67
|
%
|
67
|
%
|
|
|
|
|
3 year
|
78
|
%
|
100
|
%
|
|
|
|
|
5 year
|
100
|
%
|
83
|
%
|
|
|
|
Asset weighted
|
1 year
|
60
|
%
|
70
|
%
|
|
|
|
|
3 year
|
97
|
%
|
100
|
%
|
|
|
|
|
5 year
|
100
|
%
|
92
|
%
|
|
The performance of each fund is measured on a consistent basis against the most appropriate benchmark — a peer group of similar funds or an index.
Equal weighted: Counts the number of funds with above median ranking (if measured against peer group) or above index performance (if measured against an index) divided by the total number of funds. Asset size is not a factor.
Asset weighted: Sums the assets of the funds with above median ranking (if measured against peer group) or above index performance (if measured against an index) divided by the total sum of assets in the funds. Funds with more assets will receive a greater share of the total percentage above or below median or index.
Aggregated Allocation (Managed) Funds include funds that invest in other funds of the
Threadneedle
range including those funds that invest in both equity and fixed income.
Aggregated
Threadneedle
data includes funds on the
Threadneedle
platform sub-advised by Columbia Management as well as advisors not affiliated with Ameriprise Financial, Inc.
The following table presents managed assets by type:
|
December 31,
|
Change
|
Average
(1)
|
Change
|
||||||||||||||||||||||||||
|
December 31,
|
|||||||||||||||||||||||||||||
|
2017
|
2016
|
2017
|
2016
|
||||||||||||||||||||||||||
|
(in billions)
|
|||||||||||||||||||||||||||||
|
Equity
|
$
|
275.4
|
|
$
|
240.0
|
|
$
|
35.4
|
|
15
|
%
|
$
|
258.4
|
|
$
|
242.7
|
|
$
|
15.7
|
|
6
|
%
|
|||||||
|
Fixed income
|
173.6
|
|
175.9
|
|
(2.3
|
)
|
(1
|
)
|
177.0
|
|
179.0
|
|
(2.0
|
)
|
(1
|
)
|
|||||||||||||
|
Money market
|
5.4
|
|
6.3
|
|
(0.9
|
)
|
(14
|
)
|
5.8
|
|
7.1
|
|
(1.3
|
)
|
(18
|
)
|
|||||||||||||
|
Alternative
|
5.6
|
|
7.4
|
|
(1.8
|
)
|
(24
|
)
|
6.8
|
|
7.5
|
|
(0.7
|
)
|
(9
|
)
|
|||||||||||||
|
Hybrid and other
|
34.6
|
|
24.8
|
|
9.8
|
|
40
|
|
27.5
|
|
24.5
|
|
3.0
|
|
12
|
|
|||||||||||||
|
Total managed assets
|
$
|
494.6
|
|
$
|
454.4
|
|
$
|
40.2
|
|
9
|
%
|
$
|
475.5
|
|
$
|
460.8
|
|
$
|
14.7
|
|
3
|
%
|
|||||||
|
(1)
Average ending balances are calculated using an average of the prior period’s ending balance and all months in the current period.
|
|||||||||||||||||||||||||||||
62
The following tables present the changes in global managed assets:
|
Years Ended December 31,
|
|||||||
|
2017
|
2016
|
||||||
|
(in billions)
|
|||||||
|
Global Retail Funds
|
|
|
|
|
|||
|
Beginning assets
|
$
|
259.9
|
|
$
|
263.9
|
|
|
|
Inflows
|
50.9
|
|
52.2
|
|
|||
|
Inflows from acquisitions
(1)
|
—
|
|
1.0
|
|
|||
|
Outflows
|
(60.0
|
)
|
(63.5
|
)
|
|||
|
Net VP/VIT fund flows
|
(3.3
|
)
|
(2.0
|
)
|
|||
|
Net new flows
|
(12.4
|
)
|
(12.3
|
)
|
|||
|
Reinvested dividends
|
9.8
|
|
8.1
|
|
|||
|
Net flows
|
(2.6
|
)
|
(4.2
|
)
|
|||
|
Distributions
|
(11.7
|
)
|
(9.9
|
)
|
|||
|
Market appreciation and other
|
38.4
|
|
15.2
|
|
|||
|
Foreign currency translation
(2)
|
3.8
|
|
(5.1
|
)
|
|||
|
Total ending assets
|
287.8
|
|
259.9
|
|
|||
|
Global Institutional
|
|
|
|
|
|||
|
Beginning assets
|
194.5
|
|
208.0
|
|
|||
|
Inflows
|
24.7
|
|
24.1
|
|
|||
|
Inflows from acquisitions
(1)
|
5.4
|
|
—
|
|
|||
|
Outflows
|
(44.2
|
)
|
(38.5
|
)
|
|||
|
Net flows
|
(14.1
|
)
|
(14.4
|
)
|
|||
|
Market appreciation and other
(3)(4)
|
18.8
|
|
13.5
|
|
|||
|
Foreign currency translation
(2)
|
7.6
|
|
(12.6
|
)
|
|||
|
Total ending assets
|
206.8
|
|
194.5
|
|
|||
|
Total managed assets
|
$
|
494.6
|
|
$
|
454.4
|
|
|
|
Total net flows
|
$
|
(16.7
|
)
|
$
|
(18.6
|
)
|
|
|
Former Parent Company Related
(5)(6)
|
|||||||
|
Retail net new flows
|
$
|
(3.0
|
)
|
$
|
(1.3
|
)
|
|
|
Institutional net new flows
|
(12.2
|
)
|
(8.9
|
)
|
|||
|
Total net new flows
|
$
|
(15.2
|
)
|
$
|
(10.2
|
)
|
|
(1)
Inflows associated with acquisitions that closed during the period.
(2)
Amounts represent local currency to US dollar translation for reporting purposes.
(3)
Included in Market appreciation and other for Global Institutional in 2016 are $(0.4) billion due to the transfer of assets from Separately Managed Accounts to Unified Managed Accounts.
(4)
Includes $0.5 billion and $1.7 billion for the total change in Affiliated General Account Assets during the years ended
December 31, 2017
and 2016, respectively.
(5)
Former parent company related assets and net new flows are included in the rollforwards above.
(6)
Prior period former parent company related net new flows were restated to include additional Former Parent Company net new flows that were previously not considered. The change was a decrease of $296 million for the year ended December 31, 2016.
In a referendum in June 2016, the United Kingdom (UK) voted to leave the European Union (EU), which caused volatility in capital and currency markets. Further, in March 2017 the UK invoked article 50 of the Treaty of Lisbon in serving its relevant notice to leave the European Union on March 30, 2019. The full impact of the British exit from the EU (commonly known as “Brexit”) remains uncertain. This uncertainty may have a negative impact on our UK and European net flows and foreign currency translation if the British Pound weakens.
Total segment AUM increased $40.2
billion, or 9%,
during the year
ended
December 31, 2017
driven
by market appreciation and a positive impact of foreign currency translation, partially offset by net outflows and retail fund distributions. Total segment AUM net outflows were $16.7 billion for the year ended
December 31, 2017
, which included $15.2 billion of outflows of former parent-related assets.
63
Global retail net outflows of $2.6 billion included $3.3 billion of outflows of our variable product funds underlying insurance and annuity separate accounts and $3.0 billion of outflows from former parent-related assets. In U.S. retail, net outflows of $4.1 billion reflected industry pressures on active strategies and outflows from former parent-related assets, partially offset by $9.7 billion of reinvested dividends. In Europe, Middle East and Africa (“EMEA”) retail, net inflows were $1.5 billion.
Global institutional net outflows of $14.1 billion included $12.2 billion of outflows from former parent-related assets. Institutional outflows from former parent-related assets primarily included Zurich outflows of $7.6 billion and U.S. Trust outflows of $4.4 billion.
Institutional outflows also included $4.3 billion from three fixed-income mandates that had a weighted average fee rate of only four basis points. Flows also included $5.4 billion of inflows from the Lionstone Investments acquisition.
The following table presents the results of operations of our Asset Management segment on an operating basis:
|
Years Ended December 31,
|
Change
|
|||||||||||||
|
2017
|
2016
|
|||||||||||||
|
(in millions)
|
||||||||||||||
|
Revenues
|
|
|
|
|
|
|
|
|
||||||
|
Management and financial advice fees
|
$
|
2,574
|
|
$
|
2,452
|
|
$
|
122
|
|
5
|
%
|
|||
|
Distribution fees
|
458
|
|
487
|
|
(29
|
)
|
(6
|
)
|
||||||
|
Net investment income
|
28
|
|
14
|
|
14
|
|
NM
|
|
||||||
|
Other revenues
|
17
|
|
11
|
|
6
|
|
55
|
|
||||||
|
Total revenues
|
3,077
|
|
2,964
|
|
113
|
|
4
|
|
||||||
|
Banking and deposit interest expense
|
—
|
|
—
|
|
—
|
|
—
|
|
||||||
|
Total net revenues
|
3,077
|
|
2,964
|
|
113
|
|
4
|
|
||||||
|
Expenses
|
|
|
|
|
|
|
||||||||
|
Distribution expenses
|
1,000
|
|
1,019
|
|
(19
|
)
|
(2
|
)
|
||||||
|
Amortization of deferred acquisition costs
|
15
|
|
18
|
|
(3
|
)
|
(17
|
)
|
||||||
|
Interest and debt expense
|
22
|
|
21
|
|
1
|
|
5
|
|
||||||
|
General and administrative expense
|
1,300
|
|
1,285
|
|
15
|
|
1
|
|
||||||
|
Total expenses
|
2,337
|
|
2,343
|
|
(6
|
)
|
—
|
|
||||||
|
Operating earnings
|
$
|
740
|
|
$
|
621
|
|
$
|
119
|
|
19
|
%
|
|||
|
NM Not Meaningful.
|
||||||||||||||
Our Asset Management segment pretax operating earnings, which exclude net realized investment gains or losses, increased $119 million, or 19%, to $740 million for the year ended
December 31, 2017
compared to $621 million for the prior year primarily due to market appreciation, a $12 million increase related to CLO unwinds, a $12 million increase in performance fees
on property funds and hedge funds
(net of related compensation), a $9 million expense in the prior year from the resolution of a legacy legal matter related to the hedge fund business and continued expense management, partially offset by the cumulative impact of net outflows and higher performance-based compensation.
Net Revenues
Net revenues, which exclude net realized investment gains or losses, increased $113 million, or 4%, to $3.1 billion for the year ended
December 31, 2017
compared to $3.0 billion for the prior year reflecting market appreciation, higher revenues from CLO unwinds and higher performance fees, partially offset by the cumulative impact of net outflows, foreign exchange translation and a decrease related to the transition of advisory accounts to share classes without 12b-1 fees. The Asset Management segment revenue related to 12b-1 fees is eliminated on a consolidated basis.
Management and financial advice fees increased $122 million, or 5%, to $2.6 billion for the year ended
December 31, 2017
compared to $2.5 billion for the prior year driven by market appreciation, an increase in incentive fees from CLO unwinds and a $25 million increase in performance fees, partially offset by cumulative net outflows from former parent-related assets and higher fee yielding retail funds and an $11 million negative foreign currency translation impact. Our average weighted equity index, which is a proxy for equity movements on AUM, increased 17% for the year ended
December 31, 2017
compared to the prior year.
Distribution fees decreased $29 million, or 6%, to $458 million for the year ended
December 31, 2017
compared to $487 million for the prior year due to cumulative net outflows and a $40 million decrease related to the transition of advisory accounts to share classes without 12b-1 fees, partially offset by market appreciation.
Expenses
Total expenses decreased $6 million to $2.3 billion for the year ended
December 31, 2017
compared to the prior year primarily due to lower distribution expenses, partially offset by higher general and administrative expense.
64
Distribution expenses decreased $19 million, or 2%, to $1.0 billion for the year ended
December 31, 2017
compared to the prior year due to lower compensation driven by cumulative net outflows and a $40 million decrease related to the transition of advisory accounts to share classes without 12b-1 fees, partially offset by market appreciation. The Asset Management segment expense related to 12b-1 fees is eliminated on a consolidated basis.
General and administrative expense increased $15 million, or 1%, to $1.3 billion for the year ended
December 31, 2017
compared to the prior year primarily due to a $13 million increase in compensation related to higher performance fees and higher performance-based compensation, partially offset by a $13 million benefit from the impact of foreign exchange, a $9 million expense in the prior year from the resolution of a legacy legal matter related to the hedge fund business and continued expense management.
Annuities
The following table presents the results of operations of our Annuities segment on an operating basis:
|
Years Ended December 31,
|
Change
|
|||||||||||||
|
2017
|
2016
|
|||||||||||||
|
(in millions)
|
||||||||||||||
|
Revenues
|
|
|
|
|
|
|
|
|
||||||
|
Management and financial advice fees
|
$
|
772
|
|
$
|
732
|
|
$
|
40
|
|
5
|
%
|
|||
|
Distribution fees
|
364
|
|
349
|
|
15
|
|
4
|
|
||||||
|
Net investment income
|
697
|
|
760
|
|
(63
|
)
|
(8
|
)
|
||||||
|
Premiums
|
116
|
|
116
|
|
—
|
|
—
|
|
||||||
|
Other revenues
|
550
|
|
506
|
|
44
|
|
9
|
|
||||||
|
Total revenues
|
2,499
|
|
2,463
|
|
36
|
|
1
|
|
||||||
|
Banking and deposit interest expense
|
—
|
|
—
|
|
—
|
|
—
|
|
||||||
|
Total net revenues
|
2,499
|
|
2,463
|
|
36
|
|
1
|
|
||||||
|
Expenses
|
|
|
|
|
|
|
||||||||
|
Distribution expenses
|
428
|
|
423
|
|
5
|
|
1
|
|
||||||
|
Interest credited to fixed accounts
|
473
|
|
478
|
|
(5
|
)
|
(1
|
)
|
||||||
|
Benefits, claims, losses and settlement expenses
|
467
|
|
780
|
|
(313
|
)
|
(40
|
)
|
||||||
|
Amortization of deferred acquisition costs
|
181
|
|
209
|
|
(28
|
)
|
(13
|
)
|
||||||
|
Interest and debt expense
|
35
|
|
33
|
|
2
|
|
6
|
|
||||||
|
General and administrative expense
|
205
|
|
211
|
|
(6
|
)
|
(3
|
)
|
||||||
|
Total expenses
|
1,789
|
|
2,134
|
|
(345
|
)
|
(16
|
)%
|
||||||
|
Operating earnings
|
$
|
710
|
|
$
|
329
|
|
$
|
381
|
|
NM
|
|
|||
|
NM Not Meaningful.
|
||||||||||||||
Our Annuities segment pretax operating income, which excludes net realized investment gains or losses (net of the related DSIC and DAC amortization), the market impact on variable annuity guaranteed benefits (net of hedges and the related DSIC and DAC amortization) and the market impact on fixed index annuity benefits (net of hedges and the related DAC amortization), increased $381 million to $710 million for the year ended
December 31, 2017
compared to $329 million for the prior year primarily due to the impact of unlocking, equity market appreciation and the impact on DAC, DSIC and reserves for insurance features in non-traditional long-duration contracts from actual versus expected market performance based on our view of bond and equity performance, partially offset by lower investment yields and a $21 million negative impact in 2017 from changes in assumptions in the prior year unlocking process that resulted in ongoing increases to living benefit reserves.
RiverSource
variable annuity account balances increased 7% to $80.3 billion at
December 31, 2017
compared to the prior year due to equity market appreciation, partially offset by net outflows of $3.9 billion. Lapse rates were higher in the year, reflecting increased client asset transfers from variable annuities to affiliated fee-based investment advisory accounts.
RiverSource
fixed deferred annuity account balances declined 7% to $9.3 billion at
December 31, 2017
compared to the prior year as older policies continue to lapse and new sales are limited due to low interest rates. Given the current interest rate environment, our current fixed deferred annuity book is expected to gradually run off and earnings on our fixed deferred annuity business will trend down.
The impact on DAC, DSIC and reserves for insurance features in non-traditional long-duration contracts from actual versus expected market performance based on our view of bond and equity performance was a benefit of $81 million ($34 million for DAC, $8 million for DSIC and $39 million for insurance features in non-traditional long duration contracts) for the year ended
65
December 31, 2017
reflecting favorable equity market and bond fund returns compared to a benefit of $18 million ($6 million for DAC, $2 million for DSIC and $10 million for insurance features in non-traditional long duration contracts) for the prior year.
Net Revenues
Net revenues, which exclude net realized investment gains or losses, increased $36 million, or 1%, to $2.5 billion for the year ended
December 31, 2017
compared to the prior year due to equity market appreciation and an increase in variable annuity rider fees, partially offset by lower investment yields and net outflows in fixed and variable annuities.
Management and financial advice fees increased $40 million, or 5%, to $772 million for the year ended
December 31, 2017
compared to $732 million for the prior year due to higher fees on variable annuities driven by higher average separate account balances. Average variable annuity separate account balances increased $3.3 billion, or 5%, from the prior year due to market appreciation, partially offset by net outflows.
Net investment income, which excludes net realized investment gains or losses, decreased $63 million, or 8%, to $697 million for the year ended
December 31, 2017
compared to $760 million for the prior year primarily reflecting a decrease of approximately $45 million from lower earned interest rates and approximately $18 million from lower invested assets due to fixed annuity net outflows.
Other revenues increased $44 million, or 9%, to $550 million for the year ended
December 31, 2017
compared to $506 million for the prior year due to higher fees from variable annuity guarantee sales in the prior year where the fees start on the first anniversary date and higher average fee rates on variable annuity riders.
Expenses
Total expenses, which exclude the market impact on variable annuity guaranteed benefits (net of hedges and the related DSIC and DAC amortization), the market impact on fixed index annuity benefits (net of hedges and the related DAC amortization) and the DAC and DSIC offset to net realized investment gains or losses, decreased $345 million, or 16%, to $1.8 billion for the year ended
December 31, 2017
compared to $2.1 billion for the prior year primarily due to the impact of unlocking.
Benefits, claims, losses and settlement expenses, which exclude the market impact on variable annuity guaranteed benefits (net of hedges and the related DSIC amortization) and the DSIC offset to net realized investment gains or losses, decreased $313 million, or 40%, to $467 million for the year ended
December 31, 2017
compared to $780 million for the prior year primarily reflecting the following items:
|
•
|
The impact of unlocking was a $119 million benefit for the year ended December 31, 2017 compared to a $197 million expense for the prior year. The unlocking impact for the year ended
December 31, 2017
primarily reflected a benefit from updates to market-related inputs to our living benefit valuation. The unlocking impact for the prior year primarily reflected low interest rates and an unfavorable impact from persistency on living benefit reserves, partially offset by a benefit from updates to withdrawal utilization and fee assumptions, as well as market-related inputs related to our living benefit valuation.
|
|
•
|
The impact on DSIC and reserves for insurance features in non-traditional long-duration contracts from actual versus expected market performance based on our view of bond and equity performance was a benefit of $47 million for the year ended
December 31, 2017
reflecting favorable equity market and bond fund returns compared to a benefit of $12 million for the prior year.
|
|
•
|
A $31 million increase in expense related to higher reserve funding driven by the impact of higher fees from variable annuity guarantee sales in the prior year where the fees start on the first anniversary date.
|
|
•
|
A $21 million negative impact in 2017 from changes in assumptions in the prior year unlocking process that resulted in ongoing increases to living benefit reserves.
|
Amortization of DAC, which excludes the DAC offset to
the market impact on variable annuity guaranteed benefits and fixed index annuity benefits and the DAC offset to net realized investment gains or losses,
decreased $28 million, or 13%, to $181 million for the year ended December 31, 2017 compared to $209 million for the prior year primarily reflecting the following items:
|
•
|
The impact of unlocking was a benefit of $1 million for the year ended
December 31, 2017
compared to an expense of $18 million for the prior year.
The impact of unlocking
for the year ended
December 31, 2017
primarily reflected a $10 million benefit from a correction related to a variable annuity model assumption and slightly higher interest rates, largely offset by updates to market-related inputs to the living benefit valuation.
The impact of unlocking in the prior year primarily reflected low interest rates that more than offset benefits from persistency on annuity contracts without living benefits.
|
|
•
|
The impact on DAC from actual versus expected market performance based on our view of bond and equity performance was a benefit of $34 million for the year ended
December 31, 2017
reflecting favorable equity market and bond fund returns compared to a benefit of $6 million for the prior year.
|
66
Protection
The following table presents the results of operations of our Protection segment on an operating basis:
|
Years Ended December 31,
|
Change
|
|||||||||||||
|
2017
|
2016
|
|||||||||||||
|
(in millions)
|
||||||||||||||
|
Revenues
|
|
|
|
|
|
|
|
|
||||||
|
Management and financial advice fees
|
$
|
48
|
|
$
|
51
|
|
$
|
(3
|
)
|
(6
|
)%
|
|||
|
Distribution fees
|
101
|
|
98
|
|
3
|
|
3
|
|
||||||
|
Net investment income
|
338
|
|
330
|
|
8
|
|
2
|
|
||||||
|
Premiums
|
1,204
|
|
1,286
|
|
(82
|
)
|
(6
|
)
|
||||||
|
Other revenues
|
353
|
|
476
|
|
(123
|
)
|
(26
|
)
|
||||||
|
Total revenues
|
2,044
|
|
2,241
|
|
(197
|
)
|
(9
|
)
|
||||||
|
Banking and deposit interest expense
|
—
|
|
—
|
|
—
|
|
—
|
|
||||||
|
Total net revenues
|
2,044
|
|
2,241
|
|
(197
|
)
|
(9
|
)
|
||||||
|
Expenses
|
|
|
|
|
|
|
||||||||
|
Distribution expenses
|
68
|
|
70
|
|
(2
|
)
|
(3
|
)
|
||||||
|
Interest credited to fixed accounts
|
186
|
|
175
|
|
11
|
|
6
|
|
||||||
|
Benefits, claims, losses and settlement expenses
|
1,209
|
|
1,325
|
|
(116
|
)
|
(9
|
)
|
||||||
|
Amortization of deferred acquisition costs
|
96
|
|
138
|
|
(42
|
)
|
(30
|
)
|
||||||
|
Interest and debt expense
|
25
|
|
25
|
|
—
|
|
—
|
|
||||||
|
General and administrative expense
|
244
|
|
245
|
|
(1
|
)
|
—
|
|
||||||
|
Total expenses
|
1,828
|
|
1,978
|
|
(150
|
)
|
(8
|
)
|
||||||
|
Operating earnings
|
$
|
216
|
|
$
|
263
|
|
$
|
(47
|
)
|
(18
|
)%
|
|||
Our Protection segment pretax operating earnings, which excludes net realized investment gains or losses (net of the related DAC amortization, unearned revenue amortization and the reinsurance accrual) and the market impact on indexed universal life benefits (net of hedges and the related DAC amortization, unearned revenue amortization and the reinsurance accrual), decreased $47 million, or 18%, to $216 million for the year ended
December 31, 2017
compared to $263 million for the prior year primarily due to the impact of unlocking and the impact of the low interest rate environment on investment returns.
Net Revenues
Net revenues, which exclude net realized investment gains or losses (net of unearned revenue amortization and the reinsurance accrual) and the unearned revenue amortization and reinsurance accrual offset to the market impact on indexed universal life benefits, decreased $197 million, or 9%, to $2.0 billion for the year ended
December 31, 2017
compared to $2.2 billion for the prior year primarily due to the impact of unlocking and a decrease in premiums.
Net investment income, which excludes net realized investment gains or losses, increased $8 million, or 2%, to $338 million for the year ended
December 31, 2017
compared to $330 million for the prior year due to higher invested assets, partially offset by lower earned interest rates.
Premiums
decreased $82 million, or 6%, to $1.2 billion for the year ended
December 31, 2017
compared to $1.3 billion for the prior year primarily reflecting higher ceded premiums for our auto and home business due to new reinsurance arrangements we entered into at the beginning of the year to reduce risk.
Other revenues, which exclude
the unearned revenue amortization and reinsurance accrual offset to net realized investment gains or losses and the market impact on indexed universal life benefits,
decreased $123 million, or 26%, to $353 million for the year ended
December 31, 2017
compared to $476 million for the prior year primarily due to the impact of unlocking. Other revenues for the year ended
December 31, 2017
included a $47 million unfavorable impact from unlocking compared to a $64 million favorable impact in the prior year. The primary driver of the unlocking impact to other revenues for the year ended
December 31, 2017
was a negative impact from lower projected gains on reinsurance contracts resulting from favorable mortality experience. The primary driver of the unlocking impact to other revenues for the prior year was a positive impact from higher projected gains on reinsurance contracts resulting from unfavorable mortality experience.
Expenses
Total
expenses, which exclude the market impact on indexed universal life benefits (net of hedges and the related DAC amortization) and the DAC offset to net realized investment gains or losses, decreased $150 million, or 8%, to $1.8 billion for the year ended
December 31, 2017
compared to $2.0 billion for the prior year primarily due to the impact of unlocking and a decrease in auto and
67
home expenses, partially offset by higher interest credited to fixed accounts.
Interest
credited to fixed accounts increased $11 million, or 6%, to $186 million for the year ended
December 31, 2017
compared to $175 million for the prior year primarily driven by higher fixed account values associated with UL and VUL insurance.
Benefits
, claims, losses and settlement expenses decreased $116 million, or 9%, to $1.2 billion for the year ended
December 31, 2017
compared to $1.3 billion for the prior year due to the impact of unlocking and a $64 million decrease in auto and home expenses reflecting the impact of new reinsurance arrangements and a lower non-catastrophe loss ratio, partially offset by higher gross catastrophe losses. The unlocking impact
for the
year ended
December 31, 2017
was a $14 million benefit and primarily reflected favorable mortality experience on life insurance contracts. The unlocking impact for the prior year was a $40 million expense and primarily reflected low interest rates and unfavorable mortality experience.
Catastrophe losses, net of the impact of reinsurance, were $122 million for the
year ended
December 31, 2017
compared to $104 million for the prior year. The expanded reinsurance program resulted in ceded losses of approximately $104 million for the
year ended
December 31, 2017
.
Amortization of DAC decreased $42 million, or 30%, to $96 million for the year ended
December 31, 2017
compared to $138 million for the prior year primarily reflecting the impact of unlocking, as well as
benefits generated from ceding commission earned on our auto and home reinsurance program
. The unlocking impact for the year ended
December 31, 2017
was a benefit of $13 million and primarily reflected improved persistency and mortality on life insurance contracts. The unlocking impact for the prior year was an expense of $7 million.
Corporate & Other
The following table presents the results of operations of our Corporate & Other segment on an operating basis:
|
Years Ended December 31,
|
Change
|
|||||||||||||
|
2017
|
2016
|
|||||||||||||
|
(in millions)
|
||||||||||||||
|
Revenues
|
|
|
|
|
|
|
|
|
||||||
|
Net investment income
|
$
|
60
|
|
$
|
123
|
|
$
|
(63
|
)
|
(51
|
)%
|
|||
|
Premiums
|
109
|
|
110
|
|
(1
|
)
|
(1
|
)
|
||||||
|
Other revenues
|
7
|
|
5
|
|
2
|
|
40
|
|
||||||
|
Total revenues
|
176
|
|
238
|
|
(62
|
)
|
(26
|
)
|
||||||
|
Banking and deposit interest expense
|
3
|
|
1
|
|
2
|
|
NM
|
|
||||||
|
Total net revenues
|
173
|
|
237
|
|
(64
|
)
|
(27
|
)
|
||||||
|
Expenses
|
|
|
|
|
||||||||||
|
Distribution expenses
|
(11
|
)
|
(42
|
)
|
31
|
|
74
|
|
||||||
|
Benefits, claims, losses and settlement expenses
|
313
|
|
294
|
|
19
|
|
6
|
|
||||||
|
Amortization of deferred acquisition costs
|
—
|
|
63
|
|
(63
|
)
|
NM
|
|
||||||
|
Interest and debt expense
|
27
|
|
27
|
|
—
|
|
—
|
|
||||||
|
General and administrative expense
|
270
|
|
254
|
|
16
|
|
6
|
|
||||||
|
Total expenses
|
599
|
|
596
|
|
3
|
|
1
|
|
||||||
|
Operating loss
|
$
|
(426
|
)
|
$
|
(359
|
)
|
$
|
(67
|
)
|
(19
|
)%
|
|||
|
NM Not Meaningful.
|
||||||||||||||
Our Corporate & Other segment pretax operating loss excludes net realized investment gains or losses, the market impact of hedges to offset interest rate changes on unrealized gains or losses for certain investments, integration and restructuring charges, and the impact of consolidating CIEs. Our Corporate & Other segment pretax operating loss increased $67 million, or 19%, to $426 million for the year ended
December 31, 2017
compared to $359 million for the prior year primarily reflecting a decrease in net investment income, an increase in general and administrative expense and loss recognition of $57 million on LTC insurance products in 2017, partially offset by loss recognition of $31 million on LTC insurance products in the prior year and a $29 million increase in LTC reserves in the prior year from a correction related to our claim utilization factor.
Net
investment income decreased $63 million, or 51%, to $60 million for the year ended
December 31, 2017
compared to $123 million for the prior year primarily due to a $51 million impairment of our investment in affordable housing partnerships due to the enactment of the Tax Act and the impact of interest allocation between subsidiaries.
Distribution expenses increased $31 million due to a $27 million benefit in the prior year related to the write-off of the deferred reinsurance liability in connection with loss recognition on LTC insurance products.
Benefits, claims, losses and settlement expenses increased $19 million, or 6%, to $313 million for the year ended
December 31, 2017
compared to $294 million for the prior year. This is primarily due to a $57 million expense in 2017 from loss recognition and the
68
related cumulative impact of updating future policyholder benefit assumptions to reflect management’s current best estimate on LTC insurance products. The LTC loss recognition in 2017 was primarily due to unfavorable morbidity experience, partially offset by premium increases. The LTC reserves in 2016 increased by $39 million primarily due to a $29 million out-of-period correction related to our claim utilization factor for 2015 and prior years, a $5 million out-of-period correction related to our waiver of premium claim reserve from 2015 and prior years, and a $5 million impact from assumption changes for our active life reserve valuation.
Amortization of DAC decreased $63 million compared to the prior year reflecting the write-off of DAC in the third quarter of 2016 in connection with the loss recognition on LTC insurance products.
General and administrative expense increased $16 million, or 6%, to $270 million for the year ended
December 31, 2017
compared to $254 million for the prior year primarily due to higher performance-based compensation and a $9 million expense related to the renegotiation of a vendor arrangement, partially offset by a $14 million expense in the prior year from the resolution of a legacy legal matter related to the hedge fund business.
Consolidated Results of Operations
Year Ended
December 31, 2016
Compared to Year Ended
December 31, 2015
The following table presents our consolidated results of operations:
|
|
Years Ended December 31,
|
Change
|
||||||||||||
|
2016
|
2015
|
|||||||||||||
|
(in millions)
|
||||||||||||||
|
Revenues
|
||||||||||||||
|
Management and financial advice fees
|
$
|
5,778
|
|
$
|
5,950
|
|
$
|
(172
|
)
|
(3
|
)%
|
|||
|
Distribution fees
|
1,795
|
|
1,847
|
|
(52
|
)
|
(3
|
)
|
||||||
|
Net investment income
|
1,576
|
|
1,688
|
|
(112
|
)
|
(7
|
)
|
||||||
|
Premiums
|
1,491
|
|
1,455
|
|
36
|
|
2
|
|
||||||
|
Other revenues
|
1,095
|
|
1,260
|
|
(165
|
)
|
(13
|
)
|
||||||
|
Total revenues
|
11,735
|
|
12,200
|
|
(465
|
)
|
(4
|
)
|
||||||
|
Banking and deposit interest expense
|
39
|
|
30
|
|
9
|
|
30
|
|
||||||
|
Total net revenues
|
11,696
|
|
12,170
|
|
(474
|
)
|
(4
|
)
|
||||||
|
Expenses
|
|
|
|
|
|
|
|
|||||||
|
Distribution expenses
|
3,202
|
|
3,276
|
|
(74
|
)
|
(2
|
)
|
||||||
|
Interest credited to fixed accounts
|
623
|
|
668
|
|
(45
|
)
|
(7
|
)
|
||||||
|
Benefits, claims, losses and settlement expenses
|
2,646
|
|
2,261
|
|
385
|
|
17
|
|
||||||
|
Amortization of deferred acquisition costs
|
415
|
|
354
|
|
61
|
|
17
|
|
||||||
|
Interest and debt expense
|
241
|
|
387
|
|
(146
|
)
|
(38
|
)
|
||||||
|
General and administrative expense
|
2,977
|
|
3,082
|
|
(105
|
)
|
(3
|
)
|
||||||
|
Total expenses
|
10,104
|
|
10,028
|
|
76
|
|
1
|
|
||||||
|
Pretax income
|
1,592
|
|
2,142
|
|
(550
|
)
|
(26
|
)
|
||||||
|
Income tax provision
|
278
|
|
455
|
|
(177
|
)
|
(39
|
)
|
||||||
|
Net income
|
1,314
|
|
1,687
|
|
(373
|
)
|
(22
|
)
|
||||||
|
Less: Net income attributable to noncontrolling interests
|
—
|
|
125
|
|
(125
|
)
|
NM
|
|
||||||
|
Net income attributable to Ameriprise Financial
|
$
|
1,314
|
|
$
|
1,562
|
|
$
|
(248
|
)
|
(16
|
)%
|
|||
|
NM Not Meaningful.
|
||||||||||||||
Overall
Pretax income decreased $550 million, or 26%, to $1.6 billion for the year ended December 31, 2016 compared to $2.1 billion for the prior year primarily due to the impact of unlocking, asset management net outflows and a $127 million decrease in net income (loss) from CIEs, partially offset by the market impact on indexed universal life benefits (net of hedges and the related DAC amortization, unearned revenue amortization and the reinsurance accrual), a $24 million favorable change in the market impact of hedges on investments, and the impact on DAC, DSIC and reserves for insurance features in non-traditional long-duration contracts from actual versus expected market performance based on our view of bond and equity performance.
Net income (loss) from CIEs for the year ended December 31, 2016 was a loss of $2 million compared to income of $125 million for the prior year primarily reflecting the deconsolidation of CIEs effective January 1, 2016. Results for the year ended December
69
31, 2016 included $46 million of management fees we earned for services provided to deconsolidated CIEs. These fees were eliminated on a consolidated basis in the prior year.
The market impact on indexed universal life benefits (net of hedges and the related DAC amortization, unearned revenue amortization and the reinsurance accrual) was a benefit of $36 million for the year ended December 31, 2016 compared to an expense of $1 million for the prior year.
The impact on DAC, DSIC and reserves for insurance features in non-traditional long-duration contracts from actual versus expected market performance based on our view of bond and equity performance was a benefit of $18 million ($6 million for DAC, $2 million for DSIC and $10 million for insurance features in non-traditional long duration contracts) for the year ended December 31, 2016 reflecting favorable bond fund returns compared to a net expense of $12 million ($15 million for DAC, $4 million for DSIC and a $7 million benefit for insurance features in non-traditional long duration contracts) for the prior year reflecting unfavorable equity market and bond fund returns.
The following table presents the total pretax impacts on our revenues and expenses attributable to unlocking for the years ended December 31:
|
Pretax Increase (Decrease)
|
2016
|
2015
|
||||||
|
(in millions)
|
||||||||
|
Premiums
|
$
|
—
|
|
$
|
(3
|
)
|
||
|
Other revenues
|
64
|
|
8
|
|
||||
|
Total revenues
|
64
|
|
5
|
|
||||
|
Distribution expenses
|
(27
|
)
|
—
|
|
||||
|
Benefits, claims, losses and settlement expenses
|
229
|
|
(58
|
)
|
||||
|
Amortization of DAC
|
81
|
|
15
|
|
||||
|
Total expenses
|
283
|
|
(43
|
)
|
||||
|
Total
(1)
|
$
|
(219
|
)
|
$
|
48
|
|
||
|
(1)
Includes a $16 million and $6 million net benefit related to the market impact on variable annuity guaranteed benefits and indexed universal life benefits for the years ended December 31, 2016 and 2015, respectively.
|
||||||||
Net Revenues
Net
revenues decreased $474 million, or 4%, to $11.7 billion for the year ended December 31, 2016 compared to $12.2 billion for the prior year due to decreases in management and financial advice fees, distribution fees, net investment income and other revenues. Net revenues for the year ended December 31, 2016 included $128 million of CIE revenues compared to $446 million for the prior year primarily reflecting the CIE deconsolidation.
Management
and financial advice fees decreased $172 million, or 3%, to $5.8 billion for the year ended December 31, 2016 compared to $6.0 billion for the prior year primarily due to lower asset-based fees driven by a decrease in average AUM and a $44 million decrease in performance fees. Average AUM decreased $28.3 billion, or 4%, compared to the prior year due to asset management net outflows and the negative impact of foreign currency translation, partially offset by wrap account net inflows. See our discussion on the changes in AUM in our segment results of operations section. Management and financial advice fees for the year ended December 31, 2016 included $46 million of fees we earned for services provided to CLOs and property funds that were deconsolidated effective January 1, 2016. These fees were eliminated on a consolidated basis in the prior year.
Distribution
fees decreased $52 million, or 3%, to $1.8 billion for the year ended December 31, 2016 compared to the prior year primarily due to lower transactional volume, partially offset by higher brokerage cash spread due to an increase in short-term interest rates.
Net investment income decreased $112 million, or 7%, to $1.6 billion for the year ended December 31, 2016 compared to $1.7 billion for the prior year primarily due to a $76 million decrease in CIE net investment income, a $35 million decrease in investment income on fixed maturities driven by low interest rates and a $26 million increase in losses related to investments in affordable housing partnerships, partially offset by a $24 million favorable change in the market impact of hedges on investments. Net investment income for the year ended December 31, 2016 included $155 million of CIE net investment income compared to $231 million for the prior year primarily reflecting the CIE deconsolidation.
Other
revenues decreased $165 million, or 13%, to $1.1 billion for the year ended December 31, 2016 compared to $1.3 billion for the prior year due to a $290 million decrease in CIE other revenues reflecting the CIE deconsolidation, partially offset by the impact of unlocking, the unearned revenue amortization and the reinsurance accrual offset to the market impact on indexed universal life benefits and higher fees from variable annuity guarantee sales in the prior year where the fees start on the first anniversary date and higher average fee rates on variable annuity guarantees. The unearned revenue amortization and the reinsurance accrual offset to the market impact on indexed universal life benefits was a positive $24 million for the year ended December 31, 2016 compared to a positive $7 million for the prior year. Other revenues for the year ended December 31, 2016 included a $64 million favorable impact
70
from unlocking compared to an $8 million favorable impact in the prior year. The primary driver of the unlocking impact to other revenues for the year ended December 31, 2016 was a positive impact from higher projected gains on reinsurance contracts resulting from unfavorable mortality experience. The primary driver of the unlocking impact to other revenues for the prior year was a positive impact from model updates related to our indexed universal life product, partially offset by a negative impact from lower projected gains on reinsurance contracts resulting from favorable mortality experience.
Expenses
Total
expenses increased $76 million, or 1%, to $10.1 billion for the year ended December 31, 2016 compared to $10.0 billion for the prior year primarily due to the impact of unlocking, partially offset by lower distribution expenses and the CIE deconsolidation. Expenses for the year ended December 31, 2016 included $130 million of CIE expenses compared to $321 million for the prior year primarily reflecting the CIE deconsolidation.
Distribution expenses decreased $74 million, or 2%, to $3.2 billion for the year ended December 31, 2016 compared to $3.3 billion for the prior year driven by lower advisor compensation due to lower transactional volume, as well as a $27 million benefit related to the release of the deferred reinsurance liability in connection with loss recognition testing of LTC insurance products in the third quarter of 2016.
Interest
credited to fixed accounts decreased $45 million, or 7%, to $623 million for the year ended December 31, 2016 compared to $668 million for the prior year primarily due to lower average fixed annuity account balances and the market impact on indexed universal life benefits, net of hedges, partially offset by higher average variable annuities fixed sub-account balances. The market impact on indexed universal life benefits, net of hedges was a benefit of $30 million for the year ended December 31, 2016 compared to an expense of $4 million for the prior year. Average fixed annuity account balances decreased $976 million, or 9%, to $10.3 billion for the year ended December 31, 2016 compared to the prior year as older policies continue to lapse and new sales are limited due to low interest rates. Average variable annuities fixed sub-account balances increased $179 million, or 4%, to $5.1 billion for the year ended December 31, 2016 compared to the prior year.
Benefits, claims, losses and settlement expenses increased $385 million, or 17%, to $2.6 billion for the year ended December 31, 2016 compared to $2.3 billion for the prior year primarily reflecting the following items:
|
•
|
The
year ended December 31, 2016
included a $229 million expense from unlocking compared to a $58 million benefit in the prior year. The unlocking impact for the
year ended December 31, 2016
primarily reflected continued low interest rates and an unfavorable impact from persistency on living benefit reserves, partially offset by a benefit from updates to withdrawal utilization and fee assumptions, as well as market-related inputs related to our living benefit valuation. The unlocking impact for the prior year primarily reflected
an update to market-related inputs related to our living benefit valuation
and a benefit from model changes that more than offset the difference between our previously assumed interest rates versus the low interest rate environment.
|
|
•
|
A $39 million increase in LTC reserves in 2016, which included a $29 million out-of-period correction related to our claim utilization factor, a $5 million out-of-period correction related to our waiver of premium claim reserve and a $5 million impact from assumption changes for our active life reserve valuation as a result of loss recognition.
|
|
•
|
A $28 million favorable impact in the prior year from updating future experience assumptions related to life rider benefits.
|
|
•
|
A $24 million increase in expense related to higher reserve funding driven by the impact of higher fees from variable annuity guarantee sales in the prior year where the fees start on the first anniversary date.
|
|
•
|
A $40 million decrease in b
enefits
, claims, losses and settlement expenses
related to our auto and home business due to improved current year loss performance and
a $20 million decrease in reserves in 2016 due to
favorable prior year reserve development compared to a
$57 million increase in reserves in 2015 due to unfavorable prior year reserve development,
partially offset by an increase in catastrophe losses compared to the prior year and a $26 million increase in additional losses. Catastrophe losses were
$104
million for the
year ended December 31, 2016 compared to $72
million for the prior year.
|
Amortization of DAC increased $61 million, or 17%, to $415 million for the year ended December 31, 2016 compared to $354 million for the prior year primarily reflecting the following items:
|
•
|
The impact of unlocking was an expense of $81 million for the year ended December 31, 2016 compared to an expense of $15 million for the prior year.
The unlocking impact for the
year ended December 31, 2016
primarily reflected
continued low interest rates that more than offset benefits from persistency on annuity contracts without living benefits. In connection with the loss recognition on LTC insurance products in the third quarter of 2016, we impaired $58 million of DAC due to continued low interest rates, higher morbidity and higher reinsurance expenses, slightly offset by premium increases.
|
|
•
|
The DAC offset to the market impact on
indexed universal life benefits (net of hedges, unearned revenue amortization and the reinsurance accrual)
was an expense of $18 million for
the
year ended December 31, 2016
compared to an expense of $4 million for the prior year.
|
|
•
|
The impact on DAC from actual versus expected market performance based on our view of bond and equity performance was a benefit of $6 million for
the
year ended December 31, 2016
compared to an expense of $15 million for the prior year reflecting favorable bond fund returns in 2016 compared to unfavorable equity market and bond fund returns in the prior year.
|
71
Interest
and debt expense decreased $146 million, or 38%, to $241 million for the year ended December 31, 2016 compared to $387 million for the prior year primarily due to a $135 million decrease in CIE interest and debt expense reflecting the CIE deconsolidation.
General and administrative expenses decreased $105 million, or 3%, to $3.0 billion for the year ended December 31, 2016 compared to $3.1 billion for the prior year primarily due to a $56 million decrease in CIE expenses reflecting the CIE deconsolidation, a $10 million decrease in compensation related to lower performance fees, a benefit from the impact of foreign exchange, lower performance-based compensation, lower investment spending and a decrease in expenses related to technology, service delivery and advertising, partially offset by $30 million of incremental expense related to the planning and implementation of the new Department of Labor fiduciary standard, an increase in staff and investments in our auto and home business and $23 million of expense in the second quarter of 2016 from the resolution of a legacy legal matter related to the hedge fund business.
Income Taxes
Our effective tax rate was 17.4% for the year ended December 31, 2016 compared to 21.3% for the prior year. The effective tax rate for the year ended December 31, 2016 was lower than the statutory rate as a result of tax preferred items including the dividends received deduction, low income housing tax credits, lower taxes on net income from foreign subsidiaries and a $27 million benefit related to final resolution on the 1997 through 2005 Internal Revenue Service (“IRS”) audit. The decrease in the effective tax rate for the year ended December 31, 2016 compared to the prior year was primarily due to lower pretax income in relation to tax preferred items.
Results of Operations by Segment
Year Ended
December 31, 2016
Compared to Year Ended
December 31, 2015
The following table presents summary financial information by segment:
|
|
Years Ended December 31,
|
||||||
|
2016
|
2015
|
||||||
|
(in millions)
|
|||||||
|
Advice & Wealth Management
|
|
|
|
|
|||
|
Net revenues
|
$
|
5,036
|
|
$
|
5,013
|
|
|
|
Expenses
|
4,125
|
|
4,154
|
|
|||
|
Operating earnings
|
$
|
911
|
|
$
|
859
|
|
|
|
Asset Management
|
|||||||
|
Net revenues
|
$
|
2,964
|
|
$
|
3,254
|
|
|
|
Expenses
|
2,343
|
|
2,493
|
|
|||
|
Operating earnings
|
$
|
621
|
|
$
|
761
|
|
|
|
Annuities
|
|||||||
|
Net revenues
|
$
|
2,463
|
|
$
|
2,541
|
|
|
|
Expenses
|
2,134
|
|
1,891
|
|
|||
|
Operating earnings
|
$
|
329
|
|
$
|
650
|
|
|
|
Protection
|
|||||||
|
Net revenues
|
$
|
2,241
|
|
$
|
2,131
|
|
|
|
Expenses
|
1,978
|
|
1,933
|
|
|||
|
Operating earnings
|
$
|
263
|
|
$
|
198
|
|
|
|
Corporate & Other
|
|||||||
|
Net revenues
|
$
|
237
|
|
$
|
256
|
|
|
|
Expenses
|
596
|
|
470
|
|
|||
|
Operating loss
|
$
|
(359
|
)
|
$
|
(214
|
)
|
|
72
The following table presents the segment pretax operating impacts on our revenues and expenses attributable to unlocking:
|
Segment Pretax Operating Increase (Decrease)
|
Years Ended December 31,
|
|||||||||||||||||||||||
|
2016
|
2015
|
|||||||||||||||||||||||
|
Annuities
|
Protection
|
Corporate
|
Annuities
|
Protection
|
Corporate
|
|||||||||||||||||||
|
(in millions)
|
||||||||||||||||||||||||
|
Premiums
|
$
|
—
|
|
$
|
—
|
|
$
|
—
|
|
$
|
—
|
|
$
|
(3
|
)
|
$
|
—
|
|
||||||
|
Other revenues
|
—
|
|
64
|
|
—
|
|
—
|
|
(5
|
)
|
—
|
|
||||||||||||
|
Total revenues
|
—
|
|
64
|
|
—
|
|
—
|
|
(8
|
)
|
—
|
|
||||||||||||
|
Distribution expenses
|
—
|
|
—
|
|
(27
|
)
|
—
|
|
—
|
|
—
|
|
||||||||||||
|
Benefits, claims, losses and settlement expenses
|
197
|
|
40
|
|
6
|
|
(61
|
)
|
6
|
|
—
|
|
||||||||||||
|
Amortization of DAC
|
18
|
|
7
|
|
58
|
|
(5
|
)
|
10
|
|
—
|
|
||||||||||||
|
Total expenses
|
215
|
|
47
|
|
37
|
|
(66
|
)
|
16
|
|
—
|
|
||||||||||||
|
Total
|
$
|
(215
|
)
|
$
|
17
|
|
$
|
(37
|
)
|
$
|
66
|
|
$
|
(24
|
)
|
$
|
—
|
|
||||||
Advice & Wealth Management
The following table presents the changes in wrap account assets and average balances for the years ended December 31:
|
2016
|
2015
|
||||||
|
(in billions)
|
|||||||
|
Beginning balance
|
$
|
180.5
|
|
$
|
174.7
|
|
|
|
Net flows
|
10.2
|
|
11.1
|
|
|||
|
Market appreciation (depreciation) and other
|
10.4
|
|
(5.3
|
)
|
|||
|
Ending balance
|
$
|
201.1
|
|
$
|
180.5
|
|
|
|
Advisory wrap account assets ending balance
(1)
|
$
|
198.9
|
|
$
|
178.9
|
|
|
|
Average advisory wrap account assets
(2)
|
$
|
187.3
|
|
$
|
178.5
|
|
|
|
(1)
|
Advisory wrap account assets represent those assets for which clients receive advisory services and are the primary driver of revenue earned on wrap accounts. Clients may hold non-advisory investments in their wrap accounts that do not incur an advisory fee.
|
|
(2)
|
Average ending balances are calculated using an average of the prior period’s ending balance and all months in the current period.
|
Wrap account assets increased $20.6 billion, or 11%, during the year ended
December 31, 2016
due to net inflows of $10.2 billion and market appreciation and other of $10.4 billion. Average advisory wrap account assets increased $8.8 billion, or 5%, compared to the prior year primarily due to net inflows.
73
The following table presents the results of operations of our Advice & Wealth Management segment on an operating basis:
|
Years Ended December 31,
|
Change
|
|||||||||||||
|
2016
|
2015
|
|||||||||||||
|
(in millions)
|
||||||||||||||
|
Revenues
|
||||||||||||||
|
Management and financial advice fees
|
$
|
2,707
|
|
$
|
2,629
|
|
$
|
78
|
|
3
|
%
|
|||
|
Distribution fees
|
2,109
|
|
2,195
|
|
(86
|
)
|
(4
|
)
|
||||||
|
Net investment income
|
186
|
|
146
|
|
40
|
|
27
|
|
||||||
|
Other revenues
|
73
|
|
73
|
|
—
|
|
—
|
|
||||||
|
Total revenues
|
5,075
|
|
5,043
|
|
32
|
|
1
|
|
||||||
|
Banking and deposit interest expense
|
39
|
|
30
|
|
9
|
|
30
|
|
||||||
|
Total net revenues
|
5,036
|
|
5,013
|
|
23
|
|
—
|
|
||||||
|
Expenses
|
|
|
|
|
|
|
|
|
||||||
|
Distribution expenses
|
3,072
|
|
3,081
|
|
(9
|
)
|
—
|
|
||||||
|
Interest and debt expense
|
8
|
|
8
|
|
—
|
|
—
|
|
||||||
|
General and administrative expense
|
1,045
|
|
1,065
|
|
(20
|
)
|
(2
|
)
|
||||||
|
Total expenses
|
4,125
|
|
4,154
|
|
(29
|
)
|
(1
|
)
|
||||||
|
Operating earnings
|
$
|
911
|
|
$
|
859
|
|
$
|
52
|
|
6
|
%
|
|||
Our Advice & Wealth Management segment pretax operating earnings, which exclude net realized investment gains or losses, increased $52 million, or 6%, to $911 million for the year ended December 31, 2016 compared to $859 million for the prior year reflecting growth in wrap account assets and higher earnings on brokerage cash and short-term investments, partially offset by lower transactional volume. Pretax operating margin was 18.1% for the year ended December 31, 2016 compared to 17.1% for the prior year.
Net Revenues
Net revenues exclude net realized investment gains or losses. Net revenues increased $23 million to $5.0 billion for the year ended December 31, 2016 compared to the prior year due to higher management and financial advice fees and net investment income, partially offset by lower distribution fees. Operating net revenue per branded advisor increased to $518,000 for the year ended December 31, 2016, up 1%, from $514,000 for the prior year reflecting asset growth, offset by lower transactional volume.
Management and financial advice fees increased $78 million, or 3%, to $2.7 billion for the
year ended December 31, 2016
compared to
$2.6 billion for
the prior year due to growth in wrap account assets.
Average advisory wrap account assets increased $8.8 billion, or 5%, compared to the prior year primarily due to net inflows.
Distribution fees decreased $86 million, or 4%, to $2.1 billion for the year ended December 31, 2016 compared to $2.2 billion for the prior year primarily due to lower transactional volume, partially offset by higher brokerage cash spread due to an increase in short-term interest rates.
Net investment income increased $40 million, or 27%, to $186 million for the year ended December 31, 2016 compared to $146 million for the prior year primarily due to an increase in invested balances driven by certificate net inflows and higher investment yields.
Expenses
Total expenses decreased $29 million, or 1%, to $4.1 billion for the year ended December 31, 2016 compared to $4.2 billion for the prior year due to
a $9
million decrease in distribution expenses from lower advisor compensation and a $20 million decrease in general and administrative expense primarily due to lower expenses related to technology, service delivery and advertising.
74
Asset Management
The following table presents managed assets by type:
|
December 31,
|
Change
|
Average
(1)
|
Change
|
||||||||||||||||||||||||||
|
December 31,
|
|||||||||||||||||||||||||||||
|
2016
|
2015
|
2016
|
2015
|
||||||||||||||||||||||||||
|
(in billions)
|
|||||||||||||||||||||||||||||
|
Equity
|
$
|
240.0
|
|
$
|
255.5
|
|
$
|
(15.5
|
)
|
(6
|
)%
|
$
|
242.7
|
|
$
|
271.5
|
|
$
|
(28.8
|
)
|
(11
|
)%
|
|||||||
|
Fixed income
|
175.9
|
|
176.6
|
|
(0.7
|
)
|
—
|
|
179.0
|
|
188.1
|
|
(9.1
|
)
|
(5
|
)
|
|||||||||||||
|
Money market
|
6.3
|
|
7.5
|
|
(1.2
|
)
|
(16
|
)
|
7.1
|
|
6.8
|
|
0.3
|
|
4
|
|
|||||||||||||
|
Alternative
|
7.4
|
|
8.2
|
|
(0.8
|
)
|
(10
|
)
|
7.5
|
|
7.9
|
|
(0.4
|
)
|
(5
|
)
|
|||||||||||||
|
Hybrid and other
|
24.8
|
|
24.1
|
|
0.7
|
|
3
|
|
24.5
|
|
22.2
|
|
2.3
|
|
10
|
|
|||||||||||||
|
Total managed assets
|
$
|
454.4
|
|
$
|
471.9
|
|
$
|
(17.5
|
)
|
(4
|
)%
|
$
|
460.8
|
|
$
|
496.5
|
|
$
|
(35.7
|
)
|
(7
|
)%
|
|||||||
|
(1)
Average ending balances are calculated using an average of the prior period’s ending balance and all months in the current period.
|
|||||||||||||||||||||||||||||
The following tables present the changes in global managed assets:
|
Years Ended December 31,
|
|||||||
|
2016
|
2015
|
||||||
|
(in billions)
|
|||||||
|
Global Retail Funds
|
|
|
|
|
|||
|
Beginning assets
|
$
|
263.9
|
|
$
|
281.5
|
|
|
|
Inflows
|
52.2
|
|
54.2
|
|
|||
|
Acquisition related inflows
(1)
|
1.0
|
|
—
|
|
|||
|
Outflows
|
(63.5
|
)
|
(67.4
|
)
|
|||
|
Net VP/VIT fund flows
|
(2.0
|
)
|
(0.7
|
)
|
|||
|
Net new flows
|
(12.3
|
)
|
(13.9
|
)
|
|||
|
Reinvested dividends
|
8.1
|
|
13.4
|
|
|||
|
Net flows
|
(4.2
|
)
|
(0.5
|
)
|
|||
|
Distributions
|
(9.9
|
)
|
(16.4
|
)
|
|||
|
Market appreciation and other
(2)(4)
|
15.2
|
|
1.3
|
|
|||
|
Foreign currency translation
(3)(4)
|
(5.1
|
)
|
(2.0
|
)
|
|||
|
Total ending assets
|
259.9
|
|
263.9
|
|
|||
|
Global Institutional
|
|
|
|
|
|||
|
Beginning assets
|
208.0
|
|
224.1
|
|
|||
|
Inflows
|
24.1
|
|
27.3
|
|
|||
|
Outflows
|
(38.5
|
)
|
(42.6
|
)
|
|||
|
Net flows
|
(14.4
|
)
|
(15.3
|
)
|
|||
|
Market appreciation and other
(4)(5)(6)
|
13.5
|
|
3.7
|
|
|||
|
Foreign currency translation
(3)(4)
|
(12.6
|
)
|
(4.5
|
)
|
|||
|
Total ending assets
|
194.5
|
|
208.0
|
|
|||
|
Total managed assets
|
$
|
454.4
|
|
$
|
471.9
|
|
|
|
Total net flows
|
$
|
(18.6
|
)
|
$
|
(15.8
|
)
|
|
|
Former Parent Company Related
(7)(8)
|
|||||||
|
Retail net new flows
|
$
|
(1.3
|
)
|
$
|
(2.3
|
)
|
|
|
Institutional net new flows
|
(8.9
|
)
|
(12.7
|
)
|
|||
|
Total net new flows
|
$
|
(10.2
|
)
|
$
|
(15.0
|
)
|
|
(1)
Inflows associated with acquisitions that closed during the period.
75
(2)
Included in Market appreciation and other for retail funds in 2015 are $(0.5) billion related to the sale of the Multi-Manager business.
(3)
Amounts represent local currency to US dollar translation for reporting purposes.
(4)
Prior to the third quarter of 2016, the Foreign currency translation line represented British Pound to US dollar conversion, while the impact of translating assets from a local currency to British Pounds was included in Market appreciation (depreciation) and other. Beginning with the third quarter of 2016, the impact of translating assets from a local currency to British Pounds has been reclassified to the Foreign currency translation line. All prior periods have been restated.
(5)
Included in Market appreciation and other for Global Institutional in 2016 and 2015 are $(0.4) billion and $(0.1) billion, respectively, due to the transfer of assets from Separately Managed Accounts to Unified Managed Accounts.
(6)
Includes $1.7 billion and $(1.6) billion for the total change in Affiliated General Account Assets during the years ended December 31, 2016 and 2015, respectively.
(7)
Former parent company related assets and net new flows are included in the rollforwards above.
(8)
Prior period former parent company related net new flows were restated to include additional Former Parent Company net new flows that were previously not considered. The change was a decrease of $296 million and $215 million for the years ended December 31, 2016 and 2015, respectively.
Total segment AUM decreased $17.5 billion, or 4%, during the year ended December 31, 2016 driven by net outflows, a negative impact of foreign currency translation and retail fund distributions, partially offset by market appreciation and other. Total segment AUM net outflows were $18.6 billion for the year ended December 31, 2016, which included $10.2 billion of outflows of former parent-related assets.
Global retail funds decreased $4.0 billion, or 2%, during the year ended December 31, 2016 due to net outflows, distributions and a negative impact of foreign currency translation, partially offset by market appreciation and other. Global retail net outflows of $4.2 billion during the year ended December 31, 2016 included $2.5 billion of outflows from the Columbia
Acorn
®
Fund, $1.3 billion of outflows from former parent-related assets, $2.0 billion of outflows of our variable product funds underlying insurance and annuity separate accounts and UK and European net outflows of $1.7 billion, partially offset by reinvested dividends of $8.1 billion and inflows of $1.0 billion related to the EGA acquisition.
Global institutional AUM decreased $13.5 billion, or 6%, during the year ended December 31, 2016 due to net outflows of $14.4 billion and a $12.6 billion negative impact of foreign currency translation, partially offset by market appreciation and other. Global institutional net outflows included $0.7 billion from the termination of a former subadvisor and $8.9 billion of outflows of former parent-related assets.
The following table presents the results of operations of our Asset Management segment on an operating basis:
|
Years Ended December 31,
|
Change
|
|||||||||||||
|
2016
|
2015
|
|||||||||||||
|
(in millions)
|
||||||||||||||
|
Revenues
|
|
|
|
|
|
|
|
|
||||||
|
Management and financial advice fees
|
$
|
2,452
|
|
$
|
2,723
|
|
$
|
(271
|
)
|
(10
|
)%
|
|||
|
Distribution fees
|
487
|
|
499
|
|
(12
|
)
|
(2
|
)
|
||||||
|
Net investment income
|
14
|
|
23
|
|
(9
|
)
|
(39
|
)
|
||||||
|
Other revenues
|
11
|
|
9
|
|
2
|
|
22
|
|
||||||
|
Total revenues
|
2,964
|
|
3,254
|
|
(290
|
)
|
(9
|
)
|
||||||
|
Banking and deposit interest expense
|
—
|
|
—
|
|
—
|
|
—
|
|
||||||
|
Total net revenues
|
2,964
|
|
3,254
|
|
(290
|
)
|
(9
|
)
|
||||||
|
Expenses
|
|
|
|
|
|
|
|
|
||||||
|
Distribution expenses
|
1,019
|
|
1,091
|
|
(72
|
)
|
(7
|
)
|
||||||
|
Amortization of deferred acquisition costs
|
18
|
|
17
|
|
1
|
|
6
|
|
||||||
|
Interest and debt expense
|
21
|
|
25
|
|
(4
|
)
|
(16
|
)
|
||||||
|
General and administrative expense
|
1,285
|
|
1,360
|
|
(75
|
)
|
(6
|
)
|
||||||
|
Total expenses
|
2,343
|
|
2,493
|
|
(150
|
)
|
(6
|
)
|
||||||
|
Operating earnings
|
$
|
621
|
|
$
|
761
|
|
$
|
(140
|
)
|
(18
|
)%
|
|||
Our Asset Management segment pretax operating earnings, which exclude net realized investment gains or losses, decreased $140 million, or 18%, to $621 million for the year ended December 31, 2016 compared to $761 million for the prior year primarily due to net outflows, a $34 million decrease in performance fees, net of related compensation, a $12 million negative impact of foreign exchange and a $9 million expense from the resolution of a legacy legal matter related to the hedge fund business, partially offset by continued expense management.
76
Net Revenues
Net revenues, which exclude net realized investment gains or losses, decreased $290 million, or 9%, to $3.0 billion for the year ended December 31, 2016 compared to $3.3 billion for the prior year primarily due to lower management and financial advice fees.
Management and financial advice fees decreased $271 million, or 10%, to $2.5 billion for the year ended December 31, 2016 compared to $2.7 billion for the prior year as average AUM decreased $35.7 billion, or 7%, compared to the prior year. The decrease in fees is driven by cumulative net outflows from our higher fee yielding retail funds, a negative foreign currency translation impact related to our UK and European AUM and a $44 million decrease in performance fees. Our average weighted equity index, which is a proxy for equity movements on AUM, decreased 1% for the year ended December 31, 2016 compared to the prior year.
Expenses
Total expenses decreased $150 million, or 6%, to $2.3 billion for the year ended December 31, 2016 compared to $2.5 billion for the prior year due to a $72 million decrease in distribution expenses from lower retail fund assets and a decrease in general and administrative expense.
General and administrative expense decreased $75 million, or 6%, to $1.3 billion for the year ended December 31, 2016 compared to $1.4 billion for the prior year primarily due to a $10 million decrease in compensation related to lower performance fees, a benefit from the impact of foreign exchange, lower performance-based compensation and lower investment spending, partially offset by a $9 million expense from the resolution of a legacy legal matter related to the hedge fund business.
Annuities
The following table presents the results of operations of our Annuities segment on an operating basis:
|
Years Ended December 31,
|
Change
|
|||||||||||||
|
2016
|
2015
|
|||||||||||||
|
(in millions)
|
||||||||||||||
|
Revenues
|
|
|
|
|
|
|
|
|
||||||
|
Management and financial advice fees
|
$
|
732
|
|
$
|
755
|
|
$
|
(23
|
)
|
(3
|
)%
|
|||
|
Distribution fees
|
349
|
|
364
|
|
(15
|
)
|
(4
|
)
|
||||||
|
Net investment income
|
760
|
|
848
|
|
(88
|
)
|
(10
|
)
|
||||||
|
Premiums
|
116
|
|
107
|
|
9
|
|
8
|
|
||||||
|
Other revenues
|
506
|
|
467
|
|
39
|
|
8
|
|
||||||
|
Total revenues
|
2,463
|
|
2,541
|
|
(78
|
)
|
(3
|
)
|
||||||
|
Banking and deposit interest expense
|
—
|
|
—
|
|
—
|
|
—
|
|
||||||
|
Total net revenues
|
2,463
|
|
2,541
|
|
(78
|
)
|
(3
|
)
|
||||||
|
Expenses
|
|
|
|
|
|
|
|
|
||||||
|
Distribution expenses
|
423
|
|
446
|
|
(23
|
)
|
(5
|
)
|
||||||
|
Interest credited to fixed accounts
|
478
|
|
500
|
|
(22
|
)
|
(4
|
)
|
||||||
|
Benefits, claims, losses and settlement expenses
|
780
|
|
482
|
|
298
|
|
62
|
|
||||||
|
Amortization of deferred acquisition costs
|
209
|
|
205
|
|
4
|
|
2
|
|
||||||
|
Interest and debt expense
|
33
|
|
38
|
|
(5
|
)
|
(13
|
)
|
||||||
|
General and administrative expense
|
211
|
|
220
|
|
(9
|
)
|
(4
|
)
|
||||||
|
Total expenses
|
2,134
|
|
1,891
|
|
243
|
|
13
|
|
||||||
|
Operating earnings
|
$
|
329
|
|
$
|
650
|
|
$
|
(321
|
)
|
(49
|
)%
|
|||
Our Annuities segment pretax operating income, which excludes net realized investment gains or losses (net of the related DSIC and DAC amortization) and the market impact on variable annuity guaranteed benefits (net of hedges and the related DSIC and DAC amortization), decreased $321 million, or 49%, to $329 million for the year ended December 31, 2016 compared to $650 million for the prior year primarily due to the impact of unlocking,
lower investment yields and the negative impact from fixed annuity net outflows, partially offset by
the impact on DAC, DSIC and reserves for insurance features in non-traditional long-duration contracts from actual versus expected market performance based on our view of bond and equity performance, as well as
higher fees from
variable annuity guarantee sales, net of related expenses for reserve funding.
The impact on DAC, DSIC and reserves for insurance features in non-traditional long-duration contracts from actual versus expected market performance based on our view of bond and equity performance was a benefit of $18 million ($6 million for DAC, $2 million for DSIC and $10 million for insurance features in non-traditional long duration contracts) for the year ended December 31, 2016 reflecting favorable bond fund returns compared to a net expense of $11 million ($14 million for DAC,
77
$4 million for DSIC and a $7 million benefit for insurance features in non-traditional long duration contracts) for the prior year reflecting unfavorable equity market and bond fund returns.
RiverSource
variable annuity account balances increased 1% to $74.8 billion at December 31, 2016 compared to the prior year due to equity market appreciation, partially offset by net outflows of $2.2 billion.
RiverSource
fixed annuity account balances declined 6% to $10.0 billion at December 31, 2016 compared to the prior year as older policies continued to lapse and new sales were limited due to low interest rates.
Net Revenues
Net revenues, which exclude net realized investment gains or losses, decreased $78 million, or 3%, to $2.5 billion for the year ended December 31, 2016 compared to the prior year primarily due to lower management and financial advice fees, distribution fees and net investment income, partially offset by higher other revenues.
Management and financial advice fees decreased $23 million, or 3%, to $732 million for the year ended December 31, 2016 compared to $755 million for the prior year due to lower fees on variable annuities driven by lower average separate account balances. Average variable annuity separate account balances decreased $2.6 billion, or 4%, from the prior year primarily due to net outflows.
Net investment income, which excludes net realized investment gains or losses, decreased $88 million, or 10%, to $760 million for the year ended December 31, 2016 compared to $848 million for the prior year reflecting a decrease of approximately $49 million from lower invested assets primarily due to fixed annuity net outflows and approximately $39 million from lower interest rates.
Other revenues increased $39 million, or 8%, to $506 million for the year ended December 31, 2016 compared to $467 million for the prior year due to higher fees from variable annuity guarantee sales in the prior year where the fees start on the first anniversary date and higher average fee rates
on variable annuity guarantees
.
Expenses
Total expenses, which exclude the market impact on variable annuity guaranteed benefits (net of hedges and the related DSIC and DAC amortization) and the DAC and DSIC offset to net realized investment gains or losses, increased $243 million, or 13%, to $2.1 billion for the year ended December 31, 2016 compared to $1.9 billion for the prior year primarily due to the impact of unlocking.
Distribution expenses decreased $23 million, or 5%, to $423 million for the year ended December 31, 2016 compared to $446 million for the prior year due to lower variable annuity compensation driven by lower sales and lower average separate account balances.
Interest credited to fixed accounts decreased $22 million, or 4%, to $478 million for the year ended December 31, 2016 compared to $500 million for the prior year driven by lower average fixed annuity account balances, partially offset by higher average variable annuities fixed sub-account balances. Average fixed annuity account balances decreased $976 million, or 9%, to $10.3 billion for the year ended December 31, 2016 compared to the prior year as older policies continued to lapse and new sales were limited due to low interest rates. Average variable annuities fixed sub-account balances increased $179 million, or 4%, to $5.1 billion for the year ended December 31, 2016 compared to the prior year.
Benefits, claims, losses and settlement expenses
, which exclude the market impact on variable annuity guaranteed benefits (net of hedges and the related DSIC amortization) and the DSIC offset to net realized investment gains or losses, increased $298 million, or 62%, to $780 million
for the
year ended December 31, 2016
compared to $482
million for the prior year primarily reflecting the following items:
|
•
|
Benefits, claims, losses and settlement expenses for the
year ended December 31, 2016
included a $197 million expense from unlocking primarily reflecting continued low interest rates and an unfavorable impact from persistency on living benefit reserves, partially offset by a benefit from updates to withdrawal utilization and fee assumptions, as well as market-related inputs related to our living benefit valuation. Benefits, claims, losses and settlement expenses for the prior year included a $61 million benefit from unlocking primarily reflecting
an update to market-related inputs related to our living benefit valuation
and a benefit from model changes that more than offset the difference between our previously assumed interest rates versus the low interest rate environment.
|
|
•
|
A $24 million increase in expense related to higher reserve funding driven by the impact of higher fees from variable annuity guarantee sales in the prior year where the fees start on the first anniversary date.
|
|
•
|
A $9 million negative impact in the fourth quarter of 2016 from changes in assumptions in the third quarter unlocking process that result in ongoing increases to living benefit reserves.
|
Amortization of DAC, which excludes the DAC offset to the market impact on variable annuity guaranteed benefits and the DAC offset to net realized investment gains or losses, increased $4 million, or 2%, to $209 million
for the
year ended December 31, 2016 compared to $205 million for the prior year primarily due to the impact of unlocking, partially offset by the impact on DAC from actual versus expected market performance based on our view of bond and equity performance, which was a benefit of $6 million for the year ended December 31, 2016 compared to an expense of $14 million for the prior year reflecting favorable bond fund returns in 2016 compared to unfavorable equity market and bond fund returns in the prior year. Amortization of DAC for the year ended December 31, 2016 included an $18 million expense from unlocking reflecting continued low interest rates, partially offset by benefits
78
from persistency on annuity contracts without living benefits. Our long-term interest rate assumption remained unchanged, but we extended the period it would take for rates to reach our long term level from 3.5 years to 5.5 years. Amortization of DAC for the prior year included a $5 million benefit from unlocking primarily driven by improved persistency that more than offset the difference between our previously assumed interest rates versus the low interest rate environment.
Protection
The following table presents the results of operations of our Protection segment on an operating basis:
|
Years Ended December 31,
|
Change
|
|||||||||||||
|
2016
|
2015
|
|||||||||||||
|
(in millions)
|
||||||||||||||
|
Revenues
|
|
|
|
|
|
|
|
|
||||||
|
Management and financial advice fees
|
$
|
51
|
|
$
|
55
|
|
$
|
(4
|
)
|
(7
|
)%
|
|||
|
Distribution fees
|
98
|
|
97
|
|
1
|
|
1
|
|
||||||
|
Net investment income
|
330
|
|
325
|
|
5
|
|
2
|
|
||||||
|
Premiums
|
1,286
|
|
1,253
|
|
33
|
|
3
|
|
||||||
|
Other revenues
|
476
|
|
401
|
|
75
|
|
19
|
|
||||||
|
Total revenues
|
2,241
|
|
2,131
|
|
110
|
|
5
|
|
||||||
|
Banking and deposit interest expense
|
—
|
|
—
|
|
—
|
|
—
|
|
||||||
|
Total net revenues
|
2,241
|
|
2,131
|
|
110
|
|
5
|
|
||||||
|
Expenses
|
|
|
|
|
|
|
|
|
||||||
|
Distribution expenses
|
70
|
|
76
|
|
(6
|
)
|
(8
|
)
|
||||||
|
Interest credited to fixed accounts
|
175
|
|
164
|
|
11
|
|
7
|
|
||||||
|
Benefits, claims, losses and settlement expenses
|
1,325
|
|
1,299
|
|
26
|
|
2
|
|
||||||
|
Amortization of deferred acquisition costs
|
138
|
|
146
|
|
(8
|
)
|
(5
|
)
|
||||||
|
Interest and debt expense
|
25
|
|
23
|
|
2
|
|
9
|
|
||||||
|
General and administrative expense
|
245
|
|
225
|
|
20
|
|
9
|
|
||||||
|
Total expenses
|
1,978
|
|
1,933
|
|
45
|
|
2
|
|
||||||
|
Operating earnings
|
$
|
263
|
|
$
|
198
|
|
$
|
65
|
|
33
|
%
|
|||
Our Protection segment pretax operating earnings, which excludes net realized investment gains or losses (net of the related DAC amortization, unearned revenue amortization and the reinsurance accrual) and the market impact on indexed universal life benefits (net of hedges and the related DAC amortization, unearned revenue amortization and the reinsurance accrual), increased $65 million, or 33%, to $263 million for the year ended December 31, 2016 compared to $198 million for the prior year primarily due to
the impact of unlocking, lower
auto and home
losses and
an $11 million unfavorable impact related to a reinsurance premium correction in the prior year, partially offset by
a $28 million favorable impact in the prior year from updating future experience assumptions related to life rider benefits
.
Net Revenues
Net revenues, which exclude net realized investment gains or losses (net of unearned revenue amortization and the reinsurance accrual) and the unearned revenue amortization and the reinsurance accrual offset to the market impact on indexed universal life benefits, increased $110 million, or 5%, to $2.2 billion for the year ended December 31, 2016 compared to $2.1 billion for the prior year primarily due to the impact of unlocking and an increase in premiums.
Premiums increased $33 million, or 3%, to $1.3 billion for the year ended December 31, 2016 compared to the prior year primarily due to rate increases on our auto and home policies.
Other revenues, which exclude the unearned revenue amortization and the reinsurance accrual offset to the market impact on indexed universal life benefits and the unearned revenue amortization and the reinsurance accrual offset to net realized investment gains or losses, increased $75 million, or 19%, to $476 million for the year ended December 31, 2016 compared to $401 million for the prior year primarily due to the impact of unlocking and a $9 million unfavorable impact related to a life reinsurance premium correction in the prior year. Other revenues for the year ended December 31, 2016 included a $64 million favorable impact from unlocking compared to a $5 million unfavorable impact in the prior year. The primary driver of the unlocking impact to other revenues for the year ended December 31, 2016 was a positive impact from higher projected gains on reinsurance contracts resulting from unfavorable mortality experience. The primary driver of the unlocking impact to other revenues for the prior year was
lower projected gains on reinsurance contracts resulting from favorable mortality experience
.
79
Expenses
Total expenses, which exclude the market impact on indexed universal life benefits (net of hedges and the related DAC amortization) and the DAC offset to net realized investment gains or losses, increased $45 million, or 2%, to $2.0 billion for the year ended December 31, 2016 compared to $1.9 billion for the prior year primarily due to the impact of unlocking and an increase in general and administrative expense.
Benefits, claims, losses and settlement expenses increased $26 million, or 2%, to $1.3 billion for the year ended December 31, 2016 compared to $1.3 billion for the prior year primarily reflecting the following items:
|
•
|
Benefits, claims, losses and settlement expenses
for the
year ended December 31, 2016
included a $40 million expense from unlocking primarily reflecting continued low interest rates and
unfavorable mortality experience
.
Benefits, claims, losses and settlement expenses
for the prior year included a $6 million expense from unlocking.
|
|
•
|
A $28 million favorable impact in the prior year from updating future experience assumptions related to life rider benefits.
|
|
•
|
A $7 million increase in life and health insurance claims.
|
|
•
|
A $40 million decrease in b
enefits
, claims, losses and settlement expenses
related to our auto and home business due to improved current year loss performance and
a $20 million decrease in reserves in 2016 due to
favorable prior year reserve development compared to a
$57 million increase in reserves in 2015 due to unfavorable prior year reserve development,
partially offset by an increase in catastrophe losses compared to the prior year and a $26 million increase in additional losses. Catastrophe losses were
$104
million for the
year ended December 31, 2016 compared to $72
million for the prior year.
|
General and administrative expense increased $20 million, or 9%, to $245 million for the year ended December 31, 2016 compared to $225 million for the prior year primarily due to an increase in staff and investments in our auto and home business.
Corporate & Other
The following table presents the results of operations of our Corporate & Other segment on an operating basis:
|
Years Ended December 31,
|
Change
|
|||||||||||||
|
2016
|
2015
|
|||||||||||||
|
(in millions)
|
||||||||||||||
|
Revenues
|
|
|
|
|
|
|
|
|
||||||
|
Net investment income
|
$
|
123
|
|
$
|
133
|
|
$
|
(10
|
)
|
(8
|
)%
|
|||
|
Premiums
|
110
|
|
110
|
|
—
|
|
—
|
|
||||||
|
Other revenues
|
5
|
|
13
|
|
(8
|
)
|
(62
|
)
|
||||||
|
Total revenues
|
238
|
|
256
|
|
(18
|
)
|
(7
|
)
|
||||||
|
Banking and deposit interest expense
|
1
|
|
—
|
|
1
|
|
NM
|
|
||||||
|
Total net revenues
|
237
|
|
256
|
|
(19
|
)
|
(7
|
)
|
||||||
|
Expenses
|
|
|
|
|
|
|
||||||||
|
Distribution expenses
|
(42
|
)
|
(17
|
)
|
(25
|
)
|
NM
|
|
||||||
|
Benefits, claims, losses and settlement expenses
|
294
|
|
239
|
|
55
|
|
23
|
|
||||||
|
Amortization of deferred acquisition costs
|
63
|
|
9
|
|
54
|
|
NM
|
|
||||||
|
Interest and debt expense
|
27
|
|
31
|
|
(4
|
)
|
(13
|
)
|
||||||
|
General and administrative expense
|
254
|
|
208
|
|
46
|
|
22
|
|
||||||
|
Total expenses
|
596
|
|
470
|
|
126
|
|
27
|
|
||||||
|
Operating loss
|
$
|
(359
|
)
|
$
|
(214
|
)
|
$
|
(145
|
)
|
68
|
%
|
|||
|
NM Not Meaningful.
|
||||||||||||||
Our Corporate & Other segment pretax operating loss excludes net realized investment gains or losses, the market impact of hedges to offset interest rate changes on unrealized gains or losses for certain investments, integration and restructuring charges, and the impact of consolidating CIEs. Our Corporate & Other segment pretax operating loss increased $145 million, or 68%, to $359 million for the year ended December 31, 2016 compared to $214 million for the prior year primarily due to loss recognition of $31 million on LTC insurance products in 2016, a $29 million increase in LTC reserves from a correction related to our claim utilization factor
in 2016 and an increase in general and administrative expense.
Net investment income
, which excludes net realized investment gains or losses, the market impact of hedges to offset interest rate changes on unrealized gains or losses for certain investments, and the impact of CIEs,
decreased $10 million, or 8%, to $123 million
for the year ended December 31, 2016
compared to $133 million for the prior year primarily due to
higher losses related to investments in affordable housing partnerships.
80
Other revenues, which exclude the impact of CIEs, decreased $8 million, or 62%, to $5 million
for the year ended December 31, 2016
compared to $13 million for the prior year due to
a $4 million loss on the sale of real estate in the second quarter of 2016 and a $7 million gain on the sale of a building in the second quarter of 2015.
Distribution expenses decreased $25 million to a benefit of $42 million for the year ended December 31, 2016 compared to a benefit of $17 million for the prior year primarily due to a
$27 million benefit related to the release of the deferred reinsurance liability in connection with loss recognition testing of LTC insurance products in 2016.
Benefits, claims, losses and settlement expenses increased $55 million, or 23%, to $294 million for the year ended December 31, 2016 compared to $239 million for the prior year primarily due to a
$39 million increase in LTC reserves in 2016. The LTC reserves in 2016 increased primarily due to a $29 million out-of-period correction related to our claim utilization factor, a $5 million out-of-period correction related to our waiver of premium claim reserve and a $5 million impact from assumption changes for our active life reserve valuation.
Amortization of DAC increased $54 million to $63 million for the year ended
December 31, 2016
compared to $9 million for the prior year primarily due to the impact of unlocking in 2016, which
reflected the DAC write-off of $58 million in connection with the loss recognition on LTC insurance products
due to continued low interest rates, higher morbidity and higher reinsurance expenses, slightly offset by premium increases
.
General and administrative expense, which excludes integration and restructuring charges and the impact of CIEs, increased $46 million, or 22%, to $254 million for the year ended December 31, 2016 compared to $208 million for the prior year primarily due to $30 million of incremental expense related to the planning and implementation of the Department of Labor fiduciary standard, a $10 million increase in severance expense compared to the prior year and a $14 million expense from the resolution of a legacy legal matter related to the hedge fund business, partially offset by lower performance-based compensation.
Fair Value Measurements
We report certain assets and liabilities at fair value; specifically, separate account assets, derivatives, embedded derivatives and most investments and cash equivalents. Fair value assumes the exchange of assets or liabilities occurs in orderly transactions and is not the result of a forced liquidation or distressed sale. We include actual market prices, or observable inputs, in our fair value measurements to the extent available. Broker quotes are obtained when quotes from pricing services are not available. We validate prices obtained from third parties through a variety of means such as: price variance analysis, subsequent sales testing, stale price review, price comparison across pricing vendors and due diligence reviews of vendors. See Note 14 to the Consolidated Financial Statements for additional information on our fair value measurements.
Fair Value of Liabilities and Nonperformance Risk
Companies are required to measure the fair value of liabilities at the price that would be received to transfer the liability to a market participant (an exit price). Since there is not a market for our obligations of our variable annuity riders and indexed universal life insurance, we consider the assumptions participants in a hypothetical market would make to reflect an exit price. As a result, we adjust the valuation of variable annuity riders, indexed annuities and indexed universal life insurance by updating certain contractholder assumptions, adding explicit margins to provide for profit, risk and expenses, and adjusting the rates used to discount expected cash flows to reflect a current market estimate of our nonperformance risk. The nonperformance risk adjustment is based on observable market data adjusted to estimate the risk of our life insurance company subsidiaries not fulfilling these liabilities. Consistent with general market conditions, this estimate resulted in a spread over the LIBOR swap curve as of December 31, 2017. As our estimate of this spread widens or tightens, the liability will decrease or increase. If this nonperformance credit spread moves to a zero spread over the LIBOR swap curve, the reduction to future net income would be approximately $272 million, net of DAC, DSIC, unearned revenue amortization, the reinsurance accrual and income taxes (calculated at the statutory tax rate of 21%), based on December 31, 2017 credit spreads.
Liquidity and Capital Resources
Overview
We maintained substantial liquidity during the year ended
December 31, 2017
. At
December 31, 2017
and
2016
, we had $2.5 billion and $2.3 billion, respectively, in cash and cash equivalents excluding CIEs. We have additional liquidity available through an unsecured revolving credit facility for up to $750 million that expires in October 2022. Under the terms of the credit agreement, we can increase this facility to $1 billion upon satisfaction of certain approval requirements. Available borrowings under this facility are reduced by any outstanding letters of credit. At
December 31, 2017
, we had no outstanding borrowings under this credit facility and had $1 million of outstanding letters of credit. Our credit facility contains various administrative, reporting, legal and financial covenants. We were in compliance with all such covenants at
December 31, 2017
.
We enter into short-term borrowings, which may include repurchase agreements and Federal Home Loan Bank (“FHLB”) advances, to reduce reinvestment risk. Short-term borrowings allow us to receive cash to reinvest in longer-duration assets, while paying back the short-term debt with cash flows generated by the fixed income portfolio. The balance of repurchase agreements at both
December 31, 2017
and
2016
was $50 million, which is collateralized with agency residential mortgage backed securities and commercial mortgage backed securities from our investment portfolio. Our subsidiary, RiverSource Life Insurance Company (“RiverSource Life”), is a member of the FHLB of Des Moines, which provides access to collateralized borrowings. As of both
December 31, 2017
and
2016
,
81
we had borrowings of $150 million from the FHLB, which is collateralized with commercial mortgage backed securities. We believe cash flows from operating activities, available cash balances and our availability of revolver borrowings will be sufficient to fund our operating liquidity needs.
Dividends from Subsidiaries
Ameriprise Financial is primarily a parent holding company for the operations carried out by our wholly owned subsidiaries. Because of our holding company structure, our ability to meet our cash requirements, including the payment of dividends on our common stock, substantially depends upon the receipt of dividends or return of capital from our subsidiaries, particularly our life insurance subsidiary, RiverSource Life, our face-amount certificate subsidiary, Ameriprise Certificate Company (“ACC”), AMPF Holding Corporation, which is the parent company of our retail introducing broker-dealer subsidiary, Ameriprise Financial Services, Inc. (“AFSI”) and our clearing broker-dealer subsidiary, American Enterprise Investment Services, Inc. (“AEIS”), our Auto and Home insurance subsidiary, IDS Property Casualty Insurance Company (“IDS Property Casualty”), doing business as Ameriprise Auto & Home Insurance, our transfer agent subsidiary, Columbia Management Investment Services Corp., our investment advisory company, Columbia Management Investment Advisers, LLC, and Ameriprise International Holdings GmbH, which is the parent company of Threadneedle Asset Management Holdings Sàrl. The payment of dividends by many of our subsidiaries is restricted and certain of our subsidiaries are subject to regulatory capital requirements.
Actual capital and regulatory capital requirements for our wholly owned subsidiaries subject to regulatory capital requirements were as follows:
|
|
Actual Capital
|
Regulatory
Capital Requirements
|
|||||||||||
|
December 31,
|
December 31,
|
||||||||||||
|
2017
|
2016
|
2017
|
2016
|
||||||||||
|
(in millions)
|
|||||||||||||
|
RiverSource Life
(1)(2)
|
$
|
2,451
|
|
$
|
3,052
|
|
$
|
562
|
|
$
|
606
|
|
|
|
RiverSource Life of NY
(1)(2)
|
269
|
|
323
|
|
36
|
|
38
|
|
|||||
|
IDS Property Casualty
(1)(3)
|
781
|
|
800
|
|
214
|
|
213
|
|
|||||
|
Ameriprise Insurance Company
(1)(3)
|
48
|
|
47
|
|
3
|
|
2
|
|
|||||
|
ACC
(4)(5)
|
365
|
|
335
|
|
343
|
|
317
|
|
|||||
|
Threadneedle Asset Management Holdings Sàrl
(6)
|
426
|
|
360
|
|
170
|
|
149
|
|
|||||
|
Ameriprise National Trust Bank
(7)
|
22
|
|
22
|
|
10
|
|
10
|
|
|||||
|
AFSI
(3)(4)
|
63
|
|
77
|
|
#
|
|
#
|
|
|||||
|
Ameriprise Captive Insurance Company
(3)
|
51
|
|
51
|
|
8
|
|
9
|
|
|||||
|
Ameriprise Trust Company
(3)
|
31
|
|
29
|
|
27
|
|
24
|
|
|||||
|
AEIS
(3)(4)
|
125
|
|
107
|
|
22
|
|
19
|
|
|||||
|
RiverSource Distributors, Inc.
(3)(4)
|
12
|
|
11
|
|
#
|
|
#
|
|
|||||
|
Columbia Management Investment Distributors, Inc.
(3)(4)
|
16
|
|
14
|
|
#
|
|
#
|
|
|||||
|
Investment Professionals, Inc.
(8)
|
2
|
|
—
|
|
#
|
|
—
|
|
|||||
# Amounts are less than $1 million.
(1)
Actual capital is determined on a statutory basis.
(2)
Regulatory capital requirement is based on the statutory risk-based capital filing.
(3)
Regulatory capital requirement is based on the applicable regulatory requirement, calculated as of
December 31, 2017
and
2016
.
(4)
Actual capital is determined on an adjusted GAAP basis.
(5)
ACC is required to hold capital in compliance with the Minnesota Department of Commerce and SEC capital requirements.
(6)
Actual capital and regulatory capital requirements are determined in accordance with U.K. regulatory legislation. The regulatory capital requirements at
December 31, 2017
represent calculations at September 30,
2017
of the rule based requirements, as specified by FCA regulations.
(7)
Ameriprise National Trust Bank is required to maintain capital in compliance with the Office of the Comptroller of the Currency (“OCC”) regulations and policies.
(8)
Investment Professionals, Inc. was acquired by AMPF Holding Corporation on July 1, 2017.
In addition to the particular regulations restricting dividend payments and establishing subsidiary capitalization requirements, we take into account the overall health of the business, capital levels and risk management considerations in determining a dividend strategy for payments to our parent holding company from our subsidiaries, and in deciding to use cash to make capital contributions to our subsidiaries.
The new Tax Act had an unfavorable impact of approximately $0.3 billion on combined RiverSource Life actual capital as of December 31, 2017. While we took a one time charge in the fourth quarter for the new Tax Act, we expect ongoing benefit from tax reform to be positive as the lower tax rate will provide additional opportunity for further free cash and capital generation.
82
During the year ended
December 31, 2017
, the parent holding company received cash dividends or a return of capital from its subsidiaries of $1.7 billion and contributed cash to its subsidiaries of $79 million. During the year ended
December 31, 2016
, the parent holding company received cash dividends or a return of capital from its subsidiaries of $1.7 billion and contributed cash to its subsidiaries of $197 million.
The table below presents the historical subsidiary capacity for dividend to the parent holding company in each of the years ended December 31:
|
|
2017
|
2016
|
2015
|
||||||||
|
(in millions)
|
|||||||||||
|
RiverSource Life
(1)
|
$
|
700
|
|
$
|
1,033
|
|
$
|
1,412
|
|
||
|
Ameriprise National Trust Bank
|
5
|
|
—
|
|
—
|
|
|||||
|
ACC
(2)
|
37
|
|
17
|
|
26
|
|
|||||
|
Columbia Management Investment Advisers, LLC
|
388
|
|
296
|
|
503
|
|
|||||
|
Columbia Management Investment Services Corporation
|
25
|
|
18
|
|
14
|
|
|||||
|
Ameriprise International Holdings GmbH
|
367
|
|
233
|
|
172
|
|
|||||
|
Ameriprise Trust Company
|
4
|
|
5
|
|
6
|
|
|||||
|
IDS Property Casualty
(3)
|
—
|
|
—
|
|
11
|
|
|||||
|
Ameriprise Captive Insurance Company
|
64
|
|
64
|
|
64
|
|
|||||
|
RiverSource Distributors, Inc.
|
12
|
|
14
|
|
14
|
|
|||||
|
AMPF Holding Corporation
|
752
|
|
587
|
|
572
|
|
|||||
|
Total dividend capacity
|
$
|
2,354
|
|
$
|
2,267
|
|
$
|
2,794
|
|
||
(1)
RiverSource Life dividends in excess of statutory unassigned funds require advance notice to the Minnesota Department of Commerce, RiverSource Life’s primary regulator, and are subject to potential disapproval. In addition, dividends whose fair market value, together with that of other dividends or distributions made within the preceding 12 months, exceeds the greater of (1) the previous year’s statutory net gain from operations or (2) 10% of the previous year-end statutory capital and surplus are referred to as “extraordinary dividends.” Extraordinary dividends also require advance notice to the Minnesota Department of Commerce, and are subject to potential disapproval. For dividends exceeding these thresholds, RiverSource Life provided notice to the Minnesota Department of Commerce and received responses indicating that it did not object to the payment of these dividends. Total dividend capacity for RiverSource Life represents dividends paid during year ended December 31 along with any unpaid ordinary dividend capacity, subject to unassigned funds limitation.
(2)
The dividend capacity for ACC is based on capital held in excess of regulatory requirements.
(3)
The dividend capacity for IDS Property Casualty is based on the lesser of (1) 10% of the previous year-end capital and surplus or (2) the greater of (a) net income (excluding realized gains) of the previous year or (b) the aggregate net income of the previous three years excluding realized gains less any dividends paid within the first two years of the three-year period. Dividends that, together with the amount of other distributions made within the preceding 12 months, exceed this statutory limitation are referred to as “extraordinary dividends” and require advance notice to the Office of the Commissioner of Insurance of the State of Wisconsin, the primary state regulator of IDS Property Casualty, and are subject to potential disapproval. Total dividend capacity for IDS Property Casualty represents dividends paid during year ended December 31 along with any unpaid ordinary dividend capacity.
The following table presents cash dividends paid or return of capital to the parent holding company, net of cash capital contributions made by the parent holding company for the following subsidiaries for the years ended December 31:
|
|
2017
|
2016
|
2015
|
||||||||
|
(in millions)
|
|||||||||||
|
RiverSource Life
|
$
|
700
|
|
$
|
1,000
|
|
$
|
800
|
|
||
|
Ameriprise National Trust Bank
|
—
|
|
9
|
|
—
|
|
|||||
|
ACC
|
10
|
|
(33
|
)
|
(3
|
)
|
|||||
|
Columbia Management Investment Advisers, LLC (“CMIA”)
|
298
|
|
190
|
|
375
|
|
|||||
|
Ameriprise International Holdings GmbH
|
109
|
|
—
|
|
—
|
|
|||||
|
IDS Property Casualty
|
—
|
|
(118
|
)
|
(175
|
)
|
|||||
|
Ameriprise Advisor Capital, LLC
|
(70
|
)
|
(46
|
)
|
(72
|
)
|
|||||
|
RiverSource Distributors, Inc.
|
—
|
|
3
|
|
—
|
|
|||||
|
Ameriprise Captive Insurance Company
|
5
|
|
—
|
|
15
|
|
|||||
|
AMPF Holding Corporation
|
614
|
|
450
|
|
421
|
|
|||||
|
Total
|
$
|
1,666
|
|
$
|
1,455
|
|
$
|
1,361
|
|
||
83
In 2009, RiverSource established an agreement to protect its exposure to Genworth Life Insurance Company (“GLIC”) for its reinsured LTC. In 2016, substantial enhancements to this reinsurance protection agreement were finalized. The terms of these confidential provisions within the agreement have been shared, in the normal course of regular reviews, with our domiciliary regulator and rating agencies. Management believes that this agreement and offsetting non LTC legacy arrangements with Genworth will enable RiverSource to recover on all net exposure in the event of an insolvency of GLIC.
Dividends Paid to Shareholders and Share Repurchases
We paid regular quarterly dividends to our shareholders totaling $502 million and $489 million for the years ended
December 31, 2017
and
2016
, respectively. On January 24, 2018, we announced a quarterly dividend of $0.83 per common share. The dividend will be paid on February 28, 2018 to our shareholders of record at the close of business on February 16, 2018.
In December 2015, our Board of Directors authorized us to repurchase up to $2.5 billion of our common stock through December 31, 2017, which was exhausted in the third quarter 2017. In April 2017, our Board of Directors authorized us to repurchase up to an additional $2.5 billion of our common stock through June 30, 2019. As of
December 31, 2017
, we had $2.1 billion remaining under this share repurchase authorization. We intend to fund share repurchases through existing working capital, future earnings and other customary financing methods. The share repurchase programs do not require the purchase of any minimum number of shares, and depending on market conditions and other factors, these purchases may be commenced or suspended at any time without prior notice. Acquisitions under the share repurchase programs may be made in the open market, through privately negotiated transactions or block trades or other means. During the year ended
December 31, 2017
, we repurchased a total of 9.9 million shares of our common stock at an average price of $135.58 per share.
Cash Flows
Cash flows of CIEs and restricted and segregated cash are reflected in our cash flows provided by (used in) operating activities, investing activities and financing activities. Cash held by CIEs is not available for general use by Ameriprise Financial, nor is Ameriprise Financial cash available for general use by its CIEs. Cash segregated under federal and other regulations is held for the exclusive benefit of our brokerage customers and is not available for general use by Ameriprise Financial.
Operating Activities
Net cash provided by operating activities decreased $652 million to $1.7 billion for the year ended
December 31, 2017
compared to $2.4 billion for the prior year
primarily due to
a $263 million increase in income taxes paid and a
$508 million decrease in cash from changes in brokerage deposits.
Net cash provided by operating activities decreased $338 million to $2.4 billion for the year ended
December 31, 2016
compared to $2.7 billion for the prior year primarily due to higher cash outflows related to derivatives
,
as well as a decrease in cash from lower fee revenue net of related expenses.
Investing Activities
Our investing activities primarily relate to our Available-for-Sale investment portfolio. Further, this activity is significantly affected by the net flows of our investment certificate, fixed annuity and universal life products reflected in financing activities.
Net cash used in investing activities decreased $606 million to $199 million for the year ended
December 31, 2017
compared to $805 million for the prior year primarily due to a $1.1 billion decrease in cash used for purchases of Available-for-Sale securities, partially offset by a $495 million decrease in net cash related to changes in investments of CIEs
.
Net cash used in investing activities increased $296 million to $805 million for the year ended
December 31, 2016
compared to $509 million for the prior year primarily due to a $1.9 billion increase in cash used for purchases of Available-for-Sale securities, partially offset by a $1.2 billion increase in net cash related to changes in investments of CIEs primarily reflecting the CIE deconsolidation, a $179 million increase in proceeds from sales, maturities and repayments of mortgage loans reflecting the sale of a portion of our consumer loans in the first
quarter of 2016 and a $107 million decrease in funding of mortgage loans.
Financing Activities
Net cash used in financing activities increased $643 million to $1.8 billion for the year ended
December 31, 2017
compared to $1.1 billion for the prior year primarily due to the issuance of $500 million of long-term debt in 2016 and a $632 million decrease in net cash inflows related to investment certificates, partially offset by a $246 million decrease in repayments of long-term debt.
Net cash used in financing activities decreased $1.3 billion to $1.1 billion for the year ended
December 31, 2016
compared to $2.4 billion for the prior year. Net cash inflows related to investment certificates increased $465 million compared to the prior year due to higher proceeds from additions, partially offset by higher maturities, withdrawals and cash surrenders. Cash outflows from surrenders and other benefits of policyholder account balances decreased $782 million compared to the prior year.
During the year ended December 31, 2016, we repaid the remaining $245 million of our junior subordinated notes due 2066. In the third quarter of 2016, we issued $500 million of unsecured senior notes due 2026
. Net cash outflows related to noncontrolling interests decreased $160 million compared to the prior year reflecting the CIE deconsolidation. Net cash outflows related to borrowings of CIEs was $517 million for the year ended December 31, 2016 compared to net cash inflows of $931 million for the prior year primarily reflecting the CIE deconsolidation.
84
Contractual Commitments
The contractual obligations identified in the table below include both our on and off-balance sheet transactions that represent material expected or contractually committed future obligations. The table excludes obligations of CIEs as they are not direct obligations of the Company and have recourse only to the assets of the CIEs. Estimated cash payments due by period as of
December 31, 2017
were as follows:
|
|
Total
|
2018
|
2019-2020
|
2021-2022
|
2023 and Thereafter
|
||||||||||||||
|
(in millions)
|
|||||||||||||||||||
|
|
|
|
|
|
|
||||||||||||||
|
Long-term debt
(1)
|
$
|
2,888
|
|
$
|
13
|
|
$
|
1,075
|
|
$
|
—
|
|
$
|
1,800
|
|
||||
|
Insurance and annuities
(2)
|
50,007
|
|
2,798
|
|
4,927
|
|
4,294
|
|
37,988
|
|
|||||||||
|
Investment certificates
(3)
|
6,400
|
|
6,109
|
|
291
|
|
—
|
|
—
|
|
|||||||||
|
Deferred premium options
(4)
|
1,706
|
|
233
|
|
513
|
|
437
|
|
523
|
|
|||||||||
|
Affordable housing and other real estate partnerships
(5)
|
123
|
|
84
|
|
32
|
|
3
|
|
4
|
|
|||||||||
|
Off-Balance Sheet
|
|||||||||||||||||||
|
Operating lease obligations
|
315
|
|
69
|
|
106
|
|
62
|
|
78
|
|
|||||||||
|
Purchase obligations
(6)
|
806
|
|
290
|
|
392
|
|
103
|
|
21
|
|
|||||||||
|
Interest on long-term debt
(7)
|
562
|
|
129
|
|
190
|
|
130
|
|
113
|
|
|||||||||
|
Total
|
$
|
62,807
|
|
$
|
9,725
|
|
$
|
7,526
|
|
$
|
5,029
|
|
$
|
40,527
|
|
||||
(1)
See Note 13 to our Consolidated Financial Statements for more information about our long-term debt. Amounts include obligations under capital leases.
(2)
These scheduled payments are represented by reserves of approximately $29.9 billion at
December 31, 2017
and are based on interest credited, mortality, morbidity, lapse, surrender and premium payment assumptions. The estimated payments are presented gross before reinsurance. The scheduled payments are undiscounted and exceed the corresponding liability at December 31, 2017. Actual payment obligations may differ if experience varies from these assumptions. As of December 31, 2017, the projected period for which cash payments will be made is 40 years. Separate account liabilities have been excluded as associated contractual obligations would be met by separate account assets.
(3)
The payments due by year are based on contractual term maturities. However, contractholders have the right to redeem the investment certificates earlier and at their discretion subject to surrender charges, if any. Redemptions are most likely to occur in periods of substantial increases in interest rates.
(4)
The fair value of these commitments included on the Consolidated Balance Sheets was $1.5 billion as of
December 31, 2017
. See Note 16 to our Consolidated Financial Statements for more information about our deferred premium options.
(5)
Call dates for the obligations presented are either date or event specific. For date specific obligations, we are required to fund a specific amount on a stated date provided there are no defaults under the agreement. For event specific obligations, we are required to fund a specific amount of its capital commitment when properties in a fund become fully stabilized. For event specific obligations, the estimated call date of these commitments is used in the table above.
(6)
Purchase obligations include the minimum contractual amounts by period under contracts that were in effect at
December 31, 2017
. Many of the purchase agreements giving rise to these purchase obligations include termination clauses that may require payment of termination fees if the agreements are terminated by us without cause prior to their stated expiration; however, the table reflects the amounts to be paid assuming the contracts are not terminated.
(7)
Interest on long-term debt was estimated based on rates in effect as of
December 31, 2017
.
In addition to the contractual commitments outlined in the table above, we periodically fund the employees’ defined benefit plans. In 2018, we expect to contribute $26 million to our pension plans and $1 million to our defined benefit postretirement plans. See Note 22 to our Consolidated Financial Statements for additional information.
Total loan funding commitments, which are not included in the table above due to uncertainty with respect to timing of future cash flows, were $33 million at
December 31, 2017
. For additional information relating to these contractual commitments, see Note 23 to our Consolidated Financial Statements.
Off-Balance Sheet Arrangements
We provide asset management services to investment entities which are considered to be VIEs, such as CLOs, hedge funds, property funds and private equity funds, which are sponsored by us. We consolidate certain CLOs. We have determined that consolidation is not required for hedge funds, property funds and private equity funds, which are sponsored by us. Our maximum exposure to loss with respect to our investment in these non-consolidated entities is limited to our carrying value. We have no obligation to provide further financial or other support to these investment entities nor have we provided any support to these investment entities. See Note 4 to our Consolidated Financial Statements for additional information on our arrangements with these investment entities.
85
Forward-Looking Statements
This report contains forward-looking statements that reflect management’s plans, estimates and beliefs. Actual results could differ materially from those described in these forward-looking statements. Examples of such forward-looking statements include:
|
•
|
statements of the Company’s plans, intentions, positioning, expectations, objectives or goals, including those relating to asset flows, mass affluent and affluent client acquisition strategy, client retention and growth of our client base, financial advisor productivity, retention, recruiting and enrollments, the introduction, cessation, terms or pricing of new or existing products and services, acquisition integration, benefits and claims expenses, general and administrative costs, consolidated tax rate, return of capital to shareholders, debt repayment and excess capital position and financial flexibility to capture additional growth opportunities;
|
|
•
|
other statements about future economic performance, the performance of equity markets and interest rate variations and the economic performance of the United States and of global markets; and
|
|
•
|
statements of assumptions underlying such statements.
|
The words “believe,” “expect,” “anticipate,” “optimistic,” “intend,” “plan,” “aim,” “will,” “may,” “should,” “could,” “would,” “likely,” “forecast,” “on pace,” “project” and similar expressions are intended to identify forward-looking statements but are not the exclusive means of identifying such statements. Forward-looking statements are subject to risks and uncertainties, which could cause actual results to differ materially from such statements.
Such factors include, but are not limited to:
|
•
|
conditions in the interest rate, credit default, equity market and foreign exchange environments, including changes in valuations, liquidity and volatility;
|
|
•
|
changes in and the adoption of relevant accounting standards and securities rating agency standards and processes, as well as changes in the litigation and regulatory environment, including ongoing legal proceedings and regulatory actions, the frequency and extent of legal claims threatened or initiated by clients, other persons and regulators, and developments in regulation and legislation, including the rules and regulations implemented or that may be implemented or modified in connection with the Dodd-Frank Wall Street Reform and Consumer Protection Act or in light of the U.S. Department of Labor and other rules and exemptions pertaining to the fiduciary status of investment advice providers to 401(k) plans, plan sponsors, plan participants and the holders of individual retirement or health savings accounts;
|
|
•
|
investment management performance and distribution partner and consumer acceptance of the Company’s products;
|
|
•
|
effects of competition in the financial services industry, including pricing pressure, the introduction of new products and services and changes in product distribution mix and distribution channels;
|
|
•
|
changes to the Company’s reputation that may arise from employee or advisor misconduct, legal or regulatory actions, perceptions of the financial services industry generally, improper management of conflicts of interest or otherwise;
|
|
•
|
the Company’s capital structure, including indebtedness, limitations on subsidiaries to pay dividends, and the extent, manner, terms and timing of any share or debt repurchases management may effect as well as the opinions of rating agencies and other analysts and the reactions of market participants or the Company’s regulators, advisors, distribution partners or customers in response to any change or prospect of change in any such opinion;
|
|
•
|
changes to the availability and cost of liquidity and the Company’s credit capacity that may arise due to shifts in market conditions, the Company’s credit ratings and the overall availability of credit;
|
|
•
|
risks of default, capacity constraint or repricing by issuers or guarantors of investments the Company owns or by counterparties to hedge, derivative, insurance or reinsurance arrangements or by manufacturers of products the Company distributes, experience deviations from the Company’s assumptions regarding such risks, the evaluations or the prospect of changes in evaluations of any such third parties published by rating agencies or other analysts, and the reactions of other market participants or the Company’s regulators, advisors, distribution partners or customers in response to any such evaluation or prospect of changes in evaluation;
|
|
•
|
experience deviations from the Company’s assumptions regarding morbidity, mortality and persistency in certain annuity and insurance products (including, but not limited to, variable annuities and long term care policies), or from assumptions regarding market returns assumed in valuing or unlocking DAC and DSIC or market volatility underlying the Company’s valuation and hedging of guaranteed benefit annuity riders, or from assumptions regarding interest rates assumed in the Company's loss recognition testing of its long term care business, or from assumptions regarding anticipated claims and losses relating to the Company’s automobile and home insurance products;
|
|
•
|
changes in capital requirements that may be indicated, required or advised by regulators or rating agencies;
|
|
•
|
the impacts of the Company’s efforts to improve distribution economics and to grow third-party distribution of its products;
|
|
•
|
the ability to pursue and complete strategic transactions and initiatives, including acquisitions, divestitures, restructurings, joint ventures and the development of new products and services;
|
|
•
|
the ability to realize the financial, operating and business fundamental benefits of strategic transactions and initiatives the Company has completed, is pursuing or may pursue in the future, which may be impacted by the ability to obtain regulatory approvals, the ability to effectively manage related expenses and by market, business partner and consumer reactions to such strategic transactions and initiatives;
|
86
|
•
|
the ability and timing to realize savings and other benefits from re-engineering and tax planning;
|
|
•
|
interruptions or other failures in the Company’s communications, technology and other operating systems, including errors or failures caused by third-party service providers, interference or failures caused by third party attacks on the Company’s systems, or the failure to safeguard the privacy or confidentiality of sensitive information and data on such systems; and
|
|
•
|
general economic and political factors, including consumer confidence in the economy and the financial industry, the ability and inclination of consumers generally to invest as well as their ability and inclination to invest in financial instruments and products other than cash and cash equivalents, the costs of products and services the Company consumes in the conduct of its business, and applicable legislation and regulation and changes therein
(such as the ongoing negotiations following the June 2016 UK referendum on membership in the European Union
and the uncertain regulatory environment in the U.S. after the recent U.S. election
)
, including tax laws, tax treaties, fiscal and central government treasury policy, and policies regarding the financial services industry and publicly-held firms, and regulatory rulings and pronouncements.
|
Management cautions the reader that the foregoing list of factors is not exhaustive. There may also be other risks that management is unable to predict at this time that may cause actual results to differ materially from those in forward-looking statements. Readers are cautioned not to place undue reliance on these forward-looking statements, which speak only as of the date on which they are made. Management undertakes no obligation to update publicly or revise any forward-looking statements.
Ameriprise Financial announces financial and other information to investors through the Company’s investor relations website at ir.ameriprise.com, as well as SEC filings, press releases, public conference calls and webcasts. Investors and others interested in the company are encouraged to visit the investor relations website from time to time, as information is updated and new information is posted. The website also allows users to sign up for automatic notifications in the event new materials are posted. The information found on the website is not incorporated by reference into this report or in any other report or document the Company furnishes or files with the SEC.
Market Risk
Our primary market risk exposures are interest rate, equity price, foreign currency exchange rate and credit risk. Equity price and interest rate fluctuations can have a significant impact on our results of operations, primarily due to the effects they have on the asset management and other asset-based fees we earn, the spread income generated on our fixed deferred annuities, fixed insurance, brokerage client cash balances, face-amount certificate products and the fixed portion of our variable annuities and variable insurance contracts, the value of DAC and DSIC assets, the value of liabilities for guaranteed benefits associated with our variable annuities and the value of derivatives held to hedge these benefits.
RiverSource Life has the following variable annuity guarantee benefits: guaranteed minimum withdrawal benefits (“GMWB”), guaranteed minimum accumulation benefits (“GMAB”), guaranteed minimum death benefits (“GMDB”) and guaranteed minimum income benefits (“GMIB”). Each of these benefits guarantees payouts to the annuity holder under certain specific conditions regardless of the performance of the underlying invested assets.
The variable annuity guarantees continue to be managed by utilizing a hedging program which attempts to match the sensitivity of the assets with the sensitivity of the liabilities. This approach works with the premise that matched sensitivities will produce a highly effective hedging result. Our comprehensive hedging program focuses mainly on first order sensitivities of assets and liabilities: Equity Market Level (Delta), Interest Rate Level (Rho) and Volatility (Vega). Additionally, various second order sensitivities are managed. We use various index options across the term structure, interest rate swaps and swaptions, total return swaps and futures to manage the risk exposures. The exposures are measured and monitored daily, and adjustments to the hedge portfolio are made as necessary.
We have a macro hedge program to provide protection against the statutory tail scenario risk arising from variable annuity reserves on our statutory surplus and to cover some of the residual risks not covered by other hedging activities. We assess the residual risk under a range of scenarios in creating and executing the macro hedge program. As a means of economically hedging these risks, we use a combination of options and/or swaps. Certain of the macro hedge derivatives used contain settlement provisions linked to both equity returns and interest rates; the remaining are interest rate contracts or equity contracts. The macro hedge program could result in additional earnings volatility as changes in the value of the macro hedge derivatives, which are designed to reduce statutory capital volatility, may not be closely aligned to changes in the variable annuity guarantee embedded derivatives.
To evaluate interest rate and equity price risk we perform sensitivity testing which measures the impact on pretax income from the sources listed below for a 12-month period following a hypothetical 100 basis point increase in interest rates or a hypothetical 10% decline in equity prices. The interest rate risk test assumes a sudden 100 basis point parallel shift in the yield curve, with rates then staying at those levels for the next 12 months. The equity price risk test assumes a sudden 10% drop in equity prices, with equity prices then staying at those levels for the next 12 months. In estimating the values of variable annuity riders, indexed annuities, stock market certificates, indexed universal life insurance and the associated hedge assets, we assume no change in implied market volatility despite the 10% drop in equity prices.
87
The following tables present our estimate of the impact on pretax income from these hypothetical market movements as of
December 31, 2017
:
|
Equity Price Decline 10%
|
Equity Price Exposure to Pretax Income
|
|||||||||||
|
Before Hedge Impact
|
Hedge Impact
|
Net Impact
|
||||||||||
|
|
(in millions)
|
|||||||||||
|
Asset-based management and distribution fees
(1)
|
$
|
(266
|
)
|
$
|
5
|
|
$
|
(261
|
)
|
|||
|
DAC and DSIC amortization
(2)(3)
|
(128
|
)
|
—
|
|
(128
|
)
|
||||||
|
Variable annuity riders:
|
|
|
||||||||||
|
GMDB and GMIB
(3)
|
(29
|
)
|
—
|
|
(29
|
)
|
||||||
|
GMWB
|
(361
|
)
|
173
|
|
(188
|
)
|
||||||
|
GMAB
|
(21
|
)
|
21
|
|
—
|
|
||||||
|
DAC and DSIC amortization
(4)
|
N/A
|
|
N/A
|
|
3
|
|
||||||
|
Total variable annuity riders
|
(411
|
)
|
194
|
|
(214
|
)
|
||||||
|
Macro hedge program
(5)
|
—
|
|
38
|
|
38
|
|
||||||
|
Indexed annuities
|
1
|
|
(1
|
)
|
—
|
|
||||||
|
Certificates
|
2
|
|
(2
|
)
|
—
|
|
||||||
|
Indexed universal life insurance
|
64
|
|
(50
|
)
|
14
|
|
||||||
|
Total
|
$
|
(738
|
)
|
$
|
184
|
|
$
|
(551
|
)
|
|||
|
Interest Rate Increase 100 Basis Points
|
Interest Rate Exposure to Pretax Income
|
|||||||||||
|
Before Hedge Impact
|
Hedge Impact
|
Net Impact
|
||||||||||
|
|
(in millions)
|
|||||||||||
|
Asset-based management and distribution fees
(1)
|
$
|
(52
|
)
|
$
|
—
|
|
$
|
(52
|
)
|
|||
|
Variable annuity riders:
|
|
|
||||||||||
|
GMDB and GMIB
|
—
|
|
—
|
|
—
|
|
||||||
|
GMWB
|
979
|
|
(1,050
|
)
|
(71
|
)
|
||||||
|
GMAB
|
19
|
|
(20
|
)
|
(1
|
)
|
||||||
|
DAC and DSIC amortization
(4)
|
N/A
|
|
N/A
|
|
12
|
|
||||||
|
Total variable annuity riders
|
998
|
|
(1,070
|
)
|
(60
|
)
|
||||||
|
Macro hedge program
(5)
|
—
|
|
(1
|
)
|
(1
|
)
|
||||||
|
Fixed annuities, fixed insurance and fixed portion of variable annuities and variable insurance products
|
88
|
|
—
|
|
88
|
|
||||||
|
Brokerage client cash balances
|
118
|
|
—
|
|
118
|
|
||||||
|
Certificates
|
2
|
|
—
|
|
2
|
|
||||||
|
Indexed universal life insurance
|
95
|
|
2
|
|
97
|
|
||||||
|
Total
|
$
|
1,249
|
|
$
|
(1,069
|
)
|
$
|
192
|
|
|||
N/A Not Applicable.
(1)
Excludes incentive income which is impacted by market and fund performance during the period and cannot be readily estimated.
(2)
Market impact on DAC and DSIC amortization resulting from lower projected profits.
(3)
In estimating the impact on DAC and DSIC amortization resulting from lower projected profits, we have not changed our assumed equity asset growth rates. This is a significantly more conservative estimate than if we assumed management follows its mean reversion guideline and increased near-term rates to recover the drop in equity values over a five-year period. We make this same conservative assumption in estimating the impact from GMDB and GMIB riders and the life contingent benefits associated with GMWB.
(4)
Market impact on DAC and DSIC amortization related to variable annuity riders is modeled net of hedge impact.
(5)
The market impact of the macro hedge program is modeled net of any related impact to DAC and DSIC amortization.
The above results compare to an estimated negative net impact to pretax income of $490 million related to a 10% equity price decline and an estimated positive net impact to pretax income of $297 million related to a 100 basis point increase in interest rates as of
December 31, 2016
. The change in the equity price exposure related to asset-based management and distribution fees is primarily the result of higher assets under management.
The change in interest rate exposure related to variable annuity riders is primarily the result
88
of changes in market rates.
The change in interest rate exposure related to brokerage client cash balances is primarily driven by a change in expected product economics given the higher short-term interest rate environment.
Net impacts shown in the above table from GMWB riders result largely from differences between the liability valuation basis and the hedging basis. Liabilities are valued using fair value accounting principles, with risk margins incorporated in contractholder behavior assumptions and with discount rates increased to reflect a current market estimate of our risk of nonperformance specific to these liabilities. The Company’s hedging is based on our determination of economic risk, which excludes certain items in the liability valuation including the nonperformance spread risk.
Actual results could differ materially from those illustrated above as they are based on a number of estimates and assumptions. These include assuming that implied market volatility does not change when equity prices fall by 10%; that management does not increase assumed equity asset growth rates to anticipate recovery of the drop in equity values when valuing DAC, DSIC and the liability values associated with GMDB, GMIB and the life contingent benefits associated with GMWB; and that the 100 basis point increase in interest rates is a parallel shift of the yield curve. Furthermore, we have not tried to anticipate changes in client preferences for different types of assets or other changes in client behavior, nor have we tried to anticipate actions management might take to increase revenues or reduce expenses in these scenarios.
The selection of a 100 basis point interest rate increase as well as a 10% equity price decline should not be construed as a prediction of future market events. Impacts of larger or smaller changes in interest rates or equity prices may not be proportional to those shown for a 100 basis point increase in interest rates or a 10% decline in equity prices.
Asset-Based Management and Distribution Fees
We earn asset-based management fees and distribution fees on our assets under management. At
December 31, 2017
, the value of our assets under management was $714.3 billion. These sources of revenue are subject to both interest rate and equity price risk since the value of these assets and the fees they earn fluctuate inversely with interest rates and directly with equity prices. We do not currently hedge the interest rate or equity price risk of this exposure.
DAC and DSIC Amortization
For annuity and UL products, DAC and DSIC are amortized on the basis of estimated gross profits. Estimated gross profits are a proxy for pretax income prior to the recognition of DAC and DSIC amortization expense. When events occur that reduce or increase current period estimated gross profits, DAC and DSIC amortization expense is typically reduced or increased as well, somewhat mitigating the impact of the event on pretax income.
Variable Annuity Riders
The total contract value of all variable annuities at
December 31, 2017
was $80.3 billion. These contract values include GMWB and GMAB contracts which were $46.9 billion and $3.1 billion, respectively, at
December 31, 2017
. At
December 31, 2017
, reserves for GMWB were liabilities of $463 million and reserves for GMAB were assets of $80 million. The GMWB and GMAB reserves include the fair value of embedded derivatives, which fluctuates based on equity, interest rate and credit markets which can cause these embedded derivatives to be either an asset or a liability. At
December 31, 2017
, the reserve for GMDB and GMIB was a liability of $23 million.
Equity Price Risk
The variable annuity guaranteed benefits guarantee payouts to the annuity holder under certain specific conditions regardless of the performance of the investment assets. For this reason, when equity prices decline, the returns from the separate account assets coupled with guaranteed benefit fees from annuity holders may not be sufficient to fund expected payouts. In that case, reserves must be increased with a negative impact to earnings.
The core derivative instruments with which we hedge the equity price risk of our GMWB and GMAB provisions are longer dated put and call options; these core instruments are supplemented with equity futures and total return swaps. See Note 16 to our Consolidated Financial Statements for further information on our derivative instruments.
Interest Rate Risk
The GMAB and the non-life contingent benefits associated with the GMWB provisions create embedded derivatives which are carried at fair value separately from the underlying host variable annuity contract. Changes in the fair value of the GMWB and GMAB liabilities are recorded through earnings with fair value calculated based on projected, discounted cash flows over the life of the contract, including projected, discounted benefits and fees. Increases in interest rates reduce the fair value of the GMWB and GMAB liabilities. The GMWB and GMAB interest rate exposure is hedged with a portfolio of longer dated put and call options, interest rate swaps and swaptions. We have entered into interest rate swaps according to risk exposures along maturities, thus creating both fixed rate payor and variable rate payor terms. If interest rates were to increase, we would have to pay more to the swap counterparty, and the fair value of our equity puts would decrease, resulting in a negative impact to our pretax income.
Fixed Annuities, Fixed Insurance and Fixed Portion of Variable Annuities and Variable Insurance Contracts
Our earnings from fixed deferred annuities, fixed insurance, and the fixed portion of variable annuities and variable insurance contracts are based upon the spread between rates earned on assets held and the rates at which interest is credited to accounts. We
89
primarily invest in fixed rate securities to fund the rate credited to clients. We guarantee an interest rate to the holders of these products. Investment assets and client liabilities generally differ as it relates to basis, repricing or maturity characteristics. Rates credited to clients’ accounts generally reset at shorter intervals than the yield on the underlying investments. Therefore, in an increasing interest rate environment, higher interest rates may be reflected in crediting rates to clients sooner than in rates earned on invested assets, which could result in a reduced spread between the two rates, reduced earned income and a negative impact on pretax income. However, the current low interest rate environment is resulting in interest rates below the level of some of our liability guaranteed minimum interest rates (“GMIRs”). Hence, a modest rise in interest rates would not necessarily result in changes to all the liability credited rates while projected asset purchases would capture the full increase in interest rates. This dynamic would result in widening spreads under a modestly rising rate scenario given the current relationship between the current level of interest rates and the underlying GMIRs on the business. Of the $29.9 billion in policyholder account balances, future policy benefits and claims on our Consolidated Balance Sheets at
December 31, 2017
, $19.0 billion is related to liabilities created by these products. We do not hedge this exposure.
As a result of the low interest rate environment, our current reinvestment yields are generally lower than the current portfolio yield. We expect our portfolio income yields to continue to decline in future periods if interest rates remain low. The carrying value and weighted average yield of non-structured fixed maturity securities and commercial mortgage loans that may generate proceeds to reinvest through 2019 due to prepayment, maturity or call activity at the option of the issuer, excluding securities with a make-whole provision, were $4.9 billion and 4.4%, respectively, as of
December 31, 2017
. In addition, residential mortgage backed securities, which are subject to prepayment risk as a result of the low interest rate environment, totaled $6.6 billion and had a weighted average yield of 2.8% as of
December 31, 2017
. While these amounts represent investments that could be subject to reinvestment risk, it is also possible that these investments will be used to fund liabilities or may not be prepaid and will remain invested at their current yields. In addition to the interest rate environment, the mix of benefit payments versus product sales as well as the timing and volumes associated with such mix may impact our investment yield. Furthermore, reinvestment activities and the associated investment yield may also be impacted by corporate strategies implemented at management’s discretion. The average yield for investment purchases during the year ended
December 31, 2017
was approximately 2.7%.
The reinvestment of proceeds from maturities, calls and prepayments at rates below the current portfolio yield, which may be below the level of some liability GMIRs, will have a negative impact to future operating results. To mitigate the unfavorable impact that the low interest rate environment has on our spread income, we assess reinvestment risk in our investment portfolio and monitor this risk in accordance with our asset/liability management framework. In addition, we may reduce the crediting rates on our fixed products when warranted, subject to guaranteed minimums.
The following table presents the account values of fixed deferred annuities, fixed insurance, and the fixed portion of variable annuities and variable insurance contracts by range of GMIRs and the range of the difference between rates credited to policyholders and contractholders as of
December 31, 2017
and the respective guaranteed minimums, as well as the percentage of account values subject to rate reset in the time period indicated. Rates are reset at our discretion, subject to guaranteed minimums.
|
Account Values with Crediting Rates
|
|||||||||||||||||||
|
At Guaranteed Minimum
|
1-49 bps above Guaranteed Minimum
|
50-99 bps above Guaranteed Minimum
|
100-150 bps above Guaranteed Minimum
|
Total
|
|||||||||||||||
|
(in billions, except percentages)
|
|||||||||||||||||||
|
Range of Guaranteed Minimum Crediting Rates
|
|||||||||||||||||||
|
1% - 1.99%
|
$
|
1.8
|
|
$
|
0.2
|
|
$
|
0.4
|
|
$
|
0.1
|
|
$
|
2.5
|
|
||||
|
2% - 2.99%
|
0.5
|
|
—
|
|
—
|
|
—
|
|
0.5
|
|
|||||||||
|
3% - 3.99%
|
8.7
|
|
—
|
|
—
|
|
—
|
|
8.7
|
|
|||||||||
|
4% - 5.00%
|
5.5
|
|
—
|
|
—
|
|
—
|
|
5.5
|
|
|||||||||
|
Total
|
$
|
16.5
|
|
$
|
0.2
|
|
$
|
0.4
|
|
$
|
0.1
|
|
$
|
17.2
|
|
||||
|
Percentage of Account Values That Reset In:
|
|||||||||||||||||||
|
Next 12 months
(1)
|
98
|
%
|
80
|
%
|
21
|
%
|
63
|
%
|
96
|
%
|
|||||||||
|
> 12 months to 24 months
(2)
|
2
|
|
1
|
|
17
|
|
32
|
|
2
|
|
|||||||||
|
> 24 months
(2)
|
—
|
|
19
|
|
62
|
|
5
|
|
2
|
|
|||||||||
|
Total
|
100
|
%
|
100
|
%
|
100
|
%
|
100
|
%
|
100
|
%
|
|||||||||
(1)
Includes contracts with annual discretionary crediting rate resets and contracts with twelve or less months until the crediting rate becomes discretionary on an annual basis.
(2)
Includes contracts with more than twelve months remaining until the crediting rate becomes an annual discretionary rate.
90
Equity Indexed Annuities
Our equity indexed annuity product is a single premium annuity issued with an initial term of seven years. The annuity guarantees the contractholder a minimum return of 3% on 90% of the initial premium or end of prior term accumulation value upon renewal plus a return that is linked to the performance of the S&P 500
®
Index. The equity-linked return is based on a participation rate initially set at between 50% and 90% of the S&P 500
®
Index, which is guaranteed for the initial seven-year term when the contract is held to full term. At
December 31, 2017
, we had $22 million in liabilities related to equity indexed annuities. We discontinued new sales of equity indexed annuities in 2007.
Equity Price Risk
The equity-linked return to investors creates equity price risk as the amount credited depends on changes in equity prices. To hedge this exposure, we purchase futures, which generate returns to replicate what we must credit to client accounts.
Interest Rate Risk
Most of the proceeds received from equity indexed annuities are invested in fixed income securities with the return on those investments intended to fund the 3% guarantee. We earn income from the difference between the return earned on invested assets and the 3% guarantee rate credited to customer accounts. The spread between return earned and amount credited is affected by changes in interest rates. This risk is not currently hedged and was immaterial at
December 31, 2017
.
Fixed Index Annuities
In November 2017, we began offering a fixed index annuity product which is a fixed annuity that includes an indexed account. The rate of interest credited above the minimum guarantee for funds allocated to the indexed account is linked to the performance of the specific index for the indexed account (subject to a cap). We offer S&P 500
®
Index and MSCI
®
EAFE Index account options. Both options offer two crediting durations, one-year and two-year. The contractholder may allocate all or a portion of the policy value to a fixed or indexed account. The contractholder can choose to add a GMWB for life rider for an additional fee. As of December 31, 2017, we had $2 million in liabilities related to fixed index annuities.
Equity Price Risk
The equity-linked return to investors creates equity price risk as the amount credited depends on changes in equity prices. Most of the proceeds received from fixed index annuities are invested in fixed income securities. To hedge the equity exposure, a portion of the investment earnings received from the fixed income securities is used to purchase call spreads and futures which generate returns to replicate what we must credit to client accounts.
Interest Rate Risk
As mentioned above, most of the proceeds received from fixed index annuities are invested in fixed income securities with the return on those investments intended to fund the purchase of call spreads. There are two risks relating to interest rates. First, we have the risk that investment returns are such that we do not have enough investment income to purchase the needed call spreads. Second, in the event the policy is surrendered, we pay out a book value surrender amount and there is a risk that we will incur a loss upon having to sell the fixed income securities backing the liability (if interest rates have risen). This risk is not currently hedged.
Brokerage Client Cash Balances
We pay interest on certain brokerage client cash balances and have the ability to reset these rates from time to time based on prevailing economic and business conditions. We earn revenue to fund the interest paid from interest-earning assets or fees from off-balance sheet deposits at FDIC insured institutions, which are indexed to short-term interest rates. In general, the change in interest paid lags the change in revenues earned.
Certificate Products
Fixed Rate Certificates
We have interest rate risk from our investment certificates generally ranging in amounts from $1,000 to $2 million with interest crediting rate terms ranging from three to 48 months. We guarantee an interest rate to the holders of these products. Payments collected from clients are primarily invested in fixed income securities to fund the client credited rate with the spread between the rate earned from investments and the rate credited to clients recorded as earned income. Client liabilities and investment assets generally differ as it relates to basis, repricing or maturity characteristics. Rates credited to clients generally reset at shorter intervals than the yield on underlying investments. This exposure is not currently hedged although we monitor our investment strategy and make modifications based on our changing liabilities and the expected interest rate environment. Of the $10.3 billion in customer deposits at
December 31, 2017
, $5.8 billion related to reserves for our fixed rate certificate products.
91
Stock Market Certificates
Stock market certificates are purchased for amounts generally from $1,000 to $2 million for terms of 52 weeks, 104 weeks or 156 weeks, which can be extended to a maximum of 15 years depending on the term. For each term the certificate holder can choose to participate 100% in any percentage increase in the S&P 500
®
Index up to a maximum return or choose partial participation in any increase in the S&P 500 Index plus a fixed rate of interest guaranteed in advance. If partial participation is selected, the total of equity-linked return and guaranteed rate of interest cannot exceed the maximum return. Liabilities for our stock market certificates are included in customer deposits on our Consolidated Balance Sheets. At
December 31, 2017
, we had $530 million in reserves related to stock market certificates. The equity-linked return to investors creates equity price risk exposure. We seek to minimize this exposure with purchased futures and call spreads that replicate what we must credit to client accounts. This risk continues to be fully hedged. Stock market certificates have some interest rate risk as changes in interest rates affect the fair value of the payout to be made to the certificate holder. This risk is not currently hedged and was immaterial at
December 31, 2017
.
Indexed Universal Life
IUL insurance is similar to UL in many regards, although the rate of credited interest above the minimum guarantee for funds allocated to an indexed account is linked to the performance of the specified index for the indexed account (subject to a cap and floor). We offer an S&P 500
®
Index account option and a blended multi-index account option comprised of the S&P 500 Index, the MSCI
®
EAFE Index and the MSCI EM Index. Both options offer two crediting durations, one-year and two-year. The policyholder may allocate all or a portion of the policy value to a fixed or any available indexed account. At
December 31, 2017
, we had $1.3 billion in liabilities related to the indexed accounts of IUL, with the vast majority in the S&P 500
®
Index account option.
Equity Price Risk
The equity-linked return to investors creates equity price risk as the amount credited depends on changes in equity prices. Most of the proceeds received from IUL insurance are invested in fixed income securities. To hedge the equity exposure, a portion of the investment earnings received from the fixed income securities is used to purchase call spreads which generate returns to replicate what we must credit to client accounts.
Interest Rate Risk
As mentioned above, most of the proceeds received from IUL insurance are invested in fixed income securities with the return on those investments intended to fund the purchase of call spreads. There are two risks relating to interest rates. First, we have the risk that investment returns are such that we do not have enough investment income to purchase the needed call spreads. Second, in the event the policy is surrendered we pay out a book value surrender amount and there is a risk that we will incur a loss upon having to sell the fixed income securities backing the liability (if interest rates have risen). This risk is not currently hedged.
Foreign Currency Risk
We have foreign currency risk through our net investment in foreign subsidiaries and our operations in foreign countries. We are primarily exposed to changes in British Pounds (“GBP”) related to our net investment in Threadneedle, which was 732 million GBP at
December 31, 2017
. Our primary exposure related to operations in foreign countries is to the GBP, the Euro and the Indian Rupee. We monitor the foreign exchange rates that we have exposure to and enter into foreign currency forward contracts to mitigate risk when economically prudent. At
December 31, 2017
, the notional value of outstanding contracts and our remaining foreign currency risk related to operations in foreign countries were not material.
The stated interest rate on the $2.9 billion of our senior unsecured notes is fixed. We entered into interest rate swap agreements to effectively convert the fixed interest rate on $0.7 billion of the senior unsecured notes to floating interest rates based on six-month LIBOR. We hedged the debt in part to better align the interest expense on debt with the interest earned on cash equivalents held on our Consolidated Balance Sheets. The net interest rate risk of these items is immaterial.
Credit Risk
We are exposed to credit risk within our investment portfolio, including our loan portfolio, and through our derivative and reinsurance activities. Credit risk relates to the uncertainty of an obligor’s continued ability to make timely payments in accordance with the contractual terms of the financial instrument or contract. We consider our total potential credit exposure to each counterparty and its affiliates to ensure compliance with pre-established credit guidelines at the time we enter into a transaction which would potentially increase our credit risk. These guidelines and oversight of credit risk are managed through a comprehensive enterprise risk management program that includes members of senior management.
92
We manage the risk of credit-related losses in the event of nonperformance by counterparties by applying disciplined fundamental credit analysis and underwriting standards, prudently limiting exposures to lower-quality, higher-yielding investments, and diversifying exposures by issuer, industry, region and underlying investment type. We remain exposed to occasional adverse cyclical economic downturns during which default rates may be significantly higher than the long-term historical average used in pricing.
We manage our credit risk related to over-the-counter derivatives by entering into transactions with creditworthy counterparties, maintaining collateral arrangements and through the use of master netting arrangements that provide for a single net payment to be made by one counterparty to another at each due date and upon termination. Generally, our current credit exposure on over-the-counter derivative contracts is limited to a derivative counterparty’s net positive fair value of derivative contracts after taking into consideration the existence of netting arrangements and any collateral received. This exposure is monitored and managed to an acceptable threshold level.
The counterparty risk for centrally cleared over-the-counter derivatives is transferred to a central clearing party through contract novation. Because the central clearing party monitors open positions and adjusts collateral requirements daily, we have minimal credit exposure from such derivative instruments.
Exchange-traded derivatives are effected through regulated exchanges that require contract standardization and initial margin to transact through the exchange. Because exchange-traded futures are marked to market and generally cash settled on a daily basis, we have minimal exposure to credit-related losses in the event of nonperformance by counterparties to such derivative instruments. Other exchange-traded derivatives would be exposed to nonperformance by counterparties for amounts in excess of initial margin requirements only if the exchange is unable to fulfill the contract.
We manage our credit risk related to reinsurance treaties by evaluating the financial condition of reinsurance counterparties prior to entering into new reinsurance treaties. In addition, we regularly evaluate their financial strength during the terms of the treaties. As of
December 31, 2017
, our largest reinsurance credit risk is related to a long term care coinsurance treaty with life insurance subsidiaries of Genworth Financial, Inc. See Note 7 to our Consolidated Financial Statements for additional information on reinsurance.
93
Ameriprise Financial, Inc.
Consolidated Financial Statements:
|
Report of Independent Registered Public Accounting Firm
|
|||
|
Consolidated Statements of Operations — Years Ended December 31, 2017, 2016 and 2015
|
|||
|
Consolidated Statements of Comprehensive Income — Years Ended December 31, 2017, 2016 and 2015
|
|||
|
Consolidated Balance Sheets — December 31, 2017 and 2016
|
|||
|
Consolidated Statements of Equity — Years Ended December 31, 2017, 2016 and 2015
|
|||
|
Consolidated Statements of Cash Flows — Years Ended December 31, 2017, 2016 and 2015
|
|||
|
Notes to Consolidated Financial Statements
|
|||
|
1.
|
Basis of Presentation
|
||
|
2.
|
Summary of Significant Accounting Policies
|
||
|
3.
|
Recent Accounting Pronouncements
|
||
|
4.
|
Variable Interest Entities
|
||
|
5.
|
Investments
|
||
|
6.
|
Financing Receivables
|
||
|
7.
|
Reinsurance
|
||
|
8.
|
Goodwill and Other Intangible Assets
|
||
|
9.
|
Deferred Acquisition Costs and Deferred Sales Inducement Costs
|
||
|
10.
|
Policyholder Account Balances, Future Policy Benefits and Claims and Separate Account Liabilities
|
||
|
11.
|
Variable Annuity and Insurance Guarantees
|
||
|
12.
|
Customer Deposits
|
||
|
13.
|
Debt
|
||
|
14.
|
Fair Values of Assets and Liabilities
|
||
|
15.
|
Offsetting Assets and Liabilities
|
||
|
16.
|
Derivatives and Hedging Activities
|
||
|
17.
|
Share-Based Compensation
|
||
|
18.
|
Shareholders’ Equity
|
||
|
19.
|
Earnings per Share Attributable to Ameriprise Financial, Inc. Common Shareholders
|
||
|
20.
|
Regulatory Requirements
|
||
|
21.
|
Income Taxes
|
||
|
22.
|
Retirement Plans and Profit Sharing Arrangements
|
||
|
23.
|
Commitments, Guarantees and Contingencies
|
||
|
24.
|
Related Party Transactions
|
||
|
25.
|
Segment Information
|
||
|
26.
|
Quarterly Financial Data (Unaudited)
|
||
94
Report of Independent Registered Public Accounting Firm
To the Board of Directors and Shareholders of Ameriprise Financial, Inc.
Opinions on the Financial Statements and Internal Control over Financial Reporting
We have audited the accompanying consolidated balance sheets of Ameriprise Financial, Inc. and its subsidiaries as of December 31, 2017 and 2016, and the related consolidated statements of operations, comprehensive income, equity and cash flows for each of the three years in the period ended December 31, 2017, including the related notes and the financial statement schedule listed in the index appearing under Item 15(a)(2) (collectively referred to as the “consolidated financial statements”). We also have audited the Company's internal control over financial reporting as of December 31, 2017, based on criteria established in
Internal Control - Integrated Framework
(2013) issued by the Committee of Sponsoring Organizations of the Treadway Commission (COSO).
In our opinion, the consolidated financial statements referred to above present fairly, in all material respects, the financial position of the Company as of December 31, 2017 and 2016, and the results of their operations and their cash flows for each of the three years in the period ended December 31, 2017 in conformity with accounting principles generally accepted in the United States of America. Also in our opinion, the Company maintained, in all material respects, effective internal control over financial reporting as of December 31, 2017, based on criteria established in
Internal Control - Integrated Framework
(2013) issued by the COSO.
Basis for Opinions
The Company's management is responsible for these consolidated financial statements, for maintaining effective internal control over financial reporting, and for its assessment of the effectiveness of internal control over financial reporting, included in Management's Report on Internal Control over Financial Reporting appearing under Item 9A. Our responsibility is to express opinions on the Company’s consolidated financial statements and on the Company's internal control over financial reporting based on our audits. We are a public accounting firm registered with the Public Company Accounting Oversight Board (United States) ("PCAOB") and are required to be independent with respect to the Company in accordance with the U.S. federal securities laws and the applicable rules and regulations of the Securities and Exchange Commission and the PCAOB.
We conducted our audits in accordance with the standards of the PCAOB. Those standards require that we plan and perform the audits to obtain reasonable assurance about whether the consolidated financial statements are free of material misstatement, whether due to error or fraud, and whether effective internal control over financial reporting was maintained in all material respects.
Our audits of the consolidated financial statements included performing procedures to assess the risks of material misstatement of the consolidated financial statements, whether due to error or fraud, and performing procedures that respond to those risks. Such procedures included examining, on a test basis, evidence regarding the amounts and disclosures in the consolidated financial statements. Our audits also included evaluating the accounting principles used and significant estimates made by management, as well as evaluating the overall presentation of the consolidated financial statements. Our audit of internal control over financial reporting included obtaining an understanding of internal control over financial reporting, assessing the risk that a material weakness exists, and testing and evaluating the design and operating effectiveness of internal control based on the assessed risk. Our audits also included performing such other procedures as we considered necessary in the circumstances. We believe that our audits provide a reasonable basis for our opinions.
Definition and Limitations of Internal Control over Financial Reporting
A company’s internal control over financial reporting is a process designed to provide reasonable assurance regarding the reliability of financial reporting and the preparation of financial statements for external purposes in accordance with generally accepted accounting principles. A company’s internal control over financial reporting includes those policies and procedures that (i) pertain to the maintenance of records that, in reasonable detail, accurately and fairly reflect the transactions and dispositions of the assets of the company; (ii) provide reasonable assurance that transactions are recorded as necessary to permit preparation of financial statements in accordance with generally accepted accounting principles, and that receipts and expenditures of the company are being made only in accordance with authorizations of management and directors of the company; and (iii) provide reasonable assurance regarding prevention or timely detection of unauthorized acquisition, use, or disposition of the company’s assets that could have a material effect on the financial statements.
Because of its inherent limitations, internal control over financial reporting may not prevent or detect misstatements. Also, projections of any evaluation of effectiveness to future periods are subject to the risk that controls may become inadequate because of changes in conditions, or that the degree of compliance with the policies or procedures may deteriorate.
/s/ PricewaterhouseCoopers LLP
Minneapolis, Minnesota
February 22, 2018
We have served as the Company’s auditor since 2010.
95
Ameriprise Financial, Inc.
|
Years Ended December 31,
|
|||||||||||
|
2017
|
2016
|
2015
|
|||||||||
|
(in millions, except per share amounts)
|
|||||||||||
|
Revenues
|
|
|
|
|
|
|
|||||
|
Management and financial advice fees
|
$
|
6,392
|
|
$
|
5,778
|
|
$
|
5,950
|
|
||
|
Distribution fees
|
1,770
|
|
1,795
|
|
1,847
|
|
|||||
|
Net investment income
|
1,509
|
|
1,576
|
|
1,688
|
|
|||||
|
Premiums
|
1,394
|
|
1,491
|
|
1,455
|
|
|||||
|
Other revenues
|
1,010
|
|
1,095
|
|
1,260
|
|
|||||
|
Total revenues
|
12,075
|
|
11,735
|
|
12,200
|
|
|||||
|
Banking and deposit interest expense
|
48
|
|
39
|
|
30
|
|
|||||
|
Total net revenues
|
12,027
|
|
11,696
|
|
12,170
|
|
|||||
|
Expenses
|
|
|
|
|
|
|
|||||
|
Distribution expenses
|
3,399
|
|
3,202
|
|
3,276
|
|
|||||
|
Interest credited to fixed accounts
|
656
|
|
623
|
|
668
|
|
|||||
|
Benefits, claims, losses and settlement expenses
|
2,233
|
|
2,646
|
|
2,261
|
|
|||||
|
Amortization of deferred acquisition costs
|
267
|
|
415
|
|
354
|
|
|||||
|
Interest and debt expense
|
207
|
|
241
|
|
387
|
|
|||||
|
General and administrative expense
|
3,051
|
|
2,977
|
|
3,082
|
|
|||||
|
Total expenses
|
9,813
|
|
10,104
|
|
10,028
|
|
|||||
|
Pretax income
|
2,214
|
|
1,592
|
|
2,142
|
|
|||||
|
Income tax provision
|
734
|
|
278
|
|
455
|
|
|||||
|
Net income
|
1,480
|
|
1,314
|
|
1,687
|
|
|||||
|
Less: Net income attributable to noncontrolling interests
|
—
|
|
—
|
|
125
|
|
|||||
|
Net income attributable to Ameriprise Financial
|
$
|
1,480
|
|
$
|
1,314
|
|
$
|
1,562
|
|
||
|
Earnings per share
|
|
|
|
|
|
|
|||||
|
Basic
|
$
|
9.60
|
|
$
|
7.90
|
|
$
|
8.60
|
|
||
|
Diluted
|
$
|
9.44
|
|
$
|
7.81
|
|
$
|
8.48
|
|
||
|
Cash dividends declared per common share
|
$
|
3.24
|
|
$
|
2.92
|
|
$
|
2.59
|
|
||
|
Supplemental Disclosures:
|
|
|
|
|
|
|
|||||
|
Total other-than-temporary impairment losses on securities
|
$
|
(1
|
)
|
$
|
(2
|
)
|
$
|
(8
|
)
|
||
|
Portion of loss recognized in other comprehensive income (before taxes)
|
—
|
|
1
|
|
—
|
|
|||||
|
Net impairment losses recognized in net investment income
|
$
|
(1
|
)
|
$
|
(1
|
)
|
$
|
(8
|
)
|
||
|
See Notes to Consolidated Financial Statements.
|
|||||||||||
96
Ameriprise Financial, Inc.
Consolidated Statements of Comprehensive Income
|
Years Ended December 31,
|
|||||||||||
|
2017
|
2016
|
2015
|
|||||||||
|
(in millions)
|
|||||||||||
|
Net income
|
$
|
1,480
|
|
$
|
1,314
|
|
$
|
1,687
|
|
||
|
Other comprehensive income (loss), net of tax:
|
|
|
|
|
|
|
|||||
|
Foreign currency translation adjustment
|
(8
|
)
|
(76
|
)
|
(90
|
)
|
|||||
|
Net unrealized gains (losses) on securities
|
7
|
|
47
|
|
(360
|
)
|
|||||
|
Net unrealized gains (losses) on derivatives
|
3
|
|
4
|
|
1
|
|
|||||
|
Defined benefit plans
|
28
|
|
(34
|
)
|
(20
|
)
|
|||||
|
Other
|
(1
|
)
|
—
|
|
—
|
|
|||||
|
Total other comprehensive income (loss), net of tax
|
29
|
|
(59
|
)
|
(469
|
)
|
|||||
|
Total comprehensive income
|
1,509
|
|
1,255
|
|
1,218
|
|
|||||
|
Less: Comprehensive income attributable to noncontrolling interests
|
—
|
|
—
|
|
65
|
|
|||||
|
Comprehensive income attributable to Ameriprise Financial
|
$
|
1,509
|
|
$
|
1,255
|
|
$
|
1,153
|
|
||
|
See Notes to Consolidated Financial Statements.
|
|||||||||||
97
Ameriprise Financial, Inc.
Consolidated Balance Sheets
|
|
December 31,
|
||||||
|
2017
|
2016
|
||||||
|
(in millions, except
share amounts)
|
|||||||
|
Assets
|
|
|
|
|
|||
|
Cash and cash equivalents
|
$
|
2,484
|
|
$
|
2,318
|
|
|
|
Cash of consolidated investment entities
|
136
|
|
168
|
|
|||
|
Investments
|
35,925
|
|
35,834
|
|
|||
|
Investments of consolidated investment entities, at fair value
|
2,131
|
|
2,254
|
|
|||
|
Separate account assets
|
87,368
|
|
80,210
|
|
|||
|
Receivables
|
5,760
|
|
5,299
|
|
|||
|
Receivables of consolidated investment entities, at fair value
|
25
|
|
11
|
|
|||
|
Deferred acquisition costs
|
2,676
|
|
2,648
|
|
|||
|
Restricted and segregated cash and investments
|
3,147
|
|
3,331
|
|
|||
|
Other assets
|
7,818
|
|
7,748
|
|
|||
|
Total assets
|
$
|
147,470
|
|
$
|
139,821
|
|
|
|
Liabilities and Equity
|
|
|
|
|
|||
|
Liabilities:
|
|
|
|
|
|||
|
Policyholder account balances, future policy benefits and claims
|
$
|
29,904
|
|
$
|
30,202
|
|
|
|
Separate account liabilities
|
87,368
|
|
80,210
|
|
|||
|
Customer deposits
|
10,303
|
|
10,036
|
|
|||
|
Short-term borrowings
|
200
|
|
200
|
|
|||
|
Long-term debt
|
2,891
|
|
2,917
|
|
|||
|
Debt of consolidated investment entities, at fair value
|
2,208
|
|
2,319
|
|
|||
|
Accounts payable and accrued expenses
|
1,960
|
|
1,727
|
|
|||
|
Other liabilities
|
6,575
|
|
5,823
|
|
|||
|
Other liabilities of consolidated investment entities, at fair value
|
63
|
|
95
|
|
|||
|
Total liabilities
|
141,472
|
|
133,529
|
|
|||
|
Equity:
|
|
|
|
|
|||
|
Ameriprise Financial, Inc.:
|
|
|
|
|
|||
|
Common shares ($.01 par value; shares authorized, 1,250,000,000; shares issued, 327,506,935 and 324,006,315, respectively)
|
3
|
|
3
|
|
|||
|
Additional paid-in capital
|
8,085
|
|
7,765
|
|
|||
|
Retained earnings
|
11,329
|
|
10,351
|
|
|||
|
Treasury shares, at cost (180,872,271 and 169,246,411 shares, respectively)
|
(13,648
|
)
|
(12,027
|
)
|
|||
|
Accumulated other comprehensive income, net of tax
|
229
|
|
200
|
|
|||
|
Total equity
|
5,998
|
|
6,292
|
|
|||
|
Total liabilities and equity
|
$
|
147,470
|
|
$
|
139,821
|
|
|
|
See Notes to Consolidated Financial Statements.
|
|||||||
98
Ameriprise Financial, Inc.
Consolidated Statements of Equity
|
Ameriprise Financial, Inc.
|
Non-controlling Interests
|
Total
|
|||||||||||||||||||||||||||||||||||||
|
Number of Outstanding Shares
|
Common Shares
|
Additional Paid-In Capital
|
Retained Earnings
|
Appropriated Retained Earnings of Consolidated Investment Entities
|
Treasury Shares
|
Accumulated Other Com-prehensive Income
|
Total Ameriprise Financial, Inc. Shareholders’ Equity
|
||||||||||||||||||||||||||||||||
|
(in millions, except share data)
|
|||||||||||||||||||||||||||||||||||||||
|
Balances at January 1, 2015
|
183,109,509
|
$
|
3
|
$
|
7,345
|
$
|
8,443
|
$
|
234
|
$
|
(8,589
|
)
|
$
|
662
|
$
|
8,098
|
$
|
1,181
|
$
|
9,279
|
|||||||||||||||||||
|
Comprehensive income:
|
|||||||||||||||||||||||||||||||||||||||
|
Net income
|
—
|
—
|
—
|
1,562
|
—
|
—
|
—
|
1,562
|
125
|
1,687
|
|||||||||||||||||||||||||||||
|
Other comprehensive loss, net of tax
|
—
|
—
|
—
|
—
|
—
|
—
|
(409
|
)
|
(409
|
)
|
(60
|
)
|
(469
|
)
|
|||||||||||||||||||||||||
|
Total comprehensive income
|
1,153
|
65
|
1,218
|
||||||||||||||||||||||||||||||||||||
|
Net loss reclassified to appropriated retained earnings
|
—
|
—
|
—
|
—
|
(97
|
)
|
—
|
—
|
(97
|
)
|
97
|
—
|
|||||||||||||||||||||||||||
|
Dividends to shareholders
|
—
|
—
|
—
|
(474
|
)
|
—
|
—
|
—
|
(474
|
)
|
—
|
(474
|
)
|
||||||||||||||||||||||||||
|
Noncontrolling interests investments in subsidiaries
|
—
|
—
|
—
|
—
|
—
|
—
|
—
|
—
|
255
|
255
|
|||||||||||||||||||||||||||||
|
Distributions to noncontrolling interests
|
—
|
—
|
—
|
—
|
—
|
—
|
—
|
—
|
(415
|
)
|
(415
|
)
|
|||||||||||||||||||||||||||
|
Repurchase of common shares
|
(14,951,703
|
)
|
—
|
—
|
—
|
—
|
(1,815
|
)
|
—
|
(1,815
|
)
|
—
|
(1,815
|
)
|
|||||||||||||||||||||||||
|
Share-based compensation plans
|
2,875,454
|
—
|
266
|
(6
|
)
|
—
|
66
|
—
|
326
|
5
|
331
|
||||||||||||||||||||||||||||
|
Balances at December 31, 2015
|
171,033,260
|
3
|
7,611
|
9,525
|
137
|
(10,338
|
)
|
253
|
7,191
|
1,188
|
8,379
|
||||||||||||||||||||||||||||
|
Cumulative effect of change in accounting policies
|
—
|
—
|
—
|
1
|
(137
|
)
|
—
|
6
|
(130
|
)
|
(1,188
|
)
|
(1,318
|
)
|
|||||||||||||||||||||||||
|
Comprehensive income:
|
|||||||||||||||||||||||||||||||||||||||
|
Net income
|
—
|
—
|
—
|
1,314
|
—
|
—
|
—
|
1,314
|
—
|
1,314
|
|||||||||||||||||||||||||||||
|
Other comprehensive loss, net of tax
|
—
|
—
|
—
|
—
|
—
|
—
|
(59
|
)
|
(59
|
)
|
—
|
(59
|
)
|
||||||||||||||||||||||||||
|
Total comprehensive income
|
1,255
|
—
|
1,255
|
||||||||||||||||||||||||||||||||||||
|
Dividends to shareholders
|
—
|
—
|
—
|
(489
|
)
|
—
|
—
|
—
|
(489
|
)
|
—
|
(489
|
)
|
||||||||||||||||||||||||||
|
Repurchase of common shares
|
(18,367,742
|
)
|
—
|
—
|
—
|
—
|
(1,751
|
)
|
—
|
(1,751
|
)
|
—
|
(1,751
|
)
|
|||||||||||||||||||||||||
|
Share-based compensation plans
|
2,094,386
|
—
|
154
|
—
|
—
|
62
|
—
|
216
|
—
|
216
|
|||||||||||||||||||||||||||||
|
Balances at December 31, 2016
|
154,759,904
|
3
|
7,765
|
10,351
|
—
|
(12,027
|
)
|
200
|
6,292
|
—
|
6,292
|
||||||||||||||||||||||||||||
|
Comprehensive income:
|
|||||||||||||||||||||||||||||||||||||||
|
Net income
|
—
|
—
|
—
|
1,480
|
—
|
—
|
—
|
1,480
|
—
|
1,480
|
|||||||||||||||||||||||||||||
|
Other comprehensive loss, net of tax
|
—
|
—
|
—
|
—
|
—
|
—
|
29
|
29
|
—
|
29
|
|||||||||||||||||||||||||||||
|
Total comprehensive income
|
1,509
|
—
|
1,509
|
||||||||||||||||||||||||||||||||||||
|
Dividends to shareholders
|
—
|
—
|
—
|
(502
|
)
|
—
|
—
|
—
|
(502
|
)
|
—
|
(502
|
)
|
||||||||||||||||||||||||||
|
Repurchase of common shares
|
(12,388,348
|
)
|
—
|
—
|
—
|
—
|
(1,675
|
)
|
—
|
(1,675
|
)
|
—
|
(1,675
|
)
|
|||||||||||||||||||||||||
|
Share-based compensation plans
|
4,263,108
|
—
|
320
|
—
|
—
|
54
|
—
|
374
|
—
|
374
|
|||||||||||||||||||||||||||||
|
Balances at December 31, 2017
|
146,634,664
|
$
|
3
|
$
|
8,085
|
$
|
11,329
|
$
|
—
|
$
|
(13,648
|
)
|
$
|
229
|
$
|
5,998
|
$
|
—
|
$
|
5,998
|
|||||||||||||||||||
|
See Notes to Consolidated Financial Statements.
|
|||||||||||||||||||||||||||||||||||||||
99
Ameriprise Financial, Inc.
|
Years Ended December 31,
|
|||||||||||
|
2017
|
2016
|
2015
|
|||||||||
|
(in millions)
|
|||||||||||
|
Cash Flows from Operating Activities
|
|||||||||||
|
Net income
|
$
|
1,480
|
|
$
|
1,314
|
|
$
|
1,687
|
|
||
|
Adjustments to reconcile net income to net cash provided by operating activities:
|
|||||||||||
|
Depreciation, amortization and accretion, net
|
234
|
|
248
|
|
248
|
|
|||||
|
Deferred income tax expense (benefit)
|
156
|
|
(34
|
)
|
(131
|
)
|
|||||
|
Share-based compensation
|
121
|
|
134
|
|
145
|
|
|||||
|
Net realized investment (gains) losses
|
(50
|
)
|
(16
|
)
|
(14
|
)
|
|||||
|
Net trading (gains) losses
|
(7
|
)
|
(6
|
)
|
(7
|
)
|
|||||
|
Loss from equity method investments
|
117
|
|
54
|
|
14
|
|
|||||
|
Other-than-temporary impairments and provision for loan losses
|
—
|
|
4
|
|
9
|
|
|||||
|
Net (gains) losses of consolidated investment entities
|
5
|
|
(38
|
)
|
(132
|
)
|
|||||
|
Changes in operating assets and liabilities:
|
|||||||||||
|
Restricted and segregated investments
|
(198
|
)
|
(24
|
)
|
(401
|
)
|
|||||
|
Deferred acquisition costs
|
(35
|
)
|
55
|
|
(7
|
)
|
|||||
|
Other investments, net
|
4
|
|
14
|
|
81
|
|
|||||
|
Policyholder account balances, future policy benefits and claims, net
|
(441
|
)
|
8
|
|
494
|
|
|||||
|
Derivatives, net of collateral
|
595
|
|
59
|
|
93
|
|
|||||
|
Receivables
|
(457
|
)
|
(150
|
)
|
(277
|
)
|
|||||
|
Brokerage deposits
|
(198
|
)
|
310
|
|
337
|
|
|||||
|
Accounts payable and accrued expenses
|
206
|
|
173
|
|
82
|
|
|||||
|
Investment properties of consolidated investment entities
|
—
|
|
—
|
|
(114
|
)
|
|||||
|
Other operating assets and liabilities of consolidated investment entities, net
|
—
|
|
(9
|
)
|
95
|
|
|||||
|
Other, net
|
169
|
|
257
|
|
489
|
|
|||||
|
Net cash provided by (used in) operating activities
|
1,701
|
|
2,353
|
|
2,691
|
|
|||||
|
Cash Flows from Investing Activities
|
|||||||||||
|
Available-for-Sale securities:
|
|||||||||||
|
Proceeds from sales
|
454
|
|
366
|
|
294
|
|
|||||
|
Maturities, sinking fund payments and calls
|
4,957
|
|
4,421
|
|
4,542
|
|
|||||
|
Purchases
|
(5,419
|
)
|
(6,498
|
)
|
(4,562
|
)
|
|||||
|
Proceeds from sales, maturities and repayments of mortgage loans
|
699
|
|
810
|
|
631
|
|
|||||
|
Funding of mortgage loans
|
(479
|
)
|
(451
|
)
|
(558
|
)
|
|||||
|
Proceeds from sales and collections of other investments
|
269
|
|
253
|
|
236
|
|
|||||
|
Purchase of other investments
|
(487
|
)
|
(291
|
)
|
(306
|
)
|
|||||
|
Purchase of investments by consolidated investment entities
|
(1,268
|
)
|
(845
|
)
|
(2,678
|
)
|
|||||
|
Proceeds from sales, maturities and repayments of investments by consolidated investment entities
|
1,349
|
|
1,421
|
|
2,009
|
|
|||||
|
Purchase of land, buildings, equipment and software
|
(162
|
)
|
(92
|
)
|
(133
|
)
|
|||||
|
Other, net
|
(112
|
)
|
101
|
|
16
|
|
|||||
|
Net cash provided by (used in) investing activities
|
$
|
(199
|
)
|
$
|
(805
|
)
|
$
|
(509
|
)
|
||
|
See Notes to Consolidated Financial Statements.
|
|||||||||||
100
Ameriprise Financial, Inc.
Consolidated Statements of Cash Flows (Continued)
|
Years Ended December 31,
|
||||||||||||
|
2017
|
2016
|
2015
|
||||||||||
|
(in millions)
|
||||||||||||
|
Cash Flows from Financing Activities
|
||||||||||||
|
Investment certificates:
|
||||||||||||
|
Proceeds from additions
|
$
|
4,725
|
|
$
|
4,250
|
|
$
|
3,139
|
|
|||
|
Maturities, withdrawals and cash surrenders
|
(4,262
|
)
|
(3,155
|
)
|
(2,509
|
)
|
||||||
|
Policyholder account balances:
|
||||||||||||
|
Deposits and other additions
|
2,059
|
|
2,086
|
|
2,061
|
|
||||||
|
Net transfers to (from) separate accounts
|
(157
|
)
|
127
|
|
(171
|
)
|
||||||
|
Surrenders and other benefits
|
(1,893
|
)
|
(1,932
|
)
|
(2,714
|
)
|
||||||
|
Cash paid for purchased options with deferred premiums
|
(282
|
)
|
(341
|
)
|
(392
|
)
|
||||||
|
Cash received from purchased options with deferred premiums
|
116
|
|
276
|
|
16
|
|
||||||
|
Issuance of long-term debt, net of issuance costs
|
—
|
|
496
|
|
—
|
|
||||||
|
Repayments of long-term debt
|
(11
|
)
|
(257
|
)
|
(409
|
)
|
||||||
|
Change in short-term borrowings, net
|
—
|
|
(1
|
)
|
(1
|
)
|
||||||
|
Dividends paid to shareholders
|
(491
|
)
|
(479
|
)
|
(465
|
)
|
||||||
|
Repurchase of common shares
|
(1,485
|
)
|
(1,707
|
)
|
(1,741
|
)
|
||||||
|
Exercise of stock options
|
15
|
|
9
|
|
16
|
|
||||||
|
Borrowings by consolidated investment entities
|
—
|
|
—
|
|
1,650
|
|
||||||
|
Repayments of debt by consolidated investment entities
|
(118
|
)
|
(517
|
)
|
(719
|
)
|
||||||
|
Noncontrolling interests investments in subsidiaries
|
—
|
|
—
|
|
255
|
|
||||||
|
Distributions to noncontrolling interests
|
—
|
|
—
|
|
(415
|
)
|
||||||
|
Other, net
|
(1
|
)
|
3
|
|
3
|
|
||||||
|
Net cash provided by (used in) financing activities
|
(1,785
|
)
|
(1,142
|
)
|
(2,396
|
)
|
||||||
|
Effect of exchange rate changes on cash
|
35
|
|
(75
|
)
|
(21
|
)
|
||||||
|
Net increase (decrease) in cash, cash equivalents and restricted cash
|
(248
|
)
|
331
|
|
(235
|
)
|
||||||
|
Cash, cash equivalents and restricted cash at beginning of period
|
5,392
|
|
5,407
|
|
5,642
|
|
||||||
|
Net cash outflows upon the deconsolidation of VIEs
|
—
|
|
(346
|
)
|
—
|
|
||||||
|
Cash, cash equivalents and restricted cash at end of period
|
$
|
5,144
|
|
$
|
5,392
|
|
$
|
5,407
|
|
|||
|
Supplemental Disclosures:
|
||||||||||||
|
Interest paid excluding consolidated investment entities
|
$
|
181
|
|
$
|
163
|
|
$
|
186
|
|
|||
|
Interest paid by consolidated investment entities
|
88
|
|
127
|
|
257
|
|
||||||
|
Income taxes paid, net
|
418
|
|
155
|
|
439
|
|
||||||
|
Non-cash investing activity:
|
||||||||||||
|
Partnership commitments not yet remitted
|
9
|
|
108
|
|
45
|
|
||||||
|
December 31,
2017 |
December 31, 2016
|
|||||||||||
|
(in millions)
|
||||||||||||
|
Reconciliation of cash, cash equivalents and restricted cash:
|
||||||||||||
|
Cash and cash equivalents
|
$
|
2,484
|
|
$
|
2,318
|
|
||||||
|
Cash of consolidated investment entities
|
136
|
|
168
|
|
||||||||
|
Restricted and segregated cash and investments
|
3,147
|
|
3,331
|
|
||||||||
|
Less: Restricted and segregated investments
|
(623
|
)
|
(425
|
)
|
||||||||
|
Total cash, cash equivalents and restricted cash per consolidated statements of cash flows
|
$
|
5,144
|
|
$
|
5,392
|
|
||||||
|
See Notes to Consolidated Financial Statements.
|
||||||||||||
101
Notes to Consolidated Financial Statements
1.
Basis of Presentation
Ameriprise Financial, Inc. is a holding company, which primarily conducts business through its subsidiaries to provide financial planning, products and services that are designed to be utilized as solutions for clients’ cash and liquidity, asset accumulation, income, protection and estate and wealth transfer needs. The foreign operations of Ameriprise Financial, Inc. are conducted primarily through Threadneedle Asset Management Holdings Sàrl and Ameriprise Asset Management Holdings GmbH (collectively, “Threadneedle”).
The accompanying Consolidated Financial Statements include the accounts of Ameriprise Financial, Inc., companies in which it directly or indirectly has a controlling financial interest and variable interest entities (“VIEs”) in which it is the primary beneficiary (collectively, the “Company”). All intercompany transactions and balances have been eliminated in consolidation. Effective January 1, 2016, the Company adopted ASU 2015-02 - Consolidation: Amendments to the Consolidation Analysis (“ASU 2015-02”) and deconsolidated several collateralized loan obligations (“CLOs”) and all previously consolidated property funds. The income or loss generated by consolidated entities which will not be realized by the Company’s shareholders is attributed to noncontrolling interests in the Consolidated Statements of Operations. Noncontrolling interests are the ownership interests in subsidiaries not attributable, directly or indirectly, to Ameriprise Financial, Inc. and are classified as equity within the Consolidated Balance Sheets. The Company, excluding noncontrolling interests, is defined as “Ameriprise Financial.” Upon adoption of ASU 2015-02, the Company no longer has noncontrolling interests primarily due to the deconsolidation of property funds. See Note 3 and Note 4 for additional information on recently adopted accounting pronouncements and VIEs.
The accompanying Consolidated Financial Statements are prepared in accordance with U.S. generally accepted accounting principles (“GAAP”). The Company evaluated events or transactions that may have occurred after the balance sheet date for potential recognition or disclosure through the date the financial statements were issued.
In 2017, the Company recorded the following out-of-period corrections:
|
•
|
an
$87 million
decrease to other comprehensive income (“OCI”) related to deferred taxes on currency translations adjustments.
|
|
•
|
a
$12 million
out-of-period correction related to a variable annuity model assumption that decreased amortization of deferred acquisition costs (“DAC”) by
$8 million
and decreased benefits, claims, losses and settlement expenses by
$4 million
.
|
|
•
|
a
$20 million
decrease to income tax provision for a reversal of a tax reserve.
|
In 2016, the Company recorded a
$29 million
increase to long term care (“LTC”) reserves for an out-of-period correction related to its claim utilization factor.
In 2015, the Company recorded a capital lease that had previously been incorrectly recorded as an operating lease for Ameriprise Financial Center. The cumulative adjustment included a capital lease asset of
$70 million
, net of accumulated depreciation, and a related capital lease obligation of
$60 million
and a
$10 million
increase in pretax income. The lease term for the Ameriprise Financial Center began in November 2000 and extends for 20 years, with several options to extend the term.
The impact of these out-of-period corrections was not material to current or prior period financial statements.
2.
Summary of Significant Accounting Policies
Principles of Consolidation
A VIE is an entity that either has equity investors that lack certain essential characteristics of a controlling financial interest (including substantive voting rights, the obligation to absorb the entity’s losses, or the rights to receive the entity’s returns) or has equity investors that do not provide sufficient financial resources for the entity to support its activities.
Voting interest entities (“VOEs”) are those entities that do not qualify as a VIE. The Company consolidates VOEs in which it holds a greater than
50%
voting interest. The Company generally accounts for entities using the equity method when it holds a greater than
20%
but less than
50%
voting interest or when the Company exercises significant influence over the entity. All other investments that are not reported at fair value as trading or Available-for-Sale securities are accounted for under the cost method when the Company owns less than a
20%
voting interest and does not exercise significant influence.
A VIE is consolidated by the reporting entity that determines it has both:
|
•
|
the power to direct the activities of the VIE that most significantly impact the VIE’s economic performance; and
|
|
•
|
the obligation to absorb potentially significant losses or the right to receive potentially significant benefits to the VIE.
|
All VIEs are assessed for consolidation under this framework. When evaluating entities for consolidation, the Company considers its contractual rights in determining whether it has the power to direct the activities of the VIE that most significantly impact the VIEs economic performance. In determining whether the Company has this power, it considers whether it is acting in a role that enables it to direct the activities that most significantly impact the economic performance of an entity or if it is acting in an agent role.
In determining whether the Company has the obligation to absorb losses of the VIE or the right to receive benefits from the VIE that could potentially be significant to the VIE, the Company considers an analysis of its rights to receive benefits such as investment returns and its obligation to absorb losses associated with any investment in the VIE in conjunction with other qualitative factors. Management and incentive fees that are at market and commensurate with the level of services provided, and where the Company
102
does not hold other interests in the VIE that would absorb more than an insignificant amount of the VIE’s expected losses or receive more than an insignificant amount of the VIE’s expected residual returns, are not considered a variable interest and are excluded from the analysis.
The consolidation guidance has a scope exception for reporting entities with interests in registered money market funds which do not have an explicit support agreement.
Foreign Currency Translation
Net assets of foreign subsidiaries, whose functional currency is other than the U.S. dollar, are translated into U.S. dollars based upon exchange rates prevailing at the end of each period. Revenues and expenses are translated at daily exchange rates during the period. The resulting translation adjustment, along with any related hedge and tax effects, are included in accumulated other comprehensive income (“AOCI”). The determination of the functional currency is based on the primary economic and other management indicators. Gains and losses from foreign currency transactions are included in the consolidated results of operations.
Amounts Based on Estimates and Assumptions
Accounting estimates are an integral part of the Consolidated Financial Statements. In part, they are based upon assumptions concerning future events. Among the more significant are those that relate to investment securities valuation and recognition of other-than-temporary impairments, DAC and the corresponding recognition of DAC amortization, valuation of derivative instruments and hedging activities, litigation and claims reserves and income taxes and the recognition of deferred
tax
assets
and
liabilities.
These
accounting
estimates
reflect
the
best
judgment
of
management
and
actual
results could
differ.
Cash and Cash Equivalents
Cash equivalents include time deposits and other highly liquid investments with original or remaining maturities at the time of purchase of 90 days or less.
Investments
Available-for-Sale Securities
Available-for-Sale securities are carried at fair value with unrealized gains (losses) recorded in AOCI, net of impacts to DAC, deferred sales inducement costs (“DSIC”), unearned revenue, benefit reserves, reinsurance recoverables and income taxes. Gains and losses are recognized on a trade date basis in the Consolidated Statements of Operations upon disposition of the securities.
When the fair value of an investment is less than its amortized cost, the Company assesses whether or not: (i) it has the intent to sell the security (made a decision to sell) or (ii) it is more likely than not that the Company will be required to sell the security before its anticipated recovery. If either of these conditions exist, an other-than-temporary impairment is considered to have occurred and the Company recognizes an other-than-temporary impairment for the difference between the investment’s amortized cost and its fair value through earnings. For securities that do not meet the above criteria and the Company does not expect to recover a security’s amortized cost, the security is also considered other-than-temporarily impaired. For these securities, the Company separates the total impairment into the credit loss component and the amount of the loss related to other factors. The amount of the total other-than-temporary impairment related to credit loss is recognized in earnings. The amount of the total other-than-temporary impairment related to other factors is recognized in OCI, net of impacts to DAC, DSIC, unearned revenue, benefit reserves, reinsurance recoverables and income taxes. For Available-for-Sale securities that have recognized an other-than-temporary impairment through earnings, the difference between the amortized cost and the cash flows expected to be collected is accreted as interest income if through subsequent evaluation there is a sustained increase in the cash flow expected. Subsequent increases and decreases in the fair value of Available-for-Sale securities are included in OCI.
The Company provides a supplemental disclosure on the face of its Consolidated Statements of Operations that presents: (i) total other-than-temporary impairment losses recognized during the period and (ii) the portion of other-than-temporary impairment losses recognized in OCI. The sum of these amounts represents the credit-related portion of other-than-temporary impairments that were recognized in earnings during the period. The portion of other-than-temporary losses recognized in OCI includes: (i) the portion of other-than-temporary impairment losses related to factors other than credit recognized during the period and (ii) reclassifications of other-than-temporary impairment losses previously determined to be related to factors other than credit that are determined to be credit-related in the current period. The amount presented on the Consolidated Statements of Operations as the portion of other-than-temporary losses recognized in OCI excludes subsequent increases and decreases in the fair value of these securities.
For all securities that are considered temporarily impaired, the Company does not intend to sell these securities (has not made a decision to sell) and it is not more likely than not that the Company will be required to sell the security before recovery of its amortized cost basis. The Company believes that it will collect all principal and interest due on all investments that have amortized cost in excess of fair value that are considered only temporarily impaired.
Factors the Company considers in determining whether declines in the fair value of fixed maturity securities are other-than-temporary include: (i) the extent to which the market value is below amortized cost; (ii) the duration of time in which there has been a significant decline in value; (iii) fundamental analysis of the liquidity, business prospects and overall financial condition of the issuer; and (iv) market events that could impact credit ratings, economic and business climate, litigation and government actions, and similar external business factors. In order to determine the amount of the credit loss component for corporate debt securities considered other-
103
than-temporarily impaired, a best estimate of the present value of cash flows expected to be collected discounted at the security’s effective interest rate is compared to the amortized cost basis of the security. The significant inputs to cash flow projections consider potential debt restructuring terms, projected cash flows available to pay creditors and the Company’s position in the debtor’s overall capital structure.
For structured investments (e.g., residential mortgage backed securities, commercial mortgage backed securities, asset backed securities and other structured investments), the Company also considers factors such as overall deal structure and its position within the structure, quality of underlying collateral, delinquencies and defaults, loss severities, recoveries, prepayments and cumulative loss projections in assessing potential other-than-temporary impairments of these investments. Based upon these factors, securities that have indicators of potential other-than-temporary impairment are subject to detailed review by management. Securities for which declines are considered temporary continue to be monitored by management until management determines there is no current risk of an other-than-temporary impairment.
Other Investments
Other investments primarily reflect the Company’s interests in affordable housing partnerships, trading securities, seed money investments and syndicated loans. Affordable housing partnerships and seed money investments are accounted for under the equity method. Trading securities primarily include common stocks and trading bonds. Trading securities are carried at fair value with unrealized and realized gains (losses) recorded within net investment income.
Financing Receivables
Commercial Mortgage Loans, Syndicated Loans, and Consumer Loans
Commercial mortgage loans, syndicated loans and consumer loans are reflected within investments at amortized cost less the allowance for loan losses. Syndicated loans represent the Company’s investment in below investment grade loan syndications. Consumer loans primarily consisted of residential mortgage loans at December 31, 2016. Interest income is accrued on the unpaid principal balances of the loans as earned.
Other Loans
Other loans consist of policy and certificate loans, advisor loans and brokerage margin loans. When originated, policy and certificate loan balances do not exceed the cash surrender value of the underlying products. As there is minimal risk of loss related to policy and certificate loans, the Company does not record an allowance for loan losses. Policy and certificate loans are reflected within investments at the unpaid principal balance, plus accrued interest.
The Company offers loans to financial advisors primarily for recruiting, transitional cost assistance and retention purposes.
These loans are generally repaid over a five to nine-year period.
Advisor loans are recorded within receivables at principal less an allowance for loan losses. Interest income is recognized as earned and reflected in other revenues. R
ecoverability of these loans is assessed through analysis of financial advisor retention, loan collection and other criteria. In the event that the financial advisor is no longer affiliated with the Company, any unpaid balance of such loan becomes immediately due.
The Company’s broker dealer subsidiaries enter into lending arrangements with clients through the normal course of business, which are primarily based on customer margin levels. Margin loans are reported at the unpaid principal balance within receivables. The Company monitors the market value of collateral supporting the margin loans and requests additional collateral when necessary in order to mitigate the risk of loss. As there is minimal risk of loss related to margin loans, the allowance for loan losses is immaterial.
Nonaccrual Loans
Generally, loans are evaluated for or placed on nonaccrual status when either the collection of interest or principal has become
90 days
past due or is otherwise considered doubtful of collection. When a loan is placed on nonaccrual status, unpaid accrued interest is reversed. Interest payments received on loans on nonaccrual status are generally applied to principal unless the remaining principal balance has been determined to be fully collectible.
Revolving unsecured consumer lines are charged off at 180 days past due. Closed-end consumer loans, other than loans secured by one to four family properties, are charged off at 120 days past due and are generally not placed on nonaccrual status. Loans secured by one to four family properties are impaired when management determines the assets are uncollectible and commences foreclosure proceedings on the property, at which time the loan is written down to fair value less selling costs and recorded as real estate owned in other assets. Commercial mortgage loans are evaluated for impairment when the loan is considered for nonaccrual status, restructured or foreclosure proceedings are initiated on the property. If it is determined that the fair value is less than the current loan balance, it is written down to fair value less selling costs. Foreclosed property is recorded as real estate owned in other assets. Syndicated loans are placed on nonaccrual status when management determines it will not collect all contractual principal and interest on the loan.
Allowance for Loan Losses
Management determines the adequacy of the allowance for loan losses based on the overall loan portfolio composition, recent and historical loss experience, and other pertinent factors, including when applicable, internal risk ratings, loan-to-value (“LTV”) ratios, FICO scores of the borrower, debt service coverage and occupancy rates, along with economic and market conditions. This evaluation is inherently subjective as it requires estimates, which may be susceptible to significant change.
104
The Company determines the amount of the allowance based on management’s assessment of relative risk characteristics of the loan portfolio. The allowance is recorded for homogeneous loan categories on a pool basis, based on an analysis of product mix and risk characteristics of the portfolio, including geographic concentration, bankruptcy experiences, and historical losses, adjusted for current trends and market conditions.
While the Company attributes portions of the allowance to specific loan pools as part of the allowance estimation process, the entire allowance is available to absorb losses inherent in the total loan portfolio. The allowance is increased through provisions charged to net investment income and reduced/increased by net charge-offs/recoveries.
In determining the allowance for loan losses for advisor loans, the Company considers its historical collection experience as well as other factors including amounts due at termination, the reasons for the terminated relationship, length of time since termination, and the former financial advisor’s overall financial position. Concerns regarding the recoverability of these loans primarily arise in the event that the financial advisor is no longer affiliated with the Company. When the review of these factors indicates that further collection activity is highly unlikely, the outstanding balance of the loan is written-off and the related allowance is reduced. The provision for loan losses on advisor loans is recorded in distribution expenses.
Impaired Loans
The Company considers a loan to be impaired when, based on current information and events, it is probable the Company will not be able to collect all amounts due (both interest and principal) according to the contractual terms of the loan agreement. Impaired loans may also include loans that have been modified in troubled debt restructurings as a concession to borrowers experiencing financial difficulties. Management evaluates for impairment all restructured loans and loans with higher impairment risk factors. Factors used by the Company to determine whether all amounts due on commercial mortgage loans will be collected, include but are not limited to, the financial condition of the borrower, performance of the underlying properties, collateral and/or guarantees on the loan, and the borrower’s estimated future ability to pay based on property type and geographic location. The evaluation of impairment on consumer loans is primarily driven by delinquency status of individual loans. The impairment recognized is measured as the excess of the loan’s recorded investment over: (i) the present value of its expected principal and interest payments discounted at the loan’s effective interest rate, (ii) the fair value of collateral or (iii) the loan’s observable market price.
Restructured Loans
A loan is classified as a restructured loan when the Company makes certain concessionary modifications to contractual terms for borrowers experiencing financial difficulties. When the interest rate, minimum payments, and/or due dates have been modified in an attempt to make the loan more affordable to a borrower experiencing financial difficulties, the modification is considered a troubled debt restructuring. Generally, performance prior to the restructuring or significant events that coincide with the restructuring are considered in assessing whether the borrower can meet the new terms which may result in the loan being returned to accrual status at the time of the restructuring or after a performance period. If the borrower’s ability to meet the revised payment schedule is not reasonably assured, the loan remains on nonaccrual status.
Separate Account Assets and Liabilities
Separate account assets and liabilities are primarily funds held for the benefit of variable annuity contractholders and variable life insurance policyholders, who have a contractual right to receive the benefits of their contract or policy and bear the related investment risk. Gains and losses on separate account assets accrue directly to the contractholder or policyholder and are not reported in the Company’s Consolidated Statements of Operations. Separate account assets are recorded at fair value. Changes in the fair value of separate account assets are offset by changes in the related separate account liabilities.
Included in separate account assets and liabilities is the fair value of the pooled pension funds that are offered by Threadneedle.
Restricted and Segregated Cash and Investments
Amounts segregated under federal and other regulations are held in special reserve bank accounts for the exclusive benefit of the Company’s brokerage customers.
Land, Buildings, Equipment and Software
Land, buildings, equipment and internally developed or purchased software are carried at cost less accumulated depreciation or amortization and are reflected within other assets. The Company uses the straight-line method of depreciation and amortization over periods ranging from
three
to
39
years. At
December 31, 2017
and
2016
, land, buildings, equipment and software were
$626 million
and
$607 million
, respectively, net of accumulated depreciation of
$1.9 billion
and
$1.8 billion
, respectively. Depreciation and amortization expense for the years ended
December 31, 2017
,
2016
and
2015
was
$141 million
,
$149 million
and
$150 million
, respectively. Capitalized lease assets, net of accumulated depreciation, are included in land, buildings, equipment and software, and capital lease obligations are included in long-term debt.
Goodwill and Other Intangible Assets
Goodwill represents the amount of an acquired company’s acquisition cost in excess of the fair value of assets acquired and liabilities assumed. The Company evaluates goodwill for impairment annually on the measurement date of July 1 and whenever events and circumstances indicate that an impairment may have occurred, such as a significant adverse change in the business climate or a decision to sell or dispose of a reporting unit. Impairment is the amount carrying value exceeds fair value and is evaluated at the
105
reporting unit level. The Company assesses various qualitative factors to determine whether impairment is likely to have occurred. If impairment were to occur, the Company would use the discounted cash flow method, a variation of the income approach.
Intangible assets are amortized over their estimated useful lives unless they are deemed to have indefinite useful lives. The Company evaluates the definite lived intangible assets remaining useful lives annually and tests for impairment whenever events and circumstances indicate that an impairment may have occurred, such as a significant adverse change in the business climate. For definite lived intangible assets, impairment to fair value is recognized if the carrying amount is not recoverable. Indefinite lived intangibles are also tested for impairment annually or whenever circumstances indicate an impairment may have occurred.
Goodwill and other intangible assets are reflected in other assets.
Derivative Instruments and Hedging Activities
Freestanding derivative instruments are recorded at fair value and are reflected in other assets or other liabilities. The Company’s policy is to not offset fair value amounts recognized for derivatives and collateral arrangements executed with the same counterparty under the same master netting arrangement. The accounting for changes in the fair value of a derivative instrument depends on its intended use and the resulting hedge designation, if any. The Company primarily uses derivatives as economic hedges that are not designated as accounting hedges or do not qualify for hedge accounting treatment. The Company occasionally designates derivatives as (i) hedges of changes in the fair value of assets, liabilities, or firm commitments (“fair value hedges”), (ii) hedges of a forecasted transaction or of the variability of cash flows to be received or paid related to a recognized asset or liability (“cash flow hedges”), or (iii) hedges of foreign currency exposures of net investments in foreign operations (“net investment hedges in foreign operations”).
Derivative instruments that are entered into for hedging purposes are designated as such at the time the Company enters into the contract. For all derivative instruments that are designated for hedging activities, the Company documents all of the hedging relationships between the hedge instruments and the hedged items at the inception of the relationships. Management also documents its risk management objectives and strategies for entering into the hedge transactions. The Company assesses, at inception and on a quarterly basis, whether derivatives designated as hedges are highly effective in offsetting the fair value or cash flows of hedged items. If it is determined that a derivative is no longer highly effective as a hedge, the Company will discontinue the application of hedge accounting.
For derivative instruments that do not qualify for hedge accounting or are not designated as accounting hedges, changes in fair value are recognized in current period earnings. Changes in fair value of derivatives are presented in the Consolidated Statements of Operations based on the nature and use of the instrument. Changes in fair value of derivatives used as economic hedges are presented in the Consolidated Statements of Operations with the corresponding change in the hedged asset or liability.
For derivative instruments that qualify as fair value hedges, changes in the fair value of the derivatives, as well as changes in the fair value of the hedged assets, liabilities or firm commitments, are recognized on a net basis in current period earnings. The carrying value of the hedged item is adjusted for the change in fair value from the designated hedged risk. If a fair value hedge designation is removed or the hedge is terminated prior to maturity, previous adjustments to the carrying value of the hedged item are recognized into earnings over the remaining life of the hedged item.
For derivative instruments that qualify as cash flow hedges, the effective portion of the gain or loss on the derivative instruments is reported in AOCI and reclassified into earnings when the hedged item or transaction impacts earnings. The amount that is reclassified into earnings is presented in the Consolidated Statements of Operations with the hedged instrument or transaction impact. Any ineffective portion of the gain or loss is reported in current period earnings as a component of net investment income. If a hedge designation is removed or a hedge is terminated prior to maturity, the amount previously recorded in AOCI is reclassified to earnings over the period that the hedged item impacts earnings. For hedge relationships that are discontinued because the forecasted transaction is not expected to occur according to the original strategy, any related amounts previously recorded in AOCI are recognized in earnings immediately.
For derivative instruments that qualify as net investment hedges in foreign operations, the effective portion of the change in fair value of the derivatives is recorded in AOCI as part of the foreign currency translation adjustment. Any ineffective portion of the net investment hedges in foreign operations is recognized in net investment income during the period of change.
The equity component of indexed annuities, indexed universal life (“IUL”) and stock market certificate obligations are considered embedded derivatives. Additionally, certain annuities contain guaranteed minimum accumulation benefit (“GMAB”) and guaranteed minimum withdrawal benefit (“GMWB”) provisions. The GMAB and the non-life contingent benefits associated with GMWB provisions are also considered embedded derivatives.
See Note 14 for information regarding the Company’s fair value measurement of derivative instruments and Note 16 for the impact of derivatives on the Consolidated Statements of Operations.
Deferred Acquisition Costs
The Company incurs costs in connection with acquiring new and renewal insurance and annuity businesses. The portion of these costs which are incremental and direct to the acquisition of a new or renewal insurance policy or annuity contract are deferred. Significant costs capitalized include sales based compensation related to the acquisition of new and renewal insurance policies and annuity contracts, medical inspection costs for successful sales, and a portion of employee compensation and benefit costs based upon the
106
amount of time spent on successful sales. Sales based compensation paid to advisors and employees and third-party distributors is capitalized. Employee compensation and benefits costs which are capitalized relate primarily to sales efforts, underwriting and processing. All other costs which are not incremental direct costs of acquiring an insurance policy or annuity contract are expensed as incurred. The DAC associated with insurance policies or annuity contracts that are significantly modified or internally replaced with another contract are accounted for as contract terminations. These transactions are anticipated in establishing amortization periods and other valuation assumptions.
The Company monitors other DAC amortization assumptions, such as persistency, mortality, morbidity, interest margin, variable annuity benefit utilization and maintenance expense levels each quarter and, when assessed independently, each could impact the Company’s DAC balances.
The analysis of DAC balances and the corresponding amortization is a dynamic process that considers all relevant factors and assumptions described previously. Unless the Company’s management identifies a significant deviation over the course of the quarterly monitoring, management reviews and updates these DAC amortization assumptions annually in the third quarter of each year.
Non-Traditional Long-Duration Products
For non-traditional long-duration products (including variable and fixed deferred annuity contracts, universal life (“UL”) and variable universal life (“VUL”) insurance products), DAC are amortized based on projections of estimated gross profits (“EGPs”) over amortization periods equal to the approximate life of the business.
EGPs vary based on persistency rates (assumptions at which contractholders and policyholders are expected to surrender, make withdrawals from and make deposits to their contracts), mortality levels, client asset value growth rates (based on equity and bond market performance), variable annuity benefit utilization and interest margins (the spread between earned rates on invested assets and rates credited to contractholder and policyholder accounts) and are management’s best estimates. Management regularly monitors financial market conditions and actual contractholder and policyholder behavior experience and compares them to its assumptions. These assumptions are updated whenever it appears that earlier estimates should be revised. When assumptions are changed, the percentage of EGPs used to amortize DAC might also change. A change in the required amortization percentage is applied retrospectively; an increase in amortization percentage will result in a decrease in the DAC balance and an increase in DAC amortization expense, while a decrease in amortization percentage will result in an increase in the DAC balance and a decrease in DAC amortization expense. The impact on results of operations of changing assumptions can be either positive or negative in any particular period and is reflected in the period in which such changes are made. At each balance sheet date, the DAC balance is adjusted for the effect that would result from the realization of unrealized gains or losses impacting EGPs, with the related change recognized through AOCI.
The client asset value growth rates are the rates at which variable annuity and VUL insurance contract values invested in separate accounts are assumed to appreciate in the future. The rates used vary by equity and fixed income investments. Management reviews and, where appropriate, adjusts its assumptions with respect to client asset value growth rates on a regular basis. The Company typically uses a five-year mean reversion process as a guideline in setting near-term equity fund growth rates based on a long-term view of financial market performance as well as recent actual performance. The suggested near-term equity fund growth rate is reviewed quarterly to ensure consistency with management’s assessment of anticipated equity market performance. DAC amortization expense recorded in a period when client asset value growth rates exceed management’s near-term estimate will typically be less than in a period when growth rates fall short of management’s near-term estimate.
Traditional Long-Duration Products
For traditional long-duration products (including traditional life and disability income (“DI”) insurance products), DAC are generally amortized as a percentage of premiums over amortization periods equal to the premium paying period. The assumptions made in calculating the DAC balance and DAC amortization expense are consistent with those used in determining the liabilities.
For traditional life and DI insurance products, the assumptions provide for adverse deviations in experience and are revised only if management concludes experience will be so adverse that DAC are not recoverable. If management concludes that DAC are not recoverable, DAC are reduced to the amount that is recoverable based on best estimate assumptions and there is a corresponding expense recorded in the Consolidated Statements of Operations.
Deferred Sales Inducement Costs
Sales inducement costs consist of bonus interest credits and premium credits added to certain annuity contract and insurance policy values. These benefits are capitalized to the extent they are incremental to amounts that would be credited on similar contracts without the applicable feature. The amounts capitalized are amortized using the same methodology and assumptions used to amortize DAC. DSIC is recorded in other assets, and amortization of DSIC is recorded in benefits, claims, losses and settlement expenses.
Reinsurance
The Company cedes insurance risk to other insurers under reinsurance agreements. The Company evaluates the financial condition of its reinsurers prior to entering into new reinsurance contracts and on a periodic basis during the contract term.
107
Reinsurance premiums paid and benefits received are accounted for consistently with the basis used in accounting for the policies from which risk is reinsured and consistently with the terms of the reinsurance contracts. Reinsurance premiums for traditional life, LTC, DI and auto and home, net of the change in any prepaid reinsurance asset, are reported as a reduction of premiums. UL and VUL reinsurance premiums are reported as a reduction of other revenues. In addition, for UL and VUL insurance policies, the net cost of reinsurance ceded, which represents the discounted amount of the expected cash flows between the reinsurer and the Company, is classified as an asset or contra asset and amortized over the estimated life of the policies in proportion to the estimated gross profits and is subject to retrospective adjustment in a manner similar to retrospective adjustment of DAC. The assumptions used to project the expected cash flows are consistent with those used for DAC valuation for the same contracts. Changes in the net cost of reinsurance are reflected as a component of other revenues. Reinsurance recoveries are reported as components of benefits, claims, losses and settlement expenses.
Insurance liabilities are reported before the effects of reinsurance. Policyholder account balances, future policy benefits and claims recoverable under reinsurance contracts are recorded within receivables.
The Company also assumes life insurance and fixed annuity risk from other insurers in limited circumstances. Reinsurance premiums received and benefits paid are accounted for consistently with the basis used in accounting for the policies from which risk is reinsured and consistently with the terms of the reinsurance contracts. Liabilities for assumed business are recorded within policyholder account balances, future policy benefits and claims.
See Note 7 for additional information on reinsurance.
Policyholder Account Balances, Future Policy Benefits and Claims
The Company establishes reserves to cover the risks associated with non-traditional and traditional long-duration products and short-duration products. Reserves for non-traditional long-duration products include the liabilities related to guaranteed benefit provisions added to variable annuity contracts, variable and fixed annuity contracts and UL and VUL policies and the embedded derivatives related to variable annuity contracts, indexed annuities and IUL insurance. Reserves for traditional long-duration products are established to provide adequately for future benefits and expenses for term life, whole life, DI and long term care (“LTC”) insurance products. Reserves for short-duration products are established to provide adequately for incurred losses primarily related to auto and home policies.
Changes in future policy benefits and claims are reflected in earnings in the period adjustments are made. Where applicable, benefit amounts expected to be recoverable from reinsurance companies who share in the risk are separately recorded as reinsurance recoverable within receivables.
Non-Traditional Long-Duration Products
The liabilities for non-traditional long-duration products include fixed account values on variable and fixed annuities and UL and VUL policies, liabilities for guaranteed benefits associated with variable annuities and embedded derivatives for variable annuities, indexed annuities and IUL products.
Liabilities for fixed account values on variable and fixed deferred annuities and UL and VUL policies are equal to accumulation values, which are the cumulative gross deposits and credited interest less withdrawals and various charges.
A portion of the Company’s UL and VUL policies have product features that result in profits followed by losses from the insurance component of the contract. These profits followed by losses can be generated by the cost structure of the product or secondary guarantees in the contract. The secondary guarantee ensures that, subject to specified conditions, the policy will not terminate and will continue to provide a death benefit even if there is insufficient policy value to cover the monthly deductions and charges. The liability for these future losses is determined by estimating the death benefits in excess of account value and recognizing the excess over the estimated life based on expected assessments (e.g. cost of insurance charges, contractual administrative charges, similar fees and investment margin). See Note 11 for information regarding the liability for contracts with secondary guarantees.
Liabilities for indexed annuity products and indexed accounts of IUL products are equal to the accumulation of host contract values covering guaranteed benefits and the fair value of embedded equity options.
The guaranteed minimum death benefit (“GMDB”) and gain gross-up (“GGU”) liability is determined by estimating the expected value of death benefits in excess of the projected contract accumulation value and recognizing the excess over the estimated life based on expected assessments (e.g., mortality and expense fees, contractual administrative charges and similar fees).
If elected by the contract owner and after a stipulated waiting period from contract issuance, a guaranteed minimum income benefit (“GMIB”) guarantees a minimum lifetime annuity based on a specified rate of contract accumulation value growth and predetermined annuity purchase rates. The GMIB liability is determined each period by estimating the expected value of annuitization benefits in excess of the projected contract accumulation value at the date of annuitization and recognizing the excess over the estimated life based on expected assessments.
The liability for the life contingent benefits associated with GMWB provisions is determined by estimating the expected value of benefits that are contingent upon survival after the account value is equal to zero and recognizing the benefits over the estimated life based on expected assessments (e.g., mortality and expense fees, contractual administrative charges and similar fees).
108
In determining the liabilities for GMDB, GGU, GMIB and the life contingent benefits associated with GMWB, the Company projects these benefits and contract assessments using actuarial models to simulate various equity market scenarios. Significant assumptions made in projecting future benefits and assessments relate to customer asset value growth rates, mortality, persistency, benefit utilization and investment margins and are consistent with those used for DAC valuation for the same contracts. As with DAC, management reviews and, where appropriate, adjusts its assumptions each quarter. Unless management identifies a material deviation over the course of quarterly monitoring, management reviews and updates these assumptions annually in the third quarter of each year.
See Note 11 for information regarding variable annuity guarantees.
The fair value of embedded derivatives related to GMAB and the non-life contingent benefits associated with GMWB provisions, indexed annuities and IUL fluctuate based on equity, interest rate and credit markets and the estimate of the Company’s nonperformance risk, which can cause these embedded derivatives to be either an asset or a liability. See Note 14 for information regarding the fair value measurement of embedded derivatives.
Liabilities for fixed annuities in a benefit or payout status are based on future estimated payments using established industry mortality tables and interest rates.
Traditional Long-Duration Products
The liabilities for traditional long-duration products include liabilities for unpaid amounts on reported claims, estimates of benefits payable on claims incurred but not yet reported and estimates of benefits that will become payable on term life, whole life, DI and LTC policies as claims are incurred in the future.
Liabilities for unpaid amounts on reported life insurance claims are equal to the death benefits payable under the policies.
Liabilities for unpaid amounts on reported DI and LTC claims include any periodic or other benefit amounts due and accrued, along with estimates of the present value of obligations for continuing benefit payments. These unpaid amounts are calculated using anticipated claim continuance rates based on established industry tables, adjusted as appropriate for the Company’s experience. The discount rates used to calculate present values are based on average interest rates earned on assets supporting the liability for unpaid amounts.
Liabilities for estimated benefits payable on claims that have been incurred but not yet reported are based on periodic analysis of the actual time lag between when a claim occurs and when it is reported.
Liabilities for estimates of benefits that will become payable on future claims on term life, whole life and DI insurance policies are based on the net level premium and LTC policies are based on a gross premium valuation reflecting management’s current best estimate assumptions. Both include anticipated premium payments, mortality and morbidity rates, policy persistency and interest rates earned on assets supporting the liability. Anticipated mortality and morbidity rates are based on established industry mortality and morbidity tables, with modifications based on the Company’s experience. Anticipated premium payments and persistency rates vary by policy form, issue age, policy duration and certain other pricing factors.
For term life, whole life, DI and LTC policies, the Company utilizes best estimate assumptions as of the date the policy is issued with provisions for the risk of adverse deviation, as appropriate. After the liabilities are initially established, management performs premium deficiency tests using best estimate assumptions without provisions for adverse deviation annually in the third quarter of each year unless management identifies a material deviation over the course of quarterly monitoring. If the liabilities determined based on these best estimate assumptions are greater than the net reserves (i.e., GAAP reserves net of any DAC balance), the existing net reserves are adjusted by first reducing the DAC balance by the amount of the deficiency or to zero through a charge to current period earnings. If the deficiency is more than the DAC balance, then the net reserves are increased by the excess through a charge to current period earnings. If a premium deficiency is recognized, the assumptions as of the date of the loss recognition are locked in and used in subsequent periods. The assumptions for LTC insurance products are management's best estimate as of the date of loss recognition and thus no longer provide for adverse deviations in experience.
See Note 10 for information regarding the liabilities for traditional long-duration products.
Short-Duration Products
The liabilities for short-duration products primarily include auto and home reserves comprised of amounts determined from loss reports on individual claims, as well as amounts based on historical loss experience for losses incurred but not yet reported. Such liabilities are based on estimates. The Company’s methods for making such estimates and for establishing the resulting liabilities are continually reviewed, and any adjustments are reflected in earnings in the period such adjustments are made.
Unearned Revenue Liability
The Company’s UL and VUL policies require payment of fees or other policyholder assessments in advance for services to be provided in future periods. These charges are deferred as unearned revenue and amortized using estimated gross profits, similar to DAC. The unearned revenue liability is recorded in other liabilities and the amortization is recorded in other revenues.
For clients who pay financial planning fees prior to the advisor’s delivery of the financial plan, the financial planning fees received in advance are deferred as unearned revenue until the plan is delivered to the client.
109
Share-Based Compensation
The Company measures and recognizes the cost of share-based awards granted to employees and directors based on the grant-date fair value of the award and recognizes the expense (net of estimated forfeitures) on a straight-line basis over the vesting period. Excess tax benefits or deficiencies are created upon distribution or exercise of awards. In 2016 and prior years, excess tax benefits were recognized in additional paid-in-capital and excess tax deficiencies were recognized either as an offset to accumulated excess tax benefits, if any, or in the income statement. Beginning in 2017, all excess tax benefits and tax deficiencies are recognized as income tax expense or benefit in the income statement. The fair value of each option is estimated on the grant date using a Black-Scholes option-pricing model. The Company recognizes the cost of share-based awards granted to independent contractors and performance share units granted to the Company’s Executive Leadership Team on a fair value basis until fully vested.
Income Taxes
The Company’s provision for income taxes represents the net amount of income taxes that the Company expects to pay or to receive from various taxing jurisdictions in connection with its operations. The Company provides for income taxes based on amounts that the Company believes it will ultimately owe taking into account the recognition and measurement for uncertain tax positions. Inherent in the provision for income taxes are estimates and judgments regarding the tax treatment of certain items.
In connection with the provision for income taxes, the Consolidated Financial Statements reflect certain amounts related to deferred tax assets and liabilities, which result from temporary differences between the assets and liabilities measured for financial statement purposes versus the assets and liabilities measured for tax return purposes.
The Company is required to establish a valuation allowance for any portion of its deferred tax assets that management believes will not be realized. Significant judgment is required in determining if a valuation allowance should be established and the amount of such allowance if required. Factors used in making this determination include estimates relating to the performance of the business. Consideration is given to, among other things in making this determination: (i) future taxable income exclusive of reversing temporary differences and carryforwards; (ii) future reversals of existing taxable temporary differences; (iii) taxable income in prior carryback years; and (iv) tax planning strategies. Management may need to identify and implement appropriate planning strategies to ensure its ability to realize deferred tax assets and reduce the likelihood of the establishment of a valuation allowance with respect to such assets. See Note 21 for additional information on the Company's valuation allowance.
Changes in tax rates and tax law are accounted for in the period of enactment.
Deferred tax assets and liabilities are adjusted for the effect of a change in tax laws or rates and the effect is included in income from continuing operations. See Note 21 for further discussion on the enactment of the
legislation commonly referred to as the
Tax Cuts and Jobs Act (“Tax Act”) and the impact to the Company’s provision for income taxes for the year ended December 31, 2017.
Revenue Recognition
The Company’s management and financial advice fees are generally recognized when earned as the service is provided. A significant portion of the Company’s management fees are calculated as a percentage of the fair value of its managed assets. A large majority of the Company’s managed assets are valued by third party pricing service vendors based upon observable market data. The selection of the Company’s third party pricing service vendors and the reliability of their prices are subject to certain governance procedures, such as exception reporting, subsequent transaction testing, and annual due diligence of the Company’s vendors, which includes assessing the vendor’s valuation qualifications, control environment, analysis of asset-class specific valuation methodologies and understanding of sources of market observable assumptions.
The Company may receive performance-based incentive management fees on certain management contracts. Performance fees are paid when specific performance hurdles are met. The Company recognizes performance fees on the date the fee is no longer subject to adjustment. Any performance fees received are not subject to repayment or any other clawback provisions.
Certain management and financial advice fees are charged based on an annual fee or a transaction fee. These fees include financial planning, certain custodial and fund administration and brokerage fees. Fees from financial planning services are recognized when the financial plan is delivered. Annual custodial and fund administration fees are recognized evenly as service is provided over the contract period. Transaction based brokerage fees are recognized on the transaction date.
Mortality and expense risk fees are generally calculated as a percentage of the fair value of assets held in separate accounts and recognized when assessed.
Point-of-sale fees (such as mutual fund front-end sales loads) and asset-based fees (such as 12b-1 distribution and shareholder service fees) are generally based on a contractual percentage of assets and recognized when earned. Amounts received under marketing support arrangements for sales of mutual funds and other companies’ products, such as through the Company’s wrap accounts, as well as surrender charges on UL and VUL insurance and annuities, are recognized when assessed.
Interest income is accrued as earned using the effective interest method, which makes an adjustment of the yield for security premiums and discounts on all performing fixed maturity securities classified as Available-for-Sale so that the related security or loan recognizes a constant rate of return on the outstanding balance throughout its term.
When actual prepayments differ significantly from originally anticipated prepayments, the retrospective effective yield is recalculated to reflect actual payments to date
and updated future payment assumptions
and a catch-up adjustment is recorded in the current period. In addition, the new effective yield, which reflects anticipated
110
future payments, is used prospectively. Realized gains and losses on securities, other than trading securities and equity method investments, are recognized using the specific identification method on a trade date basis.
Premiums on auto and home insurance are net of reinsurance premiums and recognized ratably over the coverage period. Premiums on traditional life, health insurance and immediate annuities with a life contingent feature are net of reinsurance ceded and are recognized as revenue when due.
Variable annuity guaranteed benefit rider charges and cost of insurance charges on UL and VUL insurance (net of reinsurance premiums and cost of reinsurance for universal life insurance products) are recognized as revenue when assessed.
3.
Recent Accounting Pronouncements
Adoption of New Accounting Standards
Statement of Cash Flows – Restricted Cash
In November 2016, the Financial Accounting Standards Board (“FASB”) updated the accounting standards related to the classification of restricted cash on the statement of cash flows. The update requires entities to include restricted cash and restricted cash equivalents in cash and cash equivalent balances on the statement of cash flows and disclose a reconciliation between the balances on the statement of cash flows and the balance sheet. The standard is effective for interim and annual periods beginning after December 15, 2017, with early adoption permitted. The Company early adopted the standard for the interim period ended March 31, 2017 on a retrospective basis. As a result of the adoption of the standard, restricted cash balances of
$2.5 billion
and
$2.9 billion
at
December 31, 2017
and
2016
, respectively, are included in the cash and cash equivalents balances on the Company’s consolidated statements of cash flows. The impact of the change in restricted cash resulted in a
$358 million
increase and a
$66 million
decrease to the Company’s operating cash flows for the years ended
December 31, 2016
and
2015
, respectively.
Statement of Cash Flows – Classification of Certain Cash Receipts and Cash Payments
In August 2016, the FASB updated the accounting standards related to classification of certain cash receipts and cash payments on the statement of cash flows. The update includes amendments to address diversity in practice for the classification of eight specific cash flow activities. The specific amendments the Company evaluated include the classification of debt prepayment and extinguishment costs, contingent consideration payments, proceeds from insurance settlements and corporate owned life insurance settlements, distributions from equity method investees and the application of the predominance principle to separately identifiable cash flows. The standard is effective for interim and annual periods beginning after December 15, 2017. Early adoption is permitted and all amendments must be adopted during the same period. The Company early adopted the standard for the interim period ended March 31, 2017 on a retrospective basis. The adoption of the standard did not have a material impact on the Company’s operating, investing or financing cash flows.
Compensation – Stock Compensation
In March 2016, the FASB updated the accounting standards related to employee share-based payments. The update requires all excess tax benefits and tax deficiencies to be recognized as income tax expense or benefit in the income statement. This change is required to be applied prospectively to excess tax benefits and tax deficiencies resulting from settlements after the date of adoption. No adjustment is recorded for any excess tax benefits or tax deficiencies previously recorded in additional paid in capital. The update also requires excess tax benefits to be classified along with other income tax cash flows as an operating activity in the statement of cash flows. This provision can be applied on either a prospective or retrospective basis. The update permits entities to make an accounting policy election to recognize forfeitures as they occur rather than estimating forfeitures to determine the recognition of expense for share-based payment awards. The standard is effective for interim and annual periods beginning after December 15, 2016 with early adoption permitted. The Company adopted the standard on January 1, 2017 on a prospective basis, except for the cash flow statement provision, which the Company applied on a retrospective basis. During periods in which the settlement date value differs materially from the grant date fair value of
certain
share-based
payment
awards, the Company may experience volatility in income tax recognized in
its
consolidated
results
of
operations. During
the
year
ended
December 31, 2017
, the Company recognized net excess tax benefits of
$70 million
as a reduction to the income tax provision in the consolidated statements of operations. The Company maintained its accounting policy of estimating forfeitures. As a result of the adoption of the standard, net excess tax benefits of
$70 million
,
$14 million
and
$81 million
for the years ended
December 31, 2017
,
2016
and
2015
, respectively, are included in the Other, net line within operating cash flows on the Company’s consolidated statements of cash flows.
Consolidation
In February 2015, the FASB updated the accounting standard for consolidation. The update changes the accounting for the consolidation model for limited partnerships and VIEs and excludes certain money market funds from the consolidation analysis. Specific to the consolidation analysis of a VIE, the update clarifies consideration of fees paid to a decision maker and amends the related party guidance. The Company adopted the standard on January 1, 2016 using the modified retrospective approach. The adoption resulted in the deconsolidation of several CLOs and all property funds with a decrease of approximately
$6.2 billion
of assets,
$4.9 billion
of liabilities and
$1.3 billion
of equity (noncontrolling interests and appropriated retained earnings of consolidated investment entities). Effective January 1, 2016, intercompany amounts between the Company and the deconsolidated CLOs and property funds are no longer eliminated in consolidation.
111
In August 2014, the FASB updated the accounting standard related to consolidation of collateralized financing entities. The update applies to reporting entities that consolidate a collateralized financing entity and measures all financial assets and liabilities of the collateralized financing entity at fair value. The update provides a measurement alternative which would allow an entity to measure both the financial assets and financial liabilities at the fair value of the more observable of the fair value of the financial assets or financial liabilities. When the measurement alternative is elected, the reporting entity’s net income should reflect its own economic interests in the collateralized financing entity, including changes in the fair value of the beneficial interests retained by the reporting entity and beneficial interests that represent compensation for services. If the measurement alternative is not elected, the financial assets and financial liabilities should be measured separately in accordance with the requirements of the fair value accounting standard. Any difference in the fair value of the assets and liabilities would be recorded to net income attributable to the reporting entity. The Company adopted the standard on January 1, 2016 and elected the measurement alternative using the modified retrospective approach. The adoption of the standard did not have a material impact on the Company’s consolidated results of operations and financial condition after the deconsolidation of several CLOs noted above.
Future Adoption of New Accounting Standards
Income Statement – Reporting Comprehensive Income
In February 2018, the FASB updated the accounting standards related to the presentation of tax effects stranded in OCI. The update allows a reclassification from AOCI to retained earnings for tax effects stranded in AOCI resulting from the Tax Act. The update is optional and entities may elect not to reclassify the stranded tax effects. The update is effective for fiscal years beginning after December 15, 2018. Entities may elect to record the impacts either in the period of adoption or retrospectively to each period (or periods) in which the effect of the change in the U.S. federal corporate income tax rate in the Tax Act is recognized. Early adoption is permitted in any period. The Company is currently evaluating the impact of the update on its consolidated financial condition.
Derivatives and Hedging – Targeted Improvements to Accounting for Hedging Activities
In August 2017, the FASB updated the accounting standards to amend the hedge accounting recognition and presentation requirements. The objectives of the update are to better align the financial reporting of hedging relationships to the economic results of an entity’s risk management activities and simplify the application of the hedge accounting guidance. The update also adds new disclosures and amends existing disclosure requirements. The standard is effective for interim and annual periods beginning after December 15, 2018, and should be applied on a modified retrospective basis. Early adoption is permitted. The Company is currently evaluating the impact of the standard on its consolidated results of operations and financial condition.
Receivables – Premium Amortization on Purchased Callable Debt Securities
In March 2017, the FASB updated the accounting standards to shorten the amortization period for certain purchased callable debt securities held at a premium. Under current guidance, premiums are generally amortized over the contractual life of the security. The amendments require the premium to be amortized to the earliest call date. The update applies to securities with explicit, non-contingent call features that are callable at fixed prices and on preset dates. The standard is effective for interim and annual periods beginning after December 15, 2018, and should be applied on a modified retrospective basis through a cumulative-effect adjustment directly to retained earnings as of the beginning of the period of adoption. Early adoption is permitted. The update is not expected to have a material impact on the Company’s consolidated results of operations or financial condition.
Intangibles – Goodwill and Other – Simplifying the Test for Goodwill Impairment
In January 2017, the FASB updated the accounting standards to simplify the accounting for goodwill impairment. The update removes the hypothetical purchase price allocation (Step 2) of the goodwill impairment test. Goodwill impairment will now be the amount by which a reporting unit’s carrying value exceeds its fair value. The standard is effective for interim and annual periods beginning after December 15, 2019, and should be applied prospectively with early adoption permitted for any impairment tests performed after January 1, 2017. The update is not expected to have a material impact on the Company’s consolidated results of operations or financial condition.
Income Taxes – Intra-Entity Transfers of Assets Other Than Inventory
In October 2016, the FASB updated the accounting standards related to the recognition of income tax impacts on intra-entity transfers. The update requires entities to recognize the income tax consequences of intra-entity transfers, other than inventory, upon the transfer of the asset. The update requires the selling entity to recognize a current tax expense or benefit and the purchasing entity to recognize a deferred tax asset or liability when the transfer occurs. The standard is effective for interim and annual periods beginning after December 15, 2017. The Company adopted the standard on January 1, 2018. The adoption of the standard did not have an impact on the Company’s consolidated results of operations or financial condition.
Financial Instruments – Measurement of Credit Losses
In June 2016, the FASB updated the accounting standards related to accounting for credit losses on certain types of financial instruments. The update replaces the current incurred loss model for estimating credit losses with a new model that requires an entity to estimate the credit losses expected over the life of the asset. Generally, the initial estimate of the expected credit losses and subsequent changes in the estimate will be reported in current period earnings and recorded through an allowance for credit losses on the balance sheet. The current credit loss model for Available-for-Sale debt securities does not change; however, the credit loss calculation and subsequent recoveries are required to be recorded through an allowance. The standard is effective for interim and
112
annual periods beginning after December 15, 2019. Early adoption will be permitted for interim and annual periods beginning after December 15, 2018. A modified retrospective cumulative adjustment to retained earnings should be recorded as of the first reporting period in which the guidance is effective for loans, receivables, and other financial instruments subject to the new expected credit loss model. Prospective adoption is required for establishing an allowance related to Available-for-Sale debt securities, certain beneficial interests, and financial assets purchased with a more-than-insignificant amount of credit deterioration since origination. The Company is currently evaluating the impact of the standard on its consolidated results of operations and financial condition.
Leases – Recognition of Lease Assets and Liabilities on Balance Sheet
In February 2016, the FASB updated the accounting standards for leases. The update was issued to increase transparency and comparability for the accounting of lease transactions. The standard will require most lease transactions for lessees to be recorded on the balance sheet as lease assets and lease liabilities and both quantitative and qualitative disclosures about leasing arrangements. The Company currently discloses information related to operating lease arrangements within Note 23. The standard is effective for interim and annual periods beginning after December 15, 2018 with early adoption permitted. The update should be applied at the beginning of the earliest period presented using a modified retrospective approach. The Company is currently evaluating the impact of the standard on its consolidated results of operations and financial condition.
Financial Instruments – Recognition and Measurement of Financial Assets and Financial Liabilities
In January 2016, the FASB updated the accounting standards on the recognition and measurement of financial instruments. The update requires entities to carry marketable equity securities, excluding investments in securities that qualify for the equity method of accounting, at fair value with changes in fair value reflected in net income each reporting period. The update affects other aspects of accounting for equity instruments, as well as the accounting for financial liabilities utilizing the fair value option. The update eliminates the requirement to disclose the methods and assumptions used to estimate the fair value of financial assets or liabilities held at cost on the balance sheet and requires entities to use the exit price notion when measuring the fair value of financial instruments. The standard is effective for interim and annual periods beginning after December 15, 2017. The Company adopted the standard on January 1, 2018 using a modified retrospective approach. The adoption of the standard did not have a material impact on the Company’s consolidated results of operations or financial condition.
Revenue from Contracts with Customers
In May 2014, the FASB updated the accounting standards for revenue from contracts with customers. The update provides a five-step revenue recognition model for all revenue arising from contracts with customers and affects all entities that enter into contracts to provide goods or services to their customers (unless the contracts are in the scope of other standards). The standard also updates the accounting for certain costs associated with obtaining and fulfilling a customer contract and requires disclosure of quantitative and qualitative information that enables users of financial statements to understand the nature, amount, timing, and uncertainty of revenues and cash flows arising from contracts with customers. The standard is effective for interim and annual periods beginning after December 15, 2017 and early adoption is permitted for interim and annual periods beginning after December 15, 2016. The standard may be applied retrospectively for all periods presented or retrospectively with a cumulative-effect adjustment at the date of adoption. The Company adopted the revenue recognition guidance on a retrospective basis on January 1, 2018. The update does not apply to revenue associated with the manufacturing of insurance and annuity products or financial instruments as these revenues are in the scope of other standards. Therefore, the update did not have an impact on these revenues. The Company’s implementation efforts included the identification of revenue within the guidance and the review of the customer contracts to determine the Company’s performance obligation and the associated timing of each performance obligation. The Company has determined that certain payments received primarily related to franchise advisor fees should be presented as revenue rather than a reduction of expense. The Company expects the impact of this change to be an increase to both revenues and expenses of approximately
$95 million
to
$120 million
on an annual basis for the years ended December 31, 2017 and 2016. The adoption of the standard will not have other material impacts on the Company’s consolidated results of operations and financial condition.
4.
Variable Interest Entities
The Company provides asset management services to investment entities which are considered to be VIEs, such as collaterized loan obligations (“CLOs”), hedge funds, property funds, certain non-U.S. series funds (Open Ended Investment Companies and Societes d’Investissement A Capital Variable) and private equity funds (collectively, “investment entities”), which are sponsored by the Company. In addition, the Company invests in structured investments other than CLOs and certain affordable housing partnerships which are considered VIEs. The Company consolidates certain investment entities (collectively, “consolidated investment entities”) if the Company is deemed to be the primary beneficiary. The Company has
no
obligation to provide financial or other support to the non-consolidated VIEs beyond its investment nor has the Company provided any support to these entities.
See Note 2 for further discussion of the Company’s accounting policy on consolidation.
CLOs
CLOs are asset backed financing entities collateralized by a pool of assets, primarily syndicated loans and, to a lesser extent, high-yield bonds. Multiple tranches of debt securities are issued by a CLO, offering investors various maturity and credit risk characteristics. The debt securities issued by the CLOs are non-recourse to the Company. The CLO’s debt holders have recourse only to the assets of the CLO. The assets of the CLOs cannot be used by the Company. Scheduled debt payments are based on the performance of the CLO’s collateral pool. The Company earns management fees from the CLOs based on the CLO’s collateral pool
113
and, in certain instances, may also receive incentive fees. The fee arrangement is at market and commensurate with the level of effort required to provide those services. The Company has invested in a portion of the unrated, junior subordinated notes of certain CLOs.
The Company's maximum exposure to loss with respect to non-consolidated CLOs is limited to its amortized cost, which was
$6 million
and
$9 million
as of
December 31, 2017
and 2016, respectively. The Company classifies these investments as Available-for-Sale securities. See Note 5 for additional information on these investments.
Property Funds
The Company provides investment advice and related services to property funds some of which are considered VIEs. For investment management services, the Company generally earns management fees based on the market value of assets under management, and in certain instances may also receive performance-based fees. The fee arrangement is at market and commensurate with the level of effort required to provide those services. The Company does not have a significant economic interest and is not required to consolidate any of the property funds. The carrying value of the Company’s investment in property funds is reflected in other investments and was
$24 million
and
$26 million
as of
December 31, 2017
and 2016, respectively.
Hedge Funds and Private Equity Funds
The Company has determined that consolidation is not required for hedge funds and private equity funds which are sponsored by the Company and considered VIEs. For investment management services, the Company earns management fees based on the market value of assets under management, and in certain instances may also receive performance-based fees. The fee arrangement is at market and commensurate with the level of effort required to provide those services and the Company does not have a significant economic interest in any fund. The Company's maximum exposure to loss with respect to its investment in these entities is limited to its carrying value. The carrying value of the Company’s investment in these entities is reflected in other investments and was
$7 million
and
$13 million
as of
December 31, 2017
and 2016, respectively.
Non-U.S. Series Funds
The Company manages non-U.S. series funds, which are considered VIEs. For investment management services, the Company earns management fees based on the market value of assets under management, and in certain instances may also receive performance-based fees. The fee arrangement is at market and commensurate with the level of effort required to provide those services. The Company does not consolidate these funds and its maximum exposure to loss is limited to its carrying value. The carrying value of the Company’s investment in these funds is reflected in other investments and was
$25 million
and
$33 million
as of
December 31, 2017
and 2016, respectively.
Affordable Housing Partnerships and Other Real Estate Partnerships
The Company is a limited partner in affordable housing partnerships that qualify for government-sponsored low income housing tax credit programs and partnerships that invest in multi-family residential properties that were originally developed with an affordable housing component. The Company has determined it is not the primary beneficiary and therefore does not consolidate these partnerships.
A majority of the limited partnerships are VIEs. The Company’s maximum exposure to loss as a result of its investment in the VIEs is limited to the carrying value. The carrying value is reflected in other investments and was
$408 million
and
$482 million
as of
December 31, 2017
and
2016
, respectively. The Company had a
$97 million
and
$135 million
liability recorded as of
December 31, 2017
and
2016
, respectively, related to original purchase commitments not yet remitted to the VIEs. The Company has not provided any additional support and is not contractually obligated to provide additional support to the VIEs beyond the above mentioned funding commitments.
Structured Investments
The Company invests in structured investments which are considered VIEs for which it is not the sponsor. These structured investments typically invest in fixed income instruments and are managed by third parties and include asset backed securities, commercial mortgage backed securities and residential mortgage backed securities. The Company classifies these investments as Available-for-Sale securities. The Company has determined that it is not the primary beneficiary of these structures due to the size of the Company’s investment in the entities and position in the capital structure of these entities. The Company's maximum exposure to loss as a result of its investment in these structured investments is limited to its carrying value. See Note 5 for additional information on these structured investments.
114
Fair Value of Assets and Liabilities
The Company categorizes its fair value measurements according to a three-level hierarchy. See Note 14 for the definition of the three levels of the fair value hierarchy.
The following tables present the balances of assets and liabilities held by consolidated investment entities measured at fair value on a recurring basis:
|
|
December 31, 2017
|
||||||||||||||
|
Level 1
|
Level 2
|
Level 3
|
Total
|
||||||||||||
|
(in millions)
|
|||||||||||||||
|
Assets
|
|
|
|
|
|
|
|
|
|||||||
|
Investments:
|
|
|
|
|
|
|
|
|
|||||||
|
Corporate debt securities
|
$
|
—
|
|
$
|
27
|
|
$
|
—
|
|
$
|
27
|
|
|||
|
Common stocks
|
18
|
|
8
|
|
4
|
|
30
|
|
|||||||
|
Other investments
|
5
|
|
—
|
|
—
|
|
5
|
|
|||||||
|
Syndicated loans
|
—
|
|
1,889
|
|
180
|
|
2,069
|
|
|||||||
|
Total investments
|
23
|
|
1,924
|
|
184
|
|
2,131
|
|
|||||||
|
Receivables
|
—
|
|
25
|
|
—
|
|
25
|
|
|||||||
|
Total assets at fair value
|
$
|
23
|
|
$
|
1,949
|
|
$
|
184
|
|
$
|
2,156
|
|
|||
|
Liabilities
|
|
|
|
|
|
|
|
|
|||||||
|
Debt
(1)
|
$
|
—
|
|
$
|
2,208
|
|
$
|
—
|
|
$
|
2,208
|
|
|||
|
Other liabilities
|
—
|
|
63
|
|
—
|
|
63
|
|
|||||||
|
Total liabilities at fair value
|
$
|
—
|
|
$
|
2,271
|
|
$
|
—
|
|
$
|
2,271
|
|
|||
|
|
December 31, 2016
|
||||||||||||||
|
Level 1
|
Level 2
|
Level 3
|
Total
|
||||||||||||
|
(in millions)
|
|||||||||||||||
|
Assets
|
|
|
|
|
|
|
|
|
|||||||
|
Investments:
|
|
|
|
|
|
|
|
|
|||||||
|
Corporate debt securities
|
$
|
—
|
|
$
|
19
|
|
$
|
—
|
|
$
|
19
|
|
|||
|
Common stocks
|
22
|
|
6
|
|
5
|
|
33
|
|
|||||||
|
Other investments
|
4
|
|
—
|
|
—
|
|
4
|
|
|||||||
|
Syndicated loans
|
—
|
|
1,944
|
|
254
|
|
2,198
|
|
|||||||
|
Total investments
|
26
|
|
1,969
|
|
259
|
|
2,254
|
|
|||||||
|
Receivables
|
—
|
|
11
|
|
—
|
|
11
|
|
|||||||
|
Total assets at fair value
|
$
|
26
|
|
$
|
1,980
|
|
$
|
259
|
|
$
|
2,265
|
|
|||
|
Liabilities
|
|
|
|
|
|
|
|
|
|||||||
|
Debt
(1)
|
$
|
—
|
|
$
|
2,319
|
|
$
|
—
|
|
$
|
2,319
|
|
|||
|
Other liabilities
|
—
|
|
95
|
|
—
|
|
95
|
|
|||||||
|
Total liabilities at fair value
|
$
|
—
|
|
$
|
2,414
|
|
$
|
—
|
|
$
|
2,414
|
|
|||
(1)
The carrying value of the CLOs’ debt is set equal to the fair value of the CLOs’ assets. The estimated fair value of the CLOs’ debt was
$2.2 billion
and
$2.3 billion
as of
December 31, 2017
and 2016, respectively.
115
The following tables provide a summary of changes in Level 3 assets and liabilities held by consolidated investment entities measured at fair value on a recurring basis:
|
|
Corporate Debt Securities
|
Common Stocks
|
Syndicated Loans
|
|||||||||
|
Balance, January 1, 2017
|
$
|
—
|
|
$
|
5
|
|
$
|
254
|
|
|||
|
Total gains (losses) included in:
|
||||||||||||
|
Net income
|
—
|
|
(1
|
)
|
(1)
|
—
|
|
|||||
|
Purchases
|
—
|
|
3
|
|
146
|
|
||||||
|
Sales
|
(2
|
)
|
(2
|
)
|
(28
|
)
|
||||||
|
Settlements
|
—
|
|
—
|
|
(70
|
)
|
||||||
|
Transfers into Level 3
|
2
|
|
7
|
|
266
|
|
||||||
|
Transfers out of Level 3
|
—
|
|
(8
|
)
|
(388
|
)
|
||||||
|
Balance, December 31, 2017
|
$
|
—
|
|
$
|
4
|
|
$
|
180
|
|
|||
|
Changes in unrealized gains (losses) included in income relating to assets and liabilities held at December 31, 2017
|
$
|
—
|
|
$
|
(1
|
)
|
(1)
|
$
|
(1
|
)
|
(1)
|
|
|
|
Common Stocks
|
Syndicated Loans
|
Other Assets
|
Debt
|
||||||||||||
|
(in millions)
|
||||||||||||||||
|
Balance, January 1, 2016
|
$
|
3
|
|
$
|
529
|
|
$
|
2,065
|
|
$
|
(6,630
|
)
|
||||
|
Cumulative effect of change in accounting policies
(2)
|
(2
|
)
|
(304
|
)
|
(2,065
|
)
|
6,630
|
|
||||||||
|
Balance, January 1, 2016, as adjusted
|
1
|
|
225
|
|
—
|
|
—
|
|
||||||||
|
Total gains (losses) included in:
|
||||||||||||||||
|
Net income
|
2
|
|
(1)
|
7
|
|
(1)
|
1
|
|
(3)
|
—
|
|
|||||
|
Purchases
|
1
|
|
145
|
|
—
|
|
—
|
|
||||||||
|
Sales
|
—
|
|
(24
|
)
|
(1
|
)
|
—
|
|
||||||||
|
Settlements
|
—
|
|
(69
|
)
|
—
|
|
—
|
|
||||||||
|
Transfers into Level 3
|
3
|
|
405
|
|
—
|
|
—
|
|
||||||||
|
Transfers out of Level 3
|
(2
|
)
|
(435
|
)
|
—
|
|
—
|
|
||||||||
|
Balance, December 31, 2016
|
$
|
5
|
|
$
|
254
|
|
$
|
—
|
|
$
|
—
|
|
||||
|
Changes in unrealized gains (losses) included in income relating to assets and liabilities held at December 31, 2016
|
$
|
1
|
|
(1)
|
$
|
3
|
|
(1)
|
$
|
—
|
|
$
|
—
|
|
||
116
|
|
Common Stocks
|
Syndicated Loans
|
Other Assets
|
Debt
|
||||||||||||
|
(in millions)
|
||||||||||||||||
|
Balance, January 1, 2015
|
$
|
7
|
|
$
|
484
|
|
$
|
1,935
|
|
$
|
(6,030
|
)
|
||||
|
Total gains (losses) included in:
|
||||||||||||||||
|
Net income
|
(1
|
)
|
(1)
|
(24
|
)
|
(1)
|
170
|
|
(3)
|
215
|
|
(1)
|
||||
|
Other comprehensive income (loss)
|
—
|
|
—
|
|
(154
|
)
|
—
|
|
||||||||
|
Purchases
|
—
|
|
303
|
|
638
|
|
—
|
|
||||||||
|
Sales
|
—
|
|
(36
|
)
|
(524
|
)
|
—
|
|
||||||||
|
Issues
|
—
|
|
—
|
|
—
|
|
(1,267
|
)
|
||||||||
|
Settlements
|
—
|
|
(161
|
)
|
—
|
|
452
|
|
||||||||
|
Transfers into Level 3
|
7
|
|
776
|
|
—
|
|
—
|
|
||||||||
|
Transfers out of Level 3
|
(10
|
)
|
(813
|
)
|
—
|
|
—
|
|
||||||||
|
Balance, December 31, 2015
|
$
|
3
|
|
$
|
529
|
|
$
|
2,065
|
|
$
|
(6,630
|
)
|
||||
|
Changes in unrealized gains (losses) included in income relating to assets and liabilities held at December 31, 2015
|
$
|
—
|
|
$
|
(19
|
)
|
(1)
|
$
|
20
|
|
(3)
|
$
|
219
|
|
(1)
|
|
(1)
Included in net investment income in the Consolidated Statements of Operations.
(2)
The cumulative effect of change in accounting policies includes the adoption impact of ASU 2015-02 and
ASU 2014-13 – Consolidation: Measuring the Financial Assets and the Financial Liabilities of a Consolidated Collateralized Financing Entity
(“ASU 2014-13”).
(3)
Included in other revenues in the Consolidated Statements of Operations.
Securities and loans transferred from Level 3 primarily represent assets with fair values that are now obtained from a third-party pricing service with observable inputs or priced in active markets. Securities and loans transferred to Level 3 represent assets with fair values that are now based on a single non-binding broker quote. The Company recognizes transfers between levels of the fair value hierarchy as of the beginning of the quarter in which each transfer occurred. For assets and liabilities held at the end of the reporting periods that are measured at fair value on a recurring basis, there were
no
transfers between Level 1 and Level 2.
All Level 3 measurements as of
December 31, 2017
and
2016
were obtained from non-binding broker quotes where unobservable inputs utilized in the fair value calculation are not reasonably available to the Company.
Determination of Fair Value
Assets
Investments
The fair value of syndicated loans obtained from third-party pricing services using a market approach with observable inputs is classified as Level 2. The fair value of syndicated loans obtained from third-party pricing services with a single non-binding broker quote as the underlying valuation source is classified as Level 3. The underlying inputs used in non-binding broker quotes are not readily available to the Company.
In consideration of the above, management is responsible for the fair values recorded on the financial statements. Prices received from third party pricing services are subjected to exception reporting that identifies loans with significant daily price movements as well as no movements. The Company reviews the exception reporting and resolves the exceptions through reaffirmation of the price or recording an appropriate fair value estimate. The Company also performs subsequent transaction testing. The Company performs annual due diligence of the third party pricing services. The Company’s due diligence procedures include assessing the vendor’s valuation qualifications, control environment, analysis of asset-class specific valuation methodologies and understanding of sources of market observable assumptions and unobservable assumptions, if any, employed in the valuation methodology. The Company also considers the results of its exception reporting controls and any resulting price challenges that arise.
See Note 14 for a description of the Company’s determination of the fair value of corporate debt securities, common stocks and other investments.
Receivables
For receivables of the consolidated CLOs, the carrying value approximates fair value as the nature of these assets has historically been short term and the receivables have been collectible. The fair value of these receivables is classified as Level 2.
Other Assets
At
December 31, 2015
, other assets primarily consisted of properties held in consolidated property funds managed by Threadneedle and were classified as Level 3. The property funds were deconsolidated effective January 1, 2016 upon the adoption of ASU 2015-02.
117
Liabilities
Debt
Effective January 1, 2016, the Company adopted ASU 2014-13 and elected the measurement alternative, which allows an entity to measure both the financial assets and financial liabilities at the fair value of the more observable of the fair value of the financial assets or financial liabilities. See Note 3 for additional information on ASU 2014-13. The fair value of the CLOs’ assets, typically syndicated bank loans, is more observable than the fair value of the CLOs’ debt tranches for which market activity is limited and less transparent. As a result, the fair value of the CLOs’ debt is set equal to the fair value of the CLOs’ assets. Under ASU 2014-13, the fair value of the CLOs’ debt is classified as Level 2.
Prior to adoption of ASU 2014-13, the fair value of the CLOs’ debt was determined using a discounted cash flow model. Inputs used to determine the expected cash flows included assumptions about default, discount, prepayment and recovery rates of the CLOs’ underlying assets. Given the significance of the unobservable inputs to this fair value measurement, the fair value of the CLOs’ debt was classified as Level 3 prior to adoption of ASU 2014-13.
Other Liabilities
Other liabilities consist primarily of securities purchased but not yet settled held by consolidated CLOs. The carrying value approximates fair value as the nature of these liabilities has historically been short term. The fair value of these liabilities is classified as Level 2.
Fair Value Option
The Company has elected the fair value option for the financial assets and liabilities of the consolidated CLOs. Management believes that the use of the fair value option better matches the changes in fair value of assets and liabilities related to the CLOs.
The following table presents the fair value and unpaid principal balance of loans and debt for which the fair value option has been elected:
|
|
December 31,
|
||||||
|
2017
|
2016
|
||||||
|
(in millions)
|
|||||||
|
Syndicated loans
|
|
|
|
|
|||
|
Unpaid principal balance
|
$
|
2,140
|
|
$
|
2,281
|
|
|
|
Excess unpaid principal over fair value
|
(71
|
)
|
(83
|
)
|
|||
|
Fair value
|
$
|
2,069
|
|
$
|
2,198
|
|
|
|
Fair value of loans more than 90 days past due
|
$
|
24
|
|
$
|
8
|
|
|
|
Fair value of loans in nonaccrual status
|
24
|
|
8
|
|
|||
|
Difference between fair value and unpaid principal of loans more than 90 days past due, loans in nonaccrual status or both
|
35
|
|
34
|
|
|||
|
Debt
|
|
|
|
|
|||
|
Unpaid principal balance
|
$
|
2,342
|
|
$
|
2,459
|
|
|
|
Excess unpaid principal over fair value
|
(134
|
)
|
(140
|
)
|
|||
|
Carrying value
(1)
|
$
|
2,208
|
|
$
|
2,319
|
|
|
(1)
The carrying value of the CLOs’ debt is set equal to the fair value of the CLOs’ assets. The estimated fair value of the CLOs’ debt was
$2.2 billion
and
$2.3 billion
as of
December 31, 2017
and
December 31, 2016
, respectively.
Interest income from syndicated loans, bonds and structured investments is recorded based on contractual rates in net investment income. Gains and losses related to changes in the fair value of investments and gains and losses on sales of investments are also recorded in net investment income. Interest expense on debt is recorded in interest and debt expense with gains and losses related to changes in the fair value of debt recorded in net investment income.
Total net gains (losses) recognized in net investment income related to changes in the fair value of financial assets and liabilities for which the fair value option was elected were
$(5) million
,
$(38) million
and
$(35) million
for the years ended
December 31, 2017
,
2016
and
2015
, respectively.
118
Debt of the consolidated investment entities and the stated interest rates were as follows:
|
|
Carrying Value
|
Weighted Average Interest Rate
|
|||||||||||
|
December 31,
|
December 31,
|
||||||||||||
|
2017
|
2016
|
2017
|
2016
|
||||||||||
|
(in millions)
|
|
||||||||||||
|
Debt of consolidated CLOs due 2025-2026
|
$
|
2,208
|
|
$
|
2,319
|
|
2.8
|
%
|
2.5
|
%
|
|||
The debt of the consolidated CLOs has both fixed and floating interest rates, which range from
0%
to
7.4%
. The interest rates on the debt of CLOs are weighted average rates based on the outstanding principal and contractual interest rates.
At
December 31, 2017
, future maturities of debt were as follows:
|
|
(in millions)
|
||
|
2018
|
$
|
—
|
|
|
2019
|
54
|
|
|
|
2020
|
—
|
|
|
|
2021
|
—
|
|
|
|
2022
|
—
|
|
|
|
Thereafter
|
2,288
|
|
|
|
Total future maturities
|
$
|
2,342
|
|
5.
Investments
The following is a summary of investments:
|
|
December 31,
|
||||||
|
2017
|
2016
|
||||||
|
(in millions)
|
|||||||
|
Available-for-Sale securities, at fair value
|
$
|
30,927
|
|
$
|
30,719
|
|
|
|
Mortgage loans, net
|
2,756
|
|
2,986
|
|
|||
|
Policy and certificate loans
|
845
|
|
831
|
|
|||
|
Other investments
|
1,397
|
|
1,298
|
|
|||
|
Total
|
$
|
35,925
|
|
$
|
35,834
|
|
|
The following is a summary of net investment income:
|
|
Years Ended December 31,
|
||||||||||
|
2017
|
2016
|
2015
|
|||||||||
|
(in millions)
|
|||||||||||
|
Investment income on fixed maturities
|
$
|
1,349
|
|
$
|
1,368
|
|
$
|
1,403
|
|
||
|
Net realized gains (losses)
|
46
|
|
6
|
|
4
|
|
|||||
|
Affordable housing partnerships
|
(100
|
)
|
(44
|
)
|
(18
|
)
|
|||||
|
Other
|
108
|
|
91
|
|
68
|
|
|||||
|
Consolidated investment entities
|
106
|
|
155
|
|
231
|
|
|||||
|
Total
|
$
|
1,509
|
|
$
|
1,576
|
|
$
|
1,688
|
|
||
119
Available-for-Sale securities distributed by type were as follows:
|
Description of Securities
|
December 31, 2017
|
|||||||||||||||||||
|
Amortized
Cost |
Gross
Unrealized Gains |
Gross
Unrealized Losses |
Fair Value
|
Noncredit
OTTI
(1)
|
||||||||||||||||
|
|
(in millions)
|
|||||||||||||||||||
|
Corporate debt securities
|
$
|
13,976
|
|
$
|
1,131
|
|
$
|
(32
|
)
|
$
|
15,075
|
|
$
|
—
|
|
|||||
|
Residential mortgage backed securities
|
6,585
|
|
63
|
|
(37
|
)
|
6,611
|
|
—
|
|
||||||||||
|
Commercial mortgage backed securities
|
4,362
|
|
48
|
|
(36
|
)
|
4,374
|
|
—
|
|
||||||||||
|
Asset backed securities
|
1,549
|
|
36
|
|
(5
|
)
|
1,580
|
|
1
|
|
||||||||||
|
State and municipal obligations
|
2,215
|
|
259
|
|
(11
|
)
|
2,463
|
|
—
|
|
||||||||||
|
U.S. government and agency obligations
|
502
|
|
1
|
|
—
|
|
503
|
|
—
|
|
||||||||||
|
Foreign government bonds and obligations
|
298
|
|
20
|
|
(4
|
)
|
314
|
|
—
|
|
||||||||||
|
Common stocks
|
5
|
|
3
|
|
(1
|
)
|
7
|
|
—
|
|
||||||||||
|
Total
|
$
|
29,492
|
|
$
|
1,561
|
|
$
|
(126
|
)
|
$
|
30,927
|
|
$
|
1
|
|
|||||
|
Description of Securities
|
December 31, 2016
|
|||||||||||||||||||
|
Amortized
Cost |
Gross
Unrealized Gains |
Gross
Unrealized Losses |
Fair Value
|
Noncredit
OTTI (1) |
||||||||||||||||
|
|
(in millions)
|
|||||||||||||||||||
|
Corporate debt securities
|
$
|
15,231
|
|
$
|
1,065
|
|
$
|
(60
|
)
|
$
|
16,236
|
|
$
|
—
|
|
|||||
|
Residential mortgage backed securities
|
6,899
|
|
86
|
|
(67
|
)
|
6,918
|
|
(3
|
)
|
||||||||||
|
Commercial mortgage backed securities
|
3,347
|
|
59
|
|
(39
|
)
|
3,367
|
|
—
|
|
||||||||||
|
Asset backed securities
|
1,532
|
|
33
|
|
(16
|
)
|
1,549
|
|
5
|
|
||||||||||
|
State and municipal obligations
|
2,195
|
|
198
|
|
(35
|
)
|
2,358
|
|
—
|
|
||||||||||
|
U.S. government and agency obligations
|
7
|
|
1
|
|
—
|
|
8
|
|
—
|
|
||||||||||
|
Foreign government bonds and obligations
|
251
|
|
17
|
|
(7
|
)
|
261
|
|
—
|
|
||||||||||
|
Common stocks
|
10
|
|
13
|
|
(1
|
)
|
22
|
|
6
|
|
||||||||||
|
Total
|
$
|
29,472
|
|
$
|
1,472
|
|
$
|
(225
|
)
|
$
|
30,719
|
|
$
|
8
|
|
|||||
(1)
Represents the amount of other-than-temporary impairment (“OTTI”) losses in AOCI. Amount includes unrealized gains and losses on impaired securities subsequent to the initial impairment measurement date. These amounts are included in gross unrealized gains and losses as of the end of the period.
As of
December 31, 2017
and
2016
, investment securities with a fair value of
$1.7 billion
and
$1.6 billion
, respectively, were pledged to meet contractual obligations under derivative contracts and short-term borrowings, of which
$803 million
and
$473 million
, respectively, may be sold, pledged or rehypothecated by the counterparty.
As of both
December 31, 2017
and
2016
, fixed maturity securities comprised approximately
86%
of Ameriprise Financial investments. Rating agency designations are based on the availability of ratings from Nationally Recognized Statistical Rating Organizations (“NRSROs”), including Moody’s Investors Service (“Moody’s”), Standard & Poor’s Ratings Services (“S&P”) and Fitch Ratings Ltd. (“Fitch”). The Company uses the median of available ratings from Moody’s, S&P and Fitch, or, if fewer than three ratings are available, the lower rating is used. When ratings from Moody’s, S&P and Fitch are unavailable, the Company may utilize ratings from other NRSROs or rate the securities internally. As of
December 31, 2017
and
2016
, the Company’s internal analysts rated
$979 million
and
$1.1 billion
, respectively, of securities using criteria similar to those used by NRSROs.
120
A summary of fixed maturity securities by rating was as follows:
|
Ratings
|
December 31, 2017
|
December 31, 2016
|
||||||||||||||||||||
|
Amortized
Cost |
Fair Value
|
Percent of Total Fair Value
|
Amortized
Cost |
Fair Value
|
Percent of Total Fair Value
|
|||||||||||||||||
|
|
(in millions, except percentages)
|
|||||||||||||||||||||
|
AAA
|
$
|
11,293
|
|
$
|
11,331
|
|
37
|
%
|
$
|
9,252
|
|
$
|
9,305
|
|
31
|
%
|
||||||
|
AA
|
1,898
|
|
2,114
|
|
7
|
|
1,729
|
|
1,906
|
|
6
|
|
||||||||||
|
A
|
4,760
|
|
5,243
|
|
17
|
|
5,157
|
|
5,567
|
|
18
|
|
||||||||||
|
BBB
|
10,317
|
|
10,989
|
|
35
|
|
11,739
|
|
12,340
|
|
40
|
|
||||||||||
|
Below investment grade
(1)
|
1,219
|
|
1,243
|
|
4
|
|
1,585
|
|
1,579
|
|
5
|
|
||||||||||
|
Total fixed maturities
|
$
|
29,487
|
|
$
|
30,920
|
|
100
|
%
|
$
|
29,462
|
|
$
|
30,697
|
|
100
|
%
|
||||||
(1)
The amortized cost and fair value of below investment grade securities includes interest in CLOs managed by the Company of
$6 million
and
$7 million
, respectively, at
December 31, 2017
, and
$9 million
and
$14 million
, respectively, at
December 31, 2016
.
At
December 31, 2017
and
2016
, approximately
37%
and
47%
, respectively, of the securities rated AAA were GNMA, FNMA and FHLMC mortgage backed securities.
No
holdings of any other issuer were greater than
10%
of total equity.
The following tables provide information about Available-for-Sale securities with gross unrealized losses and the length of time that individual securities have been in a continuous unrealized loss position:
|
Description of Securities
|
December 31, 2017
|
||||||||||||||||||||||||||||||||
|
Less than 12 months
|
12 months or more
|
Total
|
|||||||||||||||||||||||||||||||
|
Number of Securities
|
Fair
Value |
Unrealized
Losses |
Number of Securities
|
Fair
Value |
Unrealized
Losses |
Number of Securities
|
Fair
Value |
Unrealized
Losses |
|||||||||||||||||||||||||
|
|
(in millions, except number of securities)
|
||||||||||||||||||||||||||||||||
|
Corporate debt securities
|
150
|
|
$
|
1,791
|
|
$
|
(8
|
)
|
70
|
|
$
|
740
|
|
$
|
(24
|
)
|
220
|
|
$
|
2,531
|
|
$
|
(32
|
)
|
|||||||||
|
Residential mortgage backed securities
|
102
|
|
1,772
|
|
(11
|
)
|
130
|
|
1,467
|
|
(26
|
)
|
232
|
|
3,239
|
|
(37
|
)
|
|||||||||||||||
|
Commercial mortgage backed securities
|
67
|
|
1,178
|
|
(12
|
)
|
58
|
|
783
|
|
(24
|
)
|
125
|
|
1,961
|
|
(36
|
)
|
|||||||||||||||
|
Asset backed securities
|
36
|
|
424
|
|
(2
|
)
|
26
|
|
187
|
|
(3
|
)
|
62
|
|
611
|
|
(5
|
)
|
|||||||||||||||
|
State and municipal obligations
|
76
|
|
141
|
|
(1
|
)
|
34
|
|
180
|
|
(10
|
)
|
110
|
|
321
|
|
(11
|
)
|
|||||||||||||||
|
Foreign government bonds and obligations
|
3
|
|
6
|
|
—
|
|
15
|
|
23
|
|
(4
|
)
|
18
|
|
29
|
|
(4
|
)
|
|||||||||||||||
|
Common and preferred stocks
|
—
|
|
—
|
|
—
|
|
4
|
|
1
|
|
(1
|
)
|
4
|
|
1
|
|
(1
|
)
|
|||||||||||||||
|
Total
|
434
|
|
$
|
5,312
|
|
$
|
(34
|
)
|
337
|
|
$
|
3,381
|
|
$
|
(92
|
)
|
771
|
|
$
|
8,693
|
|
$
|
(126
|
)
|
|||||||||
|
Description of Securities
|
December 31, 2016
|
||||||||||||||||||||||||||||||||
|
Less than 12 months
|
12 months or more
|
Total
|
|||||||||||||||||||||||||||||||
|
Number of Securities
|
Fair
Value |
Unrealized
Losses |
Number of Securities
|
Fair
Value |
Unrealized
Losses |
Number of Securities
|
Fair
Value |
Unrealized
Losses |
|||||||||||||||||||||||||
|
|
(in millions, except number of securities)
|
||||||||||||||||||||||||||||||||
|
Corporate debt securities
|
187
|
|
$
|
2,452
|
|
$
|
(33
|
)
|
38
|
|
$
|
377
|
|
$
|
(27
|
)
|
225
|
|
$
|
2,829
|
|
$
|
(60
|
)
|
|||||||||
|
Residential mortgage backed securities
|
127
|
|
2,533
|
|
(33
|
)
|
177
|
|
1,290
|
|
(34
|
)
|
304
|
|
3,823
|
|
(67
|
)
|
|||||||||||||||
|
Commercial mortgage backed securities
|
100
|
|
1,583
|
|
(39
|
)
|
5
|
|
43
|
|
—
|
|
105
|
|
1,626
|
|
(39
|
)
|
|||||||||||||||
|
Asset backed securities
|
48
|
|
524
|
|
(9
|
)
|
27
|
|
298
|
|
(7
|
)
|
75
|
|
822
|
|
(16
|
)
|
|||||||||||||||
|
State and municipal obligations
|
181
|
|
374
|
|
(14
|
)
|
3
|
|
110
|
|
(21
|
)
|
184
|
|
484
|
|
(35
|
)
|
|||||||||||||||
|
Foreign government bonds and obligations
|
7
|
|
30
|
|
(1
|
)
|
15
|
|
23
|
|
(6
|
)
|
22
|
|
53
|
|
(7
|
)
|
|||||||||||||||
|
Common and preferred stocks
|
—
|
|
—
|
|
—
|
|
3
|
|
1
|
|
(1
|
)
|
3
|
|
1
|
|
(1
|
)
|
|||||||||||||||
|
Total
|
650
|
|
$
|
7,496
|
|
$
|
(129
|
)
|
268
|
|
$
|
2,142
|
|
$
|
(96
|
)
|
918
|
|
$
|
9,638
|
|
$
|
(225
|
)
|
|||||||||
121
As part of Ameriprise Financial’s ongoing monitoring process, management determined that the change in gross unrealized losses on its Available-for-Sale securities is primarily attributable to tighter credit spreads.
The following table presents a rollforward of the cumulative amounts recognized in the Consolidated Statements of Operations for other-than-temporary impairments related to credit losses on Available-for-Sale securities for which a portion of the securities’ total other-than-temporary impairments was recognized in OCI:
|
|
December 31,
|
||||||||||
|
2017
|
2016
|
2015
|
|||||||||
|
(in millions)
|
|||||||||||
|
Beginning balance
|
$
|
69
|
|
$
|
85
|
|
$
|
98
|
|
||
|
Credit losses for which an other-than-temporary impairment was not previously recognized
|
—
|
|
1
|
|
—
|
|
|||||
|
Credit losses for which an other-than-temporary impairment was previously recognized
|
1
|
|
1
|
|
2
|
|
|||||
|
Reductions for securities sold during the period (realized)
|
(68
|
)
|
(18
|
)
|
(15
|
)
|
|||||
|
Ending balance
|
$
|
2
|
|
$
|
69
|
|
$
|
85
|
|
||
Net realized gains and losses on Available-for-Sale securities, determined using the specific identification method, recognized in earnings were as follows:
|
|
Years Ended December 31,
|
||||||||||
|
2017
|
2016
|
2015
|
|||||||||
|
(in millions)
|
|||||||||||
|
Gross realized gains
|
$
|
63
|
|
$
|
37
|
|
$
|
33
|
|
||
|
Gross realized losses
|
(7
|
)
|
(13
|
)
|
(19
|
)
|
|||||
|
Other-than-temporary impairments
|
(1
|
)
|
(2
|
)
|
(8
|
)
|
|||||
|
Total
|
$
|
55
|
|
$
|
22
|
|
$
|
6
|
|
||
Other-than-temporary impairments for the years ended
December 31, 2017
and 2016 primarily related to credit losses on asset backed securities. Other-than temporary impairments for the year ended
December 31, 2015
primarily related to credit losses on corporate debt securities and non-agency residential mortgage backed securities.
See Note 18 for a rollforward of net unrealized investment gains (losses) included in AOCI.
Available-for-Sale securities by contractual maturity at
December 31, 2017
were as follows:
|
|
Amortized Cost
|
Fair
Value
|
|||||
|
(in millions)
|
|||||||
|
Due within one year
|
$
|
2,314
|
|
$
|
2,333
|
|
|
|
Due after one year through five years
|
6,819
|
|
7,020
|
|
|||
|
Due after five years through 10 years
|
3,575
|
|
3,701
|
|
|||
|
Due after 10 years
|
4,283
|
|
5,301
|
|
|||
|
|
16,991
|
|
18,355
|
|
|||
|
Residential mortgage backed securities
|
6,585
|
|
6,611
|
|
|||
|
Commercial mortgage backed securities
|
4,362
|
|
4,374
|
|
|||
|
Asset backed securities
|
1,549
|
|
1,580
|
|
|||
|
Common stocks
|
5
|
|
7
|
|
|||
|
Total
|
$
|
29,492
|
|
$
|
30,927
|
|
|
Actual maturities may differ from contractual maturities because issuers may have the right to call or prepay obligations. Residential mortgage backed securities, commercial mortgage backed securities and asset backed securities are not due at a single maturity date. As such, these securities, as well as common stocks, were not included in the maturities distribution.
122
6.
Financing Receivables
The Company’s financing receivables include commercial mortgage loans, syndicated loans, consumer loans, policy loans, certificate loans, advisor loans and margin loans. See Note 2 for information regarding the Company’s accounting policies related to loans and the allowance for loan losses.
Allowance for Loan Losses
Commercial Mortgage Loans, Syndicated Loans and Consumer Loans
The following table presents a rollforward of the allowance for loan losses for the years ended and the ending balance of the allowance for loan losses by impairment method:
|
|
December 31,
|
||||||||||
|
2017
|
2016
|
2015
|
|||||||||
|
(in millions)
|
|||||||||||
|
Beginning balance
|
$
|
29
|
|
$
|
32
|
|
$
|
35
|
|
||
|
Charge-offs
|
(2
|
)
|
(5
|
)
|
(4
|
)
|
|||||
|
Provisions
|
(1
|
)
|
2
|
|
1
|
|
|||||
|
Ending balance
|
$
|
26
|
|
$
|
29
|
|
$
|
32
|
|
||
|
Individually evaluated for impairment
|
$
|
—
|
|
$
|
2
|
|
$
|
4
|
|
||
|
Collectively evaluated for impairment
|
26
|
|
27
|
|
28
|
|
|||||
The recorded investment in financing receivables by impairment method was as follows:
|
|
December 31,
|
||||||
|
2017
|
2016
|
||||||
|
(in millions)
|
|||||||
|
Individually evaluated for impairment
|
$
|
17
|
|
$
|
12
|
|
|
|
Collectively evaluated for impairment
|
3,258
|
|
3,480
|
|
|||
|
Total
|
$
|
3,275
|
|
$
|
3,492
|
|
|
As of
December 31, 2017
and
2016
, the Company’s recorded investment in financing receivables individually evaluated for impairment for which there was no related allowance for loan losses was
$17 million
and
$7 million
, respectively. Unearned income, unamortized premiums and discounts, and net unamortized deferred fees and costs are not material to the Company’s total loan balance.
During the years ended
December 31, 2017
,
2016
and
2015
, the Company purchased
$200 million
,
$92 million
and
$162 million
, respectively, and sold
$267 million
,
$271 million
and
$16 million
, respectively, of loans. See below for further discussion on the sale of consumer loans.
The Company has not acquired any loans with deteriorated credit quality as of the acquisition date.
Loans to Financial Advisors
As of December 31, 2017 and 2016, principal amounts outstanding for advisor loans were
$509 million
and
$426 million
, respectively, and allowance for loan losses were
$23 million
and
$18 million
, respectively. The allowance for loan losses related to loans to financial advisors is not included in the table disclosures above. Of the gross balance outstanding, the portion associated with financial advisors who are no longer affiliated with the Company was
$19 million
and
$16 million
at December 31, 2017 and 2016, respectively. The allowance for loan losses on these loans was
$12 million
and
$10 million
at December 31, 2017 and 2016, respectively.
Credit Quality Information
Nonperforming loans, which are generally loans 90 days or more past due, were
$19 million
and
$15 million
as of
December 31, 2017
and
2016
, respectively. All other loans were considered to be performing.
Commercial Mortgage Loans
The Company reviews the credit worthiness of the borrower and the performance of the underlying properties in order to determine the risk of loss on commercial mortgage loans. Based on this review, the commercial mortgage loans are assigned an internal risk rating, which management updates as necessary. Commercial mortgage loans which management has assigned its highest risk rating were
nil
of total commercial mortgage loans as of both
December 31, 2017
and
2016
. Loans with the highest risk rating represent distressed loans which the Company has identified as impaired or expects to become delinquent or enter into foreclosure within the next six months. In addition, the Company reviews the concentrations of credit risk by region and property type.
123
Concentrations of credit risk of commercial mortgage loans by U.S. region were as follows:
|
|
Loans
|
Percentage
|
|||||||||||
|
December 31,
|
December 31,
|
||||||||||||
|
2017
|
2016
|
2017
|
2016
|
||||||||||
|
(in millions)
|
|
|
|||||||||||
|
East North Central
|
$
|
215
|
|
$
|
198
|
|
8
|
%
|
7
|
%
|
|||
|
East South Central
|
90
|
|
88
|
|
3
|
|
3
|
|
|||||
|
Middle Atlantic
|
192
|
|
203
|
|
7
|
|
8
|
|
|||||
|
Mountain
|
256
|
|
240
|
|
9
|
|
9
|
|
|||||
|
New England
|
74
|
|
91
|
|
3
|
|
3
|
|
|||||
|
Pacific
|
812
|
|
746
|
|
29
|
|
28
|
|
|||||
|
South Atlantic
|
768
|
|
783
|
|
28
|
|
29
|
|
|||||
|
West North Central
|
235
|
|
222
|
|
8
|
|
8
|
|
|||||
|
West South Central
|
133
|
|
131
|
|
5
|
|
5
|
|
|||||
|
|
2,775
|
|
2,702
|
|
100
|
%
|
100
|
%
|
|||||
|
Less: allowance for loan losses
|
19
|
|
21
|
|
|
||||||||
|
Total
|
$
|
2,756
|
|
$
|
2,681
|
|
|||||||
Concentrations of credit risk of commercial mortgage loans by property type were as follows:
|
|
Loans
|
Percentage
|
|||||||||||
|
December 31,
|
December 31,
|
||||||||||||
|
2017
|
2016
|
2017
|
2016
|
||||||||||
|
(in millions)
|
|
|
|||||||||||
|
Apartments
|
$
|
566
|
|
$
|
504
|
|
20
|
%
|
19
|
%
|
|||
|
Hotel
|
40
|
|
42
|
|
1
|
|
1
|
|
|||||
|
Industrial
|
476
|
|
446
|
|
17
|
|
17
|
|
|||||
|
Mixed use
|
44
|
|
49
|
|
2
|
|
2
|
|
|||||
|
Office
|
492
|
|
489
|
|
18
|
|
18
|
|
|||||
|
Retail
|
937
|
|
950
|
|
34
|
|
35
|
|
|||||
|
Other
|
220
|
|
222
|
|
8
|
|
8
|
|
|||||
|
|
2,775
|
|
2,702
|
|
100
|
%
|
100
|
%
|
|||||
|
Less: allowance for loan losses
|
19
|
|
21
|
|
|
||||||||
|
Total
|
$
|
2,756
|
|
$
|
2,681
|
|
|||||||
Syndicated Loans
The recorded investment in syndicated loans at
December 31, 2017
and
2016
was
$498 million
and
$482 million
, respectively. The Company’s syndicated loan portfolio is diversified across industries and issuers. The primary credit indicator for syndicated loans is whether the loans are performing in accordance with the contractual terms of the syndication. Total nonperforming syndicated loans at
December 31, 2017
and
2016
were
$5 million
and
$1 million
, respectively.
Consumer Loans
The recorded investment in consumer loans at
December 31, 2017
and
2016
was
$2 million
and
$308 million
, respectively.
During the years ended
December 31, 2017
and
2016
, the Company sold
$252 million
and
$271 million
, respectively, of its consumer mortgage loans and recorded a loss of
$7 million
and
$11 million
, respectively.
The Company considers the credit worthiness of borrowers (FICO score), collateral characteristics such as LTV and geographic concentration in determining the allowance for loan losses for consumer loans. At a minimum, management updates FICO scores and LTV ratios semiannually. As of December 31, 2016, approximately
2%
of consumer loans had FICO scores below
640
. Consumer loans with LTV ratios greater than
90%
were not material at December 31, 2016. The Company’s most significant geographic concentration for consumer loans was in California, Colorado and Washington, which represented
52%
,
18%
and
13%
, respectively, of the portfolio as of December 31, 2016. No other state represented more than 10% of the total consumer loan portfolio. Consumer loans as of December 31, 2017 were not material.
124
Troubled Debt Restructurings
The recorded investment in restructured loans was not material as of
December 31, 2017
and
2016
. Troubled debt restructurings did not have a material impact to the Company’s allowance for loan losses or income recognized for the years ended
December 31, 2017
,
2016
and
2015
. There are
no
commitments to lend additional funds to borrowers whose loans have been restructured.
7.
Reinsurance
The Company reinsures a portion of the insurance risks associated with its traditional life, DI and LTC insurance products through reinsurance agreements with unaffiliated reinsurance companies. Reinsurance contracts do not relieve the Company from its primary obligation to policyholders.
The Company generally reinsures
90%
of the death benefit liability for new term life insurance policies beginning in 2001 and new individual UL and VUL insurance policies beginning in 2002. Policies issued prior to these dates are not subject to these same reinsurance levels.
However, for IUL policies issued after September 1, 2013 and VUL policies issued after January 1, 2014, the Company generally reinsures
50%
of the death benefit liability. Similarly, the Company reinsures
50%
of the death benefit and morbidity liabilities related to its universal life product with long term care benefits.
The maximum amount of life insurance risk the Company will retain is
$10 million
on a single life and
$10 million
on any flexible premium survivorship life policy; however, reinsurance agreements are in place such that retaining more than
$1.5 million
of insurance risk on a single life or a flexible premium survivorship life policy is very unusual. Risk on UL and VUL policies is reinsured on a yearly renewable term basis. Risk on most term life policies starting in 2001 is reinsured on a coinsurance basis, a type of reinsurance in which the reinsurer participates proportionally in all material risks and premiums associated with a policy.
For existing LTC policies, the Company has continued ceding
50%
of the risk on a coinsurance basis to subsidiaries of Genworth Financial, Inc. (“Genworth”) and retains the remaining risk. For RiverSource Life of NY, this reinsurance arrangement applies for 1996 and later issues only. Under these agreements, the Company has the right, but never the obligation, to recapture some, or all, of the risk ceded to Genworth.
Generally, the Company retains at most
$5,000
per month of risk per life on DI policies sold on policy forms introduced in most states starting in 2007 and reinsures the remainder of the risk on a coinsurance basis with unaffiliated reinsurance companies. The Company retains all risk for new claims on DI contracts sold on other policy forms introduced prior to 2007. The Company also retains all risk on accidental death benefit claims and substantially all risk associated with waiver of premium provisions.
As of
December 31, 2017
and
2016
, traditional life and UL insurance in force aggregated
$195.9 billion
and $
196.5 billion
, respectively, of which
$142.4 billion
as of both
December 31, 2017
and
2016
were reinsured at the respective year ends.
The effect of reinsurance on premiums for the Company’s traditional long-duration contracts was as follows:
|
|
Years Ended December 31,
|
||||||||||
|
2017
|
2016
|
2015
|
|||||||||
|
(in millions)
|
|||||||||||
|
Direct premiums
|
$
|
637
|
|
$
|
642
|
|
$
|
629
|
|
||
|
Reinsurance ceded
|
(227
|
)
|
(225
|
)
|
(223
|
)
|
|||||
|
Net premiums
|
$
|
410
|
|
$
|
417
|
|
$
|
406
|
|
||
Cost of insurance and administrative charges for non-traditional long-duration products are reflected in other revenues and were net of reinsurance ceded of
$114 million
,
$110 million
and
$107 million
for the years ended
December 31, 2017
,
2016
and
2015
, respectively.
The Company reinsures a portion of the risks associated with its personal auto, home and umbrella insurance products through reinsurance agreements with unaffiliated reinsurance companies. The primary reinsurance programs in 2017 include:
|
•
|
auto and home reinsurance with a limit of
$5 million
per loss and the Company retained
$1 million
per loss.
|
|
•
|
catastrophe reinsurance with a limit of
$200 million
for the first event and
$180 million
for a second event and the Company retained
$20 million
per event.
|
|
•
|
ceding
90%
of every personal umbrella loss with a limit of
$5 million
per loss.
|
|
•
|
ceding
90%
of home insurance products originating from a certain agency.
|
125
The effect of reinsurance on premiums for the Company’s short-duration contracts was as follows:
|
|
Years Ended December 31,
|
||||||||||
|
2017
|
2016
|
2015
|
|||||||||
|
(in millions)
|
|||||||||||
|
Written premiums
|
|||||||||||
|
Direct
|
$
|
1,119
|
|
$
|
1,085
|
|
$
|
1,093
|
|
||
|
Ceded
|
(171
|
)
|
(20
|
)
|
(19
|
)
|
|||||
|
Total net written premiums
|
$
|
948
|
|
$
|
1,065
|
|
$
|
1,074
|
|
||
|
Earned premiums
|
|||||||||||
|
Direct
|
$
|
1,107
|
|
$
|
1,094
|
|
$
|
1,068
|
|
||
|
Ceded
|
(123
|
)
|
(20
|
)
|
(19
|
)
|
|||||
|
Total net earned premiums
|
$
|
984
|
|
$
|
1,074
|
|
$
|
1,049
|
|
||
Reinsurance recovered on all contracts was
$357 million
,
$323 million
and
$295 million
for the years ended
December 31, 2017
,
2016
and
2015
, respectively.
Receivables included
$3.0 billion
and
$2.7 billion
of reinsurance recoverables as of
December 31, 2017
and
2016
, respectively, including
$2.3 billion
and
$2.0 billion
related to LTC risk ceded to Genworth, respectively. Policyholder account balances, future policy benefits and claims include
$509 million
and
$529 million
related to previously assumed reinsurance arrangements as of
December 31, 2017
and
2016
, respectively.
8.
Goodwill and Other Intangible Assets
Goodwill and intangible assets deemed to have indefinite lives are not amortized but are instead subject to impairment tests. There were no impairments for the years ended
December 31, 2017
,
2016
and
2015
.
The changes in the carrying amount of goodwill reported in the Company’s main operating segments were as follows:
|
Advice & Wealth
Management |
Asset
Management |
Annuities
|
Protection
|
Consolidated
|
|||||||||||||||
|
(in millions)
|
|||||||||||||||||||
|
Balance at January 1, 2016
|
$
|
252
|
|
$
|
794
|
|
$
|
46
|
|
$
|
45
|
|
$
|
1,137
|
|
||||
|
Acquisitions
(1)
|
—
|
|
19
|
|
—
|
|
—
|
|
19
|
|
|||||||||
|
Foreign currency translation
|
—
|
|
(51
|
)
|
—
|
|
—
|
|
(51
|
)
|
|||||||||
|
Purchase price adjustments
|
—
|
|
(1
|
)
|
—
|
|
—
|
|
(1
|
)
|
|||||||||
|
Balance at December 31, 2016
|
252
|
|
761
|
|
46
|
|
45
|
|
1,104
|
|
|||||||||
|
Acquisitions
(2)
|
27
|
|
22
|
|
—
|
|
—
|
|
49
|
|
|||||||||
|
Foreign currency translation
|
—
|
|
24
|
|
—
|
|
—
|
|
24
|
|
|||||||||
|
Purchase price adjustments
|
—
|
|
(2
|
)
|
—
|
|
—
|
|
(2
|
)
|
|||||||||
|
Balance at December 31, 2017
|
$
|
279
|
|
$
|
805
|
|
$
|
46
|
|
$
|
45
|
|
$
|
1,175
|
|
||||
(1)
Relates to the Company’s acquisition of Emerging Global Advisors, LLC (“EGA”).
(2)
Relates to the Company’s acquisitions of Investment Professionals, Inc. (“IPI”) and Lionstone Partners, LLC.
As of
December 31, 2017
and
2016
, the carrying amount of indefinite-lived intangible assets included
$647 million
and
$645 million
, respectively, of investment management contracts. As of both
December 31, 2017
and
2016
, the carrying amount of indefinite-lived intangible assets included
$67 million
of trade names.
126
Definite-lived intangible assets consisted of the following:
|
|
December 31, 2017
|
December 31, 2016
|
|||||||||||||||||||||
|
Gross Carrying Amount
|
Accumulated Amortization
|
Net
Carrying Amount
|
Gross Carrying Amount
|
Accumulated Amortization
|
Net
Carrying Amount
|
||||||||||||||||||
|
(in millions)
|
|||||||||||||||||||||||
|
Customer relationships
|
$
|
194
|
|
$
|
(124
|
)
|
$
|
70
|
|
$
|
144
|
|
$
|
(112
|
)
|
$
|
32
|
|
|||||
|
Contracts
|
222
|
|
(194
|
)
|
28
|
|
213
|
|
(177
|
)
|
36
|
|
|||||||||||
|
Other
|
156
|
|
(116
|
)
|
40
|
|
141
|
|
(101
|
)
|
40
|
|
|||||||||||
|
Total
|
$
|
572
|
|
$
|
(434
|
)
|
$
|
138
|
|
$
|
498
|
|
$
|
(390
|
)
|
$
|
108
|
|
|||||
Definite-lived intangible assets acquired during the year ended
December 31, 2017
were
$54 million
with a weighted average amortization period of
9
years. The aggregate amortization expense for definite-lived intangible assets during the years ended
December 31, 2017
,
2016
and
2015
was
$27 million
,
$28 million
and
$33 million
, respectively. In
2017
,
2016
and
2015
, the Company did not record any impairment charges on definite-lived intangible assets.
Estimated intangible amortization expense as of
December 31, 2017
for the next five years is as follows:
|
|
(in millions)
|
||
|
2018
|
$
|
29
|
|
|
2019
|
26
|
|
|
|
2020
|
20
|
|
|
|
2021
|
17
|
|
|
|
2022
|
15
|
|
|
9.
Deferred Acquisition Costs and Deferred Sales Inducement Costs
In the third quarter of the year, management updated market-related inputs and implemented model changes related to our living benefit valuation. In addition, management conducted its annual review of life insurance and annuity valuation assumptions relative to current experience and management expectations including modeling changes. These aforementioned changes are collectively referred to as unlocking. The impact of unlocking to DAC for the year ended December 31, 2017 primarily reflected improved persistency and mortality on life insurance contracts and a correction related to a variable annuity model assumption partially offset by updates to market-related inputs to the living benefit valuation. The impact of unlocking to DAC for the year ended December 31, 2016 primarily reflected low interest rates that more than offset benefits from persistency on annuity contracts without living benefits. In addition, the Company’s review of its closed LTC business in the prior year resulted in the write-off of DAC, which was included in the impact of unlocking. The impact of unlocking to DAC for the year ended December 31, 2015 primarily reflected the difference between the Company’s previously assumed interest rates versus the low interest rate environment partially offset by improved persistency.
The balances of and changes in DAC were as follows:
|
2017
|
2016
|
2015
|
||||||||||
|
(in millions)
|
||||||||||||
|
Balance at January 1
|
$
|
2,648
|
|
$
|
2,730
|
|
$
|
2,613
|
|
|||
|
Capitalization of acquisition costs
|
302
|
|
360
|
|
(1)
|
361
|
|
|||||
|
Amortization, excluding the impact of valuation assumptions review
|
(279
|
)
|
(334
|
)
|
(348
|
)
|
||||||
|
Amortization, impact of valuation assumptions review
|
12
|
|
(81
|
)
|
(2)
|
(6
|
)
|
|||||
|
Impact of change in net unrealized securities (gains) losses
|
(7
|
)
|
(27
|
)
|
110
|
|
||||||
|
Balance a December 31
|
$
|
2,676
|
|
$
|
2,648
|
|
$
|
2,730
|
|
|||
(1)
Includes a
$27 million
benefit
related to the write-off of the deferred
reinsurance liability in connection with the loss recognition on LTC business. The benefit was reported in Distribution expenses on the Consolidated Statements of Operations.
(2)
Includes a
$58 million
expense related to the loss recognition on LTC business.
127
The balances of and changes in DSIC, which is included in other assets, were as follows:
|
2017
|
2016
|
2015
|
|||||||||
|
(in millions)
|
|||||||||||
|
Balance at January 1
|
$
|
302
|
|
$
|
335
|
|
$
|
362
|
|
||
|
Capitalization of sales inducement costs
|
4
|
|
5
|
|
4
|
|
|||||
|
Amortization, excluding the impact of valuation assumptions review
|
(35
|
)
|
(42
|
)
|
(52
|
)
|
|||||
|
Amortization, impact of valuation assumptions review
|
(1
|
)
|
4
|
|
1
|
|
|||||
|
Impact of change in net unrealized securities (gains) losses
|
6
|
|
—
|
|
20
|
|
|||||
|
Balance at December 31
|
$
|
276
|
|
$
|
302
|
|
$
|
335
|
|
||
10.
Policyholder Account Balances, Future Policy Benefits and Claims and Separate Account Liabilities
Policyholder account balances, future policy benefits and claims consisted of the following:
|
|
December 31,
|
|||||||
|
2017
|
2016
|
|||||||
|
(in millions)
|
||||||||
|
Policyholder account balances
|
||||||||
|
Fixed annuities
(1)
|
$
|
9,934
|
|
$
|
10,588
|
|
||
|
Variable annuity fixed sub-accounts
|
5,166
|
|
5,211
|
|
||||
|
VUL/UL insurance
|
3,047
|
|
3,007
|
|
||||
|
IUL insurance
|
1,384
|
|
1,054
|
|
||||
|
Other life insurance
|
720
|
|
758
|
|
||||
|
Total policyholder account balances
|
20,251
|
|
20,618
|
|
||||
|
Future policy benefits
|
||||||||
|
Variable annuity GMWB
|
463
|
|
|
1,017
|
|
|||
|
Variable annuity GMAB
|
(80
|
)
|
(2)
|
(24
|
)
|
(2)
|
||
|
Other annuity liabilities
|
78
|
|
66
|
|
||||
|
Fixed annuity life contingent liabilities
|
1,484
|
|
1,497
|
|
||||
|
Life and DI insurance
|
1,221
|
|
1,204
|
|
||||
|
LTC insurance
|
4,896
|
|
4,352
|
|
||||
|
VUL/UL and other life insurance additional liabilities
|
688
|
|
588
|
|
||||
|
Total future policy benefits
|
8,750
|
|
8,700
|
|
||||
|
Policy claims and other policyholders’ funds
|
903
|
|
884
|
|
||||
|
Total policyholder account balances, future policy benefits and claims
|
$
|
29,904
|
|
$
|
30,202
|
|
||
|
(1)
|
Includes fixed deferred annuities, non-life contingent fixed payout annuities and indexed annuity host contracts.
|
(2)
Includes the fair value of GMAB embedded derivatives that was a net asset as of both December 31, 2017 and 2016 reported as a contra liability.
Fixed Annuities
Fixed annuities include deferred, payout and indexed annuity contracts.
Deferred contracts offer a guaranteed minimum rate of interest and security of the principal invested. Payout contracts guarantee a fixed income payment for life or the term of the contract. Liabilities for fixed annuities in a benefit or payout status are based on future estimated payments using established industry mortality tables and interest rates, ranging from
2.71%
to
9.38%
at December 31,
2017
, depending on year of issue, with an average rate of approximately
4.09%
. The Company generally invests the proceeds from the annuity contracts in fixed rate securities.
The Company’s equity indexed annuity (“EIA”) product is a single premium fixed deferred annuity. The Company discontinued new sales of EIA in 2007. The contract was issued with an initial term of
seven
years and interest earnings are linked to the performance of the S&P 500
®
Index. This annuity has a minimum interest rate guarantee of
3%
on
90%
of the initial premium, adjusted for any surrenders. The Company generally invests the proceeds from the annuity contracts in fixed rate securities and hedges the equity risk with derivative instruments.
128
In November 2017, the Company began offering a fixed index annuity product which is a fixed annuity that includes an indexed account. The rate of interest credited above the minimum guarantee for funds allocated to the indexed account is linked to the performance of the specific index for the indexed account (subject to a cap). The Company offers S&P 500
®
Index and MSCI
®
EAFE Index account options. Both options offer two crediting durations, one-year and two-year. The contractholder may allocate all or a portion of the policy value to a fixed or indexed account. The portion of the policy allocated to the indexed account is accounted for as an embedded derivative. The Company hedges the interest credited rate including equity and interest rate risk related to the indexed account with derivative instruments. The contractholder can choose to add a GMWB for life rider for an additional fee.
See Note 16 for additional information regarding the Company’s derivative instruments used to hedge the risk related to indexed annuities.
Variable Annuities
Purchasers of variable annuities can select from a variety of investment options and can elect to allocate a portion to a fixed account. A vast majority of the premiums received for variable annuity contracts are held in separate accounts where the assets are held for the exclusive benefit of those contractholders.
Most of the variable annuity contracts currently issued by the Company contain one or more guaranteed benefits, including GMWB, GMAB, GMDB and GGU provisions. The Company previously offered contracts with GMIB provisions. See Note 2 and Note 11 for additional information regarding the Company’s variable annuity guarantees. The Company does not currently hedge its risk under the GGU and GMIB provisions. See Note 14 and Note 16 for additional information regarding the Company’s derivative instruments used to hedge risks related to GMWB, GMAB and GMDB provisions.
Insurance Liabilities
VUL/UL is the largest group of insurance policies written by the Company. Purchasers of VUL can select from a variety of investment options and can elect to allocate a portion to a fixed account or a separate account. A vast majority of the premiums received for VUL policies are held in separate accounts where the assets are held for the exclusive benefit of those policyholders.
IUL is a universal life policy that includes an indexed account. The rate of credited interest above the minimum guarantee for funds allocated to the indexed account is linked to the performance of the specific index for the indexed account (subject to a cap and floor). The Company offers an S&P 500
®
Index account option and a blended multi-index account option comprised of the S&P 500 Index, the MSCI
®
EAFE Index and the MSCI EM Index. Both options offer two crediting durations, one-year and two-year. The policyholder may allocate all or a portion of the policy value to a fixed or any available indexed account. The portion of the policy allocated to the indexed account is accounted for as an embedded derivative at fair value. The Company hedges the interest credited rate including equity and interest rate risk related to the indexed account with derivative instruments. See Note 16 for additional information regarding the Company's derivative instruments used to hedge the risk related to IUL.
The Company also offers term life insurance as well as DI products. The Company no longer offers standalone LTC products and whole life insurance but has in force policies from prior years.
Insurance liabilities include accumulation values, incurred but not reported claims, obligations for anticipated future claims, unpaid reported claims and claim adjustment expenses.
The liability for estimates of benefits that will become payable on future claims on term life, whole life and DI policies is based on the net level premium and LTC policies is based on a gross premium valuation reflecting management’s current best estimate assumptions. Both include the anticipated interest rates earned on assets supporting the liability. Anticipated interest rates for term and whole life ranged from
3%
to
10%
at December 31,
2017
. Anticipated interest rates for DI policies ranged from
3.75%
to
7.5%
at December 31,
2017
and for LTC policies ranged from
6%
to
6.4%
at December 31,
2017
.
The liability for unpaid reported claims on DI and LTC policies includes an estimate of the present value of obligations for continuing benefit payments. The discount rates used to calculate present values are based on average interest rates earned on assets supporting the liability for unpaid amounts and were
4.5%
and
6.25%
for DI and LTC claims, respectively, at December 31,
2017
.
The balance of insurance liabilities related to unpaid reported and unreported claims and claim adjustment expenses for auto and home was
$722 million
and
$683 million
as of
December 31, 2017
and
2016
, respectively. The balance of insurance liabilities related to unpaid reported claims and claim adjustment expenses for life, DI and LTC policies was
$1.3 billion
and
$1.2 billion
as of
December 31, 2017
and
2016
, respectively.
The change in the liability for prior year incurred unpaid reported and unreported claims and claim adjustment expenses related to auto and home, life, DI and LTC policies was a decrease of
$41 million
,
$24 million
and
$2 million
for the years
2017
,
2016
and
2015
, respectively.
|
•
|
In 2017, there was a
$50 million
decrease primarily reflecting favorable closed claim trends of LTC policies partially offset by an increase of
$9 million
related to updated estimates for prior year catastrophes recognized in the current year along with a slight increase in non-catastrophe claims.
|
|
•
|
In 2016, there was a
$6 million
decrease primarily reflecting favorable closed claim trends of DI and LTC policies and a decrease of
$18 million
related to favorable prior year reserve development for auto and home business of
$20 million
partially offset by unfavorable prior year catastrophe reserve development of
$2 million
.
|
129
|
•
|
In 2015, there was a
$60 million
decrease primarily reflecting favorable closed claim trends of DI and LTC policies and from an update to assumptions related to life rider benefits partially offset by an increase of
$58 million
related to elevated frequency and severity experience for auto injury claims for 2014 and prior accident years as well as a more gradual than anticipated improvement of 2014 and prior years existing claims and unfavorable prior year catastrophe reserve development associated with 2014 hail storms.
|
Portions of the Company’s UL and VUL policies have product features that result in profits followed by losses from the insurance component of the policy. These profits followed by losses can be generated by the cost structure of the product or secondary guarantees in the policy. The secondary guarantee ensures that, subject to specified conditions, the policy will not terminate and will continue to provide a death benefit even if there is insufficient policy value to cover the monthly deductions and charges.
Separate Account Liabilities
Separate account liabilities consisted of the following:
|
|
December 31,
|
||||||
|
2017
|
2016
|
||||||
|
(in millions)
|
|||||||
|
Variable annuity
|
$
|
75,174
|
|
$
|
69,606
|
|
|
|
VUL insurance
|
7,352
|
|
6,659
|
|
|||
|
Other insurance
|
34
|
|
33
|
|
|||
|
Threadneedle investment liabilities
|
4,808
|
|
3,912
|
|
|||
|
Total
|
$
|
87,368
|
|
$
|
80,210
|
|
|
Threadneedle Investment Liabilities
Threadneedle provides a range of unitized pooled pension funds, which invest in property, stocks, bonds and cash. The investments are selected by the clients and are based on the level of risk they are willing to assume. All investment performance, net of fees, is passed through to the investors. The value of the liabilities represents the fair value of the pooled pension funds.
11.
Variable Annuity and Insurance Guarantees
The majority of the variable annuity contracts offered by the Company contain GMDB provisions. The Company also offers variable annuities with GGU, GMWB and GMAB provisions. The Company previously offered contracts containing GMIB provisions. See Note 2 and Note 10 for additional information regarding the Company’s variable annuity guarantees.
The GMDB and GGU provisions provide a specified minimum return upon death of the contractholder. The death benefit payable is the greater of (i) the contract value less any purchase payment credits subject to recapture less a pro-rata portion of any rider fees, or (ii) the GMDB provisions specified in the contract. The Company has the following primary GMDB provisions:
|
•
|
Return of premium — provides purchase payments minus adjusted partial surrenders.
|
|
•
|
Reset — provides that the value resets to the account value every sixth contract anniversary minus adjusted partial surrenders. This provision was often provided in combination with the return of premium provision and is no longer offered.
|
|
•
|
Ratchet — provides that the value ratchets up to the maximum account value at specified anniversary intervals, plus subsequent purchase payments less adjusted partial surrenders.
|
The variable annuity contracts with GMWB riders typically have account values that are based on an underlying portfolio of mutual funds, the values of which fluctuate based on fund performance. At issue, the guaranteed amount is equal to the amount deposited but the guarantee may be increased annually to the account value (a “step-up”) in the case of favorable market performance or by a benefit credit if the contract includes this provision.
The Company has GMWB riders in force, which contain one or more of the following provisions:
|
•
|
Withdrawals at a specified rate per year until the amount withdrawn is equal to the guaranteed amount.
|
|
•
|
Withdrawals at a specified rate per year for the life of the contractholder (“GMWB for life”).
|
|
•
|
Withdrawals at a specified rate per year for joint contractholders while either is alive.
|
|
•
|
Withdrawals based on performance of the contract.
|
|
•
|
Withdrawals based on the age withdrawals begin.
|
|
•
|
Credits are applied annually for a specified number of years to increase the guaranteed amount as long as withdrawals have not been taken.
|
Variable annuity contractholders age
79
or younger at contract issue can also obtain a principal-back guarantee by purchasing the optional GMAB rider for an additional charge. The GMAB rider guarantees that, regardless of market performance at the end of the
10
-year waiting period, the contract value will be no less than the original investment or a specified percentage of the highest
130
anniversary value, adjusted for withdrawals. If the contract value is less than the guarantee at the end of the
10
-year period, a lump sum will be added to the contract value to make the contract value equal to the guarantee value.
Certain UL policies offered by the Company provide secondary guarantee benefits. The secondary guarantee ensures that, subject to specified conditions, the policy will not terminate and will continue to provide a death benefit even if there is insufficient policy value to cover the monthly deductions and charges.
The following table provides information related to variable annuity guarantees for which the Company has established additional liabilities:
|
Variable Annuity Guarantees by Benefit Type
(1)
|
December 31, 2017
|
December 31, 2016
|
||||||||||||||||||||||||||
|
Total Contract Value
|
Contract Value in Separate Accounts
|
Net Amount at Risk
|
Weighted Average Attained Age
|
Total Contract Value
|
Contract Value in Separate Accounts
|
Net Amount at Risk
|
Weighted Average Attained Age
|
|||||||||||||||||||||
|
|
(in millions, except age)
|
|||||||||||||||||||||||||||
|
GMDB:
|
||||||||||||||||||||||||||||
|
Return of premium
|
$
|
61,418
|
|
$
|
59,461
|
|
$
|
9
|
|
66
|
$
|
56,143
|
|
$
|
54,145
|
|
$
|
208
|
|
65
|
||||||||
|
Five/six-year reset
|
8,870
|
|
6,149
|
|
12
|
|
66
|
8,878
|
|
6,170
|
|
22
|
|
66
|
||||||||||||||
|
One-year ratchet
|
6,548
|
|
6,187
|
|
11
|
|
69
|
6,426
|
|
6,050
|
|
110
|
|
68
|
||||||||||||||
|
Five-year ratchet
|
1,563
|
|
1,506
|
|
1
|
|
65
|
1,542
|
|
1,483
|
|
7
|
|
64
|
||||||||||||||
|
Other
|
1,099
|
|
1,075
|
|
50
|
|
72
|
965
|
|
942
|
|
86
|
|
71
|
||||||||||||||
|
Total — GMDB
|
$
|
79,498
|
|
$
|
74,378
|
|
$
|
83
|
|
66
|
$
|
73,954
|
|
$
|
68,790
|
|
$
|
433
|
|
65
|
||||||||
|
GGU death benefit
|
$
|
1,118
|
|
$
|
1,067
|
|
$
|
133
|
|
70
|
$
|
1,047
|
|
$
|
996
|
|
$
|
108
|
|
68
|
||||||||
|
GMIB
|
$
|
233
|
|
$
|
216
|
|
$
|
7
|
|
69
|
$
|
245
|
|
$
|
227
|
|
$
|
13
|
|
68
|
||||||||
|
GMWB:
|
||||||||||||||||||||||||||||
|
GMWB
|
$
|
2,508
|
|
$
|
2,500
|
|
$
|
1
|
|
71
|
$
|
2,650
|
|
$
|
2,642
|
|
$
|
2
|
|
70
|
||||||||
|
GMWB for life
|
44,375
|
|
44,259
|
|
129
|
|
67
|
39,436
|
|
39,282
|
|
289
|
|
(2)
|
66
|
|||||||||||||
|
Total — GMWB
|
$
|
46,883
|
|
$
|
46,759
|
|
$
|
130
|
|
67
|
$
|
42,086
|
|
$
|
41,924
|
|
$
|
291
|
|
66
|
||||||||
|
GMAB
|
$
|
3,086
|
|
$
|
3,083
|
|
$
|
—
|
|
59
|
$
|
3,484
|
|
$
|
3,476
|
|
$
|
21
|
|
59
|
||||||||
(1)
Individual variable annuity contracts may have more than one guarantee and therefore may be included in more than one benefit type. Variable annuity contracts for which the death benefit equals the account value are not shown in this table.
(2)
Amount revised to reflect updated contractholder mortality assumptions as of December 31, 2016.
The net amount at risk for GMDB, GGU and GMAB is defined as the current guaranteed benefit amount in excess of the current contract value. The net amount at risk for GMIB is defined as the greater of the present value of the minimum guaranteed annuity payments less the current contract value or zero. The net amount at risk for GMWB is defined as the greater of the present value of the minimum guaranteed withdrawal payments less the current contract value or zero.
The following table provides information related to insurance guarantees for which the Company has established additional liabilities:
|
|
December 31, 2017
|
|
December 31, 2016
|
||||||||
|
Net Amount at Risk
|
Weighted Average Attained Age
|
Net Amount at Risk
|
Weighted Average Attained Age
|
||||||||
|
(in millions, except age)
|
|||||||||||
|
UL secondary guarantees
|
$
|
6,460
|
|
65
|
$
|
6,376
|
|
64
|
|||
The net amount at risk for UL secondary guarantees is defined as the current guaranteed death benefit amount in excess of the current policyholder account balance.
131
Changes in additional liabilities (contra liabilities) for variable annuity and insurance guarantees were as follows:
|
|
GMDB & GGU
|
GMIB
|
GMWB
(1)
|
GMAB
(1)
|
UL
|
||||||||||||||
|
(in millions)
|
|||||||||||||||||||
|
Balance at January 1, 2015
|
$
|
9
|
|
$
|
7
|
|
$
|
693
|
|
$
|
(41
|
)
|
$
|
263
|
|
||||
|
Incurred claims
|
10
|
|
1
|
|
364
|
|
41
|
|
92
|
|
|||||||||
|
Paid claims
|
(5
|
)
|
—
|
|
—
|
|
—
|
|
(23
|
)
|
|||||||||
|
Balance at December 31, 2015
|
14
|
|
8
|
|
1,057
|
|
—
|
|
332
|
|
|||||||||
|
Incurred claims
|
11
|
|
1
|
|
(40
|
)
|
(23
|
)
|
127
|
|
|||||||||
|
Paid claims
|
(9
|
)
|
(1
|
)
|
—
|
|
(1
|
)
|
(25
|
)
|
|||||||||
|
Balance at December 31, 2016
|
16
|
|
8
|
|
1,017
|
|
(24
|
)
|
434
|
|
|||||||||
|
Incurred claims
|
5
|
|
—
|
|
(554
|
)
|
(56
|
)
|
84
|
|
|||||||||
|
Paid claims
|
(4
|
)
|
(2
|
)
|
—
|
|
—
|
|
(29
|
)
|
|||||||||
|
Balance at December 31, 2017
|
$
|
17
|
|
$
|
6
|
|
$
|
463
|
|
$
|
(80
|
)
|
$
|
489
|
|
||||
(1)
The incurred claims for GMWB and GMAB represent the change in the fair value of the liabilities (contra liabilities) less paid claims.
The liabilities for guaranteed benefits are supported by general account assets.
The following table summarizes the distribution of separate account balances by asset type for variable annuity contracts providing guaranteed benefits:
|
|
December 31,
|
||||||
|
2017
|
2016
|
||||||
|
(in millions)
|
|||||||
|
Mutual funds:
|
|||||||
|
Equity
|
$
|
46,038
|
|
$
|
40,622
|
|
|
|
Bond
|
23,529
|
|
23,142
|
|
|||
|
Other
|
5,109
|
|
5,326
|
|
|||
|
Total mutual funds
|
$
|
74,676
|
|
$
|
69,090
|
|
|
No gains or losses were recognized on assets transferred to separate accounts for the years ended
December 31, 2017
,
2016
and
2015
.
12.
Customer Deposits
Customer deposits consisted of the following:
|
|
December 31,
|
||||||
|
2017
|
2016
|
||||||
|
(in millions)
|
|||||||
|
Fixed rate certificates
|
$
|
5,837
|
|
$
|
5,353
|
|
|
|
Stock market certificates
|
520
|
|
547
|
|
|||
|
Stock market embedded derivative
|
10
|
|
8
|
|
|||
|
Other
|
33
|
|
27
|
|
|||
|
Less: accrued interest classified in other liabilities
|
(12
|
)
|
(11
|
)
|
|||
|
Total investment certificate reserves
|
6,388
|
|
5,924
|
|
|||
|
Brokerage deposits
|
3,915
|
|
4,112
|
|
|||
|
Total
|
$
|
10,303
|
|
$
|
10,036
|
|
|
Investment Certificates
The Company offers fixed rate investment certificates primarily in amounts ranging from
$1,000
to
$2 million
with interest crediting rate terms ranging from
3
to
48
months. Investment certificates may be purchased either with a lump sum payment or installment payments. Certificate owners are entitled to receive, at maturity, a definite sum of money. Payments from certificate owners are credited to investment certificate reserves. Investment certificate reserves generally accumulate interest at specified percentage rates. Reserves are maintained for advance payments made by certificate owners, accrued interest thereon and for additional credits in excess of minimum guaranteed rates and accrued interest thereon. On certificates allowing for the deduction of a surrender charge, the cash surrender values may be less than accumulated investment certificate reserves prior to maturity dates. Cash surrender values on
132
certificates allowing for no surrender charge are equal to certificate reserves. The Company generally invests the proceeds from investment certificates in fixed and variable rate securities.
Certain investment certificate products have returns tied to the performance of equity markets. The Company guarantees the principal for purchasers who hold the certificate for the full term and purchasers may participate in increases in the stock market based on the S&P 500
®
Index, up to a maximum return. Purchasers can choose
100%
participation in the market index up to the cap or
25%
participation plus fixed interest with a combined total up to the cap. Current first term certificates have maximum returns of
0.55%
to
8.15%
, depending on the term length. The equity component of these certificates is considered an embedded derivative and is accounted for separately. See Note 16 for additional information about derivative instruments used to economically hedge the equity price risk related to the Company’s stock market certificates.
Brokerage Deposits
Brokerage deposits are amounts payable to brokerage customers related to free credit balances, funds deposited by customers and funds accruing to customers as a result of trades or contracts. The Company pays interest on certain customer credit balances and the interest is included in banking and deposit interest expense.
13.
Debt
The balances and the stated interest rates of outstanding debt of Ameriprise Financial were as follows:
|
|
Outstanding Balance
|
|
Stated Interest Rate
|
||||||||||
|
December 31,
|
December 31,
|
||||||||||||
|
2017
|
2016
|
2017
|
2016
|
||||||||||
|
(in millions)
|
|
||||||||||||
|
Long-term debt:
|
|||||||||||||
|
Senior notes due 2019
|
$
|
300
|
|
$
|
300
|
|
7.3
|
%
|
7.3
|
%
|
|||
|
Senior notes due 2020
|
750
|
|
750
|
|
5.3
|
|
5.3
|
|
|||||
|
Senior notes due 2023
|
750
|
|
750
|
|
4.0
|
|
4.0
|
|
|||||
|
Senior notes due 2024
|
550
|
|
550
|
|
3.7
|
|
3.7
|
|
|||||
|
Senior notes due 2026
|
500
|
|
500
|
|
2.9
|
|
2.9
|
|
|||||
|
Capitalized lease obligations
|
38
|
|
49
|
|
|
||||||||
|
Other
(1)
|
3
|
|
18
|
|
|||||||||
|
Total long-term debt
|
2,891
|
|
2,917
|
|
|
|
|
|
|
||||
|
Short-term borrowings:
|
|||||||||||||
|
Federal Home Loan Bank (“FHLB”) advances
|
150
|
|
150
|
|
|
1.5
|
|
0.8
|
|
||||
|
Repurchase agreements
|
50
|
|
50
|
|
|
1.4
|
|
0.9
|
|
||||
|
Total short-term borrowings
|
200
|
|
200
|
|
|
|
|
|
|
||||
|
Total
|
$
|
3,091
|
|
$
|
3,117
|
|
|
|
|
|
|
||
(1)
Amounts include adjustments for fair value hedges on the Company’s long-term debt and unamortized discount and debt issuance costs. See Note 16 for information on the Company’s fair value hedges.
Long-Term Debt
On August 11, 2016, the Company issued
$500 million
of unsecured senior notes due September 15, 2026, and incurred debt issuance costs of
$4 million
. Interest payments are due semi-annually in arrears on March 15 and September 15, commencing on March 15, 2017.
In the first quarter of 2016, the Company extinguished
$16 million
of its junior subordinated notes due 2066 in open market transactions and recognized a gain of less than
$1 million
. In the second quarter of 2016, the Company redeemed the remaining
$229 million
of its junior subordinated notes due 2066 at a redemption price equal to 100% of the principal balance of the notes plus accrued and compounded interest.
In 2015, the Company extinguished
$49 million
of its junior subordinated notes due 2066 in open market transactions and recognized a gain of less than
$1 million
. In November 2015, the Company
used cash on hand to fund the repayment of
$350 million
of its senior notes due 2015.
The Company’s senior notes due 2019, 2020, 2023, 2024 and 2026 may be redeemed, in whole or in part, at any time prior to maturity at a price equal to the greater of the principal amount and the present value of remaining scheduled payments, discounted to the redemption date, plus accrued and unpaid interest.
133
At
December 31, 2017
, future maturities of Ameriprise Financial long-term debt were as follows:
|
|
(in millions)
|
||
|
2018
|
$
|
13
|
|
|
2019
|
314
|
|
|
|
2020
|
761
|
|
|
|
2021
|
—
|
|
|
|
2022
|
—
|
|
|
|
Thereafter
|
1,800
|
|
|
|
Total future maturities
|
$
|
2,888
|
|
Short-term Borrowings
The Company enters into repurchase agreements in exchange for cash, which it accounts for as secured borrowings and has pledged Available-for-Sale securities to collateralize its obligations under the repurchase agreements. As of
December 31, 2017
and
2016
, the Company has pledged
$43 million
and
$33 million
, respectively, of agency residential mortgage backed securities and
$8 million
and
$19 million
, respectively, of commercial mortgage backed securities. The remaining maturity of outstanding repurchase agreements was less than
one month
as of
December 31, 2017
and less than
three months
as of
December 31, 2016
. The stated interest rate of the repurchase agreements is a weighted average annualized interest rate on repurchase agreements held as of the balance sheet date.
The Company’s life insurance subsidiary is a member of the FHLB of Des Moines which provides access to collateralized borrowings. The Company has pledged Available-for-Sale securities consisting of commercial mortgage backed securities to collateralize its obligation under these borrowings. The fair value of the securities pledged is recorded in investments and was
$750 million
and
$771 million
at
December 31, 2017
and
2016
, respectively. The remaining maturity of outstanding FHLB advances was less than
four months
as of both
December 31, 2017
and
December 31, 2016
. The stated interest rate of the FHLB advances is a weighted average annualized interest rate on the outstanding borrowings as of the balance sheet date.
On October 12, 2017, the Company entered into an amended and restated credit agreement that provides for an unsecured revolving credit facility of up to
$750 million
that expires in October 2022. Under the terms of the credit agreement for the facility, the Company may increase the amount of this facility up to
$1 billion
upon satisfaction of certain approval requirements. This agreement replaced the Company’s unsecured revolving credit facility that was to expire in May 2020. As of both
December 31, 2017
and
2016
, the Company had
no
borrowings outstanding and
$1 million
of letters of credit issued against these facilities. The Company’s credit facility contains various administrative, reporting, legal and financial covenants. The Company was in compliance with all such covenants as of both
December 31, 2017
and
2016
.
14.
Fair Values of Assets and Liabilities
GAAP defines fair value as the price that would be received to sell an asset or paid to transfer a liability in an orderly transaction between market participants at the measurement date; that is, an exit price. The exit price assumes the asset or liability is not exchanged subject to a forced liquidation or distressed sale.
Valuation Hierarchy
The Company categorizes its fair value measurements according to a three-level hierarchy. The hierarchy prioritizes the inputs used by the Company’s valuation techniques. A level is assigned to each fair value measurement based on the lowest level input that is significant to the fair value measurement in its entirety. The three levels of the fair value hierarchy are defined as follows:
|
Level 1
|
Unadjusted quoted prices for identical assets or liabilities in active markets that are accessible at the measurement date.
|
|
Level 2
|
Prices or valuations based on observable inputs other than quoted prices in active markets for identical assets and liabilities.
|
|
Level 3
|
Prices or valuations that require inputs that are both significant to the fair value measurement and unobservable.
|
134
The following tables present the balances of assets and liabilities of Ameriprise Financial measured at fair value on a recurring basis:
|
|
December 31, 2017
|
|
||||||||||||||
|
Level 1
|
Level 2
|
Level 3
|
Total
|
|||||||||||||
|
(in millions)
|
||||||||||||||||
|
Assets
|
|
|
|
|
|
|
|
|
|
|||||||
|
Cash equivalents
|
$
|
147
|
|
$
|
2,025
|
|
$
|
—
|
|
$
|
2,172
|
|
|
|||
|
Available-for-Sale securities:
|
||||||||||||||||
|
Corporate debt securities
|
—
|
|
13,936
|
|
1,139
|
|
15,075
|
|
|
|||||||
|
Residential mortgage backed securities
|
—
|
|
6,456
|
|
155
|
|
6,611
|
|
|
|||||||
|
Commercial mortgage backed securities
|
—
|
|
4,374
|
|
—
|
|
4,374
|
|
|
|||||||
|
Asset backed securities
|
—
|
|
1,573
|
|
7
|
|
1,580
|
|
|
|||||||
|
State and municipal obligations
|
—
|
|
2,463
|
|
—
|
|
2,463
|
|
|
|||||||
|
U.S. government and agency obligations
|
503
|
|
—
|
|
—
|
|
503
|
|
|
|||||||
|
Foreign government bonds and obligations
|
—
|
|
314
|
|
—
|
|
314
|
|
|
|||||||
|
Common stocks
|
1
|
|
—
|
|
—
|
|
1
|
|
|
|||||||
|
Common stocks measured at net asset value (“NAV”)
|
6
|
|
(1)
|
|||||||||||||
|
Total Available-for-Sale securities
|
504
|
|
29,116
|
|
1,301
|
|
30,927
|
|
|
|||||||
|
Trading securities
|
10
|
|
34
|
|
—
|
|
44
|
|
|
|||||||
|
Separate account assets at NAV
|
87,368
|
|
(1)
|
|||||||||||||
|
Investments segregated for regulatory purposes
|
623
|
|
—
|
|
—
|
|
623
|
|
||||||||
|
Other assets:
|
||||||||||||||||
|
Interest rate derivative contracts
|
—
|
|
1,104
|
|
—
|
|
1,104
|
|
|
|||||||
|
Equity derivative contracts
|
63
|
|
2,360
|
|
—
|
|
2,423
|
|
|
|||||||
|
Foreign exchange derivative contracts
|
2
|
|
34
|
|
—
|
|
36
|
|
|
|||||||
|
Total other assets
|
65
|
|
3,498
|
|
—
|
|
3,563
|
|
|
|||||||
|
Total assets at fair value
|
$
|
1,349
|
|
$
|
34,673
|
|
$
|
1,301
|
|
$
|
124,697
|
|
|
|||
|
Liabilities
|
||||||||||||||||
|
Policyholder account balances, future policy benefits and claims:
|
||||||||||||||||
|
Indexed annuity embedded derivatives
|
$
|
—
|
|
$
|
5
|
|
$
|
—
|
|
$
|
5
|
|
|
|||
|
IUL embedded derivatives
|
—
|
|
—
|
|
601
|
|
601
|
|
|
|||||||
|
GMWB and GMAB embedded derivatives
|
—
|
|
—
|
|
(49
|
)
|
(49
|
)
|
(2)
|
|||||||
|
Total policyholder account balances, future policy benefits and claims
|
—
|
|
5
|
|
552
|
|
557
|
|
(3)
|
|||||||
|
Customer deposits
|
—
|
|
10
|
|
—
|
|
10
|
|
|
|||||||
|
Other liabilities:
|
||||||||||||||||
|
Interest rate derivative contracts
|
1
|
|
415
|
|
—
|
|
416
|
|
|
|||||||
|
Equity derivative contracts
|
7
|
|
2,876
|
|
—
|
|
2,883
|
|
|
|||||||
|
Credit derivative contracts
|
—
|
|
2
|
|
—
|
|
2
|
|
||||||||
|
Foreign exchange derivative contracts
|
4
|
|
23
|
|
—
|
|
27
|
|
||||||||
|
Other
|
9
|
|
6
|
|
28
|
|
43
|
|
|
|||||||
|
Total other liabilities
|
21
|
|
3,322
|
|
28
|
|
3,371
|
|
|
|||||||
|
Total liabilities at fair value
|
$
|
21
|
|
$
|
3,337
|
|
$
|
580
|
|
$
|
3,938
|
|
|
|||
135
|
|
December 31, 2016
|
|
||||||||||||||
|
Level 1
|
Level 2
|
Level 3
|
Total
|
|||||||||||||
|
(in millions)
|
||||||||||||||||
|
Assets
|
||||||||||||||||
|
Cash equivalents
|
$
|
30
|
|
$
|
1,796
|
|
$
|
—
|
|
$
|
1,826
|
|
|
|||
|
Available-for-Sale securities:
|
||||||||||||||||
|
Corporate debt securities
|
—
|
|
14,925
|
|
1,311
|
|
16,236
|
|
|
|||||||
|
Residential mortgage backed securities
|
—
|
|
6,650
|
|
268
|
|
6,918
|
|
|
|||||||
|
Commercial mortgage backed securities
|
—
|
|
3,367
|
|
—
|
|
3,367
|
|
|
|||||||
|
Asset backed securities
|
—
|
|
1,481
|
|
68
|
|
1,549
|
|
|
|||||||
|
State and municipal obligations
|
—
|
|
2,358
|
|
—
|
|
2,358
|
|
|
|||||||
|
U.S. government and agency obligations
|
8
|
|
—
|
|
—
|
|
8
|
|
|
|||||||
|
Foreign government bonds and obligations
|
—
|
|
261
|
|
—
|
|
261
|
|
|
|||||||
|
Common stocks
|
8
|
|
8
|
|
1
|
|
17
|
|
|
|||||||
|
Common stocks at NAV
|
5
|
|
(1)
|
|||||||||||||
|
Total Available-for-Sale securities
|
16
|
|
29,050
|
|
1,648
|
|
30,719
|
|
|
|||||||
|
Trading securities
|
9
|
|
16
|
|
—
|
|
25
|
|
|
|||||||
|
Separate account assets at NAV
|
80,210
|
|
(1)
|
|||||||||||||
|
Investments segregated for regulatory purposes
|
425
|
|
—
|
|
—
|
|
425
|
|
||||||||
|
Other assets:
|
||||||||||||||||
|
Interest rate derivative contracts
|
—
|
|
1,778
|
|
—
|
|
1,778
|
|
|
|||||||
|
Equity derivative contracts
|
43
|
|
1,531
|
|
—
|
|
1,574
|
|
|
|||||||
|
Credit derivative contracts
|
—
|
|
1
|
|
—
|
|
1
|
|
||||||||
|
Foreign exchange derivative contracts
|
13
|
|
80
|
|
—
|
|
93
|
|
|
|||||||
|
Total other assets
|
56
|
|
3,390
|
|
—
|
|
3,446
|
|
|
|||||||
|
Total assets at fair value
|
$
|
536
|
|
$
|
34,252
|
|
$
|
1,648
|
|
$
|
116,651
|
|
||||
|
|
||||||||||||||||
|
Liabilities
|
||||||||||||||||
|
Policyholder account balances, future policy benefits and claims:
|
||||||||||||||||
|
Indexed annuity embedded derivatives
|
$
|
—
|
|
$
|
5
|
|
$
|
—
|
|
$
|
5
|
|
|
|||
|
IUL embedded derivatives
|
—
|
|
—
|
|
464
|
|
464
|
|
|
|||||||
|
GMWB and GMAB embedded derivatives
|
—
|
|
—
|
|
614
|
|
614
|
|
(4)
|
|||||||
|
Total policyholder account balances, future policy benefits and claims
|
—
|
|
5
|
|
1,078
|
|
1,083
|
|
(5)
|
|||||||
|
Customer deposits
|
—
|
|
8
|
|
—
|
|
8
|
|
|
|||||||
|
Other liabilities:
|
||||||||||||||||
|
Interest rate derivative contracts
|
2
|
|
987
|
|
—
|
|
989
|
|
|
|||||||
|
Equity derivative contracts
|
3
|
|
2,132
|
|
—
|
|
2,135
|
|
||||||||
|
Foreign exchange derivative contracts
|
2
|
|
45
|
|
—
|
|
47
|
|
|
|||||||
|
Other
|
3
|
|
8
|
|
13
|
|
24
|
|
|
|||||||
|
Total other liabilities
|
10
|
|
3,172
|
|
13
|
|
3,195
|
|
||||||||
|
Total liabilities at fair value
|
$
|
10
|
|
$
|
3,185
|
|
$
|
1,091
|
|
$
|
4,286
|
|
||||
(1)
Amounts are comprised of certain financial instruments that are measured at fair value using the NAV per share (or its equivalent) as a practical expedient and have not been classified in the fair value hierarchy.
(2)
The fair value of the GMWB and GMAB embedded derivatives included
$443 million
of individual contracts in a liability position and
$492 million
of individual contracts in an asset position at December 31, 2017.
(3)
The Company’s adjustment for nonperformance risk resulted in a
$(399) million
cumulative increase (decrease) to the embedded derivatives at December 31, 2017.
(4)
The fair value of the GMWB and GMAB embedded derivatives included
$880 million
of individual contracts in a liability position and
$266 million
of individual contracts in an asset position at December 31, 2016.
(5)
The Company’s adjustment for nonperformance risk resulted in a
$(498) million
cumulative increase (decrease) to the embedded derivatives at December 31, 2016.
136
The following tables provide a summary of changes in Level 3 assets and liabilities of Ameriprise Financial measured at fair value on a recurring basis:
|
|
Available-for-Sale Securities
|
|||||||||||||||||||||||
|
Corporate Debt Securities
|
Residential Mortgage Backed Securities
|
Commercial Mortgage Backed Securities
|
Asset Backed Securities
|
Common Stocks
|
Total
|
|||||||||||||||||||
|
(in millions)
|
||||||||||||||||||||||||
|
Balance, January 1, 2017
|
$
|
1,311
|
|
$
|
268
|
|
$
|
—
|
|
$
|
68
|
|
$
|
1
|
|
$
|
1,648
|
|
||||||
|
Total gains (losses) included in:
|
||||||||||||||||||||||||
|
Net income
|
—
|
|
—
|
|
—
|
|
—
|
|
1
|
|
1
|
|
(1)
|
|||||||||||
|
Other comprehensive income (loss)
|
(8
|
)
|
1
|
|
—
|
|
(4
|
)
|
—
|
|
(11
|
)
|
||||||||||||
|
Purchases
|
138
|
|
132
|
|
65
|
|
64
|
|
—
|
|
399
|
|
||||||||||||
|
Sales
|
—
|
|
—
|
|
—
|
|
—
|
|
(1
|
)
|
(1
|
)
|
||||||||||||
|
Settlements
|
(302
|
)
|
(43
|
)
|
—
|
|
(29
|
)
|
—
|
|
(374
|
)
|
||||||||||||
|
Transfers into Level 3
|
—
|
|
20
|
|
—
|
|
27
|
|
8
|
|
55
|
|
||||||||||||
|
Transfers out of Level 3
|
—
|
|
(223
|
)
|
(65
|
)
|
(119
|
)
|
(9
|
)
|
(416
|
)
|
||||||||||||
|
Balance, December 31, 2017
|
$
|
1,139
|
|
$
|
155
|
|
$
|
—
|
|
$
|
7
|
|
$
|
—
|
|
$
|
1,301
|
|
||||||
|
Changes in unrealized gains (losses) relating to assets held at December 31, 2017
|
$
|
—
|
|
$
|
—
|
|
$
|
—
|
|
$
|
(1
|
)
|
$
|
—
|
|
$
|
(1
|
)
|
(1)
|
|||||
|
Policyholder Account Balances,
Future Policy Benefits and Claims |
Other Liabilities
|
|||||||||||||||
|
IUL
Embedded Derivatives |
GMWB
and GMAB Embedded Derivatives |
Total
|
||||||||||||||
|
(in millions)
|
||||||||||||||||
|
Balance, January 1, 2017
|
$
|
464
|
|
$
|
614
|
|
$
|
1,078
|
|
$
|
13
|
|
||||
|
Total (gains) losses included in:
|
||||||||||||||||
|
Net income
|
87
|
|
(2)
|
(977
|
)
|
(3)
|
(890
|
)
|
2
|
|
(4)
|
|||||
|
Issues
|
92
|
|
326
|
|
418
|
|
13
|
|
||||||||
|
Settlements
|
(42
|
)
|
(12
|
)
|
(54
|
)
|
—
|
|
||||||||
|
Balance, December 31, 2017
|
$
|
601
|
|
$
|
(49
|
)
|
$
|
552
|
|
$
|
28
|
|
||||
|
Changes in unrealized (gains) losses relating to liabilities held at December 31, 2017
|
$
|
87
|
|
(2)
|
$
|
(946
|
)
|
(3)
|
$
|
(859
|
)
|
$
|
—
|
|
||
137
|
|
Available-for-Sale Securities
|
|
Other Derivative Contracts
|
|||||||||||||||||||||||||
|
Corporate Debt Securities
|
Residential Mortgage Backed Securities
|
Commercial Mortgage Backed Securities
|
Asset Backed Securities
|
Common Stocks
|
Total
|
|||||||||||||||||||||||
|
(in millions)
|
||||||||||||||||||||||||||||
|
Balance, January 1, 2016
|
$
|
1,425
|
|
$
|
218
|
|
$
|
3
|
|
$
|
162
|
|
$
|
—
|
|
$
|
1,808
|
|
$
|
—
|
|
|||||||
|
Cumulative effect of change in accounting policies
|
—
|
|
—
|
|
—
|
|
21
|
|
—
|
|
21
|
|
—
|
|
||||||||||||||
|
Total gains (losses) included in:
|
||||||||||||||||||||||||||||
|
Net income
|
(1
|
)
|
1
|
|
—
|
|
(1
|
)
|
—
|
|
(1
|
)
|
(1)
|
(2
|
)
|
(3)
|
||||||||||||
|
Other comprehensive income (loss)
|
—
|
|
(1
|
)
|
—
|
|
(4
|
)
|
—
|
|
(5
|
)
|
—
|
|
||||||||||||||
|
Purchases
|
54
|
|
209
|
|
42
|
|
58
|
|
—
|
|
363
|
|
2
|
|
||||||||||||||
|
Settlements
|
(168
|
)
|
(67
|
)
|
(3
|
)
|
(2
|
)
|
—
|
|
(240
|
)
|
—
|
|
||||||||||||||
|
Transfers into Level 3
|
1
|
|
—
|
|
—
|
|
12
|
|
1
|
|
14
|
|
—
|
|
||||||||||||||
|
Transfers out of Level 3
|
—
|
|
(92
|
)
|
(42
|
)
|
(178
|
)
|
—
|
|
(312
|
)
|
—
|
|
||||||||||||||
|
Balance, December 31, 2016
|
$
|
1,311
|
|
$
|
268
|
|
$
|
—
|
|
$
|
68
|
|
$
|
1
|
|
$
|
1,648
|
|
$
|
—
|
|
|||||||
|
Changes in unrealized gains (losses) relating to assets held at December 31, 2016
|
$
|
1
|
|
$
|
1
|
|
$
|
—
|
|
$
|
(1
|
)
|
$
|
—
|
|
$
|
1
|
|
(1)
|
$
|
(2
|
)
|
(3)
|
|||||
|
Policyholder Account Balances,
Future Policy Benefits and Claims |
|||||||||||||||
|
IUL
Embedded Derivatives |
GMWB
and GMAB Embedded Derivatives |
Total
|
Other Liabilities
|
||||||||||||
|
(in millions)
|
|||||||||||||||
|
Balance, January 1, 2016
|
$
|
364
|
|
$
|
851
|
|
$
|
1,215
|
|
$
|
—
|
|
|||
|
Total (gains) losses included in:
|
|||||||||||||||
|
Net income
|
13
|
|
(2)
|
(511
|
)
|
(3)
|
(498
|
)
|
—
|
|
|||||
|
Issues
|
115
|
|
295
|
|
410
|
|
13
|
|
|||||||
|
Settlements
|
(28
|
)
|
(21
|
)
|
(49
|
)
|
—
|
|
|||||||
|
Balance, December 31, 2016
|
$
|
464
|
|
$
|
614
|
|
$
|
1,078
|
|
$
|
13
|
|
|||
|
Changes in unrealized (gains) losses relating to liabilities held at December 31, 2016
|
$
|
13
|
|
(2)
|
$
|
(448
|
)
|
(3)
|
$
|
(435
|
)
|
$
|
—
|
|
|
138
|
|
Available-for-Sale Securities
|
|
||||||||||||||||||||||||||
|
Corporate Debt Securities
|
Residential Mortgage Backed Securities
|
Commercial Mortgage Backed Securities
|
Asset Backed Securities
|
Common Stocks
|
Total
|
Trading Securities
|
||||||||||||||||||||||
|
(in millions)
|
||||||||||||||||||||||||||||
|
Balance, January 1, 2015
|
$
|
1,518
|
|
$
|
206
|
|
$
|
91
|
|
$
|
169
|
|
$
|
2
|
|
$
|
1,986
|
|
|
$
|
1
|
|
||||||
|
Total gains (losses) included in:
|
||||||||||||||||||||||||||||
|
Net income
|
(2
|
)
|
—
|
|
—
|
|
1
|
|
—
|
|
(1
|
)
|
(1)
|
(1
|
)
|
(1)
|
||||||||||||
|
Other comprehensive income (loss)
|
(21
|
)
|
(2
|
)
|
—
|
|
(2
|
)
|
—
|
|
(25
|
)
|
—
|
|
||||||||||||||
|
Purchases
|
189
|
|
334
|
|
41
|
|
72
|
|
—
|
|
636
|
|
—
|
|
||||||||||||||
|
Settlements
|
(248
|
)
|
(55
|
)
|
(7
|
)
|
(22
|
)
|
—
|
|
(332
|
)
|
—
|
|
||||||||||||||
|
Transfers into Level 3
|
—
|
|
—
|
|
6
|
|
14
|
|
—
|
|
20
|
|
—
|
|
||||||||||||||
|
Transfers out of Level 3
|
(11
|
)
|
(265
|
)
|
(128
|
)
|
(70
|
)
|
(2
|
)
|
(476
|
)
|
—
|
|
||||||||||||||
|
Balance, December 31, 2015
|
$
|
1,425
|
|
$
|
218
|
|
$
|
3
|
|
$
|
162
|
|
$
|
—
|
|
$
|
1,808
|
|
$
|
—
|
|
|||||||
|
Changes in unrealized gains (losses) relating to assets held at December 31, 2015
|
$
|
(2
|
)
|
$
|
—
|
|
$
|
—
|
|
$
|
1
|
|
$
|
—
|
|
$
|
(1
|
)
|
(1)
|
$
|
—
|
|
||||||
|
Policyholder Account Balances,
Future Policy Benefits and Claims |
|||||||||||
|
IUL
Embedded Derivatives |
GMWB
and GMAB Embedded Derivatives |
Total
|
|||||||||
|
(in millions)
|
|||||||||||
|
Balance, January 1, 2015
|
$
|
242
|
|
|
$
|
479
|
|
$
|
721
|
|
|
|
Total (gains) losses included in:
|
|||||||||||
|
Net income
|
27
|
|
(2)
|
105
|
|
(3)
|
132
|
|
|||
|
Issues
|
114
|
|
271
|
|
385
|
|
|||||
|
Settlements
|
(19
|
)
|
(4
|
)
|
(23
|
)
|
|||||
|
Balance, December 31, 2015
|
$
|
364
|
|
$
|
851
|
|
$
|
1,215
|
|
||
|
Changes in unrealized (gains) losses relating to liabilities held at December 31, 2015
|
$
|
27
|
|
(2)
|
$
|
127
|
|
(3)
|
$
|
154
|
|
(1)
Included in net investment income in the Consolidated Statements of Operations.
(2)
Included in interest credited to fixed accounts in the Consolidated Statements of Operations.
(3)
Included in benefits, claims, losses and settlement expenses in the Consolidated Statements of Operations.
(4)
Included in general and administrative expense in the Consolidated Statements of Operations.
The increase (decrease) to pretax income of the Company’s adjustment for nonperformance risk on the fair value of its embedded derivatives was
$(71) million
,
$98 million
and
$74 million
, net of DAC, DSIC, unearned revenue amortization and the reinsurance accrual, for the years ended
December 31, 2017
,
2016
and
2015
, respectively.
Securities transferred from Level 3 primarily represent securities with fair values that are now obtained from a third party pricing service with observable inputs. Securities transferred to Level 3 represent securities with fair values that are now based on a single non-binding broker quote. The Company recognizes transfers between levels of the fair value hierarchy as of the beginning of the quarter in which each transfer occurred. For assets and liabilities held at the end of the reporting periods that are measured at fair value on a recurring basis, there were
no
transfers between Level 1 and Level 2.
139
The following tables provide a summary of the significant unobservable inputs used in the fair value measurements developed by the Company or reasonably available to the Company of Level 3 assets and liabilities:
|
|
December 31, 2017
|
||||||||||||||
|
Fair Value
|
Valuation Technique
|
Unobservable Input
|
Range
|
Weighted
Average
|
|||||||||||
|
(in millions)
|
|
||||||||||||||
|
Corporate debt securities (private placements)
|
$
|
1,138
|
Discounted cash flow
|
Yield/spread to U.S. Treasuries
|
0.7
|
%
|
–
|
2.3%
|
1.1
|
%
|
|||||
|
Asset backed securities
|
$
|
7
|
Discounted cash flow
|
Annual short-term default rate
|
3.8%
|
||||||||||
|
Annual long-term default rate
|
2.5%
|
–
|
3.0%
|
2.7
|
%
|
||||||||||
|
Discount rate
|
10.5%
|
||||||||||||||
|
Constant prepayment rate
|
5.0
|
%
|
–
|
10.0%
|
9.9
|
%
|
|||||||||
|
Loss recovery
|
36.4
|
%
|
–
|
63.6%
|
63.2
|
%
|
|||||||||
|
IUL embedded derivatives
|
$
|
601
|
Discounted cash flow
|
Nonperformance risk
(1)
|
71 bps
|
||||||||||
|
GMWB and GMAB embedded derivatives
|
$
|
(49
|
)
|
Discounted cash flow
|
Utilization of guaranteed withdrawals
(2)
|
0.0
|
%
|
–
|
42.0%
|
||||||
|
|
|
|
Surrender rate
|
0.1
|
%
|
–
|
74.7%
|
||||||||
|
|
|
|
Market volatility
(3)
|
3.7
|
%
|
–
|
16.1%
|
||||||||
|
|
|
|
Nonperformance risk
(1)
|
71 bps
|
|||||||||||
|
Contingent consideration liability
|
$
|
28
|
Discounted cash flow
|
Discount rate
|
9.0%
|
||||||||||
|
|
December 31, 2016
|
|||||||||||||
|
Fair Value
|
Valuation Technique
|
Unobservable Input
|
Range
|
Weighted
Average
|
||||||||||
|
(in millions)
|
||||||||||||||
|
Corporate debt securities (private placements)
|
$
|
1,308
|
Discounted cash flow
|
Yield/spread to U.S. Treasuries
|
0.9
|
%
|
–
|
2.5%
|
1.3%
|
|||||
|
Asset backed securities
|
$
|
14
|
Discounted cash flow
|
Annual short-term default rate
|
4.8%
|
|||||||||
|
Annual long-term default rate
|
2.5%
|
|||||||||||||
|
Discount rate
|
13.5%
|
|||||||||||||
|
Constant prepayment rate
|
5.0
|
%
|
–
|
10.0%
|
9.9%
|
|||||||||
|
Loss recovery
|
36.4
|
%
|
–
|
63.6%
|
62.8%
|
|||||||||
|
IUL embedded derivatives
|
$
|
464
|
Discounted cash flow
|
Nonperformance risk
(1)
|
82 bps
|
|||||||||
|
GMWB and GMAB embedded derivatives
|
$
|
614
|
Discounted cash flow
|
Utilization of guaranteed withdrawals
(2)
|
0.0
|
%
|
–
|
75.6%
|
||||||
|
|
|
Surrender rate
|
0.1
|
%
|
–
|
66.4%
|
||||||||
|
|
|
|
Market volatility
(3)
|
5.3
|
%
|
–
|
21.2%
|
|||||||
|
|
|
|
Nonperformance risk
(1)
|
82 bps
|
||||||||||
|
Contingent consideration liabilities
|
$
|
13
|
Discounted cash flow
|
Discount rate
|
9.0%
|
|||||||||
(1)
The nonperformance risk is the spread added to the observable interest rates used in the valuation of the embedded derivatives.
(2)
The utilization of guaranteed withdrawals represents the percentage of contractholders that will begin withdrawing in any given year.
(3)
Market volatility is implied volatility of fund of funds and managed volatility funds.
Level 3 measurements not included in the table above are obtained from non-binding broker quotes where unobservable inputs utilized in the fair value calculation are not reasonably available to the Company.
Sensitivity of Fair Value Measurements to Changes in Unobservable Inputs
Significant increases (decreases) in the yield/spread to U.S. Treasuries used in the fair value measurement of Level 3 corporate debt securities in isolation would result in a significantly lower (higher) fair value measurement.
Significant increases (decreases) in the annual default rate and discount rate used in the fair value measurement of Level 3 asset backed securities in isolation, generally, would result in a significantly lower (higher) fair value measurement and a significant
140
increase (decrease) in loss recovery in isolation would result in a significantly higher (lower) fair value measurement. A significant increase (decrease) in the constant prepayment rate in isolation would result in a significantly lower (higher) fair value measurement.
Significant increases (decreases) in nonperformance risk used in the fair value measurement of the IUL embedded derivatives in isolation would result in a significantly lower (higher) fair value measurement.
Significant increases (decreases) in utilization and volatility used in the fair value measurement of the GMWB and GMAB embedded derivatives in isolation would result in a significantly higher (lower) liability value. Significant increases (decreases) in nonperformance risk and surrender rate used in the fair value measurement of the GMWB and GMAB embedded derivatives in isolation would result in a significantly lower (higher) liability value. Utilization of guaranteed withdrawals and surrender rates vary with the type of rider, the duration of the policy, the age of the contractholder, the distribution channel and whether the value of the guaranteed benefit exceeds the contract accumulation value.
Significant increases (decreases) in the discount rate used in the fair value measurement of the contingent consideration liability in isolation would result in a significantly lower (higher) fair value measurement.
Determination of Fair Value
The Company uses valuation techniques consistent with the market and income approaches to measure the fair value of its assets and liabilities. The Company’s market approach uses prices and other relevant information generated by market transactions involving identical or comparable assets or liabilities. The Company’s income approach uses valuation techniques to convert future projected cash flows to a single discounted present value amount. When applying either approach, the Company maximizes the use of observable inputs and minimizes the use of unobservable inputs.
The following is a description of the valuation techniques used to measure fair value and the general classification of these instruments pursuant to the fair value hierarchy.
Assets
Cash Equivalents
Cash equivalents include time deposits and other highly liquid investments with original or remaining maturities at the time of purchase of 90 days or less. Actively traded money market funds are measured at their NAV and classified as Level 1. The Company’s remaining cash equivalents are classified as Level 2 and measured at amortized cost, which is a reasonable estimate of fair value because of the short time between the purchase of the instrument and its expected realization.
Investments (Available-for-Sale Securities and Trading Securities)
When available, the fair value of securities is based on quoted prices in active markets. If quoted prices are not available, fair values are obtained from third party pricing services, non-binding broker quotes, or other model-based valuation techniques. Level 1 securities primarily include U.S. Treasuries. Level 2 securities primarily include corporate bonds, residential mortgage backed securities, commercial mortgage backed securities, asset backed securities, state and municipal obligations and foreign government securities. The fair value of these Level 2 securities is based on a market approach with prices obtained from third party pricing services. Observable inputs used to value these securities can include, but are not limited to, reported trades, benchmark yields, issuer spreads and non-binding broker quotes. Level 3 securities primarily include certain corporate bonds, non-agency residential mortgage backed securities and asset backed securities. The fair value of corporate bonds, non-agency residential mortgage backed securities and certain asset backed securities classified as Level 3 is typically based on a single non-binding broker quote. The underlying inputs used for some of the non-binding broker quotes are not readily available to the Company. The Company’s privately placed corporate bonds are typically based on a single non-binding broker quote. The fair value of certain asset backed securities is determined using a discounted cash flow model. Inputs used to determine the expected cash flows include assumptions about discount rates and default, prepayment and recovery rates of the underlying assets. Given the significance of the unobservable inputs to this fair value measurement, the fair value of the investment in certain asset backed securities is classified as Level 3. In addition to the general pricing controls, the Company reviews the broker prices to ensure that the broker quotes are reasonable and, when available, compares prices of privately issued securities to public issues from the same issuer to ensure that the implicit illiquidity premium applied to the privately placed investment is reasonable considering investment characteristics, maturity, and average life of the investment.
In consideration of the above, management is responsible for the fair values recorded on the financial statements. Prices received from third party pricing services are subjected to exception reporting that identifies investments with significant daily price movements as well as no movements. The Company reviews the exception reporting and resolves the exceptions through reaffirmation of the price or recording an appropriate fair value estimate. The Company also performs subsequent transaction testing. The Company performs annual due diligence of third party pricing services. The Company’s due diligence procedures include assessing the vendor’s valuation qualifications, control environment, analysis of asset-class specific valuation methodologies, and understanding of sources of market observable assumptions and unobservable assumptions, if any, employed in the valuation methodology. The Company also considers the results of its exception reporting controls and any resulting price challenges that arise.
141
Separate Account Assets
The fair value of assets held by separate accounts is determined by the NAV of the funds in which those separate accounts are invested. The NAV is used as a practical expedient for fair value and represents the exit price for the separate account. Separate account assets are excluded from classification in the fair value hierarchy.
Investments Segregated for Regulatory Purposes
Investments segregated for regulatory purposes includes U.S. Treasuries that are classified as Level 1.
Other Assets
Derivatives that are measured using quoted prices in active markets, such as foreign currency forwards, or derivatives that are exchange-traded are classified as Level 1 measurements. The variation margin on futures contracts is also classified as Level 1. The fair value of derivatives that are traded in less active over-the-counter (“OTC”) markets is generally measured using pricing models with market observable inputs such as interest rates and equity index levels. These measurements are classified as Level 2 within the fair value hierarchy and include swaps and the majority of options. The counterparties’ nonperformance risk associated with uncollateralized derivative assets was immaterial at
December 31, 2017
and
2016
. See Note 15 and Note 16 for further information on the credit risk of derivative instruments and related collateral.
Liabilities
Policyholder Account Balances, Future Policy Benefits and Claims
The Company values the embedded derivatives attributable to the provisions of certain variable annuity riders using internal valuation models. These models calculate fair value by discounting expected cash flows from benefits plus margins for profit, risk and expenses less embedded derivative fees. The projected cash flows used by these models include observable capital market assumptions and incorporate significant unobservable inputs related to contractholder behavior assumptions, implied volatility, and margins for risk, profit and expenses that the Company believes an exit market participant would expect. The fair value also reflects a current estimate of the Company’s nonperformance risk specific to these embedded derivatives. Given the significant unobservable inputs to this valuation, these measurements are classified as Level 3. The embedded derivatives attributable to these provisions are recorded in policyholder account balances, future policy benefits and claims.
The Company uses various Black-Scholes calculations to determine the fair value of the embedded derivatives associated with the provisions of its indexed annuity and IUL products. Significant inputs to the EIA calculation include observable interest rates, volatilities and equity index levels and, therefore, are classified as Level 2. The fair value of fixed index annuity and IUL embedded derivatives includes significant observable interest rates, volatilities and equity index levels and the significant unobservable estimate of the Company’s nonperformance risk. Given the significance of the nonperformance risk assumption to the fair value, the fixed index annuity and IUL embedded derivatives are classified as Level 3. The embedded derivatives attributable to these provisions are recorded in policyholder account balances, future policy benefits and claims.
The Company’s Corporate Actuarial Department calculates the fair value of the embedded derivatives on a monthly basis. During this process, control checks are performed to validate the completeness of the data. Actuarial management approves various components of the valuation along with the final results. The change in the fair value of the embedded derivatives is reviewed monthly with senior management. The Level 3 inputs into the valuation are consistent with the pricing assumptions and updated as experience develops. Significant unobservable inputs that reflect policyholder behavior are reviewed quarterly along with other valuation assumptions.
Customer Deposits
The Company uses various Black-Scholes calculations to determine the fair value of the embedded derivative liability associated with the provisions of its stock market certificates. The inputs to these calculations are primarily market observable and include interest rates, volatilities and equity index levels. As a result, these measurements are classified as Level 2.
Other Liabilities
Derivatives that are measured using quoted prices in active markets, such as foreign currency forwards, or derivatives that are exchange-traded, are classified as Level 1 measurements. The variation margin on futures contracts is also classified as Level 1. The fair value of derivatives that are traded in less active OTC markets is generally measured using pricing models with market observable inputs such as interest rates and equity index levels. These measurements are classified as Level 2 within the fair value hierarchy and include swaps and the majority of options. The Company’s nonperformance risk associated with uncollateralized derivative liabilities was immaterial at
December 31, 2017
and
2016
. See Note 15 and Note 16 for further information on the credit risk of derivative instruments and related collateral.
Securities sold but not yet purchased include highly liquid investments which are short-term in nature. Securities sold but not yet purchased are measured using amortized cost, which is a reasonable estimate of fair value because of the short time between the purchase of the instrument and its expected realization and are classified as Level 2.
Contingent consideration liabilities consist of earn-outs and/or deferred payments related to the Company’s acquisitions. Contingent consideration liabilities are recorded at fair value using a discounted cash flow model under multiple scenarios and an unobservable input (discount rate). Given the use of a significant unobservable input, the fair value of contingent consideration liabilities is classified as Level 3 within the fair value hierarchy.
142
Fair Value on a Nonrecurring Basis
The Company assesses its investment in affordable housing partnerships for other-than-temporary impairment. The investments that are determined to be other-than-temporarily impaired are written down to their fair value. The Company uses a discounted cash flow model to measure the fair value of these investments. Inputs to the discounted cash flow model are estimates of future net operating losses and tax credits available to the Company and discount rates based on market condition and the financial strength of the syndicator (general partner). During the year ended December 31, 2017, the Company recognized
$64 million
of impairments on its investment in affordable housing partnerships primarily
due to the enactment of the Tax Act.
The balance of affordable housing partnerships measured at fair value on a nonrecurring basis was
$166 million
as of December 31, 2017 and is classified as Level 3 in the fair value hierarchy.
Asset and Liabilities Not Reported at Fair Value
The following tables provide the carrying value and the estimated fair value of financial instruments that are not reported at fair value:
|
|
December 31, 2017
|
|||||||||||||||||||
|
Carrying Value
|
Fair Value
|
|||||||||||||||||||
|
Level 1
|
Level 2
|
Level 3
|
Total
|
|||||||||||||||||
|
(in millions)
|
||||||||||||||||||||
|
Financial Assets
|
||||||||||||||||||||
|
Mortgage loans, net
|
$
|
2,756
|
|
$
|
—
|
|
$
|
—
|
|
$
|
2,752
|
|
$
|
2,752
|
|
|||||
|
Policy and certificate loans
|
845
|
|
—
|
|
—
|
|
801
|
|
801
|
|
||||||||||
|
Receivables
|
1,537
|
|
103
|
|
946
|
|
487
|
|
1,536
|
|
||||||||||
|
Restricted and segregated cash
|
2,524
|
|
2,524
|
|
—
|
|
—
|
|
2,524
|
|
||||||||||
|
Other investments and assets
|
520
|
|
—
|
|
472
|
|
49
|
|
521
|
|
||||||||||
|
Financial Liabilities
|
||||||||||||||||||||
|
Policyholder account balances, future policy benefits and claims
|
$
|
10,246
|
|
$
|
—
|
|
$
|
—
|
|
$
|
10,755
|
|
$
|
10,755
|
|
|||||
|
Investment certificate reserves
|
6,390
|
|
—
|
|
—
|
|
6,374
|
|
6,374
|
|
||||||||||
|
Brokerage customer deposits
|
3,915
|
|
3,915
|
|
—
|
|
—
|
|
3,915
|
|
||||||||||
|
Separate account liabilities at NAV
|
5,177
|
|
5,177
|
|
(1)
|
|||||||||||||||
|
Debt and other liabilities
|
3,290
|
|
118
|
|
3,180
|
|
119
|
|
3,417
|
|
||||||||||
|
|
December 31, 2016
|
|||||||||||||||||||
|
Carrying Value
|
Fair Value
|
|||||||||||||||||||
|
Level 1
|
Level 2
|
Level 3
|
Total
|
|||||||||||||||||
|
(in millions)
|
||||||||||||||||||||
|
Financial Assets
|
||||||||||||||||||||
|
Mortgage loans, net
|
$
|
2,986
|
|
$
|
—
|
|
$
|
—
|
|
$
|
2,972
|
|
$
|
2,972
|
|
|||||
|
Policy and certificate loans
|
831
|
|
—
|
|
1
|
|
807
|
|
808
|
|
||||||||||
|
Receivables
(2)
|
1,407
|
|
127
|
|
870
|
|
416
|
|
1,413
|
|
||||||||||
|
Restricted and segregated cash
|
2,905
|
|
2,905
|
|
—
|
|
—
|
|
2,905
|
|
||||||||||
|
Other investments and assets
|
508
|
|
—
|
|
449
|
|
61
|
|
510
|
|
||||||||||
|
Financial Liabilities
|
||||||||||||||||||||
|
Policyholder account balances, future policy benefits and claims
|
$
|
10,906
|
|
$
|
—
|
|
$
|
—
|
|
$
|
11,417
|
|
$
|
11,417
|
|
|||||
|
Investment certificate reserves
|
5,927
|
|
—
|
|
—
|
|
5,914
|
|
5,914
|
|
||||||||||
|
Brokerage customer deposits
|
4,112
|
|
4,112
|
|
—
|
|
—
|
|
4,112
|
|
||||||||||
|
Separate account liabilities at NAV
|
4,253
|
|
4,253
|
|
(1)
|
|||||||||||||||
|
Debt and other liabilities
|
3,371
|
|
146
|
|
3,176
|
|
169
|
|
3,491
|
|
||||||||||
(1)
Amounts are comprised of certain financial instruments that are measured at fair value using the NAV per share (or its equivalent) as a practical expedient and have not been classified in the fair value hierarchy. See Note 3 for further information.
(2)
In the third quarter of 2017, the Company corrected the classification of the fair value of advisor loans, net from Level 2 to Level 3 as the valuation includes a significant unobservable input. The fair value levels at December 31, 2016 have been revised to reflect this change. The fair value of advisor loans, net was
$400 million
at
December 31, 2016
.
143
Mortgage Loans, Net
The fair value of commercial mortgage loans, except those with significant credit deterioration, is determined by discounting contractual cash flows using discount rates that reflect current pricing for loans with similar remaining maturities, liquidity and characteristics including LTV ratio, occupancy rate, refinance risk, debt service coverage, location, and property condition. For commercial mortgage loans with significant credit deterioration, fair value is determined using the same adjustments as above with an additional adjustment for the Company’s estimate of the amount recoverable on the loan. Given the significant unobservable inputs to the valuation of commercial mortgage loans, these measurements are classified as Level 3.
The fair value of consumer loans is determined by discounting estimated cash flows and incorporating adjustments for prepayment, administration expenses, loss severity, liquidity and credit loss estimates, with discount rates based on the Company’s estimate of current market conditions. The fair value of consumer loans is classified as Level 3 as the valuation includes significant unobservable inputs.
Policy and Certificate Loans
Policy loans represent loans made against the cash surrender value of the underlying life insurance or annuity product. These loans and the related interest are usually realized at death of the policyholder or contractholder or at surrender of the contract and are not transferable without the underlying insurance or annuity contract. The fair value of policy loans is determined by estimating expected cash flows discounted at rates based on the U.S. Treasury curve. Policy loans are classified as Level 3 as the discount rate used may be adjusted for the underlying performance of individual policies.
Certificate loans represent loans made against and collateralized by the underlying certificate balance. These loans do not transfer to third parties separate from the underlying certificate. The outstanding balance of these loans is considered a reasonable estimate of fair value and is classified as Level 2.
Receivables
Brokerage margin loans are measured at outstanding balances, which are a reasonable estimate of fair value because of the sufficiency of the collateral and short term nature of these loans. Margin loans that are sufficiently collateralized are classified as Level 2. Margin loans that are not sufficiently collateralized are classified as Level 3.
Securities borrowed require the Company to deposit cash or collateral with the lender. As the market value of the securities borrowed is monitored daily, the carrying value is a reasonable estimate of fair value. The fair value of securities borrowed is classified as Level 1 as the value of the underlying securities is based on unadjusted prices for identical assets.
The fair value of advisor loans is determined by discounting contractual cash flows, net of estimated credit losses, using a current market interest rate. Advisor loans are classified as Level 3.
Restricted and Segregated Cash
Restricted and segregated cash is generally set aside for specific business transactions, and restrictions are specific to the Company and do not transfer to third party market participants. The carrying amount is a reasonable estimate of fair value.
Amounts segregated under federal and other regulations may also reflect resale agreements and are measured at the price at which the securities will be sold. This measurement is a reasonable estimate of fair value because of the short time between entering into the transaction and its expected realization and the reduced risk of credit loss due to pledging U.S. government-backed securities as collateral.
The fair value of restricted and segregated cash is classified as Level 1.
Other Investments and Assets
Other investments and assets primarily consist of syndicated loans. The fair value of syndicated loans is obtained from a third-party pricing service or non-binding broker quotes. Syndicated loans that are priced using a market approach with observable inputs are classified as Level 2 and syndicated loans priced using a single non-binding broker quote are classified as Level 3.
Other investments and assets also include the Company’s membership in the FHLB and investments related to the Community Reinvestment Act. The fair value of these assets is approximated by the carrying value and classified as Level 3 due to restrictions on transfer and lack of liquidity in the primary market for these assets.
Policyholder Account Balances, Future Policy Benefits and Claims
The fair value of fixed annuities in deferral status is determined by discounting cash flows using a risk neutral discount rate with adjustments for profit margin, expense margin, early policy surrender behavior, a margin for adverse deviation from estimated early policy surrender behavior and the Company’s nonperformance risk specific to these liabilities. The fair value of non-life contingent fixed annuities in payout status, indexed annuity host contracts and the fixed portion of a small number of variable annuity contracts classified as investment contracts is determined in a similar manner. Given the use of significant unobservable inputs to these valuations, the measurements are classified as Level 3.
144
Investment Certificate Reserves
The fair value of investment certificate reserves is determined by discounting cash flows using discount rates that reflect current pricing for contracts with similar terms and characteristics, with adjustments for
early withdrawal behavior, penalty fees,
expense margin and the Company’s nonperformance risk specific to these liabilities. Given the use of significant unobservable inputs to this valuation, the measurement is classified as Level 3.
Brokerage Customer Deposits
Brokerage customer deposits are liabilities with no defined maturities and fair value is the amount payable on demand at the reporting date. The fair value of these deposits is classified as Level 1.
Separate Account Liabilities
Certain separate account liabilities are classified as investment contracts and are carried at an amount equal to the related separate account assets. The NAV of the related separate account assets is used as a practical expedient for fair value and represents the exit price for the separate account liabilities. Separate account liabilities are excluded from classification in the fair value hierarchy.
Debt and Other Liabilities
The
fair value of long-term debt is based on quoted prices in active markets, when available. If quoted prices are not available, fair values are obtained from third party pricing services, broker quotes, or other model-based valuation techniques such as present value of cash flows. The fair value of long-term debt is classified as Level 2.
The fair value of short-term borrowings is obtained from a third party pricing service. A nonperformance adjustment is not included as collateral requirements for these borrowings minimize the nonperformance risk. The fair value of short-term borrowings is classified as Level 2.
The fair value of future funding commitments to affordable housing partnerships and other real estate partnerships is determined by discounting cash flows. The fair value of these commitments includes an adjustment for the Company’s nonperformance risk and is classified as Level 3 due to the use of the significant unobservable input.
Securities loaned require the borrower to deposit cash or collateral with the Company. As the market value of the securities loaned is monitored daily, the carrying value is a reasonable estimate of fair value. Securities loaned are classified as Level 1 as the fair value of the underlying securities is based on unadjusted prices for identical assets.
15.
Offsetting Assets and Liabilities
Certain financial instruments and derivative instruments are eligible for offset in the Consolidated Balance Sheets. The Company’s derivative instruments, repurchase agreements and securities borrowing and lending agreements are subject to master netting arrangements and collateral arrangements and qualify for offset. A master netting arrangement with a counterparty creates a right of offset for amounts due to and from that same counterparty that is enforceable in the event of a default or bankruptcy. Securities borrowed and loaned result from transactions between the Company’s broker dealer subsidiary and other financial institutions and are recorded at the amount of cash collateral advanced or received. Securities borrowed and securities loaned are primarily equity securities. The Company’s securities borrowed and securities loaned transactions generally do not have a fixed maturity date and may be terminated by either party under customary terms.
The Company’s policy is to recognize amounts subject to master netting arrangements on a gross basis in the Consolidated Balance Sheets.
The following tables present the gross and net information about the Company’s assets subject to master netting arrangements:
|
|
December 31, 2017
|
||||||||||||||||||||||||||
|
Gross Amounts of Recognized Assets
|
Gross Amounts Offset in the Consolidated Balance Sheets
|
Amounts of Assets Presented in the Consolidated Balance Sheets
|
Gross Amounts Not Offset in the
Consolidated Balance Sheets
|
Net Amount
|
|||||||||||||||||||||||
|
Financial Instruments
(1)
|
Cash Collateral
|
Securities Collateral
|
|||||||||||||||||||||||||
|
(in millions)
|
|||||||||||||||||||||||||||
|
Derivatives:
|
|||||||||||||||||||||||||||
|
OTC
|
$
|
3,520
|
|
$
|
—
|
|
$
|
3,520
|
|
$
|
(2,653
|
)
|
$
|
(760
|
)
|
$
|
(88
|
)
|
$
|
19
|
|
||||||
|
OTC cleared
(2)
|
21
|
|
—
|
|
21
|
|
(15
|
)
|
—
|
|
—
|
|
6
|
|
|||||||||||||
|
Exchange-traded
|
22
|
|
—
|
|
22
|
|
(1
|
)
|
—
|
|
—
|
|
21
|
|
|||||||||||||
|
Total derivatives
|
3,563
|
|
—
|
|
3,563
|
|
(2,669
|
)
|
(760
|
)
|
(88
|
)
|
46
|
|
|||||||||||||
|
Securities borrowed
|
103
|
|
—
|
|
103
|
|
(19
|
)
|
—
|
|
(82
|
)
|
2
|
|
|||||||||||||
|
Total
|
$
|
3,666
|
|
$
|
—
|
|
$
|
3,666
|
|
$
|
(2,688
|
)
|
$
|
(760
|
)
|
$
|
(170
|
)
|
$
|
48
|
|
||||||
145
|
|
December 31, 2016
|
||||||||||||||||||||||||||
|
Gross Amounts of Recognized Assets
|
Gross Amounts Offset in the Consolidated Balance Sheets
|
Amounts of Assets Presented in the Consolidated Balance Sheets
|
Gross Amounts Not Offset in the
Consolidated Balance Sheets
|
Net Amount
|
|||||||||||||||||||||||
|
Financial Instruments
(1)
|
Cash Collateral
|
Securities Collateral
|
|||||||||||||||||||||||||
|
(in millions)
|
|||||||||||||||||||||||||||
|
Derivatives:
|
|||||||||||||||||||||||||||
|
OTC
|
$
|
2,920
|
|
$
|
—
|
|
$
|
2,920
|
|
$
|
(2,214
|
)
|
$
|
(406
|
)
|
$
|
(235
|
)
|
$
|
65
|
|
||||||
|
OTC cleared
|
512
|
|
—
|
|
512
|
|
(509
|
)
|
(3
|
)
|
—
|
|
—
|
|
|||||||||||||
|
Exchange-traded
|
14
|
|
—
|
|
14
|
|
(2
|
)
|
—
|
|
—
|
|
12
|
|
|||||||||||||
|
Total derivatives
|
3,446
|
|
—
|
|
3,446
|
|
(2,725
|
)
|
(409
|
)
|
(235
|
)
|
77
|
|
|||||||||||||
|
Securities borrowed
|
127
|
|
—
|
|
127
|
|
(16
|
)
|
—
|
|
(108
|
)
|
3
|
|
|||||||||||||
|
Total
|
$
|
3,573
|
|
$
|
—
|
|
$
|
3,573
|
|
$
|
(2,741
|
)
|
$
|
(409
|
)
|
$
|
(343
|
)
|
$
|
80
|
|
||||||
(1)
Represents the amount of assets that could be offset by liabilities with the same counterparty under master netting or similar arrangements that management elects not to offset on the Consolidated Balance Sheets.
(2)
The decrease in OTC cleared derivatives from December 31, 2016 is a result of certain central clearing parties amending their rules resulting in variation margin payments being settlement payments, as opposed to collateral.
The following tables present the gross and net information about the Company’s liabilities subject to master netting arrangements:
|
|
December 31, 2017
|
||||||||||||||||||||||||||
|
Gross Amounts of Recognized Liabilities
|
Gross Amounts Offset in the Consolidated Balance Sheets
|
Amounts of Liabilities Presented in the Consolidated Balance Sheets
|
Gross Amounts Not Offset in the
Consolidated Balance Sheets
|
Net Amount
|
|||||||||||||||||||||||
|
Financial Instruments
(1)
|
Cash Collateral
|
Securities Collateral
|
|||||||||||||||||||||||||
|
(in millions)
|
|||||||||||||||||||||||||||
|
Derivatives:
|
|||||||||||||||||||||||||||
|
OTC
|
$
|
3,309
|
|
$
|
—
|
|
$
|
3,309
|
|
$
|
(2,653
|
)
|
$
|
(70
|
)
|
$
|
(579
|
)
|
$
|
7
|
|
||||||
|
OTC cleared
(2)
|
16
|
|
—
|
|
16
|
|
(15
|
)
|
—
|
|
—
|
|
1
|
|
|||||||||||||
|
Exchange-traded
|
3
|
|
—
|
|
3
|
|
(1
|
)
|
—
|
|
—
|
|
2
|
|
|||||||||||||
|
Total derivatives
|
3,328
|
|
—
|
|
3,328
|
|
(2,669
|
)
|
(70
|
)
|
(579
|
)
|
10
|
|
|||||||||||||
|
Securities loaned
|
118
|
|
—
|
|
118
|
|
(19
|
)
|
—
|
|
(94
|
)
|
5
|
|
|||||||||||||
|
Repurchase agreements
|
50
|
|
—
|
|
50
|
|
—
|
|
—
|
|
(50
|
)
|
—
|
|
|||||||||||||
|
Total
|
$
|
3,496
|
|
$
|
—
|
|
$
|
3,496
|
|
$
|
(2,688
|
)
|
$
|
(70
|
)
|
$
|
(723
|
)
|
$
|
15
|
|
||||||
|
|
December 31, 2016
|
||||||||||||||||||||||||||
|
Gross Amounts of Recognized Liabilities
|
Gross Amounts Offset in the Consolidated Balance Sheets
|
Amounts of Liabilities Presented in the Consolidated Balance Sheets
|
Gross Amounts Not Offset in the Consolidated Balance Sheets
|
Net Amount
|
|||||||||||||||||||||||
|
Financial Instruments
(1)
|
Cash Collateral
|
Securities Collateral
|
|||||||||||||||||||||||||
|
(in millions)
|
|||||||||||||||||||||||||||
|
Derivatives:
|
|||||||||||||||||||||||||||
|
OTC
|
$
|
2,626
|
|
$
|
—
|
|
$
|
2,626
|
|
$
|
(2,214
|
)
|
$
|
(53
|
)
|
$
|
(352
|
)
|
$
|
7
|
|
||||||
|
OTC cleared
|
539
|
|
—
|
|
539
|
|
(509
|
)
|
(25
|
)
|
—
|
|
5
|
|
|||||||||||||
|
Exchange-traded
|
6
|
|
—
|
|
6
|
|
(2
|
)
|
—
|
|
—
|
|
4
|
|
|||||||||||||
|
Total derivatives
|
3,171
|
|
—
|
|
3,171
|
|
(2,725
|
)
|
(78
|
)
|
(352
|
)
|
16
|
|
|||||||||||||
|
Securities loaned
|
146
|
|
—
|
|
146
|
|
(16
|
)
|
—
|
|
(125
|
)
|
5
|
|
|||||||||||||
|
Repurchase agreements
|
50
|
|
—
|
|
50
|
|
—
|
|
—
|
|
(50
|
)
|
—
|
|
|||||||||||||
|
Total
|
$
|
3,367
|
|
$
|
—
|
|
$
|
3,367
|
|
$
|
(2,741
|
)
|
$
|
(78
|
)
|
$
|
(527
|
)
|
$
|
21
|
|
||||||
(1)
Represents the amount of liabilities that could be offset by assets with the same counterparty under master netting or similar arrangements that
management elects not to offset on the Consolidated Balance Sheets.
(2)
The decrease in OTC cleared derivatives from December 31, 2016 is a result of certain central clearing parties amending their rules resulting in
variation margin payments being settlement payments, as opposed to collateral.
In the tables above, the amounts of assets or liabilities presented are offset first by financial instruments that have the right of offset under master netting or similar arrangements, then any remaining amount is reduced by the amount of cash and securities collateral. The actual collateral may be greater than amounts presented in the tables.
146
When the fair value of collateral accepted by the Company is less than the amount due to the Company, there is a risk of loss if the counterparty fails to perform or provide additional collateral. To mitigate this risk, the Company monitors collateral values regularly and requires additional collateral when necessary. When the value of collateral pledged by the Company declines, it may be required to post additional collateral.
Freestanding derivative instruments are reflected in other assets and other liabilities. Cash collateral pledged by the Company is reflected in other assets and cash collateral accepted by the Company is reflected in other liabilities. Repurchase agreements are reflected in short-term borrowings. Securities borrowing and lending agreements are reflected in receivables and other liabilities, respectively. See Note 16 for additional disclosures related to the Company’s derivative instruments, Note 13 for additional disclosures related to the Company’s repurchase agreements and Note 4 for information related to derivatives held by consolidated investment entities.
16.
Derivatives and Hedging Activities
Derivative instruments enable the Company to manage its exposure to various market risks. The value of such instruments is derived from an underlying variable or multiple variables, including equity, foreign exchange and interest rate indices or prices. The Company primarily enters into derivative agreements for risk management purposes related to the Company’s products and operations.
The Company’s freestanding derivative instruments are all subject to master netting arrangements. The Company’s policy on the recognition of derivatives on the Consolidated Balance Sheets is to not offset fair value amounts recognized for derivatives and collateral arrangements executed with the same counterparty under the same master netting arrangement. See Note 15 for additional information regarding the estimated fair value of the Company’s freestanding derivatives after considering the effect of master netting arrangements and collateral.
The Company uses derivatives as economic hedges and accounting hedges. The following table presents the notional value and gross fair value of derivative instruments, including embedded derivatives:
|
December 31, 2017
|
December 31, 2016
|
||||||||||||||||||||||
|
Notional
|
Gross Fair Value
|
Notional
|
Gross Fair Value
|
||||||||||||||||||||
|
Assets
(1)
|
Liabilities
(2)(3)
|
Assets
(1)
|
Liabilities
(2)(3)
|
||||||||||||||||||||
|
(in millions)
|
|||||||||||||||||||||||
|
Derivatives designated as hedging instruments
|
|||||||||||||||||||||||
|
Interest rate contracts
|
$
|
675
|
|
$
|
23
|
|
$
|
—
|
|
$
|
675
|
|
$
|
40
|
|
$
|
—
|
|
|||||
|
Foreign exchange contracts
|
87
|
|
—
|
|
4
|
|
164
|
|
12
|
|
—
|
|
|||||||||||
|
Total qualifying hedges
|
762
|
|
23
|
|
4
|
|
839
|
|
52
|
|
—
|
|
|||||||||||
|
Derivatives not designated as hedging instruments
|
|||||||||||||||||||||||
|
Interest rate contracts
|
66,043
|
|
1,081
|
|
416
|
|
72,449
|
|
1,738
|
|
989
|
|
|||||||||||
|
Equity contracts
|
59,292
|
|
2,423
|
|
2,883
|
|
63,015
|
|
1,574
|
|
2,135
|
|
|||||||||||
|
Credit contracts
|
721
|
|
—
|
|
2
|
|
1,039
|
|
1
|
|
—
|
|
|||||||||||
|
Foreign exchange contracts
|
4,163
|
|
36
|
|
23
|
|
4,733
|
|
81
|
|
47
|
|
|||||||||||
|
Other contracts
|
452
|
|
—
|
|
—
|
|
241
|
|
—
|
|
—
|
|
|||||||||||
|
Total non-designated hedges
|
130,671
|
|
3,540
|
|
3,324
|
|
141,477
|
|
3,394
|
|
3,171
|
|
|||||||||||
|
Embedded derivatives
|
|||||||||||||||||||||||
|
GMWB and GMAB
(4)
|
N/A
|
|
—
|
|
(49
|
)
|
N/A
|
|
—
|
|
614
|
|
|||||||||||
|
IUL
|
N/A
|
|
—
|
|
601
|
|
N/A
|
|
—
|
|
464
|
|
|||||||||||
|
Indexed annuities
|
N/A
|
|
—
|
|
5
|
|
N/A
|
|
—
|
|
5
|
|
|||||||||||
|
SMC
|
N/A
|
|
—
|
|
10
|
|
N/A
|
|
—
|
|
8
|
|
|||||||||||
|
Total embedded derivatives
|
N/A
|
|
—
|
|
567
|
|
N/A
|
|
—
|
|
1,091
|
|
|||||||||||
|
Total derivatives
|
$
|
131,433
|
|
$
|
3,563
|
|
$
|
3,895
|
|
$
|
142,316
|
|
$
|
3,446
|
|
$
|
4,262
|
|
|||||
N/A Not applicable.
(1)
The fair value of freestanding derivative assets is included in Other assets on the Consolidated Balance Sheets.
(2)
The fair value of freestanding derivative liabilities is included in Other liabilities on the Consolidated Balance Sheets. The fair value of GMWB and GMAB, IUL, and indexed annuity embedded derivatives is included in Policyholder account balances, future policy benefits and claims on the Consolidated Balance Sheets. The fair value of the SMC embedded derivative liability is included in Customer deposits on the Consolidated Balance Sheets.
(3)
The fair value of the Company’s derivative liabilities after considering the effects of master netting arrangements, cash collateral held by the same counterparty and the fair value of net embedded derivatives was
$1.3 billion
and
$1.5 billion
as of
December 31, 2017
and
2016
, respectively. See
147
Note 15 for additional information related to master netting arrangements and cash collateral. See Note 4 for information about derivatives held by consolidated VIEs.
|
(4)
|
The fair value of the GMWB and GMAB embedded derivatives as of
December 31, 2017
included
$443 million
of individual contracts in a liability position and
$492 million
of individual contracts in an asset position. The fair value of the GMWB and GMAB embedded derivatives as of
December 31, 2016
included
$880 million
of individual contracts in a liability position and
$266 million
of individual contracts in an asset position.
|
See Note 14 for additional information regarding the Company’s fair value measurement of derivative instruments.
As of
December 31, 2017
and
2016
, investment securities with a fair value of
$89 million
and
$235 million
, respectively, were received as collateral to meet contractual obligations under derivative contracts, of which
$89 million
and
$118 million
, respectively, may be sold, pledged or rehypothecated by the Company. As of
December 31, 2017
and
2016
, the Company had sold, pledged or rehypothecated
nil
and
$19 million
, respectively, of these securities. In addition, as of
December 31, 2017
and
2016
, non-cash collateral accepted was held in separate custodial accounts and was not included in the Company’s Consolidated Balance Sheets.
Derivatives Not Designated as Hedges
The following table presents a summary of the impact of derivatives not designated as hedging instruments, including embedded derivatives, on the Consolidated Statements of Operations:
|
Net Investment Income
|
Banking and Deposit Interest Expense
|
Distribution Expenses
|
Interest Credited to Fixed Accounts
|
Benefits, Claims, Losses and Settlement Expenses
|
General and Administrative Expense
|
||||||||||||||||||
|
(in millions)
|
|||||||||||||||||||||||
|
Year Ended December 31, 2017
|
|||||||||||||||||||||||
|
Interest rate contracts
|
$
|
(3
|
)
|
$
|
—
|
|
$
|
—
|
|
$
|
—
|
|
$
|
1
|
|
$
|
—
|
|
|||||
|
Equity contracts
|
(10
|
)
|
4
|
|
54
|
|
75
|
|
(1,081
|
)
|
11
|
|
|||||||||||
|
Credit contracts
|
—
|
|
—
|
|
—
|
|
—
|
|
(22
|
)
|
—
|
|
|||||||||||
|
Foreign exchange contracts
|
—
|
|
—
|
|
3
|
|
—
|
|
(23
|
)
|
6
|
|
|||||||||||
|
Other contracts
|
—
|
|
—
|
|
—
|
|
—
|
|
(2
|
)
|
—
|
|
|||||||||||
|
GMWB and GMAB embedded derivatives
|
—
|
|
—
|
|
—
|
|
—
|
|
663
|
|
—
|
|
|||||||||||
|
IUL embedded derivatives
|
—
|
|
—
|
|
—
|
|
(45
|
)
|
—
|
|
—
|
|
|||||||||||
|
SMC embedded derivatives
|
—
|
|
(4
|
)
|
—
|
|
—
|
|
—
|
|
—
|
|
|||||||||||
|
Total gain (loss)
|
$
|
(13
|
)
|
$
|
—
|
|
$
|
57
|
|
$
|
30
|
|
$
|
(464
|
)
|
$
|
17
|
|
|||||
|
Year Ended December 31, 2016
|
|||||||||||||||||||||||
|
Interest rate contracts
|
$
|
3
|
|
$
|
—
|
|
$
|
—
|
|
$
|
—
|
|
$
|
36
|
|
$
|
—
|
|
|||||
|
Equity contracts
|
(1
|
)
|
2
|
|
23
|
|
20
|
|
(897
|
)
|
6
|
|
|||||||||||
|
Credit contracts
|
—
|
|
—
|
|
—
|
|
—
|
|
2
|
|
—
|
|
|||||||||||
|
Foreign exchange contracts
|
—
|
|
—
|
|
(1
|
)
|
—
|
|
—
|
|
14
|
|
|||||||||||
|
Other contracts
|
—
|
|
—
|
|
—
|
|
—
|
|
(2
|
)
|
—
|
|
|||||||||||
|
GMWB and GMAB embedded derivatives
|
—
|
|
—
|
|
—
|
|
—
|
|
237
|
|
—
|
|
|||||||||||
|
IUL embedded derivatives
|
—
|
|
—
|
|
—
|
|
15
|
|
—
|
|
—
|
|
|||||||||||
|
SMC embedded derivatives
|
—
|
|
(2
|
)
|
—
|
|
—
|
|
—
|
|
—
|
|
|||||||||||
|
Total gain (loss)
|
$
|
2
|
|
$
|
—
|
|
$
|
22
|
|
$
|
35
|
|
$
|
(624
|
)
|
$
|
20
|
|
|||||
|
Year Ended December 31, 2015
|
|||||||||||||||||||||||
|
Interest rate contracts
|
$
|
(21
|
)
|
$
|
—
|
|
$
|
—
|
|
$
|
—
|
|
$
|
228
|
|
$
|
—
|
|
|||||
|
Equity contracts
|
—
|
|
—
|
|
1
|
|
(10
|
)
|
(317
|
)
|
2
|
|
|||||||||||
|
Credit contracts
|
—
|
|
—
|
|
—
|
|
—
|
|
(1
|
)
|
—
|
|
|||||||||||
|
Foreign exchange contracts
|
4
|
|
—
|
|
(1
|
)
|
—
|
|
13
|
|
(2
|
)
|
|||||||||||
|
Other contracts
|
1
|
|
—
|
|
—
|
|
—
|
|
(1
|
)
|
—
|
|
|||||||||||
|
GMWB and GMAB embedded derivatives
|
—
|
|
—
|
|
—
|
|
—
|
|
(372
|
)
|
—
|
|
|||||||||||
|
IUL embedded derivatives
|
—
|
|
—
|
|
—
|
|
(8
|
)
|
—
|
|
—
|
|
|||||||||||
|
Indexed annuity embedded derivatives
|
—
|
|
—
|
|
—
|
|
1
|
|
—
|
|
—
|
|
|||||||||||
|
Total gain (loss)
|
$
|
(16
|
)
|
$
|
—
|
|
$
|
—
|
|
$
|
(17
|
)
|
$
|
(450
|
)
|
$
|
—
|
|
|||||
148
The Company holds derivative instruments that either do not qualify or are not designated for hedge accounting treatment. These derivative instruments are used as economic hedges of equity, interest rate, credit and foreign currency exchange rate risk related to various products and transactions of the Company.
Certain annuity contracts contain GMWB or GMAB provisions, which guarantee the right to make limited partial withdrawals each contract year regardless of the volatility inherent in the underlying investments or guarantee a minimum accumulation value of consideration received at the beginning of the contract period, after a specified holding period, respectively. The GMAB and non-life contingent GMWB provisions are considered embedded derivatives, which are bifurcated from their host contracts for valuation purposes and reported on the Consolidated Balance Sheets at fair value with changes in fair value reported in earnings. The Company economically hedges the exposure related to GMAB and non-life contingent GMWB provisions primarily using futures, options, interest rate swaptions, interest rate swaps, total return swaps and variance swaps.
The deferred premium associated with certain of the above options and swaptions is paid or received semi-annually over the life of the contract or at maturity. The following is a summary of the payments the Company is scheduled to make and receive for these options and swaptions as of
December 31, 2017
:
|
|
Premiums Payable
|
Premiums Receivable
|
|||||
|
|
(in millions)
|
||||||
|
2018
|
$
|
233
|
|
$
|
131
|
|
|
|
2019
|
296
|
|
171
|
|
|||
|
2020
|
217
|
|
100
|
|
|||
|
2021
|
187
|
|
109
|
|
|||
|
2022
|
250
|
|
148
|
|
|||
|
2023-2027
|
523
|
|
59
|
|
|||
|
Total
|
$
|
1,706
|
|
$
|
718
|
|
|
Actual timing and payment amounts may differ due to future settlements, modifications or exercises of the contracts prior to the full premium being paid or received.
The Company has a macro hedge program to provide protection against the statutory tail scenario risk arising from variable annuity reserves on its statutory surplus and to cover some of the residual risks not covered by other hedging activities. As a means of economically hedging these risks, the Company uses a combination of futures, options, interest rate swaptions and/or swaps. Certain of the macro hedge derivatives contain settlement provisions linked to both equity returns and interest rates. The Company’s macro hedge derivatives that contain settlement provisions linked to both equity returns and interest rates are shown in Other contracts in the tables above.
Indexed annuity, IUL and stock market certificate products have returns tied to the performance of equity markets. As a result of fluctuations in equity markets, the obligation incurred by the Company related to indexed annuity, IUL and stock market certificate products will positively or negatively impact earnings over the life of these products. The equity component of the indexed annuity, IUL and stock market certificate product obligations are considered embedded derivatives, which are bifurcated from their host contracts for valuation purposes and reported on the Consolidated Balance Sheets at fair value with changes in fair value reported in earnings. As a means of economically hedging its obligations under the provisions of these products, the Company enters into index options and futures contracts.
The Company enters into futures, credit default swaps and commodity swaps to manage its exposure to price risk arising from seed money investments in proprietary investment products. The Company enters into foreign currency forward contracts to economically hedge its exposure to certain foreign transactions. The Company enters into futures contracts to economically hedge its exposure related to compensation plans. In 2015, the Company entered into interest rate swaps to offset interest rate changes on unrealized gains or losses for certain investments.
Cash Flow Hedges
The Company has designated and accounts for the following as cash flow hedges: (i) interest rate swaps to hedge interest rate exposure on debt, (ii) interest rate lock agreements to hedge interest rate exposure on debt issuances and (iii) swaptions used to hedge the risk of increasing interest rates on forecasted fixed premium product sales.
For the years ended
December 31, 2017
,
2016
and
2015
, amounts recognized in earnings related to cash flow hedges due to ineffectiveness were
$1 million
,
nil
and
$1 million
, respectively. The estimated net amount of existing pretax losses as of
December 31, 2017
that the Company expects to reclassify to earnings within the next twelve months is
nil
, which consists of
$2 million
of pretax gains to be recorded as a reduction to interest and debt expense and
$2 million
of pretax losses to be recorded in net investment income. Currently, the longest period of time over which the Company is hedging exposure to the variability in future cash flows is
18
years and relates to forecasted debt interest payments. See Note 18 for a rollforward of net unrealized derivative gains (losses) included in AOCI related to cash flow hedges.
149
Fair Value Hedges
The Company entered into and designated as fair value hedges
two
interest rate swaps to convert senior notes due 2019 and 2020 from fixed rate debt to floating rate debt. The swaps have identical terms as the underlying debt being hedged so no ineffectiveness is expected to be realized. The Company recognizes gains and losses on the derivatives and the related hedged items within interest and debt expense. The following table presents the amounts recognized in income related to fair value hedges:
|
Derivatives designated as hedging instruments
|
Location of Gain Recorded into Income
|
Amount of Gain Recognized in Income on Derivatives
|
||||||||||||
|
Years Ended December 31,
|
||||||||||||||
|
2017
|
2016
|
2015
|
||||||||||||
|
(in millions)
|
||||||||||||||
|
Interest rate contracts
|
Interest and debt expense
|
$
|
16
|
|
$
|
19
|
|
$
|
31
|
|
||||
Net Investment Hedges
The Company entered into, and designated as net investment hedges in foreign operations, forward contracts to hedge a portion of the Company’s foreign currency exchange rate risk associated with its investment in Threadneedle. As the Company determined that the forward contracts are effective, the change in fair value of the derivatives is recognized in AOCI as part of the foreign currency translation adjustment.
For the years ended
December 31, 2017
and 2016, the Company recognized a loss of
$4 million
and a gain of
$34 million
, respectively, in OCI.
Credit Risk
Credit risk associated with the Company’s derivatives is the risk that a derivative counterparty will not perform in accordance with the terms of the applicable derivative contract. To mitigate such risk, the Company has established guidelines and oversight of credit risk through a comprehensive enterprise risk management program that includes members of senior management. Key components of this program are to require preapproval of counterparties and the use of master netting and collateral arrangements whenever practical. See Note 15 for additional information on the Company’s credit exposure related to derivative assets.
Certain of the Company’s derivative contracts contain provisions that adjust the level of collateral the Company is required to post based on the Company’s debt rating (or based on the financial strength of the Company’s life insurance subsidiaries for contracts in which those subsidiaries are the counterparty). Additionally, certain of the Company’s derivative contracts contain provisions that allow the counterparty to terminate the contract if the Company’s debt does not maintain a specific credit rating (generally an investment grade rating) or the Company’s life insurance subsidiary does not maintain a specific financial strength rating. If these termination provisions were to be triggered, the Company’s counterparty could require immediate settlement of any net liability position. As of
December 31, 2017
and
2016
, the aggregate fair value of derivative contracts in a net liability position containing such credit contingent provisions was
$372 million
and
$254 million
, respectively. The aggregate fair value of assets posted as collateral for such instruments as of
December 31, 2017
and
2016
was
$369 million
and
$246 million
, respectively. If the credit contingent provisions of derivative contracts in a net liability position as of
December 31, 2017
and
2016
were triggered, the aggregate fair value of additional assets that would be required to be posted as collateral or needed to settle the instruments immediately would have been
$3 million
and
$8 million
, respectively.
17.
Share-Based Compensation
The Company’s share-based compensation plans consist of the Amended and Restated Ameriprise Financial 2005 Incentive Compensation Plan (the “2005 ICP”), the Ameriprise Financial 2008 Employment Incentive Equity Award Plan (the “2008 Plan”), the Ameriprise Financial Franchise Advisor Deferred Compensation Plan (“Franchise Advisor Deferral Plan”) and the Ameriprise Advisor Group Deferred Compensation Plan (“Advisor Group Deferral Plan”).
The components of the Company’s share-based compensation expense, net of forfeitures, were as follows:
|
December 31,
|
|||||||||||
|
2017
|
2016
|
2015
|
|||||||||
|
(in millions)
|
|||||||||||
|
Stock option
|
$
|
32
|
|
$
|
34
|
|
$
|
39
|
|
||
|
Restricted stock
|
24
|
|
24
|
|
22
|
|
|||||
|
Restricted stock units
|
65
|
|
76
|
|
83
|
|
|||||
|
Liability awards
|
45
|
|
4
|
|
14
|
|
|||||
|
Total
|
$
|
166
|
|
$
|
138
|
|
$
|
158
|
|
||
For the years ended
December 31, 2017
,
2016
and
2015
, total income tax benefit recognized by the Company related to share-based compensation expense was
$58 million
,
$48 million
and
$56 million
, respectively.
As of
December 31, 2017
, there was
$94 million
of total unrecognized compensation cost related to non-vested awards under the Company’s share-based compensation plans, which is expected to be recognized over a weighted-average period of
2.5
years.
150
Amended and Restated Ameriprise Financial 2005 Incentive Compensation Plan
The 2005 ICP, which was amended and approved by shareholders on April 30, 2014, provides for the grant of cash and equity incentive awards to directors, employees and independent contractors, including stock options, restricted stock awards, restricted stock units, stock appreciation rights, performance shares and similar awards designed to comply with the applicable federal regulations and laws of jurisdiction. Under the 2005 ICP, a maximum of
54.4
million shares may be issued. Of this total, no more than
4.5
million shares may be issued after April 30, 2014 for full value awards, which are awards other than stock options and stock appreciation rights. Shares issued under the 2005 ICP may be authorized and unissued shares or treasury shares.
Ameriprise Financial 2008 Employment Incentive Equity Award Plan
The 2008 Plan is designed to align employees’ interests with those of the shareholders of the Company and attract and retain new employees. The 2008 Plan provides for the grant of equity incentive awards to new employees, primarily those, who became employees in connection with a merger or acquisition, including stock options, restricted stock awards, restricted stock units, and other equity-based awards designed to comply with the applicable federal and foreign regulations and laws of jurisdiction. Under the 2008 Plan, a maximum of
6.0
million shares may be issued.
Stock Options
Stock options granted under the 2005 ICP and the 2008 Plan have an exercise price not less than
100%
of the current fair market value of a share of the Company’s common stock on the grant date and a maximum term of
10
years. Stock options granted generally vest ratably over
three
to
four
years. Vesting of option awards may be accelerated based on age and length of service. Stock options granted are expensed on a straight-line basis over the vesting period based on the fair value of the awards on the date of grant. The grant date fair value of the options is calculated using a Black-Scholes option-pricing model.
The following weighted average assumptions were used for stock option grants:
|
2017
|
2016
|
2015
|
||||||
|
Dividend yield
|
2.3
|
%
|
2.3
|
%
|
2.0
|
%
|
||
|
Expected volatility
|
30
|
%
|
27
|
%
|
26
|
%
|
||
|
Risk-free interest rate
|
1.9
|
%
|
1.3
|
%
|
1.2
|
%
|
||
|
Expected life of stock option (years)
|
5.0
|
5.0
|
5.0
|
|||||
The dividend yield assumption represents the Company’s expected dividend yield based on its historical dividend payouts and management’s expectations. The expected volatility is based on the Company’s historical and implied volatilities. The risk-free interest rate for periods within the expected option life is based on the U.S. Treasury yield curve at the grant date. The expected life of the option is based on the Company’s past experience and other considerations.
The weighted average grant date fair value for options granted during
2017
,
2016
and
2015
was
$28.33
,
$17.00
and
$25.12
, respectively.
A summary of the Company’s stock option activity for
2017
is presented below (shares and intrinsic value in millions):
|
Shares
|
Weighted Average Exercise Price
|
Weighted Average Remaining Contractual
Term (Years)
|
Aggregate Intrinsic Value
|
|||||||||
|
Outstanding at January 1
|
8.2
|
|
$
|
84.85
|
|
6.7
|
$
|
241
|
|
|||
|
Granted
|
1.2
|
|
123.58
|
|
||||||||
|
Exercised
|
(3.3
|
)
|
69.41
|
|
||||||||
|
Forfeited
|
(0.1
|
)
|
106.62
|
|
||||||||
|
Outstanding at December 31
|
6.0
|
|
100.38
|
|
7.0
|
413
|
|
|||||
|
Exercisable at December 31
|
3.2
|
|
92.72
|
|
5.8
|
243
|
|
|||||
The intrinsic value of a stock option is the amount by which the fair value of the underlying stock exceeds the exercise price of the option. The total intrinsic value of options exercised was
$222 million
,
$37 million
and
$111 million
during the years ended
December 31, 2017
,
2016
and
2015
, respectively.
151
Restricted Stock Awards
Restricted stock awards granted under the 2005 ICP and 2008 Plan generally vest ratably over
three
to
four
years or at the end of
five
years. Vesting of restricted stock awards may be accelerated based on age and length of service. Compensation expense for restricted stock awards is based on the market price of Ameriprise Financial common stock on the date of grant and is amortized on a straight-line basis over the vesting period. Quarterly dividends are paid on restricted stock, as declared by the Company’s Board of Directors, during the vesting period and are not subject to forfeiture.
Restricted Stock Units and Deferred Share Units
The 2005 ICP provides for the grant of deferred share units to non-employee directors of the Company and the 2005 ICP and 2008 Plan provide for the grant of restricted stock units to employees. The director awards are fully vested upon issuance and are settled for Ameriprise Financial common stock upon the director’s termination of service. The employee awards generally vest ratably over
three
to
four
years. Compensation expense for deferred share units and restricted stock units is based on the market price of Ameriprise Financial stock on the date of grant. Restricted stock units granted to employees are expensed on a straight-line basis over the vesting period or on an accelerated basis if certain age and length of service requirements are met. Deferred share units granted to non-employee directors are expensed immediately. Dividends are paid on restricted stock units, as declared by the Company’s Board of Directors, during the vesting period and are not subject to forfeiture. Dividend equivalents are issued on deferred share units, as dividends are declared by the Company's Board of Directors, until distribution and are not subject to forfeiture.
Ameriprise Financial Deferred Compensation Plan
The Ameriprise Financial Deferred Compensation Plan (“DCP”) under the 2005 ICP gives certain employees the choice to defer a portion of their eligible compensation, which can be invested in investment options as provided by the DCP, including the Ameriprise Financial Stock Fund. The DCP is an unfunded non-qualified deferred compensation plan under section 409A of the Internal Revenue Code. The Company provides a match on certain deferrals. Participant deferrals vest immediately and the Company match vests after three years. Distributions are made in shares of the Company’s common stock for the portion of the deferral invested in the Ameriprise Financial Stock Fund and the Company match, for which the Company has recorded in equity. The DCP does allow for accelerated vesting of the share-based awards in cases of death, disability and qualified retirement. Compensation expense related to the Company match is recognized on a straight-line basis over the vesting period or on an accelerated basis if certain age and length of service requirements are met. Dividend equivalents are issued on deferrals into the Ameriprise Financial Stock Fund and the Company match. Dividend equivalents related to deferrals are not subject to forfeiture, whereas dividend equivalents related to the Company match are subject to forfeiture until fully vested.
Ameriprise Financial Franchise Advisor Deferral Plan
The Franchise Advisor Deferral Plan, which was amended in January 2011, gives certain advisors the choice to defer a portion of their commissions into Ameriprise Financial stock or other investment options. The Franchise Advisor Deferral Plan is an unfunded non-qualified deferred compensation plan under section 409A of the Internal Revenue Code. Prior to 2011, all deferrals were in the form of share-based awards and the Company provided a match on the advisor deferrals, which participants could elect to receive in cash or shares of common stock.
The Franchise Advisor Deferral Plan allows for the grant of share-based awards of up to
12.5
million shares of common stock. The number of units awarded is based on the performance measures, deferral percentage and the market value of Ameriprise Financial common stock on the deferral date as defined by the plan. Share-based awards made during 2011 and later are fully vested and are not subject to forfeitures. Share-based awards made prior to 2011 generally vest ratably over
four
years, beginning on January 1 of the year following the plan year in which the award was made. In addition to the voluntary deferral, certain advisors are eligible for the Franchise Advisor Top Performer Stock Award or the Franchise Consultant Growth Bonus. The Franchise Advisor Top Performer Stock Award allows eligible advisors to earn additional deferred stock awards on commissions over a specified threshold. The awards vest ratably over
four
years. The Franchise Consultant Growth Bonus allows eligible advisors who coach other advisors the ability to earn a bonus based on the success of the advisors they coach, which can be deferred into the plan. The awards vest ratably over
three
years. The Franchise Advisor Deferral Plan allows for accelerated vesting of the share-based awards based on age and years as an advisor. Commission expense is recognized on a straight-line basis over the vesting period. However, as franchise advisors are not employees of the Company, the expense is adjusted each period based on the stock price of the Company’s common stock up to the vesting date. Share units receive dividend equivalents, as dividends are declared by the Company’s Board of Directors, until distribution and are subject to forfeiture until vested.
152
Ameriprise Advisor Group Deferred Compensation Plan
The Advisor Group Deferral Plan, which was created in April 2009, allows for employee advisors to receive share-based bonus awards which are subject to future service requirements and forfeitures. The Advisor Group Deferral Plan is an unfunded non-qualified deferred compensation plan under section 409A of the Internal Revenue Code. The Advisor Group Deferral Plan also gives qualifying employee advisors the choice to defer a portion of their base salary or commissions. This deferral can be in the form of Ameriprise Financial stock or other investment options. Deferrals are not subject to future service requirements or forfeitures. Under the Advisor Group Deferral Plan, a maximum of
3.0
million shares may be issued. Awards granted under the Advisor Group Deferral Plan may be settled in cash and/or shares of the Company’s common stock according to the award’s terms. Share units receive dividend equivalents, as dividends are declared by the Company’s Board of Directors, until distribution and are subject to forfeiture until vested.
Full Value Share Award Activity
A summary of activity for the Company’s restricted stock awards, restricted stock units granted to employees (including advisors), compensation and commission deferrals into stock and deferred share units for
2017
is presented below (shares in millions):
|
Shares
|
Weighted Average Grant-date Fair Value
|
|||||
|
Non-vested shares at January 1
|
1.3
|
|
$
|
99.37
|
|
|
|
Granted
|
0.5
|
|
127.08
|
|
||
|
Deferred
|
0.2
|
|
134.01
|
|
||
|
Vested
|
(0.7
|
)
|
113.59
|
|
||
|
Forfeited
|
(0.1
|
)
|
106.43
|
|
||
|
Non-vested shares at December 31
|
1.2
|
|
107.52
|
|
||
The deferred shares in the table above primarily relate to franchise advisor voluntary deferrals of their commissions into Ameriprise Financial stock under the Franchise Advisor Deferral Plan that are fully vested at the deferral date.
The fair value of full value share awards vested during the years ended
December 31, 2017
,
2016
and
2015
was
$97 million
,
$103 million
and
$133 million
, respectively.
The weighted average grant date fair value for restricted shares, restricted stock units and deferred share units during
2017
,
2016
and
2015
was
$124.51
,
$88.61
and
$128.43
, respectively. The weighted average grant date fair value for franchise advisor and advisor group deferrals during
2017
,
2016
and
2015
was
$134.58
,
$94.55
and
$123.88
, respectively.
Performance Share Units
Under the 2005 ICP, the Company’s Executive Leadership Team may be awarded a target number of performance share units (“PSUs”). PSUs will be earned only to the extent that the Company attains certain goals relating to the Company’s performance and relative total shareholder returns against peers over a
three
-year period. The awards also have a
three
-year service condition with cliff vesting with an accelerated service condition based on age and length of service. The actual number of PSUs ultimately earned could vary from
zero
, if performance goals are not met, to as much as
200%
of the target, if performance goals are significantly exceeded. The value of each target PSU is equal to the value of one share of Ameriprise Financial common stock. The total amount of target PSUs outstanding at the end of
December 31, 2017
,
2016
and
2015
was
0.2 million
. The PSUs are liability awards. During the years ended
December 31, 2017
,
2016
and
2015
, the value of shares settled for PSU awards was
$13 million
,
$15 million
and
$27 million
, respectively.
Threadneedle Equity Incentive Plan (“EIP”)
Prior to 2012, certain key Threadneedle employees were eligible for awards under the EIP based on a formula tied to Threadneedle’s financial performance. Awards under the EIP were first made in April 2009; prior awards were made under the equity participation plan (“EPP”). The EPP and EIP awards were fully amortized as of December 31, 2015. During the years ended
December 31, 2017
,
2016
and
2015
, cash settlements of EPP and EIP awards were
nil
,
$2 million
and
$28 million
, respectively.
153
18.
Shareholders’ Equity
The
following tables provide the amounts related to each component of OCI:
|
Year Ended December 31, 2017
|
||||||||||||
|
Pretax
|
Income Tax Benefit (Expense)
|
Net of Tax
|
||||||||||
|
(in millions)
|
||||||||||||
|
Net unrealized securities gains (losses):
|
||||||||||||
|
Net unrealized securities gains (losses) arising during the period
(1)
|
$
|
243
|
|
$
|
(77
|
)
|
$
|
166
|
|
|||
|
Reclassification of net securities (gains) losses included in net income
(2)
|
(55
|
)
|
19
|
|
(36
|
)
|
||||||
|
Impact of DAC, DSIC, unearned revenue, benefit reserves and reinsurance recoverables
|
(180
|
)
|
57
|
|
(123
|
)
|
||||||
|
Net unrealized securities gains (losses)
|
8
|
|
(1
|
)
|
7
|
|
||||||
|
Net unrealized derivatives gains (losses):
|
||||||||||||
|
Reclassification of net derivative (gains) losses included in net income
(3)
|
5
|
|
(2
|
)
|
3
|
|
||||||
|
Net unrealized derivatives gains (losses)
|
5
|
|
(2
|
)
|
3
|
|
||||||
|
Defined benefit plans:
|
||||||||||||
|
Prior service credit
|
2
|
|
(1
|
)
|
1
|
|
||||||
|
Net gain (loss) arising during the period
|
38
|
|
(11
|
)
|
27
|
|
||||||
|
Defined benefit plans
|
40
|
|
(12
|
)
|
28
|
|
||||||
|
Foreign currency translation
|
74
|
|
(82
|
)
|
(4
|
)
|
(8
|
)
|
||||
|
Other
|
(1
|
)
|
—
|
|
(1
|
)
|
||||||
|
Total other comprehensive income (loss)
|
$
|
126
|
|
$
|
(97
|
)
|
$
|
29
|
|
|||
|
Year Ended December 31, 2016
|
|||||||||||
|
Pretax
|
Income Tax Benefit (Expense)
|
Net of Tax
|
|||||||||
|
(in millions)
|
|||||||||||
|
Net unrealized securities gains (losses):
|
|||||||||||
|
Net unrealized securities gains (losses) arising during the period
(1)
|
$
|
339
|
|
$
|
(121
|
)
|
$
|
218
|
|
||
|
Reclassification of net securities (gains) losses included in net income
(2)
|
(22
|
)
|
8
|
|
(14
|
)
|
|||||
|
Impact of DAC, DSIC, unearned revenue, benefit reserves and reinsurance recoverables
|
(242
|
)
|
85
|
|
(157
|
)
|
|||||
|
Net unrealized securities gains (losses)
|
75
|
|
(28
|
)
|
47
|
|
|||||
|
Net unrealized derivatives gains (losses):
|
|||||||||||
|
Reclassification of net derivative (gains) losses included in net income
(3)
|
6
|
|
(2
|
)
|
4
|
|
|||||
|
Net unrealized derivatives gains (losses)
|
6
|
|
(2
|
)
|
4
|
|
|||||
|
Defined benefit plans:
|
|||||||||||
|
Net gain (loss) arising during the period
|
(45
|
)
|
11
|
|
(34
|
)
|
|||||
|
Defined benefit plans
|
(45
|
)
|
11
|
|
(34
|
)
|
|||||
|
Foreign currency translation
|
(117
|
)
|
41
|
|
(76
|
)
|
|||||
|
Total other comprehensive income (loss)
|
$
|
(81
|
)
|
$
|
22
|
|
$
|
(59
|
)
|
||
154
|
Year Ended December 31, 2015
|
|||||||||||
|
Pretax
|
Income Tax Benefit (Expense)
|
Net of Tax
|
|||||||||
|
(in millions)
|
|||||||||||
|
Net unrealized securities gains (losses):
|
|||||||||||
|
Net unrealized securities gains (losses) arising during the period
(1)
|
$
|
(1,027
|
)
|
$
|
359
|
|
$
|
(668
|
)
|
||
|
Reclassification of net securities (gains) losses included in net income
(2)
|
(6
|
)
|
2
|
|
(4
|
)
|
|||||
|
Impact of DAC, DSIC, unearned revenue, benefit reserves and reinsurance recoverables
|
480
|
|
(168
|
)
|
312
|
|
|||||
|
Net unrealized securities gains (losses)
|
(553
|
)
|
193
|
|
(360
|
)
|
|||||
|
Net unrealized derivatives gains (losses):
|
|||||||||||
|
Reclassification of net derivative (gains) losses included in net income
(3)
|
1
|
|
—
|
|
1
|
|
|||||
|
Net unrealized derivatives gains (losses)
|
1
|
|
—
|
|
1
|
|
|||||
|
Defined benefit plans:
|
|||||||||||
|
Prior service credit
|
(2
|
)
|
—
|
|
(2
|
)
|
|||||
|
Net gain (loss) arising during the period
|
(24
|
)
|
6
|
|
(18
|
)
|
|||||
|
Defined benefit plans
|
(26
|
)
|
6
|
|
(20
|
)
|
|||||
|
Foreign currency translation
|
(46
|
)
|
16
|
|
(30
|
)
|
|||||
|
Other comprehensive income (loss) attributable to Ameriprise Financial
|
(624
|
)
|
215
|
|
(409
|
)
|
|||||
|
Other comprehensive income (loss) attributable to noncontrolling interests
|
(60
|
)
|
—
|
|
(60
|
)
|
|||||
|
Total other comprehensive income (loss)
|
$
|
(684
|
)
|
$
|
215
|
|
$
|
(469
|
)
|
||
(1)
Includes other-than-temporary impairment losses on Available-for-Sale securities related to factors other than credit that were recognized in other comprehensive income (loss) during the period.
(2)
Reclassification amounts are recorded in net investment income.
(3)
Includes a
$2 million
,
$1 million
and
$4 million
pretax gain reclassified to interest and debt expenses and a
$5 million
,
$6 million
and
$5 million
pretax loss reclassified to net investment income for the years ended
December 31, 2017
,
2016
and
2015
, respectively.
(4)
Includes an
$87 million
decrease to OCI related to deferred taxes on currency translations adjustments.
Other comprehensive income (loss) related to net unrealized securities gains (losses) includes three components: (i) unrealized gains (losses) that arose from changes in the market value of securities that were held during the period; (ii) (gains) losses that were previously unrealized, but have been recognized in current period net income due to sales of Available-for-Sale securities and due to the reclassification of noncredit other-than-temporary impairment losses to credit losses; and (iii) other adjustments primarily consisting of changes in insurance and annuity asset and liability balances, such as DAC, DSIC, unearned revenue, benefit reserves and reinsurance recoverables, to reflect the expected impact on their carrying values had the unrealized gains (losses) been realized as of the respective balance sheet dates.
155
The following table presents the changes in the balances of each component of AOCI, net of tax:
|
Net Unrealized Securities Gains
|
Net Unrealized Derivatives Losses
|
Defined Benefit Plans
|
Foreign Currency Translation
|
Other
|
Total
|
||||||||||||||||||
|
(in millions)
|
|||||||||||||||||||||||
|
Balance, January 1, 2015
|
$
|
786
|
|
$
|
—
|
|
$
|
(71
|
)
|
$
|
(53
|
)
|
$
|
—
|
|
$
|
662
|
|
|||||
|
OCI before reclassifications
|
(356
|
)
|
—
|
|
(25
|
)
|
(30
|
)
|
—
|
|
(411
|
)
|
|||||||||||
|
Amounts reclassified from AOCI
|
(4
|
)
|
1
|
|
5
|
|
—
|
|
—
|
|
2
|
|
|||||||||||
|
OCI attributable to Ameriprise Financial
|
(360
|
)
|
1
|
|
(20
|
)
|
(30
|
)
|
—
|
|
(409
|
)
|
|||||||||||
|
Balance, December 31, 2015
|
426
|
|
(1)
|
1
|
|
(91
|
)
|
(83
|
)
|
—
|
|
253
|
|
||||||||||
|
Cumulative effect of change in accounting policies
|
6
|
|
—
|
|
—
|
|
—
|
|
—
|
|
6
|
|
|||||||||||
|
OCI before reclassifications
|
61
|
|
—
|
|
(39
|
)
|
(76
|
)
|
—
|
|
(54
|
)
|
|||||||||||
|
Amounts reclassified from AOCI
|
(14
|
)
|
4
|
|
5
|
|
—
|
|
—
|
|
(5
|
)
|
|||||||||||
|
OCI attributable to Ameriprise Financial
|
47
|
|
4
|
|
(34
|
)
|
(76
|
)
|
—
|
|
(59
|
)
|
|||||||||||
|
Balance, December 31, 2016
|
479
|
|
(1)
|
5
|
|
(125
|
)
|
(159
|
)
|
—
|
|
200
|
|
||||||||||
|
OCI before reclassifications
|
43
|
|
—
|
|
20
|
|
(8
|
)
|
(1
|
)
|
54
|
|
|||||||||||
|
Amounts reclassified from AOCI
|
(36
|
)
|
3
|
|
8
|
|
—
|
|
—
|
|
(25
|
)
|
|||||||||||
|
OCI attributable to Ameriprise Financial
|
7
|
|
3
|
|
28
|
|
(8
|
)
|
(1
|
)
|
29
|
|
|||||||||||
|
Balance, December 31, 2017
|
$
|
486
|
|
(1)
|
$
|
8
|
|
$
|
(97
|
)
|
$
|
(167
|
)
|
$
|
(1
|
)
|
$
|
229
|
|
||||
(1)
Includes
$1 million
,
$4 million
and
$4 million
of noncredit related impairments on securities and net unrealized securities gains (losses) on previously impaired securities at
December 31, 2017
,
2016
and
2015
, respectively.
For the years ended
December 31, 2017
,
2016
and
2015
, the Company repurchased a total of
9.9 million
shares,
17.6 million
shares and
13.9 million
shares, respectively, of its common stock for an aggregate cost of
$1.3 billion
,
$1.7 billion
and
$1.7 billion
, respectively. In December 2015, the Company’s Board of Directors authorized additional expenditures of up to
$2.5 billion
for the repurchase of shares of the Company’s common stock through December 31, 2017, which was exhausted in the third quarter of 2017. In April 2017, the Company's Board of Directors authorized an expenditure of up to
$2.5 billion
for the repurchase of shares of the Company’s common stock through June 30, 2019. As of
December 31, 2017
, the Company had
$2.1 billion
remaining under its share repurchase authorizations.
The Company may also reacquire shares of its common stock under its share-based compensation plans related to restricted stock awards and certain option exercises. The holders of restricted shares may elect to surrender a portion of their shares on the vesting date to cover their income tax obligation. These vested restricted shares are reacquired by the Company and the Company’s payment of the holders’ income tax obligations are recorded as a treasury share purchase.
For the years ended
December 31, 2017
,
2016
and
2015
, the Company reacquired
0.3 million
shares,
0.3 million
shares and
0.4 million
shares, respectively, of its common stock through the surrender of shares upon vesting and paid in the aggregate
$33 million
,
$29 million
and
$49 million
, respectively, related to the holders’ income tax obligations on the vesting date. Option holders may elect to net settle their vested awards resulting in the surrender of the number of shares required to cover the strike price and tax obligation of the options exercised. These shares are reacquired by the Company and recorded as treasury shares. For the years ended
December 31, 2017
,
2016
and
2015
, the Company reacquired
2.2 million
shares,
0.5 million
shares and
0.7 million
shares, respectively, of its common stock through the net settlement of options for an aggregate value of
$298 million
,
$48 million
and
$92 million
, respectively.
For the years ended
December 31, 2017
,
2016
and
2015
, respectively, the Company reissued
0.8 million
,
0.9 million
and
1.0 million
treasury shares, respectively, for restricted stock award grants, PSUs, and issuance of shares vested under advisor deferred compensation plans.
156
19.
Earnings per Share Attributable to Ameriprise Financial, Inc. Common Shareholders
The computations of basic
and
diluted earnings per share
attributable
to
Ameriprise
Financial,
Inc.
common
shareholders are
as
follows:
|
|
Years Ended December 31,
|
||||||||||
|
2017
|
2016
|
2015
|
|||||||||
|
(in millions, except per share amounts)
|
|||||||||||
|
Numerator:
|
|||||||||||
|
Net income
|
$
|
1,480
|
|
$
|
1,314
|
|
$
|
1,687
|
|
||
|
Less: Net income attributable to noncontrolling interests
|
—
|
|
—
|
|
125
|
|
|||||
|
Net income attributable to Ameriprise Financial
|
$
|
1,480
|
|
$
|
1,314
|
|
$
|
1,562
|
|
||
|
Denominator:
|
|||||||||||
|
Basic: Weighted-average common shares outstanding
|
154.1
|
|
166.3
|
|
181.7
|
|
|||||
|
Effect of potentially dilutive nonqualified stock options and other share-based awards
|
2.6
|
|
1.9
|
|
2.5
|
|
|||||
|
Diluted: Weighted-average common shares outstanding
|
156.7
|
|
168.2
|
|
184.2
|
|
|||||
|
Earnings per share attributable to Ameriprise Financial, Inc. common shareholders:
|
|||||||||||
|
Basic
|
$
|
9.60
|
|
$
|
7.90
|
|
$
|
8.60
|
|
||
|
Diluted
|
$
|
9.44
|
|
$
|
7.81
|
|
$
|
8.48
|
|
||
The calculation of diluted earnings per share excludes the incremental effect of
nil
,
1.5 million
and
1.7 million
options as of
December 31, 2017
,
2016
and
2015
, respectively, due to their anti-dilutive effect.
20.
Regulatory Requirements
Restrictions on the transfer of funds exist under regulatory requirements applicable to certain of the Company’s subsidiaries. As of
December 31, 2017
, the aggregate amount of unrestricted net assets was approximately
$904 million
.
The National Association of Insurance Commissioners (“NAIC”) defines Risk-Based Capital (“RBC”) requirements for insurance companies. The RBC requirements are used by the NAIC and state insurance regulators to identify companies that merit regulatory actions designed to protect policyholders. These requirements apply to both the Company’s life and property casualty insurance companies. In addition, IDS Property Casualty is subject to the statutory surplus requirements of the State of Wisconsin. The Company’s life and property casualty companies each met their respective minimum RBC requirements.
The Company’s life and property casualty insurance companies are required to prepare statutory financial statements in accordance with the accounting practices prescribed or permitted by the insurance departments of their respective states of domicile, which vary materially from GAAP. Prescribed statutory accounting practices include publications of the NAIC, as well as state laws, regulations and general administrative rules. The more significant differences from GAAP include charging policy acquisition costs to expense as incurred, establishing annuity and insurance reserves using different actuarial methods and assumptions, valuing investments on a different basis and excluding certain assets from the balance sheet by charging them directly to surplus, such as a portion of the net deferred income tax assets.
RiverSource Life received approval from the Minnesota Department of Commerce to apply a permitted statutory accounting practice, effective July 1, 2017 through June 30, 2018, for certain derivative instruments used to economically hedge the interest rate exposure of certain variable annuity products that do not qualify for statutory hedge accounting. The permitted practice is intended to mitigate the impact to statutory surplus from the misalignment between variable annuity statutory reserves, which are not carried at fair value, and the fair value of derivatives used to economically hedge the interest rate exposure of non-life contingent living benefit guarantees. The permitted practice allows RiverSource Life to defer a portion of the change in fair value, net investment income and realized gains or losses generated from designated derivatives to the extent the amounts do not offset the current period interest-rate related change in the variable annuity statutory reserve liability. The deferred amount is amortized over ten years using the straight-line method with the ability to accelerate amortization at management’s discretion. There was no immediate impact to statutory surplus at the effective date for the permitted statutory accounting practice. As of December 31, 2017, application of this permitted practice resulted in a decrease to RiverSource Life’s statutory surplus of approximately
$3 million
.
State insurance statutes contain limitations as to the amount of dividends that insurers may make without providing prior notification to state regulators. For RiverSource Life, dividends in excess of unassigned surplus, as determined in accordance with accounting practices prescribed by the State of Minnesota, require advance notice to the Minnesota Department of Commerce, RiverSource Life’s primary regulator, and are subject to potential disapproval. RiverSource Life’s statutory unassigned surplus (deficit) aggregated
$(306) million
and
$275 million
as of
December 31, 2017
and
2016
, respectively.
157
In addition, dividends whose fair market value, together with that of other dividends made within the preceding 12 months, exceeds the greater of the previous year’s statutory net gain from operations or
10%
of the previous year-end statutory capital and surplus are referred to as “extraordinary dividends.” Extraordinary dividends also require advance notice to the Minnesota Department of Commerce, and are subject to potential disapproval. Statutory capital and surplus for RiverSource Life was
$2.4 billion
and
$3.0 billion
as of
December 31, 2017
and
2016
, respectively. Statutory capital and surplus for IDS Property Casualty was
$781 million
and
$800 million
as of
December 31, 2017
and
2016
, respectively.
Statutory net gain from operations and net income (loss) are summarized as follows:
|
Years Ended December 31,
|
|||||||||||
|
2017
|
2016
|
2015
|
|||||||||
|
(in millions)
|
|||||||||||
|
RiverSource Life
|
|||||||||||
|
Statutory net gain from operations
|
$
|
958
|
|
$
|
834
|
|
$
|
1,033
|
|
||
|
Statutory net income (loss)
|
222
|
|
322
|
|
633
|
|
|||||
|
IDS Property Casualty
|
|||||||||||
|
Statutory net income (loss)
|
(10
|
)
|
(8
|
)
|
(44
|
)
|
|||||
Government debt securities of
$4 million
as of both
December 31, 2017
and
2016
held by the Company’s life insurance subsidiaries were on deposit with various states as required by law.
Ameriprise Certificate Company (“ACC”) is registered as an investment company under the Investment Company Act of 1940 (the “1940 Act”). ACC markets and sells investment certificates to clients. ACC is subject to various capital requirements under the 1940 Act, laws of the State of Minnesota and understandings with the Securities and Exchange Commission (“SEC”) and the Minnesota Department of Commerce. The terms of the investment certificates issued by ACC and the provisions of the 1940 Act also require the maintenance by ACC of qualified assets. Under the provisions of its certificates and the 1940 Act, ACC was required to have qualified assets (as that term is defined in Section 28(b) of the 1940 Act) in the amount of
$6.4 billion
and
$5.9 billion
as of
December 31, 2017
and
2016
, respectively. ACC had qualified assets of
$6.9 billion
and
$6.3 billion
as of
December 31, 2017
and
2016
, respectively.
Ameriprise Financial and ACC entered into a Capital Support Agreement on March 2, 2009, pursuant to which Ameriprise Financial agrees to commit such capital to ACC as is necessary to satisfy applicable minimum capital requirements. Effective April 30, 2014, this agreement was amended to revise the maximum commitment to
$50 million
. For the years ended
December 31, 2017
and
2016
, ACC did not draw upon the Capital Support Agreement and had met all applicable capital requirements.
Threadneedle’s required capital is predominantly based on the requirements specified by its regulator, the Financial Conduct Authority (“FCA”), under its Capital Adequacy Requirements for asset managers.
The Company has
five
broker-dealer subsidiaries, American Enterprise Investment Services Inc., Ameriprise Financial Services, Inc., RiverSource Distributors, Inc., Columbia Management Investment Distributors, Inc. and IPI. The broker-dealers are subject to the net capital requirements of the Financial Industry Regulatory Authority (“FINRA”) and the Uniform Net Capital requirements of the SEC under Rule 15c3-1 of the Securities Exchange Act of 1934.
Ameriprise Trust Company is subject to capital adequacy requirements under the laws of the State of Minnesota as enforced by the Minnesota Department of Commerce.
Ameriprise National Trust Bank is subject to regulation by the Comptroller of Currency (“OCC”) and, to a limited extent, by the Federal Deposit Insurance Corporation. As a limited powers national association, Ameriprise National Trust Bank is subject to supervision under various laws and regulations enforced by the OCC, including those related to capital adequacy, liquidity and conflicts of interest.
158
21.
Income Taxes
The components of income tax provision attributable to continuing operations were as follows:
|
Years Ended December 31,
|
|||||||||||
|
2017
|
2016
|
2015
|
|||||||||
|
(in millions)
|
|||||||||||
|
Current income tax
|
|||||||||||
|
Federal
|
$
|
468
|
|
$
|
245
|
|
$
|
509
|
|
||
|
State and local
|
58
|
|
44
|
|
36
|
|
|||||
|
Foreign
|
52
|
|
23
|
|
41
|
|
|||||
|
Total current income tax
|
578
|
|
312
|
|
586
|
|
|||||
|
Deferred income tax
|
|||||||||||
|
Federal
|
169
|
|
(36
|
)
|
(124
|
)
|
|||||
|
State and local
|
(5
|
)
|
3
|
|
(4
|
)
|
|||||
|
Foreign
|
(8
|
)
|
(1
|
)
|
(3
|
)
|
|||||
|
Total deferred income tax
|
156
|
|
(34
|
)
|
(131
|
)
|
|||||
|
Total income tax provision
|
$
|
734
|
|
$
|
278
|
|
$
|
455
|
|
||
On December 22, 2017, the Tax Act was signed into law. The provision for income taxes for the year ended December 31, 2017 includes an expense of
$286 million
due to the enactment of the Tax Act. The
$286 million
expense includes: 1) a
$221 million
expense for the remeasurement of deferred tax assets and liabilities to the Tax Act’s statutory rate of 21%; 2) a
$57 million
expense for the foreign provisions of the Tax Act, including a deemed repatriation tax of the Company’s total post-1986 earnings and profits (“E&P”); and 3) an
$8 million
expense for the remeasurement of tax contingencies, specifically state tax contingencies and interest accrued for tax contingencies.
The Company considers the expenses related to the remeasurement of deferred tax assets and liabilities and the foreign provisions of the Tax Act to be provisional amounts based on reasonable estimates as discussed below.
The geographic sources of pretax income from continuing operations were as follows:
|
Years Ended December 31,
|
|||||||||||
|
2017
|
2016
|
2015
|
|||||||||
|
(in millions)
|
|||||||||||
|
United States
|
$
|
1,988
|
|
$
|
1,412
|
|
$
|
1,710
|
|
||
|
Foreign
|
226
|
|
180
|
|
432
|
|
|||||
|
Total
|
$
|
2,214
|
|
$
|
1,592
|
|
$
|
2,142
|
|
||
159
The principal reasons that the aggregate income tax provision attributable to continuing operations is different from that computed by using the U.S. statutory rate of 35% were as follows:
|
Years Ended December 31,
|
||||||||
|
2017
|
2016
|
2015
|
||||||
|
Tax at U.S. statutory rate
|
35.0
|
%
|
35.0
|
%
|
35.0
|
%
|
||
|
Changes in taxes resulting from:
|
||||||||
|
Impact of the Tax Act
|
13.0
|
|
—
|
|
—
|
|
||
|
Dividends received deduction
|
(5.8
|
)
|
(7.6
|
)
|
(6.7
|
)
|
||
|
Low income housing tax credits
|
(3.4
|
)
|
(4.2
|
)
|
(3.0
|
)
|
||
|
Incentive compensation
|
(3.0
|
)
|
—
|
|
—
|
|
||
|
Foreign taxes
|
(2.0
|
)
|
(2.5
|
)
|
—
|
|
||
|
Foreign tax credits, net of addback
|
—
|
|
(1.6
|
)
|
(2.1
|
)
|
||
|
Taxes applicable to prior years
|
—
|
|
(3.1
|
)
|
—
|
|
||
|
State taxes, net of federal benefit
|
—
|
|
1.9
|
|
—
|
|
||
|
Net income attributable to noncontrolling interests
|
—
|
|
—
|
|
(2.0
|
)
|
||
|
Other, net
|
(0.7
|
)
|
(0.5
|
)
|
0.1
|
|
||
|
Income tax provision
|
33.1
|
%
|
17.4
|
%
|
21.3
|
%
|
||
The increase in the Company’s effective tax rate for the year ended
December 31, 2017
compared to
2016
was primarily due to a
$286 million
expense in
2017
due to provisions of the Tax Act, including remeasurement of net deferred tax assets, a deemed repatriation of E&P and remeasurement of tax contingencies, partially offset by a
$70 million
benefit for net excess tax benefits related to the adoption of a new accounting standard for employee share-based payments. The decrease in the Company’s effective tax rate in
2016
compared to
2015
is primarily the result of lower pretax income in relation to tax preferred items including the dividends received deduction, low income housing tax credits and a
$27 million
benefit related to final resolution on the 1997 through 2005 IRS audit.
As of December 31, 2017, the Company had not fully completed its accounting for the tax effects of the enactment of the Tax Act; however, the Company is able to provide reasonable estimates of the Tax Act’s impact. The Company’s provision for income taxes for the year ended December 31, 2017 is based in part on a reasonable estimate of the remeasurement of deferred tax assets and liabilities and the foreign provisions of the Tax Act. The Company recognized a provisional tax amount of
$278 million
, which is included as a component of provision for income taxes from continuing operations.
The Company considers the accounting for the Tax Act’s expense related to remeasurement of tax contingencies to be final and complete.
The components of the provisional tax amounts are as follows:
|
•
|
The Company recorded a provisional tax amount of
$221 million
to remeasure certain deferred tax assets and liabilities as a result of the enactment of the Tax Act. The Company is still analyzing certain aspects of the Tax Act and is refining the estimate of the expected reversal of its deferred tax balances. This can potentially affect the measurement of these balances or give rise to new deferred tax amounts. In addition, further guidance from federal and state taxing authorities may change the provisional tax liability or the accounting treatment of the provisional tax liability.
|
|
•
|
The Company recorded a provisional tax amount of
$57 million
related to the foreign provisions of the Tax Act. This expense is primarily related to a deemed repatriation of the Company’s post-1986 E&P, including the state taxation of the deemed repatriation. The Company has calculated this amount based on reliable estimates but has not yet finalized the calculation of the total post-1986 foreign E&P and the income tax pools for all foreign subsidiaries. In addition, the deemed repatriation tax is calculated, in part, on the amount of E&P held in cash and other specified assets. This amount may change when the Company finalizes the calculation of post-1986 foreign E&P previously deferred from U.S. federal taxation and finalizes the amounts held in cash or other specified assets. In addition, further guidance from federal and state taxing authorities may change the provisional tax liability or the accounting treatment of the provisional tax liability. The U.S. federal component of the deemed repatriation tax is payable over an eight-year period.
|
Accumulated earnings of certain foreign subsidiaries, which totaled
$429 million
at
December 31, 2017
, are intended to be permanently reinvested outside the United States. Total foreign accumulated earnings and profits have been subjected to U.S. income tax as a part of the Tax Act. No additional tax expense is expected on the accumulated earnings that are permanently reinvested.
160
Deferred income tax assets and liabilities result from temporary differences between the assets and liabilities measured for GAAP reporting versus income tax return purposes.
Deferred income tax assets and liabilities are measured at the statutory rate of 21% as of December 31, 2017 and 35% as of December 31, 2016.
The significant components of the Company’s deferred income tax assets and liabilities, which are included net within other assets or other liabilities on the Consolidated Balance Sheets, were as follows:
|
December 31,
|
|||||||
|
2017
|
2016
|
||||||
|
(in millions)
|
|||||||
|
Deferred income tax assets
|
|||||||
|
Liabilities for policyholder account balances, future policy benefits and claims
|
$
|
620
|
|
$
|
1,177
|
|
|
|
Deferred compensation
|
345
|
|
439
|
|
|||
|
Investment related
|
245
|
|
253
|
|
|||
|
Postretirement benefits
|
34
|
|
62
|
|
|||
|
Currency translation adjustments
|
—
|
|
73
|
|
|||
|
Other
|
66
|
|
68
|
|
|||
|
Gross deferred income tax assets
|
1,310
|
|
2,072
|
|
|||
|
Less: valuation allowance
|
17
|
|
11
|
|
|||
|
Total deferred income tax assets
|
1,293
|
|
2,061
|
|
|||
|
Deferred income tax liabilities
|
|||||||
|
Deferred acquisition costs
|
446
|
|
717
|
|
|||
|
Net unrealized gains on Available-for-Sale securities
|
162
|
|
264
|
|
|||
|
Depreciation expense
|
93
|
|
146
|
|
|||
|
Intangible assets
|
93
|
|
126
|
|
|||
|
Deferred sales inducement costs
|
62
|
|
113
|
|
|||
|
Goodwill
|
52
|
|
74
|
|
|||
|
Other
|
7
|
|
2
|
|
|||
|
Gross deferred income tax liabilities
|
915
|
|
1,442
|
|
|||
|
Net deferred income tax assets
|
$
|
378
|
|
$
|
619
|
|
|
Included
in the Company’s deferred income tax assets are tax benefits primarily related to state net operating losses of
$17 million
, net of federal benefit, which will expire beginning December 31,
2018
. Based on analysis of the Company’s tax position, management believes it is more likely than not that the Company will not realize certain state net operating losses and state deferred tax assets; therefore, a valuation allowance of
$17 million
has been established.
A reconciliation of the beginning and ending amount of gross unrecognized tax benefits was as follows:
|
2017
|
2016
|
2015
|
|||||||||
|
(in millions)
|
|||||||||||
|
Balance at January 1
|
$
|
115
|
|
$
|
161
|
|
$
|
242
|
|
||
|
Additions based on tax positions related to the current year
|
16
|
|
15
|
|
18
|
|
|||||
|
Additions for tax positions of prior years
|
3
|
|
33
|
|
48
|
|
|||||
|
Reductions for tax positions of prior years
|
(57
|
)
|
(87
|
)
|
(147
|
)
|
|||||
|
Audit settlements
|
(1
|
)
|
(7
|
)
|
—
|
|
|||||
|
Balance at December 31
|
$
|
76
|
|
$
|
115
|
|
$
|
161
|
|
||
If
recognized, approximately
$58 million
,
$46 million
and
$57 million
, net of federal tax benefits, of unrecognized tax benefits as of
December 31, 2017
,
2016
, and
2015
, respectively, would affect the effective tax rate.
It is reasonably possible that the total amounts of unrecognized tax benefits will change in the next 12 months. The Company estimates that the total amount of gross unrecognized tax benefits may decrease by
$20 million
to
$30 million
in the next 12 months primarily due to IRS settlements and state exams.
The
Company recognizes interest and penalties related to unrecognized tax benefits as a component of the income tax provision. The Company recognized
nil
, a net decrease of
$43 million
, and a net increase of
$3 million
in interest and penalties for the years ended
December 31, 2017
,
2016
, and
2015
, respectively. At both
December 31, 2017
and
2016
, the Company had a payable of
$8 million
related to accrued interest and penalties.
161
The Company or one or more of its subsidiaries files income tax returns in the U.S. federal jurisdiction, and various state and foreign jurisdictions. In the third quarter of 2017, the Company received final cash settlements for resolution of the 2006 through 2011 IRS audits. The IRS has completed its examination of the 2008 through 2010 tax returns and these years are effectively settled; however, the statutes of limitation, remain open for certain carryover adjustments. The IRS is currently auditing the Company’s U.S. income tax returns for 2012 through 2015. The Company’s state income tax returns are currently under examination by various jurisdictions for years ranging from 2005 through 2015.
22.
Retirement Plans and Profit Sharing Arrangements
Defined Benefit Plans
Pension Plans and Other Postretirement Benefits
The Company’s U.S. non-advisor employees are generally eligible for the Ameriprise Financial Retirement Plan (the “Retirement Plan”), a noncontributory defined benefit plan which is a qualified plan under the Employee Retirement Income Security Act of 1974, as amended (“ERISA”). Funding of costs for the Retirement Plan complies with the applicable minimum funding requirements specified by ERISA and is held in a trust. The Retirement Plan is a cash balance plan by which the employees’ accrued benefits are based on notional account balances, which are maintained for each individual. Each pay period these balances are credited with an amount equal to a percentage of eligible compensation as defined by the Retirement Plan (which includes, but is not limited to, base pay, performance based incentive pay, commissions, shift differential and overtime). Prior to March 1, 2010, the percentage ranged from
2.5%
to
10%
based on employees’ age plus years of service. Effective March 1, 2010, the percentage ranges from
2.5%
to
5%
based on employees’ years of service. Employees eligible for the plan at the time of the change will continue to receive the same percentage they were receiving until the new schedule becomes more favorable. Employees’ balances are also credited with a fixed rate of interest that is updated each January 1 and is based on the average of the daily
five
-year U.S. Treasury Note yields for the previous October 1 through November 30, with a minimum crediting rate of
5%
. Employees are fully vested after
three
years of service or upon retirement at or after age 65, disability or death while employed. Employees have the option to receive annuity payments or a lump sum payout of vested balance at termination or retirement. The Retirement Plan’s year-end is September 30.
In addition, the Company sponsors the Ameriprise Financial Supplemental Retirement Plan (the “SRP”), an unfunded non-qualified deferred compensation plan subject to Section 409A of the Internal Revenue Code. This plan is for certain highly compensated employees to replace the benefit that cannot be provided by the Retirement Plan due to IRS limits. The SRP generally parallels the Retirement Plan but offers different payment options.
The Company also sponsors unfunded defined benefit postretirement plans that provide health care and life insurance to retired U.S. employees. On December 31, 2016, the access to retiree health care coverage was closed to all active employees who had previously met the qualification requirements. Instead, only existing retirees, as of January 1, 2017, qualifying for the plan and electing coverage will be provided a fixed amount to subsidize health care insurance purchased through other providers. Net periodic postretirement benefit costs were not material for the years ended
December 31, 2017
,
2016
and
2015
.
Most employees outside the U.S. are covered by local retirement plans, some of which are funded, while other employees receive payments at the time of retirement or termination under applicable labor laws or agreements.
All components of the net periodic benefit cost are recorded in general and administrative expense and were as follows:
|
Years Ended December 31,
|
|||||||||||
|
2017
|
2016
|
2015
|
|||||||||
|
(in millions)
|
|||||||||||
|
Service cost
|
$
|
47
|
|
$
|
44
|
|
$
|
46
|
|
||
|
Interest cost
|
28
|
|
29
|
|
27
|
|
|||||
|
Expected return on plan assets
|
(45
|
)
|
(41
|
)
|
(40
|
)
|
|||||
|
Amortization of prior service costs
|
(1
|
)
|
(1
|
)
|
(1
|
)
|
|||||
|
Amortization of net loss
|
10
|
|
6
|
|
9
|
|
|||||
|
Other
|
3
|
|
4
|
|
4
|
|
|||||
|
Net periodic benefit cost
|
$
|
42
|
|
$
|
41
|
|
$
|
45
|
|
||
The prior service costs are amortized on a straight-line basis over the average remaining service period of active participants. Actuarial gains and losses in excess of
10%
of the greater of the projected benefit obligation or the market-related value of assets are amortized on a straight-line basis over the expected average remaining service period of active participants.
162
The following table provides a reconciliation of changes in the benefit obligation:
|
Pension Plans
|
Other Postretirement Plans
|
||||||||||||||
|
2017
|
2016
|
2017
|
2016
|
||||||||||||
|
(in millions)
|
|||||||||||||||
|
Benefit obligation, January 1
|
$
|
899
|
|
$
|
812
|
|
$
|
15
|
|
$
|
18
|
|
|||
|
Service cost
|
47
|
|
44
|
|
—
|
|
—
|
|
|||||||
|
Interest cost
|
28
|
|
29
|
|
—
|
|
1
|
|
|||||||
|
Benefits paid
|
(12
|
)
|
(8
|
)
|
(1
|
)
|
(4
|
)
|
|||||||
|
Actuarial (gain) loss
|
39
|
|
65
|
|
1
|
|
—
|
|
|||||||
|
Plan change
|
—
|
|
—
|
|
—
|
|
(2
|
)
|
|||||||
|
Participant contributions
|
—
|
|
—
|
|
—
|
|
2
|
|
|||||||
|
Settlements
|
(21
|
)
|
(18
|
)
|
—
|
|
—
|
|
|||||||
|
Foreign currency rate changes
|
15
|
|
(25
|
)
|
—
|
|
—
|
|
|||||||
|
Benefit obligation, December 31
|
$
|
995
|
|
$
|
899
|
|
$
|
15
|
|
$
|
15
|
|
|||
The following table provides a reconciliation of changes in the fair value of assets:
|
Pension Plans
|
|||||||
|
2017
|
2016
|
||||||
|
(in millions)
|
|||||||
|
Fair value of plan assets, January 1
|
$
|
628
|
|
$
|
608
|
|
|
|
Actual return on plan assets
|
107
|
|
62
|
|
|||
|
Employer contributions
|
32
|
|
13
|
|
|||
|
Benefits paid
|
(12
|
)
|
(8
|
)
|
|||
|
Settlements
|
(21
|
)
|
(18
|
)
|
|||
|
Foreign currency rate changes
|
14
|
|
(29
|
)
|
|||
|
Fair value of plan assets, December 31
|
$
|
748
|
|
$
|
628
|
|
|
The Company complies with the minimum funding requirements in all countries. The following table provides the amounts recognized in the Consolidated Balance Sheets at December 31, which equal the funded status of the plans:
|
Pension Plans
|
Other Postretirement Plans
|
||||||||||||||
|
2017
|
2016
|
2017
|
2016
|
||||||||||||
|
(in millions)
|
|||||||||||||||
|
Benefit liability
|
$
|
(253
|
)
|
$
|
(271
|
)
|
$
|
(15
|
)
|
$
|
(15
|
)
|
|||
|
Benefit asset
|
6
|
|
—
|
|
—
|
|
—
|
|
|||||||
|
Net amount recognized
|
$
|
(247
|
)
|
$
|
(271
|
)
|
$
|
(15
|
)
|
$
|
(15
|
)
|
|||
The accumulated benefit obligation for all pension plans as of
December 31, 2017
and
2016
was
$916 million
and
$822 million
, respectively. The following table provides information for pension plans with benefit obligations in excess of plan assets:
|
December 31,
|
|||||||
|
2017
|
2016
|
||||||
|
(in millions)
|
|||||||
|
Pension plans with accumulated benefit obligations in excess of plan assets
|
|||||||
|
Accumulated benefit obligation
|
$
|
759
|
|
$
|
684
|
|
|
|
Fair value of plan assets
|
562
|
|
469
|
|
|||
|
Pension plans with projected benefit obligations in excess of plan assets
|
|||||||
|
Projected benefit obligation
|
$
|
816
|
|
$
|
899
|
|
|
|
Fair value of plan assets
|
562
|
|
628
|
|
|||
163
The weighted average assumptions used to determine benefit obligations were as follows:
|
Pension Plans
|
Other Postretirement Plans
|
||||||||||
|
2017
|
2016
|
2017
|
2016
|
||||||||
|
Discount rates
|
3.32
|
%
|
3.66
|
%
|
3.41
|
%
|
3.77
|
%
|
|||
|
Rates of increase in compensation levels
|
4.29
|
|
4.39
|
|
N/A
|
|
N/A
|
|
|||
The weighted average assumptions used to determine net periodic benefit cost of pension plans were as follows:
|
2017
|
2016
|
2015
|
||||||
|
Discount rates
|
3.64
|
%
|
3.67
|
%
|
3.43
|
%
|
||
|
Rates of increase in compensation levels
|
4.39
|
|
4.43
|
|
4.41
|
|
||
|
Expected long-term rates of return on assets
|
7.13
|
|
6.98
|
|
7.10
|
|
||
In developing the expected long-term rate of return on assets, management evaluated input from an external consulting firm, including their projection of asset class return expectations and long-term inflation assumptions. The Company also considered historical returns on the plans’ assets. Discount rates are based on yields available on high-quality corporate bonds that would generate cash flows necessary to pay the benefits when due.
The Company’s pension plans’ assets are invested in an aggregate diversified portfolio to minimize the impact of any adverse or unexpected results from a security class on the entire portfolio. Diversification is interpreted to include diversification by asset type, performance and risk characteristics and number of investments. When appropriate and consistent with the objectives of the plans, derivative instruments may be used to mitigate risk or provide further diversification, subject to the investment policies of the plans. Asset classes and ranges considered appropriate for investment of the plans’ assets are determined by each plan’s investment committee. The target allocations are
70%
equity securities,
20%
debt securities and
10%
all other types of investments, except for the assets in pooled pension funds which are
83%
equity securities and
17%
debt securities and additional voluntary contribution (“AVC”) assets outside the U.S. which are allocated at the discretion of the individual and will be converted at retirement into the defined benefit pension plan. Actual allocations will generally be within
5%
of these targets. At
December 31, 2017
, there were no significant holdings of any single issuer and the exposure to derivative instruments was not significant.
The following tables present the Company’s pension plan assets measured at fair value on a recurring basis:
|
Asset Category
|
December 31, 2017
|
||||||||||||||||
|
Level 1
|
Level 2
|
Level 3
|
Total
|
||||||||||||||
|
(in millions)
|
|||||||||||||||||
|
Equity securities:
|
|||||||||||||||||
|
U.S. large cap stocks
|
$
|
95
|
|
$
|
94
|
|
$
|
—
|
|
$
|
189
|
|
|||||
|
U.S. small cap stocks
|
76
|
|
4
|
|
—
|
|
80
|
|
|||||||||
|
Non-U.S. large cap stocks
|
28
|
|
43
|
|
—
|
|
71
|
|
|||||||||
|
Non-U.S. small cap stocks
|
28
|
|
—
|
|
—
|
|
28
|
|
|||||||||
|
Emerging markets
|
19
|
|
32
|
|
—
|
|
51
|
|
|||||||||
|
Debt securities:
|
|||||||||||||||||
|
U.S. investment grade bonds
|
27
|
|
11
|
|
—
|
|
38
|
|
|||||||||
|
U.S. high yield bonds
|
—
|
|
26
|
|
—
|
|
26
|
|
|||||||||
|
Non-U.S. investment grade bonds
|
—
|
|
16
|
|
—
|
|
16
|
|
|||||||||
|
Real estate investment trusts at NAV
|
—
|
|
—
|
|
—
|
|
18
|
|
(1)
|
||||||||
|
Hedge funds at NAV
|
—
|
|
—
|
|
—
|
|
27
|
|
(1)
|
||||||||
|
Pooled pension funds
|
—
|
|
166
|
|
—
|
|
166
|
|
|||||||||
|
AVC assets (pooled pension funds)
|
—
|
|
20
|
|
—
|
|
20
|
|
|||||||||
|
Cash equivalents
|
18
|
|
—
|
|
—
|
|
18
|
|
|||||||||
|
Total
|
$
|
291
|
|
$
|
412
|
|
$
|
—
|
|
$
|
748
|
|
|||||
164
|
Asset Category
|
December 31, 2016
|
||||||||||||||||
|
Level 1
|
Level 2
|
Level 3
|
Total
|
||||||||||||||
|
(in millions)
|
|||||||||||||||||
|
Equity securities:
|
|||||||||||||||||
|
U.S. large cap stocks
|
$
|
73
|
|
$
|
76
|
|
$
|
—
|
|
$
|
149
|
|
|||||
|
U.S. small cap stocks
|
69
|
|
4
|
|
—
|
|
73
|
|
|||||||||
|
Non-U.S. large cap stocks
|
22
|
|
34
|
|
—
|
|
56
|
|
|||||||||
|
Non-U.S. small cap stocks
|
21
|
|
—
|
|
—
|
|
21
|
|
|||||||||
|
Emerging markets
|
14
|
|
23
|
|
—
|
|
37
|
|
|||||||||
|
Debt securities:
|
|||||||||||||||||
|
U.S. investment grade bonds
|
26
|
|
10
|
|
—
|
|
36
|
|
|||||||||
|
U.S. high yield bonds
|
—
|
|
24
|
|
—
|
|
24
|
|
|||||||||
|
Non-U.S. investment grade bonds
|
—
|
|
14
|
|
—
|
|
14
|
|
|||||||||
|
Real estate investment trusts at NAV
|
—
|
|
—
|
|
—
|
|
17
|
|
(1)
|
||||||||
|
Hedge funds at NAV
|
—
|
|
—
|
|
—
|
|
26
|
|
(1)
|
||||||||
|
Pooled pension funds
|
—
|
|
142
|
|
—
|
|
142
|
|
|||||||||
|
AVC assets (pooled pension funds)
|
—
|
|
17
|
|
—
|
|
17
|
|
|||||||||
|
Cash equivalents
|
16
|
|
—
|
|
—
|
|
16
|
|
|||||||||
|
Total
|
$
|
241
|
|
$
|
344
|
|
$
|
—
|
|
$
|
628
|
|
|||||
(1)
Amounts are comprised of certain investments that are measured at fair value using the NAV per share (or its equivalent) as a practical expedient and have not been classified in the fair value hierarchy. See Note 2 for further information.
Equity securities are managed to track the performance of common market indices for both U.S. and non-U.S. securities, primarily across large cap, small cap and emerging market asset classes. Debt securities are managed to track the performance of common market indices for both U.S. and non-U.S. investment grade bonds as well as a pool of U.S. high yield bonds. Real estate funds are managed to track the performance of a broad population of investment grade non-agricultural income producing properties. The Company’s investments in hedge funds include investments in a multi-strategy fund and an off-shore fund managed to track the performance of broad fund of fund indices. Pooled pension funds are managed to track a specific benchmark based on the investment objectives of the fund. Cash equivalents consist of holdings in a money market fund that seeks to equal the return of the three month U.S. Treasury bill.
The
fair value of real estate funds and hedge funds is measured at NAV as a practical expedient and is based upon the total net assets held by the respective fund. These funds have not been classified within the fair value hierarchy. The fair value of pooled pension funds and equity securities held in collective trust funds is based on the fund’s NAV and classified as Level 2 as they trade in principal-to-principal markets. Equity securities and mutual funds traded in active markets are classified as Level 1. For debt securities and cash equivalents, the valuation techniques and classifications are consistent with those used for the Company’s own investments as described in Note 14.
The
amounts recognized in AOCI, net of tax, as of
December 31, 2017
but not recognized as components of net periodic benefit cost included an unrecognized actuarial loss of
$99 million
, an unrecognized prior service credit of
nil
, and a currency exchange rate adjustment loss of
$2 million
related to the Company’s pension plans. The Company’s other postretirement plans included an unrecognized actuarial gain of
$3 million
and an unrecognized prior service credit of
$1 million
. The estimated amounts that will be amortized from AOCI, net of tax, into net periodic benefit cost in
2018
include a prior service credit of
nil
and an actuarial loss of
$7 million
related to Company’s pension plans and an actuarial gain of
nil
related to Company’s other postretirement plans. See Note 18 for a rollforward of AOCI related to the Company’s defined benefit plans.
The Company’s pension plans expect to make benefit payments to retirees as follows:
|
Pension Plans
|
Other
Postretirement Plans
|
||||||
|
2018
|
$
|
83
|
|
$
|
1
|
|
|
|
2019
|
62
|
|
1
|
|
|||
|
2020
|
61
|
|
1
|
|
|||
|
2021
|
74
|
|
1
|
|
|||
|
2022
|
70
|
|
1
|
|
|||
|
2023-2027
|
390
|
|
5
|
|
|||
165
The Company expects to contribute
$26 million
and
$1 million
to its pension plans and other postretirement plans, respectively, in
2018
.
Defined Contribution Plans
The Company’s employees are generally eligible to participate in the Ameriprise Financial 401(k) Plan (the “401(k) Plan”). The 401(k) Plan allows eligible employees to make contributions through payroll deductions up to IRS limits and invest their contributions in one or more of the 401(k) Plan investment options, which include the Ameriprise Financial Stock Fund. The Company provides a dollar for dollar match up to the first
5%
of eligible compensation an employee contributes on a pretax and/or Roth 401(k) basis for each annual period.
Under the 401(k) Plan, employees become eligible for contributions under the plan during the pay period they reach
60
days of service. Match contributions are fully vested after
five
years of service, vesting ratably over the first
five
years of service, or upon retirement at or after age 65, disability or death while employed. The Company’s defined contribution plan expense was
$49 million
,
$48 million
and
$47 million
in
2017
,
2016
and
2015
, respectively.
Employees outside the U.S. who are not covered by the 401(k) may be covered by local defined contribution plans which are subject to applicable laws and rules of the country where the plan is administered. The Company’s expense related to defined contribution plans outside the U.S. was
$5 million
,
$6 million
and
$6 million
in
2017
,
2016
and
2015
, respectively.
23.
Commitments, Guarantees and Contingencies
Commitments
The Company is committed to pay aggregate minimum rentals under noncancelable operating leases for office facilities in future years as of
December 31, 2017
as follows:
|
(in millions)
|
|||
|
2018
|
$
|
69
|
|
|
2019
|
58
|
|
|
|
2020
|
48
|
|
|
|
2021
|
35
|
|
|
|
2022
|
27
|
|
|
|
Thereafter
|
78
|
|
|
|
Total
(1)
|
$
|
315
|
|
(1)
Minimum payments have not been reduced by minimum sublease rentals due in the future under noncancelable subleases.
For
the years ended
December 31, 2017
,
2016
and
2015
, operating lease expense was
$84 million
,
$59 million
and
$67 million
, respectively.
The following table presents the Company’s funding commitments as of December 31:
|
2017
|
2016
|
||||||
|
(in millions)
|
|||||||
|
Commercial mortgage loans
|
$
|
31
|
|
$
|
78
|
|
|
|
Consumer mortgage loans
|
—
|
|
185
|
|
|||
|
Consumer lines of credit
|
2
|
|
2
|
|
|||
|
Affordable housing and other real estate partnerships
|
123
|
|
177
|
|
|||
|
Total funding commitments
|
$
|
156
|
|
$
|
442
|
|
|
The
decrease in consumer mortgage loan funding commitments at
December 31, 2017
compared to the prior year is due to the sale of loans. See Note 6 for additional information.
Guarantees
The Company’s life and annuity products all have minimum interest rate guarantees in their fixed accounts. As of
December 31, 2017
, t
hese guarantees range from
1%
to
5%
.
Contingencies
RiverSource Life and RiverSource Life of NY are required by law to be a member of the guaranty fund association in every state where they are licensed to do business. In the event of insolvency of one or more unaffiliated insurance companies, the Company could be adversely affected by the requirement to pay assessments to the guaranty fund associations.
The
Company projects its cost of future guaranty fund assessments based on estimates of insurance company insolvencies provided by the National Organization of Life and Health Insurance Guaranty Associations (“NOLHGA”) and the amount of its premiums written
166
relative to the industry-wide premium in each state. The Company accrues the estimated cost of future guaranty fund assessments when it is considered probable that an assessment will be imposed, the event obligating the Company to pay the assessment has occurred and the amount of the assessment can be reasonably estimated.
The
Company has a liability for estimated guaranty fund assessments and a related premium tax asset. At
December 31, 2017
and
2016
, the estimated liability was
$14 million
and
$16 million
, respectively, and the related premium tax asset was
$12 million
and
$14 million
, respectively. The expected period over which guaranty fund assessments will be made and the related tax credits recovered is not known.
The
Company and its subsidiaries are involved in the normal course of business in legal, regulatory and arbitration proceedings, including class actions, concerning matters arising in connection with the conduct of its activities as a diversified financial services firm. These include proceedings specific to the Company as well as proceedings generally applicable to business practices in the industries in which it operates. The Company can also be subject to litigation arising out of its general business activities, such as its investments, contracts, leases and employment relationships. Uncertain economic conditions, heightened and sustained volatility in the financial markets and significant financial reform legislation may increase the likelihood that clients and other persons or regulators may present or threaten legal claims or that regulators increase the scope or frequency of examinations of the Company or the financial services industry generally.
As
with other financial services firms, the level of regulatory activity and inquiry concerning the Company’s businesses remains elevated. From time to time, the Company receives requests for information from, and/or has been subject to examination or claims by, the SEC, FINRA, the OCC, the UK Financial Conduct Authority, state insurance and securities regulators, state attorneys general and various other domestic or foreign governmental and quasi-governmental authorities on behalf of themselves or clients concerning the Company’s business activities and practices, and the practices of the Company’s financial advisors. The Company has numerous pending matters which include information requests, exams or inquiries that the Company has received during recent periods regarding certain matters, including: sales and distribution of mutual funds, exchange traded funds, annuities, equity and fixed income securities, real estate investment trusts, insurance products, and financial advice offerings, including managed accounts; supervision of the Company’s financial advisors; administration of insurance and annuity claims; security of client information; trading activity and the Company’s monitoring and supervision of such activity; performance advertising and product disclosures, including third party performance claims; and transaction monitoring systems and controls. The Company is also participating in regulatory audits, market conduct examinations and other state inquiries relating to an industry-wide investigation of unclaimed property and escheatment practices and procedures. The Company has cooperated and will continue to cooperate with the applicable regulators.
These
legal and regulatory proceedings and disputes are subject to uncertainties and, as such, it is inherently difficult to determine whether any loss is probable or even reasonably possible, or to reasonably estimate the amount of any loss. The Company cannot predict with certainty if, how or when any such proceedings will be initiated or resolved or what the eventual settlement, fine, penalty or other relief, if any, may be, particularly for proceedings that are in their early stages of development or where plaintiffs seek indeterminate damages. Numerous issues may need to be resolved, including through potentially lengthy discovery and determination of important factual matters, and by addressing unsettled legal questions relevant to the proceedings in question, before a loss or range of loss can be reasonably estimated for any proceeding. An adverse outcome in one or more proceeding could eventually result in adverse judgments, settlements, fines, penalties or other sanctions, in addition to further claims, examinations or adverse publicity that could have a material adverse effect on the Company’s consolidated financial condition, results of operations or liquidity.
In
accordance with applicable accounting standards, the Company establishes an accrued liability for contingent litigation and regulatory matters when those matters present loss contingencies that are both probable and can be reasonably estimated. In such cases, there still may be an exposure to loss in excess of any amounts reasonably estimated and accrued. When a loss contingency is not both probable and estimable, the Company does not establish an accrued liability, but continues to monitor, in conjunction with any outside counsel handling a matter, further developments that would make such loss contingency both probable and reasonably estimable. Once the Company establishes an accrued liability with respect to a loss contingency, the Company continues to monitor the matter for further developments that could affect the amount of the accrued liability that has been previously established, and any appropriate adjustments are made each quarter.
Certain
legal and regulatory proceedings are described below.
In
November 2014, a lawsuit was filed against the Company’s London-based asset management affiliate in England’s High Court of Justice Commercial Court, entitled Otkritie Capital International Ltd and JSC Otkritie Holding v. Threadneedle Asset Management Ltd. and Threadneedle Management Services Ltd. (“Threadneedle Defendants”). Claimants allege that the Threadneedle Defendants should be held liable for the wrongful acts of one of its former employees, who in February 2014 was held jointly and severally liable with several other parties for conspiracy and dishonest assistance in connection with a fraud perpetrated against Claimants in 2011. Claimants allege they were harmed by that fraud in the amount of
$106 million
. The Threadneedle Defendants applied to the Court for an Order dismissing the proceedings as an abuse of process of the Court. This application was declined in August 2015. The Threadneedle Defendants applied to the Court of Appeal for leave to appeal, which application was granted in November 2015. In April 2017, the Court of Appeal denied the Threadneedle Defendants’ appeal. As a result, the case will proceed in England’s High Court of Justice, Commercial Court. A Case Management Conference was held October 6, 2017, and it was directed that trial of the matter shall not be set before May 1, 2019. The Company’s reasonable estimate of the range of loss, if any, that may result from this matter is not expected to have a material effect on its consolidated results of operations or financial condition.
167
24.
Related Party Transactions
The Company may engage in transactions in the ordinary course of business with significant shareholders or their subsidiaries, between the Company and its directors and officers or with other companies whose directors or officers may also serve as directors or officers for the Company or its subsidiaries. The Company carries out these transactions on customary terms. The transactions have not had a material impact on the Company’s consolidated results of operations or financial condition.
The Company’s executive officers and directors may have transactions with the Company or its subsidiaries involving financial products and insurance services. All obligations arising from these transactions are in the ordinary course of the Company’s business and are on the same terms in effect for comparable transactions with the general public. Such obligations involve normal risks of collection and do not have features or terms that are unfavorable to the Company or its subsidiaries.
25.
Segment Information
The Company’s reporting segments are Advice & Wealth Management, Asset Management, Annuities, Protection and Corporate & Other.
Beginning in the first quarter of 2017, the long term care business, which had been reported as part of the Protection segment, is reflected in the Corporate & Other segment. The Company discontinued underwriting long term care insurance in 2002 and the transfer of this closed block to the Corporate & Other segment allows investors to better understand the performance of the Company’s on-going Protection businesses. Prior periods presented have been restated to reflect the change.
The accounting policies of the segments are the same as those of the Company, except for operating adjustments defined below, the method of capital allocation, the accounting for gains (losses) from intercompany revenues and expenses and not providing for income taxes on a segment basis.
The largest source of intersegment revenues and expenses is retail distribution services, where segments are charged transfer pricing rates that approximate arm’s length market prices for distribution through the Advice & Wealth Management segment. The Advice & Wealth Management segment provides distribution services for affiliated and non-affiliated products and services. The Asset Management segment provides investment management services for the Company’s owned assets and client assets, and accordingly charges investment and advisory management fees to the other segments.
All costs related to shared services are allocated to the segments based on a rate times volume or fixed basis.
The Advice & Wealth Management segment provides financial planning and advice, as well as full-service brokerage services, primarily to retail clients through the Company’s advisors. These services are centered on long-term, personal relationships between the Company’s advisors and its clients and focus on helping clients confidently achieve their financial goals. The Company’s advisors provide a distinctive approach to financial planning and have access to a broad selection of both affiliated and non-affiliated products to help clients meet their financial needs. A significant portion of revenues in this segment is fee-based, driven by the level of client assets, which is impacted by both market movements and net asset flows. The Company also earns net investment income on invested assets primarily from certificate products. This segment earns revenues (distribution fees) for distributing non-affiliated products and intersegment revenues (distribution fees) for distributing the Company’s affiliated products and services provided to its retail clients. Intersegment expenses for this segment include expenses for investment management services provided by the Asset Management segment.
The Asset Management segment provides investment management and advice and investment products to retail, high net worth and institutional clients on a global scale through the
Columbia Threadneedle Investments
brand, which represents the combined capabilities, resources and reach of Columbia Management Investment Advisers, LLC (“Columbia Management”) and Threadneedle. Columbia Management primarily provides products and services in the U.S. and Threadneedle primarily provides products and services internationally. The Company provides U.S. retail clients with products through unaffiliated third party financial institutions and through the Advice & Wealth Management segment, and provides institutional products and services through its institutional sales force. Retail products for non-U.S. investors are primarily distributed through third-party financial institutions and unaffiliated financial advisors. Retail products include U.S. mutual funds and their non-U.S. equivalents, exchange-traded funds and variable product funds underlying insurance and annuity separate accounts. Institutional asset management services are designed to meet specific client objectives and may involve a range of products, including those that focus on traditional asset classes, separately managed accounts, individually managed accounts, CLOs, hedge fund or alternative strategies, collective funds and property funds. CLOs, hedge fund or alternative strategies and certain private funds are often classified as alternative assets. Revenues in this segment are primarily earned as fees based on managed asset balances, which are impacted by market movements, net asset flows, asset allocation and product mix. The Company may also earn performance fees from certain accounts where investment performance meets or exceeds certain pre-identified targets. The Asset Management segment also provides intercompany asset management services for Ameriprise Financial subsidiaries. The fees for all such services are reflected within the Asset Management segment results through intersegment transfer pricing. Intersegment expenses for this segment include distribution expenses for services provided by the Advice & Wealth Management, Annuities and Protection segments.
The Annuities segment provides variable and fixed annuity products of RiverSource Life companies to individual clients. The Company provides variable annuity products through its advisors and its fixed annuity products are distributed through both affiliated and unaffiliated advisors and financial institutions. Revenues for the Company’s variable annuity products are primarily earned as fees
168
based on underlying account balances, which are impacted by both market movements and net asset flows. Revenues for the Company’s fixed deferred annuity products are primarily earned as net investment income on assets supporting fixed account balances, with profitability significantly impacted by the spread between net investment income earned and interest credited on the fixed account balances. The Company also earns net investment income on owned assets supporting reserves for immediate annuities with a non-life contingent feature and for certain guaranteed benefits offered with variable annuities and on capital supporting the business. Revenues for the Company’s immediate annuities with a life contingent feature are earned as premium revenue. Intersegment revenues for this segment reflect fees paid by the Asset Management segment for marketing support and other services provided in connection with the availability of variable insurance trust funds (“VIT Funds”) under the variable annuity contracts. Intersegment expenses for this segment include distribution expenses for services provided by the Advice & Wealth Management segment, as well as expenses for investment management services provided by the Asset Management segment.
The Protection segment offers a variety of products to address the protection and risk management needs of the Company’s retail clients including life, DI and property casualty insurance. Life and DI products are primarily provided through the Company’s advisors. The Company’s property casualty products are sold through affinity relationships. The Company issues insurance policies through its life insurance subsidiaries and the Property Casualty companies. The primary sources of revenues for this segment are premiums, fees, and charges that the Company receives to assume insurance-related risk. The Company earns net investment income on owned assets supporting insurance reserves and capital supporting the business. The Company also receives fees based on the level of assets supporting VUL separate account balances. This segment earns intersegment revenues from fees paid by the Asset Management segment for marketing support and other services provided in connection with the availability of VIT Funds under the VUL contracts. Intersegment expenses for this segment include distribution expenses for services provided by the Advice & Wealth Management segment, as well as expenses for investment management services provided by the Asset Management segment.
The Corporate & Other segment consists of net investment income or loss on corporate level assets, including excess capital held in the Company’s subsidiaries and other unallocated equity and other revenues as well as unallocated corporate expenses. The Corporate & Other segment also includes the results of the Company’s closed block long term care business. The Corporate & Other segment also includes revenues and expenses of consolidated investment entities, which are excluded on an operating basis.
Management uses segment operating measures in goal setting, as a basis for determining employee compensation and in evaluating performance on a basis comparable to that used by some securities analysts and investors. Consistent with GAAP accounting guidance for segment reporting, operating earnings is the Company’s measure of segment performance. Operating earnings should not be viewed as a substitute for GAAP income from continuing operations before income tax provision. The Company believes the presentation of segment operating earnings, as the Company measures it for management purposes, enhances the understanding of its business by reflecting the underlying performance of its core operations and facilitating a more meaningful trend analysis.
Operating earnings is defined as operating net revenues less operating expenses. Operating net revenues and operating expenses exclude results of discontinued operations, the market impact on IUL benefits (net of hedges and the related DAC amortization, unearned revenue amortization, and the reinsurance accrual), integration and restructuring charges and the impact of consolidating investment entities. Operating net revenues also exclude net realized investment gains or losses (net of unearned revenue amortization and the reinsurance accrual) and the market impact of hedges to offset interest rate changes on unrealized gains or losses for certain investments. Operating expenses also exclude the market impact on variable annuity guaranteed benefits (net of hedges and the related DSIC and DAC amortization), the market impact on fixed index annuity benefits (net of hedges and the related DAC amortization), and the DSIC and DAC amortization offset to net realized investment gains or losses. The market impact on variable annuity guaranteed benefits, fixed index annuity benefits and IUL benefits includes changes in embedded derivative values caused by changes in financial market conditions, net of changes in economic hedge values and unhedged items including the difference between assumed and actual underlying separate account investment performance, fixed income credit exposures, transaction costs and certain policyholder contract elections, net of related impacts on DAC and DSIC amortization. The market impact also includes certain valuation adjustments made in accordance with FASB Accounting Standards Codification 820, Fair Value Measurements and Disclosures, including the impact on embedded derivative values of discounting projected benefits to reflect a current estimate of the Company’s life insurance subsidiary’s nonperformance spread.
The following tables summarize selected financial information by segment and reconcile segment totals to those reported on the consolidated financial statements:
|
|
December 31,
|
||||||
|
2017
|
2016
|
||||||
|
(in millions)
|
|||||||
|
Advice & Wealth Management
|
$
|
13,270
|
|
$
|
12,654
|
|
|
|
Asset Management
|
8,393
|
|
7,254
|
|
|||
|
Annuities
|
98,276
|
|
93,481
|
|
|||
|
Protection
|
18,039
|
|
16,780
|
|
|||
|
Corporate & Other
|
9,492
|
|
9,652
|
|
|||
|
Total assets
|
$
|
147,470
|
|
$
|
139,821
|
|
|
169
|
|
Years Ended December 31,
|
||||||||||
|
2017
|
2016
|
2015
|
|||||||||
|
(in millions)
|
|||||||||||
|
Operating net revenues:
|
|||||||||||
|
Advice & Wealth Management
|
$
|
5,506
|
|
$
|
5,036
|
|
$
|
5,013
|
|
||
|
Asset Management
|
3,077
|
|
2,964
|
|
3,254
|
|
|||||
|
Annuities
|
2,499
|
|
2,463
|
|
2,541
|
|
|||||
|
Protection
|
2,044
|
|
2,241
|
|
2,131
|
|
|||||
|
Corporate & Other
|
173
|
|
237
|
|
256
|
|
|||||
|
Eliminations
(1)
|
(1,411
|
)
|
(1,406
|
)
|
(1,461
|
)
|
|||||
|
Total segment operating revenues
|
11,888
|
|
11,535
|
|
11,734
|
|
|||||
|
Net realized gains (losses)
|
46
|
|
6
|
|
4
|
|
|||||
|
Revenue attributable to CIEs
|
94
|
|
128
|
|
446
|
|
|||||
|
Market impact on IUL benefits, net
|
1
|
|
24
|
|
7
|
|
|||||
|
Market impact of hedges on investments
|
(2
|
)
|
3
|
|
(21
|
)
|
|||||
|
Total net revenues per consolidated statements of operations
|
$
|
12,027
|
|
$
|
11,696
|
|
$
|
12,170
|
|
||
(1)
Represents the elimination of intersegment revenues recognized for the years ended
December 31, 2017
,
2016
and
2015
in each segment as follows: Advice and Wealth Management (
$953
,
$982
and
$1,035
, respectively); Asset Management (
$47
,
$44
and
$43
, respectively); Annuities (
$351
,
$333
and
$340
, respectively); Protection (
$62
,
$46
and
$42
, respectively); and Corporate & Other (
$(2)
,
$1
and
$1
, respectively).
|
|
Years Ended December 31,
|
||||||||||
|
2017
|
2016
|
2015
|
|||||||||
|
(in millions)
|
|||||||||||
|
Operating earnings:
|
|||||||||||
|
Advice & Wealth Management
|
$
|
1,163
|
|
$
|
911
|
|
$
|
859
|
|
||
|
Asset Management
|
740
|
|
621
|
|
761
|
|
|||||
|
Annuities
|
710
|
|
329
|
|
650
|
|
|||||
|
Protection
|
216
|
|
263
|
|
198
|
|
|||||
|
Corporate & Other
|
(426
|
)
|
(359
|
)
|
(214
|
)
|
|||||
|
Total segment operating earnings
|
2,403
|
|
1,765
|
|
2,254
|
|
|||||
|
Net realized gains (losses)
|
44
|
|
6
|
|
4
|
|
|||||
|
Net income (loss) attributable to CIEs
|
2
|
|
(2
|
)
|
125
|
|
|||||
|
Market impact on variable annuity guaranteed benefits, net
|
(232
|
)
|
(216
|
)
|
(214
|
)
|
|||||
|
Market impact on IUL benefits, net
|
4
|
|
36
|
|
(1
|
)
|
|||||
|
Market impact of hedges on investments
|
(2
|
)
|
3
|
|
(21
|
)
|
|||||
|
Integration and restructuring charges
|
(5
|
)
|
—
|
|
(5
|
)
|
|||||
|
Pretax income per consolidated statements of operations
|
$
|
2,214
|
|
$
|
1,592
|
|
$
|
2,142
|
|
||
170
26.
Quarterly Financial Data (Unaudited)
|
|
2017
|
2016
|
|||||||||||||||||||||||||||||
|
12/31
|
9/30
|
6/30
|
3/31
|
12/31
|
9/30
|
6/30
|
3/31
|
||||||||||||||||||||||||
|
(in millions, except per share data)
|
|||||||||||||||||||||||||||||||
|
Net revenues
|
$
|
3,160
|
|
$
|
2,981
|
|
$
|
2,985
|
|
$
|
2,901
|
|
$
|
3,062
|
|
$
|
2,998
|
|
$
|
2,871
|
|
$
|
2,765
|
|
|||||||
|
Pretax income
|
600
|
|
628
|
|
511
|
|
475
|
|
469
|
|
238
|
|
410
|
|
475
|
|
|||||||||||||||
|
Net income
|
181
|
|
503
|
|
393
|
|
403
|
|
400
|
|
215
|
|
335
|
|
364
|
|
|||||||||||||||
|
Earnings per share:
|
|||||||||||||||||||||||||||||||
|
Basic
|
$
|
1.20
|
|
$
|
3.29
|
|
$
|
2.53
|
|
$
|
2.56
|
|
$
|
2.49
|
|
$
|
1.31
|
|
$
|
1.99
|
|
$
|
2.11
|
|
|||||||
|
Diluted
|
$
|
1.18
|
|
$
|
3.24
|
|
$
|
2.50
|
|
$
|
2.52
|
|
$
|
2.46
|
|
$
|
1.30
|
|
$
|
1.97
|
|
$
|
2.09
|
|
|||||||
|
Weighted average common shares outstanding:
|
|||||||||||||||||||||||||||||||
|
Basic
|
151.0
|
|
153.0
|
|
155.1
|
|
157.5
|
|
160.4
|
|
164.0
|
|
168.3
|
|
172.6
|
|
|||||||||||||||
|
Diluted
|
153.8
|
|
155.4
|
|
157.5
|
|
160.1
|
|
162.4
|
|
165.8
|
|
170.1
|
|
174.4
|
|
|||||||||||||||
|
Cash dividends declared per common share
|
$
|
0.83
|
|
$
|
0.83
|
|
$
|
0.83
|
|
$
|
0.75
|
|
$
|
0.75
|
|
$
|
0.75
|
|
$
|
0.75
|
|
$
|
0.67
|
|
|||||||
|
Common share price:
|
|||||||||||||||||||||||||||||||
|
High
|
173.62
|
|
149.99
|
|
133.02
|
|
135.20
|
|
119.32
|
|
101.81
|
|
102.74
|
|
105.47
|
|
|||||||||||||||
|
Low
|
147.79
|
|
128.06
|
|
118.84
|
|
110.56
|
|
86.25
|
|
84.93
|
|
84.92
|
|
76.00
|
|
|||||||||||||||
None.
Disclosure Controls and Procedures
We
maintain disclosure controls and procedures (as defined in Rules 13a-15(e) and 15d-15(e) of the Securities Exchange Act of 1934, as amended (the “Exchange Act”)) designed to provide reasonable assurance that the information required to be reported in the Exchange Act filings is recorded, processed, summarized and reported within the time periods specified in and pursuant to SEC regulations, including controls and procedures designed to ensure that this information is accumulated and communicated to our management, including our Chief Executive Officer and Chief Financial Officer, as appropriate, to allow timely decisions regarding the required disclosure. It should be noted that, because of inherent limitations, our company’s disclosure controls and procedures, however well designed and operated, can provide only reasonable, and not absolute, assurance that the objectives of the disclosure controls and procedures are met.
Our management, under the supervision and with the participation of our Chief Executive Officer and Chief Financial Officer, evaluated the effectiveness of the disclosure controls and procedures as of the end of the period covered by this report. Based upon that evaluation, our company’s Chief Executive Officer and Chief Financial Officer have concluded that our disclosure controls and procedures were effective at a reasonable level of assurance as of
December 31, 2017
.
Changes in Internal Control over Financial Reporting
There have not been any changes in our internal control over financial reporting (as such term is defined in Rules 13a-15(f) and 15d-15(f) under the Exchange Act) during the fourth fiscal quarter of the year to which this report relates that have materially affected, or are reasonably likely to materially affect, our company’s internal control over financial reporting.
Management’s Report on Internal Control Over Financial Reporting
Our management is responsible for establishing and maintaining adequate internal control over financial reporting for the Company.
The Company’s internal control over financial reporting is a process designed by, or under the supervision of, the Company’s principal executive and principal financial officers and effected by the Company’s Board of Directors, management and other personnel to provide reasonable assurance regarding the reliability of financial reporting and the preparation of financial statements for external purposes in accordance with generally accepted accounting principles in the United States of America, and includes those policies and procedures that:
|
•
|
Pertain to the maintenance of records that, in reasonable detail, accurately and fairly reflect the transactions and dispositions of the assets of the Company;
|
|
•
|
Provide reasonable assurance that transactions are recorded as necessary to permit preparation of financial statements in accordance with generally accepted accounting principles, and that receipts and expenditures of the Company are being made only in accordance with authorizations of management and directors of the Company; and
|
|
•
|
Provide reasonable assurance regarding prevention or timely detection of unauthorized acquisition, use or disposition of the Company’s assets that could have a material effect on the financial statements.
|
171
Because
of its inherent limitations, internal control over financial reporting may not prevent or detect misstatements. Also, projections of any evaluation of effectiveness to future periods are subject to the risk that controls may become inadequate because of changes in conditions, or that the degree of compliance with the policies or procedures may deteriorate.
The
Company’s management, with the participation of our Chief Executive Officer and Chief Financial Officer, assessed the effectiveness of the Company’s internal control over financial reporting as of
December 31, 2017
. In making this assessment, the Company’s management used the criteria set forth in Internal Control — Integrated Framework (2013) issued by the Committee of Sponsoring Organizations of the Treadway Commission.
Based
on management’s assessment and those criteria, we believe that, as of
December 31, 2017
, the Company’s internal control over financial reporting is effective.
PricewaterhouseCoopers LLP, the Company’s independent registered public accounting firm, has issued an audit report on the effectiveness of the Company’s internal control over financial reporting as of
December 31, 2017
.
On February 22, 2018, the Board of Directors (“Board”) of the Company approved, effective immediately, certain amendments to the Company’s by-laws (“By-Laws”). A summary of the changes to the By-Laws are set forth below and is qualified in its entirety by reference to the full text of the amended and restated By-Laws, a complete copy of which is attached hereto as Exhibit 3.2 and is hereby incorporated by reference in response to this Item 9B
Amendments to the By-Laws include amending: (i) Section 1.03(b) to clarify that such waivers include both written waivers and waivers by electronic transmission; (ii) Section 1.10(a)(ii)(C)(1) to clarify that a stockholder nominee is consenting to being named in the Company’s proxy statement as a nominee of the stockholder; (iii) Section 1.10(c)(iv) to provide that stockholders may now submit proposals pursuant to Rule 14a-8 of the Exchange Act by proxy and requiring that certain information be included in any such proposal by proxy; (iv) Section 1.11(a) to remove the references to withhold votes related to the majority votes cast standard for the election of directors and also clarify that broker nonvotes (like abstentions) are not considered to be votes cast; (v) Section 1.11(b) to clarify that the director resignation required by Section 1.11(b) is contingent upon acceptance by the Board; (vi) Section 1.12 to provide that only the nominees for director nominated by a stockholder pursuant to the advance notice provision must provide certain information within the time periods prescribed for the delivery of a notice pursuant to the advance notice provision; (vii) Section 2.14 and 3.09 to clarify that actions of the Board or a committee require a quorum when there is a vacancy on the Board or Committee; (viii) Section 2.16 to clarify the ability to rely on certain accounts and reports; (ix) Section 4.04 to clarify that the Board may authorize certain officers of the Company to appoint or elect other officers; and (x) Section 5.01 to clarify who may sign stock certificates.
The following portions of the Proxy Statement are incorporated herein by reference:
|
•
|
information included under the caption “Items to be Voted on by Shareholders-Item 1-Election of the Eight Director Nominees Named Below”;
|
|
•
|
information included under the caption “Requirements, Including Deadlines, for Submission of Proxy Proposals, Nomination of Directors and Other Business by Shareholders”;
|
|
•
|
information under the caption “Corporate Governance-Codes of Conduct”;
|
|
•
|
information included under the caption “Corporate Governance-Membership on Board Committees”;
|
|
•
|
information under the caption “Corporate Governance-Nominating and Governance Committee-Director Nomination Process”;
|
|
•
|
information included under the caption “Corporate Governance-Audit Committee”;
|
|
•
|
information included under the caption “Corporate Governance-Audit Committee Financial Experts”; and
|
|
•
|
information under the
caption
“Section 16(a) Beneficial Ownership Reporting Compliance.”
|
EXECUTIVE LEADERSHIP TEAM
Set forth below is a list of the members of our Executive Leadership Team as of the date this Annual Report on Form 10-K has been filed with the SEC. Also included in this list is David K. Stewart, our principal accounting officer. Each such person’s age is indicated by the number in parentheses next to his or her name.
Each individual with an asterisk next to his or her name has been designated as an “executive officer” for purposes of the Exchange Act. None of the below individuals have any family relationship with any other member of the Executive Leadership Team or our principal accounting officer, and none of such individuals became a member of the Executive Leadership Team pursuant to any arrangement or understanding with any other person. Each executive officer has been elected to serve until the next annual election of officers or until his or her successor is elected and qualified.
172
*James M. Cracchiolo-Chairman and Chief Executive Officer, Ameriprise Financial
Mr. Cracchiolo (
59
)
has been our Chairman and Chief Executive Officer since September 2005 when the Company completed its spinoff from American Express. Prior to his current role, Mr. Cracchiolo held a number of senior-level positions at American Express, including group president of American Express Global Financial Services (2000 - 2005); CEO and president of American Express Financial Corporation (AEFC) (2000 - 2005) and chairman of AEFC (2001 - 2005); chairman of American Express Bank Ltd. (2000 - 2005); president and CEO of Travel Related Services International (TRS) (1998 - 2003); president of Global Network Services (1997 -1998); senior vice president of TRS Quality, Global Reengineering (1993 - 1997); and executive vice president and chief financial officer of Shearson Lehman Brothers (then a unit of American Express) (1990 -1993). In addition, he is an advisor to the March of Dimes and previously served on the boards of the American Council of Life Insurers and The Financial Services Roundtable and on the board of advisors to the March of Dimes.
*Walter
S. Berman-Executive Vice President and Chief Financial Officer
Mr. Berman (
75
) has been our Executive Vice President and Chief Financial Officer since September 2005. Prior to that, Mr. Berman served as Executive Vice President and Chief Financial Officer of AEFC, a position he held since January 2003. From April 2001 to January 2004, Mr. Berman served as Corporate Treasurer of American Express.
Scott E. Couto-Head of North America
Mr. Couto (48) has been our Head of North America for Columbia Threadneedle Investments since February 2018. He was previously President of Fidelity Institutional Asset Management and held executive positions across distribution, product and marketing at Fidelity Investments. Mr. Couto joined Fidelity in 2009 from Evergreen Investments. Prior to that, he was with Liberty Funds, a predecessor fund family of Columbia. Mr. Couto received a degree in finance and investments from Babson College and holds the Chartered Financial Analyst® designation.
Kelli
A. Hunter-Executive Vice President of Human Resources
Ms. Hunter (
56
) has been our Executive Vice President of Human Resources since September 2005. Prior to that, Ms. Hunter served as Executive Vice President of Human Resources of AEFC since joining our company in June 2005. Prior to joining AEFC, Ms. Hunter was Senior Vice President-Global Human Capital for Crown Castle International Corporation in Houston, Texas. Prior to that, she held a variety of senior level positions in human resources for Software Spectrum, Inc., Mary Kay, Inc., as well as Morgan Stanley Inc. and Bankers Trust New York Corporation.
*Karen
Wilson Thissen-Executive Vice President and General Counsel
Ms. Wilson Thissen (
51
)
has been our Executive Vice President and General Counsel since January 2017. Prior to that, Ms. Wilson Thissen served as our Executive Vice President and Deputy General Counsel since January 2014 and in other positions within the Company since November 2004. Before joining the Company, Ms. Wilson Thissen was a partner at the law firm Faegre & Benson LLP (now Faegre Baker Daniels LLP).
*Randy
Kupper-Executive Vice President and Chief Information Officer
Mr. Kupper (
59
) has been our Executive Vice President and Chief Information Officer since June 2012. Prior to that, Mr. Kupper had served as Executive Vice President-Applications Development since January 2010 and as Senior Vice President-Applications Development since November 2008. Prior to joining Ameriprise in 2008, he served as a Senior Vice President-Technology of U.S. Consumer and Small Business Services at American Express, where he spent approximately ten years holding leadership positions in the technologies organization.
Neal
Maglaque-President-Advice & Wealth Management, Business Development and Chief Operating Officer
Mr. Maglaque (
61
) has been our President-Advice & Wealth Management, Business Development and Chief Operating Officer since June 2012. Prior to that time, Mr. Maglaque served as Executive Vice President and Advice & Wealth Management Chief Operating Officer since 2009, Senior Vice President-USAG Business Planning and Operations since 2006 and as Senior Vice President-Lead Financial Officer Enterprise Finance since 2005. Prior thereto, Mr. Maglaque held several leadership positions at American Express.
Deirdre D. McGraw-Executive Vice President-Marketing, Corporate Communications and Community Relations
Ms. McGraw (
47
) has been our Executive Vice President-Marketing, Corporate Communications and Community Relations since May 2014. Previously, Ms. McGraw served as Executive Vice President, Corporate Communications and Community Relations since February 2010. Prior to that, Ms. McGraw served as Senior Vice President-Corporate Communications and Community Relations since February 2007 and as Vice President-Corporate Communications since May 2006. Prior thereto, Ms. McGraw served as Vice President-Business Planning and Communications for the Group President, Global Financial Services at American Express.
*Colin
Moore-Executive Vice President and Global Chief Investment Officer
Mr. Moore (
59
) has been our Executive Vice President and Global Chief Investment Officer since June 2013. Mr. Moore also continues to serve as Chief Investment Officer-Columbia Management, a position he has held since 2010. Prior thereto, he was head of fixed income and liquidity strategies from 2009 to 2010. Mr. Moore joined Columbia Management in 2002 as head of equity and has been a member of the investment community since 1983.
173
Patrick H. O’Connell-Executive Vice President, Ameriprise Advisor Group
Patrick H. O'Connell (48) has been our Executive Vice President of the Ameriprise Advisor Group since February 2013. Prior to that, he was Senior Vice President for the employee advisor business in the eastern half of the United States and in other senior leadership positions within the company before that. Mr. O'Connell earned his M.B.A. and B.S. from Widener University.
Michelle Scrimgeour-Chief Executive Officer, EMEA
Ms. Scrimgeour (54) has been our Chief Executive Officer, EMEA since April 2017. She was previously Chief Risk Officer at M&G Investments and a Director of M&G Group Limited. She joined M&G in 2012 from BlackRock (previously Merrill Lynch Investment Managers and Mercury Asset Management), where Ms. Scrimgeour held several roles across the business and across asset classes, including Chief Operating Officer for International Fixed Income; Global Head of Fixed Income Product; Head of Alternative Investments and senior roles in the Quantitative Equity and Transition Management businesses. Scrimgeour holds a BA (Hons) in French from the University of Sheffield.
*Joseph E. Sweeney-President-Advice & Wealth Management, Products and Service Delivery
Mr. Sweeney (
56
) has been our President-Advice & Wealth Management, Products and Service Delivery since June 2012. Prior to that time, Mr. Sweeney served as President-Advice and Wealth Management, Products and Services since May 2009 and as President-Financial Planning, Products and Services since 2005. Prior to that, Mr. Sweeney served as Senior Vice President and General Manager of Banking, Brokerage and Managed Products of AEFC since April 2002. Prior thereto, he served as Senior Vice President and Head, Business Transformation, Global Financial Services of American Express from March 2001 until April 2002. Mr. Sweeney is currently on the board of directors of the Securities Industry and Financial Markets Association.
*David
K. Stewart-Senior Vice President and Controller (Principal Accounting Officer)
Mr. Stewart (
64
) has been our Senior Vice President and Controller since September 2005. Prior to that, Mr. Stewart served as Vice President and Controller of AEFC and its subsidiaries since June 2002, when he joined American Express. Prior thereto, Mr. Stewart held various management and officer positions in accounting, financial reporting and treasury operations at Lutheran Brotherhood, now known as Thrivent Financial for Lutherans, where he was Vice President-Treasurer from 1997 until 2001.
*William F. Truscott-CEO-Global Asset Management
Mr. Truscott (
57
) has been our CEO - Global Asset Management since September 2012. Prior to that time, Mr. Truscott had served as CEO - U.S. Asset Management and President, Annuities since May 2010, as President - U.S. Asset Management, Annuities and Chief Investment Officer since February 2008 and as President - U.S. Asset Management and Chief Investment Officer since September 2005. Prior to that, Mr. Truscott served as Senior Vice President and Chief Investment Officer of AEFC, a position he held since he joined the company in September 2001.
Bill Williams-Executive Vice President, Ameriprise Franchise Group
Bill Williams (50) has been our Executive Vice President, Ameriprise Franchise Group since February 2013. Mr. Williams joined Ameriprise in 1989 as an advisor. Mr. Williams has held a number of management roles within Ameriprise before assuming his current position. Williams is a graduate of Bentley University with a BA in Finance.
*John R. Woerner-President-Insurance & Annuities and Chief Strategy Officer
Mr. Woerner (
48
) has been our President - Insurance and Annuities and Chief Strategy Officer since September 2012. Prior to that time, he served as President - Insurance and Chief Strategy Officer since February 2008 and, as Senior Vice President - Strategy and Business Development since September 2005. Prior to that, Mr. Woerner served as Senior Vice President - Strategic Planning and Business Development of AEFC since March 2005. Prior to joining AEFC, Mr. Woerner was a Principal at McKinsey & Co., where he spent approximately ten years serving leading U.S. and European financial services firms, and co-led McKinsey’s U.S. Asset Management Practice.
CORPORATE GOVERNANCE
We have adopted a set of Corporate Governance Principles and Categorical Standards of Director Independence which, together with the charters of the three standing committees of the Board of Directors (Audit; Compensation and Benefits; and Nominating and Governance) and our Code of Conduct (which constitutes the Company’s code of ethics), provide the framework for the governance of our company. A complete copy of our Corporate Governance Principles and Categorical Standards of Director Independence, the charters of each of the Board committees, the Code of Conduct (which applies not only to our Chief Executive Officer, Chief Financial Officer and Controller, but also to all other employees of our company) and the Code of Business Conduct for the Members of the Board of Directors may be found by clicking the “Corporate Governance” link found on our Investor Relations website at ir.ameriprise.com. You may also access our Investor Relations website through our main website at ameriprise.com by clicking on the “Investor Relations” link, which is located at the bottom of the page. (Information from such sites is not incorporated by reference into this report.) You may also obtain free copies of these materials by writing to our Corporate Secretary at our principal executive offices.
174
The following portions of the Proxy Statement are incorporated herein by reference:
|
•
|
information under the caption “Corporate Governance-Compensation and Benefits Committee-Compensation Committee Interlocks and Insider Participation”;
|
|
•
|
information included under the caption “Compensation of Executive Officers”; and
|
|
•
|
information included under the caption “Compensation of Directors.”
|
Equity Compensation Plan Information
|
Plan category
|
(a)
|
(b)
|
(c)
|
|||||||
|
Number of securities to be issued upon exercise of outstanding options, warrants and rights
|
Weighted-average exercise price of outstanding options, warrants and rights
|
Number of securities remaining available for future issuance under equity compensation plans (excluding securities reflected in column (a)) – shares
|
||||||||
|
Equity compensation plans approved by security holders
|
7,857,964
|
|
(1)
|
$
|
100.46
|
|
13,228,175
|
|
||
|
Equity compensation plans not approved by security holders
|
2,702,893
|
|
(2)
|
$
|
47.50
|
|
7,433,577
|
|
(3)
|
|
|
Total
|
10,560,857
|
|
$
|
100.38
|
|
20,661,752
|
|
|||
(1)
Includes
1,883,908
share units subject to vesting per the terms of the applicable plan which could result in the issuance of common stock. As the terms of these share based awards do not provide for an exercise price, they have been excluded from the weighted average exercise price in column B.
(2)
Includes
2,692,534
share units subject to vesting per the terms of the applicable plans which could result in the issuance of common stock. As the terms of these share based awards do not provide for an exercise price, they have been excluded from the weighted average exercise price in column B. For additional information on the Company’s equity compensation plans see Note 17 — Share-Based Compensation to our Consolidated Financial Statements in Part II, Item 8 of this Annual Report on Form 10-K. The non-shareholder approved plans consist of the Ameriprise Financial 2008 Employment Incentive Equity Award Plan, the Ameriprise Advisor Group Deferred Compensation Plan and the Ameriprise Financial Franchise Advisor Deferred Compensation Plan.
(3)
Consists of
3,258,635
shares of common stock issuable under the terms of the Ameriprise Financial 2008 Employment Incentive Equity Award Plan,
2,027,756
shares of common stock issuable under the Ameriprise Advisor Group Deferred Compensation Plan, and
2,147,186
shares of common stock issuable under the Ameriprise Financial Franchise Advisor Deferred Compensation Plan.
Descriptions of our equity compensation plans can be found in Note 17 to our Consolidated Financial Statements included in Part II, Item 8 of this Annual Report on Form 10-K. Information concerning the market for our common shares and our shareholders can be found in Part II, Item 5 of this Annual Report on Form 10-K. Price and dividend information concerning our common shares may be found in Note 26 to our Consolidated Financial Statements included in Part II, Item 8 of this Annual Report on Form 10-K. The information included under the caption “Ownership of Our Common Shares” in the Proxy Statement is incorporated herein by reference.
The information under the captions “Corporate Governance-Director Independence,” “Corporate Governance-Categorical Standards of Director Independence,” “Corporate Governance-Independence of Committee Members” and “Certain Transactions” in the Proxy Statement is incorporated herein by reference.
The information set forth under the heading “Items to be Voted on by Shareholders-Item 4-Ratification of the Audit Committee’s Selection of PricewaterhouseCoopers LLP as the Company’s Independent Registered Public Accounting Firm for 2018 - Independent Registered Public Accounting Fees”; “-Services to Associated Organizations”; and “-Policy on Pre-Approval of Services Provided by Independent Registered Public Accounting Firm,” in the Proxy Statement is incorporated herein by reference.
175
|
(a) 1.
|
Financial Statements:
The information required herein has been provided in Item 8, which is incorporated herein by reference.
|
|
|
2.
|
Financial schedules required to be filed by Item 8 of this form, and by Item 15(b):
Schedule I-Condensed Financial Information of Registrant (Parent Company Only)
|
|
|
Condensed Statements of Operations – Years Ended December 31, 2017, 2016 and 2015
|
||
|
Condensed Balance Sheets - December 31, 2017 and 2016
|
||
|
Condensed Statements of Cash Flows – Years Ended December 31, 2017, 2016 and 2015
|
||
|
Notes to Condensed Financial Information of Registrant
|
||
|
All other financial schedules are not required under the related instructions, or are inapplicable and therefore have been omitted.
|
||
|
3.
|
Exhibits:
Pursuant to the rules and regulations of the Securities and Exchange Commission, we have filed certain agreements as exhibits to this Annual Report on Form 10-K. These agreements may contain representations and warranties by the parties. These representations and warranties have been made solely for the benefit of the other party or parties to such agreements and (i) may have been qualified by disclosures made to such other party or parties, (ii) were made only as of the date of such agreements or such other date(s) as may be specified in such agreements and are subject to more recent developments, which may not be fully reflected in our public disclosure, (iii) may reflect the allocation of risk among the parties to such agreements and (iv) may apply materiality standards different from what may be viewed as material to investors. Accordingly, these representations and warranties may not describe our actual state of affairs at the date hereof and should not be relied upon.
The following exhibits are filed as part of this Annual Report on Form 10-K. The exhibit numbers followed by an asterisk (*) indicate exhibits electronically filed herewith. All other exhibit numbers indicate exhibits previously filed and are hereby incorporated herein by reference. Exhibits numbered 10.2 through 10.23 are management contracts or compensation plans or arrangements.
|
|
|
Exhibit
|
Description
|
|
|
Amended Restated Certificate of Incorporation of Ameriprise Financial, Inc. (incorporated by reference to Exhibit 3.1 to the Current Report on Form 8-K, File No. 1-32525, filed on May 1, 2014).
|
||
|
3.2
*
|
Amended and Restated Bylaws of Ameriprise Financial, Inc.
|
|
|
Form of Specimen Common Stock Certificate (incorporated by reference to Exhibit 4.1 to Amendment No. 3 to Form 10 Registration Statement, File No. 1-32525, filed on August 19, 2005).
Other instruments defining the rights of holders of long-term debt securities of the registrant are omitted pursuant to Section (b)(4)(iii)(A) of Item 601 of Regulation S-K. The registrant agrees to furnish copies of these instruments to the SEC upon request.
|
||
|
Indenture dated as of October 5, 2005, between Ameriprise Financial, Inc. and U.S. Bank National Association, trustee (incorporated by reference to Exhibit 4(a) to the Registration Statement on Form S-3, File No. 333-128834, filed on October 5, 2005).
|
||
|
Indenture dated as of May 5, 2006, between Ameriprise Financial, Inc. and U.S. Bank National Association, trustee (incorporated by reference to Exhibit 4.A to the Registration Statement on Form S-3ASR, File No. 333-133860, filed on May 5, 2006).
|
||
|
Junior Subordinated Debt Indenture, dated as of May 5, 2006, between Ameriprise Financial, Inc. and U.S. Bank National Association, trustee (incorporated by reference to Exhibit 4.C to the Registration Statement on Form S-3ASR, File No. 333-133860, filed on May 5, 2006).
|
||
|
Subordinated Debt Indenture, dated as of May 5, 2006, between Ameriprise Financial, Inc. and U.S. Bank National Association, trustee (incorporated by reference to Exhibit 4.B to the Registration Statement on Form S-3ASR, File No. 333-133860, filed on May 5, 2006).
|
||
|
Tax Allocation Agreement by and between American Express and Ameriprise Financial, Inc., dated as of September 30, 2005 (incorporated by reference to Exhibit 10.2 to the Current Report on Form 8-K, File No. 1-32525, filed on October 4, 2005).
|
||
176
|
Exhibit
|
Description
|
|
|
Ameriprise Financial 2005 Incentive Compensation Plan, as amended and restated effective April 30, 2014 (incorporated by reference to Exhibit B to the Proxy Statement for the Annual Meeting of Shareholders held on April 30, 2014, File No. 001-32525, filed on March 17, 2014).
|
||
|
Ameriprise Financial Deferred Compensation Plan, as amended and restated effective January 1, 2012 (incorporated by reference to Exhibit 10.3 of the Annual Report on Form 10-K, File No. 1-32525, filed on February 24, 2012).
|
||
|
10.4
*
|
Ameriprise Financial Supplemental Retirement Plan, as amended and restated effective October 3, 2017.
|
|
|
Form of Ameriprise Financial 2005 Incentive Compensation Plan Master Agreement for Substitution Awards (incorporated by reference to Exhibit 10.8 to Amendment No. 2 to Form 10 Registration Statement, File No. 1-32525, filed on August 15, 2005).
|
||
|
Ameriprise Financial Form of Award Certificate — Non-Qualified Stock Option Award (incorporated by reference to Exhibit 10.4 to the Current Report on Form 8-K, File No. 1-32525, filed on October 4, 2005).
|
||
|
Ameriprise Financial Form of Award Certificate — Restricted Stock Award (incorporated by reference to Exhibit 10.5 to the Current Report on Form 8-K, File No. 1-32525, filed on October 4, 2005).
|
||
|
Ameriprise Financial Form of Award Certificate — Restricted Stock Unit Award (incorporated by reference to Exhibit 10.6 to the Current Report on Form 8-K, File No. 1-32525, filed on October 4, 2005).
|
||
|
Ameriprise Financial Form of Agreement — Cash Incentive Award (incorporated by reference to Exhibit 10.7 to the Current Report on Form 8-K, File No. 1-32525, filed on October 4, 2005).
|
||
|
Ameriprise Financial Long-Term Incentive Award Program Guide.
|
||
|
Ameriprise Financial Performance Cash Unit Plan Supplement to the Long Term Incentive Award Program Guide (incorporated by reference to Exhibit 10.1 of the Quarterly Report on Form 10-Q, File No. 1-32525, filed on May 2, 2011).
|
||
|
Ameriprise Financial Form of Award Certificate — Performance Cash Unit Plan Award (incorporated by reference to Exhibit 10.12 of the Annual Report on Form 10-K File No. 1-32525, filed on February 25, 2016)
|
||
|
Ameriprise Financial Performance Share Unit Plan Supplement to the Long-Term Incentive Award Program Guide (incorporated by reference to Exhibit 10.3 of the Quarterly Report on Form 10-Q, File No. 1-32525, filed on May 2, 2011).
|
||
|
Ameriprise Financial Form of Award Certificate — Performance Share Unit Plan Award (incorporated by reference to Exhibit 10.14 of the Annual Report on Form 10-K File No. 1-32525, filed on February 25, 2016).
|
||
|
Ameriprise Financial Deferred Share Plan for Outside Directors, as amended and restated effective December 3, 2014 (incorporated by reference to Exhibit 10.15 of the Annual Report on Form 10-K File No. 1-32525, filed on February 24, 2015).
|
||
|
CEO Security and Compensation Arrangements (incorporated by reference to Item 1.01 of the Current Report on Form 8-K, File No. 1-32525, filed on October 31, 2005).
|
||
|
Ameriprise Financial Senior Executive Severance Plan, as amended and restated effective January 1, 2012 (incorporated by reference to Exhibit 10.17 of the Annual Report on Form 10-K, File No. 1-32525, filed on February 24, 2012).
|
||
|
Restricted Stock Awards in lieu of Key Executive Life Insurance Program (incorporated by reference to Item 1.01 of the Current Report on Form 8-K, File No. 1-32525, filed on November 18, 2005).
|
||
|
Ameriprise Financial Annual Incentive Award Plan, adopted effective as of September 30, 2005 (incorporated by reference to Exhibit 10.28 of the Annual Report on Form 10-K, File No. 1-32525, filed on March 8, 2006).
|
||
|
Form of Indemnification Agreement for directors, Chief Executive Officer, Chief Financial Officer, General Counsel and Principal Accounting Officer and any other officers designated by the Chief Executive Officer (incorporated by reference to Exhibit 10.1 to the Current Report on Form 8-K, File No. 1-32525, filed on April 26, 2012).
|
||
|
Ameriprise Financial 2008 Employment Incentive Equity Award Plan (incorporated by reference to Exhibit 4.1 to the Registration Statement on Form S-8, File No. 333-156075, filed on December 11, 2008).
|
||
|
First Amendment to the Ameriprise Financial 2008 Employment Incentive Equity Award Plan dated September 29, 2015 (incorporated by reference to Exhibit 10.1 to the Quarterly Report on Form 10-Q, File No. 1-32525, filed on November 2, 2015).
|
||
|
Ameriprise Advisor Group Deferred Compensation Plan, as amended and restated effective January 1, 2016 (incorporated by reference to Exhibit 10.23 of the Annual Report on Form 10-K File No. 1-32525, filed on February 25, 2016).
|
||
177
|
Exhibit
|
Description
|
|
|
Third Amended and Restated Credit Agreement, dated as of October 12, 2017, among Ameriprise Financial, Inc., as Borrower, the lenders party thereto, Wells Fargo Bank, National Association as Administrative Agent, Swingline Lender and Issuing Lender, Bank of America, N.A. and Citibank, N.A. as Co-Syndication Agents, Credit Suisse AG, Cayman Islands Branch, Goldman Sachs Bank USA, HSBC Bank USA, National Association, JPMorgan Chase Bank, N.A. and U.S. Bank National Association as Co-Documentation Agents, and Wells Fargo Securities, LLC, Merrill Lynch, Pierce, Fenner & Smith, Incorporated, and Citigroup Global Markets Inc., as Joint Lead Arrangers and Joint Bookrunners (incorporated by reference to Exhibit 10.1 to the Current Report on Form 8-K, File No. 1-32525, filed on October 16, 2017).
|
||
|
12
*
|
Ratio of Earnings to Fixed Charges.
|
|
|
13
*
|
Portions of the Ameriprise Financial, Inc. 2017 Annual Report to Shareholders, which, except for those sections incorporated herein by reference, are furnished solely for the information of the SEC and are not to be deemed “filed.”
|
|
|
21
*
|
Subsidiaries of Ameriprise Financial, Inc.
|
|
|
23
*
|
Consent of PricewaterhouseCoopers LLP, Independent Registered Public Accounting Firm.
|
|
|
24
|
Powers of attorney (included on Signature Page).
|
|
|
31.1
*
|
Certification of James M. Cracchiolo pursuant to Rule 13a-14(a) promulgated under the Securities Exchange Act of 1934, as amended.
|
|
|
31.2
*
|
Certification of Walter S. Berman pursuant to Rule 13a-14(a) promulgated under the Securities Exchange Act of 1934, as amended.
|
|
|
32
*
|
Certification of James M. Cracchiolo and Walter S. Berman pursuant to 18 U.S.C. Section 1350, as adopted pursuant to Section 906 of the Sarbanes-Oxley Act of 2002.
|
|
|
101*
|
The following materials from Ameriprise Financial, Inc.’s Annual Report on Form 10-K for the year ended December 31, 2017, formatted in XBRL: (i) Consolidated Statements of Operations for the years ended December 31, 2017, 2016 and 2015; (ii) Consolidated Statements of Comprehensive Income for the years ended December 31, 2017, 2016 and 2015; (iii) Consolidated Balance Sheets at December 31, 2017 and 2016; (iv) Consolidated Statements of Equity for the years ended December 31, 2017, 2016 and 2015; (v) Consolidated Statements of Cash Flows for the years ended December 31, 2017, 2016 and 2015; and (vi) Notes to the Consolidated Financial Statements; and (vii) Schedule I - Condensed Financial Information of Registrant (Parent Only).
|
|
|
* Filed electronically herewithin.
|
||
None.
178
Signatures
Pursuant to the requirements of the Securities Exchange Act of 1934, the registrant has duly caused this report to be signed on its behalf by the undersigned, thereunto duly authorized.
AMERIPRISE FINANCIAL, INC.
Registrant
|
Date: February 22, 2018
|
By
|
/s/ Walter S. Berman
|
|
Walter S. Berman
Executive Vice President and Chief Financial Officer
|
||
POWER OF ATTORNEY
KNOW ALL PERSONS BY THESE PRESENTS, that each of the undersigned directors and officers of Ameriprise Financial, Inc., a Delaware corporation, does hereby make, constitute and appoint James M. Cracchiolo, Walter S. Berman and Karen Wilson Thissen, and each of them, the undersigned’s true and lawful attorneys-in-fact, with power of substitution, for the undersigned and in the undersigned’s name, place and stead, to sign and affix the undersigned’s name as such director and/or officer of said corporation to an Annual Report on Form 10-K or other applicable form, and all amendments thereto, to be filed by such corporation with the Securities and Exchange Commission, Washington, D.C., under the Securities Exchange Act of 1934, as amended, with all exhibits thereto and other supporting documents, with said Commission, granting unto said attorneys-in-fact, and any of them, full power and authority to do and perform any and all acts necessary or incidental to the performance and execution of the powers herein expressly granted.
Pursuant to the requirements of the Securities Exchange Act of 1934, this report has been signed below by the following persons on behalf of the registrant and in the capacity and on the dates indicated.
|
Date: February 22, 2018
|
By
|
/s/ James M. Cracchiolo
|
|
James M. Cracchiolo
Chairman and Chief Executive Officer
(Principal Executive Officer and Director)
|
||
|
Date: February 22, 2018
|
By
|
/s/ Walter S. Berman
|
|
Walter S. Berman
Executive Vice President and Chief Financial Officer
(Principal Financial Officer)
|
||
|
Date: February 22, 2018
|
By
|
/s/ David K. Stewart
|
|
David K. Stewart
Senior Vice President and Controller
(Principal Accounting Officer)
|
||
|
Date: February 22, 2018
|
By
|
/s/ Dianne Neal Blixt
|
|
Dianne Neal Blixt
Director
|
||
|
Date: February 22, 2018
|
By
|
/s/ Amy DiGeso
|
|
Amy DiGeso
Director
|
||
179
|
Date: February 22, 2018
|
By
|
/s/ Lon R. Greenberg
|
|
Lon R. Greenberg
Director
|
||
|
Date: February 22, 2018
|
By
|
/s/ Siri S. Marshall
|
|
Siri S. Marshall
Director
|
||
|
Date: February 22, 2018
|
By
|
/s/ Jeffrey Noddle
|
|
Jeffrey Noddle
Director
|
||
|
Date: February 22, 2018
|
By
|
/s/ H. Jay Sarles
|
|
H. Jay Sarles
Director
|
||
|
Date: February 22, 2018
|
By
|
/s/ Robert F. Sharpe, Jr.
|
|
Robert F. Sharpe, Jr.
Director
|
||
|
Date: February 22, 2018
|
By
|
/s/ Christopher J. Williams
|
|
Christopher J. Williams
Director
|
||
180
Schedule I - Condensed Financial Information of Registrant
(Parent Company Only)
181
|
Schedule I — Condensed Financial Information of Registrant
Condensed Statements of Operations
(Parent Company Only)
|
|||||||||||
|
Years Ended December 31,
|
|||||||||||
|
2017
|
2016
|
2015
|
|||||||||
|
(in millions)
|
|||||||||||
|
Revenues
|
|||||||||||
|
Management and financial advice fees
|
$
|
(1
|
)
|
$
|
(1
|
)
|
$
|
(1
|
)
|
||
|
Net investment income
|
11
|
|
14
|
|
2
|
|
|||||
|
Other revenues
|
11
|
|
9
|
|
14
|
|
|||||
|
Total revenues
|
21
|
|
22
|
|
15
|
|
|||||
|
Banking and deposit interest expense
|
5
|
|
1
|
|
—
|
|
|||||
|
Total net revenues
|
16
|
|
21
|
|
15
|
|
|||||
|
Expenses
|
|||||||||||
|
Benefits, claims, losses and settlement expenses
|
76
|
|
41
|
|
13
|
|
|||||
|
Distribution expense
|
18
|
|
—
|
|
—
|
|
|||||
|
Interest and debt expense
|
116
|
|
113
|
|
124
|
|
|||||
|
General and administrative expense
|
249
|
|
192
|
|
193
|
|
|||||
|
Total expenses
|
459
|
|
346
|
|
330
|
|
|||||
|
Pretax loss before equity in earnings of subsidiaries
|
(443
|
)
|
(325
|
)
|
(315
|
)
|
|||||
|
Income tax benefit
|
(47
|
)
|
(146
|
)
|
(123
|
)
|
|||||
|
Loss before equity in earnings of subsidiaries
|
(396
|
)
|
(179
|
)
|
(192
|
)
|
|||||
|
Equity in earnings of subsidiaries
|
1,876
|
|
1,493
|
|
1,754
|
|
|||||
|
Net income
|
1,480
|
|
1,314
|
|
1,562
|
|
|||||
|
Other comprehensive income (loss), net of tax
|
29
|
|
(59
|
)
|
(409
|
)
|
|||||
|
Total comprehensive income
|
$
|
1,509
|
|
$
|
1,255
|
|
$
|
1,153
|
|
||
|
See Notes to Condensed Financial Information of Registrant.
|
|||||||||||
182
|
Schedule I — Condensed Financial Information of Registrant
Condensed Balance Sheets
(Parent Company Only)
|
|||||||
|
December 31,
|
|||||||
|
2017
|
2016
|
||||||
|
(in millions, except share amounts)
|
|||||||
|
Assets
|
|||||||
|
Cash and cash equivalents
|
$
|
494
|
|
$
|
754
|
|
|
|
Investments
|
341
|
|
314
|
|
|||
|
Loans to subsidiaries
|
227
|
|
167
|
|
|||
|
Due from subsidiaries
|
382
|
|
452
|
|
|||
|
Receivables
|
5
|
|
10
|
|
|||
|
Land, buildings, equipment, and software, net of accumulated depreciation of $1,111 and $1,005, respectively
|
236
|
|
221
|
|
|||
|
Restricted and segregated cash
|
—
|
|
24
|
|
|||
|
Investments in subsidiaries
|
8,060
|
|
7,739
|
|
|||
|
Other assets
|
1,146
|
|
1,240
|
|
|||
|
Total assets
|
$
|
10,891
|
|
$
|
10,921
|
|
|
|
Liabilities and Shareholders’ Equity
|
|||||||
|
Liabilities:
|
|||||||
|
Accounts payable and accrued expenses
|
$
|
627
|
|
$
|
524
|
|
|
|
Due to subsidiaries
|
74
|
|
88
|
|
|||
|
Borrowings from subsidiaries
|
363
|
|
364
|
|
|||
|
Long-term debt
|
2,891
|
|
2,917
|
|
|||
|
Other liabilities
|
938
|
|
736
|
|
|||
|
Total liabilities
|
4,893
|
|
4,629
|
|
|||
|
Shareholders’ Equity:
|
|||||||
|
Common shares ($.01 par value; shares authorized, 1,250,000,000; shares issued, 327,506,935 and 324,006,315, respectively)
|
3
|
|
3
|
|
|||
|
Additional paid-in capital
|
8,085
|
|
7,765
|
|
|||
|
Retained earnings
|
11,329
|
|
10,351
|
|
|||
|
Treasury shares, at cost (180,872,271 and 169,246,411 shares, respectively)
|
(13,648
|
)
|
(12,027
|
)
|
|||
|
Accumulated other comprehensive income, net of tax, including amounts applicable to equity
investments in subsidiaries
|
229
|
|
200
|
|
|||
|
Total shareholders’ equity
|
5,998
|
|
6,292
|
|
|||
|
Total liabilities and equity
|
$
|
10,891
|
|
$
|
10,921
|
|
|
|
See Notes to Condensed Financial Information of Registrant.
|
|||||||
183
|
Schedule I — Condensed Financial Information of Registrant
Condensed Statements of Cash Flows
(Parent Company Only)
|
|||||||||||
|
Years Ended December 31,
|
|||||||||||
|
2017
|
2016
|
2015
|
|||||||||
|
(in millions)
|
|||||||||||
|
Cash Flows from Operating Activities
|
|||||||||||
|
Net income
|
$
|
1,480
|
|
$
|
1,314
|
|
$
|
1,562
|
|
||
|
Equity in earnings of subsidiaries
|
(1,876
|
)
|
(1,493
|
)
|
(1,754
|
)
|
|||||
|
Dividends received from subsidiaries
|
1,698
|
|
1,465
|
|
1,485
|
|
|||||
|
Other operating activities, primarily with subsidiaries
|
712
|
|
528
|
|
262
|
|
|||||
|
Net cash provided by operating activities
|
2,014
|
|
1,814
|
|
1,555
|
|
|||||
|
Cash Flows from Investing Activities
|
|||||||||||
|
Available-for-Sale securities:
|
|||||||||||
|
Proceeds from sales
|
—
|
|
55
|
|
112
|
|
|||||
|
Maturities, sinking fund payments and calls
|
44
|
|
277
|
|
506
|
|
|||||
|
Purchases
|
(77
|
)
|
(129
|
)
|
(28
|
)
|
|||||
|
Proceeds from sale of other investments
|
3
|
|
—
|
|
62
|
|
|||||
|
Purchase of other investments
|
—
|
|
—
|
|
(5
|
)
|
|||||
|
Purchase of land, buildings, equipment and software
|
(69
|
)
|
(49
|
)
|
(47
|
)
|
|||||
|
Contributions to subsidiaries
|
(79
|
)
|
(197
|
)
|
(271
|
)
|
|||||
|
Return of capital from subsidiaries
|
47
|
|
187
|
|
146
|
|
|||||
|
Repayment of loans to subsidiaries
|
1,277
|
|
1,910
|
|
2,897
|
|
|||||
|
Issuance of loans to subsidiaries
|
(1,337
|
)
|
(1,910
|
)
|
(2,897
|
)
|
|||||
|
Other, net
|
(91
|
)
|
59
|
|
6
|
|
|||||
|
Net cash provided by investing activities
|
(282
|
)
|
203
|
|
481
|
|
|||||
|
Cash Flows from Financing Activities
|
|||||||||||
|
Dividends paid to shareholders
|
(491
|
)
|
(479
|
)
|
(465
|
)
|
|||||
|
Repurchase of common shares
|
(1,485
|
)
|
(1,707
|
)
|
(1,741
|
)
|
|||||
|
Cash paid for purchased options with deferred premiums
|
(19
|
)
|
(22
|
)
|
(19
|
)
|
|||||
|
Issuance of long-term debt, net of issuance costs
|
—
|
|
496
|
|
—
|
|
|||||
|
Repayments of long-term debt
|
(11
|
)
|
(257
|
)
|
(409
|
)
|
|||||
|
Borrowings from subsidiaries
|
15
|
|
—
|
|
3
|
|
|||||
|
Repayments of borrowings from subsidiaries
|
(15
|
)
|
—
|
|
(18
|
)
|
|||||
|
Exercise of stock options
|
15
|
|
9
|
|
16
|
|
|||||
|
Other, net
|
(1
|
)
|
36
|
|
1
|
|
|||||
|
Net cash used in financing activities
|
(1,992
|
)
|
(1,924
|
)
|
(2,632
|
)
|
|||||
|
Net increase (decrease) in cash and cash equivalents
|
(260
|
)
|
93
|
|
(596
|
)
|
|||||
|
Cash and cash equivalents at beginning of year
|
754
|
|
661
|
|
1,257
|
|
|||||
|
Cash and cash equivalents at end of year
|
$
|
494
|
|
$
|
754
|
|
$
|
661
|
|
||
|
Supplemental Disclosures:
|
|||||||||||
|
Interest paid on debt
|
$
|
128
|
|
$
|
121
|
|
$
|
154
|
|
||
|
Income taxes paid (received), net
|
(368
|
)
|
(112
|
)
|
378
|
|
|||||
|
Non-cash dividends from subsidiaries
|
—
|
|
11
|
|
52
|
|
|||||
|
See Notes to Condensed Financial Information of Registrant.
|
|||||||||||
184
Schedule I — Condensed Financial Information of Registrant
Notes to Condensed Financial Information of Registrant (Parent Company Only)
1. Basis of Presentation
The accompanying Condensed Financial Statements include the accounts of Ameriprise Financial, Inc. (the “Registrant,” “Ameriprise Financial” or “Parent Company”) and, on an equity basis, its subsidiaries and affiliates. The financial statements have been prepared in accordance with U.S. generally accepted accounting principles. The financial information of the Parent Company should be read in conjunction with the Consolidated Financial Statements and Notes of Ameriprise Financial. Parent Company revenues and expenses, other than compensation and benefits and debt and interest expense, are primarily related to intercompany transactions with subsidiaries and affiliates.
The change in the fair value of derivative instruments used as hedges is reflected in the Parent Company Only Condensed Statements of Operations. For certain of these derivatives, the change in the hedged item is reflected in the subsidiaries’ Statements of Operations. The change in fair value of certain derivatives used to economically hedge risk related to GMWB provisions is included in benefits, claims, losses and settlement expenses, while the underlying benefits, claims, losses and settlement expenses are reflected in equity in earnings of subsidiaries.
In 2015, the Company recorded a capital lease that had previously been incorrectly recorded as an operating lease for Ameriprise Financial Center. The cumulative adjustment included a capital lease asset of
$70 million
, net of accumulated depreciation, and a related capital lease obligation of
$60 million
and a
$10 million
increase in pretax income. The lease term for the Ameriprise Financial Center began in November 2000 and extends for 20 years, with several options to extend the term.
2. Debt
All of the debt of Ameriprise Financial is borrowings of the Parent Company, except as indicated below.
|
•
|
At both
December 31, 2017
and
2016
, the debt of Ameriprise Financial included
$50 million
of repurchase agreements, which are accounted for as secured borrowings.
|
|
•
|
At both
December 31, 2017
and
2016
, Ameriprise Financial had
$150 million
of borrowings from the Federal Home Loan Bank of Des Moines, which is collateralized with commercial mortgage backed securities.
|
3. Borrowings from Subsidiaries
The Parent Company has intercompany lending arrangements with its subsidiaries. At the end of each business day, taking into consideration all legal and regulatory requirements associated with its subsidiaries, Ameriprise Financial is entitled to draw on all funds in specified bank accounts. Repayment of all or a portion of the funds is due on demand. The Parent Company also has revolving credit agreements with its subsidiaries as the borrower aggregating
$1.0 billion
of which
nil
was outstanding as of December 31,
2017
and
2016
.
4. Guarantees, Commitments and Contingencies
The Parent Company is the guarantor for operating leases of IDS Property Casualty Insurance Company and certain other subsidiaries.
All consolidated legal, regulatory and arbitration proceedings, including class actions of Ameriprise Financial, Inc. and its consolidated subsidiaries are potential or current obligations of the Parent Company.
The Parent Company has committed revolving credit agreements with its subsidiaries as the lender aggregating
$366 million
as of December 31,
2017
.
The Parent Company and Ameriprise Certificate Company (“ACC”) entered into a Capital Support Agreement on March 2, 2009, pursuant to which the Parent Company agrees to commit such capital to ACC as is necessary to satisfy applicable minimum capital requirements. Effective April 30, 2014, this agreement was amended to revise the maximum commitment to
$50 million
. For the years ended December 31,
2017
,
2016
and
2015
, ACC did not draw upon the Capital Support Agreement and had met all applicable capital requirements.
The Parent Company and IDS Property Casualty Insurance Company (“IDS Property Casualty”) entered into a Capital Support Agreement on September 30, 2015, pursuant to which the Parent Company agrees to commit such capital to IDS Property Casualty as is necessary to maintain IDS Property Casualty’s current financial strength ratings by AM Best. The maximum capital amount is
$150 million
. Effective February 1, 2018, this agreement was amended to revise the expiration date to be April 1, 2019. For the year ended
December 31, 2017
, IDS Property Casualty did not draw upon the Capital Support Agreement.
Ameriprise Financial Services Inc. (“AFSI”) entered into a FINRA approved subrogation agreement with the Parent Company on December 15, 2014 for regulatory net capital purposes. The agreement consists of a
$200 million
secured demand note. The note is secured by cash and securities equal to the principal value of the note pledged by the Parent Company. For the year ended
December 31, 2017
, AFSI had not made a demand of the principal amount.
185
TABLE OF CONTENTS
Part IItem 1. BusinessItem 1A. Risk FactorsItem 1B. Unresolved Staff CommentsItem 2. PropertiesItem 3. Legal ProceedingsItem 4. Mine Safety DisclosuresPart IIItem 5. Market For Registrant S Common Equity, Related Stockholder Matters and Issuer Purchases Of Equity SecuritiesItem 6. Selected Financial DataItem 7. Management S Discussion and Analysis Of Financial Condition and Results Of OperationsItem 7A. Quantitative and Qualitative Disclosures About Market RiskItem 8. Financial Statements and Supplementary DataItem 9. Changes in and Disagreements with Accountants on Accounting and Financial DisclosureItem 9A. Controls and ProceduresItem 9B. Other InformationPart IIIItem 10. Directors, Executive Officers and Corporate GovernanceItem 11. Executive CompensationItem 12. Security Ownership Of Certain Beneficial Owners and Management and Related Stockholder MattersItem 13. Certain Relationships and Related Transactions, and Director IndependenceItem 14. Principal Accountant Fees and ServicesPart IVItem 15. Exhibits and Financial Statement SchedulesItem 16. Form 10-k Summary