AMPHASTAR PHARMACEUTICALS, INC.
10-Ks and 10-Qs
|
|
|
|
|
|
|
|
|
|
|
|
|
|
|
|
|
|
|
|
|
|
|
|
|
|
|
|
|
|
|
|
|
|
|
|
|
|
|
|
|
UNITED STATES
SECURITIES AND EXCHANGE COMMISSION
Washington, D.C. 20549
FORM 10-K
|
x
|
ANNUAL REPORT PURSUANT TO SECTION 13 OR 15(d) OF THE SECURITIES EXCHANGE ACT OF 1934
|
For the fiscal year ended December 31, 2014
OR
|
¨
|
TRANSITION REPORT PURSUANT TO SECTION 13 OR 15(d) OF THE SECURITIES EXCHANGE ACT OF 1934
|
For the transition period from ____ to _____
Commission File Number 001-36509
AMPHASTAR PHARMACEUTICALS, INC.
(Exact name of registrant as specified in its charter)
|
Delaware
|
33-0702205
|
|
|
(State or other jurisdiction of
incorporation or organization)
|
(I.R.S. Employer
Identification No.)
|
11570 6
th
Street,
Rancho Cucamonga, CA 91730
(Address of principal executive offices, including zip code)
(909) 980-9484
(Registrant’s telephone number, including area code)
Securities registered pursuant to Section 12(b) of the Act:
|
Title of each class
|
Name of each exchange on which registered
|
|
|
Common Stock, $0.0001 par value per share
|
NASDAQ Stock Market LLC
|
Securities registered pursuant to Section 12(g) of the Act: None
Indicate by check mark if the registrant is a well-known seasoned issuer, as defined in Rule 405 of the Securities Act. Yes
¨
No
x
Indicate by check mark if the registrant is not required to file reports pursuant to Section 13 or Section 15(d) of the Act. Yes
¨
No
x
Indicate by check mark whether the registrant (1) has filed all reports required to be filed by Section 13 or 15(d) of the Securities Exchange Act of 1934 during the preceding 12 months (or for such shorter period that the registrant was required to file such reports), and (2) has been subject to such filing requirements for the past 90 days. Yes
x
No
¨
Indicate by check mark whether the registrant has submitted electronically and posted on its corporate Web site, if any, every Interactive Data File required to be submitted and posted pursuant to Rule 405 of Regulation S-T (§ 232.405 of this chapter) during the preceding 12 months (or for such shorter period that the registrant was required to submit and post such files). Yes
x
No
¨
Indicate by check mark if disclosure of delinquent filers pursuant to Item 405 of Regulation S-K (§ 229.405 of this chapter) is not contained herein, and will not be contained, to the best of registrant’s knowledge, in definitive proxy or information statements incorporated by reference in Part III of this Form 10-K or any amendment to this Form 10-K.
¨
Indicate by check mark whether the registrant is a large accelerated filer, an accelerated filer, a non-accelerated filer, or a smaller reporting company. See the definitions of “large accelerated filer,” “accelerated filer” and “smaller reporting company” in Rule 12b-2 of the Exchange Act. (Check one):
|
Large accelerated filer
|
¨
|
Accelerated filer
|
¨
|
|
|
Non-accelerated filer
|
x
|
(Do not check if a smaller reporting company)
|
Smaller reporting company
|
¨
|
Indicate by check mark whether the registrant is a shell company (as defined in Rule 12b-2 of the Act). Yes
¨
No
x
Aggregate market value of registrant’s common stock held by non-affiliates of the registrant on June 30, 2014, based upon the closing price of Common Stock on such date as reported by NASDAQ Global Select Market, was approximately $430,686,276. Shares of common stock known to be owned by directors and executive officers of the Registrant subject to Section 16 of the Securities Exchange Act of 1934 are not included in the computation. No determination has been made that such persons are “affiliates” within the meaning of Rule 12b-2 under the Exchange Act.
At March 18, 2015, there were 44,564,667, shares of the registrant’s Common Stock outstanding.
Documents Incorporated by Reference
Portions of the registrant’s definitive proxy statement to be filed with the Securities and Exchange Commission within 120 days after the end of its fiscal year to which this report relates in connection with its 2015 Annual Meeting of Stockholders are incorporated by reference into Part III hereof.
AMPHASTAR PHARMACEUTICALS, INC.
|
Page
No.
|
|||
|
|
|||
|
|
|||
|
|
|||
|
|
|||
|
|
|||
|
|
|||
|
|
|||
|
|
|||
|
|
|||
|
|
|||
|
|
|||
|
|
|||
|
|
|||
|
|
|||
|
|
|||
|
|
|||
|
|
|||
|
|
|||
|
|
|||
|
|
|||
|
|
|||
SPECIAL NOTE ABOUT FORWARD-LOOKING STATEMENTS
This Annual Report on Form 10-K, or Annual Report, contains “forward-looking statements” that involve substantial risks and uncertainties. In some cases, you can identify forward-looking statements by the following words: “may,” “will,” “could,” “would,” “should,” “expect,” “intend,” “plan,” “anticipate,” “believe,” “estimate,” “predict,” “project,” “potential,” “continue,” “ongoing” or the negative of these terms or other comparable terminology, although not all forward-looking statements contain these words. These statements relate to future events or our future financial performance or condition and involve known and unknown risks, uncertainties and other factors that could cause our actual results, levels of activity, performance or achievement to differ materially from those expressed or implied by these forward-looking statements. These forward-looking statements include, but are not limited to, statements about:
|
|
·
|
our expectations regarding the sales and marketing of our products, including our enoxaparin product;
|
|
|
·
|
our expectations regarding the integrity of our supply chain for our products, including the risks associated with our single source suppliers;
|
|
|
·
|
our beliefs about and objectives for future operations;
|
|
|
·
|
the timing and likelihood of FDA approvals and regulatory actions on our product candidates, manufacturing activities and product marketing activities;
|
|
|
·
|
our ability to advance product candidates in our platforms into successful and completed clinical trials and our subsequent ability to successfully commercialize our product candidates;
|
|
|
·
|
our ability to compete in the development and marketing of our products and product candidates;
|
|
|
·
|
the potential for adverse application of environmental, health and safety and other laws and regulations on our operations;
|
|
|
·
|
our expectations for market acceptance of our new products and proprietary drug delivery technologies;
|
|
|
·
|
the potential for our marketed products to be withdrawn due to patient adverse events or deaths, or if we fail to secure FDA approval for products subject to the Prescription Drug Wrap-Up program;
|
|
|
·
|
our expectations in obtaining insurance coverage and adequate reimbursement for our products from third-party payers;
|
|
|
·
|
the amount of price concessions or exclusion of suppliers adversely affecting our business;
|
|
|
·
|
our ability to establish and maintain intellectual property on our products and our ability to successfully defend these in cases of alleged infringement;
|
|
|
·
|
the implementations of our business strategies, product candidates and technology;
|
|
|
·
|
the potential for exposure to product liability claims;
|
|
|
·
|
future acquisitions or investments;
|
|
|
·
|
our ability to expand internationally;
|
|
|
·
|
economic and industry trends and trend analysis;
|
|
|
·
|
our ability to remain in compliance with laws and regulations that currently apply or become applicable to our business both in the United States and internationally; and
|
|
|
·
|
our financial performance expectations, including our expectations regarding our revenue, cost of revenue, gross profit or gross margin, operating expenses, including changes in research and development, sales and marketing and general and administrative expenses, and our ability to achieve and maintain future profitability.
|
You should read this Annual Report and the documents that we reference elsewhere in this Annual Report completely and with the understanding that our actual results may differ materially from what we expect as expressed or implied by our forward-looking statements. In light of the significant risks and uncertainties to which our forward-looking statements are subject, you should not place undue reliance on or regard these statements as a representation or warranty by us or any other person that we will achieve our objectives and plans in any specified timeframe, or at all. We discuss many of these risks and uncertainties in greater detail in this Annual Report, particularly in Part I. Item 1A. “Risk Factors.” These forward-looking statements represent our estimates and assumptions only as of the date of this Annual Report regardless of the time of delivery of this Annual Report. Except as required by law, we undertake no obligation to update or revise publicly any forward-looking statements, whether as a result of new information, future events or otherwise after the date of this Annual Report.
|
Business.
|
Overview
Amphastar Pharmaceuticals, together with its subsidiaries (collectively “Amphastar,” “the Company,” “we,” “our,” and “us”), is a specialty pharmaceutical company that focuses primarily on developing, manufacturing, marketing and selling technically-challenging generic and proprietary injectable and inhalation products. Additionally, in 2014, we commenced sales of insulin active pharmaceutical ingredient, or insulin API, products. We currently manufacture and sell 17 products and are developing a portfolio of 13 generic and eight proprietary injectable and inhalation product candidates. For the years ended December 31, 2014, 2013, and 2012, we recorded net revenues of $210.5 million, $229.7 million, and $204.3 million, respectively. We recorded a net loss of $10.7 million for the year ended December 31, 2014 and recorded net income of $11.9 million and $18.1 million for the years ended December 31, 2013 and 2012, respectively.
Our largest product by net revenues is currently enoxaparin sodium injection, the generic equivalent of Sanofi S.A.’s Lovenox
®
. Enoxaparin is a difficult to manufacture injectable form of low molecular weight heparin that is used as an anticoagulant and is indicated for multiple indications including the prevention and treatment of deep vein thrombosis. We commenced sales of our enoxaparin product in January 2012, and for the years ended December 31, 2014, 2013, and 2012, we recognized net revenues from the sale of our enoxaparin product of $107.5 million, $145.9 million, and $127.7 million, respectively. We believe that our enoxaparin product demonstrates our capabilities in characterizing complex molecules (which is a process that involves a determination of physiochemical properties, biological activity, immunochemical properties and purity), developing therapeutically equivalent generic versions of drugs with large, complex molecules and meeting regulatory requirements.
In addition to our currently marketed products, we have a pipeline of 21 generic and proprietary product candidates in various stages of development which target a variety of indications. With respect to these product candidates, we have filed three abbreviated new drug applications, or ANDAs, one new drug application, or NDA, and one NDA supplement with the U.S. Food and Drug Administration, or FDA.
Our product candidate, Primatene
®
Mist HFA, an over-the-counter epinephrine inhalation product, is intended to be used for the temporary relief of mild asthma symptoms. In 2013, we filed an NDA for Primatene
®
Mist HFA. In May 2014, we received a complete response letter, or CRL, from the FDA, which required additional non-clinical information, label revisions and follow-up studies (label comprehension, behavioral and actual use) to assess consumers’ ability to use the device correctly to support approval of the product in the over-the-counter setting. Additionally, the CRL noted current Good Manufacturing Practices, or cGMP, deficiencies in a recent inspection of our API supplier’s manufacturing facility, which produces epinephrine, and indicated that our NDA could not be approved until these issues were resolved. Subsequent to the receipt of the CRL, the supplier notified us that the cGMP deficiencies were satisfactorily resolved and accordingly, we believe this condition for approval has been satisfied. We met with the FDA in October 2014 to discuss preliminary data results and to clarify the FDA requirements for further studies. We are in the process of generating the remaining data required by the CRL and plan to submit an NDA amendment that we believe will address the FDA’s concerns. However, there can be no guarantee that any amendment to our NDA will result in timely approval of the product candidate or approval at all.
Our Amphadase
®
product candidate is a bovine-sourced hyaluronidase injection. We received approval of our NDA for Amphadase
®
from the FDA in 2004, but we discontinued the product in 2009 due to a lack of API supply. We filed an NDA supplement in December 2013 to qualify our own manufactured API. There can be no assurance that we will receive approval for this or any of our other product candidates.
Our multiple technological capabilities enable the development of technically-challenging products. These capabilities include characterizing complex molecules, analyzing peptides and proteins, conducting immunogenicity studies, engineering particles and improving drug delivery through sustained-release technology. These technological capabilities have enabled us to produce bioequivalent versions of complex drugs and support the development and manufacture of a broad range of dosage formulations, including solutions, emulsions, suspensions and lyophilized products, as well as products administered via metered dose inhalers, or MDIs, and dry powder inhalers, or DPIs.
Our primary strategic focus is to develop and commercialize products with high technical barriers to market entry. We are specifically focused on products that:
|
|
▪
|
leverage our research and development capabilities;
|
|
|
▪
|
require raw materials or an API for which we believe we have a competitive advantage in sourcing, synthesizing or manufacturing; and/or
|
|
|
▪
|
improve upon an existing drug’s formulation with respect to drug delivery, safety and/or efficacy.
|
Not all of our products will include all of these characteristics. Moreover, we will opportunistically develop and commercialize product candidates with lower technical barriers to market entry if, for example, our existing supply chain and manufacturing infrastructure allow us to pursue a specific product candidate in a competitive and cost-effective manner.
To complement our internal growth and expertise, we have made several strategic acquisitions of companies, products and technologies. We believe that these acquisitions collectively have strengthened our core injectable and inhalation product technology infrastructure by providing additional manufacturing, marketing and research and development capabilities including the ability to manufacture raw materials, APIs and other components for our products.
Our Markets
We primarily target products with high technical barriers to market entry, with a particular focus on the injectable and inhalation markets. We also target the manufacture and sale of certain APIs.
|
|
▪
|
Injectable market.
Based on an IMS Health National Sales Perspective Report, the U.S. generic injectable drug market in 2014 was approximately $8.0 billion, of which our generic development portfolio is targeting over $5.0 billion. The injectable market requires highly technical manufacturing capabilities and compliance with strict cGMP requirements, which create high barriers to market entry. Due to these high barriers to market entry, there are a limited number of companies with the technology and experience needed to manufacture injectable products. There have also been a number of quality issues over the past several years that have disrupted the ability of certain injectable manufacturers to produce sufficient product quantity to meet market demand. As such, the supply of injectables has been constrained, even as demand for injectable products has continued to increase.
|
|
|
▪
|
Inhalation market.
Based on an IMS Health National Sales Perspective Report, the U.S. inhalation drug market in 2014 was approximately $21.9 billion, of which our generic development portfolio is targeting over $9.0 billion. Inhalation drug therapy is used extensively to treat respiratory conditions such as asthma and chronic obstructive pulmonary disease. The MDI is the most widely used device to deliver inhalation therapies. It uses pressurized gas, historically chlorofluorocarbons, or CFCs, and more recently hydrofluoroalkanes, or HFAs, to release its dose when the device is activated by the patient. The DPI, which does not rely on a propellant, is also widely used. As in the case of injectables, there are significant technical barriers to manufacturing inhalation products. The evolution of inhalation delivery technologies from nebulizers and CFCs to HFAs and DPIs has required manufacturers of inhalation products to re-formulate their products, which in many cases may require technical engineering capabilities, additional regulatory approvals and modified delivery devices. Additionally, the development of generic HFA and DPI products will require bioequivalence studies for FDA approval.
|
Our Strengths
We have built our company by integrating the following capabilities and strengths that we believe enable us to compete effectively in the pharmaceutical industry:
|
|
▪
|
Robust portfolio of products and product candidates.
Including our enoxaparin product, we have 17 commercial products and 21 product candidates at different stages of development. We also continue to develop our product candidates, which represent our longer-term growth opportunities.
|
|
|
▪
|
Advanced technical capabilities and multiple delivery technologies.
We have developed several advanced technical capabilities that we incorporate into the development of our products and product candidates, including characterization of complex molecules, peptide and protein analysis, immunogenicity studies, particle engineering and sustained-release technology. In addition, we apply these capabilities across our injectable and inhalation delivery technologies. Our injectable delivery technologies enable us to develop and manufacture generic and proprietary injectables in normal solution, lyophilized, suspension, jelly and emulsion forms, as well as in pre-filled syringes. Our inhalation technologies cover a variety of delivery methods, including DPIs and HFA formulations of MDIs. These technical capabilities form the foundation for our strategy to develop products with high barriers to market entry targeting a wide range of indications.
|
|
|
▪
|
Vertically integrated infrastructure.
We are a vertically integrated company with the demonstrated ability to advance a product candidate from the research stage through commercialization. Our capabilities include strong research and development expertise, sophisticated pharmaceutical engineering capabilities, comprehensive manufacturing capabilities, including the ability to synthesize and manufacture our own API, a strict quality assurance system, extensive regulatory and clinical experience and established marketing and distribution relationships. We believe our vertical integration allows us to achieve better operating efficiencies, accelerated product development and internal control over product quality.
|
|
|
▪
|
Experienced management team with deep scientific expertise.
Our management team has a successful track record in product development, project management, quality assurance and sales and marketing, as well as established relationships with our key customers, partners and suppliers. Our research and development leadership has deep expertise in areas such as pharmaceutical formulation, process development,
in vivo
studies, analytical chemistry, physical chemistry, drug delivery and clinical research. We believe that our scientific and technical expertise, coupled with our management team’s experience and industry relationships, will enable us to successfully expand our position with respect to our current products and establish a meaningful market position for our product candidates.
|
Our Strategy
Our goal is to be an industry leader in the development, manufacturing and marketing of technically-challenging injectable and inhalation pharmaceutical products. To achieve this goal, we are pursuing the following key strategies:
|
|
▪
|
Diversify our revenues by commercializing our product candidates.
Assuming we are successful in developing and obtaining regulatory approvals, we plan to commercialize our product candidates and thereby diversify our sources of revenues. We have 21 product candidates in various stages of development, including 13 generic product candidates and eight proprietary product candidates. We also expect to expand our internal sales and marketing capabilities and, in some cases, enter into strategic alliances with other pharmaceutical companies, to drive market penetration for our product candidates.
|
|
|
▪
|
Focus on high-margin generic product opportunities.
We believe that we have significant opportunities for growth driven by our technical expertise in the development of generic product candidates with high technical barriers to market entry. We believe that if these product candidates are commercialized, they are likely to face less competition than less technically-challenging generic products, which may enable us to earn higher margins for a longer period of time. We believe that generic competition for these products is likely to be limited because of challenges in product development, manufacturing or sourcing of raw materials or APIs.
|
|
|
▪
|
Develop proprietary products.
We currently have eight proprietary product candidates at various stages of development targeting a broad range of indications. We believe that proprietary products tend to face less competition than generic products due to market exclusivity, intellectual property protection and other barriers to entry. For these reasons, we believe that our proprietary products will provide us with the opportunity for higher margins and long-term revenue growth.
|
|
|
▪
|
Leverage our vertically-integrated infrastructure to drive operational efficiencies.
We believe our vertically-integrated infrastructure provides significant benefits including better operating efficiencies, accelerated product development and internal control over product quality. Our ability to manufacture our own API allows us to develop products that other companies may not focus on due to the uncertainty of API supply. In addition, our vertically-integrated infrastructure, including our research and development capabilities, allows us to conduct technically-challenging studies in-house. We believe this vertically integrated-infrastructure has led, and will continue to lead, to a competitive portfolio of products and product candidates.
|
|
|
▪
|
Target and integrate acquisitions of pharmaceutical companies, products and technologies.
We have a demonstrated ability to identify, acquire and integrate pharmaceutical companies, products and technologies to complement our internal product development capabilities. We have acquired International Medication Systems, Limited, or IMS, Armstrong Pharmaceuticals, Inc., or Armstrong, Nanjing Puyan Pharmaceutical Technology Co., Ltd. (which we renamed Amphastar Nanjing Pharmaceuticals Co., Ltd.), or ANP, and Merck’s API Manufacturing Business in Éragny-sur-Epte, France, in connection with which, we established our French subsidiary, Amphastar France Pharmaceuticals, S.A.S., or AFP. Products we have acquired include Cortrosyn
®
and Epinephrine Mist, and trade names such as Primatene
®
Mist. We believe that our scientific and managerial expertise and our integration experience have improved the quality of the product lines and companies that we have acquired, which has had, and we believe will continue to have, a positive effect on our results of operations. For example, if approval is received from the FDA, we plan to have our acquired subsidiary ANP provide us with access to certain raw materials for the manufacture of the API for our enoxaparin product and eventually to manufacture API for our other products and product candidates.
|
Our Technical Capabilities
We develop, manufacture, market and sell generic and proprietary products targeting injectable and inhalation markets. We also manufacture and sell insulin API.
|
|
▪
|
Injectable.
Our injectable product technologies enable us to develop and manufacture generic and proprietary injectables in liquid, lyophilized, suspension and emulsion forms, as well as pre-filled syringes. We have multiple injectable facilities that include aseptic filling lines dedicated to the sterile manufacture and fill of injectable products. Additionally, we maintain compliance with cGMP regulations which has enabled us to obtain regulatory approvals and support commercial supply.
|
|
|
▪
|
Inhalation.
We are focused on developing a range of generic and proprietary inhalation products utilizing a variety of delivery technologies. We have expertise in formulating HFA-based MDIs as well as packaging our inhalation drugs in DPIs, blister packs and other forms for loading in a variety of inhalation devices. As with our injectable products, we maintain compliance with cGMP regulations, which we believe will enable us to obtain regulatory approvals and support commercial supply.
|
We have advanced capabilities that enable us to focus on developing technically-challenging products.
|
|
▪
|
Characterization of complex molecules.
Characterization of complex molecules includes a determination of physiochemical properties, biological activity, immunochemical properties and purity. Such characterization is important in the development of a generic product that is the same as a reference drug product, which in turn allows the generic drug developer to demonstrate such “sameness” to the FDA. Complex molecule drugs typically have large molecules composed of a mixture of molecules that differ very slightly from one another. These slight variances make complex molecules difficult to characterize. We have developed analytical tools that have enabled us to characterize complex molecules in our products and product candidates. We believe we have the technology to develop a variety of additional analytical tools that will enable us to characterize other complex molecules, including peptide and protein-based products.
|
|
|
▪
|
Immunogenicity.
The ability of an antigen to elicit immune responses is called immunogenicity. Unwanted immunogenicity, which is strongly linked with protein drug products, occurs when a patient mounts an undesired immune response against a drug therapy. As a result, the FDA has signaled that they may require immunogenicity studies as part of the new pathway for biosimilars and biogenerics, and in the past the FDA has required these studies in connection with the approval of products with complex molecules. We gained expertise in immunogenicity by performing immunogenicity studies in connection with the FDA approval process for our enoxaparin product. We believe that our experience in conducting these difficult immunogenicity studies will be of primary importance in our future efforts to develop complex molecules, biosimilar and biogeneric product candidates.
|
|
|
▪
|
Peptide and protein product development and production.
The development of peptide and protein drug products utilizes characterization technology and immunogenicity studies as well as recombinant DNA, or rDNA, API manufacturing technology. We have experience in the use of rDNA manufacturing technology which includes the genetic engineering of host cells, fermentation to promote cell culture growth and isolation and purification of the desired protein from the cell culture. Through each step, testing is required to ensure that only the desired protein is included in the finished product. We believe that this technology will allow us to develop protein and peptide drug products.
|
|
|
▪
|
Particle engineering.
Particle engineering is important in the field of pulmonary drug delivery as there is a direct relationship between the properties of a particle and its absorption by the lungs. We believe our expertise and technology applicable to particle engineering and physical chemistry allows us to engineer the size, shape, surface smoothness and distribution of particles to develop inhalation products that are more easily dispersed through targeted areas. We believe this expertise will allow us to formulate difficult to disperse inhalation products.
|
|
|
▪
|
Sustained-release.
We have developed technology aimed at improving drug delivery through sustained-release injectable products. The purpose of our sustained-release technology is to create products that require less dosing frequency and that we believe can diminish the fluctuations of drug concentrations in a patient’s blood stream that otherwise require more frequent dosing. We plan to use our sustained-release technology to develop both generic and proprietary products.
|
Business Segments
Our performance will be assessed and resources will be allocated based on the following two reportable segments: (1) finished pharmaceutical products and (2) active pharmaceutical ingredients, or API products. The finished pharmaceutical products segment currently manufactures, markets and distributes enoxaparin, Cortrosyn
®
, naloxone, lidocaine jelly, as well as, various other critical and non-critical care drugs. The API segment currently manufactures and distributes recombinant human insulin and porcine insulin.
Information reported herein is consistent with how it is reviewed and evaluated by our chief operating decision maker.
Factors used to identify our segments include markets, customers and products.
For more information regarding our segments, see "Part II – Item 8. Financial Statements and Supplementary Data – Notes to Consolidated Financial Statements – Segment Information."
Finished Pharmaceutical Product Segment
Our Marketed Products
We currently manufacture and sell 15 products
in our finished pharmaceutical product segment
. The following is a description of products in our existing portfolio.
Enoxaparin
Enoxaparin is a difficult to manufacture injectable form of low molecular weight heparin that is used as an anticoagulant which is indicated for multiple indications, including the prevention and treatment of deep vein thrombosis. Enoxaparin is difficult to produce in part because the API is not easily obtained or manufactured. We manufacture the API for our enoxaparin product and perform all subsequent manufacturing of the finished product in-house. We believe that it will be difficult for other companies to obtain or manufacture the API and prove “sameness.” In January 2012, we commenced sales of our enoxaparin product. For the years ended December 31, 2014, 2013, and 2012, we recorded net revenues from enoxaparin of $107.5 million, $145.9 million, and $127.7 million, respectively.
Other Marketed Products
We have 14 other products that we currently market. Other marketed products include Cortrosyn
®
(cosyntropin for injection), a lyophilized powder that is indicated for use as a diagnostic agent in the screening of patients with adrenocortical insufficiency, lidocaine jelly, a local anesthetic product used primarily for urological procedures and our portfolio of emergency syringe products, which include critical care drugs, such as atropine, calcium chloride, dextrose, epinephrine, lidocaine, naloxone and sodium bicarbonate, which are provided in pre-filled syringes and are designed for emergency use in hospital settings. We also manufacture and sell phytonadione injection for newborn use, lidocaine topical solution for use as a local anesthetic, morphine, epinephrine in vial form and a lorazepam injection. For the years ended December 31, 2014, 2013, and 2012, we recorded net revenues from these other marketed products of $103.0 million, $83.8 million, and $76.6 million, respectively.
Our Product Candidates
We seek to develop product candidates with high technical barriers to market entry that leverage our technical capabilities and competitive advantages. We are focused on both generics and proprietary product candidates in the injectable and inhalable markets. The product candidates in our pipeline are in various stages of development, with a number of these candidates still in early stages of development. We currently have 21 product candidates in our pipeline, including 13 generic product candidates and eight proprietary product candidates.
The development, regulatory approval for and commercialization of our product candidates are subject to numerous risks. See “Risk Factors” for additional information.
Generic Product Candidates
We generally employ a strategy of developing generic product candidates that possess a combination of factors that present technical barriers, including difficult formulations, complex characterizations, difficult manufacturing requirements and/or limited availability of raw materials that we believe will make these product candidates less susceptible to competition and pricing pressure. We currently have 13 generic product candidates at various development stages that leverage our various technical capabilities, including:
|
|
▪
|
injectable technologies, which include various delivery methods and sizes of pre-filled syringes, vials in solution, jelly, suspension and lyophilized forms;
|
|
|
▪
|
inhalation technologies, which include MDIs, nasal and DPIs; and
|
|
|
▪
|
sophisticated analytical technologies, which include characterization and immunogenicity studies for complex molecules, particle engineering, sustained-release technology and peptide, protein and DNA analysis.
|
The following table summarizes our current portfolio of 13 generic product candidates in development.
|
Applied Technical Capability
|
||||||||||||||
|
Delivery
Technology
|
Number of
Candidates
|
Therapeutic
Area
|
Characterization
|
Immunogenicity
|
Particle
Engineering
|
Sustained-Release
|
Peptide and
Protein Technology
|
|||||||
|
Injectable
|
5
|
Endocrinology
|
P
|
P
|
P
|
P
|
||||||||
|
Injectable
|
1
|
Hematology
|
P
|
|||||||||||
|
Injectable
|
1
|
Reproductive System
|
P
|
P
|
||||||||||
|
Inhalation
|
6
|
Respiratory
|
P
|
P
|
||||||||||
Our generic product candidates are at various stages of development, ranging from early formulation work to bioequivalence studies or the filing of an ANDA. Of these product candidates, five are in early-stage development prior to bioequivalence studies.
Proprietary Product Candidates
Our integrated technical skills and expertise provide a strong basis for the development of proprietary drug candidates. These skills include new chemical entity assessment, synthesis technology, formulation development, characterization analysis and immunogenicity studies, among others.
With respect to our proprietary pipeline strategy, we currently have eight proprietary drug candidates at various development stages that leverage our various technical capabilities. The following table summarizes our proprietary product candidates for which NDAs have been filed with the FDA.
|
Applied Technical Capability
|
||||||||||||||
|
Delivery
Technology
|
Candidates
|
Therapeutic
Indication
|
Characterization
|
Immunogenicity
|
Particle Engineering
|
Sustained-Release
|
Peptide and
Protein Technology
|
|||||||
|
Inhalation
|
Primatene
®
Mist HFA
|
Asthma
|
P
|
|||||||||||
|
Injectable
|
Amphadase
®
|
Anesthetic Adjuvant
|
P
|
P
|
||||||||||
Primatene
®
Mist HFA
Primatene
®
Mist HFA, an over-the-counter epinephrine inhalation product candidate, is intended to be used for the temporary relief of mild symptoms of intermittent asthma. We developed Primatene
®
Mist HFA to replace the over-the-counter CFC formulation of our Primatene
®
Mist product which was withdrawn for environmental reasons under the Montreal Protocol. We acquired the exclusive rights to the trademark, domain name, website and domestic marketing, distribution and selling rights related to Primatene
®
Mist, and the associated CFC inventory, from Wyeth Consumer Healthcare Division in 2008 for $33.1 million. At the time of the transaction the Environmental Protection Agency was reviewing a possible ban on all CFC formulated products. In our first full year of sales of the CFC formulation of Primatene
®
Mist, we generated cash flows from sales of the product in excess of the purchase price. We filed an investigational new drug application, or IND, for Primatene
®
Mist HFA for mild symptoms of intermittent asthma in October 2009.
We filed an NDA for Primatene
®
Mist HFA in 2013. In February 2014, the FDA held a joint meeting of the Nonprescription Drugs Advisory Committee and its Pulmonary Allergy Drugs Advisory Committee, which we refer to as the Committee, to discuss the NDA for Primatene
®
Mist HFA. The Committee voted 14 to 10 that the data in the NDA supported efficacy, but voted 17 to 7 that safety had not been established for the intended over-the-counter use. The Committee also voted 18 to 6 that the product did not have a favorable risk-benefit profile for the intended over-the-counter use, and individual Committee members provided recommendations for resolving their concerns. On May 22, 2014, we received a CRL from the FDA, which required additional non-clinical information, label revisions and follow-up studies (label comprehension, behavioral and actual use) to assess consumers’ ability to use the device correctly to support approval of the product in the over-the-counter setting. Additionally, in the CRL for Primatene
®
Mist HFA, the FDA noted cGMP deficiencies in a recent inspection of our API supplier’s manufacturing facility, which produces epinephrine, and indicated that our NDA could not be approved until these issues were resolved. Subsequent to the receipt of the CRL, the supplier notified us that the cGMP deficiencies were satisfactorily resolved and accordingly, we believe this condition for approval has been satisfied. We met with the FDA in October 2014 to discuss preliminary data results and to clarify the FDA requirements for further studies. We are in the process of generating the remaining data required by the CRL and plan to submit an NDA amendment that we believe will address the FDA’s concerns. However, there can be no guarantee that any amendment to our NDA will result in timely approval of the product candidate or approval at all.
Amphadase
®
(Hyaluronidase Injection)
Amphadase
®
is a bovine-sourced hyaluronidase injection. Other formulations of hyaluronidase injection include Vitrase and Hylenex which are marketed by Bausch & Lomb and Halozyme, respectively. We received our NDA approval for Amphadase
®
in 2004, but we discontinued the product in 2009 due to a lack of API supply. We filed an IND in February 2004 for Amphadase
®
as an adjuvant in subcutaneous fluid administration for achieving hydration, to increase absorption and dispersion of other injected drugs, and in subcutaneous urography for improving absorption of radiopaque agents. We reactivated this IND in April 2012 to allow studies of the new API, which is to be supplied by us. We filed an NDA supplement in December 2013 to qualify such API. In April 2014, our China facility was subject to an inspection by the FDA. The inspection resulted in multiple observations on Form 483, an FDA form on which deficiencies are noted after an FDA inspection. We believe we have addressed the FDA’s concerns in our initial response in May 2014 and with data provided in October 2014. We are currently awaiting approval from the FDA.
Other Proprietary Product Candidates
In addition to Primatene
®
Mist HFA and Amphadase
®
, we have six other proprietary product candidates in development, which include two new chemical entity drug candidates. These proprietary product candidates target indications including diabetes, asthma, anticoagulants, osteoporosis and Alzheimer’s disease. These product candidates incorporate a wide variety of our technical capabilities, such as particle engineering, sustained-release technology and peptide and protein analysis and utilize our inhalation and injectable delivery technologies.
API Segment
We began to manufacture and sell
two products
recombinant human insulin, or RHI, API and porcine insulin API as a result of our acquisition of Merck Sharpe & Dohme’s, or Merck’s, API manufacturing business in Éragny-sur-Epte, France, or the Merck API Transaction, in April 2014. In July 2014, we entered into a supply agreement with MannKind Corporation, or MannKind to supply them with RHI for use in their product Afrezza
®
, and in January 2015 we entered to a supply option agreement to supply additional quantities, as needed.
Acquisition of Merck’s API Manufacturing Business
On April 30, 2014, we completed our acquisition of the Merck API Transaction, which manufactures porcine insulin API and recombinant human insulin API. The purchase price of the transaction totaled €24.8 million, or $34.4 million on April 30, 2014, subject to certain customary post-closing adjustments and currency exchange fluctuations. The terms of the purchase include multiple payments over four years as follows:
|
Euros
|
U.S.
Dollars
|
|||||||
|
(in thousands)
|
||||||||
|
At Closing, April 2014
|
€ | 13,252 | $ | 18,352 | ||||
|
December 2014
|
4,899 | 5,989 | ||||||
|
December 2015
|
3,186 | 3,873 | ||||||
|
December 2016
|
3,186 | 3,873 | ||||||
|
December 2017
|
500 | 607 | ||||||
| € | 25,023 | $ | 32,694 | |||||
In order to facilitate the acquisition, we established a subsidiary in France, AFP. We will continue the current site manufacturing activities, which consist of the manufacturing of porcine insulin API and recombinant human insulin API. As part of the transaction, we have entered into various additional agreements, including various supply agreements, as well as the assignment and licensing of patents under which Merck was operating at this facility. In addition, certain existing customer agreements have been assigned to AFP.
Supply Agreement with MannKind Corporation
On July 31, 2014, we entered into a supply agreement with MannKind, pursuant to which we will manufacture for and supply to MannKind certain quantities of recombinant human insulin, or RHI, for use in MannKind’s product Afrezza
®
. Under the terms of the supply agreement, we will be responsible for manufacturing the RHI in accordance with MannKind’s specifications and agreed-upon quality standards. MannKind has agreed to purchase annual minimum quantities of RHI under the supply agreement of an aggregate amount of approximately €120.1 million, or approximately $146.0 million, in calendar years 2015 through 2019. MannKind paid a non-refundable reservation fee to us in the amount of €11.0 million, or approximately $14.0 million. Under the agreement, the non-refundable reservation fee is considered as partial payment for the purchase commitment quantity for 2015. We classified the amount as deferred revenue.
Unless earlier terminated, the term of the supply agreement expires on December 31, 2019 and can be renewed for additional, successive two-year terms upon 12 months’ written notice given prior to the end of the initial term or any additional two-year term. MannKind and we each have customary termination rights, including termination for material breach that is not cured within a specific time frame or in the event of liquidation, bankruptcy, or insolvency of the other party. In addition, MannKind may terminate the supply agreement upon two years’ prior written notice to us without cause or upon 30 days prior written notice to us if a controlling regulatory authority withdraws approval for Afrezza
®
; provided, however, in the event of a termination pursuant to either of these scenarios, the provisions of the supply agreement require MannKind to pay the full amount of all unpaid purchase commitments due over the initial term within 60 calendar days of the effective date of such termination.
In January 2015, we entered into a supply option agreement with MannKind, pursuant to which MannKind will have the option to purchase RHI, for use in MannKind’s product Afrezza
®
, in addition to the amounts specified in the July 2014 supply agreement. Under the agreement, MannKind has the option to purchase additional RHI in calendar years 2016 through 2019. In the event MannKind elects not to exercise its minimum annual purchase option for any year, MannKind shall pay us a capacity cancellation fee.
Research and Development
We have approximately 217 employees dedicated to research and development with expertise in areas such as pharmaceutical formulation, process development, toxicity studies, analytical, synthetic and physical chemistry, drug delivery, device development, equipment and engineering, clinical research statistical analysis, etc. Our focus on developing products with high barriers to market entry requires a significant investment in research and development, including clinical development. In particular, developing proprietary products that are reformulations of existing proprietary compounds often requires clinical trials to gain regulatory approval, and we have a team dedicated to designing and managing clinical trials. We have successfully completed several clinical trials for some of our product candidates and are in the process of planning clinical trials for other product candidates under development.
We have made, and will continue to make, substantial investments in research and development. Research and development costs for the years ended December 31, 2014, 2013 and 2012 were $28.4 million, $33.0 million, and $31.2 million, respectively, which represent 14%, 14% and 15% of our net revenues for that period, respectively.
Backlog
A significant portion of our customer shipments in any fiscal year relate to orders received and shipped in that fiscal year, resulting in low product backlog relative to total shipments. Backlog is not material and not a meaningful indicator in any given period of our ability to achieve any particular level of overall revenue or financial performance.
Manufacturing and Facilities
Our manufacturing facilities are located in Rancho Cucamonga and South El Monte, California; Canton, Massachusetts; Éragny-sur-Epte, France; and Nanjing, China. We own or lease a total of 60 buildings at six locations in the U.S., France and China, that comprise 1.44 million square feet of manufacturing, research and development, distribution, packaging, laboratory, office and warehouse space. Our facilities are regularly inspected by the FDA in connection with our product approvals, and we believe that all of our facilities are being operated in material compliance with the FDA’s cGMP regulations.
We are currently expanding our facility in Nanjing, China and we expect that the investment in expanding our facility in China will require a total of up to approximately $15.0 million. We currently have contractual commitments with third parties obligating us to undertake this investment.
We acquired Merck’s API manufacturing business in Éragny-sur-Epte, France in April 2014, which manufactures porcine insulin API and RHI API, and we expect to continue the current site activities.
We believe that our current manufacturing capacity is adequate for the near term. We have in the past approached capacity at one of our facilities largely as a result of the FDA’s request that we reintroduce certain previously discontinued products to help cope with a nation-wide shortage of these products. We believe that these capacity issues have been ameliorated as a result of certain other manufacturers re-entering the market and increasing the production of the products that were subject to the shortage.
Raw Material and Other Suppliers
We depend on suppliers for raw materials, APIs and other components that are subject to stringent FDA requirements. In some cases, we obtain raw materials, components or API used in certain of our products from single sources. Currently we obtain the starting material, heparin USP, for our enoxaparin product, epinephrine for our Primatene
®
Mist HFA product candidate and API for certain of our other marketed products from single sources. If we experience difficulties acquiring sufficient quantities of required materials or products from our existing suppliers, or if our suppliers are found to be non-compliant with the FDA’s quality system regulation, or QSR, cGMPs or other applicable laws or regulations, we would be required to find alternative suppliers. Obtaining the required regulatory approvals to use alternative suppliers may be a lengthy and uncertain process during which we could lose sales. If our primary suppliers become unable or unwilling to perform, we could experience protracted delays or interruptions in the supply of materials which would ultimately delay our manufacture of products for commercial sale, which could materially and adversely affect our development programs, commercial activities, operating results and financial condition.
If our suppliers encounter problems during manufacturing, establishing additional or replacement suppliers for these materials may take a substantial period of time, as suppliers must be approved by the FDA. Further, a significant portion of our raw materials may be available only from foreign sources, which are subject to the special risks of doing business abroad. For example, heparin USP is the starting material for the production of the API in our enoxaparin product. We have established a supply chain for heparin that originates in China and have implemented validated technology processes designed to screen and test incoming starting material, which includes methods currently required by the FDA. However, the FDA has required companies importing heparin to test imported heparin using specific screening methods to detect certain contaminants and it has increased its scrutiny of Chinese facilities that produce heparin for the U.S. market. For example, in August 2008, the FDA inspected two facilities in China belonging to suppliers in our heparin supply chain and issued warning letters, one of which needed to be resolved as a precondition to approving the ANDA for our enoxaparin product candidate in September 2011. If the facility owned by our ANP subsidiary is qualified by the FDA, we plan to have ANP provide us with starting materials for the manufacture of API for enoxaparin. We also plan to have our subsidiary eventually manufacture APIs for not only enoxaparin, but also our other products and product candidates.
Sales and Marketing
Our products are primarily marketed and sold to hospitals, long-term care facilities, alternate care sites, clinics and doctors’ offices. Most of these facilities are members of one or more group purchasing organizations, which negotiate collective purchasing agreements on behalf of their members. These facilities purchase products through specialty distributors and wholesalers. We have relationships with the major group purchasing organizations in the U.S. We also have relationships with major specialty distributors, wholesalers and retailers who distribute pharmaceutical products nationwide.
The following table provides information regarding the percentage of our net revenues that is derived from each of our major customers and partners:
|
% of Net Revenues
Year Ended
December 31,
|
||||||||||||
|
2014
|
2013
|
2012
|
||||||||||
|
Actavis, Inc.
|
30 | % | 35 | % | 35 | % | ||||||
|
AmerisourceBergen Corporation
|
15 | % | 15 | % | 14 | % | ||||||
|
Cardinal Health, Inc.
|
14 | % | 13 | % | 13 | % | ||||||
|
McKesson Corporation
|
22 | % | 26 | % | 27 | % | ||||||
Our marketing department is responsible for establishing and maintaining contracts and relationships with the group purchasing organizations, distributors, retailers, wholesalers and, occasionally, directly to hospitals or long-term care facilities. One or more of our proprietary product candidates may require deployment of a sales force either directly or through a strategic partner.
Under an agreement with Actavis we are paid a fixed cost per unit of our enoxaparin product sold to Actavis and also share in the gross profits from Actavis’ sales of the product in the U.S. retail pharmacy market. We may enter into similar agreements with distributors or strategic partners in the future.
For the years ended December 31, 2014, 2013, and 2012, we generated 4%, 1% and 1% of our total revenue, respectively, from customers located outside of the United States. Other financial information about our segment and geographic areas is incorporated herein by reference to Note 6 of the Notes to Consolidated Financial Statements included elsewhere in this report.
Competition
The majority of our marketed products are generic products. We face and will face significant competition for our products and product candidates from pharmaceutical companies that focus on the generic injectable and inhalation markets such as Hospira, Inc., Sagent Pharmaceuticals, Inc., Akorn, Inc., Sandoz Inc., Mylan Inc. and Teva Pharmaceutical Industries Ltd. Competition in the generic pharmaceutical industry has increased as producers of branded products have entered the business by creating generic drug subsidiaries, purchasing generic drug companies, or licensing their products to generic manufacturers prior to patent expiration and/or as their patents expire. Therefore, our competitors also include the innovator companies of our generic drug products. For example, enoxaparin is currently marketed by Sanofi S.A., or Sanofi, under the brand name Lovenox
®
. Sanofi also markets their authorized generic enoxaparin product through their subsidiary, Winthrop. Sandoz also markets a generic version of enoxaparin. Teva Pharmaceuticals Industries Ltd. has received approval from the FDA of its ANDA for its generic enoxaparin product, and Hospira has filed an ANDA with the FDA for its generic version of enoxaparin. The presence of these current and prospective competitive products may have an adverse effect on our market share, revenue and gross profit from our enoxaparin product.
Similarly, we will face significant competition for our proprietary product candidates. Our competitors vary depending upon product categories, and within each product category, upon dosage strengths and drug-delivery systems. Based on total assets, annual revenues and market capitalization, we are smaller than many of our national and international competitors with respect to both our generic and proprietary products and product candidates. Many of our competitors have been in business for a longer period of time, have a greater number of products on the market and have greater financial and other resources than we do. It is also possible that developments by our competitors will make our generic or proprietary products and product candidates noncompetitive or obsolete.
For pharmaceutical companies, the most important competitive factors are scope of product line, ability to timely develop new products and relationships with group purchasing organizations, retailers, wholesalers and customers. Sales of generic pharmaceutical products tend to follow a pattern based on regulatory and competitive factors. As patents for brand-name products and related exclusivity periods expire, the first generic pharmaceutical manufacturer to receive regulatory approval for generic versions of products is typically able to achieve significant market penetration and higher margins. As competing generic manufacturers receive regulatory approval on the same products, market size, revenue and gross profit typically decline. The level of market share and price will be affected, which will in turn affect the revenue and gross profit attributable to a particular generic pharmaceutical product. This impact is normally related to the number of competitors in that product’s market and the timing of that product’s regulatory approval. We must develop and introduce new products in a timely and cost-effective manner and identify products with significant barriers to market entry in order to grow our business.
Government Regulation and Price Constraints
In the United States
General
Pharmaceutical companies and their prescription brand and generic pharmaceutical products are subject to extensive pre- and post-market regulation by the FDA under the Federal Food, Drug, and Cosmetic Act, or FFDCA, the Public Health Service Act of 1944, or PHSA, and regulations implementing those statutes, with regard to the testing, manufacturing, safety, efficacy, labeling, storage, record-keeping, advertising and promotion of such products, and by comparable agencies and laws in foreign countries. For many drugs (drugs falling within the definition of “new drug” in the FFDCA), FDA approval is required before the product can be marketed in the U.S. All applications for FDA approval must contain, among other things, comprehensive and scientifically reliable information relating to pharmaceutical formulation, stability, manufacturing, processing, packaging, labeling and quality control. These applications must also contain data and information related to safety, effectiveness, bioavailability and/or bioequivalence.
In addition, many of our activities are subject to the jurisdiction of other federal regulatory and enforcement departments and agencies, such as the Department of Health and Human Services, or HHS, Office of the Inspector General, or OIG, the Federal Trade Commission (which also has the authority to regulate the advertising of consumer healthcare products, including OTC drugs), the Department of Justice, the Drug Enforcement Administration, or DEA, the Veterans Administration, the Centers for Medicare and Medicaid Services and the Securities and Exchange Commission, or SEC. Individual states, acting through their attorneys general, have become active as well, seeking to regulate the marketing of prescription drugs under state consumer protection and false advertising laws.
FDA Approval and Regulatory Considerations
Prescription generic and branded pharmaceutical products are subject to extensive regulation by the FDA under the FFDCA and PHSA and regulations implementing those statutes, with regard to the testing, manufacturing, safety, efficacy, labeling, storage, record-keeping, advertising and promotion of such products, and regulation by other state, federal and foreign agencies under the laws that they enforce. For many drugs (drugs falling within the definition of “new drug” in the FFDCA), including the drugs in our current drug portfolio, FDA approval is required before marketing in the U.S. Applications for FDA drug approval must generally contain, among other things, information relating to pharmaceutical formulation, stability, manufacturing, processing, packaging, labeling, quality control and either safety and effectiveness or bioequivalence. There are two drug approval processes under the FFDCA — an ANDA approval process for generic drugs and an NDA approval process for new drugs that cannot be approved in ANDAs. For drugs that are “biological products” within the meaning of the PHSA, there are two different approval processes — a biological license application, or BLA, approval process for original biological products and a biosimilar application approval process for biosimilar products that are approved based on their similarity to biologicals that were previously approved in BLAs.
The ANDA Approval Process
Our generic drug product candidates cannot be lawfully marketed unless we obtain FDA approval. The Drug Price Competition and Patent Term Restoration Act of 1984, commonly known as “the Hatch-Waxman Act,” established abbreviated FDA approval procedures for drugs that are shown to be bioequivalent to drugs previously approved by the FDA through its NDA process, which are commonly referred to as the “innovator” or “reference” drugs. Approval to market and distribute these bioequivalent drugs is obtained by filing an ANDA with the FDA. An ANDA is a comprehensive submission that contains, among other things, data and information pertaining to the API, drug product formulation, specifications, stability, analytical methods, manufacturing process validation data, quality control procedures and bioequivalence. Rather than demonstrating safety and effectiveness, an ANDA applicant must demonstrate that its product is bioequivalent to an approved reference drug. In certain situations, an applicant may submit an ANDA for a product with a strength or dosage form that differs from a reference drug based upon FDA approval of an ANDA Suitability Petition. The FDA will approve an ANDA Suitability Petition if it finds that the product does not raise questions of safety and efficacy requiring new clinical data. ANDAs generally cannot be submitted for products that are not bioequivalent to the referenced drug or that are labeled for a use that is not approved for the reference drug. Applicants seeking to market such products can submit an NDA under Section 505(b)(2) of the FFDCA with supportive data from clinical trials.
Upon approval of an NDA or ANDA, the FDA lists the product in a publication entitled “Approved Drug Products with Therapeutic Equivalence Evaluations,” which is commonly known as the “Orange Book.” In the case of an NDA, the FDA also lists patents identified by the NDA applicant as claiming the drug or an approved method of using the drug. Any applicant who files an ANDA must certify to the FDA with regard to each relevant patent that (1) no patent information has been submitted to the FDA; (2) the patent has expired; (3) the listed patent has not expired, but will expire on a particular date and approval is sought after patent expiration; or (4) the patent is invalid or will not be infringed upon by the manufacture, use or sale of the drug product for which the ANDA is submitted. This last certification is known as a Paragraph IV certification. A notice of the Paragraph IV certification must be provided to each owner of the patent that is the subject of the certification and to the holder of the approved NDA to which the ANDA refers. If the NDA holder submits the patent information to FDA prior to submission of the ANDA and the NDA holder or patent owner(s) sues the ANDA applicant for infringement within 45 days of its receipt of the certification notice, the FDA is prevented from approving that ANDA until the earlier of 30 months from the receipt of the notice of the Paragraph IV certification, the expiration of the patent or such shorter or longer period as may be ordered by a court. This prohibition is generally referred to as the 30-month stay. An ANDA applicant that is sued for infringement may file a counterclaim to challenge the listing of the patent or information submitted to FDA about the patent.
Generally, if an ANDA applicant (1) files a substantially complete ANDA with a Paragraph IV certification on the first day that any ANDA applicant files an application with such a certification based on the same reference drug and (2) provides appropriate notice to the NDA holder, and all patent owner(s) for a particular generic product, the applicant may be awarded a delay in the approval of other subsequently filed ANDAs with Paragraph IV certifications based on the same reference drug. This statutory delay is commonly referred to as 180-day exclusivity. A substantially complete ANDA is one that contains all the information required by the statute and the FDA’s regulations, including the results of any required bioequivalence studies. The FDA may refuse to accept the filing of an ANDA that is not substantially complete or may determine during substantive review of the ANDA that additional information, such as an additional bioequivalence study, is required to support approval. Such a determination may affect an applicant’s first to file status and eligibility for 180-day exclusivity. The MMA provides that the 180-day exclusivity delay ends 180 days after the first commercial marketing of the ANDA product. This exclusivity may be forfeited under a number of different circumstances, including: (1) failure to market within certain prescribed periods of time following certain events related to submission of the application, approval of the application, court decisions and settlements and patent withdrawals from the Orange Book; (2) an amendment or withdrawal of the Paragraph IV certification or certifications upon which the exclusivity was based; (3) failure to obtain tentative approval within certain prescribed time periods (30, 36, or 40 months after submission of the ANDA); (4) an agreement with the NDA holder, patent owner or another ANDA applicant that is determined by a court or the FTC to violate provisions of antitrust laws; (5) withdrawal of the ANDA; or (6) expiration of patent or patents upon which exclusivity is based.
The 180-day exclusivity provisions described above were passed in the Medicare Prescription Drug Improvement and Modernization Act of 2003, or the MMA, and do not apply where the first ANDA with a Paragraph IV certification submitted for the reference drug was filed before December 8, 2003. In this circumstance, the pre-MMA exclusivity provisions apply. Under these provisions, the 180-day exclusivity delay ends 180 days after the first commercial marketing of the ANDA product or a court decision holding the patent invalid, unenforceable or not infringed, whichever comes first. In addition, under the pre-MMA exclusivity provisions, exclusivity is awarded separately to the first applicant or applicants submitting an ANDA with a paragraph IV certification for each patent, resulting in the possibility that different ANDA applicants will hold different exclusivities on different patents, resulting in situations in which an applicant that holds an exclusivity on one patent is subject to another applicant’s exclusivity on a different patent. The FDA has addressed these situations through policies involving exclusivity sharing. The pre-MMA exclusivity provisions do not provide for exclusivity forfeiture.
ANDA approvals can be delayed by exclusivities awarded to the holder of the NDA for the reference drug. The FFDCA provides five-year exclusivity to the first applicant to gain approval of an NDA for a new chemical entity, or NCE, meaning that the FDA has not previously approved any other drug containing the same active moiety. This exclusivity generally prohibits the submission of an ANDA for any drug product containing the same active moiety during the five-year exclusivity period. However, submission of an ANDA with a Paragraph IV certification is permitted after four years, and if a patent infringement lawsuit is brought within 45 days after such certification, FDA approval of the ANDA is delayed until 7.5 years after the NCE approval date. The FFDCA also provides three-year exclusivity for the approval of new and supplemental NDAs for product changes that require new clinical investigations (other than bioavailability studies) that were conducted or sponsored by the applicant. These changes include, among other things, new indications, dosage forms, routes of administration or strengths of an existing drug and new uses.
ANDA approvals can also be delayed by orphan drug exclusivity, pediatric exclusivity and exclusivity for certain new antibiotic drugs. The FDA may grant orphan drug designation to a drug intended to treat a rare disease or condition, which is generally a disease or condition that affects fewer than 200,000 individuals in the U.S. or more than 200,000 individuals in the U.S. and for which there is no reasonable expectation that the cost of developing and making available in the U.S. a drug for this type of disease or condition will be recovered from sales in the U.S. for that drug. Seven-year orphan drug exclusivity is available to a product that has orphan drug designation and that receives the first FDA approval for the indication for which the drug has such designation. Orphan drug exclusivity prevents approval of another application for the same drug, for the same orphan indication, for a period of seven years, regardless of whether the application is a full NDA or an ANDA, except in limited circumstances, such as a showing of clinical superiority to the product with orphan exclusivity. Pediatric exclusivity, if granted, provides an additional six months to an existing exclusivity or statutory delay in approval resulting from a patent certification. This six-month exclusivity, which runs from the end of other exclusivity protection or patent delay, may be granted based on the voluntary completion of a pediatric study in accordance with an FDA-issued written request for such a study. The FFDCA also provides exclusivity for certain antibiotic drugs for serious or life-threatening infections that FDA designates as “qualified infectious disease products.” This exclusivity extends other exclusivities for the same drug by five years, but does not extend patent-related delays in approval.
The NDA Approval Process
The NDA approval process is generally far more demanding than the ANDA process, depending on whether the applicant is submitting a “full NDA” containing all of the data and information required for approval of a new drug or a “Section 505(b)(2) NDA” which is a more limited submission that is generally utilized for modifications to previously approved products.
The “Full NDA”
The approval process for a full NDA generally involves:
|
|
▪
|
completion of preclinical laboratory and animal testing in compliance with the FDA’s good laboratory practice, or GLP, regulations;
|
|
|
▪
|
submission to the FDA of an investigational new drug application, or IND, for human clinical testing, which must satisfy the FDA and become effective before human clinical trials may begin;
|
|
|
▪
|
performance of adequate and well-controlled human clinical trials to establish the efficacy of the proposed drug product for each intended use;
|
|
|
▪
|
satisfactory completion of an FDA pre-approval inspection of the facility or facilities at which the product is produced to assess compliance with the FDA’s cGMP regulations; and
|
|
|
▪
|
submission to and approval by the FDA of an NDA.
|
Before human clinical trials can begin on a new drug, the results of preclinical tests, together with manufacturing information and analytical data, must be submitted to the FDA as part of an IND and the FDA must permit the IND to become effective. Each clinical trial under an IND must be reviewed and approved by an independent Institutional Review Board, or IRB. Human clinical trials are typically conducted in three sequential phases that may overlap. These phases generally include:
|
|
▪
|
Phase 1, during which the drug is introduced into healthy human subjects or, on occasion, patients and is tested for safety, stability, dose tolerance and metabolism;
|
|
|
▪
|
Phase 2, during which the drug is introduced into a limited patient population to determine the efficacy of the product in specific targeted indications, to determine dosage tolerance and optimal dosage and to identify possible adverse effects and safety risks; and
|
|
|
▪
|
Phase 3, during which the clinical trial is expanded to a larger and more diverse patient group at geographically dispersed clinical trial sites to further evaluate the drug and ultimately to demonstrate effectiveness.
|
The IND sponsor, the FDA or the IRB may suspend a clinical trial at any time for various reasons, including failure to follow appropriate ethical trial protocols, failure to provide adequate protections for trial participants or a belief that the subjects are being exposed to an unacceptable health risk.
The results of preclinical animal studies and human clinical studies, together with other detailed (e.g., information relating to pharmaceutical formulation, stability, manufacturing, processing, packaging, labeling, quality control) are submitted to the FDA in the NDA.
The Section 505(b)(2) NDA
For modifications to products previously approved by the FDA, an applicant may file an NDA under Section 505(b)(2) of the FFDCA. This section permits the filing of an NDA where some or all of the data required for approval comes from studies not conducted by or for the applicant and for which the applicant has not obtained a right of reference. Under this section, an applicant may rely on the approval of another NDA or on studies published in the scientific literature. The applicant may be required to conduct additional studies or provide additional information to fully demonstrate the safety and effectiveness of its modification to the approved product.
Where a Section 505(b)(2) applicant relies on the FDA’s approval of another NDA, the applicant is required to submit the same types of patent certifications as are required for an ANDA. As in the case of an ANDA, a Paragraph IV certification challenging one or more of the patents listed for the reference drug will require notice to the patent owner(s) and NDA holder and will permit a patent infringement suit that may result in a 30-month stay in the approval of the Section 505(b)(2) NDA. The approval of a Section 505(b)(2) NDA may also be delayed by the NCE, three-year, orphan drug, pediatric and new antibiotic exclusivities that are applicable to ANDAs as discussed above.
The Biosimilar Application Approval Process
The BPCIA, passed by Congress in 2010, amended the PHSA to create an abbreviated approval pathway for follow-on biologics. This approval pathway is available for “biosimilar” products, which are products that are highly similar to biologics that have been approved in BLAs under the PHSA notwithstanding minor differences in clinically inactive components. A biosimilar application must contain information demonstrating (1) biosimilarity to the reference product, (2) sameness of strength, dosage form, route of administration and mechanism(s) of action with the reference product (where known), (3) approval of the reference product for the indication(s) proposed for the biosimilar product and (4) appropriate manufacturing facilities. FDA will approve the application based on a finding of biosimilarity or interchangeability with the reference product. A finding of biosimilarity must be based on (1) a demonstration that the products are “highly similar” notwithstanding minor differences in clinically inactive components, (2) animal studies, including an assessment of toxicity, and (3) a clinical study or studies (including an assessment of immunogenicity and pharmacokinetics or pharmacodynamics) sufficient to show the safety, purity and potency of the proposed product for one or more “appropriate” conditions of use for which licensure is sought and for which the reference product is licensed, unless FDA waives a specific requirement. The definition of “biosimilar” requires that there be no clinically meaningful differences between the biosimilar and reference product with regard to safety, purity and potency.
An applicant with a pending or approved biosimilar application may seek an FDA determination that its product is interchangeable with the reference drug. In addition to demonstrating biosimilarity to the reference product, the biosimilar applicant must demonstrate that its product can be expected to yield the same clinical result as the reference product in any given patient. If the biosimilar product may be administered more than once to a patient, the applicant must demonstrate that the risk in terms of safety or diminished efficacy of alternating or switching between the biosimilar and reference products is not greater than the risk of continued administration of the reference product. The PHSA provides that a determination of interchangeability means that the biosimilar product may be substituted for the reference product without the intervention of the health care provider who prescribed the reference product. The first biosimilar determined to be interchangeable with a particular reference product for any condition of use is protected by an exclusivity that delays an FDA determination of interchangeability with regard to any other biosimilar application. The exclusivity delays the subsequent interchangeability determination until the earlier of: (1) one year after the first commercial marketing of the first interchangeable product; (2) 18 months after resolution of a patent infringement suit based on a final court decision regarding all of the patents in the litigation or dismissal of the litigation with or without prejudice; (3) 42 months after approval of the first interchangeable biosimilar biological product, if an expedited patent action was commenced against the applicant under section 351(l)(6) and the litigation is still pending; or (4) 18 months after approval of the first interchangeable product if the reference product sponsor did not sue the biosimilar applicant for infringement under the patent resolution provisions of the PHSA.
The PHSA provides a number of exclusivity protections for reference products that may delay submission and approval of biosimilar applications. The PHSA delays submission of a biosimilar application until four years after the date on which the reference product was first licensed and delays final approval of a biosimilar application until twelve years after the first licensure of the reference product. The first-licensure requirement precludes an additional period of exclusivity for a supplement to the original application for the reference product. It also precludes exclusivity for an entirely new BLA in certain circumstances. A new BLA submitted by a sponsor or manufacturer of a previously approved biologic would not be protected by exclusivity for (1) a non-structural change that results in a new indication, route of administration, dosing schedule, dosage form, delivery system, delivery device or strength or (2) a structural change that does not result in a change in safety, purity or potency. As in the case of NDAs approved under the FFDCA, BLAs may be entitled to orphan exclusivity and to pediatric exclusivity.
The BPCIA amended the definition of biological product to include proteins (other than synthetic polypeptides). Applications for biological products, including proteins, must now be approved under the PHSA rather than under the FFDCA. The BPCIA provides a grandfather exception for biologics falling within a product class for which FDA has approved an application under the FFDCA. Applications for approval of these types of proteins may be submitted under the FFDCA until March 23, 2020 unless there is a biological product licensed under the PHSA that could serve as a reference product for a biosimilar application.
Under the PHSA, patents are not listed in the Orange Book and companies submitting biosimilar applications are not required to submit patent certifications. Patent disputes are resolved outside of the FDA regulatory process. The biosimilar applicant must share the contents of its biosimilar application and information on its manufacturing processes with counsel for the company holding the BLA for the reference drug. The biosimilar applicant and BLA holder must exchange information about relevant patents and seek agreement on patents to be litigated under an expedited litigation procedure.
The BLA Approval Process
The BLA approval process is similar to the “Full NDA” approval process and generally involves:
|
|
▪
|
completion of preclinical laboratory and animal testing in compliance with the FDA’s GLP regulations;
|
|
|
▪
|
submission to the FDA of an IND for human clinical testing, which must satisfy FDA and become effective before human clinical trials may begin;
|
|
|
▪
|
performance of adequate and well-controlled human clinical trials to establish the efficacy of the proposed drug product for each intended use;
|
|
|
▪
|
satisfactory completion of an FDA pre-approval inspection of the facility or facilities at which the product is produced to assess compliance with the FDA’s cGMP regulations; and
|
|
|
▪
|
submission to and approval by the FDA of a BLA.
|
FDA Action on an Application for Approval
If applicable statutory or regulatory requirements are not satisfied, the FDA may deny approval of an NDA, ANDA, BLA, or biosimilar application, or the FDA may require additional data or information. After approval of the application, the FDA may suspend or withdraw the approval based on various criteria, including new information related to safety or effectiveness or failure to comply with post-approval requirements. In addition, the FDA may in some instances require post-marketing studies on approved products and may take actions to limit marketing of the product based on the results of those studies.
The new drug and biological product approval processes may take years, and the time may vary substantially based upon the type of application and the type, complexity and novelty of the product or disease. Government regulation may delay or prevent marketing of potential products for a considerable period of time and impose costly procedures upon a manufacturer’s activities. Success in early stage clinical trials does not assure success in later stage clinical trials. Data obtained from clinical activities are not always conclusive and may be subject to varying interpretations that could delay, limit or prevent regulatory approval. Even if a product receives regulatory approval, later discovery of previously unknown problems with a product may result in restrictions on the product or complete withdrawal of the product from the market.
Manufacturing (cGMP) Requirements
We and our contract manufacturers and other suppliers are required to comply with applicable FDA manufacturing requirements contained in the FDA’s cGMP regulations. These cGMP regulations require among other things, quality control and quality assurance as well as the corresponding maintenance of records and documentation. The manufacturing facilities for our products must meet cGMP requirements to the satisfaction of the FDA before FDA will approve our products and we must continue to meet these requirements after our products are approved. We and our third-party manufacturers and other suppliers are subject to periodic inspections of facilities by the FDA and other authorities to assess our compliance with applicable regulations.
Other Regulatory Requirements
Maintaining substantial compliance with appropriate federal, state and local statutes and regulations requires the expenditure of substantial time and financial resources. Drug manufacturers are required to register their establishments with the FDA and certain state agencies. After approval, the FDA and these state agencies conduct periodic unannounced inspections to ensure continued compliance with ongoing regulatory requirements.
In addition, after approval, some types of changes to the approved product, such as adding new indications, manufacturing changes and additional labeling claims, are subject to further FDA review and approval. The FDA may require post-approval testing and surveillance programs to monitor safety and effectiveness of approved products that have been commercialized. Any drug products manufactured or distributed pursuant to FDA approvals are subject to continuing regulation by the FDA, including:
|
|
▪
|
record-keeping requirements;
|
|
|
▪
|
reporting of adverse experiences with the drug;
|
|
|
▪
|
providing the FDA with updated safety and efficacy information;
|
|
|
▪
|
reporting on advertisements and promotional labeling;
|
|
|
▪
|
drug sampling and distribution requirements; and
|
|
|
▪
|
complying with electronic record and signature requirements.
|
In addition, the FDA strictly regulates labeling, advertising, promotion and other types of information on products that are placed on the market. There are numerous regulations and policies that govern various means for disseminating information to health-care professionals, as well as consumers, including industry sponsored scientific and educational activities, information provided to the media and information provided over the Internet. Drugs may be promoted only for the approved indications and in accordance with the provisions of the approved label.
FDA Enforcement Authority
The FDA has very broad enforcement authority and the failure to comply with applicable regulatory requirements can result in administrative or judicial sanctions being imposed on us or on the manufacturers and distributors of our approved products, including warning letters, refusals of government contracts, clinical holds, civil penalties, injunctions (which may in some circumstances involve restitution, disgorgement or profits, recalls and/or total or partial suspension of production or distribution), seizure of products, withdrawal of approvals, refusal to approve pending applications and criminal prosecution of the company and company officials that may result in fines and incarceration. FDA has authority to inspect manufacturing facilities as well as other facilities in which drug products are held, packaged or stored, to determine compliance with cGMP and other requirements under the FDCA. The FDA and other agencies actively enforce the laws and regulations prohibiting the promotion of off-label uses, and a company that is found to have improperly promoted off-label uses may be subject to significant liability. In addition, even after regulatory approval is obtained, later discovery of previously unknown problems with a product may result in restrictions on the product or even complete withdrawal of the product from the market.
We are also subject to various laws and regulations regarding laboratory practices, the experimental use of animals and the use and disposal of hazardous or potentially hazardous substances in connection with our research. In each of these areas, as above, the FDA has broad regulatory and enforcement powers, including the ability to levy fines and civil penalties, suspend or delay issuance of approvals, seize or recall products and withdraw approvals, any one or more of which could have a materially adverse effect on us.
On February 27 through March 3, 2014, our facility in Rancho Cucamonga, CA was subject to an inspection by the FDA under the Bioresearch Monitoring Program, or BIMO. The inspection covered a clinical trial for one of our pipeline products to establish that Good Clinical Practices were followed during the execution of the trial. The inspection did not result in any observations on Form 483.
On March 31, 2014 through April 4, 2014, our facility in Nanjing, China was subject to an inspection by the FDA. The inspection resulted in multiple observations on Form 483. We responded to those observations on April 25, 2014 providing our corrective action plan as well as corrective actions already implemented. We believe that we have addressed all of the observations and the final follow up response to the FDA was submitted with data supporting our actions in October 2014.
On March 31, 2014 through April 3, 2014, our facility in Canton, MA was subject to a preapproval inspection by the FDA relating to our NDA for Primatene
®
Mist HFA. The inspection did not result in any observations on Form 483.
From July 9, 2014 through August 8, 2014, our facility in Rancho Cucamonga, CA was subject to an inspection by the FDA. The inspection included a review of current Good Manufacturing Practices, preapproval inspections for two ANDAs currently being reviewed by the FDA, and a review of post-market adverse drug events. The inspections resulted in multiple observations on Form 483. We responded to those observations on September 3, 2014. We believe that our responses to the Form 483 will satisfy the FDA and that no significant further actions will be necessary.
From August 27, 2014 through September 12, 2014, our facility in South El Monte, CA was subject to a current Good Manufacturing Practices inspection by the FDA. The inspections resulted in multiple observations on Form 483. We responded to those observations on October 3, 2014. We believe that our responses to the Form 483 will satisfy the FDA and that no significant further actions will be necessary.
Foreign Regulatory Requirements
Outside the U.S., our ability to market a product is contingent upon receiving marketing authorization from the appropriate regulatory authorities. The requirements governing marketing authorization, pricing and reimbursement vary widely from country to country. At present, foreign marketing authorizations are applied for at a national level, although within the European Union registration procedures are available to companies wishing to market a product in more than one European Union member state. The regulatory authority generally will grant marketing authorization if it is satisfied that we have presented it with adequate evidence of safety, quality and efficacy.
Prescription Drug Wrap-Up
When Congress passed the FFDCA in 1938, it required that “new drugs” be approved based on their safety. In 1962, Congress amended the FFDCA to require that sponsors demonstrate that new drugs are effective, as well as safe, in order to receive FDA approval. We refer to these provisions as the “1962 Amendments.” The 1962 Amendments also required the FDA to conduct a retrospective evaluation of the efficacy of the drug products that the FDA approved between 1938 and 1962 on the basis of safety alone. The FDA contracted with the National Academy of Science/National Research Council, or the NAS/NRC, to make an initial evaluation of the efficacy of many of these drug products. The FDA’s administrative implementation of the NAS/NRC reports was called the Drug Efficacy Study Implementation, or the DESI.
Drugs that were not subject to applications approved between 1938 and 1962 were not subject to DESI review. For a period of time, the FDA did not challenge the marketing of these drugs without approval. In 1984, however, spurred by serious adverse reactions to one of these products and concerns expressed by Congress, FDA undertook an assessment of the products under an initiative known as the “Prescription Drug Wrap-Up.” Most of these drugs contain active ingredients that were first marketed prior to the enactment of the FFDCA. Several of our marketed pharmaceutical products fall within this category.
The FDA has asserted that all drugs subject to the Prescription Drug Wrap-Up are on the market illegally unless they fall within two “grandfather” exceptions to the new drug definition. The first is a provision in the new drug definition exempting drugs that were on the market prior to the passage of the FFDCA and that contain the same representations concerning the conditions of use as they did prior to passage of the FFDCA. The 1962 Amendments also exempt drugs that were not new drugs prior to the passage of the 1962 Amendments and that have the same composition and labeling as they had prior to the passage of the 1962 Amendments. The FDA and the courts have interpreted these two exceptions very narrowly. Therefore, the FDA could commence enforcement action at any time regarding any or all of our unapproved prescription products.
The FDA has adopted a risk-based enforcement policy that prioritizes enforcement of new drug requirements for these and other unapproved drugs that pose safety concerns, lack evidence of efficacy, prevent patients from pursuing effective therapies, are marketed fraudulently, violate other provisions of the FFDCA, such as cGMP requirements, or directly compete with approved drugs. The FDA has indicated that approval of an NDA for one drug within a class of drugs marketed without FDA approval may trigger agency enforcement of the new drug requirements. Once the FDA issues an approved NDA for one of the drug products at issue or completes the efficacy review for that drug product, it may require other manufacturers to also obtain approval for that same drug in order to continue marketing it in the U.S. While the FDA generally provides sponsors a one-year grace period, the agency is not statutorily required to do so.
Fraud and Abuse Laws
Because of the significant federal funding involved in Medicare and Medicaid, Congress and the states have enacted, and actively enforce, a number of laws to eliminate fraud and abuse in federal health care programs. Our business is subject to compliance with these laws.
Federal False Claims Act
Another development affecting the health care industry is the increased use of the federal False Claims Act, and in particular, actions brought pursuant to the False Claims Act’s “whistleblower” or “qui tam” provisions. The False Claims Act imposes liability on any person or entity that, among other things, knowingly presents, or causes to be presented, a false or fraudulent claim for payment by a federal health care program. The qui tam provisions of the False Claims Act allow a private individual to bring actions on behalf of the federal government alleging that the defendant has submitted a false claim to the federal government and to share in any monetary recovery. In recent years, the number of suits brought against health care providers by private individuals has increased dramatically. In addition, various states have enacted false claims laws analogous to the False Claims Act, and many of these state laws apply where a claim is submitted to any third-party payer and not merely a federal or other governmental health care program.
When an entity is determined to have violated the False Claims Act, it may be required to pay up to three times the actual damages sustained by the government, plus civil penalties of between $5,500 and $11,000 for each separate instance of a false claim. There are many potential bases for liability under the False Claims Act. Liability arises, primarily, when an entity knowingly submits, or causes another to submit, a false claim for reimbursement to the federal government. The federal government has used the False Claims Act to assert liability on the basis of inadequate care, kickbacks and other improper referrals, and improper use of Medicare numbers when detailing the provider of services, in addition to the more predictable allegations of misrepresentations with respect to the services rendered. In addition, the federal government has prosecuted companies under the False Claims Act in connection with off-label promotion of products. Our current and future activities relating to the reporting of wholesale or estimated retail prices of our products, the reporting of discount and rebate information and other information affecting federal, state and third-party reimbursement of our products, and the sale and marketing of our products may be subject to scrutiny under these laws. While we are unaware of any current matters, we are unable to predict whether we will be subject to actions under the False Claims Act or a similar state law, or the impact of such actions. However, the costs of defending such claims, as well as any sanctions imposed, could significantly affect our financial performance.
The Sunshine Act
The Physician Payment Sunshine Act, or the Sunshine Act, which was enacted as part of the Affordable Care Act, requires all pharmaceutical manufacturers that participate in Medicare, Medicaid or the Children’s Health Insurance Program to report annually to the Secretary of the Department of Health and Human Services payments or other transfers of value made by that entity, or by a third party as directed by that entity, to physicians and teaching hospitals or to third parties on behalf of physicians or teaching hospitals. The payments required to be reported include the cost of meals provided to a physician, travel reimbursements and other transfers of value provided as part of contracted services, including speaker programs, advisory boards, consultation services and clinical trial services. The final rule implementing the Sunshine Act requires data collection on payments to begin on August 1, 2013. We have timely filed our first annual report, comprised of data collected from August 1, 2013 to December 31, 2013, which was due March 31, 2014. The statute requires the federal government to make reported information available to the public. Failure to comply with the reporting requirements can result in significant civil monetary penalties ranging from $1,000 to $10,000 for each payment or other transfer of value that is not reported (up to a maximum per annual report of $150,000) and from $10,000 to $100,000 for each knowing failure to report (up to a maximum per annual report of $1.0 million). Additionally, there are criminal penalties if an entity intentionally makes false statements in such reports. We are subject to the Sunshine Act and the information we disclose may lead to greater scrutiny, which may result in modifications to established practices and additional costs. Additionally, similar reporting requirements have also been enacted on the state level domestically, and an increasing number of countries worldwide either have adopted or are considering adopting similar laws requiring transparency of interactions with health care professionals.
Environmental Considerations
We are subject to federal, state and local environmental laws and regulations, both U.S. and foreign, including those promulgated by the Occupational Safety and Health Administration, the Environmental Protection Agency, the Department of Health and Human Services and the Air Quality Management District, which govern activities and operations that may have adverse environmental effects such as discharges to air, soil and water, as well as handling and disposal practices for solid and hazardous wastes. Because we own and operate real property, these laws impose strict liability for the costs of cleaning up, and for damages resulting from, sites of past spills, disposals or other releases of hazardous substances and materials. These laws and regulations may also require us to pay for the investigation and remediation of environmental contamination at properties operated by us and at off-site locations where we have arranged for the disposal of hazardous substances. If it is determined that our operations or facilities are not in compliance with current environmental laws, we could be subject to fines and penalties, the amount of which could be material.
The costs of complying with various applicable environmental requirements, as they now exist or as may be altered in the future, could adversely affect our financial condition and results of operations. For example, as a result of environmental concerns about the use of CFCs, the FDA issued a final rule on January 16, 2009 that required the phase-out of the CFC version of our Primatene
®
Mist product by December 31, 2011. This phase out caused us to halt sales of the CFC version of our Primatene
®
Mist product subsequent to December 31, 2011 and write off our inventory for the product, which had an adverse effect on our financial results.
Prior to the Merck API Transaction, Merck notified us of several items it had identified as part of its own internal auditing that relate to potential minor environmental issues. Merck identified certain issues that did not meet their internal policies and procedures but did not violate any French environmental law or regulation. Merck has agreed to pay for the remediation costs up to a certain dollar amount, after which we will be responsible for any additional costs; however, we expect that remediation costs will remain below that threshold.
We have made and will continue to make expenditures to comply with current and future U.S. and foreign environmental laws and regulations. We anticipate that we will incur additional capital and operating costs in the future to comply with existing environmental laws and new requirements arising from new or amended statutes and regulations. We cannot accurately predict the impact and costs that future regulations will impose on our business.
Other Regulations
We also must comply with data protection and data privacy requirements. Compliance with these laws, rules and regulations regarding privacy, security and protection of employee data could result in higher compliance and technology costs for us, as well as significant fines, penalties and damage to our global reputation and our brand as a result of non-compliance.
Intellectual Property
Our success depends on our ability to operate without infringing the patents and proprietary rights of third parties. However, we cannot determine with certainty whether patents or patent applications of other parties will have a materially adverse effect on our ability to make, use, or sell any products. A number of pharmaceutical companies, biotechnology companies, universities and research institutions may have filed patent applications or may have been granted patents that cover aspects of our, or our licensors’ products, product candidates, or other technologies.
We primarily rely on trade secrets, unpatented proprietary know-how and continuing technological innovation to protect our products and technologies, especially where we do not believe patent protection is appropriate or obtainable. Although in some cases we seek patent protection to preserve our competitive position, our current patent portfolio does not cover the majority of our existing products and product candidates. We own several U.S. and foreign patents covering processes and equipment used in the manufacture of a few of our products. The expiration dates of these patents range from 2020 to 2027.
In addition, we own a United States patent covering Primatene
®
Mist HFA: United States Patent Number 8,367,734, or the “‘734 patent,” which was issued on February 5, 2013, and expires in January 2026. Additionally, we have several patent applications that are currently pending in the U.S. and other countries, including China, but which have not yet issued as patents. Accordingly, other than the ‘734 patent covering Primatene
®
Mist HFA, none of our significant products or product candidates are covered by any United States or foreign patents related to formulations or compositions. Indeed, many of our products and product candidates are generic products, and therefore may not be eligible for patent protection. For example, our enoxaparin product is a generic product, and as such, it is not covered by any United States or foreign patents. Other of our products, including Amphadase
®
, are based on compounds for which any applicable patents have expired, or which were not patented by Amphastar in the first instance because they are older compounds. As for the remainder of our product candidates that are not intended to be generic products, these are early stage product candidates currently under development, for which we intend to seek to obtain patent rights or rely on trade secret protection (but in any case, are not currently covered by any United States or foreign patents). In addition, with respect to such product candidates, we may seek patent rights for various potential technology platforms (or rely on trade secret protection), which could apply across multiple product candidates (but again, such potential technology platforms currently are not covered by any United States or foreign patents).
We may not be able to obtain patent or other forms of protection for inventions or other intellectual property developed by our officers, employees, or consultants because we might not have been the first to file or to invent the patentable technology or others may have independently developed similar or alternative technology. We also own several trademarks registered with the USPTO and one trademark registered with the Canadian Intellectual Property Office.
Despite our efforts to protect our proprietary information through the use of confidentiality and non-disclosure agreements, unauthorized parties may copy aspects of our products or obtain and use information that we regard as proprietary. Other parties may also independently develop know-how or obtain unauthorized access to our technologies.
Intellectual property protection is highly uncertain and involves complex legal and factual questions. Our patents and those for which we have or will license rights may be challenged, invalidated, infringed or circumvented, and the rights granted in those patents may not provide proprietary protection or competitive advantages to us. We and our licensors may not be able to develop patentable products. Even if a patent application is filed, some or all of the patent claims may not be allowed, the patent itself may not issue, or in the event of issuance, the issued claims may not be sufficient to protect the technology owned by or licensed to us.
Third-party patent applications and patents could reduce the coverage of the patents licensed, or that may be licensed to, or owned by us. If patents containing competitive or conflicting claims are issued to third parties, we may be enjoined from the commercialization of products or be required to obtain licenses to these patents or to develop or obtain alternative technology. In addition, other parties may duplicate, design around or independently develop similar or alternative technologies to ours or those of our licensors.
Litigation may be necessary to enforce patents issued or licensed to us or to determine the scope or validity of another party’s proprietary rights. USPTO interference proceedings may be necessary if we and another party both claim to have invented the same subject matter. Even if we ultimately prevail, we could incur substantial costs and our management’s attention would be diverted if:
|
|
▪
|
litigation is required to defend against patent suits brought by third parties;
|
|
|
▪
|
we participate in patent suits brought against or initiated by our licensors;
|
|
|
▪
|
we initiate suits against third parties who are infringing on our patents; or
|
|
|
▪
|
we participate in an interference or other similar USPTO proceeding.
|
However, even if we pursue litigation or other action to protect our intellectual property rights, we may not prevail in any of these actions or proceedings.
Employees
As of December 31, 2014, we had a total of 1,361 full-time employees.
Corporate Information
We incorporated in California under the name Amphastar Pharmaceuticals, Inc. in 1996 and merged our California corporation into Amphastar Pharmaceuticals, Inc., a newly formed Delaware corporation, in 2004. Our corporate offices are located at 11570 6
th
Street, Rancho Cucamonga, CA 91730. Our telephone number is (909) 980-9484. Our Annual Reports on Form 10-K, Quarterly Reports on Form 10-Q, Current Reports on Form 8-K and amendments to those reports filed or furnished pursuant to Section 13(a) or 15(d) of the Securities Exchange Act of 1934, as amended, are available free of charge as soon as reasonably practicable after we electronically file them with, or furnish them to, the SEC. You can access our filings with the SEC by visiting
www.amphastar.com
. The information that is contained on, or can be accessed through our website is not incorporated into this Annual Report on Form 10-K, and the inclusion of our website address is an inactive textual reference only.
We use our website as a channel of distribution for important company information. Important information, including press releases, analyst presentations and financial information regarding us, as well as corporate governance information, is routinely posted and accessible on the “Investors” section of the website, which is accessible by clicking on the tab labeled “Investors” on our website home page. Information on or that can be accessed through our website is not part of this Annual Report on Form 10-K, and the inclusion of our website address is an inactive textual reference only.
|
Risk Factors.
|
Investing in our common stock involves a high degree of risk. You should carefully consider the risks and uncertainties described below, together with all of the other information contained in this Annual Report, including our consolidated financial statements and the related notes thereto. Our future operating results may vary substantially from anticipated results due to a number of risks and uncertainties, many of which are beyond our control. The risks and uncertainties described below are not the only ones we face. Additional risks and uncertainties that we are unaware of, or that we currently believe are not material, may also become important factors that affect us. The following discussion highlights some of these risks and uncertainties and the possible impact of these risks on future results of operations. If any of the following risks occur, our business, financial condition or results of operations could be materially and adversely affected. In that case, the market value of our common stock could decline substantially and you could lose part or all of your investment.
Risks Relating to Our Business and Industry
Our enoxaparin product represents a significant portion of our net revenues. If the sales volume or pricing of this product continues to decline, or if we are unable to satisfy market demand for this product, it could have a material adverse effect on our business, financial position and results of operations.
Sales from our enoxaparin product, which is our largest selling product, represented 51%, 64%, and 63% of our total net revenues for the years ended December 31, 2014, 2013, and 2012, respectively. We are currently experiencing declining revenue from enoxaparin and some of our other existing products and anticipate that we may operate at a loss in the near term while continuing to invest in developing new products. If the sales volume or pricing of enoxaparin continues to decline, or if we are unable to satisfy market demand for this product, our business, financial position and results of operations could be materially and adversely affected, and the market value of our common stock could decline. For example, due to intense pricing competition in the pharmaceutical industry, we have experienced significant declines in the per unit pricing and gross margins attributable to our enoxaparin product since its commercial launch, even during periods where we have increased market share and net revenues. Our enoxaparin product could be rendered obsolete or negatively impacted by numerous factors, many of which are beyond our control, including:
• decreasing average sales prices;
• development by others of new pharmaceutical products that are more effective than ours;
• entrance of new competitors into our markets;
• loss of key relationships with suppliers, group purchasing organizations or end-user customers;
• manufacturing or supply interruptions;
• changes in the prescribing practices of physicians;
• changes in third-party reimbursement practices;
• product liability claims; and
• product recalls or safety alerts.
Any factor adversely affecting the sale of enoxaparin may cause our revenues to decline, and we may not be able to achieve and maintain profitability.
Our success depends on our ability to develop and/or acquire and commercialize additional pharmaceutical products.
Our financial results depend upon our ability to commercialize additional generic and proprietary pharmaceutical products that address unmet medical needs, are accepted by patients and physicians and are reimbursed by payers. Commercialization requires that we successfully and cost-effectively develop, test and manufacture or otherwise acquire both generic and proprietary products. All of our products must receive regulatory approval and meet (and continue to comply with) regulatory and safety standards. If health or safety concerns arise with respect to a product, we may be forced to withdraw it from the market. For example, as a result of environmental concerns over the use of chlorofluorocarbons, or CFCs, the U.S. Food and Drug Administration, or FDA, issued a final rule on January 16, 2009 that required the phase-out of the CFC formulation of our Primatene
®
Mist product by December 31, 2011. As a result, in order to resume selling Primatene
®
Mist we have developed a formulation of the product that will use hydrofluoroalkane, or HFA, as the propellant, and we are now seeking FDA approval for the modified product. There can be no guarantee that our investment in research and development activities will result in FDA approval or produce a commercially viable new product. See the risk factor entitled “The FDA approval process is time-consuming and complicated, and we may not obtain the FDA approval required for a product within the timeline we desire, or at all. Additionally, we may lose FDA approval and/or our products may become subject to foreign regulations.”
The development and commercialization process, particularly with respect to our proprietary products, is time-consuming, costly and involves a high degree of business risk. Our products currently under development, if and when fully developed and tested, may not perform as we expect. Necessary regulatory approvals may not be obtained in a timely manner, if at all, and we may not be able to produce and market such products successfully and profitably. For example, we filed an abbreviated new drug application, or ANDA, for our enoxaparin product in March 2003, but FDA approval was not granted until September 2011 due to delays caused largely by our inclusion in lengthy litigation with Sanofi S.A., or Sanofi, the FDA’s requirement that we perform immunogenicity studies and the receipt of an FDA Warning Letter by the supplier of the starting material for our enoxaparin product, who also became the subject of an FDA Import Alert. Following FDA approval, we became involved in litigation with Momenta Pharmaceuticals, Inc. and Sandoz, Inc., which further delayed the commercial launch of our enoxaparin product until January 2012. Delays in any part of the process, or our inability to obtain regulatory approval of our products, could adversely affect our operating results by restricting or delaying our introduction of new products, which could cause the market value of our products to decline. To the extent that we expend significant resources on research and development efforts and are not able, ultimately, to introduce successful new products as a result of those efforts, our business, financial position and results of operations may be materially and adversely affected, and the market value of our common stock could decline.
Our ability to introduce new generic products also depends upon our success in challenging patent rights held by third parties or in developing non-infringing products. Due to the emergence and development of competing products over time, our overall profitability depends on, among other things, our ability to introduce new products in a timely manner, to continue to manufacture products cost-effectively and to manage the life cycle of our product portfolio. If we are unable to cost-effectively maintain an adequate flow of successful generic and proprietary products and new indications and/or delivery methods for existing products sufficient to cover our substantial research and development costs and the decline in sales of older products that either become subject to generic competition, or are displaced by competing products or therapies, this could have a material adverse effect on our business, financial condition or results of operations.
Our success depends on the integrity of our supply chain, including multiple single source suppliers, the disruption of which could negatively impact our business.
Some of our products are the result of complex manufacturing processes, and some require highly specialized raw materials. Because our business requires outsourcing in some instances, we are subject to inherent uncertainties related to product safety, availability and security. For some of our key raw materials, components and active pharmaceutical ingredient, or API, used in certain of our products, we have only a single, external source of supply, and alternate sources of supply may not be readily available. For example, we purchase heparin USP as the starting material for producing our enoxaparin product exclusively from a single source supplier and, in 2009, this supplier received a Warning Letter from the FDA and was the subject of an FDA Import Alert. The resulting shortage of heparin USP resulted in significant delays to the FDA approval process for our enoxaparin product. There are no guarantees our supplier will not receive Warning Letters in the future or that we will be able to replace this single source supplier with an alternate supplier on a commercially reasonable and timely basis, or at all, to prevent a shortage of heparin USP. Additionally, in 2013 our single source supplier of epinephrine API for our Primatene
®
Mist HFA product candidate received a warning letter from the FDA, which our supplier has since addressed. In the future, it is possible that our suppliers will receive warning letters from the FDA and be unsuccessful in their efforts to address the issues raised in such warning letters on a timely basis, or at all, which would result in delays in commercialization and/or manufacturing of our products or product candidates, if FDA approval for such products or product candidates is received. Furthermore, we may be unable to replace such supplier with an alternate supplier on a commercially reasonable and timely basis, or at all.
If we fail to maintain relationships with our current suppliers, we may not be able to complete development, commercialization or marketing of our products, which would have a material and adverse effect on our business. Third-party suppliers may not perform as agreed or may terminate their agreements with us. For example, because these third parties provide materials to a number of other pharmaceutical companies, they may experience capacity constraints or choose to prioritize one or more of their other customers over us. Any significant problem that our suppliers experience could delay or interrupt our supply of materials until the supplier cures the problem or until we locate, negotiate for, validate and receive FDA approval for an alternative source of supply, if one is available. In the near term, we do not anticipate that the FDA will approve alternative sources to back up our primary suppliers. Therefore, if our primary suppliers become unable or unwilling to manufacture or deliver materials, we could experience protracted delays or interruptions in the supply of materials. This would ultimately delay our manufacture of products for commercial sale, which could materially and adversely affect our development programs, commercial activities, operating results and financial condition.
Additionally, any failure by us to forecast demand for, or to maintain an adequate supply of, the raw material and finished product could result in an interruption in the supply of certain products and a decline in sales of that product.
We face significant competition in the pharmaceutical industry with respect to both our proprietary and generic drugs, which may result in others developing or commercializing products before or more successfully than we do, which could significantly limit our growth and materially and adversely affect our financial results.
Our business operates in the pharmaceutical industry, which is an industry characterized by intense competition. Many of our competitors have longer operating histories and greater financial, research and development, marketing and other resources than we do. Consequently, many of our competitors may be able to develop products and/or processes competitive with, or superior to, our own. We are concentrating the majority of our efforts and resources on developing product candidates utilizing our proprietary technologies. The commercial success of products utilizing such technologies will depend, in large part, on the intensity of competition, labeling claims approved by the FDA for our products compared to claims approved for competitive products and the relative timing and sequence for commercial launch of new products by other companies that compete with our new products. If alternative technologies or other therapeutic approaches are adopted prior to our new product approvals, then the market for our new products may be substantially decreased, thus reducing our ability to generate future profits.
This intensely competitive environment requires an ongoing, extensive search for technological innovations and the ability to market products effectively, including the ability to communicate the effectiveness, safety and value of our products to healthcare professionals in private practice, group practices and managed care organizations. Our competitors vary depending upon product categories, and within each product category, upon dosage strengths and upon drug-delivery systems. Based on total assets, annual revenues and market capitalization, we are smaller than many of our national and international competitors with respect to both our generic and proprietary pharmaceutical products and product candidates. Many of our competitors have been in business for a longer period of time than us, have a greater number of products on the market and have greater financial and other resources than we do. Furthermore, recent trends in this industry are toward further market consolidation of large drug companies into a smaller number of very large entities, further concentrating financial, technical and market strength and increasing competitive pressure in the industry. If we directly compete with them for the same markets and/or products, their financial strength could prevent us from capturing a profitable share of those markets. Smaller companies may also prove to be significant competitors, particularly through collaborative arrangements with large and established companies. It is possible that developments by our competitors will make our products or technologies noncompetitive or obsolete.
If we fail to obtain exclusive marketing rights for our generic pharmaceutical products or fail to introduce these generic products on a timely basis, our revenues, gross margin and operating results may decline significantly.
The Hatch-Waxman amendments to the Federal Food, Drug, and Cosmetic Act, or FFDCA, provide for a period of 180 days of generic marketing exclusivity for any applicant that is first-to-file an ANDA containing a certification of invalidity, non-infringement or unenforceability related to a patent listed with respect to the corresponding brand drug, which we refer to as a Paragraph IV certification. The holder of an approved ANDA containing a Paragraph IV certification that is successful in challenging the applicable brand drug patent(s) is often able to price the applicable generic drug to yield relatively high gross margins during this 180-day marketing exclusivity period. ANDAs that contain Paragraph IV certifications challenging patents, however, generally become the subject of patent litigation that can be both lengthy and costly. There is no certainty that we will prevail in any such litigation, that we will be the first-to-file and granted the 180-day marketing exclusivity period or, if we are granted the 180-day marketing exclusivity period, that we will not forfeit such period. Even where we are awarded marketing exclusivity, we may be required to share our exclusivity period with other ANDA applicants who submit Paragraph IV certifications. In addition, brand companies often authorize a generic version of the corresponding brand drug to be sold during any period of marketing exclusivity that is awarded, which reduces gross margins during the marketing exclusivity period. Brand companies may also reduce the price of their brand product to compete directly with generics entering the market, which similarly would have the effect of reducing gross margins. Furthermore, timely commencement of litigation by the patent owner imposes an automatic stay of ANDA approval by the FDA for 30 months, unless the case is decided in the ANDA applicant’s favor during that period. Finally, if the court’s decision is adverse to the ANDA applicant, the ANDA approval will be delayed until the challenged patent expires, and the applicant will not be granted the 180-day marketing exclusivity.
Accordingly, our revenues and future profitability are dependent, in large part, upon our ability or the ability of our development partners to file ANDAs with the FDA timely and effectively or to enter into contractual relationships with other parties that have obtained marketing exclusivity. We may not be able to develop and introduce successful products in the future within the time constraints necessary to be successful. If we or our development partners are unable to continue to timely and effectively file ANDAs with the FDA or to partner with other parties that have obtained marketing exclusivity, our revenues, gross margin and operating results may decline significantly, and our prospects and business may be materially adversely affected.
Our generic products face, and our generic product candidates will face, additional competitive pressures that are specific to the generic pharmaceutical industry.
With respect to our generic pharmaceutical business, revenues and gross profit derived from the sales of generic pharmaceutical products tend to follow a pattern based on certain regulatory and competitive factors. As patents and exclusivities protecting a brand name product expire, the first manufacturer to receive regulatory approval for a generic version of the product is generally able to achieve significant market penetration. Therefore, our ability to increase or maintain revenues and profitability in our generics business is largely dependent on our success in challenging patents and developing non-infringing formulations of proprietary products. As competing manufacturers receive regulatory approvals on generic products or as brand manufacturers launch generic versions of their products (for which no separate regulatory approval is required), market share, revenues and gross profit typically decline, often significantly and rapidly. Accordingly, the level of market share, revenue and gross profit attributable to a particular generic product normally is related to the number of competitors in that product’s market and the timing of that product’s regulatory approval and launch, in relation to competing approvals and launches. For example, with respect to our enoxaparin product, Sandoz also markets the generic version of enoxaparin, Teva Pharmaceutical Industries Ltd. has received approval from the FDA of its ANDA for its generic enoxaparin product and Hospira, Inc. has filed an ANDA with the FDA for approval of its generic version. The presence of these current and prospective competitive products may have an adverse effect on our market share, revenue and gross profit from our enoxaparin product. Since the commercial launch of our enoxaparin product, we have experienced significant declines in the per unit pricing and gross margins attributable to this product, even as we have increased market share and net revenues. Consequently, we must continue to develop and introduce new generic products in a timely and cost-effective manner to maintain our revenues and gross margins. We may have fewer opportunities to launch significant generic products in the future, as the number and size of proprietary products that are subject to patent challenges is expected to decrease in the next several years compared to historical levels. Additionally, as new competitors enter the market, there may be increased pricing pressure on certain products, which may result in lower gross margins. In addition to our enoxaparin product, we have experienced significant pricing pressure on many of our other products, including Cortrosyn
®
, and we expect this trend to continue in the future.
Competition in the generic drug industry has also increased due to the proliferation of authorized generic pharmaceutical products. “Authorized generics” are generic pharmaceutical products that are introduced by brand companies, either directly or through partnering arrangements with other generic companies. Authorized generics are equivalent to the brand companies’ brand name drugs, but are sold at relatively lower prices than the brand name drugs. An authorized generic product can be marketed during the 180-day exclusivity granted to the first manufacturer or manufacturers to submit an ANDA with a Paragraph IV certification for a generic version of the brand product. The sale of authorized generics adversely impacts the market share of a generic product that has been granted 180-day exclusivity. For example, with respect to our enoxaparin product, Sanofi currently markets an authorized generic enoxaparin product through its subsidiary, Winthrop. This is a significant source of competition for us because brand companies do not face any regulatory barriers to introducing authorized generics of their products. Because authorized generics may be sold during our exclusivity periods, if any, they can materially decrease the profits that we could otherwise receive as an exclusive marketer of a generic alternative. Such actions have the effect of reducing the potential market share and profitability of our generic products and may inhibit us from developing and introducing generic pharmaceutical products corresponding to certain brand name drugs.
Such competition can also result from the entry of generic versions of another product in the same therapeutic class as one of our drugs, or in another competing therapeutic class, or from the compulsory licensing of our products by governments, or from a general weakening of intellectual property laws in certain countries around the world.
If the market for a reference brand product, such as Lovenox
®
, significantly declines, sales or potential sales of our generic and biosimilar products and product candidates may suffer and our business would be materially impacted.
Proprietary products face competition on numerous fronts as technological advances are made or new products are introduced. As new products are approved that compete with the reference proprietary product to our generic products and generic or biosimilar product candidates, such as Lovenox
®
, which is the reference brand product for our enoxaparin product, sales of the reference brand products may be significantly and adversely impacted and may render the reference brand product obsolete. In addition, brand companies may pursue life cycle management strategies that also impact our generic products.
If the market for a reference brand product is impacted, we in turn may lose significant market share or market potential for our generic or biosimilar products and product candidates, and the value for our generic or biosimilar pipeline could be negatively impacted. As a result, our business, including our financial results and our ability to fund future discovery and development programs, would suffer.
Health care providers may not be receptive to our products, particularly those that incorporate our proprietary drug delivery platforms.
The commercial success of our products will depend on acceptance by health care providers and others that such products are clinically effective, affordable and safe. Our products utilizing our proprietary drug delivery technologies may not be accepted by health care providers and others. Factors that may materially affect market acceptance of our products include but are not limited to:
• the relative therapeutic advantages and disadvantages of our products compared to competitive products;
• the relative timing of commercial launch of our products compared to competitive products;
• the relative safety and efficacy of our products compared to competitive products;
• the product labeling approved by the FDA for our products and for competing products;
• the willingness of third party payers to reimburse for our prescription products;
• the willingness of pharmacy chains to stock our new products; and
• the willingness of consumers to pay for our products.
Our products, if successfully developed and commercially launched, will compete with both currently marketed products and new products launched in the future by other companies. Health care providers may not accept or utilize some of our products. Physicians and other prescribers may not be inclined to prescribe our prescription products unless our products demonstrate commercially viable advantages over other products currently marketed for the same indications. Pharmacy chains may not be willing to stock certain of our new products, and pharmacists may not recommend such products to consumers. Further, consumers may not be willing to purchase some of our products. If our products do not achieve market acceptance, we may not be able to generate significant revenues or become profitable.
If we are unable to maintain our group purchasing organization relationships, our revenues could decline and future profitability could be jeopardized.
Many of the existing and potential customers for our products have combined to form group purchasing organizations in an effort to lower costs. Group purchasing organizations negotiate pricing arrangements with medical supply manufacturers and distributors, and these negotiated prices are made available to a group purchasing organization’s affiliated hospitals and other members. Group purchasing organizations provide end-users access to a broad range of pharmaceutical products from multiple suppliers at competitive prices and, in certain cases, exercise considerable influence over the drug purchasing decisions of such end-users. Hospitals and other end-users contract with the group purchasing organization of their choice for their purchasing needs. We currently derive, and expect to continue to derive, our revenue from end-user customers that are members of group purchasing organizations. Maintaining our strong relationships with these group purchasing organizations will require us to continue to be a reliable supplier, offer a broad product line, remain price competitive, comply with FDA regulations and provide high-quality products. Although our group purchasing organization pricing agreements are typically multi-year in duration, most of them may be terminated by either party with 60 or 90 days’ notice. The group purchasing organizations with which we have relationships may have relationships with manufacturers that sell competing products, and such group purchasing organizations may earn higher margins from these competing products or combinations of competing products or may prefer products other than ours for other reasons. If we are unable to maintain our group purchasing organization relationships, sales of our products and revenue could decline.
Although we reported net income for fiscal 2013 and fiscal 2012, we incurred losses for fiscal 2014.
We recorded a net loss of $10.7 million for the year ended December 31, 2014, compared with net income of $11.9 million and $18.1 million for the years ended December 31, 2013 and 2012, respectively. This loss resulted principally from a decrease in profit sharing revenues under our profit sharing agreement with Actavis, Inc., or Actavis, under which Actavis markets and distributes our enoxaparin product to the retail market in the U.S. We may continue to incur operating and net losses and negative cash flow from operations. Our business may generate operating losses to the extent Actavis reports decreased profit levels on their determined sales volumes and product pricing for enoxaparin, if we are unable to maintain and expand our relationships with group purchasing organizations or if we do not successfully commercialize our product candidates and generate sufficient revenues to support our level of operating expenses. Because of the numerous risks and uncertainties associated with our profit sharing agreement, our commercialization efforts and future product development, we are unable to predict whether we will be able to achieve and maintain profitability.
Consolidation in the health care industry could lead to demands for price concessions or for the exclusion of some suppliers from certain of our markets, which could have an adverse effect on our business, financial condition or results of operations.
Because health care costs have risen significantly, numerous initiatives and reforms by legislatures, regulators and third-party payers to curb these cost increases have resulted in a trend in the health care industry to consolidate product suppliers and purchasers. As the health care industry consolidates, competition among suppliers to provide products to purchasers has become more intense. This in turn has resulted and will likely continue to result in greater pricing pressures and the exclusion of certain suppliers from important market segments as group purchasing organizations and large single accounts continue to use their market power to influence product pricing and purchasing decisions. As the U.S. payer market concentrates further and as more drugs become available in generic form, biopharmaceutical companies may face greater pricing pressure from private third-party payers, who will continue to drive more of their patients to use lower cost generic alternatives. This drive towards generic alternatives could adversely affect sales of our proprietary products and increase competition among generic manufacturers.
Sales of our products may be adversely affected by the continuing consolidation of our customer base.
A significant proportion of our sales are made to relatively few U.S. wholesalers and group purchasing organizations. These customers are continuing to undergo significant consolidation. Sales to three of these customers for the years ended December 31, 2014, 2013, and 2012, respectively, accounted for approximately 51%, 54%, and 53% of our total net revenues, respectively. Such consolidation has provided and may continue to provide them with additional purchasing leverage, and consequently may increase the pricing pressures that we face. Additionally, the emergence of large buying groups representing independent retail pharmacies, and the prevalence and influence of managed care organizations and similar institutions, enable those groups to extract price discounts on our products.
Moreover, we are exposed to a concentration of credit risk as a result of this concentration among our customers. If one or more of our major customers experienced financial difficulties, the effect on us would be substantial. This could have a material adverse effect on our business, financial condition and results of operations.
Our net sales and quarterly growth comparisons may also be affected by fluctuations in the buying patterns of retail chains, major distributors and other trade buyers, whether resulting from seasonality, pricing, wholesaler buying decisions or other factors. In addition, because a significant portion of our U.S. revenues is derived from relatively few customers, any financial difficulties experienced by a single customer, or any delay in receiving payments from a single customer, could have a material adverse effect on our business, financial condition and results of operations.
If our business partners do not fulfill their obligations with respect to our distribution or collaboration agreements our revenues and our business will suffer.
Pursuant to certain distribution or collaboration agreements, the success of some of our products or product candidates also depends on the success of the collaboration with our business partners, who are responsible for certain aspects of researching, developing, marketing, distributing or commercializing our products or product candidates. If such an agreement were to be terminated in accordance with its terms, including due to a party’s failure to perform its obligations or responsibilities under the agreement, revenues could be delayed or diminished from these products and our revenues and/or profit share for these products could be adversely impacted.
For example, we have a profit sharing agreement with Actavis to market and distribute our enoxaparin product to the retail market in the U.S. If Actavis fails to commit sufficient resources to market and distribute our products to the retail market, our profit sharing revenue from retail sales of enoxaparin could be severely impacted.
The revenues we earn and report from our profit sharing agreement with Actavis are subject to their marketing, pricing and reporting practices.
Under the terms of our profit sharing agreement, Actavis markets and distributes our enoxaparin product to the retail market in the U.S., we share in the profits from these activities as reported to us by Actavis. Accordingly, the amounts of profit sharing revenues we recognize each period are subject to Actavis’ marketing, pricing and reporting practices. To the extent Actavis reports varying profit levels on their determined sales volumes and product pricing, our profit sharing revenue from retail sales of enoxaparin, financial position, results of operations and cash flows could be materially impacted.
We depend upon our key personnel, the loss of whom could adversely affect our operations. If we fail to attract and retain the talent required for our business, our business could be materially harmed.
We depend to a significant degree on our key management employees, including our Chief Executive Officer and Chief Science Officer, Jack Y. Zhang; Chief Operating Officer and Chief Scientist, Mary Z. Luo; President, Jason B. Shandell; Chief Financial Officer and Senior Vice President, William J. Peters; and Corporate Executive Vice President of Operations and President, International Medication Systems, Ltd., Marilyn J. Purchase. The loss of services from any of these persons may significantly delay or prevent the achievement of our product development or business objectives. Our officers all serve “at will” and we or they can terminate their employment with us at any time. We do not carry key man life insurance on any key personnel. Competition among pharmaceutical companies for qualified employees is intense, and the ability to attract and retain qualified individuals is critical to our success. We have experienced attrition among our executive officers in the past, although we do not believe that the departures of executive officers have had a materially adverse effect on our business. However, any future loss of key members of our organization, or any inability to continue to attract high-quality employees, may delay or prevent the achievement of major business objectives. Our productivity may be adversely affected if we do not integrate or train our new employees quickly and effectively.
Competition for highly-skilled personnel is often intense, especially in Southern California, where we have a substantial presence and need for highly-skilled personnel. We may not be successful in attracting, integrating or retaining qualified personnel to fulfill our current or future needs. Also, to the extent we hire personnel from competitors, we may be subject to allegations that we have improperly solicited, or that they have divulged proprietary or other confidential information, or that their former employers own their inventions or work product.
Because a portion of our future manufacturing is expected to take place in China, a significant disruption in the construction or operation of our manufacturing facility in China or political unrest in China could materially and adversely affect our business, financial condition and results of operations.
We intend to invest in the expansion of our manufacturing facility in China. Any disruption in construction of the facility or the inability of our manufacturing facility in China to produce adequate quantities of raw materials or APIs to meet our needs, whether as a result of a natural disaster or other causes, could impair our ability to operate our business. Furthermore, since this facility is located in China, we are exposed to the possibility of product supply disruption and increased costs in the event of changes in the policies of the Chinese government, political unrest or unstable economic conditions in China. The nationalization or other expropriation of private enterprises by the Chinese government could result in the total loss of our investment in China. Any of these matters could materially and adversely affect our business and results of operations. These interruptions or failures could also impede commercialization of our product candidates and impair our competitive position.
We are exposed to risks related to our international operations and failure to manage these risks may adversely affect our operating results and financial condition.
We have operations both inside and outside the U.S. For example, we have suppliers in Asia and Europe, and we own manufacturing facilities in Nanjing, China and Éragny-sur-Epte, France. As a result, a significant portion of our operations are conducted by and/or rely on entities outside the markets in which our products are sold, and, accordingly, we import a substantial number of products into such markets. We may, therefore, be denied access to our customers or suppliers or denied the ability to ship products from any of our sites as a result of a closing of the borders of the countries in which we sell our products, or in which our operations are located, due to economic, legislative, political and military conditions in such countries.
International operations are subject to a number of other inherent risks, and our future results could be adversely affected by a number of factors, including:
|
•
|
requirements or preferences for domestic products or solutions, which could reduce demand for our products;
|
|
•
|
differing existing or future regulatory and certification requirements;
|
|
•
|
management communication and integration problems resulting from cultural and geographic dispersion;
|
|
•
|
greater difficulty in collecting accounts receivable and longer collection periods;
|
|
•
|
difficulties in enforcing contracts;
|
|
•
|
difficulties and costs of staffing and managing non-U.S. operations;
|
|
•
|
the uncertainty of protection for intellectual property rights in some countries;
|
|
•
|
tariffs and trade barriers, export regulations and other regulatory and contractual limitations on our ability to sell our products;
|
|
•
|
greater risk of a failure of foreign employees to comply with both U.S. and foreign laws, including export and antitrust regulations, the U.S. Foreign Corrupt Practices Act and any trade regulations ensuring fair trade practices;
|
|
•
|
uneven electricity supply that can negatively impact manufacturing;
|
|
•
|
heightened risk of unfair or corrupt business practices in certain geographies and of improper or fraudulent sales arrangements that may impact financial results and result in restatements of, or irregularities in, financial statements;
|
|
•
|
potentially adverse tax consequences, including multiple and possibly overlapping tax structures; and
|
|
•
|
political and economic instability, political unrest and terrorism.
|
In addition, the expansion of our existing international operations, including our facility expansion in Nanjing, China, and entry into additional international markets, including our recent acquisition of a manufacturing business in Éragny-sur-Epte, France, have required and will continue to require significant management attention and financial resources. These and other factors could harm our ability to gain future revenues and, consequently, materially impact our business, operations results and financial condition.
The Chinese government may exert substantial influence over the manner in which we conduct our business operations in China.
The Chinese government has exercised, and continues to exercise, substantial control over virtually every sector of the Chinese economy through regulation and state ownership. Our ability to conduct our proposed manufacturing operations in China may be harmed by changes in its laws and regulations, including those relating to taxation, import and export tariffs, environmental regulations, land use rights, property ownership and other matters. We believe that our operations in China are in material compliance with all applicable legal and regulatory requirements. However, the central or local governments of the jurisdictions in which we operate may impose new, stricter regulations or interpretations of existing regulations that would require additional expenditures and efforts on our part to ensure our compliance with such regulations or interpretations. Accordingly, government actions in the future, including any decision not to continue to support recent economic reforms and to return to a more centrally planned economy or regional or local variations in the implementation of economic policies, could have a significant effect on economic conditions in China or particular regions thereof and could require us to divest ourselves of any interest we then hold in Chinese properties or entities, including our Chinese operating subsidiary, Amphastar Nanjing Pharmaceuticals Co., Ltd., or ANP.
The Chinese legal system can be uncertain and could limit the legal protections available to us.
Unlike common law systems, such as the United States, the Chinese legal system is based on written statutes and decided legal cases have little precedential value. Our Chinese operating subsidiary, ANP, is subject to laws and regulations applicable to foreign investment in China in general and laws and regulations applicable to foreign invested enterprises in particular. ANP is also subject to laws and regulations governing the formation and conduct of domestic Chinese companies. Relevant Chinese laws, regulations and legal requirements may change frequently, and their interpretation and enforcement involve uncertainties. For example, we may have to resort to administrative and court proceedings to enforce the legal protections under law or contract. However, since Chinese administrative and court authorities have significant discretion in interpreting and implementing statutory and contract terms, it may be more difficult to evaluate the outcome of administrative and court proceedings and our level of legal protection in China compared to other legal systems. Such uncertainties, including the inability to enforce our contracts and intellectual property rights, could materially and adversely affect our business and operations. In addition, confidentiality protections in China may not be as effective as in the U.S. or other countries. Accordingly, future developments in the Chinese legal system, including the promulgation of new laws, changes to existing laws or the interpretation or enforcement thereof, or the preemption of local requirements by national laws, could limit the legal protections available to us.
We could be materially and adversely affected by violations of the U.S. Foreign Corrupt Practices Act and similar worldwide anti-bribery laws.
The U.S. Foreign Corrupt Practices Act and similar worldwide anti-bribery laws generally prohibit companies and their intermediaries from making improper payments to non-U.S. officials for the purpose of obtaining or retaining business. Our policies mandate compliance with these anti-bribery laws, which often carry substantial penalties. We are currently expanding our operation abroad, including expanding our facilities in China, a country which has experienced governmental and private sector corruption to some degree, and in certain circumstances, strict compliance with anti-bribery laws may conflict with certain local customs and practices. Our internal control policies and procedures may not always protect us from reckless or other inappropriate acts committed by our affiliates, employees or agents. Violations of these laws, or allegations of such violations, could have a material adverse effect on our business, financial position and results of operations and could cause the market value of our common stock to decline.
Movements in foreign currency exchange rates could have a material adverse effect on our business, financial position and results of operations and could cause the market value of our common stock to decline.
A portion of our revenues, indebtedness and other liabilities and our costs are denominated in foreign currencies, including the Chinese Yuan and the Euro. We report our financial results in U.S. dollars. Our results of operations and, in some cases, cash flows may in the future be adversely affected by certain movements in exchange rates. From time to time, we may implement currency hedges intended to reduce our exposure to changes in foreign currency exchange rates. However, our hedging strategies may not be successful, and any of our unhedged foreign exchange exposures will continue to be subject to market fluctuations. These risks could cause a material adverse effect on our business, financial position and results of operations and could cause the market value of our common stock to decline.
We may be exposed to product liability claims and may not be able to obtain or maintain adequate product liability insurance.
Our business exposes us to potential product liability risks, which are inherent in the testing, manufacturing, marketing and sale of pharmaceutical products. Product liability claims might be made by patients, health care providers or others who sell or consume our products. These claims may be made even with respect to those products that possess regulatory approval for commercial sale.
Our reputation is the foundation of our relationships with physicians, patients, group purchasing organizations and other customers. If we are unable to effectively manage real or perceived issues that could negatively impact sentiments toward us, our business could suffer. Our customers may have a number of concerns about the safety of our products whether or not such concerns have a basis in generally accepted science or peer-reviewed scientific research. These concerns may be increased by negative publicity, even if the publicity is inaccurate. Any negative publicity, whether accurate or inaccurate, about the efficacy, safety or side effects of our products or product categories, whether involving us, a competitor or a reference drug, could materially reduce market acceptance of our products, cause consumers to seek alternatives to our products, result in product withdrawals and cause our stock price to decline. Negative publicity could also result in an increased number of product liability claims, whether or not these claims have a basis in scientific fact.
We currently maintain a $10.0 million product liability insurance policy, which covers Amphastar, International Medication Systems, Ltd., or IMS, and Amphastar France Pharmaceuticals S.A.S., or AFP products, but our insurance coverage may not reimburse us or may not be sufficient to reimburse us for all expenses or losses we may suffer from any product liability claims. Moreover, insurance coverage is becoming increasingly expensive and, in the future, we may not be able to maintain insurance coverage at a reasonable cost or in sufficient amounts to protect us against losses. Large judgments have been awarded in class action lawsuits based on drug products that had unanticipated side effects. A successful product liability claim or series of claims brought against us could cause our stock price to fall and, if judgments exceed our insurance coverage, could decrease our cash and adversely affect our business.
If serious adverse events or deaths are identified relating to any of our products once they are on the market, we may be required to withdraw our products from the market, which would hinder or preclude our ability to generate revenues.
We are required to report to relevant regulatory authorities adverse events or deaths associated with our product candidates or approved products. Based on such events, regulatory authorities may withdraw their approvals of such products or take enforcement actions. We may be required to reformulate our products, and/or we may have to recall the affected products from the market and may not be able to reintroduce them into the market. Furthermore, our reputation in the marketplace may suffer and we may become the target of lawsuits, including class actions suits. Any of these events could harm or prevent sales of the affected products and could have a material adverse effect upon our business and financial condition.
Any acquisitions of technologies, products and businesses may be difficult to integrate, could adversely affect our relationships with key customers and/or could result in significant charges to earnings.
We plan to regularly review potential acquisitions of technologies, products and businesses complementary to our business. Acquisitions typically entail many risks and could result in difficulties in integrating operations, personnel, technologies and products. If we are not able to successfully integrate our acquisitions, we may not obtain the advantages and synergies that the acquisitions were intended to create, which may have a material adverse effect on our business, results of operations, financial condition and cash flows, our ability to develop and introduce new products and the market price of our stock. In addition, in connection with acquisitions, we could experience disruption in our business, technology and information systems, customer or employee base, including diversion of management’s attention from our continuing operations. There is also a risk that key employees of companies that we acquire or key employees necessary to successfully commercialize technologies and products that we acquire may seek employment elsewhere, including with our competitors. Furthermore, there may be overlap between our products or customers and the companies that we acquire that may create conflicts in relationships or other commitments detrimental to the integrated businesses. If we are unable to successfully integrate technologies, products, businesses or personnel that we acquire, we could incur significant impairment charges or other adverse financial consequences.
Identifying, executing and realizing attractive returns on acquisitions is highly competitive and involves a high degree of uncertainty. We expect to encounter competition for potential target businesses from both strategic and financial buyers. Some of these competitors may be well established and have extensive experience in identifying and consummating business combinations. Some of these competitors may possess greater technical, human and other resources than us, and our financial resources may be relatively limited when contrasted with those of our competitors. We may lose acquisition opportunities if we do not match our competitors’ pricing, terms and structure criteria for such acquisitions. If we are forced to match these criteria to make acquisitions, we may not be able to achieve acceptable returns on our acquisitions or may bear substantial risk of capital loss. In addition, target companies may not be willing to sell assets at valuations which are attractive to us. Furthermore, the terms of our existing or future indebtedness may hinder or prevent us from making additional acquisitions of technologies, products or businesses. Because of these factors, we may not be able to consummate an acquisition on attractive terms, if at all.
We intend to conduct an extensive due diligence investigation for any business we consider acquiring. Intensive due diligence is often time consuming and expensive due to the operations, finance and legal professionals who may be involved in the due diligence process. Even if we conduct extensive due diligence on a target business which we acquire, we may not identify all material issues that are present inside a particular target business. If our due diligence fails to discover or identify material issues relating to a target business, industry or the environment in which the target business operates, we may be forced to later write-down or write-off assets, restructure the target business’s operations or incur impairment or other charges that could result in losses to us.
Charges to earnings resulting from acquisitions could have a material adverse effect on our business, financial position and results of operations and could cause the market value of our common stock to decline.
Under U.S. generally accepted accounting principles, or GAAP, business combination accounting standards, we recognize the identifiable assets acquired, the liabilities assumed and any non-controlling interests in acquired companies generally at their acquisition date fair values and, in each case, separately from goodwill. Goodwill as of the acquisition date is measured as the excess amount of consideration transferred, which is also generally measured at fair value, and the net of the acquisition date amounts of the identifiable assets acquired and the liabilities assumed. Our estimates of fair value are based upon assumptions believed to be reasonable but which are inherently uncertain. After we complete an acquisition, the following factors could result in material charges and adversely affect our operating results and may adversely affect our cash flows:
|
•
|
costs incurred to combine the operations of companies we acquire, such as transitional employee expenses and employee retention, redeployment or relocation expenses;
|
|
•
|
impairment of goodwill or intangible assets, including acquired in-process research and development;
|
|
•
|
amortization of intangible assets acquired;
|
|
•
|
a reduction in the useful lives of intangible assets acquired;
|
|
•
|
identification of or changes to assumed contingent liabilities, including, but not limited to, contingent purchase price consideration, income tax contingencies and other non-income tax contingencies, after our final determination of the amounts for these contingencies or the conclusion of the measurement period (generally up to one year from the acquisition date), whichever comes first;
|
|
•
|
charges to our operating results to eliminate certain duplicative pre-acquisition activities, to restructure our operations or to reduce our cost structure;
|
|
•
|
charges to our operating results resulting from expenses incurred to effect the acquisition; and
|
|
•
|
changes to contingent consideration liabilities, including accretion and fair value adjustments.
|
A significant portion of these adjustments could be accounted for as expenses that will decrease our net income and earnings per share for the periods in which those costs are incurred. Such charges could cause a material adverse effect on our business, financial position and results of operations and could cause the market value of the common stock to decline.
The Affordable Care Act and certain new legislation and regulatory proposals may increase our costs of compliance and negatively impact our profitability over time.
In March 2010, President Barack Obama signed the Patient Protection and Affordable Care Act, as amended by the Health Care and Education Affordability Reconciliation Act, which we refer to collectively as the Affordable Care Act. The Affordable Care Act makes extensive changes to the delivery of health care in the U.S. We expect that the rebates, discounts, taxes and other costs resulting from the Affordable Care Act over time will have a negative effect on our expenses and profitability in the future. Furthermore, the Independent Payment Advisory Board created by the Affordable Care Act to reduce the per capita rate of growth in Medicare spending could potentially limit access to certain treatments or mandate price controls for our products. Moreover, expanded government investigative authority and increased disclosure obligations may increase the cost of compliance with new regulations and programs.
Congress has also proposed a number of legislative initiatives, including possible repeal of the Affordable Care Act. At this time, it remains unclear whether there will be any changes made to the Affordable Care Act, whether to certain provisions or its entirety. In addition, some details regarding the implementation of the Affordable Care Act are yet to be determined, and, at this time, the full effect that the Affordable Care Act would have on our business remains unclear.
In addition, other legislative changes have been proposed and adopted since the Affordable Care Act was enacted. For example, on August 2, 2011, the President signed into law the Budget Control Act of 2011, which, among other things, created the Joint Select Committee on Deficit Reduction to recommend proposals in spending reductions to Congress. As a result of the failure of the Joint Select Committee to propose, and of Congress to enact, deficit reduction measures of at least $1.2 trillion for the years 2013 through 2021, the Budget Control Act provides for automatic cuts to be made to most federal government programs, which, with respect to Medicare, would include aggregate reductions to Medicare payments to providers of up to 2% per fiscal year, starting in 2013. Pursuant to the American Taxpayer Relief Act of 2012, which was enacted by Congress on January 1, 2013, the imposition of these automatic cuts began April 1, 2013. In addition, the new law, among other things, reduces Medicare inpatient payment amounts to hospitals and increases the statute of limitations for recovering overpayments from three years to five years. The full impact on our business of this new law, assuming it is implemented, is uncertain. Nor is it clear whether other legislative changes will be adopted or how such changes would affect the demand for our products.
In addition, there have been a number of other legislative and regulatory proposals aimed at changing the pharmaceutical industry. In particular, California has enacted legislation that requires development of an electronic pedigree to track and trace each prescription drug at the saleable unit level through the distribution system. California’s electronic pedigree requirement is scheduled to take effect in January 2015. Compliance with California and future federal or state electronic pedigree requirements may increase our operational expenses and impose significant administrative burdens. As a result of these and other new proposals, we may determine to change our current manner of operation, provide additional benefits or change our contract arrangements, any of which could have a material adverse effect on our business, financial condition and results of operations.
President Barack Obama also signed into law the Food and Drug Administration Safety and Innovation Act. The new law and related agreements make several significant changes to the FFDCA and FDA’s processes for reviewing marketing applications that could have a significant impact on the pharmaceutical industry, including, among other things, the following:
|
•
|
reauthorizes the Prescription Drug User Fee Act, which increases the amount of associated user fees, and, for certain types of applications, increases the expected time frame for FDA review of new drug applications, or NDAs;
|
|
•
|
permanently reauthorizes and makes some revisions to the Best Pharmaceuticals for Children Act and the Pediatric Research Equity Act, which provide for pediatric exclusivity and mandated pediatric assessments for certain types of applications, respectively;
|
|
•
|
revises certain standards and requirements for FDA inspections of manufacturing facilities and the importation of drug products from foreign countries;
|
|
•
|
creates incentives for the development of certain antibiotic drug products;
|
|
•
|
modifies the standards for accelerated approval of certain new medical treatments;
|
|
•
|
expands the reporting requirements for potential and actual drug shortages;
|
|
•
|
requires the FDA to issue a report on, among other things, ensuring the safety of prescription drugs that have the potential for abuse;
|
|
•
|
requires the FDA to hold a public meeting regarding the potential rescheduling of drug products containing hydrocodone, which was held in October 2012; and
|
|
•
|
requires electronic submission of certain marketing applications following the issuance of final FDA regulations.
|
The full impact on our business of the new laws is uncertain; however, we anticipate that it will have an adverse effect on our results of operations.
Additionally, we encounter similar regulatory and legislative issues in most other countries. In the European Union, or EU, and some other international markets, the government provides health care at low cost to consumers and regulates pharmaceutical prices, patient eligibility or reimbursement levels to control costs for the government-sponsored health care system. This international system of price regulations may lead to inconsistent prices.
If significant additional reforms are made to the U.S. health care system, or to the health care systems of other markets in which we operate, those reforms could have a material adverse effect on our business, financial position and results of operations and could cause the market value of our common stock to decline.
Global macroeconomic conditions may negatively affect us and may magnify certain risks that affect our business.
Our business is sensitive to general economic conditions, both inside and outside the U.S. Slower global economic growth, credit market crises, high levels of unemployment, reduced levels of capital expenditures, government deficit reduction, sequestration and other austerity measures and other challenges affecting the global economy adversely affect us and our distributors, customers and suppliers. It is uncertain how long these effects will last, or whether economic and financial trends will worsen or improve. Such uncertain economic times may have a material adverse effect on our revenues, results of operations, financial condition and, if circumstances worsen, our ability to raise capital at reasonable rates. If slower growth in the global economy or in any of the markets we serve continues for a significant period, if there is significant deterioration in the global economy or such markets or if improvements in the global economy don’t benefit the markets we serve, our business and financial statements could be adversely affected.
Additionally, as a result of the current or a future global economic downturn, our third-party payers may delay or be unable to satisfy their reimbursement obligations. Sales of our principal products are dependent, in part, on the availability and extent of reimbursement from third-party payers, including government programs such as Medicare and Medicaid and private payer healthcare and insurance programs. A reduction in the availability or extent of reimbursement from government and/or private payer healthcare programs could have a material adverse effect on the sales of our products, our business and results of operations.
Current economic conditions may adversely affect the ability of our distributors, customers, suppliers and service providers to obtain the liquidity required to pay for our products, or otherwise to buy necessary inventory or raw materials, and to perform their obligations under agreements with us, which could disrupt our operations, and could negatively impact our business and cash flow. Although we make efforts to monitor these third parties’ financial condition and their liquidity, our ability to do so is limited, and some of them may become unable to pay their bills in a timely manner, or may even become insolvent, which could negatively impact our business and results of operations. These risks may be elevated with respect to our interactions with third parties with substantial operations in countries where current economic conditions are the most severe, particularly where such third parties are themselves exposed to sovereign risk from business interactions directly with fiscally-challenged government payers.
At the same time, significant changes and volatility in the financial markets, in the consumer and business environment, in the competitive landscape and in the global political and security landscape make it increasingly difficult for us to predict our revenues and earnings into the future. As a result, any revenue or earnings guidance or outlook which we have given or might give may be overtaken by events, or may otherwise turn out to be inaccurate. Though we endeavor to give reasonable estimates of future revenues and earnings at the time we give such guidance, based on then-current conditions, there is a significant risk that such guidance or outlook will turn out to be, or to have been, incorrect.
Significant balances of intangible assets, including goodwill, are subject to impairment testing and may result in impairment charges, which may materially and adversely affect our results of operations and financial condition.
A significant amount of our total assets is related to goodwill and intangible assets. As of December 31, 2014 the value of our goodwill and intangible assets net of accumulated amortization was $42.6 million. Goodwill and other intangible assets are tested for impairment annually when events occur or circumstances change that could potentially reduce the fair value of the reporting unit or intangible asset. Impairment testing compares the fair value of the reporting unit or intangible asset to its carrying amount. For example, for the year ended December 31, 2012 we had an impairment charge of $2.1 million primarily related to equipment for a production project that was suspended. Any future goodwill or other intangible asset impairment, if any, would be recorded in operating income and could have a material adverse effect on our results of operations and financial condition.
Our outstanding loan agreements contain restrictive covenants that may limit our operating flexibility.
Our loan agreements are collateralized by substantially all of our presently existing and subsequently acquired personal property assets, and subject us to certain affirmative and negative covenants, including limitations on our ability to transfer or dispose of assets, merge with or acquire other companies, make investments, pay dividends, incur additional indebtedness and liens and conduct transactions with affiliates. We are also subject to certain covenants that require us to maintain certain financial ratios and are required under certain conditions to make mandatory prepayments of outstanding principal. As a result of these covenants and ratios, we have certain limitations on the manner in which we can conduct our business, and we may be restricted from engaging in favorable business activities or financing future operations or capital needs until our current debt obligations are paid in full or we obtain the consent of our lenders, which we may not be able to obtain. We may not be able to generate sufficient cash flow or revenue to meet the financial covenants or pay the principal and interest on our debt. In addition, upon the occurrence of an event of default, our lenders, among other things, can declare all indebtedness due and payable immediately, which would adversely impact our liquidity and reduce the availability of our cash flows to fund working capital needs, capital expenditures and other general corporate purposes. An event of default includes our failure to pay any amount due and payable under the loan agreements, the occurrence of a material adverse change in our business as defined in the loan agreements, our breach of any covenant in the loan agreements, subject to a grace period in some cases, or an involuntary insolvency proceeding. Additionally, a lender could exercise its lien on substantially all of our assets and our future working capital, borrowings or equity financing may not be available to repay or refinance any such debt.
As a public company, we are obligated to develop and maintain adequate internal controls and be able, on an annual basis, to provide an assertion as to the effectiveness of such controls. Failure to maintain adequate internal controls or to implement new or improved controls could have a material adverse effect on our business, financial position and results of operations and could cause the market value of our common stock to decline.
Ensuring that we have adequate internal financial and accounting controls and procedures in place so that we can produce accurate financial statements on a timely basis is a costly and time-consuming effort. Our internal control over financial reporting is designed to provide reasonable assurance regarding the reliability of financial reporting and the preparation of financial statements in accordance with GAAP. We are in the very early stages of the costly and challenging process of compiling the system and processing documentation necessary to perform the evaluation needed to comply with Section 404 of the Sarbanes-Oxley Act of 2002. We may not be able to complete our evaluation, testing and any required remediation in a timely fashion. During the evaluation and testing process, if we identify one or more material weaknesses in our internal control over financial reporting, we will be unable to assert that our internal controls are effective.
If we are unable to assert that our internal control over financial reporting is effective, we could lose investor confidence in the accuracy and completeness of our financial reports, which would cause the price of our common stock to decline, and we may be subject to investigation or sanctions by the Securities and Exchange Commission, or SEC.
We are required to disclose changes made in our internal control and procedures on a quarterly basis. However, our independent registered public accounting firm will not be required to report on the effectiveness of our internal control over financial reporting pursuant to Section 404 of the Sarbanes-Oxley Act until the later of the year following our first annual report required to be filed with the SEC, or the date we are no longer an “emerging growth company” as defined in the JOBS Act if we take advantage of the exemptions contained in the JOBS Act. At such time, our independent registered public accounting firm may issue a report that is adverse in the event it is not satisfied with the level at which our controls are documented, designed or operating. Our remediation efforts may not enable us to avoid a material weakness in the future.
Additionally, to comply with the requirements of being a public company, we may need to undertake various actions, such as implementing new internal controls and procedures and hiring accounting or internal audit staff, which may adversely affect our operating results and financial condition.
There are inherent uncertainties involved in estimates, judgments and assumptions used in the preparation of financial statements in accordance with GAAP. Any future changes in estimates, judgments and assumptions used or necessary revisions to prior estimates, judgments or assumptions or changes in accounting standards could lead to a restatement or revision to previously consolidated financial statements, which could have a material adverse effect on our business, financial position and results of operations and could cause the market value of our common stock to decline.
The preparation of financial statements in conformity with GAAP requires management to make estimates and assumptions that affect the amounts reported in the consolidated financial statements and accompanying notes. We base our estimates on historical experience and on various other assumptions that we believe to be reasonable under the circumstances, as discussed in greater detail in the section titled “Management’s Discussion and Analysis of Financial Condition and Results of Operations” the results of which form the basis for making judgments about the carrying values of assets and liabilities that are not readily apparent from other sources. Our operating results may be adversely affected if our assumptions change or if actual circumstances differ from those in our assumptions, which could cause our operating results to fall below the expectations of securities analysts and investors, resulting in a decline in our stock price. Significant assumptions and estimates used in preparing our consolidated financial statements include those related to revenue recognition, provision for wholesaler chargebacks, accruals for product returns, valuation of inventory, impairment of intangibles and long-lived assets, accounting for income taxes and share-based compensation. Furthermore, although we have recorded reserves for litigation related contingencies based on estimates of probable future costs, such litigation related contingencies could result in substantial further costs. Also, any new or revised accounting standards may require adjustments to previously issued financial statements. Any such changes could result in corresponding changes to the amounts of liabilities, revenues, expenses and income. Any such changes could have a material adverse effect on our business, financial position and results of operations and could cause the market value of our common stock to decline.
Changes in financial accounting standards or practices can have a significant effect on our reported results and may even affect our reporting of transactions completed before the change is effective. New accounting pronouncements and varying interpretations of accounting pronouncements have occurred and may occur in the future. Changes to existing rules or the questioning of current practices may adversely affect our business and financial results.
Changes in income tax laws, tax rulings and other factors may have a significantly adverse impact on our effective tax rate and tax expense, which could have a material adverse effect on our business, financial position and results of operations and could cause the market value of our common stock to decline.
Potential changes to income tax laws in the U.S. include measures which would defer the deduction of interest expense related to deferred income; determine the foreign tax credit on a pooling basis; tax currently excess returns associated with transfers of intangibles offshore; and limit earnings stripping by expatriated entities. In addition, proposals were made to encourage manufacturing in the U.S., including reduced rates of tax and increased deductions related to manufacturing. We cannot determine whether these proposals will be modified or enacted, whether other proposals unknown at this time will be made or the extent to which the corporate tax rate might be reduced and ameliorate the adverse impact of some of these proposals. If enacted, and depending on its precise terms, such legislation could materially increase our overall effective income tax rate and income tax expense. This could have a material adverse effect on our business, financial position and results of operations and could cause the market value of our common stock to decline.
In addition to income taxes in the U.S. we are subject to income taxes in many foreign jurisdictions. Significant judgment is required in determining our worldwide provision for income taxes. In the ordinary course of business, there are many transactions and calculations where the ultimate tax determination is uncertain. The final determination of any tax audits or related litigation could be materially different from our historical income tax provisions and accruals.
Additionally, increases in our effective tax rate as a result of a change in the mix of earnings in countries with differing statutory tax rates, changes in our overall profitability, changes in the valuation of deferred tax assets and liabilities, the results of audits and the examination of previously filed tax returns by various taxing authorities and continuing assessments of our tax exposures could impact our tax liabilities and affect our income tax expense, which could have a material adverse effect on our business, financial position and results of operations and could cause the market value of our common stock to decline.
Counterfeit versions of our products could harm our patients and reputation.
Our industry has been increasingly challenged by the vulnerability of distribution channels to illegal counterfeiting and the presence of counterfeit products in a growing number of markets and over the Internet. Counterfeit products are frequently unsafe or ineffective, and can be potentially life-threatening. To distributors and patients, counterfeit products may be visually indistinguishable from the authentic version. Reports of adverse reactions to counterfeit drugs or increased levels of counterfeiting could materially affect patient confidence in the authentic product, and harm the business of companies such as ours. Additionally, it is possible that adverse events caused by unsafe counterfeit products would mistakenly be attributed to the authentic product. If a product of ours was the subject of counterfeits, we could incur substantial reputational and financial harm in the longer term.
Our business and operations would suffer in the event of system failures.
Despite the implementation of security measures, our internal computer systems are vulnerable to damage from computer viruses, unauthorized access, natural disasters, terrorism, war and telecommunication and electrical failures. Any system failure, accident or security breach that causes interruptions in our operations could result in a material disruption of our product development programs. For example, the loss of clinical trial data from completed clinical trials could result in delays in our regulatory approval efforts and significantly increase our costs to recover or reproduce the data. To the extent that any disruption or security breach results in a loss or damage to our data or applications, or inappropriate disclosure of confidential or proprietary information, we may incur liability and the further development of our product candidates may be delayed.
In addition, we rely on complex information technology systems, including Internet-based systems, to support our supply chain processes as well as internal and external communications. The size and complexity of our systems make them potentially vulnerable to breakdown or interruption, whether due to computer viruses or other causes that may result in the loss of key information or the impairment of production and other supply chain processes. Such disruptions and breaches of security could adversely affect our business.
We or the third parties upon whom we depend may be adversely affected by earthquakes or other natural disasters and our business continuity and disaster recovery plans may not adequately protect us from a serious disaster.
The facilities we use for our headquarters, laboratory and research and development activities are located in earthquake-prone areas of California. A significant percentage of the facilities we use for our manufacturing, packaging, warehousing, distribution and administration offices are also located in these areas. Earthquakes or other natural disasters could severely disrupt our operations, and have a material adverse effect on our business, results of operations, financial condition and prospects. If a natural disaster, power outage or other event occurred that prevented us from using all or a significant portion of our facilities, that damaged critical infrastructure, such as our manufacturing facilities, or that otherwise disrupted operations, it may be difficult or, in certain cases, impossible for us to continue our business for a substantial period of time. The disaster recovery and business continuity plans we have in place currently are limited and are unlikely to prove adequate in the event of a serious disaster or similar event. We may incur substantial expenses as a result of the limited nature of our disaster recovery and business continuity plans.
Risks Relating to Regulatory Matters
The FDA approval process is time-consuming and complicated, and we may not obtain the FDA approval required for a product within the timeline we desire, or at all. Additionally, we may lose FDA approval and/or our products may become subject to foreign regulations.
The development, testing, manufacturing, marketing and sale of generic and proprietary pharmaceutical products and biological products are subject to extensive federal, state and local regulation in the U.S. and other countries. Satisfaction of all regulatory requirements, which typically takes years for drugs that have to be approved in ANDAs, NDAs, biological license applications, or BLAs, or biosimilar applications is dependent upon the type, complexity and novelty of the product candidate and requires the expenditure of substantial resources for research (including qualification of suppliers and their supplied materials), development, in vitro and in vivo (including nonclinical and clinical trials) studies, manufacturing process development and commercial scale up. All of our products are subject to compliance with the FFDCA and/or the Public Health Service Act, or PHSA, and with the FDA’s implementing regulations. Failure to adhere to applicable statutory or regulatory requirements by us or our business partners would have a material adverse effect on our operations and financial condition. In addition, in the event we are successful in developing product candidates for distribution and sale in other countries, we would become subject to regulation in such countries. Such foreign regulations and product approval requirements are expected to be time consuming and expensive as well.
We may encounter delays or agency rejections during any stage of the regulatory review and approval process based upon a variety of factors, including without limitation the failure to provide clinical data demonstrating compliance with the FDA’s requirements for safety, efficacy and quality. Those requirements may become more stringent prior to submission of our applications for approval or during the review of our applications due to changes in the law or changes in FDA policy or the adoption of new regulations. After submission of an application, the FDA may refuse to file the application, deny approval of the application or require additional testing or data. The FDA can convene an Advisory Committee to assist the FDA in examining specific issues related to the application. In February 2014, the FDA held a joint meeting of its Nonprescription Drugs Advisory Committee and its Pulmonary Allergy Drugs Advisory Committee, which we refer to as the Committee, to discuss the NDA for Primatene
®
Mist HFA. The Committee voted 14 to 10 that the data in the NDA supported efficacy, but voted 17 to 7 that safety had not been established for the intended over-the-counter use. The Committee also voted 18 to 6 that the product did not have a favorable risk-benefit profile for the intended over-the-counter use, and individual Committee members provided recommendations for resolving their concerns. Although the FDA is not required to follow the recommendations of its advisory committees, it usually does. On May 22, 2014, we received a CRL from the FDA, which requires additional non-clinical information, label revisions and follow-up studies (label comprehension, behavioral and actual use) to assess consumers’ ability to use the device correctly to support approval of the product in the over-the-counter setting. Additionally, in the CRL for Primatene
®
Mist HFA, the FDA noted current Good Manufacturing Practices, or cGMP, deficiencies in a recent inspection of our API supplier’s manufacturing facility, which produces epinephrine, and indicated that our NDA could not be approved until these issues were resolved. Subsequent to the receipt of the CRL, the supplier notified us that the cGMP deficiencies were satisfactorily resolved and accordingly, we believe this condition for approval has been satisfied. We met with the FDA in October 2014 to discuss preliminary data results and to clarify the FDA requirements for further studies. We are in the process of generating the remaining data required by the CRL and plan to submit an NDA amendment that we believe will address the FDA’s concerns. However, there can be no guarantee that any amendment to our NDA will result in timely approval of the product or approval at all.
Under various user fee enactments, the FDA has committed to timelines for its review of NDAs, ANDAs, BLAs and biosimilar applications. However, the FDA’s timelines described in its guidance on these statutes are flexible and subject to changes based on workload and other potential review issues that may delay the FDA’s review of an application. Further, the terms of approval of any applications may be more restrictive than our expectations and could affect the marketability of our products.
The FDA also has the authority to revoke or suspend approvals of previously approved products for cause, to debar companies and individuals from participating in the approval process for ANDAs, to request recalls of allegedly violative products, to seize allegedly violative products, to obtain injunctions that may, among other things, close manufacturing plants that are not operating in conformity with cGMP and stop shipments of potentially violative products and to prosecute companies and individuals for violations of the FFDCA. In the event that the FDA takes any such action relating to our products or product candidates, such actions would have a material adverse effect on our operations and financial condition.
Clinical failure can occur at any stage of clinical development. The results of earlier clinical trials are not necessarily predictive of future results and any product candidate we advance through clinical trials may not have favorable results in later clinical trials or receive regulatory approval.
Clinical failure can occur at any stage of our clinical development. Clinical trials may produce negative or inconclusive results, and we may decide, or regulators may require us, to conduct additional clinical trials or preclinical studies. In addition, data obtained from trials and studies are susceptible to varying interpretations, and regulators may not interpret our data as favorably as we do, which may delay, limit or prevent regulatory approval. Success in preclinical studies and early clinical trials does not ensure that subsequent clinical trials will generate the same or similar results or otherwise provide adequate data to demonstrate the efficacy and safety of a product candidate. A number of companies in the pharmaceutical industry, including those with greater resources and experience than us, have suffered significant setbacks in Phase 3 clinical trials, even after seeing promising results in earlier clinical trials.
In addition, the design of a clinical trial can determine whether its results will support approval of a product and flaws in the design of a clinical trial may not become apparent until the clinical trial is well-advanced. Further, clinical trials of potential products often reveal that it is not practical or feasible to continue development efforts. If any of our product candidates are found to be unsafe or lack efficacy, we will not be able to obtain regulatory approval for them and our business would be harmed.
In some instances, there can be significant variability in safety and/or efficacy results between different trials of the same product candidate due to numerous factors, including changes in trial protocols, differences in composition of the patient populations, adherence to the dosing regimen and other trial protocols and the rate of dropout among clinical trial participants. Our clinical trials may not demonstrate consistent or adequate efficacy and safety to obtain regulatory approval to market our product candidates. If we are unable to bring any of our current or future product candidates to market, or to acquire any marketed, previously approved products, our ability to create long-term stockholder value will be limited.
If clinical studies for our product candidates are unsuccessful or significantly delayed, we will be unable to meet our anticipated development and commercialization timelines, which would have an adverse impact our business.
Some of our new drug candidates must be approved in NDAs based on clinical studies demonstrating safety and/or effectiveness. For these types of studies, we rely on our investigational teams, who mainly are medical experts working in multicenter hospitals, to execute our study protocols with our product candidates. As a result, we have less control over our development program than if we were to perform the studies entirely on our own. Third parties may not perform their responsibilities according to our anticipated schedule. Delays in our development programs could significantly increase our product development costs and delay product commercialization.
The commencement of clinical trials on our product candidates may be delayed for several reasons, including but not limited to delays in demonstrating sufficient pre-clinical safety required to obtain regulatory clearance to commence a clinical trial, reaching agreements on acceptable terms with prospective contract research organizations, clinical trial sites and licensees, manufacturing and quality assurance release of a sufficient supply of a product candidate for use in our clinical trials, delays in recruiting sufficient subjects for a clinical trial and/or obtaining institutional review board approval to conduct a clinical trial at a prospective clinical site. Once a clinical trial has begun, it may be delayed, suspended or terminated by us or by regulatory authorities for a variety of reasons, including without limitation ongoing discussions with regulatory authorities regarding the scope or design of our clinical trials, a determination by us or regulatory authorities that continuing a trial presents an unreasonable health risk to participants, failure to conduct clinical trials in accordance with regulatory requirements, lower than anticipated recruitment or retention rate of patients in clinical trials, inspection of the clinical trial operations or trial sites by regulatory authorities, the imposition of a clinical hold by the FDA, lack of adequate funding to continue clinical trials and/or negative or unanticipated results of clinical trials.
Patient enrollment, a significant factor in the time required to complete a clinical study, is affected by many factors, including the size and nature of the study subject population, the proximity of patients to clinical sites, the eligibility criteria for the study, the design of the clinical study, competing clinical studies and clinicians’ and patients’ perceptions as to the potential advantages of the drug being studied in relation to available alternatives, including without limitation therapies being investigated by other companies. Further, completion of a clinical study and/or the results of a clinical study may be adversely affected by failure to retain subjects who enroll in a study but withdraw due to, among other things, adverse side effects, lack of efficacy, improvement in condition before treatment has been completed or for personal issues or who fail to return for or complete post-treatment follow-up.
Changes in governmental regulations and guidance relating to clinical studies may occur and we may need to amend study protocols to reflect these changes. Protocol amendments may require us to resubmit protocols to institutional review boards for reexamination or renegotiate terms with contract research organizations and study sites and investigators, all of which may adversely impact the costs or timing of or our ability to successfully complete a trial.
Clinical trials required by the FDA for approval of our products may not produce the results we need to move forward in product development or to submit or obtain approval of an NDA. Success in pre-clinical testing and early phase clinical trials does not assure that late phase clinical trials will be successful. Even if the results of any future Phase 3 clinical trials are positive, we may have to commit substantial time and additional resources to conduct further pre-clinical and clinical studies before we can submit NDAs or obtain FDA approval for our product candidates.
Clinical trials are expensive and at times difficult to design and implement, in part because they are subject to rigorous regulatory requirements. Further, if participating subjects or patients in clinical studies suffer drug-related adverse reactions during the course of such trials, or if we or the FDA believes that participating patients are being exposed to unacceptable health risks, we may suspend the clinical trials. Failure can occur at any stage of the trials, and we could encounter problems that would cause us to abandon clinical trials and/or require additional clinical studies relating to a product candidate.
Even if our clinical trials and laboratory testing are completed as planned, their results may fail to provide support for approval of our products or for label claims that will make our products commercially viable.
Positive results in nonclinical testing and early phase clinical studies do not ensure that late phase clinical studies will be successful or that our product candidates will be approved by the FDA. To obtain FDA approval of our proprietary product candidates, we must demonstrate through nonclinical testing and clinical studies that each product is safe and effective for each proposed indication. Further, clinical study results frequently are susceptible to varying interpretations. Medical professionals, investors and/or regulatory authorities may analyze or weigh study data differently than we do. In addition, determining the value of clinical data typically requires application of assumptions and extrapolations to raw data. Alternative methodologies may lead to differing conclusions, including with respect to the safety or efficacy of our product candidates.
In addition, if we license to third parties rights to develop our product candidates in other geographic areas or for other indications, we may have limited control over nonclinical testing or clinical studies that may be conducted by such third-party licensees in those territories or for those indications. If data from third-party testing identifies a safety or efficacy concern, such data could adversely affect our or another licensee’s development of such product.
There is significant risk that our products could fail to show anticipated results in nonclinical testing and/or clinical studies and, as a result, we may elect to discontinue the development of a product for a particular indication or altogether. A failure to obtain requisite regulatory approvals or to obtain approvals of the scope requested may delay or preclude us from marketing our products or limit the commercial use of the products, and would have a material adverse effect on our business, financial condition and results of operations.
The novel use of HFA for any of our product candidates, or any of our other product candidates requiring novel particle engineering, may not receive regulatory approval, and without regulatory approval we will not be able to market our product candidates.
We are engaging in particle engineering for certain product candidates, including and especially the use of HFA for our Primatene
®
Mist HFA product candidate. With respect to Primatene
®
Mist HFA, we have chosen to develop a formulation of the product candidate that will use HFAs as a propellant because of an FDA-mandated phase-out of drugs utilizing CFCs as propellants. Although HFAs have been used in other settings, using HFAs as a propellant in an epinephrine inhalation product is a novel use, and there is no guarantee that we will obtain regulatory approval or, upon commercialization, market acceptance of this product. In addition to Primatene
®
Mist HFA, we are similarly engaging in particle engineering for additional product candidates and, similarly, there is no guarantee that we will obtain regulatory approval or, upon commercialization, market acceptance of these products.
The development of a product candidate and issues relating to its approval and marketing are subject to extensive regulations by the FDA in the U.S. and regulatory authorities in other countries, with regulations differing from country to country. We are not permitted to market our product candidates in the U.S. until we receive approval of an NDA from the FDA. NDA approvals may require extensive preclinical and clinical data and supporting information to establish the product candidate’s safety and effectiveness for each desired indication. NDAs must include significant information regarding the chemistry, manufacturing and controls for the product. Obtaining approval of an NDA is a lengthy, expensive and uncertain process, and we may not be successful in obtaining approval. If we submit an NDA to the FDA, the FDA must decide whether to accept or reject the submission for filing. Any submissions may not be accepted for filing and review by the FDA. Even if a product is approved, the FDA may limit the indications for which the product may be marketed, require extensive warnings on the product labeling or require additional expensive and time-consuming post-approval clinical trials or reporting as conditions of approval. Regulators of other countries and jurisdictions have their own procedures for approval of product candidates with which we must comply prior to marketing in those countries or jurisdictions. Obtaining regulatory approval for marketing of a product candidate in one country does not necessarily ensure that we will be able to obtain regulatory approval in any other country.
In addition, delays in approvals or rejections of marketing applications in the U.S. or other countries may be based upon many factors, including regulatory requests for additional analyses, reports, data, preclinical studies and clinical trials, regulatory questions regarding different interpretations of data and results, changes in regulatory policy during the period of product development and the emergence of new information regarding our product candidates or other products. Also, regulatory approval for any of our product candidates may be withdrawn.
We also have plans to develop synthetic APIs. Our ongoing trials and studies may not be successful or regulators may not agree with our conclusions regarding the preclinical studies and clinical trials we have conducted to date or approve the use of such synthetic APIs.
If we are unable to obtain approval from the FDA or other regulatory agencies for our product candidates or synthetic APIs, we will not be able to market such product candidates and our ability to achieve profitability may be materially impaired.
The commercial success of our NDA product candidates will depend in significant measure on the label claims that the FDA approves for such products.
The scientific foundation of our NDA products will be based on our various proprietary technologies and the commercial success of these product candidates will depend in significant measure upon our ability to obtain FDA approval of labeling describing such products’ expected features or benefits. Failure to achieve FDA approval of product labeling containing adequate information on features or benefits will prevent or substantially limit our advertising and promotion of such features in order to differentiate our proprietary technologies from those products that already exist in the market. This failure would have a material adverse impact on our business.
Our ANDA products are also subject to FDA approval of their labeling.
Even if we are able to obtain regulatory approval for our generic products, state pharmacy boards or state agencies may conclude that our products are not substitutable at the pharmacy level for the reference listed drug. If our generic products are not substitutable at the pharmacy level for their reference listed drugs, this could materially reduce sales of our products and our business would suffer.
Although the FDA may determine that a generic product is therapeutically equivalent to a brand product and indicate this therapeutic equivalence by providing it with an “A” rating in the FDA’s Orange Book, this designation is not binding on state pharmacy boards or state agencies. As a result, in states that do not deem our product candidates substitutable at the pharmacy level, physicians may be required to specifically prescribe our product or a generic product alternative in order for our product to be dispensed. Should this occur with respect to one of our generic product candidates, it could materially reduce sales in those states, which would substantially harm our business.
Our investments in biosimilar products may not result in products that are approved by the FDA or other foreign regulatory authorities and, even if approved by such authorities, may not result in commercially successful products.
We plan to build on our existing platforms to produce biosimilar products in the future. In 2010, Congress amended the PHSA to create an abbreviated approval pathway for follow-on biologics. This approval pathway is available for “biosimilar” products, which are products that are highly similar to previously approved biologics notwithstanding minor differences in inactive components. The process for bringing a biosimilar product to market is uncertain and may be drawn out for an extended period of time. The FDA has not yet promulgated regulations governing this process and only one biosimilar application has been approved to date. Approval of biosimilar applications may be delayed by exclusivity on the BLA for the reference product for up to twelve years. Biosimilar applicants are also subjected to a patent resolution process that will require biosimilar applicants to share the contents of their application and information concerning its manufacturing processes with counsel for the company holding the BLA for the reference drug and to engage in a patent litigation process that could delay or prevent the commercial launch of a product for many years.
Biosimilar products are not presumed to be substitutable for the reference drug under the Biologics Price Competition and Innovation Act, or BPCIA. Biosimilar applicants must seek a separate FDA determination that they are “interchangeable” with the reference drug, meaning that they can be expected to produce the same clinical result in any given patient without an increase in risk due to switching from the brand product. The statutory standards for determining biosimilarity and interchangeability are broad and uncertain, and the FDA has broad discretion to determine the nature and extent of product characterization, nonclinical testing and clinical testing on a product-by-product basis.
Products approved based on biosimilarity without an FDA determination of interchangeability may not be substitutable at the retail pharmacy level. Some states have passed laws limiting pharmacy substitution to biosimilar products that the FDA has determined to be interchangeable, as well as restrictions on the substitution of interchangeable biosimilar products. These restrictions include, among other things, requirements for informing the patient and the prescribing physician of the substitution or proposed substitution, authority for the prescribing physician and the patient to preclude substitution and recordkeeping requirements. There is no certainty that other states will not impose similar restrictions or that states will not impose further restrictions or preclude substitution of interchangeable biosimilar products entirely.
Our competitive advantage in this area will depend on our success in demonstrating to the FDA that platform technology provides a level of scientific assurance that facilitates determinations of interchangeability, reduces the need for expensive clinical or other testing and raises the scientific quality requirements for our competitors to demonstrate that their products are highly similar to a brand product. Our ability to succeed will depend in part on our ability to invest in new programs and develop data in a timeframe that enables the FDA to consider our approach as the FDA begins to implement the new law. BLA holders will develop strategies and precedents for delaying or impeding approvals of biosimilar products and determinations of interchangeability. For example, the lengthy 12-year exclusivity protection provides the BLA holder for the reference drug with an opportunity to develop and replace its original product with a modified product that may avoid a determination of interchangeability and that may qualify for an additional 12-year marketing exclusivity period, reducing the potential opportunity for substitution at the retail pharmacy level for interchangeable biosimilars. As brand and biosimilar companies gain greater understanding of and experience with the new regulatory pathway, we expect to see new and unexpected company strategies, FDA decisions and court decisions that will pose unexpected challenges that will prevent, delay or make more difficult biosimilar approvals. As an example, there is a currently pending Citizen Petition filed with the FDA that argues that approving a biosimilar that relies on a reference product approved under a BLA submitted prior to passage of the BPCIA would constitute a taking under the Fifth Amendment to the U.S. Constitution that requires just compensation. The Citizen Petition requests that the FDA not accept for filing, file, approve, discuss or otherwise take any action with regard to any investigational new drug application or BLA for a product for which the reference product BLA was submitted prior to passage of the BPCIA. Should this petition be granted, there would be far fewer approved biologics that could serve as reference products for biosimilar applications, which could have a significant adverse impact on our business.
In addition, the BPCIA was passed as part of the Affordable Care Act and there have been ongoing legislative proposals to repeal the Affordable Care Act. If the Affordable Care Act is amended or is repealed with respect to the biosimilar approval pathway, our opportunity to develop biosimilars (including interchangeable biologics) could be materially impaired and our business could be materially and adversely affected.
Some of our products are used with drug delivery or companion diagnostic devices which have their own regulatory, manufacturing, reimbursement and other risks.
Some of our products or product candidates may be used in combination with a drug delivery device, such as an injector or other delivery system. Our product candidates intended for use with such devices, or expanded indications that we may seek for our products used with such devices, may not be approved or may be substantially delayed in receiving approval if the devices do not gain and/or maintain their own regulatory approvals or clearances. Where approval of the drug product and device is sought under a single application, the increased complexity of the review process may delay approval. In addition, some of these drug delivery devices are provided by single source unaffiliated third-party companies. We are dependent on the sustained cooperation and effort of those third-party companies both to supply the devices and, in some cases, to conduct the studies required for approval or other regulatory clearance of the devices. We are also dependent on those third-party companies continuing to maintain such approvals or clearances once they have been received. Failure of third-party companies to supply the devices, to successfully complete studies on the devices in a timely manner, or to obtain or maintain required approvals or clearances of the devices could result in increased development costs, delays in or failure to obtain regulatory approval and delays in product candidates reaching the market or in gaining approval or clearance for expanded labels for new indications. We filed a Field Alert Report for enoxaparin in June 2013, as required by the FDA for certain quality issues with safety implications, because the product did not meet functionality criteria. The needle-shielding component was breaking during shipping, preventing correct administration of the medication. While the specific issues related to this Field Alert Report were resolved, we may experience similar issues in the future. In addition, loss of regulatory approval or clearance of a device that is used with our product may result in the removal of our product from the market.
The drug delivery devices used with our products are also subject to many of the same reimbursement risks and challenges to which our products are subject. A reduction in the availability of, or the coverage and/or reimbursement for, drug delivery devices used with our products could have a material adverse effect on our product sales, business and results of operations.
If pharmaceutical companies are successful in limiting the use of generics through their legislative, regulatory and/or other efforts, our sales of generic products may suffer.
Many pharmaceutical companies producing proprietary drugs have increasingly used state and federal legislative and regulatory means to delay, impede and/or prevent generic competition. These efforts have included but are not limited to the following:
|
•
|
making changes to the formulation of their product and arguing that potential generic competitors must demonstrate bioequivalence and/or comparable abuse-resistance to the reformulated brand product;
|
|
•
|
pursuing new patents for existing products which may be granted immediately prior to the expiration of earlier patents, which could extend patent protection for additional years or otherwise delay the launch of generics;
|
|
•
|
selling the brand product as an authorized generic, either by the brand company directly, through an affiliate or by a marketing partner;
|
|
•
|
using the FDA’s Citizen Petition process to request amendments to FDA standards or otherwise delay generic drug approvals;
|
|
•
|
challenging FDA denials of Citizen Petitions in court and seeking injunctive relief to reverse approval of generic drug applications;
|
|
•
|
seeking changes to standards in the U.S. Pharmacopeia/National Formulary, which are compendial drug standards that are recognized by industry and, in some instances, are enforceable under the FFDCA;
|
|
•
|
attempting to use the legislative and regulatory process to have drugs reclassified or rescheduled by the DEA;
|
|
•
|
using the legislative and regulatory process to set standards and requirements for abuse deterrent formulations that are patented or that will otherwise impede or prevent generic competition;
|
|
•
|
seeking special patent-term extensions through amendments to non-related federal legislation;
|
|
•
|
engaging in initiatives to enact state legislation that would restrict the substitution of certain generic drugs, including products that we are developing;
|
|
•
|
entering into agreements with pharmacy benefit management companies that block the dispensing of generic products;
|
|
•
|
seeking patents on methods of manufacturing certain API;
|
|
•
|
settling patent lawsuits with generic companies in a manner that leaves the patent as an obstacle for approval of other companies’ generic drugs;
|
|
•
|
settling patent litigation with generic companies in a manner that avoids forfeiture of or otherwise protects or extends the exclusivity period;
|
|
•
|
providing medical education or other information to physicians, third-party payers and federal and state regulators that takes the position that certain generic products are inappropriate for approval or for substitution after approval;
|
|
•
|
seeking state law restrictions on the substitution of generic and biosimilar products at the pharmacy level without the instruction or permission of a physician; and
|
|
•
|
seeking federal or state regulatory restrictions on the use of the same non-proprietary name as the reference brand product for a biosimilar or interchangeable biologic.
|
If pharmaceutical companies or other third parties are successful in limiting the use of generic products through these or other means, our sales of generic products may decline. If we experience a material decline in generic product sales, our results of operations, financial condition and cash flows will suffer.
In the event that we are successful in bringing any products to market, our revenues may be adversely affected if we fail to obtain insurance coverage or adequate reimbursement for our products from third-party payers and administrators.
Our ability to successfully commercialize our products may depend in part on the availability of reimbursement for and insurance coverage of our prescription products from government health administration authorities, private health insurers and other third-party payers and administrators, including Medicaid and Medicare. Third-party payers and administrators, including state Medicaid programs and Medicare, have been recently challenging the prices charged for pharmaceutical products. Government and other third-party payers increasingly are limiting both coverage and the level of reimbursement for new drugs. Third-party insurance coverage may not be available to patients for some of our products candidates. The continuing efforts of government and third-party payers to contain or reduce the costs of health care may limit our commercial opportunity. If government and other third-party payers do not provide adequate coverage and reimbursement for certain of our products, health care providers may not prescribe them or patients may ask their health care providers to prescribe competing products with more favorable reimbursement.
Managed care organizations and other private insurers frequently adopt their own payment or reimbursement reductions. Consolidation among managed care organizations has increased the negotiating power of these entities. Private third-party payers, as well as governments, increasingly employ formularies to control costs by negotiating discounted prices in exchange for formulary inclusion. While these approaches generally favor generic products over brands, generic competition is stronger. Our existing products and our product candidates include proprietary products and generic products. Failure to obtain timely or adequate pricing or formulary placement for our products or obtaining such pricing or placement at unfavorable pricing could adversely impact revenue. In addition to formulary tier co-pay differentials, private health insurance companies and self-insured employers have been raising co-payments required from beneficiaries, particularly for proprietary pharmaceuticals and biotechnology products. Private health insurance companies also are increasingly imposing utilization management tools, such as requiring prior authorization for a proprietary product if a generic product is available or requiring the patient to first fail on one or more generic products before permitting access to a proprietary medicine. We do not currently have any managed care organization agreements and do not intend to have managed care organization agreements in the future.
We must manufacture our product at our facilities in conformity with cGMP regulations; failure to maintain compliance with cGMP regulations may prevent or delay the manufacture or marketing of our products or product candidates and may prevent us from gaining approval of our products.
All of our products and product candidates for use in clinical studies must be manufactured, packaged, labeled and stored in accordance with cGMP. For our approved products, modifications, enhancements, or changes in manufacturing processes and sites may require supplemental FDA approval, which may be subject to a lengthy application process or which we may be unable to obtain.
All facilities of Amphastar and our subsidiaries are periodically subject to inspection by the FDA and other governmental entities, and operations at these facilities could be interrupted or halted if the FDA or another governmental entity deems such inspections as unsatisfactory. In addition, our secondary heparin supplier in China has yet to be inspected by the FDA. Products manufactured in our facilities must be made in a manner consistent with cGMP or similar standards in each territory in which we manufacture. Compliance with such standards requires substantial expenditures of time, money and effort in such areas as production and quality control to ensure full technical compliance. Failure to comply with cGMP or with other state or federal requirements may result in unanticipated compliance expenditures, total or partial suspension of production or distribution, suspension of review of applications submitted for approval of our product candidates, termination of ongoing research, disqualification of data derived from studies on our products and/or enforcement actions such as recall or seizure of products, injunctions, civil penalties and criminal prosecutions of the company and company officials. Any suspension of production or distribution would require us to engage contract manufacturing organizations to manufacture our products or to accept a hiatus in marketing our products. Any contract manufacturing organization we engage will require time to learn our methods of production and to scale up to full production of our products. Any delays caused by the transfer of manufacturing to a contract manufacturing organization may have a material adverse effect on our results of operations. Additionally, any contract manufacturing organization that we engage will be subject to the same cGMP regulations as us, and any failure on their part to comply with FDA or other governmental regulations will result in similar consequences.
Our operations are subject to environmental, health and safety and other laws and regulations, with which compliance is costly and which exposes us to penalties for non-compliance.
Our business, products and product candidates are subject to federal, state and local laws and regulations relating to the protection of the environment, natural resources and worker health and safety and the use, management, storage and disposal of hazardous substances, waste and other regulated materials. Because we own and operate real property, various environmental laws also may impose liability on us for the costs of cleaning up and responding to hazardous substances that may have been released on our property, including releases unknown to us. These environmental laws and regulations also could require us to pay for environmental remediation and response costs at third-party locations where we dispose of or recycle hazardous substances. The costs of complying with these various environmental requirements, as they now exist or as may be altered in the future, could adversely affect our financial condition and results of operations. For example, as a result of environmental concerns about the use of CFCs, the FDA issued a final rule on January 16, 2009 that required the phase-out of the CFC version of our Primatene
®
Mist product by December 31, 2011. This phase out caused us to halt sales of the CFC version of our Primatene
®
Mist product subsequent to December 31, 2011 and write off our inventory for the product, which had an adverse effect on our financial results.
We also must comply with data protection and data privacy requirements. Compliance with these laws, rules and regulations regarding privacy, security and protection of employee data could result in higher compliance and technology costs for us, as well as significant fines, penalties and damage to our global reputation and our brand as a result of non-compliance.
Our products may be subject to federal and state laws and certain initiatives relating to cost control, which may decrease our profitability.
In the U.S., we expect there may be federal and state proposals for cost controls. We expect that increasing emphasis on managed care in the U.S. will continue to put pressure on the pricing of pharmaceutical products. In addition, we are required to pay rebates to states, which are generally calculated based on the prices for our products that are paid by state Medicaid programs. Cost control initiatives could decrease the price that we charge, and increase the rebate amounts that we must provide, for any of our products in the future. Further, cost control initiatives could impair our ability to commercialize our products and our ability to earn significant revenues from commercialization. In the U.S., all of our pharmaceutical products are subject to increasing pricing pressures. Such pressures have increased as a result of the Medicare Prescription Drug Improvement and Modernization Act of 2003, or MMA, due to the enhanced purchasing power of the private sector plans that negotiate on behalf of Medicare beneficiaries. To date, we do not believe that federal and state cost control initiatives have had a direct impact on the pricing of our products, but they could have such an impact in the future. Similarly, rebate obligations have been relatively stable, but if such obligations increase, our revenue could be adversely affected. In addition, if the MMA or the Affordable Care Act were amended to impose direct governmental price controls and access restrictions, it would have a significant adverse impact on our business. Furthermore, managed care organizations, as well as Medicaid and other government agencies, continue to seek price discounts. Some states have implemented, and other states are considering, price controls or patient access constraints under the Medicaid program, and some states are considering price-control regimes that would affect rebate levels and apply to broader segments of their populations that are not Medicaid-eligible. Further, there continue to be legislative proposals to amend U.S. laws to allow the importation into the U.S. of prescription drugs, which can be sold at prices that are regulated by the governments of various foreign countries. In addition to well-documented safety concerns, such as the increased risk of counterfeit products entering the supply chain, such importation could impact pharmaceutical prices in the U.S.
Some of our products are marketed without FDA approval and may be subject to enforcement actions by the FDA.
A number of our prescription products are marketed without FDA approval. These products, like many other unapproved prescription drugs on the market, contain active ingredients that were first marketed prior to the enactment of the FFDCA. The FDA has assessed these products in a program known as the “Prescription Drug Wrap-Up” and has stated that these drugs cannot be lawfully marketed unless they comply with certain “grandfather” exceptions to the definition of “new drug” in the FFDCA. These exceptions have been strictly construed by FDA and by the courts, and the FDA has stated that it is unlikely that any of the unapproved prescription drugs on the market, including certain of our drugs, qualify for the exceptions. At any time, the FDA may require that some or all of our unapproved prescription drugs be approved and may direct that we recall these products and/or cease marketing the products until they are approved. The FDA may also take enforcement actions based on our marketing of these unapproved products, including but not limited to the issuance of an untitled letter or a warning letter, and a judicial action seeking injunction, product seizure and civil or criminal penalties. While the FDA has not undertaken any such enforcement actions against our unapproved drugs, the enforcement posture could change at any time and our ability to market such drugs would terminate with little or no notice. Moreover, our competitors may market FDA approved prescription products that compete against our unapproved prescription products. Such competitors have brought, and in the future may bring, claims against us alleging unfair competition or related claims.
As a result of our meetings with the FDA in 2009, we decided to discontinue all of our products that were subject to the Prescription Drug Wrap-Up program, with the exception of epinephrine in vial form. These products were all produced at our subsidiary. During the third quarter of 2010, the FDA requested that we reintroduce several of the withdrawn products to cope with a drug shortage, while we prepared and filed applications for approval of the products. Between August and October, 2010, we reintroduced atropine, calcium chloride, morphine, dextrose, epinephrine, and sodium bicarbonate injections, and continue to market these products without FDA approval. For the years ended December 31, 2014, 2013, and 2012, we recorded net revenues of $27.0 million, $29.6 million, and $19.2 million, respectively, from unapproved products. We have filed three ANDAs and are preparing additional applications with respect to these products.
Our reporting and payment obligations under the Medicare and/or Medicaid drug rebate programs and other governmental purchasing and rebate programs are complex and may involve subjective decisions that could change as a result of new business circumstances, new regulatory guidance or advice of legal counsel. Any determination of failure to comply with those obligations could subject us to penalties and sanctions which could have a material adverse effect on our business, financial position and results of operations and the market value of our common stock could decline.
The regulations regarding reporting and payment obligations with respect to Medicare and/or Medicaid reimbursement and rebates and other governmental programs are complex. Because our processes for these calculations and the judgments involved in making these calculations involve, and will continue to involve, subjective decisions and complex methodologies, these calculations are subject to the risk of errors. In addition, they are subject to review and challenge by the applicable governmental agencies, and it is possible that such reviews could result in material changes. The Affordable Care Act includes a provision requiring the Centers for Medicare and Medicaid Services, or CMS, to publish a weighted Average Manufacturer Price, or AMP, for all multi-source drugs. The provision was effective October 1, 2010; however, weighted average AMP’s have not yet been published by CMS, except in draft form, and have not been implemented for use in the calculation of Federal Upper Limits. Although the weighted average AMP would not reveal our individual AMP, publishing a weighted average AMP available to customers and the public at large could negatively affect our leverage in commercial price negotiations.
In addition, as also disclosed herein, a number of state and federal government agencies are conducting investigations of manufacturers’ reporting practices with respect to Average Wholesale Prices, or AWP, in which they have suggested that reporting of inflated AWP has led to excessive payments for prescription drugs. Numerous pharmaceutical companies have been named as defendants in various actions relating to pharmaceutical pricing issues and whether allegedly improper actions by pharmaceutical manufacturers led to excessive payments by Medicare and/or Medicaid.
Any governmental agencies that have commenced, or may commence, an investigation of our business relating to the sales, marketing, pricing, quality or manufacturing of pharmaceutical products could seek to impose, based on a claim of violation of fraud and false claims laws or otherwise, civil and/or criminal sanctions, including fines, penalties and possible exclusion from federal health care programs including Medicare and/or Medicaid. Some of the applicable laws may impose liability even in the absence of specific intent to defraud. Furthermore, should there be ambiguity with regard to how to properly calculate and report payments — and even in the absence of any such ambiguity — a governmental authority may take a position contrary to a position we have taken, and may impose civil and/or criminal sanctions. Any such penalties or sanctions could have a material adverse effect on our business, financial position and results of operations and could cause the market value of our common stock to decline.
Proposed FDA labeling rules could result in additional liability risks for our products.
The FDA has recently proposed allowing generic drug manufacturers to independently update product labeling to reflect newly discovered safety data, which could result in failure-to-warn suits. This could increase our labeling obligations and potentially increase our liability risk for our products.
We may be subject to enforcement action if we engage in the off-label promotion of our products.
Our promotional materials and training methods must comply with the FFDCA and other applicable laws and regulations, including restraints and prohibitions on the promotion of off-label, or unapproved, use. Physicians may prescribe our products for off-label use without regard to these prohibitions, as the FFDCA does not restrict or regulate a physician’s choice of treatment within the practice of medicine. However, if the FDA determines that our promotional materials or training constitutes promotion of an off-label use, it could request that we modify our training or promotional materials or subject us to regulatory or enforcement actions, including but not limited to the issuance of an untitled letter or warning letter, and a judicial action seeking injunction, product seizure and civil or criminal penalties. It is also possible that other federal, state or non-U.S. enforcement authorities might take action if they consider our promotional or training materials to constitute promotion of an unapproved use, which could result in significant fines or penalties under other statutory authorities, such as laws prohibiting false claims for reimbursement. In that event, our reputation could be damaged and adoption of the products could be impaired. Although our policy is to refrain from statements that could be considered off-label promotion of our products, the FDA or another regulatory agency could disagree and conclude that we have engaged in off-label promotion. In addition, the off-label use of our products may increase the risk of product liability claims. Product liability claims are expensive to defend and could divert our management’s attention, result in substantial damage awards against us and harm our reputation.
The pharmaceutical industry is highly regulated and pharmaceutical companies are subject to various federal and state fraud and abuse laws, including, without limitation, the federal Anti-Kickback Statute and the federal False Claims Act.
Healthcare fraud and abuse regulations are complex, and even minor irregularities can potentially give rise to claims that a statute or prohibition has been violated. The laws that may affect our ability to operate include:
|
•
|
the federal healthcare programs’ anti-kickback law, which prohibits, among other things, persons from knowingly and willfully soliciting, receiving, offering or paying remuneration, directly or indirectly, in exchange for or to induce either the referral of an individual for, or the purchase, order or recommendation of, any good or service for which payment may be made under federal healthcare programs such as the Medicare and Medicaid programs;
|
|
•
|
federal false claims laws which prohibit, among other things, individuals or entities from knowingly presenting, or causing to be presented, claims for payment from Medicare, Medicaid, or other third-party payers that are false or fraudulent;
|
|
•
|
the federal Health Insurance Portability and Accountability Act of 1996, which created federal criminal laws that prohibit executing a scheme to defraud any healthcare benefit program or making false statements relating to healthcare matters;
|
|
•
|
the FFDCA and similar laws regulating advertisement and labeling;
|
|
•
|
the U.S. Foreign Corrupt Practices Act, which prohibits corrupt payments, gifts or transfers of value to non-U.S. officials; and
|
|
•
|
non-U.S. and U.S. state law equivalents of each of the above federal laws, such as anti-kickback and false claims laws which may apply to items or services reimbursed by any third-party payer, including commercial insurers.
|
The federal false claims laws have been interpreted to apply to arrangements between pharmaceutical manufacturers on the one hand and prescribers, purchasers or formulary managers on the other. Although there are several statutory exemptions and regulatory safe harbors protecting certain common activities from prosecution, the exemptions and safe harbors are drawn narrowly, and practices that involve remuneration intended to induce prescribing, purchasing or recommending may be subject to scrutiny if they do not qualify for an exemption or safe harbor. Most states also have statutes or regulations similar to the federal anti-kickback law and federal false claims laws, which apply to items and services covered by Medicaid and other state programs, or, in several states, apply regardless of the payer. Administrative, civil and criminal sanctions may be imposed under these federal and state laws.
Further, the Affordable Care Act, among other things, amends the intent requirement of the federal anti-kickback and criminal healthcare fraud statutes. A person or entity can now be found guilty under the Affordable Care Act without actual knowledge of the statute or specific intent to violate it. In addition, the Affordable Care Act provides that the government may assert that a claim including items or services resulting from a violation of the federal anti-kickback statute constitutes a false or fraudulent claim for purposes of the false claims statutes. Possible sanctions for violation of these anti-kickback laws include monetary fines, civil and criminal penalties, exclusion from Medicare and Medicaid programs and forfeiture of amounts collected in violation of such prohibitions. Any violations of these laws, or any action against us for violation of these laws, even if we successfully defend against it, could result in a material adverse effect on our reputation, business, results of operations and financial condition.
To enforce compliance with the federal laws, the U.S. Department of Justice, or DOJ, has recently increased its scrutiny of interactions between healthcare companies and healthcare providers, which has led to a number of investigations, prosecutions, convictions and settlements in the healthcare industry. Dealing with investigations can be time- and resource-consuming and can divert management’s attention from the business. Additionally, if a healthcare provider settles an investigation with the DOJ or other law enforcement agencies, we may be forced to agree to additional onerous compliance and reporting requirements as part of a consent decree or corporate integrity agreement. Any such investigation or settlement could increase our costs or otherwise have an adverse effect on our business.
Over the past few years, a number of pharmaceutical and other healthcare companies have been prosecuted under these laws for a variety of promotional and marketing activities, such as: providing free trips, free goods, sham consulting fees and grants and other monetary benefits to prescribers; reporting inflated average wholesale prices that were then used by federal programs to set reimbursement rates; engaging in off-label promotion; and submitting inflated best price information to the Medicaid Rebate Program to reduce liability for Medicaid rebates.
In addition, there has been a recent trend of increased federal and state regulation of payments made to physicians for marketing. Some states, such as California, Massachusetts and Vermont, mandate implementation of commercial compliance programs, along with the tracking and reporting of gifts, compensation and other remuneration to physicians. The shifting commercial compliance environment and the need to build and maintain robust and expandable systems to comply with different compliance and/or reporting requirements in multiple jurisdictions increase the possibility that a healthcare company may run afoul of one or more of the requirements.
If the activities of any of our business partners are found to be in violation of these laws or any other federal and state fraud and abuse laws, they may be subject to penalties, including civil and criminal penalties, damages, fines and the curtailment or restructuring of its activities with regard to the commercialization of our products, which could harm the commercial success of our products and materially affect our business, financial condition and results of operations. While we have implemented numerous risk mitigation measures to comply with such regulations in this complex operating environment, we cannot guarantee that we will be able to effectively mitigate all operational risks. While we have developed and instituted a corporate compliance program, we cannot guarantee that we, our employees, our consultants or our contractors are or will be in compliance with all potentially applicable U.S. federal and state regulations and/or laws, all potentially applicable foreign regulations and/or laws and/or all requirements of the corporate integrity agreement. Because of the far-reaching nature of these laws, we may be required to alter or discontinue one or more of our business practices to be in compliance with these laws. If we fail to adequately mitigate our operational risks or if we or our agents fail to comply with any of those regulations, laws and/or requirements, a range of actions could result, including, but not limited to, the termination of clinical trials, the failure to approve a product candidate, restrictions on our products or manufacturing processes, withdrawal of our products from the market, significant fines, exclusion from government healthcare programs or other sanctions or litigation. Such occurrences could have a material and adverse effect on our product sales, business and results of operations.
The scope and enforcement of these laws is uncertain and subject to rapid change in the current environment of healthcare reform, especially in light of the lack of applicable precedent and regulations. Federal or state regulatory authorities might challenge our current or future activities under these laws. Any such challenge could have a material adverse effect on our reputation, business, results of operations and financial condition. In addition, efforts to ensure that our business arrangements with third parties will comply with these laws and regulations will involve substantial costs. Any state or federal regulatory review of us or the third parties with whom we contract, regardless of the outcome, would be costly and time-consuming.
Risks Relating to our Intellectual Property
Our success depends on our ability to protect our intellectual property.
In addition to obtaining FDA approval for our generic and proprietary drug candidates, our success also depends on our ability to obtain and maintain patent protection for new products developed utilizing our technologies, in the U.S. and in other countries, and to enforce these patents. The patent positions of pharmaceutical firms, including us, are generally uncertain and involve complex legal and factual issues. Any of our patent claims in our approved and pending non-provisional and provisional patent applications relating to our technologies may not be issued or, if issued, any of our existing and future patent claims may not be held valid and enforceable against third-party infringement. Moreover, any patent claims relating to our technologies may not be sufficiently broad to protect our products. In addition, issued patent claims may be challenged, potentially invalidated, or potentially circumvented. Our patent claims may not afford us protection against our competitors. We currently have a number of U.S. and foreign patents issued. However, issuance of a patent is not conclusive evidence of its validity or enforceability. We may not receive patents for any of our pending patent applications or any patent applications that we may file in the future and our issued patents may not be upheld if challenged.
In March 2013, the U.S. transitioned to a first inventor to file system in which, assuming the other requirements for patentability are met, the first inventor to file a patent application is entitled to receive a patent (rather than the first to invent as was the case under prior U.S. law). Accordingly, it is possible that potentially invalidating prior art may become available in between the time that we develop an invention and file a patent application that covers the invention. In addition, we may be subject to a third-party preissuance submission of prior art to the U.S. Patent and Trademark Office, or USPTO, or become involved in opposition, derivation, reexamination, inter parties review or interference proceedings challenging our patent rights or the patent rights of others. An adverse determination in any such submission, proceeding or litigation could reduce the scope of, or invalidate our patent rights, allow third parties to commercialize our technology or products and compete directly with us, without payment to us, or result in our inability to manufacture or commercialize products without infringing third party patent rights.
Past enforcement of intellectual property rights in countries outside the U.S., including China in particular, has been limited or non-existent. Future enforcement of patents and proprietary rights in many other countries will likely be problematic or unpredictable. Moreover, the issuance of a patent in one country does not assure the issuance of a similar patent in another country. Claim interpretation and infringement laws vary by nation, so the extent of any patent protection is uncertain and may vary in different jurisdictions.
We also rely on, or intend to rely on, our trademarks, trade names and brand names to distinguish our products from the products of our competitors and have registered or applied to register our own trademarks. However, our trademark applications may not be approved. Third parties may also oppose our trademark applications or otherwise challenge our use of the trademarks. In the event that our trademarks are successfully challenged, we could be forced to rebrand our product, which could result in loss of brand recognition and could require us to devote significant resources to advertising and marketing these new brands. Further, our competitors may infringe our trademarks or we may not have adequate resources to enforce our trademarks.
With respect to our proprietary products, if we fail to adequately protect or enforce our intellectual property rights, we could lose sales to generic versions of our proprietary products which could cause a material adverse effect on our business, financial position and results of operations and could cause the market value of our common stock to decline.
The success of our proprietary products depends in part on our ability to obtain, maintain and enforce patents and trademarks, and to protect trade secrets, know-how and other proprietary information. Our ability to commercialize any proprietary product successfully will largely depend upon our ability to obtain and maintain patents of sufficient scope to prevent third parties from developing substantially equivalent products. In the absence of patent and trade secret protection, competitors may adversely affect our proprietary products business by independently developing and marketing substantially equivalent products. It is also possible that we could incur substantial costs if we are required to initiate litigation against others to protect or enforce our intellectual property rights.
We have filed patent applications covering compositions of, methods of making and/or methods of using, our proprietary products and proprietary product candidates. We may not be issued patents based on patent applications already filed or that we may file in the future, and if patents are issued, they may be insufficient in scope to cover our proprietary products. The issuance of a patent in one country does not ensure the issuance of a similar patent in any other country, or that we will even seek patent protection in all countries worldwide. Furthermore, the patent position of companies in the pharmaceutical industry generally involves complex legal and factual questions and has been and remains the subject of much litigation. Legal standards relating to scope and validity of patent claims are evolving and may differ in various countries. Any patents we have obtained, or will obtain in the future, may be challenged, invalidated or circumvented. Moreover, the USPTO or any other governmental agency, as well as third parties, may commence interference, opposition or other related third party proceedings involving our patents or patent applications. Any challenge to, or invalidation or circumvention of, our patents or patent applications would be costly, would require significant time and attention of our management, could cause a material adverse effect on our business, financial position and results of operations and could cause the market value of our common stock to decline.
Our unpatented trade secrets, know-how, confidential and proprietary information and technology may be inadequately protected.
We rely on unpatented trade secrets, know-how and technology. This intellectual property is difficult to protect, especially in the pharmaceutical industry, where much of the information about a product must be submitted to regulatory authorities during the regulatory approval process. We seek to protect trade secrets, confidential information and proprietary information, in part, by entering into confidentiality and invention assignment agreements with employees, consultants and others. These parties may breach or terminate these agreements, and we may not have adequate remedies for such breaches. Furthermore, these agreements may not provide meaningful protection for our trade secrets or other confidential or proprietary information or result in the effective assignment to us of intellectual property, and may not provide an adequate remedy in the event of unauthorized use or disclosure of confidential information or other breaches of the agreements. Despite our efforts to protect our trade secrets and our other confidential and proprietary information, we or our collaboration partners, board members, employees, consultants, contractors, or scientific and other advisors may unintentionally or willfully disclose our proprietary information to competitors.
There is a risk that our trade secrets and other confidential and proprietary information could have been, or could, in the future, be shared by any of our former employees with, and be used to the benefit of, any company that competes with us.
If we fail to maintain trade secret protection or fail to protect the confidentiality of our other confidential and proprietary information, our competitive position may be adversely affected. Competitors may also independently discover our trade secrets. Enforcement of claims that a third party has illegally obtained and is using trade secrets is expensive, time consuming and uncertain. If our competitors independently develop equivalent knowledge, methods and know-how, we would not be able to assert our trade secret protections against them, which could have a material adverse effect on our business.
There can be no assurance of timely patent review and approval to minimize competition and generate sufficient revenues.
There can be no assurance that the USPTO will have sufficient resources to review and grant our patent applications in a timely manner. Consequently, our patent applications may be delayed for many years (if they issue as patents at all), which would prevent intellectual property protection for our products. If we fail to successfully commercialize our products due to the lack of intellectual property protection, we may be unable to generate sufficient revenues to meet or grow our business according to our expected goals and this may have a materially adverse effect on our profitability, financial condition and operations.
We may become involved in patent litigations or other intellectual property proceedings relating to our future product approvals, which could result in liability for damages or delay or stop our development and commercialization efforts.
The pharmaceutical industry has been characterized by significant litigation and other proceedings regarding patents, patent applications and other intellectual property rights. The situations in which we may become parties to such litigation or proceedings may include any third parties initiating litigation claiming that our products infringe their patent or other intellectual property rights; in such case, we will need to defend against such proceedings. For example, the field of generic pharmaceuticals is characterized by frequent litigation that occurs in connection with generic pharmaceutical companies filing ANDAs, Paragraph IV certifications and attempting to invalidate the patents of the proprietary reference drug. Any non-generic products that we successfully develop may be subject to such challenge by third parties. As a generic pharmaceutical company, we also expect to file ANDAs, Paragraph IV certifications and to attempt to invalidate patents of third party reference drugs for which we seek to develop generic versions.
The costs of resolving any patent litigation or other intellectual property proceeding, even if resolved in our favor, could be substantial. Many of our potential competitors will be able to sustain the cost of such litigation and proceedings more effectively than we can because of their substantially greater resources. Uncertainties resulting from the initiation and continuation of patent litigation or other intellectual property proceedings could have a material adverse effect on our ability to compete in the marketplace. Patent litigation and other intellectual property proceedings may also consume significant management time.
In the event that a competitor infringes upon our patent or other intellectual property rights, enforcing those rights may be costly, difficult and time-consuming. Even if successful, litigation to enforce our intellectual property rights or to defend our patents against challenge could be expensive and time-consuming and could divert our management’s attention. We may not have sufficient resources to enforce our intellectual property rights or to defend our patent or other intellectual property rights against a challenge. If we are unsuccessful in enforcing and protecting our intellectual property rights and protecting our products, it could materially harm our business.
For example, we have been involved in litigation related to our sales of enoxaparin. A preliminary injunction was issued on October 28, 2011 that barred us from selling our generic enoxaparin until the injunction was stayed on January 25, 2012. After appeal, the U.S. Supreme Court denied certiorari and on July 19, 2013, the District Court granted our motion for summary judgment in accordance with the Federal Circuit opinion and denied Momenta and Sandoz’s motion for leave to amend infringement contentions. For further details, see the section titled Litigation in Note 17 in the accompanying “Notes to Consolidated Financial Statements” in this Annual Report. Despite the ultimately favorable ruling in the litigation, the protracted litigation involved large legal expenses and the diversion of management’s time and effort away from the business. Any future adverse determinations in a judicial or administrative proceeding or failure to obtain necessary licenses could result in substantial monetary damage awards and could prevent us from manufacturing and selling our products, which could have a material and adverse effect on our financial condition.
There may also be situations where we use our business judgment and decide to market and sell products, notwithstanding the fact that allegations of patent infringement(s) have not been finally resolved by the courts, which situation is commonly referred to as an at-risk launch. The risk involved in doing so can be substantial because the remedies available to the owner of a patent for infringement may include, among other things, damages measured by the profits lost by the patent owner and not necessarily by the profits earned by the infringer as well as injunctive relief, which would halt our ability to market and sell such products altogether. In the case of a willful infringement, the definition of which is subjective, such damages may be increased up to three times. Moreover, because of the discount pricing typically involved with generic products, patented proprietary products generally realize a substantially higher profit margin than generic products. An adverse decision in a case such as this or in other similar litigation could have a material adverse effect on our business, financial position and results of operations and could cause the market value of our common stock to decline.
We may be subject to claims that we, our board members, employees or consultants have used or disclosed alleged trade secrets or other proprietary information belonging to third parties and any such individuals who are currently affiliated with one of our competitors may disclose our proprietary technology or information.
As is commonplace in the biotechnology and pharmaceutical industries, some of our board members, employees and consultants are or have been employed at, or associated with, other biotechnology or pharmaceutical companies that compete with us. While employed at or associated with these companies, these individuals may become exposed to or involved in research and technology similar to the areas of research and technology in which we are engaged. We may be subject to claims that we, or our employees, board members or consultants have inadvertently, willfully or otherwise used or disclosed alleged trade secrets or other proprietary information of those companies. Litigation may be necessary to defend against such claims.
We have entered into confidentiality agreements with our executives and key consultants. However, we do not have, and are not planning to enter into, any confidentiality agreements with our non-executive directors because they have a fiduciary duty of confidentiality as directors. Our former board members, employees or consultants who are currently employed at, or associated with, one of our competitors may unintentionally or willfully disclose our proprietary technology or information.
Risks Related to Ownership of Our Common Stock
Our quarterly and annual operating results may fluctuate significantly or may fall below the expectations of investors or securities analysts, each of which may cause our stock price to fluctuate or decline.
Our operating results may be subject to quarterly and annual fluctuations as a result of a number of factors, including the following:
|
•
|
the commercial success of our key products;
|
|
•
|
results of clinical trials of our product candidates or those of our competitors;
|
|
•
|
pricing actions by competitors;
|
|
•
|
the timing of orders from our customers;
|
|
•
|
manufacturing or supply interruptions;
|
|
•
|
actions by regulatory bodies, such as the FDA, that have the effect of delaying or rejecting approvals of our product candidates;
|
|
•
|
changes in the prescription practices of physicians;
|
|
•
|
changes or developments in laws or regulations applicable to our product candidates;
|
|
•
|
introduction of competitive products or technologies;
|
|
•
|
failure to meet or exceed financial projections we provide to the public;
|
|
•
|
actual or anticipated variations in quarterly operating results;
|
|
•
|
failure to meet or exceed the estimates and projections of securities analysts or investors;
|
|
•
|
the perception of the pharmaceutical industry by the public, legislatures, regulators and the investment community;
|
|
•
|
general economic and market conditions and overall fluctuations in U.S. equity markets;
|
|
•
|
developments concerning our sources of manufacturing supply;
|
|
•
|
disputes or other developments relating to patents or other proprietary rights;
|
|
•
|
litigation or investigations involving us, our industry, or both;
|
|
•
|
additions or departures of key scientific or management personnel;
|
|
•
|
issuances of debt, equity or convertible securities;
|
|
•
|
changes in the market valuations of similar companies;
|
|
•
|
major catastrophic events;
|
|
•
|
major changes in our board of directors or management or departures of key personnel; or
|
|
•
|
the other factors described in this “Item 1.A Risk Factors” section.
|
Any one of the factors above, or the cumulative effect of some of the factors referred to above, may result in significant fluctuations in our quarterly or annual operating results. This variability and unpredictability could result in our failing to meet our revenue, billings or operating results expectations or those of securities analysts or investors for any period. In addition, a significant percentage of our operating expenses are fixed in nature and based on forecasted revenue trends. Accordingly, in the event of revenue shortfalls, we are generally unable to mitigate the negative impact on operating results in the short term. If we fail to meet or exceed such expectations for these or any other reasons, our business could be materially adversely affected and our stock price could fluctuate or decline substantially.
In addition, if the market for pharmaceutical company stocks or the stock market in general experience a loss of investor confidence, the trading price of our common stock could decline for reasons unrelated to our business, operating results or financial condition. The trading price of our common stock might also decline in reaction to events that affect other companies in our industry even if these events do not directly affect us. Our stock price may also be affected by the expiration of market stand-offs or contractual lock-up agreements or sales of large blocks of our stock.
In the past, following periods of volatility in the market price of a company’s securities, securities class action litigation has often been brought against that company. If our stock price is volatile, we may become the target of securities litigation. Securities litigation could result in substantial costs and divert our management’s attention and resources from our business, and this could have a material adverse effect on our business, operating results and financial condition.
Future sales of our common stock may cause our stock price to decline.
If our existing stockholders sell, or indicate an intent to sell, substantial amounts of our common stock in the public market after the contractual lock-up agreements executed as part of our initial public offering and other legal restrictions on resale lapse, the trading price of our common stock could decline.
Stockholders holding approximately 49% of our outstanding shares have executed lock-up agreements pursuant to which such stockholders are prohibited from selling (i) 75% of their securities for the period of 271 to 360 days, (ii) 50% of their securities for the period of 361 days to 450 days and (iii) 25% of their securities for the period of 451 to 540 days, with each period being measured from June 24, 2014, the date of the prospectus to our initial public offering. Jefferies LLC and BMO Capital Markets Corp. may, in their joint discretion, permit securities subject to this additional lock-up to be sold prior to its expiration.
After the lock-up agreements pertaining to our initial public offering expire, up to an additional 12,754,964 shares will be eligible for sale in the public market, of which 12,523,882 are held by directors, executive officers and other affiliates and will be subject to volume limitations under Rule 144 under the Securities Act and various vesting agreements.
In addition, we have registered approximately 16.3 million shares subject to options outstanding or reserved for future issuance under our equity compensation plans. If these additional shares are sold, or if it is perceived that they will be sold, in the public market, the trading price of our common stock could decline.
Jack Y. Zhang and Mary Z. Luo, each of whom serves as a director and an executive officer, own a significant percentage of our stock and will be able to exert significant control over matters subject to stockholder approval.
As of March 18, 2015, Jack Y. Zhang and Mary Z. Luo, each of whom serves as one of our directors and executive officers, and their affiliates beneficially own approximately 23.8% of our outstanding common stock, including shares of common stock subject to options exercisable within 60 days of March 18, 2015. Our directors, executive officers and each of our stockholders who own greater than 5% of our outstanding common stock and their affiliates, in the aggregate, own approximately 26.7% of the outstanding, including shares of our common stock, based on the number of shares outstanding and shares of our common stock subject to options exercisable within 60 days of March 18, 2015. As a result, these stockholders, if acting together, will be able to influence or control matters requiring approval by our stockholders, including the election of directors and the approval of mergers, acquisitions or other extraordinary transactions. They may also have interests that differ from yours and may vote in a way with which you disagree and which may be adverse to your interests. This concentration of ownership may have the effect of delaying, preventing or deterring a change of control of our company, could deprive our stockholders of an opportunity to receive a premium for their common stock as part of a sale of our company and might ultimately affect the market price of our common stock.
We do not intend to pay dividends for the foreseeable future.
The continued operation and expansion of our business will require substantial funding. Accordingly, we do not anticipate that we will pay any cash dividends on shares of our common stock for the foreseeable future. Any determination to pay dividends in the future will be at the discretion of our board of directors and will depend upon results of operations, financial condition, contractual restrictions, restrictions imposed by applicable law and other factors our board of directors deems relevant. Our existing loan agreements restrict, and any future indebtedness may restrict, our ability to pay dividends. Investors seeking cash dividends should not purchase our common stock. Accordingly, realization of a gain on your investment will depend on the appreciation of the price of our common stock, which may never occur.
The requirements of being a public company may strain our resources, divert management’s attention and affect our ability to attract and retain executive management and qualified board members.
As a public company, we are subject to the reporting requirements of the Exchange Act, the Sarbanes-Oxley Act, the Dodd-Frank Act, the listing requirements of the NASDAQ Stock Market LLC and other applicable securities rules and regulations. Compliance with these rules and regulations will increase our legal and financial compliance costs, make some activities more difficult, time-consuming or costly and increase demand on our systems and resources, particularly after we are no longer an “emerging growth company,” as defined in the JOBS Act. The Sarbanes-Oxley Act requires, among other things, that we maintain effective disclosure controls and procedures and internal control over financial reporting. In order to maintain and, if required, improve our disclosure controls and procedures and internal control over financial reporting to meet this standard, significant resources and management oversight may be required. As a result, management’s attention may be diverted from other business concerns, which could adversely affect our business and operating results. Although we have already hired additional employees to comply with these requirements, we may need to hire more employees in the future or engage outside consultants, which will increase our costs and expenses.
In addition, changing laws, regulations and standards relating to corporate governance and public disclosure are creating uncertainty for public companies, increasing legal and financial compliance costs and making some activities more time consuming. These laws, regulations and standards are subject to varying interpretations, in many cases due to their lack of specificity, and, as a result, their application in practice may evolve over time as new guidance is provided by regulatory and governing bodies. This could result in continuing uncertainty regarding compliance matters and higher costs necessitated by ongoing revisions to disclosure and governance practices. We intend to invest resources to comply with evolving laws, regulations and standards, and this investment may result in increased general and administrative expenses and a diversion of management’s time and attention from revenue-generating activities to compliance activities. If our efforts to comply with new laws, regulations and standards differ from the activities intended by regulatory or governing bodies due to ambiguities related to their application and practice, regulatory authorities may initiate legal proceedings against us and our business may be adversely affected.
We also believe that being a public company and these new rules and regulations make it more expensive for us to obtain director and officer liability insurance.
As a result of disclosure of information in this Annual Report and in filings required of a public company, our business and financial condition are more visible, which we believe may result in threatened or actual litigation, including by competitors and other third parties. If such claims are successful, our business and operating results could be adversely affected. Even if the claims do not result in litigation or are resolved in our favor, these claims, and the time and resources necessary to resolve them, could divert the resources of our management and adversely affect our business and operating results.
We may become involved in securities class action litigation that could divert management’s attention from our business and adversely affect our business and could subject us to significant liabilities.
The stock markets have from time to time experienced significant price and volume fluctuations that have affected the market prices for the common stock of pharmaceutical companies. These broad market fluctuations as well as a broad range of other factors, including the realization of any of the risks described in this section, may cause the market price of our common stock to decline. In the past, securities class action litigation has often been brought against a company following a decline in the market price of its securities. This risk is especially relevant for us because pharmaceutical companies generally experience significant stock price volatility. We may become involved in this type of litigation in the future. Litigation is often expensive and could divert management’s attention and resources from our primary business, which could adversely affect our business. Any adverse determination in any such litigation or any amounts paid to settle any such actual or threatened litigation could require that we make significant payments.
We are an emerging growth company and the reduced reporting requirements applicable to emerging growth companies may make our common stock less attractive to investors.
We are an “emerging growth company,” as defined in the JOBS Act, and we may take advantage of certain exemptions from various reporting requirements that are applicable to public companies that are not emerging growth companies including, but not limited to, not being required to comply with the auditor attestation requirements of Section 404 of the Sarbanes-Oxley Act, reduced disclosure obligations regarding executive compensation in our periodic reports and proxy statements and exemptions from the requirements of holding a nonbinding advisory vote on executive compensation and stockholder approval of any golden parachute payments not previously approved. Investors may find our common stock less attractive because we may rely on these exemptions. If some investors find our common stock less attractive as a result, there may be a less active trading market for our common stock, and our stock price may be more volatile.
In addition, Section 107 of the JOBS Act also provides that an emerging growth company can take advantage of the extended transition period provided in Section 7(a)(2)(B) of the Securities Act for complying with new or revised accounting standards. In other words, an emerging growth company can delay the adoption of certain accounting standards until those standards would otherwise apply to private companies. However, we chose to “opt out” of such extended transition period, and as a result, we comply with new or revised accounting standards on the relevant dates on which adoption of such standards is required for non-emerging growth companies. Section 107 of the JOBS Act provides that our decision to opt out of the extended transition period for complying with new or revised accounting standards was irrevocable.
As an emerging growth company, we have also chosen to take advantage of certain provisions of the JOBS Act that allow us to provide you with less information in our public reports than would otherwise be required if we are not an emerging growth company. As a result, this Annual Report includes less information about us than would otherwise be required if we were not an emerging growth company within the meaning of the JOBS Act, which may make it more difficult for you to evaluate an investment in our company.
We would cease to be an emerging growth company upon the earliest of: (i) the last day of the fiscal year following the fifth anniversary of the completion of our initial public offering, which occurred on June 25, 2014, (ii) the last day of the fiscal year during which we have annual gross revenue of at least $1.0 billion, (iii) the date on which we are deemed to be a “large accelerated filer” under the Exchange Act (we will qualify as a large accelerated filer as of the first day of the first fiscal year after we have (a) more than $700.0 million in outstanding common equity held by our non-affiliates and (b) been public for at least 12 months; the value of our outstanding common equity will be measured each year on the last business day of our second fiscal quarter); or (iv) the date on which we have, during the previous three-year period, issued more than $1.0 billion in non-convertible debt securities.
Some provisions of our charter documents and Delaware law may have anti-takeover effects that could discourage an acquisition of us by others, even if an acquisition would be beneficial to our stockholders, and may prevent attempts by our stockholders to replace or remove our current management.
Provisions in our amended and restated certificate of incorporation and our amended and restated bylaws, as well as provisions of the Delaware General Corporation Law, or the DGCL, could depress the trading price of our common stock by making it more difficult for a third party to acquire us or increase the cost of acquiring us, even if doing so would benefit our stockholders, including transactions in which stockholders might otherwise receive a premium for their shares. These provisions include:
|
•
|
authorizing the issuance of “blank check” preferred stock, the terms of which may be established and shares of which may be issued without stockholder approval;
|
|
•
|
prohibiting stockholder action by written consent, thereby requiring all stockholder actions to be taken at a meeting of our stockholders;
|
|
•
|
eliminating the ability of stockholders to call a special meeting of stockholders;
|
|
•
|
establishing advance notice requirements for nominations for election to the board of directors or for proposing matters that can be acted upon at stockholder meetings; and
|
|
•
|
establishing a classified board of directors, whereby only one-third of the members of our board of directors are elected at one time.
|
These provisions may frustrate or prevent any attempts by our stockholders to replace or remove our current management by making it more difficult for stockholders to replace members of our board of directors, which is responsible for appointing the members of our management. In addition, we are subject to Section 203 of the DGCL, which generally prohibits a Delaware corporation from engaging in any of a broad range of business combinations with an interested stockholder for a period of three years following the date on which the stockholder became an interested stockholder, unless such transactions are approved by our board of directors. This provision could delay or prevent a change of control, whether or not it is desired by or beneficial to our stockholders, which could also affect the price that some investors are willing to pay for our common stock.
|
Unresolved Staff Comments.
|
Not applicable.
|
Properties.
|
Our manufacturing facilities are located in Rancho Cucamonga and South El Monte, California; Canton, Massachusetts; Éragny-sur-Epte, France; and Nanjing, China. We own or lease a total of 60 buildings at six locations in the U.S., France and China, that comprise 1.44 million square feet of manufacturing, research and development, distribution, packaging, laboratory, office and warehouse space. Our facilities are regularly inspected by the FDA in connection with our product approvals, and we believe that all of our facilities are being operated in material compliance with the FDA’s cGMP regulations.
We are currently expanding our facility in Nanjing, China and we expect that the investment in expanding our facility in China will require a total of up to approximately $15.0 million. We currently have contractual commitments with third parties obligating us to undertake this investment.
In April 2014, we acquired Merck’s API manufacturing business in Éragny-sur-Epte, France, which manufactures porcine insulin API and recombinant human insulin API, and expect to continue the current site activities.
The following table provides a summary of our owned properties:
|
Location
|
Aggregate
Facility Size
(in square feet)
|
Primary Use
|
Segment
|
|||
|
Rancho Cucamonga, CA
|
267,674
|
Headquarters, research and development, laboratories, manufacturing, packaging, warehousing and administration offices
|
Finished pharmaceutical products
|
|||
|
Éragny-sur-Epte, France
|
251,983
|
Manufacturing, laboratories, warehousing and administration offices
|
API
|
|||
|
Canton, MA
|
251,750
|
Manufacturing, packaging, warehousing, distribution and administration offices
|
Finished pharmaceutical products
|
|||
|
Nanjing, China
|
145,502
|
Manufacturing, research and development and warehousing
|
Finished pharmaceutical products
|
|||
|
Chino, CA
(1)
|
57,968
|
Research and development, and laboratories
|
Finished pharmaceutical products
|
|||
|
South El Monte, CA
|
10,000
|
Manufacturing
|
Finished pharmaceutical products
|
_____________________
|
(1)
|
In October 2012, we purchased a building in Chino, California that we had originally leased from MicroScience Institute, a related party, for $7.4 million.
|
The properties leased by us have expiration dates ranging from 2015 to 2025 (including certain renewal options). The following table provides a summary of our leased properties:
|
Location
|
Aggregate
Facility Size
(in square feet)
|
Primary Use
|
Segment
|
|||
|
Nanjing, China
|
41,719
|
Procurement, manufacturing, laboratories and administration offices
|
Finished pharmaceutical products
|
|||
|
Rancho Cucamonga, CA
|
94,545
|
Warehousing, distribution and administration offices
|
Finished pharmaceutical products
|
|||
|
South El Monte, CA
|
323,358
|
Manufacturing, packaging, warehousing, distribution and administration offices
|
Finished pharmaceutical products
|
We believe that our current manufacturing capacity is adequate for the near term. We have in the past approached capacity at one of our facilities largely as a result of the FDA’s request that we reintroduce certain previously discontinued products to help cope with a nation-wide shortage of these products. We believe that these capacity issues have been ameliorated as a result of certain other manufacturers re-entering the market and increasing the production of the products that were subject to the shortage.
|
Legal Proceedings.
|
The disclosure under Note 17 of the Notes to the Consolidated Financial Statements included elsewhere in this report is incorporated by reference in this Part I, Item 3.
|
Mine Safety Disclosures.
|
Not applicable.
|
Market for Registrant’s Common Equity, Related Stockholder Matters and Issuer Purchases of Equity Securities.
|
Our Common Stock is listed on the NASDAQ Global Select Market and has traded under the symbol “AMPH” since our initial public offering on June 25, 2014. Prior to this date, there was no public market for our common stock. As a result, we have not set forth quarterly information with respect to the high and low prices for our common stock for the two most recent fiscal years.
The high and low market price for our Common Stock during each of the quarterly periods since our initial public offering is included below:
|
Market Price
|
||||||
|
High
|
|
Low
|
||||
|
2014
|
|
|||||
|
Second Quarter
|
$
|
10.50
|
|
$
|
8.75
|
|
|
Third Quarter
|
$
|
12.23
|
$
|
8.69
|
||
|
Fourth Quarter
|
$
|
12.39
|
|
$
|
9.93
|
|
Dividend Policy
We have not declared or paid any dividends on our Common Stock since our initial public offering. We currently anticipate that we will retain future earnings, if any, for the development, operation and expansion of our business and do not anticipate declaring or paying any dividends in the foreseeable future. Additionally, our ability to pay dividends on our common stock is limited by restrictions under the terms of our existing credit facilities. Any future determinations related to dividend policy will be made at the discretion of our board of directors.
Holders of Record
At March 18, 2015, we had 44,564,667 shares of common stock outstanding held by approximately 421 stockholders of record of our Common Stock. We believe the actual number of stockholders is greater than this number of record holders, and includes stockholders who are beneficial owners, but whose shares are held in “street” name by brokers and other nominees. This number of holders of record also does not include stockholders whose shares may be held in trust by other entities.
Stock Performance Graph
This graph shall not be deemed “soliciting material” or to be “filed” with the Securities and Exchange Commission for purposes of Section 18 of the Securities Exchange Act of 1934, as amended (Exchange Act), or otherwise subject to the liabilities under that Section, and shall not be deemed to be incorporated by reference into any filing of Amphastar Pharmaceuticals, Inc. under the Securities Act of 1933, as amended, or the Exchange Act.
The following graph illustrates a comparison of the total cumulative stockholder return on our common stock since June 25, 2014, which is the date our common stock first began trading on the NASDAQ Global Select Market, with two indices: the NASDAQ Composite Index and the NASDAQ Pharmaceutical Index. The graph assumes an initial investment of $100 on June 25, 2014, in our common stock and in the stocks comprising each index. It also assumes reinvestment of dividends, if any. Historical stockholder return shown is not necessarily indicative of future performance, and we do not make or endorse any predictions as to future stockholder returns.
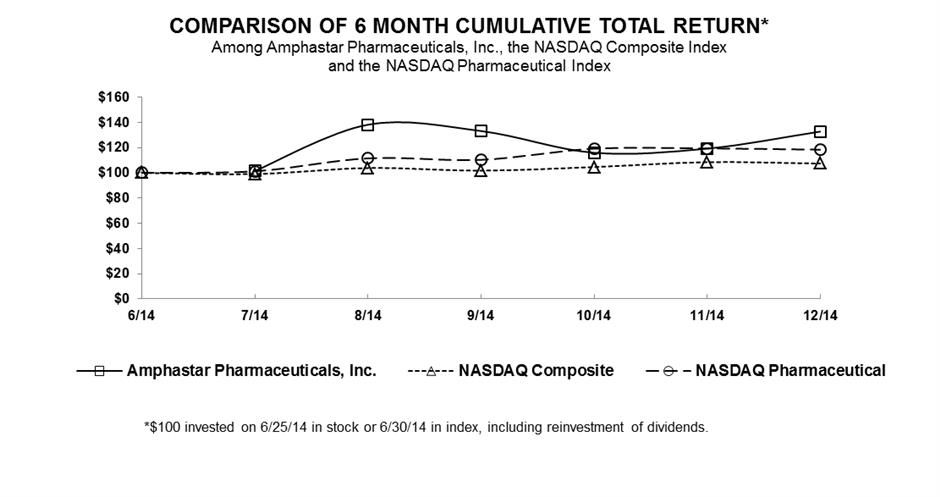
Issuer Purchases of Equity Securities During the Quarter Ended December 31, 2014
The table below provides information with respect to repurchases of our common stock.
|
Period
|
Total Number of Shares
Purchased
(1)
|
Average
Price Paid
per Share
|
Total Number of Shares
Purchased as Part of
Publicly Announced Plans
or Programs
|
Maximum Number of
Shares that May Yet Be
Purchased Under the Plans
or Programs
|
|||||||||||||
|
October 1
–
October 31, 2014
|
— | — | — | — | |||||||||||||
|
November 1
–
November 30, 2014
|
— | — | — | — | |||||||||||||
|
December 1
–
December 31, 2014
|
29,400 | $ | 11.70 | 29,400 | — | ||||||||||||
_____________________
|
(1)
|
In December 2014, we repurchased shares of our common stock as part of the $10.0 million share buyback program authorized by our Board of Directors on November 6, 2014.
|
Recent Sales of Unregistered Securities
In fiscal 2014, we granted stock options under our Amended and Restated 2005 Equity Incentive Award Plan, or the 2005 Plan, to purchase 1,661,862 shares of our common stock to certain of our officers, directors, employees and consultants at exercise prices ranging from $14.40 to $15.84 per share. During such period, we issued an aggregate of 30,000 shares of common stock that were not registered under the Securities Act pursuant to the exercise of stock options under our various stock option plans for cash consideration with aggregate exercise proceeds of $0.6 million. During the same period, we also issued an aggregate of 456,406 DSUs, to be settled in shares of our common stock, to directors, officers, employees and consultants pursuant to our equity compensation plans. These issuances were undertaken in reliance upon the exemption from registration requirements available under Rule 701 of the Securities Act.
Securities Authorized for Issuance Under Equity Compensation Plans
See Item 12, “Security Ownership of Certain Beneficial Owners and Management and Related Stockholder Matters” for information regarding securities authorized for issuance.
Use of Proceeds from Registered Securities
In June 2014, we completed an initial public offering, or IPO, in which we sold 5,840,000 shares of our common stock, which included 1,200,000 shares of our common stock pursuant to the underwriters’ exercise of their over-allotment option, at a price to the public of $7.00 per share, resulting in gross proceeds of $40.9 million. In connection with the offering, we paid $6.2 million in underwriting discounts, commissions, and offering costs, resulting in net proceeds of $34.7 million. None of the underwriting discounts and commissions or other offering expenses associated with the IPO were paid to directors, officers or their respective associates, or to persons owning 10% or more of our common stock.
We have invested the net proceeds from the IPO in product development, working capital and other general corporate purposes.
There has been no material change in the planned use of proceeds from our initial public offering as described in our final prospectus filed with the SEC pursuant to Rule 424(b).
|
Selected Financial Data.
|
The following table sets forth selected financial data as of and for the periods indicated. The selected financial data set forth below has been derived from our consolidated financial statements as of and for the years ended December 31, 2014, 2013, 2012, and 2011, which have been audited by our independent registered public accounting firm. The data presented below should be read in conjunction with our consolidated financial statements, the notes to our consolidated financial statements and Item 7 “Management’s Discussion and Analysis of Financial Condition and Results of Operations.”
|
Year Ended December 31,
|
||||||||||||||||
|
2014
|
2013
|
2012
|
2011
|
|||||||||||||
|
(in thousands, except per share data)
|
||||||||||||||||
|
Consolidated Statements of Operations Data:
|
||||||||||||||||
|
Net revenues
|
$ | 210,461 | $ | 229,681 | $ | 204,323 | $ | 118,356 | ||||||||
|
Cost of revenues
|
159,205 | 142,725 | 114,020 | 90,252 | ||||||||||||
|
Gross profit
|
51,256 | 86,956 | 90,303 | 28,104 | ||||||||||||
|
Operating expenses:
|
||||||||||||||||
|
Selling, distribution and marketing
|
5,564 | 5,349 | 4,426 | 4,100 | ||||||||||||
|
General and administrative
|
34,809 | 30,972 | 27,223 | 26,433 | ||||||||||||
|
Research and development
|
28,427 | 33,019 | 31,163 | 31,049 | ||||||||||||
|
Impairment of long-lived assets
|
439 | 126 | 2,094 | 67 | ||||||||||||
|
Total operating expenses
|
69,239 | 69,466 | 64,906 | 61,649 | ||||||||||||
|
Income (loss) from operations
|
(17,983 | ) | 17,490 | 25,397 | (33,545 | ) | ||||||||||
|
Non-operating income (expense):
|
||||||||||||||||
|
Interest income
|
243 | 187 | 242 | 401 | ||||||||||||
|
Interest expense
|
(609 | ) | (958 | ) | (784 | ) | (584 | ) | ||||||||
|
Other income, net
|
201 | 508 | 1,023 | 1,841 | ||||||||||||
|
Total non-operating income (expense)
|
(165 | ) | (263 | ) | 481 | 1,658 | ||||||||||
|
Income (loss) before income taxes
|
(18,148 | ) | 17,227 | 25,878 | (31,887 | ) | ||||||||||
|
Income tax expense (benefit)
|
(7,449 | ) | 5,365 | 7,784 | (39,639 | ) | ||||||||||
|
Net income (loss)
|
$ | (10,699 | ) | $ | 11,862 | $ | 18,094 | $ | 7,752 | |||||||
|
Net income (loss) per common share:
|
||||||||||||||||
|
Basic
|
$ | (0.25 | ) | $ | 0.31 | $ | 0.47 | $ | 0.20 | |||||||
|
Diluted
|
$ | (0.25 | ) | $ | 0.31 | $ | 0.46 | $ | 0.20 | |||||||
|
Weighted-average shares used to compute net income (loss) per common share:
|
||||||||||||||||
|
Basic
|
41,957 | 38,712 | 38,580 | 38,513 | ||||||||||||
|
Diluted
|
41,957 | 38,883 | 38,940 | 38,919 | ||||||||||||
|
December 31,
|
||||||||||||||||
|
2014
|
2013
|
2012
|
2011
|
|||||||||||||
|
(in thousands)
|
||||||||||||||||
|
Consolidated Balance Sheet Data:
|
||||||||||||||||
|
Cash, cash equivalents, restricted cash and short-term investments
|
$ | 69,323 | $ | 54,912 | $ | 52,101 | $ | 56,233 | ||||||||
|
Working capital
|
135,401 | 107,569 | 105,615 | 92,683 | ||||||||||||
|
Total assets
|
389,370
|
338,748 | 317,477 | 282,174 | ||||||||||||
|
Long-term debt and capital leases, including current portion
|
43,700 | 32,173 | 38,002 | 14,167 | ||||||||||||
|
Retained earnings
|
63,110 | 73,809 | 61,947 | 43,853 | ||||||||||||
|
Total stockholders’ equity
|
281,860
|
251,545 | 233,439 | 208,518 | ||||||||||||
|
Management’s Discussion and Analysis of Financial Condition and Results of Operations.
|
The following is a discussion and analysis of the consolidated operating results, financial condition, liquidity and cash flows of our company as of and for the periods presented below. The following discussion and analysis should be read in conjunction with the audited consolidated financial statements and the related notes thereto included in Item 8 under the heading “Financial Statements and Supplementary Data.” This discussion contains forward-looking statements that are based on the beliefs of our management, as well as assumptions made by, and information currently available to, our management. Actual results could differ materially from those discussed in or implied by forward-looking statements as a result of various factors, including those discussed below and elsewhere in this Annual Report on Form 10-K, particularly in the section entitled “Risk Factors.”
Overview
We are a specialty pharmaceutical company that focuses primarily on developing, manufacturing, marketing and selling technically-challenging generic and proprietary injectable and inhalation products. Additionally, in 2014, we commenced sales of insulin API products. We currently manufacture and sell 17 products and are developing a portfolio of 13 generic and eight proprietary injectable and inhalation product candidates.
Our largest product by net revenues is currently enoxaparin sodium injection, the generic equivalent of Sanofi S.A.’s Lovenox
®
. Enoxaparin is a difficult to manufacture injectable form of low molecular weight heparin that is used as an anticoagulant and is indicated for multiple indications, including the prevention and treatment of deep vein thrombosis.
Our pipeline of 21 generic and proprietary product candidates is in various stages of development and targets a variety of indications. With respect to these product candidates, we have filed three abbreviated new drug applications, one new drug application, or NDA, and one NDA supplement with the U.S. Food and Drug Administration, or FDA.
We have agreements with established group purchasing organizations and wholesaler networks to distribute enoxaparin, which is marketed under our own label for the hospital and clinic market. For the U.S. retail market, we have an agreement with Actavis, Inc., or Actavis, to distribute enoxaparin, which is marketed under Actavis’ label.
To complement our internal growth and expertise, we have made several strategic acquisitions of companies, products and technologies. These acquisitions collectively have strengthened our core injectable and inhalation product technology infrastructure by providing additional manufacturing, marketing and research and development capabilities including the ability to manufacture raw materials, APIs and other components for our products.
Business Segments
Our performance will be assessed and resources will be allocated based on the following two reportable segments: (1) finished pharmaceutical products and (2) active pharmaceutical ingredients, or API products. The finished pharmaceutical products segment currently manufactures, markets and distributes enoxaparin, Cortrosyn
®
, naloxone, lidocaine jelly, as well as, various other critical and non-critical care drugs. The API segment currently manufactures and distributes recombinant human insulin and porcine insulin.
Information reported herein is consistent with how it is reviewed and evaluated by our chief operating decision maker.
Factors used to identify our segments include markets, customers and products.
For more information regarding our segments, see "Part II – Item 8. Financial Statements and Supplementary Data – Notes to Consolidated Financial Statements – Segment Reporting Information."
Results of Operations
Year ended December 31, 2014 compared to year ended December 31, 2013
Net revenues
|
Year Ended December 31,
|
Change
|
|||||||||||||||
|
2014
|
2013
|
Dollars
|
%
|
|||||||||||||
|
(in thousands)
|
||||||||||||||||
|
Net revenues
|
||||||||||||||||
|
Finished pharmaceutical products
|
||||||||||||||||
|
Enoxaparin
|
$ | 107,456 | $ | 145,923 | $ | (38,467 | ) | (26 | %) | |||||||
|
Other products
|
91,024 | 83,758 | 7,266 | 9 | % | |||||||||||
|
Total finished pharmaceutical products
|
$ | 198,480 | $ | 229,681 | $ | (31,201 | ) | (14 | %) | |||||||
|
API
|
11,981 | — | 11,981 | 100 | % | |||||||||||
|
Total net revenues
|
$ | 210,461 | $ | 229,681 | $ | (19,220 | ) | (8 | %) | |||||||
|
Cost of revenues
|
||||||||||||||||
|
Finished pharmaceutical products
|
$ | 145,757 | $ | 142,725 | $ | 3,032 | 2 | % | ||||||||
|
API
|
13,448 | — | 13,448 | 100 | % | |||||||||||
|
Total cost of revenues
|
$ | 159,205 | $ | 142,725 | $ | 16,480 | 12 | % | ||||||||
|
Gross profit
|
$ | 51,256 | $ | 86,956 | $ | (35,700 | ) | (41 | %) | |||||||
|
as % of net revenues
|
24 | % | 38 | % | ||||||||||||
Net revenues were $210.5 million and $229.7 million for the years ended December 31, 2014 and 2013, respectively, representing a decrease of $19.2 million, or 8%. The decrease is primarily due to lower sales of enoxaparin and Cortrosyn
®
. Total enoxaparin and Cortrosyn
®
sales decreased $38.5 million and $2.5 million, respectively, due to lower average prices and lower unit sales. This was partially offset by sales of naloxone and other critical care products as a result of both an increase in unit sales and higher average prices. Additionally, during fiscal 2014, we commenced sales of recombinant human insulin and porcine insulin from our insulin business, which we acquired from Merck in April 2014.
We expect that the declines in both the average selling price and the number of units sold of enoxaparin will continue in 2015, as an additional competitor, Teva, recently launched a competing enoxaparin product. We recently raised prices on several other finished pharmaceutical products, so we believe that the average selling price of these products will increase in 2015.
We anticipate that sales of insulin API will increase due to sales under our supply agreement with MannKind. However, most of our API sales are denominated in Euros, and the declining value of the Euro versus the dollar will have a negative impact on API sales in 2015.
Cost of revenues
Cost of revenues was $159.2 million and $142.7 million for the years ended December 31, 2014 and 2013, respectively, representing an increase of $16.5 million, or 12%. The increase is primarily due to the overall cost of revenue at AFP of $13.4 million, relating to the cost of sales of our insulin products. We added headcount at AFP, during the year, to meet the additional planned sales quantities to MannKind. The associated expenses resulted in a negative gross margin for the AFP business. The cost of revenues as a percentage of revenues, increased to 76% from 62%. This increase as a percentage of revenues was due to lower pricing on enoxaparin and Cortrosyn
®
.
The declining prices of enoxaparin and Cortrosyn
®
will put additional downward pressure on gross margins, but this trend will be partially offset by increases in prices of several other finished pharmaceutical products.
As production levels increase at AFP, we anticipate that the API business will return to profitability.
Selling, distribution and marketing, and general and administrative
|
Year Ended December 31,
|
Change
|
|||||||||||||||
|
2014
|
2013
|
Dollars
|
%
|
|||||||||||||
|
(in thousands)
|
||||||||||||||||
|
Selling, distribution, and marketing
|
$ | 5,564 | $ | 5,349 | $ | 215 | 4 | % | ||||||||
|
General and administrative
|
34,809 | 30,972 | 3,837 | 12 | % | |||||||||||
General and administrative expenses were $34.8 million and $31.0 million for the years ended December 31, 2014 and 2013, respectively, representing an increase of $3.8 million, or 12%. The increase was primarily due to the inclusion of expenses generated at our French subsidiary, AFP, which we acquired in April 2014, and an increase in corporate compensation expenses including stock-based compensation expense.
General and administrative expenses will increase on an annual basis due to the annualization of costs associated with our insulin business acquired in April 2014, the costs associated with compliance with Sarbanes-Oxley section 404, and the full year impact of corporate public company expenses.
Research and development
|
Year Ended December 31,
|
Change
|
|||||||||||||||
|
2014
|
2013
|
Dollars
|
%
|
|||||||||||||
|
(in thousands)
|
||||||||||||||||
|
Research and development
|
$ | 28,427 | $ | 33,019 | $ | (4,592 | ) | (14 | %) | |||||||
Research and development expenses were $28.4 million and $33.0 million for the years ended December 31, 2014 and 2013, respectively, representing a decrease of $4.6 million, or 14%. The decrease is primarily due to a decrease in submission fees paid to the FDA during the year ended December 31, 2014 and a decrease in spending on materials and other research and development supplies. This decrease was partially offset by an increase in clinical trials expense.
Research and development costs consist primarily of costs associated with the research and development of our product candidates, such as salaries and other personnel-related expenses for employees involved with research and development activities, manufacturing pre-launch inventory, clinical trials, FDA fees, testing, operating and lab supplies, depreciation and amortization and other related expenses. We expense research and development costs as incurred.
We have made, and expect to continue to make, substantial investments in research and development to expand our product portfolio and grow our business. These costs will fluctuate significantly from quarter to quarter based on the timing of various clinical trials, the pre-launch costs associated with new products, and FDA filing fees. As we undertake new and challenging research and development projects, we anticipate that the associated annual costs will increase significantly in 2015 to 2017 time period.
The following table sets forth our research and development expenses for the years ended December 31, 2014 and 2013:
|
Year Ended December 31,
|
Change
|
|||||||||||||||
|
2014
|
2013
|
Dollars
|
%
|
|||||||||||||
|
(in thousands)
|
||||||||||||||||
|
Salaries and personnel-related expenses
|
$ | 11,283 | $ | 9,703 | $ | 1,580 | 16 | % | ||||||||
|
Pre-launch inventory
|
1,018 | 3,439 | (2,421 | ) | (70 | %) | ||||||||||
|
Clinical trials
|
1,915 | 41 | 1,874 | 457 | % | |||||||||||
|
FDA fees
|
— | 4,169 | (4,169 | ) | (100 | %) | ||||||||||
|
Testing, operating and lab supplies
|
6,511 | 8,824 | (2,313 | ) | (26 | %) | ||||||||||
|
Depreciation and amortization
|
3,725 | 3,242 | 483 | 15 | % | |||||||||||
|
Other expenses
|
3,975 | 3,601 | 374 | 10 | % | |||||||||||
|
Total research and development expenses
|
$ | 28,427 | $ | 33,019 | $ | (4,592 | ) | (14 | %) | |||||||
Impairment of long-lived assets
|
Year Ended December 31,
|
Change
|
|||||||||||||||
|
2014
|
2013
|
Dollars
|
%
|
|||||||||||||
|
(in thousands)
|
||||||||||||||||
|
Impairment of long-lived assets
|
$ | 439 | $ | 126 | $ | 313 | 248 | % | ||||||||
Impairment of long-lived assets was $0.4 million and $0.1 million for the year ended December 31, 2014 and 2013, respectively, representing an increase of $0.3 million, or 248%. The increase is primarily related to capitalized cost associated with a project that was suspended during the year ended December 31, 2014.
Provision for income tax expense (benefit)
|
Year Ended December 31,
|
Change
|
|||||||||||||||
|
2014
|
2013
|
Dollars
|
%
|
|||||||||||||
|
(in thousands)
|
||||||||||||||||
|
Income tax expense (benefit)
|
$ | (7,449 | ) | $ | 5,365 | $ | (12,814 | ) | (239 | %) | ||||||
|
Effective tax rate
|
(41 | %) | 31 | % | ||||||||||||
Income tax benefit was $7.4 million for the year ended December 31, 2014 compared to an income tax expense of $5.4 million for the year ended December 31, 2013, representing a decrease in income tax expense of $12.8 million, or 239%. The decrease in income tax expense is primarily related to the pre-tax loss that occurred during the year ended December 31, 2014.
Year ended December 31, 2013 compared to year ended December 31, 2012
Net revenues
|
Year Ended December 31,
|
Change
|
|||||||||||||||
|
2013
|
2012
|
Dollars
|
%
|
|||||||||||||
|
(in thousands)
|
||||||||||||||||
|
Net revenues
|
||||||||||||||||
|
Finished pharmaceutical products
|
||||||||||||||||
|
Enoxaparin
|
$ | 145,923 | $ | 127,704 | $ | 18,219 | 14 | % | ||||||||
|
Other products
|
83,758 | 76,619 | 7,139 | 9 | % | |||||||||||
|
Total finished pharmaceutical products
|
$ | 229,681 | $ | 204,323 | $ | 25,358 | 12 | % | ||||||||
|
API
|
— | — | — | — | ||||||||||||
|
Total net revenues
|
$ | 229,681 | $ | 204,323 | $ | 25,358 | 12 | % | ||||||||
|
Cost of revenues
|
||||||||||||||||
|
Finished pharmaceutical products
|
$ | 142,725 | $ | 114,020 | $ | 28,705 | 25 | % | ||||||||
|
API
|
— | — | — | — | ||||||||||||
|
Total cost of revenues
|
$ | 142,725 | $ | 114,020 | $ | 28,705 | 25 | % | ||||||||
|
Gross profit
|
$ | 86,956 | $ | 90,303 | $ | (3,347 | ) | (4 | %) | |||||||
|
as % of net revenues
|
38 | % | 44 | % | ||||||||||||
Net revenues were $229.7 million and $204.3 million for the years ended December 31, 2013 and 2012, respectively, representing an increase of $25.4 million, or 12%. The increase was primarily due to an increase of $18.2 million in sales of enoxaparin. Other product revenue increased by $7.1 million as a result of a temporary shortage by one of our competitors in the market place for these products, which we do not expect to recur in future periods.
Cost of revenues
Cost of revenues were $142.7 million and $114.0 million for the years ended December 31, 2013 and 2012, respectively, representing an increase of $28.7 million, or 25%, primarily due to an increase in sales unit volume of enoxaparin. In addition, during the year ended December 31, 2012, we benefitted from the effect of having previously expensed $7.7 million of enoxaparin inventory costs in 2011 as pre-launched inventory.
Gross profit as a percentage of net revenues was 38% and 44% for the years ended December 31, 2013 and 2012, respectively. The decrease is primarily related to the effect of having previously expensed $7.7 million of enoxaparin inventory in 2011 as pre-launched inventory.
Selling, distribution and marketing, and general and administrative
|
Year Ended December 31,
|
Change
|
|||||||||||||||
|
2013
|
2012
|
Dollars
|
%
|
|||||||||||||
|
(in thousands)
|
||||||||||||||||
|
Selling, distribution, and marketing
|
$ | 5,349 | $ | 4,426 | $ | 923 | 21 | % | ||||||||
|
General and administrative
|
30,972 | 27,223 | 3,749 | 14 | % | |||||||||||
General and administrative expenses were $31.0 million and $27.2 million for the years ended December 31, 2013 and 2012, respectively, representing an increase of $3.8 million, or 14%. The increase was primarily due to an increase in compensation expenses and an accrual of $1.0 million related to the retirement of our former Chief Financial Officer in the year ended December 31, 2013.
Research and development
|
Year Ended December 31,
|
Change
|
|||||||||||||||
|
2013
|
2012
|
Dollars
|
%
|
|||||||||||||
|
(in thousands)
|
||||||||||||||||
|
Research and development
|
$ |
33,019
|
$ | 31,163 | $ |
1,856
|
6 | % | ||||||||
Research and development expenses were $33.0 million and $31.2 million for the years ended December 31, 2013 and 2012, respectively, representing an increase of $1.9 million, or 6%. The increase is primarily related to submission fees paid to the FDA during 2013, which is offset by a decrease in clinical trial expense.
The following table sets forth our research and development expenses for the years ended December 31, 2013 and 2012:
|
Year Ended December 31,
|
Change
|
|||||||||||||||
|
2013
|
2012
|
Dollars
|
%
|
|||||||||||||
|
(in thousands)
|
||||||||||||||||
|
Salaries and personnel-related expenses
|
$ | 9,703 | $ | 8,878 | $ | 825 | 9 | % | ||||||||
|
Pre-launch inventory
|
3,439 | 3,167 | 272 | 9 | % | |||||||||||
|
Clinical trials
|
41 | 3,667 | (3,626 | ) | (99 | %) | ||||||||||
|
FDA fees
|
4,169 | — | 4,169 | 100 | % | |||||||||||
|
Testing, operating and lab supplies
|
8,824 | 8,614 | 210 | 2 | % | |||||||||||
|
Depreciation and amortization
|
3,242 | 2,106 | 1,136 | 54 | % | |||||||||||
|
Other expenses
|
3,601 | 4,731 | (1,130 | ) | (24 | %) | ||||||||||
|
Total research and development expenses
|
$ | 33,019 | $ | 31,163 | $ | 1,856 | 6 | % | ||||||||
Impairment of long-lived assets
|
Year Ended December 31,
|
Change
|
|||||||||||||||
|
2013
|
2012
|
Dollars
|
%
|
|||||||||||||
|
(in thousands)
|
||||||||||||||||
|
Impairment of long-lived assets
|
$ | 126 | $ | 2,094 | $ | (1,968 | ) | (94 | %) | |||||||
Impairment of long-lived assets was $0.1 million and $2.1 million for years ended December 31, 2013 and 2012, respectively, representing a decrease of $2.0 million, or 94%. The decrease primarily related to equipment for a production project that was suspended during the year ended December 31, 2012.
Provision for income tax expense
|
Year Ended December 31,
|
Change
|
|||||||||||||||
|
2013
|
2012
|
Dollars
|
%
|
|||||||||||||
|
(in thousands)
|
||||||||||||||||
|
Income tax expense
|
$ | 5,365 | $ | 7,784 | $ | (2,419 | ) | (31 | %) | |||||||
|
Effective tax rate
|
31 | % | 30 | % | ||||||||||||
Income tax expense was $5.4 million and $7.8 million for the years ended December 31, 2013 and 2012, respectively, representing a decrease in income tax expense of $2.4 million, or 31%. The decrease in income tax expense is primarily related to the retroactive application in the year ended December 31, 2013 of the federal research and development tax credit for the 2012 tax year. The legislation renewing the allowance of the federal R&D tax credit for 2012 was not passed into law until January 2013, therefore, the R&D tax credit was not factored into our 2012 income tax expense. Also, the decrease in income tax expense is related to a decrease in taxable income.
Liquidity and Capital Resources
Cash Requirements and Sources
Our business requires capital resources in order to maintain and expand our business. Our future capital expenditures will include projects undertaken to upgrade, expand and improve our manufacturing facilities in the United States, China and France. Our cash obligations include the principal and interest payments due on our existing loans as described below and throughout this report. We believe that our cash reserves, operating cash flows, and availability under our revolving credit facility will be sufficient to meet our cash needs for the foreseeable future.
Working capital increased $27.8 million to $135.4 million at December 31, 2014 compared to $107.6 million at December 31, 2013. The increase in working capital was primarily due to cash in-flows from operations of $21.1 million and the proceeds from our initial public offering of $34.7 million, partially offset by payments on long-term debt of $8.2 million and capital expenditures of $20.5 million.
Cash Flows from Operations
The following table summarizes our cash flows used in operating, investing, and financing activities for the years ended December 31, 2014, 2013 and 2012.
|
Year Ended December 31,
|
||||||||||||
|
2014
|
2013
|
2012
|
||||||||||
|
(in thousands)
|
||||||||||||
|
Statement of Cash Flow Data:
|
||||||||||||
|
Net cash provided by (used in)
|
||||||||||||
|
Operating activities
|
$ |
21,052
|
$ |
31,042
|
$ | (1,650 | ) | |||||
|
Investing activities
|
(39,773 | ) | ( 18,298 | ) | (25,112 | ) | ||||||
|
Financing activities
|
32,117
|
(9,370 | ) | 23,237 | ||||||||
|
Effect of exchange rate changes on cash
|
845
|
— | — | |||||||||
|
Net increase (decrease) in cash and cash equivalents
|
$ | 14,241 | $ | 3,374 | $ | (3,525 | ) | |||||
Sources and Use of Cash
Operating Activities
Net cash provided by operating activities was $21.1 million for the year ended December 31, 2014, which included a net loss of $10.7 million. Non-cash items are comprised of $14.4 million of depreciation and amortization, $9.3 million of share-based compensation expense, and a $5.8 million change in deferred taxes and other tax related items. Additionally, we received a deposit of €11.0 million, or approximately $14.0 million, from MannKind for future deliveries of insulin.
Investing Activities
Net cash used in investing activities of $39.8 million for the year ended December 31, 2014 was primarily related to the purchase of an API facility in France from Merck with an initial payment of $18.4 million, and $20.5 million in purchases of property, machinery, and equipment, including the associated capitalized labor and interest on self-constructed assets. Additionally, $0.8 million in deposits were made for machinery and equipment.
Financing Activitie
s
Net cash provided by financing activities of $32.1 million for the year ended December 31, 2014 was primarily related to proceeds of our initial public offering of $38.0 million, after deducting $2.9 million in underwriting discounts and commissions incurred in connection therewith. We also paid $3.3 million in offering expense incurred in connection with the IPO, resulting in net proceeds of $34.7 million. Additionally, net cash provided by financing activities included $21.9 million in borrowings related to the purchase of the API facility in France from Merck, and $4.6 million relating to the refinancing of an existing mortgage. This was offset by $1.9 million related to the cost associated with the initial public offering, $15.0 million in net repayments related to our line of credit, $14.2 million in principal payments on debt, and $1.1 million relating to the tax benefit of options exercised.
Debt and Borrowing Capacity
Our outstanding debt obligations are summarized as follows:
|
December 31,
|
||||||||||||
|
2014
|
2013
|
change
|
||||||||||
|
(in thousands)
|
||||||||||||
|
Short-term debt and current portion of long-term debt
|
|
$
|
7,594
|
|
$
|
22,104
|
|
$
|
(14,510
|
)
|
||
|
Long-term debt
|
|
36,106
|
|
10,069
|
|
26,038
|
|
|||||
|
Total debt
|
|
$
|
43,700
|
|
$
|
32,173
|
|
$
|
11,528
|
|||
The increase in long-term debt is primarily related to the debt associated with the Merck API Transaction and the refinancing of an existing mortgage which was to mature in March 2014 and will now mature in April 2021.
As of December 31, 2014, we had $38.0 million in unused borrowing capacity under revolving lines of credit with Cathay Bank and East West Bank.
Indebtedness
Line of Credit Facility — Due March 2016
In March 2012, we entered into a $10.0 million line of credit facility with East West Bank. Borrowings under the facility are secured by inventory and accounts receivable. Borrowings under the facility bear interest at the prime rate as published by
The Wall Street Journal
. This facility was to mature in July 2014. In April 2014, we extended the maturity date to March 2016. As of December 31, 2014, we did not have any amounts outstanding under this facility.
Revolving Line of Credit — Due May 2016
In April 2012, we entered into a $20.0 million revolving line of credit facility with Cathay Bank. Borrowings under the facility are secured by inventory, accounts receivables, and intangibles held by us. The facility bears interest at the prime rate as published by
The Wall Street Journal
with a minimum interest rate of 4.00%. This revolving line of credit was to mature in May 2014. In April 2014, we modified the facility to extend the maturity date to May 2016. As of December 31, 2014, we did not have any amounts outstanding under this facility.
Line of Credit Facility — Due January 2019
In July 2013, we entered into an $8.0 million line of credit facility with East West Bank. Borrowings under the facility are secured by equipment. We paid monthly interest-only payments on the loan until January 2015, after which we began making 48 monthly principal and interest payments. The facility bears interest at the prime rate as published in
The Wall Street Journal
plus 0.25% and matures in January 2019. As of December 31, 2014, we did not have any amounts outstanding under this facility.
Financial Covenants Under Lines of Credit
At December 31, 2014, we were not in compliance with two of our financial covenants with Cathay Bank. The first one required a fixed charge coverage ratio of 1.2 to 1.0, or greater, and the second one required a minimum debt service coverage ratio of 1.5 to 1.0, or greater. On March 13, 2015, we obtained a waivers of these debt covenants for the period ending December 31, 2014. At December 31, 2013, we were in compliance with all of our debt covenants, which include a minimum current ratio, minimum debt service coverage, minimum tangible net worth and maximum debt-to-effective-tangible-net-worth ratio, computed on a consolidated basis in some instances and on a separate-company basis in others.
Weighted-Average Interest Rates Under Lines of Credit
The weighted-average interest rates on lines of credit as of December 31, 2014 and 2013 were 3.6% and 4.1%, respectively.
Acquisition Loan with Cathay Bank — Due April 2019
On April 22, 2014, in conjunction with our acquisition of Merck’s API manufacturing business in Éragny-sur-Epte, France, we entered into a secured term loan with Cathay Bank as lender. The principal amount of the loan is $21.9 million and bears a variable interest rate at the prime rate as published by
The Wall Street Journal
, with a minimum interest rate of 4.00%. Beginning on June 1, 2014 and through the maturity date, April 22, 2019, we must make monthly payments of principal and interest equal to the then outstanding amount of the loan amortized over a 120-month period. On April 22, 2019, all amounts outstanding under the loan become due and payable, which would be approximately $12.0 million based upon an interest rate of 4.00%. The loan is secured by 65% of the issued and outstanding shares of stock in Amphastar France Pharmaceuticals S.A.S., or AFP, a subsidiary we established in France in order to facilitate the acquisition, and certain assets of ours, including accounts receivable, inventory, certain investment property, goods, deposit accounts and general intangibles but not including our equipment and real property.
The loan includes customary restrictions on, among other things, our ability to incur additional indebtedness, pay dividends in cash or make other distributions in cash, make certain investments, acquire other companies, create liens, sell assets and make loans. The loan also contains customary financial covenants, computed on a consolidated basis, which include a minimum tangible net worth, a maximum total liabilities to tangible net worth ratio, a minimum current ratio, a minimum profitability and a minimum fixed charge coverage ratio.
The loan also includes customary events of default, the occurrence and continuation of any of which provide Cathay Bank the right to exercise remedies against us and the collateral securing the loan. These events of default include, among other things, our failure to pay any amounts due under the loan, our insolvency, the occurrence of any default under certain other indebtedness or material agreements and a final judgment against us that is not discharged in 30-days.
Merck Payment Obligation — Due December 2017
On April 30, 2014, in conjunction with the Merck API Transaction, we entered into a commitment obligation with Merck, in the principal amount of €11.6 million, or $16.0 million, subject to currency exchange fluctuations. The terms of the purchase price include annual payments over four years and bear a fixed interest rate of 3.00%. The final payment to Merck relating to this obligation is due December 2017. In December 2014, we made a principal payment of €4.9 million, or $6.0 million.
As of December 31, 2014, the payment obligation had a book value of €6.9 million, or $8.2 million, which approximates fair value. The fair value of the payment obligation was determined by using the interest rate associated with our acquisition loan with Cathay Bank that bears a variable interest rate at the prime rate as published by
T
he Wall Street Journal
, with a minimum interest rate of 4.00%. The fair value of the debt obligation is not re-measured on a recurring basis and the variable interest rate is deemed to be a Level 2 input for measuring fair value.
Critical Accounting Policies
We prepare our consolidated financial statements in accordance with U.S. generally accepted accounting principles, or GAAP. The preparation of consolidated financial statements in conformity with GAAP requires management to make estimates and assumptions that affect the amounts reported in the consolidated financial statements and accompanying notes. Actual results could differ from those estimates. In some cases, changes in the accounting estimates are reasonably likely to occur from period to period. Accordingly, actual results could differ materially from our estimates. To the extent that there are material differences between these estimates and actual results, our financial condition and results of operations will be affected. We base our estimates on past experience and other assumptions that we believe are reasonable under the circumstances, and we evaluate these estimates on an ongoing basis. We refer to accounting estimates of this type as critical accounting policies, which we discuss further below. While our significant accounting policies are more fully described in Note 2 to our audited consolidated financial statements, we believe that the following accounting policies are critical to the process of making significant judgments and estimates in the preparation of our audited consolidated financial statements.
Revenue Recognition
Our net revenues consist principally of revenues generated from the sale of our pharmaceutical products and profit sharing revenues received under our profit sharing agreement with Actavis. We also generate a small amount of revenues from contract manufacturing services. Generally, we recognize revenues at the time of product delivery to our customers. In some cases, revenues are recognized at the time of shipment when stipulated by the terms of the sale agreements. We also record profit-sharing revenues, which are included in net revenues, from a distribution agreement with Actavis at the time Actavis sells the products to its customers. Revenues derived from contract manufacturing services are recognized when third-party products are shipped to customers, after the customer has accepted test samples of the products to be shipped.
We do not recognize product revenues unless the following fundamental criteria are met: (i) persuasive evidence of an arrangement exists, (ii) transfer of title has occurred, (iii) the price to the customer is fixed or determinable and (iv) collection is reasonably assured. Furthermore, we do not recognize revenues until all customer acceptance requirements have been met. We estimate and record reductions to revenues for early-payment discounts, product returns, administrative and management fees, rebates and pricing adjustments, such as wholesaler chargebacks, in the same period that the related revenues are recorded.
If actual future payments for the discounts, returns, fees, rebates and chargebacks exceed the estimates we made at the time of sale, our financial position, results of operations and cash flows would be negatively impacted. As discussed under “Accrual for Product Returns” below, we are generally obligated to accept from our customers the return of pharmaceuticals that have or will soon reach their expiration dates. We establish reserves for such amounts based on historical experience and other information available at the time of sale, but the actual returns will not occur until several years after the sale. We have significant experience with returns of our products other than enoxaparin, but since we only began selling our enoxaparin product in January 2012, we have limited experience with returns of expired enoxaparin. Although we believe that our estimates and assumptions are reasonable as of the date when made, actual results may differ significantly from these estimates. Our financial position, results of operations and cash flows may be materially and negatively impacted if actual returns exceed our estimated allowances for returns.
We establish allowances for estimated chargebacks and product returns based on a number of qualitative and quantitative factors, including:
|
|
▪
|
contract pricing and return terms of our agreements with customers;
|
|
|
▪
|
wholesaler inventory levels and turnover;
|
|
|
▪
|
historical chargeback and product return rates;
|
|
|
▪
|
shelf lives of our products, which is generally two years, as is the case with enoxaparin;
|
|
|
▪
|
direct communication with customers;
|
|
|
▪
|
anticipated introduction of competitive products or authorized generics; and
|
|
|
▪
|
anticipated pricing strategy changes by us and/or our competitors
|
Provision for Wholesaler Chargebacks
The provision for chargebacks is a significant estimate used in the recognition of revenues. As part of our sales terms with wholesale customers, we agree to reimburse wholesalers for differences between the wholesale prices, at which we sell our products to wholesalers, and the lower prices at which the products are resold under our various contractual arrangements with third parties such as hospitals and group purchasing organizations. We estimate chargebacks at the time of sale to wholesalers based on wholesaler inventory stocking levels, historic chargeback rates and current contract pricing.
The provision for chargebacks is reflected in net revenues and a reduction to accounts receivable. The following table is an analysis of our chargeback provision:
|
Year Ended
December 31,
|
||||||||
|
2014
|
2013
|
|||||||
|
(in thousands)
|
||||||||
|
Beginning balance
|
$ | 18,104 | $ | 11,898 | ||||
|
Provision related to sales made in the current period
|
156,235 | 213,075 | ||||||
|
Credits issued to third parties
|
(162,467 | ) | (206,869 | ) | ||||
|
Ending balance
|
$ | 11,872 | $ | 18,104 | ||||
Changes in the chargeback provision from period to period are primarily dependent on our sales to wholesalers, the level of inventory held at the wholesalers and the wholesalers’ customer mix. The approach that we use to estimate chargebacks has been consistently applied for all periods presented. Variations in estimates have been historically small. We continually monitor the provision for chargebacks and make adjustments when we believe that the actual chargebacks may differ from the estimates. The settlement of chargebacks generally occurs within 30 days after the sale to wholesalers.
Accrual for Product Returns
We offer most customers the right to return qualified excess or expired inventory for partial credit; however, products sold to Actavis are non-returnable. Our product returns primarily consist of the returns of expired products from sales made in prior periods. Returned products cannot be resold. At the time product revenues are recognized, we record an accrual for estimated returns. The accrual is based, in part, upon the historical relationship of product returns to sales and customer contract terms. We also assess other factors that could affect product returns including market conditions, product obsolescence and the introduction of new competition. Although these factors do not normally give our customers the right to return products outside of the regular return policy, we realize that such factors could ultimately lead to increased returns. We analyze these situations on a case-by-case basis and make adjustments to the product return reserve as appropriate.
When we do not have specific historical experience with actual returns for a product, we consider other available information to record a reasonable product return reserve. If we already sell products that are similar to a newly launched product, we estimate the new product return rate using historical experience of similar products. If there are similar products on the market produced by other companies, we may also consider the additional relevant industry data in calculating our estimate. The criteria used to make the determination of whether a new product is similar to existing products includes whether it: (i) is used for the treatment of a similar type of disease or indication, (ii) has a comparable shelf life, (iii) has similar frequency of dosing, (iv) has similar types of customers, (v) is distributed in a similar manner and (vi) has similar rights of return and other comparable sales incentives. We also consider whether we have the ability to monitor inventory levels in our distribution channels to determine the underlying patient demand for a new product. We analyze the product’s sell-through cycle based on wholesaler chargeback claims and customers’ re-ordering patterns to determine whether the estimated product return rate is reasonable. Additionally, we consider factors such as size and maturity of the market prior to launch and the introduction of additional competition. If the available information is not sufficient to record a reasonable product return accrual, revenues from the sales of the new product would be deferred until the product is consumed by the end customer or rights of return granted under the return policy have expired. Historically, we have not deferred revenues on any of our products.
On each balance sheet date, we classify that portion of our accrual for product returns that is attributable to products that are eligible for return within 12 months following the balance sheet date as a current obligation and the remainder as a long-term obligation.
The provision for product returns is reflected in net revenues. The following table is an analysis of our product return liability:
|
Year Ended
December 31,
|
||||||||
|
2014
|
2013
|
|||||||
|
(in thousands)
|
||||||||
|
Beginning balance
|
$ | 4,592 | $ | 2,673 | ||||
|
Provision for product returns
|
(714 | ) | 2,711 | |||||
|
Credits issued to third parties
|
(1,470 | ) | (792 | ) | ||||
|
Ending balance
|
$ | 2,408 | $ | 4,592 | ||||
For the years ended December 31, 2014 and 2013, our aggregate product return rate was 1.1% and 1.4% of qualified sales, respectively.
Inventory
Inventories, net of allowances, are stated at the lower of cost or market. Cost is determined by the first-in, first-out method. Inventories are reviewed periodically for slow-moving or obsolete status. We adjust our inventory to reflect situations in which the cost of inventory is not expected to be recovered. We would record a reserve to adjust inventory to its net realizable value: (i) if a launch of a new product is delayed and inventory may not be fully utilized and could be subject to impairment, (ii) when a product is close to expiration and not expected to be sold, (iii) when a product has reached its expiration date, or (iv) when a product is not expected to be sellable. In determining the reserves for these products, we consider factors such as the amount of inventory on hand and its remaining shelf life and current and expected market conditions, including management forecasts and levels of competition.
Impairment of Intangibles and Long-Lived Assets
We review long-lived assets and identifiable intangible assets for impairment whenever events or changes in circumstances indicate that the carrying amount of an asset may not be recoverable. Such events and circumstances include decisions by the FDA regarding evidence of effectiveness of proprietary drug candidates or bioequivalence (sameness) of our generic product candidates as compared to the reference drug, communication with the regulatory agencies regarding the safety and efficacy of our products under review, the use of the asset in current research and development projects, any potential alternative uses of the asset in other research and development projects in the short-to-medium term, clinical trial results and research and development portfolio management options. Determination of recoverability is based on an estimate of undiscounted future cash flows resulting from the use of the asset and its eventual disposition. If the sum of the expected future undiscounted cash flows is less than the carrying amount of the asset, further impairment analysis is performed. An impairment loss is measured as the amount by which the carrying amount exceeds the fair value of the assets (assets to be held and used) or fair value less cost to sell (assets to be disposed of).
Indefinite-lived intangibles, which include goodwill and the Primatene
®
Mist trademark acquired in June 2008, are tested for impairment annually or more frequently if indicators of impairment are present. An impairment loss is recorded if the asset’s fair value is less than its carrying value. We also periodically review the Primatene
®
Mist trademark to determine if events and circumstances continue to support an indefinite useful life. If the life is no longer indefinite, the asset is tested for impairment. The carrying value, after recognition of any impairment loss, is amortized over its remaining useful life.
Since December 31, 2011 we are no longer allowed to distribute the CFC formulation of our Primatene
®
Mist product related to this intangible asset. However, we have developed a hydrofluoroalkane, or HFA, version of this product, which we plan to market under the same trade name. In 2013, we filed a new drug application, or NDA, for Primatene
®
Mist HFA. In May 2014, we received a complete response letter, or CRL, from the FDA, which requires additional non-clinical information, label revisions and follow-up studies (label comprehension, behavioral and actual use) to assess consumers’ ability to use the device correctly to support approval of the product in the over-the-counter setting. Additionally, the CRL noted current Good Manufacturing Practices, or cGMP, deficiencies in a recent inspection of our API supplier’s manufacturing facility, which produces epinephrine, and indicated that our NDA could not be approved until these issues were resolved. Subsequent to the receipt of the CRL, the supplier notified us that the cGMP deficiencies were satisfactorily resolved. Accordingly, we believe this condition for approval has been satisfied. We met with the FDA in October 2014 to discuss preliminary data results and to clarify the FDA requirements for further studies. We are in the process of generating the remaining data required by the CRL and plan to submit an NDA amendment that we believe will address the FDA’s concerns. However, there can be no guarantee that any amendment to our NDA will result in timely approval of the product or approval at all.
All of our impairments relate primarily to the write-off of certain manufacturing equipment related to abandoned projects. Since we periodically assess our product candidates and make changes to product development plans, we incur impairment charges from time to time. These charges can fluctuate significantly from period to period.
Deferred Income Taxes
We utilize the liability method of accounting for income taxes. Under the liability method, deferred taxes are determined based on the temporary differences between the financial statements and tax basis of assets and liabilities using enacted tax rates. A valuation allowance is recorded when it is more likely than not that the deferred tax assets will not be realized. We have adopted the with-and-without methodology for determining when excess tax benefits from the exercise of share-based awards are realized. Under the with-and-without methodology, current year operating loss deductions and prior year operating loss carryforwards are deemed to be utilized prior to the utilization of current year excess tax benefits from share-based awards.
A number of years may elapse before an uncertain tax position for which we have established a tax reserve is audited and finally resolved. The number of years for which we can be subject to audit varies depending on the tax jurisdiction. While it is often difficult to predict the final outcome or the timing of the resolution of an audit, we believe that our reserves for uncertain tax benefits reflect the outcome of tax positions that is more likely than not to occur. The resolution of a matter could be recognized as an adjustment to our provision for income taxes and our effective tax rate in the period of resolution, and may also require a use of cash.
Share-Based Compensation
Options issued under our Amended and Restated 2005 Equity Incentive Award Plan, or the 2005 Plan, are generally granted at prices equal to or greater than the fair value of the underlying shares on the date of grant and vest based on continuous service. The options have a contractual term of five to ten years and generally vest over a three- to five-year period. The fair value of each option is amortized into compensation expense on a straight-line basis between the grant date for the option and the vesting date. The awards of restricted common stock such as deferred stock units, or DSUs, are valued at fair value on the date of grant. We use the Black-Scholes option pricing model to determine the fair value of share-based awards. The Black-Scholes option pricing model has various inputs such as the estimated common share price, the risk-free interest rate, volatility, expected life and dividend yield, all of which are estimates. We used the risk free rate on U.S. Treasury securities at the time of grant for instruments with maturities commensurate with the expected term of the stock option. Our volatility estimate was based on a set of peer companies, since our shares do not have sufficient trading history. Our dividend yield was assumed to be 0%, because we have no plans to pay dividends. We also record share-based compensation expense net of expected forfeitures. The change of any of these inputs could significantly impact the determination of the fair value of our options and thus could significantly impact our results of operations. There are no significant awards with performance conditions and no awards with market conditions.
Common Stock Valuation
For all equity grants prior to our IPO, we were required to estimate the fair value of the common stock underlying our share-based awards when performing the fair value calculations with the Black-Scholes option-pricing model. The fair values of the common stock underlying our share-based awards were determined by our board of directors, with input from management and contemporaneous third-party valuations. We believe that our board of directors has the relevant experience and expertise to determine the fair value of our common stock. As described below, the exercise price of our share-based awards was determined by our board of directors based on the most recent third-party valuation report as of the grant date.
Given the absence of a public trading market of our common stock, and in accordance with the
American Institute of Certified Public Accountants Practice Guide, Valuation of Privately-Held-Company Equity Securities Issued as Compensation
, our board of directors exercised reasonable judgment and considered numerous objective and subjective factors to determine the best estimate of the fair value of our common stock including:
|
|
▪
|
valuations of our common stock performed by unrelated third-party specialists;
|
|
|
▪
|
our launch of new products into the market and forward looking assumptions of our pipeline;
|
|
|
▪
|
results of litigation;
|
|
|
▪
|
receipt of FDA approvals and PDUFA dates;
|
|
|
▪
|
lack of marketability of our common stock;
|
|
|
▪
|
our actual operating and financial performance and forward looking assumptions;
|
|
|
▪
|
current business conditions and projections;
|
|
|
▪
|
hiring of key personnel and the experience of our management;
|
|
|
▪
|
our company history and the introduction of new products;
|
|
|
▪
|
our stage of development;
|
|
|
▪
|
likelihood of achieving a liquidity event, such as an initial public offering or a merger or acquisition of our company given prevailing market conditions;
|
|
|
▪
|
the market performance of comparable publicly traded companies; and
|
|
|
▪
|
the U.S. and global capital market conditions.
|
The dates of our valuation reports, which were prepared on a quarterly basis, were not always contemporaneous with the grant dates of our share-based awards. Therefore, in those cases where the report was not contemporaneous with the grant date of the stock based awards, we considered the amount of time between the valuation report date and the grant date to determine whether to use the latest common stock valuation report for the purposes of determining the fair value of our common stock for financial reporting purposes. If share-based awards were granted in a short period of time preceding the date of a valuation report, we assessed the fair value of such share-based awards used for financial reporting purposes after considering the fair value reflected in the subsequent valuation report and other facts and circumstances on the date of grant as discussed below. There were significant judgments and estimates inherent in these valuations, which included assumptions regarding our future operating performance, the time to completing an initial public offering or other liquidity event and the determinations of the appropriate valuation methods to be applied.
In valuing our common stock, our board of directors determined the equity value of our business using generally accepted valuation methodologies including discounted cash flow analysis and comparable public company analysis.
Discounted cash flow analysis measures the value of a company by the present value of its future economic benefits. These benefits can include earnings, cost savings, tax deductions and proceeds from disposition. Value indications are developed by discounting expected cash flows to their present value at a rate of return that incorporates the risk-free rate for the use of funds, the expected rate of inflation and risks associated with the particular investment.
The comparable public company analysis measures the value of a company through the analysis of recent sales of comparable companies focused on the sale of pharmaceuticals as traded in the public markets. This method of valuation involves analyzing transaction and financial data of publicly-traded companies to develop multiples. These multiples, usually of estimated sales, earnings before interest, taxes, depreciation and amortization, or EBITDA, and net income, are then applied to the subject company to develop an indication of value. For purposes of our comparable public company analysis, our peer group of U.S.-based publicly traded companies used for valuation estimates, including the determination of the discount rate, volatility assumptions and market trading multiples is comprised of companies that focus primarily on the sale of pharmaceutical products. More specifically, we focused on companies with similar pharmaceutical product offerings in the injectable and inhalation markets. From time to time, we updated the set of peer group companies as new or more relevant information became available. Within each valuation report, this peer group was used for valuation estimates, including the determination of the discount rate, volatility assumptions and market trading multiples. While we believe that these groups of comparable companies were appropriate, there are differences in size or stage of maturity between many of our selected peer public companies and us. Therefore, had a different set of peer companies been used, a different valuation may have resulted.
Once calculated, the board determines the midpoint of the results of the discounted cash flow and the market comparable approach and then weights the two methodologies to determine an estimated enterprise value.
Once an enterprise value was determined, we utilized the option pricing method, or OPM, to allocate the equity value to our common stock. The OPM values each equity class by creating a series of call options on our equity value, with exercise prices based on the strike prices of derivatives. This method is generally preferred when future outcomes are difficult to predict and dissolution or liquidation is not imminent. The inability to readily sell shares of a company increases the owner’s exposure to changing market conditions and increases the risk of ownership. Because of the lack of marketability and the resulting increased risk associated with ownership of a privately-held stock, an investor typically demands a higher return or yield in comparison to a similar but publicly-traded stock. An indication of the discount for lack of marketability can be developed using a put option model. A put option model values what the illiquid security holder lacks, the ability to sell his or her shares. Theoretically, a holder of an illiquid security and a put option, and a holder of an identical, but liquid security, are in the same financial position. The put option model has the benefit of being company-specific (through the use of a company-specific volatility rate), verifiable and has relatively few inputs (risk free rate, term and volatility).
JOBS Act Accounting Election
Under the JOBS Act, emerging growth companies can delay adopting new or revised accounting standards issued subsequent to the enactment of the JOBS Act until such time as those standards apply to private companies. We have irrevocably elected not to avail ourselves of this exemption from new or revised accounting standards, and, therefore, will be subject to the same new or revised accounting standards as other public companies that are not emerging growth companies.
Recent Accounting Pronouncements
In July 2013, the Financial Accounting Standards Board, or FASB, issued an Accounting Standard Update to the accounting guidance to address the diversity in practice related to the financial statement presentation of unrecognized tax benefits as either a reduction of a deferred tax asset or a liability when a net operating loss carryforward, a similar tax loss, or a tax credit carryforward exists. This guidance is effective prospectively for fiscal years, and interim periods within those years, beginning after December 15, 2013. The adoption of this guidance did not have a material impact on our consolidated financial statements.
In April 2014, the FASB issued an accounting standards update that raises the threshold for disposals to qualify as discontinued operations and allows companies to have significant continuing involvement with and continuing cash flows from or to the discontinued operation. It also requires additional disclosures for discontinued operations and new disclosures for individually material disposal transactions that do not meet the definition of a discontinued operation. This guidance will be effective for fiscal years beginning after December 15, 2014, which will be our fiscal year 2015, with early adoption permitted. We do not expect the adoption of the guidance will have a material impact on our consolidated financial statements.
In May 2014, the FASB issued an accounting standards update that creates a single source of revenue guidance for companies in all industries. The new standard provides guidance for all revenue arising from contracts with customers and affects all entities that enter into contracts to provide goods or services to their customers, unless the contracts are within the scope of other accounting standards. It also provides a model for the measurement and recognition of gains and losses on the sale of certain nonfinancial assets. This guidance must be adopted using either a full retrospective approach for all periods presented or a modified retrospective approach and will be effective for fiscal years beginning after December 15, 2016, which will be our fiscal year 2017. We have not yet evaluated the potential impact of adopting the guidance on our consolidated financial statements.
In June 2014, the FASB issued an accounting standards update that requires a performance target that affects vesting of a share-based payment award and that could be achieved after the requisite service period to be treated as a performance condition. As such, the performance target should not be reflected in estimating the grant-date fair value of the award. Compensation cost should be recognized over the required service period, if it is probable that the performance target will be achieved. This guidance will be effective for fiscal years beginning after December 15, 2015, which will be our fiscal year 2016, with early adoption permitted. We do not expect the adoption of the guidance will have a material impact on our consolidated financial statements.
In August 2014, the FASB issued an accounting standards update that will require management to evaluate if there is substantial doubt about our ability to continue as a going concern and, if so, to disclose this in both interim and annual reporting periods. This guidance will become effective for our annual filing for the period ending December 31, 2016 and interim periods thereafter, and allows for early adoption. We do not expect the adoption of the guidance will have a material impact on our consolidated financial statements.
Non-GAAP Financial Measures
We report our financial results in accordance with accounting principles generally accepted in the United States, or GAAP.
Agreements with Corporate Partners
Distribution Agreement with Actavis, Inc.
In May 2005, we entered into an agreement to grant certain exclusive marketing rights for our enoxaparin product to Andrx Pharmaceuticals, Inc., or Andrx, which generally extends to the U.S. retail pharmacy market. To obtain such rights, Andrx made a non-refundable, upfront payment of $4.5 million to us upon execution of the agreement which was classified as deferred revenues. Under the agreement, we are paid a fixed cost per unit sold to Andrx and also receive a percentage between 50% and 55% of the gross profits from Andrx’s sales of the product in the U.S. retail pharmacy market. In November 2006, Watson Pharmaceuticals, Inc., or Watson, acquired Andrx and all of the rights and obligations associated with the agreement. In January 2013, Watson adopted Actavis as its new global name. The agreement has a term that expires in January 2019 and can be extended by Actavis for an additional three years. The agreement may only be terminated prior to the end of the term by either party in the case of a breach of contract or insolvency of the other party, by us if Actavis fails to purchase a minimum number of units and by Actavis if an infringement claim is made against Actavis.
We manufacture our enoxaparin product for the retail market according to demand specifications of Actavis. Upon shipment of enoxaparin to Actavis, we recognize product sales at an agreed transfer price and record the related cost of products sold. Based on the terms of our distribution agreement with Actavis, we are entitled to a share of the ultimate profits based on the eventual net revenue from enoxaparin sales by Actavis to the end user less the agreed transfer price originally paid to us by Actavis. Actavis provides us with a quarterly sales report that calculates our share of Actavis’ enoxaparin gross profit. We record our share of Actavis’ gross profit as a component of net revenue.
Supply Agreement with MannKind Corporation
On July 31, 2014, we entered into a supply agreement with MannKind Corporation, or MannKind, pursuant to which we will manufacture for and supply to MannKind certain quantities of recombinant human insulin, or RHI, for use in MannKind’s product Afrezza
®
. Under the terms of the supply agreement, we will be responsible for manufacturing the RHI in accordance with MannKind’s specifications and agreed-upon quality standards. MannKind has agreed to purchase annual minimum quantities of RHI under the supply agreement of an aggregate amount of approximately €120.1 million, or approximately $146.0 million, in calendar years 2015 through 2019.
MannKind paid a non-refundable reservation fee to us in the amount of €11.0 million, or approximately $14.0 million. Under the agreement, the non-refundable reservation fee is considered as partial payment for the purchase commitment quantity for 2015. We classified the amount as deferred revenue.
Unless earlier terminated, the term of the supply agreement expires on December 31, 2019 and can be renewed for additional, successive two-year terms upon 12 months’ written notice given prior to the end of the initial term or any additional two-year term. MannKind and we each have customary termination rights, including termination for material breach that is not cured within a specific time frame or in the event of liquidation, bankruptcy, or insolvency of the other party. In addition, MannKind may terminate the supply agreement upon two years’ prior written notice to us without cause or upon 30 days prior written notice to us if a controlling regulatory authority withdraws approval for Afrezza
®
; provided, however, in the event of a termination pursuant to either of these scenarios, the provisions of the supply agreement require MannKind to pay the full amount of all unpaid purchase commitments due over the initial term within 60 calendar days of the effective date of such termination.
In January 2015, we entered into a supply option agreement with MannKind, pursuant to which MannKind will have the option to purchase RHI, for use in MannKind’s product Afrezza
®
, in addition to the amounts specified in the July 2014 supply agreement. Under the agreement, MannKind has the option to purchase additional RHI in calendar years 2016 through 2019. In the event MannKind elects not to exercise its minimum annual purchase option for any year, MannKind shall pay us a capacity cancellation fee.
Contractual Obligations
Set forth below are our contractual payment obligations (including interest obligations but excluding intercompany obligations) as of December 31, 2014:
|
Contractual
Obligations
(1)
|
Total
|
Less than
1 year
|
1 - 3 years
|
3 - 5 years
|
More
than
5 years
|
|||||||||||||||
|
(in thousands)
|
||||||||||||||||||||
|
Long-term debt
(2)
|
$ | 48,130 | $ | 8,981 | $ | 18,285 | $ | 16,521 | $ | 4,343 | ||||||||||
|
Operating leases
|
7,011
|
2,585 | 2,908 | 1,518 | — | |||||||||||||||
|
Capital leases
|
1,128 | 403 | 599 | 126 | — | |||||||||||||||
|
Facility construction in Nanjing, China
(3)
|
15,000 | — | 15,000 | — | — | |||||||||||||||
|
Purchase obligations
(4)
|
6,826 | 6,826 | — | — | — | |||||||||||||||
| $ | 78,095 | $ | 18,795 | $ | 36,792 | $ | 18,165 | $ | 4,343 | |||||||||||
|
(1)
|
The table above excludes (i) our liability for uncertain tax position of $4.8 million because the timing of any related payments cannot be reasonably estimated.
|
|
(2)
|
Long-term debt includes accrued and unpaid interest. As of December 31, 2014, the weighted average interest rate on our long-term debt was 4.0%.
|
|
(3)
|
Obligation to develop a facility in Nanjing, China. Please see “— Investment in China” below for further discussion.
|
|
(4)
|
The purchase obligations principally relate to inventory and pharmaceutical manufacturing and laboratory equipment. We anticipate meeting these purchase obligations through a combination of cash on hand, future cash flows from operations and debt and lease facilities. We have made deposits related to equipment purchases on these obligations totaling $15.8 million as of December 31, 2014.
|
Investment in China
We entered into agreements with a Chinese governmental entity to acquire land-use rights to real property in Nanjing, China. Under the terms of these agreements, we are obligated to invest capital in our wholly-owned subsidiary, Amphastar Nanjing Pharmaceuticals Co., Ltd., or ANP, and to develop these properties as an API manufacturing facility for our pipeline. In conjunction with these agreements, ANP modified its business license on July 3, 2012 to increase its authorized capital. As of December 31, 2014, we have invested approximately $45.0 million in ANP of its registered capital commitment of $61.0 million. We are committed to invest an additional $16.0 million in ANP, which is due by December 2017. This requirement to invest in China will result in cash being transferred from the U.S. parent company to ANP.
Per these agreements, in January 2010 we acquired certain land-use rights with a carrying value of $1.2 million. In addition, we purchased additional land-use rights in November 2012 for $1.3 million. We are committed to spend approximately $15.0 million in land development. The agreements require the construction of fixed assets on the property and specified a timetable for the construction of these fixed assets. The current pace of development of the property is behind the schedule described in the purchase agreement and, per the purchase agreement, potential monetary penalties could result if the development is delayed or not completed in accordance with the guidelines stated in the purchase agreements. During the year ended December 31, 2014, we invested $7.2 million to fund our research and development pipeline for ANP.
Anticipated Liquidity
We expect our cash requirements to increase significantly in the foreseeable future as we move forward with our product candidates, pursue strategic acquisitions of businesses or assets and as we sponsor clinical trials for, seek regulatory approvals of, and develop, manufacture and market our current development-stage product candidates.
We expect that cash flows from ongoing operations borrowing capacity under our existing lines of credit will enable us to meet our obligations as they become due for at least the next 12 months, including scheduled debt and lease payments. We expect additional cash flows to be generated in the longer term from future product introductions, although there can be no assurance as to the receipt of regulatory approval for any product candidates that we are developing or the timing of any product introductions, which could be lengthy or ultimately unsuccessful.
Off-Balance Sheet Arrangements
We do not have any relationships or financial partnerships with unconsolidated entities, such as entities often referred to as structured finance or special purpose entities, which would have been established for the purpose of facilitating off-balance sheet arrangements or other contractually narrow or limited purposes. In addition, we do not engage in trading activities involving non-exchange traded contracts.
|
Quantitative and Qualitative Disclosures about Market Risk.
|
The following discussion provides forward-looking quantitative and qualitative information about our potential exposure to market risk. Market risk represents the potential loss arising from adverse changes in the value of financial instruments. The risk of loss is assessed based on the likelihood of adverse changes in fair values, cash flows or future earnings. We are exposed to market risk for changes in the market values of our investments (Investment Risk), the impact of interest rate changes (Interest Rate Risk), and the impact of foreign currency exchange changes (Foreign Currency Exchange Risk).
Investment Risk
We regularly review the carrying value of our investments and identify and recognize losses, for income statement purposes, when events and circumstances indicate that any declines in the fair values of such investments below our accounting basis are other than temporary. As of December 31, 2014, we did not have any such investments.
As of December 31, 2014, we had $7.4 million deposited in three banks located in China and $8.0 million deposited in one bank located in France. We also maintained $43.0 million in Money Market, Money Market Insured Deposit Account Service, or MMIDAS, and Insured Cash Sweep, or ICS, accounts as of December 31, 2014. The remaining amounts of our cash equivalent as of December 31, 2014 are in non-interest bearing accounts.
As of December 31, 2013, we had $2.9 million deposited in two banks located in China. We also maintained $41.2 million in Money Market, MMIDAS and ICS accounts as of December 31, 2013. The remaining amounts of our cash equivalents as of December 31, 2013 are in non-interest bearing accounts.
The MMIDAS accounts and ICS accounts allow us to distribute our funds among a network of depository institutions that are re-allocated such that each deposit account is below the $250.0 thousand Federal Deposit Insurance Corporation, or FDIC, limit, thus providing greater FDIC insurance coverage for our overall cash balances. We have not experienced any losses in such accounts, nor do we believe we are exposed to any significant credit risk on our bank account balances.
Interest Rate Risk
Our primary exposure to market risk is interest-rate-sensitive investments and credit facilities, which are affected by changes in the general level of U.S. interest rates. Due to the nature of our short-term investments, such as our certificates of deposit, we believe that we are not subject to any material interest rate risk with respect to our short-term investments.
As of December 31, 2014, we had $43.7 million in long-term debt and capital leases outstanding. Of this amount, $30.0 million had variable interest rates with a weighted-average interest rate of 4.0% at December 31, 2014. An increase in the index underlying these rates of 1% (100 basis points) would increase our annual interest expense on the variable-rate debt by approximately $0.3 million per year. As of December 31, 2013, we had $32.2 million in long-term debt and capital leases outstanding. Of this amount, $26.3 million had variable interest rates with a weighted average interest rate of 4.0% at December 31, 2013. A 1% (100 basis points) increase in the index underlying these rates would increase our annual interest expense on the variable-rate debt by approximately $0.3 million per year.
Foreign Currency Rate Risk
Our products are primarily sold in U.S. domestic market, and for the years ended December 31, 2014, 2013, and 2012, foreign sales were minimal. Therefore, we have little exposure to foreign currency price fluctuations. However, as a result of our acquisition of Merck’s API manufacturing business in Éragny-sur-Epte, France, we are exposed to market risk related to changes in foreign currency exchange rates. Specifically, our insulin sales contracts are primarily denominated in Euros, which are subject to fluctuations relative to the U.S. dollar, or USD. We do not currently hedge our foreign currency exchange rate risk. At this time, an immediate 10% change in currency exchange rates would not have a material effect on our financial position, results of operations or cash flows.
Our Chinese subsidiary, Amphastar Nanjing Pharmaceuticals, Limited, or ANP, maintains their books of record in Chinese Yuan, or CNY. These books are remeasured into the functional currency of USD, using the current or historical exchange rates. The resulting currency re-measurement adjustments and other transactional foreign exchange gains and losses are reflected in our statement of operations.
Our French subsidiary, Amphastar France Pharmaceuticals, S.A.S., or AFP, maintains their books of record in Euros. These books are translated to USD at the average exchange rates during the period. Assets and liabilities are translated at the rate of exchange prevailing on the balance sheet date. Equity is translated at the prevailing rate of exchange at the date of the equity transactions. Translation adjustments are reflected in stockholders’ equity and are included as a component of other comprehensive income (loss). We do not undertake hedging transactions to cover our foreign currency exposure.
As of December 31, 2014 and 2013, ANP had receivables denominated in CNY in the amount of $1.6 million and $5.6 million, respectively.
|
I
te
m 8.
|
Financial Statements and Supplementary Data.
|
Index to Amphastar Pharmaceuticals, Inc. Consolidated Financial Statements
Report
of Independent Registered Public Accounting Firm
Board of Directors and Stockholders
Amphastar Pharmaceuticals, Inc.
We have audited the accompanying consolidated balance sheets of Amphastar Pharmaceuticals, Inc. (the Company) as of December 31, 2014 and 2013 and the related consolidated statements of operations, comprehensive income (loss), stockholders’ equity, and cash flows for each of the three years in the period ended December 31, 2014. These financial statements are the responsibility of the Company’s management. Our responsibility is to express an opinion on these financial statements based on our audits.
We conducted our audits in accordance with the standards of the Public Company Accounting Oversight Board (United States). Those standards require that we plan and perform the audit to obtain reasonable assurance about whether the financial statements are free of material misstatement. We were not engaged to perform an audit of the Company’s internal control over financial reporting. Our audits included consideration of internal control over financial reporting as a basis for designing audit procedures that are appropriate in the circumstances, but not for the purpose of expressing an opinion on the effectiveness of the Company’s internal control over financial reporting. Accordingly, we express no such opinion. An audit also includes examining, on a test basis, evidence supporting the amounts and disclosures in the financial statements, assessing the accounting principles used and significant estimates made by management, and evaluating the overall financial statement presentation. We believe that our audits provide a reasonable basis for our opinion.
In our opinion, the financial statements referred to above present fairly, in all material respects, the consolidated financial position of Amphastar Pharmaceuticals, Inc. at December 31, 2014 and 2013 and the consolidated results of its operations, comprehensive income (loss), and its cash flows for each of the three years in the period ended December 31, 2014, in conformity with U.S. generally accepted accounting principles.
/s/ Ernst & Young LLP
Los Angeles, California
March 26, 2015
AMPHASTAR
PHARMACEUTICALS, INC.
CONSOLIDATED BALANCE SHEETS
(in thousands, except share data)
|
|
December 31,
2014
|
December 31,
2013
|
||||||
|
ASSETS
|
|
|||||||
|
Current Assets:
|
|
|||||||
|
Cash and cash equivalents
|
|
$
|
67,828
|
$
|
53,587
|
|
||
|
Restricted cash and restricted short-term investments
|
|
1,495
|
1,325
|
|||||
|
Accounts receivable, net
|
|
22,852
|
24,585
|
|
||||
|
Inventories, net
|
|
82,332
|
69,916
|
|
||||
|
Income tax refund and deposits
|
273
|
2,429
|
||||||
|
Prepaid expenses and other assets
|
|
3,683
|
5,033
|
|||||
|
Deferred tax assets
|
|
19,533
|
16,096
|
|
||||
|
Total current assets
|
|
197,996
|
172,971
|
|
||||
|
Property, plant, and equipment, net
|
|
138,289
|
116,619
|
|
||||
|
Goodwill and intangible assets, net
|
42,565
|
40,163
|
||||||
|
Other assets
|
|
3,588
|
2,877
|
|
||||
|
Deferred tax assets
|
|
6,932
|
6,118
|
|
||||
|
|
||||||||
|
Total assets
|
|
$
|
389,370
|
$
|
338,748
|
|
||
|
|
||||||||
|
LIABILITIES AND EQUITY
|
|
|||||||
|
Current Liabilities:
|
|
|||||||
|
Accounts payable
|
|
$
|
10,161
|
$
|
20,380
|
|
||
|
Accrued liabilities
|
13,144
|
7,628
|
||||||
|
Income taxes payable
|
|
3,123
|
2,847
|
|
||||
|
Accrued payroll and related benefits
|
11,449
|
9,161
|
||||||
|
Current portion of product return accrual
|
1,918
|
2,639
|
||||||
|
Current portion of deferred revenue
|
14,013
|
643
|
||||||
|
Current portion of long-term debt and capital leases
|
|
7,594
|
22,104
|
|
||||
|
Current portion of deferred tax liability
|
1,193
|
—
|
||||||
|
Total current liabilities
|
|
62,595
|
65,402
|
|||||
|
|
|
|||||||
|
Long-term product return accrual
|
|
490
|
1,953
|
|
||||
|
Long-term reserve for income tax liability
|
499
|
—
|
||||||
|
Long-term deferred revenue
|
|
1,982
|
2,625
|
|
||||
|
Long-term debt and capital leases, net of current portion
|
|
36,106
|
10,069
|
|
||||
|
Deferred tax liabilities
|
|
5,838
|
7,154
|
|
||||
|
Total liabilities
|
107,510
|
87,203
|
||||||
|
Commitments and Contingencies:
|
|
|||||||
|
Stockholders’ equity:
|
|
|||||||
|
Preferred stock: par value $.0001; authorized shares—20,000,000; none issued
|
|
—
|
—
|
|
||||
|
Common stock; par value $.0001; authorized shares—300,000,000; issued and outstanding shares—44,646,767 and 38,765,940 at December 31, 2014 and December 31, 2013, respectively
|
|
4
|
4
|
|
||||
|
Additional paid-in capital
|
|
220,745
|
177,732
|
|
||||
|
Retained earnings
|
|
63,110
|
73,809
|
|
||||
|
Accumulated other comprehensive loss
|
(
1,654
|
)
|
—
|
|||||
|
Treasury stock
|
(345
|
)
|
—
|
|||||
|
Total stockholders’ equity
|
|
281,860
|
251,545
|
|
||||
|
|
||||||||
|
Total liabilities and stockholders’ equity
|
|
$
|
389,370
|
$
|
338,748
|
|||
See accompanying notes to consolidated financial statements.
AMPHASTAR
PHARMACEUTICALS, INC.
CONSOLIDATED STATEMENTS OF OPERATIONS
(in thousands, except per share data)
|
Year Ended December 31,
|
||||||||||||
|
2014
|
2013
|
2012
|
||||||||||
|
Net revenues
|
$ | 210,461 | $ | 229,681 | $ | 204,323 | ||||||
|
Cost of revenue
|
159,205 | 142,725 | 114,020 | |||||||||
|
Gross profit
|
51,256 | 86,956 | 90,303 | |||||||||
|
Operating expenses:
|
||||||||||||
|
Selling, distribution, and marketing
|
5,564 | 5,349 | 4,426 | |||||||||
|
General and administrative
|
34,809 | 30,972 | 27,223 | |||||||||
|
Research and development
|
28,427 | 33,019 | 31,163 | |||||||||
|
Impairment of long-lived assets
|
439 | 126 | 2,094 | |||||||||
|
Total operating expenses
|
69,239 | 69,466 | 64,906 | |||||||||
|
Income (loss) from operations
|
(17,983 | ) | 17,490 | 25,397 | ||||||||
|
Non-operating income (expense):
|
||||||||||||
|
Interest income
|
243 | 187 | 242 | |||||||||
|
Interest expense
|
(609 | ) | (958 | ) | (784 | ) | ||||||
|
Other income, net
|
201 | 508 | 1,023 | |||||||||
|
Total non-operating income (expense), net
|
(165 | ) | (263 | ) | 481 | |||||||
|
Income (loss) before income taxes
|
(18,148 | ) | 17,227 | 25,878 | ||||||||
|
Income tax expense (benefit)
|
(7,449 | ) | 5,365 | 7,784 | ||||||||
|
Net income (loss)
|
$ | (10,699 | ) | $ | 11,862 | $ | 18,094 | |||||
|
Net income (loss) per common share:
|
||||||||||||
|
Basic
|
$ | (0.25 | ) | $ | 0.31 | $ | 0.47 | |||||
|
Diluted
|
$ | (0.25 | ) | $ | 0.31 | $ | 0.46 | |||||
|
Weighted-average shares used to compute net income (loss) per common share:
|
||||||||||||
|
Basic
|
41,957 | 38,712 | 38,580 | |||||||||
|
Diluted
|
41,957 | 38,883 | 38,940 | |||||||||
See accompanying notes to consolidated financial statements.
AMPHASTAR
PHARMACEUTICALS, INC.
CONSOLIDATED STATEMENTS OF COMPREHENSIVE INCOME (LOSS)
(in thousands)
|
Year Ended December 31,
|
||||||||||||
|
2014
|
2013
|
2012
|
||||||||||
|
Net income (loss)
|
$ | (10,699 | ) | $ | 11,862 | $ | 18,094 | |||||
|
Accumulated other comprehensive income (loss)
|
||||||||||||
|
Foreign currency translation adjustment
|
(
1,810
|
) | — | — | ||||||||
|
Change in actuarial valuation
|
156
|
— | — | |||||||||
|
Accumulated other comprehensive loss
|
(
1,654
|
) | — | — | ||||||||
|
Total comprehensive income (loss)
|
$ | ( 12,353 | ) | $ | 11,862 | $ | 18,094 | |||||
See accompanying notes to consolidated financial statements.
AMPHASTAR
PHARMACEUTICALS, INC.
CONSOLIDATED STATEMENTS OF STOCKHOLDERS’ EQUITY
(in thousands, except share data)
| Common Stock | Accumulated |
Treasury Stock
|
||||||||||||||||||||||||||||||
| Shares | Amount |
Additional
Paid-in
Capital
|
Retained
Earnings
|
Other
Comprehensive
Income (loss)
|
Shares
|
Amount
|
Total
|
|||||||||||||||||||||||||
|
Balance as of December 31, 2011
|
38,510,314 | $ | 4 | $ | 164,661 | $ | 43,853 | $ | — | — | $ | — | $ | 208,518 | ||||||||||||||||||
|
Net income
|
— | — | — | 18,094 | — | — | — | 18,094 | ||||||||||||||||||||||||
|
Reduction of excess tax benefit of share-based awards
|
— | — | (120 | ) | — | — | — | — | (120 | ) | ||||||||||||||||||||||
|
Exercise of stock options
|
41,300 | — | 333 | — | — | — | — | 333 | ||||||||||||||||||||||||
|
Issuance of common stock to employees in connection with the release of vested deferred stock units, net of common stock withheld to settle equity awards
|
98,386 | — | (811 | ) | — | — | — | — | (811 | ) | ||||||||||||||||||||||
|
Issuance of common stock to nonemployees in connection with exercise of common stock options
|
31,660 | — | — | — | — | — | — | — | ||||||||||||||||||||||||
|
Nonemployee share-based compensation expense ($412 related to stock option awards and $338 related to DSU awards)
|
— | — | 750 | — | — | — | — | 750 | ||||||||||||||||||||||||
|
Employee share-based compensation expense ($6,465 related to stock option awards and $210 related to DSU awards)
|
— | — | 6,675 | — | — | — | — | 6,675 | ||||||||||||||||||||||||
|
Balance as of December 31, 2012
|
38,681,660 | 4 | 171,488 | 61,947 | — | — | — | 233,439 | ||||||||||||||||||||||||
|
Net income
|
— | — | — | 11,862 | — | — | — | 11,862 | ||||||||||||||||||||||||
|
Reduction of excess tax benefit of share-based awards
|
— | — | (647 | ) | — | — | — | — | (647 | ) | ||||||||||||||||||||||
|
Exercise of stock options
|
4,200 | — | 55 | — | — | — | — | 55 | ||||||||||||||||||||||||
|
Issuance of common stock to employees in connection with the release of vested deferred stock units, net of common stock withheld to settle equity awards
|
14,023 | — | (199 | ) | — | — | — | — | (199 | ) | ||||||||||||||||||||||
|
Issuance of common stock to nonemployees in connection with the release of vested deferred stock units
|
66,057 | — | — | — | — | — | — | — | ||||||||||||||||||||||||
|
Nonemployee share-based compensation expense ($499 related to stock option awards and $447 related to DSU awards)
|
— | — | 946 | — | — | — | — | 946 | ||||||||||||||||||||||||
|
Employee share-based compensation expense ($5,926 related to stock option awards and $163 related to DSU awards)
|
— | — | 6,089 | — | — | — | — | 6,089 | ||||||||||||||||||||||||
|
Balance as of December 31, 2013
|
38,765,940 | 4 | 177,732 | 73,809 | — | — | — | 251,545 | ||||||||||||||||||||||||
|
Net loss
|
— | — | — | (10,699 | ) | — | — | — | (10,699 | ) | ||||||||||||||||||||||
|
Accumulated other comprehensive loss
|
— | — | — | — | ( 1,654 | ) | — | — | ( 1,654 | ) | ||||||||||||||||||||||
|
Reduction of excess tax benefit of share-based awards
|
— | — | (1,109 | ) | — | — | — | — | (1,109 | ) | ||||||||||||||||||||||
|
Common stock issued through initial public offering
|
5,840,000 | — | 38,018 | — | — | — | — | 38,018 | ||||||||||||||||||||||||
|
Cost related to public offering
|
— | — | (3,358 | ) | — | — | — | — | (3,358 | ) | ||||||||||||||||||||||
|
Treasury stock acquired
|
— | — | — | — | — | (29,400 | ) | (345 | ) | (345 | ) | |||||||||||||||||||||
|
Exercise of stock options
|
30,000 | — | 571 | — | — | — | — | 571 | ||||||||||||||||||||||||
|
Issuance of common stock to employees in connection with the release of vested deferred stock units, net of common stock withheld to settle equity awards
|
14,306 | — | (389 | ) | — | — | — | — | (389 | ) | ||||||||||||||||||||||
|
Issuance of common stock to nonemployees in connection with the release of vested deferred stock units
|
25,921 | — | — | — | — | — | — | — | ||||||||||||||||||||||||
|
Nonemployee share-based compensation expense ($576 related to stock option awards and $370 related to DSU awards)
|
— | — | 946 | — | — | — | — | 946 | ||||||||||||||||||||||||
|
Employee share-based compensation expense ($6,728 related to stock option awards and $1,606 related to DSU awards)
|
— | — | 8,334 | — | — | — | — | 8,334 | ||||||||||||||||||||||||
|
Balance as of December 31, 2014
|
44,676,167 | $ | 4 | $ | 220,745 | $ | 63,110 | $ | ( 1,654 | ) | (29,400 | ) | $ | (345 | ) | $ |
281,860
|
|||||||||||||||
See accompanying notes to consolidated financial statements.
77
|
Year Ended December 31,
|
||||||||||||
|
2014
|
2013
|
2012
|
||||||||||
|
Cash Flows From Operating Activities:
|
||||||||||||
|
Net income (loss)
|
$ | (10,699 | ) | $ | 11,862 | $ | 18,094 | |||||
|
Reconciliation to net cash provided by (used in) operating activities:
|
||||||||||||
|
Impairment of long-lived assets
|
439 | 126 | 2,094 | |||||||||
|
Loss on disposal of property, plant, and equipment
|
46 | 91 | 611 | |||||||||
|
Depreciation and amortization of property, plant, and equipment
|
12,528 | 11,171 | 9,657 | |||||||||
|
Amortization of product rights, trademarks, and patents
|
1,920 | 1,907 | 1,840 | |||||||||
|
Imputed interest accretion
|
163 | — | — | |||||||||
|
Employee share-based compensation expense
|
8,334 | 6,089 | 6,675 | |||||||||
|
Non-employee share-based compensation expense
|
946 | 946 | 750 | |||||||||
|
Reserve for income tax liabilities
|
499 | (167 | ) | (3,308 | ) | |||||||
|
Changes in deferred taxes
|
(8,743 | ) | 2,248 | 11,583 | ||||||||
|
Changes in operating assets and liabilities:
|
||||||||||||
|
Accounts receivable, net
|
1,210
|
11,824 | (16,647 | ) | ||||||||
|
Inventories, net
|
6,565
|
(18,538 | ) | (25,219 | ) | |||||||
|
Income tax refund and deposits
|
1,873 | (576 | ) | 2,399 | ||||||||
|
Prepaid expenses and other assets
|
(88 | ) | 29 | 180 | ||||||||
|
Income taxes payable
|
559 | (173 | ) | (2,351 | ) | |||||||
|
Accounts payable and accrued liabilities
|
5,500
|
4,203
|
(8,008 | ) | ||||||||
|
Net cash provided by (used in) operating activities
|
21,052
|
31,042
|
(1,650 | ) | ||||||||
|
Cash Flows From Investing Activities:
|
||||||||||||
|
Acquisition of business
|
(18,352 | ) | — | — | ||||||||
|
Purchases of property, plant, and equipment
|
(18,671 | ) | ( 17,642 | ) | (23,133 | ) | ||||||
|
Capitalized labor, overhead, and interest on self-constructed assets
|
(1,828 | ) | (660 | ) | (603 | ) | ||||||
|
Proceeds from the sale of property, plant and equipment
|
— | — | 74 | |||||||||
|
Purchase of trademarks and other intangible assets
|
— | — | (1,509 | ) | ||||||||
|
Sales of short-term investments, net
|
— | 513 | 810 | |||||||||
|
Decrease (increase) in restricted cash
|
(170 | ) | 50 | (203 | ) | |||||||
|
Deposits and other assets, net
|
(752 | ) | (559 | ) | (548 | ) | ||||||
|
Net cash used in investing activities
|
(39,773 | ) | ( 18,298 | ) |
(25,112
|
) | ||||||
|
Cash Flows From Financing Activities:
|
||||||||||||
|
Net proceeds from issuance of common stock
|
38,018 | — | — | |||||||||
|
Payments on repurchase of common stock
|
(389 | ) | (199 | ) | (811 | ) | ||||||
|
Excess tax benefit (reduction) related to share-based compensation
|
(1,109 | ) | (647 | ) | (120 | ) | ||||||
|
Net proceeds from exercise of common stock options
|
571 | 55 | 333 | |||||||||
|
Costs related to public offering
|
(1,920 | ) | — | — | ||||||||
|
Deferred offering cost
|
— | (1,427 | ) | — | ||||||||
|
Payments on treasury stock
|
(345 | ) | — | — | ||||||||
|
Proceeds from borrowing under lines of credit
|
25,000 | 66,000 | 53,961 | |||||||||
|
Repayments under lines of credit
|
(40,000 | ) | (71,000 | ) | (29,252 | ) | ||||||
|
Proceeds from issuance of long-term debt
|
26,505 | — | — | |||||||||
|
Principal payments on long-term debt
|
(8,216 | ) | (2,152 | ) | (874 | ) | ||||||
|
Principal payments on short-term debt
|
(5,998
|
) | — | — | ||||||||
|
Net cash provided by (used in) financing activities
|
32,117
|
(9,370 | ) | 23,237 | ||||||||
|
Effect of exchange rate changes on cash
|
845
|
— | — | |||||||||
|
Net increase (decrease) in cash and cash equivalents
|
14,241 | 3,374 | (3,525 | ) | ||||||||
|
Cash and cash equivalents at beginning of period
|
53,587 | 50,213 | 53,738 | |||||||||
|
Cash and cash equivalents at end of period
|
$ | 67,828 | $ | 53,587 | $ | 50,213 | ||||||
|
Noncash Investing and Financing Activities:
|
||||||||||||
|
Equipment acquired under capital leases
|
$ | 78 | $ | 1,323 | $ | — | ||||||
|
Supplemental Disclosures of Cash Flow Information:
|
||||||||||||
|
Interest paid
|
$ | 2,607 | $ | 1,100 | $ | 1,089 | ||||||
|
Income taxes paid
|
$ | 436 | $ | 4,158 | $ | 2,078 | ||||||
See accompanying notes to consolidated financial statements
1. General
Amphastar Pharmaceuticals, Inc., a California corporation, was incorporated on February 29, 1996 and merged with and into Amphastar Pharmaceuticals, Inc., a Delaware corporation, in July 2004 (hereinafter referred to as “the Company”). The Company is a specialty pharmaceutical company that primarily develops, manufactures, markets, and sells generic and proprietary injectable and inhalation products, including products with high technical barriers to market entry. Additionally, in 2014, the Company commenced sales of insulin active pharmaceutical ingredient, or API products. Most of the Company’s products are used in hospital or urgent care clinical settings and are primarily contracted and distributed through group purchasing organizations and drug wholesalers. The Company’s insulin API products are primarily sold to other pharmaceutical companies for use in their own products. The Company’s inhalation products will be primarily distributed through drug retailers once they are brought to market.
2. Summary of Significant Accounting Policies
Basis of Presentation
All significant intercompany activity has been eliminated in the preparation of the consolidated financial statements. Some information and footnote disclosures normally included in financial statements prepared in accordance with generally accepted accounting principles, or GAAP, have been condensed or omitted pursuant to those rules and regulations.
The accompanying consolidated financial statements include the accounts of the Company and its wholly-owned subsidiaries: International Medication Systems, Limited, or IMS; Amphastar Laboratories, Inc.; Armstrong Pharmaceuticals, Inc., or Armstrong; Amphastar Nanjing Pharmaceuticals Co., Ltd., or ANP; and Amphastar France Pharmaceuticals, S.A.S., or AFP.
Use of Estimates
The preparation of consolidated financial statements in accordance with U.S. GAAP requires management to make estimates and assumptions that affect the amounts reported in the consolidated financial statements and accompanying notes. Actual results could differ from those estimates. The principal accounting estimates include: determination of allowances for doubtful accounts and discounts, liabilities for product returns and chargebacks, reserves for excess or unsellable inventory, impairment of long-lived and intangible assets and goodwill, self-insured claims, workers’ compensation liabilities, litigation reserves, stock price volatilities for share-based compensation expense, fair market values of the Company’s common stock, valuation allowances for deferred tax assets, and liabilities for uncertain income tax positions.
Foreign Currency
The functional currency of the Company and its domestic and Chinese subsidiaries is the U.S. dollar, or USD. The Company’s Chinese subsidiary, ANP, maintains its books of record in Chinese Yuan. These books are remeasured into the functional currency of USD using the current or historical exchange rates. The resulting currency remeasurement adjustments and other transactional foreign exchange gains and losses are reflected in the Company’s statement of operations. The Company’s French subsidiary, AFP, maintains its books of record in Euros, which is the local currency in France and has been determined to be its functional currency. These books are translated to USD at the average exchange rates during the period. Assets and liabilities are translated at the rate of exchange prevailing on the balance sheet date. Equity is translated at the prevailing rate of exchange at the date of the equity transactions. Translation adjustments are reflected in stockholders’ equity and are included as a component of other comprehensive income (loss). Additionally, the Company does not undertake hedging transactions to cover its foreign currency exposure.
Comprehensive Income (Loss)
For the Company’s recently acquired subsidiary in France, the Euro, which is the local currency, has been determined to be the functional currency. The results of the Company’s French subsidiary’s operations are translated to U.S. dollars at the average exchange rates during the period.
For the year ended December 31, 2014, the Company includes its foreign currency translation adjustment as well as the change to its actuarial valuation on the Company’s defined benefit pension plan (see Note 16) as part of its comprehensive loss. For the years ended December 31, 2013 and 2012, net income (loss) equaled total comprehensive income (loss).
AMPHASTAR PHARMACEUTICALS, INC.
NOTES TO CONSOLIDATED FINANCIAL STATEMENTS
Shipping and Handling Costs
For the years ended December 31, 2014, 2013, and 2012, the Company included shipping and handling costs of approximately $2.5 million, $2.4 million, and $2.1 million, respectively, in selling, distribution and marketing expenses in the accompanying consolidated statements of operations.
Research and Development Costs
Research and development costs are charged to expense as incurred and consist of costs incurred to further the Company’s research and development activities including salaries and related employee benefits, costs associated with clinical trials, nonclinical research and development activities, regulatory activities, research-related overhead expenses and fees paid to external service providers.
The Company may produce inventories prior to or with the expectation of receiving marketing authorization in the near term, based on operational decisions about the most effective use of existing resources. This inventory is referred to as pre-launch inventory. The Company’s policy is to expense pre-launch inventory as research and development costs, as incurred, until the drug candidate receives marketing authorization. As a result of the policy, while marketing authorization may have been received by the end of a reporting period, any inventories produced prior to such authorization are expensed. If marketing authorization is received and previously expensed pre-launch inventory is sold, such sales may contribute up to a 100% margin to the Company’s operating results. Pre-launch inventory costs include cost of work in process materials and finished drug products.
Financial Instruments
The carrying amounts of cash and cash equivalents, short-term investments, accounts receivable, accounts payable, accrued expenses, and short-term borrowings approximate fair value due to the short maturity of these items. A majority of the Company’s long-term obligations consist of variable rate debt and their carrying value approximates fair value. Their carrying value approximates fair value as the stated borrowing rates are comparable to rates currently offered to the Company for instruments with similar maturities. However, the Company has one fixed-rate, long-term mortgage for which the carrying value differs from the fair value and is not remeasured on a recurring basis (see Note 13).
Cash and Cash Equivalents
Cash and cash equivalents consist of cash, money market funds, certificates of deposit and highly liquid investments purchased with original maturities of three months or less.
Restricted Cash and Restricted Short-Term Investments
Restricted cash and restricted short-term investments as of December 31, 2014 and 2013 included $1.5 million and $1.3 million, respectively, in certificates of deposit, which is the collateral required for the Company to qualify for workers’ compensation self-insurance and is available to meet the Company’s workers’ compensation obligations on a current basis, as needed. These funds are classified as current assets. The Company’s short-term investments are classified as held- to-maturity and consist of certificates of deposit purchased with maturities greater than three months but mature within one year of the date of purchase. The estimated fair value of each investment approximates its amortized cost.
Allowance for Doubtful Accounts Receivable
The Company evaluates the collectability of accounts receivable based on a combination of factors. When the Company is aware of circumstances that may impair a customer’s ability to pay subsequent to the original sale, the Company will record a specific allowance to reduce the amounts due to the amount the Company reasonably believes will be collected. For all other customers, the Company recognizes an allowance for doubtful accounts based on factors that include the length of time the receivables are past due, industry and geographic concentrations, the current business environment and historical collection experience.
Inventories
Inventories are stated at the lower of cost or market, using the first-in, first-out method. Provisions are made for slow-moving, unsellable, or obsolete items. Inventories consist of currently marketed products and products manufactured under contract.
AMPHASTAR PHARMACEUTICALS, INC.
NOTES TO CONSOLIDATED FINANCIAL STATEMENTS
Property, Plant and Equipment
Property, plant and equipment are stated at cost or, in the case of assets acquired in a business combination, at fair value on the purchase date. Depreciation and amortization expense is computed using the straight-line method over the estimated useful lives of the related assets as follows:
|
Buildings (years)
|
20
|
- | 31 |
|
Machinery and equipment (years)
|
2
|
- | 12 |
|
Furniture and fixtures (years)
|
3
|
- | 7 |
|
Automobiles (years)
|
4
|
- | 5 |
|
Leasehold improvements
|
Lesser of remaining lease term or useful life | ||
Goodwill and Intangible Assets
Intangible assets with finite lives are amortized over the period the asset is expected to contribute directly or indirectly to the future cash flows of the Company. Product rights are amortized over their estimated useful lives ranging from five to 15 years on a straight-line basis since their projected revenues are expected to be consistent each year. Patents and trademarks are amortized on a straight-line basis over their estimated useful lives, generally ranging from 10 to 20 years. Land-use rights are amortized on a straight-line basis over their useful lives, generally ranging from 37 to 50 years. In accordance with the Company’s accounting policy, the Company tests all intangible assets on an annual basis and between annual tests whenever there is an indication of impairment.
Impairment of Long-Lived Assets
The Company reviews long-lived assets and definite-lived intangibles for impairment in the fourth quarter of each year or whenever events or changes in circumstances indicate that the carrying amount of an asset may not be recoverable. If the sum of the expected future undiscounted cash flows is less than the carrying amount of the asset, further impairment analysis is performed. An impairment loss is measured as the amount by which the carrying amount of the asset exceeds the fair value of the assets (assets to be held and used) or fair value less cost to sell (assets to be disposed of). The Company also reviews the useful lives of its assets periodically to determine whether events and circumstances warrant a revision to the remaining useful life. Changes in the useful life are adjusted prospectively by revising the remaining period over which the asset is amortized.
Deferred Income Taxes
The Company utilizes the liability method of accounting for income taxes. Under the liability method, deferred taxes are determined based on the temporary differences between the financial statements and the tax basis of assets and liabilities using enacted tax rates. A valuation allowance is recorded when it is more likely than not that the deferred tax assets will not be realized. The Company has adopted the with-and-without methodology for determining when excess tax benefits from the exercise of share-based awards are realized. Under the with-and-without methodology, current year operating loss deductions and prior-year operating loss carryforwards are deemed to be utilized prior to the utilization of current-year excess tax benefits from share-based awards.
Self-Insured Claims
The Company is primarily self-insured, up to certain limits, for workers’ compensation claims. The Company has purchased stop-loss insurance, which will reimburse the Company for individual claims in excess of $350,000 annually or aggregate claims exceeding $1.9 million annually. Operations are charged with the cost of claims reported and an estimate of claims incurred but not reported. A liability for unpaid claims and the associated claim expenses, including incurred but not reported losses, is actuarially determined and reflected in accrued liabilities in the accompanying consolidated balance sheets. Total expense under the program was approximately $1.0 million, $0.8 million, and $1.2 million, for the years ended December 31, 2014, 2013 and 2012, respectively. The self-insured claims liability was $2.2 million and $2.0 million at December 31, 2014 and 2013, respectively. The determination of such claims and expenses and the appropriateness of the related liability is reviewed periodically and updated, as necessary. Changes in estimates are recorded in the period identified.
81
AMPHASTAR PHARMACEUTICALS, INC.
NOTES TO CONSOLIDATED FINANCIAL STATEMENTS
Correction of an Immaterial Error
During the fourth quarter of 2014, the Company identified an immaterial error in the Company’s previously reported consolidated financial statements primarily pertaining to the year ended December 31, 2013 as the result of not capitalizing interest expense on certain foreign construction projects during the year. The Company corrected the immaterial error in the fourth quarter of 2014, resulting in a decrease to net loss by $0.3 million, which has no impact to the Company’s basic and diluted loss per share for the year ended December 31, 2014. Based on management's evaluation of the materiality of the error from a qualitative and quantitative perspective as required by authoritative guidance, the Company concluded that correcting the error had no material impact on any of the Company's previously issued interim financial statements and had no effect on the trend of financial results.
Business Combinations
Business combinations are accounted for in accordance with Accounting Standards Codification, or ASC 805, Business Combinations, using the acquisition method of accounting. The acquisition method of accounting requires an acquirer to recognize the assets acquired and the liabilities assumed at the acquisition date measured at their fair values as of that date. Fair value determinations are based on discounted cash flow analyses or other valuation techniques. In determining the fair value of the assets acquired and liabilities assumed in a material acquisition, the Company may utilize appraisals from third party valuation firms to determine fair values of some or all of the assets acquired and liabilities assumed, or may complete some or all of the valuations internally. In either case, the Company takes full responsibility for the determination of the fair value of the assets acquired and liabilities assumed. The value of goodwill reflects the excess of the fair value of the consideration conveyed to the seller over the fair value of the net assets received.
Acquisition-related costs are costs the Company incurs to effect a business combination. The Company accounts for acquisition-related costs as expenses in the periods in which the costs are incurred.
Recent Accounting Pronouncements
In July 2013, the Financial Accounting Standards Board, or FASB, issued an Accounting Standard Update to the accounting guidance to address the diversity in practice related to the financial statement presentation of unrecognized tax benefits as either a reduction of a deferred tax asset or a liability when a net operating loss carryforward, a similar tax loss, or a tax credit carryforward exists. This guidance is effective prospectively for fiscal years, and interim periods within those years, beginning after December 15, 2013. The adoption of this guidance did not have a material impact on the Company’s consolidated financial statements.
In April 2014, the FASB issued an accounting standards update that raises the threshold for disposals to qualify as discontinued operations and allows companies to have significant continuing involvement with and continuing cash flows from or to the discontinued operation. It also requires additional disclosures for discontinued operations and new disclosures for individually material disposal transactions that do not meet the definition of a discontinued operation. This guidance will be effective for fiscal years beginning after December 15, 2014, which will be the Company's fiscal year 2015, with early adoption permitted. The Company does not expect the adoption of the guidance will have a material impact on the Company's consolidated financial statements.
In May 2014, the FASB issued an accounting standards update that creates a single source of revenue guidance for companies in all industries. The new standard provides guidance for all revenue arising from contracts with customers and affects all entities that enter into contracts to provide goods or services to their customers, unless the contracts are within the scope of other accounting standards. It also provides a model for the measurement and recognition of gains and losses on the sale of certain nonfinancial assets. This guidance must be adopted using either a full retrospective approach for all periods presented or a modified retrospective approach and will be effective for fiscal years beginning after December 15, 2016, which will be the Company's fiscal year 2017. The Company has not yet evaluated the potential impact of adopting the guidance on the Company's consolidated financial statements.
In June 2014, the FASB issued an accounting standards update that requires a performance target that affects vesting of a share-based payment award and that could be achieved after the requisite service period to be treated as a performance condition. As such, the performance target should not be reflected in estimating the grant-date fair value of the award. Compensation cost should be recognized over the required service period, if it is probable that the performance target will be achieved. This guidance will be effective for fiscal years beginning after December 15, 2015, which will be the Company's fiscal year 2016, with early adoption permitted. The Company does not expect the adoption of the guidance will have a material impact on the Company's consolidated financial statements.
In August 2014, the FASB issued an accounting standards update that will require management to evaluate if there is substantial doubt about the Company’s ability to continue as a going concern and, if so, to disclose this in both interim and annual reporting periods. This guidance will become effective for the Company’s annual filing for the period ending December 31, 2016 and interim periods thereafter, and allows for early adoption. The Company does not expect the adoption of the guidance will have a material impact on the Company’s consolidated financial statements.
AMPHASTAR PHARMACEUTICALS, INC.
NOTES TO CONSOLIDATED FINANCIAL STATEMENTS
3. Business Acquisition
Acquisition of Merck’s API Manufacturing Business
On April 30, 2014, the Company completed the acquisition of Merck Sharpe & Dohme’s API manufacturing business in Éragny-sur-Epte, France, or the Merck API Transaction, which manufactures porcine insulin API and recombinant human insulin API. The purchase price of the transaction totaled €24.8 million, or $34.4 million on April 30, 2014, subject to certain customary post-closing adjustments and currency exchange fluctuations. The terms of the purchase include multiple payments over four years as follows (see Note 13):
|
Euros
|
U.S.
Dollars
|
|||||||
|
(in thousands)
|
||||||||
|
At Closing, April 2014
|
€ | 13,252 | $ | 18,352 | ||||
|
December 2014
|
4,899 | 5,989 | ||||||
|
December 2015
|
3,186 | 3,873 | ||||||
|
December 2016
|
3,186 | 3,873 | ||||||
|
December 2017
|
500 | 607 | ||||||
| € | 25,023 | $ | 32,694 | |||||
In order to facilitate the acquisition, the Company established a subsidiary in France, AFP. The Company will continue the current site manufacturing activities, which consist of the manufacturing of porcine insulin API and recombinant human insulin API. As part of the transaction, the Company has entered into various additional agreements, including various supply agreements, as well as the assignment and licensing of patents under which Merck was operating at this facility. In addition, certain existing customer agreements have been assigned to AFP.
The transaction was accounted for as a business combination in accordance to ASC 805. The following table summarizes the estimated fair values of the assets acquired and liabilities assumed as of the acquisition date:
|
Fair Value
|
||||||||
|
Euros
|
U.S.
Dollars
|
|||||||
|
(in thousands)
|
||||||||
|
Inventory
|
€ | 15,565 | $ | 21,554 | ||||
|
Real property
|
4,800 | 6,647 | ||||||
|
Machinery & equipment
|
6,800 | 9,417 | ||||||
|
Intangibles
|
80 | 111 | ||||||
|
Goodwill
|
3,155 | 4,369 | ||||||
|
Total assets acquired
|
€ | 30,400 | $ | 42,098 | ||||
|
Accrued liabilities
|
€ | 2,425 | $ | 3,358 | ||||
|
Deferred tax liabilities
|
3,155 | 4,369 | ||||||
|
Total liabilities assumed
|
5,580 | 7,727 | ||||||
|
Total fair value of consideration transferred
|
€ | 24,820 | $ | 34,371 | ||||
The Company’s accounting for this acquisition is preliminary. The fair value estimates for the assets acquired and liabilities assumed were based upon preliminary calculations and valuations, and the Company’s estimates and assumptions are subject to change as the Company obtains additional information for its estimates during the measurement period (up to one year from the acquisition date). During the year ended December 31, 2014, the Company received updated information regarding its deferred tax liability and related goodwill recorded as of the acquisition date. While finalizing acquisition accounting, the Company recorded a measurement period adjustment which impacted goodwill and deferred tax liability by €3.2 million, or $4.4 million and €3.2 million, or $4.4 million, respectively during the year ended December 31, 2014. The operations of the acquired business have been included in the Company’s consolidated financial statements commencing on the acquisition date. The results of operations for this acquisition have not been separately presented because this acquisition is not material to the Company’s consolidated results of operations.
The following unaudited pro forma financial information for the year ended December 31, 2014 and 2013 gives effect to the transaction as if it had occurred on January 1, 2013. Such unaudited pro forma information is based on historical financial information prior to the transaction as well as actual results subsequent to the acquisition with respect to the transaction and does not reflect estimated operational and administrative cost savings, or synergies, for the periods prior to the transaction that management of the combined company estimates may be achieved as a result of the transaction. The unaudited pro forma information primarily reflects the additional depreciation related to the fair value adjustment to property, plant and equipment acquired, valuation step up related to the fair value of inventory and additional interest expense associated with the financing obtained by the Company in connection with the acquisition.
|
Year Ended
December 31,
|
||||||||
|
2014
|
2013
|
|||||||
|
(in thousands,
except per share data)
|
||||||||
|
Net revenues
|
$ | 212,745 | $ | 243,786 | ||||
|
Net income (loss)
|
(11,928 | ) | 12,969 | |||||
|
Diluted net income (loss) per share
|
$ | (0.28 | ) | $ | 0.33 | |||
Acquisition Loan with Cathay Bank
On April 22, 2014, in conjunction with the Merck API Transaction, the Company entered into a secured term loan with Cathay Bank as lender. The principal amount of the loan is $21.9 million and bears a variable interest rate at the prime rate as published by
The Wall Street Journal
, with a minimum interest rate of 4.00%. Beginning on June 1, 2014 and through the maturity date, April 22, 2019, the Company must make monthly payments of principal and interest based on the then outstanding amount of the loan amortized over a 120-month period. On April 22, 2019, all amounts outstanding under the loan become due and payable, which would be approximately $12.0 million based upon an interest rate of 4.00%. The loan is secured by 65% of the issued and outstanding shares of stock in AFP and certain assets of the Company, including accounts receivable, inventory, certain investment property, goods, deposit accounts, and general intangibles but not including the Company’s equipment and real property.
The loan includes customary restrictions on, among other things, the Company’s ability to incur additional indebtedness, pay dividends in cash or make other distributions in cash, make certain investments, create liens, sell assets, and make loans. The loan also includes customary events of defaults, the occurrence and continuation of any of which provide Cathay Bank the right to exercise remedies against the Company and the collateral securing the loan. These events of default include, among other things, the Company’s failure to pay any amounts due under the loan, the Company’s insolvency, the occurrence of any default under certain other indebtedness or material agreements, and a final judgment against the Company that is not discharged in 30 days.
4. Revenue Recognition
Generally, revenue is recognized at the time of product delivery to the Company’s customers. In some cases, revenue is recognized at the time of shipment when stipulated by the terms of the sale agreements. The Company also records profit-sharing revenue stemming from a distribution agreement with Actavis, Inc., or Actavis (see Note 17). Profit-sharing revenue is recognized at the time Actavis sells the products to its customers. Revenues derived from contract manufacturing services are recognized when third-party products are shipped to customers, after the customer has accepted test samples of the products to be shipped.
The Company does not recognize product revenue unless the following fundamental criteria are met: (i) persuasive evidence of an arrangement exists, (ii) transfer of title has occurred, (iii) the price to the customer is fixed or determinable, and (iv) collection is reasonably assured. Furthermore, the Company does not recognize revenue until all customer acceptance requirements have been met. The Company estimates and records reductions to revenue for discounts, product returns, and pricing adjustments, such as wholesaler chargebacks, in the same period that the related revenue is recorded.
The Company’s accounting policy is to review each agreement involving contract development and manufacturing services to determine if there are multiple revenue-generating activities that constitute more than one unit of accounting. Revenues are recognized for each unit of accounting based on revenue recognition criteria relevant to that unit. The Company does not have any revenue arrangements with multiple deliverables.
Provision for Wholesaler Chargebacks
The provision for chargebacks is a significant estimate used in the recognition of revenue. As part of its sales terms with wholesale customers, the Company agrees to reimburse wholesalers for differences between the gross sales prices at which the Company sells its products to wholesalers and the actual prices of such products at the time wholesalers resell them under the Company’s various contractual arrangements with third parties such as hospitals and group purchasing organizations. The Company estimates chargebacks at the time of sale to wholesalers based on wholesaler inventory stocking levels, historic chargeback rates, and current contract pricing.
The provision for chargebacks is reflected in net revenues and a reduction to accounts receivables. The following table is an analysis of the chargeback provision:
|
Year Ended December 31,
|
||||||||
|
2014
|
2013
|
|||||||
|
(in thousands)
|
||||||||
|
Beginning balance
|
$ | 18,104 | $ | 11,898 | ||||
|
Provision related to sales made in the current period
|
156,235 | 213,075 | ||||||
|
Credits issued to third parties
|
(162,467 | ) | (206,869 | ) | ||||
|
Ending balance
|
$ | 11,872 | $ | 18,104 | ||||
Changes in chargeback provision from period to period are primarily dependent on the Company’s sales to its wholesalers, the level of inventory held by the wholesalers’, and on the wholesaler customer mix. The approach that the Company uses to estimate chargebacks has been consistently applied for all periods presented. Variations in estimates have been historically small. The Company continually monitors the provision for chargebacks and makes adjustments when it believes that the actual chargebacks may differ from the estimates. The settlement of chargebacks generally occurs within 30 days after the sale to wholesalers.
Accrual for Product Returns
The Company offers most customers the right to return qualified excess or expired inventory for partial credit; however, products sold to Actavis are non-returnable. The Company’s product returns primarily consist of the returns of expired products from sales made in prior periods. Returned products cannot be resold. At the time product revenue is recognized, the Company records an accrual for estimated returns. The accrual is based, in part, upon the historical relationship of product returns to sales and customer contract terms. The Company also assesses other factors that could affect product returns including market conditions, product obsolescence, and the introduction of new competition. Although these factors do not normally give the Company’s customers the right to return products outside of the regular return policy, the Company realizes that such factors could ultimately lead to increased returns. The Company analyzes these situations on a case-by-case basis and makes adjustments to the product return reserve as appropriate.
The provision for product returns is reflected in net revenues. The following table is an analysis of product return liability:
|
Year Ended December 31,
|
||||||||
|
2014
|
2013
|
|||||||
|
(in thousands)
|
||||||||
|
Beginning balance
|
$ | 4,592 | $ | 2,673 | ||||
|
Provision for product returns
|
(714 | ) | 2,711 | |||||
|
Credits issued to third parties
|
(1,470 | ) | (792 | ) | ||||
|
Ending balance
|
$ | 2,408 | $ | 4,592 | ||||
For the years ended December 31, 2014 and 2013, the Company’s aggregate product return rate was 1.1% and 1.4% of qualified sales, respectively.
AMPHASTAR PHARMACEUTICALS, INC.
NOTES TO CONSOLIDATED FINANCIAL STATEMENTS
5. Income (Loss) per Share
Basic income (loss) per share is calculated based upon the weighted-average number of common shares outstanding during the period and contingently issuable shares such as fully vested deferred stock units, or DSUs, as of the date all necessary conditions for issuance have been met. Diluted income per share gives effect to all potential dilutive common shares outstanding during the period, such as stock options and nonvested DSUs.
As the Company reported a net loss for the year ended December 31, 2014, the diluted net loss per share, as reported, is equal to the basic net loss per share since the effect of the assumed exercise of stock options and conversion of nonvested DSUs is anti-dilutive. Total stock options and nonvested DSUs excluded from the year ended December 31, 2014 net loss per share were 11,371,891 and 503,010, respectively.
For the year ended December 31, 2013, options to purchase 7,124,091 shares of common stock with a weighted-average exercise price of $17.62 per share, respectively, were excluded in the computation of diluted net income per share because the effect from the assumed exercise of these options would be anti-dilutive.
For the year ended December 31, 2012, options to purchase 5,235,278 shares of common stock with a weighted-average exercise price of $22.09 per share, respectively, were excluded in the computation of diluted net income per share because the effect from the assumed exercise of these options would be anti-dilutive.
The following table provides the calculation of basic and diluted net income (loss) per common share for each of the periods presented:
|
Year Ended December 31,
|
||||||||||||
|
2014
|
2013
|
2012
|
||||||||||
|
(in thousands, except per share data)
|
||||||||||||
|
Basic and dilutive numerator:
|
||||||||||||
|
Net income (loss)
|
$ | (10,699 | ) | $ | 11,862 | $ | 18,094 | |||||
|
Denominator:
|
||||||||||||
|
Common shares outstanding
|
41,957
|
38,705 | 38,578 | |||||||||
|
Contingently issuable shares - vested DSUs
|
—
|
7 | 2 | |||||||||
|
Weighted-average common shares outstanding—basic
|
41,957 | 38,712 | 38,580 | |||||||||
|
Net effect of dilutive securities:
|
||||||||||||
|
Stock options
|
— | 104 | 241 | |||||||||
|
Contingently issuable shares – nonvested DSUs
|
— | 67 | 119 | |||||||||
|
Weighted-average common shares outstanding—diluted
|
41,957 | 38,883 | 38,940 | |||||||||
|
Net income (loss) per common share—basic
|
$ | (0.25 | ) | $ | 0.31 | $ | 0.47 | |||||
|
Net income (loss) per common share—diluted
|
$ | (0.25 | ) | $ | 0.31 | $ | 0.46 | |||||
6. Segment Reporting
The Company’s business is the development, manufacture, and marketing of pharmaceutical products. On April 30, 2014, the Company established AFP and as a result, during the quarter ended September 30, 2014, the Company changed the structure of its reportable segments, establishing two reporting segments that each report to the Chief Operating Decision Maker, or CODM, as defined in ASC Topic 280, Segment Reporting. The Company’s performance will be assessed and resources will be allocated by the CODM based on the following two reportable segments:
|
-
|
Finished pharmaceutical products
|
|
-
|
Active pharmaceutical ingredients, or API
|
The finished pharmaceutical products segment currently manufactures, markets and distributes enoxaparin, Cortrosyn
®
, naloxone, lidocaine jelly, as well as, various other critical and non-critical care drugs. The API segment currently manufactures and distributes recombinant human insulin and porcine insulin.
Selected financial information by reporting segment is presented below:
|
Year Ended December 31,
|
||||||||||||
|
2014
|
2013
|
2012
|
||||||||||
|
(in thousands)
|
||||||||||||
|
Net revenues:
|
||||||||||||
|
Finished pharmaceutical products
|
$ | 198,480 | $ | 229,681 | $ | 204,323 | ||||||
|
API
|
11,981 | — | — | |||||||||
|
Total net revenues
|
210,461 | 229,681 | 204,323 | |||||||||
|
Gross profit (loss):
|
||||||||||||
|
Finished pharmaceutical products
|
52,724 | 86,956 | 90,303 | |||||||||
|
API
|
(1,468 | ) | — | — | ||||||||
|
Total gross profit
|
51,256 | 86,956 | 90,303 | |||||||||
|
Operating expenses
|
69,239 | 69,466 | 64,906 | |||||||||
|
Income (loss) from operations
|
(17,983 | ) | 17,490 | 25,397 | ||||||||
|
Non-operating income (expenses)
|
(165 | ) | (263 | ) | 481 | |||||||
|
Income (loss) before income taxes
|
$ | (18,148 | ) | $ | 17,227 | $ | 25,878 | |||||
The Company manages its business segments to the gross profit level and manages its operating and other costs on a company-wide basis. The Company does not identify total assets by segment for internal purposes, as the Company’s CODM does not assess performance, make strategic decisions, or allocate resources based on assets.
Net revenues and carrying values of long-lived assets of enterprises by geographic regions are as follows:
|
Net Revenue
Year Ended December 31,
|
Long-Lived Assets
December 31,
|
|||||||||||||||||||
|
2014
|
2013
|
2012
|
2014
|
2013
|
||||||||||||||||
|
(in thousands)
|
||||||||||||||||||||
|
U.S.
|
$ | 198,480 | $ | 229,681 | $ | 204,323 | $ | 102,313 | $ | 99,398 | ||||||||||
|
China
|
— | — | — | 22,170 | 17,221 | |||||||||||||||
|
France
|
11,981 | — | — | 13,806 | — | |||||||||||||||
|
Total
|
$ | 210,461 | $ | 229,681 | $ | 204,323 | $ | 138,289 | $ | 116,619 | ||||||||||
AMPHASTAR PHARMACEUTICALS, INC.
NOTES TO CONSOLIDATED FINANCIAL STATEMENTS
7. Customer and Supplier Concentration
Customer Concentrations
Three large wholesale drug distributors, AmerisourceBergen Corporation, or AmerisourceBergen, Cardinal Health, Inc. or Cardinal, and McKesson Corporation, or McKesson, are all distributors of the Company’s products, as well as suppliers of a broad range of health care products. Actavis, Inc. has exclusive marketing rights of the Company’s enoxaparin product to the U.S. retail pharmacy market. MannKind Corporation began buying RHI API from the Company in December 2014. The Company considers these five customers to be its major customers, as each individually and they collectively represented a significant percentage of the Company’s net revenue for the years ended December 31, 2014, 2013, and 2012, and accounts receivable as of December 31, 2014 and 2013. The following table provides accounts receivable and net revenues information for these major customers:
|
% of Total Accounts
Receivable
|
% of Net
Revenue
|
|||||||||||||||||||
|
December 31,
|
Year Ended December 31,
|
|||||||||||||||||||
|
2014
|
2013
|
2014
|
2013
|
2012
|
||||||||||||||||
|
Actavis, Inc.
|
18 | % | 44 | % | 30 | % | 35 | % | 35 | % | ||||||||||
|
AmerisourceBergen
|
5 | % | 11 | % | 15 | % | 15 | % | 14 | % | ||||||||||
|
Cardinal Health
|
15 | % | 7 | % | 14 | % | 13 | % | 13 | % | ||||||||||
|
MannKind Corporation
|
21
|
% |
—
|
2
|
% |
—
|
—
|
|||||||||||||
|
McKesson
|
13 | % | 13 | % | 22 | % | 26 | % | 27 | % | ||||||||||
Supplier Concentrations
The Company depends on suppliers for raw materials, active pharmaceutical ingredients, and other components that are subject to stringent U.S. Food and Drug Administration, or FDA, requirements. Some of these materials may only be available from one or a limited number of sources. Establishing additional or replacement suppliers for these materials may take a substantial period of time, as suppliers must be approved by the FDA. Furthermore, a significant portion of raw materials may only be available from foreign sources. If the Company is unable to secure, on a timely basis, sufficient quantities of the materials it depends on to manufacture and market its products, it could have a materially adverse effect on the Company’s business, financial condition, and results of operations.
8. Fair Value Measurements
The accounting standards of the Financial Accounting Standards Board, or FASB, define fair value as the price that would be received to sell an asset or paid to transfer a liability in an orderly transaction between market participants in the principal or most advantageous market for the asset or liability at the measurement date (an exit price). These standards also establish a hierarchy that prioritizes observable and unobservable inputs used in measuring fair value of an asset or liability, as described below:
|
·
|
Level 1
– Inputs to measure fair value are based on quoted prices (unadjusted) in active markets on identical assets or liabilities;
|
|
·
|
Level 2 –
Inputs to measure fair value are based on the following: a) quoted prices in active markets on similar assets or liabilities, b) quoted prices for identical or similar instruments in inactive markets, or c) observable (other than quoted prices) or collaborated observable market data used in a pricing model from which the fair value is derived; and
|
|
·
|
Level 3
– Inputs to measure fair value are unobservable and the assets or liabilities have little, if any, market activity; these inputs reflect the Company’s own assumptions about the assumptions that market participants would use in pricing the assets or liabilities based on best information available in the circumstances.
|
The Company measures fair value based on the prices that would be received to sell an asset or paid to transfer a liability in an orderly transaction between market participants at the measurement date.
The Company classifies its cash equivalents and short-term investments as Level 1 assets, as they are valued on a recurring basis using quoted market prices with no valuation adjustments applied. The Company does not hold any Level 2 or Level 3 instruments that are measured for fair value on a recurring basis.
The fair values of the Company’s financial assets and liabilities measured on a recurring basis, as of December 31, 2014 and 2013, are as follows:
|
Total
|
Quoted Prices in
Active Markets
for Identical
Assets
(Level 1)
|
Significant Other
Observable Inputs
(Level 2)
|
Significant
Unobservable Inputs
(Level 3)
|
|||||||||||||
|
(in thousands)
|
||||||||||||||||
|
Cash equivalents:
|
||||||||||||||||
|
Money market accounts
|
$ | 42,994 | $ |
42,994
|
$ | — | $ | — | ||||||||
|
Restricted short-term investments:
|
||||||||||||||||
|
Certificates of deposit
|
1,495 | 1,495 | — | — | ||||||||||||
|
Fair value measurement as of December 31, 2014
|
$ | 44,489 | $ | 44,489 | $ | — | $ | — | ||||||||
|
Cash equivalents:
|
||||||||||||||||
|
Money market accounts
|
$ | 41,183 | $ | 41,183 | $ | — | $ | — | ||||||||
|
Restricted short-term investments:
|
||||||||||||||||
|
Certificates of deposit
|
1,325 | 1,325 | — | — | ||||||||||||
|
Fair value measurement as of December 31, 2013
|
$ | 42,508 | $ | 42,508 | $ | — | $ | — | ||||||||
The fair value of the Company’s cash equivalents includes money market funds and certificates of deposit with maturities of one year or less. Short-term investments consist of certificate of deposit accounts that expire within 12 months for which market prices are readily available. The restrictions placed on the certificate of deposit accounts have a negligible effect on the fair value of these financial assets; these funds are restricted to meet the Company’s obligation for workers’ compensation claims.
The Company adopted the required fair value measurements and disclosures provisions related to nonfinancial assets and liabilities. These assets and liabilities are not measured at fair value on a recurring basis but are subject to fair value adjustments in certain circumstances. These items primarily include long-lived assets, goodwill, and intangible assets for which the fair value of assets is determined as part of the related impairment test. As of December 31, 2014 and 2013, there were no significant adjustments to fair value for nonfinancial assets or liabilities.
AMPHASTAR PHARMACEUTICALS, INC.
NOTES TO CONSOLIDATED FINANCIAL STATEMENTS
9. Goodwill and Intangible Assets
Intangible assets include product rights, trademarks, patents, land-use rights, and goodwill. The table below shows the weighted-average life, original cost, accumulated amortization, and net book value by major intangible asset classification:
|
Weighted-Average Life (Years)
|
Original Cost
|
Accumulated Amortization
|
Net Book Value
|
|||||||||||||
|
(in thousands)
|
||||||||||||||||
|
Definite-lived intangible assets
|
||||||||||||||||
|
Product rights
|
12 | $ | 27,134 | $ | 20,896 | $ | 6,238 | |||||||||
|
Patents
|
10 | 293 | 78 | 215 | ||||||||||||
|
Trademarks
|
11 | 19 | 15 | 4 | ||||||||||||
|
Land-use rights
|
39 | 2,540 | 221 | 2,319 | ||||||||||||
|
Other intangible assets
|
1 | 505 | 505 | — | ||||||||||||
|
Subtotal
|
12 |
30,491
|
21,715
|
8,776 | ||||||||||||
|
Indefinite-lived intangible assets
|
||||||||||||||||
|
Trademark
|
* | 29,225 | — | 29,225 | ||||||||||||
|
Goodwill
|
||||||||||||||||
|
Finished pharmaceutical products
|
* | 280 | — | 280 | ||||||||||||
|
API
|
* |
4,187
|
— |
4,187
|
||||||||||||
|
AFP customers
|
* | 97 | — | 97 | ||||||||||||
|
Subtotal
|
* |
33,789
|
— |
33,789
|
||||||||||||
|
As of December 31, 2014
|
* | $ |
64,280
|
$ |
21,715
|
$ |
42,565
|
|||||||||
|
Weighted-Average Life (Years)
|
Original Cost
|
Accumulated Amortization
|
Net Book Value
|
|||||||||||||
|
(in thousands)
|
||||||||||||||||
|
Definite-lived intangible assets
|
||||||||||||||||
|
Product rights
|
12 | $ | 27,134 | $ | 19,114 | $ | 8,020 | |||||||||
|
Patents
|
10 | 298 | 50 | 248 | ||||||||||||
|
Trademarks
|
11 | 19 | 13 | 6 | ||||||||||||
|
Land-use rights
|
39 | 2,540 | 156 | 2,384 | ||||||||||||
|
Other intangible assets
|
1 | 505 | 505 | — | ||||||||||||
|
Subtotal
|
11 | 30,496 | 19,838 | 10,658 | ||||||||||||
|
Indefinite-lived intangible assets
|
||||||||||||||||
|
Trademark
|
* | 29,225 | — | 29,225 | ||||||||||||
|
Goodwill
|
||||||||||||||||
|
Finished pharmaceutical products
|
* | 280 | — | 280 | ||||||||||||
|
API
|
* | — | — | — | ||||||||||||
|
Subtotal
|
* | 29,505 | — | 29,505 | ||||||||||||
|
As of December 31, 2013
|
* | $ | 60,001 | $ | 19,838 | $ | 40,163 | |||||||||
_______________________
*
Intangible assets with indefinite lives have an undeterminable average life.
Goodwill acquired during the year ended December 31, 2014 is wholly related to the Merck API Transaction (see Note 3).
Goodwill
The Changes in the carrying amounts of goodwill were as follow:
|
December 31,
|
||||||||
|
2014
|
2013
|
|||||||
|
(in thousands)
|
||||||||
|
Beginning balance
|
$ | 280 | $ | 280 | ||||
|
Goodwill related to acquisition of business
|
4,369 | — | ||||||
|
Currency translation and other adjustments
|
(182 | ) | — | |||||
|
Ending Balance
|
$ | 4,467 | $ | 280 | ||||
Primatene
®
Mist Trademark
In January 2009, the Company acquired the exclusive rights to the trademark, domain name, website and domestic marketing, distribution and selling rights related to Primatene
®
Mist, an over-the-counter bronchodilator product, for a total consideration of $29.2 million, which is the carrying value as of December 31, 2014.
In determining the useful life of the trademark, the Company considered the following: the expected use of the intangible; the longevity of the brand; the legal, regulatory and contractual provisions that affect their maximum useful life; the Company’s ability to renew or extend the asset’s legal or contractual life without substantial costs; effects of the regulatory environment; expected changes in distribution channels; maintenance expenditures required to obtain the expected future cash flows from the asset; and considerations for obsolescence, demand, competition and other economic factors.
As a result of environmental concerns about chlorofluorocarbons, or CFCs, the FDA issued a final ruling on January 16, 2009 that required the CFC formulation of its Primatene
®
Mist product to be phased out by December 31, 2011. The former formulation of Primatene
®
Mist contained CFCs as a propellant; however, the Company intends to use the trademark for a future version of Primatene
®
Mist that utilizes hydrofluoroalkane, or HFA, as a propellant.
In 2013, the Company filed a new drug application, or NDA, for Primatene
®
Mist HFA and received a Prescription Drug User Fee Act date set for May 2014. In May 2014, the Company received a complete response letter, or CRL, from the FDA, which requires additional non-clinical information, label revisions and follow-up studies (label comprehension, behavioral and actual use) to assess consumers’ ability to use the device correctly to support approval of the product in the over-the-counter setting. Additionally the CRL noted current Good Manufacturing Practices, or cGMP, deficiencies in a recent inspection of the Company’s API supplier’s manufacturing facility, which produces epinephrine, and indicated that the Company’s NDA could not be approved until these issues were resolved. Subsequent to the receipt of the CRL, the supplier notified the Company that the cGMP deficiencies were satisfactorily resolved. Accordingly, the Company believes this condition for approval has been satisfied. The Company met with the FDA in October 2014 to discuss preliminary data results and to clarify the FDA requirements for further studies. The Company is in the process of generating the remaining data required by the CRL and will submit an NDA Amendment that it believes will address the FDA’s concerns. However, there can be no guarantee that any amendment to the Company’s NDA will result in timely approval of the product or approval at all.
Based on the Company’s filed version of Primatene
®
Mist HFA, the Company’s plan to submit an NDA amendment to address the FDA’s concerns, the long history of the Primatene
®
Mist trademark (marketed since 1963) and the Company’s perpetual rights to the trademark, the Company has determined that the trademark has an indefinite useful life. If the HFA version is approved by the FDA, it will be marketed under the same trade name; therefore, an impairment charge would not be required.
Amortization
Included in cost of revenues for the years ended December 31, 2014, 2013 and 2012 is product rights amortization expense of $1.8 million each year, primarily related to Cortrosyn
®
.
As of December 31, 2014, the expected amortization expense for all amortizable intangible assets during the next five fiscal years ended December 31 and thereafter is as follows:
|
(in thousands)
|
||||
|
2015
|
$ | 1,878 | ||
|
2016
|
1,878 | |||
|
2017
|
1,877 | |||
|
2018
|
986 | |||
|
2019
|
95 | |||
|
Thereafter
|
2,062 | |||
|
Total amortizable intangible assets
|
8,776 | |||
|
Indefinite-lived intangibles
|
33,789
|
|||
|
Total intangibles (net of accumulated amortization)
|
$ |
42,565
|
||
AMPHASTAR PHARMACEUTICALS, INC.
NOTES TO CONSOLIDATED FINANCIAL STATEMENTS
10. Inventories
Inventories are stated at the lower of cost or market, using the first-in, first-out method. Provisions are made for slow-moving, unsellable or obsolete items. Inventories consist of the following:
|
December 31,
|
||||||||
|
2014
|
2013
|
|||||||
|
(in thousands)
|
||||||||
|
Raw materials and supplies
|
$ | 41,996 | $ | 34,470 | ||||
|
Work in process
|
16,221 | 14,698 | ||||||
|
Finished goods
|
24,755 | 26,501 | ||||||
|
Total inventory
|
82,972 | 75,669 | ||||||
|
Less reserve for excess and obsolete inventories
|
(640 | ) | (5,753 | ) | ||||
|
Total inventory, net
|
$ | 82,332 | $ | 69,916 | ||||
11. Property, Plant, and Equipment
Property, plant, and equipment consist of the following:
|
December 31,
|
||||||||
|
2014
|
2013
|
|||||||
|
(in thousands)
|
||||||||
|
Building
|
$ | 67,760 | $ | 58,898 | ||||
|
Leasehold improvements
|
23,960 | 23,834 | ||||||
|
Land
|
7,020 | 5,805 | ||||||
|
Machinery and equipment
|
104,819 | 93,617 | ||||||
|
Furniture, fixtures, and automobiles
|
12,213 | 9,355 | ||||||
|
Construction in progress
|
25,068 | 15,685 | ||||||
|
Total property, plant, and equipment
|
240,840 | 207,194 | ||||||
|
Less accumulated depreciation and amortization
|
(102,551 | ) | (90,575 | ) | ||||
|
Total property, plant, and equipment, net
|
$ | 138,289 | $ | 116,619 | ||||
The Company incurred depreciation expense of $12.5 million, $11.2 million, and $9.7 million for the years ended December 31, 2014, 2013, and 2012, respectively.
Interest expense capitalized was approximately $1.2 million, $0.1 million, and $0.3 million, for the years ended December 31, 2014, 2013, and 2012, respectively. The interest expense capitalized is primarily related to certain foreign construction projects during the year.
As of December 31, 2014 and 2013, the Company had $3.4 million and $3.4 million, respectively, in capitalized manufacturing equipment that is intended to be used specifically for the manufacture of Primatene
®
Mist HFA. The Company will continue to monitor developments with the FDA as it relates to its Primatene
®
Mist HFA in determining if there is an impairment of these related fixed assets (see Note 9).
12. Impairment of Long-Lived Assets
All of the Company’s impairments relate primarily to the write-off of certain manufacturing equipment related to abandoned projects. For the years ended December 31, 2014, 2013 and 2012, the Company recorded an impairment loss of $0.4 million, $0.1 million, and $2.1 million, respectively in the Finished Pharmaceutical Product segment. The $2.1 million impairment write-off in 2012 is primarily related to equipment for a production project that was suspended.
AMPHASTAR PHARMACEUTICALS, INC.
NOTES TO CONSOLIDATED FINANCIAL STATEMENTS
13. Debt
Debt consists of the following:
|
December 31,
|
||||||||
|
2014
|
2013
|
|||||||
|
(in thousands)
|
||||||||
|
Loans with East West Bank
|
||||||||
|
Mortgage payable due January 2016
|
$ | 3,887 | $ | 4,041 | ||||
|
Mortgage payable due September 2016
|
2,289 | 2,364 | ||||||
|
Equipment loan paid off November 2014
|
— | 783 | ||||||
|
Line of credit facility due March 2016
|
— | — | ||||||
|
Equipment loan due April 2017
|
2,923 | 4,103 | ||||||
|
Line of credit facility due January 2019
|
— | — | ||||||
|
Loans with Cathay Bank
|
||||||||
|
Mortgage payable due April 2021
|
4,549 | 4,624 | ||||||
|
Revolving line of credit due May 2016
|
— | 15,000 | ||||||
|
Acquisition loan due April 2019
|
20,870 | — | ||||||
|
Payment obligation to Merck
|
8,160 | — | ||||||
|
Equipment under Capital Leases
|
1,022 | 1,258 | ||||||
|
Total debt and capital leases
|
43,700 | 32,173 | ||||||
|
Less current portion of long-term debt and capital leases
|
7,594 | 22,104 | ||||||
|
Long-term debt, net of current portion and capital leases
|
$ | 36,106 | $ | 10,069 | ||||
Loans with East West Bank
Mortgage Payable—Due January 2016
In December 2010, the Company refinanced an existing mortgage term loan, which had a principal balance outstanding of $4.5 million at December 31, 2010. The loan is payable in monthly installments with a final balloon payment of $3.8 million. The loan is secured by one of the buildings at the Company’s Rancho Cucamonga, California, headquarters complex, as well as one of its buildings at its Chino, California, complex. The loan bears a variable interest rate at the prime rate as published by
The Wall Street Journal,
with a minimum interest rate of 5.00%, and matures in January 2016.
Mortgage Payable—Due September 2016
In September 2006, the Company entered into a mortgage term loan in the principal amount of $2.8 million, which matures in September 2016. The loan is payable in monthly installments with a final balloon payment of $2.2 million plus interest. The loan is secured by one of the buildings at the Company’s Rancho Cucamonga, California, headquarters complex. The variable interest rate is equal to the three-month LIBOR plus 2.50%.
Equipment Loan—Paid off November 2014
In May 2009, the Company entered into an $8.0 million revolving credit facility. In November 2010, the Company converted the outstanding principal balance of $3.2 million into an equipment loan. Borrowings under the facility were secured by equipment purchased with debt proceeds. The facility bore interest at the prime rate as published by
The Wall Street Journal,
with a minimum interest rate of 5.00%. In November 2014, the Company repaid all outstanding amounts due under this facility.
Line of Credit Facility—Due March 2016
In March 2012, the Company entered into a $10.0 million line of credit
facility. Borrowings under the facility are secured by inventory and accounts receivable. Borrowings under the facility bear interest at the prime rate as published by
The Wall Street Journal
. This facility was to mature in July 2014. In April 2014, the Company extended the maturity date to March 2016. As of December 31, 2014, the Company did not have any amounts outstanding under this facility.
Equipment Loan—Due April 2017
In March 2012, the Company entered into an $8.0 million revolving credit facility. In March 2013, the Company, converted the outstanding principal balance of $4.9 million into an equipment loan. Borrowings under the facility are secured by equipment purchased with debt proceeds. Borrowings under the facility bear interest at the prime rate as published by
The Wall Street Journal
, with a minimum interest rate of 3.50%. This facility matures in April 2017.
Line of Credit Facility—Due January 2019
In July 2013, the Company entered into an $8.0 million line of credit facility. Borrowings under the facility were secured by equipment. The facility bore interest at the prime rate as published in
The Wall Street Journal
plus 0.25% and was to mature in January 2019. As of December 31, 2014, the Company did not have any amounts outstanding under this facility.
In January 2015, the Company drew down $6.2 million from the line of credit facility. Subsequently, the facility was then converted in an equipment loan with an outstanding principal balance of $6.2 million. Borrowings under the facility are secured by equipment purchased with the debt proceeds. The Company entered into a fixed interest rate swap contract on this facility to exchange the floating rate for a fixed interest payment over the life of the facility without the exchange of the underlying notional debt amount. The facility bears interest at a fixed rate of 4.48% and matures in January 2019.
Loans with Cathay Bank
Mortgage Payable—Due April 2021
In March 2007, the Company entered into a mortgage term loan in the principal amount of $5.3 million, which matured in March 2014. In April 2014, the Company refinanced the mortgage term loan, which had a principal balance outstanding of $4.6 million. The loan is payable in monthly installments of $28.1 thousand with a final balloon payment of $3.9 million. The loan is secured by the building at the Company’s Canton, Massachusetts location and bears interest at a fixed rate of 5.42% and matures in April 2021. As of December 31, 2014, the loan had a fair value of $4.8 million, compared to a book value of $4.5 million. The fair value of the loan was determined by using the interest rate associated with the Company’s mortgage loans with similar terms and collateral that has variable interest rates. The fair value of debt obligations is not re-measured on a recurring basis and the variable interest rate is deemed to be a Level 2 input for measuring fair value.
Revolving Line of Credit—Due May 2016
In April 2012, the Company entered into a $20.0 million revolving line of credit facility. Borrowings under the facility are secured by inventory, accounts receivables, and intangibles held by the Company. The facility bears interest at the prime rate as published by
The Wall Street Journal
with a minimum interest rate of 4.00%. This revolving line of credit was to mature in May 2014. In April 2014, the Company modified the facility to extend the maturity date to May 2016. As of December 31, 2014, the Company did not have any amounts outstanding under this facility.
Acquisition Loan—Due April 2019
On April 22, 2014, in conjunction with the Merck API Transaction, the Company entered into a secured term loan facility. The principal amount of the loan is $21.9 million and bears a variable interest rate at the prime rate as published by
The Wall Street Journal
, with a minimum interest rate of 4.00%. Beginning on June 1, 2014 and through the maturity date, April 22, 2019, the Company must make monthly payments of principal and interest based on the then outstanding amount of the loan amortized over a 120-month period. On April 22, 2019, all amounts outstanding under the loan become due and payable, which would be approximately $12.0 million based upon an interest rate of 4.00%. The loan is secured by 65% of the issued and outstanding shares of stock in AFP and certain assets of the Company, including accounts receivable, inventory, certain investment property, goods, deposit accounts, and general intangibles but not including the Company’s equipment and real property.
The loan includes customary restrictions on, among other things, the Company’s ability to incur additional indebtedness, pay dividends in cash or make other distributions in cash, make certain investments, create liens, sell assets, and make loans. The loan also includes customary events of defaults, the occurrence and continuation of any of which provide Cathay Bank the right to exercise remedies against the Company and the collateral securing the loan. These events of default include, among other things, the Company’s failure to pay any amounts due under the loan, the Company’s insolvency, the occurrence of any default under certain other indebtedness or material agreements, and a final judgment against the Company that is not discharged in 30 days.
Payment Obligation
Merck—Due December 2017
On April 30, 2014, in conjunction with the Merck API Transaction, the Company entered into a commitment obligation with Merck, in the principal amount of €11.6 million, or $16.0 million, subject to currency exchange fluctuations. The terms of the purchase price include annual payments over four years and bear a fixed interest rate of 3.00%. The final payment to Merck relating to this obligation is due December 2017. In December 2014, the Company made a principal payment of €4.9 million, or $6.0 million.
As of December 31, 2014, the payment obligation had a book value of €6.9 million, or $8.2 million, which approximates fair value. The fair value of the payment obligation was determined by using the interest rate associated with the Company’s acquisition loan with Cathay Bank that bears a variable interest rate at the prime rate as published by
The Wall Street Journal
, with a minimum interest rate of 4.00%. The fair value of the debt obligation is not re-measured on a recurring basis and the variable interest rate is deemed to be a Level 2 input for measuring fair value.
Covenants
At December 31, 2014, the Company was not in compliance with two of its financial covenants with Cathay Bank. The first one requiring a fixed charge coverage ratio of 1.2 to 1.0, or greater, and the second one required a minimum debt service coverage ratio of 1.5 to 1.0, or greater. On March 13, 2015, the Company obtained waivers of the debt covenants for the period ending December 31, 2014. At December 31, 2013, the Company was in compliance with its debt covenants, which include a minimum current ratio, minimum debt service coverage, minimum tangible net worth, and maximum debt-to-effective-tangible-net-worth ratio, computed on a consolidated basis in some instances and on a separate-company basis in others.
Equipment under Capital Leases
The Company entered into leases for certain equipment under capital leasing arrangements, which will expire at various times through 2019. The cost of equipment under capital leases was $1.5 million and $1.5 million at December 31, 2014 and 2013, respectively.
The accumulated amortization of equipment under capital leases was $0.4 million and $0.2 million at December 31, 2014 and 2013, respectively. Amortization of assets recorded under capital leases is included in depreciation and amortization expense in the accompanying consolidated financial statements.
Long-Term Debt Maturities
As of December 31, 2014, the principal amounts of long-term debt maturities during each of the next five fiscal years ending December 31 are as follows:
|
Debt
|
Capital Leases
|
Total
|
||||||||||
|
(in thousands)
|
||||||||||||
|
2015
|
$ | 7,243 | $ | 403 | ||||||||
|
2016
|
12,973 | 301 | ||||||||||
|
2017
|
3,131 | 298 | ||||||||||
|
2018
|
2,203 | 126 | ||||||||||
|
2019
|
13,076 | — | ||||||||||
|
Thereafter
|
4,052 | — | ||||||||||
| 42,678 | 1,128 | |||||||||||
|
Less amount representing interest
|
— | 106 | ||||||||||
| $ | 42,678 | $ | 1,022 | $ | 43,700 | |||||||
AMPHASTAR PHARMACEUTICALS, INC.
NOTES TO CONSOLIDATED FINANCIAL STATEMENTS
14. Income Taxes
The Company’s income (loss) before income taxes generated from its United States and foreign operations were:
|
Year Ended December 31,
|
||||||||||||
|
2014
|
2013
|
2012
|
||||||||||
|
(in thousands)
|
||||||||||||
|
Income (loss) before income taxes:
|
||||||||||||
|
United States
|
$ | (12,946 | ) | $ | 20,116 | $ | 27,715 | |||||
|
Foreign
|
(5,202 | ) | (2,889 | ) | (1,837 | ) | ||||||
|
Total income (loss) before taxes
|
$ | (18,148 | ) | $ | 17,227 | $ | 25,878 | |||||
The Company’s provision (benefit) for income taxes consisted of the following:
|
Year Ended December 31,
|
||||||||||||
|
2014
|
2013
|
2012
|
||||||||||
|
(in thousands)
|
||||||||||||
|
Current provision (benefit):
|
||||||||||||
|
Federal
|
$ | (131 | ) | $ | 3,306 | $ | (1,304 | ) | ||||
|
State
|
193 | 541 | (2,337 | ) | ||||||||
|
Foreign
|
1,388 | 104 | 94 | |||||||||
|
Total current provision (benefit)
|
1,450 | 3,951 | (3,547 | ) | ||||||||
|
Deferred provision (benefit):
|
||||||||||||
|
Federal
|
(4,309 | ) | 2,254 | 11,817 | ||||||||
|
State
|
(1,699 | ) | 227 | 170 | ||||||||
|
Foreign
|
(2,891 | ) | (1,067 | ) | (656 | ) | ||||||
|
Total deferred provision (benefit)
|
(8,899 | ) | 1,414 | 11,331 | ||||||||
|
Total provision (benefit) for income taxes
|
$ | (7,449 | ) | $ | 5,365 | $ | 7,784 | |||||
A reconciliation of the statutory federal income tax rate to the Company’s effective tax rate is as follows:
|
Year Ended December 31,
|
||||||||||||
|
2014
|
2013
|
2012
|
||||||||||
|
Statutory federal income tax (benefit)
|
(35.0 | %) | 35.0 | % | 35.0 | % | ||||||
|
State tax expense, net of federal tax benefit
|
(5.4 | ) | 2.9 | (4.7 | ) | |||||||
|
Foreign income tax
|
1.8 | 0.3 | 0.1 | |||||||||
|
Qualified production activities deduction
|
— | (3.3 | ) | — | ||||||||
|
Research and development credits
|
(6.4 | ) | (9.9 | ) | — | |||||||
|
Benefit for uncertain tax position
|
— | — | (3.0 | ) | ||||||||
|
ISO portion of stock options deductions
|
4.0 | 6.3 | 4.0 | |||||||||
|
Other
|
— | (0.2 | ) | (1.3 | ) | |||||||
|
Effective tax rate (benefit)
|
(41.0 | %) | 31.1 | % | 30.1 | % | ||||||
AMPHASTAR PHARMACEUTICALS, INC.
NOTES TO CONSOLIDATED FINANCIAL STATEMENTS
Deferred Tax Assets and Liabilities
Deferred income taxes reflect the net tax effects of temporary differences between the carrying amounts of assets and liabilities for financial reporting purposes and the amounts used for income tax purposes. The significant components of the Company’s deferred tax assets and liabilities are as follows:
|
December 31,
|
||||||||
|
2014
|
2013
|
|||||||
|
(in thousands)
|
||||||||
|
Deferred tax assets:
|
||||||||
|
Net operating loss carryforward
|
$ | 7,877 | $ | 933 | ||||
|
State income taxes
|
270 | 290 | ||||||
|
Inventory capitalization and reserve
|
6,843 | 5,800 | ||||||
|
Deferred revenue
|
864 | 1,151 | ||||||
|
Accrued payroll and benefits
|
1,571 | 1,465 | ||||||
|
Share-based compensation
|
8,437 | 6,987 | ||||||
|
Research and development credits
|
9,863 | 7,751 | ||||||
|
Alternative minimum tax
|
447 | 406 | ||||||
|
Accrued professional fees
|
568 | 885 | ||||||
|
Product return allowance
|
1,221 | 2,092 | ||||||
|
Accrued chargebacks
|
4,792 | 7,187 | ||||||
|
Bad debt reserve
|
67 | 57 | ||||||
|
Intangibles
|
3,861
|
—
|
||||||
|
Accrued for workers’ compensation insurance
|
864 | 776 | ||||||
|
Total deferred tax assets
|
47,545
|
35,780 | ||||||
|
Deferred tax liabilities:
|
||||||||
|
Depreciation/amortization
|
15,649 | 13,920 | ||||||
|
Intangibles
|
4,753
|
3,828 | ||||||
|
Federal impact of state deferred taxes
|
2,910
|
2,397 | ||||||
|
Other
|
937
|
575 | ||||||
|
Total deferred tax liabilities
|
24,249
|
20,720 | ||||||
|
Valuation Allowance
|
3,862 | — | ||||||
|
Net deferred tax assets
|
$ | 19,434 | $ | 15,060 | ||||
Net Operating Loss Carryforwards and Tax Credits
At December 31, 2014, the Company had U.S. federal, California , and other State net operating loss (“NOL”) carryforwards of approximately $15.4 million, $15.5 million, and $1.6 million, respectively. The federal, California and other states loss carryforwards begin to expire in 2034, 2029, and 2030, respectively. The Company also had foreign NOL carryforwards of approximately $2.9 million which can be used annually with certain limitations and have an indefinite carryforward period.
The California and other state NOL carryforwards exclude $15.8 million and $0.1 million, respectively, related to excess tax benefits from share-based awards. When the related tax benefits from these share-based awards are utilized, the tax benefit of these adjustments which will reduce the amount of income taxes payable will be offset against additional paid in capital.
At December 31, 2014, the Company had federal and California research and development tax credit carryforwards of approximately $2.7 million and $7.2 million, respectively. The federal research and development tax credit begins to expire in 2031 unless utilized beforehand. The California research and development tax credit has an indefinite carryforward period. The Company also had a U.S. federal alternative minimum tax credit carryforward of $0.4 million which can be used to offset future regular tax to the extent of the current AMT; the credit has an indefinite carryforward period.
The utilization of the NOL and credit carryforwards and other tax attributes could be subject to an annual limitation under Sections 382 and 383 of the Internal Revenue Code of 1986 (the “Code”), whereby they could be limited in the event a cumulative change in ownership of more than 50% occurs within a three-year period, as defined in the Code.
Valuation Allowance
In assessing the realizability of deferred tax assets, Management considers whether it is more likely than not that some portion or all of the deferred tax assets will be realized. When making an assessment when to establish a valuation allowance, Management considers sources of taxable income such as income in prior carryback periods, future reversal of existing deferred taxable temporary differences, projected future taxable income, and tax-planning strategies. Based on these assessments, Management believes that the Company’s deferred tax assets will more likely than not be realized in future years, except for the deferred tax asset related to certain intangible
assets
purchased by AFP in conjunction with the purchase of an API facility in France in April 2014. As a result, in connection with the AFP purchase accounting, the Company recorded a valuation allowance against the intangible deferred tax asset of $4.4 million with an offsetting entry to goodwill.
Undistributed Earnings (Losses) from Foreign Operations
As of December 31, 2014 and 2013, deferred income taxes have not been provided on the accumulated undistributed losses of the Company’s foreign subsidiaries of approximately $10.5 million and $5.0 million, respectively. In addition, it is the Company’s plan not to repatriate future foreign earnings to the U.S.
Uncertain Income Tax Positions
A reconciliation of the beginning and ending balances of unrecognized tax benefits is as follows:
|
December 31,
|
||||||||
|
2014
|
2013
|
|||||||
|
(in thousands)
|
||||||||
|
Balance at the beginning of the year
|
$ | 4,186 | $ | 3,532 | ||||
|
Additions based on tax positions related to the current year
|
655 | 766 | ||||||
|
Deductions based on tax audit settlement
|
— | (93 | ) | |||||
|
Deductions based on statute of limitations
|
(58 | ) | (19 | ) | ||||
|
Balance at the end of the year
|
$ | 4,783 | $ | 4,186 | ||||
Included in the balance of unrecognized tax benefits as of December 31, 2014 was $4.3 million that represents the portion that would impact the effective income tax rate if recognized. The Company believes that it is reasonably possible that the total amount of unrecognized tax benefit as of December 31, 2014 will decline by $1.9 million in the next 12 months as a result of the expected resolution of a current U.S. state audit.
The Company recognizes accrued interest and penalties related to unrecognized tax benefits in its income tax provision. For the years ended December 31, 2014 and 2013, the Company recognized accrued interest of approximately $0.1 million and $0.1 million, respectively, related to its uncertain tax position. For the year ended December 31, 2012, the Company recognized a net reduction to its income tax provision of approximately $1.2 million, related to its uncertain tax position. No penalties were required to be accrued on its uncertain tax positions.
The Company and/or one or more of its subsidiaries filed income tax returns in the U.S. federal jurisdiction and various U.S. states and foreign jurisdictions. As of December 31, 2014, the Company is not subject to U.S. federal, state, and foreign income tax examinations for years before 2006. In August 2011, the California FTB commenced an audit of the Company’s 2007, 2008, and 2009 tax returns; this audit is currently ongoing. The Company is subject to income tax audit by tax authorities for tax years 2011, 2012 and 2013 for federal and 2007 to 2013 for states.
15. Stockholders' Equity
Common and Preferred Stock
In June 2014, the Company completed an initial public offering in which the Company sold 5,840,000 shares of its common stock, which included 1,200,000 shares of the Company’s common stock pursuant to the underwriters’ exercise of their over-allotment option, at a price to the public of $7.00 per share, resulting in gross proceeds of $40.9 million. In connection with the offering, the Company paid $6.2 million in underwriting discounts, commissions, and offering costs, resulting in net proceeds of $34.7 million.
The Company’s Certificate of Incorporation, as amended and restated in June 2014 in connection with the closing of its initial public offering, authorizes the Company to issue 300,000,000 shares of common stock, $0.0001 par value per share, and 20,000,000 shares of preferred stock, $0.0001 par value per share. As of December 31, 2014 and 2013, there were no shares of preferred stock issued or outstanding.
Equity Plans
As of December 31, 2014, the Company had two equity plans, the Amended and Restated 2005 Equity Incentive Award Plan, or 2005 Plan, and the 2014 Employee Stock Purchase Plan or ESPP. Prior to the adoption of these plans, the Company granted options pursuant to the 2002 Amended and Restated Stock Option/Stock Issuance Plan and, from 1998 through 2001, the Company’s board of directors granted options to purchase shares of its common stock under the Key Employee Stock Incentive Plan, the 2001 Employee Incentive Plan, the 2000 Employee Incentive Plan and the 1999 Employee Incentive Plan. Upon termination of the predecessor plans, the shares available for grant at the time of termination, and shares subsequently returned to the plans upon forfeiture or option termination, were transferred to the successor plan in effect at the time of share return.
The Company issues new shares of common stock upon exercise of stock options.
Amended and Restated 2005 Equity Incentive Award Plan
The 2005 Plan provides for the grant of incentive stock options, or ISOs, nonqualified stock options, or NQSOs, restricted stock awards, restricted stock unit awards, stock appreciation rights, or SARs, dividend equivalents and stock payments to our employees, members of the board of directors and consultants. Stock options under the 2005 Plan may be granted with a term of up to ten years and at prices no less than the fair market value of our common stock on the date of grant. To date, stock options granted to existing employees generally vest over three to five years and stock options granted to new employees vest over four years. The 2005 Plan also contains an "evergreen provision" that allows for an annual increase in the number of shares available for issuance on January 1 of each year during the ten-year term of the 2005 Plan, beginning January 1, 2007. The annual increase in the number of shares shall be either 2% of our outstanding shares on the applicable January 1 or a lesser amount determined by our board of directors.
As of December 31, 2014 the Company reserved an aggregate of 2.3 million shares of common stock for future issuance under the 2005 Plan. In January 2015, an additional 892,936 shares were reserved under the 2005 Plan.
2014 Employee Stock Purchase Plan
The Company adopted the ESPP in June 2014 in connection with its initial public offering. The Company’s ESPP permits eligible employees to purchase common stock at a discount through payroll deductions during defined offering periods. Under the ESPP, the Company may specify offerings with durations of not more than 27 months, and may specify shorter purchase periods within each offering. Each offering will have one or more purchase dates on which shares of its common stock will be purchased for employees participating in the offering. An offering may be terminated under certain circumstances. The price at which the stock is purchased is equal to the lower of 85% of the fair market value of the common stock at the beginning of an offering period or on the date of purchase.
As of December 31, 2014, the Company had not provided for any offerings under the ESPP and 2,000,000 shares of its common stock remained available for issuance under the ESPP.
Share Buyback Program
On November 6, 2014 the Company’s Board of Directors authorized a $10.0 million share buyback program, which is expected to continue for an indefinite period of time. The primary goal of the program is to offset dilution created by the Company’s equity compensation programs.
Purchases are being made through the open market and private block transactions pursuant to Rule 10b5-1 plans, privately negotiated transactions or other means as determined by the Company’s management and in accordance with the requirements of the Securities and Exchange Commission. The timing and actual number of shares repurchased will depend on a variety of factors including price, corporate and regulatory requirements, and other conditions. These repurchased shares are accounted for under the cost method and are included as a component of treasury stock in the Company’s Consolidated Balance Sheets.
Pursuant to the Company’s share repurchase program, the Company purchased 29,400 shares of its common stock during the year ended December 31, 2014 totaling $0.3 million.
AMPHASTAR PHARMACEUTICALS, INC.
NOTES TO CONSOLIDATED FINANCIAL STATEMENTS
Share-Based Award Activity and Balances
The Company accounts for share-based compensation payments in accordance with ASC Topic 718, which require measurement and recognition of compensation expense at fair value for all share-based payment awards made to employees, directors, and non-employees. Under these standards, the fair value of share-based payment awards is estimated at the grant date using an option-pricing model and the portion that is ultimately expected to vest is recognized as compensation cost over the requisite service period. The Company uses the Black-Scholes option-pricing model to estimate the fair value of share-based awards and recognizes share-based compensation cost over the vesting period using the straight-line single option method. Non-vested stock options held by non-employees are revalued using the Company’s estimate of fair value at each balance sheet date.
Options issued under the Company’s Amended and Restated 2005 Equity Incentive Award Plan, or the 2005 Plan, are generally granted at prices equal to or greater than the fair value of the underlying shares on the date of grant and vest based on continuous service. The options have a contractual term of five to ten years and generally vest over a three- to five-year period. The fair value of each option is amortized into compensation expense on a straight-line basis between the grant date for the option and the vesting date. The awards of restricted common stock such as Deferred Stock Units, or DSUs are valued at fair value on the date of grant. The Company uses the Black-Scholes option pricing model to determine the fair value of share-based awards. The Black-Scholes option pricing model has various inputs such as the estimated common share price, the risk-free interest rate, volatility, expected life and dividend yield, all of which are estimates. The Company also records share-based compensation expense net of expected forfeitures. The change of any of these inputs could significantly impact the determination of the fair value of the Company’s options and thus could significantly impact its results of operations. There are no awards with performance conditions and no awards with market conditions.
Valuation models and significant assumptions for share-based compensation are as follows:
|
|
▪
|
Determining Fair Value.
For all equity awards granted after the completion of the Company’s initial public offering, the fair value for its underlying common stock is determined using the closing price on the date of grant as reported on the NASDAQ Global Select Market. The Company uses the Black-Scholes formula to estimate the fair value of our share-based payments using a single option award approach. The application of this valuation model involves assumptions that are judgmental and sensitive in the determination of compensation expense. Key assumptions and estimation methodologies for inputs to the Black-Scholes calculation are developed in accordance with ASC Topic 718. The Company amortizes its share-based compensation expense over the requisite service period, which in most cases is the vesting period of the award.
|
For all equity grants granted, the primary factor in the valuation of equity awards was the fair value of the underlying common stock at the time of grant. Since the Company’s common stock was not traded in a public stock market exchange prior to June 25, 2014, the Board of Directors considered numerous factors including recent cash sales of the Company’s common stock to third-party investors, new business and economic developments affecting the Company and independent appraisals, when appropriate, to determine the fair value of the Company’s common stock. Independent appraisal reports were prepared using conventional valuation techniques, such as discounted cash flow analyses and the guideline company method using revenue and earnings multiples for comparable publicly traded companies, and a calculation of total option proceeds, from which a discount factor for lack of marketability was applied. This determination of the fair value of the common stock was performed on a contemporaneous basis. The Board of Directors determined the Company’s common stock fair market value on a quarterly basis and in some cases more frequently when appropriate.
|
▪
|
Expected Volatility.
The Company has limited data regarding company-specific historical or implied volatility of its share price. Consequently, the Company estimates its volatility based on the average of the historical volatilities of peer group companies from publicly available data for sequential periods approximately equal to the expected terms of its option grants. Management considers factors such as stage of life cycle, competitors, size, market capitalization and financial leverage in the selection of similar entities.
|
|
|
▪
|
Expected Term.
The expected term represents the period of time in which the options granted are expected to be outstanding. The Company estimates the expected term of options granted based on the midpoint between the vesting date and the end of the contractual term under the “short-cut” or simplified method permitted by the SEC implementation guidance for “plain vanilla” options. Applying this method, the weighted-average expected term of the Company’s options is approximately five years. The use of the short-cut method is permitted by the SEC beyond December 31, 2007, under certain circumstances, as described in the SEC implementation guidance. The Company will continue to use the short-cut method, as permitted, until we have developed sufficient historical data for employee exercise and post-vesting employment termination behavior after our common stock has been publicly traded for a reasonable period of time.
|
|
|
▪
|
Forfeitures.
The Company estimates forfeitures at the time of grant and revises those estimates in subsequent periods if actual experience differs from those estimates. For the years ended December 31, 2014, 2013 and 2012, the Company estimated an average overall forfeiture rate of 8%, 8%, and 9%, respectively, based on historical forfeitures since 1998. Forfeiture rates are separately calculated for its (1) directors and officers, (2) management personnel and (3) other employees. Share-based compensation is recorded net of expected forfeitures. The Company will periodically assess the forfeiture rate and the amount of expense recognized based on estimated historical forfeitures as compared to actual forfeitures. Changes in estimates are recorded in the period they are identified.
|
|
|
▪
|
Risk-Free Rate.
The risk-free interest rate is selected based upon the implied yields in effect at the time of the option grant on U.S. Treasury zero-coupon issues with a term approximately equal to the expected life of the option being valued.
|
|
|
▪
|
Dividends.
The Company does not anticipate paying cash dividends in the foreseeable future. Consequently, the Company uses an expected dividend yield rate of zero.
|
Tax benefits resulting from tax deductions in excess of the share-based compensation cost recognized (excess tax benefits) are recorded in the statements of cash flows as financing activities.
The weighted-averages for key assumptions used in determining the fair value of options granted during the years ended December 31, 2014, 2013, and 2012 are as follows:
|
Year Ended December 31,
|
||||||||||||
|
2014
|
2013
|
2012
|
||||||||||
|
Average volatility
|
29.9 | % | 28.6 | % | 32.6 | % | ||||||
|
Risk-free interest rate
|
1.7 | % | 1.3 | % | 0.7 | % | ||||||
|
Weighted-average expected life in years
|
5.0 | 4.5 | 4.8 | |||||||||
|
Dividend yield rate
|
0.0 | % | 0.0 | % | 0.0 | % | ||||||
Stock Options
A summary of option activity under all plans for the year ended December 31, 2014 is presented below:
|
Options
|
Weighted-
Average
Exercise
Price
|
Weighted-
Average
Remaining
Contractual
Term (Years)
|
Aggregate
Intrinsic
Value
(1)
|
|||||||||||||
|
(in thousands)
|
||||||||||||||||
|
Outstanding as of December 31, 2013
|
10,771,755 | $ | 15.39 | |||||||||||||
|
Options granted
|
1,661,862 | 15.04 | ||||||||||||||
|
Options exercised
|
(65,000 | ) | 10.79 | |||||||||||||
|
Options cancelled
|
(135,398 | ) |
15.74
|
|||||||||||||
|
Options expired
|
(861,328 | ) | 18.48 | |||||||||||||
|
Outstanding as of December 31, 2014
|
11,371,891 | $ | 15.12 | 4.62 | $ | 1,815 | ||||||||||
|
Exercisable as of December 31, 2014
|
6,281,300 | $ | 16.95 | 3.54 | $ | 871 | ||||||||||
__________________________________
|
(1)
|
The aggregate intrinsic value is calculated as the difference between the exercise price of the underlying awards and the estimated fair value of the Company’s common stock for those awards that have an exercise price below the estimated fair value at December 31, 2014.
|
AMPHASTAR PHARMACEUTICALS, INC.
NOTES TO CONSOLIDATED FINANCIAL STATEMENTS
A summary of option activity under all plans for the year ended December 31, 2013 is presented below:
|
Options
|
Weighted-
Average
Exercise
Price
|
Weighted-
Average
Remaining
Contractual
Term (Years)
|
Aggregate
Intrinsic
Value
(1)
|
|||||||||||||
|
(in thousands)
|
||||||||||||||||
|
Outstanding as of December 31, 2012
|
8,278,766 | $ | 18.00 | |||||||||||||
|
Options granted
|
3,598,725 | 12.09 | ||||||||||||||
|
Options exercised
|
(4,200 | ) | 13.07 | |||||||||||||
|
Options cancelled
|
(403,370 | ) | 12.88 | |||||||||||||
|
Options expired
|
(698,166 | ) | 30.84 | |||||||||||||
|
Outstanding as December 31, 2013
|
10,771,755 | $ | 15.39 | 4.88 | $ | 20,343 | ||||||||||
|
Exercisable as of December 31, 2013
|
5,154,201 | $ | 18.86 | 3.37 | $ | 5,756 | ||||||||||
___________________________________
|
(1)
The aggregate intrinsic value is calculated as the difference between the exercise price of the underlying awards and the estimated fair value of the Company’s common stock for those awards that have an exercise price below the estimated fair value at December 31, 2013.
|
For the years ended December 31, 2014, 2013, and 2012, the Company recorded stock option expense related to employees under all plans of $6.7 million, $5.9 million, and $6.5 million, respectively.
Information relating to option grants and exercises is as follows:
|
Year Ended December 31,
|
||||||||||||
|
2014
|
2013
|
2012
|
||||||||||
|
(in thousands, except per share data)
|
||||||||||||
|
Weighted-average grant date fair value
|
$ | 4.02 | $ | 2.79 | $ | 3.01 | ||||||
|
Intrinsic value of options exercised
|
144 | — | 1,546 | |||||||||
|
Cash received
|
571 | 55 | 333 | |||||||||
|
Total fair value of the options vested during the year
|
6,407 | 6,067 | 6,809 | |||||||||
A summary of the status of the Company’s nonvested options as of December 31, 2014, and changes during the year ended December 31, 2014, are presented below:
|
Options
|
Weighted-Average
Grant Date
Fair Value
|
|||||||
|
Nonvested as of December 31, 2013
|
5,617,554 | $ | 3.12 | |||||
|
Options granted
|
1,661,862 | 4.02 | ||||||
|
Options vested
|
(2,053,427 | ) | 3.12 | |||||
|
Options forfeited
|
(135,398 | ) | 5.60 | |||||
|
Nonvested as of December 31, 2014
|
5,090,591 | 3.34 | ||||||
A summary of the status of the Company’s nonvested options as of December 31, 2013, and changes during the year ended December 31, 2013, are presented below:
|
Options
|
Weighted-Average
Grant Date
Fair Value
|
|||||||
|
Nonvested as of December 31, 2012
|
3,849,866 | $ | 4.01 | |||||
|
Options granted
|
3,598,725 | 2.79 | ||||||
|
Options vested
|
(1,427,667 | ) | 4.25 | |||||
|
Options forfeited
|
(403,370 | ) | 4.13 | |||||
|
Nonvested as of December 31, 2013
|
5,617,554 | 3.12 | ||||||
AMPHASTAR PHARMACEUTICALS, INC.
NOTES TO CONSOLIDATED FINANCIAL STATEMENTS
As of December 31, 2014, there was $11.9 million of total unrecognized compensation cost, net of forfeitures, related to nonvested stock option based compensation arrangements granted under the Company’s 2005 Equity Incentive Award Plan, or the 2005 Plan. The cost is expected to be recognized over a weighted-average period of 2.3 years and will be adjusted for future changes in estimated forfeitures.
Deferred Stock Units
Beginning in 2007, the Company granted restricted stock awards in the form of deferred stock units, or DSUs, to certain employees and members of the Board of Directors with a vesting period of up to five years. The grantee receives one share of common stock at a specified future date for each DSU awarded. The DSUs may not be sold or otherwise transferred until certificates of common stock have been issued, recorded, and delivered to the participant. The DSUs do not have any voting or dividend rights prior to the issuance of certificates of the underlying common stock. The share-based expense associated with these grants was based on the Company’s common stock fair value at the time of grant and is amortized over the requisite service period, which generally is the vesting period. The Company recorded a total expense of $2.0 million, $0.6 million, and $0.5 million for the years ended December 31, 2014, 2013, and 2012, respectively, for these DSU awards.
As of December 31, 2014, there was $5.8 million of total unrecognized compensation cost, net of forfeitures, related to nonvested DSU-based compensation arrangements granted under the 2005 Plan. The cost is expected to be recognized over a weighted-average period of 2.4 years and will be adjusted for future changes in estimated forfeitures.
Additionally, prior to the Company’s IPO, the Company issued DSUs that were treated as an accounting exchange for expiring stock options, whereby the fair value of the expiring stock options equaled the fair value of the DSUs at the date of the exchange. As such, the Company did not record any expense related to these award modifications.
Information relating to DSU grants and deliveries is as follows:
|
Total DSUs Issued
|
Total Fair Market
Value of DSUs Issued
as Compensation
(1)
|
|||||||
|
(in thousands)
|
||||||||
|
DSUs outstanding at December 31, 2012
|
111,731 | |||||||
|
DSUs granted
(2)
|
100,675 | $ | 1,000 | |||||
|
DSUs forfeited
|
(20,048 | ) | ||||||
|
DSUs surrendered for taxes
|
(13,783 | ) | ||||||
|
Common stock delivered for DSUs
|
(80,080 | ) | ||||||
|
DSUs outstanding at December 31, 2013
|
98,495 | |||||||
|
DSUs granted
|
456,406 | $ | 6,474 | |||||
|
DSUs forfeited
|
(994 | ) | ||||||
|
DSUs surrendered for taxes
|
(10,670
|
) | ||||||
|
Common stock delivered
|
(40,227 | ) | ||||||
|
DSUs outstanding at December 31, 2014
|
503,010 | |||||||
____________________________
|
(1)
|
The total FMV is derived from the number of DSUs granted times the current stock price on the date of grant.
|
|
(2)
|
76,000 total expiring options were exchanged for 20,374 DSUs, in aggregate in 2013.
|
Equity Awards to Consultants
The Company has entered into various consulting agreements with Company stockholders and outside consultants. Consulting expenses are accrued as services are rendered. Consulting services are paid in cash and/or in common stock or stock options. Share-based compensation expense is recorded over the service period based on the estimated fair market value of the equity award at the date services are performed or upon completion of all services under the agreement. During the year ended December 31, 2014, the Company recorded an immaterial amount of share-based compensation related to the issuance of stock and stock options for services rendered by consultants. For the years ended December 31, 2013 and 2012, the Company did not record any share-based compensation expense for services rendered by consultants.
The Company recorded share-based compensation expense under all plans and is included in the Company’s consolidated statement of operations as follows:
|
Year Ended December 31,
|
||||||||||||
|
2014
|
2013
|
2012
|
||||||||||
|
(in thousands)
|
||||||||||||
|
Cost of revenues
|
$ | 1,678 | $ | 1,503 | $ | 1,794 | ||||||
|
Operating expenses:
|
||||||||||||
|
Selling, distribution and marketing
|
137 | 132 | 143 | |||||||||
|
General and administrative
|
6,800 | 4,701 | 4,593 | |||||||||
|
Research and development
|
665 | 699 | 895 | |||||||||
|
Total share-based compensation
|
$ | 9,280 | $ | 7,035 | $ | 7,425 | ||||||
16. Employee Benefits
401(k) plan
The Company has a defined contribution 401(k) plan, or the Plan, whereby eligible employees voluntarily contribute up to a defined percentage of their annual compensation. The Company matches contributions at a rate of 50% on the first 4% of employee contributions, or up to 2% of their annual compensation, and pays the administrative costs of the Plan. Employer contributions vest over four years. Total employer contributions for the years ended December 31, 2014, 2013, and 2012 were approximately $0.7 million, $0.6 million, and $0.5 million, respectively.
Defined Benefit Pension Plan
In connection with the Merck API Transaction, the Company assumed an obligation associated with a defined-benefit plan for eligible employees of AFP. This plan provides benefits to the employees from the date of retirement and is based on the employee’s length of time with the Company. The calculation is based on a statistical calculation combining a number of factors that include the employee’s age, length of service, and AFPs turnover rate.
The liability under the plan is based on a discount rate of 1.75% as of December 31, 2014. The liability is included in accrued liabilities in the accompanying consolidated balance sheets. The plan is currently unfunded, and the benefit obligation under the plan was $1.1 million at December 31, 2014. Expense under the plan was $0.2 million for the year ended December 31, 2014. The Company recorded an unrecognized gain of $0.2 million in its accumulated other comprehensive loss during the year ended December 31, 2014
related to the change in actuarial valuation of the Company’s defined benefit pension plan
.
17. Commitments and Contingencies
Distribution Agreement with Actavis, Inc.
In May 2005, the Company entered into an agreement to grant certain exclusive marketing rights for its enoxaparin product to Andrx Pharmaceuticals, Inc., or Andrx, which generally extends to the U.S. retail pharmacy market. To obtain such rights, Andrx made a non-refundable, upfront payment of $4.5 million to the Company upon execution of the agreement which was classified as deferred revenues. Under the agreement, the Company is paid a fixed cost per unit sold to Andrx and also shares in the gross profits (as defined) from Andrx’s sales of the product in the U.S. retail pharmacy market. In November 2006, Watson Pharmaceuticals, Inc., or Watson, acquired Andrx and all of the rights and obligations associated with the agreement. In January 2013, Watson adopted Actavis, Inc. as its new global name. The agreement has a term that expires in January 2019 and can be extended by Actavis for an additional three years. The agreement may only be terminated prior to the end of the term by either party in the case of a breach of contract or insolvency of the other party, by the Company if Actavis fails to purchase a minimum number of units and by Actavis if an infringement claim is made against Actavis.
In January 2012, the Company launched enoxaparin, beginning the seven-year period in which Actavis has the exclusive marketing rights for the Company’s enoxaparin product in the U.S. retail pharmacy market and the start of the Company’s recognition of the $4.5 million deferred revenue over this period on a straight-line basis. Actavis has an option to renew the agreement for an additional three years. As of December 31, 2014 and 2013, the balance of the deferred revenue was $2.6 million and $3.3 million, respectively.
The Company manufactures its enoxaparin product for the retail market according to demand specifications of Actavis. Upon shipment of enoxaparin to Actavis, the Company recognizes product sales at an agreed transfer price and records the related cost of products sold. Based on the terms of the Company’s distribution agreement with Actavis, the Company is entitled to a share of the ultimate profits based on the eventual net revenue from enoxaparin sales by Actavis to the end user less the agreed transfer price originally paid by Actavis to the Company. Actavis provides the Company with a quarterly sales report that calculates the Company’s share of Actavis’ enoxaparin gross profit. The Company records its share of Actavis’ gross profit as a component of net revenue.
Supply Agreement with MannKind Corporation
On July 31, 2014, the Company entered in a supply agreement with MannKind Corporation, or MannKind, pursuant to which the Company will manufacture for and supply to MannKind certain quantities of recombinant human insulin, or RHI, for use in MannKind’s product Afrezza
®
. Under the terms of the supply agreement, the Company will be responsible for manufacturing the RHI in accordance with MannKind’s specifications and agreed-upon quality standards. MannKind has agreed to purchase annual minimum quantities of RHI under the supply agreement of an aggregate amount of approximately €120.1 million, or approximately $146.0 million, in calendar years 2015 through 2019.
MannKind paid a non-refundable reservation fee to the Company in the amount of €11.0 million, or approximately $14.0 million. Under the agreement, the non-refundable reservation fee is considered as partial payment for the purchase commitment quantity for 2015. The Company classified the amount as deferred revenue. As of December 31, 2014, the balance of the deferred revenue was €11.0 million, or $13.4 million.
Unless earlier terminated, the term of the supply agreement expires on December 31, 2019 and can be renewed for additional, successive two-year terms upon 12 months’ written notice given prior to the end of the initial term or any additional two-year term. MannKind and the Company each have customary termination rights, including termination for material breach that is not cured within a specific time frame or in the event of liquidation, bankruptcy, or insolvency of the other party. In addition, MannKind may terminate the supply agreement upon two years’ prior written notice to the Company without cause or upon 30 days prior written notice to the Company if a controlling regulatory authority withdraws approval for Afrezza
®
; provided, however, in the event of a termination pursuant to either of these scenarios, the provisions of the supply agreement require MannKind to pay the full amount of all unpaid purchase commitments due over the initial term within 60 calendar days of the effective date of such termination.
In January 2015, the Company entered into a supply option agreement with MannKind, pursuant to which MannKind will have the option to purchase RHI, for use in MannKind’s product Afrezza
®
, in addition to the amounts specified in the July 2014 supply agreement. Under the agreement, MannKind has the option to purchase additional RHI in calendar years 2016 through 2019. In the event MannKind elects not to exercise its minimum annual purchase option for any year, MannKind shall pay the Company a capacity cancellation fee.
Operating Lease Agreements
The Company leases real and personal property, in the normal course of business, under various non-cancelable operating leases. The Company, at its option, can renew a substantial portion of its leases, at the market rate, for various renewal periods ranging from one to six years. Rental expense under these leases for the years ended December 31, 2014, 2013 and 2012 was approximately $3.1 million, $3.1 million, and $3.9 million, respectively.
Future minimum rental payments under operating leases that have initial or remaining non-cancelable lease terms in excess of 12 months for fiscal years ending December 31 are as follows:
|
Operating
Leases
|
||||
|
(in thousands)
|
||||
|
2015
|
$ | 2,585 | ||
|
2016
|
1,552 | |||
|
2017
|
1,356 | |||
|
2018
|
843 | |||
|
2019
|
675 | |||
| $ | 7,011 | |||
Purchase Commitments
As of December 31, 2014, the Company has entered into commitments to purchase equipment and raw materials for an aggregate amount of approximately $6.8 million. The Company anticipates that most of these commitments will be fulfilled by 2016.
The Company has entered into agreements with a Chinese governmental entity to acquire land-use rights to real property in Nanjing, China. Under the terms of these agreements, the Company has committed to invest capital in its wholly-owned subsidiary, ANP, and to develop these properties as an API manufacturing facility for the Company’s pipeline. In conjunction with these agreements, ANP modified its business license on July 3, 2012 to increase its authorized capital. As of December 31, 2014, the Company had invested approximately $45.0 million in ANP of its registered capital commitment of $61.0 million. The Company has committed to invest an additional $16.0 million in ANP, which is currently due by December 2017. This requirement to invest in ANP will result in cash being transferred from the U.S. parent company to ANP.
Per these agreements, in January 2010, the Company acquired certain land-use rights with a carrying value of $1.2 million. In addition, the Company purchased additional land-use rights in November 2012 for $1.3 million. The Company is committed to spend approximately $15.0 million in land development. The agreements require the construction of fixed assets on the property and specified a timetable for the construction of these fixed assets. The current pace of development of the property is behind the schedules described in the purchase agreements and, per the purchase agreement, potential monetary penalties could result if the development is delayed or not completed in accordance with the guidelines stated in the purchase agreements. During the year ended December 31, 2014, the Company invested $7.2 million to fund the Company’s research and development pipeline for ANP
.
18. Litigation
Enoxaparin Patent Litigation
In September 2011, Momenta Pharmaceuticals, Inc., or Momenta, a Boston-based pharmaceutical company, and Sandoz Inc, or Sandoz, the generic division of Novartis, initiated litigation against the Company for alleged patent infringement of two patents related to testing methods for batch release of enoxaparin, which the Company refers to as the “‘886 patent” and the “‘466 patent.” The lawsuit was filed in the United States District Court for the District of Massachusetts, or the District Court. In October 2011, the District Court issued a preliminary injunction barring the Company from selling its generic enoxaparin product and also requiring Momenta and Sandoz to post a $100.1 million bond. The preliminary injunction was stayed by the United States Court of Appeals for the Federal Circuit, or Federal Circuit, in January 2012, and reversed by the Federal Circuit in August 2012.
AMPHASTAR PHARMACEUTICALS, INC.
NOTES TO CONSOLIDATED FINANCIAL STATEMENTS
In January 2013, the Company moved for summary judgment of non-infringement of both patents. Momenta and Sandoz withdrew their allegations as to the ‘466 patent, and in July 2013, the District Court granted the Company’s motion for summary judgment of non-infringement of the ‘886 patent and denied Momenta and Sandoz’s motion for leave to amend infringement contentions. On January 24, 2014, the District Court judge entered final judgment in the Company’s favor on both patents. Momenta and Sandoz also filed a motion to collect attorney’s fees and costs relating to a discovery motion which the District Court granted. The parties have briefed the amount of attorney’s fees that should be imposed, which the Company believes should not exceed an amount of approximately $40 thousand. On January 30, 2014, Momenta and Sandoz filed a notice of appeal to the Federal Circuit appealing the court’s final judgment including summary judgment denying Momenta and Sandoz’s motion for leave to amend their infringement contentions. The Company intends to attempt to collect the $100.1 million bond posted by Momenta and Sandoz following the appeal. Momenta filed its opening appeal brief on June 27, 2014, the Company filed its responding brief on September 25, 2014, and Momenta filed its reply brief on November 13, 2014.
The Federal Circuit has scheduled oral argument for May 4, 2015.
False Claims Act Litigation
In January 2009, the Company filed a qui tam complaint in the U.S. District Court for the Central District of California alleging that Aventis Pharma S.A., or Aventis, through its acquisition of a patent through false and misleading statements to the U.S. Patent and Trademark Office, as well as through false and misleading statements to the FDA, overcharged the federal and state governments for its Lovenox
®
product. If the Company is successful in this litigation, it could be entitled to a portion of any damage award that the government ultimately may recover from Aventis. In October 2011, the District Court unsealed the Company’s complaint. Since the complaint was unsealed, this case has steadily progressed and remains pending.
On February 28, 2014, Aventis filed a motion for summary judgment on the issue of the adequacy of the Company’s notice letter to the government, and the District Court denied Aventis’ motion for summary judgment in a final order it issued on May 12, 2014. On June 9, 2014, at Aventis’ request, the District Court issued an order certifying for appeal its order denying Aventis’ motion for summary judgment. On June 9, 2014, Aventis filed with the United States Court of Appeals for the Ninth Circuit a petition for permission to appeal the District Court’s denial of Aventis’ motion for summary judgment, and the Company filed an opposition to Aventis’ petition on June 19, 2014. On August 22, 2014, the Court of Appeals granted Aventis’ petition. The parties have completed and filed their respective appeal briefs with the Ninth Circuit. A date for oral argument has not yet been set by the Ninth Circuit.
The District Court set an evidentiary hearing for July 7, 2014 on the “original source” issue, a key element under the False Claims Act. The evidentiary hearing was conducted as scheduled, from July 7, 2014 through July 10, 2014. The Company filed its post-hearing brief on August 11, 2014, Aventis filed its post-hearing brief on September 10, 2014, and the Company filed its reply brief on September 24, 2014. The District Court conducted a hearing for closing argument on the original source issue on October 10, 2014. The original source issue currently is under submission with the District Court.
California Employment Litigation
On January 6, 2015, the Company received a formal demand from Plaintiff’s counsel in an employment related lawsuit captioned Eva Hernandez v. International Medication Systems Limited, in connection with a complaint originally filed on February 4, 2013 in the Superior Court of California County of Los Angeles, by plaintiff Eva Hernandez on behalf of herself and others similarly situated. Plaintiff’s counsel has indicated an intent to file a motion for class certification, which currently is set to be filed by April 16, 2015. Plaintiff’s current complaint includes alleged violations of the California Labor Code stemming from the Company’s alleged timekeeping practices, as well as other similar and related claims brought under California law. In her current complaint, Plaintiff seeks damages and related remedies under California law, as well as various penalty payments under the California Labor Code, on behalf of herself and others similarly situated. The Company intends to vigorously defend against these claims, to which the Company believes it has substantial factual and legal defenses. In light of such factual and legal defenses, the Company believes the possibility of a material loss on the merits of the action is remote.
Other Litigation
The Company is also subject to various other claims and lawsuits arising in the ordinary course of business. In the opinion of management, the ultimate resolution of these matters is not expected to have a materially adverse effect on its financial position, results of operations, or cash flows; however, the results of litigation and claims are inherently unpredictable. Regardless of the outcome, litigation can have an adverse impact on the Company because of defense and settlement costs, diversion of management resources, and other factors.
AMPHASTAR PHARMACEUTICALS, INC.
NOTES TO CONSOLIDATED FINANCIAL STATEMENTS
19. Subsequent Event
Equipment Loan — Due January 2019
In January 2015, the Company drew down $6.2 million from its $8.0 million revolving credit facility with East West Bank which was entered into in July 2013. Subsequently, the facility was then converted in an equipment loan with an outstanding principal balance of $6.2 million. Borrowings under the facility are secured by equipment purchased with the debt proceeds. The Company entered into a fixed interest rate swap contract on this facility to exchange floating rate for a fixed interest payment over the life of the facility without the exchange of the underlying notional debt amount. The facility bears interest at a fixed rate of 4.48% and matures in January 2019.
Supply Option Agreement with MannKind Corporation
In January 2015, the Company entered into a supply option agreement with MannKind, pursuant to which MannKind will have the option to purchase RHI, for use in MannKind’s product Afrezza
®
, in addition to the amounts specified in the July 2014 supply agreement. Under the agreement, MannKind has the option to purchase additional RHI in calendar years 2016 through 2019. In the event MannKind elects not to exercise its minimum annual purchase option for any year, MannKind shall pay the Company a capacity cancellation fee.
AMPHASTAR PHARMACEUTICALS, INC.
NOTES TO CONSOLIDATED FINANCIAL STATEMENTS
20. Quarterly Financial Data (Unaudited)
|
|
2014 Quarters
|
|||||||||||||||
|
|
First
|
|
Second
|
|
Third
|
|
Fourth
|
|||||||||
|
Net revenues
|
|
|
||||||||||||||
|
Finished pharmaceutical products
|
$
|
45,870
|
$
|
48,901
|
53,729
|
49,980
|
||||||||||
|
API
|
—
|
102
|
5,982
|
5,897
|
||||||||||||
|
Total net revenues
|
$
|
45,870
|
|
|
$
|
49,003
|
|
|
$
|
59,711
|
|
|
$
|
55,877
|
|
|
|
Gross profit
|
|
|||||||||||||||
|
Finished pharmaceutical products
|
$
|
12,509
|
14,961
|
12,122
|
13,132
|
|||||||||||
|
API
|
—
|
35
|
(331
|
)
|
(1,172
|
)
|
||||||||||
|
Total gross profit
|
$
|
12,509
|
|
|
$
|
14,996
|
|
|
$
|
11,791
|
|
|
$
|
11,960
|
|
|
|
Net loss
|
|
$
|
(1,619
|
)
|
|
$
|
(1,180
|
)
|
|
$
|
(5,379)
|
|
|
$
|
(2,521
|
)
|
|
|
|
|
|
|||||||||||||
|
Weighted-average shares used to compute net income per common share
|
|
|
|
|
||||||||||||
|
Basic
|
|
38,769
|
|
|
39,767
|
|
|
44,644
|
|
|
44,648
|
|
||||
|
Diluted
|
|
38,769
|
|
|
39,767
|
|
|
44,644
|
|
|
44,648
|
|
||||
|
Net loss per common share
|
|
|
|
|
||||||||||||
|
Basic
|
|
$
|
(0.04
|
)
|
|
$
|
(0.03
|
)
|
|
$
|
(0.12
|
)
|
|
$
|
(0.06
|
)
|
|
Diluted
|
|
$
|
(0.04
|
)
|
|
$
|
(0.03
|
)
|
|
$
|
(0.12
|
)
|
|
$
|
(0.06
|
)
|
|
|
2013 Quarters
|
|||||||||||||||
|
|
First
|
Second
|
Third
|
Fourth
|
||||||||||||
|
Net revenue
|
|
|||||||||||||||
|
Finished pharmaceutical products
|
$
|
52,963
|
|
$
|
62,524
|
|
$
|
59,318
|
|
$
|
54,876
|
|
||||
|
API
|
—
|
—
|
—
|
—
|
||||||||||||
|
Total net revenues
|
$
|
52,963
|
|
$
|
62,524
|
|
$
|
59,318
|
|
$
|
54,876
|
|
||||
|
Gross profit
|
|
|||||||||||||||
|
Finished pharmaceutical products
|
$
|
19,558
|
|
$
|
27,489
|
|
$
|
20,280
|
|
$
|
19,629
|
|
||||
|
API
|
—
|
—
|
—
|
—
|
||||||||||||
|
Total gross profit
|
$
|
19,558
|
|
$
|
27,489
|
|
$
|
20,280
|
|
$
|
19,629
|
|
||||
|
Net income (loss)
|
|
$
|
2,383
|
$
|
7,810
|
$
|
(160
|
)
|
$
|
1,829
|
||||||
|
|
||||||||||||||||
|
Weighted-average shares used to compute net loss per common share
|
|
|||||||||||||||
|
Basic
|
|
38,707
|
|
38,708
|
|
38,709
|
|
38,724
|
|
|||||||
|
Diluted
|
|
38,845
|
|
38,847
|
|
38,709
|
|
39,141
|
|
|||||||
|
Net income (loss) per common share
|
|
|||||||||||||||
|
Basic
|
|
$
|
0.06
|
$
|
0.20
|
$
|
0.00
|
$
|
0.05
|
|||||||
|
Diluted
|
|
$
|
0.06
|
$
|
0.20
|
$
|
0.00
|
$
|
0.05
|
|||||||
Net income (loss) per common share amounts for the fiscal quarters have been calculated independently and may not in the aggregate equal the amount for the full year.
|
Changes in and Disagreements with Accountants on Accounting and Financial Disclosure.
|
None.
|
Controls and Procedures.
|
Evaluation of Disclosure Controls and Procedures
Our management, including our Chief Executive Officer and our Chief Financial Officer, conducted an evaluation of the effectiveness of the design and operation of our disclosure controls and procedures, as defined in Rules 13a-15(e) and 15d-15(e) under the Exchange Act of 1934, as amended, as of the end of the period covered by this Annual Report on Form 10-K. Based on this evaluation, our Chief Executive Officer and our Chief Financial Officer have concluded that our disclosure controls and procedures (a) were effective to ensure that information that we are required to disclose in reports that we file or submits under the Exchange Act is recorded, processed, summarized and reported within the time periods specified in SEC rules and forms and (b) include, without limitation, controls and procedures designed to ensure that information required to be disclosed by us in reports filed or submitted under the Exchange Act is accumulated and communicated to our management, including our Chief Executive Officer and Chief Financial Officer, as appropriate, to allow timely decisions regarding required disclosure.
Management’s Report on Internal Control Over Financial Reporting
This report does not include a report of management’s assessment regarding internal control over financial reporting or an attestation report of our independent registered public accounting firm due to a transition period established by the rules of the SEC for newly public companies.
Changes in Internal Control Over Financial Reporting
Our management, including our Chief Executive Officer and our Chief Financial Officer, evaluated the changes in our internal control over financial reporting during the year ended December 31, 2014. We determined that there were no significant changes in our internal control over financial reporting during the year ended December 31, 2014, that have materially affected, or are reasonably likely to materially affect, our internal control over financial reporting.
|
Other Information.
|
None.
|
Directors, Executive Officers and Corporate Governance.
|
Information required by this item will be included in our Proxy Statement for our 2015 Annual Meeting of Stockholders to be filed within 120 days after our fiscal year end of December 31, 2015, or 2015 Proxy Statement, and is incorporated by reference into this Annual Report.
|
Executive Compensation.
|
Information required by this item will be included in our 2015 Proxy Statement and is incorporated by reference into this Annual Report.
|
Security Ownership of Certain Beneficial Owners and Management and Related Stockholder Matters.
|
Information required by this item will be included in our 2015 Proxy Statement and is incorporated by reference into this Annual Report.
|
It
em
13.
|
Certain Relationships and Related Transactions, and Director Independence.
|
Information required by this item will be included in our 2015 Proxy Statement and is incorporated by reference into this Annual Report.
|
It
em
14.
|
Principal Accountant Fees and Services.
|
Information required by this item will be included in our 2015 Proxy Statement and is incorporated by reference into this Annual Report.
|
Item
15.
|
Exhibits and Financial Statement Schedules.
|
|
(a)
|
(1) Financial Statements filed as part of this report are listed in Part II, Item 8 of this report.
(2) No other financial schedules have been included because they are not applicable, not required or because required
information is included in the consolidated financial statements or notes thereto.
|
|
(b)
|
The following exhibits are filed as part of, or incorporated by reference into, this Annual Report.
|
|
Exhibit
No.
|
Description
|
||||
|
3.1
|
Amended and Restated Certificate of Incorporation (incorporated by reference to Exhibit 3.1 to the Company’s Current Report on Form 8-K filed with the SEC on July 1, 2014)
|
||||
|
3.2
|
Amended and Restated Bylaws (incorporated by reference to Exhibit 3.4 to the Company’s Registration Statement on Form S-1 filed with the SEC on May 20, 2014)
|
||||
|
4.1
|
Specimen common stock certificate (incorporated by reference to Exhibit 4.1 to Amendment No. 1 to the Company’s Registration Statement on Form S-1 filed with the SEC on June 5, 2014)
|
||||
|
10.1+
|
Form of Indemnification Agreement for Directors and Officers (incorporated by reference to Exhibit 10.1 to Amendment No. 1 to the Company’s Registration Statement on Form S-1 filed with the SEC on June 5, 2014)
|
||||
|
10.2+
|
2002 Stock Option/Stock Issuance Plan (incorporated by reference to Exhibit 10.2 to Amendment No. 1 to the Company’s Registration Statement on Form S-1 filed with the SEC on June 5, 2014)
|
||||
|
10.3+
|
Form of Notice of Stock Option Grant under the Amended 2002 Stock Option/Stock Issuance Plan (incorporated by reference to Exhibit 10.3 to Amendment No. 1 to the Company’s Registration Statement on Form S-1 filed with the SEC on June 5, 2014)
|
||||
|
10.4+
|
Amended and Restated 2005 Equity Incentive Award Plan (incorporated by reference to Exhibit 10.4 to Amendment No. 1 to the Company’s Registration Statement on Form S-1 filed with the SEC on June 5, 2014)
|
||||
|
10.5+
|
Form of Stock Option Grant Notice and Stock Option Agreement under the Amended and Restated 2005 Equity Incentive Award Plan (incorporated by reference to Exhibit 10.5 to Amendment No. 1 to the Company’s Registration Statement on Form S-1 filed with the SEC on June 5, 2014)
|
||||
|
10.6+
|
Form of Deferred Stock Unit Notice of Grant and Deferred Stock Unit Agreement under the Amended and Restated 2005 Equity Incentive Award Plan (incorporated by reference to Exhibit 10.6 to Amendment No. 1 to the Company’s Registration Statement on Form S-1 filed with the SEC on June 5, 2014)
|
||||
|
10.7†
|
Distribution Agreement, dated May 2, 2005, between Amphastar Pharmaceuticals, Inc. and Andrx Pharmaceuticals, Inc., as amended (incorporated by reference to Exhibit 10.7 to Amendment No. 1 to the Company’s Registration Statement on Form S-1 filed with the SEC on June 5, 2014)
|
||||
|
10.8
|
Business Loan Agreement, dated December 31, 2010, between International Medication Systems, Limited and East West Bank, as amended (incorporated by reference to Exhibit 10.8 to Amendment No. 1 to the Company’s Registration Statement on Form S-1 filed with the SEC on June 5, 2014)
|
||||
|
10.9
|
Revolving Loan and Security Agreement, dated April 10, 2012, between Amphastar Pharmaceuticals, Inc. and Cathay Bank (incorporated by reference to Exhibit 10.9 to Amendment No. 1 to the Company’s Registration Statement on Form S-1 filed with the SEC on June 5, 2014)
|
||||
|
10.10
|
Business Loan Agreement, dated July 5, 2013, between International Medication Systems, Limited, Amphastar Pharmaceuticals, Inc. and East West Bank (incorporated by reference to Exhibit 10.10 to Amendment No. 1 to the Company’s Registration Statement on Form S-1 filed with the SEC on June 5, 2014)
|
||||
|
10.11
|
Registration Rights Agreement, dated February 4, 2005, between Amphastar Pharmaceuticals, Inc. and Lotus China Fund, L.P. (incorporated by reference to Exhibit 10.11 to Amendment No. 1 to the Company’s Registration Statement on Form S-1 filed with the SEC on June 5, 2014)
|
||||
|
10.12
|
Standard offer, Agreement and Escrow Instructions for Purchase of Real Estate, dated October 2, 2012, among Amphastar Pharmaceuticals, Inc., Jack Y. Zhang and Mary Z. Luo (incorporated by reference to Exhibit 10.12 to Amendment No. 1 to the Company’s Registration Statement on Form S-1 filed with the SEC on June 5, 2014)
|
||||
|
10.13◊
|
Transfer Contract for the Right to the Use of State-owned Land, dated December 29, 2009, between Amphastar Nanjing Pharmaceuticals Co., Ltd. and Nanjing Xingang Hi-Tech Company Limited (incorporated by reference to Exhibit 10.13 to Amendment No. 1 to the Company’s Registration Statement on Form S-1 filed with the SEC on June 5, 2014)
|
||||
|
10.14◊
|
Investment Agreement, dated July 5, 2010, between Amphastar Nanjing Pharmaceuticals Co., Ltd. and the Management Committee of the Nanjing Economic and Technological Development Zone (incorporated by reference to Exhibit 10.14 to Amendment No. 1 to the Company’s Registration Statement on Form S-1 filed with the SEC on June 5, 2014)
|
||||
|
10.15◊
|
Transfer Contract for the Right to the Use of State-owned Land, dated December 31, 2010, between Amphastar Nanjing Pharmaceuticals Co., Ltd. and Nanjing Xingang Hi-Tech Company Limited. (incorporated by reference to Exhibit 10.15 to Amendment No. 1 to the Company’s Registration Statement on Form S-1 filed with the SEC on June 5, 2014)
|
||||
|
10.16†
|
Long-Term Supply Agreement, dated November 30, 2008 between Qingdao Jiulong Biopharmaceutical Co., Ltd. and International Medication Systems, Limited (incorporated by reference to Exhibit 10.16 to Amendment No. 1 to the Company’s Registration Statement on Form S-1 filed with the SEC on June 5, 2014)
|
||||
|
10.17+
|
2014 Employee Stock Purchase Plan (incorporated by reference to Exhibit 10.17 to Amendment No. 1 to the Company’s Registration Statement on Form S-1 filed with the SEC on June 5, 2014)
|
||||
|
10.18
|
Asset Purchase Agreement, dated April 30, 2014, among Diosynth France, Amphastar France Pharmaceuticals SAS and Schering-Plough (incorporated by reference to Exhibit 10.18 to the Company’s Registration Statement on Form S-1 filed with the SEC on May 20, 2014)
|
||||
|
10.19
|
Loan Agreement, dated April 22, 2014, between Amphastar Pharmaceuticals, Inc. and Cathay Bank (incorporated by reference to Exhibit 10.19 to the Company’s Registration Statement on Form S-1 filed with the SEC on May 20, 2014)
|
||||
|
10.20
|
Promissory Note, dated April 22, 2014, by Amphastar Pharmaceuticals, Inc. payable to Cathay Bank in the original principal sum of $21,900,000 (incorporated by reference to Exhibit 10.20 to the Company’s Registration Statement on Form S-1 filed with the SEC on May 20, 2014)
|
||||
|
10.21+
|
Employment Agreement, dated May 19, 2014, between Amphastar Pharmaceuticals, Inc. and Jack Zhang (incorporated by reference to Exhibit 10.21 to the Company’s Registration Statement on Form S-1 filed with the SEC on May 20, 2014)
|
||||
|
10.22+
|
Employment Agreement, dated May 19, 2014, between Amphastar Pharmaceuticals, Inc. and Mary Luo (incorporated by reference to Exhibit 10.22 to the Company’s Registration Statement on Form S-1 filed with the SEC on May 20, 2014)
|
||||
|
10.23+
|
Employment Agreement, dated May 19, 2014, between Amphastar Pharmaceuticals, Inc. and Jason Shandell (incorporated by reference to Exhibit 10.23 to the Company’s Registration Statement on Form S-1 filed with the SEC on May 20, 2014)
|
||||
|
10.24+
|
Employment Agreement, dated May 19, 2014, between Amphastar Pharmaceuticals, Inc. and Marilyn Purchase (incorporated by reference to Exhibit 10.24 to the Company’s Registration Statement on Form S-1 filed with the SEC on May 20, 2014)
|
||||
|
10.25+
|
Employment Agreement, dated March 11, 2014, between Amphastar Pharmaceuticals, Inc. and William Peters (incorporated by reference to Exhibit 10.25 to the Company’s Registration Statement on Form S-1 filed with the SEC on May 20, 2014)
|
||||
|
10.26†
|
Supply Agreement, dated July 31, 2014, between Mannkind Corporation and Amphastar France Pharmaceuticals, S.A.S. (incorporated by reference to Exhibit 10.1 to the Company’s Registration Statement on Form 10-Q filed with the SEC on November 13, 2014)
|
||||
|
10.27
|
First Amendment to Supply Agreement, dated October 31, 2014, by and between MannKind Corporation, Amphastar France Pharmaceuticals, S.A.S., and Amphastar Pharmaceuticals, Inc. (incorporated by reference to Exhibit 10.1 to the Company’s Registration Statement on Form 10-Q filed with the SEC on November 13, 2014)
|
||||
|
21.1
|
Subsidiaries of the Company
|
||||
|
31.1
|
Certification of Chief Executive Officer Pursuant to Rules 13a-14(a) Under the Securities Exchange Act of 1934
|
||||
|
31.2
|
Certification of Chief Financial Officer Pursuant to Rules 13a-14(a) Under the Securities Exchange Act of 1934
|
||||
|
32.1#
|
Certification of Chief Executive Officer Pursuant to Rules 13a-14(b) and 15d-14(b) of the Securities Exchange Act of 1934 and 18 U.S.C. Section 1350, as Adopted Pursuant to Section 906 of the Sarbanes-Oxley Act of 2002
|
||||
|
32.2#
|
Certification of Chief Financial Officer Pursuant to Rules 13a-14(b) and 15d-14(b) of the Securities Exchange Act of 1934 and 18 U.S.C. Section 1350, as Adopted Pursuant to Section 906 of the Sarbanes-Oxley Act of 2002
|
||||
|
101.INS
|
XBRL Instance Document.
|
||||
|
101.SCH
|
XBRL Taxonomy Extension Schema Document.
|
||||
|
101.CAL
|
XBRL Taxonomy Extension Calculation Linkbase Document.
|
||||
|
101.LAB
|
XBRL Taxonomy Extension Label Linkbase Document.
|
||||
|
101.PRE
|
XBRL Taxonomy Extension Presentation Linkbase Document.
|
||||
|
101.DEF
|
XBRL Taxonomy Extension Definitions Linkbase Document.
|
||||
|
#
|
The information in Exhibits 32.1 and 32.2 shall not be deemed “filed” for purposes of Section 18 of the Securities Exchange Act of 1934, as amended (the “Exchange Act”), or otherwise subject to the liabilities of that section, nor shall they be deemed incorporated by reference in any filing under the Securities Act of 1933, as amended, or the Exchange Act (including this Report), unless the Registrant specifically incorporates the foregoing information into those documents by reference.
|
|
+
|
Indicates a management contract or compensatory plan or arrangement.
|
|
◊
|
English translation of original Chinese document.
|
|
†
|
Confidential treatment requested as to portions of the exhibit. Confidential materials omitted and file separately with the SEC.
|
SIGNA
TURES
Pursuant to the requirements of the Securities Exchange Act of 1934, the Registrant has duly caused this report to be signed on its behalf by the undersigned, thereunto duly authorized.
|
|
||
|
AMPHASTAR PHARMACEUTICALS, INC.
(Registrant)
|
||
|
By:
|
/s/ JACK Y. ZHANG
|
|
|
Jack Y. Zhang
|
||
|
Chief Executive Officer
(Principal Executive Officer)
|
||
Date: March 26, 2015
|
|
||
|
AMPHASTAR PHARMACEUTICALS, INC.
(Registrant)
|
||
|
By:
|
/s/ WILLIAM J. PETERS
|
|
|
William J. Peters
|
||
|
Chief Financial Officer
(Principal Financial and Accounting Officer)
|
||
Date: March 26, 2015
POWER OF ATTORNEY
Each person whose signature appears below constitutes and appoints Jack Y. Zhang and William J. Peters, and each of them, as his or her true and lawful attorney-in-fact and agent, with full power of substitution and resubstitution, for him or her and in his or her name, place and stead, in any and all capacities, to sign any and all amendments to this Annual Report on Form 10-K, and to file the same, with all exhibits thereto, and other documents in connection therewith, with the Securities and Exchange Commission, granting unto said attorneys-in-fact and agents, and each of them, full power and authority to do and perform each and every act and thing requisite and necessary to be done in connection therewith, as fully to all intents and purposes as he or she might or could do in person, hereby ratifying and confirming all that said attorneys-in-fact and agents, or any of them, or their or his substitutes, may lawfully do or cause to be done by virtue thereof.
Pursuant to the requirements of the Securities Exchange Act of 1934, this report has been signed below by the following persons on behalf of the registrant and in the capacities and on the date indicated:
|
Signature
|
Title | Date | ||
|
/s/ JACK Y. ZHANG
|
Chief Executive Officer and Director
(Principal Executive Officer)
|
March 26, 2015
|
||
|
Jack Yongfeng Zhang
|
||||
|
/s/ MARY Z. LUO
|
Chairman, Chief Operating Officer
and Director
|
March 26, 2015
|
||
|
Mary Z. Luo
|
||||
|
/s/ WILLIAM J. PETERS
|
Chief Financial Officer (Principal Financial and Accounting Officer)
|
March 26, 2015
|
||
|
William J. Peters
|
||||
|
/s/ JASON B. SHANDELL
|
President and Director
|
March 26, 2015
|
||
|
Jason B. Shandell
|
||||
|
/s/ RICHARD KOO
|
Director
|
March 26, 2015
|
||
|
Richard Koo
|
||||
|
/s/ HOWARD LEE
|
Director
|
March 26, 2015
|
||
|
Howard Lee
|
||||
|
/s/ FLOYD PETERSEN
|
Director
|
March 26, 2015
|
||
|
Floyd Petersen
|
||||
|
/s/ RICHARD PRINS
|
Director
|
March 26, 2015
|
||
|
Richard Prins
|
||||
|
/s/ STEPHEN SHOHET
|
Director
|
March 26, 2015
|
||
|
Stephen Shohet
|
||||
|
/s/ MICHAEL A. ZASLOFF
|
Director
|
March 26, 2015
|
||
|
Michael A. Zasloff
|
115
TABLE OF CONTENTS
Item 1. BusinessItem 1A. Risk FactorsItem 1B. Unresolved Staff CommentsItem 2. PropertiesItem 3. Legal ProceedingsItem 4. Mine Safety DisclosuresPart IIItem 5. Market For Registrant S Common Equity, Related Stockholder Matters and Issuer Purchases Of Equity SecuritiesItem 6. Selected Financial DataItem 7. Management S Discussion and Analysis Of Financial Condition and Results Of OperationsItem 7A. Quantitative and Qualitative Disclosures About Market RiskItem 8. Financial Statements and Supplementary DataItem 9. Changes in and Disagreements with Accountants on Accounting and Financial DisclosureItem 9A. Controls and ProceduresItem 9B. Other InformationPart IIIItem 10. Directors, Executive Officers and Corporate GovernanceItem 11. Executive CompensationItem 12. Security Ownership Of Certain Beneficial Owners and Management and Related Stockholder MattersItem 13. Certain Relationships and Related Transactions, and Director IndependenceItem 14. Principal Accountant Fees and ServicesPart IVItem 15. Exhibits and Financial Statement Schedules