AMERESCO, INC.
10-Ks and 10-Qs
|
|
|
|
|
|
|
|
|
|
|
|
|
|
|
|
|
|
|
|
|
|
|
|
|
|
|
|
|
|
|
|
|
|
|
|
|
|
|
|
|
|
|
|
|
|
|
|
|
|
|
|
|
UNITED STATES
SECURITIES AND EXCHANGE COMMISSION
WASHINGTON, D.C. 20549
FORM 10-K
(Mark One)
|
þ
|
|
ANNUAL REPORT PURSUANT TO SECTION 13 OR 15(d) OF THE SECURITIES EXCHANGE ACT OF 1934
|
For the fiscal year ended
December 31, 2016
OR
|
o
|
|
TRANSITION REPORT PURSUANT TO SECTION 13 OR 15(d) OF THE SECURITIES EXCHANGE ACT OF 1934
|
For the transition period from ___________ to ___________.
Commission File Number: 001-34811
Ameresco, Inc.
(Exact name of registrant as specified in its charter)
|
Delaware
|
|
04-3512838
|
|
(State or Other Jurisdiction of
Incorporation or Organization)
|
|
(I.R.S. Employer
Identification No.)
|
|
111 Speen Street, Suite 410
Framingham, Massachusetts
|
|
01701
|
|
(Address of Principal Executive Offices)
|
|
(Zip Code)
|
(508) 661-2200
(Registrant’s Telephone Number, Including Area Code)
Securities registered pursuant to Section 12(b) of the Act:
|
Title of each class
|
Name of each exchange on which registered
|
|
Class A Common Stock,
par value $0.0001 per share
|
New York Stock Exchange
|
Securities registered pursuant to Section 12(g) of the Act:
None
Indicate by check mark if the registrant is a well-known seasoned issuer, as defined in Rule 405 of the Securities Act. Yes
o
No
þ
Indicate by check mark if the registrant is not required to file reports pursuant to Section 13 or Section 15(d) of the Act. Yes
o
No
þ
Indicate by check mark whether the registrant (1) has filed all reports required to be filed by Section 13 or 15(d) of the Securities Exchange Act of 1934 during the preceding 12 months (or for such shorter period that the registrant was required to file such reports) and (2) has been subject to such filing requirements for the past 90 days. Yes
þ
No
o
Indicate by check mark whether the registrant has submitted electronically and posted on its corporate Web site, if any, every Interactive Data File required to be submitted and posted pursuant to Rule 405 of Regulation S-T during the preceding 12 months (or for such shorter period that the registrant was required to submit and post such files). Yes
þ
No
o
Indicate by check mark if disclosure of delinquent filers pursuant to Item 405 of Regulation S-K is not contained herein, and will not be contained, to the best of registrant’s knowledge, in definitive proxy or information statements incorporated by reference in Part III of this Annual Report on Form 10-K or any amendment to this Annual Report on Form 10-K.
þ
Indicate by check mark whether the registrant is a large accelerated filer, an accelerated filer, a non-accelerated filer or a smaller reporting company. See definitions of “large accelerated filer,” “accelerated filer” and “smaller reporting company” in Rule 12b-2 of the Exchange Act.
|
Large Accelerated Filer
o
|
Accelerated Filer
þ
|
Non-accelerated filer
o
|
Smaller reporting company
o
|
|
(Do not check if a smaller reporting company)
|
|||
Indicate by check mark whether the registrant is a shell company (as defined in Rule 12b-2 of the Act). Yes
o
No
þ
The aggregate market value of the voting and non-voting common equity held by non-affiliates computed by reference to the price at which the common equity was last sold on the New York Stock Exchange on June 30,
2016
, the last business day of the registrant’s most recently completed second fiscal quarter, was
$92,090,491
.
Indicate the number of shares outstanding of each of the registrant’s classes of common stock as of the latest practicable date.
|
Class
|
Shares outstanding as of March 1, 2017
|
|
Class A Common Stock, $0.0001 par value per share
|
27,394,471
|
|
Class B Common Stock, $0.0001 par value per share
|
18,000,000
|
DOCUMENTS INCORPORATED BY REFERENCE
Portions of the definitive proxy statement for our
2017
annual meeting of stockholders are incorporated by reference into Part III.
AMERESCO, INC.
TABLE OF CONTENTS
|
|
|
Page
|
|
|
||
|
|
||
|
|
||
NOTE ABOUT FORWARD LOOKING STATEMENTS
This Annual Report on Form 10-K contains “forward-looking statements” within the meaning of Section 21E of the Securities Exchange Act of 1934, as amended (“the Exchange Act”). All statements, other than statements of historical fact, including statements regarding our strategy, future operations, future financial position, future revenues, projected costs, prospects, plans, objectives of management, expected market growth and other characterizations of future events or circumstances are forward-looking statements. These statements are often, but not exclusively, identified by the use of words such as “may,” “will,” “expect,” “believe,” “anticipate,” “intend,” “could,” “estimate,” “target,” “project,” “predict” or “continue,” and similar expressions or variations. These forward-looking statements include, among other things, statements about:
•
our expectations as to the future growth of our business and associated expenses;
•
our expectations as to revenue generation;
•
the future availability of borrowings under our revolving credit facility;
•
the expected future growth of the market for energy efficiency and renewable energy solutions;
•
our backlog, awarded projects and recurring revenue and the timing of such matters;
•
our expectations as to acquisition activity;
•
the impact of any restructuring;
•
the uses of future earnings;
•
our intention to repurchase shares of our Class A common stock;
•
the expected energy and cost savings of our projects; and
•
the expected energy production capacity of our renewable energy plants.
These forward-looking statements are based on current expectations and assumptions that are subject to risks, uncertainties and other factors that could cause actual results and the timing of certain events to differ materially and adversely from the future results expressed or implied by such forward-looking statements. Risks, uncertainties and factors that could cause or contribute to such differences include, but are not limited to, those discussed in the section titled “Risk Factors,” set forth in Item 1A of this Annual Report on Form 10-K and elsewhere in this report. The forward-looking statements in this Annual Report on Form 10-K represent our views as of the date of this Annual Report on Form 10-K. Subsequent events and developments may cause our views to change. However, while we may elect to update these forward-looking statements at some point in the future, we have no current intention of doing so and undertake no obligation to do so except to the extent required by applicable law. You should, therefore, not rely on these forward-looking statements as representing our views as of any date subsequent to the date of this Annual Report on Form 10-K.
Company Overview
Founded in 2000, Ameresco, Inc. is a leading independent provider of comprehensive energy services, including energy efficiency, infrastructure upgrades, energy security and resilience, asset sustainability and renewable energy solutions for businesses and organizations throughout North America and Europe. Ameresco’s sustainability services include capital and operational upgrades to a facility’s energy infrastructure and the development, construction, ownership and operation of renewable energy plants. Ameresco has successfully completed energy saving, environmentally responsible projects with federal, state and local governments, healthcare and educational institutions, housing authorities, and commercial and industrial customers. With its corporate headquarters in Framingham, MA, Ameresco has more than 1,000 employees across more than 70 offices providing local expertise in the United States, Canada, and the United Kingdom.
Strategic acquisitions of complementary businesses and assets have been an important part of our historical development. Since inception, we have completed numerous acquisitions, which have enabled us to broaden our service offerings and expand our geographical reach.
Our principal service is the development, design, engineering and installation of projects that reduce the energy and operations and maintenance (“O&M”) costs of our customers’ facilities. These projects generally include a variety of measures that incorporate innovative technology and techniques, customized for the facility and designed to improve the efficiency of major building systems, such as heating, ventilation, cooling and lighting systems, while enhancing the comfort and usability of the buildings. Such measures may include a combination of the following: water reclamation, light-emitting diode (“LED”) lighting, smart metering, intelligent micro-grids, battery storage, combine heat and power (“CHP”) or the installation of renewable energy, such as solar photovoltaic (“PV”). We also offer the ability to incorporate analytical tools that provide improved building energy management capabilities and enable customers to identify opportunities for energy cost savings. We typically commit to customers that our energy efficiency projects will satisfy agreed upon performance standards upon installation or achieve specified increases in energy efficiency. In most cases, the forecasted lifetime energy and operating cost savings of the energy efficiency measures we install will defray all or almost all of the cost of such measures. In many cases, we assist customers in obtaining third-party financing, grants or rebates for the cost of constructing the facility improvements, resulting in little or no upfront capital expenditure by the customer. After a project is complete, we may operate, maintain and repair the customer’s energy systems under a multi-year O&M contract, which provides us with recurring revenue and visibility into the customer’s evolving needs.
We also serve certain customers by developing and building small-scale renewable energy plants located at or close to a customer’s site. Depending upon the customer’s preference, we will either retain ownership of the completed plant or build it for the customer. Most of our small-scale renewable energy plants to date consist of solar PV installations and plants constructed adjacent to landfills, that use landfill gas (“LFG”) to generate energy. We have also designed and built, as well as own, operate and maintain, plants that utilize biogas from wastewater treatment processes. Our largest renewable energy project for a customer uses biomass as the primary source of energy. In the case of most of the plants that we own, the electricity, thermal energy or processed renewable gas fuel generated by the plant is sold under a long-term supply contract with the customer, which is typically a utility, municipality, industrial facility or other purchaser of large amounts of energy. For information on how we finance the projects that we own and operate, please see the disclosures under Note 2, “Summary of Significant Accounting Policies”, Note 7, “Long-Term Debt” and Note 9, “Investment Fund” to our Consolidated Financial Statements appearing in Item 8 of this Annual Report on Form 10-K.
As of
December 31, 2016
, we had backlog of approximately
$534.1 million
in expected future revenues under signed customer contracts for the installation or construction of projects; and we also had been awarded projects for which we had not yet signed customer contracts with estimated total future revenues of an additional
$957.6 million
. As of
December 31, 2015
, we had backlog of approximately
$390.4 million
in expected future revenues under signed customer contracts for the installation or construction of projects, which we sometimes refer to as fully-contracted backlog; and we also had been awarded projects for which we had not yet signed customer contracts, which we sometimes refer to as awarded projects, with estimated total future revenues of an additional
$955.8 million
. As of
December 31, 2014
, we had backlog of approximately
$386.2 million
in expected future revenues under signed customer contracts for the installation or construction of projects; and we also had been awarded projects for which we had not yet signed customer contracts with estimated total future revenues of an additional
$853.8 million
. The contracts reflected in our fully-contracted backlog typically have a construction period of 12 to 24 months and we typically expect to recognize revenue for such contracts over the same period. Where we have been awarded a project, but have not yet signed a customer contract for that project, we would not begin recognizing revenue unless and until
1
a customer contract has been signed and we treat the project as fully-contracted backlog. Recently, awarded projects typically have been taking 12 to 18 months from award to having a signed contract and thus convert to fully-contracted backlog. It may take longer, however, depending upon the size and complexity of the project. Generally, the larger and more complex the project, the longer it takes to take it from award to signed contract. Historically, approximately 90% of our awarded projects ultimately have resulted in a signed contract.
See “We may not recognize all revenues from our backlog or receive all payments anticipated under awarded projects and customer contracts” and “In order to secure contracts for new projects, we typically face a long and variable selling cycle that requires significant resource commitments and requires a long lead time before we realize revenues” in Item 1A, Risk Factors of this Annual Report on Form 10-K.
Revenues generated from backlog, which we refer to as project revenues, were
$454.2 million
, $
434.4 million
and
$386.8 million
for the
twelve months ended December 31, 2016
,
2015
and
2014
, respectively.
We also expect to realize recurring revenues both from long-term O&M contracts and from energy output sales for renewable energy operating assets that we own. In addition, we expect to generate revenues from the sale of photovoltaic solar energy products and systems (“integrated-PV”) and other services, such as consulting services and enterprise energy management services. Information about revenues from these other service and product offerings may be found in Note 18 of “Notes to Consolidated Financial Statements” included in Item 8 of this Annual Report on Form 10-K, which information is incorporated herein by reference.
Ameresco’s Services and Products
Our principal service is energy efficiency projects, which entails the design, engineering and installation of, and assisting with the arranging of financing for an ever-increasing array of innovative technologies and techniques to improve the energy efficiency, and control the operation, of a building’s energy- and water- consuming systems. In certain projects, we also design and construct for a customer a central plant or cogeneration system providing power, heat and/or cooling to a building, or a small-scale plant that produces electricity, gas, heat or cooling from renewable sources of energy. Our projects generally range in size and scope from a one-month project to design and retrofit a lighting system to a more complex 30-month project to design and install a central plant or cogeneration system or other small-scale plant. Projects we have constructed or are currently working on include designing, engineering and installing energy conservation measures across school buildings; large, complex energy conservation and energy security projects for the federal government; and municipal-scale street lighting projects incorporating smart-city controls.
After an energy efficiency or renewable energy project is completed, we often provide ongoing O&M services under a multi-year contract. These services include operating, maintaining and repairing facility energy systems such as boilers, chillers and building controls, as well as central power and other small-scale plants. For larger projects, we frequently maintain staff on-site to perform these services.
Our service offering also includes the sale of electricity, processed renewable gas fuel, heat or cooling from the portfolio of assets that we own and operate.
We have constructed and are currently designing and constructing a wide range of renewable energy plants using LFG, wastewater treatment biogas, solar, biomass, other bio-derived fuels, wind and hydro sources of energy. Most of our renewable energy projects to date have involved the generation of electricity from solar PV and LFG or the sale of processed LFG. We purchase the LFG that otherwise would be combusted or vented, process it, and either sell it or use it in our energy plants. We have also designed and built, as well as own, operate and maintain, plants that take biogas generated in the anaerobic digesters of wastewater treatment plants and turn it into renewable natural gas that is either used to generate energy on-site or that can be sold through the nation’s natural gas pipeline grid. Where we own and operate energy producing assets, we typically enter into a long-term power purchase agreement (“PPA”) for the sale of the energy.
As of
December 31, 2016
, we owned and operated 55 small-scale renewable energy plants and solar PV installations. Of the owned plants, 24 are renewable LFG plants, two are wastewater biogas plants, and 29 are solar PV installations. The 55 small-scale renewable energy plants and solar PV installations that we own have the capacity to generate electricity or deliver renewable gas fuel producing an aggregate of more than 164 megawatt equivalents.
Our service and product offerings also include integrated-PV and consulting and enterprise energy management services.
2
Customer Arrangements
For our energy efficiency projects, we typically enter into energy savings performance contracts (“ESPCs”), under which we agree to develop, design, engineer and construct a project and also commit that the project will satisfy agreed upon performance standards that vary from project to project. These performance commitments are typically based on the design, capacity, efficiency or operation of the specific equipment and systems we install. Depending on the project, the measurement and demonstration may be required only once, upon installation, based on an analysis of one or more sample installations, or may be required to be repeated at agreed upon intervals generally over periods of up to 20 years. We often assist these customers in identifying and obtaining financing, through rebate programs, grant programs, third-party lenders and other sources.
Under our contracts, we typically do not take responsibility for a wide variety of factors outside of our control and exclude or adjust for such factors in commitment calculations. These factors include variations in energy prices and utility rates, weather, facility occupancy schedules, the amount of energy-using equipment in a facility and the failure of the customer to operate or maintain the project properly. Typically, our performance commitments apply to the aggregate overall performance of a project rather than to individual energy efficiency measures. Therefore, to the extent an individual measure underperforms, it may be offset by other measures that overperform during the same period. In the event that an energy efficiency project does not perform according to the agreed upon specifications, our agreements typically allow us to satisfy our obligation by adjusting or modifying the installed equipment, installing additional measures to provide substitute energy savings or paying the customer for lost energy savings based on the assumed conditions specified in the agreement. Many of our equipment supply, local design and installation subcontracts contain provisions that enable us to seek recourse against our vendors or subcontractors if there is a deficiency in our energy reduction commitment. See “We may have liability to our customers under our ESPCs if our projects fail to deliver the energy use reductions to which we are committed under the contract” in Item 1A, Risk Factors.
The projects that we perform for governmental agencies are governed by particular qualification and contracting regimes. Certain states require qualification with an appropriate state agency as a precondition to performing work or appearing as a qualified energy service provider for state, county and local agencies within the state. Most of the work that we perform for the federal government is performed under indefinite delivery, indefinite quantity (“IDIQ”) agreements between government agencies and us or our subsidiaries. These IDIQ agreements allow us to contract with the relevant agencies to implement energy projects, but no work may be performed unless we and the agency agree on a task order or delivery order governing the provision of a specific project. The government agencies enter into contracts for specific projects on a competitive basis. We and our subsidiaries and affiliates are currently party to an IDIQ agreement with the U.S. Department of Energy, expiring in 2019, with an aggregate maximum potential ordering amount of $5 billion. We are also party to similar agreements with other federal agencies, including the U.S. Army Corps of Engineers and the U.S. General Services Administration. Payments by the federal government for energy efficiency measures are based on the services provided and products installed, but are limited to the savings derived from such measures, calculated in accordance with federal regulatory guidelines and the specific contract terms. The savings are typically determined by comparing energy use and O&M costs before and after the installation of the energy efficiency measures, adjusted for changes that affect energy use and O&M costs but are not caused by the energy efficiency measures.
Sales and Marketing
Our sales and marketing approach is to offer customers customized and comprehensive energy efficiency solutions tailored to meet their economic, operational and technical needs. The sales, design and construction process for energy efficiency and renewable energy projects recently has been averaging from 18 to 42 months. We identify project opportunities through referrals, requests for proposals (“RFPs”), conferences and events, website, online campaigns, telemarketing and repeat business from existing customers. Our direct sales force develops and follows up on customer leads. As of
December 31, 2016
, we had
118
employees in direct sales.
In preparation for a proposal, our team typically conducts a preliminary audit of the customer’s needs and requirements, and identifies areas to enhance efficiencies and reduce costs. We collect and analyze the customer’s utility bill and other data related to energy use. If the bills are complex or numerous, we often utilize Ameresco’s enterprise energy management software tools to scan, compile and analyze the information. Our experienced engineers visit and assess the customer’s current energy systems and infrastructure. Through our knowledge of the federal, state, local governmental and utility environment, we assess
3
the availability of energy, utility or environmental-based payments for usage reductions or renewable power generation, which helps us optimize the economic benefits of a proposed project for a customer. Once awarded a project, we perform a more detailed audit of the customer’s facilities, which serves as the basis for the final specifications of the project and final contract terms.
For renewable energy plants that are not located on a customer’s site or use sources of energy not within the customer’s control, the sales process also involves the identification of sites with attractive sources of renewable energy and obtaining necessary rights and governmental permits to develop a plant on that site. For example, for LFG projects, we start with gaining control of a LFG resource located close to the prospective customer. For solar and wind projects, we look for sites where utilities are interested in purchasing renewable energy power at rates that are sufficient to make a project feasible. Where governmental agencies control the site and resource, such as a landfill owned by a municipality, the customer may be required to issue an RFP to use the site or resource. Once we believe we are likely to obtain the rights to the site and the resource, we seek customers for the energy output of the potential project, with whom we can enter into a long-term PPA.
Customers
In
2016
, we served customers throughout the United States, Canada and the United Kingdom (“U.K”). Historically, including for the years ended
December 31, 2016
,
2015
and
2014
approximately 75% of our revenues have been derived from federal, state, provincial or local government entities, including public housing authorities and public universities. Our federal customers include various divisions of the U.S. federal government. The U.S. federal government, which is considered a single customer for reporting purposes, constituted
27.3%
,
20.2%
and
17.9%
of our consolidated revenues for the years ended
December 31,
2016
,
2015
and
2014
, respectively. For the year ended December 31,
2016
, our largest 20 customers accounted for approximately
43.6%
of our total revenues. Other than the U.S. federal government, no one customer represented more than 10% of our revenues during this period.
See “Provisions in our government contracts may harm our business, financial condition and operating results” in Item 1A, Risk Factors for a discussion of special considerations applicable to government contracting.
Competition
While we face significant competition from a large number of companies, we believe few offer the full range of services that we provide.
Our principal competitors for our core business include Constellation Energy (an Exelon company), Energy Systems Group, Honeywell, Johnson Controls, McKinstry, NORESCO, Opterra and Siemens Building Technologies. We compete primarily on the basis of our comprehensive, independent offering of energy efficiency and renewable energy services and the breadth and depth of our expertise.
For renewable energy plants, we compete primarily with many large independent power producers and utilities, as well as a large number of developers of renewable energy projects. In the LFG market, our principal competitors include national project developers and owners of landfills who self-develop projects using LFG from their landfills, such as Waste Management. In the solar PV market, our principal competitors are Apex Clean Energy, Borrego Solar, Dominion, Duke Energy, G&S Solar, SCE&G (a Scana company), SolarCity, Southern Company and SunPower. We compete for renewable energy projects primarily on the basis of our experience, reputation and ability to identify and complete high quality and cost-effective projects.
For O&M services, our principal competitors are Emcorp Group, Fluor, Honeywell, Johnson Controls and Veolia. In this area, we compete primarily on the basis of our expertise and quality of service.
See “We operate in a highly competitive industry, and our current or future competitors may be able to compete more effectively than we do, which could have a material adverse effect on our business, revenues, growth rates and market share” in Item 1A, Risk Factors for further discussion of competition.
Regulatory
Various regulations affect the conduct of our business. federal and state legislation and regulations enable us to enter into ESPCs with Government agencies in the United States. The applicable regulatory requirements for ESPCs differ in each state and between agencies of the federal government.
4
Our projects must conform to all applicable electric reliability, building and safety, and environmental regulations and codes, which vary from place to place and time to time. Various federal, state, provincial and local permits are required to construct an energy efficiency project or renewable energy plant.
Renewable energy projects are also subject to specific Governmental safety and economic regulation. States and the federal government typically do not regulate the transportation or sale of LFG unless it is combined with and distributed with natural gas, but this is not uniform among states and may change from time to time. States regulate the retail sale and distribution of natural gas to end-users, although regulatory exemptions from regulation are available in some states for limited gas delivery activities, such as sales only to a single customer. The sale and distribution of electricity at the retail level is subject to state and provincial regulation, and the sale and transmission of electricity at the wholesale level is subject to federal regulation. While we do not own or operate retail-level electric distribution systems or wholesale-level transmission systems, the prices for the products we offer can be affected by the tariffs, rules and regulations applicable to such systems, as well as the prices that the owners of such systems are able to charge. The construction of power generation projects typically is regulated at the state and provincial levels, and the operation of these projects also may be subject to state and provincial regulation as “utilities.” At the federal level, the ownership and operation of, and sale of power from, generation facilities may be subject to regulation under the Public Utility Holding Company Act of 2005 (“PUHCA”), the Federal Power Act (“FPA”), and Public Utility Regulatory Policies Act of 1978 (“PURPA”). However, because all of the plants that we have constructed and operated to date are small power “qualifying facilities” under PURPA, they are subject to less regulation under the FPA, PUHCA and related state utility laws than traditional utilities.
If we pursue projects employing different technologies or with a single project electrical capacity greater than 20 megawatts, we could become subject to some of the regulatory schemes which do not apply to our current projects. In addition, the state, provincial and federal regulations that govern qualifying facilities and other power sellers frequently change, and the effect of these changes on our business cannot be predicted.
LFG power generation facilities require an air emissions permit, which may be difficult to obtain in certain jurisdictions. See “Compliance with environmental laws could adversely affect our operating results” in Item 1A, Risk Factors. Renewable energy projects may also be eligible for certain Governmental or Government-related incentives from time to time, including tax credits, cash payments in lieu of tax credits, and the ability to sell associated environmental attributes, including carbon credits. Government incentives and mandates typically vary by jurisdiction.
Some of the demand reduction services we provide for utilities and institutional clients are subject to regulatory tariffs imposed under federal and state utility laws. In addition, the operation of, and electrical interconnection for, our renewable energy projects are subject to federal, state or provincial interconnection and federal reliability standards also set forth in utility tariffs. These tariffs specify rules, business practices and economic terms to which we are subject. The tariffs are drafted by the utilities and approved by the utilities’ state, provincial or federal regulatory commissions.
Employees
As of December 31,
2016
, we had a total of 1,038 employees in offices located in 35 states, the District of Columbia, four Canadian provinces and the U.K.
Seasonality
See “Our business is affected by seasonal trends and construction cycles, and these trends and cycles could have an adverse effect on our operating results” in Item 1A, Risk Factors and “Overview — Effects of Seasonality” in Item 7, Management’s Discussion and Analysis of Financial Condition and Results of Operations” for a discussion of seasonality in our business.
Segments and Geographic Information
Financial information about our domestic and international operations and about our segments may be found in Notes 14 and 18, respectively, of “Notes to Consolidated Financial Statements” included in Item 8 of this Annual Report on Form 10-K, which information is incorporated herein by reference.
Additional Information
Ameresco was incorporated in Delaware in 2000 and is headquartered in Framingham, Massachusetts.
Periodic reports, proxy statements and other information are available to the public, free of charge, on our website, www.ameresco.com, as soon as reasonably practicable after they have been filed with the Securities and Exchange Commission
5
(“SEC”), and through the SEC’s website, www.sec.gov. We include our website address in this report only as an inactive textual reference and do not intend it to be an active link to our website. None of the material on our website is part of this Annual Report on Form 10-K.
Executive Officers
The following is a list of our executive officers, their ages as of March 1,
2017
and their principal positions.
|
Name
|
Age
|
Position (s)
|
|||
|
George P. Sakellaris
|
70
|
|
Chairman of the Board of Directors, President and Chief Executive Officer
|
||
|
David J. Anderson
|
56
|
|
Executive Vice President and Director
|
||
|
Michael T. Bakas
|
48
|
|
Senior Vice President, Renewable Energy
|
||
|
Nicole A. Bulgarino
|
44
|
|
Senior Vice President and General Manager, Federal Solutions
|
||
|
David J. Corrsin
|
58
|
|
Executive Vice President, General Counsel and Secretary and Director
|
||
|
Joseph P. DeManche
|
60
|
|
Executive Vice President, Engineering and Operations
|
||
|
Louis P. Maltezos
|
50
|
|
Executive Vice President
|
||
|
John R. Granara, III
|
48
|
|
Executive Vice President, Chief Financial Officer and Treasurer
|
||
George P. Sakellaris:
Mr. Sakellaris has served as chairman of our board of directors and our president and chief executive officer since founding Ameresco in 2000.
David J. Anderson:
Mr. Anderson has served as our executive vice president as well as a director, since 2000 and oversees business development, government relations, strategic marketing and communications, as well as several U.S. business units and U.K. operations.
Michael T. Bakas:
Mr. Bakas has served as our senior vice president, renewable energy, since March 2010. From 2000 to February 2010, he was our vice president, renewable energy.
David J. Corrsin:
Mr. Corrsin has served as our executive vice president, general counsel and secretary, as well as a director, since 2000.
Nicole A. Bulgarino
: Ms. Bulgarino has served as our senior vice president and general manager of federal solutions since May 2015. Ms. Bulgarino served as vice president and general manager of federal solutions from February 2014 to May 2015; vice president, federal group operations from December 2012 to February 2014; director, implementation from May 2010 to December 2012; and senior engineer from June 2004 to May 2010.
Joseph P. DeManche:
Mr. DeManche has served as our executive vice president, engineering and operations since 2002.
Louis P. Maltezos:
Mr. Maltezos has served as executive vice president since April 2009 and oversees Central and Northwest Regions and Canada operations. Mr. Maltezos has also served as the chief executive officer of Ameresco Canada since September 2015 and served as the president of Ameresco Canada from September 2014 to September 2015.
John R. Granara, III:
Mr. Granara has served as our executive vice president since February 2017 and as our chief financial officer and treasurer since May 2015. Mr. Granara previously served as our vice president and chief accounting officer from September 2013 to May 2015. Prior to joining Ameresco, Mr. Granara served as Vice President Finance, Chief Accounting Officer and Corporate Controller for GT Advanced Technologies, Inc., a diversified technology company, from May 2011 through August 2013. Mr. Granara also served as interim chief financial officer of A123 Systems, Inc, a lithium-ion battery developer and manufacturer, from January 2011 through May 2011, and as vice president, finance, and corporate controller of A123 Systems, Inc. from November 2007 through December 2011. On October 16, 2012, A123 Systems, Inc. filed for voluntary reorganization under Chapter 11 of the U.S. Bankruptcy Code.
6
Our business is subject to numerous risks. We caution you that the following important factors, among others, could cause our actual results to differ materially from those expressed in forward-looking statements made by us or on our behalf in filings with the SEC, press releases, communications with investors and oral statements. Any or all of our forward-looking statements in this Annual Report on Form 10-K and in any other public statements we make may turn out to be wrong. They can be affected by inaccurate assumptions we might make or by known or unknown risks and uncertainties. Many factors mentioned in the discussion below will be important in determining future results. Consequently, no forward-looking statement can be guaranteed. Actual future results may differ materially from those anticipated in forward-looking statements. We undertake no obligation to update any forward-looking statements, whether as a result of new information, future events or otherwise, except to the extent required by applicable law. You should, however, consult any further disclosure we make in our reports filed with the SEC.
Risks Related to Our Business
If demand for our energy efficiency and renewable energy solutions does not develop as we expect, our revenues will suffer and our business will be harmed.
We believe, and our growth plans assume, that the market for energy efficiency and renewable energy solutions will continue to grow, that we will increase our penetration of this market and that our revenues from selling into this market will continue to increase over time. If our expectations as to the size of this market and our ability to sell our products and services in this market are not correct, our revenues will suffer and our business will be harmed.
In order to secure contracts for new projects, we typically face a long and variable selling cycle that requires significant resource commitments and requires a long lead time before we realize revenues.
The sales, design and construction process for energy efficiency and renewable energy projects recently has been taking from 18 to 42 months on average, with sales to federal government and housing authority customers tending to require the longest sales processes. Our existing and potential customers generally follow extended budgeting and procurement processes, and sometimes must engage in regulatory approval processes related to our services. Our customers often use outside consultants and advisors, which contributes to a longer sales cycle. Most of our potential customers issue an RFP, as part of their consideration of alternatives for their proposed project. In preparation for responding to an RFP, we typically conduct a preliminary audit of the customer’s needs and the opportunity to reduce its energy costs. For projects involving a renewable energy plant that is not located on a customer’s site or that uses sources of energy not within the customer’s control, the sales process also involves the identification of sites with attractive sources of renewable energy, such as a landfill or a favorable site for solar PV, and it may involve obtaining necessary rights and governmental permits to develop a project on that site. If we are awarded a project, we then perform a more detailed audit of the customer’s facilities, which serves as the basis for the final specifications of the project. We then must negotiate and execute a contract with the customer. In addition, we or the customer typically need to obtain financing for the project.
This extended sales process requires the dedication of significant time by our sales and management personnel and our use of significant financial resources, with no certainty of success or recovery of our related expenses. A potential customer may go through the entire sales process and not accept our proposal. All of these factors can contribute to fluctuations in our quarterly financial performance and increase the likelihood that our operating results in a particular quarter will fall below investor expectations. These factors could also adversely affect our business, financial condition and operating results due to increased spending by us that is not offset by increased revenues.
7
We may not recognize all revenues from our backlog or receive all payments anticipated under awarded projects and customer contracts.
As of
December 31, 2016
, we had backlog of approximately
$534.1 million
in expected future revenues under signed customer contracts for the installation or construction of projects, which we sometimes refer to as fully-contracted backlog; and we also had been awarded projects for which we do not yet have signed customer contracts with estimated total future revenues of an additional
$957.6 million
. As of
December 31, 2015
, we had fully-contracted backlog of approximately
$390.4 million
; and we also had awarded projects for which we had not yet have signed customer contracts with estimated total future revenues of an additional
$955.8 million
. As of
December 31, 2014
, we had fully-contracted backlog of approximately
$386.2 million
; and we also had been awarded projects for which we had not yet signed customer contracts with estimated total future revenues of an additional
$853.8 million
.
Our customers have the right under some circumstances to terminate contracts or defer the timing of our services and their payments to us. In addition, our government contracts are subject to the risks described below under “Provisions in government contracts may harm our business, financial condition and operating results.” The payment estimates for projects that have been awarded to us but for which we have not yet signed contracts have been prepared by management and are based upon a number of assumptions, including that the size and scope of the awarded projects will not change prior to the signing of customer contracts, that we or our customers will be able to obtain any necessary third-party financing for the awarded projects, and that we and our customers will reach agreement on and execute contracts for the awarded projects. We are not always able to enter into a contract for an awarded project on the terms proposed. As a result, we may not receive all of the revenues that we include in the awarded projects component of our backlog or that we estimate we will receive under awarded projects. If we do not receive all of the revenue we currently expect to receive, our future operating results will be adversely affected. In addition, a delay in the receipt of revenues, even if such revenues are eventually received, may cause our operating results for a particular quarter to fall below our expectations.
Our business depends in part on federal, state, provincial and local government support for energy efficiency and renewable energy, and a decline in such support could harm our business.
We depend in part on legislation and government policies that support energy efficiency and renewable energy projects that enhance the economic feasibility of our energy efficiency services and small-scale renewable energy projects. This support includes legislation and regulations that authorize and regulate the manner in which certain governmental entities do business with us; encourage or subsidize governmental procurement of our services; encourage or in some cases require other customers to procure power from renewable or low-emission sources, to reduce their electricity use or otherwise to procure our services; and provide us with tax and other incentives that reduce our costs or increase our revenues. Without this support, on which projects frequently rely for economic feasibility, our ability to complete projects for existing customers and obtain project commitments from new customers could be adversely affected.
A significant decline in the fiscal health of federal, state, provincial and local governments could reduce demand for our energy efficiency and renewable energy projects.
Historically, including for the years ended
December 31, 2016
,
2015
and
2014
, more than 75% of our revenues have been derived from sales to federal, state, provincial or local governmental entities, including public housing authorities and public universities. We expect revenues from this market sector to continue to comprise a significant percentage of our revenues for the forseeable future. A significant decline in the fiscal health of these existing and potential customers may make it difficult for them to enter into contracts for our services or to obtain financing necessary to fund such contracts, or may cause them to seek to renegotiate or terminate existing agreements with us. In addition, if there is a partial shutdown of any federal, state, provincial or local governing body this may adversely impact our financial performance.
Provisions in our government contracts may harm our business, financial condition and operating results.
A significant majority of our fully-contracted backlog and awarded projects is attributable to customers that are government entities. Our contracts with the federal government and its agencies, and with state, provincial and local governments, customarily contain provisions that give the government substantial rights and remedies, many of which are not typically found in commercial contracts, including provisions that allow the government to:
|
•
|
terminate existing contracts, in whole or in part, for any reason or no reason;
|
|
•
|
reduce or modify contracts or subcontracts;
|
8
|
•
|
decline to award future contracts if actual or apparent organizational conflicts of interest are discovered, or to impose organizational conflict mitigation measures as a condition of eligibility for an award;
|
|
•
|
suspend or debar the contractor from doing business with the government or a specific government agency; and
|
|
•
|
pursue criminal or civil remedies under the False Claims Act, False Statements Act and similar remedy provisions unique to government contracting.
|
Under general principles of government contracting law, if the government terminates a contract for convenience, the terminated company may recover only its incurred or committed costs, settlement expenses and profit on work completed prior to the termination. If the government terminates a contract for default, the defaulting company is entitled to recover costs incurred and associated profits on accepted items only and may be liable for excess costs incurred by the government in procuring undelivered items from another source. In most of our contracts with the federal government, the government has agreed to make a payment to us in the event that it terminates the agreement early. The termination payment is designed to compensate us for the cost of construction plus financing costs and profit on the work completed.
In ESPCs for governmental entities, the methodologies for computing energy savings may be less favorable than for non-governmental customers and may be modified during the contract period. We may be liable for price reductions if the projected savings cannot be substantiated.
In addition to the right of the federal government to terminate its contracts with us, federal government contracts are conditioned upon the continuing approval by Congress of the necessary spending to honor such contracts. Congress often appropriates funds for a program on a September 30 fiscal-year basis even though contract performance may take more than one year. Consequently, at the beginning of many major Governmental programs, contracts often may not be fully funded, and additional monies are then committed to the contract only if, as and when appropriations are made by Congress for future fiscal years. Similar practices are likely to also affect the availability of funding for our contracts with Canadian, as well as state, provincial and local government entities. If one or more of our government contracts were terminated or reduced, or if appropriations for the funding of one or more of our contracts is delayed or terminated, our business, financial condition and operating results could be adversely affected.
Our senior credit facility, project financing term loans and construction contain financial and operating restrictions that may limit our business activities and our access to credit.
Provisions in our senior credit facility, project financing term loans and construction loans impose customary restrictions on our and certain of our subsidiaries’ business activities and uses of cash and other collateral. These agreements also contain other customary covenants, including covenants that require us to meet specified financial ratios and financial tests.
We have a $60 million, subject to the quarter end ratio covenant described below, revolving senior secured credit facility that matures in June 2020. This facility may not be sufficient to meet our needs as our business grows, and we may be unable to extend or replace it on acceptable terms, or at all. Under the revolving credit facility we are required to maintain a maximum ratio of total funded debt to EBITDA (as defined in the agreement) of less than 2.00 to 1.0 as of the end of each fiscal quarter ending on or before June 30, 2016; less than 2.75 to 1.0 as of the end of each fiscal quarter ending September 30, 2016, December 31, 2016, March 31, 2017 and June 30, 2017; and less than 2.00 to 1.0 as of the end of each fiscal quarter ending September 30, 2017 and thereafter. We are also required to maintain a debt service coverage ratio (as defined in the agreement) of at least 1.5 to 1.0. EBITDA for purposes of the facility excludes the results of renewable energy projects that we own and for which financing from others remains outstanding.
In addition, our project financing term loans and construction loans require us to comply with a variety of financial and operational covenants.
Although we do not consider it likely that we will fail to comply with any of these covenants for the next twelve months, we cannot assure that we will be able to do so. Our failure to comply with these covenants may result in the declaration of an event of default and cause us to be unable to borrow under our credit facility. In addition to preventing additional borrowings under this facility, an event of default, if not cured or waived, may result in the acceleration of the maturity of indebtedness outstanding under it or the applicable project financing term loan, which would require us to pay all amounts outstanding. If an event of default occurs, we may not be able to cure it within any applicable cure period, if at all. Certain of our debt agreements also contain subjective acceleration clauses based on a lender deeming that a “material adverse change” in our business has occurred. If these clauses are implicated, and the lender declares that an event of default has occurred, the outstanding indebtedness would likely be immediately due and owing. If the maturity of our indebtedness is accelerated, we may not have
9
sufficient funds available for repayment or we may not have the ability to borrow or obtain sufficient funds to replace the accelerated indebtedness on terms acceptable to us or at all.
The projects we undertake for our customers generally require significant capital, which our customers or we may finance through third parties, and such financing may not be available to our customers or to us on favorable terms, if at all.
Our projects for customers are typically financed by third parties. For small-scale renewable energy plants that we own, we typically rely on a combination of our working capital and debt to finance construction costs. If we or our customers are unable to raise funds on acceptable terms when needed, we may be unable to secure customer contracts, the size of contracts we do obtain may be smaller or we could be required to delay the development and construction of projects, reduce the scope of those projects or otherwise restrict our operations. Any inability by us or our customers to raise the funds necessary to finance our projects could materially harm our business, financial condition and operating results.
Project development or construction activities may not be successful, and we may make significant investments without first obtaining project financing, which could increase our costs and impair our ability to recover our investments.
The development and construction of small-scale renewable energy plants and other energy infrastructure projects involve numerous risks. We may be required to spend significant sums for preliminary engineering, permitting, legal and other expenses before we can determine whether a project is feasible, economically attractive or capable of being built. In addition, we will often choose to bear the costs of such efforts prior to obtaining project financing, prior to getting final regulatory approval and prior to our final sale to a customer, if any.
Successful completion of a particular project may be adversely affected by numerous factors, including: failures or delays in obtaining desired or necessary land rights, including ownership, leases and/or easements; failures or delays in obtaining necessary permits, licenses or other governmental support or approvals, or in overcoming objections from members of the public or adjoining land owners; uncertainties relating to land costs for projects; unforeseen engineering problems; access to available transmission for electricity generated by our small-scale renewable energy plants; construction delays and contractor performance shortfalls; work stoppages or labor disruptions and compliance with labor regulations; cost over-runs; availability of products and components from suppliers; adverse weather conditions; environmental, archaeological and geological conditions; and availability of construction and permanent financing.
If we are unable to complete the development of a small-scale renewable energy plants or fail to meet one or more agreed target construction milestone dates, we may be subject to liquidated damages and/or penalties under the Engineering Procurement and Construction agreement or other agreements relating to the power plant or project, and we typically will not be able to recover our investment in the project. We expect to invest a significant amount of capital to develop projects whether owned by us or by third parties. If we are unable to complete the development of a project, we may write-down or write-off some or all of these capitalized investments, which would have an adverse impact on our net income in the period in which the loss is recognized.
Our business is affected by seasonal trends and construction cycles, and these trends and cycles could have an adverse effect on our operating results.
We are subject to seasonal fluctuations and construction cycles, particularly in climates that experience colder weather during the winter months, such as the northern United States and Canada, or at educational institutions, where large projects are typically carried out during summer months when their facilities are unoccupied. In addition, government customers, many of which have fiscal years that do not coincide with ours, typically follow annual procurement cycles and appropriate funds on a fiscal-year basis even though contract performance may take more than one year. Further, government contracting cycles can be affected by the timing of, and delays in, the legislative process related to government programs and incentives that help drive demand for energy efficiency and renewable energy projects. As a result, our revenues and operating income in the third and fourth quarter are typically higher, and our revenues and operating income in the first quarter are typically lower, than in other quarters of the year. As a result of such fluctuations, we may occasionally experience declines in revenue or earnings as compared to the immediately preceding quarter, and comparisons of our operating results on a period-to-period basis may not be meaningful.
We may have exposure to additional tax liabilities and our effective tax rate may increase or fluctuate, which could increase our income tax expense and reduce our net income.
Our provision for income taxes is subject to volatility and could be adversely affected by changes in tax laws or regulations, particularly changes in tax incentives in support of energy efficiency. For example, certain deductions and
10
investment credits relating to energy efficiency expired at the end of 2016. Further, there are increasing calls for “comprehensive tax reform,” which could significantly alter the existing tax code, including the removal of these credits prior to their scheduled expiration. If these deductions and credits expire without being extended, or otherwise are eliminated, our effective tax rate would increase, which could increase our income tax expense and reduce our net income.
In addition, like other companies, we may be subject to examination of our income tax returns by the U.S. Internal Revenue Service and other tax authorities; our U.S. federal tax returns for 2014 through 2015 are subject to audit by federal, state and foreign tax authorities. Though we regularly assess the likelihood of adverse outcomes from such examinations and the adequacy of our provision for income taxes, there can be no assurance that such provision is sufficient and that a determination by a tax authority will not have an adverse effect on our net income.
Changes in the laws and regulations governing the public procurement of ESPCs could have a material impact on our business.
We derive a significant amount of our revenue from ESPCs with our government customers. While federal, state and local government rules governing such contracts vary, such rules may, for example, permit the funding of such projects through long-term financing arrangements; permit long-term payback periods from the savings realized through such contracts; allow units of government to exclude debt related to such projects from the calculation of their statutory debt limitation; allow for award of contracts on a “best value” instead of “lowest cost” basis; and allow for the use of sole source providers. To the extent these rules become more restrictive in the future, our business could be harmed.
Failure of third parties to manufacture quality products or provide reliable services in a timely manner could cause delays in the delivery of our services and completion of our projects, which could damage our reputation, have a negative impact on our relationships with our customers and adversely affect our growth.
Our success depends on our ability to provide services and complete projects in a timely manner, which in part depends on the ability of third parties to provide us with timely and reliable products and services. In providing our services and completing our projects, we rely on products that meet our design specifications and components manufactured and supplied by third parties, as well as on services performed by subcontractors.We also rely on subcontractors to perform substantially all of the construction and installation work related to our projects; and we often need to engage subcontractors with whom we have no experience for our projects.
If any of our subcontractors are unable to provide services that meet or exceed our customers’ expectations or satisfy our contractual commitments, our reputation, business and operating results could be harmed. In addition, if we are unable to avail ourselves of warranty and other contractual protections with providers of products and services, we may incur liability to our customers or additional costs related to the affected products and components, which could have a material adverse effect on our business, financial condition and operating results. Moreover, any delays, malfunctions, inefficiencies or interruptions in these products or services could adversely affect the quality and performance of our solutions and require considerable expense to establish alternate sources for such products and services. This could cause us to experience difficulty retaining current customers and attracting new customers, and could harm our brand, reputation and growth.
We may have liability to our customers under our ESPCs if our projects fail to deliver the energy use reductions to which we are committed under the contract.
For our energy efficiency projects, we typically enter into ESPCs under which we commit that the projects will satisfy agreed-upon performance standards appropriate to the project. These commitments are typically structured as guarantees of increased energy efficiency that are based on the design, capacity, efficiency or operation of the specific equipment and systems we install. Our commitments generally fall into three categories: pre-agreed, equipment-level and whole building-level. Under a pre-agreed efficiency commitment, our customer reviews the project design in advance and agrees that, upon or shortly after completion of installation of the specified equipment comprising the project, the pre-agreed increase in energy efficiency will have been met. Under an equipment-level commitment, we commit to a level of increased energy efficiency based on the difference in use measured first with the existing equipment and then with the replacement equipment upon completion of installation. A whole building-level commitment requires future measurement and verification of increased energy efficiency for a whole building, often based on readings of the utility meter where usage is measured. Depending on the project, the measurement and verification may be required only once, upon installation, based on an analysis of one or more sample installations, or may be required to be repeated at agreed upon intervals generally over periods of up to 20 years.
11
Under our contracts, we typically do not take responsibility for a wide variety of factors outside our control and exclude or adjust for such factors in commitment calculations. These factors include variations in energy prices and utility rates, weather, facility occupancy schedules, the amount of energy-using equipment in a facility, and failure of the customer to operate or maintain the project properly. We rely in part on warranties from our equipment suppliers and subcontractors to back-stop the warranties we provide to our customers and, where appropriate, pass on the warranties to our customers. However, the warranties we provide to our customers are sometimes broader in scope or longer in duration than the corresponding warranties we receive from our suppliers and subcontractors, and we bear the risk for any differences, as well as the risk of warranty default by our suppliers and subcontractors.
Typically, our performance commitments apply to the aggregate overall performance of a project rather than to individual energy efficiency measures. Therefore, to the extent an individual measure underperforms, it may be offset by other measures that overperform during the same period. In the event that an energy efficiency project does not perform according to the agreed-upon specifications, our agreements typically allow us to satisfy our obligation by adjusting or modifying the installed equipment, installing additional measures to provide substitute energy savings, or paying the customer for lost energy savings based on the assumed conditions specified in the agreement. However, we may incur additional or increased liabilities or expenses under our ESPCs in the future. Such liabilities or expenses could be substantial, and they could materially harm our business, financial condition or operating results. In addition, any disputes with a customer over the extent to which we bear responsibility to improve performance or make payments to the customer may diminish our prospects for future business from that customer or damage our reputation in the marketplace.
We may assume responsibility under customer contracts for factors outside our control, including, in connection with some customer projects, the risk that fuel prices will increase.
We typically do not take responsibility under our contracts for a wide variety of factors outside our control. We have, however, in a limited number of contracts assumed some level of risk and responsibility for certain factors — sometimes only to the extent that variations exceed specified thresholds — and may also do so under certain contracts in the future, particularly in our contracts for renewable energy projects. For example, under a contract for the construction and operation of a cogeneration facility at the U.S. Department of Energy Savannah River Site in South Carolina, a subsidiary of ours is exposed to the risk that the price of the biomass that will be used to fuel the cogeneration facility may rise during the 19-year performance period of the contract. Several provisions in that contract mitigate the price risk. In addition, although we typically structure our contracts so that our obligation to supply a customer with LFG, electricity or steam, for example, does not exceed the quantity produced by the production facility, in some circumstances we may commit to supply a customer with specified minimum quantities based on our projections of the facility’s production capacity. In such circumstances, if we are unable to meet such commitments, we may be required to incur additional costs or face penalties. Despite the steps we have taken to mitigate risks under these and other contracts, such steps may not be sufficient to avoid the need to incur increased costs to satisfy our commitments, and such costs could be material. Increased costs that we are unable to pass through to our customers could have a material adverse effect on our operating results.
Our business depends on experienced and skilled personnel and substantial specialty subcontractor resources, and if we lose key personnel or if we are unable to attract and integrate additional skilled personnel, it will be more difficult for us to manage our business and complete projects.
The success of our business and construction projects depend in large part on the skill of our personnel and on trade labor resources, including with certain specialty subcontractor skills. Competition for personnel, particularly those with expertise in the energy services and renewable energy industries, is high. In the event we are unable to attract, hire and retain the requisite personnel and subcontractors, we may experience delays in completing projects in accordance with project schedules and budgets. Further, any increase in demand for personnel and specialty subcontractors may result in higher costs, causing us to exceed the budget on a project. Either of these circumstances may have an adverse effect on our business, financial condition and operating results, harm our reputation among and relationships with our customers and cause us to curtail our pursuit of new projects.
Our future success is particularly dependent on the vision, skills, experience and effort of our senior management team, including our executive officers and our founder, principal stockholder, president and chief executive officer, George P. Sakellaris. If we were to lose the services of any of our executive officers or key employees, our ability to effectively manage our operations and implement our strategy could be harmed and our business may suffer.
12
If we cannot obtain surety bonds and letters of credit, our ability to operate may be restricted.
Federal and state laws require us to secure the performance of certain long-term obligations through surety bonds and letters of credit. In addition, we are occasionally required to provide bid bonds or performance bonds to secure our performance under energy efficiency contracts. In the future, we may have difficulty procuring or maintaining surety bonds or letters of credit, and obtaining them may become more expensive, require us to post cash collateral or otherwise involve unfavorable terms. Because we are sometimes required to have performance bonds or letters of credit in place before projects can commence or continue, our failure to obtain or maintain those bonds and letters of credit would adversely affect our ability to begin and complete projects, and thus could have a material adverse effect on our business, financial condition and operating results.
We operate in a highly competitive industry, and our current or future competitors may be able to compete more effectively than we do, which could have a material adverse effect on our business, revenues, growth rates and market share.
Our industry is highly competitive, with many companies of varying size and business models, many of which have their own proprietary technologies, competing for the same business as we do. Many of our competitors have longer operating histories and greater resources than us, and could focus their substantial financial resources to develop a competitive advantage. Our competitors may also offer energy solutions at prices below cost, devote significant sales forces to competing with us or attempt to recruit our key personnel by increasing compensation, any of which could improve their competitive positions. Any of these competitive factors could make it more difficult for us to attract and retain customers, cause us to lower our prices in order to compete, and reduce our market share and revenues, any of which could have a material adverse effect on our financial condition and operating results. We can provide no assurance that we will continue to effectively compete against our current competitors or additional companies that may enter our markets.
In addition, we may also face competition based on technological developments that reduce demand for electricity, increase power supplies through existing infrastructure or that otherwise compete with our products and services. We also encounter competition in the form of potential customers electing to develop solutions or perform services internally rather than engaging an outside provider such as us.
We may be unable to complete or operate our projects on a profitable basis or as we have committed to our customers.
Development, installation and construction of our energy efficiency and renewable energy projects, and operation of our renewable energy projects, entails many risks, including:
|
•
|
failure to receive critical components and equipment that meet our design specifications and can be delivered on schedule;
|
|
•
|
failure to obtain all necessary rights to land access and use;
|
|
•
|
failure to receive quality and timely performance of third-party services;
|
|
•
|
increases in the cost of labor, equipment and commodities needed to construct or operate projects;
|
|
•
|
permitting and other regulatory issues, license revocation and changes in legal requirements;
|
|
•
|
shortages of equipment or skilled labor;
|
|
•
|
unforeseen engineering problems;
|
|
•
|
failure of a customer to accept or pay for renewable energy that we supply;
|
|
•
|
weather interferences, catastrophic events including fires, explosions, earthquakes, droughts and acts of terrorism; and accidents involving personal injury or the loss of life;
|
|
•
|
labor disputes and work stoppages;
|
|
•
|
mishandling of hazardous substances and waste; and
|
|
•
|
other events outside of our control.
|
Any of these factors could give rise to construction delays and construction and other costs in excess of our expectations. This could prevent us from completing construction of our projects, cause defaults under our financing agreements or under
13
contracts that require completion of project construction by a certain time, cause projects to be unprofitable for us, or otherwise impair our business, financial condition and operating results.
Our small-scale renewable energy plants may not generate expected levels of output.
The small-scale renewable energy plants that we construct and own are subject to various operating risks that may cause them to generate less than expected amounts of processed LFG, electricity or thermal energy. These risks include a failure or degradation of our, our customers’ or utilities’ equipment; an inability to find suitable replacement equipment or parts; less than expected supply of the plant’s source of renewable energy, such as LFG or biomass; or a faster than expected diminishment of such supply. Any extended interruption in the plant’s operation, or failure of the plant for any reason to generate the expected amount of output, could have a material adverse effect on our business and operating results. In addition, we have in the past, and could in the future, incur material asset impairment charges if any of our renewable energy plants incurs operational issues that indicate that our expected future cash flows from the plant are less than its carrying value. Any such impairment charge could have a material adverse effect on our operating results in the period in which the charge is recorded.
We plan to expand our business in part through future acquisitions, but we may not be able to identify or complete suitable acquisitions.
Historically, acquisitions have been a significant part of our growth strategy. We plan to continue to use acquisitions of companies or assets to expand our project skill-sets and capabilities, expand our geographic markets, add experienced management and increase our product and service offerings. However, we may be unable to implement this growth strategy if we cannot identify suitable acquisition candidates, reach agreement with acquisition targets on acceptable terms or arrange required financing for acquisitions on acceptable terms. In addition, the time and effort involved in attempting to identify acquisition candidates and consummate acquisitions may divert members of our management from the operations of our company.
Any future acquisitions that we may make could disrupt our business, cause dilution to our stockholders and harm our business, financial condition or operating results.
If we are successful in consummating acquisitions, those acquisitions could subject us to a number of risks, including:
|
•
|
the purchase price we pay could significantly deplete our cash reserves or result in dilution to our existing stockholders;
|
|
•
|
we may find that the acquired company or assets do not improve our customer offerings or market position as planned;
|
|
•
|
we may have difficulty integrating the operations and personnel of the acquired company;
|
|
•
|
key personnel and customers of the acquired company may terminate their relationships with the acquired company as a result of the acquisition;
|
|
•
|
we may experience additional financial and accounting challenges and complexities in areas such as tax planning and financial reporting;
|
|
•
|
we may incur additional costs and expenses related to complying with additional laws, rules or regulations in new jurisdictions;
|
|
•
|
we may assume or be held liable for risks and liabilities (including for environmental-related costs) as a result of our acquisitions, some of which we may not discover during our due diligence or adequately adjust for in our acquisition arrangements;
|
|
•
|
our ongoing business and management’s attention may be disrupted or diverted by transition or integration issues and the complexity of managing geographically or culturally diverse enterprises;
|
|
•
|
we may incur one-time write-offs or restructuring charges in connection with the acquisition;
|
|
•
|
we may acquire goodwill and other intangible assets that are subject to amortization or impairment tests, which could result in future charges to earnings; and
|
|
•
|
we may not be able to realize the cost savings or other financial benefits we anticipated.
|
These factors could have a material adverse effect on our business, financial condition and operating results.
14
We may be required to write-off or impair capitalized costs or intangible assets in the future or we may incur restructuring costs or other charges, each of which could harm our earnings.
In accordance with generally accepted accounting principles in the United States, we capitalize certain expenditures and advances relating to our acquisitions, pending acquisitions, project development costs, interest costs related to project financing and certain project assets. In addition, we have considerable unamortized assets. From time to time in future periods, we may be required to incur a charge against earnings in an amount equal to any unamortized capitalized expenditures and advances, net of any portion thereof that we estimate will be recoverable, through sale or otherwise, relating to: (i) any operation or other asset that is being sold, permanently shut down, impaired or has not generated or is not expected to generate sufficient cash flow; (ii) any pending acquisition that is not consummated; (iii) any project that is not expected to be successfully completed; and (iv) any goodwill or other intangible assets that are determined to be impaired.
In response to such charges and costs and other market factors, we may be required to implement restructuring plans in an effort to reduce the size and cost of our operations and to better match our resources with our market opportunities. As a result of such actions, we would expect to incur restructuring expenses and accounting charges which may be material. Several factors could cause a restructuring to adversely affect our business, financial condition and results of operations. These include potential disruption of our operations, the development of our small-scale renewable energy projects and other aspects of our business. Employee morale and productivity could also suffer and result in unintended employee attrition. Any restructuring would require substantial management time and attention and may divert management from other important work. Moreover, we could encounter delays in executing any restructuring plans, which could cause further disruption and additional unanticipated expense.
See also Note 2, “Significant Accounting Policies” and Note 4, “Goodwill and Intangible Assets”, to our Consolidated Financial Statements appearing in Item 8 of this Annual Report on Form 10-K.
We need governmental approvals and permits, and we typically must meet specified qualifications, in order to undertake our energy efficiency projects and construct, own and operate our small-scale renewable energy projects, and any failure to do so would harm our business.
The design, construction and operation of our energy efficiency and small-scale renewable energy projects require various governmental approvals and permits, and may be subject to the imposition of related conditions that vary by jurisdiction. In some cases, these approvals and permits require periodic renewal. We cannot predict whether all permits required for a given project will be granted or whether the conditions associated with the permits will be achievable. The denial of a permit essential to a project or the imposition of impractical conditions would impair our ability to develop the project. In addition, we cannot predict whether the permits will attract significant opposition or whether the permitting process will be lengthened due to complexities and appeals. Delay in the review and permitting process for a project can impair or delay our ability to develop that project or increase the cost so substantially that the project is no longer attractive to us. We have experienced delays in developing our projects due to delays in obtaining permits and may experience delays in the future. If we were to commence construction in anticipation of obtaining the final, non-appealable permits needed for that project, we would be subject to the risk of being unable to complete the project if all the permits were not obtained. If this were to occur, we would likely lose a significant portion of our investment in the project and could incur a loss as a result. Further, the continued operations of our projects require continuous compliance with permit conditions. This compliance may require capital improvements or result in reduced operations. Any failure to procure, maintain and comply with necessary permits would adversely affect ongoing development, construction and continuing operation of our projects.
In addition, the projects we perform for governmental agencies are governed by particular qualification and contracting regimes. Certain states require qualification with an appropriate state agency as a precondition to performing work or appearing as a qualified energy service provider for state, county and local agencies within the state. For example, the Commonwealth of Massachusetts and the states of Colorado and Washington pre-qualify energy service providers and provide contract documents that serve as the starting point for negotiations with potential governmental clients. Most of the work that we perform for the federal government is performed under IDIQ agreements between a government agency and us or a subsidiary. These IDIQ agreements allow us to contract with the relevant agencies to implement energy projects, but no work may be performed unless we and the agency agree on a task order or delivery order governing the provision of a specific project. The government agencies enter into contracts for specific projects on a competitive basis. We and our subsidiaries and affiliates are currently party to an IDIQ agreement with the U.S. Department of Energy that expires in 2019. We are also party to similar agreements with other federal agencies, including the U.S. Army Corps of Engineers and the U.S. General Services Administration.
15
If we are unable to maintain or renew our IDIQ qualification under the U.S. Department of Energy program for ESPCs, or similar federal or state qualification regimes, our business could be materially harmed.
Many of our small-scale renewable energy projects are, and other future projects may be, subject to or affected by U.S. federal energy regulation or other regulations that govern the operation, ownership and sale of the facility, or the sale of electricity from the facility.
PUHCA and the FPA regulate public utility holding companies and their subsidiaries and place constraints on the conduct of their business. The FPA regulates wholesale sales of electricity and the transmission of electricity in interstate commerce by public utilities. Under PURPA, all of our current small-scale renewable energy projects are small power “qualifying facilities” (facilities meeting statutory size, fuel and filing requirements) that are exempt from regulations under PUHCA, most provisions of the FPA and state rate and financial regulation. None of our renewable energy projects are currently subject to rate regulation for wholesale power sales by the Federal Energy Regulatory Commission (“FERC”) under the FPA, but certain of our projects that are under construction or development could become subject to such regulation in the future. Also, we may acquire interests in or develop generating projects that are not qualifying facilities. Non-qualifying facility projects would be fully subject to FERC corporate and rate regulation, and would be required to obtain FERC acceptance of their rate schedules for wholesale sales of energy, capacity and ancillary services, which requires substantial disclosures to and discretionary approvals from FERC. FERC may revoke or revise an entity’s authorization to make wholesale sales at negotiated, or market-based, rates if FERC determines that we can exercise market power in transmission or generation, create barriers to entry or engage in abusive affiliate transactions or market manipulation. In addition, many public utilities (including any non-qualifying facility generator in which we may invest) are subject to FERC reporting requirements that impose administrative burdens and that, if violated, can expose the company to civil penalties or other risks.
All of our wholesale electric power sales are subject to certain market behavior rules. These rules change from time to time, by virtue of FERC rulemaking proceedings and FERC-ordered amendments to utilities’ or power pools’ FERC tariffs. If we are deemed to have violated these rules, we will be subject to potential disgorgement of profits associated with the violation and/or suspension or revocation of our market-based rate authority, as well as potential criminal and civil penalties. If we were to lose market-based rate authority for any non-qualifying facility project we may acquire or develop in the future, we would be required to obtain FERC’s acceptance of a cost-based rate schedule and could become subject to, among other things, the burdensome accounting, record keeping and reporting requirements that are imposed on public utilities with cost-based rate schedules. This could have an adverse effect on the rates we charge for power from our projects and our cost of regulatory compliance.
Wholesale electric power sales are subject to increasing regulation. The terms and conditions for power sales, and the right to enter and remain in the wholesale electric sector, are subject to FERC oversight. Due to major regulatory restructuring initiatives at the federal and state levels, the U.S. electric industry has undergone substantial changes over the past decade. We cannot predict the future design of wholesale power markets or the ultimate effect ongoing regulatory changes will have on our business. Other proposals to further regulate the sector may be made and legislative or other attention to the electric power market restructuring process may delay or reverse the movement towards competitive markets.
If we become subject to additional regulation under PUHCA, FPA or other regulatory frameworks, if existing regulatory requirements become more onerous, or if other material changes to the regulation of the electric power markets take place, our business, financial condition and operating results could be adversely affected.
Compliance with environmental laws could adversely affect our operating results.
Costs of compliance with federal, state, provincial, local and other foreign existing and future environmental regulations could adversely affect our cash flow and profitability. We are required to comply with numerous environmental laws and regulations and to obtain numerous governmental permits in connection with energy efficiency and renewable energy projects, and we may incur significant additional costs to comply with these requirements. If we fail to comply with these requirements, we could be subject to civil or criminal liability, damages and fines. Existing environmental regulations could be revised or reinterpreted and new laws and regulations could be adopted or become applicable to us or our projects, and future changes in environmental laws and regulations could occur. These factors may materially increase the amount we must invest to bring our projects into compliance and impose additional expense on our operations.
In addition, private lawsuits or enforcement actions by federal, state, provincial and/or foreign regulatory agencies may materially increase our costs. Certain environmental laws make us potentially liable on a joint and several basis for the remediation of contamination at or emanating from properties or facilities we currently or formerly owned or operated or
16
properties to which we arranged for the disposal of hazardous substances. Such liability is not limited to the cleanup of contamination we actually caused. Although we seek to obtain indemnities against liabilities relating to historical contamination at the facilities we own or operate, we cannot provide any assurance that we will not incur liability relating to the remediation of contamination, including contamination we did not cause.
We may not be able to obtain or maintain, from time to time, all required environmental regulatory approvals. A delay in obtaining any required environmental regulatory approvals or failure to obtain and comply with them could adversely affect our business and operating results.
International expansion is one of our growth strategies, and international operations will expose us to additional risks that we do not face in the United States, which could have an adverse effect on our operating results.
We generate a portion of our revenues from operations in Canada and the U.K., and although we are engaged in overseas projects for the U.S. Department of Defense, we currently derive a small amount of revenues from outside of North America. However, international expansion is one of our growth strategies, and we expect our revenues and operations outside of North America will expand in the future. These operations will be subject to a variety of risks that we do not face in the United States, and that we may face only to a limited degree in Canada, including:
|
•
|
building and managing highly experienced foreign workforces and overseeing and ensuring the performance of foreign subcontractors;
|
|
•
|
increased travel, infrastructure and legal and compliance costs associated with multiple international locations;
|
|
•
|
additional withholding taxes or other taxes on our foreign income, and tariffs or other restrictions on foreign trade or investment;
|
|
•
|
imposition of, or unexpected adverse changes in, foreign laws or regulatory requirements, many of which differ from those in the United States;
|
|
•
|
increased exposure to foreign currency exchange rate risk;
|
|
•
|
longer payment cycles for sales in some foreign countries and potential difficulties in enforcing contracts and collecting accounts receivable;
|
|
•
|
difficulties in repatriating overseas earnings;
|
|
•
|
general economic conditions in the countries in which we operate; and
|
|
•
|
political unrest, war, incidents of terrorism, or responses to such events.
|
Our overall success in international markets will depend, in part, on our ability to succeed in differing legal, regulatory, economic, social and political conditions. We may not be successful in developing and implementing policies and strategies that will be effective in managing these risks in each country where we do business. Our failure to manage these risks successfully could harm our international operations, reduce our international sales and increase our costs, thus adversely affecting our business, financial condition and operating results.
Changes in utility regulation and tariffs could adversely affect our business.
Our business is affected by regulations and tariffs that govern the activities and rates of utilities. For example, utility companies are commonly allowed by regulatory authorities to charge fees to some business customers for disconnecting from the electric grid or for having the capacity to use power from the electric grid for back-up purposes. These fees could increase the cost to our customers of taking advantage of our services and make them less desirable, thereby harming our business, financial condition and operating results. Our current generating projects are all operated as qualifying facilities. FERC regulations under the FPA confer upon these facilities key rights to interconnection with local utilities, and can entitle qualifying facilities to enter into power purchase agreements with local utilities, from which the qualifying facilities benefit. Changes to these federal laws and regulations could increase our regulatory burdens and costs, and could reduce our revenues. State regulatory agencies could award renewable energy certificates or credits that our electric generation facilities produce to our power purchasers, thereby reducing the power sales revenues we otherwise would earn. In addition, modifications to the pricing policies of utilities could require renewable energy systems to charge lower prices in order to compete with the price of electricity from the electric grid and may reduce the economic attractiveness of certain energy efficiency measures.
17
Some of the demand-reduction services we provide for utilities and institutional clients are subject to regulatory tariffs imposed under federal and state utility laws. In addition, the operation of, and electrical interconnection for, our renewable energy projects are subject to federal, state or provincial interconnection and federal reliability standards that are also set forth in utility tariffs. These tariffs specify rules, business practices and economic terms to which we are subject. The tariffs are drafted by the utilities and approved by the utilities’ state and federal regulatory commissions. These tariffs change frequently and it is possible that future changes will increase our administrative burden or adversely affect the terms and conditions under which we render service to our customers.
Our activities and operations are subject to numerous health and safety laws and regulations, and if we violate such regulations, we could face penalties and fines.
We are subject to numerous health and safety laws and regulations in each of the jurisdictions in which we operate. These laws and regulations require us to obtain and maintain permits and approvals and implement health and safety programs and procedures to control risks associated with our projects. Compliance with those laws and regulations can require us to incur substantial costs. Moreover, if our compliance programs are not successful, we could be subject to penalties or to revocation of our permits, which may require us to curtail or cease operations of the affected projects. Violations of laws, regulations and permit requirements may also result in criminal sanctions or injunctions.
Health and safety laws, regulations and permit requirements may change or become more stringent. Any such changes could require us to incur materially higher costs than we currently have. Our costs of complying with current and future health and safety laws, regulations and permit requirements, and any liabilities, fines or other sanctions resulting from violations of them, could adversely affect our business, financial condition and operating results.
If our subsidiaries default on their obligations under their debt instruments, we may need to make payments to lenders to prevent foreclosure on the collateral securing the debt.
We typically set up subsidiaries to own and finance our renewable energy projects. These subsidiaries incur various types of debt which can be used to finance one or more projects. This debt is typically structured as non-recourse debt, which means it is repayable solely from the revenues from the projects financed by the debt and is secured by such projects’ physical assets, major contracts and cash accounts and a pledge of our equity interests in the subsidiaries involved in the projects. Although our subsidiary debt is typically non-recourse to Ameresco, if a subsidiary of ours defaults on such obligations, or if one project out of several financed by a particular subsidiary’s indebtedness encounters difficulties or is terminated, then we may from time to time determine to provide financial support to the subsidiary in order to maintain rights to the project or otherwise avoid the adverse consequences of a default. In the event a subsidiary defaults on its indebtedness, its creditors may foreclose on the collateral securing the indebtedness, which may result in our losing our ownership interest in some or all of the subsidiary’s assets. The loss of our ownership interest in a subsidiary or some or all of a subsidiary’s assets could have a material adverse effect on our business, financial condition and operating results.
We are exposed to the credit risk of some of our customers.
Most of our revenues are derived under multi-year or long-term contracts with our customers, and our revenues are therefore dependent to a large extent on the creditworthiness of our customers. During periods of economic downturn, our exposure to credit risks from our customers increases, and our efforts to monitor and mitigate the associated risks may not be effective in reducing our credit risks. In the event of non-payment by one or more of our customers, our business, financial condition and operating results could be adversely affected.
Fluctuations in foreign currency exchange rates can impact our results.
A portion of our total revenues are generated by our Canadian and U.K. subsidiaries. Changes in exchange rates between the Canadian dollar and the U.S. dollar, as well as the British pound sterling and the U.S. dollar, may adversely affect our operating results.
A failure of our information technology (“IT”) and data security infrastructure could adversely impact our business and operations.
We rely upon the capacity, reliability and security of our IT and data security infrastructure and our ability to expand and continually update this infrastructure in response to the changing needs of our business. As we implement new systems, they may not perform as expected. We also face the challenge of supporting our older systems and implementing necessary upgrades. If we experience a problem with the functioning of an important IT system or a security breach of our IT systems,
18
including during system upgrades and/or new system implementations, the resulting disruptions could have an adverse effect on our business.
We and certain of our third-party vendors receive and store personal information in connection with our human resources operations and other aspects of our business. Despite our implementation of security measures, our IT systems, like those of other companies, are vulnerable to damages from computer viruses, natural disasters, unauthorized access, cyber attack and other similar disruptions. Any system failure, accident or security breach could result in disruptions to our operations. A material network breach in the security of our IT systems could include the theft of our intellectual property, trade secrets, customer information, human resources information or other confidential matter. To the extent that any disruptions or security breach results in a loss or damage to our data, or an inappropriate disclosure of confidential, proprietary or customer information, it could cause significant damage to our reputation, affect our relationships with our customers, lead to claims against the Company and ultimately harm our business. In addition, we may be required to incur significant costs to protect against damage caused by these disruptions or security breaches in the future.
Risks Related to Ownership of Our Class A Common Stock
The trading price of our Class A common stock is volatile.
The trading price of our Class A common stock is volatile and could be subject to wide fluctuations. In addition, if the stock market in general experiences a significant decline, the trading price of our Class A common stock could decline for reasons unrelated to our business, financial condition or operating results. Some companies that have had volatile market prices for their securities have had securities class actions filed against them. If a suit were filed against us, regardless of its merits or outcome, it would likely result in substantial costs and divert management’s attention and resources. This could have a material adverse effect on our business, operating results and financial condition.
Holders of our Class A common stock are entitled to one vote per share, and holders of our Class B common stock are entitled to five votes per share. The lower voting power of our Class A common stock may negatively affect the attractiveness of our Class A common stock to investors and, as a result, its market value.
We have two classes of common stock: Class A common stock, which is listed on the NYSE and which is entitled to one vote per share, and Class B common stock, which is not listed on the any security exchange and is entitled to five votes per share. The difference in the voting power of our Class A and Class B common stock could diminish the market value of our Class A common stock because of the superior voting rights of our Class B common stock and the power those rights confer.
For the foreseeable future, Mr. Sakellaris or his affiliates will be able to control the selection of all members of our board of directors, as well as virtually every other matter that requires stockholder approval, which will severely limit the ability of other stockholders to influence corporate matters.
Except in certain limited circumstances required by applicable law, holders of Class A and Class B common stock vote together as a single class on all matters to be voted on by our stockholders. Mr. Sakellaris, our founder, principal stockholder, president and chief executive officer, owns all of our Class B common stock, which, together with his Class A common stock, represents approximately
80%
of the combined voting power of our outstanding Class A and Class B common stock. Under our restated certificate of incorporation, holders of shares of Class B common stock may generally transfer those shares to family members, including spouses and descendants or the spouses of such descendants, as well as to affiliated entities, without having the shares automatically convert into shares of Class A common stock. Therefore, Mr. Sakellaris, his affiliates, and his family members and descendants will, for the foreseeable future, be able to control the outcome of the voting on virtually all matters requiring stockholder approval, including the election of directors and significant corporate transactions such as an acquisition of our company, even if they come to own, in the aggregate, as little as 20% of the economic interest of the outstanding shares of our Class A and Class B common stock. Moreover, these persons may take actions in their own interests that you or our other stockholders do not view as beneficial.
Though we may repurchase shares of our Class A common stock pursuant to our recently announced share repurchase program, we are not obligated to do so and if we do, we may purchase only a limited number of shares of Class A common stock.
On May 5, 2016, we announced a stock repurchase program under which the Company is currently authorized to repurchase, in the aggregate, up to $15.0 million of our outstanding Class A common stock. However, we are not obligated to acquire any shares of our Class A common stock, and holders of our Class A common stock should not rely on the share repurchase program to increase their liquidity. The amount and timing of any share repurchases will depend upon a variety of
19
factors, including the trading price of our Class A common stock, liquidity, securities laws restrictions, other regulatory restrictions, potential alternative uses of capital, and market and economic conditions. We intend to purchase through open market transactions or in privately negotiated transactions, in accordance with applicable securities laws and regulatory limitations. We may reduce or eliminate our share repurchase program in the future. The reduction or elimination of our share repurchase program, particularly if we do not repurchase the full number of shares authorized under the program, could adversely affect the market price of our common stock.
20
None.
Our corporate headquarters is located in Framingham, Massachusetts, where we occupy approximately 26,000 square feet under a lease expiring on June 30, 2025. We occupy nine regional offices in Tempe, Arizona; Islandia, New York; Oak Brook, Illinois; Columbia, Maryland; Charlotte, North Carolina; Knoxville, Tennessee; Tomball, Texas; Spokane, Washington and North York, Ontario, each less than 25,000 square feet, under lease or sublease agreements. In addition, we lease space, typically less space, for 63 field offices throughout North America and the U.K. We also own 55 small-scale renewable energy plants throughout North America, which are located on leased sites or sites provided by customers. We expect to add new facilities and expand existing facilities as we continue to add employees and expand our business into new geographic areas.
In the ordinary conduct of our business we are subject to periodic lawsuits, investigations and claims. Although we cannot predict with certainty the ultimate resolution of such lawsuits, investigations and claims against us, we do not believe that any currently pending or threatened legal proceedings to which we are a party will have a material adverse effect on our business, results of operations or financial condition.
For additional information about certain proceedings, please refer to Note 13, “Commitments and Contingencies”, to our Consolidated Financial Statements included in this report, which is incorporated into this item by reference.
Not applicable.
21
|
Item 5.
|
Market for Registrant’s Common Equity, Related Stockholder Matters and Issuer Purchases of Equity Securities
|
Our Class A common stock trades on the New York Stock Exchange under the symbol “AMRC”. The following table sets forth, for the fiscal quarters indicated, the high and low sale prices per share of our Class A common stock.
|
2016
|
2015
|
||||||||||||||
|
High
|
Low
|
High
|
Low
|
||||||||||||
|
First Quarter
|
$
|
6.23
|
|
$
|
4.14
|
|
$
|
7.84
|
|
$
|
5.78
|
|
|||
|
Second Quarter
|
5.01
|
|
3.91
|
|
7.98
|
|
6.40
|
|
|||||||
|
Third Quarter
|
5.34
|
|
4.35
|
|
7.90
|
|
5.31
|
|
|||||||
|
Fourth Quarter
|
6.30
|
|
4.60
|
|
7.10
|
|
5.68
|
|
|||||||
The closing sale price of our Class A common stock was
$5.20
on March 1,
2017
, and according to the records of our transfer agent, there were 15 shareholders of record of our Class A common stock on that date. A substantially greater number of holders of our Class A common stock are “street name” or beneficial holders, whose shares are held of record by banks, brokers, and other financial institutions.
Our Class B common stock is not publicly traded and is held of record by George P. Sakellaris, our founder, principal stockholder, president and chief executive officer, and the Ameresco 2015 Annuity Trust, of which Mr. Sakellaris is trustee and the sole beneficiary.
Dividend Policy
We have never declared or paid any cash dividends on our capital stock. We currently intend to retain earnings, if any, to finance the growth and development of our business and do not expect to pay any cash dividends for the foreseeable future. Our revolving senior secured credit facility contains provisions that limit our ability to declare and pay cash dividends during the term of that agreement. Payment of future dividends, if any, will be at the discretion of our board of directors and will depend on our financial condition, results of operations, capital requirements, restrictions contained in current or future financing instruments, provisions of applicable law and other factors our board of directors deems relevant.
22
Stock Performance Graph
The following performance graph and related information shall not be deemed “soliciting material” or to be “filed” with the SEC, nor shall such information be incorporated by reference into any future filing under the Securities Act of 1933 (the “Securities Act”) or the Exchange Act, except to the extent that we specifically incorporate it by reference into such filing.
The following graph compares the cumulative total return attained by shareholders on our Class A common stock relative to the cumulative total returns of the Russell 2000 index and the NASDAQ Clean Edge Green Energy index. An investment of $100 (with reinvestment of all dividends) is assumed to have been made in our Class A common stock on December 31, 2011, and in each of the indexes on December 31, 2011 and its relative performance is tracked through
December 31, 2016
.
COMPARISON OF FIVE-YEAR CUMULATIVE TOTAL RETURN
*
Among Ameresco, Inc., the Russell 2000 Index
and the NASDAQ Clean Edge Green Energy Index
*$100 invested on December 31, 2011 in our Class A common stock or December 31, 2011 in respective index, including reinvestment of dividends. Fiscal year ending
December 31, 2016
.
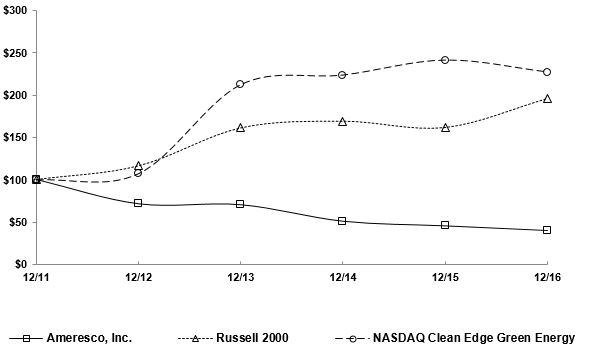
|
12/31/2011
|
12/31/2012
|
12/31/2013
|
12/31/2014
|
12/31/2015
|
12/31/2016
|
||||||
|
Ameresco, Inc.
|
$100.00
|
$71.50
|
$70.41
|
$51.02
|
$45.55
|
$40.09
|
|||||
|
Russell 2000 Index
|
$100.00
|
$116.35
|
$161.52
|
$169.43
|
$161.95
|
$196.45
|
|||||
|
NASDAQ Clean Edge Green Energy Index
|
$100.00
|
$107.45
|
$212.14
|
$223.41
|
$241.05
|
$227.07
|
|||||
Shareholder returns over the indicated period should not be considered indicative of future shareholder returns.
23
Stock Repurchase Program
The following table provides information as of and for the quarter ended December 31, 2016 regarding shares of our Class A common stock that were repurchased under our stock repurchase program authorized by the Board of Directors on April 27, 2016 (the “Repurchase Program”):
|
Period
|
Total Number of Shares Purchased
|
Average Price Paid per Share
|
Total Number of Shares Purchased as Part of Publicly Announced Plans or Programs
|
Approximate
Dollar Value of
Shares that May
Yet Be Purchased
Under the Plans
or Programs
|
|||||||||
|
October 1, 2016 - October 31, 2016
|
260,868
|
|
$
|
5.03
|
|
260,868
|
|
$
|
4,273,675
|
|
|||
|
November 1, 2016 - November 30, 2016
|
104,806
|
|
5.18
|
|
104,806
|
|
3,731,067
|
|
|||||
|
December 1, 2016 - December 31, 2016
|
11,800
|
|
5.53
|
|
11,800
|
|
3,665,770
|
|
|||||
|
Total
|
377,474
|
|
$
|
5.09
|
|
377,474
|
|
$
|
3,665,770
|
|
|||
Under the Repurchase Program, we were authorized to repurchase up to $10.0 million of our Class A common stock. In February 2017, our Board of Directors authorized us to repurchase up to an additional $5.0 million of our Class A common stock. Stock repurchases may be made from time to time through the open market and privately negotiated transactions. The amount and timing of any share repurchases will depend upon a variety of factors, including the trading price of our Class A common stock, liquidity, securities laws restrictions, other regulatory restrictions, potential alternative uses of capital, and market and economic conditions. The Repurchase Program may be suspended or terminated at any time without prior notice, and has no expiration date.
You should read the following selected consolidated financial data in conjunction with Item 7 “Management’s Discussion and Analysis of Financial Condition and Results of Operations” and our consolidated financial statements and the related notes appearing in Item 8 “Financial Statements and Supplementary Data” of this Annual Report on Form 10-K. We prepare our financial statements in conformity with accounting principles generally accepted in the United States of America (“GAAP”).
We derived the consolidated statements of income (loss) data for the years ended December 31,
2016
,
2015
, and
2014
and the consolidated balance sheet data at
December 31, 2016
and
2015
from our audited consolidated financial statements appearing in Item 8 of this Annual Report on Form 10-K. We derived the consolidated statements of income (loss) data for the years ended December 31, 2013 and 2012, and the consolidated balance sheet data at December 31, 2014, 2013, and 2012, from our audited consolidated financial statements that are not included in this Annual Report on Form 10-K. Our historical results are not necessarily indicative of the results to be expected in any future period.
24
|
|
Year Ended December 31,
|
||||||||||||||||||
|
|
2016
|
2015
|
2014
|
2013
|
2012
|
||||||||||||||
|
|
(in thousands, except share and per share data)
|
||||||||||||||||||
|
|
|
|
|
|
|
|
|
|
|
|
|||||||||
|
Revenues
|
$
|
651,227
|
|
$
|
630,832
|
|
$
|
593,241
|
|
$
|
574,171
|
|
$
|
631,171
|
|
||||
|
Cost of revenues
|
516,883
|
|
513,768
|
|
476,309
|
|
470,846
|
|
503,024
|
|
|||||||||
|
Gross profit
|
134,344
|
|
117,064
|
|
116,932
|
|
103,325
|
|
128,147
|
|
|||||||||
|
Selling, general and administrative expenses
|
110,568
|
|
110,007
|
|
103,781
|
|
96,693
|
|
98,474
|
|
|||||||||
|
Goodwill impairment
|
—
|
|
—
|
|
—
|
|
—
|
|
1,016
|
|
|||||||||
|
Operating income
|
23,776
|
|
7,057
|
|
13,151
|
|
6,632
|
|
28,657
|
|
|||||||||
|
Other expenses, net
|
7,409
|
|
6,765
|
|
6,859
|
|
3,873
|
|
4,050
|
|
|||||||||
|
Income before provision for income taxes
|
16,367
|
|
292
|
|
6,292
|
|
2,759
|
|
24,607
|
|
|||||||||
|
Income tax provision (benefit)
|
4,370
|
|
4,976
|
|
(4,091
|
)
|
345
|
|
6,247
|
|
|||||||||
|
Net income (loss)
|
11,997
|
|
(4,684
|
)
|
10,383
|
|
2,414
|
|
18,360
|
|
|||||||||
|
Net loss attributable to redeemable non-controlling interest
|
35
|
|
5,528
|
|
—
|
|
—
|
|
—
|
|
|||||||||
|
Net income attributable to Ameresco, Inc.
|
$
|
12,032
|
|
$
|
844
|
|
$
|
10,383
|
|
$
|
2,414
|
|
$
|
18,360
|
|
||||
|
Net income per share attributable to common shareholders:
|
|
|
|
|
|
|
|
|
|
|
|||||||||
|
Basic
|
$
|
0.26
|
|
$
|
0.02
|
|
$
|
0.22
|
|
$
|
0.05
|
|
$
|
0.41
|
|
||||
|
Diluted
|
$
|
0.26
|
|
$
|
0.02
|
|
$
|
0.22
|
|
$
|
0.05
|
|
$
|
0.40
|
|
||||
|
Weighted average common shares outstanding:
|
|
|
|
|
|
|
|
|
|
|
|||||||||
|
Basic
|
46,409,192
|
|
46,494,448
|
|
46,161,846
|
|
45,560,078
|
|
44,649,275
|
|
|||||||||
|
Diluted
|
46,493,477
|
|
47,664,895
|
|
47,027,755
|
|
46,685,125
|
|
45,995,463
|
|
|||||||||
|
As of December 31,
|
|||||||||||||||||||
|
2016
|
2015
|
2014
|
2013
|
2012
|
|||||||||||||||
|
(in thousands)
|
|||||||||||||||||||
|
|
|||||||||||||||||||
|
Cash and cash equivalents
|
$
|
20,607
|
|
$
|
21,645
|
|
$
|
23,762
|
|
$
|
17,171
|
|
$
|
63,348
|
|
||||
|
Current assets
|
226,061
|
|
263,698
|
|
215,795
|
|
247,009
|
|
297,843
|
|
|||||||||
|
Total assets
|
797,281
|
|
723,440
|
|
617,550
|
|
600,983
|
|
669,726
|
|
|||||||||
|
Current liabilities
|
190,602
|
|
179,723
|
|
142,934
|
|
133,288
|
|
148,889
|
|
|||||||||
|
Long-term debt, less current portion
|
140,593
|
|
100,490
|
|
85,724
|
|
97,902
|
|
103,333
|
|
|||||||||
|
Federal ESPC liabilities
(1)
|
133,003
|
|
122,040
|
|
70,875
|
|
44,297
|
|
92,843
|
|
|||||||||
|
Total stockholders’ equity
|
$
|
294,306
|
|
$
|
287,409
|
|
$
|
286,306
|
|
$
|
276,806
|
|
$
|
261,819
|
|
||||
|
(1)
|
Federal ESPC liabilities represent the advances received from third-party investors under agreements to finance certain energy savings performance contract projects with various federal government agencies. Upon completion and acceptance of the project by the government, typically within 24 months of construction commencement, the ESPC receivable from the Government and corresponding related ESPC liability is eliminated from our consolidated balance sheet. Until recourse to us ceases for the ESPC receivables transferred to the investor, upon final acceptance of the work by the Government customer, we remain the primary obligor for financing received.
|
25
You should read the following discussion and analysis of our financial condition and results of operations together with our consolidated financial statements and the related notes and other financial information included in Item 8 of this Annual Report on Form 10-K. Some of the information contained in this discussion and analysis or set forth elsewhere in this Report, including information with respect to our plans and strategy for our business and related financing, includes forward-looking statements that involve risks and uncertainties. You should review the “Risk Factors” included in Item 1A of this Annual Report on Form 10-K for a discussion of important factors that could cause actual results to differ materially from the results described in or implied by the forward-looking statements contained in the following discussion and analysis.
Overview
Ameresco is a leading provider of energy efficiency solutions for facilities throughout North America and Europe. We provide solutions that enable customers to reduce their energy consumption, lower their operating and maintenance costs and realize environmental benefits. Our comprehensive set of services includes upgrades to a facility’s energy infrastructure and the construction and operation of small-scale renewable energy plants.
In September 2015, we entered into an agreement with a third party investor which granted the investor ownership interests in the net assets of certain of our renewable energy project subsidiaries. We entered into this agreement in order to finance the costs of constructing certain project assets which are under long-term customer contracts. We have determined that we are the primary beneficiary in the operational partnership for accounting purposes. Accordingly, we consolidate the assets and liabilities and operating results of the entities in our consolidated financial statements. We recognize the investor’s share of the net assets of the investor’s funds as redeemable non-controlling interests in our consolidated balance sheets. These income or loss allocations, which are reflected on our consolidated statements of income (loss), may create significant volatility in our reported results of operations, including potentially changing net income available (loss attributable) to common stockholders from income to loss, or vice versa, from quarter to quarter.
In addition to organic growth, strategic acquisitions of complementary businesses and assets have been an important part of our historical development. Since inception, we have completed numerous acquisitions, which have enabled us to broaden our service offerings and expand our geographical reach.
Our acquisition of a solar photovoltaic (“solar PV”) asset under construction in the fourth quarter of 2016 expanded our portfolio of small-scale renewable energy plants.
Our acquisition of the energy consultancy and energy project management business of Energyexcel LLP in the third quarter of 2014 expanded our local presence in the U.K. and our commercial and industrial customer base.
Energy Savings Performance and Energy Supply Contracts
For our energy efficiency projects, we typically enter into ESPCs, under which we agree to develop, design, engineer and construct a project and also commit that the project will satisfy agreed-upon performance standards that vary from project to project. These performance commitments are typically based on the design, capacity, efficiency or operation of the specific equipment and systems we install. Our commitments generally fall into three categories: pre-agreed, equipment-level and whole building-level. Under a pre-agreed energy reduction commitment, our customer reviews the project design in advance and agrees that, upon or shortly after completion of installation of the specified equipment comprising the project, the commitment will have been met. Under an equipment-level commitment, we commit to a level of energy use reduction based on the difference in use measured first with the existing equipment and then with the replacement equipment. A whole building-level commitment requires demonstration of energy usage reduction for a whole building, often based on readings of the utility meter where usage is measured. Depending on the project, the measurement and demonstration may be required only once, upon installation, based on an analysis of one or more sample installations, or may be required to be repeated at agreed upon intervals generally over up to 20 years.
Under our contracts, we typically do not take responsibility for a wide variety of factors outside of our control and exclude or adjust for such factors in commitment calculations. These factors include variations in energy prices and utility rates, weather, facility occupancy schedules, the amount of energy-using equipment in a facility and the failure of the customer to operate or maintain the project properly. Typically, our performance commitments apply to the aggregate overall performance of a project rather than to individual energy efficiency measures. Therefore, to the extent an individual measure underperforms, it may be offset by other measures that overperform during the same period. In the event that an energy efficiency project does not perform according to the agreed-upon specifications, our agreements typically allow us to satisfy our obligation by
26
adjusting or modifying the installed equipment, installing additional measures to provide substitute energy savings or paying the customer for lost energy savings based on the assumed conditions specified in the agreement. Many of our equipment supply, local design and installation subcontracts contain provisions that enable us to seek recourse against our vendors or subcontractors if there is a deficiency in our energy reduction commitment. See “We may have liability to our customers under our ESPCs if our projects fail to deliver the energy use reductions to which we are committed under the contract” in Item 1A, Risk Factors in this Annual Report on Form 10-K.
Payments by the federal government for energy efficiency measures are based on the services provided and the products installed, but are limited to the savings derived from such measures, calculated in accordance with federal regulatory guidelines and the specific contract’s terms. The savings are typically determined by comparing energy use and other costs before and after the installation of the energy efficiency measures, adjusted for changes that affect energy use and other costs but are not caused by the energy efficiency measures.
For projects involving the construction of a small-scale renewable energy plant that we own and operate, we enter into long-term contracts to supply the electricity, processed LFG, heat or cooling generated by the plant to the customer, which is typically a utility, municipality, industrial facility or other large purchaser of energy. The rights to use the site for the plant and purchase of renewable fuel for the plant are also obtained by us under long-term agreements with terms at least as long as the associated output supply agreement. Our supply agreements typically provide for fixed prices or prices that escalate at a fixed rate or vary based on a market benchmark. See “We may assume responsibility under customer contracts for factors outside our control, including, in connection with some customer projects, the risk that fuel prices will increase” in Item 1A, Risk Factors in this Annual Report on Form 10-K.
Project Financing
To finance projects with federal governmental agencies, we typically sell to third-party lenders our right to receive a portion of the long-term payments from the customer arising out of the project for a purchase price reflecting a discount to the aggregate amount due from the customer. The purchase price is generally advanced to us over the implementation period based on completed work or a schedule predetermined to coincide with the construction of the project. Under the terms of these financing arrangements, we are required to complete the construction or installation of the project in accordance with the contract with our customer, and the liability remains on our consolidated balance sheet until the completed project is accepted by the customer. Once the completed project is accepted by the customer, the financing is treated as a true sale and the related receivable and financing liability are removed from our consolidated balance sheet.
Institutional customers, such as state, provincial and local governments, schools and public housing authorities, typically finance their energy efficiency and renewable energy projects through either tax-exempt leases or issuances of municipal bonds. We assist in the structuring of such third-party financing.
In some instances, customers prefer that we retain ownership of the renewable energy plants and related project assets that we construct for them. In these projects, we typically enter into a long-term supply agreement to furnish electricity, gas, heat or cooling to the customer’s facility. To finance the significant upfront capital costs required to develop and construct the plant, we rely either on our internal cash flow or, in some cases, third-party debt. For project financing by third-party lenders, we typically establish a separate subsidiary, usually a limited liability company, to own the project assets and related contracts. The subsidiary contracts with us for construction and operation of the project and enters into a financing agreement directly with the lenders. Additionally, we will provide assurance to the lender that the project will achieve commercial operation. Although the financing is secured by the assets of the subsidiary and a pledge of our equity interests in the subsidiary, and is non-recourse to Ameresco, Inc., we may from time to time determine to provide financial support to the subsidiary in order to maintain rights to the project or otherwise avoid the adverse consequences of a default. The amount of such financing is included on our consolidated balance sheet.
Effects of Seasonality
We are subject to seasonal fluctuations and construction cycles, particularly in climates that experience colder weather during the winter months, such as the northern United States and Canada, or at educational institutions, where large projects are typically carried out during summer months when their facilities are unoccupied. In addition, government customers, many of which have fiscal years that do not coincide with ours, typically follow annual procurement cycles and appropriate funds on a fiscal-year basis even though contract performance may take more than one year. Further, government contracting cycles can be affected by the timing of, and delays in, the legislative process related to government programs and incentives that help drive demand for energy efficiency and renewable energy projects. As a result, our revenues and operating income in the third and
27
fourth quarter are typically higher, and our revenues and operating income in the first quarter are typically lower, than in other quarters of the year. As a result of such fluctuations, we may occasionally experience declines in revenues or earnings as compared to the immediately preceding quarter, and comparisons of our operating results on a period-to-period basis may not be meaningful.
Our annual and quarterly financial results are also subject to significant fluctuations as a result of other factors, many of which are outside our control. See “Our operating results may fluctuate significantly from quarter to quarter and may fall below expectations in any particular fiscal quarter” in Item 1A, Risk Factors in this Annual Report on Form 10-K.
Backlog and Awarded Projects
Total construction backlog represents projects that are active within our ESPC sales cycle. Our sales cycle begins with the initial contact with the customer and ends, when successful, with a signed contract, also referred to as fully-contracted backlog. Our sales cycle recently has been averaging
18
to
42
months. Awarded backlog is created when a potential customer awards a project to Ameresco following a request for proposal. Once a project is awarded but not yet contracted, we typically conduct a detailed energy audit to determine the scope of the project as well as identify the savings that may be expected to be generated from upgrading the customer’s energy infrastructure. At this point, we also determine the sub-contractor, what equipment will be used, and assist in arranging for third party financing, as applicable. Recently, awarded projects have been taking
12
to
18
months to result in a signed contract and thus convert to fully-contracted backlog. It may take longer, however, depending upon the size and complexity of the project. Historically, approximately 90% of our awarded projects ultimately have resulted in a signed contract. After the customer and Ameresco agree to the terms of the contract and the contract becomes executed, the project moves to fully-contracted backlog. The contracts reflected in our fully-contracted backlog typically have a construction period of
12
to
24
months and we typically expect to recognize revenue for such contracts over the same period. Fully-contracted backlog begins converting into revenues generated from backlog on a percentage-of-completion basis once construction has commenced. See “We may not recognize all revenues from our backlog or receive all payments anticipated under awarded projects and customer contracts” and “In order to secure contracts for new projects, we typically face a long and variable selling cycle that requires significant resource commitments and requires a long lead time before we realize revenues” in Item 1A, Risk Factors in this Annual Report on Form 10-K.
As of
December 31, 2016
, we had backlog of approximately
$534.1 million
in expected future revenues under signed customer contracts for the installation or construction of projects; and we also had been awarded projects for which we had not yet signed customer contracts with estimated total future revenues of an additional
$957.6 million
. As of
December 31, 2015
, we had fully-contracted backlog of approximately
$390.4 million
in future revenues under signed customer contracts for the installation or construction of projects; and we also had been awarded projects for which we had not yet signed customer contracts with estimated total future revenues of an additional
$955.8 million
. As of
December 31, 2014
, we had backlog of approximately
$386.2 million
in expected future revenues under signed customer contracts for the installation or construction of projects; and we also had been awarded projects for which we had not yet signed customer contracts with estimated total future revenues of an additional
$853.8 million
.
We define our 12-month backlog as the estimated amount of revenues that we expect to recognize in the next twelve months from our fully-contracted backlog. As of
December 31, 2016
and
2015
, our 12-month backlog was
$309.6 million
and
$310.8 million
, respectively.
Assets in development, which represents the potential design/build project value of small-scale renewable energy plants that have been awarded or for which we have secured development rights, was
$228.3 million
and
$168.9 million
as of
December 31, 2016
and
2015
, respectively.
Financial Operations Overview
Revenues
We derive revenues principally from energy efficiency projects, which entails the design, engineering and installation of equipment and other measures that incorporate a range of innovative technology and techniques to improve the efficiency and control the operation of a facility’s energy infrastructure; this can include designing and constructing for a customer a central plant or cogeneration system providing power, heat and/or cooling to a building, or other small-scale plant that produces electricity, gas, heat or cooling from renewable sources of energy. We also derive revenue from: long-term O&M contracts; energy supply contracts for renewable energy operating assets that we own; integrated-PV; and consulting and enterprise energy management services.
28
Historically, including for the years ended
December 31, 2016
,
2015
and
2014
, approximately 75% of our revenues have been derived from federal, state, provincial or local government entities, including public housing authorities and public universities.
Cost of Revenues and Gross Margin
Cost of revenues include the cost of labor, materials, equipment, subcontracting and outside engineering that are required for the development and installation of our projects, as well as pre-construction costs, sales incentives, associated travel, inventory obsolescence charges, amortization of intangible assets related to customer contracts, and, if applicable, costs of procuring financing. A majority of our contracts have fixed price terms; however, in some cases we negotiate protections, such as a cost-plus structure, to mitigate the risk of rising prices for materials, services and equipment.
Cost of revenues also include costs for the small-scale renewable energy plants that we own, including the cost of fuel (if any) and depreciation charges.
As a result of certain acquisitions, we have intangible assets related to customer contracts; these are amortized over a period of approximately one to five years from the respective date of acquisition. This amortization is recorded as a cost of revenues in the consolidated statements of income (loss). Amortization expense for the years ended
December 31, 2016
and
2015
related to customer contracts was
$0.2 million
and
$0.9 million
, respectively.
Gross margin, which is gross profit as a percent of revenues, is affected by a number of factors, including the type of services performed. Renewable energy projects that we own and operate typically have higher margins than energy efficiency projects, and sales in the United States typically have higher margins than in Canada due to the typical mix of products and services that we sell there.
In addition, gross margin frequently varies across the construction period of a project. Our expected gross margin on, and expected revenues for, a project are based on budgeted costs. From time to time, a portion of the contingencies reflected in budgeted costs are not incurred due to strong execution performance. In that case, and generally at project completion, we recognize revenues for which there is no further corresponding cost of revenues. As a result, gross margin tends to be back-loaded for projects with strong execution performance; this explains the gross margin improvement that occurs from time to time at project closeout. We refer to this gross margin improvement at the time of project completion as a project closeout.
Selling, General and Administrative Expenses
Selling, general and administrative expenses include salaries and benefits, project development costs, and general and administrative expenses not directly related to the development or installation of projects.
Salaries and benefits.
Salaries and benefits consist primarily of expenses for personnel not directly engaged in specific project or revenue generating activity. These expenses include the time of executive management, legal, finance, accounting, human resources, information technology and other staff not utilized in a particular project. We employ a comprehensive time card system which creates a contemporaneous record of the actual time by employees on project activity.
Project development costs.
Project development costs consist primarily of sales, engineering, legal, finance and third-party expenses directly related to the development of a specific customer opportunity. This also includes associated travel and marketing expenses.
General and administrative expenses.
These expenses consist primarily of rents and occupancy, professional services, insurance, unallocated travel expenses, telecommunications, office expenses and amortization of intangible assets not related to customer contracts. Professional services consist principally of recruiting costs, external legal, audit, tax and other consulting services. For the years ended
December 31, 2016
and
2015
, we recorded amortization expense of
$2.2 million
and
$3.2 million
, respectively, related to customer relationships, non-compete agreements, technology and trade names. Amortization expense related to these intangible assets is included in selling, general and administrative expenses in the consolidated statements of income (loss). For the year ended
December 31, 2016
we recorded $6.2 million in restructuring charges which consisted primarily of bad debt expense in our Canada segment, and a reserve for certain amounts receivable from a customer who declared bankruptcy. For the year ended
December 31, 2015
, we recorded $6.6 million in restructuring charges which consisted primarily of severance charges and bad debt expense in our Canada segment and software group.
29
Other Expenses, Net
Other expenses, net includes gains and losses from derivatives, interest income and expenses, amortization of deferred financing costs, net and foreign currency transaction gains and losses. Interest expense will vary periodically depending on the amounts drawn on our revolving senior secured credit facility and the prevailing short-term interest rates.
Provision or Benefit for Income Taxes
The provision or benefit for income taxes is based on various rates set by federal and local authorities and is affected by permanent and temporary differences between financial accounting and tax reporting requirements.
Critical Accounting Policies and Estimates
This discussion and analysis of our financial condition and results of operations is based upon our consolidated financial statements, which have been prepared in accordance with accounting principles generally accepted in the United States. The preparation of these consolidated financial statements requires management to make estimates and assumptions that affect the reported amounts of assets, liabilities, revenues, expense and related disclosures. The most significant estimates with regard to these consolidated financial statements relate to estimates of final contract profit in accordance with long-term contracts, project development costs, project assets, impairment of goodwill, impairment of long-lived assets, fair value of derivative financial instruments, income taxes and stock-based compensation expense. Such estimates and assumptions are based on historical experience and on various other factors that management believes to be reasonable under the circumstances. Estimates and assumptions are made on an ongoing basis, and accordingly, the actual results may differ from these estimates under different assumptions or conditions.
The following are critical accounting policies that, among others, affect our more significant judgments and estimates used in the preparation of our consolidated financial statements.
Revenue Recognition
For each arrangement we have with a customer, we typically provide a combination of one or more of the following services or products:
|
•
|
installation or construction of energy efficiency measures, facility upgrades and/or a renewable energy plant to be owned by the customer;
|
|
•
|
sale and delivery, under long-term agreements, of electricity, gas, heat, chilled water or other output of a renewable energy or central plant that we own and operate;
|
|
•
|
sale and delivery of PV equipment and other renewable energy products for which we are a distributor, whether under our own brand name or for others;
|
|
•
|
O&M services provided under long-term O&M agreements; and
|
|
•
|
enterprise energy management and consulting services.
|
Often, we will sell a combination of these services and products in a bundled arrangement. We divide bundled arrangements into separate deliverables and revenue is allocated to each deliverable based on the relative selling price. The relative selling price is determined using third party evidence or management’s best estimate of selling price.
We recognize revenues from the installation or construction of a project on a percentage-of-completion basis. The percentage-of-completion for each project is determined on an actual cost-to-estimated final cost basis. In accordance with industry practice, we include in current assets and liabilities the amounts of receivables related to construction projects that are payable over a period in excess of one year. We recognize revenues associated with contract change orders only when the authorization for the change order has been properly executed and the work has been performed.
When the estimate on a contract indicates a loss, or claims against costs incurred reduce the likelihood of recoverability of such costs, our policy is to record the entire expected loss immediately, regardless of the percentage of completion.
Deferred revenue represents circumstances where (i) there has been a receipt of cash from the customer for work or services that have yet to be performed, (ii) receipt of cash where the product or service may not have been accepted by the customer or (iii) when all other revenue recognition criteria have been met, but an estimate of the final total cost cannot be determined. Deferred revenue will vary depending on the timing and amount of cash receipts from customers and can vary
30
significantly depending on specific contractual terms. As a result, deferred revenue is likely to fluctuate from period to period. Unbilled revenue, presented as costs and estimated earnings in excess of billings, represent amounts earned and billable that were not invoiced at the end of the fiscal period.
We recognize revenues from the sale and delivery of products, including the output of our renewable energy plants, when produced and delivered to the customer, in accordance with the specific contract terms, provided that persuasive evidence of an arrangement exists, our price to the customer is fixed or determinable and collectability is reasonably assured.
We recognize revenues from O&M contracts, consulting services and enterprise energy management services as the related services are performed.
For a limited number of contracts under which we receive additional revenue based on a share of energy savings, we recognize such additional revenue as energy savings are generated.
Project Development Costs
We capitalize as project development costs only those costs incurred in connection with the development of energy efficiency and renewable energy projects, primarily direct labor, interest costs, outside contractor services, consulting fees, legal fees and associated travel, if incurred after a point in time when the realization of related revenue becomes probable. Project development costs incurred prior to the probable realization of revenues are expensed as incurred.
Project Assets
We capitalize interest costs relating to construction financing during the period of construction. The interest capitalized is included in the total cost of the project at completion. The amount of interest capitalized for the years ended
December 31,
2016
,
2015
and
2014
was
$1.3 million
, $
0.9 million
and
$0.5 million
, respectively.
Routine maintenance costs are expensed in the current year’s consolidated statements of income (loss) to the extent that they do not extend the life of the asset. Major maintenance, upgrades and overhauls are required for certain components of our assets. In these instances, the costs associated with these upgrades are capitalized and are depreciated over the shorter of the life of the asset or until the next required major maintenance or overhaul period. Gains or losses on disposal of property and equipment are reflected in selling, general and administrative expenses in the consolidated statements of income (loss).
We evaluate our long-lived assets for impairment as events or changes in circumstances indicate the carrying value of these assets may not be fully recoverable. Should an assessment be performed or triggering event identified, we evaluate recoverability of long-lived assets to be held and used by estimating the undiscounted future cash flows before interest associated with the expected uses and eventual disposition of those assets. When these comparisons indicate that the carrying value of those assets is greater than the undiscounted cash flows, we recognize an impairment loss for the amount that the carrying value exceeds the fair value.
Impairment of Goodwill and Intangible Assets
We apply accounting standards codification (“ASC”) 350,
Intangibles-Goodwill and Other
, in accounting for the valuation of goodwill and identifiable intangible assets. We have selected December 31 as our annual goodwill impairment review date.
Goodwill represents the excess of cost over the fair value of net tangible and identifiable intangible assets of businesses acquired. We assess the impairment of goodwill and intangible assets with indefinite lives on an annual basis and whenever events or changes in circumstances indicate that the carrying value of the asset may not be recoverable. We would record an impairment charge if such an assessment were to indicate that, more likely than not, the fair value of such assets was less than their carrying values. Judgment is required in determining whether an event has occurred that may impair the value of goodwill or identifiable intangible assets. Factors that could indicate that an impairment may exist include significant underperformance relative to plan or long-term projections, significant changes in business strategy, significant negative industry or economic trends or a significant decline in the base stock price of our public competitors for a sustained period of time. When changes occur in the composition of one or more reporting units, the goodwill is reassigned to the reporting units affected based on their relative fair values.
The first step, or Step 1, of the goodwill impairment test, used to identify potential impairment, compares the fair value of the equity with its carrying amount, including goodwill. If the fair value of the equity exceeds its carrying amount, goodwill of the reporting unit is considered not impaired, thus the second step of the impairment test is unnecessary. If the carrying
31
amount of a reporting unit exceeds its fair value, or the carrying amount of a reporting unit is negative, the second step of the goodwill impairment test shall be performed to measure the amount of impairment loss, if any.
We completed the Step 1 test using both an income approach and a market approach. The discounted cash flow method was used to measure the fair value of our equity under the income approach. A terminal value utilizing a constant growth rate of cash flows was used to calculate a terminal value after the explicit projection period. Determining the fair value using a discounted cash flow method requires that we make significant estimates and assumptions, including long-term projections of cash flows, market conditions and appropriate discount rates. Our judgments are based upon historical experience, current market trends, pipeline for future sales and other information. While we believe that the estimates and assumptions underlying the valuation methodology are reasonable, different estimates and assumptions could result in a different outcome. In estimating future cash flows, we rely on internally generated projections for a defined time period for sales and operating profits, including capital expenditures, changes in net working capital and adjustments for non-cash items to arrive at the free cash flow available to invested capital.
Under the market approach, we estimate the fair value based on market multiples of revenue and earnings of comparable publicly traded companies and comparable transactions of similar companies. The estimates and assumptions used in our calculations include revenue growth rates, expense growth rates, expected capital expenditures to determine projected cash flows, expected tax rates and an estimated discount rate to determine present value of expected cash flows. These estimates are based on historical experiences, our projections of future operating activity and our weighted-average cost of capital.
Separable intangible assets that are not deemed to have indefinite lives are amortized over their useful lives. We annually assess whether a change in the life over which our intangible assets are amortized is necessary or more frequently if events or circumstances warrant. We review all amortizable intangible assets for impairment whenever events or changes in circumstances indicate the carrying amount of such assets may not be recoverable. Recoverability of these assets is determined by comparing the forecasted undiscounted net cash flows of the operation to which the assets relate to their carrying amount. If the operation is determined to be unable to recover the carrying amount of its assets, then intangible assets are written down first, followed by the other long-lived assets of the operation, to fair value. Fair value is determined based on discounted cash flows or appraised values, depending upon the nature of the assets.
If we determine that an impairment has occurred, we will record a write-down of the carrying value and charge the impairment as an operating expense in the period the determination is made. Although we believe goodwill and intangible assets are appropriately stated in our consolidated financial statements, changes in strategy or market conditions could significantly impact these judgments and require an adjustment to the recorded balance.
Based on our goodwill impairment assessment, all of our reporting units with goodwill had estimated fair values as of
December 31, 2016
that exceeded their carrying values by at least
13%
, with the exception of our Southwest reporting unit, a member of the U.S. Regions segment, which had a fair value that exceeded its carrying value by
9%
. This reporting unit had goodwill of
$16,829
at
December 31, 2016
. Based on our goodwill impairment assessment, all of our reporting units with goodwill had estimated fair values as of
December 31, 2016
that exceeded their carrying value. Based on our goodwill impairment assessment, all of our reporting units with goodwill had estimated fair values as of
December 31, 2015
that exceeded their carrying values by at least
13%
, with the exception of our Integrated-PV reporting unit which had a fair value that exceeded its carrying value by
5%
. This reporting unit had goodwill of
$7.6 million
at
December 31, 2015
.
We performed a Step 1 test at our
December 31,
2016
,
2015
and
2014
annual testing dates, and concluded that Step 1 was passed as the fair value of the enterprise value exceeded the carrying value of the enterprise value for all reporting units. However, during the course of our valuation analysis we determined that although the fair value of our Canada reporting unit exceeded the carrying amount of this reporting unit, as of
December 31, 2016
and
December 31, 2015
, the carrying value of our Canada reporting unit was negative. This determination, combined with qualitative considerations, prompted the performance of the Step 2 test as prescribed under ASC 350, recognizing and measuring the amount of the impairment loss, if any. Step 2 of the goodwill impairment test compares the implied fair value of the reporting unit’s goodwill with the carrying amount of the goodwill. The fair value of this goodwill can only be measured as a residual after the entity assigns the fair value of the reporting unit to all the assets and liabilities of that reporting unit, including any unrecognized intangible assets as if the reporting unit had been acquired in a business combination. The implied fair value of the goodwill of our Canada reporting unit exceeded the carrying value of that goodwill and as a result, no impairment of goodwill has been identified.
32
Impairment of Long-Lived Assets
We use the guidance prescribed in ASC 360,
Property, Plant and Equipment
, for the proper testing and valuation methodology to ensure we record any impairment when the carrying amount of a long-lived asset is not recoverable equivalent to an amount equal to its fair market value.
We review long-lived asset groups for potential impairment whenever events or changes in circumstances indicate that the carrying amount of the assets may not be fully recoverable or that the useful lives of these assets are no longer appropriate. Examples of such triggering events applicable to our asset groups include a significant decrease in the market price of a long-lived asset group or a current-period operating or cash flow loss combined with a history of operating or cash flow losses or a projection or forecast that demonstrates continuing losses associated with the use of a long-lived asset group.
Should an asset group be identified as potentially impaired based on the defined criteria, an impairment test is performed that includes a comparison of the estimated undiscounted cash flows of the asset as compared to the recorded value of the asset. If these estimates or their related assumptions change in the future, an impairment charge may be required against these assets in the reporting period in which the impairment is determined.
Derivative Financial Instruments
We account for our interest rate swaps as derivative financial instruments. As required under GAAP, derivatives are carried on our consolidated balance sheets at fair value. The fair value of our interest rate swaps is determined based on observable market data in combination with expected cash flows for each instrument.
We follow the guidance which expands the disclosure requirements for derivative instruments and hedging activities.
In the normal course of business, we utilize derivative contracts as part of our risk management strategy to manage exposure to market fluctuations in interest rates. These instruments are subject to various credit and market risks. Controls and monitoring procedures for these instruments have been established and are routinely reevaluated. Credit risk represents the potential loss that may occur because a party to a transaction fails to perform according to the terms of the contract. The measure of credit exposure is the replacement cost of contracts with a positive fair value. We seek to manage credit risk by entering into financial instrument transactions only through counterparties that we believe to be creditworthy. Market risk represents the potential loss due to the decrease in the value of a financial instrument caused primarily by changes in interest rates. We seek to manage market risk by establishing and monitoring limits on the types and degree of risk that may be undertaken. As a matter of policy, we do not use derivatives for speculative purposes.
We are exposed to interest rate risk through our borrowing activities. A portion of our project financing includes four credit facilities, both project related and corporate, that utilize a variable rate swap instrument.
|
•
|
Prior to December 31, 2009, we entered into two interest rate swap contracts under which we agreed to pay an amount equal to a specified fixed rate of interest times a notional principal amount, and to, in turn, receive an amount equal to a specified variable rate of interest times the same notional principal amount. The first swap covers an initial notional amount of $3.3 million variable rate note at a fixed interest rate of 5.3%, with an effective date of February 28, 2006, and expires in February 2021. The second swap covers an initial notional amount of $13.1 million variable rate note at a fixed interest rate of 5.4%, with an effective date of September 30, 2008, and expires in March 2024.
|
|
•
|
In March 2010, we entered into a 14-year interest rate swap contract under which we agreed to pay an amount equal to a specified fixed rate of interest times a notional principal amount, and to in turn receive an amount equal to a specified variable rate of interest times the same notional principal amount. The swap covers an initial notional amount of $27.9 million variable rate note at a fixed interest rate of 3.7%, with an effective date of March 11, 2010, and expires in December 2024.
|
|
•
|
In July 2011, we entered into a
five
-year interest rate swap contract under which we agreed to pay an amount equal to a specified fixed rate of interest times a notional principal amount, and to in turn receive an amount equal to a specified variable rate of interest times the same notional principal amount. The swap covered an initial notional amount of
$38.6 million
variable rate note at a fixed interest rate of
2.0%
and expired in June 2016. This interest rate swap was designated as a hedge since inception.
|
|
•
|
In October 2012, and in connection with a construction and term loan, we entered into two eight-year interest rate swap contracts under which we agreed to pay an amount equal to a specified fixed rate of interest times a notional principal amount, and to in turn receive an amount equal to a specified variable rate of interest times the same notional
|
33
principal amount. The swaps have an initial notional amount of $16.8 million, which increased to $42.2 million on September 30, 2013, at a fixed rate of 1.7%, and expires in March 2020.
|
•
|
In October 2012, we also entered into two eight-year forward starting interest rate swap contracts under which the Company agreed to pay an amount equal to specified fixed rate of interest times a notional amount, and to in turn receive an amount equal to a specified variable rate of interest times the same notional principal amount. The swaps cover an initial notional amount of
$25.4 million
variable rate note at a fixed interest rate of
3.7%
, with an effective date of March 31, 2020, and expires in June 2028.
|
|
•
|
In September 2015, we entered into a seven-year forward starting interest rate swap contract under which we agreed to pay an amount equal to a specified fixed rate of interest times a notional amount, and to in turn receive an amount equal to a specified variable rate of interest times the same notional principal amount. The swap covers an initial notional amount of
$20.7 million
variable rate note at a fixed interest rate of
2.2%
, with an effective date of February 29, 2016, and expires in February 2023. This interest rate swap has been designated as a hedge since inception.
|
|
•
|
In September 2015, we also also entered into a fifteen-year forward starting interest rate swap contract under which we agreed to pay an amount equal to a specified fixed rate of interest times a notional amount, and to in turn receive an amount equal to a specified variable rate of interest times the same notional principal amount. The swap covers an initial notional amount of
$14.1 million
variable rate note at a fixed interest rate of
3.3%
, with an effective date of February 28, 2023, and expires in December 2038. This interest rate swap has been designated as a hedge since inception.
|
We entered into each of the interest rate swap contracts as an economic hedge.
We recognize all derivatives in our consolidated financial statements at fair value.
The interest rate swaps that we entered into prior to December 31, 2009 qualified, but were not designated as cash flow hedges until April 1, 2010. Accordingly, any changes in fair value through March 31, 2010 were reported in other expenses, net in our consolidated statements of income (loss) at fair value, and in the consolidated statements of comprehensive income (loss) thereafter. Cash flows from these derivative instruments are reported as operating activities on the consolidated statements of cash flows.
The interest rate swap that we entered into in March 2010 was a floating-to-fixed interest rate swap. This swap was designated as a hedge in March 2013. During the second quarter of 2014, this swap was de-designated and re-designated as a hedge as a result of a partial pay down of the associated hedged debt principal. As a result
$566
was reclassified from accumulated other comprehensive loss and recorded as a reduction to other expenses, net in our consolidated statements of income (loss) during the second quarter of 2014.
The interest rate swaps that we entered into during 2011, 2012 and 2015 qualify, and have been designated, as cash flow hedges.
We recognize the fair value of derivative instruments designated as hedges in our consolidated balance sheets and any changes in the fair value are recorded as adjustments to other comprehensive income (loss).
Income Taxes
We provide for income taxes based on the liability method. We provide for deferred income taxes based on the expected future tax consequences of differences between the financial statement basis and the tax basis of assets and liabilities calculated using the enacted tax rates in effect for the year in which the differences are expected to be reflected in the tax return.
We account for uncertain tax positions using a “more-likely-than-not” threshold for recognizing and resolving uncertain tax positions. The evaluation of uncertain tax positions is based on factors that include, but are not limited to, changes in tax law, the measurement of tax positions taken or expected to be taken in tax returns, the effective settlement of matters subject to audit, new audit activity and changes in facts or circumstances related to a tax position. We evaluate uncertain tax positions on a quarterly basis and adjust the level of the liability to reflect any subsequent changes in the relevant facts surrounding the uncertain positions. Our liabilities for an uncertain tax position can be relieved only if the contingency becomes legally extinguished through either payment to the taxing authority or the expiration of the statute of limitations, the recognition of the benefits associated with the position meet the “more-likely-than-not” threshold or the liability becomes effectively settled through the examination process. We consider matters to be effectively settled once: the taxing authority has completed all of its
34
required or expected examination procedures, including all appeals and administrative reviews; we have no plans to appeal or litigate any aspect of the tax position and we believe that it is highly unlikely that the taxing authority would examine or re-examine the related tax position. We also accrue for potential interest and penalties, related to unrecognized tax benefits in income tax expense.
In November 2015, the FASB issued ASU 2015-17, which simplifies the presentation of deferred income taxes. We elected to early adopt ASU 2015-17 retrospectively in the fourth quarter of 2015. As a result, we have presented all deferred tax assets and liabilities as noncurrent on our consolidated balance sheet as of December 31, 2016 and 2015, respectively.
Stock-Based Compensation Expense
Our stock-based compensation expense results from the issuances of shares of restricted common stock and grants of stock options to employees, directors, outside consultants and others. We recognize the costs associated with option grants using the fair value recognition provisions of ASC 718,
Compensation — Stock Compensation
. Generally, ASC 718 requires the value of all stock-based payments to be recognized in the statement of operations based on their estimated fair value at date of grant amortized over the grants’ respective vesting periods. For the years ended December 31,
2016
,
2015
and
2014
, we recorded stock-based compensation expense of approximately
$1.5 million
,
$1.8 million
, and
$2.5 million
, respectively, in connection with stock-based payment awards. The compensation expense is allocated between cost of revenues and selling, general and administrative expenses in the accompanying consolidated statements of income (loss) based on the salaries and work assignments of the employees holding the options.
Stock Option Grants
We have granted stock options to certain employees and directors under our 2010 stock incentive plan and at December 31,
2016
,
7,409,802
shares were available for grant under that plan. We have also granted stock options to certain employees and directors under our 2000 stock incentive plan; however, we will grant no further stock options or restricted stock awards under that plan.
Stock options issued under our 2000 stock incentive plan generally expire if not exercised within ten years after the grant date. Under the terms of our 2010 stock incentive plan, all options expire if not exercised within ten years after the grant date. Historically, options generally provided for vesting over five years, with 20% vesting at the end of the first year and five percent vesting every three months beginning one year after the grant date. During 2011, we began awarding options generally providing for vesting over five years, with 20% vesting on each of the first five anniversaries of the grant date. If the employee ceases to be employed for any reason before vested options have been exercised, the employee generally has three months to exercise vested options or they are forfeited. Certain option grants have performance conditions that must be achieved prior to vesting and are expensed based on the expected achievement at each reporting period.
We follow the fair value recognition provisions of ASC 718 requiring that all stock-based payments to employees, including grants of employee stock options and modifications to existing stock options, be recognized in the consolidated statements of income (loss) based on their fair values, using the prospective-transition method.
We use the Black-Scholes option pricing model to determine the weighted-average fair value of options granted and record stock-based compensation expense utilizing the straight-line method.
The determination of the fair value of stock-based payment awards utilizing the Black-Scholes model is affected by the stock price and a number of assumptions, including expected volatility, expected life, risk-free interest rate and expected dividends. The following table sets forth the significant assumptions used in the model during
2016
,
2015
and
2014
:
|
|
Year Ended December 31,
|
|||||
|
|
2016
|
2015
|
2014
|
|||
|
Expected dividend yield
|
—%
|
—%
|
—%
|
|||
|
Risk-free interest rate
|
1.16%-1.77%
|
1.53%-2.01%
|
1.93%-2.01%
|
|||
|
Expected volatility
|
46%-49%
|
44%-49%
|
50%-52%
|
|||
|
Expected life
|
6.5-10 years
|
5.0-6.5 years
|
6.5 years
|
|||
We will continue to use our judgment in evaluating the expected term, volatility and forfeiture rate related to our own stock-based compensation on a prospective basis, and incorporating these factors into the Black-Scholes pricing model. Higher volatility and longer expected lives result in an increase to stock-based compensation expense determined at the date of grant.
35
In addition, any changes in the estimated forfeiture rate can have a significant effect on reported stock-based compensation expense, as the cumulative effect of adjusting the rate for all expense amortization is recognized in the period that the forfeiture estimate is changed. If a revised forfeiture rate is higher than the previously estimated forfeiture rate, an adjustment is made that will result in a decrease to the stock-based compensation expense recognized in our consolidated financial statements. If a revised forfeiture rate is lower than the previously estimated rate, an adjustment is made that will result in an increase to the stock-based compensation expense recognized in our consolidated financial statements. These expenses will affect our cost of revenues as well as our selling, general and administrative expenses.
As of December 31,
2016
, we had
$3.0 million
of total unrecognized stock-based compensation expense related to employee and director stock options. We expect to recognize this cost over a weighted-average period of
2.7
years after December 31,
2016
. The allocation of this expense between cost of revenues and selling, general and administrative expenses will depend on the salaries and work assignments of the personnel holding these options.
Recent Accounting Pronouncements
In May 2014, the Financial Accounting Standards Board (“FASB”) issued Accounting Standards Update (“ASU”) 2014-09, Revenue from Contracts with Customers (Topic 606). The guidance in this ASU affects any entity that either enters into contracts with customers to transfer goods or services or enters into contracts for the transfer of nonfinancial assets unless those contracts are within the scope of other standards. The guidance in this ASU supersedes the revenue recognition requirements in ASC 605, Revenue Recognition, and most industry-specific guidance throughout the Industry Topics of the Codification. This ASU also supersedes some cost guidance included in ASC 605-35, Revenue Recognition-Construction-Type and Production-Type Contracts. In addition, the existing requirements for the recognition of a gain or loss on the transfer of nonfinancial assets that are not in a contract with a customer are amended to be consistent with the guidance on recognition and measurement in this ASU. The FASB has approved a one year deferral of this standard, and this pronouncement is now effective for annual reporting periods beginning after December 15, 2017. Entities would be permitted to adopt the standard as early as the original public entity effective date (i.e., annual reporting periods beginning after December 15, 2016 and interim periods therein). Early adoption prior to that date would not be permitted. Retrospective application of the amendments in this ASU is required. The new guidance must be adopted using either a full retrospective approach for all periods presented in the period of adoption (with some limited relief provided) or a modified retrospective approach. We are currently assessing the impact of this ASU on our consolidated financial statements. We expect to have our preliminary evaluation, including the selection of an adoption method, completed by the end of the first half of 2017. We are not planning on early adopting and currently expect to adopt the new revenue recognition guidance in the first quarter of 2018. We do not currently expect this guidance to have a material impact on our consolidated financial position or results of operations based on the evaluation of our current contracts and revenue streams, most will be recorded consistently under both the current and new standard. The FASB has issued, and may issue in the future, interpretive guidance which may cause our evaluation to change.
In August 2014, the FASB issued ASU 2014-15, Presentation of Financial Statements — Going Concern (Subtopic 205-40) (“ASU 2014-15”). ASU 2014-15 requires management to assess an entity’s ability to continue as a going concern by incorporating and expanding upon certain principles of current U.S. auditing standards. Specifically, the amendments (1) provide a definition of the term “substantial doubt”, (2) require an evaluation every reporting period, including interim periods, (3) provide principles for considering the mitigating effect of management’s plans, (4) require certain disclosures when substantial doubt is alleviated as a result of consideration of management’s plans, (5) require an express statement and other disclosures when substantial doubt is still present, and (6) require an assessment for a period of one year after the date that the financial statements are issued (or available to be issued). ASU 2014-15 is effective for annual reporting periods ending after December 15, 2016 and interim periods thereafter. We adopted ASU 2014-15 as of December 31, 2016, and the adoption did not have an impact on our going concern conclusions.
In February 2015, the FASB issued ASU 2015-02, Consolidation (Topic 810): Amendments to the Consolidation Analysis (“ASU 2015-02”). ASU 2015-02 affects reporting entities that are required to evaluate whether they should consolidate certain legal entities. ASU 2015-02 is effective for annual reporting periods beginning after December 15, 2015 and interim periods within those annual reporting periods. We adopted this guidance in the first quarter of fiscal 2016. This pronouncement did not change our previous consolidation conclusions, and thus did not have an impact on our consolidated financial statements.
In April 2015, the FASB issued ASU 2015-03, Interest — Imputation of Interest (Subtopic 835-03): Simplifying the Presentation of Debt Issuance Costs (“ASU 2015-03”). ASU 2015-03 requires debt issuance costs related to a recognized debt liability to be presented in the balance sheet as a direct deduction from the debt liability rather than as an asset. ASU 2015-03 is effective for annual reporting periods beginning after December 15, 2015, and interim periods within those annual reporting
36
periods. We adopted this accounting standard effective in the first quarter of fiscal 2016. As such, prior periods in our financial statements were retrospectively adjusted.
In November 2015, the FASB issued ASU 2015-17, Income Taxes (Topic 740): Balance Sheet Classification of Deferred Taxes (“ASU 2015-17”), which simplifies the presentation of deferred income taxes. ASU 2015-17 requires that deferred tax assets and liabilities be classified as noncurrent in a classified statement of financial position. ASU 2015-17 is effective for financial statements issued for fiscal years beginning after December 15, 2016 (and interim periods within those fiscal years) with early adoption permitted. ASU 2015-17 may be either applied prospectively to all deferred tax assets and liabilities or retrospectively to all periods presented. We elected to early adopt ASU 2015-17 retrospectively in the fourth quarter of 2015. As a result, we have presented all deferred tax assets and liabilities as noncurrent on our consolidated balance sheet as of December 31, 2016 and 2015, respectively.
In February 2016, the FASB issued ASU 2016-02, Leases (Topic 842). The guidance in this ASU supersedes the leasing guidance in Topic 840, Leases. Under the new guidance, lessees are required to recognize lease assets and lease liabilities on the balance sheet for all leases with terms longer than 12 months. Leases will be classified as either finance or operating, with classification affecting the pattern of expense recognition in the income statement. ASU 2016-02 is effective for fiscal years beginning after December 15, 2018, including interim periods within those fiscal years. We are currently evaluating the impact of our pending adoption of the new standard on our consolidated financial statements.
In March 2016, the FASB issued ASU No. 2016-09, Compensation-Stock Compensation-Improvements to Employee Share-Based Payment Accounting (“ASU 2016-09”). The guidance in this ASU involves several aspects of the accounting for share-based payment transactions, including the income tax consequences, classification of awards as either equity or liabilities, and classification on the statement of cash flows. Under ASU 2016-09, income tax benefits and deficiencies are to be recognized as income tax expense or benefit in the statement of operations and the tax effects of exercised or vested awards should be treated as discrete items in the reporting period in which they occur. Additionally, under ASU 2016-09, excess tax benefits should be classified along with other income tax cash flows as an operating activity. ASU 2016-09 will be effective for us on January 1, 2017, with early adoption permitted. Upon adoption of this standard as of January 1, 2017, we estimate we will record a
$4.0 million
deferred tax asset and a corresponding credit to retained earnings for excess tax benefits that had not previously been recognized because the related tax deductions had not reduced taxes payable. We will not change our accounting policy in regards to forfeitures.
In January 2017, the FASB issued ASU No. 2017-04, Intangibles—Goodwill and Other (Topic 350): Simplifying the Test for Goodwill Impairment (“ASU 2017-04”). Under the new guidance, a reporting entity will no longer be required to perform a hypothetical purchase price allocation to measure goodwill impairment (formerly known as “Step-2” analysis). Instead, impairment will be measured using the difference between carrying amount and the fair value of the reporting unit. ASU 2017-04 is effective for fiscal years beginning after December 15, 2019, including interim periods within those fiscal years, with early adoption permitted. We are currently evaluating the impact of our pending adoption of the new standard on our consolidated financial statements.
37
Results of Operations
The following table sets forth certain financial data from the consolidated statements of income (loss) expressed as a percentage of revenues for the periods indicated (in thousands):
|
Year Ended December 31,
|
||||||||||||||||||||
|
2016
|
2015
|
2014
|
||||||||||||||||||
|
Dollar
|
% of
|
Dollar
|
% of
|
Dollar
|
% of
|
|||||||||||||||
|
Amount
|
Revenues
|
Amount
|
Revenues
|
Amount
|
Revenues
|
|||||||||||||||
|
Revenues
|
$
|
651,227
|
|
100.0
|
%
|
$
|
630,832
|
|
100.0
|
%
|
$
|
593,241
|
|
100.0
|
%
|
|||||
|
Cost of revenues
|
516,883
|
|
79.4
|
%
|
513,768
|
|
81.4
|
%
|
476,309
|
|
80.3
|
%
|
||||||||
|
Gross profit
|
134,344
|
|
20.6
|
%
|
117,064
|
|
18.6
|
%
|
116,932
|
|
19.7
|
%
|
||||||||
|
Selling, general and administrative expenses
|
110,568
|
|
17.0
|
%
|
110,007
|
|
17.4
|
%
|
103,781
|
|
17.5
|
%
|
||||||||
|
Operating income
|
23,776
|
|
3.7
|
%
|
7,057
|
|
1.1
|
%
|
13,151
|
|
2.2
|
%
|
||||||||
|
Other expenses, net
|
7,409
|
|
1.1
|
%
|
6,765
|
|
1.1
|
%
|
6,859
|
|
1.2
|
%
|
||||||||
|
Income before provision (benefit) for income taxes
|
16,367
|
|
2.5
|
%
|
292
|
|
—
|
%
|
6,292
|
|
1.1
|
%
|
||||||||
|
Income tax provision (benefit)
|
4,370
|
|
0.7
|
%
|
4,976
|
|
0.8
|
%
|
(4,091
|
)
|
(0.7
|
)%
|
||||||||
|
Net income (loss)
|
$
|
11,997
|
|
1.8
|
%
|
$
|
(4,684
|
)
|
(0.7
|
)%
|
$
|
10,383
|
|
1.8
|
%
|
|||||
|
Net loss attributable to redeemable non-controlling interest
|
$
|
35
|
|
—
|
%
|
$
|
5,528
|
|
0.9
|
%
|
$
|
—
|
|
—
|
%
|
|||||
|
Net income attributable to Ameresco, Inc.
|
$
|
12,032
|
|
1.8
|
%
|
$
|
844
|
|
0.1
|
%
|
$
|
10,383
|
|
1.8
|
%
|
|||||
Revenues
The following table sets forth a comparison of our revenues for the periods indicated (in thousands):
|
Year Ended December 31,
|
Dollar
|
Percentage
|
||||||||||||
|
2016
|
2015
|
Change
|
Change
|
|||||||||||
|
Revenues
|
$
|
651,227
|
|
$
|
630,832
|
|
$
|
20,395
|
|
3.2
|
%
|
|||
|
Year Ended December 31,
|
Dollar
|
Percentage
|
||||||||||||
|
2015
|
2014
|
Change
|
Change
|
|||||||||||
|
Revenues
|
$
|
630,832
|
|
$
|
593,241
|
|
$
|
37,591
|
|
6.3
|
%
|
|||
Total revenues increased by
$20.4 million
, or
3.2%
, from
2015
to
2016
primarily due to a
$50.4 million
increase in revenues from our U.S. Federal segment, a
$15.1 million
increase in revenues from our Small-Scale Infrastructure segment and a
$1.2 million
increase in revenues from our Canada segment. These increases were partially offset by a
$31.6 million
decrease in revenues from our U.S. Regions segment and a
$14.7 million
decrease in revenues from All Other.
Total revenues increased by
$37.6 million
, or
6.3%
, from
2014
to
2015
primarily due to a
$37.9 million
increase in revenues from our U.S. Regions segment, a
$21.4 million
increase in revenues from our U.S. Federal segment and a
$8.0 million
increase in revenues from our Small-Scale Infrastructure segment. These increases were partially offset by a
$21.3 million
decrease in revenues from our Canada segment and a
$8.5 million
decrease in revenues from our All Other segment.
38
Cost of Revenues and Gross Margin
The following table sets forth a comparison of our cost of revenues and gross profit for the periods indicated (in thousands):
|
Year Ended December 31,
|
Dollar
|
Percentage
|
||||||||||||
|
2016
|
2015
|
Change
|
Change
|
|||||||||||
|
Cost of revenues
|
$
|
516,883
|
|
$
|
513,768
|
|
$
|
3,115
|
|
0.6
|
%
|
|||
|
Gross margin %
|
20.6
|
%
|
18.6
|
%
|
|
|
|
|||||||
|
Year Ended December 31,
|
Dollar
|
Percentage
|
||||||||||||
|
2015
|
2014
|
Change
|
Change
|
|||||||||||
|
Cost of revenues
|
$
|
513,768
|
|
$
|
476,309
|
|
$
|
37,459
|
|
7.9
|
%
|
|||
|
Gross margin %
|
18.6
|
%
|
19.7
|
%
|
||||||||||
Cost of revenues.
Total cost of revenues increased
$3.1 million
, or
0.6%
, from
2015
to
2016
due primarily to the increase in revenues described above, partially offset by cost budget revisions and a reserve for potential future losses totaling $6.6 million on the significant project in our Canada segment recorded during 2015. Total cost of revenues increased by
$37.5 million
, or
7.9%
, from
2014
to
2015
due primarily to the increase in revenues described above as, a reserve for potential future losses totaling $6.6 million on the significant project in our Canada segment in 2015, and a $1.0 million recovery during the second quarter of 2014 related to a customer warranty issue.
Gross margin.
Gross margin increases from
18.6%
in
2015
to
20.6%
in
2016
. The increase was due primarily to cost budget revisions on a significant project in our Canada segment during 2015, which resulted in a reduction in project to date revenues recognized and a reserve for potential future losses on the project recorded during 2015. Gross margin decreased from
19.7%
in
2014
to
18.6%
in
2015
. The decrease was driven primarily by the $1.0 million recovery in 2014 and the cost budget revision and reserve for future losses on a significant project in our Canada segment, both described above.
Selling, General and Administrative Expenses
The following table sets forth a comparison of our selling, general and administrative expenses for the periods indicated (in thousands):
|
Year Ended December 31,
|
Dollar
|
Percentage
|
||||||||||||
|
2016
|
2015
|
Change
|
Change
|
|||||||||||
|
Selling, general and administrative expenses
|
$
|
110,568
|
|
$
|
110,007
|
|
$
|
561
|
|
0.5
|
%
|
|||
|
Year Ended December 31,
|
Dollar
|
Percentage
|
||||||||||||
|
2015
|
2014
|
Change
|
Change
|
|||||||||||
|
Selling, general and administrative expenses
|
$
|
110,007
|
|
$
|
103,781
|
|
$
|
6,226
|
|
6.0
|
%
|
|||
Selling, general and administrative expenses were relatively flat at
$110.6 million
and
$110.0 million
in 2016 and 2015, respectively, with higher recurring expenses in 2016 offset by non-recurring restructuring charges of $6.6 million in 2015.
Selling, general and administrative expenses increased
$6.2 million
or
6.0%
to
$110.0 million
from
2014
to
2015
primarily due to $6.6 million in restructuring charges, and a $1.4 million increase in project development costs.
Goodwill Impairment
We conducted our annual goodwill impairment test as of
December 31, 2016
,
2015
and
2014
for all reporting units and noted no impairment of goodwill.
Other Expenses, Net
Other expenses, net includes gains and losses from derivatives and foreign currency transactions, interest income and expenses and amortization of deferred financing costs, net. Other expenses, net, increased from
2015
to
2016
by
$0.6 million
. Other expenses, net, decreased from
2014
to
2015
by
$0.1 million
.
39
Income Before Taxes
Income before taxes increased from
2015
to
2016
by
$16.1 million
, or
5,505.1%
, primarily due to an increase in gross margin, and decreased from
2014
to
2015
by
$6.0 million
, or
95.4%
, primarily due to the restructuring charges and increase in project development costs in 2015 described above.
Provision (Benefit) for Income Taxes
The provision for income taxes for the year ending December 31, 2015 has been revised. See Note 2 for further discussion of this revision.
The provision (benefit) for income taxes is based on various rates set by federal, state, provincial and local authorities and is affected by permanent and temporary differences between financial accounting and tax reporting requirements. For the years ended
December 31, 2016
,
2015
and
2014
, our statutory rate, which is a combined federal and state rate, has ranged between 38.1% and 45.6%. During
2016
, we recognized an income tax provision of
$4.4 million
. The effective annual income tax rate for
2016
was
26.7%
. The principal reasons for the difference between the statutory rate and the estimated annual effective rate for 2016 relate to the effects of the tax deduction under Internal Revenue Code Section 179D and production tax credits to which we are entitled from plants we own.
The investment tax credits to which we are entitled fluctuate from year to year based on the cost of the renewable energy plants that we place or expect to place in service in that year. There were no owned renewable energy plants placed in service during the year and therefore no investment tax credits included in the rate for the year.
In addition, the tax deduction under Internal Revenue Code Section 179D was retroactively extended in the fourth quarter of 2015 and expired on December 31, 2016. The amount of the deduction to which we are entitled would vary in accordance with the number of qualifying projects completed during the year and any impact on our effective tax rate would further depend on the magnitude of the available deduction.
During
2015
, we recognized an income tax provision of
$5.0 million
, or
1,704.1%
of pretax income. The principal reason for the difference between the statutory rate and the annual effective rate were the effects of the valuation allowance required for the Canada losses and the effects of the net loss attributable to redeemable non-controlling interest partially offset by energy efficiency tax benefits.
During
2014
, we recognized an income tax benefit of
$4.1 million
, or (65.0)% of pretax income. The principal reason for the difference between the statutory rate and the annual effective rate were the effects of investment tax credits and production tax credits to which we are entitled from plants we own. These energy efficiency tax benefits accounted for a $9.5 million reduction in the 2014 provision, or a reduction of 151.3% in the effective rate.
Net Income (Loss)
Net income increased
$16.7 million
to a net income of
$12.0 million
for the
twelve months ended December 31, 2016
compared to a net loss of
$4.7 million
for the same period of
2015
for the reasons discussed above. Basic and diluted loss per share for the
twelve months ended December 31, 2016
were
$0.26
per share, an increase of
$0.24
per share, compared to the same period of
2015
.
Net income decreased $15.1 million to a net loss of $4.7 million for the twelve months ended December 31, 2015 compared to net income of $10.4 million for the same period of 2014 for the reasons discussed above. Basic and diluted earnings per share for the twelve months ended December 31, 2015 were $0.02 per share, a decrease of $0.20 per share, compared to the same period of 2014.
Business Segment Analysis (in thousands)
We report results under ASC 280,
Segment Reporting.
Our reportable segments for the year ended
December 31, 2016
are U.S. Regions, U.S. Federal, Canada and Small-Scale Infrastructure. Our U.S. Regions, U.S. Federal and Canada segments offer energy efficiency products and services, which include: the design, engineering and installation of equipment and other measures to improve the efficiency and control the operation of a facility’s energy infrastructure; renewable energy solutions and services, which include the construction of small-scale plants that we own or develop for customers that produce electricity, gas, heat or cooling from renewable sources of energy; and O&M services. Our Small-Scale Infrastructure segment sells electricity, processed renewable gas fuel, heat or cooling, produced from renewable sources of energy and generated by small-scale plants that we own. Our Small-Scale Infrastructure segment also now includes certain small-scale plants developed for
40
customers previously included in our U.S. Regions segment. Previously reported amounts have been restated for comparative purposes. The “All Other” category offers enterprise energy management services, consulting services and integrated-PV. These segments do not include results of other activities, such as corporate operating expenses not specifically allocated to the segments.
U.S. Regions
|
Year Ended December 31,
|
Dollar
|
Percentage
|
||||||||||||
|
2016
|
2015
|
Change
|
Change
|
|||||||||||
|
Revenues
|
$
|
269,766
|
|
$
|
301,371
|
|
$
|
(31,605
|
)
|
(10.5
|
)%
|
|||
|
Income before taxes
|
$
|
18,200
|
|
$
|
24,800
|
|
$
|
(6,600
|
)
|
(26.6
|
)%
|
|||
|
|
||||||||||||||
|
Year Ended December 31,
|
Dollar
|
Percentage
|
||||||||||||
|
2015
|
2014
|
Change
|
Change
|
|||||||||||
|
Revenues
|
$
|
301,371
|
|
$
|
263,451
|
|
$
|
37,920
|
|
14.4
|
%
|
|||
|
Income before taxes
|
$
|
24,800
|
|
$
|
24,849
|
|
$
|
(49
|
)
|
(0.2
|
)%
|
|||
Revenues for the U.S. Regions segment decreased by
$31.6 million
, or
10.5%
, to
$269.8 million
for the
twelve months ended December 31, 2016
compared to the same period of
2015
primarily due to a decrease in the number of active projects.
Revenues for the U.S. Regions segment increased by
$37.9 million
, or
14.4%
, to
$301.4 million
for the
twelve months ended December 31, 2015
compared to the same period of
2014
primarily due to an increase in the size of active projects.
Income before taxes for the U.S. Regions segment decreased by
$6.6 million
, or
26.6%
, for the
twelve months ended December 31, 2016
compared to the same period of
2015
primarily due to the decrease in revenues described above, which resulted in decreased operating leverage.
Income before taxes for the U.S. Regions segment was flat from
2014
to
2015
at $24.8 million for the
twelve months ended December 31, 2015
compared to the same period of
2014
primarily due to an increase in project development costs and the prior year effect of the recovery of a customer warranty issue.
U.S. Federal
|
Year Ended December 31,
|
Dollar
|
Percentage
|
||||||||||||
|
2016
|
2015
|
Change
|
Change
|
|||||||||||
|
Revenues
|
$
|
177,991
|
|
$
|
127,620
|
|
$
|
50,371
|
|
39.5
|
%
|
|||
|
Income before taxes
|
$
|
22,236
|
|
$
|
16,676
|
|
$
|
5,560
|
|
33.3
|
%
|
|||
|
Year Ended December 31,
|
Dollar
|
Percentage
|
||||||||||||
|
2015
|
2014
|
Change
|
Change
|
|||||||||||
|
Revenues
|
$
|
127,620
|
|
$
|
106,192
|
|
$
|
21,428
|
|
20.2
|
%
|
|||
|
Income before taxes
|
$
|
16,676
|
|
$
|
14,035
|
|
$
|
2,641
|
|
18.8
|
%
|
|||
Revenues for the U.S. Federal segment increased by
$50.4 million
, or
39.5%
, to
$178.0 million
for the
twelve months ended December 31, 2016
compared to the same period of
2015
primarily due to an increase in the contract value of active projects and the timing of revenue recognized as a result of the phase of active projects.
Revenues for the U.S. Federal segment increased from
2014
to
2015
by
$21.4 million
, or
20.2%
, to
$127.6 million
primarily due to the phase of active projects.
Income before taxes for the U.S. Federal segment increased by
$5.6 million
, or
33.3%
, to
$22.2 million
for the
twelve months ended December 31, 2016
compared to the same period of
2015
primarily due to the increase in revenues described above partially offset by a budget revision on a large project in the second quarter of 2016.
Income before taxes for the U.S. Federal segment increased from
2014
to
2015
by
$2.6 million
, or
18.8%
, to
$16.7 million
. The increase was primarily due to the increase in revenues described above.
41
Canada
|
Year Ended December 31,
|
Dollar
|
Percentage
|
||||||||||||
|
2016
|
2015
|
Change
|
Change
|
|||||||||||
|
Revenues
|
$
|
50,448
|
|
$
|
49,235
|
|
$
|
1,213
|
|
2.5
|
%
|
|||
|
Loss before taxes
|
$
|
(2,330
|
)
|
$
|
(15,449
|
)
|
$
|
13,119
|
|
84.9
|
%
|
|||
|
Year Ended December 31,
|
Dollar
|
Percentage
|
||||||||||||
|
2015
|
2014
|
Change
|
Change
|
|||||||||||
|
Revenues
|
$
|
49,235
|
|
$
|
70,492
|
|
$
|
(21,257
|
)
|
(30.2
|
)%
|
|||
|
Loss before taxes
|
$
|
(15,449
|
)
|
$
|
(7,838
|
)
|
$
|
(7,611
|
)
|
(97.1
|
)%
|
|||
Revenues for the Canada segment increased
$1.2 million
, or
2.5%
, to
$50.4 million
for the
twelve months ended December 31, 2016
compared to the same period of
2015
primarily due to cost budget revisions, during the first quarter of 2015, on a significant project which resulted in a reduction in project to date revenues recognized in 2015, as well as an increase in the size of active projects in 2016.
Revenues for the Canada segment decreased from
2014
to
2015
by
$21.3 million
, or
30.2%
, to
$49.2 million
, primarily due to unfavorable foreign exchange rate fluctuations and significant cost budget revisions on a project which resulted in a reduction in project to date revenues recognized compared to the same period in 2014.
Loss before taxes for the Canada segment decreased
$13.1 million
, or
84.9%
, to
$2.3 million
for the
twelve months ended December 31, 2016
compared to the same period of
2015
primarily due to a reserve in 2015 for potential future losses on the significant project described above as well as improved gross margin on active projects in 2016, partially offset by $1.9 million of bad debt expense recorded during the second quarter of 2016.
Loss before taxes for the Canada segment increased from
2014
to
2015
by
$7.6 million
, or
97.1%
, to a loss of
$15.4 million
primarily due to additional restructuring charges in the fourth quarter of 2015 totaling $4.0 million as well as cost budget revisions and a reserve for potential future losses totaling $6.6 million on the significant project described above.
Small-Scale Infrastructure
|
Year Ended December 31,
|
Dollar
|
Percentage
|
||||||||||||
|
2016
|
2015
|
Change
|
Change
|
|||||||||||
|
Revenues
|
$
|
81,395
|
|
$
|
66,322
|
|
$
|
15,073
|
|
22.7
|
%
|
|||
|
Income before taxes
|
$
|
10,859
|
|
$
|
8,613
|
|
$
|
2,246
|
|
26.1
|
%
|
|||
|
Year Ended December 31,
|
Dollar
|
Percentage
|
||||||||||||
|
2015
|
2014
|
Change
|
Change
|
|||||||||||
|
Revenues
|
$
|
66,322
|
|
$
|
58,286
|
|
$
|
8,036
|
|
13.8
|
%
|
|||
|
Income before taxes
|
$
|
8,613
|
|
$
|
3,191
|
|
$
|
5,422
|
|
169.9
|
%
|
|||
Revenues for the Small-Scale Infrastructure segment increased
$15.1 million
, or
22.7%
, to
$81.4 million
for the
twelve months ended December 31, 2016
primarily due to the active development of small-scale plants we are constructing for customers during 2016, as compared to 2015 where no similar projects were in development.
Revenues for the Small-Scale Infrastructure segment increased from
2014
to
2015
by
$8.0 million
, or
13.8%
, to
$66.3 million
primarily due to an increase in the number of owned plants fully operational compared to the same period of 2014 and project revenue associated with a small-scale renewable energy plant under construction for a customer.
Income before taxes for the Small-Scale Infrastructure segment increased by
$2.2 million
, or
26.1%
, to
$10.9 million
for the
twelve months ended December 31, 2016
compared to the same period of
2015
primarily due to the increase in revenues described above.
Income before taxes for the Small-Scale Infrastructure segment increased by
$5.4 million
, or
169.9%
, to
$8.6 million
for the twelve months ended December 31, 2015 compared to the same period of 2014 primarily due to revisions to our property tax estimates resulting in a cumulative decrease in accrued costs.
42
All Other & Unallocated Corporate Activity
|
Year Ended December 31,
|
Dollar
|
Percentage
|
||||||||||||
|
2016
|
2015
|
Change
|
Change
|
|||||||||||
|
Revenues
|
$
|
71,627
|
|
$
|
86,284
|
|
$
|
(14,657
|
)
|
(17.0
|
)%
|
|||
|
Loss before taxes
|
$
|
(417
|
)
|
$
|
(8,677
|
)
|
$
|
8,260
|
|
95.2
|
%
|
|||
|
Unallocated corporate activity
|
$
|
(32,181
|
)
|
$
|
(25,671
|
)
|
$
|
(6,510
|
)
|
(25.4
|
)%
|
|||
|
Year Ended December 31,
|
Dollar
|
Percentage
|
||||||||||||
|
2015
|
2014
|
Change
|
Change
|
|||||||||||
|
Revenues
|
$
|
86,284
|
|
$
|
94,820
|
|
$
|
(8,536
|
)
|
(9.0
|
)%
|
|||
|
Loss before taxes
|
$
|
(8,677
|
)
|
$
|
(324
|
)
|
$
|
(8,353
|
)
|
(2,578.1
|
)%
|
|||
|
Unallocated corporate activity
|
$
|
(25,671
|
)
|
$
|
(27,621
|
)
|
$
|
1,950
|
|
7.1
|
%
|
|||
Revenues not allocated to segments and presented as all other decreased
$14.7 million
, or
17.0%
, to
$71.6 million
for the
twelve months ended December 31, 2016
compared to the same period of
2015
primarily due to our anticipated decrease in integrated-PV sales as a result of a weakening of sales to customers for oilfield microgrid applications.
Revenues not allocated to segments and presented as all other, decreased from
2014
to
2015
by
$8.5 million
,
or
9.0%
, to
$86.3 million
primarily due to a $9.5 million decrease in revenues from integrated-PV sales.
Loss before taxes not allocated to segments and presented as all other improved by
$8.3 million
to a loss of
$0.4 million
for the
twelve months ended December 31, 2016
compared to the same period of
2015
primarily due to the positive impact of our 2015 restructuring efforts, including cost savings realized in our software group from a lower headcount.
Loss before taxes not allocated to segments and presented as all other, increased from
2014
to
2015
by
$8.4 million
from a loss of
$0.3 million
to a loss of
$8.7 million
primarily due to the decrease in revenues described above as well as $2.3 million in restructuring charges, recorded in the fourth quarter of 2015, related to our software group.
Unallocated corporate activity includes all corporate level selling, general and administrative expenses and other expenses not allocated to the segments. We do not allocate any indirect expenses to the segments.
Unallocated corporate activity increased by
$6.5 million
,
or
25.4%
, to
$32.2 million
primarily due to $3.2 million in reserves for certain amounts receivable from a customer who declared bankruptcy.
Unallocated corporate activity decreased from
2014
to
2015
by
$2.0 million
,
or
7.1%
, to
$25.7 million
primarily due to a decrease in stock compensation expense and severance charges compared to the same period in the prior year as well as acquisition related business development costs incurred during 2014 which were not repeated in 2015.
Liquidity and Capital Resources
Sources of liquidity.
Since inception, we have funded operations primarily through cash flow from operations, advances from Federal ESPC projects and various forms of debt.
The changes in cash and cash equivalents for the years ended
December 31, 2016
,
2015
and
2014
were as follows:
|
Year Ended December 31,
|
|||||||||||
|
2016
|
2015
|
2014
|
|||||||||
|
Cash flows (used in) provided by operating activities
|
$
|
(58,073
|
)
|
$
|
(49,538
|
)
|
$
|
1,308
|
|
||
|
Cash flows used in investing activities
|
(79,616
|
)
|
(51,829
|
)
|
(38,600
|
)
|
|||||
|
Cash flows provided by financing activities
|
137,301
|
|
100,705
|
|
42,776
|
|
|||||
|
Effect of exchange rate changes on cash
|
(650
|
)
|
(1,455
|
)
|
1,107
|
|
|||||
|
Net (decrease) increase in cash and cash equivalents
|
$
|
(1,038
|
)
|
$
|
(2,117
|
)
|
$
|
6,591
|
|
||
We believe that cash and cash equivalents, and availability under our revolving senior secured credit facility, combined with our access to the credit markets, will be sufficient to fund our operations through
2017
and thereafter.
43
Proceeds from our Federal ESPC projects are generally received through agreements to sell the ESPC receivables related to certain ESPC contracts to third-party investors. We use the advances from the investors under these agreements to finance the projects. Until recourse to us ceases for the ESPC receivables transferred to the investor, upon final acceptance of the work by the government customer, we are the primary obligor for financing received. The transfers of receivables under these agreements do not qualify for sales accounting until final customer acceptance of the work, so the advances from the investors are not classified as operating cash flows. Cash draws that we receive under these ESPC agreements are recorded as financing cash inflows. The use of the cash received under these arrangements to pay project costs is classified as operating cash flows. Due to the manner in which the ESPC contracts with the third-party investors are structured, our reported operating cash flows are materially impacted by the fact that operating cash flows only reflect the ESPC contract expenditure outflows and do not reflect any inflows from the corresponding contract revenues. Upon acceptance of the project by the federal customer the ESPC receivable and corresponding ESPC liability are removed from our consolidated balance sheet as a non-cash settlement. See Note 2, “Summary of Significant Accounting Policies”, to our Consolidated Financial Statements appearing in Item 8 of this Annual Report on Form 10-K.
Our service offering also includes the development, construction and operation of small-scale renewable energy plants. Small-scale renewable energy projects, or project assets, can either be developed for the portfolio of assets that we own and operate or designed and built for customers. Expenditures related to projects that we own are recorded as cash outflows from investing activities. Expenditures related to projects that we build for customers are recorded as cash outflows from operating activities as cost of revenues.
Capital expenditures.
Our total capital expenditures were $
76.0 million
,
$52.7 million
, and
$24.7 million
for the
twelve months ended December 31, 2016
,
2015
and
2014
, respectively. The
2014
capital expenditures were net of Section 1603 rebates received of
$3.7 million
. Section 1603 of the American Recovery and Reinvestment Tax Act of 2009 authorized the U.S. Department of the Treasury to make payments to eligible persons who place in service specified energy property. This property would have been eligible for production tax credits under the Code, but we elected to forgo such tax credits in exchange for the payment made under Section 1603. Additionally, we invested
$3.6 million
in acquisitions, net of debt assumed, for the
twelve months ended December 31, 2016
, and
$13.9 million
in acquisitions for the twelve months ended December 31,
2014
. We currently plan to invest approximately
$60.0 million
to
$85.0 million
in capital expenditures in
2017
, principally for the development of new renewable energy plants.
Cash flows from operating activities.
Operating activities used $
58.1 million
of net cash during
2016
. In
2016
, we had net income of
$12.0 million
, which is net of non-cash compensation, depreciation, amortization, deferred income taxes and other non-cash items totaling $
35.8 million
. Net increases in restricted cash, prepaid expenses and other current assets, accounts receivable including retainage and other assets and decreases in accounts payable and accrued expenses and other current liabilities and other liabilities used
$20.5 million
. These uses of cash were partially offset by a decrease in inventory, costs and estimated earnings in excess of billings and billings in excess of cost and estimated earnings and project development costs and increases in income taxes payable which provided
$31.5 million
. Federal ESPC receivables used
$116.8 million
. As described above, Federal ESPC operating cash flows only reflect the ESPC expenditure outflows and do not reflect any inflows from the corresponding contract revenues, which are recorded as cash inflows from financing activities due to the timing of the receipt of cash related to the assignment of the ESPC receivables to the third-party investors.
Operating activities used $
49.5 million
of net cash during
2015
. In
2015
, we had a net loss of
$4.7 million
, which is net of non-cash compensation, depreciation, amortization, gains on sales of assets, deferred income taxes and other non-cash items totaling $
37.2 million
. Net increases in accounts receivable including retainage, inventory, costs and estimated earnings in excess of billings and billings in excess of cost and estimated earnings, prepaid expenses and other current assets, project development costs and other assets and decreases in other liabilities used
$39.3 million
. However, decreases in restricted cash and increases in accounts payable and accrued expenses and other current liabilities and incomes taxes payable provided
$30.6 million
. Federal ESPC receivables used
$73.2 million
.
Operating activities provided $1.3 million of net cash during 2014. In 2014, we had net income of
$10.4 million
, which is net of non-cash compensation, depreciation, amortization, gains on sales of assets, deferred income taxes and other non-cash items totaling
$24.6 million
. Net decreases in restricted cash, accounts receivable including retainage, inventory, costs and estimated earnings in excess of billings and billings in excess of cost and estimated earnings, prepaid expenses and other current assets and project development costs and increases in accounts payable and accrued expenses and other current liabilities and income taxes payable provided
$35.1 million
. However, increases in other assets and decreases in other liabilities used
$9.3 million
. Federal ESPC receivables used
$59.5 million
.
44
Cash flows from investing activities.
Cash used for investing activities totaled
$79.6 million
during
2016
and consisted of capital investments of
$73.2 million
related to the development of renewable energy plants,
$2.8 million
related to purchases of other property and equipment and
$3.6 million
related to acquisitions of renewable energy plants.
Cash used for investing activities totaled
$51.8 million
during
2015
and consisted of capital investments of
$51.3 million
related to the development of renewable energy plants and
$1.3 million
related to purchases of other property and equipment Offsetting these amounts was
$0.9 million
in proceeds from the sale of a project asset in Canada.
Cash used for investing activities totaled
$38.6 million
during
2014
and consisted of capital investments of
$26.7 million
related to the development of renewable energy plants,
$1.7 million
related to purchases of other property and equipment and
$13.9 million
primarily for the acquisition of EEX. Offsetting these amounts were
$3.7 million
of Section 1603 rebates received during the period.
Cash flows from financing activities.
Net cash provided by financing activities totaled
$137.3 million
during
2016
and included repayments of
$14.0 million
on long-term debt, payments of
$1.9 million
relating to financing fees and
$6.4 million
for the repurchase of stock. These uses of financing cash were offset by proceeds from long-term debt financing of
$38.0 million
, proceeds from sale-leaseback financings of
$17.0 million
, proceeds from redeemable non-controlling interest of
$6.4 million
, proceeds from our senior secured credit facility of
$3.8 million
, releases of restricted cash of
$3.2 million
and exercises of options, which provided
$1.1 million
. Proceeds from Federal ESPC projects provided
$90.0 million
in cash.
Net cash provided by financing activities totaled
$100.7 million
during
2015
and included repayments of
$12.4 million
on long-term debt,
$5.7 million
placed into restricted cash accounts and payments of
$2.7 million
relating to financing fees. These uses of financing cash were offset by proceeds from our senior secured credit facility of
$6.3 million
, exercises of options, which provided
$1.2 million
, proceeds from sale-leaseback financings of
$12.5 million
, proceeds from long-term debt financing of
$17.7 million
and proceeds from redeemable non-controlling interest of
$6.0 million
. Proceeds from Federal ESPC projects provided
$78.0 million
in cash.
Net cash provided by financing activities totaled
$42.8 million
during
2014
and included repayments of
$18.4 million
on long-term debt and payments of
$0.4 million
relating to financing fees. These uses of financing cash were offset by the release of
$3.0 million
from restricted cash accounts, exercises of options which provided
$1.4 million
and proceeds from our senior secured credit facility of
$5.0 million
. Proceeds from Federal ESPC projects provided
$51.2 million
in cash.
Senior Secured Credit Facility
—
Revolver and Term Loan
On June 30, 2015, we entered into a third amended and restated bank credit facility with two banks. The new credit facility replaced and extended our existing credit facility, which was scheduled to expire in accordance with its terms on June 30, 2016. The revolving credit and term loan facility mature on June 30, 2020, when all amounts will be due and payable in full. We expect to use the new credit facility for our general corporate purposes, including permitted acquisitions, refinancing of existing indebtedness and working capital. In July 2016, we entered into an amendment to the third amended and restated bank credit facility that amended the requirement of the total funded debt to EBITDA ratio as described below. In November 2016, we entered into an additional amendment to the third amended and restated bank credit facility that increased the amount of the term loan under the credit facility by approximately $20.0 million to an aggregate of $30.0 million and extends the maturity date of the term loan from June 30, 2018 to June 30, 2020.
The credit facility consists of a
$60.0 million
revolving credit facility and a
$30.0 million
term loan. The revolving credit facility may be increased by up to an additional
$25.0 million
at our option if lenders are willing to provide such increased commitments, subject to certain conditions. Up to
$20.0 million
of the revolving credit facility may be borrowed in Canadian dollars, Euros and Pounds Sterling. We are the sole borrower under the credit facility. The obligations under the credit facility are guaranteed by certain of our direct and indirect wholly owned domestic subsidiaries and are secured by a pledge of all of our and such of our subsidiary guarantors’ assets, other than the equity interests of certain subsidiaries and assets held in non-core subsidiaries (as defined in the agreement). At
December 31, 2016
and
2015
,
$28.5 million
and $14.3 million, was outstanding under the term loan, respectively. At
December 31, 2016
and
2015
,
$15.0 million
and $11.3 million was outstanding under the revolving credit facility, respectively.
The interest rate for borrowings under the credit facility is based on, at our option, either (1) a base rate equal to a margin of
0.5%
or
0.25%
, depending on our ratio of Total Funded Debt to EBITDA (each as defined in the agreement), over the highest of (a) the federal funds effective rate, plus
0.50%
, (b) Bank of America’s prime rate and (c) a rate based on the London interbank deposit rate (“LIBOR”) plus
1.50%
, or (2) the one-, two- three- or six-month LIBOR plus a margin of
2.00%
or
1.75%
, depending on our ratio of Total Funded Debt to EBITDA. A commitment fee of
0.375%
is payable quarterly on the
45
undrawn portion of the revolving credit facility. At
December 31, 2016
, the interest rate for borrowings under the revolving credit facility was
4.25%
and the weighted average interest rate for borrowings under the term loan was
2.94%
.
The revolving credit facility does not require amortization of principal. The term loan requires quarterly principal payments of
$1.5 million
, with the balance due at maturity. All borrowings may be paid before maturity in whole or in part at our option without penalty or premium, other than reimbursement of any breakage and deployment costs in the case of LIBOR borrowings.
The credit facility limits our ability to, among other things: incur additional indebtedness; incur liens or guarantee obligations; merge, liquidate or dispose of assets; make acquisitions or other investments; enter into hedging agreements; pay dividends and make other distributions and engage in transactions with affiliates, except in the ordinary course of business on an arms’ length basis.
Under the credit facility, we may not invest cash or property in, or loan to, our non-core subsidiaries in aggregate amounts exceeding
49%
of our consolidated stockholders’ equity. In addition, under the credit facility, we and our core subsidiaries must maintain the following financial covenants:
|
•
|
a ratio of total funded debt to EBITDA of:
|
||
|
-
|
less than 2.00 to 1.0 as of the end of each fiscal quarter ending on or before June 30, 2016;
|
||
|
-
|
less than 2.75 to 1.0 as of the end of each fiscal quarter ending September 30, 2016, December 31, 2016, March 31, 2017 and June 30, 2017; and
|
||
|
-
|
less than 2.00 to 1.0 as of the end of each fiscal quarter ending September 30, 2017 and thereafter; and
|
||
|
•
|
a debt service coverage ratio (as defined in the agreement) of at least 1.5 to 1.0.
|
||
Any failure to comply with the financial or other covenants of the credit facility would not only prevent us from being able to borrow additional funds, but would constitute a default, permitting the lenders to, among other things, accelerate the amounts outstanding, including all accrued interest and unpaid fees, under the credit facility, to terminate the credit facility, and enforce liens against the collateral.
The credit facility also includes several other customary events of default, including a change in control, permitting the lenders to accelerate the indebtedness, terminate the credit facility, and enforce liens against the collateral.
As of
December 31, 2016
, we were in compliance with all of the financial and operational covenants in the senior credit facility. In addition, we do not consider it likely that we will fail to comply with these covenants for the next twelve months.
Project Financing
Construction and Term Loans.
We have entered into a number of construction and term loan agreements for the purpose of constructing and owning certain renewable energy plants. The physical assets and the operating agreements related to the renewable energy plants are owned by wholly owned, single member special purpose subsidiaries. These construction and term loans are structured as project financings made directly to a subsidiary, and upon acceptance of a project, the related construction loan converts into a term loan. While we are required under GAAP to reflect these loans as liabilities on our consolidated balance sheet, they are generally non-recourse and not direct obligations of Ameresco, Inc. As of
December 31, 2016
, we had outstanding
$108.0 million
in aggregate principal amount under these loans with maturities at various dates from 2017 to 2031. Effective interest rates, after consideration for our interest rate swap contracts, ranged from 4.7% to 13.0%. As of
December 31, 2015
, we had outstanding $87.5 million in aggregate principal amount under these loans, bearing interest at rates ranging from 4.7% to 7.3% and maturing at various dates from 2017 to 2028. As of
December 31, 2014
, we had outstanding $77.3 million in aggregate principal amount under these loans, bearing interest at rates ranging from 6.1% to 7.3% and maturing at various dates from 2017 to 2028.
In September 2015, we entered into a credit and guaranty agreement for use in providing non-recourse financing for certain of its solar PV projects currently under construction. The credit and guaranty agreement provides for a
$20.7 million
construction-to-term loan credit facility and bears interest at a variable rate. On March 30, 2016, the construction loan was converted to a term loan. At
December 31, 2016
,
$19.4 million
was outstanding under the term loan. The variable rate for this loan at
December 31, 2016
was
3.5%
.
In November 2016, we entered into a construction loan agreement with a bank for use in providing non-recourse financing for certain solar PV projects currently under construction. The construction loan agreement provides for a $35.0 million
46
construction facility that bears interest at a variable rate. The facility matures on June 30, 2017, and all remaining unpaid amounts outstanding under the facility will be due at that time. At
December 31, 2016
, $7.0 million was outstanding under the construction loan. The variable rate for this loan at
December 31, 2016
was 6.0%. We have classified this debt as non-current as of
December 31, 2016
, due to our intention to refinance the variable rate construction loan to sale-leasebacks prior to the maturity date.
In November 2016, we entered into a construction loan agreement with a bank for use in providing non-recourse financing for a certain natural gas to energy project currently under construction. The construction loan agreement provides for a $9.5 million construction facility. The facility matures on March 1, 2018, and all remaining unpaid amounts outstanding under the facility will be due at that time. At
December 31, 2016
, $3.1 million was outstanding under the construction loan. The fixed rate for this loan at
December 31, 2016
was 8.8%. We have classified this debt as current as of
December 31, 2016
, due to our intent to repay the construction loan in full prior to December 31, 2017.
In December 2016, we acquired a solar PV project currently under construction as well as an associated construction loan agreement with a bank for use in providing non-recourse financing for this acquired solar PV project currently under construction. The construction loan agreement provides for a $10.7 million construction facility. The facility matures on May 30, 2017, and all remaining unpaid amounts outstanding under the facility will be due at that time. At
December 31, 2016
, $9.5 million was outstanding under the construction loan. The fixed rate for this loan at
December 31, 2016
was 13.0%. We have classified this debt as non-current as of
December 31, 2016
, due to our intention to refinance the construction loan to a term loan prior to the maturity date. This construction loan contains a subjective acceleration clause that allows the bank to call the debt, if a material adverse change occurs. If exercised, the subjective acceleration clause provides for a 60-day notice period to repay the construction loan balance. At
December 31, 2016
, the bank had not exercised the subjective acceleration clause.
One loan, with an outstanding balance as of
December 31, 2016
of $2.7 million, does require Ameresco, Inc. to provide assurance to the lender of the project performance. A second loan, entered into during 2012, with an outstanding balance at
December 31, 2016
of $35.7 million, requires Ameresco, Inc. to provide assurance to the lender of reimbursement upon any recapture of certain renewable energy government cash grants upon the occurrence of events that cause the recapture of such grants.
These construction and term loan agreements require us to comply with a variety of financial and operational covenants. As of
December 31, 2016
, we were in compliance with all of these financial and operational covenants. In addition, we do not consider it likely that we will fail to comply with these covenants during the term of these agreements.
Federal ESPC liabilities.
We have arrangements with certain lenders to provide advances to us during the construction or installation of projects for certain customers, typically federal governmental entities, in exchange for our assignment to the lenders of our rights to the long-term receivables arising from the ESPCs related to such projects. These financings totaled
$133.0 million
and
$122.0 million
in principal amounts at
December 31, 2016
and
2015
, respectively. Under the terms of these financing arrangements, we are required to complete the construction or installation of the project in accordance with the contract with our customer, and the debt remains on our consolidated balance sheet until the completed project is accepted by the customer.
Sale-Leaseback.
During the first quarter of 2015, we entered into an agreement with an investor which gives us the option to sell and contemporaneously lease back solar PV projects. In September 2016, we amended our agreement with the investor whereas the investor has committed up to a maximum combined funding amount of $100.0 million through June 30, 2017 on certain projects. As of December 31, 2016, $70.5 million remained available under the lending commitment. During the year ended December 31, 2016, we sold six solar PV projects and in return received $17.0 million as part of this arrangement. During the year ended December 31, 2015, we sold three solar PV projects and in return received $12.5 million as part of this arrangement. While we are required under GAAP to reflect these lease payments as liabilities on our consolidated balance sheet, they are generally non-recourse and not direct obligations of Ameresco, Inc., except that Ameresco, Inc. has guaranteed certain obligations relating to taxes and project warranties, operation and maintenance.
47
Contractual Obligations
The following table summarizes our significant contractual obligations and commitments as of
December 31, 2016
(in thousands):
|
|
Payments due by Period
|
|||||||||||||||||||
|
|
|
Less than
|
One to
|
Three to
|
More than
|
|||||||||||||||
|
Total
|
One Year
|
Three Years
|
Five Years
|
Five Years
|
||||||||||||||||
|
Senior Secured Credit Facility:
|
||||||||||||||||||||
|
Revolver
|
$
|
15,033
|
|
$
|
—
|
|
$
|
—
|
|
$
|
15,033
|
|
$
|
—
|
|
|||||
|
Term Loan
|
28,500
|
|
6,000
|
|
12,000
|
|
10,500
|
|
—
|
|
||||||||||
|
Project Financing:
|
||||||||||||||||||||
|
Construction and term loans
|
108,009
|
|
11,107
|
|
32,328
|
|
36,634
|
|
27,940
|
|
||||||||||
|
Federal ESPC liabilities(1)
|
133,003
|
|
—
|
|
133,003
|
|
—
|
|
—
|
|
||||||||||
|
Interest obligations(2)
|
46,809
|
|
6,958
|
|
11,414
|
|
8,524
|
|
19,913
|
|
||||||||||
|
Capital lease liabilities
|
14,647
|
|
2,185
|
|
4,599
|
|
3,545
|
|
4,318
|
|
||||||||||
|
Operating leases
|
18,378
|
|
4,690
|
|
6,600
|
|
3,573
|
|
3,515
|
|
||||||||||
|
Total
|
$
|
364,379
|
|
$
|
30,940
|
|
$
|
199,944
|
|
$
|
77,809
|
|
$
|
55,686
|
|
|||||
|
(1
|
)
|
Federal ESPC arrangements relate to the installation and construction of projects for certain customers, typically federal governmental entities, where we assign to third-party lenders our right to customer receivables. We are relieved of the liability when the project is completed and accepted by the customer. We typically expect to be relieved of the liability between one and three years from the date of project construction commencement. The table does not include, for our Federal ESPC liability arrangements, the difference between the aggregate amount of the long-term customer receivables sold by us to the lender and the amount received by us from the lender for such sale.
|
|
|
|
|||
|
(2
|
)
|
For both the revolving and term loan portions of our senior secured credit facility, the table above assumes that the variable interest rate in effect at December 31, 2016 remains constant for the term of the facility. Excludes interest on construction loans payable and lines of credit due to no stated payment terms.
|
|
Off-Balance Sheet Arrangements
We did not have during the periods presented, and we do not currently have, any off-balance sheet arrangements, as defined under SEC rules, such as relationships with unconsolidated entities or financial partnerships, which are often referred to as structured finance or special purpose entities, established for the purpose of facilitating financing transactions that are not required to be reflected on our balance sheet.
We are exposed to changes in interest rates and foreign currency exchange rates because we finance certain operations through fixed and variable rate debt instruments and denominate our transactions in U.S. and Canadian dollars and British pounds sterling (“GBP”). Changes in these rates may have an impact on future cash flows and earnings. We manage these risks through normal operating and financing activities and, when deemed appropriate, through the use of derivative financial instruments.
Interest Rate Risk
We had cash and cash equivalents totaling $
20.6 million
as of
December 31, 2016
and
$21.6 million
as of
December 31, 2015
. Our exposure to interest rate risk primarily relates to the interest expense paid on our senior secured credit facility.
Derivative Instruments
We do not enter into financial instruments for trading or speculative purposes. However, through our subsidiaries we do enter into derivative instruments for purposes other than trading purposes. Certain of the term loans that we use to finance our renewable energy projects bear variable interest rates that are indexed to short-term market rates. We have entered into interest rate swaps in connection with these term loans in order to seek to hedge our exposure to adverse changes in the applicable short-term market rate. In some instances, the conditions of our renewable energy project term loans require us to enter into
48
interest rate swap agreements in order to mitigate our exposure to adverse movements in market interest rates. The interest rate swaps that we have entered into qualify and have been designated as fair value hedges. See Note 2 of “Notes to Consolidated Financial Statements” included in Item 8 of this Annual Report on Form 10-K.
By using derivative instruments, we are subject to credit and market risk. The fair market value of the derivative instruments is determined by using valuation models whose inputs are derived using market observable inputs, including interest rate yield curves, and reflects the asset or liability position as of the end of each reporting period. When the fair value of a derivative contract is positive, the counterparty owes us, thus creating a receivable risk for us. We are exposed to counterparty credit risk in the event of non-performance by counterparties to our derivative agreements. We minimize counterparty credit (or repayment) risk by entering into transactions with major financial institutions of investment grade credit rating.
Our exposure to market interest rate risk is not hedged in a manner that completely eliminates the effects of changing market conditions on earnings or cash flow.
Foreign Currency Risk
We have revenues, expenses, assets and liabilities that are denominated in foreign currencies, principally the Canadian dollar and British pound sterling (“GBP”). Also, a significant number of employees are located in Canada and the U.K., and our subsidiaries in those countries transact business in those respective currencies. As a result, we have designated the Canadian dollar as the functional currency for Canadian operations. Similarly, the GBP has been designated as the functional currency for our operations in the U.K. When we consolidate the operations of these foreign subsidiaries into our financial results, because we report our results in U.S. dollars, we are required to translate the financial results and position of our foreign subsidiaries from their respective functional currencies into U.S. dollars. We translate the revenues, expenses, gains, and losses from our Canadian and U.K. subsidiaries into U.S. dollars using a weighted average exchange rate for the applicable fiscal period. We translate the assets and liabilities of our Canadian and U.K. subsidiaries into U.S. dollars at the exchange rate in effect at the applicable balance sheet date. Translation adjustments are not included in determining net income for the period but are disclosed and accumulated in a separate component of consolidated equity until sale or until a complete or substantially complete liquidation of the net investment in our foreign subsidiary takes place. Changes in the values of these items from one period to the next which result from exchange rate fluctuations are recorded in our consolidated statements of changes in stockholders’ equity as accumulated other comprehensive loss. For the year ended
December 31, 2016
, due to the strengthening of the U.S. dollar versus the GBP, our foreign currency translation resulted in a loss of
$1.9 million
which we recorded as a decrease in accumulated other comprehensive loss. For the year ended
December 31, 2015
, due to the strengthening of the U.S. dollar versus both the Canadian dollar and GBP, our foreign currency translation resulted in a loss of
$2.4 million
, which we recorded as a decrease in accumulated other comprehensive loss.
As a consequence, gross profit, operating results, profitability and cash flows are impacted by relative changes in the value of the Canadian dollar and GBP. We have not repatriated earnings from our foreign subsidiaries, but have elected to invest in new business opportunities there. See Note 8 to our consolidated financial statements appearing in Item 8 of this Annual Report on Form 10-K. We do not hedge our exposure to foreign currency exchange risk.
49
AMERESCO, INC.
CONSOLIDATED BALANCE SHEETS
(in thousands, except share and per share amounts)
|
December 31,
|
|||||||
|
2016
|
2015
|
||||||
|
ASSETS
|
|||||||
|
Current assets:
|
|
|
|||||
|
Cash and cash equivalents
|
$
|
20,607
|
|
$
|
21,645
|
|
|
|
Restricted cash
|
12,299
|
|
16,236
|
|
|||
|
Accounts receivable, net
|
85,354
|
|
73,372
|
|
|||
|
Accounts receivable retainage, net
|
17,465
|
|
21,454
|
|
|||
|
Costs and estimated earnings in excess of billings
|
56,914
|
|
88,334
|
|
|||
|
Inventory, net
|
12,104
|
|
13,223
|
|
|||
|
Prepaid expenses and other current assets
|
11,732
|
|
11,745
|
|
|||
|
Income tax receivable
|
406
|
|
2,151
|
|
|||
|
Project development costs
|
9,180
|
|
15,538
|
|
|||
|
Total current assets
|
226,061
|
|
263,698
|
|
|||
|
Federal ESPC receivable
|
158,209
|
|
125,804
|
|
|||
|
Property and equipment, net
|
5,018
|
|
5,328
|
|
|||
|
Project assets, net
|
319,758
|
|
244,309
|
|
|||
|
Goodwill
|
57,976
|
|
59,085
|
|
|||
|
Intangible assets, net
|
3,931
|
|
6,770
|
|
|||
|
Other assets
|
26,328
|
|
18,446
|
|
|||
|
Total assets
|
$
|
797,281
|
|
$
|
723,440
|
|
|
|
LIABILITIES AND STOCKHOLDERS’ EQUITY
|
|||||||
|
Current liabilities:
|
|||||||
|
Current portions of long-term debt and capital lease liabilities
|
$
|
19,292
|
|
$
|
13,427
|
|
|
|
Accounts payable
|
126,583
|
|
114,759
|
|
|||
|
Accrued expenses and other current liabilities
|
22,763
|
|
21,983
|
|
|||
|
Billings in excess of cost and estimated earnings
|
21,189
|
|
28,744
|
|
|||
|
Income taxes payable
|
775
|
|
810
|
|
|||
|
Total current liabilities
|
190,602
|
|
179,723
|
|
|||
|
Long-term debt and capital lease liabilities, less current portions and net of deferred financing fees
|
140,593
|
|
100,490
|
|
|||
|
Federal ESPC liabilities
|
133,003
|
|
122,040
|
|
|||
|
Deferred income taxes, net
|
9,037
|
|
6,143
|
|
|||
|
Deferred grant income
|
7,739
|
|
8,291
|
|
|||
|
Other liabilities
|
15,154
|
|
18,854
|
|
|||
|
Commitments and contingencies (Note 13)
|
|
|
|||||
|
Redeemable non-controlling interest
|
6,847
|
|
490
|
|
|||
The accompanying notes are an integral part of these consolidated financial statements.
50
|
AMERESCO, INC.
|
|||||||
|
CONSOLIDATED BALANCE SHEETS — (Continued)
|
|||||||
|
(in thousands, except share and per share amounts)
|
|||||||
|
December 31,
|
|||||||
|
2016
|
2015
|
||||||
|
Stockholders’ equity:
|
|||||||
|
Preferred stock, $0.0001 par value, 5,000,000 shares authorized, no shares issued and outstanding at December 31, 2016 and 2015
|
$
|
—
|
|
$
|
—
|
|
|
|
Class A common stock, $0.0001 par value, 500,000,000 shares authorized, 27,706,866 shares issued and outstanding at December 31, 2016, 28,684,392 shares issued and outstanding at December 31, 2015
|
3
|
|
3
|
|
|||
|
Class B common stock, $0.0001 par value, 144,000,000 shares authorized, 18,000,000 shares issued and outstanding at December 31, 2016 and 2015
|
2
|
|
2
|
|
|||
|
Additional paid-in capital
|
112,926
|
|
110,311
|
|
|||
|
Retained earnings
|
194,353
|
|
182,321
|
|
|||
|
Accumulated other comprehensive loss, net
|
(6,591
|
)
|
(5,228
|
)
|
|||
|
Less - treasury stock, at cost, 1,298,418 shares at December 31, 2016
|
(6,387
|
)
|
—
|
|
|||
|
Total equity
|
294,306
|
|
287,409
|
|
|||
|
Total liabilities, redeemable non-controlling interest and equity
|
$
|
797,281
|
|
$
|
723,440
|
|
|
The accompanying notes are an integral part of these consolidated financial statements.
51
AMERESCO, INC.
CONSOLIDATED STATEMENTS OF INCOME (LOSS)
(in thousands, except share and per share amounts)
|
|
Year Ended December 31,
|
||||||||||
|
|
2016
|
2015
|
2014
|
||||||||
|
Revenues
|
$
|
651,227
|
|
$
|
630,832
|
|
$
|
593,241
|
|
||
|
Cost of revenues
|
516,883
|
|
513,768
|
|
476,309
|
|
|||||
|
Gross profit
|
134,344
|
|
117,064
|
|
116,932
|
|
|||||
|
Selling, general and administrative expenses
|
110,568
|
|
110,007
|
|
103,781
|
|
|||||
|
Operating income
|
23,776
|
|
7,057
|
|
13,151
|
|
|||||
|
Other expenses, net (Note 15)
|
7,409
|
|
6,765
|
|
6,859
|
|
|||||
|
Income before provision (benefit) for income taxes
|
16,367
|
|
292
|
|
6,292
|
|
|||||
|
Income tax provision (benefit)
|
4,370
|
|
4,976
|
|
(4,091
|
)
|
|||||
|
Net income (loss)
|
11,997
|
|
(4,684
|
)
|
10,383
|
|
|||||
|
Net loss attributable to redeemable non-controlling interest
|
35
|
|
5,528
|
|
—
|
|
|||||
|
Net income attributable to Ameresco, Inc.
|
$
|
12,032
|
|
$
|
844
|
|
$
|
10,383
|
|
||
|
Net income per share attributable to common shareholders:
|
|
|
|
|
|
|
|||||
|
Basic
|
$
|
0.26
|
|
$
|
0.02
|
|
$
|
0.22
|
|
||
|
Diluted
|
$
|
0.26
|
|
$
|
0.02
|
|
$
|
0.22
|
|
||
|
Weighted average common shares outstanding:
|
|
|
|
|
|
|
|||||
|
Basic
|
46,409,192
|
|
46,494,448
|
|
46,161,846
|
|
|||||
|
Diluted
|
46,493,477
|
|
47,664,895
|
|
47,027,755
|
|
|||||
The accompanying notes are an integral part of these consolidated financial statements.
52
AMERESCO, INC.
CONSOLIDATED STATEMENTS OF COMPREHENSIVE INCOME (LOSS)
(in thousands)
|
|
Year Ended December 31,
|
||||||||||
|
|
2016
|
2015
|
2014
|
||||||||
|
Net income (loss)
|
$
|
11,997
|
|
$
|
(4,684
|
)
|
$
|
10,383
|
|
||
|
Other comprehensive loss:
|
|||||||||||
|
Unrealized gain (loss) from interest rate hedges, net of tax effect of $(52), $390 and $917, respectively
|
506
|
|
(230
|
)
|
(2,217
|
)
|
|||||
|
Foreign currency translation adjustment
|
(1,869
|
)
|
(2,378
|
)
|
(3,515
|
)
|
|||||
|
Total other comprehensive loss
|
(1,363
|
)
|
(2,608
|
)
|
(5,732
|
)
|
|||||
|
Comprehensive income (loss)
|
10,634
|
|
(7,292
|
)
|
4,651
|
|
|||||
|
Comprehensive loss attributable to redeemable non-controlling interest
|
35
|
|
5,528
|
|
—
|
|
|||||
|
Comprehensive income (loss) attributable to common shareholders
|
$
|
10,669
|
|
$
|
(1,764
|
)
|
$
|
4,651
|
|
||
The accompanying notes are an integral part of these consolidated financial statements.
53
AMERESCO, INC.
CONSOLIDATED STATEMENTS OF CHANGES IN REDEEMABLE NON-CONTROLLING INTEREST AND STOCKHOLDERS’ EQUITY
(in thousands, except share amounts)
|
|
|
|
|
|
|
Accumulated
|
|
|||||||||||||||||||||||||||||||||||||
|
Redeemable
|
|
|
Additional
|
|
|
|
Other
|
Non-
|
||||||||||||||||||||||||||||||||||||
|
Non-Controlling
|
Class A Common Stock
|
Class B Common Stock
|
Paid-in
|
Retained
|
Treasury Stock
|
Comprehensive
|
controlling
|
Total
|
||||||||||||||||||||||||||||||||||||
|
Interest
|
Shares
|
Amount
|
Shares
|
Amount
|
Capital
|
Earnings
|
Shares
|
Amount
|
Income (Loss)
|
Interest
|
Equity
|
|||||||||||||||||||||||||||||||||
|
Balance, December 31, 2013
|
$
|
—
|
|
27,869,317
|
|
$
|
3
|
|
18,000,000
|
|
$
|
2
|
|
$
|
102,587
|
|
$
|
171,094
|
|
—
|
|
$
|
—
|
|
$
|
3,112
|
|
$
|
8
|
|
$
|
276,806
|
|
|||||||||||
|
Exercise of stock options, net
|
—
|
|
482,475
|
|
—
|
|
—
|
|
—
|
|
1,447
|
|
—
|
|
—
|
|
—
|
|
—
|
|
—
|
|
1,447
|
|
||||||||||||||||||||
|
Stock-based compensation expense, including excess tax benefits of $918
|
—
|
|
—
|
|
—
|
|
—
|
|
—
|
|
3,411
|
|
—
|
|
—
|
|
—
|
|
—
|
|
—
|
|
3,411
|
|
||||||||||||||||||||
|
Unrealized loss from interest rate hedge, net
|
—
|
|
—
|
|
—
|
|
—
|
|
—
|
|
—
|
|
—
|
|
—
|
|
—
|
|
(2,217
|
)
|
—
|
|
(2,217
|
)
|
||||||||||||||||||||
|
Foreign currency translation adjustment
|
—
|
|
—
|
|
—
|
|
—
|
|
—
|
|
—
|
|
—
|
|
—
|
|
—
|
|
(3,515
|
)
|
—
|
|
(3,515
|
)
|
||||||||||||||||||||
|
Non-controlling interest
|
—
|
|
—
|
|
—
|
|
—
|
|
—
|
|
—
|
|
—
|
|
—
|
|
—
|
|
—
|
|
(9
|
)
|
(9
|
)
|
||||||||||||||||||||
|
Net income
|
—
|
|
—
|
|
—
|
|
—
|
|
—
|
|
—
|
|
10,383
|
|
—
|
|
—
|
|
—
|
|
—
|
|
10,383
|
|
||||||||||||||||||||
|
Balance, December 31, 2014
|
—
|
|
28,351,792
|
|
3
|
|
18,000,000
|
|
2
|
|
107,445
|
|
181,477
|
|
—
|
|
—
|
|
(2,620
|
)
|
(1
|
)
|
286,306
|
|
||||||||||||||||||||
|
Exercise of stock options, net
|
—
|
|
332,600
|
|
—
|
|
—
|
|
—
|
|
1,153
|
|
—
|
|
—
|
|
—
|
|
—
|
|
—
|
|
1,153
|
|
||||||||||||||||||||
|
Stock-based compensation expense, including excess tax benefits of $(50)
|
—
|
|
—
|
|
—
|
|
—
|
|
—
|
|
1,830
|
|
—
|
|
—
|
|
—
|
|
—
|
|
—
|
|
1,830
|
|
||||||||||||||||||||
|
Unrealized loss from interest rate hedge, net
|
—
|
|
—
|
|
—
|
|
—
|
|
—
|
|
—
|
|
—
|
|
—
|
|
—
|
|
(230
|
)
|
—
|
|
(230
|
)
|
||||||||||||||||||||
|
Foreign currency translation adjustment
|
—
|
|
—
|
|
—
|
|
—
|
|
—
|
|
—
|
|
—
|
|
—
|
|
—
|
|
(2,378
|
)
|
—
|
|
(2,378
|
)
|
||||||||||||||||||||
|
Non-controlling interest
|
—
|
|
—
|
|
—
|
|
—
|
|
—
|
|
(117
|
)
|
—
|
|
—
|
|
—
|
|
—
|
|
1
|
|
(116
|
)
|
||||||||||||||||||||
|
Contributions from redeemable non-controlling interest
|
6,018
|
|
—
|
|
—
|
|
—
|
|
—
|
|
—
|
|
—
|
|
—
|
|
—
|
|
—
|
|
—
|
|
—
|
|
||||||||||||||||||||
|
Net (loss) income
|
(5,528
|
)
|
—
|
|
—
|
|
—
|
|
—
|
|
—
|
|
844
|
|
—
|
|
—
|
|
—
|
|
—
|
|
844
|
|
||||||||||||||||||||
|
Balance, December 31, 2015
|
490
|
|
28,684,392
|
|
3
|
|
18,000,000
|
|
2
|
|
110,311
|
|
182,321
|
|
—
|
|
—
|
|
(5,228
|
)
|
—
|
|
287,409
|
|
||||||||||||||||||||
|
Exercise of stock options, net
|
—
|
|
320,892
|
|
—
|
|
—
|
|
—
|
|
1,054
|
|
—
|
|
—
|
|
—
|
|
—
|
|
—
|
|
1,054
|
|
||||||||||||||||||||
|
Stock-based compensation expense, including excess tax benefits of $99
|
—
|
|
—
|
|
—
|
|
—
|
|
—
|
|
1,561
|
|
—
|
|
—
|
|
—
|
|
—
|
|
—
|
|
1,561
|
|
||||||||||||||||||||
|
Open market purchase of common shares
|
—
|
|
(1,298,418
|
)
|
—
|
|
—
|
|
—
|
|
—
|
|
—
|
|
1,298,418
|
|
(6,387
|
)
|
—
|
|
—
|
|
(6,387
|
)
|
||||||||||||||||||||
|
Unrealized gain from interest rate hedge, net
|
—
|
|
—
|
|
—
|
|
—
|
|
—
|
|
—
|
|
—
|
|
—
|
|
—
|
|
506
|
|
—
|
|
506
|
|
||||||||||||||||||||
|
Foreign currency translation adjustment
|
—
|
|
—
|
|
—
|
|
—
|
|
—
|
|
—
|
|
—
|
|
—
|
|
—
|
|
(1,869
|
)
|
—
|
|
(1,869
|
)
|
||||||||||||||||||||
|
Contributions from redeemable non-controlling interest
|
6,392
|
|
—
|
|
—
|
|
—
|
|
—
|
|
—
|
|
—
|
|
—
|
|
—
|
|
—
|
|
—
|
|
—
|
|
||||||||||||||||||||
|
Net (loss) income
|
(35
|
)
|
—
|
|
—
|
|
—
|
|
—
|
|
—
|
|
12,032
|
|
—
|
|
—
|
|
—
|
|
—
|
|
12,032
|
|
||||||||||||||||||||
|
Balance, December 31, 2016
|
$
|
6,847
|
|
27,706,866
|
|
$
|
3
|
|
18,000,000
|
|
$
|
2
|
|
$
|
112,926
|
|
$
|
194,353
|
|
1,298,418
|
|
$
|
(6,387
|
)
|
$
|
(6,591
|
)
|
$
|
—
|
|
$
|
294,306
|
|
|||||||||||
54
AMERESCO, INC.
(in thousands)
|
|
Year Ended December 31,
|
||||||||||
|
|
2016
|
2015
|
2014
|
||||||||
|
Cash flows from operating activities:
|
|
|
|
|
|||||||
|
Net income (loss)
|
$
|
11,997
|
|
$
|
(4,684
|
)
|
$
|
10,383
|
|
||
|
Adjustments to reconcile net income (loss) to net cash flows from operating activities:
|
|||||||||||
|
Depreciation of project assets
|
19,377
|
|
16,911
|
|
15,047
|
|
|||||
|
Depreciation of property and equipment
|
3,020
|
|
3,263
|
|
3,044
|
|
|||||
|
Amortization of deferred financing fees
|
1,503
|
|
1,139
|
|
1,353
|
|
|||||
|
Amortization of intangible assets
|
2,358
|
|
4,150
|
|
4,738
|
|
|||||
|
Provision for bad debts
|
5,392
|
|
4,102
|
|
1,988
|
|
|||||
|
Gain on sale of assets
|
—
|
|
(17
|
)
|
—
|
|
|||||
|
Unrealized gain on interest rate swaps
|
(279
|
)
|
(368
|
)
|
(1,418
|
)
|
|||||
|
Stock-based compensation expense
|
1,462
|
|
1,769
|
|
2,493
|
|
|||||
|
Deferred income taxes
|
2,867
|
|
4,086
|
|
(2,749
|
)
|
|||||
|
Excess tax benefits from stock-based compensation arrangements
|
(99
|
)
|
50
|
|
(918
|
)
|
|||||
|
Unrealized foreign exchange loss
|
167
|
|
2,083
|
|
1,054
|
|
|||||
|
Changes in operating assets and liabilities:
|
|||||||||||
|
Restricted cash
|
(5,423
|
)
|
3,108
|
|
300
|
|
|||||
|
Accounts receivable
|
(12,002
|
)
|
(4,472
|
)
|
8,611
|
|
|||||
|
Accounts receivable retainage
|
3,875
|
|
(3,825
|
)
|
3,289
|
|
|||||
|
Federal ESPC receivable
|
(116,753
|
)
|
(73,243
|
)
|
(59,457
|
)
|
|||||
|
Inventory
|
1,118
|
|
(4,327
|
)
|
1,308
|
|
|||||
|
Costs and estimated earnings in excess of billings
|
31,170
|
|
(22,904
|
)
|
4,587
|
|
|||||
|
Prepaid expenses and other current assets
|
(98
|
)
|
(3,369
|
)
|
5,526
|
|
|||||
|
Project development costs
|
4,162
|
|
(4,581
|
)
|
482
|
|
|||||
|
Other assets
|
(525
|
)
|
(4,083
|
)
|
(1,907
|
)
|
|||||
|
Accounts payable, accrued expenses and other current liabilities
|
(2,798
|
)
|
26,273
|
|
9,496
|
|
|||||
|
Billings in excess of cost and estimated earnings
|
(6,974
|
)
|
10,674
|
|
811
|
|
|||||
|
Other liabilities
|
(3,578
|
)
|
(2,444
|
)
|
(7,414
|
)
|
|||||
|
Income taxes payable
|
1,988
|
|
1,171
|
|
661
|
|
|||||
|
Cash flows from operating activities
|
(58,073
|
)
|
(49,538
|
)
|
1,308
|
|
|||||
|
Cash flows from investing activities:
|
|
|
|||||||||
|
Purchases of property and equipment
|
(2,807
|
)
|
(1,343
|
)
|
(1,745
|
)
|
|||||
|
Purchases of project assets
|
(73,234
|
)
|
(51,340
|
)
|
(26,679
|
)
|
|||||
|
Grant awards and rebates received on project assets
|
—
|
|
—
|
|
3,727
|
|
|||||
|
Proceeds from sales of assets
|
—
|
|
854
|
|
—
|
|
|||||
|
Acquisitions, net of cash received
|
(3,575
|
)
|
—
|
|
(13,903
|
)
|
|||||
|
Cash flows from investing activities
|
$
|
(79,616
|
)
|
$
|
(51,829
|
)
|
$
|
(38,600
|
)
|
||
The accompanying notes are an integral part of these consolidated financial statements.
55
AMERESCO, INC.
CONSOLIDATED STATEMENTS OF CASH FLOWS — (Continued)
(in thousands)
|
|
Year Ended December 31,
|
||||||||||
|
|
2016
|
2015
|
2014
|
||||||||
|
Cash flows from financing activities:
|
|
|
|
|
|||||||
|
Excess tax benefits from stock-based compensation arrangements
|
$
|
99
|
|
$
|
(50
|
)
|
$
|
918
|
|
||
|
Payments of financing fees
|
(1,908
|
)
|
(2,748
|
)
|
(374
|
)
|
|||||
|
Proceeds from exercises of options
|
1,054
|
|
1,153
|
|
1,447
|
|
|||||
|
Repurchase of common stock
|
(6,387
|
)
|
—
|
|
—
|
|
|||||
|
Proceeds from senior secured credit facility
|
3,822
|
|
6,300
|
|
5,000
|
|
|||||
|
Proceeds from long-term debt financing
|
38,004
|
|
17,747
|
|
—
|
|
|||||
|
Proceeds from Federal ESPC projects
|
90,039
|
|
77,971
|
|
51,165
|
|
|||||
|
Proceeds from sale-leaseback financing
|
17,045
|
|
12,506
|
|
—
|
|
|||||
|
Non-controlling interest
|
—
|
|
(116
|
)
|
(9
|
)
|
|||||
|
Proceeds from investment by redeemable non-controlling interest
|
6,392
|
|
6,018
|
|
—
|
|
|||||
|
Restricted cash
|
3,155
|
|
(5,684
|
)
|
3,021
|
|
|||||
|
Payments on long-term debt
|
(14,014
|
)
|
(12,392
|
)
|
(18,392
|
)
|
|||||
|
Cash flows from financing activities
|
137,301
|
|
100,705
|
|
42,776
|
|
|||||
|
Effect of exchange rate changes on cash
|
(650
|
)
|
(1,455
|
)
|
1,107
|
|
|||||
|
Net (decrease) increase in cash and cash equivalents
|
(1,038
|
)
|
(2,117
|
)
|
6,591
|
|
|||||
|
Cash and cash equivalents, beginning of year
|
21,645
|
|
23,762
|
|
17,171
|
|
|||||
|
Cash and cash equivalents, end of year
|
$
|
20,607
|
|
$
|
21,645
|
|
$
|
23,762
|
|
||
|
Supplemental disclosures of cash flow information:
|
|||||||||||
|
Cash paid for interest
|
$
|
7,220
|
|
$
|
5,537
|
|
$
|
6,583
|
|
||
|
Cash paid for income taxes
|
$
|
3,475
|
|
$
|
1,437
|
|
$
|
3,125
|
|
||
|
Non-cash Federal ESPC settlement
|
$
|
79,075
|
|
$
|
26,606
|
|
$
|
24,587
|
|
||
|
Accrued purchases of project assets
|
$
|
19,506
|
|
$
|
5,065
|
|
$
|
3,229
|
|
||
The accompanying notes are an integral part of these consolidated financial statements.
56
AMERESCO, INC.
NOTES TO CONSOLIDATED FINANCIAL STATEMENTS
NOTES TO CONSOLIDATED FINANCIAL STATEMENTS
(in thousands, except share and per share amounts)
1. DESCRIPTION OF BUSINESS
Ameresco, Inc. (including its subsidiaries, the “Company”) was organized as a Delaware corporation on April 25, 2000. The Company is a provider of energy efficiency solutions for facilities throughout North America and Europe. The Company provides solutions, both products and services, that enable customers to reduce their energy consumption, lower their operating and maintenance costs and realize environmental benefits. The Company’s comprehensive set of services includes upgrades to a facility’s energy infrastructure and the construction and operation of small-scale renewable energy plants. It also sells certain photovoltaic (“PV”) equipment worldwide. The Company operates in the United States, Canada and Europe.
The Company is compensated through a variety of methods, including: 1) direct payments based on fee-for-services contracts (utilizing lump-sum or cost-plus pricing methodologies); 2) the sale of energy from the Company’s operating assets; and 3) direct payment for PV equipment and systems.
2. SUMMARY OF SIGNIFICANT ACCOUNTING POLICIES
Certain amounts have been reclassified in the prior year financial statements to conform to the current year presentation.
Revision to Previously Issued Financial Statements
The Company provides for deferred income taxes based on the expected future tax consequences of differences between financial statement basis and the tax basis of assets and liabilities calculated using the enacted tax rates in effect for the year in which the differences are expected to be reflected in the tax return. In 2016, the Company determined that they did not provide for the deferred tax liability and related income tax provision during the year ended December 31, 2015 related to the outside basis difference in its consolidated investment in the investment fund. The investment fund is discussed in Notes 9 and 10. As a result, the prior period was revised as follows: (i) total long term liabilities increased by
$2,133
as of December 31, 2015 as a result of increasing the deferred tax liability and retained earnings decreased by the same amount as of December 31, 2015, (ii) the income tax provision increased by
$2,133
for the year ended December 31, 2015 which resulted in an increase to net loss and a decrease of net income attributable to Ameresco, Inc. of the same amount for the year ended December 31, 2015, (iii) the basic and diluted net income per share attributable to Ameresco, Inc. decreased from
$0.06
to
$0.02
, (iv) an increase in comprehensive loss, and comprehensive loss attributable to shareholders of
$2,133
for the year ended December 31, 2015, and (v) net loss increased and deferred income taxes decreased within the cash flows from operating activities by
$2,133
resulting in
no
change to cash flows from operating activities for the year ended December 31, 2015. The Company has determined that the impact on its previously issued financial statements was not material.
Principles of Consolidation
The accompanying consolidated financial statements include the accounts of the Company, its subsidiaries in which the Company has a controlling financial interest and an investment fund formed to fund the purchase of solar energy systems, which is consolidated as a variable interest entity (“VIE”). The Company uses a qualitative approach in assessing the consolidation requirement for VIEs. This approach focuses on determining whether the Company has the power to direct the activities of the VIE that most significantly affect the VIE’s economic performance and whether the Company has the obligation to absorb losses or the right to receive benefits that could potentially be significant to the VIE. For all periods presented, the Company has determined that it is the primary beneficiary in all of its operational VIEs. The Company evaluates its relationships with the VIEs on an ongoing basis to ensure that it continues to be the primary beneficiary. All significant intercompany accounts and transactions have been eliminated. Gains and losses from the translation of all foreign currency financial statements are recorded in accumulated other comprehensive loss, net within stockholders’ equity.
The Company prepares its financial statements in conformity with accounting principles generally accepted in the United States of America (“GAAP”).
Use of Estimates
GAAP requires management to make estimates and assumptions that affect the reported amounts of assets and liabilities, the disclosure of contingent assets and liabilities at the date of the financial statements and the reported amounts of revenues and expenses during the reporting period. The most significant estimates and assumptions used in these consolidated financial statements relate to management’s estimates of final construction contract profit in accordance with accounting for long-term contracts, allowance for doubtful accounts, inventory reserves, realization of project development costs, fair value of derivative
57
AMERESCO, INC.
NOTES TO CONSOLIDATED FINANCIAL STATEMENTS - (Continued)
NOTES TO CONSOLIDATED FINANCIAL STATEMENTS - (Continued)
(in thousands, except share and per share amounts)
financial instruments and stock-based awards, impairment of long lived assets, income taxes, self insurance reserves and potential liability in conjunction with certain commitments and contingencies. Actual results could differ from those estimates.
The Company is self-insured for employee health insurance. The maximum exposure in fiscal year 2016 under the plan was
$100
per covered participant, after which reinsurance takes effect. The liability for unpaid claims and associated expenses, including incurred but not reported claims, is determined by management and reflected in the Company’s consolidated balance sheets in accrued expenses and other current liabilities. The liability is calculated based on historical data, which considers both the frequency and settlement amount of claims. The Company’s estimated accrual for this liability could be different than its ultimate obligation if variables such as the frequency or amount of future claims differ significantly from management’s assumptions.
5
Cash and Cash Equivalents
Cash and cash equivalents includes cash on deposit, overnight repurchase agreements and amounts invested in highly liquid money market funds. Cash equivalents consist of short term investments with original maturities of three months or less. The Company maintains accounts with financial institutions and the balances in such accounts, at times, exceed federally insured limits. This credit risk is divided among a number of financial institutions that management believes to be of high quality. The carrying amount of cash and cash equivalents approximates its fair value measured using level 1 inputs per the fair value hierarchy as defined in Note 16.
Restricted Cash
Restricted cash consists of cash and cash equivalents held in an escrow account in association with construction draws for energy savings performance contracts (“ESPC”), construction of project assets, operations and maintenance (“O&M”) reserve accounts and cash collateralized letters of credit as well as cash required under term loans to be maintained in debt service reserve accounts until all obligations have been indefeasibly paid in full. These accounts are primarily invested in highly liquid money market funds. The carrying amount of the cash and cash equivalents in these accounts approximates its fair value measured using level one inputs per the fair value hierarchy as defined in Note 16. Restricted cash also includes funds held for clients, which represent assets that, based upon the Company’s intent, are restricted for use solely for the purposes of satisfying the obligations to remit funds to third parties, primarily utility service providers, relating to the Company’s enterprise energy management services. As of
December 31, 2016
and
2015
, the Company classified the non-current portion of restricted cash of
$19,920
and
$13,515
, respectively, in other assets on its consolidated balance sheets.
Accounts Receivable
Accounts receivable are stated at the amount management expects to collect from outstanding balances. An allowance for doubtful accounts is provided for those accounts receivable considered to be uncollectible based upon historical experience and management’s evaluation of outstanding accounts receivable. Bad debts are written off against the allowance when identified.
Changes in the allowance for doubtful accounts are as follows:
|
Year Ended December 31,
|
|||||||||||
|
|
2016
|
2015
|
2014
|
||||||||
|
Allowance for doubtful accounts, beginning of period
|
$
|
3,729
|
|
$
|
2,851
|
|
$
|
1,519
|
|
||
|
Charges to costs and expenses
|
4,332
|
|
1,451
|
|
1,988
|
|
|||||
|
Account write-offs and other
|
(225
|
)
|
(573
|
)
|
(656
|
)
|
|||||
|
Allowance for doubtful accounts, end of period
|
$
|
7,836
|
|
$
|
3,729
|
|
$
|
2,851
|
|
||
During the year ended ended
December 31, 2016
, the Company reserved for certain assets related to a customer who declared bankruptcy. Of this amount,
$2,394
was recorded as an allowance for doubtful accounts in accounts receivable, net. In addition, the Company recorded a
$476
charge to write-off costs and estimated earnings in excess of billings and a
$325
charge for project costs incurred during the first quarter of 2016. The Company has additional exposure of
$758
for the remaining receivables. During the year ended
December 31, 2016
, the Company also reserved for certain assets in its Canada segment totaling
$1,934
due to collectability concerns as a result of its previously disclosed restructuring efforts. This reserve included
$1,655
for doubtful accounts in accounts receivable, net and
$279
reserved against accounts receivable retainage, net.
58
AMERESCO, INC.
NOTES TO CONSOLIDATED FINANCIAL STATEMENTS - (Continued)
NOTES TO CONSOLIDATED FINANCIAL STATEMENTS - (Continued)
(in thousands, except share and per share amounts)
Accounts Receivable Retainage
Accounts receivable retainage represents amounts due from customers, but where payments are withheld contractually until certain construction milestones are met. Amounts retained typically range from
5%
to
10%
of the total invoice. The Company classifies as a current asset those retainages that are expected to be billed in the next twelve months. During the year ended
December 31, 2015
, based upon an evaluation by management, the Company recorded a reserve totaling
$1,282
against the accounts receivable retainage balance for amounts determined to be potentially uncollectible. For the year ended
December 31, 2016
, the Company recorded an additional reserve of
$279
against the remaining accounts receivable retainage, net balance.
Inventory
Inventories, which consist primarily of PV solar panels, batteries and related accessories, are stated at the lower of cost (“first-in, first-out” method) or net realizable value (determined as the estimated selling prices in the ordinary course of business, less reasonably predictable costs of completion, disposal, and transportation). Provisions have been made to reduce the carrying value of inventory to the net realizable value.
Prepaid Expenses
Prepaid expenses consist primarily of short-term prepaid expenditures that will amortize within one year.
Federal ESPC Receivable
Federal ESPC receivable represents the amount to be paid by various federal government agencies for work performed and earned by the Company under specific ESPCs. The Company assigns certain of its rights to receive those payments to third-party investors that provide construction and permanent financing for such contracts. Upon completion and acceptance of the project by the government, typically within 24 months of construction commencement, the assigned ESPC receivable from the government and corresponding ESPC liability are eliminated from the Company’s consolidated financial statements.
Project Development Costs
The Company capitalizes as project development costs only those costs incurred in connection with the development of energy projects, primarily direct labor, interest costs, outside contractor services, consulting fees, legal fees and travel, if incurred after a point in time where the realization of related revenue becomes probable. Project development costs incurred prior to the probable realization of revenue are expensed as incurred. The Company classifies as a current asset those project development efforts that are expected to proceed to construction activity in the twelve months that follow. The Company periodically reviews these balances and writes off any amounts where the realization of the related revenue is no longer probable.
Property and Equipment
Property and equipment consists primarily of office and computer equipment, and is recorded at cost. Major additions and improvements are capitalized as additions to the property and equipment accounts, while replacements, maintenance and repairs that do not improve or extend the life of the respective assets, are expensed as incurred. Depreciation and amortization of property and equipment are computed on a straight-line basis over the following estimated useful lives:
|
Asset Classification
|
|
Estimated Useful Life
|
|
Furniture and office equipment
|
|
Five years
|
|
Computer equipment and software costs
|
|
Three to five years
|
|
Leasehold improvements
|
|
Lesser of term of lease or five years
|
|
Automobiles
|
|
Five years
|
|
Land
|
Unlimited
|
|
Project Assets
Project assets consist of costs of materials, direct labor, interest costs, outside contract services, deposits and project development costs incurred in connection with the construction of small-scale renewable energy plants that the Company owns and the implementation of energy savings contracts. These amounts are capitalized and amortized to cost of revenues in the Company’s consolidated statements of income (loss) on a straight line basis over the lives of the related assets or the terms of the related contracts.
59
AMERESCO, INC.
NOTES TO CONSOLIDATED FINANCIAL STATEMENTS - (Continued)
NOTES TO CONSOLIDATED FINANCIAL STATEMENTS - (Continued)
(in thousands, except share and per share amounts)
The Company capitalizes interest costs relating to construction financing during the period of construction. Capitalized interest is included in project assets, net, in the Company’s consolidated balance sheets. Capitalized interest is amortized to cost of revenues in the Company’s consolidated statements of income (loss) on a straight line basis over the useful life of the associated project asset. The amount of interest capitalized for the years ended
December 31, 2016
,
2015
and
2014
was
$1,253
, $
941
and $
518
, respectively.
Routine maintenance costs are expensed in the current year’s consolidated statements of income (loss) to the extent that they do not extend the life of the asset. Major maintenance, upgrades and overhauls are required for certain components of the Company’s assets. In these instances, the costs associated with these upgrades are capitalized and are depreciated over the shorter of the remaining life of the asset or the period until the next required major maintenance or overhaul. Gains or losses on disposal of property and equipment are reflected in selling, general and administrative expenses in the consolidated statements of income (loss).
The Company evaluates its long-lived assets for impairment as events or changes in circumstances indicate the carrying value of these assets may not be fully recoverable. Examples of such triggering events applicable to the Company’s assets include a significant decrease in the market price of a long-lived asset or asset group or a current-period operating or cash flow loss combined with a history of operating or cash flow losses or a projection or forecast that demonstrates continuing losses associated with the use of a long-lived asset or asset group.
The Company evaluates recoverability of long-lived assets to be held and used by estimating the undiscounted future cash flows before interest associated with the expected uses and eventual disposition of those assets. When these comparisons indicate that the carrying value of those assets is greater than the undiscounted cash flows, the Company recognizes an impairment loss for the amount that the carrying value exceeds the fair value.
From time to time, the Company has applied for and received cash grant awards from the U.S. Treasury Department (the “Treasury”) under Section 1603 of the American Recovery and Reinvestment Act of 2009 (the “Act”). The Act authorized the Treasury to make payments to eligible persons who place in service qualifying renewable energy projects. The grants are paid in lieu of investment tax credits. All of the cash proceeds from the grants were used and recorded as a reduction in the cost basis of the applicable project assets. If the Company disposes of the property, or the property ceases to qualify as specified energy property, within five years from the date the property is placed in service, then a prorated portion of the Section 1603 payment must be repaid.
The Company did
no
t receive any Section 1603 grants during the years ended
December 31, 2016
and
December 31, 2015
. The Company received
$3,727
in Section 1603 grants during the year ended
December 31, 2014
. No further Section 1603 grant payments are expected to be received as the program has expired.
For tax purposes, the Section 1603 payments are not included in federal and certain state taxable income and the basis of the property is reduced by 50% of the payment received. Deferred grant income of
$7,739
and
$8,291
in the accompanying consolidated balance sheets at
December 31, 2016
and
2015
, respectively, represents the benefit of the basis difference to be amortized to income tax expense over the life of the related property.
Deferred Financing Fees
Deferred financing fees relate to the external costs incurred to obtain financing for the Company. Deferred financing fees are amortized over the respective term of the financing using the effective interest method, with the exception of the Company’s revolving credit facility and construction loans, as discussed in Note 7, for which deferred financing fees are amortized on a straight line basis over the term of the agreement. Deferred financing fees are presented on the consolidated balance sheets as a reduction to long-term debt and capital lease liabilities.
Goodwill and Intangible Assets
The Company has classified as goodwill the amounts paid in excess of fair value of the net assets (including tax attributes) of companies acquired in purchase transactions. The Company has recorded intangible assets related to customer contracts, customer relationships, non-compete agreements, trade names and technology, each with defined useful lives. The Company assesses the impairment of goodwill and intangible assets that have indefinite lives on an annual basis (December 31
st
) and whenever events or changes in circumstances indicate that the carrying value of the asset may not be recoverable. The Company would record an impairment charge if such an assessment were to indicate that the fair value of such assets was less than their carrying values. Judgment is required in determining whether an event has occurred that may impair the value of goodwill or identifiable intangible assets.
60
AMERESCO, INC.
NOTES TO CONSOLIDATED FINANCIAL STATEMENTS - (Continued)
NOTES TO CONSOLIDATED FINANCIAL STATEMENTS - (Continued)
(in thousands, except share and per share amounts)
Factors that could indicate that an impairment may exist include significant under-performance relative to plan or long-term projections, significant changes in business strategy, significant negative industry or economic trends or a significant decline in the base price of the Company’s publicly traded stock for a sustained period of time.
Although the Company believes goodwill and intangible assets are appropriately stated in the accompanying consolidated financial statements, changes in strategy or market conditions could significantly impact these judgments and require an adjustment to the recorded balance.
In August 2014, the Company acquired the energy consultancy and energy project management business of Energyexcel LLP (“EEX”), an independent energy services provider located in Central London, U.K. The Company paid
$9,054
to acquire substantially all of the assets of EEX. The purchase price is subject to post-closing adjustments for working capital and for certain indemnity obligations of the seller and its owners. The Company deposited approximately
$834
of the initial cash payment with a third-party escrow agent as security for these matters.
Acquired intangible assets other than goodwill that are subject to amortization include customer contracts and customer relationships, as well as software/technology, trade names and non-compete agreements. The intangible assets are amortized over periods ranging from
one
to
fifteen
years from their respective acquisition dates.
See Notes 3 and 4 for additional disclosures.
Other Assets
Other assets consist primarily of notes and contracts receivable due to the Company from various customers and non-current restricted cash. Other assets also include the non-current portion of project development costs, accounts receivable retainages, sale-leaseback deferred loss and deferred contract costs.
Asset Retirement Obligations
The Company recognizes a liability for the fair value of required asset retirement obligations (“AROs”) when such obligations are incurred. The liability is estimated on a number of assumptions requiring management’s judgment, including equipment removal costs, site restoration costs, salvage costs, cost inflation rates and discount rates and is credited to its projected future value over time. The capitalized asset is depreciated using the convention of depreciation of plant assets. Upon satisfaction of the ARO conditions, any difference between the recorded ARO liability and the actual retirement cost incurred is recognized as an operating gain or loss in the consolidated statements of income (loss). As of
December 31, 2016
and
2015
the Company had no ARO liabilities recorded.
Federal ESPC Liabilities
Federal ESPC liabilities represent the advances received from third-party investors under agreements to finance certain ESPC projects with various federal government agencies. Upon completion and acceptance of the project by the government, typically within 24 months of construction commencement, the ESPC receivable from the government and corresponding ESPC liability is eliminated from the Company’s consolidated balance sheet. Until recourse to the Company ceases for the ESPC receivables transferred to the investor, upon final acceptance of the work by the government customer, the Company remains the primary obligor for financing received.
Sale-Leaseback
During the first quarter of 2015, the Company entered into an agreement with an investor which gives the Company the option to sell and contemporaneously lease back solar photovoltaic (“solar PV”) projects. In September 2016, the Company amended its agreement with the investor whereas the investor has committed up to a maximum combined funding amount of
$100,000
through June 30, 2017 on certain projects. See below for a summary of solar PV project sales by fiscal year:
|
Year Ended
|
# Solar PV Projects Sold
|
Sale Price
|
Deferred Gain Recorded
|
Deferred Loss Recorded
|
Capital Lease Asset/Liability Recorded
|
Initial Lease Term
|
Minimum Lease Payment
|
Maximum Lease Payment
|
||||||||||||||
|
Year-ended December 31, 2015
|
3
|
12,506
|
|
933
|
|
924
|
|
6,810
|
|
20
|
7
|
|
348
|
|
||||||||
|
Year-ended December 31, 2016
|
6
|
17,045
|
|
906
|
|
145
|
|
8,830
|
|
20-25
|
2
|
|
397
|
|
||||||||
61
AMERESCO, INC.
NOTES TO CONSOLIDATED FINANCIAL STATEMENTS - (Continued)
NOTES TO CONSOLIDATED FINANCIAL STATEMENTS - (Continued)
(in thousands, except share and per share amounts)
As part of the agreement, the Company is a party to a master lease agreement that provides for the sale of solar PV projects to a third-party investor and the simultaneous leaseback of the projects, which the Company then operates and maintains, recognizing revenue through the sale of the electricity and solar renewable energy credits generated by these projects. In sale-leaseback arrangements, the Company first determines whether the solar PV project under the sale-leaseback arrangement is “integral equipment.” A solar PV project is determined to be integral equipment when the cost to remove the project from its existing location, including the shipping and reinstallation costs of the solar PV project at the new site, including any diminution in fair value, exceeds
10%
of the fair value of the solar PV project at the time of its original installation. When the leaseback arrangement expires, the Company has the option to purchase the solar PV project for the then fair market value or, in certain circumstances, renew the lease for an extended term. All solar PV projects sold to date under the sale-leaseback program have been determined by the Company not to be integral equipment as the cost to remove the project from its existing location would not exceed
10%
of its original fair value.
For solar PV projects that the Company has determined not to be integral equipment, the Company then determines if the leaseback should be classified as a capital lease or an operating lease. All solar PV projects sold to date under the sale-leaseback program have been determined by the Company to be capital leases. For leasebacks classified as capital leases, the Company initially records a capital lease asset and capital lease obligation in its consolidated balance sheet equal to the lower of the present value of the Company’s future minimum leaseback payments or the fair value of the solar PV project. For capital leasebacks, the Company defers any gain or loss, representing the excess or shortfall of cash received from the investor compared to the net book value of the asset in the Company’s consolidated balance sheet at the time of the sale. The Company records the long term portion of any deferred gain or loss in other liabilities and other assets, respectively, and the current portion of any deferred gain and loss in accrued expenses and other current liabilities and prepaid expenses and other current assets, respectively, in its consolidated balance sheet and amortizes the deferred amounts over the lease term in cost of revenues in its consolidated statements of income (loss). Net amortization expense in cost of revenues related to deferred gains and losses was
$(24)
of net gains for the year ended December 31,
2016
.
Other Liabilities
Other liabilities consist primarily of deferred revenue related to multi-year operation and maintenance contracts which expire at various dates through 2033. Other liabilities also include the fair value of derivatives and the long term portion of sale-leaseback deferred gains. See Note 17 for additional disclosures.
Revenue Recognition
The Company derives revenues from energy efficiency and renewable energy products and services. Energy efficiency products and services include the design, engineering, and installation of equipment and other measures to improve the efficiency, and control the operation, of a facility’s energy infrastructure. Renewable energy products and services include the construction of small-scale plants that produce electricity, gas, heat or cooling from renewable sources of energy, the sale of such electricity, gas, heat or cooling from plants that the Company owns, and the sale and installation of solar energy products and systems.
Revenue from the installation or construction of projects is recognized on a percentage-of-completion basis. The percentage-of-completion for each project is determined on an actual cost-to-estimated final cost basis. Maintenance revenue is recognized as related services are performed. In accordance with industry practice, the Company includes in current assets and liabilities the amounts of receivables related to construction projects realizable and payable over a period in excess of one year. The revenue associated with contract change orders is recognized only when the authorization for the change order has been properly executed and the work has been performed.
When the estimate on a contract indicates a loss, or claims against costs incurred reduce the likelihood of recoverability of such costs, the Company records the entire expected loss immediately, regardless of the percentage of completion.
Billings in excess of cost and estimated earnings represents advanced billings on certain construction contracts. Costs and estimated earnings in excess of billings represent certain amounts under customer contracts that were earned and billable but not invoiced.
The Company sells certain products and services in bundled arrangements, where multiple products and/or services are involved. The Company divides bundled arrangements into separate deliverables and revenue is allocated to each deliverable based on the relative selling price. The relative selling price is determined using third-party evidence or management’s best estimate of selling price.
62
AMERESCO, INC.
NOTES TO CONSOLIDATED FINANCIAL STATEMENTS - (Continued)
NOTES TO CONSOLIDATED FINANCIAL STATEMENTS - (Continued)
(in thousands, except share and per share amounts)
The Company recognizes revenues from the sale and delivery of products, including the output from renewable energy plants, when produced and delivered to the customer, in accordance with specific contract terms, provided that persuasive evidence of an arrangement exists, the Company’s price to the customer is fixed or determinable and collectability is reasonably assured.
The Company recognizes revenues from O&M contracts, consulting services and enterprise energy management services as the related services are performed.
For a limited number of contracts under which the Company receives additional revenue based on a share of energy savings, such additional revenue is recognized as energy savings are generated.
Cost of Revenues
Cost of revenues include the cost of labor, materials, equipment, subcontracting and outside engineering that are required for the development and installation of projects, as well as preconstruction costs, sales incentives, associated travel, inventory obsolescence charges, amortization of intangible assets related to customer contracts, and, if applicable, costs of procuring financing. A majority of the Company’s contracts have fixed price terms; however, in some cases the Company negotiates protections, such as a cost-plus structure, to mitigate the risk of rising prices for materials, services and equipment.
Cost of revenues also include the costs of maintaining and operating the small-scale renewable energy plants that the Company owns, including the cost of fuel (if any) and depreciation charges.
Income Taxes
The Company provides for income taxes based on the liability method. The Company provides for deferred income taxes based on the expected future tax consequences of differences between the financial statement basis and the tax basis of assets and liabilities calculated using the enacted tax rates in effect for the year in which the differences are expected to be reflected in the tax return.
The Company accounts for uncertain tax positions using a “more-likely-than-not” threshold for recognizing and resolving uncertain tax positions. The evaluation of uncertain tax positions is based on factors that include, but are not limited to, changes in tax law, the measurement of tax positions taken or expected to be taken in tax returns, the effective settlement of matters subject to audit, new audit activity and changes in facts or circumstances related to a tax position. The Company evaluates uncertain tax positions on a quarterly basis and adjusts the level of the liability to reflect any subsequent changes in the relevant facts surrounding the uncertain positions.
The Company’s liabilities for uncertain tax positions can be relieved only if the contingency becomes legally extinguished through either payment to the taxing authority or the expiration of the statute of limitations, the recognition of the benefits associated with the position meet the “more-likely-than-not” threshold or the liability becomes effectively settled through the examination process.
The Company considers matters to be effectively settled once the taxing authority has completed all of its required or expected examination procedures, including all appeals and administrative reviews; the Company has no plans to appeal or litigate any aspect of the tax position; and the Company believes that it is highly unlikely that the taxing authority would examine or re-examine the related tax position. The Company also accrues for potential interest and penalties, related to unrecognized tax benefits in income tax expense.
In November 2015, the Financial Accounting Standards Board (“FASB”) issued Accounting Standards Update (“ASU”) 2015-17, which simplifies the presentation of deferred income taxes. The Company elected to early adopt ASU 2015-17 retrospectively in the fourth quarter of 2015. As a result, it has presented all deferred tax assets and liabilities as noncurrent on its consolidated balance sheet as of December 31, 2016 and 2015, respectively.
See Note 8 for additional information on the Company’s income taxes.
Foreign Currency
The local currency of the Company’s foreign operations is considered the functional currency of such operations. All assets and liabilities of the Company’s foreign operations are translated into U.S. dollars at year-end exchange rates. Income and expense items are translated at average exchange rates prevailing during the year. Translation adjustments are accumulated as a separate component of stockholders’ equity. Foreign currency translation gains and losses are reported in the consolidated
63
AMERESCO, INC.
NOTES TO CONSOLIDATED FINANCIAL STATEMENTS - (Continued)
NOTES TO CONSOLIDATED FINANCIAL STATEMENTS - (Continued)
(in thousands, except share and per share amounts)
statements of comprehensive income (loss). Foreign currency transaction gains and losses are reported in the consolidated statements of income (loss).
Financial Instruments
Financial instruments consist of cash and cash equivalents, restricted cash, accounts and notes receivable, long-term contract receivables, accounts payable, accrued expenses, short- and long-term debt and interest rate swaps. The estimated fair value of cash and cash equivalents, restricted cash, accounts and notes receivable, long-term contract receivables, accounts payable and accrued expenses approximates their carrying value. See below for fair value measurements of long-term debt. See Note 16 for fair value measurement of interest rate swaps.
Stock-Based Compensation Expense
Stock-based compensation expense results from the issuance of shares of restricted common stock and grants of stock options to employees, directors, outside consultants and others. The Company recognizes the costs associated with restricted stock and option grants using the fair value recognition provisions of accounting standards codification (“ASC”) 718,
Compensation - Stock Compensation
(“ASC 718”) on a straight-line basis over the vesting period of the awards. Certain option grants have performance conditions that must be achieved prior to vesting and are expensed based on the expected achievement at each reporting period.
Stock-based compensation expense is recognized based on the grant-date fair value. The Company estimates the fair value of the stock-based awards, including stock options, using the Black-Scholes option-pricing model. Determining the fair value of stock-based awards requires the use of highly subjective assumptions, including the fair value of the common stock underlying the award, the expected term of the award and expected stock price volatility.
The assumptions used in determining the fair value of stock-based awards represent management’s estimates, which involve inherent uncertainties and the application of management judgment. As a result, if factors change, and different assumptions are employed, the stock-based compensation could be materially different in the future. The risk-free interest rates are based on the U.S. Treasury yield curve in effect at the time of grant, with maturities approximating the expected life of the stock options.
The Company has no history of paying dividends. Additionally, as of each of the grant dates, there was no expectation that the Company would pay dividends over the expected life of the options. The expected life of the awards is estimated using historical data and management’s expectations. Beginning in the year ended
December 31, 2016
, the Company uses historical volatility as the expected volatility assumption required in the Black-Scholes model. Prior to the year ended
December 31, 2016
. because there was no public market for the Company’s common stock prior to the Company’s initial public offering, management lacked company-specific historical and implied volatility information. Therefore, estimates of expected stock volatility were based on that of publicly traded peer companies.
The Company is required to recognize compensation expense for only the portion of options that are expected to vest. Actual historical forfeiture rate of options is based on employee terminations and the number of shares forfeited. This data and other qualitative factors are considered by the Company in determining the forfeiture rate used in recognizing stock compensation expense. If the actual forfeiture rate varies from historical rates and estimates, additional adjustments to compensation expense may be required in future periods. If there are any modifications or cancellations of the underlying unvested securities or the terms of the stock option, it may be necessary to accelerate, increase or cancel any remaining unamortized stock-based compensation expense.
The Company also accounts for equity instruments issued to non-employee directors and consultants at fair value. All transactions in which goods or services are the consideration received for the issuance of equity instruments are accounted for based on the fair value of the consideration received or the fair value of the equity instrument issued, whichever is more reliably measurable. The measurement date of the fair value of the equity instrument issued is the date on which the counterparty’s performance is complete. No awards to individuals who were not either an employee or director of the Company occurred during the years ended December 31,
2016
,
2015
and
2014
.
Fair Value Measurements
The Company follows the guidance related to fair value measurements for all of its non-financial assets and non-financial liabilities, except for those recognized at fair value in the financial statements at least annually. These assets include goodwill
64
AMERESCO, INC.
NOTES TO CONSOLIDATED FINANCIAL STATEMENTS - (Continued)
NOTES TO CONSOLIDATED FINANCIAL STATEMENTS - (Continued)
(in thousands, except share and per share amounts)
and long-lived assets measured at fair value for impairment assessments, and non-financial assets and liabilities initially measured at fair value in a business combination.
The Company’s financial instruments include cash and cash equivalents, restricted cash, accounts and notes receivable, long-term contract receivables, interest rate swaps, accounts payable, accrued expenses, capital lease assets and liabilities and short- and long-term borrowings. Because of their short maturity, the carrying amounts of cash and cash equivalents, restricted cash, accounts and notes receivable, accounts payable, accrued expenses and short-term borrowings approximate fair value. The carrying value of long-term variable-rate debt approximates fair value. As of
December 31, 2016
, the fair value of the Company’s long-term debt exceeds its carrying value by approximately
$508
. Fair value of the Company’s debt is based on quoted market prices or on rates available to the Company for debt with similar terms and maturities, which are level two inputs of the fair value hierarchy, as defined in Note 16.
The Company accounts for its interest rate swaps as derivative financial instruments in accordance with the related guidance. Under this guidance, derivatives are carried on the Company’s consolidated balance sheets at fair value. The fair value of the Company’s interest rate swaps are determined based on observable market data in combination with expected cash flows for each instrument.
See Note 16 for additional information related to fair value measurements.
Share Repurchase Program
In April 2016, the Company’s Board of Directors authorized the repurchase of up to
$10,000
of the Company’s Class A common stock from time to time on the open market in privately negotiated transactions. The timing and amount of any shares repurchased will be determined by the Company’s management based on its evaluation of market conditions and other factors. Any repurchased shares will be available for use in connection with its stock plans and for other corporate purposes. The repurchase program will be funded using the Company’s working capital and borrowings under its revolving line of credit. The Company accounts for share repurchases using the cost method. Under this method, the cost of the share repurchase is recorded entirely in treasury stock, a contra equity account. During the year ended
December 31, 2016
, the Company repurchased
1,298,418
shares of common stock in the amount of
$6,387
, including fees of
$52
.
Derivative Financial Instruments
In the normal course of business, the Company utilizes derivatives contracts as part of its risk management strategy to manage exposure to market fluctuations in interest rates. These instruments are subject to various credit and market risks. Controls and monitoring procedures for these instruments have been established and are routinely reevaluated. Credit risk represents the potential loss that may occur because a party to a transaction fails to perform according to the terms of the contract. The measure of credit exposure is the replacement cost of contracts with a positive fair value. The Company seeks to manage credit risk by entering into financial instrument transactions only through counterparties that the Company believes to be creditworthy.
Market risk represents the potential loss due to the decrease in the value of a financial instrument caused primarily by changes in interest rates. The Company seeks to manage market risk by establishing and monitoring limits on the types and degree of risk that may be undertaken. As a matter of policy, the Company does not use derivatives for speculative purposes. The Company considers the use of derivatives with all financing transactions to mitigate risk.
The Company recognizes cash flows from derivative instruments as operating activities in the consolidated statements of cash flows. The effective portion of changes in fair value on interest rate swaps designated as cash flow hedges are recognized in the Company’s consolidated statements of comprehensive income (loss). The ineffective portion of changes in fair value on interest rate swaps designated as hedges and changes in fair value on interest rate swaps not designated as hedges are recognized in the Company’s consolidated statements of income (loss).
During 2007, the Company entered into
two
interest rate swap contracts under which the Company agreed to pay an amount equal to a specified fixed rate of interest times a notional principal amount, and to in turn receive an amount equal to a specified variable rate of interest times the same notional principal amount. The swaps cover initial notional amounts of
$13,081
and
$3,256
, each a variable rate note at fixed interest rates of
5.4%
and
5.3%
, respectively, and expire in March 2024 and February 2021, respectively. These interest rate swaps qualified, but were not designated, as cash flow hedges until April 1, 2010. Since April 2010, they have been designated as hedges.
In March 2010, the Company entered into a
fourteen
-year interest rate swap contract under which the Company agreed to pay an amount equal to a specified fixed rate of interest times a notional amount, and to in turn receive an amount equal to a
65
AMERESCO, INC.
NOTES TO CONSOLIDATED FINANCIAL STATEMENTS - (Continued)
NOTES TO CONSOLIDATED FINANCIAL STATEMENTS - (Continued)
(in thousands, except share and per share amounts)
specified variable rate of interest times the same notional principal amount. The swap covers an initial notional amount of approximately
$27,900
variable rate note at a fixed interest rate of
3.74%
and expires in December 2024. This swap was designated as a hedge in March 2013. For the year ended December 31, 2013, the Company recorded an unrealized (gain) loss in earnings of
$(266)
, as other expenses, net in the consolidated statements of income (loss). During the second quarter of 2014 this swap was de-designated and re-designated as a hedge as a result of a partial pay down of the associated hedged debt principal. As a result
$566
was reclassified from accumulated other comprehensive loss and recorded as a reduction to other expenses, net in the Company’s consolidated statements of income (loss) during the second quarter of 2014.
In July 2011, the Company entered into a
five
-year interest rate swap contract under which the Company agreed to pay an amount equal to a specified fixed rate of interest times a notional amount, and to in turn receive an amount equal to a specified variable rate of interest times the same notional principal amount. The swap covered an initial notional amount of
$38,571
variable rate note at a fixed interest rate of
1.965%
and expired in June 2016. This interest rate swap was designated as a hedge since inception.
In October 2012, the Company entered into
two
eight
-year interest rate swap contracts under which the Company agreed to pay an amount equal to a specified fixed rate of interest times a notional amount, and to in turn receive an amount equal to a specified variable rate of interest times the same notional principal amount. The swaps cover an initial notional amount of
$16,750
variable rate note at a fixed interest rate of
1.71%
. This notional amount increased to
$42,247
on September 30, 2013 and expires in March 2020. These interest rate swaps have been designated as hedges since inception.
In October 2012, the Company also entered into
two
eight
-year forward starting interest rate swap contracts under which the Company agreed to pay an amount equal to specified fixed rate of interest times a notional amount, and to in turn receive an amount equal to a specified variable rate of interest times the same notional principal amount. The swaps cover an initial notional amount of
$25,377
variable rate note at a fixed interest rate of
3.70%
, with an effective date of March 31, 2020, and expires in June 2028. These interest rate swaps have been designated as hedges since inception.
In September 2015, the Company entered into a
seven
-year forward starting interest rate swap contract under which the Company agreed to pay an amount equal to a specified fixed rate of interest times a notional amount, and to in turn receive an amount equal to a specified variable rate of interest times the same notional principal amount. The swap covers an initial notional amount of
$20,746
variable rate note at a fixed interest rate of
2.19%
, and expires in February 2023. The effective date of the interest rate swap was February 29, 2016. The underlying cash flows hedged have an initial principal balance of
$20,746
with an effective date of March 30, 2016. This interest rate swap has been designated as a hedge since inception.
In September 2015, the Company also entered into a
fifteen
-year forward starting interest rate swap contract under which the Company agreed to pay an amount equal to a specified fixed rate of interest times a notional amount, and to in turn receive an amount equal to a specified variable rate of interest times the same notional principal amount. The swap covers an initial notional amount of
$14,084
variable rate note at a fixed interest rate of
3.26%
, with an effective date of February 28, 2023, and expires in December 2038. This interest rate swap has been designated as a hedge since inception.
See Notes 15, 16 and 17 for additional information on the Company’s derivative instruments.
Earnings Per Share
Basic earnings per share is calculated using the Company’s weighted-average outstanding common shares, including vested restricted shares. When the effects are not anti-dilutive, diluted earnings per share is calculated using the weighted-average outstanding common shares; the dilutive effect of convertible preferred stock, under the “if converted” method; and the treasury stock method with regard to warrants and stock options; all as determined under the treasury stock method.
|
Year Ended December 31,
|
|||||||||||
|
|
2016
|
2015
|
2014
|
||||||||
|
Net income attributable to Ameresco, Inc.
|
$
|
12,032
|
|
$
|
844
|
|
$
|
10,383
|
|
||
|
Basic weighted-average shares outstanding
|
46,409,192
|
|
46,494,448
|
|
46,161,846
|
|
|||||
|
Effect of dilutive securities:
|
|
|
|
|
|
|
|||||
|
Stock options
|
84,285
|
|
1,170,447
|
|
865,909
|
|
|||||
|
Diluted weighted-average shares outstanding
|
46,493,477
|
|
47,664,895
|
|
47,027,755
|
|
|||||
66
AMERESCO, INC.
NOTES TO CONSOLIDATED FINANCIAL STATEMENTS - (Continued)
NOTES TO CONSOLIDATED FINANCIAL STATEMENTS - (Continued)
(in thousands, except share and per share amounts)
For the years ended December 31,
2016
,
2015
and
2014
,
3,530,220
,
1,767,778
and
1,737,261
shares of common stock, respectively, related to stock options were excluded from the calculation of dilutive shares since the inclusion of such shares would be anti-dilutive.
Variable Interest Entities
Certain contracts are executed jointly through partnership and joint venture arrangements with unrelated third parties. The arrangements are often formed for the single business purpose of executing a specific project and allow the Company to share risks and/or secure specialty skills required for project execution.
The Company evaluates each partnership and joint venture at inception to determine if it qualifies as a VIE under ASC 810,
Consolidation
. A variable interest entity is an entity used for business purposes that either (a) does not have equity investors with voting rights or (b) has equity investors who are not required to provide sufficient financial resources for the entity to support its activities without additional subordinated financial support. Upon the occurrence of certain events outlined in ASC 810, the Company reassesses its initial determination of whether the partnership or joint venture is a VIE.
The Company also evaluates whether it is the primary beneficiary of each VIE and consolidates the VIE if the Company has both (a) the power to direct the economically significant activities of the entity and (b) the obligation to absorb losses of, or the right to receive benefits from, the entity that could potentially be significant to the VIE. The Company considers the contractual agreements that define the ownership structure, distribution of profits and losses, risks, responsibilities, indebtedness, voting rights and board representation of the respective parties in determining whether it qualifies as the primary beneficiary. The Company also considers all parties that have direct or implicit variable interests when determining whether it is the primary beneficiary. When the Company is determined to be the primary beneficiary, the VIE is consolidated. As required by ASC 810, management's assessment of whether the Company is the primary beneficiary of a VIE is continuously performed. See Note 9 for additional disclosures.
Redeemable Non-Controlling Interest
In September 2015, the Company formed an investment fund with a third-party investor which granted the investor ownership interests in the net assets of certain of the Company’s renewable energy project subsidiaries. The Company entered into this agreement in order to finance the costs of constructing the project assets which are under long-term customer contracts. The Company has determined that it is the primary beneficiary in the operational partnership for accounting purposes. Accordingly, the Company will consolidate the assets and liabilities and operating results of the entities in its consolidated financial statements. The Company will recognize the investor’s share of the net assets of the subsidiary as a redeemable non-controlling interest in its consolidated balance sheets.
The Company has determined that the provisions in the contractual arrangement represent a substantive profit-sharing arrangement. The Company has further determined that the appropriate methodology for attributing income and loss to the redeemable non-controlling interest each period is a balance sheet approach referred to as the hypothetical liquidation at book value (“HLBV”) method. Under the HLBV method, the amounts of income and loss attributed to the redeemable non-controlling interest in the consolidated statements of income (loss) reflect changes in the amounts the investor would hypothetically receive at each balance sheet date under the liquidation provisions of the contractual agreement, assuming the net assets of this funding structure were liquidated at recorded amounts. The investor’s non-controlling interest in the results of operations of this funding structure is determined as the difference in the non-controlling interest’s claim under the HLBV method at the start and end of each reporting period, after taking into account any capital transactions, such as contributions or distributions, between the Company’s subsidiary and the investor. The use of the HLBV methodology to allocate income to the redeemable non-controlling interest holder may create volatility in the Company’s consolidated statements of income (loss) as the application of HLBV can drive changes in net income available and loss attributable to the redeemable non-controlling interest from quarter to quarter.
The Company classified the non-controlling interest with redemption features that are not solely within the control of the Company outside of permanent equity on its consolidated balance sheets. The redeemable non-controlling interest will be reported using the greater of its carrying value at each reporting date as determined by the HLBV method or the estimated redemption value in each reporting period.
See Notes 9 and 10 for additional disclosures.
67
AMERESCO, INC.
NOTES TO CONSOLIDATED FINANCIAL STATEMENTS - (Continued)
NOTES TO CONSOLIDATED FINANCIAL STATEMENTS - (Continued)
(in thousands, except share and per share amounts)
Recent Accounting Pronouncements
In May 2014, FASB issued ASU 2014-09, Revenue from Contracts with Customers (Topic 606). The guidance in this ASU affects any entity that either enters into contracts with customers to transfer goods or services or enters into contracts for the transfer of nonfinancial assets unless those contracts are within the scope of other standards. The guidance in this ASU supersedes the revenue recognition requirements in ASC 605, Revenue Recognition, and most industry-specific guidance throughout the Industry Topics of the Codification. This ASU also supersedes some cost guidance included in ASC 605-35, Revenue Recognition-Construction-Type and Production-Type Contracts. In addition, the existing requirements for the recognition of a gain or loss on the transfer of nonfinancial assets that are not in a contract with a customer are amended to be consistent with the guidance on recognition and measurement in this ASU. The FASB has approved a one year deferral of this standard, and this pronouncement is now effective for annual reporting periods beginning after December 15, 2017. Entities would be permitted to adopt the standard as early as the original public entity effective date (i.e., annual reporting periods beginning after December 15, 2016 and interim periods therein). Early adoption prior to that date is not permitted. Retrospective application of the amendments in this ASU is required. The new guidance must be adopted using either a full retrospective approach for all periods presented in the period of adoption (with some limited relief provided) or a modified retrospective approach. The Company is currently assessing the impact of this ASU on its consolidated financial statements. The Company expects to have its preliminary evaluation, including the selection of an adoption method, completed by the end of the first half of 2017. The Company is not planning on early adopting and currently expects to adopt the new revenue recognition guidance in the first quarter of 2018. The Company does not currently expect this guidance to have a material impact on its consolidated financial position or results of operations based on the evaluation of its current contracts and revenue streams, most will be recorded consistently under both the current and new standard. The FASB has issued, and may issue in the future, interpretive guidance which may cause the Company’s evaluation to change.
In August 2014, the FASB issued ASU 2014-15, Presentation of Financial Statements — Going Concern (Subtopic 205-40) (“ASU 2014-15”). ASU 2014-15 requires management to assess an entity’s ability to continue as a going concern by incorporating and expanding upon certain principles of current U.S. auditing standards. Specifically, the amendments (1) provide a definition of the term “substantial doubt”, (2) require an evaluation every reporting period, including interim periods, (3) provide principles for considering the mitigating effect of management’s plans, (4) require certain disclosures when substantial doubt is alleviated as a result of consideration of management’s plans, (5) require an express statement and other disclosures when substantial doubt is still present, and (6) require an assessment for a period of one year after the date that the financial statements are issued (or available to be issued). ASU 2014-15 is effective for annual reporting periods ending after December 15, 2016 and interim periods thereafter. The Company adopted ASU 2014-15 as of December 31, 2016, and the adoption did not have an impact on its going concern conclusions.
In February 2015, the FASB issued ASU 2015-02, Consolidation (Topic 810): Amendments to the Consolidation Analysis (“ASU 2015-02”). ASU 2015-02 affects reporting entities that are required to evaluate whether they should consolidate certain legal entities. ASU 2015-02 is effective for annual reporting periods beginning after December 15, 2015 and interim periods within those annual reporting periods. The Company adopted this guidance in the first quarter of fiscal 2016. This pronouncement did not change the Company’s previous consolidation conclusions, and thus did not have an impact on the Company’s consolidated financial statements.
In April 2015, the FASB issued ASU 2015-03, Interest — Imputation of Interest (Subtopic 835-03): Simplifying the Presentation of Debt Issuance Costs (“ASU 2015-03”). ASU 2015-03 requires debt issuance costs related to a recognized debt liability to be presented in the balance sheet as a direct deduction from the debt liability rather than as an asset. ASU 2015-03 is effective for annual reporting periods beginning after December 15, 2015, and interim periods within those annual reporting periods. The Company adopted this guidance in the first quarter of fiscal 2016. As such, deferred financing fees are presented on the Consolidated Balance Sheets as a reduction to long-term debt and capital lease liabilities.
In February 2016, the FASB issued ASU 2016-02, Leases (Topic 842). The guidance in this ASU supersedes the leasing guidance in Topic 840, Leases. Under the new guidance, lessees are required to recognize lease assets and lease liabilities on the balance sheet for all leases with terms longer than 12 months. Leases will be classified as either finance or operating, with classification affecting the pattern of expense recognition in the income statement. ASU 2016-02 is effective for fiscal years beginning after December 15, 2018, including interim periods within those fiscal years. The Company is currently evaluating the impact of our pending adoption of the new standard on its consolidated financial statements.
In March 2016, the FASB issued ASU No. 2016-09, Compensation-Stock Compensation-Improvements to Employee Share-Based Payment Accounting ("ASU 2016-09"). The guidance in this ASU involves several aspects of the accounting for
68
AMERESCO, INC.
NOTES TO CONSOLIDATED FINANCIAL STATEMENTS - (Continued)
NOTES TO CONSOLIDATED FINANCIAL STATEMENTS - (Continued)
(in thousands, except share and per share amounts)
share-based payment transactions, including the income tax consequences, classification of awards as either equity or liabilities, and classification on the statement of cash flows. Under ASU 2016-09, income tax benefits and deficiencies are to be recognized as income tax expense or benefit in the statement of operations and the tax effects of exercised or vested awards should be treated as discrete items in the reporting period in which they occur. Additionally, under ASU 2016-09, excess tax benefits should be classified along with other income tax cash flows as an operating activity. ASU 2016-09 will be effective for the Company on January 1, 2017, with early adoption permitted. Upon adoption of this standard as of January 1, 2017, the Company estimates it will record a
$4,000
deferred tax asset and a corresponding credit to retained earnings for excess tax benefits that had not previously been recognized because the related tax deductions had not reduced taxes payable. The Company will not change its accounting policy in regards to forfeitures.
In January 2017, the FASB issued ASU No. 2017-04, Intangibles—Goodwill and Other (Topic 350): Simplifying the Test for Goodwill Impairment (“ASU 2017-04”). Under the new guidance, a reporting entity will no longer be required to perform a hypothetical purchase price allocation to measure goodwill impairment (formerly known as “Step-2” analysis). Instead, impairment will be measured using the difference between carrying amount and the fair value of the reporting unit. ASU 2017-04 is effective for fiscal years beginning after December 15, 2019, including interim periods within those fiscal years, with early adoption permitted. The Company is currently evaluating the impact ASU 2017-04 will have on its consolidated financial statements.
3. BUSINESS ACQUISITIONS AND RELATED TRANSACTIONS
The Company accounts for acquisitions using the acquisition method in accordance with ASC 805,
Business Combinations
. The purchase price for each has been allocated to the assets based on their estimated fair values at the date of each acquisition as set forth in the table below. The excess purchase price over the estimated fair value of the net assets, which are calculated using level 3 inputs per the fair value hierarchy as defined in Note 16, acquired has been recorded as goodwill. Intangible assets identified have been recorded and are being amortized over periods ranging from
one
to
fifteen years
. See Note 4 for additional information.
In December 2016, the Company acquired a solar PV project currently under construction as well as an associated construction loan agreement with a bank for use in providing non-recourse financing for this acquired solar PV project currently under construction. The Company paid
$3,575
to acquire the asset under construction, and assumed
$9,503
of associated non-recourse financing.
In August 2014, the Company acquired the energy consultancy and energy project management business of EEX, an independent energy services provider located in Central London, U.K. The Company paid
$9,054
to acquire substantially all of the assets of EEX. The purchase price is subject to post-closing adjustments for working capital and for certain indemnity obligations of the seller and its owners. The Company deposited approximately
$834
of the initial cash payment with a third-party escrow agent as security for these matters.
A summary of the cumulative consideration paid and the allocation of the purchase price of all of the acquisitions in each respective year is as follows:
|
2016
|
2015
|
2014
|
|||||||
|
Accounts receivable
|
—
|
|
—
|
|
1,432
|
|
|||
|
Costs and estimated earnings in excess of billings
|
—
|
|
—
|
|
186
|
|
|||
|
Prepaid expenses and other current assets
|
263
|
|
—
|
|
295
|
|
|||
|
Property and equipment and project assets
|
12,815
|
|
—
|
|
123
|
|
|||
|
Goodwill
|
—
|
|
—
|
|
7,590
|
|
|||
|
Intangible assets
(1)
|
—
|
|
—
|
|
7,208
|
|
|||
|
Accounts payable
|
—
|
|
—
|
|
(1,719
|
)
|
|||
|
Accrued liabilities
|
—
|
|
—
|
|
(459
|
)
|
|||
|
Billings in excess of cost and estimated earnings
|
—
|
|
—
|
|
(752
|
)
|
|||
|
Purchase price
|
$
|
13,078
|
|
$
|
—
|
|
$
|
13,904
|
|
|
Total, net of cash received
|
$
|
13,078
|
|
$
|
—
|
|
$
|
13,904
|
|
|
Debt assumed
|
$
|
9,503
|
|
$
|
—
|
|
$
|
—
|
|
|
Total fair value of consideration
|
$
|
3,575
|
|
$
|
—
|
|
$
|
13,904
|
|
69
AMERESCO, INC.
NOTES TO CONSOLIDATED FINANCIAL STATEMENTS - (Continued)
NOTES TO CONSOLIDATED FINANCIAL STATEMENTS - (Continued)
(in thousands, except share and per share amounts)
(1) Intangible assets acquired during 2014 consisted of customer contracts, customer relationships, non-compete agreements and technology and were assigned a weighted average useful life of
8.2
years.
The results of the acquired companies since the dates of the acquisitions have been included in the Company’s operations as presented in the accompanying consolidated statements of income (loss), consolidated statements of comprehensive income (loss) and consolidated statements of cash flows.
4. GOODWILL AND INTANGIBLE ASSETS
The changes in the carrying value of goodwill attributable to each reportable segment are as follows:
|
U.S. Regions
|
U.S. Federal
|
Canada
|
Other
|
Total
|
|||||||||||||||
|
Balance, December 31, 2014
|
$
|
24,759
|
|
$
|
3,375
|
|
$
|
3,781
|
|
$
|
28,564
|
|
$
|
60,479
|
|
||||
|
Goodwill acquired during the year
|
—
|
|
—
|
|
|
|
—
|
|
—
|
|
|||||||||
|
Fair value adjustments
(1)
|
—
|
|
—
|
|
—
|
|
(403
|
)
|
(403
|
)
|
|||||||||
|
Currency effects
|
—
|
|
—
|
|
(619
|
)
|
(372
|
)
|
(991
|
)
|
|||||||||
|
Balance, December 31, 2015
|
24,759
|
|
3,375
|
|
3,162
|
|
27,789
|
|
59,085
|
|
|||||||||
|
Goodwill acquired during the year
|
—
|
|
—
|
|
—
|
|
—
|
|
—
|
|
|||||||||
|
Fair value adjustments
|
—
|
|
—
|
|
—
|
|
—
|
|
—
|
|
|||||||||
|
Currency effects
|
—
|
|
—
|
|
100
|
|
(1,209
|
)
|
(1,109
|
)
|
|||||||||
|
Balance, December 31, 2016
|
$
|
24,759
|
|
$
|
3,375
|
|
$
|
3,262
|
|
$
|
26,580
|
|
$
|
57,976
|
|
||||
|
Accumulated Goodwill Impairment Balance, December 31, 2015
|
$
|
—
|
|
$
|
—
|
|
$
|
(1,016
|
)
|
$
|
—
|
|
$
|
(1,016
|
)
|
||||
|
Accumulated Goodwill Impairment Balance, December 31, 2016
|
$
|
—
|
|
$
|
—
|
|
$
|
(1,016
|
)
|
$
|
—
|
|
$
|
(1,016
|
)
|
||||
(1) Fair value adjustment represents the final net working capital adjustment for purchase accounting related to the Company’s prior year acquisition of Energyexcel LLP (“EEX”).
The measurement periods for purchase price allocations end as soon as information on the facts and circumstances becomes available, but do not exceed 12 months. Adjustments in purchase price allocations may require a recasting of the amounts allocated to goodwill retroactively to the periods in which the acquisitions occurred.
In accordance with ASC 350, goodwill was tested for impairment as of
December 31, 2016
,
2015
and
2014
at the reporting unit level using a discounted cash flow method under the income approach and with a peer-based, risk-adjusted weighted average cost of capital. No instances of impairment were identified in the
December 31, 2016
,
2015
or
2014
assessments. Based on the Company’s goodwill impairment assessment, all of its reporting units with goodwill had estimated fair values as of
December 31, 2016
that exceeded their carrying values by at least
13%
, with the exception of the Southwest reporting unit, a member of the U.S. Regions segment, which had a fair value that exceeded its carrying value by
9%
. This reporting unit had goodwill of
$16,829
at
December 31, 2016
. Based on the Company’s goodwill impairment assessment, all of its reporting units with goodwill had estimated fair values as of
December 31, 2015
that exceeded their carrying values by at least
13%
, with the exception of the Integrated-PV reporting unit which had a fair value that exceeded its carrying value by
5%
. This reporting unit had goodwill of
$7.6 million
at
December 31, 2015
.
The Company performed a Step 1 test at its
December 31,
2016
,
2015
and
2014
annual testing dates, and concluded that Step 1 passed as the fair value of the enterprise value exceeded the carrying value of the enterprise value for all reporting units. However, during the course of the valuation analysis it was determined that although the fair value of the Company’s Canada reporting unit exceeded the carrying amount of this reporting unit, as of
December 31,
2016
and
December 31, 2015
the carrying value of the Canada reporting unit was negative. This determination, combined with qualitative considerations, prompted the performance of the Step 2 test as prescribed under ASC 350, recognizing and measuring the amount of the impairment loss, if any. Step 2 of the goodwill impairment test compares the implied fair value of the reporting unit’s goodwill with the carrying amount of the goodwill. The fair value of this goodwill can only be measured as a residual after the entity assigns the fair value of the reporting unit to all the assets and liabilities of that reporting unit, including any unrecognized intangible assets as if the reporting unit had been acquired in a business combination. The implied fair value of the goodwill of
70
AMERESCO, INC.
NOTES TO CONSOLIDATED FINANCIAL STATEMENTS - (Continued)
NOTES TO CONSOLIDATED FINANCIAL STATEMENTS - (Continued)
(in thousands, except share and per share amounts)
our Canada reporting unit exceeded the carrying value of that goodwill and as a result, no impairment of goodwill has been identified.
Customer contracts are amortized ratably over the period of the acquired customer contracts ranging in periods from approximately
one
to
five
years. All other intangible assets are amortized over periods ranging from approximately
four
to
fifteen
years, as defined by the nature of the respective intangible asset.
Separable intangible assets that are not deemed to have indefinite lives are amortized over their useful lives. The Company annually assesses whether a change in the life over which the Company’s assets are amortized is necessary or more frequently if events or circumstances warrant. No changes to useful lives were made during the years ended
December 31, 2016
,
2015
and
2014
.
The gross carrying amount and accumulated amortization of intangible assets are as follows:
|
As of December 31,
|
|||||||
|
2016
|
2015
|
||||||
|
Gross Carrying Amount
|
|||||||
|
Customer contracts
|
$
|
7,594
|
|
$
|
7,898
|
|
|
|
Customer relationships
|
11,652
|
|
12,496
|
|
|||
|
Non-compete agreements
|
3,203
|
|
3,324
|
|
|||
|
Technology
|
2,716
|
|
2,701
|
|
|||
|
Trade names
|
542
|
|
540
|
|
|||
|
25,707
|
|
26,959
|
|
||||
|
Accumulated Amortization
|
|||||||
|
Customer contracts
|
7,566
|
|
7,683
|
|
|||
|
Customer relationships
|
8,048
|
|
6,621
|
|
|||
|
Non-compete agreements
|
3,158
|
|
3,149
|
|
|||
|
Technology
|
2,485
|
|
2,241
|
|
|||
|
Trade names
|
519
|
|
495
|
|
|||
|
21,776
|
|
20,189
|
|
||||
|
Intangible assets, net
|
$
|
3,931
|
|
$
|
6,770
|
|
|
Amortization expense related to customer contracts is included in cost of revenues in the consolidated statements of income (loss). Amortization expense related to customer relationships, non-compete agreements, technology and trade names is included in selling, general and administrative expenses in the consolidated statements of income (loss). Amortization expense for the years ended
December 31, 2016
,
2015
and
2014
is as follows:
|
Year Ended December 31,
|
|||||||||||
|
2016
|
2015
|
2014
|
|||||||||
|
Customer contracts
|
$
|
184
|
|
$
|
932
|
|
$
|
1,673
|
|
||
|
Customer relationships
|
1,809
|
|
2,139
|
|
1,688
|
|
|||||
|
Non-compete agreements
|
116
|
|
494
|
|
805
|
|
|||||
|
Technology
|
238
|
|
528
|
|
490
|
|
|||||
|
Trade names
|
11
|
|
57
|
|
82
|
|
|||||
|
Total intangible amortization expense
|
$
|
2,358
|
|
$
|
4,150
|
|
$
|
4,738
|
|
||
Estimated amortization expense for existing intangible assets for the next five succeeding fiscal years is as follows:
71
AMERESCO, INC.
NOTES TO CONSOLIDATED FINANCIAL STATEMENTS - (Continued)
NOTES TO CONSOLIDATED FINANCIAL STATEMENTS - (Continued)
(in thousands, except share and per share amounts)
|
Estimated Amortization
|
|||||||
|
Included in Cost of Revenues
|
Included in Selling, General and Administrative Expenses
|
||||||
|
2017
|
$
|
29
|
|
$
|
1,479
|
|
|
|
2018
|
—
|
|
1,010
|
|
|||
|
2019
|
—
|
|
714
|
|
|||
|
2020
|
—
|
|
499
|
|
|||
|
2021
|
—
|
|
181
|
|
|||
5. PROPERTY AND EQUIPMENT
Property and equipment consists of the following:
|
December 31,
|
|||||||
|
|
2016
|
|
2015
|
||||
|
Furniture and office equipment
|
$
|
5,429
|
|
|
$
|
5,120
|
|
|
Computer equipment and software costs
|
19,475
|
|
|
18,024
|
|
||
|
Leasehold improvements
|
2,819
|
|
|
2,690
|
|
||
|
Automobiles
|
1,156
|
|
|
1,126
|
|
||
|
Land
|
1,379
|
|
520
|
|
|||
|
Property and equipment, gross
|
30,258
|
|
|
27,480
|
|
||
|
Less - accumulated depreciation
|
(25,240
|
)
|
|
(22,152
|
)
|
||
|
Property and equipment, net
|
$
|
5,018
|
|
|
$
|
5,328
|
|
Depreciation expense on property and equipment for the years ended December 31,
2016
,
2015
and
2014
was
$3,020
,
$3,263
and
$3,044
, respectively, and is included in selling, general and administrative expenses in the accompanying consolidated statements of income (loss).
6. PROJECT ASSETS
Project assets consist of the following:
|
December 31,
|
|||||||
|
|
2016
|
|
2015
|
||||
|
Project assets
|
$
|
431,361
|
|
|
$
|
336,065
|
|
|
Less - accumulated depreciation and amortization
|
(111,603
|
)
|
|
(91,756
|
)
|
||
|
Project assets, net
|
$
|
319,758
|
|
|
$
|
244,309
|
|
Included in project assets are capital lease assets and accumulated depreciation of capital lease assets. Capital lease assets consist of the following:
|
December 31,
|
|||||||
|
|
2016
|
|
2015
|
||||
|
Capital lease assets
|
$
|
15,640
|
|
|
$
|
6,810
|
|
|
Less - accumulated depreciation and amortization
|
(744
|
)
|
|
(174
|
)
|
||
|
Capital lease assets, net
|
$
|
14,896
|
|
|
$
|
6,636
|
|
For the
twelve months ended December 31, 2016
,
2015
and
2014
, the Company received
$0
,
$0
and
$3,727
, respectively, in grant awards from the Treasury under Section 1603 of the 2009 American Recovery and Reinvestment Act. The Act authorizes the Treasury to make payments to eligible persons who place in service qualifying renewable energy projects. The grants are paid in lieu of investment tax credits. All of the cash proceeds from the grants were used and recorded as a reduction in the cost basis of the applicable project assets. If the Company disposes of the property, or the property ceases to qualify as a specified energy property, within five years from the date the property is placed in service, then a prorated portion of the Section 1603 payment must be repaid. For tax purposes, the Section 1603 payments are not included in federal and certain state
72
AMERESCO, INC.
NOTES TO CONSOLIDATED FINANCIAL STATEMENTS - (Continued)
NOTES TO CONSOLIDATED FINANCIAL STATEMENTS - (Continued)
(in thousands, except share and per share amounts)
taxable income and the basis of the property is reduced by 50% of the payment received. Deferred grant income of
$7,739
and
$8,291
in the accompanying consolidated balance sheets at December 31,
2016
and
2015
, respectively, represents the benefit of the basis difference to be amortized to income tax expense over the life of the related property.
The Company has received cash rebates from a utility company, which were accounted for as reductions in the book value of the related project assets. The rebates were one-time payments based on the cost and efficiency of the installed units, and are earned upon installation and inspection by the utility. The payments are not related to, or subject to adjustment based on, future operating performance. The rebates were payable from the utility to the Company and are applied against the cost of construction, thereby reducing the book value of the corresponding project assets and have been treated as an investing activity in the accompanying consolidated statements of cash flows.
No
rebates were received during the years ended December 31,
2016
and
2015
.
Depreciation and amortization expense on the above project assets, net of deferred grant amortization, for the years ended December 31,
2016
,
2015
and
2014
was
$19,377
,
$16,911
and
$15,047
, respectively, and is included in cost of revenues in the accompanying consolidated statements of income (loss). Included in these depreciation and amortization expense totals are depreciation and amortization expense on capital lease assets of
$570
,
$174
and
$0
, respectively, for the years ended December 31,
2016
,
2015
and
2014
.
Long-term debt comprised the following:
|
December 31,
|
|||||||
|
|
2016
|
|
2015
|
||||
|
Senior secured credit facility, due June 2020, interest at varying rates monthly in arrears
|
$
|
43,420
|
|
|
$
|
25,540
|
|
|
6.345% term loan payable in semi-annual installments through February 2021
|
1,482
|
|
|
1,727
|
|
||
|
6.345% term loan payable in semi-annual installments through June 2024
|
9,096
|
|
|
9,822
|
|
||
|
Variable rate construction to term loan payable in quarterly installments through December 2024
|
10,139
|
|
|
11,644
|
|
||
|
6.500% term loan payable in monthly installments through October 2017
|
110
|
|
234
|
|
|||
|
7.250% term loan payable in quarterly installments through March 2021
|
2,651
|
|
3,208
|
|
|||
|
6.110% term loan payable in monthly installments through June 2028
|
4,591
|
|
4,772
|
|
|||
|
Variable rate construction to term loan payable in quarterly installments through June 2020
|
35,679
|
|
38,401
|
|
|||
|
Variable rate construction to term loan payable in semi-annual installments through 2023
|
19,398
|
|
17,112
|
|
|||
|
4.950% term loan payable in quarterly installments through July 2031
|
4,549
|
|
—
|
|
|||
|
13.000% construction loan payable, due May 2017
|
9,503
|
|
—
|
|
|||
|
8.750% construction loan payable, due March 2018
|
3,140
|
|
—
|
|
|||
|
Variable rate construction loan payable, due June 2017
|
7,008
|
|
—
|
|
|||
|
Capital leases
|
14,647
|
|
6,760
|
|
|||
|
|
165,413
|
|
|
119,220
|
|
||
|
Less - current maturities
|
19,292
|
|
|
13,427
|
|
||
|
Less - deferred financing fees
|
5,528
|
|
5,303
|
|
|||
|
Long-term debt
|
$
|
140,593
|
|
|
$
|
100,490
|
|
Aggregate maturities of long-term debt for the years ended December 31, are as follows:
73
AMERESCO, INC.
NOTES TO CONSOLIDATED FINANCIAL STATEMENTS - (Continued)
NOTES TO CONSOLIDATED FINANCIAL STATEMENTS - (Continued)
(in thousands, except share and per share amounts)
|
2017
(1)
|
$
|
19,292
|
|
|
2018
(1)
|
32,271
|
|
|
|
2019
|
16,657
|
|
|
|
2020
|
60,688
|
|
|
|
2021
|
5,025
|
|
|
|
Thereafter
|
32,257
|
|
|
|
Debt Discount
|
(777
|
)
|
|
|
|
$
|
165,413
|
|
|
(1
|
)
|
Included in 2017 aggregate maturities is the full balance of the construction loan payable due March 1, 2018, as the Company intends to repay this loan in full prior to December 31, 2017. Included in 2018 aggregate maturities is the full balance of the variable rate construction loan payable, due June 2017, and the 13.000% construction loan payable, due May 2017, as the Company intends to refinance the full balances outstanding at December 31, 2016 to long-term debt prior to their respective maturity dates.
|
|
Senior Secured Credit Facility - Revolver and Term Loan
On June 30, 2015, the Company entered into a third amended and restated bank credit facility with
two
banks. The new credit facility replaces and extended the Company’s existing credit facility, which was scheduled to expire in accordance with its terms on June 30, 2016. The revolving credit facility and term loan mature on June 30, 2020, when all amounts will be due and payable in full. The Company expects to use the new credit facility for general corporate purposes of the Company and its subsidiaries, including permitted acquisitions, refinancing of existing indebtedness and working capital. In July 2016, the Company entered into an amendment to the third amended and restated bank credit facility that amended the requirement of the total funded debt to EBITDA ratio as described below. In November 2016, the Company entered into an additional amendment to the third amended and restated bank credit facility that increased the amount of the term loan under the credit facility by approximately
$20,000
to an aggregate of
$30,000
and extends the maturity date of the term loan from June 30, 2018 to June 30, 2020.
The credit facility consists of a
$60,000
revolving credit facility and a
$30,000
term loan. The revolving credit facility may be increased by up to an additional
$25,000
at the Company’s option if lenders are willing to provide such increased commitments, subject to certain conditions. Up to
$20,000
of the revolving credit facility may be borrowed in Canadian dollars, Euros and pounds sterling. The Company is the sole borrower under the credit facility. The obligations under the credit facility are guaranteed by certain of the Company’s direct and indirect wholly owned domestic subsidiaries and are secured by a pledge of all of the Company’s and such subsidiary guarantors’ assets, other than the equity interests of certain subsidiaries and assets held in non-core subsidiaries (as defined in the agreement). At
December 31, 2016
and
2015
,
$28,500
and
$14,285
, was outstanding under the term loan, respectively. At
December 31, 2016
and
2015
,
$15,033
and
$11,300
was outstanding under the revolving credit facility, respectively.
The interest rate for borrowings under the credit facility is based on, at the Company’s option, either (1) a base rate equal to a margin of
0.5%
or
0.25%
, depending on the Company’s ratio of Total Funded Debt to EBITDA (each as defined in the agreement), over the highest of (a) the federal funds effective rate, plus
0.50%
, (b) Bank of America’s prime rate and (c) a rate based on the London interbank deposit rate (“LIBOR”) plus
1.50%
, or (2) the one-, two- three- or six-month LIBOR plus a margin of
2.00%
or
1.75%
, depending on the Company’s ratio of Total Funded Debt to EBITDA. A commitment fee of
0.375%
is payable quarterly on the undrawn portion of the revolving credit facility. At
December 31, 2016
, the interest rate for borrowings under the revolving credit facility was
4.25%
and the weighted average interest rate for borrowings under the term loan was
2.94%
.
The revolving credit facility does not require amortization of principal. The term loan requires quarterly principal payments of
$1,500
, with the balance due at maturity. All borrowings may be paid before maturity in whole or in part at the Company’s option without penalty or premium, other than reimbursement of any breakage and deployment costs in the case of LIBOR borrowings.
The credit facility limits the Company’s and its subsidiaries’ ability to, among other things: incur additional indebtedness; incur liens or guarantee obligations; merge, liquidate or dispose of assets; make acquisitions or other investments; enter into
74
AMERESCO, INC.
NOTES TO CONSOLIDATED FINANCIAL STATEMENTS - (Continued)
NOTES TO CONSOLIDATED FINANCIAL STATEMENTS - (Continued)
(in thousands, except share and per share amounts)
hedging agreements; pay dividends and make other distributions and engage in transactions with affiliates, except in the ordinary course of business on an arms’ length basis.
Under the credit facility, the Company and its subsidiaries may not invest cash or property in, or loan to, the Company’s non-core subsidiaries in aggregate amounts exceeding
49%
of the Company’s consolidated stockholders’ equity. In addition, under the credit facility, the Company and its core subsidiaries must maintain the following financial covenants:
|
•
|
a ratio of total funded debt to EBITDA of:
|
||
|
-
|
less than 2.00 to 1.0 as of the end of each fiscal quarter ending on or before June 30, 2016;
|
||
|
-
|
less than 2.75 to 1.0 as of the end of each fiscal quarter ending September 30, 2016, December 31, 2016, March 31, 2017 and June 30, 2017; and
|
||
|
-
|
less than 2.00 to 1.0 as of the end of each fiscal quarter ending September 30, 2017 and thereafter; and
|
||
|
•
|
a debt service coverage ratio (as defined in the agreement) of at least 1.5 to 1.0.
|
||
Any failure to comply with the financial or other covenants of the credit facility would not only prevent the Company from being able to borrow additional funds, but would constitute a default, permitting the lenders to, among other things, accelerate the amounts outstanding, including all accrued interest and unpaid fees, under the credit facility, to terminate the credit facility, and enforce liens against the collateral.
The credit facility also includes several other customary events of default, including a change in control of the Company, permitting the lenders to accelerate the indebtedness, terminate the credit facility, and enforce liens against the collateral.
For purposes of the Company’s senior secured facility: EBITDA excludes the results of certain renewable energy projects that the Company owns and for which financing from others remains outstanding; total funded debt includes amounts outstanding under both the term loan and revolver portions of the senior secured credit facility plus other indebtedness, but excludes non-recourse indebtedness of project company subsidiaries; and debt service includes principal and interest payments on the indebtedness included in total funded debt other than principal payments on the revolver portion of the facility.
At
December 31, 2016
, the Company was in compliance with all financial and operational covenants.
6.345%
Term Loans
On January 30, 2006, the Company entered into a master construction and term loan facility with a bank for use in providing limited recourse financing for certain of its landfill gas (“LFG”) to energy projects. The total loan commitment is
$17,156
, and is comprised initially of
two
tranches, but structured for the addition of subsequent projects that meet lender credit requirements.
The first tranche had an original balance, upon conversion to term loan, of
$3,240
, and bore an interest rate of
6.345%
per annum under the construction loan. The term loan bears interest at a variable rate, with interest payments due in quarterly installments. The remaining principal amounts are due in semi-annual installments ranging from
$96
to
$275
, with the remaining principal and unpaid interest due February 26, 2021.
The interest rate at
December 31, 2016
was
2.998%
.
The second tranche had an original balance, upon conversion to term loan, of
$13,081
and bore an interest rate of
6.345%
per annum under the construction loan. The term loan bears interest at a variable rate, with interest payments due in quarterly installments. The remaining principal amounts are due in semi-annual installments ranging from
$326
to
$1,179
, with principal and unpaid interest due June 30, 2024. The interest rate at
December 31, 2016
was
2.748%
.
As of December 31,
2016
and
2015
,
$10,578
and $
11,549
, respectively, was collectively outstanding under this facility.
In the event a payment is defaulted on, the payee has the option to accelerate payment terms and make due the remaining principal and accrued interest balance.
Variable-Rate Construction and Term Loans Due 2024
In February 2009, the Company entered into a construction and term loan financing agreement with a bank for use in providing limited recourse financing for certain of its LFG to energy projects. The total loan commitment under the agreement was
$37,906
, and bears interest at a variable rate. Prior to and during March 2010, the Company had construction draws totaling
$27,868
. During March 2010, the Company converted all of the construction loans to a single term loan balance of
$27,868
. The loan bears interest at a variable rate, with interest payments due in quarterly installments. The remaining principal
75
AMERESCO, INC.
NOTES TO CONSOLIDATED FINANCIAL STATEMENTS - (Continued)
NOTES TO CONSOLIDATED FINANCIAL STATEMENTS - (Continued)
(in thousands, except share and per share amounts)
amounts are due in quarterly installments ranging from
$109
to
$1,149
, after an initial payment of
$2,424
paid on March 31, 2010, with principal and unpaid interest due on December 31, 2024. The Company made an additional principal payment of
$3,712
during the year ended December 31, 2014. As of
December 31, 2016
and
2015
, the outstanding balance under the term loan was
$10,139
and
$11,644
, respectively. The interest rate at
December 31, 2016
was
4.248%
.
6.500%
Term Loan
The Company has a term loan agreement with a finance company with a total loan amount of
$755
. The note evidencing the loan bears interest at a fixed rate of
6.500%
per annum. Principal and interest payments are due in monthly installments of
$11
, with the final payment being due October 1, 2017.
As of December 31,
2016
and
2015
,
$110
and
$234
, respectively, was outstanding under the term loan. In the event a payment is defaulted on, the payee has the option to accelerate payment terms and make due the remaining principal and accrued interest balance.
7.250%
Term Loan
On March 31, 2011, the Company entered into a term loan with a bank with an original principal amount of
$5,500
. The note evidencing the loan bears interest at a rate of
7.25%
per annum. The remaining principal amounts are due in quarterly installments ranging from
$144
to
$171
, plus interest, with remaining principal balances and unpaid interest due March 31, 2021. In the event a payment is defaulted on, the payee has the option to accelerate payment terms and make due the remaining principal and accrued interest balance. At
December 31, 2016
and
2015
,
$2,651
and
$3,208
, respectively, was outstanding under the term loan.
6.110%
Construction and Term Loan
On October 3, 2011, the Company entered into a construction and term loan with a syndication group with an original principal amount of
$7,380
. The note evidencing the loan bears interest at a rate of
6.11%
per annum. Monthly interest only payments were due from November 1, 2011 to June 1, 2013. The remaining principal amounts were due starting on June 1, 2013 in monthly installments ranging from
$0
to
$70
, plus interest, with remaining principal balances and unpaid interest due June 1, 2028. At
December 31, 2016
and
2015
,
$4,591
and
$4,772
, respectively, was outstanding under the term loan.
Variable-Rate Construction and Term Loans Due 2020
In October 2012, the Company entered into a credit and guaranty agreement with
two
banks for use in providing limited recourse financing for certain of its LFG to energy and solar PV projects. The credit and guaranty agreement provided for a
$47,234
construction-to-term loan credit facility and bears interest at a variable rate. The loans were fully converted to term loans during the year ended December 31, 2014. The term loan bears interest at a variable rate, with interest payments due in quarterly installments. The remaining principal amounts are due in quarterly installments ranging from
$389
to
$903
. The facility matures on March 31, 2020, and all remaining unpaid amounts outstanding under the facility will be due at that time. At
December 31, 2016
and
2015
,
$35,679
and
$38,401
, respectively, was outstanding under term loans. The interest rate at
December 31, 2016
was
3.998%
.
Variable-Rate Construction and Term Loans Due 2023
In September 2015, the Company entered into a credit and guaranty agreement for use in providing non-recourse financing for certain of its solar PV projects currently under construction. The credit and guaranty agreement provides for a
$20,746
construction-to-term loan credit facility and bears interest at a variable rate. The loans were fully converted to term loans during the year ended December 31, 2016. The term loan bears interest at a variable rate, with interest payments due in quarterly installments. The remaining principal amounts are due in semi-annual installments ranging from
$105
to
$835
. The facility matures on February 28, 2023, and all remaining unpaid amounts outstanding under the facility will be due at that time. At
December 31, 2016
,
$19,877
was outstanding under term loans. At
December 31, 2015
,
$17,663
was outstanding under construction loans. The interest rate at
December 31, 2016
was
3.498%
.
4.950%
Term Loan
On August 4, 2016, the Company entered into a term loan with
two
banks with an original principal amount of
$4,837
. The note evidencing the loan bears interest at a rate of
4.95%
per annum. The remaining principal amounts are due in quarterly installments ranging from
$43
to
$156
, plus interest, with remaining principal balances and unpaid interest due July 1, 2031. At
December 31, 2016
,
$4,616
was outstanding on the term loan.
76
AMERESCO, INC.
NOTES TO CONSOLIDATED FINANCIAL STATEMENTS - (Continued)
NOTES TO CONSOLIDATED FINANCIAL STATEMENTS - (Continued)
(in thousands, except share and per share amounts)
8.750%
Construction Loan
On November 1, 2016, the Company entered into a construction loan agreement with a bank for use in providing non-recourse financing for a certain natural gas to energy project currently under construction. The construction loan agreement provides for a
$9,500
construction facility and bears interest at a rate of
8.75%
per annum. The facility matures on March 1, 2018, and all remaining unpaid amounts outstanding under the facility will be due at that time. At
December 31, 2016
,
$3,258
was outstanding under the construction loan. The Company has classified this debt as current as of
December 31, 2016
, due to the Company’s intent to repay the construction loan in full prior to December 31, 2017.
Variable Rate Construction Loan Due June 30, 2017
On November 18, 2016, the Company entered into a construction loan agreement and subsequent amendment with a bank for use in providing non-recourse financing for certain solar PV projects currently under construction. The construction loan agreement provides for a
$35,000
construction facility and bears interest at a variable rate. The facility matures on June 30, 2017, and all remaining unpaid amounts outstanding under the facility will be due at that time. At
December 31, 2016
,
$7,008
was outstanding under the construction loan. The interest rate at
December 31, 2016
was
6.00%
. The Company has classified this debt as non-current as of
December 31, 2016
, due to the Company’s intention to refinance the variable rate construction loan to sale-leasebacks prior to the maturity date.
13.000%
Construction Loan
On December 22, 2016, the Company acquired a solar PV project (see Note 3) currently under construction as well as an associated construction loan agreement with a bank for use in providing non-recourse financing for this acquired solar PV project currently under construction. The construction loan agreement provides for a
$10,694
construction facility and bears interest at a rate of
13.00%
per annum. The facility matures on May 30, 2017, and all remaining unpaid amounts outstanding under the facility will be due at that time. At
December 31, 2016
,
$9,503
was outstanding under the construction loan. The Company has classified this debt as non-current as of
December 31, 2016
, due to the Company’s intention to refinance the construction loan to a term loan prior to the maturity date. This construction loan contains a subjective acceleration clause that allows the bank to call the debt, if a material adverse change occurs. If exercised, the subjective acceleration clause provides for a
60
-day notice period to repay the construction loan balance. At
December 31, 2016
, the bank had not exercised the subjective acceleration clause.
8. INCOME TAXES
Some amounts for the year ending December 31, 2015 have been revised, see Note 2 for further discussion of this revision.
The components of income before income taxes are as follows:
|
Year Ended December 31,
|
|||||||||||
|
|
2016
|
|
2015
|
|
2014
|
||||||
|
Domestic
|
$
|
19,874
|
|
|
$
|
17,860
|
|
|
$
|
14,505
|
|
|
Foreign
|
(3,507
|
)
|
|
(17,568
|
)
|
|
(8,213
|
)
|
|||
|
Income before provision for income taxes
|
$
|
16,367
|
|
|
$
|
292
|
|
|
$
|
6,292
|
|
77
AMERESCO, INC.
NOTES TO CONSOLIDATED FINANCIAL STATEMENTS - (Continued)
NOTES TO CONSOLIDATED FINANCIAL STATEMENTS - (Continued)
(in thousands, except share and per share amounts)
The components of the provision (benefit) for income taxes are as follows:
|
Year Ended December 31,
|
|||||||||||
|
|
2016
|
|
2015
|
|
2014
|
||||||
|
Current:
|
|
|
|
|
|
|
|
|
|||
|
Federal
|
$
|
1,304
|
|
|
$
|
224
|
|
|
$
|
(2,659
|
)
|
|
State
|
303
|
|
|
603
|
|
|
1,826
|
|
|||
|
Foreign
|
(106
|
)
|
|
443
|
|
|
(814
|
)
|
|||
|
1,501
|
|
|
1,270
|
|
|
(1,647
|
)
|
||||
|
Deferred:
|
|
|
|
|
|
|
|
|
|||
|
Federal
|
2,341
|
|
|
3,861
|
|
|
(3,263
|
)
|
|||
|
State
|
106
|
|
|
134
|
|
|
574
|
|
|||
|
Foreign
|
422
|
|
|
(289
|
)
|
|
245
|
|
|||
|
2,869
|
|
|
3,706
|
|
|
(2,444
|
)
|
||||
|
$
|
4,370
|
|
|
$
|
4,976
|
|
|
$
|
(4,091
|
)
|
|
The Company’s deferred tax assets and liabilities result primarily from temporary differences between financial reporting and tax recognition of depreciation, reserves, and certain accrued liabilities.
Deferred tax assets and liabilities consist of the following:
|
December 31,
|
|||||||
|
|
2016
|
|
2015
|
||||
|
Deferred tax assets:
|
|
|
|
|
|
||
|
Compensation accruals
|
$
|
4,259
|
|
|
$
|
3,330
|
|
|
Reserves
|
4,597
|
|
|
3,651
|
|
||
|
Other accruals
|
732
|
|
|
2,252
|
|
||
|
Net operating losses
|
8,044
|
|
|
8,220
|
|
||
|
Interest rate swaps
|
1,500
|
|
|
1,804
|
|
||
|
Energy efficiency
|
14,449
|
|
|
18,110
|
|
||
|
Deferred revenue
|
1,351
|
|
1,479
|
|
|||
|
Gross deferred income tax assets
|
34,932
|
|
|
38,846
|
|
||
|
Valuation allowance
|
(7,344
|
)
|
(7,122
|
)
|
|||
|
Total deferred income tax assets
|
$
|
27,588
|
|
$
|
31,724
|
|
|
|
Deferred tax liabilities:
|
|
|
|
|
|
||
|
Depreciation
|
$
|
(30,974
|
)
|
|
$
|
(32,542
|
)
|
|
Contract refinancing
|
(217
|
)
|
|
(304
|
)
|
||
|
Canada
|
(1,901
|
)
|
|
(2,234
|
)
|
||
|
United Kingdom
|
(697
|
)
|
(538
|
)
|
|||
|
Outside basis difference
|
(2,756
|
)
|
(2,133
|
)
|
|||
|
Acquisition accounting
|
(80
|
)
|
|
(116
|
)
|
||
|
Total deferred income tax liabilities
|
(36,625
|
)
|
|
(37,867
|
)
|
||
|
Deferred income tax liabilities, net
|
$
|
(9,037
|
)
|
|
$
|
(6,143
|
)
|
The Company recorded a valuation allowance in the amount of
$7,344
and
$7,122
as of
December 31, 2016
and
2015
, respectively, related to the following items: 1) The Company recorded a valuation allowance on a deferred tax asset relating to interest rate swaps in the amount of
$859
and
$1,121
as of
December 31, 2016
and
2015
, respectively. The deferred tax asset represents a future capital loss which can only be recognized for income tax purposes to the extent of capital gain
78
AMERESCO, INC.
NOTES TO CONSOLIDATED FINANCIAL STATEMENTS - (Continued)
NOTES TO CONSOLIDATED FINANCIAL STATEMENTS - (Continued)
(in thousands, except share and per share amounts)
income. Although the Company anticipates sufficient future taxable income, it is more likely than not that it will not be of the appropriate character to allow for the recognition of the future capital loss. 2) As of
December 31, 2016
and
2015
, the Company recorded a valuation allowance on a deferred tax asset relating to a foreign net operating loss in the amount of
$6,269
and
$5,778
, respectively. It is more likely than not that the Company will not generate sufficient taxable income at the foreign subsidiary level to utilize the net operating loss. 3) The Company recorded a valuation allowance on a deferred tax asset relating to a state net operating loss of
$216
and
$223
at one of its subsidiaries as of
December 31, 2016
and
2015
, respectively. It is more likely than not that the Company will not generate sufficient taxable income at the subsidiary level to utilize the net operating loss.
The provision for income taxes is based on the various rates set by federal and local authorities and is affected by permanent and temporary differences between financial accounting and tax reporting requirements.
The following is a reconciliation of the effective tax rates:
|
Year Ended December 31,
|
|||||||||||
|
|
2016
|
|
2015
|
|
2014
|
||||||
|
Income before income tax
|
$
|
16,367
|
|
|
$
|
292
|
|
|
$
|
6,292
|
|
|
Federal statutory tax expense
|
$
|
5,728
|
|
|
$
|
102
|
|
|
$
|
2,202
|
|
|
State income taxes, net of Federal benefit
|
678
|
|
|
604
|
|
|
666
|
|
|||
|
Net state impact of deferred rate change
|
(110
|
)
|
|
55
|
|
|
264
|
|
|||
|
Non deductible expenses
|
670
|
|
|
933
|
|
|
764
|
|
|||
|
Impact of reserve for uncertain tax positions
|
(411
|
)
|
(1,772
|
)
|
(977
|
)
|
|||||
|
Stock-based compensation expense
|
306
|
|
|
402
|
|
|
415
|
|
|||
|
Energy efficiency preferences
|
(4,130
|
)
|
|
(3,280
|
)
|
|
(9,517
|
)
|
|||
|
Foreign items and rate differential
|
516
|
|
|
1,556
|
|
|
719
|
|
|||
|
Valuation allowance
|
213
|
|
4,255
|
|
1,408
|
|
|||||
|
Energy partnership basis adjustments
|
—
|
|
2,133
|
|
—
|
|
|||||
|
Miscellaneous
|
910
|
|
|
(12
|
)
|
|
(35
|
)
|
|||
|
|
$
|
4,370
|
|
|
$
|
4,976
|
|
|
$
|
(4,091
|
)
|
|
Effective tax rate:
|
|
|
|
|
|
|
|
||||
|
Federal statutory rate expense
|
35.0
|
%
|
35.0
|
%
|
35.0
|
%
|
|||||
|
State income taxes, net of Federal benefit
|
4.1
|
%
|
206.8
|
%
|
10.6
|
%
|
|||||
|
Net state impact of deferred rate change
|
(0.7
|
)%
|
18.8
|
%
|
4.2
|
%
|
|||||
|
Non deductible expenses
|
4.1
|
%
|
319.5
|
%
|
12.1
|
%
|
|||||
|
Impact of reserve for uncertain tax positions
|
(2.5
|
)%
|
(606.8
|
)%
|
(15.5
|
)%
|
|||||
|
Stock-based compensation expense
|
1.9
|
%
|
137.7
|
%
|
6.6
|
%
|
|||||
|
Energy efficiency preferences
|
(25.2
|
)%
|
(1,123.3
|
)%
|
(151.3
|
)%
|
|||||
|
Foreign items and rate differential
|
3.2
|
%
|
532.9
|
%
|
11.4
|
%
|
|||||
|
Valuation allowance
|
1.3
|
%
|
1,457.2
|
%
|
22.4
|
%
|
|||||
|
Energy partnership basis adjustments
|
—
|
%
|
730.5
|
%
|
—
|
%
|
|||||
|
Miscellaneous
|
5.5
|
%
|
(4.1
|
)%
|
(0.6
|
)%
|
|||||
|
|
26.7
|
%
|
1,704.2
|
%
|
(65.1
|
)%
|
|||||
A reconciliation of the beginning and ending balances of the total amounts of gross unrecognized tax benefits is as follows:
79
AMERESCO, INC.
NOTES TO CONSOLIDATED FINANCIAL STATEMENTS - (Continued)
NOTES TO CONSOLIDATED FINANCIAL STATEMENTS - (Continued)
(in thousands, except share and per share amounts)
|
Year Ended December 31,
|
|||||||
|
|
2016
|
|
2015
|
||||
|
Balance, beginning of year
|
$
|
2,200
|
|
|
$
|
3,700
|
|
|
Additions for prior year tax positions
|
—
|
|
|
200
|
|
||
|
Settlements paid to tax authorities
|
(1,310
|
)
|
|
—
|
|
||
|
Reductions of prior year tax positions
|
(290
|
)
|
|
(1,700
|
)
|
||
|
Balance, end of year
|
$
|
600
|
|
|
$
|
2,200
|
|
At December 31,
2016
and
2015
, the Company had approximately
$600
and
$2,200
, respectively, of total gross unrecognized tax benefits. The current year decrease in unrecognized tax benefits relates primarily to items resolved as part of the IRS audit and amounts related to years already audited. The Company believes that it is likely that none of the remaining unrecognized tax benefits related to federal and state exposures will be necessary within the next twelve months.
Of the total gross unrecognized tax benefits as of December 31,
2016
and
2015
,
$20
and
$800
, respectively, (both net of the federal benefit on state amounts) represent the amount of unrecognized tax benefits that, if recognized, would favorably affect the effective income tax rate in any future periods.
At
December 31, 2016
the Company had state net operating loss carryforwards of approximately
$10,700
, which will expire from 2016 through 2033. The tax effected portion of the state net operating loss relating to excess stock option deductions is approximately
$12
. Any tax benefit resulting from excess stock option deductions is recorded as an adjustment to additional paid in capital when realized. At
December 31, 2016
the Company had Canadian net operating loss carryforwards of approximately
$24,100
, which will expire for tax years 2016 through 2026.
The Company does not accrue U.S. tax for foreign earnings that it considers to be permanently reinvested outside the United States. Consequently, the Company has not provided any U.S. tax on the unremitted earnings of its foreign subsidiaries. As of
December 31, 2016
, the amount of earnings for which no repatriation tax has been provided was estimated to be
$0
.
At
December 31, 2016
the company had a federal tax credit carryforward of approximately
$9,800
which will expire at various times through 2035. The portion of the federal tax credit relating to excess stock option deductions is approximately
$4,000
, the tax benefit of which will be recorded as an adjustment to additional paid in capital when realized.
The tax years 2014 through
2016
remain open to examination by major taxing jurisdictions. The Company accounts for interest and penalties related to uncertain tax positions as part of its provision for federal and state income taxes. The (decrease) increase included in tax expense for the years end December 31,
2016
,
2015
and
2014
were
$(20)
,
$(200)
and
$(200)
, respectively.
9. INVESTMENT FUND
During the third quarter of 2015, the Company formed an investment fund for the purpose of funding the purchase of a solar energy system. The Company consolidates the investment fund, and all inter-company balances and transactions between the Company and the investment fund are eliminated in its consolidated financial statements. The Company determined that the investment fund meets the definition of a VIE. The Company uses a qualitative approach in assessing the consolidation requirement for VIEs that focuses on determining whether the Company has the power to direct the activities of the VIE that most significantly affect the VIE’s economic performance and whether the Company has the obligation to absorb losses or the right to receive benefits that could potentially be significant to the VIE.
The Company has considered the provisions within the contractual arrangements that grant it power to manage and make decisions that affect the operation of this VIE, including determining the solar energy systems and associated long term customer contracts to be sold or contributed to the VIE, and installation, operation and maintenance of the solar energy systems. The Company considers that the rights granted to the other investors under the contractual arrangements are more protective in nature rather than participating rights. As such, the Company has determined it is the primary beneficiary of the VIE for all periods presented. The Company evaluates its relationships with VIEs on an ongoing basis to ensure that it continues to be the primary beneficiary.
Under the related agreements, cash distributions of income and other receipts by the fund, net of agreed-upon expenses and estimated expenses, tax benefits and detriments of income and loss, and tax benefits of tax credits, are assigned to the fund investor and Company’s subsidiary as specified in contractual arrangements. Certain of these arrangements have call and put
80
AMERESCO, INC.
NOTES TO CONSOLIDATED FINANCIAL STATEMENTS - (Continued)
NOTES TO CONSOLIDATED FINANCIAL STATEMENTS - (Continued)
(in thousands, except share and per share amounts)
options to acquire the investor’s equity interest as specified in the contractual agreement. See Note 10 for additional information on the call and put options.
A summary of amounts related to the investment fund in the Company’s consolidated balance sheets for the years ending
December 31, 2016
and 2015 is as follows:
|
2016
|
2015
|
|||||
|
Cash
|
$
|
1,157
|
|
$
|
—
|
|
|
Restricted cash
|
1,554
|
|
5,419
|
|
||
|
Accounts receivable
|
80
|
|
—
|
|
||
|
Costs and estimated earnings in excess of billings
|
50
|
|
—
|
|
||
|
Prepaid expenses and other current assets
|
50
|
|
25
|
|
||
|
Project assets, net
|
32,185
|
|
32,657
|
|
||
|
Other assets
|
77
|
|
112
|
|
||
|
Accrued liabilities
|
$
|
165
|
|
$
|
—
|
|
10. NON-CONTROLLING INTERESTS AND EQUITY
Redeemable Non-controlling Interest
The Company’s wholly owned subsidiary with a membership interest in the investment fund has the right, beginning on the fifth anniversary of the final funding of the variable rate construction and term loans due 2023 and extending for
six months
, to elect to require the non-controlling interest holder to sell all of its membership units to the Company’s wholly owned subsidiary (the “Call Option”). The Company’s investment fund, which was formed in the third quarter of 2015, also includes a right, beginning on the sixth anniversary of the final funding and extending for
one year
, for the non-controlling interest holder to elect to require the Company’s wholly owned subsidiary to purchase all of its membership interests in the fund (the “Put Option”).
Because the Put Option represents a redemption feature that is not solely within the control of the Company, the non-controlling interest in these funds is presented outside of permanent equity. Redeemable non-controlling interests are reported using the greater of their carrying value at each reporting date (which is impacted by attribution under the HLBV method) or their estimated redemption value in each reporting period.
The purchase price for the fund investor’s membership interest under the Call Option is equal to the fair market value as of the exercise date.
Common and Preferred Stock
The Company has authorized
500,000,000
shares of Class A common stock, par value
$0.0001
per share,
144,000,000
shares of Class B common stock, par value
$0.0001
per share, and
5,000,000
shares of Preferred Stock, par value
$0.0001
per share. The rights of the holders of the Company’s Class A common stock and Class B common stock are identical, except with respect to voting and conversion. Each share of the Company’s Class A common stock is entitled to
one
vote per share and is not convertible into any other shares of the Company’s capital stock. Each share of the Company’s Class B common stock is entitled to
five
votes per share, is convertible at any time into one share of Class A common stock at the option of the holder of such share and will automatically convert into one share of Class A common stock upon the occurrence of certain specified events, including a transfer of such shares (other than to such holder’s family members, descendants or certain affiliated persons or entities). The Company’s Board of Directors is authorized to fix the rights and terms for any series of preferred stock without additional shareholder approval.
11. STOCK INCENTIVE PLAN
In 2000, the Company’s Board of Directors approved the Company’s 2000 Stock Incentive Plan (the “2000 Plan”) and between 2000 and 2010 authorized the Company to reserve a total of
28,500,000
shares of its then authorized common stock, par value
$0.0001
per share (”Common Stock”) for issuance under the 2000 Plan. The 2000 Plan provided for the issuance of restricted stock grants, incentive stock options and nonqualified stock options. The Company will grant no further stock options or restricted awards under the 2000 Plan.
The Company’s 2010 Stock Incentive Plan (the “2010 Plan”), was adopted by the Company’s Board of Directors in May 2010 and approved by its stockholders in June 2010. The 2010 Plan provides for the grant of incentive stock options, non-statutory stock options, performance-based stock options, restricted stock awards and other stock-based awards. Upon its effectiveness,
10,000,000
shares of the Company’s Class A common stock were reserved for issuance under the 2010 Plan. As
81
AMERESCO, INC.
NOTES TO CONSOLIDATED FINANCIAL STATEMENTS - (Continued)
NOTES TO CONSOLIDATED FINANCIAL STATEMENTS - (Continued)
(in thousands, except share and per share amounts)
of
December 31, 2016
, the Company had granted options to purchase
3,119,604
shares of Class A common stock under the 2010 Plan.
Stock Option Grants
The Company has granted stock options to certain employees and directors, including its principal and controlling stockholder, under the 2000 Plan. The Company has also granted stock options to certain employees and directors under the 2010 Plan. At
December 31, 2016
,
7,409,802
shares were available for grant under the 2010 Plan.
The following table summarizes the collective activity under the 2000 Plan and the 2010 Plan:
|
|
Number of Options
|
|
Weighted-Average Exercise Price
|
Weighted-Average Remaining Contractual Term
|
Aggregate Intrinsic Value
|
|||||||
|
Outstanding at December 31, 2013
|
4,573,378
|
|
$
|
7.528
|
|
|||||||
|
Granted
(1)
|
145,000
|
|
7.578
|
|
||||||||
|
Exercised
|
(482,475
|
)
|
2.999
|
|
||||||||
|
Forfeited
|
(324,330
|
)
|
12.226
|
|
||||||||
|
Expired
|
(18,000
|
)
|
2.750
|
|
||||||||
|
Outstanding at December 31, 2014
|
3,893,573
|
|
|
7.721
|
|
|||||||
|
Granted
(1)
|
747,100
|
|
6.404
|
|
||||||||
|
Exercised
|
(332,600
|
)
|
3.467
|
|
||||||||
|
Forfeited
|
(168,633
|
)
|
9.409
|
|
||||||||
|
Outstanding at December 31, 2015
|
4,139,440
|
|
7.740
|
|
||||||||
|
Granted
(1)
|
665,000
|
|
4.703
|
|
||||||||
|
Exercised
|
(320,892
|
)
|
3.286
|
|
||||||||
|
Forfeited
|
(194,562
|
)
|
8.154
|
|
||||||||
|
Expired
|
(317,604
|
)
|
11.293
|
|
||||||||
|
Outstanding at December 31, 2016
|
3,971,382
|
|
$
|
7.300
|
|
5.50
|
$
|
1,143
|
|
|||
|
Options exercisable at December 31, 2016
|
2,664,405
|
|
$
|
7.850
|
|
4.05
|
$
|
626
|
|
|||
|
Expected to vest at December 31, 2016
|
1,306,977
|
|
6.179
|
|
8.46
|
$
|
517
|
|
||||
(1) Grants are related to the 2010 Plan.
The aggregate intrinsic value of stock options exercised during the years ended December 31,
2016
,
2015
and
2014
was $
575
, $
1,024
and
$2,030
, respectively.
During the year ended
December 31, 2016
, a total of
320,892
shares were issued upon the exercise of options under the 2000 Plan at an average price of
$3.286
per share. Cash received from option exercises under all stock-based payment arrangements, net, for the years ended December 31,
2016
,
2015
and
2014
was
$1,054
,
$1,153
and
$1,447
, respectively.
Stock options issued under our 2000 Plan generally expire if not exercised within
ten
years after the grant date. Under the terms of our 2010 stock incentive plan, all options expire if not exercised within
ten
years after the grant date. Historically, options generally provided for vesting over
five
years, with
20%
vesting on the first anniversary of the grant date and
5%
vesting every three months thereafter. During 2011, the Company began awarding options generally providing for vesting over
five
years, with
20%
vesting on each of the first
five
anniversaries of the grant date. From time to time, the Company awards options providing for vesting over
three
years, with one-third vesting on each of the first three anniversaries of the grant date. During the year ending
December 31, 2016
, the Company also awarded options that vest based upon the achievement of specific performance goals. If the employee ceases to be employed by the Company for any reason before vested options have been exercised, the employee has
90
days to exercise options that have vested as of the date of such employee’s termination or they are forfeited.
82
AMERESCO, INC.
NOTES TO CONSOLIDATED FINANCIAL STATEMENTS - (Continued)
NOTES TO CONSOLIDATED FINANCIAL STATEMENTS - (Continued)
(in thousands, except share and per share amounts)
The Company uses the Black-Scholes option pricing model to determine the weighted-average fair value of options granted. The Company will recognize the compensation cost of stock-based awards on a straight-line basis over the vesting period of the award.
The determination of the fair value of stock-based payment awards utilizing the Black-Scholes model is affected by the stock price and a number of assumptions, including expected volatility, expected life, risk-free interest rate and expected dividends. The following table sets forth the significant assumptions used in the model during
2016
,
2015
and
2014
:
|
|
Year Ended December 31,
|
||||
|
|
2016
|
2015
|
|
2014
|
|
|
Expected dividend yield
|
—%
|
—%
|
|
—%
|
|
|
Risk-free interest rate
|
1.16%-1.77%
|
1.53%-2.01%
|
|
1.93%-2.01%
|
|
|
Expected volatility
|
46%-49%
|
44%-49%
|
|
50%-52%
|
|
|
Expected life
|
6.5-10 years
|
5.0-6.5 years
|
|
6.5 years
|
|
The Company will continue to use judgment in evaluating the expected term, volatility and forfeiture rate related to the stock-based compensation on a prospective basis, and incorporating these factors into the Black-Scholes pricing model. Higher volatility and longer expected lives result in an increase to stock-based compensation expense determined at the date of grant. In addition, any changes in the estimated forfeiture rate can have a significant effect on reported stock-based compensation expense, as the cumulative effect of adjusting the rate for all expense amortization is recognized in the period that the forfeiture estimate is changed. If a revised forfeiture rate is higher than the previously estimated forfeiture rate, an adjustment is made that will result in a decrease to the stock-based compensation expense recognized in the accompanying consolidated financial statements. If a revised forfeiture rate is lower than the previously estimated rate, an adjustment is made that will result in an increase to the stock-based compensation expense recognized in the accompanying consolidated financial statements. These expenses will affect the cost of revenues, salaries and benefits and project development costs expenses.
The weighted-average fair value of stock options granted during the years ended December 31,
2016
,
2015
and
2014
, under the Black-Scholes option pricing model was
$2.60
, $
3.03
and
$3.97
, respectively, per share. For the years ended December 31,
2016
,
2015
and
2014
, the Company recorded stock-based compensation expense of approximately
$1,462
,
$1,769
, and
$2,493
, respectively, in connection with stock-based payment awards. The compensation expense is allocated between cost of revenues and selling, general and administrative expenses in the accompanying consolidated statements of income (loss) based on the salaries and work assignments of the employees holding the options. As of December 31,
2016
, there was approximately
$2,990
of unrecognized compensation expense related to non-vested stock option awards that is expected to be recognized over a weighted-average period of
2.7
years.
12. EMPLOYEE BENEFITS
The Company has salary reduction/profit sharing plans under the provisions of Section 401(k) of the Internal Revenue Code. The plans cover all employees who have completed the minimum service requirement, as defined by the plans. The plans require the Company to contribute
100%
of the first
six
percent of base compensation that a participant contributes to the plans. Matching contributions made by the Company were
$4,600
, $
4,733
and
$4,556
for the years ended December 31,
2016
,
2015
and
2014
, respectively.
The Company has a Group Personal Pension Plan (GPPP) for employees in the U.K., established in 2016, whereby eligible employees may contribute a portion of their compensation, subject to their age and other limitations established by HM Revenue & Customs. The plan requires the Company to contribute
100%
of the first
six
percent of base compensation that a participant contributes to the plans. Matching contributions made by the Company were
$202
for the year ended December 31,
2016
.
The Company has a Registered Retirement Savings Plan (RRSP) for employees in Canada, whereby eligible employees may contribute a portion of their compensation. The plan requires the Company to contribute
100%
of the first
six
percent of base compensation that a participant contributes to the plans. Matching contributions made by the Company were
$307
,
$411
and
$475
for the years ended December 31,
2016
,
2015
and
2014
, respectively.
13. COMMITMENTS AND CONTINGENCIES
83
AMERESCO, INC.
NOTES TO CONSOLIDATED FINANCIAL STATEMENTS - (Continued)
NOTES TO CONSOLIDATED FINANCIAL STATEMENTS - (Continued)
(in thousands, except share and per share amounts)
The Company leases certain administrative offices. The leases are long-term noncancelable real estate lease agreements, expiring at various dates through fiscal 2025. The agreements generally provide for fixed minimum rental payments and the payment of utilities, real estate taxes, insurance and repairs. Rent and related expenses for the years ended December 31,
2016
,
2015
and
2014
was
$6,147
,
$6,070
and
$5,667
, respectively.
The Company’s estimated minimum future lease obligations under operating leases are as follows:
|
|
Operating Leases
|
||
|
Year ended December 31,
|
|
|
|
|
2017
|
$
|
4,690
|
|
|
2018
|
3,675
|
|
|
|
2019
|
2,925
|
|
|
|
2020
|
2,080
|
|
|
|
2021
|
1,493
|
|
|
|
Thereafter
|
3,515
|
|
|
|
Total minimum lease payments
|
$
|
18,378
|
|
Legal Proceedings
The Company also is involved in a variety of claims and other legal proceedings generally incidental to its normal business activities. While the outcome of any of these proceedings cannot be accurately predicted, the Company does not believe the ultimate resolution of any of these existing matters would have a material adverse effect on its financial condition or results of operations.
Solar Tariff Contingency
In October 2012, the U.S. Department of Commerce (“Commerce”) announced its final determination in the anti-dumping (“AD”) and countervailing duty (“CVD”) investigations of imports of solar cells manufactured in the People’s Republic of China (“PRC”), including solar modules containing such cells. Commerce’s final determination confirmed its previously published AD duty of
249.96%
, for manufacturers without a separate rate, and increased its CVD from
3.61%
to
15.24%
; both duties are applied to the value of imports of solar modules containing PRC cells. On November 7, 2012, the International Trade Commission announced its final determination upholding the duties. All shipments from May 25, 2012 until the Company suspended importing solar modules containing PRC cells in July 2012 (“covered shipments”) were subject to the CVD and were covered by a single continuous entry bond. Covered shipments also were subject to AD duty, for each of which the Company was required to post a single entry bond. In August 2014, U.S. Customs lifted suspension of liquidation of covered shipments. As a result of liquidation, during the third and fourth quarters of 2014, the Company paid CVD on covered shipments at the
3.61%
rate. During the fourth quarter of 2014 through the first quarter of 2015, the Company paid AD duties on covered shipments at a
31.18%
rate. During the fourth quarter of 2015, the Company received the final bill from U.S. Customs for liquidation of one remaining covered shipment containing PRC cells and the matter was resolved in the first quarter of 2016.
Commitments as a Result of Acquisitions
Related to the Company's acquisition of EEX in the second quarter of 2014 (see Note 3), the former owners of EEX, who are now employees of the Company, may be entitled to receive up to
4,500
GBP (
$5,551
converted as of
December 31, 2016
) in additional consideration, accounted for as compensation for post-combination services, if the acquired business meets certain financial performance milestones through December 31, 2018.
The Company has established a reserve reflecting its current estimate of its ultimate exposure to these assessments.
84
AMERESCO, INC.
NOTES TO CONSOLIDATED FINANCIAL STATEMENTS - (Continued)
NOTES TO CONSOLIDATED FINANCIAL STATEMENTS - (Continued)
(in thousands, except share and per share amounts)
14. GEOGRAPHIC INFORMATION
The Company attributes revenues to customers based on the location of the customer. Information as to the Company’s operations in different geographical areas is as follows:
|
December 31,
|
|||||||
|
|
2016
|
|
2015
|
||||
|
Long-lived assets:
|
|
|
|
|
|
||
|
United States
|
$
|
306,908
|
|
|
$
|
235,298
|
|
|
Canada
|
16,454
|
|
|
14,233
|
|
||
|
Other
|
1,414
|
|
106
|
|
|||
|
Total long-lived assets
|
$
|
324,776
|
|
|
$
|
249,637
|
|
|
Year Ended December 31,
|
|||||||||||
|
2016
|
2015
|
2014
|
|||||||||
|
Revenues:
|
|
|
|||||||||
|
United States
|
$
|
588,791
|
|
$
|
567,815
|
|
$
|
509,200
|
|
||
|
Canada
|
49,706
|
|
48,968
|
|
70,069
|
|
|||||
|
Other
|
12,730
|
|
14,049
|
|
13,972
|
|
|||||
|
Total revenues
|
$
|
651,227
|
|
$
|
630,832
|
|
$
|
593,241
|
|
||
15. OTHER EXPENSES, NET
The components of other expenses, net, are as follows:
|
Year Ended December 31,
|
|||||||||||
|
|
2016
|
2015
|
2014
|
||||||||
|
Unrealized gain on interest rate swaps
|
$
|
(279
|
)
|
$
|
(368
|
)
|
$
|
(1,418
|
)
|
||
|
Interest expense, net of interest income
|
6,510
|
|
3,734
|
|
5,898
|
|
|||||
|
Amortization of deferred financing fees, net
|
1,173
|
|
1,030
|
|
1,248
|
|
|||||
|
Foreign currency transaction loss
|
5
|
|
2,369
|
|
1,131
|
|
|||||
|
Other expenses, net
|
$
|
7,409
|
|
$
|
6,765
|
|
$
|
6,859
|
|
||
Estimated amortization expense for existing deferred financing fees for the next five succeeding fiscal years is as follows:
|
Estimated Amortization
|
||||
|
2017
|
$
|
1,309
|
|
|
|
2018
|
1,119
|
|
||
|
2019
|
997
|
|
||
|
2020
|
524
|
|
||
|
2021
|
301
|
|
||
16. FAIR VALUE MEASUREMENT
The Company recognizes its financial assets and liabilities at fair value on a recurring basis (at least annually). Fair value is defined as the price that would be received for an asset or paid to transfer a liability (an exit price) in the principal or most advantageous market for the asset or liability in an orderly transaction between market participants on the measurement date. Three levels of inputs that may be used to measure fair value are as follows:
Level 1:
Inputs are based upon unadjusted quoted prices for identical instruments traded in active markets.
Level 2:
Inputs are based upon quoted prices for similar instruments in active markets, quoted prices for identical or similar instruments in markets that are not active, and model based valuation techniques for which all significant assumptions are observable in the market or can be corroborated by observable market data for substantially the full term of the assets or liabilities.
85
AMERESCO, INC.
NOTES TO CONSOLIDATED FINANCIAL STATEMENTS - (Continued)
NOTES TO CONSOLIDATED FINANCIAL STATEMENTS - (Continued)
(in thousands, except share and per share amounts)
Level 3:
Inputs are generally unobservable and typically reflect management’s estimates of assumptions that market participants would use in pricing the asset or liability. The fair values are therefore determined using model-based techniques that include option pricing models, discounted cash flow models, and similar techniques.
The following table presents the input level used to determine the fair values of the Company’s financial instruments measured at fair value on a recurring basis:
|
Fair Value as of December 31,
|
|||||||||
|
|
Level
|
2016
|
2015
|
||||||
|
Liabilities:
|
|
|
|
|
|||||
|
Interest rate swap instruments
|
2
|
$
|
3,843
|
|
$
|
4,681
|
|
||
The fair value of the Company’s interest rate swaps was determined using cash flow analysis on the expected cash flow of the contract in combination with observable market-based inputs, including interest rate curves and implied volatilities. As part of this valuation, the Company considered the credit ratings of the counterparties to the interest rate swaps to determine if a credit risk adjustment was required.
The fair value of financial instruments is determined by reference to observable market data and other valuation techniques, as appropriate. The only category of financial instruments where the difference between fair value and recorded book value is notable is long-term debt. At
December 31, 2016
and
2015
, the fair value of the Company’s long-term debt was estimated using discounted cash flows analysis, based on the Company’s current incremental borrowing rates for similar types of borrowing arrangements which are considered to be level two inputs. There have been no transfers in or out of level two for the years ended
December 31, 2016
and
2015
. Based on the analysis performed, the fair value and the carrying value of the Company’s long-term debt, excluding capital leases, are as follows:
|
As of December 31, 2016
|
As of December 31, 2015
|
||||||||||||||
|
|
Fair Value
|
Carrying Value
|
Fair Value
|
Carrying Value
|
|||||||||||
|
Long-term debt value
|
$
|
145,746
|
|
$
|
145,238
|
|
$
|
108,323
|
|
$
|
107,148
|
|
|||
The Company is also required periodically to measure certain other assets at fair value on a nonrecurring basis, including long-lived assets, goodwill and other intangible assets. The Company determined the fair value used in its annual goodwill impairment analysis with its own discounted cash flow analysis. The Company has determined the inputs used in such analysis as Level 3 inputs. The Company did not record any impairment charges on goodwill or other intangible assets as
no
significant events requiring non-financial assets and liabilities to be measured at fair value occurred for the years ended December 31,
2016
or
2015
.
17. DERIVATIVE INSTRUMENTS AND HEDGING ACTIVITIES
At December 31,
2016
and
2015
, the following table presents information about the fair value amounts of the Company’s derivative instruments:
|
|
Derivatives as of December 31,
|
||||||||||
|
|
2016
|
|
2015
|
||||||||
|
|
Balance Sheet Location
|
|
Fair Value
|
|
Balance Sheet Location
|
|
Fair Value
|
||||
|
Derivatives Designated as Hedging Instruments:
|
|
|
|
|
|
|
|
|
|
||
|
Interest rate swap contracts
|
Other liabilities
|
|
$
|
3,843
|
|
|
Other liabilities
|
|
$
|
4,681
|
|
All of the Company’s derivatives were designated as hedging instruments for the years ended
December 31, 2016
and
2015
. All but
one
derivative were designated as hedging instruments prior to March 2013 and all were designated as hedging instruments for the remainder of the year ended December 31, 2013.
86
AMERESCO, INC.
NOTES TO CONSOLIDATED FINANCIAL STATEMENTS - (Continued)
NOTES TO CONSOLIDATED FINANCIAL STATEMENTS - (Continued)
(in thousands, except share and per share amounts)
The following tables present information about the effects of the Company’s derivative instruments on the consolidated statements of income (loss) and consolidated statements of comprehensive income (loss):
|
Location of Gain Recognized in Net Income (Loss)
|
Amount of Gain Recognized in Net Income (Loss) for the Year Ended December 31,
|
||||||||||||
|
2016
|
2015
|
2014
|
|||||||||||
|
Derivatives Designated as Hedging Instruments:
|
|||||||||||||
|
Interest rate swap contracts
|
Other expenses, net
|
$
|
(279
|
)
|
$
|
(368
|
)
|
$
|
(1,418
|
)
|
|||
|
Year Ended
|
|||
|
December 31, 2016
|
|||
|
Derivatives Designated as Hedging Instruments:
|
|||
|
Accumulated loss in AOCI at the beginning of the period
|
$
|
(2,548
|
)
|
|
Unrealized gain recognized in AOCI
|
1,685
|
|
|
|
Loss reclassified from AOCI to other expenses, net
|
(1,179
|
)
|
|
|
Accumulated loss in AOCI at the end of the period
|
$
|
(2,042
|
)
|
18. BUSINESS SEGMENT INFORMATION
The Company reports results under ASC 280,
Segment Reporting.
The Company’s reportable segments for the year ended
December 31, 2016
are U.S. Regions, U.S. Federal, Canada and Small-Scale Infrastructure. The Company’s U.S. Regions, U.S. Federal and Canada segments offer energy efficiency products and services which include the design, engineering and installation of equipment and other measures to improve the efficiency and control the operation of a facility’s energy infrastructure, renewable energy solutions and services which include the construction of small-scale plants for customers that produce electricity, gas, heat or cooling from renewable sources of energy and O&M services. The Company’s Small-Scale Infrastructure segment sells electricity, processed landfill gas (“LFG”), heat or cooling, produced from renewable sources of energy, from small-scale plants that the Company owns and the construction of small-scale plants for customers. The Company’s Small-Scale Infrastructure segment also now includes certain small-scale plants developed for customers previously included in our U.S. Regions segment. Previously reported amounts have been restated for comparative purposes.The “All Other” category offers enterprise energy management services, consulting services and the sale of solar PV energy products and systems which we refer to as integrated-PV. These segments do not include results of other activities, such as corporate operating expenses not specifically allocated to the segments. Certain reportable segments are an aggregation of operating segments. For the years ended December 31,
2016
,
2015
and
2014
unallocated corporate expenses were
$32,181
,
$25,671
and
$27,621
, respectively. The accounting policies are the same as those described in the summary of significant accounting policies in Note 2. During the year ended
December 31, 2016
, the Company reserved for certain assets in its Canada segment totaling
$1,934
due to collectability concerns as a result of its previously disclosed restructuring efforts. During the year ended
December 31, 2016
, the Company included in unallocated corporate activity
$2,870
as a reserve for amounts payable from a customer who declared bankruptcy.
For the years ended
December 31,
2016
,
2015
and
2014
more than
75%
of the Company’s revenues have been derived from federal, state, provincial or local government entities, including public housing authorities and public universities. The U.S. federal government, which is considered a single customer for reporting purposes, constituted
27.3%
,
20.2%
and
17.9%
of the Company’s consolidated revenues for the years ended
December 31,
2016
,
2015
and
2014
, respectively. Revenues from the U.S. federal government are included in the Company’s U.S. Federal segment.
The reports of the Company’s chief operating decision maker do not include assets at the operating segment level.
87
AMERESCO, INC.
NOTES TO CONSOLIDATED FINANCIAL STATEMENTS - (Continued)
NOTES TO CONSOLIDATED FINANCIAL STATEMENTS - (Continued)
(in thousands, except share and per share amounts)
An analysis of the Company’s business segment information and reconciliation to the consolidated financial statements is as follows:
|
|
U.S. Regions
|
|
U.S. Federal
|
|
Canada
|
|
Small-Scale Infrastructure
|
|
All Other
|
|
Total Consolidated
|
||||||||||||
|
2016
|
|||||||||||||||||||||||
|
Revenues
|
$
|
269,766
|
|
$
|
177,991
|
|
$
|
50,448
|
|
$
|
81,395
|
|
$
|
71,627
|
|
$
|
651,227
|
|
|||||
|
Interest income
|
—
|
|
11
|
|
—
|
|
38
|
|
—
|
|
49
|
|
|||||||||||
|
Interest expense
|
—
|
|
942
|
|
1,737
|
|
4,386
|
|
23
|
|
7,088
|
|
|||||||||||
|
Depreciation and intangible asset amortization
|
490
|
|
2,588
|
|
1,090
|
|
16,004
|
|
2,628
|
|
22,800
|
|
|||||||||||
|
Unallocated corporate activity
|
—
|
|
—
|
|
—
|
|
—
|
|
—
|
|
(32,181
|
)
|
|||||||||||
|
Income (loss) before taxes, excluding unallocated corporate activity
|
18,200
|
|
22,236
|
|
(2,330
|
)
|
10,859
|
|
(417
|
)
|
48,548
|
|
|||||||||||
|
2015
|
|||||||||||||||||||||||
|
Revenues
|
301,371
|
|
127,620
|
|
49,235
|
|
66,322
|
|
86,284
|
|
630,832
|
|
|||||||||||
|
Interest income
|
—
|
|
—
|
|
1,154
|
|
175
|
|
—
|
|
1,329
|
|
|||||||||||
|
Interest expense
|
—
|
|
—
|
|
1,338
|
|
3,912
|
|
—
|
|
5,250
|
|
|||||||||||
|
Depreciation and intangible asset amortization
|
838
|
|
1,209
|
|
1,081
|
|
14,316
|
|
4,078
|
|
21,522
|
|
|||||||||||
|
Unallocated corporate activity
|
—
|
|
—
|
|
—
|
|
—
|
|
—
|
|
(25,671
|
)
|
|||||||||||
|
Income (loss) before taxes, excluding unallocated corporate activity
|
24,800
|
|
16,676
|
|
(15,449
|
)
|
8,613
|
|
(8,677
|
)
|
25,963
|
|
|||||||||||
|
2014
|
|||||||||||||||||||||||
|
Revenues
|
263,451
|
|
106,192
|
|
70,492
|
|
58,286
|
|
94,820
|
|
593,241
|
|
|||||||||||
|
Interest income
|
—
|
|
—
|
|
1
|
|
43
|
|
1
|
|
45
|
|
|||||||||||
|
Interest expense
|
—
|
|
—
|
|
1,369
|
|
3,188
|
|
—
|
|
4,557
|
|
|||||||||||
|
Depreciation and intangible asset amortization
|
1,352
|
|
1,178
|
|
1,288
|
|
12,892
|
|
4,199
|
|
20,909
|
|
|||||||||||
|
Unallocated corporate activity
|
—
|
|
—
|
|
—
|
|
—
|
|
—
|
|
(27,621
|
)
|
|||||||||||
|
Income (loss) before taxes, excluding unallocated corporate activity
|
24,849
|
|
14,035
|
|
(7,838
|
)
|
3,191
|
|
(324
|
)
|
33,913
|
|
|||||||||||
Information as to the Company’s revenues by service and product lines is as follows:
|
Year Ended December 31,
|
|||||||||||
|
2016
|
2015
|
2014
|
|||||||||
|
Revenues:
|
|||||||||||
|
Project(1)
|
$
|
454,200
|
|
$
|
434,380
|
|
$
|
386,816
|
|
||
|
Operating Assets(2)
|
64,882
|
|
55,130
|
|
51,756
|
|
|||||
|
O&M(3)
|
63,082
|
|
59,117
|
|
59,424
|
|
|||||
|
Integrated-PV(4)
|
29,325
|
|
40,070
|
|
51,200
|
|
|||||
|
Other Services
|
39,738
|
|
42,135
|
|
44,045
|
|
|||||
|
Total Revenues
|
$
|
651,227
|
|
$
|
630,832
|
|
$
|
593,241
|
|
||
(1) Project revenues consists of services related to the design, engineering and installation of, and the arranging of financing for, equipment and other measures to improve the efficiency and control the operation of a facility’s energy infrastructure. Project revenues also include the construction for customers of small-scale plants that produce electricity, gas, heat or cooling from renewable sources of energy.
(2) Operating Assets revenues includes the sale of electricity, processed LFG, heat or cooling from plants that the Company owns.
88
AMERESCO, INC.
NOTES TO CONSOLIDATED FINANCIAL STATEMENTS - (Continued)
NOTES TO CONSOLIDATED FINANCIAL STATEMENTS - (Continued)
(in thousands, except share and per share amounts)
(3) O&M revenues includes operations and maintenance services for customers as well as measurement and verification services related to our ESPCs.
(4) Integrated-PV revenues includes the sale of solar PV energy products and systems.
19. QUARTERLY INFORMATION (Unaudited)
The following tables set forth selected unaudited condensed consolidated statement of
income (loss) data for each of the most recent eight quarters ended December 31,
2016
. Operating results for any quarter are not necessarily indicative of results for any future period.
|
Three Months Ended,
|
|||||||||||||||
|
March 31
|
June 30
|
September 30
|
December 31
|
||||||||||||
|
2016
|
|||||||||||||||
|
Revenues
|
$
|
133,776
|
|
$
|
162,628
|
|
$
|
180,598
|
|
$
|
174,225
|
|
|||
|
Gross profit
|
$
|
27,676
|
|
$
|
31,856
|
|
$
|
38,795
|
|
$
|
36,017
|
|
|||
|
Net income attributable to Ameresco, Inc.
|
$
|
1,054
|
|
$
|
1,994
|
|
$
|
5,715
|
|
$
|
3,269
|
|
|||
|
Net income per share attributable to common shareholders:
|
|||||||||||||||
|
Basic
|
$
|
0.02
|
|
$
|
0.04
|
|
$
|
0.12
|
|
$
|
0.07
|
|
|||
|
Diluted
|
$
|
0.02
|
|
$
|
0.04
|
|
$
|
0.12
|
|
$
|
0.07
|
|
|||
|
Weighted average common shares outstanding:
|
|||||||||||||||
|
Basic
|
46,742,488
|
|
46,719,122
|
|
46,360,575
|
|
45,811,358
|
|
|||||||
|
Diluted
|
46,860,344
|
|
46,793,350
|
|
46,430,163
|
|
45,907,120
|
|
|||||||
|
2015
|
|||||||||||||||
|
Revenues
|
$
|
115,433
|
|
$
|
152,489
|
|
$
|
189,142
|
|
$
|
173,768
|
|
|||
|
Gross profit
|
$
|
19,643
|
|
$
|
30,896
|
|
$
|
36,293
|
|
$
|
30,232
|
|
|||
|
Net (loss) income attributable to Ameresco, Inc.
|
$
|
(4,188
|
)
|
$
|
1,991
|
|
$
|
4,178
|
|
$
|
(1,137
|
)
|
|||
|
Net (loss) income per share attributable to common shareholders:
|
|||||||||||||||
|
Basic
|
$
|
(0.09
|
)
|
$
|
0.04
|
|
$
|
0.09
|
|
$
|
(0.02
|
)
|
|||
|
Diluted
|
$
|
(0.09
|
)
|
$
|
0.04
|
|
$
|
0.09
|
|
$
|
(0.02
|
)
|
|||
|
Weighted average common shares outstanding:
|
|||||||||||||||
|
Basic
|
46,408,123
|
|
46,493,162
|
|
46,517,638
|
|
46,556,977
|
|
|||||||
|
Diluted
|
46,408,123
|
|
47,385,412
|
|
48,056,359
|
|
46,566,977
|
|
|||||||
20. SUBSEQUENT EVENTS
In February 2017, the Company’s Board of Directors authorized an increase in the Company’s share repurchase authorization to
$15 million
, up from
$10 million
, of the Company's Class A common stock from time to time on the open market or in privately negotiated transactions.
The timing and amount of any shares repurchased will be determined by the Company's management based on its evaluation of market conditions and other factors. Any repurchased shares will be available for use in connection with its stock plans and for other corporate purposes. The repurchase program will be funded using the Company's working capital and borrowings under its revolving line of credit.
In January 2017, the Company acquired
two
additional solar PV project currently under construction as well as associated construction loans agreement with a bank for use in providing non-recourse financing for these acquired solar PV project currently under construction. The Company paid
$2,409
to acquire the asset under construction, and assumed
$5,635
of associated non-recourse financing.
89
REPORT OF INDEPENDENT REGISTERED PUBLIC ACCOUNTING FIRM
To the Board of Directors and Shareholders of
Ameresco, Inc.
We have audited the accompanying consolidated balance sheets of Ameresco, Inc. and Subsidiaries (the “Company”) as of December 31, 2016 and 2015, and the related consolidated statements of income (loss), comprehensive income (loss), changes in redeemable non-controlling interest and stockholders’ equity, and cash flows for each of the years in the three-year period ended December 31, 2016. We also have audited the Company’s internal control over financial reporting as of December 31, 2016, based on criteria established in
Internal Control - Integrated Framework
issued by the Committee of Sponsoring Organizations of the Treadway Commission in 2013. The Company’s management is responsible for these financial statements, for maintaining effective internal control over financial reporting, and for its assessment of the effectiveness of internal control over financial reporting included in the accompanying Management’s Annual Report on Internal Control over Financial Reporting. Our responsibility is to express an opinion on these financial statements and an opinion on the Company's internal control over financial reporting based on our audits.
We conducted our audits in accordance with the standards of the Public Company Accounting Oversight Board (United States). Those standards require that we plan and perform the audits to obtain reasonable assurance about whether the financial statements are free of material misstatement and whether effective internal control over financial reporting was maintained in all material respects. Our audits of the financial statements included examining, on a test basis, evidence supporting the amounts and disclosures in the financial statements, assessing the accounting principles used and significant estimates made by management, and evaluating the overall financial statement presentation. Our audit of internal control over financial reporting included obtaining an understanding of internal control over financial reporting, assessing the risk that a material weakness exists, and testing and evaluating the design and operating effectiveness of internal control based on the assessed risk. Our audits also included performing such other procedures as we considered necessary in the circumstances. We believe that our audits provide a reasonable basis for our opinions.
A company's internal control over financial reporting is a process designed to provide reasonable assurance regarding the reliability of financial reporting and the preparation of financial statements for external purposes in accordance with generally accepted accounting principles. A company's internal control over financial reporting includes those policies and procedures that
(1)
pertain to the maintenance of records that, in reasonable detail, accurately and fairly reflect the transactions and dispositions of the assets of the company;
(2)
provide reasonable assurance that transactions are recorded as necessary to permit preparation of financial statements in accordance with generally accepted accounting principles, and that receipts and expenditures of the company are being made only in accordance with authorizations of management and directors of the company; and
(3)
provide reasonable assurance regarding prevention or timely detection of unauthorized acquisition, use, or disposition of the company's assets that could have a material effect on the financial statements.
Because of its inherent limitations, internal control over financial reporting may not prevent or detect misstatements. Also, projections of any evaluation of effectiveness to future periods are subject to the risk that controls may become inadequate because of changes in conditions, or that the degree of compliance with the policies or procedures may deteriorate.
In our opinion, the consolidated financial statements referred to above present fairly, in all material respects, the financial position of Ameresco, Inc. and Subsidiaries as of December 31, 2016 and 2015, and the results of their operations and their cash flows for each of the years in the three-year period ended December 31, 2016, in conformity with accounting principles generally accepted in the United States of America. Also in our opinion, Ameresco, Inc. and Subsidiaries maintained, in all material respects, effective internal control over financial reporting as of December 31, 2016, based on criteria established in
Internal Control - Integrated Framework
issued by the Committee of Sponsoring Organizations of the Treadway Commission in 2013.
/s/ RSM US LLP
Boston, Massachusetts
March 3, 2017
90
None.
Evaluation of Disclosure Controls and Procedures
Our management, with the participation of our principal executive officer and principal financial officer, evaluated the effectiveness of our disclosure controls and procedures, as defined in Rules 13a-15(e) and 15d-15(e) under the Exchange Act, as of the end of the period covered by this annual report, or the evaluation date. Disclosure controls and procedures are designed to ensure that information required to be disclosed by a company in the reports that it files or submits under the Exchange Act is recorded, processed, summarized and reported, within the time periods specified in the SEC’s rules and forms. Our management recognizes that any controls and procedures, no matter how well designed and operated, can provide only reasonable assurance of achieving their objectives, and management necessarily applies its judgment in evaluating the cost-benefit relationship of possible controls and procedures. Our management, after evaluating the effectiveness of our disclosure controls and procedures as of the evaluation date, concluded that as of the evaluation date, our disclosure controls and procedures were effective at the reasonable assurance level.
Management’s Annual Report on Internal Control over Financial Reporting
Our management, with the participation of our principal executive officer and principal financial officer, is responsible for establishing and maintaining adequate internal control over our financial reporting as defined in Rules 13a-15(f) and 15d-15(f) under the Exchange Act as a process designed by, or under the supervision of, a company’s principal executive and principal financial officers and effected by our board of directors, management and other personnel to provide reasonable assurance regarding the reliability of financial reporting and the preparation of financial statements for external purposes in accordance with GAAP. Our internal control over financial reporting includes those policies and procedures that:
|
•
|
pertain to the maintenance of records that, in reasonable detail, accurately and fairly reflect our transactions and dispositions of our assets;
|
|
•
|
provide reasonable assurance that transactions are recorded as necessary to permit preparation of financial statements in accordance with GAAP, and that our receipts and expenditures are being made only in accordance with authorizations of our management and directors; and
|
|
•
|
provide reasonable assurance regarding prevention or timely detection of unauthorized acquisition, use or disposition of our assets that could have a material effect on our financial statements.
|
Because of its inherent limitations, internal control over financial reporting may not prevent or detect misstatements. Projections of any evaluation of effectiveness to future periods are subject to the risk that controls may become inadequate because of changes in conditions, or that the degree of compliance with the policies or procedures may deteriorate.
Our management assessed the effectiveness of our internal control over financial reporting as of
December 31, 2016
. In making this assessment, management used the criteria set forth by the Committee of Sponsoring Organizations of the Treadway Commission (COSO) in Internal Control - Integrated Framework (2013).
Based on this assessment and those criteria, our management concluded that, as of
December 31, 2016
, our internal control over financial reporting was effective.
The effectiveness of our internal control over financial reporting as of
December 31, 2016
has been audited by RSM US LLP, an independent registered public accounting firm, as stated in their report, which appears under Item 8.
Changes in Internal Control over Financial Reporting
There were no changes in our internal control over financial reporting, other than those stated above, during our most recent fiscal quarter that have materially affected, or are reasonably likely to materially affect, our internal control over financial reporting.
None.
91
The information concerning our executive officers is set forth under the heading “Executive Officers” at the end of Item 1 in Part I of this report.
We have adopted a written code of business conduct and ethics that applies to our directors, officers and employees, including our principal executive officer, principal financial officer, principal accounting officer or controller, and persons performing similar functions. A copy of the code of business conduct and ethics is posted on the Investor Relations section of our website, which is located at www.ameresco.com. In addition, we intend to post on our website all disclosures that are required by law or applicable NYSE listing standards concerning any amendments to, or waivers from, any provision of the code. We include our website address in this report only as an inactive textual reference and do not intend it to be an active link to our website. None of the material on our website is part of this Annual Report on Form 10-K.
The response to the remainder of this item is incorporated by reference from the discussion responsive thereto in the sections titled “Corporate Governance” and “Stock Ownership - Section 16(a) Beneficial Ownership Reporting Compliance” contained in the definitive proxy statement for our
2017
annual meeting of stockholders.
The response to this item is incorporated by reference from the discussion responsive thereto in the sections titled “Executive Compensation and Related Information” and “Corporate Governance” contained in the definitive proxy statement for our
2017
annual meeting of stockholders.
Equity Compensation Plan Information
The following table provides information about the securities authorized for issuance under our equity compensation plans as of
December 31, 2016
:
Equity Compensation Plan Information
|
(a)
|
(b)
|
(c)
|
||||||||
|
Plan category
|
Number of securities to be issued upon exercise of outstanding options, warrants and rights
|
Weighted-average exercise price of outstanding options, warrants and rights
|
Number of securities remaining available for future issuance under equity compensation plans (excluding securities reflected in column (a))
|
|||||||
|
Equity compensation plans approved by security holders
(1)(2)
|
3,971,382
|
|
$
|
7.2997
|
|
7,409,802
|
|
|||
|
Equity compensation plans not approved by security holders
|
—
|
|
—
|
|
—
|
|
||||
|
Total
|
3,971,382
|
|
$
|
7.2997
|
|
7,409,802
|
|
|||
|
(1)
|
Consists of our 2000 stock incentive plan and our 2010 stock incentive plan.
|
|
(2)
|
All securities remaining available for future issuance are under our 2010 stock incentive plan. In addition to being available for future issuance upon exercise of options that may be granted after
December 31, 2016
, shares under our 2010 stock incentive plan may instead be issued in the form of stock appreciation rights, restricted stock, restricted stock units and other stock-based awards.
|
The response to the remainder of this item is incorporated by reference from the discussion responsive thereto in the section titled “Stock Ownership” contained in the definitive proxy statement for our
2017
annual meeting of stockholders.
The response to this item is incorporated by reference from the discussion responsive thereto in the sections titled “Certain Relationships and Related Person Transactions” and “Corporate Governance” contained in the definitive proxy statement for our
2017
annual meeting of stockholders.
92
The response to this item is incorporated by reference from the discussion responsive thereto in the section titled “Proposal 2 - Ratification of the Selection of our Independent Registered Public Accounting Firm” contained in the definitive proxy statement for our
2017
annual meeting of stockholders.
93
(a)(1)
Consolidated Financial Statements.
The following consolidated financial statements of Ameresco, Inc. are filed in Item 8 of this Annual Report on Form 10-K:
(2)
Financial Statement Schedules.
Schedules are omitted because they are not applicable, or are not required, or because the information is included in the consolidated financial statements and notes thereto.
(3)
Exhibits.
The exhibits filed or furnished with this report or that are incorporated herein by reference are set forth in the Exhibit Index immediately preceding such exhibits, which Exhibit Index is incorporated herein by reference.
94
SIGNATURES
Pursuant to the requirements of Section 13 or 15(d) of the Securities Exchange Act of 1934, the Registrant has duly caused this report to be signed on its behalf by the undersigned, thereunto duly authorized.
|
AMERESCO, INC.
|
||
|
Date: March 3, 2017
|
By:
|
/s/ George P. Sakellaris
|
|
George P. Sakellaris
|
||
|
President and Chief Executive Officer
|
||
Pursuant to the requirements of the Securities Exchange Act of 1934, this Annual Report on Form 10-K has been signed below by the following persons on behalf of the Registrant and in the capacities and on the dates indicated.
|
Signature
|
Title
|
Date
|
||
|
/s/ George P. Sakellaris
|
Chairman of the Board of Directors,
President and Chief Executive Officer
(Principal Executive Officer)
|
March 3, 2017
|
||
|
George P. Sakellaris
|
||||
|
/s/ John R. Granara, III
|
Executive Vice President and Chief Financial Officer
(Principal Financial and Accounting Officer)
|
March 3, 2017
|
||
|
John R. Granara, III
|
||||
|
/s/ David J. Anderson
|
Director
|
March 3, 2017
|
||
|
David J. Anderson
|
||||
|
/s/ David J. Corrsin
|
Director
|
March 3, 2017
|
||
|
David J. Corrsin
|
||||
|
/s/ Douglas I. Foy
|
Director
|
March 3, 2017
|
||
|
Douglas I. Foy
|
||||
|
/s/ Thomas S. Murley
|
Director
|
March 3, 2017
|
||
|
Thomas S. Murley
|
||||
|
/s/ Jennifer L. Miller
|
Director
|
March 3, 2017
|
||
|
Jennifer L. Miller
|
||||
|
/s/ Joseph W. Sutton
|
Director
|
March 3, 2017
|
||
|
Joseph W. Sutton
|
||||
|
/s/ Frank V. Wisneski
|
Director
|
March 3, 2017
|
||
|
Frank V. Wisneski
|
||||
95
Exhibit Index
|
Exhibit
Number
|
Description
|
|
3.1
|
Amended and Restated Certificate of Incorporation of Ameresco, Inc. Filed as Exhibit 3.1 to our Current Report on Form 8-K dated July 27, 2010 and filed with the Commission on July 30, 2010 (file no. 001-34811) and incorporated herein by reference.
|
|
3.2
|
Amended and Restated By-Laws of Ameresco, Inc. (as further amended May 22, 2014). Filed as Exhibit 3.1 to our Quarterly Report on Form 10-Q for the fiscal quarter ended June 30, 2014 and filed with the Commission on July 31, 2014 (file no. 011-34811) and incorporated herein by reference. Filed as Exhibit 3.1 to our Registration Statement on Form S-1 (pre-effective amendment no. 4; reg. no. 333-165821) and incorporated herein by reference.
|
|
4.1
|
Specimen Certificate evidencing shares of Class A common stock. Filed as Exhibit 4.1 to our Registration Statement on Form S-1 (pre-effective amendment no. 4; reg. no. 333-165821) and incorporated herein by reference.
|
|
10.1.1
|
Lease dated November 20, 2000 between Ameresco, Inc. and BCIA New England Holdings, LLC. Filed as Exhibit 10.1 to our Registration Statement on Form S-1 (reg. no. 333-165821) and incorporated herein by reference.
|
|
10.1.2
|
First Amendment to Lease dated November 2001 by and between Ameresco, Inc. and BCIA New England Holdings, LLC. Filed as Exhibit 10.2 to our Registration Statement on Form S-1 (reg. no. 333-165821) and incorporated herein by reference.
|
|
10.1.3
|
Second Amendment to Lease and Extension Agreement dated April 8, 2005 by and between Ameresco, Inc. and BCIA New England Holdings, LLC. Filed as Exhibit 10.3 to our Registration Statement on Form S-1 (reg. no. 333-165821) and incorporated herein by reference.
|
|
10.1.4
|
Third Amendment to Lease dated April 17, 2007 by and between RREEF America REIT III-Z1 LLC and Ameresco, Inc. Filed as Exhibit 10.4 to our Registration Statement on Form S-1 (reg. no. 333-165821) and incorporated herein by reference.
|
|
10.1.5
|
Fourth Amendment to Lease dated January 1, 2010 by and between RREEF America REIT III-Z1 LLC and Ameresco, Inc. Filed as Exhibit 10.17 to our Registration Statement on Form S-1 (pre-effective amendment no. 3; reg. no. 333-165821) and incorporated herein by reference.
|
|
10.1.6
|
Fifth Amendment to Lease dated August 31, 2011 by and between RREEF America REIT III-Z1 LLC and Ameresco, Inc. Filed as Exhibit 10.1.6 to our Annual Report on Form 10-K for the fiscal year ended December 31, 2011 and filed with the Commission on March 15, 2012 (file no. 011-34811) and incorporated herein by reference.
|
|
10.1.7
|
Sixth Amendment to Lease dated June 18, 2013 by and between 111 MPA LLC and Ameresco, Inc. Filed as Exhibit 10.3 to our Quarterly Report on Form 10-Q for the fiscal quarter ended June 30, 2013 and filed with the Commission on August 9, 2013 (file no. 001-34811) and incorporated herein by reference.
|
|
10.1.8
|
Seventh Amendment to Lease dated May 6, 2016 by and between 111 MPA LLC and Ameresco, Inc. Filed as Exhibit 10.3 to our Quarterly Report on Form 10-Q for the fiscal quarter ended June 30, 2016 and filed with the Commission on August 9, 2016 (file no. 001-34811) and incorporated herein by reference.
|
|
10.2.1
|
Third Amended and Restated Credit and Security Agreement dated June 30, 2015 among Ameresco, Inc., certain guarantors party thereto, certain lenders party thereto from time to time and Bank of America, N.A. as Administrative Agent. Filed as Exhibit 10.1 to our Current Report on Form 8-K dated June 30, 2015 and filed with the Commission on July 2, 2015 (file no. 001-34811) and incorporated herein by reference.
|
96
|
Exhibit
Number
|
Description
|
|
10.2.2
|
Amendment No. 1 to Third Amended and Restated Credit and Security Agreement dated April 22, 2016 among Ameresco, Inc., certain guarantors party thereto, certain lenders party thereto from time to time and Bank of America, N.A. as Administrative Agent. Filed as Exhibit 10.1 to our Quarterly Report on Form 10-Q for the fiscal quarter ended June 30, 2016 and filed with the Commission on August 9, 2016 (file no. 001-34811) and incorporated herein by reference.
|
|
10.2.3
|
Amendment No. 2 to Third Amended and Restated Credit and Security Agreement dated May 4, 2016 among Ameresco, Inc., certain guarantors party thereto, certain lenders party thereto from time to time and Bank of America, N.A. as Administrative Agent. Filed as Exhibit 10.2 to our Quarterly Report on Form 10-Q for the fiscal quarter ended June 30, 2016 and filed with the Commission on August 9, 2016 (file no. 001-34811) and incorporated herein by reference.
|
|
10.2.4
|
Amendment No. 3 to Third Amended and Restated Credit and Security Agreement dated July 27, 2016 among Ameresco, Inc., certain guarantors party thereto, certain lenders party thereto from time to time and Bank of America, N.A. as Administrative Agent. Filed as Exhibit 10.1 to our Quarterly Report on Form 10-Q for the fiscal quarter ended September 30, 2016 and filed with the Commission on November 1, 2016 (file no. 001-34811) and incorporated herein by reference.
|
|
10.2.5
|
Amendment No. 4 to Third Amended and Restated Credit and Security Agreement dated November 17, 2016 among Ameresco, Inc., certain guarantors party thereto, certain lenders party thereto from time to time and Bank of America, N.A. as Administrative Agent. Filed as Exhibit 10.1 to our Current Report on Form 8-K dated November 17, 2016 and filed with the Commission on November 22, 2016 (file no. 001-34811) and incorporated herein by reference.
|
|
10.3.1+
|
Ameresco, Inc. 2000 Stock Incentive Plan. Filed as Exhibit 10.6 to our Registration Statement on Form S-1 (reg. no. 333-165821) and incorporated herein by reference.
|
|
10.3.2+
|
Form of Incentive Stock Option Agreement granted under Ameresco, Inc. 2000 Stock Incentive Plan. Filed as Exhibit 10.7 to our Registration Statement on Form S-1 (reg. no. 333-165821) and incorporated herein by reference.
|
|
10.3.3+
|
Form of Non-Qualified Stock Option Agreement granted under Ameresco, Inc. 2000 Stock Incentive Plan. Filed as Exhibit 10.8 to our Registration Statement on Form S-1 (reg. no. 333-165821) and incorporated herein by reference.
|
|
10.3.3+
|
Form of Non-Qualified Stock Option Agreement granted under Ameresco, Inc. 2000 Stock Incentive Plan. Filed as Exhibit 10.8 to our Registration Statement on Form S-1 (reg. no. 333-165821) and incorporated herein by reference.
|
|
10.4.1+
|
Ameresco, Inc. 2010 Stock Incentive Plan. Filed as Exhibit 10.10 to our Registration Statement on Form S-1 (pre-effective amendment no. 4; reg. no. 333-165821) and incorporated herein by reference.
|
|
10.4.2+
|
Form of Incentive Stock Option Agreement granted under Ameresco, Inc. 2010 Stock Incentive Plan. Filed as Exhibit 10.11 to our Registration Statement on Form S-1 (pre-effective amendment no. 4; reg. no. 333-165821) and incorporated herein by reference.
|
|
10.4.3+
|
Form of Director Stock Option Agreement granted under Ameresco, Inc. 2010 Stock Incentive Plan. Filed as Exhibit 10.12 to our Registration Statement on Form S-1 (pre-effective amendment no. 4; reg. no. 333-165821) and incorporated herein by reference.
|
|
10.6.1+
|
Form of Indemnification Agreement entered into between Ameresco, Inc. and each non-employee director. Filed as Exhibit 10.6.1 to our Annual Report on Form 10-K for the fiscal year ended December 31, 2010 and filed with the Commission on March 31, 2011 (file no. 001-34811) and incorporated herein by reference.
|
|
10.6.2+
|
Form of Indemnification Agreement entered into between Ameresco, Inc. and each employee director. Filed as Exhibit 10.6.2 to our Annual Report on Form 10-K for the fiscal year ended December 31, 2010 and filed with the Commission on March 31, 2011 (file no. 001-34811) and incorporated herein by reference.
|
|
21.1*
|
Subsidiaries of Ameresco, Inc.
|
|
23.1*
|
Consent of RSM US LLP.
|
97
|
Exhibit
Number
|
Description
|
|
31.1*
|
Principal Executive Officer Certification required by Rule 13a-14(a) or Rule 15d-14(a) of the Securities Exchange Act of 1934, as adopted pursuant to Section 302 of the Sarbanes-Oxley Act of 2002.
|
|
31.2*
|
Principal Financial Officer Certification required by Rule 13a-14(a) or Rule 15d-14(a) of the Securities Exchange Act of 1934, as adopted pursuant to Section 302 of the Sarbanes-Oxley Act of 2002.
|
|
32.1**
|
Certifications pursuant to 18 U.S.C. Section 1350, as adopted pursuant to Section 906 of the Sarbanes-Oxley Act of 2002.
|
|
101
|
The following consolidated financial statements from Ameresco, Inc.’s Annual Report on Form 10-K for the year ended December 31, 2016, formatted in XBRL (Extensible Business Reporting Language): (i) Consolidated Balance Sheets (ii) Consolidated Statements of Income (Loss), (iii) Consolidated Statements of Comprehensive Income (Loss), (iv) Consolidated Statement of Changes in Redeemable Non-Controlling Interest and Stockholders’ Equity, (v) Consolidated Statements of Cash Flows, and (vi) Notes to Consolidated Financial Statements.
|
|
*
|
Filed herewith.
|
|
**
|
Furnished herewith.
|
|
+
|
Identifies a management contract or compensatory plan or arrangement in which an executive officer or director of Ameresco participates.
|
|
++
|
Confidential treatment requested as to certain portions, which portions have been omitted and filed separately with the Securities and Exchange Commission.
|
98
TABLE OF CONTENTS
Item 1. BusinessItem 1A. Risk FactorsItem 1B. Unresolved Staff CommentsItem 2. PropertiesItem 3. Legal ProceedingsItem 4. Mine Safety DisclosuresPart IIItem 5. Market For Registrant S Common Equity, Related Stockholder Matters and Issuer Purchases Of Equity SecuritiesItem 5C. Unregistered Sales Of Equity and Use Of ProceedsItem 6. Selected Financial DataItem 7. Management S Discussion and Analysis Of Financial Condition and Results Of OperationsItem 7A. Quantitative and Qualitative Disclosures About Market RiskItem 8. Financial Statements and Supplementary DataItem 9. Changes in and Disagreements with Accountants on Accounting and Financial DisclosureItem 9A. Controls and ProceduresItem 9B. Other InformationPart IIIItem 10. Directors, Executive Officers and Corporate GovernanceItem 11. Executive CompensationItem 12. Security Ownership Of Certain Beneficial Owners and Management and Related Stockholder MattersItem 13. Certain Relationships and Related Transactions, and Director IndependenceItem 14. Principal Accountant Fees and ServicesPart IVItem 15. Exhibits and Financial Statement Schedules