UNITED STATES SECURITIES AND EXCHANGE COMMISSION
Washington, D.C. 20549
Form 10-K
(Mark One)
|
x
|
ANNUAL REPORT PURSUANT TO SECTION 13 OR 15(d) OF THE SECURITIES EXCHANGE ACT OF 1934
For the fiscal year ended
December 31, 2018
|
OR
|
☐
|
TRANSITION REPORT PURSUANT TO SECTION 13 OR 15(d) OF THE SECURITIES EXCHANGE ACT OF 1934
For the transition period from _______________ to _______________
|
Commission file number 001-38485
|
Amneal Pharmaceuticals, Inc.
|
||
|
(Exact name of registrant as specified in its charter)
|
||
|
Delaware
|
|
32-0546926
|
|
(State or other jurisdiction of incorporation or organization)
|
|
(I.R.S. Employer Identification No.)
|
|
400 Crossing Boulevard, Bridgewater, NJ
|
|
08807
|
|
(Address of principal executive offices)
|
|
(Zip Code)
|
|
(908) 947-3120
|
||
|
(Registrant’s telephone number, including area code)
|
||
Securities registered pursuant to Section 12(b) of the Act:
|
Title of each class
|
|
Name of each exchange on which registered
|
|
Class A Common Stock, par value $0.01 per share
|
|
New York Stock Exchange
|
Securities registered pursuant to Section 12(g) of the Act: None
Indicate by check mark if the registrant is a well-known seasoned issuer, as defined in Rule 405 of the Securities Act.
Yes ☐ No
x
Indicate by check mark if the registrant is not required to file reports pursuant to Section 13 or Section 15(d) of the Act.
Yes ☐ No
x
Indicate by check mark whether the registrant (1) has filed all reports required to be filed by Section 13 or 15(d) of the Securities Exchange Act of 1934 during the preceding 12 months (or for such shorter period that the registrant was required to file such reports), and (2) has been subject to such filing requirements for the past 90 days.
Yes
x
No ☐
Indicate by check mark whether the registrant has submitted electronically every Interactive Data File required to be submitted pursuant to Rule 405 of Regulation S-T (§ 232.405 of this chapter) during the preceding 12 months (or for such shorter period that the registrant was required to submit such files).
Yes
x
No ☐
Indicate by check mark if disclosure of delinquent filers pursuant to Item 405 of Regulation S-K (§ 229.405 of this chapter) is not contained herein, and will not be contained, to the best of registrant’s knowledge, in definitive proxy or information statements incorporated by reference in Part III of this Form 10-K or any amendment to this Form 10-K.
x
Indicate by check mark whether the registrant is a large accelerated filer, an accelerated filer, a non-accelerated filer, a smaller reporting company, or an emerging growth company. See the definitions of "large accelerated filer," "accelerated filer," "smaller reporting company," and "emerging growth company" in Rule 12b-2 of the Exchange Act. (Check one):
|
Large accelerated filer
|
☐
|
Accelerated filer
|
☐
|
|
Non-accelerated filer
|
x
|
Smaller reporting company
|
☐
|
|
Emerging growth company
|
☐
|
||
If an emerging growth company, indicate by check mark if the registrant has elected not to use the extended transition period for complying with any new or revised financial accounting standards provided pursuant to Section 13(a) of the Exchange Act. ☐
Indicate by check mark whether the registrant is a shell company (as defined in Rule 12b-2 of the Exchange Act). Yes ☐ No
x
The aggregate market value of the registrant’s outstanding shares of common stock, other than shares held by persons who may be deemed affiliates of the registrant, computed by reference to the price at which the registrant’s common stock was last sold on the New York Stock Exchange as of the last business day of the registrant’s most recently completed second fiscal quarter (June 30, 2018), was approximately $1,970,292,676.
As of
February 21, 2019
, there were
115,420,925
shares of Class A common stock outstanding,
170,940,707
shares of Class B common stock outstanding and
12,328,767
shares of Class B-1 common stock outstanding, all with a par value of $0.01.
DOCUMENTS INCORPORATED BY REFERENCE
Certain information required to be furnished pursuant to Part III of this Form 10-K will be set forth in, and is hereby incorporated by reference herein from, the registrant’s definitive proxy statement for its 2019 Annual Meeting of Stockholders, to be filed by the registrant with the Securities and Exchange Commission pursuant to Regulation 14A no later than 120 days after December 31, 2018 (the “2019 Proxy Statement”).
1
Amneal Pharmaceuticals, Inc.
Table of Contents
|
|
|
|
|
|
PART I.
|
|
|
|
|
Item 1.
|
|||
|
Item 1A.
|
|||
|
Item 1B.
|
|||
|
Item 2.
|
|||
|
Item 3.
|
|||
|
Item 4.
|
|||
|
|
|
|
|
|
PART II.
|
|
|
|
|
Item 5.
|
|||
|
Item 6.
|
|||
|
Item 7.
|
|||
|
Item 7A.
|
|||
|
Item 8.
|
|||
|
Item 9.
|
|||
|
Item 9A.
|
|||
|
Item 9B.
|
|||
|
|
|
|
|
|
PART III.
|
|
|
|
|
Item 10.
|
|||
|
Item 11.
|
|||
|
Item 12.
|
|||
|
Item 13.
|
|||
|
Item 14.
|
|||
|
|
|
|
|
|
PART IV.
|
|
|
|
|
Item 15.
|
|||
|
Item 16.
|
|
||
|
|
|
|
|
2
Cautionary Note Regarding Forward-Looking Statements
This Annual Report on Form 10-K and Amneal Pharmaceuticals, Inc.'s other publicly available documents contain "forward-looking statements" within the meaning of the safe harbor provisions of the U.S. Private Securities Litigation Reform Act of 1995. Management and representatives of Amneal Pharmaceuticals, Inc. and its subsidiaries (the "Company") also may from time to time make forward-looking statements. Forward-looking statements do not relate strictly to historical or current facts and reflect management’s assumptions, views, plans, objectives and projections about the future. Forward-looking statements may be identified by the use of words such as “plans,” “expects,” “will,” “anticipates,” “estimates” and other words of similar meaning in conjunction with, among other things: discussions of future operations; expected operating results and financial performance; impact of planned acquisitions and dispositions; the Company’s strategy for growth; product development; regulatory approvals; market position and expenditures.
Because forward-looking statements are based on current beliefs, expectations and assumptions regarding future events, they are subject to uncertainties, risks and changes that are difficult to predict and many of which are outside of the Company's control. Investors should realize that if underlying assumptions prove inaccurate, known or unknown risks or uncertainties materialize, or other factors or circumstances change, the Company’s actual results and financial condition could vary materially from expectations and projections expressed or implied in its forward-looking statements. Investors are therefore cautioned not to rely on these forward-looking statements.
Such risks and uncertainties include, but are not limited to:
|
•
|
the impact of global economic conditions;
|
|
•
|
our ability to integrate the operations of Amneal Pharmaceuticals LLC and Impax Laboratories, LLC pursuant to the business combination completed on May 4, 2018, and our ability to realize the anticipated synergies and other benefits of the combination;
|
|
•
|
our ability to successfully develop, license, acquire and commercialize new products on a timely basis;
|
|
•
|
our ability to obtain exclusive marketing rights for our products;
|
|
•
|
the competition we face in the pharmaceutical industry from brand and generic drug product companies, and the impact of that competition on our ability to set prices;
|
|
•
|
our ability to manage our growth through acquisitions and otherwise;
|
|
•
|
our dependence on the sales of a limited number of products for a substantial portion of our total revenues;
|
|
•
|
the risk of product liability and other claims against us by consumers and other third parties;
|
|
•
|
risks related to changes in the regulatory environment, including United States federal and state laws related to healthcare fraud abuse and health information privacy and security and changes in such laws;
|
|
•
|
changes to FDA product approval requirements;
|
|
•
|
risks related to federal regulation of arrangements between manufacturers of branded and generic products;
|
|
•
|
the impact of healthcare reform and changes in coverage and reimbursement levels by governmental authorities and other third-party payers;
|
|
•
|
the continuing trend of consolidation of certain customer groups;
|
|
•
|
our reliance on certain licenses to proprietary technologies from time to time;
|
|
•
|
our dependence on third-party suppliers and distributors for raw materials for our products and certain finished goods;
|
|
•
|
our dependence on third-party agreements for a portion of our product offerings;
|
|
•
|
our ability to identify and make acquisitions of or investments in complementary businesses and products on advantageous terms;
|
|
•
|
legal, regulatory and legislative efforts by our brand competitors to deter competition from our generic alternatives;
|
|
•
|
the significant amount of resources we expend on research and development;
|
|
•
|
our substantial amount of indebtedness and our ability to generate sufficient cash to service our indebtedness in the future, and the impact of interest rate fluctuations on such indebtedness;
|
the high concentration of ownership of our Class A Common Stock and the fact that we are controlled by the Amneal Group; and
|
•
|
such other factors as may be set forth elsewhere in this Annual Report on Form 10-K, particularly in the section entitled
1A. Risk Factors
and our public filings with the SEC.
|
Investors also should carefully read the Risk Factors described in
Item 1A. Risk Factors
for a description of certain risks that could, among other things, cause our actual results to differ materially from those expressed in our forward-looking statements. Investors should understand that it is not possible to predict or identify all such factors and should not consider the risks described above and in
Item 1A. Risk Factors
to be a complete statement of all potential risks and uncertainties. The Company does not undertake to publicly update any forward-looking statement that may be made from time to time, whether as a result of new information or future events or developments.
3
PART I.
Item 1. Business
Overview
Amneal Pharmaceuticals, Inc. (the "Company," "we," "us," or "our"), together with its subsidiaries, is a global pharmaceutical company that develops, licenses, manufactures, markets and distributes generic and specialty pharmaceutical products in a variety of dosage forms and therapeutic categories.
The Company is a Delaware corporation and was formed under the name Atlas Holdings, Inc. on October 4, 2017, for the purpose of facilitating the combination (the "Combination") of Amneal Pharmaceuticals LLC ("Amneal"), a Delaware limited liability company, and Impax Laboratories, Inc. ("Impax"), a Delaware corporation. Prior to the Combination, Amneal was a privately held limited liability company with a portfolio of generic pharmaceutical products and Impax was a publicly held corporation with a portfolio of generic and specialty pharmaceutical products. On May 4, 2018, the Combination was completed and the Company changed its name from Atlas Holdings, Inc. to Amneal Pharmaceuticals, Inc.
As a result of the Combination, Impax became a Delaware limited liability company wholly owned by Amneal and Amneal became the operating company for the combined business. As of February 21, 2019, the group of stockholders who owned Amneal prior to the Combination (the "Amneal Group") hold approximately 57% of the equity interests in Amneal, and the Company holds the remaining 43% of the equity interests in Amneal. Although the Company holds a minority economic interest in Amneal, as the managing member of Amneal we conduct and exercise full control over all activities of Amneal. Accordingly, we report our financial results on a consolidated basis and report a non-controlling interest relating to the economic interest in Amneal not held by the Company. We treat Amneal as the accounting acquirer of Impax in the Combination, and thus the historical financial results of the Company for the periods prior to the closing of the Combination are the historical financial results of Amneal.
For more information about the Combination, see
Note 1. Nature of Operations and Basis of Presentation
.
Recent Transactions
In addition to the Combination, discussed above, we completed the following business development transactions in 2018:
|
•
|
On May 4, 2018, we entered into a licensing agreement for the U.S. market with MabXience S.L. for its biosimilar candidate for Avastin® (bevacizumab).
|
|
•
|
On May 7, 2018, we acquired 98.0% of the outstanding equity interests in Gemini Laboratories, LLC ("Gemini"), a company with a portfolio of licensed and owned, niche and mature branded products.
|
|
•
|
On August 16, 2018, we entered into a 10-year license and supply agreement with Jerome Stevens Pharmaceuticals, Inc. ("JSP") for Levothyroxine sodium tablets with an effective date of March 22, 2019.
|
|
•
|
On August 31, 2018, we entered into a 5-year supply and distribution agreement with American Regent, Inc. for the only preservative-free generic alternative to Makena® (hydroxyprogesterone caproate injection, USP, 250mg/mL).
|
|
•
|
On November 9, 2018, we entered into transition agreement with Lannett Company to begin commercialization of Levothyroxine sodium tablets on December 1, 2018, ahead of the effective date of our agreement with JSP.
|
Segments of the Business
The Company is organized into two business segments: Generics and Specialty. Prior to the Combination, Amneal had only a generics business and Impax had both a generics and a specialty business. Thus, our Generics segment comprises the generics business of Amneal and the generics business of Impax, and the Specialty segment comprises the specialty business of Impax and the Gemini business, which we acquired on May 7, 2018.
Generics
Prescription pharmaceutical products are sold either as branded or generic products. Generic pharmaceutical products have the same active pharmaceutical ingredient ("API"), dosage form, potency, route of administration, and intended use as patented branded pharmaceutical products and are usually marketed under their chemical (generic) names rather than brand names. However, generic pharmaceutical products are intended to provide a cost-effective alternative for consumers while maintaining the safety, efficacy and stability of the branded product, and as such are generally sold at prices below their branded equivalents. Typically, a generic pharmaceutical may not be marketed until the expiration of applicable patent(s) on the corresponding branded product, unless the resolution of patent litigation results in an earlier opportunity to enter the market.
4
Generic manufacturers are required to file and receive approval for an Abbreviated New Drug Application ("ANDA") in order to market a generic pharmaceutical product. In general, those companies that are able to prepare high quality ANDA submissions are comparatively advantaged. Under the previous Generic Drug User Fee Amendments ("GDUFA") authorization, the time required to obtain Food and Drug Administration ("FDA") approval of ANDAs was on average approximately 32-34 months post-filing. In August 2017, GDUFA was reauthorized and signed into law by President Trump as part of the Food and Drug Administration Reauthorization Act. This reauthorization, known as GDUFA II, is in effect from October 1, 2017 through September 30, 2022. As a result of GDUFA II, we expect the average time required to achieve approval of a generic pharmaceutical product after making an ANDA filing to decrease.
The Company’s Generics segment includes over 200 product families covering an extensive range of dosage forms and delivery systems, including both immediate and extended release oral solids, powders, liquids, sterile injectables, nasal sprays, inhalation and respiratory products, ophthalmics (which are sterile pharmaceutical preparations administered for ocular conditions), films, transdermal patches and topicals (which are creams or gels designed to administer pharmaceuticals locally through the skin). We focus on developing products with substantial barriers-to-entry resulting from complex drug formulations or manufacturing, or legal or regulatory challenges. Focusing on these opportunities allows us to offer first-to-file ("FTF"), first-to-market ("FTM") and other high-value products. A generic pharmaceutical product is considered a FTF product if the ANDA filed with respect to such product is the first to be filed for such product. Pursuant to the Hatch-Waxman Act, FTF products may receive a statutory 180-day exclusivity period, subject to certain conditions. For all reasons other than statutory exclusivity, a generic product is considered an FTM product if it is the first marketed generic version of a branded pharmaceutical . We define high-value products as products with three or fewer generic competitors at the time of launch. FTF, FTM and high-value products tend to be more profitable and often have longer life cycles than other generic pharmaceuticals. See "Pharmaceutical Approval Process in the United States," below, for more information.
As of December 31, 2018, our Generics business had 124 products either approved but not yet launched or pending FDA approval and another 96 products in various stages of development. Over 46% of our total generic pipeline consists of what we believe to be potential FTF, FTM and high-value products. We have an integrated, team-based approach to product development that combines its formulation, regulatory, legal, manufacturing and commercial capabilities.
Specialty
Our Specialty segment is engaged in the development, promotion, sale and distribution of proprietary branded pharmaceutical products, with a focus on products addressing central nervous system ("CNS") disorders, including migraine and Parkinson’s disease. Our portfolio of products includes Rytary®, an extended release oral capsule formulation of carbidopa-levodopa for the treatment of Parkinson’s disease, post-encephalitic parkinsonism, and parkinsonism that may follow carbon monoxide intoxication or manganese intoxication. In addition to Rytary®, our promoted Specialty portfolio includes Zomig® (zolmitriptan) products, for the treatment of migraine headaches, which is sold under a license agreement with AstraZeneca UK Limited, Emverm® (mebendazole) 100 mg chewable tablets, for the treatment of pinworm, whipworm, common roundworm, common hookworm and American hookworm in single or mixed infections, and Unithroid® (levothyroxine sodium), for the treatment of hypothyroidism, which is sold under a license and distribution agreement with JSP.
Geographic Areas
We operate in the United States, Switzerland, India, Ireland, the United Kingdom and certain other countries. Investments and activities in some countries outside the U.S. are subject to higher risks than comparable U.S. activities because the investment and commercial climate may be influenced by financial instability in international economies, restrictive economic policies and political and legal system uncertainties.
5
Sales & Marketing and Customers
In the United States and the Commonwealth of Puerto Rico, we market our products primarily through wholesalers and distributors, retail pharmacies, mail-order pharmacies and directly into hospitals and institutions. The majority of our generic pharmaceutical products are marketed to large group purchasing organizations ("GPOs") and sold through wholesalers, directly to large chain retailers or to mail order customers. Our sterile injectable products are generally marketed to GPOs and specialty distributors, and sold through wholesalers, and occasionally directly to large hospitals and institutions. All of our wholesalers purchase products and warehouse them for retail drug stores, independent pharmacies and managed care organizations, such as hospitals, nursing homes, health maintenance organizations, clinics, pharmacy benefit management companies and mail-order customers. In Europe and other foreign jurisdictions, we sell our products to wholesalers, distributors, independent pharmacies and, in certain countries, directly to hospitals. Through a broad network of sales representatives, we adapt our strategy to different markets as dictated by such market’s regulatory and competitive landscapes. We have over 200 customers, some of which are part of large purchasing groups. For the year ended December 31, 2018, on a combined basis, our three largest customers accounted for approximately
83%
of our gross revenue, broken out as follows: Cardinal Health, Inc. 31%, AmerisourceBergen Corporation 29% and McKesson Drug Co. 23%.
We have no long-term agreements that guarantee future business with any of our major customers and the loss of or substantial reduction in orders from any one or more of these customers could have a material adverse effect on our operating results, future prospects and financial condition.
Competition
The pharmaceutical industry is highly competitive and is affected by new technologies, new developments, government regulations, health care legislation, availability of financing, and other factors. Many of our competitors have longer operating histories and substantially greater financial, research and development, marketing, and other resources than we do. Competing manufacturers of generic pharmaceutical products create value for our customers by offering substitutes for branded pharmaceutical products at significantly lower prices, and at times we may not be able to differentiate our product offerings from those of our competitors, successfully formulate and bring to market new products that are less expensive than those of our competitors or offer commercial terms as favorable as those of our competitors. We compete with numerous other companies that currently operate, or intend to operate, in the pharmaceutical industry, including companies that are engaged in the development of controlled-release drug delivery technologies and products, and other manufacturers that may decide to undertake development of such products. Our principal competitors in the generic pharmaceutical products market are Teva Pharmaceutical Industries Ltd., Mylan N.V., Endo International plc, Sandoz International GmbH, Pfizer Inc., Fresenius Kabi KGAa, Sun Pharmaceutical Industries Ltd., Lupin Pharmaceuticals, Inc., Hikma Pharmaceuticals PLC and Aurobindo Pharma Limited.
By focusing on our high-value products with complex dosage forms and high barriers to entry, as well as taking advantage of our vertically integrated supply chain and selective use of internal API, we aim to manufacture more profitable products relative to our competition. However, there is no guarantee that this or any future strategy will enable us to compete successfully in the generic pharmaceutical industry.
The Hatch-Waxman Act amended the Food, Drug and Cosmetic Act ("FDCA") and provided for a period of 180 days of generic marketing exclusivity for each applicant that is first-to-file an ANDA with a Paragraph IV certification. The holder of the approved ANDA that successfully challenges the relevant innovator drug patent(s) usually enjoys higher market share and sales during the 180-day period of exclusivity. When the exclusivity period concludes, other generic competitors may launch their versions of the product, which may cause significant price erosion and loss of market share. In cases where we are the holder of an ANDA for a FTF product, upon the expiration of the 180 day exclusivity period, we may adjust the price of such product and provide price adjustments to our customers for the difference between the lower price and the price at which we previously sold the product then held in inventory by our customers. These adjustments are commonly known as shelf stock adjustments. In certain circumstances, we may decide not to provide price adjustments to certain customers and, as a result, we may receive returns of unsold product from these customers and forego future sales volume as opposed to reducing pricing.
Authorized generic pharmaceutical products, which are generic labeled versions of pharmaceutical products introduced by brand companies (directly or through a third party) under the brand’s new drug application ("NDA") approval, have also increased competition in the generic pharmaceutical industry. Authorized generic pharmaceutical products may be sold prior to, during and subsequent to the 180-day exclusivity period and are a significant source of competition, because brand companies do not face any regulatory barriers to rapidly introducing generic versions of their pharmaceutical products.
Additionally, consolidation among wholesalers and retailers and the formation of GPOs has caused increased price competition in the generic pharmaceutical market. The downward price adjustments demanded by distributors of generic pharmaceutical
6
products has reduced revenue and average product gross margin across the industry. Should these price reductions continue or even increase, it could have a material adverse effect on our revenue and gross margin.
The main competitive factors in the generic pharmaceutical market include:
|
•
|
a generic pharmaceutical products manufacturer’s ability to rapidly develop and obtain regulatory approval for and supply commercial quantities of generic pharmaceutical products;
|
|
•
|
the introduction of other generic pharmaceutical manufacturers’ products in direct competition with our products;
|
|
•
|
the introduction of authorized generic pharmaceutical products in direct competition with our products;
|
|
•
|
consolidation among our customers and the formation of buyer consortia;
|
|
•
|
pricing pressures by competitors and customers;
|
|
•
|
product quality of our generic pharmaceutical competitors;
|
|
•
|
our and our competitors’ breadth of product offerings across its portfolio;
|
|
•
|
our ability and the ability of our generic pharmaceutical competitors to quickly enter the market after the expiration of patents or statutory exclusivity periods, limiting the extent and duration of profitability for our products;
|
|
•
|
the willingness of our customers to switch their source of supply of products among various generic pharmaceutical competitors;
|
|
•
|
the ability of our generic pharmaceutical competitors to identify and market niche products;
|
|
•
|
our and our competitors’ level of service (including maintenance of inventories for timely delivery) and reputation as a reliable developer and manufacturer of generic pharmaceutical products; and
|
|
•
|
product appearance and labeling for our products and those of our competitors.
|
In the brand-name pharmaceutical market, our principal competitors are pharmaceutical companies that are focused on Parkinson’s disease and other CNS disorders. In addition, with respect to products that we are developing internally and/or any additional products we may in-license from third parties, we expect that we will face increased competition from large pharmaceutical companies, drug delivery companies and other specialty pharmaceutical companies that have focused on the same disorders as our branded products.
Research and Development
Research and development ("R&D") activities represent a significant part of our business. Research and development expenditures relate to the processes of discovering, testing and developing new products, upfront payments and milestones, improving existing products, as well as demonstrating product efficacy, if applicable, and regulatory compliance prior to launch. We are committed to investing in R&D with the aim of delivering high quality and innovative products. For the years ended December 31,
2018
,
2017
and
2016
, we spent
$194 million
,
$171 million
and
$179 million
, respectively, on R&D.
Raw Materials
Raw materials, including APIs, essential to our business are generally readily available from multiple sources. We purchase raw materials from distributors of bulk pharmaceutical chemicals and we also manufacture certain APIs at our facilities in India. In some cases, however, the raw materials used to manufacture our products are available only from a single supplier. Further, even if more than one supplier exists, we may choose, and have done so in the case of our API suppliers for a majority of our products, to list only one supplier in our product applications submitted to the FDA. Generally, we would need as long as 18 months to find and qualify a new sole-source supplier. If we receive less than one year’s termination notice from a sole-source supplier that it intends to cease supplying raw materials, it could result in disruption of our ability to produce the drug involved. Although to date, we have only experienced occasional interruptions in supplies, no assurance can be given that we will continue to receive uninterrupted or adequate supplies of such raw materials. Any inability to obtain raw materials on a timely basis, or any significant price increases not passed on to customers, could have a material adverse effect on our business.
Because legal and regulatory requirements mandate that our product marketing authorizations specify API and raw material suppliers, if a specified supplier were for any reason unable to continue to supply us, we would need to seek FDA approval of a new supplier. The resulting delay in the manufacture and marketing of the impacted pharmaceutical product during the FDA process to qualify and approve the new supplier could, depending on the product, have a material adverse effect on our results of operations and financial condition. We protect against the risk of such an event by generally providing for, where feasible, two or more suppliers of raw materials for the pharmaceutical products we manufacture, including those for which we manufacture API in-house. Additionally, we may enter into a contract with a raw material distributor in order to secure adequate supply for specific products.
7
Manufacturing and Distribution
We have a network of ten manufacturing sites and seven co-located R&D centers within the United States, India and Ireland, with broad dosage capability across oral solids, solutions, suspensions, creams, gels, ointments, nasal sprays, hormonals, patches, oral thin films, dry powder inhalers, metered dose inhalers, cytotoxics, injectables, ophthalmics, otics, and tablets / capsules, as described below. We also have a distribution center in Glasgow, Kentucky and a packaging center in East Hanover, New Jersey. We manufacture the vast majority of our products internally; of these products, for the combined year ended December 31, 2018, those manufactured in our U.S. facilities contributed 54% of product net revenue compared to 21% for those manufactured in India as of December 31, 2018. We rely on third-party manufacturers to supply a small number of products in our portfolio representing approximately 25% of our combined net revenue for the year ended December 31, 2018. Most of our Specialty products are manufactured by third-party manufacturers. In addition, we selectively manufacture API for a subset of our products, which helps to reduce the overall cost of manufacturing for our products and gives us greater control over our supply chain.
Government Regulation
The business of developing, manufacturing, selling and distributing generic products is subject to significant environmental, health and safety laws and regulations, including those governing laboratory procedures and the handling, use, storage, treatment and disposal of hazardous materials and wastes. These regulatory regimes are overseen by governmental bodies, principally the FDA and, as applicable, the Drug Enforcement Agency ("DEA"), the Federal Trade Commission ("FTC") and several state and local government agencies in the United States and abroad. Failure to comply with the regulations of these governmental agencies may result in suspension of regulatory approval and potential civil and criminal actions against us. The regulatory environment, particularly enforcement positions, statues and legal interpretations applicable to the pharmaceutical industry are constantly in flux and not always clear. Significant changes in this environment could have a material adverse effect on our financial condition and results of operations.
The FDCA, the Controlled Substances Act and other statutes and regulations govern the development, testing, manufacture, safety, effectiveness, labeling, storage, record keeping, approval and promotion of our products. Failure to comply with these regulations can result in judicial and or administrative sanctions, such as product seizures, injunctions, fines and criminal prosecutions. The FDA has the authority to withdraw its approval of pharmaceuticals at any time, in accordance with its regulatory due process procedures, and can enforce the recall of products.
Pharmaceutical Approval Process in the United States
In the United States, FDA approval is required before any “new drug” may be marketed, including new formulations, strengths, dosage forms and generic versions of previously approved drugs. Generally, the following two types of applications are used to obtain FDA approval of a “new drug.”
New Drug Application
For a drug product containing an active ingredient not previously approved by the FDA, a prospective manufacturer must submit a complete application containing the results of clinical studies supporting the drug product’s safety and efficacy. A NDA is also required for a drug with a previously approved active ingredient if the drug will be used to treat an indication for which the drug was not previously approved or if the dosage form, strength or method of delivery is changed. The process required by the FDA before a pharmaceutical product may be approved for marketing in the U.S. generally involves the steps listed below, which could take from approximately three to more than ten years to complete.
|
•
|
Laboratory and clinical tests;
|
|
•
|
Submission of an Investigational New Drug (“IND”) application, which must become effective before clinical studies may begin;
|
|
•
|
Adequate and well-controlled human clinical studies to establish the safety and efficacy of the proposed product for its intended use;
|
|
•
|
Submission of a NDA containing the results of the preclinical tests and clinical studies establishing the safety and efficacy of the proposed product for its intended use, as well as extensive data addressing such matters such as manufacturing and quality assurance;
|
|
•
|
Scale-up to commercial manufacturing; and
|
|
•
|
FDA approval of a NDA.
|
8
As noted above, the submission of a NDA is not a guarantee that the FDA will find it complete and accept it for filing. The FDA reviews all NDAs submitted before it accepts them for filing. It may refuse to file the application and instead request additional information, in which case, the application must be resubmitted with the supplemental information. After the application is deemed filed by the FDA, FDA staff will review a NDA to determine, among other things, whether a product is safe and efficacious for its intended use.
If, after reviewing the NDA, the FDA determines that the application cannot be approved in its current form, the FDA sends the NDA applicant a Complete Response Letter identifying all outstanding deficiencies that preclude final approval. The FDA then halts its review until the applicant resubmits the NDA with new information designed to address the deficiencies. An applicant receiving a Complete Response Letter may resubmit the application with data and information addressing the FDA’s concerns or requirements, withdraw the application without prejudice to a subsequent submission of a related application or request a hearing on whether there are grounds for denying approval of the application. If a product receives regulatory approval, the approval may be significantly limited to specific diseases and dosages or the indications for use may otherwise be limited, in each case compared to the approval sought, which could restrict the commercial value of the product. In addition, the FDA may require an applicant to conduct Phase 4 testing which involves clinical trials designed to further assess a drug’s safety and effectiveness after NDA approval, and may require surveillance programs to monitor the safety of approved products which have been commercialized. Once issued, the FDA may withdraw product approval if ongoing regulatory requirements are not met or if safety or efficacy questions are raised after the product reaches the market. The agency may also impose requirements that the NDA holder conduct new studies, make labeling changes, implement Risk Evaluation and Mitigation Strategies, and take other corrective measures.
Abbreviated New Drug Application
For a generic version of an approved drug-a drug product that contains the same active ingredient as a drug previously approved by the FDA and is in the same dosage form and strength, utilizes the same method of delivery and will be used to treat the same indications as the approved product - the FDA requires only an abbreviated new drug application that ordinarily need not include clinical studies demonstrating safety and efficacy. An ANDA typically requires only data demonstrating that the generic formulation is bioequivalent to the previously approved “reference listed drug,” indicating that the rate of absorption and levels of concentration of the generic drug in the body do not show a significant difference from those of the reference listed drug. In July 2012, GDUFA was enacted into law. The GDUFA legislation implemented fees for new ANDA applications, Drug Master Files, product and establishment fees and a one-time fee for back-logged ANDA applications pending approval as of October 1, 2012. In return, the program was intended to provide faster and more predictable ANDA reviews by the FDA and increased inspections of drug facilities. Under GDUFA, generic product companies face significant penalties for failure to pay the new user fees, including rendering an ANDA application not “substantially complete” until the fee is paid. Prior to the implementation of GDUFA, the FDA took an average of approximately 32-34 months to approve an ANDA. Following the implementation of GDUFA, the FDA’s stated internal goal for ANDAs was to have a “first-action” goal date within 15 months of submission on 75% of submitted ANDAs. The “first-action” goal date is referred to by the FDA as the date in which the FDA takes a first action on an application by either granting approval or tentative approval or in the event of deficiencies, identifying those deficiencies in a complete response letter or in a refusal to receive the application.
The Hatch-Waxman Act established the modern regulatory system for generic pharmaceutical products by creating a standardized approach for generic pharmaceutical makers to file ANDAs and receive FDA approval for generic pharmaceutical products. In order to gain FDA approval, there are various regulatory hurdles that a prospective generic manufacturer must clear:
Current Good Manufacturing Practices ("cGMP")
In order to obtain FDA approval for its products, a generic pharmaceutical manufacturer must demonstrate that its facilities comply with cGMP regulations. The manufacturer is required to comply with cGMP standards at all times during the production and processing of pharmaceuticals, and the FDA may inspect the manufacturer’s sites at any time to ensure compliance.
Safety and Efficacy
With respect to ANDA filings for generic pharmaceutical manufacturers, the FDA waives the requirement for certain clinical trials because the manufacturer of the brand pharmaceutical product has already performed these studies and established the safety and efficacy of the reference pharmaceutical product. However, an ANDA filer is still required to conduct bioequivalence studies to test the generic pharmaceutical product against the brand pharmaceutical product. For most orally administered pharmaceutical products, bioequivalence between brand and generic is established when there is no statistically significant difference in the rate and extent to which the API from the product is absorbed into the bloodstream. For certain pharmaceutical
9
products, such as topical, locally acting pharmaceutical products, other means of establishing bioequivalence may be required by the FDA. Additionally, an ANDA for a generic pharmaceutical product must contain other information, such as patent certifications and stability, chemistry, manufacturing and labeling data.
Patent Provisions
A branded pharmaceutical product is usually protected under patents granted by the U.S. Patent and Trademark Office that allow only the pharmaceutical company that developed the pharmaceutical product to market and sell such product. For a generic pharmaceutical manufacturer to introduce a generic version of a referenced branded pharmaceutical product, it must submit to the FDA an ANDA with a certification stating one of the following:
|
•
|
Paragraph I: That the required patent information relating to the patent for the referenced branded pharmaceutical product has not been filed;
|
|
•
|
Paragraph II: That the patent for the referenced branded pharmaceutical product has expired;
|
|
•
|
Paragraph III: That the patent for the referenced branded pharmaceutical product will expire on a particular date; or
|
|
•
|
Paragraph IV: That the patent for the referenced branded pharmaceutical product is invalid and/or will not be infringed by the pharmaceutical product for which approval is being sought
|
Filing an ANDA with certifications under Paragraph I or II, referenced above, permits the ANDA to be approved immediately, if it is otherwise eligible. Filing an ANDA with certifications under Paragraph III, referenced above, indicates that the ANDA may be approved on the expiration date of the referenced branded pharmaceutical product’s patent. Under Paragraph IV, referenced above, a generic pharmaceutical manufacturer can challenge the patent of the branded referenced pharmaceutical product.
If the ANDA for a generic pharmaceutical product has a Paragraph IV certification, the filer must also notify the NDA and patent holders upon acceptance of the ANDA filing by the FDA (the "PIV Notice"). The NDA and patent holders may initiate a patent infringement lawsuit in response, the filing of which automatically prevents the FDA from approving the ANDA until the earlier of (i) 30 months following receipt of the PIV Notice and/or (ii) a decision in the lawsuit that is favorable to the ANDA filer.
Generic Pharmaceutical Pricing
The pricing of a generic pharmaceutical product nearly always correlates to the number of companies manufacturing generic versions of such pharmaceutical product. A generic pharmaceutical product is usually at its highest price immediately after the first generic launch of the product, either because a single manufacturer has been granted 180-day exclusivity or because only a few manufacturers have entered the market due to other technical or operational obstacles to bringing such product to market, such as raw materials shortages or complex formulation. As additional generic manufacturers enter the market, the price of a generic pharmaceutical product typically falls as manufacturers compete on price to capture market share. Additionally, consolidation among wholesalers and retailers and the formation of GPOs has caused increased price competition in the generic pharmaceutical market.
Healthcare Reform
In the United States, there have recently been multiple federal and state proposals related to the pricing of pharmaceuticals and other changes to the healthcare system. It is currently unclear what, if any, legislative proposals may be adopted or how governmental bodies and private payors will respond to such healthcare reform. As such, we cannot predict the impact of potential legislation on our business and cannot guarantee that such legislation will not have a material adverse effect on our financial condition and results of operations.
Pharmaceutical Pedigree Laws
Various pharmaceutical pedigree laws, such as the Drug Supply Chain Security Act enacted in 2014, require the tracking of all transactions involving prescription pharmaceutical products from the manufacturer to the dispensary (e.g. pharmacy). Compliance with such laws requires extensive tracking systems and tight coordination with customers and manufacturers. While we believe that we currently fully comply with these laws and we intend to do so in the future, such legislation and government enforcement regarding these laws is constantly evolving. Failure to comply could result in fines, penalties or loss of business that could have a material adverse effect on our financial results.
10
Federal Regulation of Patent Litigation Settlements and Authorized Generic Arrangements
Pursuant to the Medicare Prescription Drug Improvement and Modernization Act of 2003, generic and brand pharmaceutical companies must file with the United States Department of Justice ("DOJ") and FTC certain agreements entered into between other brand and/or generic pharmaceutical companies in regards to the settlement of patent litigation and/or the manufacture and marketing of generic versions of branded pharmaceutical products. This requirement impacts the ways in which generic pharmaceutical companies resolve intellectual property litigation and may result in an increase in private-party litigation against pharmaceutical companies and/or additional investigations by the FTC or other governmental organizations.
Other Regulatory Requirements
We are subject to the Maximum Allowable Cost Regulations, which limit reimbursements for certain generic prescription drugs under Medicare, Medicaid, and other programs to the lowest price at which these drugs are generally available. In many instances, only generic prescription drugs fall within the regulations’ limits. Generally, the pricing and promotion of, method of reimbursement and fixing of reimbursement levels for, and the reporting to federal and state agencies relating to drug products is under active review by federal, state and local governmental entities, as well as by private third-party reimbursors and individuals under whistleblower statutes. At present, the DOJ and U.S. Attorneys Offices and State Attorneys General have initiated investigations, reviews, and litigation into industry-wide pharmaceutical pricing and promotional practices, and whistleblowers have filed qui tam suits. We cannot predict the results of those reviews, investigations, and litigation, or their impact on our business. For further detail, see
Note 18. Commitments and Contingencies
.
Virtually every state, as well as the District of Columbia, has enacted legislation permitting the substitution of equivalent generic prescription drugs for brand-name drugs where authorized or not prohibited by the prescribing physician, and some states mandate generic substitution in Medicaid programs.
In addition, numerous state and federal requirements exist for a variety of controlled substances, such as narcotics, that may be part of our product formulations. The DEA, which has authority similar to the FDA’s and may also pursue monetary penalties, and other federal and state regulatory agencies have far reaching authority.
The State of California requires that any manufacturer, wholesaler, retailer or other entity in California that sells, transfers, or otherwise furnishes certain so called precursor substances must have a permit issued by the California Department of Justice, Bureau of Narcotic Enforcement. The substances covered by this requirement include ephedrine, pseudoephedrine, norpseudoephedrine, and phenylpropanolamine, among others. The Bureau has authority to issue, suspend and revoke precursor permits, and a permit may be denied, revoked or suspended for various reasons, including (i) failure to maintain effective controls against diversion of precursors to unauthorized persons or entities; (ii) failure to comply with the Health and Safety Code provisions relating to precursor substances, or any regulations adopted thereunder; (iii) commission of any act which would demonstrate actual or potential unfitness to hold a permit in light of the public safety and welfare, which act is substantially related to the qualifications, functions or duties of the permit holder; or (iv) if any individual owner, manager, agent, representative or employee of the permit applicant/permit holder willfully violates any federal, state or local criminal statute, rule, or ordinance relating to the manufacture, maintenance, disposal, sale, transfer or furnishing of any precursor substances.
Environmental Laws
We are subject to comprehensive federal, state and local environmental laws and regulations that govern, among other things, air polluting emissions, waste water discharges, solid and hazardous waste disposal, and the remediation of contamination associated with current or past generation handling and disposal activities. We are subject periodically to environmental compliance reviews by various environmental regulatory agencies. While it is impossible to predict accurately the future costs associated with environmental compliance and potential remediation activities, compliance with environmental laws is not expected to require significant capital expenditures and has not had, and is not expected to have, a material adverse effect on our business, operations or financial condition.
Patents, Trademarks and Licenses
We own or license a number of patents in the U.S. and other countries covering certain products and product candidates and have also developed brand names and trademarks for other products and product candidates.
11
Generally, the brand pharmaceutical business relies upon patent protection to ensure market exclusivity for the life of the patent. We consider the overall protection of our patents, trademarks and license rights to be of material value and act to protect these rights from infringement. However, our business is not dependent upon any single patent, trademark or license.
In the branded pharmaceutical industry, the majority of an innovative product’s commercial value is usually realized during the period in which the product has market exclusivity. In the U.S. and some other countries, when market exclusivity expires and generic versions of a product are approved and marketed, there can often be very substantial and rapid declines in the branded product’s sales. The rate of this decline varies by country and by therapeutic category; however, following patent expiration, branded products often continue to have market viability based upon the goodwill of the product name, which typically benefits from trademark protection.
An innovator product’s market exclusivity is generally determined by two forms of intellectual property: patent rights held by the innovator company and any regulatory forms of exclusivity to which the innovator is entitled.
Patents are a key determinant of market exclusivity for most branded pharmaceuticals. Patents provide the innovator with the right to exclude others from practicing an invention related to the medicine. Patents may cover, among other things, the active ingredient(s), various uses of a drug product, pharmaceutical formulations, drug delivery mechanisms and processes for (or intermediates useful in) the manufacture of products. Protection for individual products extends for varying periods in accordance with the expiration dates of patents in the various countries. The protection afforded, which may also vary from country to country, depends upon the type of patent, its scope of coverage and the availability of meaningful legal remedies in the country.
Market exclusivity is also sometimes influenced by regulatory exclusivity rights. Many developed countries provide certain non-patent incentives for the development of medicines. For example, the U.S., the European Union and Japan each provide for a minimum period of time after the approval of a new drug during which the regulatory agency may not rely upon the innovator’s data to approve a competitor’s generic copy. Regulatory exclusivity rights are also available in certain markets as incentives for research on new indications, on orphan drugs and on medicines useful in treating pediatric patients. Regulatory exclusivity rights are independent of any patent rights and can be particularly important when a drug lacks broad patent protection. However, most regulatory forms of exclusivity do not prevent a competitor from gaining regulatory approval prior to the expiration of regulatory data exclusivity on the basis of the competitor’s own safety and efficacy data on its drug, even when that drug is identical to that marketed by the innovator.
We estimate the likely market exclusivity period for each of our branded products on a case-by-case basis. It is not possible to predict the length of market exclusivity for any of our branded products with certainty because of the complex interaction between patent and regulatory forms of exclusivity, and inherent uncertainties concerning patent litigation. There can be no assurance that a particular product will enjoy market exclusivity for the full period of time that we currently estimate or that the exclusivity will be limited to the estimate.
In addition to patents and regulatory forms of exclusivity, we also market products with trademarks. Trademarks have no effect on market exclusivity for a product, but are considered to have marketing value. Trademark protection continues in some countries as long as used; in other countries, as long as registered. Registration is for fixed terms and may be renewed indefinitely.
Seasonality
Consistent with the typical United States pharmaceutical industry trends, the first quarter of each year may be our lowest revenue quarter in the year. Certain products of our portfolio are also affected by seasonality. Sales of Adrenaclick® (epinephrine injection, USP auto-injector), Methylphenidate and Amphetamines tend to be higher in the third quarter of each year than in the other quarters. The seasonal impact of these particular products may affect a quarterly comparison within any fiscal year.
Employees
As of December 31, 2018, we have approximately 6,000 employees, of whom approximately 40% are located in the United States and approximately 60% are located outside of the United States, primarily in India.
Available Information
Our main corporate website address is
www.amneal.com
. Copies of our Quarterly Reports on Form 10-Q, Annual Reports on Form 10-K, Current Reports on Form 8-K, proxy statements and any amendments to such reports filed with or furnished to the U.S. Securities and Exchange Commission ("SEC"), are available free of charge on our website as soon as reasonably practicable
12
after having been filed with or furnished to the SEC. All SEC filings are also available at the SEC’s website at
www.sec.gov
. In addition, the written charters of our Audit Committee, Compensation Committee, Conflicts Committee, Integration Committee, and Nominating and Governance Committee of the Board of Directors and our Code of Business Conduct, Corporate Governance Guidelines and other corporate governance materials are available on our website. The information on our website is not, and will not be deemed, a part of this Report or incorporated into any other filings we make with the SEC.
Item 1A. Risk Factors
An investment in our common stock involves a high degree of risk. In deciding whether to invest in our common stock, you should consider carefully the following risk factors, as well as the other information included in this Annual Report on Form 10-K. The materialization of any of these risks could have a material adverse effect on our business, results of operations and financial condition.
Global economic conditions could harm us.
While global economic conditions have been fairly stable as a whole in recent years, continued concerns about the systemic impact of potential geopolitical issues and economic policy uncertainty, particularly in areas in which we operate, could potentially cause economic and market instability in the future and could adversely affect our business, including our financial performance.
Challenging economic conditions could result in tighter credit conditions. The cost and availability of credit may be adversely affected by illiquid credit markets and wider credit spreads, which could adversely affect the ability of our third-party distributors, partners, manufacturers and suppliers to buy inventory or raw materials and to perform their obligations under agreements with us, which could disrupt our operations and adversely affect our financial performance.
Global efforts to contain health care costs continue to exert pressure on product pricing and market access to pharmaceutical products. In many international markets, government-mandated pricing actions have reduced prices of patented drugs. And it is possible that the United States may adopt similar measures to reduce drug prices to consumers. Some countries may be subject to periods of financial instability, may have reduced resources to spend on healthcare or may be subject to economic sanctions, and our business in these countries may be disproportionately affected by these changes. In addition, the currencies of some countries may depreciate against the U.S. dollar substantially and if we are unable to offset the impact of such depreciation, our financial performance within such countries could be adversely affected.
We may be unable to integrate operations successfully and realize the anticipated synergies and other benefits of the Combination.
The business combination of Impax and Amneal involves the combination of two companies that operated as independent companies prior to the closing of the Combination. The integration of the businesses may be more time consuming and require more resources than initially estimated and we may fail to realize some or all of the anticipated benefits of the Combination if the integration process takes longer than expected, is more costly than expected or is unsuccessful in any other way. The integration process could also result in the diversion of management’s attention, the disruption or interruption of, or the loss of momentum in, the businesses of Impax and Amneal or inconsistencies in standards, control, procedures and policies, any of which could adversely affect the Company’s ability to maintain relationships with customers, partners and employees or its ability to achieve the anticipated benefits of the Combination, or could reduce the earnings or otherwise adversely affect our business and financial results.
13
If we are unable to successfully develop or commercialize new products, our operating results will suffer.
Developing and commercializing a new product is time consuming, costly and subject to numerous factors that may delay or prevent such development and commercialization. Our future results of operations will depend to a significant extent upon our ability to successfully commercialize new products in a timely manner. We face several challenges when developing and commercializing new products, including:
|
•
|
our ability to develop products in a timely and cost-efficient manner and in compliance with regulatory requirements, including delays associated with the FDA listing and approval process and our ability to obtain required regulatory approvals in a timely manner, or at all, and maintain such approvals if obtained;
|
|
•
|
the success of our clinical testing process to ensure that new products are safe and effective or bioequivalent to the reference listed drug;
|
|
•
|
the risk that any of our products presently under development, if and when fully developed and tested, will not perform as expected;
|
|
•
|
the risk that legal action may be brought against our generic drug products by our branded drug product competitors, including patent infringement claims among others;
|
|
•
|
the availability, on commercially reasonable terms, of raw materials, including APIs and other key ingredients necessary to the development of our drug products; and
|
|
•
|
Our ability to scale-up manufacturing methods to successfully manufacture commercial quantities of drug product in compliance with regulatory requirements.
|
As a result of these and other difficulties, our products currently in development may or may not receive necessary regulatory approvals on a timely basis or at all, which may result in unsuccessful development or commercialization of new products. If any of our products, when acquired or developed and approved, cannot be successfully or timely commercialized, our operating results could be adversely affected. We cannot guarantee that any investment we make in developing or marketing products will be recouped, even if we are successful in commercializing those products.
If we fail to obtain exclusive marketing rights for our products or fail to introduce our products on a timely basis, our revenues, gross margin and operating results may decline significantly.
The Hatch-Waxman amendments to the FDCA provide for a period of 180 days of generic marketing exclusivity for any applicant that is first to file an ANDA containing a certification of invalidity, non-infringement or unenforceability related to a patent listed with respect to the corresponding branded drug (commonly referred to as a "Paragraph IV certification"). "First filers" are often able to price the applicable generic drug to yield relatively high gross margins during this 180-day marketing exclusivity period.
With respect to our generic products, ANDAs containing Paragraph IV certifications generally become the subject of patent litigation that can be both lengthy and costly. There is no certainty that we will prevail in any such litigation, that we will be the first to file and thus granted the 180-day marketing exclusivity period, or, if we are granted the 180-day marketing exclusivity period, that we will not forfeit such period. Even where we are awarded marketing exclusivity, we may be required to share our exclusivity period with other first filers. In addition, branded drug product companies often authorize a generic version of the corresponding branded drug product to be sold during any period of marketing exclusivity that is awarded (described further below), which reduces gross margins during the marketing exclusivity period. Branded drug product companies may also reduce the price of their branded drug product to compete directly with generic drug products entering the market, which would similarly have the effect of reducing gross margins. Furthermore, timely commencement of the litigation by the patent owner imposes an automatic stay of ANDA approval by the FDA for 30 months, unless the case is decided in the ANDA applicant’s favor during that period. Finally, if the court decision is adverse to the ANDA applicant, the ANDA approval will be delayed until the challenged patent expires, and the applicant forfeits the 180-day marketing exclusivity.
14
Our future profitability depends, to a significant extent, upon our ability to introduce, on a timely basis, new generic drug products that are either the first-to-market (or among the first-to-market) or that otherwise can gain significant market share. The timeliness of our product introductions is dependent upon, among other things, the timing of regulatory approval of our products, which to a large extent is outside of our control, as well as the timing of the introduction of competing products. As additional distributors introduce comparable generic pharmaceutical products, price competition intensifies, market access narrows, and product sales prices and gross margins decline, often significantly and rapidly. Accordingly, our revenues and future profitability are dependent, in large part, upon our ability or the ability of our development partners to file ANDAs with the FDA in a timely and effective manner or, alternatively, to enter into contractual relationships with other parties that have obtained marketing exclusivity. No assurances can be given that we will be able to develop and introduce successful products in the future within the time constraints necessary to be successful. If we or our development partners are unable to continue to timely and effectively file ANDAs with the FDA or to partner with other parties that have obtained marketing exclusivity, our revenues, gross margin and operating results may decline significantly, and our prospects and business may be materially adversely affected.
With respect to our branded products, generic equivalents for branded pharmaceutical products are typically sold at lower prices than the branded products. The regulatory approval process in the United States and European Union exempts generic products from costly and time-consuming clinical trials to demonstrate their safety and efficacy and relies instead on the safety and efficacy of prior products. After the introduction of a competing generic product, a significant percentage of the prescriptions previously written for the branded product are often written for the generic version. In addition, legislation enacted in most U.S. states allows, or in some instances mandates, a pharmacist to dispense an available generic equivalent when filling a prescription for a branded product, in the absence of specific instructions from the prescribing physician. Pursuant to the provisions of the Hatch-Waxman Act, manufacturers of branded products often bring lawsuits to enforce their patent rights against generic products released prior to the expiration of branded products’ patents, but it is possible for generic manufacturers to offer generic products while such litigation is pending. As a result, branded products typically experience a significant loss in revenues following the introduction of a competing generic product, even if subject to an existing patent. Our branded pharmaceutical products are or may become subject to competition from generic equivalents because there is no proprietary protection for some of the branded pharmaceutical products we sell, because our patent protection expires or because our patent protection is not sufficiently broad or enforceable.
We face intense competition in the pharmaceutical industry from both brand and generic drug product companies, which could significantly limit our growth and materially adversely affect our financial results.
The pharmaceutical industry is highly competitive. The principal competitive factors in the pharmaceutical market include:
|
•
|
introduction of other generic drug manufacturers’ products in direct competition with our generic drug products;
|
|
•
|
introduction of authorized generic drug products in direct competition with our products, particularly during exclusivity periods;
|
|
•
|
the ability of generic drug product competitors to quickly enter the market after the expiration of patents or exclusivity periods, diminishing the amount and duration of significant profits;
|
|
•
|
consolidation among distribution outlets through mergers and acquisitions and the formation of buying groups;
|
|
•
|
the willingness of generic drug customers, including wholesale and retail customers, to switch among products of different pharmaceutical manufacturers;
|
|
•
|
pricing pressures by competitors and customers;
|
|
•
|
a company’s reputation as a manufacturer and distributor of quality products;
|
|
•
|
a company’s level of service (including maintaining sufficient inventory levels for timely deliveries);
|
|
•
|
product appearance and labeling; and
|
|
•
|
a company’s breadth of product offerings.
|
Many of our competitors have longer operating histories and greater financial, R&D, marketing and other resources than we do. Consequently, some of our competitors may be able to develop products and/or processes competitive with, or superior to, our products. Furthermore, we may not be able to (i) differentiate our products from those of our competitors, (ii) successfully develop or introduce new products, on a timely basis or at all, that are less costly than those of our competitors, or (iii) offer customers payment and other commercial terms as favorable as those offered by our competitors. The markets in which we compete and intend to compete are undergoing, and are expected to continue to undergo, rapid and significant change. We expect competition to intensify as technology advances and consolidation continues. New developments by other manufacturers and distributors could render our products uncompetitive or obsolete.
We believe our principal competitors in the U.S. generic pharmaceutical products market, where we primarily compete, are Teva Pharmaceutical Industries Ltd., Mylan N.V., Endo International plc, Sandoz International GmbH, Pfizer Inc., Fresenius Kabi KGAa, Sun Pharmaceutical Industries Ltd., Lupin Pharmaceuticals, Inc., Hikma Pharmaceuticals PLC and Aurobindo Pharma Limited.
15
These companies, among others, collectively compete with the majority of our products. We also face price competition generally as other generic manufacturers enter the market. Any such price competition may be especially pronounced where our competitors source their products from jurisdictions where production costs may be lower (sometimes significantly) than our production costs, especially lower-cost foreign jurisdictions. Any of these factors could result in reductions in our sales prices and gross margin. This price competition has led to an increase in demands for downward price adjustments by generic pharmaceutical distributors. Our principal strategy in addressing our competition is to offer customers a consistent supply of our generic drug products, as well as to pursue product opportunities with the potential for limited competition, such as high-barrier-to-entry first-to-file or first-to-market products. There can be no assurance, however, that this strategy will enable us to compete successfully in the generic drug product industry or that we will be able to develop and implement any new or additional viable strategies.
Competition in the generic drug industry has also increased due to the proliferation of authorized generic pharmaceutical products. Authorized generic drug products are generic drug products that are introduced by brand companies, either directly or through third parties, under the brand’s NDA approval for our own branded drug. Authorized generics do not face any regulatory barriers to introduction and are not prohibited from sale during the 180-day marketing exclusivity period granted to the first-to-file ANDA applicant. The sale of authorized generics adversely impacts the market share of a generic drug product that has been granted 180 days of marketing exclusivity. This is a significant source of competition for us, because an authorized generic drug product can materially decrease the profits that we could receive as an otherwise exclusive marketer of a generic drug product. Such actions have the effect of reducing the potential market share and profitability of our generic drug products and may inhibit us from developing and introducing generic pharmaceutical drug products corresponding to certain branded drugs.
If we are unable to manage our growth, our business will suffer.
We have experienced rapid growth in the past several years and anticipate continued rapid expansion in the future. This growth has required us to expand, upgrade, and improve our administrative, operational, and management systems, internal controls and resources. Although we cannot assure you that we will, in fact, grow as we expect, if we fail to manage growth effectively or to develop a successful marketing approach, our business and financial results will be materially harmed. We may also seek to expand our business through complementary or strategic acquisitions of other businesses, products or assets, or through joint ventures, strategic agreements or other arrangements. Any such acquisitions, joint ventures or other business combinations may involve significant integration challenges, operational complexities and time consumption and require substantial resources and effort. It may also disrupt our ongoing businesses, which may adversely affect our relationships with customers, employees, regulators and others with whom we have business or other dealings. Further, if we are unable to realize synergies or other benefits expected to result from any acquisitions, joint ventures or other business combinations, or to generate additional revenue to offset any unanticipated inability to realize these expected synergies or benefits, our growth and ability to compete may be impaired, which would require us to focus additional resources on the integration of operations rather than other profitable areas of our business, and may otherwise cause a material adverse effect on our business, results of operations and financial condition. Acquisitions may also have hidden costs, including unforeseen pre-acquisition liabilities or the impairment of customer relationships or certain acquired assets such as goodwill. We may also incur costs and inefficiencies to the extent an acquisition expands the industries, markets or geographies in which we operate due to our limited exposure to and experience in a given industry, market or region. Finally, acquisitions can also involve post-transaction disputes with the counterparty regarding a number of matters, including a purchase price or other working capital adjustment or liabilities for which we believe we were indemnified under the relevant transaction agreements.
As our competitors introduce their own generic equivalents of our generic drug products, our revenues and gross margin from such products generally decline, often rapidly.
Revenues and gross margin derived from generic pharmaceutical products often follow a pattern based on regulatory and competitive factors that we believe are unique to the generic pharmaceutical industry. As the patent(s) for a brand name product or the statutory marketing exclusivity period (if any) expires, the first generic manufacturer to receive regulatory approval for a generic equivalent of the product is often able to capture a substantial share of the market. However, as other generic manufacturers receive regulatory approvals for their own generic versions, that market share, and the price of that product, will typically decline depending on several factors, including the number of competitors, the price of the branded product and the pricing strategy of the new competitors. We cannot provide assurance that we will be able to continue to develop such products or that the number of our competitors for any given product will not increase to such an extent that we may stop marketing a generic drug product for which we previously obtained approval, which may have a material adverse impact on our revenues and gross margin.
16
The illegal distribution and sale by third parties of counterfeit versions of our products or of stolen products could have a negative impact on our reputation and a material adverse effect on our business, results of operations and financial condition.
Third parties could illegally distribute and sell counterfeit versions of our products, which do not meet the rigorous manufacturing and testing standards that our products undergo. Counterfeit products are frequently unsafe or ineffective and can be life-threatening. Counterfeit medicines may contain harmful substances, the wrong dose of the active pharmaceutical ingredient or no active pharmaceutical ingredients at all. However, to distributors and users, counterfeit products may be visually indistinguishable from the authentic version.
Reports of adverse reactions to counterfeit drugs or increased levels of counterfeiting could materially affect patient confidence in the authentic product. It is possible that adverse events caused by unsafe counterfeit products will mistakenly be attributed to the authentic product. In addition, thefts of inventory at warehouses, plants or while in-transit, which are not properly stored and which are sold through unauthorized channels could adversely impact patient safety, our reputation and our business.
Public loss of confidence in the integrity of pharmaceutical products as a result of counterfeiting or theft could have a material adverse effect on our business, results of operations and financial condition.
Our business is highly dependent on market perceptions of us and the safety and quality of our products. Our business, products or product pricing could be subject to negative publicity, which could have a material adverse effect on our business, results of operations and financial condition.
Market perceptions of our business are very important to us, especially market perceptions of the safety and quality of our products. If any of our products or similar products that other companies distribute are subject to market withdrawal or recall or are proven to be, or are claimed to be, harmful to consumers, then this could have a material adverse effect on our business, results of operations and financial condition. Also, because our business is dependent on market perceptions, negative publicity associated with product quality, illness or other adverse effects resulting from, or perceived to be resulting from, our products could have a material adverse impact on our business, results of operations and financial condition.
The generic pharmaceutical industry has also in recent years been the subject of significant publicity regarding the pricing of pharmaceutical products more generally, including publicity and pressure resulting from prices charged by competitors and peer companies for new products as well as price increases by competitors and peer companies on older products that the public has deemed excessive. Any downward pricing pressure on the price of certain of our products arising from social or political pressure to lower the cost of pharmaceutical products could have a material adverse impact on our business, results of operations and financial condition.
Accompanying the press and media coverage of pharmaceutical pricing practices and public complaints about the same, there has been increasing U.S. federal and state legislative and enforcement interest with respect to drug pricing. For instance, the DOJ issued subpoenas to pharmaceutical companies, including to the Company, seeking information about the sales, marketing and pricing of certain generic drugs. See
Note 18. Commitments and Contingencies
for additional information on the DOJ investigation. In addition to the effects of any investigations or claims brought against us, our business, results of operations and financial condition could also be adversely affected if any such inquiries, of us or of other pharmaceutical companies or the industry more generally, were to result in legislative or regulatory proposals that limit our ability to increase the prices of our products.
A substantial portion of our total revenues is expected to be derived from sales of a limited number of products.
We expect that we will continue to derive a substantial portion of our revenue from sales of a limited number of products. For the year ended
December 31, 2018
, our significant product families accounted for
29%
of our consolidated net revenue. The sale of our products may be significantly influenced by market conditions, as well as regulatory actions. We may experience decreases in the sale of our products in the future as a result of actions taken by our competitors, such as price reductions, or as a result of regulatory actions related to our products or to competing products, which could have a material impact on our results of operations. Actions which could be taken by our competitors, which may materially and adversely affect our business, results of operations and financial condition, may include, without limitation, pricing changes and entering or exiting the market for specific products.
Our growth is dependent on our ability to continue to successfully develop and commercialize new products in a timely manner.
Our financial results will depend upon our ability to introduce and commercialize additional generic and branded products in a timely manner. In the generic pharmaceutical products market, revenue from newly launched generic products is typically relatively high during the period immediately following launch and can be expected generally to decline over time. Revenue from generic
17
drugs in general, including prices of generic products that have generic alternatives on the market, can generally be expected to decline over time. Revenue from branded pharmaceutical products can be expected to decline as the result of entry of new competitors, particularly of companies producing generic versions of the branded products. Our growth is therefore dependent upon our ability to successfully introduce and commercialize new generic and branded products.
Our ability to develop or license, or otherwise acquire, and introduce new products on a timely basis in relation to our competitors’ product introductions involves inherent risks and uncertainties.
Product development is inherently risky, especially for new drugs for which safety and efficacy have not been established and the market is not yet proven. Likewise, product licensing involves inherent risks including uncertainties due to matters that may affect the achievement of milestones, as well as the possibility of contractual disagreements with regard to terms such as license scope or termination rights. The development and commercialization process, particularly with regard to new drugs, also requires substantial time, effort and financial resources. The process of obtaining FDA approval to manufacture and market new pharmaceutical products is rigorous, time consuming, costly and largely unpredictable. We, or a partner, may not be successful in obtaining FDA approval or in commercializing any of the products that we are developing or licensing.
Our approved products may not achieve expected levels of market acceptance.
Even if we are able to obtain regulatory approvals for our new products, the success of those products is dependent upon market acceptance. Levels of market acceptance for our new products could be affected by several factors, including:
|
•
|
the availability of alternative products from our competitors;
|
|
•
|
the prices of our products relative to those of our competitors;
|
|
•
|
the timing of our market entry;
|
|
•
|
the ability to market our products effectively at the retail level;
|
|
•
|
the perception of patients and the healthcare community, including third-party payers, regarding the safety, efficacy and benefits of our drug products compared to those of competing products; and
|
|
•
|
the acceptance of our products by government and private formularies.
|
Some of these factors will not be in our control, and our products may not achieve expected levels of market acceptance. Additionally, continuing and increasingly sophisticated studies of the proper utilization, safety and efficacy of pharmaceutical products are being conducted by the industry, government agencies and others which can call into question the utilization, safety and efficacy of products currently or previously marketed by us. In some cases, studies have resulted, and may in the future result, in the discontinuance of product marketing or other risk management programs such as the need for a patient registry.
We may discontinue the manufacture and distribution of certain existing products, which may adversely impact our business, results of operations and financial condition.
We continually evaluate the performance of our products and may determine that it is in our best interest to discontinue the manufacture and distribution of certain of our products. We cannot guarantee that we have correctly forecasted, or will correctly forecast in the future, the appropriate products to discontinue or that our decision to discontinue various products is prudent if market conditions change. In addition, we cannot assure you that the discontinuance of products will reduce our operating expenses or will not cause us to incur material charges associated with such a decision. Furthermore, the discontinuance of existing products entails various risks, including, in the event that we decide to sell the discontinued product, the risk that we will not be able to find a purchaser for such products or that the purchase price obtained will not be equal to at least the book value of the net assets for such products. Other risks include managing the expectations of, and maintaining good relations with, our customers who previously purchased products from our discontinued products, which could prevent us from selling other products to them in the future. Moreover, we may incur other significant liabilities and costs associated with our discontinuance of products, which could have a material adverse effect on our business, results of operations and financial condition.
18
Manufacturing or quality control problems may damage our reputation for quality production, demand costly remedial activities and negatively impact our business, results of operations and financial condition.
As a pharmaceutical company, we are subject to substantial regulation by various governmental authorities. For instance, we must comply with requirements of the FDA, DEA and other healthcare regulators with respect to the manufacture, labeling, sale, distribution, marketing, advertising, promotion and development of pharmaceutical products. We must register our facilities, whether located in the United States or elsewhere, with the FDA as well as regulators outside the United States, and our products must be made in a manner consistent with cGMP, or similar standards in each territory in which we manufacture. The failure of one of our facilities, or a facility of one of our third-party suppliers, to comply with applicable laws and regulations may lead to breach of representations made to our customers or to regulatory or government action against us related to products made in that facility.
In addition, the FDA, DEA and other agencies periodically inspect our manufacturing facilities. Following an inspection, an agency may issue a notice listing conditions that are believed to violate cGMP or other regulations, or a warning letter for violations of "regulatory significance" that may result in enforcement action if not promptly and adequately corrected. We remain committed to continuing to improve our quality control and manufacturing practices; however, we cannot be assured that the FDA will continue to be satisfied with our corrective actions and with our quality control and manufacturing systems and standards. Failure to comply strictly with these regulations and requirements may damage our reputation and lead to financial penalties, compliance expenditures, the recall or seizure of products, total or partial suspension of production and/or distribution, withdrawal or suspension of the applicable regulator’s review of our submissions, enforcement actions, injunctions and criminal prosecution. Further, other federal agencies, our customers and partners in our alliance, development, collaboration and other partnership agreements with respect to our products and services may take any such FDA observations or warning letters into account when considering the award of contracts or the continuation or extension of such partnership agreements. Because regulatory approval to manufacture a drug is site-specific, the delay and cost of remedial actions, or obtaining approval to manufacture at a different facility, could negatively impact our business. Any failure by us to comply with applicable laws and regulations and/or any actions by the FDA and other agencies as described above could have a material adverse effect on our business, financial position and results of operations.
We are involved in various legal proceedings and may be involved in future legal proceedings, all of which are uncertain, and existing and future proceedings may require us to incur substantial expense to defend and/or expose us to substantial liability.
The development, manufacture and sale of our drug products involves an inherent risk of product liability and other claims and the associated adverse publicity, and insurance against such potential claims is expensive and may be difficult to obtain. Litigation is inherently subject to uncertainties and we may be required to expend substantial amounts in the defense or resolution of this and similar matters. We regularly monitor the use of our products for trends or increases in reports of adverse events or product complaints, and regularly report such matters to the FDA. In some cases, an increase in adverse event reports may be an indication that there has been a change in a product’s specifications or efficacy. Such changes could lead to a recall of the product in question or, in some cases, increases in product liability claims related to the product in question. If the coverage limits for product liability and other insurance policies are not adequate, or if certain of our products are excluded from coverage, a claim brought against us, whether covered by insurance or not, could have a material adverse effect on our business, results of operations, financial condition and cash flows. We also rely on self-insurance to cover product liability and other claims, and these claims may exceed the amounts we have reserved under our self-insurance program.
In the ordinary course of our business, we may also be subject to a variety of other types of claims, proceedings, investigations and litigation initiated by government agencies or third parties. These matters may include compliance matters, product regulation or safety, taxes, employee benefit plans, employment discrimination, health and safety, environmental, antitrust, securities law, customs, import/export, government contract compliance, financial controls or reporting, intellectual property, allegations of misrepresentation, false claims or false statements, commercial claims, claims regarding promotion of our products and services, or other similar matters. In addition, government investigations related to the use of our generic drug products may cause reputational harm to us. Negative publicity, whether accurate or inaccurate, about the efficacy, safety or side effects of our generic drug products or product categories, whether involving us or a competitor, could materially reduce market acceptance of our products, cause consumers to seek alternatives to our products, result in product withdrawals and cause our stock price to decline. Negative publicity could also result in an increased number of product liability claims, whether or not these claims have a basis in scientific fact. Any such claims, proceedings, investigations or litigation, regardless of the merits, might result in substantial costs to defend or settle, restrictions on product use or sales, or otherwise injure our business.
19
We manufacture and derive a portion of our revenue from the sale of pharmaceutical products in the opioid class of drugs. The U.S. Department of Health and Human Services has declared the wide spread addiction to and abuse of such products a public health emergency, and in recent months, the federal government has also announced plans to increase federal oversight on opioid sale and consumption. These plans, along with changing public and clinical perceptions of opioid products and the risks relating to their use may result in the imposition of even stricter regulation of such products and further restrictions on their sale and use. For instance, the DEA has recently increased its scrutiny and regulation over the manufacture, distribution and sale of opioid products, which may require us to incur significant expenses to comply with such regulations. State governments have also taken steps to impose surcharges or taxes on opioid manufacturers or distributors. Any new or stricter regulations imposed by governmental authorities such as the DEA related to opioid products, as well as a potential increase in opioid-related litigation involving us, could result in material adverse effects on our business and results of operations. See
Note 18. Commitments and Contingencies - Prescription Opioid Litigation
for more information regarding opioid-related litigation involving the Company.
We are subject to United States federal and state laws related to healthcare fraud and abuse and health information privacy and security, and the failure to comply with such laws may adversely affect our business.
In the United States, many of our products are eligible for reimbursement under federal and state health care programs such as Medicaid, Medicare, TriCare, and/or state pharmaceutical assistance programs, and as a result, certain federal and state healthcare laws and regulations pertaining to fraud and abuse and patients’ rights are, and will be, applicable to our business. We could be subject to healthcare fraud and abuse and patient privacy regulation by both the federal government and the states in which we conduct our business. The laws that may affect our ability to operate include, but are not limited to: (i) the U.S. Anti-Kickback Statute, which applies to our marketing and research practices, educational programs, pricing policies and relationships with healthcare providers or other entities, by prohibiting, among other things, soliciting, receiving, offering or paying remuneration, directly or indirectly, as a means of inducing, or in exchange for, either the referral of an individual or the purchase or recommendation of an item or service reimbursable under a federal healthcare program, such as the Medicare and Medicaid programs; (ii) federal civil and criminal false claims laws and civil monetary penalty laws, which prohibit, among other things, individuals or entities from knowingly presenting, or causing to be presented, claims for payment from Medicare, Medicaid or other third-party payers that are false or fraudulent; (iii) the U.S. Health Insurance Portability and Accountability Act of 1996, ("HIPAA"), which among other things created new federal criminal statutes that prohibit executing a scheme to defraud any healthcare benefit program or making false statements relating to healthcare matters, and HIPAA, as amended by the Health Information Technology for Economic and Clinical Health Act of 2009, and our implementing regulations, which impose certain requirements relating to the privacy, security and transmission of individually identifiable health information and place restrictions on the use of such information for marketing communications; (iv) the U.S. Physician Payments Sunshine Act, which among other things, requires manufacturers of drugs, devices, biologics and medical supplies for which payment is available under a federal healthcare program to report annually information related to "payments or other transfers of value" made to physicians and teaching hospitals, and ownership and investment interests held by certain healthcare professionals and their immediate family members, and similar state laws; (v) the government pricing rules applicable to the Medicaid, Medicare Part B, 340B Drug Pricing Program, the U.S. Department of Veterans Affairs program, the TRICARE program, and state price reporting laws; and (vi) state and foreign law equivalents of each of the above U.S. laws, such as anti-kickback and false claims laws which may apply to items or services reimbursed by any third-party payer, including commercial insurers, and state and foreign laws governing the privacy and security of health information in certain circumstances, such as the requirements under the European Union General Data Protection Regulation which became effective in May 2018, many of which differ from each other in significant ways and often are not preempted by HIPAA, thus complicating compliance efforts. Violations of the fraud and abuse laws may result in severe penalties against us and/or our responsible employees, including jail sentences, large fines, and the exclusion of our products from reimbursement under federal and state programs. Defense of litigation claims and government investigations can be costly, time-consuming, and distract management, and it is possible that we could incur judgments or enter into settlements that would require us to change the way we operate our business. We are committed to conducting the sales and marketing of our products in compliance with the healthcare fraud and abuse laws, but certain applicable laws may impose liability even in the absence of specific intent to defraud. Furthermore, should there be ambiguity, a governmental authority may take a position contrary to a position we have taken, or should an employee violate these laws without our knowledge, a governmental authority may impose civil and/or criminal sanctions.
20
Any adverse outcome in these types of actions, or the imposition of penalties or sanctions for failing to comply with fraud and abuse laws, could adversely affect us and may have a material adverse effect on our business, results of operations, financial condition and cash flows. Some of the statutes and regulations that govern our activities, such as federal and state anti-kickback and false claims laws, are broad in scope, and while exemptions and safe harbors protecting certain common activities exist, they are often narrowly drawn. While we manage our business activities to comply with these statutory provisions, due to their breadth, complexity and, in certain cases, uncertainty of application, it is possible that our activities could be subject to challenge by various government agencies. In particular, the FDA, the DOJ and other agencies have increased their enforcement activities with respect to the sales, marketing, research and similar activities of pharmaceutical companies in recent years, and many pharmaceutical companies have been subject to government investigations related to these practices. A determination that we are in violation of these and/or other government regulations and legal requirements may result in civil damages and penalties, criminal fines and prosecution, administrative remedies, the recall of products, the total or partial suspension of manufacturing and/or distribution activities, seizure of products, injunctions, whistleblower lawsuits, failure to obtain approval of pending product applications, withdrawal of existing product approvals, exclusion from participation in government healthcare programs and other sanctions.
Any of these types of investigations or enforcement actions could affect our ability to commercially distribute our products and could materially and adversely affect our business, financial condition, results of operations and cash flows.
Approvals for our new generic drug products may be delayed or become more difficult to obtain if the FDA institutes changes to its approval requirements.
The FDA may institute changes to its ANDA approval requirements, such as implementing new or additional fees similar to the fees imposed by the GDUFA and its second iteration (GDUFA II), which may make it more difficult or expensive for us to obtain approval for our new generic products. The FDA may also implement other changes that may directly affect some of our ANDA filings pending approval from the FDA, such as changes to guidance from the FDA regarding bioequivalency requirements for particular drugs. Such changes may cause our development of such generic drugs to be significantly more difficult or result in delays in FDA approval or result in our decision to abandon or terminate certain projects. Any changes in FDA requirements may make it more difficult for us to file ANDAs or obtain approval of our ANDAs and generate revenues and thus have a material adverse effect on our business, results of operations and financial condition.
It is also possible that approvals for our products may become more difficult to obtain in the event of a prolonged government shutdown that impacts the operations of the FDA.
Federal regulation of arrangements between manufacturers of branded and generic products could adversely affect our business.
We are involved in numerous patent litigations in which we challenge the validity or enforceability of innovator companies' listed patents and/or their applicability to our generic pharmaceutical products, as well as patent infringement litigation in which generic companies challenge the validity or enforceability of our patents and/or their applicability to their generic pharmaceutical products, and therefore settling patent litigations has been and is likely to continue to be an important part of our business. As part of the Medicare Prescription Drug and Modernization Act of 2003, companies, including us, are required to file with the FTC and the DOJ agreements entered into between branded and generic pharmaceutical companies related to the manufacture, marketing and sale of generic versions of branded drugs for their review. The FTC has publicly stated that, in its view, some of the brand-generic settlement agreements violate the antitrust laws and has brought actions against some brand and generic companies that have entered into such agreements. In June 2013, the U.S. Supreme Court in its decision in
FTC v. Actavis
determined that "reverse payment" settlement agreements between brand and generic companies could violate antitrust laws. The Supreme Court held that such settlement agreements are neither immune from antitrust attack nor presumptively illegal but rather should be analyzed under the "Rule of Reason." It is currently uncertain the effect the Supreme Court’s decision will have on our existing settlement agreements or its impact on our ability to enter into such settlement agreements in the future or the terms thereof. The Supreme Court’s decision may result in heightened scrutiny from the FTC of such settlement agreements and we may become subject to increased FTC investigations or enforcement actions arising from such settlement agreements. Further, private plaintiffs, including direct and indirect purchasers of our products, may also become more active in bringing private litigation claims against us and other brand and generic pharmaceutical companies alleging that such settlement agreements violate antitrust laws. Accordingly, we have in the past received and may receive formal or informal requests from the FTC for information about a particular settlement agreement, and there is a risk that the FTC, or others, such as customers, may commence an action against us alleging violations of the antitrust laws. Such settlement agreements may further expose us to claims by purchasers of the products for unlawfully inhibiting competition. We have been involved in private antitrust actions involving certain settlement agreements as described in
Note 18. Commitments and Contingencies - Other Litigation Related to the Company's Business.
21
Antitrust investigation and claims are generally expensive and time consuming, and we can give no assurance as to the timing or outcome of such investigations or claims or of any future private litigation or government action alleging that one of our settlement agreements violates antitrust laws. The impact of federal regulation of arrangements between manufacturers of brand and generic products, further legislation and the potential for private-party lawsuits associated with such arrangements could adversely affect our business.
Healthcare reform and a reduction in the coverage and reimbursement levels by governmental authorities, HMOs, MCOs or other third-party payers may adversely affect our business.
As part of commercializing our products, we have obtained authorization to receive reimbursement at varying levels for the cost of certain products and related treatments from governmental authorities and private health insurers and other organizations, such as health maintenance organizations ("HMOs") and managed care organizations ("MCOs"). The trend toward managed healthcare in the United States, the growth of organizations such as HMOs and MCOs, and legislative proposals to reform healthcare and government insurance programs could significantly influence the purchase of pharmaceutical products, resulting in lower prices and a reduction in product demand. The Patient Protection and Affordable Care Act and the Health Care and Education Reconciliation Act of 2010 were signed into law on March 23, 2010 and March 30, 2010, respectively. These laws are referred to herein as "healthcare reform." A number of provisions of the healthcare reform laws continue to have a negative impact on the price of our products sold to U.S. government entities. For example, the legislation includes measures that (i) significantly increase Medicaid rebates through both the expansion of the program; (ii) substantially expand the Public Health System (340B) program to allow other entities to purchase prescription drugs at substantial discounts; (iii) extend the Medicaid rebate rate to a significant portion of Managed Medicaid enrollees; (iv) apply a 75% discount to Medicare Part D beneficiary spending in the coverage gap for branded and authorized generic prescription drugs; and (v) levy a significant excise tax on the industry to fund healthcare reform. Such cost containment measures and healthcare reform affect our ability to sell our products and have a material adverse effect on our business, results of operations and financial condition. Additionally, the Medicare Part D Prescription Drug Benefit established a voluntary outpatient prescription drug benefit for Medicare beneficiaries (primarily the elderly over 65 and the disabled). These beneficiaries may enroll in private drug plans. There are multiple types of Part D plans and numerous plan sponsors, each with its own formulary and product access requirements. The plans have considerable discretion in establishing formularies and tiered co-pay structures and in placing prior authorization and other restrictions on the utilization of specific products. In addition, Part D plan sponsors are permitted and encouraged to negotiate rebates with manufacturers. The Medicare Part D program, which went into effect January 1, 2006, is administered by the Centers for Medicare & Medicaid Services ("CMS") within the Department of Health and Human Services.
22
The CMS has issued extensive regulations and other sub-regulatory guidance documents implementing the Medicare Part D benefit, and the OIG has issued regulations and other guidance in connection with the Medicare Part D program. The federal government can be expected to continue to issue guidance and regulations regarding the obligations of Part D sponsors and their subcontractors. Participating drug plans may establish drug formularies that exclude coverage of specific drugs and payment levels for drugs negotiated with Part D drug plans may be lower than reimbursement levels available through private health plans or other payers. Moreover, beneficiary co-insurance requirements could influence which products are recommended by physicians and selected by patients. There is no guarantee that any drug that we market will be offered by drug plans participating under the Medicare Part D program or of the terms of any such coverage, or that covered drugs will be reimbursed at amounts that reflect current or historical levels. Additionally, any reimbursement granted may not be maintained, or limits on reimbursement available from third-party payers may reduce the demand for, or negatively affect the price of those products, which could significantly harm our business, results of operations, financial condition and cash flows. We may also be subject to lawsuits relating to reimbursement programs that could be costly to defend, divert management’s attention and adversely affect our operating results. Most state Medicaid programs have established preferred drug lists, and the process, criteria and timeframe for obtaining placement on the preferred drug list varies from state to state. Under the Medicaid drug rebate program, a manufacturer must pay a rebate for Medicaid utilization of a product. The rebate for single source products (including authorized generics) is based on the greater of (i) a specified percentage of the product’s average manufacturer price or (ii) the difference between the product’s average manufacturer price and the best price offered by the manufacturer. The rebate for multiple source products is a specified percentage of the product’s average manufacturer price. In addition, many states have established supplemental rebate programs as a condition for including a drug product on a preferred drug list. The profitability of our products may depend on the extent to which they appear on the preferred drug lists of a significant number of state Medicaid programs and the amount of the rebates that must be paid to such states. In addition, there is significant fiscal pressure on the Medicaid program, and amendments to lower the pharmaceutical costs of the program are possible. Such amendments could materially adversely affect our anticipated revenues and results of operations. Due to the uncertainties regarding the outcome of future healthcare reform initiatives and their enactment and implementation, we cannot predict which, if any, of the future reform proposals will be adopted or the effect such adoption may have on our business. Future rulemaking and reform, including repeal of existing law, with respect to the healthcare and pharmaceutical industries, could increase rebates, reduce prices or the rate of price increases for healthcare products and services, or require additional reporting and disclosure. We cannot predict the timing or impact of any future rulemaking, reform or repeal of healthcare laws.
The majority of our products are produced at a few locations and a business interruption at one or more of these locations or within our supply chain could have a material adverse effect on our business, financial position and results of operations.
We produce the majority of the products that we manufacture at our manufacturing facilities in New York, New Jersey and India, as well as at certain third-party suppliers. Disruptions at these facilities or within our supply chain can occur for many reasons, including events unrelated to us or beyond our control, such as fires and other industrial accidents, floods and other severe weather events, natural disasters, environmental incidents or other catastrophes, utility and transportation infrastructure disruptions, shortages of raw materials, and acts of war or terrorism. Work stoppages, whether union-organized or not, can also disrupt operations. Business interruption could also be caused by compliance failures. A significant disruption at any of these facilities or otherwise within our supply chain, even on a short-term basis, could impair our ability to produce and ship products to the market on a timely basis or at all, which could have a material adverse effect on our business, financial position and results of operations.
Our profitability depends on our major customers. If these relationships do not continue as expected, our business, condition (financial and otherwise), prospects and results of operations could materially suffer.
We currently have over 200 customers, some of which are part of large purchasing groups. Our three largest customers, AmerisourceBergen Corporation, Cardinal Health, Inc. and McKesson Drug Co., accounted for approximately
83%
,
79%
and
78%
of total gross sales of products for the years ended
December 31, 2018
,
2017
and
2016
, respectively. The loss of any one or more of these or any other major customer or the substantial reduction in orders from any one or more of our major customers could have a material impact on our future operating results and financial condition.
23
We may experience declines in the sales volume and prices of our products as a result of the continuing trend of consolidation of certain customer groups, which could have a material adverse effect on our business, financial position and results of operations.
Our ability to successfully commercialize any generic or branded pharmaceutical product depends in large part upon the acceptance of the product by third parties, including pharmacies, government formularies, other retailers, physicians and patients. Therefore, our success will depend in large part on market acceptance of our products. We make a significant amount of our sales to a relatively small number of drug wholesalers and retail drug chains. These customers represent an essential part of the distribution chain of our pharmaceutical products. Drug wholesalers and retail drug chains have undergone, and are continuing to undergo, significant consolidation. This consolidation may result in these groups gaining additional purchasing leverage and, consequently, increasing the product pricing pressures facing our business. Additionally, the emergence of large buying groups representing independent retail pharmacies and other drug distributors, and the prevalence and influence of managed care organizations and similar institutions, potentially enable such groups to demand larger price discounts on our products. For example, there has been a recent trend of large wholesalers and retailer customers forming partnerships, such as the alliance between Walgreens and AmerisourceBergen Corporation, the alliance between Rite Aid and McKesson Drug Company, and the alliance between CVS Caremark and Cardinal Health. The result of these developments may have a material adverse effect on our business, financial position and results of operations.
From time to time we may need to rely on licenses to proprietary technologies, which may be difficult or expensive to obtain.
We may need to obtain licenses to patents and other proprietary rights held by third parties to develop, manufacture and market products. If we are unable to timely obtain these licenses on commercially reasonable terms, our ability to commercially market our products may be inhibited or prevented, which could have a material adverse effect on our business, results of operations and financial condition.
We depend to a large extent on third-party suppliers and distributors for the raw materials for our products, particularly the chemical compounds comprising the APIs that we use to manufacture our products, as well as for certain finished goods. A prolonged interruption in the supply of such products could have a material adverse effect on our business, financial position and results of operations.
The bulk of the raw materials essential to our manufacturing business are purchased from third parties. If we experience supply interruptions or delays, or if a supplier discontinues the sale of certain products, we may have to obtain substitute materials or products, which in turn would require us to obtain amended or additional regulatory approvals, subjecting us to additional expenditures of significant time and resources. In addition, changes in our raw material suppliers could result in significant delays in production, higher raw material costs and loss of sales and customers, because regulatory authorities must generally approve raw material sources for pharmaceutical products, which may be time consuming. Any significant supply interruption could have a material adverse effect on our business, condition (financial and otherwise), prospects and results of operations. To date, we have experienced no significant difficulties in obtaining raw materials. However, because the federal drug application process requires specification of raw material suppliers, if raw materials from a specified supplier were to become unavailable, FDA approval of a new supplier would be required. The amount of time required for the FDA to qualify a new supplier and confirm that our manufacturing processes meet the necessary standards could cause delays in the manufacturing and marketing of one or more of our products and could, depending on the particular product, have a material adverse effect on our results of operations and financial condition.
The time necessary to develop generic and branded drugs may adversely affect whether, and the extent to which, we receive a return on our capital.
We generally begin our development activities for a new generic drug product several years in advance of the patent expiration date of the brand-name drug equivalent. The development process, including drug formulation, testing, and FDA review and approval, often takes three or more years. This process requires that we expend considerable capital to pursue activities that do not yield an immediate or near-term return. Also, because of the significant time necessary to develop a product, the actual market for a product at the time it is available for sale may be significantly less than the originally projected market for the product. If this were to occur, our potential return on our investment in developing the product, if approved for marketing by the FDA, would be adversely affected and we may never receive a return on our investment in the product. It is also possible for the manufacturer of the brand-name product for which we are developing a generic drug to obtain approvals from the FDA to switch the brand-name drug from the prescription market to the OTC market. If this were to occur, we would be prohibited from marketing our product other than as an OTC drug, in which case revenues could be substantially less than we anticipated.
24
Developing and commercializing branded pharmaceutical products is generally more costly than developing and commercializing generic products. In order to grow and achieve success in our branded product business, we must continually identify, develop, acquire and license new products that we can ultimately market. There are many difficulties and uncertainties inherent in pharmaceutical research and development, and there is a high rate of failure inherent in new drug discovery and development. Failure can occur at any point in the process, including late in the process after substantial investment. New product candidates that appear promising in development may fail to reach the market or may have only limited commercial success because of efficacy or safety concerns, inability to obtain necessary regulatory approvals and payer reimbursement, limited scope of approved uses, difficulty or excessive costs to manufacture, or infringement of the patents or intellectual property rights of others. Products that do reach the market may ultimately be subject to recalls or other suspensions in sales. Delays and uncertainties in the FDA approval process and the approval processes in other countries can result in delays in product launches and lost market opportunity. Because there is a high rate of failure inherent in the research and development process of new products, there is a significant risk that funds invested in research and development will not generate financial returns. We cannot be certain when or whether any of our products currently under development will be approved or launched or whether, once launched, such products will be commercially successful. We may be required to spend several years and incur substantial expense in completing certain clinical trials. The length of time, number of trial sites and patients required for clinical trials vary substantially, and we may have difficulty finding a sufficient number of sites and subjects to participate in our trials. Delays in planned clinical trials can result in increased development costs, delays in regulatory approvals and delays in product candidates reaching the market. We rely on independent third-party clinical investigators to recruit subjects and conduct clinical trials in accordance with applicable study protocols and laws and regulations. If regulatory authorities determine that we have not complied with regulations in the development of a product candidate, they may refuse to accept trial data from the site and/or not approve the product candidate, and we would not be able to market and sell that product. If we are not able to market and sell our products after significant expenditures to develop and test them, our business and results of operations could be materially and adversely affected.
The testing required for the regulatory approval of our products is conducted primarily by independent third parties. Any failure by any of these third parties to perform this testing properly and in a timely manner may have an adverse effect upon our ability to obtain regulatory approvals.
Our applications for regulatory approval of our products, including both internally developed and in-licensed products, incorporate the results of testing and other information that is conducted or gathered primarily by independent third parties (including, for example, manufacturers of raw materials, testing laboratories, contract research organizations or independent research facilities). Our ability to obtain and maintain regulatory approval of the products being tested is dependent upon the quality of the work performed by these third parties, the quality of the third parties’ facilities, and the accuracy of the information provided by third parties. We have little or no control over any of these factors. If this testing is not performed properly, our ability to obtain or maintain regulatory approvals, and to launch or continue selling products, could be restricted or delayed.
We depend on third-party agreements for a portion of our product offerings and any failure to maintain these arrangements or enter into similar arrangements with new partners could result in a material adverse effect.
We have broadened our product offering by entering into a variety of third-party agreements covering any combination of joint development, supply, marketing and/or distribution of products. We cannot provide assurance that the development, supply, marketing and/or distribution efforts of our contractual partners will continue to be successful, that we will be able to renew such agreements or that we will be able to enter into new agreements for additional products. Any alteration to, or termination of, our current distribution and marketing agreements, failure to enter into new and similar agreements, or interruption of our product supply under the such agreements, could have a material adverse effect on our business, condition (financial and otherwise), prospects or results of operations.
25
We may make acquisitions of, or investments in, complementary businesses or products, which may be on terms that may not turn out to be commercially advantageous, may require additional debt or equity financing, which could increase our leverage and dilute equity holders.
We regularly review the potential acquisition of technologies, products, product rights and complementary businesses and are currently evaluating, and intend to continue to evaluate, potential product and/or company acquisitions and other business development opportunities. We may choose to enter into such transactions at any time. Nonetheless, we cannot provide assurance that we will be able to identify suitable acquisition or investment candidates. To the extent that we do identify candidates that we believe to be suitable, we cannot provide assurance that we will be able to reach an agreement with the selling party or parties, that the terms we may agree to will be commercially advantageous to us, or that we will be able to successfully consummate such investments or acquisitions even after definitive documents have been signed. If we make any acquisitions or investments, we may finance such acquisitions or investments through our cash reserves, debt financing, which may increase our leverage, or by issuing additional equity interests, which could dilute the holdings of our then-existing owners. If we require financing, we cannot provide assurance that we will be able to obtain required financing when needed on acceptable terms or at all.
Our operations in, and potential expansion into additional, international markets subjects us to increased regulatory oversight both in those international markets and domestically and regulatory, economic, social and political uncertainties, which could cause a material adverse effect on our business, financial position and results of operations.
We are subject to certain risks associated with having assets and operations located in foreign jurisdictions, including our operations in India, Germany and the United Kingdom. We may also in the future expand our international business and operations into jurisdictions in which we have limited operating experience, including with respect to seeking regulatory approvals, marketing or selling products.
Our operations in these jurisdictions may be adversely affected by general economic conditions and economic and fiscal policy, including changes in exchange rates and controls, interest rates and taxation policies, increased government regulation, and, with respect to India, any reversal of India’s recent economic liberalization and deregulation policies, as well as social stability and political, economic or diplomatic developments in the future. Certain jurisdictions have, from time to time, experienced instances of civil unrest and hostilities, both internally and with neighboring countries. Rioting, military activity, terrorist attacks, or armed hostilities could cause our operations in such jurisdictions to be adversely affected or suspended. We generally do not have insurance for losses and interruptions caused by terrorist attacks, military conflicts and wars. In addition, anti-bribery and anti-corruption laws may conflict with some local customs and practices in foreign jurisdictions. Our international operations may subject us to heightened scrutiny under the Foreign Corrupt Practices Act ("FCPA"), the UK Bribery Act and similar anti-bribery laws, and could subject us to liability under such laws despite our best efforts to comply with such laws. As a result of our policy to comply with the FCPA, the UK Bribery Act and similar anti-bribery laws, we may be at a competitive disadvantage to competitors that are not subject to, or do not comply with, such laws. Further, notwithstanding our compliance programs, there can be no assurances that our policies will prevent our employees or agents from violating these laws or protect us from any such violations. Additionally, we cannot predict the nature, scope or impact of any future regulatory requirements that may apply to our international operations or how foreign governments will interpret existing or new laws. Alleged, perceived or actual violations of any such existing or future laws by us or due to the acts of others, may result in criminal or civil sanctions, including contract cancellations or debarment, and damage to our reputation, any of which could have a material adverse effect on our business.
We have increased exposure to tax liabilities, including foreign tax liabilities.
As a U.S. company with subsidiaries in, among other countries, India, Germany, Switzerland and England, we are subject to, or potentially subject to, income taxes as well as non-income based taxes in these jurisdictions as well as the United States. Significant judgment is required in determining our worldwide provision for income taxes and other tax liabilities. Changes in tax laws or tax rulings may have a significantly adverse impact on our effective tax rate. In addition, we have potential tax exposures resulting from the varying application of statutes, regulations and interpretations, which include exposures on intercompany terms of cross-border arrangements among foreign subsidiaries in relation to various aspects of our business, including research and development activities and manufacturing. Tax authorities in various jurisdictions may disagree with, and subsequently challenge, the amount of profits taxed in such jurisdictions; such challenges may result in increased tax liability, including accrued interest and penalties, which would cause our tax expense to increase and which may have a material adverse effect on our business, financial position and results of operations and our ability to satisfy our debt obligations.
26
Our Tax Receivable Agreement with APHC Holdings, LLC (formerly known as Amneal Holdings LLC) dated May 4, 2018 (the "Tax Receivable Agreement") requires us to make cash payments to them in respect of certain tax benefits to which we may become entitled, and we expect that the payments we will be required to make will be substantial.
We are a party to the Tax Receivable Agreement with APHC Holdings, LLC (formerly known as Amneal Holdings LLC), which we refer to as "Holdings." Under the Tax Receivable Agreement, we will be required to make cash payments to Holdings and its permitted transferees equal to 85% of certain tax benefits, if any, that we actually realize, or in certain circumstances are deemed to realize, as a result of redemptions or exchanges of Amneal common units by Holdings and its permitted transferees as set forth in the agreement. We expect that the amount of the cash payments that we will be required to make under the Tax Receivable Agreement will be significant. Any payments made by us to Holdings or its permitted transferees under the Tax Receivable Agreement will generally reduce the amount of overall cash flow that might have otherwise been available to us.
The actual amount and timing of any payments under the Tax Receivable Agreement will vary depending upon a number of factors, including the timing of redemptions or exchanges by the holders of Amneal common units, the amount of gain recognized by such holders, the amount and timing of the taxable income we generate in the future, and the federal tax rates then applicable.
In certain cases, payments under the Tax Receivable Agreement to Holdings or its permitted transferees may be accelerated or significantly exceed the actual benefits we realize in respect of the tax attributes subject to the Tax Receivable Agreement.
The Tax Receivable Agreement provides that upon certain mergers, asset sales, other forms of business combinations or other changes of control or if, at any time, we elect an early termination of the Tax Receivable Agreement, then our obligations under the Tax Receivable Agreement to make payments would be based on certain assumptions, including an assumption that we would have sufficient taxable income to fully utilize all potential future tax benefits that are subject to the Tax Receivable Agreement.
As a result of the foregoing, we could be required to make payments under the Tax Receivable Agreement that (i) are greater than the actual benefits we ultimately realize in respect of the tax benefits that are subject to the Tax Receivable Agreement and (ii) are based on the present value of the anticipated future tax benefits that are the subject of the Tax Receivable Agreement, which payment may be required to be made significantly in advance of the actual realization, if any, of such future tax benefits. In these situations, our obligations under the Tax Receivable Agreement could have a substantial negative impact on our liquidity and could have the effect of delaying or preventing certain mergers, asset sales, other forms of business combinations or other changes of control. There can be no assurance that we will be able to fund or finance our obligations under the Tax Receivable Agreement.
We will not be reimbursed for any payments made to Holdings or its permitted transferees under the Tax Receivable Agreement in the event that any tax benefits are disallowed.
Payments under the Tax Receivable Agreement will be based on the tax reporting positions that we determine, and the Internal Revenue Service (the "IRS") or another tax authority may challenge all or part of the tax benefits we claim, as well as other related tax positions we take, and a court could sustain such challenge. If the outcome of any such challenge would reasonably be expected to materially adversely affect a recipient’s rights or obligations (including the amount or timing of payments) under the Tax Receivable Agreement, then we will not be permitted to settle or fail to contest such challenge without the consent of Holdings. We will not be reimbursed for any cash payments previously made to Holdings or its permitted transferees under the Tax Receivable Agreement in the event that any tax benefits initially claimed by us and for which payment has been made to Holdings or its permitted transferees are subsequently challenged by a taxing authority and are ultimately disallowed. Instead, any excess cash payments made by us to Holdings or its permitted transferees will be netted against any future cash payments that we might otherwise be required to make to Holdings or its permitted transferees under the terms of the Tax Receivable Agreement. However, we might not determine that we have effectively made an excess cash payment to Holdings or its permitted transferees for a number of years following the initial time of such payment. As a result, payments could be made under the Tax Receivable Agreement in excess of the tax savings that we ultimately realize in respect of the tax attributes with respect to Holdings or its permitted transferees.
27
Our competitors or other third parties may allege that we are infringing upon their intellectual property, forcing us to expend substantial resources in litigation, the outcome of which is uncertain. Any unfavorable outcome of such litigation, including losses related to "at-risk" product launches, could have a material adverse effect on our business, financial position and results of operations.
Companies that produce branded pharmaceutical products routinely bring litigation against ANDA or similar applicants that seek regulatory approval to manufacture and market generic forms of their branded products alleging patent infringement or other violations of intellectual property rights. Patent holders may also bring patent infringement suits against companies that are currently marketing and selling approved generic products. Litigation often involves significant expense and can delay or prevent introduction or sale of our generic products. If valid and enforceable patents are infringed by our products, we would need to delay selling the infringing generic product unless we could obtain a license from the patent holder, and, if we were already selling the infringing product, cease selling and potentially destroy existing product stock.
There may be situations in which we may make business and legal judgments to market and sell products that are subject to claims of alleged patent infringement prior to final resolution of those claims by the courts, based upon our belief that such patents are invalid, unenforceable, or are not infringed by our marketing and sale of such products. This is referred to in the pharmaceutical industry as an "at-risk" launch. The risk involved in an at-risk launch can be substantial because, if a patent holder ultimately prevails against us, the remedies available to such holder may include, among other things, damages measured by the profits lost by the patent holder or treble damages, which can be significantly higher than the profits we make from selling the generic version of the product. We could be liable for substantial damages from adverse court decisions in such matters. We may also be harmed by the loss of any value of such inventory that we are unable to market or sell.
28
The use of legal, regulatory and legislative strategies by brand competitors, including authorized generics and citizen’s petitions, as well as the potential impact of proposed legislation, may have an adverse effect on our business.
Brand drug companies often pursue strategies that may serve to prevent or delay competition from our generic alternatives to their branded products. These strategies include, but are not limited to:
|
•
|
marketing an authorized generic version of a branded product at the same time that we introduce a generic equivalent of that product, directly or through agreement with a generic competitor;
|
|
•
|
filing "citizen’s petitions" with the FDA to thwart generic competition by causing delays of our product approvals;
|
|
•
|
using risk evaluation and mitigation strategies ("REMS"), related distribution restrictions or other means of limiting access to their branded products, to prevent us from obtaining product samples needed to conduct bioequivalence testing required for ANDA approval, thereby delaying or preventing us from obtaining FDA approval of a generic version of such branded products;
|
|
•
|
seeking to secure patent protection of certain "Elements to Assure Safe Use" of a REMS program, which are required medical interventions or other actions healthcare professionals need to execute prior to prescribing or dispensing the drug to the patient, in an attempt to thwart our ability to avoid infringement of the patents in question or secure approval;
|
|
•
|
seeking to establish regulatory and legal obstacles that would make it more difficult for us to demonstrate a generic product’s bioequivalence or "sameness" to the related branded product;
|
|
•
|
initiating legislative and administrative efforts in various states to limit the substitution of generic versions of branded pharmaceutical products for the corresponding branded products;
|
|
•
|
filing suits for patent infringement that automatically delay FDA approval of our generic products;
|
|
•
|
introducing "next-generation" products prior to the expiration of market exclusivity for their branded product, which often materially reduces the demand for the generic product for which we may be seeking FDA approval;
|
|
•
|
obtaining extensions of market exclusivity by conducting clinical trials of branded drugs in pediatric populations or by other methods as discussed below;
|
|
•
|
persuading the FDA to withdraw the approval of branded drugs for which the associated patents are about to expire, thus allowing the brand company to develop and launch new patented products serving as substitutes for the withdrawn products;
|
|
•
|
seeking to obtain new patents on drugs for which patent protection is about to expire;
|
|
•
|
filing patent applications that are more complex and costly to challenge;
|
|
•
|
seeking temporary restraining orders and injunctions against selling a generic equivalent of their branded product based on alleged misappropriation of trade secrets or breach of confidentiality obligations;
|
|
•
|
seeking temporary restraining orders and injunctions against us after we have received final FDA approval for a product for which we are attempting to launch at-risk prior to resolution of related patent litigation;
|
|
•
|
reducing the marketing of the branded product to healthcare providers, thereby reducing the branded drug’s commercial exposure and market size, which in turn adversely affects the market potential of the equivalent generic product; and
|
|
•
|
converting branded prescription drugs that are facing potential generic competition to over-the-counter products, thereby significantly impeding the growth of the generic prescription market for such drugs.
|
These and other strategies by brand competitors, as well as the potential impact of proposed legislation, may increase our costs associated with the introduction or marketing of our generic products, delay or prevent such introduction and/or significantly reduce the profit potential of our products.
29
We expend a significant amount of resources on research and development, including milestones on in-licensed products, which may not lead to successful product introductions.
Much of our development effort is focused on technically difficult-to-formulate products and/or products that require advanced manufacturing technology. We expend significant resources on research and development primarily to enable us to manufacture and market FDA-approved pharmaceuticals in accordance with FDA regulations. We have entered into, and may in the future enter into, agreements that require us to make significant milestone payments upon achievement of various research and development events and regulatory approvals. As we continue to develop and in-license new products, we will likely incur increased research and licensing expenses. Because of the inherent risk associated with research and development efforts in the industry, particularly with respect to new drugs, our research and development expenditures may not result in the successful introduction of FDA-approved pharmaceutical products. Additionally, after we or our development partners submit an ANDA, the FDA may request that additional studies be conducted. As a result, we may be unable to reasonably determine the total research and development costs required to develop a particular product. Finally, we cannot be certain that any investment made in developing products will be recovered, even if we are successful in commercialization. To the extent that we expend significant resources on research and development efforts and are not ultimately able to successfully introduce new products as a result of those efforts, our business, financial position and results of operations may be materially adversely affected.
The risks and uncertainties inherent in conducting clinical trials could delay or prevent the development and commercialization of our own branded products, which could have a material adverse effect on our business, results of operations and financial condition.
With respect to our branded products which do not qualify for the FDA’s abbreviated application procedures, we must demonstrate through clinical trials that these products are safe and effective for use. We have only limited experience in conducting and supervising clinical trials. The process of completing clinical trials and preparing a NDA may take several years and requires substantial resources. Our studies and filings may not result in FDA approval to market our new drug products and, if the FDA grants approval, we cannot predict the timing of any approval. There are substantial filing fees for NDAs that are not refundable if FDA approval is not obtained.
There are a number of risks and uncertainties associated with clinical trials. The results of clinical trials may not be indicative of results that would be obtained from large scale testing. Clinical trials are often conducted with patients having advanced stages of disease and, as a result, during the course of treatment these patients can die or suffer adverse medical effects for reasons that may not be related to the pharmaceutical agents being tested, but which nevertheless affect the clinical trial results. In addition, side effects experienced by the patients may cause delay of approval or limit the profile of an approved product. Moreover, our clinical trials may not demonstrate sufficient safety and efficacy to obtain approval from the FDA or foreign regulatory authorities. The FDA or foreign regulatory authorities may not agree with our assessment of the clinical data or they may interpret it differently. Such regulatory authorities may require additional or expanded clinical trials. Even if the FDA or foreign regulatory authorities approve certain products developed by us, there is no assurance that such regulatory authorities will not subject marketing of such products to certain limits on indicated use.
30
Failure can occur at any time during the clinical trial process and, in addition, the results from early clinical trials may not be predictive of results obtained in later and larger clinical trials, and product candidates in later clinical trials may fail to show the desired safety or efficacy despite having progressed successfully through earlier clinical testing. A number of companies in the pharmaceutical industry, including us, have suffered significant setbacks in clinical trials, even in advanced clinical trials after showing positive results in earlier clinical trials. The completion of clinical trials for our product candidates may be delayed or halted for the reasons noted above in addition to many other reasons, including:
|
•
|
delays in patient enrollment, and variability in the number and types of patients available for clinical trials;
|
|
•
|
regulators or institutional review boards may not allow us to commence or continue a clinical trial;
|
|
•
|
our inability, or the inability of our partners, to manufacture or obtain from third parties materials sufficient to complete our clinical trials;
|
|
•
|
delays or failure in reaching agreement on acceptable clinical trial contracts or clinical trial protocols with prospective clinical trial sites;
|
|
•
|
risks associated with trial design, which may result in a failure of the trial to show statistically significant results even if the product candidate is effective;
|
|
•
|
difficulty in maintaining contact with patients after treatment commences, resulting in incomplete data;
|
|
•
|
poor effectiveness of product candidates during clinical trials;
|
|
•
|
safety issues, including adverse events associated with product candidates;
|
|
•
|
the failure of patients to complete clinical trials due to adverse side effects, dissatisfaction with the product candidate, or other reasons;
|
|
•
|
governmental or regulatory delays or changes in regulatory requirements, policy and guidelines; and
|
|
•
|
varying interpretation of data by the FDA or foreign regulatory authorities.
|
In addition, our product candidates could be subject to competition for clinical study sites and patients from other therapies under development which may delay the enrollment in or initiation of our clinical trials.
The FDA or foreign regulatory authorities may require us to conduct unanticipated additional clinical trials, which could result in additional expense and delays in bringing our product candidates to market. Any failure or delay in completing clinical trials for our product candidates would prevent or delay the commercialization of our product candidates. We cannot assure you that our expenses related to clinical trials will lead to the development of brand-name drugs that will generate revenues in the near future. Delays or failure in the development and commercialization of our own branded products could have a material adverse effect on our business, results of operations and financial condition.
Our reporting and payment obligations under the Medicaid rebate program and other governmental purchasing and rebate programs are complex and may involve subjective decisions. Any determination that we have failed to comply with those obligations could subject us to penalties and sanctions, which could have a material adverse effect on our business.
The regulations applicable to us regarding reporting and payment obligations with respect to Medicaid reimbursement and rebates and other governmental programs are complex. As described in
Note 18. Commitments and Contingencies,
we and other pharmaceutical companies are defendants in a number of suits filed by state attorneys general and have been notified of an investigation by the DOJ with respect to Medicaid reimbursement and rebates. Our calculations and methodologies are subject to review and challenge by the applicable governmental agencies, and it is possible that such reviews could adversely affect us and our business. In addition, because our processes for these calculations and the judgments involved in making these calculations involve, and will continue to involve, subjective decisions and complex methodologies, these calculations are subject to the risk of error and misjudgment. Any governmental agencies that have commenced (or that may commence) an investigation of us could impose, based on a claim of violation of anti-fraud and false claims laws or otherwise, civil and/or criminal sanctions, including fines, penalties and possible exclusion from federal health care programs (including Medicaid and Medicare). Some of the applicable laws may impose liability even in the absence of specific intent to defraud. Furthermore, should there be ambiguity with respect to how to properly calculate and report
payments, and even in the absence of any such ambiguity, a governmental authority may take a position contrary to a position that we have taken and may impose civil and/or criminal sanctions on us. Any such penalties, sanctions, or exclusion from federal health care programs could have a material adverse effect on our business, financial position and results of operations. From time to time we conduct routine reviews of our government pricing calculations. These reviews may have an impact on government price reporting and rebate calculations used to comply with various government regulations regarding reporting and payment obligations.
31
Our operating results are affected by many factors and may fluctuate significantly on a quarterly basis.
Our operating results may vary substantially from quarter to quarter and may be greater or less than those achieved in the immediately preceding period or in the comparable period of the prior year. Factors that may cause quarterly results to vary include, but are not limited to, the following:
|
•
|
the number of new product introductions by us;
|
|
•
|
losses related to inventory write-offs;
|
|
•
|
marketing exclusivity, if any, which may be obtained on certain new products;
|
|
•
|
the level of competition in the marketplace for certain products;
|
|
•
|
our ability to create demand in the marketplace for our products;
|
|
•
|
availability of raw materials and finished products from suppliers;
|
|
•
|
our ability to manufacture products at our manufacturing facilities;
|
|
•
|
the scope and outcome of governmental regulatory actions;
|
|
•
|
our dependence on a small number of products for a significant portion of net revenue or income;
|
|
•
|
legal actions against our generic products brought by brand competitors, and legal challenges to our intellectual property rights by generic competitors;
|
|
•
|
price erosion and customer consolidation; and
|
|
•
|
significant payments (such as milestones) payable by us under collaboration, licensing, and development agreements to our partners before the related product has received FDA approval.
|
Our profitability also depends upon the prices we are able to charge for our products, the costs to purchase products from third parties, and our ability to manufacture our products in a cost effective manner. If our revenues decline or do not grow as anticipated, we may not be able to reduce our operating expenses to offset such declines. Failure to achieve anticipated levels of revenues could, therefore, significantly harm our operating results for a particular fiscal period.
In certain circumstances, we issue price adjustments and other sales allowances to our customers. Although we may establish reserves based on our estimates of these amounts, if estimates are incorrect and the reserves are inadequate, it may result in adjustments to these reserves that may have a material adverse effect on our financial position and results of operations.
As described above, the first company to file an ANDA containing a Paragraph IV certification that successfully challenges the patent(s) on a branded product may be granted 180 days of generic market exclusivity by the FDA for such generic product. At the expiration of such exclusivity period, other generic distributors may enter the market, resulting in a significant price decline for the drug (in some instances, price declines have exceeded 90%). When we experience price declines following a period of generic marketing exclusivity, or at any time when a competitor enters the market or offers a lower price with respect to a product we are selling, we may, at our discretion, decide to lower the price of our product to retain market share and provide price adjustments to our customers for the difference between our new (lower) price and the price at which we previously sold the product which is still held in inventory by such customers. Because the entry of a competitive generic product following the expiration of any exclusivity period is unpredictable, we do not establish reserves for such potential adjustments, and therefore the full effect of such adjustments are not reflected in our operating results until such adjustments actually occur. There are also circumstances under which we may decide not to provide price adjustments to certain customers, and consequently, as a matter of business strategy, we may risk a greater level of sale returns of products in a customer’s existing inventory and lose future sales volume to competitors rather than reduce our pricing.
Based on estimates, we establish reserves for sales allowances including, but not limited to: sales discounts and returns, chargebacks, sales volume rebates, shelf stocks, re-procurement charges, cash discounts, and Medicaid rebate obligations at the time of sale. Although we believe our reserves are adequate as of the date of this report, we cannot provide assurances that our reserves will ultimately prove to be adequate. Increases in sales allowances may exceed our estimates for a variety of reasons, including unanticipated competition or an unexpected change in one or more of our contractual relationships. We will continue to evaluate the effects of competition and will record a price adjustment reserve if and when we deem it necessary. Any failure to establish adequate reserves with respect to sales allowances may result in a material adverse effect on our financial position and results of operations.
32
If we determine that our goodwill and other intangible assets have become impaired, we may record significant impairment charges, which would adversely affect our results of operations.
Goodwill and other intangible assets represent a significant portion of our assets. Goodwill is the excess of cost over the fair market value of net assets acquired in business combinations. In the future, goodwill and intangible assets may increase as a result of future acquisitions. We review our goodwill and indefinite lived intangible assets at least annually for impairment. We review our intangible assets with finite lives for recoverability whenever events or changes in circumstances indicate that the carrying amount of the assets may not be fully recoverable. Impairment may result from, among other things, deterioration in the performance of acquired businesses, adverse market conditions and adverse changes in applicable laws or regulations, including changes that restrict the activities of an acquired business. Any impairment of goodwill or other intangible assets would result in a non-cash charge against earnings, which would adversely affect our results of operations.
Investigations and litigation concerning the calculation of average wholesale prices may adversely affect our business.
Many government and third-party payers, including Medicare, Medicaid, HMOs and others, reimburse doctors and others for the purchase of certain prescription drugs based on a drug’s average wholesale price ("AWP"). In the past several years, state and federal government agencies have conducted ongoing investigations of manufacturers’ reporting practices with respect to AWP, as a result of which certain agencies have suggested that reporting of inflated AWPs by manufacturers has led to excessive payments for prescription drugs. Numerous pharmaceutical companies have been named as defendants in actions brought by various State Attorneys General and have faced state law
qui tam
actions brought on behalf of various states, alleging generally that the defendants defrauded state Medicaid systems by purportedly reporting or causing the reporting of AWP and/or "Wholesale Acquisition Costs" that exceeded the actual selling price of the defendants’ prescription drugs. We, for example, are subject to a civil investigative demand issued by the Texas State Attorney General alleging certain overpayments to us by the Texas Medicaid system as further described in
Note 18. Commitments and Contingencies - Texas State Attorney General Civil Investigative Demand
. These cases generally seek some combination of actual damages, and/or double damages, treble damages, compensatory damages, statutory damages, civil penalties, disgorgement of excessive profits, restitution, disbursements, counsel fees and costs, litigation expenses, investigative costs, injunctive relief, punitive damages, imposition of a constructive trust, accounting of profits or gains derived through the alleged conduct, expert fees, interest and other relief that the court may have deemed proper.
We can give no assurance that we will be able to settle current or future actions on terms that we deem reasonable, or that such settlements or adverse judgments, if entered, will not exceed the amount of any reserve. Accordingly, such actions could adversely affect us and may have a material adverse effect on our business, results of operations, financial condition and cash flows.
33
We are increasingly dependent on information technology, and our systems and infrastructure face certain risks, including cybersecurity and data leakage risks.
Significant disruptions to our information technology systems or breaches of information security could adversely affect our business. In the ordinary course of business, we collect, store and transmit large amounts of confidential information, and it is critical that we do so in a secure manner to maintain the confidentiality and integrity of such information. Additionally, our information technology systems are critical to our ability to store electronic and financial information and to manage a variety of business processes and activities, including manufacturing, financial, logistics, sales, marketing and administrative functions. We depend on our information technology infrastructure to communicate internally and externally with employees, customers, suppliers and others. We also use information technology networks and systems to comply with regulatory, legal and tax requirements. We have outsourced significant elements of our information technology infrastructure; as a result we manage independent vendor relationships with third-parties who are responsible for maintaining significant elements of our information technology systems and infrastructure and who may or could have access to our confidential information. The size and complexity of our information technology systems, and those of our third party vendors, make such systems potentially vulnerable to service interruptions and security breaches from inadvertent or intentional actions by our employees, partners or vendors. These systems are also vulnerable to attacks by malicious third parties, and may be susceptible to intentional or accidental physical damage to the infrastructure maintained by us or by third parties. Maintaining the secrecy of confidential, proprietary, and/or trade secret information is important to our competitive business position. We continually assess these threats and makes investments to increase internal protection, detection, and response capabilities, as well as ensure our third-party providers have required capabilities and controls, to address this risk. But there can be no guarantee that our efforts will prevent service interruptions or security breaches in our systems or the unauthorized or inadvertent wrongful use or disclosure of confidential information that could adversely affect our business operations or result in the loss, dissemination, or misuse of critical or sensitive information. A breach of our security measures or the accidental loss, inadvertent disclosure, unapproved dissemination, misappropriation or misuse of trade secrets, proprietary information, or other confidential information, whether as a result of theft, hacking, fraud, trickery or other forms of deception, or for any other cause, could enable others to produce competing products, use our proprietary technology or information, and/or adversely affect our business position. Further, any such interruption, security breach, loss or disclosure of confidential information could result in financial, legal, business, and reputational harm to us and could have a material adverse effect on our business, financial position, results of operations and/or cash flow.
Our future success depends on our ability to attract and retain talented employees and consultants.
Our future success depends, to a substantial degree, upon the continued service of the members of our management team. The loss of the services of members of our management team, or their inability to perform services on our behalf, could have a material adverse effect on our business, condition (financial and otherwise), prospects and results of operations. Our success also depends, to a large extent, upon the contributions of our sales, marketing, scientific and quality assurance staff. We compete with brand and generic pharmaceutical manufacturers for qualified personnel, and our competitors may offer more favorable employment opportunities than we do. If we are not able to attract and retain the necessary personnel to accomplish our business objectives we could experience constraints that would adversely affect our ability to sell and market our products effectively, to meet the demands of our strategic partners in a timely fashion, and to support our research and development programs. In particular, our sales and marketing efforts depend on the ability to attract and retain skilled and experienced sales, marketing and quality assurance representatives. Although we believe that we have been successful in attracting and retaining skilled personnel in all areas of our business, we cannot provide assurance that we can continue to attract, train and retain such personnel. Any failure in this regard could limit the rates at which we generate sales and develop or acquire new products.
34
We depend on our ability to protect our intellectual property and proprietary rights.
Our success depends on our ability to protect and defend the intellectual property rights associated with our current and future products. If we fail to protect our intellectual property adequately, competitors may manufacture and market products similar to, or that may be confused with, our products, and our generic competitors may obtain regulatory approval to make and distribute generic versions of our branded products. Some patent applications in the United States are maintained in secrecy or are not published until the resulting patents issue. We also cannot be certain that patents will be issued with respect to any of our patent applications or that any existing or future patents issued to or licensed by us will provide competitive advantages for our products or will not be challenged, invalidated, circumvented or held unenforceable in proceedings commenced by our competitors or other third parties. Furthermore, our patent rights may not prevent or limit our present and future competitors from developing, making, importing, using or commercializing products that are functionally similar to our products. We rely particularly on trade secrets, trademarks, unpatented proprietary expertise and continuing innovation that we seek to protect, in part, by registering and using marks; and by entering into confidentiality agreements with licensees, suppliers, employees, consultants and other parties-we use this approach to protecting our intellectual property in large part because few of our products are protected by patents. We cannot provide assurance that these agreements will not be breached or circumvented. We also cannot be certain that we will have recourse to adequate remedies in the event of a breach of such agreements. Disputes may arise concerning the ownership of intellectual property or the applicability of confidentiality agreements. We cannot be sure that our trade secrets and proprietary technology will not be independently developed or otherwise become known by our competitors or, if patents are not issued with respect to our internally developed products, that we will be able to maintain the confidentiality of information relating to these products. In addition, efforts to ensure our intellectual property rights may be costly, time-consuming and/or ultimately unsuccessful. We cannot be sure that we will have the resources to protect our own rights against infringement by third parties. Our inability to protect our intellectual property and proprietary rights could have a material adverse effect on our business, results of operations, financial condition and cash flows.
If we fail to maintain an effective system of internal control over financial reporting, we may not be able to accurately report our financial results, timely file our periodic reports, maintain our reporting status or prevent fraud.
We are required to comply with Section 404 of the Sarbanes-Oxley Act. Section 404 of the Sarbanes-Oxley Act requires public companies to conduct an annual review and evaluation of their internal controls and attestations of the effectiveness of internal controls by independent auditors. Ensuring that we have adequate internal financial and accounting controls and procedures in place so that we can produce accurate financial statements on a timely basis is a costly and time-consuming effort that will need to be evaluated frequently. Our failure to maintain the effectiveness of our internal controls in accordance with the requirements of the Sarbanes-Oxley Act or the inability of our independent registered public accounting firm to express an opinion as to the effectiveness of our internal control over financial reporting could have a material adverse effect on our business. We could lose investor confidence in the accuracy and completeness of our financial reports, which could have an adverse effect on the price of our common stock. In addition, if our efforts to comply with new or changed laws, regulations, and standards differ from the activities intended by regulatory or governing bodies due to ambiguities related to practice, regulatory authorities may initiate legal proceedings against us and our business may be harmed.
Our management or our independent registered public accounting firm may also identify material weaknesses in our internal control over financial reporting in the future. The existence of internal control material weaknesses may result in current and potential stockholders and alliance and collaboration agreements’ partners losing confidence in our financial reporting, which could harm our business, the market price of our common stock, and our ability to retain our current, or obtain new, alliance and collaboration agreements’ partners.
In addition, the existence of material weaknesses in our internal control over financial reporting may affect our ability to timely file periodic reports under the Exchange Act. The inability to timely file periodic reports under the Exchange Act could result in the SEC revoking the registration of our common stock, which would prohibit us from listing or having our stock quoted on any public market. This would have an adverse effect on our business and stock price by limiting the publicly available information regarding us and greatly reducing the ability of our stockholders to sell or trade our common stock.
35
The United Kingdom’s vote to exit from the European Union may adversely affect our business.
In June 2016, a majority of British voters voted to exit the European Union in a referendum vote commonly referred to as “Brexit,” and, in March 2017, the British government delivered formal notice of the U.K.’s intention to leave the European Union. The British government is currently negotiating the terms of a U.K.’s exit with the European Union. A withdrawal could, among other things, disrupt the free movement of goods, services and people between the U.K. and the European Union, undermine bilateral cooperation in key geographic areas and significantly disrupt trade between the U.K. and the European Union or other nations. In addition, Brexit could lead to legal uncertainty and potentially divergent national laws and regulations as the U.K. determines which European Union laws to replace or replicate. The effects of Brexit will depend on any agreements the U.K. makes to retain access to European Union or other markets during any transitional period or more permanently. It is unclear what general long-term economic, financial, trade and legal implications a U.K. withdrawal from the European Union would have and how the withdrawal and implications thereof could impact our business. In addition, Brexit may lead other European Union member countries to consider referendums regarding their European Union membership. Any of these events, along with any political, economic and regulatory changes that may occur, could cause political and economic uncertainty in Europe and internationally and harm our business and financial results.
We may need to raise additional funds in the future which may not be available on acceptable terms or at all.
We may consider issuing additional debt or equity securities in the future to fund potential acquisitions or investments, to refinance existing debt, or for general corporate purposes. If we issue equity, convertible preferred equity or convertible debt securities to raise additional funds, our stockholders may experience dilution, and the new equity or debt securities may have rights, preferences and privileges senior to those of our stockholders. If we incur additional debt, we may increase our leverage relative to our earnings or to our equity capitalization, requiring us to pay additional interest expenses and potentially lowering our credit ratings. We may not be able to market such issuances on favorable terms, or at all, in which case, we may not be able to develop or enhance our products, execute our business plan, take advantage of future opportunities, or respond to competitive pressures or unanticipated customer requirements.
Risks Relating to Our Indebtedness
We have a substantial amount of indebtedness, which could adversely affect our financial health.
We have a substantial amount of indebtedness. In order to finance the Combination, during the combined year ended
December 31, 2018
, we borrowed $2.7 billion in an aggregate principal amount of new senior secured term loans and entered into a new senior secured asset based revolving credit facility with borrowing capacity of up to $500 million, under which no amounts were drawn and outstanding as of
December 31, 2018
. The net proceeds from the new term loans were used to finance in part the Combination, to pay off certain existing indebtedness of Amneal and Impax and to pay fees and expenses related to the foregoing. For additional details of our debt, see
Note 16. Debt.
Our substantial level of indebtedness could have important consequences. For example, it could:
|
•
|
increase our vulnerability to adverse economic and industry conditions;
|
|
•
|
limit our ability to obtain additional financing for future working capital, capital expenditures, raw materials, strategic acquisitions and other general corporate requirements;
|
|
•
|
expose us to interest rate fluctuations because the interest on certain debt under the credit facilities is imposed at variable rates;
|
|
•
|
require us to dedicate a substantial portion of our cash flow from operations to payments on our debt, thereby reducing the availability of cash flow for operations and other purposes;
|
|
•
|
make it more difficult for us to satisfy our obligations to our lenders, resulting in possible defaults on and acceleration of such indebtedness;
|
|
•
|
limit our ability to refinance indebtedness or increase the associated costs;
|
|
•
|
require us to sell assets to reduce debt or influence the decision about whether to do so;
|
|
•
|
limit our flexibility in planning for, or reacting to, changes in our business and the industry in which we operate or prevent us from carrying out capital spending that is necessary or important to our growth strategy and efforts to improve operating margins or our business; and
|
|
•
|
place us at a competitive disadvantage compared to any competitors that have less debt or comparable debt at more favorable interest rates and that, as a result, may be better positioned to withstand economic downturn.
|
36
We may not be able to generate sufficient cash to service all of our indebtedness and may be forced to take other actions to satisfy our obligations under our indebtedness, which may not be successful.
Our ability to make scheduled payments on or refinance our debt obligations depends on our financial condition and operating performance, which are subject to prevailing economic and competitive conditions and to certain financial, business, legislative, regulatory and other factors which may be beyond our control. We may be unable to maintain a level of cash flows from operating activities sufficient to permit us to pay the principal, premium, if any, and interest on our indebtedness. As of
December 31, 2018
, we had approximately
$2.7 billion
of indebtedness, with an annual interest expense of approximately
$150 million
to
$160 million
and annual debt payments of approximately $27 million on our Term Loan.
If our cash flows and capital resources are insufficient to fund our debt service obligations, we could face substantial liquidity problems and could be forced to reduce or delay investments and capital expenditures or to dispose of material assets or operations, seek additional debt or equity capital or restructure or refinance our indebtedness. We may not be able to effect any such alternative measures on commercially reasonable terms or at all and, even if successful, those alternative actions may not allow us to meet our scheduled debt service obligations. Our credit agreements restrict our ability to dispose of assets and use the proceeds from those dispositions and also restrict our ability to raise debt or equity capital to be used to repay other indebtedness when it becomes due. We may not be able to consummate those dispositions or obtain proceeds in an amount sufficient to meet any debt service obligations when due.
Our inability to generate sufficient cash flows to satisfy our debt obligations, or to refinance our indebtedness on commercially reasonable terms or at all, would materially and adversely affect our financial position and results of operations and our ability to satisfy our obligations, including our indebtedness.
If we cannot make scheduled payments on our debt, we will be in default and, as a result:
|
•
|
our debt holders could declare all outstanding principal and interest to be due and payable;
|
|
•
|
the lenders under our credit agreements could terminate their commitments to lend us money; and
|
|
•
|
we could be forced into bankruptcy or liquidation.
|
The terms of our credit agreements restrict our operations, particularly our ability to respond to changes or to take certain actions.
Our credit agreements contain a number of restrictive covenants that impose operating and financial restrictions on us and may limit our ability to engage in acts that may be in our long-term best interest, including restrictions on the ability to:
|
•
|
incur additional indebtedness;
|
|
•
|
pay dividends or make other distributions or repurchase or redeem capital stock;
|
|
•
|
prepay, redeem or repurchase certain debt;
|
|
•
|
make loans and investments;
|
|
•
|
sell assets;
|
|
•
|
incur liens;
|
|
•
|
enter into transactions with affiliates;
|
|
•
|
alter the businesses conducted by us;
|
|
•
|
enter into agreements restricting subsidiaries’ ability to pay dividends; and
|
|
•
|
consolidate, merge or sell all or substantially all of our assets.
|
A breach of the covenants under such credit agreements could result in an event of default under the applicable indebtedness. Such a default may allow the creditors to accelerate the related debt and may result in the acceleration of any other debt to which a cross-acceleration or cross-default provision applies which could have a material adverse effect on our business, operations and financial results. Furthermore, if we were unable to repay the amounts due and payable under our credit agreements, those lenders could proceed against the collateral granted to them to secure that indebtedness which could force us into bankruptcy or liquidation. In the event our lenders accelerated the repayment of the borrowings, we and our subsidiaries may not have sufficient assets to repay that indebtedness. Any acceleration of amounts due under the credit agreements would likely have a material adverse effect on us. As a result of these restrictions, we may be:
•
limited in how we conduct business;
|
•
|
unable to raise additional debt or equity financing to operate during general economic or business downturns; or
|
•
unable to compete effectively or to take advantage of new business opportunities.
37
These restrictions may affect our ability to grow in accordance with our strategy.
Risks Related to Our Class A Common Stock
We are a holding company with nominal net worth and depend on dividends and distributions from our subsidiaries to pay any dividends.
We are a holding company with nominal net worth and will not have any material assets or conduct any business operations other than our investments in our subsidiaries. Our business operations are conducted primarily out of our direct operating subsidiary, Amneal, and its subsidiaries, including Impax. As a result, our ability to satisfy our financial obligations and, notwithstanding any restrictions on payment of dividends under our existing indebtedness, our ability to pay dividends, if any, is dependent upon cash dividends and distributions or other transfers from our subsidiaries, including from Amneal.
The Class A Common Stock price is expected to be volatile, and the market price of Class A Common Stock may decline.
The market price of our Class A Common Stock could be subject to significant fluctuations. Market prices for securities of pharmaceutical, biotechnology, and other life sciences companies have historically been particularly volatile. Some of the factors that may cause the market price of Class A Common Stock to fluctuate include:
|
•
|
our ability to obtain regulatory approvals for product candidates, and delays or failures to obtain such approvals;
|
|
•
|
the failure of any of our product candidates, if approved for marketing and commercialization, to achieve commercial success;
|
|
•
|
issues in manufacturing our approved products or product candidates;
|
|
•
|
the entry into, or termination of, key agreements, including key licensing or collaboration agreements;
|
|
•
|
the initiation of material developments in, or conclusion of, litigation to enforce or defend any of our intellectual property rights or defend against the intellectual property rights of others;
|
|
•
|
announcements by commercial partners or competitors of new commercial products, clinical progress (or the lack thereof), significant contracts, commercial relationships, or capital commitments;
|
|
•
|
adverse publicity relating to our markets, including with respect to other products and potential products in such markets;
|
|
•
|
the introduction of technological innovations or new therapies competing with our products or our potential products;
|
|
•
|
the loss of talented employees;
|
|
•
|
changes in estimates or recommendations by securities analysts, if any, who cover the Class A Common Stock regarding us, our business, our industry or our competitors, or the failure of analysts to regularly publish reports on us;
|
|
•
|
general and industry-specific economic conditions potentially affecting our research and development expenditures;
|
|
•
|
changes in the structure of health care payment systems;
|
|
•
|
period-to-period fluctuations in our financial results;
|
|
•
|
failure to meet or exceed financial and development projections we may provide to the public;
|
|
•
|
failure to meet or exceed the financial and development projections of the investment community;
|
|
•
|
the perception of the pharmaceutical industry by the public, legislators, regulators, and the investment community;
|
|
•
|
adverse regulatory decisions;
|
|
•
|
disputes or other developments relating to proprietary rights, including patents, litigation matters, and our ability to obtain patent protection for our technologies;
|
|
•
|
sales of the Class A Common Stock by us or our stockholders in the future; and
|
|
•
|
trading volume of the Class A Common Stock.
|
Moreover, the stock markets in general have experienced substantial volatility that has often been unrelated to the operating performance of individual companies or the biotechnology sector. These broad market fluctuations may also adversely affect the trading price of our Class A Common Stock.
In the past, following periods of volatility in the market price of a company’s securities, stockholders have often instituted class action securities litigation against those companies. Such litigation, if instituted, could result in substantial costs and diversion of management’s attention and resources, which could significantly harm the Company’s profitability and reputation.
38
Future sales of shares by stockholders could cause the Class A Common Stock price to decline.
If our stockholders sell, or indicate an intention to sell, substantial amounts of Class A Common Stock in the public market, the trading price of Class A Common Stock could decline.
The Company’s Second Amended and Restated Stockholders Agreement, dated December 16, 2017 (the "Stockholders' Agreement"), includes certain lock-up provisions that limited the ability of the Amneal Group and its permitted transferees to transfer shares of our common stock held by such members for a period of 180 days from the closing of the Combination. The lock-up restriction has expired, and thus, subject to applicable securities laws, the 171,260,707 shares of Class A Common Stock subject to outstanding Amneal common units held by the Amneal Group and its permitted transferees are eligible for sale or transfer (subject to certain continuing restrictions). The Amneal Group and the other stockholders may sell their shares in the public market. Such shares may also be resold into the public markets in accordance with the requirements of Rule 144, including the volume limitations, manner of sale requirements and notice requirements thereof. If some or all of these shares are sold, or if it is perceived that they will be sold, in the public market, the trading price of the Class A Common Stock could decline.
The high concentration of ownership of the Class A Common Stock may prevent other stockholders from influencing significant corporate decisions and may result in conflicts of interest that could cause the Class A Common Stock’s stock price to decline.
As of
December 31, 2018
, our executive officers and directors, and affiliates of our executive officers and directors, beneficially owned or controlled approximately 60%
of the outstanding shares of our common stock. Accordingly, these executive officers, directors, and their affiliates, acting as a group, have substantial influence over the outcome of corporate actions requiring stockholder approval, including the election of directors, any merger, consolidation, or sale of all or substantially all of our assets or any other significant corporate transactions. These stockholders may also delay or prevent a change of control of the Company, even if such a change of control would benefit our other stockholders. The significant concentration of stock ownership may adversely affect the trading price of Class A Common Stock due to investors’ perception that conflicts of interest may exist or arise.
We are controlled by the Amneal Group. The interests of the Amneal Group may differ from the interests of our other stockholders.
As of
December 31, 2018
, the Amneal Group controlled approximately 60% of the voting power of all of our outstanding shares of common stock.
Through its control of a majority of our voting power and the provisions set forth in our charter, bylaws and the Stockholders Agreement, the Amneal Group has the ability to designate and elect a majority of our board of directors. As of
December 31, 2018
, seven out of thirteen members of our board of directors, as well as one observer, have been designated by the Amneal Group. The Amneal Group has control over all matters submitted to our stockholders for approval, including changes in capital structure, transactions requiring stockholder approval under Delaware law and corporate governance, subject to the terms of the Stockholders Agreement relating to the Amneal Group's agreement to vote in favor of directors not designated by the Amneal Group and such other matters that are set forth in the Stockholders Agreement. The Amneal Group may have different interests than our other stockholders and may make decisions adverse such interests.
Among other things, the Amneal Group's control could delay, defer, or prevent a sale of the Company that the Company’s other stockholders support, or, conversely, this control could result in the consummation of such a transaction that our other stockholders do not support. This concentrated control could discourage a potential investor from seeking to acquire Class A Common Stock and, as a result, might harm the market price of that Class A Common Stock.
The Amneal Group could transfer control of us to a third party by transferring its shares. In addition, members of the Amneal Group could pledge Amneal Common Units or shares of Class B Common Stock or both to secure borrowings. The voluntary or forced sale of these units or shares pursuant to a margin call or otherwise could cause our stock price to decline and negatively impact our business.
39
Our charter provides that the Court of Chancery of the State of Delaware will be the sole and exclusive forum for substantially all disputes between us and our stockholders, which could limit the ability of our stockholders to obtain a favorable judicial forum for disputes with us or our current or former directors, officers or employees.
Our charter provides that unless we consent in writing to the selection of an alternative forum, the Court of Chancery of the State of Delaware (or, if such court does not have jurisdiction, the Superior Court of the State of Delaware or the federal district court for the District of Delaware) will be the sole and exclusive forum for any derivative action or proceeding brought on behalf of the Company, any action asserting a claim of breach of fiduciary duty owed by any of our current or former director or officer to us or our stockholders, any action asserting a claim arising pursuant to any provision of the DGCL, our charter or bylaws or any action asserting a claim governed by the internal affairs doctrine. The choice of forum provision may limit a stockholder’s ability to bring a claim in a judicial forum that it finds favorable for disputes with us or our current or former directors, officers or other employees, which may discourage such lawsuits against us and our current or former directors, officers and other employees. Alternatively, if a court were to find the choice of forum provision contained in our charter to be inapplicable or unenforceable in an action, we may incur additional costs associated with resolving such action in other jurisdictions, which could harm our business, results of operations, and financial condition.
Anti-takeover provisions under Delaware law could make an acquisition of the Company more difficult and may prevent attempts by our stockholders to replace or remove our management.
Because we are incorporated in Delaware, we are governed by the provisions of Section 203 of the DGCL, which prohibits stockholders owning in excess of 15% of the outstanding voting stock of the Company from merging or combining with us. Although we believe these provisions collectively will provide for an opportunity to receive higher bids by requiring potential acquirers to negotiate with our board of directors, they would apply even if the offer may be considered beneficial by some stockholders. In addition, these provisions may frustrate or prevent any attempts by our stockholders to replace or remove then current management by making it more difficult for stockholders to replace members of our board of directors, which is responsible for appointing the members of management.
We do not anticipate that we will pay any cash dividends in the foreseeable future.
The current expectation is that we will retain our future earnings to fund the development and growth of our business. As a result, capital appreciation, if any, of our Class A Common Stock will be the sole source of gain for our stockholders for the foreseeable future. The payment of future cash dividends, if any, will be at the discretion of our Board of Directors and will be dependent upon our earnings, financial condition, capital requirements and other factors as our Board of Directors may deem relevant.
Item 1B. Unresolved Staff Comments
None.
Item 2. Properties
Amneal owns or leases numerous properties in domestic and foreign locations. Amneal’s principal properties include manufacturing facilities, R&D laboratories, warehouses, and corporate offices. Amneal also has numerous smaller facilities that include sales and support offices and storage facilities throughout the world. Our properties are generally used to support the operations of both Generics and Specialty.
Our significant properties are as follows:
40
|
Property Address
|
Legal Status
|
Purpose
|
||
|
400 Crossing Boulevard, Bridgewater, New Jersey
|
Leased
|
Executive Office
|
||
|
118 Beaver Trail, Glasgow, Kentucky
|
Leased
|
Administrative, Distribution and Warehouse
|
||
|
40 Aberdeen Drive, Glasgow, Kentucky
|
Leased
|
Warehouse
|
||
|
19 Nichols Drive, Yaphank, New York
|
Leased
|
Warehouse
|
||
|
21 Colonial Drive, Piscataway, New Jersey
|
Leased
|
Warehouse
|
||
|
41-49 Colonial Drive, Piscataway, New Jersey
|
Leased
|
Manufacturing
|
||
|
1045 Centennial Ave, Piscataway, New Jersey
|
Leased
|
R&D, manufacturing
|
||
|
131 Chambersbrook Rd., Branchburg, New Jersey
|
Leased
|
Manufacturing
|
||
|
65 Readington, Branchburg, New Jersey
|
Leased
|
Manufacturing
|
||
|
1 New England Avenue, Piscataway, New Jersey
|
Leased
|
Manufacturing
|
||
|
19 Readington Road, Branchburg, New Jersey
|
Leased
|
Warehouse
|
||
|
1 Murray Road, East Hanover, New Jersey
|
Leased
|
Packaging
|
||
|
50 Horseblock Road, (Yaphank) Brookhaven, New York
|
Leased
|
Manufacturing, R&D, Quality and Regulatory
|
||
|
75 Adams, Hauppauge, New York
|
Leased
|
Manufacturing, R&D, Quality and Regulatory
|
||
|
Cahir Road, Cashel Co, Tipperary, Ireland
|
Owned
|
R&D, manufacturing
|
||
|
881/1 and 871, Near Hotel Karnavati, Vill Rajoda, Tal Bavla, Ahmedabad—380001, India
|
Owned
|
Oral Solids Manufacturing and R&D
|
||
|
Plot No 15-16-17, Pharmasez, Sarkhej Balva Highway NH No. 8A Village Matoda, India
|
Leased
|
Oral Solids and Injectables Manufacturing and R&D
|
||
|
Magnet Park, Corporate House No 18, Sarkhej Gandhinagar Highway, Thaltej, Ahmedabad, India
|
Leased
|
R&D (Injectables), Corporate Office
|
||
|
Plot No 99, Gallops Industrial Park, Village Rajoda, Bavla, Ahmedabad 382 220, India
|
Leased
|
Additional Warehouse for OSD
|
||
|
901-905, 906-910& 911 Iscon Elegance, S.G.Highway, Ahmedabad, India
|
Leased
|
Corporate Office
|
||
|
63, Silver Industrial Estate, B/H JP Cold Storage, Village-Moraiya, Tal-Sanand, Dist Ahmedabad, India
|
Leased
|
Warehouse
|
||
|
72, Silver Industrial Estate, B/H JP Cold Storage, Village-Moraiya, Tal-Sanand, Dist Ahmedabad, India
|
Leased
|
Warehouse
|
||
|
Plot S3, S4 & S5 -A, TSIIC,Sez, Jadcherla Telangana Mahabubnagar 509302, India
|
Leased
|
Oncology R&D and Manufacturing
|
||
|
Plot No 68 SY No 60,62&63 Ofe Bonamgi Revenue Village Parawada Mandal AP 008 Visakhapatam Apandhra Pradesh, 530001, India
|
Owned
|
API Manufacturing and R&D
|
||
|
Plot No Z/111/A Dahej Sez, Part II Dahej, Gujarat Bharuch-392110, India
|
Leased
|
API Manufacturing
|
||
Item 3. Legal Proceedings
Information pertaining to legal proceedings can be found in
Note 18. Commitments and Contingencies
and is incorporated by reference herein.
Item 4. Mine Safety Disclosures
Not applicable.
PART II.
Item 5. Market for Registrant’s Common Equity, Related Stockholder Matters and Issuer Purchases of Equity Securities
Market Information and Holders
The principal market for our Class A Common Stock is the New York Stock Exchange ("NYSE"). Our Class A Common Stock has been traded on the NYSE under the symbol "AMRX" since it began trading on May 7, 2018. According to the records of our transfer agent, we had 221 holders of record of our Class A Common Stock as of February 21, 2019. A substantially greater number of holders of our Class A Common Stock are "street name" or beneficial holders, whose shares of record are held by banks, brokers, and other financial institutions. As of February 21, 2019, there were 36 record holders of our Class B Common Stock and 1 record holder of our Class B-1 Common Stock. All of our issued and outstanding Class B Common Stock is held by the Amneal Group. All of our issued and outstanding Class B-1 Common Stock is held by TPG Group Holdings. Our Class B Common Stock and Class B-1 Common Stock are not listed nor traded on any stock exchange.
Performance Graph
Set forth below is a line graph comparing the change in the cumulative total shareholder return on our Class A Common Stock with the cumulative total returns of the NYSE Composite Index, the Russell 2000 Index and the Dow Jones U.S. Pharmaceuticals Index for the period from May 7, 2018, to December 31, 2018, assuming the investment of $100 on May 7, 2018, and the reinvestment of dividends. The Class A Common Stock price performance shown on the graph only reflects the change in our Class A Common Stock price relative to the noted indices and is not necessarily indicative of future price performance.
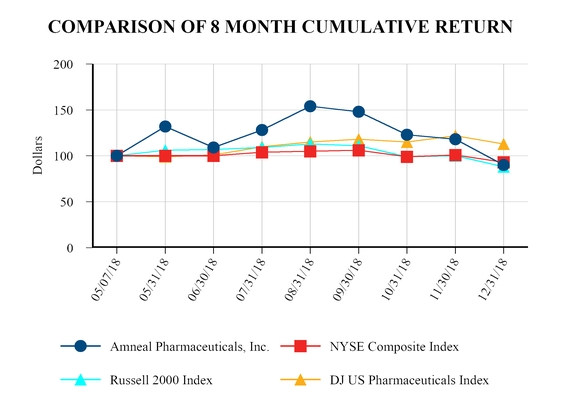
Dividends
We have never paid cash dividends on any series of our common stock and have no present plans to do so. Our current policy is to retain all earnings, if any, for use in the operation of our business.
41
Item 6. Selected Financial Data
The following selected financial data should be read together with our consolidated financial statements and accompanying consolidated financial statement footnotes and
Item 7. Management’s Discussion and Analysis of Financial Condition and Results of Operations
. The selected consolidated financial statement data in this section are not intended to replace our consolidated financial statements and the accompanying consolidated financial statement footnotes. Our historical consolidated financial results are not necessarily indicative of our future consolidated financial results.
|
(In thousands, except per share data)
|
Years Ended December 31,
|
||||||||||||||||||
|
Statements of Operations Data:
|
2018
(1)(2)(3)
|
2017
|
2016
|
2015
|
2014
|
||||||||||||||
|
Net revenue
|
$
|
1,662,991
|
|
$
|
1,033,654
|
|
$
|
1,018,225
|
|
$
|
866,280
|
|
$
|
785,263
|
|
||||
|
Research and development and intellectual property legal development expenses
|
210,451
|
|
191,938
|
|
204,747
|
|
153,713
|
|
118,539
|
|
|||||||||
|
In-process research and development impairment charges
|
39,259
|
|
—
|
|
—
|
|
—
|
|
—
|
|
|||||||||
|
Operating (loss) income
|
(19,673
|
)
|
245,103
|
|
284,881
|
|
236,158
|
|
218,575
|
|
|||||||||
|
Net (loss) income
|
(201,303
|
)
|
169,325
|
|
209,426
|
|
170,629
|
|
177,812
|
|
|||||||||
|
Net loss attributable to Amneal Pharmaceuticals, Inc.
|
$
|
(20,920
|
)
|
$
|
—
|
|
$
|
—
|
|
$
|
—
|
|
$
|
—
|
|
||||
|
Per share data:
|
|||||||||||||||||||
|
Net loss per share — basic and diluted
|
$
|
(0.16
|
)
|
||||||||||||||||
|
(In thousands)
|
As of December 31,
|
||||||||||||||||||
|
Balance Sheet Data:
|
2018
(1)(2)(3)
|
2017
|
2016
|
2015
|
2014
|
||||||||||||||
|
Cash and cash equivalents
|
$
|
213,394
|
|
$
|
74,166
|
|
$
|
27,367
|
|
$
|
61,087
|
|
$
|
117,522
|
|
||||
|
Working capital
|
732,794
|
|
475,050
|
|
501,041
|
|
365,454
|
|
325,989
|
|
|||||||||
|
Total assets
|
4,352,736
|
|
1,341,889
|
|
1,218,817
|
|
1,014,093
|
|
829,983
|
|
|||||||||
|
Long-term debt, net
|
2,630,598
|
|
1,355,274
|
|
1,119,268
|
|
911,043
|
|
711,914
|
|
|||||||||
|
Total liabilities
|
3,456,373
|
|
1,717,471
|
|
1,394,762
|
|
1,200,966
|
|
927,670
|
|
|||||||||
|
Total equity (deficit)
|
$
|
896,363
|
|
$
|
(375,582
|
)
|
$
|
(175,945
|
)
|
$
|
(186,873
|
)
|
$
|
(97,687
|
)
|
||||
(1)
On May 4, 2018, the Combination was completed and on May 7, 2018, we acquired 98% of the outstanding equity interests in Gemini. Consolidated operating results for 2018 include the results of operations of Impax and Gemini subsequent to the transaction closing dates. For more information, see
Note 1. Nature of Operations
and
Basis of Presentation
and
Note 3. Acquisitions and Divestitures
.
(2)
Operating loss for 2018 includes:
|
•
|
$56 million
for restructuring charges related to the Combination, of which
$45 million
was for employee separation and
$11 million
was for asset-related charges. For more information, see
Note 6. Restructuring and Asset-Related Charges
.
|
|
•
|
$222 million
for acquisition, transaction-related and integration expenses related to the Combination, including
$35 million
for professional service fees (e.g. legal, investment banking and accounting), information technology systems conversions, and contract termination/renegotiation costs,
$159 million
for the accelerated vesting of certain of Amneal's profit participation units that occurred prior to the closing of the Combination, and
$28 million
for a transaction-related bonus. For more information, see
Note 7. Acquisition, Transaction-Related and Integration Expenses
.
|
|
•
|
$48 million
for impairment of intangible assets recognized in connection with the Combination, of which
$9 million
was recognized in cost of goods sold and
$39 million
was recognized for in-process research and development. For more information, see
Note 14. Goodwill and Intangible Assets
.
|
(3)
Net loss for 2018 includes incremental interest expense for additional long-term debt incurred as a result of the Combination.
42
Item 7. Management’s Discussion and Analysis of Financial Condition and Results of Operations
The following discussion and analysis contains forward-looking statements that involve risks and uncertainties. Our actual results could differ materially from those anticipated in these forward-looking statements as a result of certain factors, including those set forth under
Item 1A. Risk Factors
and under the heading Forward-Looking Statements in this Annual Report on Form 10-K. The following discussion and analysis, as well as other sections in this report, should be read in conjunction with the consolidated financial statements and related notes to consolidated financial statements included elsewhere herein.
Overview
The Company
Amneal Pharmaceuticals, Inc. (the "Company," "we," "us," or "our") is a pharmaceutical company specializing in developing, manufacturing, marketing and distributing high-value generic pharmaceutical products across a broad array of dosage forms and therapeutic areas, as well as branded products. We were formed on October 4, 2017, under the name Atlas Holdings, Inc. for the purpose of facilitating the combination (the "Combination") of Impax Laboratories, Inc. ("Impax") and Amneal Pharmaceuticals LLC ("Amneal"), which closed on May 4, 2018. Refer to
Note 1. Nature of Operations and Basis of Presentation
for further information related to the Combination. Prior to the consummation of the Combination, Amneal and Impax operated separately as independent companies. We operate in two segments, referred to as Generics and Specialty. Generics concentrates its efforts on generic products, which are the pharmaceutical and therapeutic equivalents of brand-name drug products and are usually marketed under their established nonproprietary drug names rather than a brand name. Specialty utilizes its specialty sales force to market proprietary branded pharmaceutical products for the treatment of central nervous system ("CNS") disorders and other select specialty segments.
Generics specializes in developing, manufacturing, marketing and distributing high-value generic pharmaceutical products across a broad array of dosage forms and therapeutic areas. We currently market over 200 product families in the United States and our marketed and pipeline generics portfolios cover an extensive range of dosage forms and delivery systems, including both immediate and extended release oral solids such as tablets, capsules and powders, liquids, sterile injectables, nasal sprays, inhalation and respiratory products, ophthalmics (which are sterile pharmaceutical preparations administered for ocular conditions), films, transdermal patches and topicals (which are creams or gels designed to administer pharmaceuticals locally through the skin). We focus on developing products with substantial barriers-to-entry as a result of complex drug formulations or manufacturing, legal and/or regulatory challenges. We believe that focusing on these opportunities allows us to offer first-to-file ("FTF"), first-to-market ("FTM") and other "high-value" products, which we define as products with zero to three generic competitors at time of launch. These products tend to be more profitable and often have longer life cycles than other generic pharmaceuticals. As of
December 31, 2018
, we had 124 products approved but not yet launched or pending FDA approval and another 96 products in various stages of development. Over 46% of our total generic pipeline consists of potential FTF, FTM and other high-value products. We believe that we led the U.S. generics market in product approvals and launches in 2018, with 62 of our products receiving final approval, 10 receiving tentative approval and 42 new product launches.
43
Specialty is comprised of the Impax specialty business acquired in the Combination and the Gemini Laboratories LLC ("Gemini") business acquired on May 7, 2018. Refer to
Note 3. Acquisitions and Divestitures
for further information related to the Combination and the Gemini acquisition. Prior to these two transactions, we did not have a Specialty segment. Specialty is engaged in the development, promotion, sale and distribution of proprietary branded pharmaceutical products that we believe represent improvements to already-approved pharmaceutical products addressing CNS disorders, including migraine and Parkinson's disease, and branded pharmaceutical products in other select specialty segments. We believe that we have the research, development and formulation expertise to develop branded products that will deliver significant improvements over existing therapies.
Our branded pharmaceutical product portfolio currently consists of commercial CNS and other select specialty products, including our internally developed branded product, Rytary® (IPX066), an extended release oral capsule formulation of carbidopa-levodopa for the treatment of Parkinson’s disease, post-encephalitic parkinsonism, and parkinsonism that may follow carbon monoxide intoxication and/or manganese intoxication, which was approved by the FDA on January 7, 2015 and which Impax began marketing in the United States in April 2015. In addition to Rytary®, our Specialty segment is also currently engaged in the sale and distribution of four other branded products; the more significant include Zomig® (zolmitriptan) products, indicated for the treatment of migraine headaches, under the terms of a Distribution, License, Development and Supply Agreement with AstraZeneca UK Limited in the United States and in certain U.S. territories, and Emverm® (mebendazole) 100 mg chewable tablets, indicated for the treatment of pinworm, whipworm, common roundworm, common hookworm, and American hookworm in single or mixed infections.
Generic products, particularly in the U.S., generally contribute most significantly to revenues and gross margins at the time of their launch, and even more so in periods of market exclusivity, or in periods of limited generic competition. As such, the timing of new product introductions can have a significant impact on the Company’s financial results. The entrance into the market of additional competition generally has a negative impact on the volume and pricing of the affected products. Additionally, pricing is often affected by factors outside of the Company’s control.
For Specialty products, the majority of the product’s commercial value is usually realized during the period in which the product has market exclusivity. In the U.S. and some other countries, when market exclusivity expires and generic versions of a product are approved and marketed, there can often be very substantial and rapid declines in the branded product’s sales.
Our financial results in 2018 were impacted significantly by our Combination with Impax in May 2018. The historical financial results of the Company for the periods prior the closing of the Combination are the historical financial results of Amneal, and thus the current year results, and balances, may not be comparable to prior years as the current year includes the results of Impax from May 4, 2018. Our current year results have also been impacted by the integration of Amneal and Impax as a result of our continued actions to adjust our operations and cost structure.
44
Results of Operations
Overview
The following table sets forth our summarized, consolidated results of operations for the years ended
December 31, 2018
,
2017
and
2016
(in thousands):
|
|
Years Ended December 31,
|
||||||||||
|
|
2018
|
2017
|
2016
|
||||||||
|
Net revenue
|
$
|
1,662,991
|
|
$
|
1,033,654
|
|
$
|
1,018,225
|
|
||
|
Cost of goods sold
|
946,588
|
|
507,476
|
|
420,770
|
|
|||||
|
Gross profit
|
716,403
|
|
526,178
|
|
597,455
|
|
|||||
|
Selling, general and administrative
|
230,435
|
|
109,046
|
|
118,757
|
|
|||||
|
Research and development
|
194,190
|
|
171,420
|
|
179,019
|
|
|||||
|
In-process research and development impairment charges
|
39,259
|
|
—
|
|
—
|
|
|||||
|
Acquisition, transaction-related and integration expenses
|
221,818
|
|
9,403
|
|
70
|
|
|||||
|
Restructuring and asset-related charges
|
56,413
|
|
—
|
|
—
|
|
|||||
|
Legal settlement gains
|
(22,300
|
)
|
(29,312
|
)
|
(11,000
|
)
|
|||||
|
Intellectual property legal development expenses
|
16,261
|
|
20,518
|
|
25,728
|
|
|||||
|
Operating (loss) income
|
(19,673
|
)
|
245,103
|
|
284,881
|
|
|||||
|
Total other expense, net
|
(183,049
|
)
|
(73,780
|
)
|
(70,060
|
)
|
|||||
|
(Loss) income before income taxes
|
(202,722
|
)
|
171,323
|
|
214,821
|
|
|||||
|
(Benefit from) provision for income taxes
|
(1,419
|
)
|
1,998
|
|
5,395
|
|
|||||
|
Net (loss) income
|
$
|
(201,303
|
)
|
$
|
169,325
|
|
$
|
209,426
|
|
||
Net Revenue
2018 compared with 2017
Net revenue for the year ended
December 31, 2018
increased by
61%
, or
$629 million
, to
$1.66 billion
compared to
$1.03 billion
for the year ended
December 31, 2017
. The increase was primarily attributable to the acquisitions of Impax and Gemini, as well as strong new product launches in the United States ("U.S.") during the year in our Generics segment. The revenue increase was partially offset by pricing pressures on our existing product base and a decline in international revenue of $16 million primarily as a result of the divestitures of our Australian business in August 2017 and our Spain and Nordics businesses in September 2017.
2017 compared with 2016
Net revenue for the year ended
December 31, 2017
increased by
2%
, or
$15 million
, to
$1.03 billion
compared to
$1.02 billion
for the year ended
December 31, 2016
. The increase in net revenue is primarily attributable to strong new U.S. product launches during the year in our Generics segment, partially offset by the divestitures of our Australian business in August 2017 and our Spain and Nordics businesses in September 2017.
45
Cost of Goods Sold and Gross Profit
2018 compared with 2017
Cost of goods sold for the year ended
December 31, 2018
increased by
87%
, or
$439 million
, to
$947 million
compared to
$507 million
for the year ended
December 31, 2017
. The acquisitions of Impax and Gemini, as well as new product launches in the U.S., contributed to the increase in cost of goods sold. Cost of goods sold was also impacted by amortization of intangible assets and inventory fair value step-up arising in purchase accounting, excess capacity charges associated with the wind-down of our Hayward, CA manufacturing plant, amortization of an up-front payment under a transition agreement, intangible asset impairment charges and write-offs of pre-launch inventory, primarily in our Generics segment.
Accordingly, gross profit for the year ended
December 31, 2018
was
$716 million
, or
43%
of net revenue, compared to gross profit of
$526 million
, or
51%
of net revenue, for the year ended
December 31, 2017
. Our gross profit as a percentage of net revenue declined primarily as a result of factors noted above as well as lower margin products in our Generics segment contributed by the Impax portfolio.
2017 compared with 2016
Cost of goods sold for the year ended
December 31, 2017
increased by
21%
, or
$87 million
to
$507 million
compared to
$421 million
for the year ended
December 31, 2016
. The
$87 million
increase in cost of goods sold was primarily attributable to manufacturing optimization expenses, higher depreciation/ lease expense from equipment and capital expenditures and lower production of certain products in our Generics segment.
Accordingly, gross profit for the year ended
December 31, 2017
was
$526 million
, or
51%
of net revenue, compared to gross profit for the year ended December 31, 2016 of
$597 million
, or
59%
of net revenue. Our gross profit as a percentage of net revenue declined primarily as a result of the factors that impacted our Generic segment as noted above.
Selling, General and Administrative
2018 compared with 2017
Selling, general and administrative ("SG&A") expenses for the year ended
December 31, 2018
were
$230 million
, as compared to
$109 million
for the year ended
December 31, 2017
. The
$121 million
increase compared to the prior year was primarily due to the Impax and Gemini acquisitions, including selling expenses associated with our Specialty segment, stock-based compensation related to new equity awards, and other public company costs that did not exist prior to the Combination. These costs were partially offset by savings generated from the prior year divestitures of our Australian, Spain and Nordics businesses.
2017 compared with 2016
SG&A expenses for the year ended
December 31, 2017
were
$109 million
compared to
$119 million
for the year ended
December 31, 2016
. The
$10 million
decrease compared to the prior year was primarily due to lower sales expenses, and salaries and benefits as a result of the divestitures of our Australian, Spain and Nordics businesses.
Research and Development
2018 compared with 2017
Research and development for the year ended
December 31, 2018
was
$194 million
compared to
$171 million
for the year ended
December 31, 2017
. The
$23 million
increase compared to the prior year was mainly attributable to the Impax and Gemini acquisitions.
2017 compared with 2016
Research and development for the year ended
December 31, 2017
was
$171 million
compared to
$179 million
for the year ended
December 31, 2016
. The
$8 million
decrease from the prior year was the result of lower material and supplies costs, lower external development costs due to the timing of certain projects, and lower exhibit batch product costs in our Generics segment.
46
In-Process Research and Development Impairment Charges
For the year ended December 31, 2018, we recognized in-process research and development impairment charges of
$39 million
associated with reevaluating two projects in our Generics segment due to changes in our key valuation metrics, (i.e. expected growth rates, market size, delayed launch date or unforeseen legal/regulatory risks). There were no in-process research and development impairment charges in 2017 or 2016.
Acquisition, Transaction-Related and Integration Expenses
2018 compared with 2017
Acquisition, transaction-related and integration expenses were
$222 million
for the year ended
December 31, 2018
compared to
$9 million
for the year ended
December 31, 2017
. The
$212 million
increase is primarily attributable to a $159 million charge for the accelerated vesting of certain of Amneal's profit participation units that occurred prior to the closing of the Combination, $35 million for professional services fees and other third-party expenses associated with the post closing integration of Impax and Gemini and $28 million for a transaction-related cash bonus for employees of Amneal for service prior to the closing of the Combination. For additional information, see
Note 7.
Acquisition, Transaction-Related and Integration Expenses.
2017 compared with 2016
Acquisition, transaction-related and integration expenses of
$9 million
for the year ended
December 31, 2017
were comprised of professional fees and other third-party expenses incurred in preparation for the Combination. Acquisition, transaction-related and integration expenses were immaterial in 2016.
Restructuring and Asset-Related Charges
Restructuring and asset-related charges of
$56 million
for the year ended
December 31, 2018
were comprised of $45 million in employee separation charges related to a reduction in workforce resulting from the Combination and $11 million in asset-related charges associated with the closing of our Hayward, California based operations. There were no restructuring and asset-related charges in 2017 or 2016.
Legal Settlement Gains
Legal settlement gains of
$22 million
and $11 million for the years ended December 31, 2018 and December 31, 2016, respectively, primarily related to settlements with several innovators of branded pharmaceutical products.
Legal settlement gains of
$29 million
for the year ended December 31, 2017 were primarily related to a settlement with the innovator of Suboxone for $25 million, resulting in a net gain after legal fees of $22 million.
Intellectual Property Legal Development Expense
2018 compared with 2017
Intellectual property legal development expenses for the year ended
December 31, 2018
were
$16 million
as compared to
$21 million
for the year ended
December 31, 2017
. The $5 million decrease was primarily due to reduced expenses related to trials on patent challenges during 2018. These costs include, but are not limited to, formulation assessments, patent challenge opinions and strategy, and litigation expenses to defend the intellectual property.
2017 compared with 2016
Intellectual property legal development expenses for the year ended
December 31, 2017
were
$21 million
as compared to
$26 million
for the year ended
December 31, 2016
. The $5 million decrease was primarily due to reduced expenses related to trials on patent challenges during 2017.
47
Other Expense, Net
2018 compared with 2017
Total other expense, net was
$183 million
for the year ended
December 31, 2018
, as compared to
$74 million
for the year ended
December 31, 2017
. The increase of
$109 million
was primarily attributable to
$73 million
of additional interest expense associated with an increase in long-term debt related to the Combination and the acquisition of Gemini, a net $20 million foreign exchange loss as compared to a net $29 million foreign exchange gain in the prior year, primarily as a result of the impact of fluctuations in the Swiss Franc, Indian Rupee and Euro on intercompany loans, and a
$20 million
loss on extinguishment of debt arising from the debt refinancing executed in connection with the Combination, partially offset by a
$26 million
reduction in the loss recognized on sale of certain international businesses.
2017 compared with 2016
Total other expense, net was
$74 million
for the year ended
December 31, 2017
, as compared to
$70 million
for the year ended
December 31, 2016
. The increase of
$4 million
was primarily attributable to a
$29 million
loss on sale of certain international businesses, $16 million of additional interest expense associated with increased borrowings which occurred in both April 2017 and May 2016 under Amneal’s term and revolving credit facilities and a
$3 million
loss on extinguishment and modification of debt, partially offset by a net change of
$43 million
in foreign exchange. For the year ended December 31, 2017, foreign exchange gain was $29 million as compared to a foreign exchange loss of $14 million for the year ended December 31, 2016, primarily as a result of the impact of fluctuation in the Swiss Franc, Indian Rupee and Euro on intercompany loans.
(Benefit From) Provision for Income Taxes
2018 compared with 2017
The benefit from income taxes was
$1 million
for the year ended
December 31, 2018
as compared to a provision for income taxes of
$2 million
for the year ended
December 31, 2017
.
Prior to the Combination, as a limited liability company, income taxes were only provided for the international subsidiaries as all domestic taxes flowed to the members. Subsequent to May 4, 2018, domestic income taxes were also provided for our allocable share of income or losses from Amneal at the prevailing U.S. federal, state, and local corporate income tax rates.
The change in income tax expense is also associated with the year over year decline in pre-tax income. The decline in pre-tax income was primarily attributable to a
$212 million
increase in acquisition, transaction-related and integration expenses and
$56 million
in restructuring and asset-related charges associated with the Combination.
2017 compared with 2016
The provision for income taxes for the years ended
December 31, 2017
and
December 31, 2016
was
$2 million
and
$5 million
, respectively, representing a decrease of $3 million. The decrease was primarily due to lower earnings in India from product sales to the United States and the effects of certain adjustments recorded in 2017.
Net (Loss) Income
2018 compared with 2017
We recognized a net loss of
$201 million
for the year ended
December 31, 2018
compared to net income of
$169 million
for the year ended
December 31, 2017
. Our statements of operations for the year ended December 31, 2018 include the results of operations of Impax and Gemini subsequent to May 4, 2018 and May 7, 2018, respectively. For the year ended December 31, 2018, Impax contributed an estimated pre-tax loss of $104 million and Gemini contributed estimated pre-tax income of $10 million.
Our results for the year ended
December 31, 2018
were also impacted by the expenses related to the Combination, which include a charge of $159 million for the accelerated vesting of profit participation units,
$73 million
of additional interest expense,
$56 million
of restructuring charges and asset-related charges,
$35 million
for acquisition, transaction-related and integration expenses,
$28 million
for a transaction-related cash bonus for employees and a
$20 million
for a loss on extinguishment of debt.
48
2017 compared with 2016
We recognized net income of
$169 million
for the year ended
December 31, 2017
, which was a decrease of
$40 million
compared to
$209 million
for the year ended
December 31, 2016
. The decrease was primarily attributable to a 2017 loss on the sale of certain international businesses of $29 million.
Generics
The following table sets forth results of operations for our Generics segment for the years ended
December 31, 2018
,
2017
and
2016
(in thousands):
|
Years Ended December 31,
|
|||||||||||
|
2018
|
2017
|
2016
|
|||||||||
|
Net revenue
|
$
|
1,439,031
|
|
$
|
1,033,654
|
|
$
|
1,018,225
|
|
||
|
Cost of goods sold
|
842,996
|
|
507,476
|
|
420,770
|
|
|||||
|
Gross profit
|
596,035
|
|
526,178
|
|
597,455
|
|
|||||
|
Selling, general and administrative
|
68,426
|
|
56,050
|
|
69,540
|
|
|||||
|
Research and development
|
183,412
|
|
171,420
|
|
179,019
|
|
|||||
|
In-process research and development impairment charges
|
39,259
|
|
—
|
|
—
|
|
|||||
|
Acquisition, transaction-related and integration expenses
|
114,622
|
|
—
|
|
—
|
|
|||||
|
Restructuring and asset-related charges
|
33,943
|
|
—
|
|
—
|
|
|||||
|
Legal settlement gains
|
(22,300
|
)
|
(29,312
|
)
|
(11,000
|
)
|
|||||
|
Intellectual property legal development expenses
|
15,772
|
|
20,518
|
|
25,728
|
|
|||||
|
Operating income
|
$
|
162,901
|
|
$
|
307,502
|
|
$
|
334,168
|
|
||
Net Revenue
2018 compared with 2017
Net revenue for the Generics segment for the year ended December 31, 2018 increased by
39%
, or
$405 million
, to
$1.44 billion
, compared to
$1.03 billion
for the year ended
December 31, 2017
. The acquisition of Impax contributed to revenue growth in 2018. Also contributing to revenue growth in 2018 was approximately $150 million from strong new product launches in the United States ("U.S."), including Methylphenidate Hydrochloride extended release tablets, Phytonadione tablets, Levothyroxine tablets, Potassium Chloride oral solution, Erythromycin instant release tablets and Colesevelam Hydrochloride tablets. These increases were offset by revenue declines in both price and volume in Lidocaine gel, Tobramycin inhalation solution, and Omega-3 Acid capsules. Such revenue declines were partially offset by higher net revenue of Spironolactone tablets, Diclofenac Sodium gel, and Mometasone Furoate nasal spray, all of which primarily benefited from volume growth.
Overall, growth in our existing U.S. base product portfolio, which excluded 2018 new product launches and the impact of the Impax acquisition, was essentially flat, with volume growth of $29 million offset by price declines of $27 million. Our international revenue declined by $16 million year over year, primarily as a result of the divestitures of our Australian business in August 2017 and our Spain and Nordics business in September 2017.
2017 compared with 2016
Net revenue for the Generics segment for the year ended December 31, 2017 increased by
2%
, or
$15 million
, to
$1.03 billion
, compared to
$1.02 billion
for the year ended
December 31, 2016
. New product launches in the U.S. were responsible for a significant portion of our net revenue growth in 2017, with such product launches contributing $193 million in net revenues led by Aspirin-Dipyridamole ER, Oseltamivir, Tepadina Injection, Mometasone Furoate Nasal Spray and Capecitabine.
Our U.S. base product portfolio net revenue, which excluded 2017 new product launches, decreased by $165 million year over year. Lidocaine Ointment, Metaxalone, Fluocinolone and Acyclovir net revenues declined due to market competition on both price and volume, with net revenue attributable to Naproxen Sodium declining due primarily to volume reduction, and net revenue attributable to Ibuprofen and Oxy/APAP declining due primarily to supply constraints. Such net revenue declines were partially offset by higher net revenue of Yuvafem, a generic to Estradiol Vaginal Tablets, and Diclofenac Sodium Gel. Also contributing
49
to the decrease were higher re-procurement charges of $26 million from 2016 to 2017 attributable to supply constraints caused by vendor delays and lower production in our New York-based manufacturing facilities due to renovations. Before re-procurement charges and the erosion of three semi-exclusive products that experienced competition in 2017, our United States base business decreased 9%, which consisted of price declines of 16%, partially offset by volume growth of 7%.
Our international net revenue decreased by $12 million year over year due primarily to the divestitures of our Australian business in August 2017 and our Spain and Nordics businesses in September 2017, partially offset slightly by new product launches in Germany.
Cost of Goods Sold and Gross Profit
2018 compared with 2017
Cost of goods sold for the year ended
December 31, 2018
increased by
$336 million
, or
66%
, to
$843 million
, compared to
$507 million
for the year ended
December 31, 2017
. The acquisition of Impax, as well as new product launches in the U.S., contributed to the increase in cost of goods sold. Cost of goods sold was also impacted by amortization of intangible assets and inventory fair-value step-up arising in purchase accounting of $34 million, excess capacity charges associated with the wind-down of our Hayward, CA manufacturing plant of $28 million, amortization of an up-front payment under a transition agreement of
$10 million
, impairment of a product intangible asset of
$9 million
and write-offs of pre-launch inventory of $9 million.
Accordingly, gross profit for the year ended
December 31, 2018
was
$596 million
, or
41.4%
of net revenue, as compared to gross profit of
$526 million
, or
50.9%
of net revenue, for the year ended
December 31, 2017
. Our gross profit as a percentage of net revenue declined primarily as a result of factors noted above, as well as lower margin products in our Generics segment contributed by the Impax portfolio.
2017 compared with 2016
Cost of goods sold for the year ended
December 31, 2017
was
$507 million
, an increase of
$87 million
compared to the year ended
December 31, 2016
. The increase in cost of goods sold was primarily attributable to optimization expenses. In 2017, Amneal began and completed a project to upgrade certain older manufacturing facilities in New York to optimize its manufacturing footprint. Such optimization expenses were incurred as internal resources and were deployed for these upgrades or were idle and production was lower than capacity. In addition, certain re-procurement charges were incurred as a result of lower production. The manufacturing facility upgrades were completed and these costs are not expected to continue in the future. Additionally, Amneal’s gross margins during the years ended December 31, 2017 were impacted by (i) higher depreciation / lease expense from equipment and capital expenditures and (ii) lower production of certain of Amneal’s products for which API was temporarily unavailable and has since been resolved.
Accordingly, gross profit for the year ended
December 31, 2017
was
$526 million
, or
50.9%
of net revenue compared to gross profit of
$597 million
, or
58.7%
of net revenues for the year ended
December 31, 2016
. The decrease in gross margin for the year ended December 31, 2017 from the same period in 2016 of 8 percentage points was primarily a result of optimization expenses incurred amounting to $24 million or a gross margin decrease of approximately 3 percentage points. In 2017, Amneal began and completed a project to upgrade certain older manufacturing facilities in New York to optimize its manufacturing footprint. Such optimization expenses were incurred as internal resources and were deployed for these upgrades or were idle and production was lower than capacity. In addition, certain re-procurement charges were incurred as a result of lower production. The manufacturing facility upgrades were completed and these costs are not expected to continue in the future. Additionally, Amneal’s gross margins during the years ended December 31, 2017 were impacted by (i) higher depreciation / lease expense from equipment and capital expenditures and (ii) lower production of certain of Amneal’s products for which API was temporarily unavailable and has since been resolved.
Gross profit of Amneal’s products decreased from 2016 to 2017 by approximately 3%. This decrease is primarily the result of (i) lower pricing due to increased competition on certain of Amneal’s products and (ii) price reductions attributable to the continued consolidation of Amneal’s customers. These declines in gross profit were partially offset by Amneal’s launch of certain high-value products.
50
Selling, General, and Administrative
2018 compared with 2017
SG&A expenses for the year ended
December 31, 2018
were
$68 million
compared to
$56 million
for the year ended
December 31, 2017
. The
$12 million
increase was primarily due to the acquisition of Impax, partially offset by savings generated from the prior year divestitures of several international businesses.
2017 compared with 2016
SG&A expenses for the year ended
December 31, 2017
were
$56 million
compared to
$70 million
for the year ended
December 31, 2016
. The $14 million decrease is primarily due to lower sales expenses and salaries and benefits as a result of the divestitures of Amneal’s Australian business in August 2017 and Spain and Nordics businesses in September 2017, and additional resources that were converted to research and development activities in Ireland to support inhalation products. These declines were partially offset by higher freight costs.
Research and Development
2018 compared with 2017
Research and development expenses for the year ended
December 31, 2018
were
$183 million
compared to
$171 million
for the year ended
December 31, 2017
. The $12 million increase from the prior year was primarily due to the acquisition of Impax.
2017 compared with 2016
Research and development expenses for the year ended
December 31, 2017
were
$171 million
compared to
$179 million
for the year ended
December 31, 2016
. The
$8 million
decrease was the result of lower material and supplies costs, lower external development costs due to the timing of certain projects, and lower exhibit batch product costs as more of Amneal’s projects in 2017 were performed in India, which has lower production costs compared to the United States. This decrease was partially offset by higher patient study (bio-equivalence) costs due to timing of such studies, and salaries and benefits to support escalating the development of inhalation products in Ireland.
In-Process Research and Development Impairment Charges
For the year ended December 31, 2018, we recognized in-process research and development impairment charges of
$39 million
associated with reevaluating two projects due to changes in our key valuation metrics, (i.e. expected growth rates, market size, delayed launch date or unforeseen legal/regulatory risks). There were no in-process research and development impairment charges in 2017 or 2016.
Acquisition, Transaction-Related and Integration Expenses
Acquisition, transaction-related and integration expenses were
$115 million
for the year ended December 31, 2018. Acquisition, transaction-related and integration expenses are comprised of a $98 million charge for the accelerated vesting of certain of Amneal's profit participation units that occurred prior to the closing of the Combination and $16 million for a transaction-related cash bonus for employees of Amneal for service prior to the closing of the Combination. There were no acquisition, transaction-related and integration expenses in 2017 or 2016. For additional information, see
Note 7.
A
cquisition, Transaction-Related and Integration Expenses
.
Restructuring and Asset-Related Expenses
Restructuring and asset-related charges of
$34 million
for the year ended December 31, 2018 were comprised of $23 million in employee separation charges related to a reduction in workforce resulting from the Combination and $11 million in asset-related charges associated with the closing of our Hayward, California based operations. There were no restructuring and asset-related expenses in 2017 or 2016.
Legal Settlement Gains
Legal settlement gains of $22 million for the year ended December 31, 2018 primarily related to settlements with several innovators of branded pharmaceutical products.
51
Legal settlement gains of $29 million for the year ended December 31, 2017 were primarily related to a settlement with the innovator of Suboxone for $21 million, net of legal fees, and reimbursement of legal fees from Kashiv Pharmaceuticals, LLC, a related party, for the termination and settlement of an agreement to develop Oxycodone HCL oral tablets of $8 million.
Legal settlement gains of $11 million for the year ended December 31, 2016 primarily related to the settlement of patent infringement matters on certain products.
Intellectual Property Legal Development Expenses
2018 compared with 2017
Intellectual property legal development expenses for the year ended
December 31, 2018
were
$16 million
, compared to
$21 million
for the year ended
December 31, 2017
. The
$5 million
decrease was primarily due to reduced expenses related to trials on patent challenges during 2018. These costs include, but are not limited to, formulation assessments, patent challenge opinions and strategy, and litigation expenses to defend the intellectual property.
2017 compared with 2016
Intellectual property legal development expenses for the year ended
December 31, 2017
were
$21 million
, compared to
$26 million
for the year ended
December 31, 2016
. The
$5 million
decrease was the result primarily of reduced expenses related to trials on patent challenges during 2017.
Specialty
The following table sets forth results of operations for our Specialty segment for the years ended
December 31, 2018
,
2017
and
2016
(in thousands):
|
Years Ended December 31,
|
|||||||||||
|
2018
|
2017
|
2016
|
|||||||||
|
Net revenue
|
$
|
223,960
|
|
$
|
—
|
|
$
|
—
|
|
||
|
Cost of goods sold
|
103,592
|
|
—
|
|
—
|
|
|||||
|
Gross profit
|
120,368
|
|
—
|
|
—
|
|
|||||
|
Selling, general and administrative
|
49,465
|
|
—
|
|
—
|
|
|||||
|
Research and development
|
10,778
|
|
—
|
|
—
|
|
|||||
|
Restructuring and asset-related charges
|
4,076
|
|
—
|
|
—
|
|
|||||
|
Intellectual property legal development expenses
|
489
|
|
—
|
|
—
|
|
|||||
|
Operating income
|
$
|
55,560
|
|
$
|
—
|
|
$
|
—
|
|
||
Our Specialty segment is comprised of the Impax Specialty business acquired on May 4, 2018 and the Gemini business acquired on May 7, 2018. Prior to these two transactions, we did not have a Specialty segment. Refer to
Note 3. Acquisitions and Divestitures
for further information related to these two transactions.
Liquidity and Capital Resources
Our primary source of liquidity is cash generated from operations, available cash and borrowings under debt financing arrangements, including $398 million of available capacity on our revolving credit facility. We believe these sources are sufficient to fund our planned operations, meet our interest and contractual obligations and provide sufficient liquidity over the next 12 months. However, our ability to satisfy our working capital requirements and debt obligations will depend upon economic conditions and demand for our products, which are factors that may be out of our control.
Our primary uses of capital resources are to fund operating activities, including research and development expenses associated with new product filings, and pharmaceutical product manufacturing expenses, license payments, and spending on production facility expansions and capital equipment items.
52
Over the next 12 months, we will make substantial payments for monthly interest and quarterly principal amounts due on our Senior Secured Credit Facilities, severance, and capital expenditures. We will also be required to make a $50 million payment to JSP 30 days after our first commercial sale of Levothyroxine pursuant to the terms of a license and supply agreement, as described in
Note 5. Alliance and Collaboration
. Given the magnitude of projected expenditures, we may require additional funds from our ABL to meet these increased cash needs in the next year.
We are party to a tax receivable agreement that requires us to make cash payments to Holdings in respect of certain tax benefits that we may realize or may be deemed to realize as a result of redemptions or exchanges of Amneal common units by Holdings. The tax receivable agreement also requires that we make an accelerated payment to Holdings equal to the present value of all future payments due under the agreement upon certain change of control and similar transactions. The timing of any payments under the tax receivable agreement will vary depending upon a number of factors, but we expect that the payments could be substantial, and could be in excess of the tax savings that we ultimately realize. Because of the foregoing, our obligations under the tax receivable agreement could have a substantial negative impact on our liquidity.
See Item 1A. Risk Factors and Note 8. Income Taxes
.
In addition, pursuant to the limited liability operating agreement of Amneal, in connection with any tax period, Amneal will be required to make distributions to its members, on a pro rata basis in proportion to the number of Amneal Common Units held by each member, of cash until each member (other than the Company) has received an amount at least equal to its assumed tax liability and the Company has received an amount sufficient to enable it to timely satisfy all of its U.S. federal, state and local and non-U.S. tax liabilities, and meet its obligations pursuant to the tax receivable agreement. For the year ended December 31, 2018, Amneal made an aggregate of $36 million in tax distributions to Holdings, with an additional $13 million due to Holdings as of December 31, 2018.
At
December 31, 2018
, our cash and cash equivalents consist of cash on deposit and highly liquid investments. A portion of our cash flows are derived outside the United States. As a result, we are subject to market risk associated with changes in foreign exchange rates. We maintain cash balances at both U.S. based and foreign country based commercial banks. At various times during the year, our cash balances held in the United States may exceed amounts that are insured by the Federal Deposit Insurance Corporation ("FDIC"). We make our investments in accordance with our investment policy. The primary objectives of our investment policy are liquidity and safety of principal.
Cash Flows
Cash Flows from Operating Activities
Our net cash provided by operating activities was
$250 million
for the year ended
December 31, 2018
, as compared to
$234 million
for the year ended
December 31, 2017
. The increase of
$16 million
in net cash provided by operating activities was primarily attributed to increased collections of trade accounts receivable arising from the Impax and Gemini businesses, partially offset by higher disbursements associated with the Combination, which include acquisition, severance and other integration related costs.
Our net cash provided by operating activities was
$234 million
for the year ended
December 31, 2017
, as compared to net cash provided by operating activities of
$115 million
for the year ended
December 31, 2016
. The increase of
$119 million
in net cash provided by operating activities was primarily due to strong collection of trade accounts receivable and an increase in accounts payable and accrued expenses as a result of the timing of cash disbursements for inventory and capital expenditures, which was partially offset by a reduction in net income adjusted for non-cash expenditures, higher prepaid expenses and other current assets due primarily to goods and service tax prepayments in India, export incentives in India and a royalty stream that was prepaid on a license with a related-party, and higher related-party receivables from a development contract settlement.
Cash Flows from Investing Activities
Our net cash used in investing activities was
$396 million
for the year ended
December 31, 2018
, as compared to
$99 million
for the year ended
December 31, 2017
. The increase in net cash used in investing activities of
$298 million
was primarily attributed to the acquisitions of Impax and Gemini, the acquisition of Estradiol products rights from Kashiv, and the proceeds received on the sale of certain international businesses in 2017, partially offset by lower capital expenditures and proceeds from the sales of property, plant, and equipment.
Our net cash used in investing activities was
$99 million
for the year ended
December 31, 2017
, as compared to
$125 million
for the year ended
December 31, 2016
. The decrease in net cash used in investing activities of
$26 million
was primarily attributed
53
to a decrease in purchases of property, plant and equipment due to completing the expansion of certain facilities, and the proceeds received on the sale of certain international businesses, partially offset by an increase in the acquisition of product rights.
Cash Flows from Financing Activities
Our net cash provided by financing activities was
$288 million
for the year ended
December 31, 2018
, as compared to net cash used in financing activities of
$95 million
for the year ended
December 31, 2017
. The increase of
$383 million
was primarily related to an increase in net new borrowings, equity contributions, and lower distributions to members, partially offset by payment of a related party note and the acquisition of a redeemable non-controlling interest in one of Amneal's subsidiaries.
Our net cash used in financing activities was
$95 million
for the year ended
December 31, 2017
, as compared to net cash used in financing activities of
$19 million
for the year ended
December 31, 2016
. The increase of
$76 million
was primarily related to equity distributions, partially offset by proceeds from increases in borrowings under Amneal’s term and revolving loan facilities.
Commitments and Contractual Obligations
Our contractual obligations as of
December 31, 2018
were as follows (in thousands):
|
|
Payments Due by Period
|
|||||||||||||||||||
|
Contractual Obligations
|
Total
|
Less
Than 1 Year |
1-3
Years |
3-5
Years |
More
Than 5 Years |
|||||||||||||||
|
Bank term loan and other
|
$
|
2,686,500
|
|
$
|
27,000
|
|
$
|
54,000
|
|
$
|
54,000
|
|
$
|
2,551,500
|
|
|||||
|
Interest payments on bank term loan
(1)
|
971,851
|
|
157,435
|
|
310,112
|
|
453,271
|
|
51,033
|
|
||||||||||
|
Operating lease obligations
(2)
|
97,561
|
|
25,885
|
|
23,176
|
|
20,372
|
|
28,128
|
|
||||||||||
|
Financing obligation - related party
(3)
|
134,566
|
|
5,474
|
|
10,948
|
|
10,948
|
|
107,196
|
|
||||||||||
|
Levothyroxine transition payment
|
3,816
|
|
3,816
|
|
—
|
|
—
|
|
—
|
|
||||||||||
|
Open purchase order commitments
|
65,302
|
|
31,078
|
|
34,224
|
|
—
|
|
—
|
|
||||||||||
|
Total
|
$
|
3,959,596
|
|
$
|
250,688
|
|
$
|
432,460
|
|
$
|
538,591
|
|
$
|
2,737,857
|
|
|||||
(1)
Interest on existing bank term loan was calculated based on applicable rates at December 31, 2018.
(2)
Amounts represent future minimum rental payments under non-cancelable leases for certain facilities and machinery and equipment.
(3)
Amounts represent future minimum rental payments under non-cancelable financing obligation for a production facility in NY.
The foregoing table does not include milestone payments potentially payable by Amneal under its collaboration agreements and licenses. Such milestone payments are dependent upon the occurrence of specific and contingent events, and not the passage of time. Significant transactions including milestones are as follows:
Levothyroxine License and Supply Agreement; Transition Agreement
On August 16, 2018, we entered into a license and supply agreement with Jerome Stevens Pharmaceuticals, Inc. ("JSP") for levothyroxine sodium tablets ("Levothyroxine"). We will be JSP's exclusive commercial partner in the U.S. market for a 10-year term commencing on March 22, 2019. We will be required to make a payment of
$50 million
to JSP 30 days after our first commercial sale of Levothyroxine. Additionally, the agreement requires us to make an additional
$20 million
payment to JSP if the Food and Drug Administration ("FDA") has not given final approval to third-party competitor's abbreviated new drug application for generic levothyroxine sodium tablets with an AB1, AB2, AB3 or AB4 designation by the first anniversary date of our first sale of Levothyroxine. During January 2019, the FDA approved a third-party competitor's abbreviated new drug application for generic levothyroxine with an AB2 designation. Therefore, we do not believe that we will be required to make the additional $20 million payment to JSP. In addition, the agreement provides for us to pay a share of the net profits of our sales of Levothyroxine, after considering product costs. We will not be required to make any payments to JSP prior to March 22, 2019.
On November 9, 2018, we entered into a transition agreement with Lannett Company (“Lannett”) and JSP. Under the terms of the agreement, we assumed the distribution and marketing of Levothyroxine from Lannett beginning December 1, 2018 through March 22, 2019, ahead of the commencement date of the license and supply agreement with JSP described above.
54
We made a $43 million non-refundable upfront profit-sharing payment to Lannett in December 2018. During the fourth quarter of 2018, we recognized $10 million of the $47 million transition contract asset to cost of goods sold. As of December 31, 2018, we have a remaining $36 million transition contract asset in prepaid expenses and other current assets and a $4 million transition contract liability in accounts payable and accrued expenses.
In February 2019, we made the remaining $4 million payment to fully settle the remaining non-refundable amount owed to Lannett under the Transition Agreement.
Adello License and Commercialization Agreement
On October 1, 2017, Amneal and Adello Biologics, LLC ("Adello"), a related party, entered into a license and commercialization agreement. Adello granted Amneal an exclusive license, under Adello's NDA, to distribute and sell two bio-similar products in the United States. Adello is responsible for development, regulatory filings, obtaining FDA approval, and manufacturing, and Amneal is responsible for marketing, selling and pricing activities. The term of the agreement is 10 years from the applicable product’s launch date.
In connection with the agreement, Amneal paid an upfront amount of approximately $2 million in October 2017 for execution of the agreement. The agreement also provides for potential future milestone payments to Adello of (i) up to $21 million relating to regulatory approval, (ii) up to $43 million for successful delivery of commercial launch inventory, (iii) between $20 million and $50 million relating to number of competitors at launch for one product, and (iv) between $15 million and $68 million for the achievement of cumulative net sales for both products. The milestones are subject to certain performance conditions, which may or may not be achieved, including FDA filing, FDA approval, launch activities and commercial sales volume objectives. In addition, the agreement provides for Amneal to pay a profit share equal to 50% of Net Profits, after considering manufacturing and marketing costs.
Outstanding Debt Obligations
Term Loan and Revolving Credit Agreements
On May 4, 2018 we entered into a senior credit agreement that provided a term loan ("Term Loan") with a principal amount of $2.7 billion and an asset backed credit facility ("ABL") under which loans and letters of credit up to a principal amount of $500 million are available (principal amount of up to $25 million is available for letters of credit) (collectively, the "Senior Secured Credit Facilities"). The term loan is repayable in equal quarterly installments at a rate of 1.00% of the original principal amount annually, with the balance payable at maturity on May 4, 2025. The Term Loan bears a variable annual interest rate, which is one-month LIBOR plus 3.5% at
December 31, 2018
. The ABL bears an annual interest rate of one-month LIBOR plus 1.5% at
December 31, 2018
and matures on May 4, 2023. As of September 30, 2018, the annual interest rate for the ABL may be reduced or increased by 0.25% based on step-downs and step-ups determined by the average historical excess availability. At
December 31, 2018
, we had no outstanding borrowings under the ABL.
The proceeds of any loans made under the Senior Secured Credit Facilities can be used for capital expenditures, acquisitions, working capital needs and other general purposes, subject to covenants as described below. We pay a commitment fee based on the average daily unused amount of the ABL at a rate based on average historical excess availability, between 0.25% and 0.375% per annum. At
December 31, 2018
, the ABL commitment fee rate is 0.375% per annum.
The Senior Secured Credit Facilities contain a number of covenants that, among other things, create liens on Amneal's and its subsidiaries' assets. The Senior Secured Credit Facilities contain certain negative covenants that, among other things and subject to certain exceptions, restrict Amneal’s and its subsidiaries' ability to incur additional debt or guarantees, grant liens, make loans, acquisitions or other investments, dispose of assets, merge, dissolve, liquidate or consolidate, pay dividends or other payments on capital stock, make optional payments or modify certain debt instruments, modify certain organizational documents, enter into arrangements that restrict the ability to pay dividends or grant liens, or enter into or consummate transactions with affiliates. The ABL Facility also includes a financial covenant whereby Amneal must maintain a minimum fixed charge coverage ratio if certain borrowing conditions are met. The Senior Secured Credit Facilities contain customary events of default, subject to certain exceptions. Upon the occurrence of certain events of default, the obligations under the Senior Secured Credit Facilities may be accelerated and the commitments may be terminated. At December 31, 2018, Amneal was in compliance with all covenants under the Senior Secured Credit Facility.
Off-Balance Sheet Arrangements
We did not have any off-balance sheet arrangements as of
December 31, 2018
.
55
Critical Accounting Policies
Our significant accounting policies are described in
Note 2. Summary of Significant Accounting Policies
.
Included within these policies are certain policies which contain critical accounting estimates and, therefore, have been deemed to be “critical accounting policies.” Critical accounting estimates are those which require management to make assumptions about matters that were uncertain at the time the estimate was made and for which the use of different estimates, which reasonably could have been used, or changes in the accounting estimates that are reasonably likely to occur from period to period could have a material impact on our financial condition or results of operations. We have identified the following to be our critical accounting policies: sales-related deductions, impairment of goodwill and intangible assets, income taxes and contingencies.
Sales-Related Deductions
Our gross product revenue is subject to a variety of deductions, which are estimated and recorded in the same period that the revenue is recognized, and primarily represent chargebacks, rebates, group purchasing organization fees, prompt payment (cash) discounts, consideration payable to the customer, billbacks, Medicaid and other government pricing programs, price protection and shelf stock adjustments, sales returns and profit shares. Those deductions represent estimates of rebates and discounts related to gross sales for the reporting period and, as such, knowledge and judgment of market conditions and practice are required when estimating the impact of these revenue deductions on gross sales for a reporting period.
Historically, our changes of estimates reflecting actual results or updated expectations have not been material to our overall business. Product-specific rebates, however, may have a significant impact on year-over-year individual product growth trends. If any of our ratios, factors, assessments, experiences or judgments are not indicative or accurate predictors of our future experience, our results could be materially affected. The sensitivity of our estimates can vary by program, type of customer and geographic location. However, estimates associated with governmental allowances, Medicaid and other performance-based contract rebates are most at risk for material adjustment because of the extensive time delay between the recording of the accrual and its ultimate settlement, an interval that can generally range up to one year. Because of this time lag, in any given quarter, our adjustments to actual can incorporate revisions of several prior quarters.
Impairment of Goodwill and Intangible Assets
Goodwill
Goodwill, which represents the excess of purchase price over the fair value of net assets acquired, is carried at cost. Goodwill is not amortized; rather, it is subject to a periodic assessment for impairment by applying a fair value based test. We review goodwill for possible impairment annually during the fourth quarter, or whenever events or circumstances indicate that the carrying amount may not be recoverable. We performed our most recent annual impairment test on October 1, 2018.
The impairment model prescribes a two-step method for determining goodwill impairment. However, an entity is permitted to first assess qualitative factors to determine whether the two-step goodwill impairment test is necessary. The qualitative factors considered by us may include, but are not limited to, general economic conditions, our outlook, market performance of our industry and recent and forecasted financial performance. Further testing is only required if the entity determines, based on the qualitative assessment, that it is more likely than not that a reporting unit’s fair value is less than its carrying amount. Otherwise, no further impairment testing is required. In the first step, we determine the fair value of the reporting unit using a discounted cash flow analysis. If the net book value of the reporting unit exceeds its fair value, we then perform the second step of the impairment test, which requires allocation of the reporting unit’s fair value to all of its assets and liabilities using the acquisition method prescribed under authoritative guidance for business combinations with any residual fair value being allocated to goodwill. An impairment charge is recognized when the implied fair value of a reporting unit’s goodwill is less than its carrying amount.
Goodwill is allocated and evaluated for impairment at the reporting unit level, which is defined as an operating segment or one level below an operating segment. We have two reportable segments, Generics and Specialty, which are the same as the respective operating segments and reporting units. As of December 31, 2018, $360 million and $66 million of goodwill was allocated to our Specialty and Generics segments, respectively.
Significant judgment is employed in determining the assumptions utilized as of the acquisition date and for each subsequent measurement period. Accordingly, changes in assumptions described above, could have a material impact on our consolidated results of operations.
56
For each of our reporting units, there are a number of future events and factors that may impact future results and the outcome of subsequent goodwill impairment testing. For a list of these factors, see Item 1A.
Risk Factors
.
Intangible Assets
We review our long-lived assets, including intangible assets with finite lives, for recoverability whenever events or changes in circumstances indicate that the carrying amount of the assets may not be fully recoverable. We evaluate assets for potential impairment by comparing estimated future undiscounted net cash flows to the carrying amount of the asset. If the carrying amount of the assets exceeds the estimated future undiscounted cash flows, impairment is measured based on the difference between the carrying amount of the assets and fair value which is generally an expected present value cash flow technique. Our policy in determining whether an impairment indicator exists comprises measurable operating performance criteria as well as other qualitative measures. Events giving rise to impairment are an inherent risk in the pharmaceutical industry and cannot be predicted. Factors that we consider in deciding when to perform an impairment review include significant under-performance of a product in relation to expectations, significant negative industry or economic trends, and significant changes or planned changes in our use of the assets. If our assumptions are not correct, there could be an impairment loss in subsequent periods or, in the case of a change in the estimated useful life of the asset, a change in amortization expense.
For the year ended December 31, 2018, the Company recognized a total of
$48 million
of intangible asset impairment charges, of which
$9 million
was recognized in cost of goods sold and
$39 million
was recognized in in-process research and development. The impairment charge recognized in costs of goods sold was related to products in the Generics segment and almost entirely related to
one
product. The impairment charges were primarily the result of a loss of a customer for a marketed product during the third quarter of 2018, resulting in significantly lower expected future cash flows. The in-process research and development impairment charges were related to the Generics segment and related primarily to
two
products. The impairment charges were primarily the result of a loss of forecasted market share of the
two
products during the fourth quarter of 2018.
Intangible assets with indefinite lives, including in-process research and development (“IPR&D”), are tested for impairment if impairment indicators arise and, at a minimum, annually. However, an entity is permitted to first assess qualitative factors to determine if a quantitative impairment test is necessary. Further testing is only required if the entity determines, based on the qualitative assessment, that it is more likely than not that an indefinite-lived intangible asset’s fair value is less than its carrying amount. Otherwise, no further impairment testing is required. The indefinite-lived intangible asset impairment test consists of a one-step analysis that compares the fair value of the intangible asset with its carrying amount. If the carrying amount of an intangible asset exceeds its fair value, an impairment loss is recognized in an amount equal to that excess. We consider many factors in evaluating whether the value of its intangible assets with indefinite lives may not be recoverable, including, but not limited to, expected growth rates, the cost of equity and debt capital, general economic conditions, our outlook and market performance of our industry and recent and forecasted financial performance.
Income Taxes
We record valuation allowances against our deferred tax assets when it is more likely than not that all or a portion of a deferred tax asset will not be realized. We routinely evaluate the realizability of our deferred tax assets by assessing the likelihood that our deferred tax assets will be recovered based on all available positive and negative evidence, including scheduled reversals of deferred tax liabilities, estimates of future taxable income, tax planning strategies and results of operations. Estimating future taxable income is inherently uncertain and requires judgment. In projecting future taxable income, we consider our historical results and incorporate certain assumptions, including projected new product launches, revenue growth, and operating margins, among others. As of December 31, 2018, we had $357 million of deferred tax assets related to the Combination. We have not recorded an allowance on those deferred tax assets because we concluded, based on the weight of all available positive and negative evidence, those deferred tax assets recorded as part of the Combination are more likely than not to be realized. We maintain a valuation allowance against certain of our foreign jurisdiction tax attributes.
We expect to realize future tax benefits related to the utilization of these assets. If we determine in the future that we will not be able to fully utilize all or part of these deferred tax assets, we would record a valuation allowance through earnings in the period the determination was made, which could have an adverse effect on our results of operations and earnings in future periods.
As described in
Note 8. Income Taxes
, we are a party to a tax receivable agreement ("TRA") under which we are generally required to pay to the other holders of Amneal Common Units 85% of the applicable tax savings, of any, in U.S. federal and state income tax that the Company is deemed to realize as a result of certain tax attributes of their Amneal Common Units sold to the Company (or exchanged in a taxable sale) and that are created as a result of (i) the sales of their Amneal Common Units for shares of Class A common stock and (ii) tax benefits attributable to payments made under the tax receivable agreement (including imputed interest). In connection with the exchanges which occurred as part of the PIPE Investment and the Closing
57
Date Redemption (see
Note 1. Nature of Operations and Basis of Presentation)
, we recorded a TRA liability. At December 31, 2018, we had a
$193 million
TRA liability. Such amounts will be paid when such deferred tax assets are realized as a reduction to income taxes due or payable.
Amounts payable under the TRA are contingent upon, among other things, (i) generation of future taxable income over the term of the TRA and (ii) future changes in tax laws. If we do not generate sufficient taxable income in the aggregate over the term of the TRA to utilize the tax benefits, then we would not be required to make the related TRA payments. Therefore, we would only recognize a liability for TRA payments if we determine if it is probable that we will generate sufficient future taxable income over the term of the TRA to utilize the related tax benefits. Estimating future taxable income is inherently uncertain and requires judgment. In projecting future taxable income, we consider our historical results and incorporate certain assumptions, including projected new product launches, revenue growth, and operating margins, among others. If we determine in the future that we will not be able to fully utilize all or part of the related tax benefits, we would derecognize the portion of the liability related the benefits not expected to be utilized.
Contingencies
We are involved in various litigation, government investigations and other legal proceedings that arise from time to time in the ordinary course of business. Our legal proceedings are complex, constantly evolving and subject to uncertainty. As such, the Company cannot predict the outcome or impact of our legal proceedings.
While the Company believes it has valid claims and/or defenses to the matters described below, the nature of litigation is unpredictable and the outcome of the following proceedings could include damages, fines, penalties and injunctive or administrative remedies. For any proceedings where losses are probable and reasonably capable of estimation, the Company accrues for a potential loss. While these accruals have been deemed reasonable by the Company’s management, the assessment process relies heavily on estimates and assumptions that may ultimately prove inaccurate or incomplete. Additionally, unforeseen circumstances or events may lead the Company to subsequently change its estimates and assumptions. The process of analyzing, assessing and establishing reserve estimates relative to legal proceedings involves a high degree of judgment.
Although the outcome and costs of the asserted and unasserted claims is difficult to predict, based on the information presently known to management, the Company does not currently expect the ultimate liability, if any, for such matters to have a material adverse effect on its business, financial condition, results of operations, or cash flows.
For further details, see
Note 18. Commitments and Contingencies
.
Recently Issued Accounting Standards
Recently issued accounting standards are discussed in
Note 2. Summary of Significant Accounting Policies
.
Item 7A. Quantitative and Qualitative Disclosures About Market Risk
Our cash is held on deposit in demand accounts at large financial institutions in amounts in excess of the FDIC insurance coverage limit of $250,000 per depositor, per FDIC-insured bank, per ownership category. Our cash equivalents are comprised of highly rated money market funds. We had no short-term investments as of
December 31, 2018
or
December 31, 2017
.
Financial instruments that potentially subject us to concentrations of credit risk consist principally of cash equivalents and accounts receivable. We limit our credit risk associated with cash equivalents by placing investments with high credit quality securities, including U.S. government securities, treasury bills, corporate debt, short-term commercial paper and highly rated money market funds. As discussed above in
Item 7. Management's Discussion and Analysis of Financial Condition and Results of Operations
, we are party to a Term Loan with a principal amount of $2.7 billion and an ABL under which loans and letters of credit up to a principal amount of $500 million are available (principal amount of up to $25 million is available for letters of credit) pursuant to the Senior Secured Credit Facilities. The proceeds for any loans made under our Senior Secured Credit Facility are available for capital expenditures, acquisitions, working capital needs and other general corporate purposes.
We limit our credit risk with respect to accounts receivable by performing credit evaluations when deemed necessary. We do not require collateral to secure amounts owed to us by our customers.
By the nature of our global operations, we are exposed to cash flow and earnings fluctuations resulting from foreign exchange rate variation. These exposures are transactional and translational in nature. Since we manufacture and sell our products throughout the world, we believe our foreign currency risk is diversified. Principal drivers of this diversified foreign exchange exposure include the European Euro, British Pound, Indian Rupee, and the Swiss Franc. Our transactional exposure arises from the purchase and sale of goods and services in currencies other than the functional currency of our operational units. We also have exposure related to the translation of financial statements of our foreign divisions into U.S. dollars, our functional currency. The financial statements of our operations outside the U.S. are measured using the local currency as the functional currency. Adjustments to translate the assets and liabilities of these foreign operations into U.S. dollars are accumulated as a component of other comprehensive income/(loss). Transaction gains and losses are included in the determination of our net income in our consolidated
58
statements of operations. Such foreign currency transaction gains and losses include fluctuations related to long term intercompany loans that are payable in the foreseeable future.
Inflation has not had a significant impact on our revenues or operations to date and we do not believe that inflation will have a significant impact on our revenues or operations for 2019.
In the normal course of operations, we are exposed to market risks relating to our long-term debt arising from adverse changes in interest rates. Market risk is defined for these purposes as the potential change in the fair value of a financial asset or liability resulting from an adverse movement in interest rates. Changes in interest rates impact fixed and variable rate debt differently. For fixed rate debt, a change in interest rates will impact only the fair value of the debt, whereas for variable rate debt, a change in the interest rates will impact interest expense and cash flows. At December 31, 2018, we had no fixed rate debt and
$2.7 billion
of variable rate debt. Increases or decreases in interest rates would affect our annual interest expense. Based upon our principal amount of long-term debt outstanding at December 31, 2018, a hypothetical 1.0% increase or decrease in interest rates would have affected our annual interest expense by approximately $18 million. We may enter into interest rate swaps to manage the impact of interest rate changes. There were no outstanding interest rate swap agreements as of December 31, 2018 or 2017.
Item 8. Financial Statements and Supplementary Data
The consolidated financial statements listed in
Item 15. Exhibits, Financial Statement Schedules
are filed as part of this Annual Report on Form 10-K and incorporated by reference herein.
Item 9. Changes in and Disagreements with Accountants on Accounting and Financial Disclosure
Not applicable.
Item 9A. Controls and Procedures
Disclosure Controls and Procedures
We maintain disclosure controls and procedures (as defined in Rule 13a-15(e) of the Exchange Act) that are designed to ensure information required to be disclosed by us in reports that we file or submit under the Exchange Act is recorded, processed, summarized and reported within the time periods specified in the SEC’s rules and forms, and that such information is accumulated and communicated to our management, including our Chief Executive Officer and Chief Financial Officer, as appropriate, to allow timely decisions regarding required disclosure.
Our management, with the participation of our Chief Executive Officer and Chief Financial Officer, evaluated the effectiveness of the design and operation of our disclosure controls and procedures as of the end of the period covered by this Annual Report on Form 10-K as required by Rule 13a-15(b). Based upon that evaluation, our Chief Executive Officer and Chief Financial Officer concluded that our disclosure controls and procedures were effective as of
December 31, 2018
at the reasonable assurance level.
Management's Report on Internal Control Over Financial Reporting
Our management is responsible for establishing and maintaining adequate internal control over financial reporting (as defined in Rule 13a-15(f) under the Exchange Act). Management conducted an assessment of the effectiveness of our internal control over financial reporting based on the criteria set forth in Internal Control - Integrated Framework issued by the Committee of Sponsoring Organizations of the Treadway Commission (2013 framework). Based on the assessment, management has concluded that our internal control over financial reporting was effective as of December 31, 2018.
Changes in Internal Control over Financial Reporting
During the quarter ended
December 31, 2018
, there were no changes in our internal control over financial reporting which materially affected, or are reasonably likely to materially affect, our internal control over financial reporting.
Limitation on Effective Controls
Management, including the Chief Executive Officer and Chief Financial Officer, does not expect that our disclosure controls and procedures or its system of internal control over financial reporting will prevent or detect all errors and all fraud. A control system, no matter how well designed or operated, can provide only reasonable, but not absolute, assurance that the objectives of the system of internal control are met. The design of our control system reflects the fact that there are resource constraints, and that the benefits of such control system must be considered relative to their costs. Further, because of the inherent limitations in all control systems, no evaluation of controls can provide absolute assurance that all control failures and instances of fraud, if any, within the Company have been detected. These inherent limitations include the realities that judgments in decision-making can be faulty and that breakdowns can occur because of simple error or mistake. Additionally, controls can be circumvented by the intentional acts of individuals, by collusion of two or more people, or by management override of the controls. The design of any system of controls is also based in part on certain assumptions about the likelihood of future events, and there can be no assurance that the design of any particular control will always succeed in achieving its objective under all potential future conditions.
Item 9B. Other Information
As previously announced, Bryan M. Reasons stepped down from his role as Senior Vice President and Chief Financial Officer of the Company effective as of January 22, 2019. On February 28, 2019, in connection with his termination of employment with the Company as of such date, the Company and Mr. Reasons entered into a separation agreement (the “Separation Agreement”). Pursuant to the Separation Agreement, and in consideration of Mr. Reasons’ execution of a release of claims in favor of the Company and his continued compliance with certain restrictive covenants, Mr. Reasons will receive (i) severance payments totaling $1,947,549.70, $374,528.79 of which is payable on May 3, 2019 and the remainder is to be paid in 21 substantially equal installments thereafter on the Company’s regular payroll dates; (ii) a payment of $298,616.23, less payroll deductions and withholdings, on March 8, 2019, which constitutes Mr. Reasons' annual incentive bonus for fiscal year 2018 based on actual performance for the year, as determined by the Company’s Board of Directors, and (iii) additional monthly payments or reimbursement in an amount of the cost of monthly premiums for Mr. Reasons’ and his covered dependents’ coverage under the Company’s group health plans during the period beginning on February 28, 2019 and ending on the earlier of (a) February 28,
59
2021, (b) the date Mr. Reasons becomes eligible for comparable coverage under another employer’s group health plan(s) or (c) the date Mr. Reasons is no longer eligible for COBRA. The Separation Agreement also provides for the exercisability of Mr. Reasons’ vested options until February 28, 2020.
The foregoing summary of the Separation Agreement does not purport to be complete and is qualified in its entirety by reference to the Separation Agreement, a copy of which is filed as Exhibit 10.19 hereto and is incorporated by reference herein.
PART III.
Item 10. Directors, Executive Officers and Corporate Governance
The information required in this Item 10 will be included in the following sections in the 2019 Proxy Statement, which sections are incorporated in this Item 10 by reference: “Proposal No. 1-Election of Directors,” “Our Management,” “Section 16(a) Beneficial Ownership Reporting Compliance,” “Committees of the Board of Directors” and “Audit Committee.”
Code of Business Conduct for Principal Executive Officer, Principal Financial Officer and Principal Accounting Officer
. We have adopted a Code of Business Conduct that applies to all of our employees, officers and directors. The full text of our Code of Business Conduct is available at the investors section of our website, http://investors.amneal.com. We intend to disclose any amendment to, or waiver from, a provision of the Code of Business Conduct that applies to our principal executive officer, principal financial officer or principal accounting officer in the investors section of our website.
Item 11. Executive Compensation
The information required in this Item 11 will be included in the following sections in the 2019 Proxy Statement, which sections are incorporated in this Item 11 by reference: “Compensation Discussion and Analysis,” “Executive Compensation,” “Director Compensation,” “The Board’s Role in Risk Oversight,” “Compensation Committee Interlocks and Insider Participation” and “Report of the Compensation Committee.” Notwithstanding the foregoing, the information in the section entitled “Report of the Compensation Committee” is only “furnished” herein and shall not be deemed “filed” for purposes of Section 18 of the Exchange Act.
Item 12. Security Ownership of Certain Beneficial Owners and Management and Related Stockholder Matters
Except as set forth below, the information required in this Item 12 will be included in the section entitled “Beneficial Ownership” in the 2019 Proxy Statement, which section is incorporated in this Item 12 by reference.
Securities Authorized for Issuance Under Equity Compensation Plans.
The following table summarizes information, as of December 31, 2018, relating to the Amneal Pharmaceuticals, Inc. 2018 Incentive Award Plan, which was approved by the Company’s stockholders and which authorizes the grant of stock options, stock appreciation rights, restricted stock awards, restricted stock unit awards, other stock or cash based awards and dividend equivalent awards to employees, non-employee directors and consultants.
60
Equity Compensation Plan Information
|
Plan Category
|
Number of securities to
be issued upon exercise
of outstanding options,
warrants and rights
(a)
|
Weighted-average
exercise price of
outstanding options,
warrants and rights
(b)
|
Number of securities
remaining available for
future issuance under
equity compensation
plans (excluding
securities reflected in
column (a))
(c)
|
|
Equity compensation plans approved by security holders
|
7,145,205
(1)
|
17.73
(2)
|
18,292,841
|
|
Equity compensation plans not approved by security holders
|
—
|
—
|
—
|
|
Total
|
7,145,205
|
17.73
|
18,292,841
|
(1)
Equity compensation plans approved by security holders which are included in column (a) of the table are the 2018 Incentive Award Plan (including 3,376,535 shares of Class A Common Stock to be issued for options and 1,330,624 shares of Class A Common Stock to be issued for RSUs subject to continued employment) and 2,438,046 of options remaining from the Impax option conversion associated with the Combination on May 4, 2018. RSUs included in column (a) of the table represent the full number of RSUs awarded and outstanding whereas the number of shares of Class A Common Stock to be issued upon vesting will be lower than what is reflected on the table because the value of shares required to meet employee tax withholding requirements are not issued.
(2)
Column (b) relates to stock options and does not include any exercise price for RSUs because an RSU’s value is dependent upon attainment of continued employment or service and they are settled for shares of Common Stock on a one-for-one basis.
Item 13. Certain Relationships and Related Transactions, and Director Independence
The information required in this Item 13 will be included in the following sections in the 2019 Proxy Statement, which sections are incorporated in this Item 13 by reference: “Certain Related Parties and Related Party Transactions,” “Controlled Company Status” and “Committees of the Board of Directors.”
Item 14. Principal Accounting Fees and Services
The information required in this Item 14 will be included in the section entitled “Independent Registered Public Accounting Firm Fees” in the 2019 Proxy Statement, which section is incorporated in this Item 14 by reference.
PART IV.
Item 15. Exhibits, Financial Statement Schedules
(a)(1) Consolidated Financial Statements
Index to financial statements and supplementary data filed as part of this Report.
61
(a)(2) Financial Statement Schedules
All schedules are omitted because they are not required or because the required information is included in the Consolidated Financial Statements or notes thereto.
(a)(3) Exhibits
See the "Exhibit Index" prior to the signature page of this Annual Report on Form 10-K.
Item 16. Form 10-K Summary
Not applicable.
62
REPORT OF INDEPENDENT REGISTERED PUBLIC ACCOUNTING FIRM
To the Stockholders and the Board of Directors of Amneal Pharmaceuticals, Inc.
Opinion on the Financial Statements
We have audited the accompanying consolidated balance sheets of Amneal Pharmaceuticals, Inc. (the Company) as of December 31, 2018 and 2017, the related consolidated statements of operations, comprehensive loss, changes in stockholders’ equity / members’ deficit and cash flows for each of the three years in the period ended December 31, 2018, and the related notes (collectively referred to as the “consolidated financial statements”). In our opinion, the consolidated financial statements present fairly, in all material respects, the financial position of the Company at December 31, 2018 and 2017, and the results of its operations and its cash flows for each of the three years in the period ended December 31, 2018, in conformity with U.S. generally accepted accounting principles.
Basis for Opinion
These financial statements are the responsibility of the Company’s management. Our responsibility is to express an opinion on the Company’s financial statements based on our audits. We are a public accounting firm registered with the Public Company Accounting Oversight Board (United States) (PCAOB) and are required to be independent with respect to the Company in accordance with the U.S. federal securities laws and the applicable rules and regulations of the Securities and Exchange Commission and the PCAOB.
We conducted our audits in accordance with the standards of the PCAOB. Those standards require that we plan and perform the audit to obtain reasonable assurance about whether the financial statements are free of material misstatement, whether due to error or fraud. The Company is not required to have, nor were we engaged to perform, an audit of its internal control over financial reporting. As part of our audits we are required to obtain an understanding of internal control over financial reporting but not for the purpose of expressing an opinion on the effectiveness of the Company's internal control over financial reporting. Accordingly, we express no such opinion.
Our audits included performing procedures to assess the risks of material misstatement of the financial statements, whether due to error or fraud, and performing procedures that respond to those risks. Such procedures included examining, on a test basis, evidence regarding the amounts and disclosures in the financial statements. Our audits also included evaluating the accounting principles used and significant estimates made by management, as well as evaluating the overall presentation of the financial statements. We believe that our audits provide a reasonable basis for our opinion.
/s/ Ernst & Young LLP
We have served as the Company’s auditor since 2008.
Iselin, New Jersey
March 1, 2019
F-
1
Amneal Pharmaceuticals, Inc.
Consolidated Statements of Operations
(in thousands, except per share amounts)
|
Years Ended December 31,
|
|||||||||||
|
2018
|
2017
|
2016
|
|||||||||
|
Net revenue
|
$
|
1,662,991
|
|
$
|
1,033,654
|
|
$
|
1,018,225
|
|
||
|
Cost of goods sold
|
946,588
|
|
507,476
|
|
420,770
|
|
|||||
|
Gross profit
|
716,403
|
|
526,178
|
|
597,455
|
|
|||||
|
Selling, general and administrative
|
230,435
|
|
109,046
|
|
118,757
|
|
|||||
|
Research and development
|
194,190
|
|
171,420
|
|
179,019
|
|
|||||
|
In-process research and development impairment charges
|
39,259
|
|
—
|
|
—
|
|
|||||
|
Acquisition, transaction-related and integration expenses
|
221,818
|
|
9,403
|
|
70
|
|
|||||
|
Restructuring and asset-related charges
|
56,413
|
|
—
|
|
—
|
|
|||||
|
Legal settlement gains
|
(22,300
|
)
|
(29,312
|
)
|
(11,000
|
)
|
|||||
|
Intellectual property legal development expenses
|
16,261
|
|
20,518
|
|
25,728
|
|
|||||
|
Operating (loss) income
|
(19,673
|
)
|
245,103
|
|
284,881
|
|
|||||
|
Other (expense) income:
|
|||||||||||
|
Interest expense, net
|
(143,571
|
)
|
(71,061
|
)
|
(55,283
|
)
|
|||||
|
Foreign exchange (loss) gain
|
(19,701
|
)
|
29,092
|
|
(14,108
|
)
|
|||||
|
Loss on extinguishment of debt
|
(19,667
|
)
|
(2,532
|
)
|
—
|
|
|||||
|
Loss on sale of certain international businesses
|
(2,958
|
)
|
(29,232
|
)
|
—
|
|
|||||
|
Other income (expense)
|
2,848
|
|
(47
|
)
|
(669
|
)
|
|||||
|
Total other expense, net
|
(183,049
|
)
|
(73,780
|
)
|
(70,060
|
)
|
|||||
|
(Loss) income before income taxes
|
(202,722
|
)
|
171,323
|
|
214,821
|
|
|||||
|
(Benefit from) provision for income taxes
|
(1,419
|
)
|
1,998
|
|
5,395
|
|
|||||
|
Net (loss) income
|
(201,303
|
)
|
169,325
|
|
209,426
|
|
|||||
|
Less: Net loss (income) attributable to Amneal Pharmaceuticals LLC pre-Combination
|
148,806
|
|
(167,648
|
)
|
(207,378
|
)
|
|||||
|
Less: Net loss (income) attributable to non-controlling interests
|
32,753
|
|
(1,677
|
)
|
(2,048
|
)
|
|||||
|
Net loss attributable to Amneal Pharmaceuticals, Inc. before accretion of redeemable non-controlling interest
|
(19,744
|
)
|
—
|
|
—
|
|
|||||
|
Accretion of redeemable non-controlling interest
|
(1,176
|
)
|
—
|
|
—
|
|
|||||
|
Net loss attributable to Amneal Pharmaceuticals, Inc.
|
$
|
(20,920
|
)
|
$
|
—
|
|
$
|
—
|
|
||
|
Net loss per share attributable to Amneal Pharmaceuticals, Inc.'s common stockholders:
|
|||||||||||
|
Class A and Class B-1 basic and diluted
|
$
|
(0.16
|
)
|
|
|
||||||
|
Weighted-average common shares outstanding:
|
|||||||||||
|
Class A and Class B-1 basic and diluted
|
127,252
|
|
|
|
|||||||
T
he accompanying notes are an integral part of these consolidated financial statements.
F-
2
Amneal Pharmaceuticals, Inc.
Consolidated Statements of Comprehensive Loss
(in thousands)
|
Years Ended December 31,
|
|||||||||||
|
2018
|
2017
|
2016
|
|||||||||
|
Net (loss) income
|
$
|
(201,303
|
)
|
|
$
|
169,325
|
|
$
|
209,426
|
|
|
|
Less: Net loss (income) attributable to Amneal Pharmaceuticals LLC pre-Combination
|
148,806
|
|
|
(167,648
|
)
|
(207,378
|
)
|
||||
|
Less: Net loss (income) attributable to non-controlling interests
|
32,753
|
|
|
(1,677
|
)
|
(2,048
|
)
|
||||
|
Net loss attributable to Amneal Pharmaceuticals, Inc. before accretion of redeemable non-controlling interest
|
(19,744
|
)
|
—
|
|
—
|
|
|||||
|
Accretion of redeemable non-controlling interest
|
(1,176
|
)
|
—
|
|
—
|
|
|||||
|
Net loss attributable to Amneal Pharmaceuticals, Inc.
|
(20,920
|
)
|
|
—
|
|
—
|
|
||||
|
Other comprehensive (loss) income:
|
|
|
|
|
|
||||||
|
Foreign currency translation adjustments
|
(3,952
|
)
|
|
(1,435
|
)
|
3,047
|
|
||||
|
Less: Other comprehensive (income) loss attributable to Amneal Pharmaceuticals LLC pre-Combination
|
(1,721
|
)
|
|
1,435
|
|
(3,047
|
)
|
||||
|
Less: Other comprehensive loss attributable to non-controlling interests
|
3,256
|
|
|
—
|
|
—
|
|
||||
|
Other comprehensive loss attributable to Amneal Pharmaceuticals, Inc.
|
(2,417
|
)
|
|
—
|
|
—
|
|
||||
|
Comprehensive loss attributable to Amneal Pharmaceuticals, Inc.
|
$
|
(23,337
|
)
|
|
$
|
—
|
|
$
|
—
|
|
|
T
he accompanying notes are an integral part of these consolidated financial statements.
F-
3
Amneal Pharmaceuticals, Inc.
Consolidated Balance Sheets
(in thousands)
|
December 31, 2018
|
December 31, 2017
|
||||||
|
Assets
|
|||||||
|
Current assets:
|
|||||||
|
Cash and cash equivalents
|
$
|
213,394
|
|
$
|
74,166
|
|
|
|
Restricted cash
|
5,385
|
|
3,756
|
|
|||
|
Trade accounts receivable, net
|
481,495
|
|
351,367
|
|
|||
|
Inventories
|
457,219
|
|
284,038
|
|
|||
|
Prepaid expenses and other current assets
|
128,321
|
|
42,396
|
|
|||
|
Related party receivables
|
830
|
|
16,210
|
|
|||
|
Total current assets
|
1,286,644
|
|
771,933
|
|
|||
|
Property, plant and equipment, net
|
544,146
|
|
486,758
|
|
|||
|
Goodwill
|
426,226
|
|
26,444
|
|
|||
|
Intangible assets, net
|
1,654,969
|
|
44,599
|
|
|||
|
Deferred tax asset, net
|
373,159
|
|
898
|
|
|||
|
Other assets
|
67,592
|
|
11,257
|
|
|||
|
Total assets
|
$
|
4,352,736
|
|
$
|
1,341,889
|
|
|
|
Liabilities and Stockholders' Equity (Members' Deficit)
|
|||||||
|
Current liabilities:
|
|||||||
|
Accounts payable and accrued expenses
|
$
|
514,440
|
|
$
|
194,779
|
|
|
|
Current portion of long-term debt, net
|
21,449
|
|
89,171
|
|
|||
|
Current portion of financing obligation - related party
|
266
|
|
311
|
|
|||
|
Related party payables
|
17,695
|
|
12,622
|
|
|||
|
Total current liabilities
|
553,850
|
|
296,883
|
|
|||
|
Long-term debt, net
|
2,630,598
|
|
1,355,274
|
|
|||
|
Financing obligations - related party
|
39,083
|
|
39,987
|
|
|||
|
Deferred income taxes
|
1,178
|
|
2,491
|
|
|||
|
Liabilities under tax receivable agreement
|
192,884
|
|
—
|
|
|||
|
Other long-term liabilities
|
38,780
|
|
7,793
|
|
|||
|
Related party payable - long term
|
—
|
|
15,043
|
|
|||
|
Total long-term liabilities
|
2,902,523
|
|
1,420,588
|
|
|||
|
Commitments and contingencies (Notes 5 & 18)
|
|
|
|
|
|||
|
Stockholders' equity (members' deficit):
|
|||||||
|
Members' equity, 189,000 units authorized, issued and outstanding at December 31, 2017
|
—
|
|
2,716
|
|
|||
|
Members' accumulated deficit
|
—
|
|
(382,785
|
)
|
|||
|
Preferred stock, $0.01 par value, 2,000 shares authorized; none issued and outstanding at December 31, 2018
|
—
|
|
—
|
|
|||
|
Class A common stock, $0.01 par value, 900,000 shares authorized; 115,047 shares issued and outstanding at December 31, 2018
|
1,151
|
|
—
|
|
|||
|
Class B common stock, $0.01 par value, 300,000 shares authorized; 171,261 shares issued and outstanding at December 31, 2018
|
1,713
|
|
—
|
|
|||
|
Class B-1 common stock, $0.01 par value, 18,000 shares authorized; 12,329 shares issued and outstanding at December 31, 2018
|
123
|
|
—
|
|
|||
|
Additional paid-in capital
|
530,438
|
|
8,562
|
|
|||
|
Stockholders' accumulated deficit
|
(20,920
|
)
|
—
|
|
|||
|
Accumulated other comprehensive loss
|
(7,755
|
)
|
(14,232
|
)
|
|||
|
Total Amneal Pharmaceuticals, Inc. stockholders' equity (members' deficit)
|
504,750
|
|
(385,739
|
)
|
|||
|
Non-controlling interests
|
391,613
|
|
10,157
|
|
|||
|
Total stockholders' equity (members' deficit)
|
896,363
|
|
(375,582
|
)
|
|||
|
Total liabilities and stockholders' equity (members’ deficit)
|
$
|
4,352,736
|
|
$
|
1,341,889
|
|
|
T
he accompanying notes are an integral part of these consolidated financial statements.
F-
4
Amneal Pharmaceuticals, Inc.
Consolidated Statement of Changes in Stockholders' Equity / Members' Deficit
(in thousands)
|
|
|
Class A Common Stock
|
Class B Common Stock
|
Class B-1 Common Stock
|
Additional Paid-in Capital
|
|
Accumulated Other Comprehensive Loss
|
Non-Controlling Interests
|
Total Equity
|
Redeemable Non-Controlling Interest
|
|||||||||||||||||||||||||||||||
|
Members' Equity
|
Members' Accumulated Deficit
|
Shares
|
Amount
|
Shares
|
Amount
|
Shares
|
Amount
|
Stockholders' Accumulated Deficit
|
|||||||||||||||||||||||||||||||||
|
Balance at January 1, 2016
|
$
|
2,675
|
|
$
|
(181,974
|
)
|
—
|
|
$
|
—
|
|
—
|
|
$
|
—
|
|
—
|
|
$
|
—
|
|
$
|
—
|
|
$
|
—
|
|
$
|
(15,844
|
)
|
$
|
8,270
|
|
$
|
(186,873
|
)
|
$
|
—
|
|
||
|
Net income
|
—
|
|
207,378
|
|
—
|
|
—
|
|
—
|
|
—
|
|
—
|
|
—
|
|
—
|
|
—
|
|
—
|
|
2,048
|
|
209,426
|
|
—
|
|
|||||||||||||
|
Dividend to non-controlling interest
|
—
|
|
—
|
|
—
|
|
—
|
|
—
|
|
—
|
|
—
|
|
—
|
|
—
|
|
—
|
|
—
|
|
(973
|
)
|
(973
|
)
|
—
|
|
|||||||||||||
|
Distributions to members
|
—
|
|
(200,615
|
)
|
—
|
|
—
|
|
—
|
|
—
|
|
—
|
|
—
|
|
—
|
|
—
|
|
—
|
|
—
|
|
(200,615
|
)
|
—
|
|
|||||||||||||
|
Foreign currency translation adjustment
|
—
|
|
—
|
|
—
|
|
—
|
|
—
|
|
—
|
|
—
|
|
—
|
|
—
|
|
—
|
|
3,047
|
|
—
|
|
3,047
|
|
—
|
|
|||||||||||||
|
Return of capital
|
—
|
|
43
|
|
—
|
|
—
|
|
—
|
|
—
|
|
—
|
|
—
|
|
—
|
|
—
|
|
—
|
|
—
|
|
43
|
|
—
|
|
|||||||||||||
|
Balance at December 31, 2016
|
2,675
|
|
(175,168
|
)
|
—
|
|
—
|
|
—
|
|
—
|
|
—
|
|
—
|
|
—
|
|
—
|
|
(12,797
|
)
|
9,345
|
|
(175,945
|
)
|
—
|
|
|||||||||||||
|
Net income
|
—
|
|
167,648
|
|
—
|
|
—
|
|
—
|
|
—
|
|
—
|
|
—
|
|
—
|
|
—
|
|
—
|
|
1,677
|
|
169,325
|
|
—
|
|
|||||||||||||
|
Dividend to non-controlling interest
|
—
|
|
—
|
|
—
|
|
—
|
|
—
|
|
—
|
|
—
|
|
—
|
|
—
|
|
—
|
|
—
|
|
(865
|
)
|
(865
|
)
|
—
|
|
|||||||||||||
|
Capital contribution
|
41
|
|
—
|
|
—
|
|
—
|
|
—
|
|
—
|
|
—
|
|
—
|
|
8,562
|
|
—
|
|
—
|
|
—
|
|
8,603
|
|
—
|
|
|||||||||||||
|
Distributions to members
|
—
|
|
(375,265
|
)
|
—
|
|
—
|
|
—
|
|
—
|
|
—
|
|
—
|
|
—
|
|
—
|
|
—
|
|
—
|
|
(375,265
|
)
|
—
|
|
|||||||||||||
|
Foreign currency translation adjustment
|
—
|
|
—
|
|
—
|
|
—
|
|
—
|
|
—
|
|
—
|
|
—
|
|
—
|
|
—
|
|
(1,435
|
)
|
—
|
|
(1,435
|
)
|
—
|
|
|||||||||||||
|
Balance at December 31, 2017
|
$
|
2,716
|
|
$
|
(382,785
|
)
|
—
|
|
$
|
—
|
|
—
|
|
$
|
—
|
|
—
|
|
$
|
—
|
|
$
|
8,562
|
|
$
|
—
|
|
$
|
(14,232
|
)
|
$
|
10,157
|
|
$
|
(375,582
|
)
|
$
|
—
|
|
||
The accompanying notes are an integral part of these consolidated financial statements.
F-
5
Amneal Pharmaceuticals, Inc.
Consolidated Statement of Changes in Stockholders' Equity / Members' Deficit
(in thousands)
|
Class A Common Stock
|
Class B Common Stock
|
Class B-1 Common Stock
|
Additional Paid-in Capital
|
Stockholders' Accumulated Deficit
|
Accumulated Other Comprehensive Loss
|
Non-Controlling Interests
|
Total Equity
|
Redeemable Non-Controlling Interest
|
||||||||||||||||||||||||||||||||
|
Members' Equity
|
Members' Accumulated Deficit
|
Shares
|
Amount
|
Shares
|
Amount
|
Shares
|
Amount
|
|||||||||||||||||||||||||||||||||
|
Balance at January 1, 2018
|
$
|
2,716
|
|
$
|
(382,785
|
)
|
—
|
|
$
|
—
|
|
—
|
|
$
|
—
|
|
—
|
|
$
|
—
|
|
$
|
8,562
|
|
$
|
—
|
|
$
|
(14,232
|
)
|
$
|
10,157
|
|
$
|
(375,582
|
)
|
$
|
—
|
|
|
|
Period Prior to the Combination
|
|
|||||||||||||||||||||||||||||||||||||||
|
Net (loss) income
|
—
|
|
(148,806
|
)
|
—
|
|
—
|
|
—
|
|
—
|
|
—
|
|
—
|
|
—
|
|
—
|
|
—
|
|
97
|
|
(148,709
|
)
|
—
|
|
||||||||||||
|
Cumulative-effective adjustment from adoption of ASU 2014-09 (Topic 606)
|
—
|
|
4,977
|
|
—
|
|
—
|
|
—
|
|
—
|
|
—
|
|
—
|
|
—
|
|
—
|
|
—
|
|
—
|
|
4,977
|
|
—
|
|
||||||||||||
|
Capital contribution from non-controlling interest
|
—
|
|
—
|
|
—
|
|
—
|
|
—
|
|
—
|
|
—
|
|
—
|
|
—
|
|
—
|
|
—
|
|
360
|
|
360
|
|
—
|
|
||||||||||||
|
Distributions to members
|
—
|
|
(182,998
|
)
|
—
|
|
—
|
|
—
|
|
—
|
|
—
|
|
—
|
|
(8,562
|
)
|
—
|
|
—
|
|
—
|
|
(191,560
|
)
|
—
|
|
||||||||||||
|
PPU expense
|
158,757
|
|
—
|
|
—
|
|
—
|
|
—
|
|
—
|
|
—
|
|
—
|
|
—
|
|
—
|
|
—
|
|
158,757
|
|
—
|
|
||||||||||||||
|
Foreign currency translation adjustment
|
—
|
|
—
|
|
—
|
|
—
|
|
—
|
|
—
|
|
—
|
|
—
|
|
—
|
|
—
|
|
1,721
|
|
—
|
|
1,721
|
|
—
|
|
||||||||||||
|
Capital contribution by Amneal Holdings for employee bonuses
|
27,742
|
|
—
|
|
—
|
|
—
|
|
—
|
|
—
|
|
—
|
|
—
|
|
—
|
|
—
|
|
—
|
|
—
|
|
27,742
|
|
—
|
|
||||||||||||
|
Period Subsequent to the Combination
|
||||||||||||||||||||||||||||||||||||||||
|
Effect of the Combination
|
(189,215
|
)
|
709,612
|
|
73,289
|
|
733
|
|
224,996
|
|
2,250
|
|
—
|
|
—
|
|
330,678
|
|
—
|
|
9,437
|
|
626,737
|
|
1,490,232
|
|
—
|
|
||||||||||||
|
Redemption of Class B Common Stock for PIPE
|
—
|
|
—
|
|
34,520
|
|
345
|
|
(46,849
|
)
|
(468
|
)
|
12,329
|
|
123
|
|
165,180
|
|
—
|
|
(1,965
|
)
|
(130,501
|
)
|
32,714
|
|
—
|
|
||||||||||||
|
Redemption of Class B Common Stock for distribution to PPU Holders
|
—
|
|
—
|
|
6,886
|
|
69
|
|
(6,886
|
)
|
(69
|
)
|
—
|
|
—
|
|
24,293
|
|
—
|
|
(289
|
)
|
(19,181
|
)
|
4,823
|
|
—
|
|
||||||||||||
|
Net (loss) income
|
—
|
|
—
|
|
—
|
|
—
|
|
—
|
|
—
|
|
—
|
|
—
|
|
—
|
|
(19,744
|
)
|
—
|
|
(32,917
|
)
|
(52,661
|
)
|
67
|
|
||||||||||||
|
Foreign currency translation adjustment
|
—
|
|
—
|
|
—
|
|
—
|
|
—
|
|
—
|
|
—
|
|
—
|
|
—
|
|
—
|
|
(2,417
|
)
|
(3,256
|
)
|
(5,673
|
)
|
—
|
|
||||||||||||
|
Stock-based compensation
|
—
|
|
—
|
|
—
|
|
—
|
|
—
|
|
—
|
|
—
|
|
—
|
|
8,840
|
|
—
|
|
—
|
|
—
|
|
8,840
|
|
—
|
|
||||||||||||
|
Exercise of stock options
|
—
|
|
—
|
|
352
|
|
4
|
|
—
|
|
—
|
|
—
|
|
—
|
|
2,184
|
|
—
|
|
(10
|
)
|
1,619
|
|
3,797
|
|
—
|
|
||||||||||||
|
Reclassification of redeemable non-controlling interest
|
—
|
|
—
|
|
—
|
|
—
|
|
—
|
|
—
|
|
—
|
|
—
|
|
—
|
|
(1,176
|
)
|
—
|
|
(10,532
|
)
|
(11,708
|
)
|
11,708
|
|
||||||||||||
|
Non-controlling interests from acquisition of Gemini
|
—
|
|
—
|
|
—
|
|
—
|
|
—
|
|
—
|
|
—
|
|
—
|
|
—
|
|
—
|
|
—
|
|
2,518
|
|
2,518
|
|
—
|
|
||||||||||||
|
Acquisition of redeemable non-controlling interest
|
—
|
|
—
|
|
—
|
|
—
|
|
—
|
|
—
|
|
—
|
|
—
|
|
—
|
|
—
|
|
—
|
|
—
|
|
—
|
|
(11,775
|
)
|
||||||||||||
|
Acquisition of non-controlling interests
|
—
|
|
—
|
|
—
|
|
—
|
|
—
|
|
—
|
|
—
|
|
—
|
|
(920
|
)
|
—
|
|
—
|
|
(2,565
|
)
|
(3,485
|
)
|
—
|
|
||||||||||||
|
Tax distribution
|
—
|
|
—
|
|
—
|
|
—
|
|
—
|
|
—
|
|
—
|
|
—
|
|
—
|
|
—
|
|
—
|
|
(48,955
|
)
|
(48,955
|
)
|
—
|
|
||||||||||||
|
Other
|
—
|
|
—
|
|
—
|
|
—
|
|
—
|
|
—
|
|
—
|
|
—
|
|
183
|
|
—
|
|
—
|
|
(1,968
|
)
|
(1,785
|
)
|
—
|
|
||||||||||||
|
Balance at December 31, 2018
|
$
|
—
|
|
$
|
—
|
|
115,047
|
|
$
|
1,151
|
|
171,261
|
|
$
|
1,713
|
|
12,329
|
|
$
|
123
|
|
$
|
530,438
|
|
$
|
(20,920
|
)
|
$
|
(7,755
|
)
|
$
|
391,613
|
|
$
|
896,363
|
|
$
|
—
|
|
|
The accompanying notes are an integral part of these consolidated financial statements.
F-
6
Amneal Pharmaceuticals, Inc.
Consolidated Statements of Cash Flows
(in thousands)
|
|
Years Ended December 31,
|
||||||||||
|
|
2018
|
2017
|
2016
|
||||||||
|
Cash flows from operating activities:
|
|
|
|||||||||
|
Net (loss) income
|
$
|
(201,303
|
)
|
$
|
169,325
|
|
$
|
209,426
|
|
||
|
Adjustments to reconcile net (loss) income to net cash provided by operating activities:
|
|
|
|||||||||
|
Depreciation and amortization
|
137,403
|
|
45,936
|
|
33,016
|
|
|||||
|
Unrealized foreign currency loss (gain)
|
18,582
|
|
(30,823
|
)
|
12,162
|
|
|||||
|
Amortization of debt issuance costs
|
5,859
|
|
4,585
|
|
3,055
|
|
|||||
|
Loss on extinguishment of debt
|
19,667
|
|
2,532
|
|
—
|
|
|||||
|
Loss on sale of certain international businesses
|
2,958
|
|
29,232
|
|
—
|
|
|||||
|
Intangible asset impairment charges
|
47,928
|
|
—
|
|
—
|
|
|||||
|
Non-cash restructuring and asset-related charges
|
11,295
|
|
—
|
|
—
|
|
|||||
|
Deferred tax (benefit) provision
|
(9,439
|
)
|
742
|
|
121
|
|
|||||
|
Stock-based compensation and PPU expense
|
167,597
|
|
—
|
|
—
|
|
|||||
|
Inventory provision
|
44,539
|
|
3,771
|
|
9,235
|
|
|||||
|
Other operating charges and credits, net
|
(1,866
|
)
|
9,935
|
|
197
|
|
|||||
|
Changes in assets and liabilities:
|
|
|
|||||||||
|
Trade accounts receivable, net
|
89,084
|
|
35,255
|
|
(122,482
|
)
|
|||||
|
Inventories
|
(42,875
|
)
|
(31,826
|
)
|
(42,587
|
)
|
|||||
|
Prepaid expenses, other current assets and other assets
|
19,198
|
|
(25,305
|
)
|
2,042
|
|
|||||
|
Related party receivables
|
10,928
|
|
(5,485
|
)
|
307
|
|
|||||
|
Accounts payable, accrued expenses and other liabilities
|
(55,212
|
)
|
18,105
|
|
6,265
|
|
|||||
|
Related party payables
|
(14,113
|
)
|
8,208
|
|
4,303
|
|
|||||
|
Net cash provided by operating activities
|
250,230
|
|
234,187
|
|
115,060
|
|
|||||
|
Cash flows from investing activities:
|
|
|
|||||||||
|
Purchases of property, plant and equipment
|
(83,088
|
)
|
(94,771
|
)
|
(122,756
|
)
|
|||||
|
Acquisition of product rights and licenses
|
(14,000
|
)
|
(19,500
|
)
|
(1,850
|
)
|
|||||
|
Acquisitions, net of cash acquired
|
(324,634
|
)
|
—
|
|
—
|
|
|||||
|
Proceeds from sales of property, plant and equipment
|
25,344
|
|
—
|
|
—
|
|
|||||
|
Proceeds from sale of certain international businesses, net of cash sold
|
—
|
|
15,717
|
|
—
|
|
|||||
|
Net cash used in investing activities
|
(396,378
|
)
|
(98,554
|
)
|
(124,606
|
)
|
|||||
|
Cash flows from financing activities:
|
|
|
|||||||||
|
Payments of deferred financing costs and debt extinguishment costs
|
(54,955
|
)
|
(5,026
|
)
|
(6,506
|
)
|
|||||
|
Proceeds from issuance of debt
|
1,325,383
|
|
250,000
|
|
225,000
|
|
|||||
|
Payments of principal on debt and capital leases
|
(617,051
|
)
|
(13,625
|
)
|
(11,137
|
)
|
|||||
|
Net (payments) borrowings on revolving credit line
|
(75,000
|
)
|
50,000
|
|
(25,000
|
)
|
|||||
|
Payments of principal on financing obligation - related party
|
(243
|
)
|
(274
|
)
|
(259
|
)
|
|||||
|
Proceeds from exercise of stock options
|
3,797
|
|
—
|
|
—
|
|
|||||
|
Equity contributions
|
27,742
|
|
40
|
|
(5
|
)
|
|||||
|
Capital contribution from (dividend to) non-controlling interest
|
360
|
|
(865
|
)
|
(973
|
)
|
|||||
|
Acquisition of redeemable non-controlling interest
|
(11,775
|
)
|
—
|
|
—
|
|
|||||
|
Tax distribution to non-controlling interest
|
(35,543
|
)
|
—
|
|
—
|
|
|||||
|
Distributions to members
|
(182,998
|
)
|
(375,265
|
)
|
(200,615
|
)
|
|||||
|
Repayment of related party notes
|
(92,042
|
)
|
—
|
|
—
|
|
|||||
|
Net cash provided by (used in) financing activities
|
287,675
|
|
(95,015
|
)
|
(19,495
|
)
|
|||||
|
Effect of foreign exchange rate on cash
|
(670
|
)
|
(242
|
)
|
1,481
|
|
|||||
|
Net increase (decrease) in cash, cash equivalents, and restricted cash
|
140,857
|
|
40,376
|
|
(27,560
|
)
|
|||||
|
Cash, cash equivalents, and restricted cash - beginning of period
|
77,922
|
|
37,546
|
|
65,106
|
|
|||||
|
Cash, cash equivalents, and restricted cash - end of period
|
$
|
218,779
|
|
$
|
77,922
|
|
$
|
37,546
|
|
||
|
Cash and cash equivalents - end of period
|
$
|
213,394
|
|
$
|
74,166
|
|
$
|
27,367
|
|
||
|
Restricted cash - end of period
|
5,385
|
|
3,756
|
|
10,179
|
|
|||||
|
Cash, cash equivalents, and restricted cash - end of period
|
$
|
218,779
|
|
$
|
77,922
|
|
$
|
37,546
|
|
||
|
Supplemental disclosure of cash flow information:
|
|||||||||||
|
Cash paid for interest
|
$
|
131,505
|
|
$
|
65,086
|
|
$
|
50,569
|
|
||
|
Cash received (paid), net for income taxes
|
$
|
34,952
|
|
$
|
(5,780
|
)
|
$
|
(4,922
|
)
|
||
|
Supplemental disclosure of non-cash investing and financing activity:
|
|||||||||||
|
Acquisition of non-controlling interest
|
$
|
3,485
|
|
$
|
—
|
|
$
|
—
|
|
||
|
Tax distribution to non-controlling interest
|
13,412
|
|
—
|
|
—
|
|
|||||
|
Distribution to members
|
8,562
|
|
—
|
|
—
|
|
|||||
|
Receivable from the sale of certain international businesses
|
—
|
|
1,936
|
|
—
|
|
|||||
|
Note payable resulting from the Ireland building purchase
|
—
|
|
14,758
|
|
—
|
|
|||||
|
Transaction costs paid by Amneal Holdings
|
$
|
—
|
|
$
|
8,561
|
|
$
|
—
|
|
||
The accompanying notes are an integral part of these consolidated financial statements.
F-
7
Amneal Pharmaceuticals, Inc.
Notes to Consolidated Financial Statements
1. Nature of Operations and Basis of Presentation
Amneal Pharmaceuticals, Inc., formerly known as Atlas Holdings, Inc. (the "Company"), was formed along with its wholly owned subsidiary, K2 Merger Sub Corporation, a Delaware corporation ("Merger Sub"), on October 4, 2017, for the purpose of facilitating the combination of Impax Laboratories, Inc. (now Impax Laboratories, LLC), a Delaware corporation then listed on the Nasdaq Stock Market ("Impax") and Amneal Pharmaceuticals LLC, a Delaware limited liability company ("Amneal").
Amneal was formed in 2002 and operates through various subsidiaries. Amneal is a vertically integrated developer, manufacturer, and seller of generic pharmaceutical products. Amneal’s pharmaceutical research includes analytical and formulation development and stability. Amneal has operations in the United States, Switzerland, India, Ireland and the United Kingdom, and certain other countries, primarily in Western Europe. Amneal sells to wholesalers, distributors, hospitals, chain pharmacies and individual pharmacies, either directly or indirectly.
On October 17, 2017, Amneal, Impax, the Company and Merger Sub entered into the Business Combination Agreement, as amended on November 21, 2017 and December 16, 2017 (the "BCA").
On May 4, 2018, pursuant to the BCA, Impax and Amneal combined the generics and specialty pharmaceutical business of Impax with the generic drug development and manufacturing business of Amneal to create the Company as a new generics and specialty pharmaceutical company listed on the New York Stock Exchange, through the following transactions (together, the "Combination," and the closing of the Combination, the "Closing"): (i) Merger Sub merged with and into Impax, with Impax surviving as a direct wholly owned subsidiary of the Company, (ii) each share of Impax’s common stock, par value
$0.01
per share ("Impax Common Stock"), issued and outstanding immediately prior to the Closing, other than Impax Common Stock held by Impax in treasury, by the Company or by any of their respective subsidiaries, was converted into the right to receive
one
fully paid and non-assessable share of Class A common stock of the Company, par value
$0.01
per share ("Class A Common Stock"), (iii) Impax converted to a Delaware limited liability company, (iv) the Company contributed to Amneal all of the Company’s equity interests in Impax, in exchange for Amneal common units ("Amneal Common Units"), (v) the Company issued an aggregate number of shares of Class B common stock of the Company, par value
$0.01
per share ("Class B Common Stock," and collectively, with the Class A Common Stock and Class B-1 common stock of the Company, par value
$0.01
, ("Class B-1 Common Stock"), the "Company Common Stock" to APHC Holdings, LLC, (formerly Amneal Holdings, LLC), the parent entity of Amneal as of the Closing ("Holdings"), and (vi) the Company became the managing member of Amneal.
Immediately upon the Closing, holders of Impax Common Stock prior to the Closing collectively held approximately
25%
of the Company and Holdings held a majority interest in the Company with an effective voting interest of approximately
75%
on a fully diluted and as converted basis through its ownership of Class B Common Stock. Holdings also held a corresponding number of Amneal Common Units, which entitled it to approximately
75%
of the economic interests in the combined businesses of Impax and Amneal. The Company held an interest in Amneal of approximately
25%
and became its managing member.
In connection with the Combination, on May 4, 2018, Holdings entered into definitive purchase agreements which provided for a private placement of certain shares of Class A Common Stock and Class B-1 Common Stock (the "PIPE Investment") with select institutional investors (the "PIPE Investors"). Pursuant to the terms of the purchase agreements, upon the Closing, Holdings exercised its right to cause the Company to redeem approximately
15%
of its ownership interests in the Company in exchange for
34.5 million
shares of Class A Common Stock and
12.3 million
unregistered shares of Class B-1 Common Stock (the "Redemption"). The shares of Class A Common Stock and Class B-1 Common Stock received in the Redemption were sold immediately following the Closing by Holdings to the PIPE Investors at a per share purchase price of
$18.25
for gross proceeds of
$855.0 million
. Following the PIPE Investment, the PIPE Investors owned collectively approximately
15%
of the Company Common Stock on a fully diluted and as converted basis. On May 4, 2018, Holdings also caused Amneal to redeem (the "Closing Date Redemption")
6.9 million
of Amneal Common Units held by Holdings for a like number of shares of Class A Common Stock, for future distribution to certain direct and indirect members of Holdings who were or are employees of the Company and to whom were previously issued (prior to the Closing) profit participation units ("PPUs") in Amneal. As a result of the PIPE Investment and Closing Date Redemption, the voting and economic interest of approximately
75%
held by Holdings immediately upon Closing was reduced by approximately
18%
. The overall interest percentage held by non-controlling interest holders upon the consummation of the Combination, PIPE Investment and Closing Date Redemption was approximately
57%
. As of
December 31, 2018
, the overall interest percentage held by non-controlling interest holders was approximately
57%
.
O
n July 5, 2018, Holdings distributed to its members (collectively, the "Amneal Group") all Amneal Common Units and shares of Class B Common Stock held by Holdings. As a result, as of
December 31, 2018
, Holdings did
no
t hold any equity interest in Amneal or the Company.
F-
8
The Company is a holding company, whose principal assets are Amneal Common Units.
2. Summary of Significant Accounting Policies
Accounting Principles
The financial statements and accompanying notes are prepared in accordance with accounting principles generally accepted in the United States of America ("U.S. GAAP"). All intercompany accounts and transactions have been eliminated.
Principles of Consolidation
Although the Company has a minority economic interest in Amneal, it is Amneal’s sole managing member, having the sole voting power to make all of Amneal’s business decisions and control its management. Therefore, the Company consolidates the financial statements of Amneal and its subsidiaries. The Company’s consolidated financial statements are a continuation of Amneal’s financial statements, with adjustments to equity to reflect the Combination, the PIPE Investment and non-controlling interests for the portion of Amneal’s economic interests that is not held by the Company. Prior to the closing of the Combination and PIPE Investment, the Company did not conduct any activities other than those incidental to the formation of it and Merger Sub and the matters contemplated by the BCA and had no operations and no material assets or liabilities. The current year results and balances may not be comparable to prior years as the current year includes the impact of the Combination.
Use of Estimates
The preparation of financial statements in conformity with U.S. GAAP requires the Company's management to make estimates and assumptions that affect the reported financial position at the date of the financial statements and the reported results of operations during the reporting period. Such estimates and assumptions affect the reported amounts of assets, liabilities, revenues and expenses, and disclosure of contingent assets and liabilities in the consolidated financial statements and accompanying notes. The following are some, but not all, of such estimates: the determination of chargebacks, sales returns, rebates, bill backs, allowances for accounts receivable, accrued liabilities, stock-based compensation, valuation of inventory balances, the determination of useful lives for product rights and the assessment of expected cash flows used in evaluating goodwill and other long-lived assets for impairment. Actual results could differ from those estimates.
Revenue Recognition
On January 1, 2018, the Company adopted Accounting Standards Update ("ASU") 2014-09, "Revenue from Contracts with Customers and associated ASUs (collectively "Topic 606"), which sets forth a new five-step revenue recognition model which replaces the prior revenue recognition guidance in its entirety and is intended to eliminate numerous industry-specific sections of revenue recognition guidance that have historically existed.
When assessing its revenue recognition, the Company performs the following five steps in accordance with Topic 606: (i) identify the contract with a customer; (ii) identify the performance obligations in the contract; (iii) determine the transaction price; (iv) allocate the transaction price to the performance obligations in the contract; and (v) recognize revenue when (or as) the entity satisfies the performance obligation. The Company recognizes revenue when it transfers control of its products to customers, in an amount that reflects the consideration to which the Company expects to be entitled to receive in exchange for those products. For further details on the Company’s revenue recognition policies under Topic 606, refer to
Note 4. Revenue Recognition
.
F-
9
A rollforward of the major categories of sales-related deductions for the years ended
December 31, 2018
,
2017
and
2016
is as follows (in thousands):
|
Contract Charge-backs and Sales Volume Allowances
|
Cash Discount Allowances
|
Accrued Returns Allowance
|
Accrued Medicaid and Commercial Rebates
|
|||||||||||||
|
Balance at January 1, 2016
|
$
|
330,811
|
|
$
|
14,894
|
|
$
|
32,124
|
|
$
|
14,385
|
|
||||
|
Provision related to sales recorded in the period
|
2,182,606
|
|
70,662
|
|
31,741
|
|
17,181
|
|
||||||||
|
Credits/payments issued during the period
|
(2,146,569
|
)
|
(67,118
|
)
|
(17,670
|
)
|
(23,509
|
)
|
||||||||
|
Balance at December 31, 2016
|
366,848
|
|
18,438
|
|
46,195
|
|
8,057
|
|
||||||||
|
Provision related to sales recorded in the period
|
2,489,681
|
|
79,837
|
|
24,571
|
|
25,982
|
|
||||||||
|
Credits/payments issued during the period
|
(2,402,826
|
)
|
(77,867
|
)
|
(25,591
|
)
|
(21,128
|
)
|
||||||||
|
Balance at December 31, 2017
|
453,703
|
|
20,408
|
|
45,175
|
|
12,911
|
|
||||||||
|
Liabilities assumed from acquisitions
|
|
222,970
|
|
|
11,781
|
|
|
102,502
|
|
|
51,618
|
|
||||
|
Provision related to sales recorded in the period
|
3,463,983
|
|
117,010
|
|
85,996
|
|
104,664
|
|
||||||||
|
Credits/payments issued during the period
|
(3,311,060
|
)
|
(113,042
|
)
|
(79,170
|
)
|
(94,991
|
)
|
||||||||
|
Balance at December 31, 2018
|
$
|
829,596
|
|
$
|
36,157
|
|
$
|
154,503
|
|
$
|
74,202
|
|
||||
Stock-Based Compensation
The Company’s stock-based compensation consists of stock options and restricted stock units ("RSUs") awarded to employees and non-employee directors. Stock options are measured at their fair value on the grant date or date of modification, as applicable. RSUs are measured at the stock price on the grant date or date of modification, as applicable. The Company recognizes compensation expense on a straight-line basis over the requisite service and/or performance period, as applicable. Forfeitures of awards are accounted for as a reduction in stock-based compensation expense in the period such awards are forfeited. The Company's policy is to issue new shares upon option exercises and RSU vestings.
Foreign Currencies
The Company has operations in the U.S., Switzerland, India, the U.K., Ireland, and other international jurisdictions. The results of its non-U.S. dollar based operations are translated to U.S. Dollars at the average exchange rates during the period. Assets and liabilities are translated at the rate of exchange prevailing on the balance sheet date. Investment accounts are translated at historical exchange rates. Translation adjustments are accumulated in a separate component of stockholders’/members’ deficit in the consolidated balance sheet and are included in the determination of comprehensive income. Transaction gains and losses are included in the determination of net (loss) income in the Company consolidated statements of operations as a component of foreign exchange gains and losses. Such foreign currency transaction gains and losses include fluctuations related to long term intercompany loans that are payable in the foreseeable future.
Business Combinations
Business combinations are accounted for using the acquisition method of accounting. Under the acquisition method, the acquiring entity in a business combination records the assets acquired and liabilities assumed at the date of acquisition at their fair values. Any excess of the purchase price over the fair value of net assets and other identifiable intangible assets acquired is recorded as goodwill. Acquisition-related costs, primarily professional fees, are expensed as incurred.
Cash and Cash Equivalents
Cash and cash equivalents consist of cash on deposit and highly liquid investments with original maturities of three months or less. A portion of the Company’s cash flows are derived outside the U.S. As a result, the Company is subject to market risk associated with changes in foreign exchange rates. The Company maintains cash balances at both U.S. based and foreign based commercial banks. At various times during the year, cash balances in the U.S. may exceed amounts that are insured by the Federal Deposit Insurance Corporation ("FDIC").
F-
10
Restricted Cash
At
December 31, 2018
and
2017
, respectively, the Company had restricted cash balances of
$5 million
and
$4 million
in its bank accounts primarily related to the purchase of certain land and equipment.
Accounts Receivable and Allowance for Doubtful Accounts
Trade accounts receivable are recorded at the invoiced amount and do not bear interest. The Company limits its credit risk with respect to accounts receivable by performing credit evaluations when deemed necessary. The Company does not require collateral to secure amounts owed to it by its customers.
The allowance for doubtful accounts is management’s best estimate of the amount of probable collection losses in the Company’s existing accounts receivable. Management determines the allowance based on historical experience along with the present knowledge of potentially uncollectible accounts. Account balances are charged off against the allowance when management believes it is probable the receivable will not be recovered. The Company does not have any off-balance-sheet credit exposure related to customers.
Inventories
Inventories consist of finished goods held for sale, raw materials, and work in process. Inventories are stated at net realizable value, with cost determined using the first-in, first-out method. Adjustments for excess and obsolete inventories are established based upon historical experience and management’s assessment of current product demand. These assessments include inventory obsolescence based on its expiration date, damaged or rejected product, and slow-moving products.
Property, Plant, and Equipment
Property, plant, and equipment are stated at historical cost less accumulated depreciation. Depreciation expense is computed primarily using the straight-line method over the estimated useful lives of the assets, which are as follows:
|
Asset Classification
|
Estimated Useful Life
|
|
|
Buildings
|
30 years
|
|
|
Computer equipment
|
5 years
|
|
|
Furniture and fixtures
|
7 years
|
|
|
Leasehold improvements
|
Shorter of asset's useful life or remaining life of lease
|
|
|
Machinery and equipment
|
7 years
|
|
|
Vehicles
|
5 years
|
|
Upon retirement or disposal, the cost of the asset disposed and the accumulated depreciation are removed from the accounts, and any gain or loss is reflected as part of operating income (loss) in the period of disposal. Expenditures that significantly increase value or extend useful lives of property, plant, and equipment are capitalized, whereas those for normal maintenance and repairs are expensed. The Company capitalizes interest on borrowings during the construction period of major capital projects as part of the related asset and amortizes the capitalized interest into earnings over the related asset’s remaining useful life.
In-Process Research and Development
The fair value of in-process research and development ("IPR&D") acquired in a business combination is determined based on the present value of each research project’s projected cash flows using an income approach. Revenues are estimated based on relevant market size and growth factors, expected industry trends, individual project life cycles and the life of each research project’s underlying marketability. In determining the fair value of each research project, expected cash flows are adjusted for certain risks of completion, including technical and regulatory risk.
The value attributable to IPR&D projects at the time of acquisition is capitalized as an indefinite-lived intangible asset and tested for impairment until the project is completed or abandoned. Upon completion of the project, the indefinite-lived intangible asset is then accounted for as a finite-lived intangible asset and amortized on a straight-line basis over its estimated useful life. If the project is abandoned, the indefinite-lived intangible asset is charged to expense.
F-
11
Intangible assets with indefinite lives, including IPR&D, are tested for impairment if impairment indicators arise and, at a minimum, annually. However, an entity is permitted to first assess qualitative factors to determine if a quantitative impairment test is necessary. Further testing is only required if the entity determines, based on the qualitative assessment, that it is more likely than not that an indefinite-lived intangible asset’s fair value is less than its carrying amount. Otherwise, no further impairment testing is required. The indefinite-lived intangible asset impairment test consists of a one-step analysis that compares the fair value of the intangible asset with its carrying amount. If the carrying amount of an intangible asset exceeds its fair value, an impairment loss is recognized in an amount equal to that excess. The Company considers many factors in evaluating whether the value of its intangible assets with indefinite lives may not be recoverable, including, but not limited to, expected growth rates, the cost of equity and debt capital, general economic conditions, the Company's outlook and market performance of the Company's industry and recent and forecasted financial performance.
Goodwill
Goodwill, which represents the excess of purchase price over the fair value of net assets acquired, is carried at cost. Goodwill is not amortized; rather, it is subject to a periodic assessment for impairment by applying a fair value based test. The Company reviews goodwill for possible impairment annually during the fourth quarter, or whenever events or circumstances indicate that the carrying amount may not be recoverable.
The impairment model prescribes a two-step method for determining goodwill impairment. However, an entity is permitted to first assess qualitative factors to determine whether the two-step goodwill impairment test is necessary. The qualitative factors considered by the Company may include, but are not limited to, general economic conditions, the Company’s outlook, market performance of the Company’s industry and recent and forecasted financial performance. Further testing is only required if the entity determines, based on the qualitative assessment, that it is more likely than not that a reporting unit’s fair value is less than its carrying amount. Otherwise, no further impairment testing is required. In the first step, the Company determines the fair value of its reporting unit using a discounted cash flow analysis. If the net book value of the reporting unit exceeds its fair value, the Company then performs the second step of the impairment test, which requires allocation of the reporting unit’s fair value to all of its assets and liabilities using the acquisition method prescribed under authoritative guidance for business combinations with any residual fair value being allocated to goodwill. An impairment charge is recognized when the implied fair value of the Company’s reporting unit’s goodwill is less than its carrying amount.
Assumptions and estimates used in the evaluation of impairment may affect the carrying value of long-lived assets, which could result in impairment charges in future periods. Such assumptions include projections of future cash flows and the current fair value of the asset.
Impairment of Long-Lived Assets (Including Intangible Assets with Finite Lives)
The Company reviews its long-lived assets, including intangible assets with finite lives, for recoverability whenever events or changes in circumstances indicate that the carrying amount of the assets may not be fully recoverable. The Company evaluates assets for potential impairment by comparing estimated future undiscounted net cash flows to the carrying amount of the asset. If the carrying amount of the assets exceeds the estimated future undiscounted cash flows, impairment is measured based on the difference between the carrying amount of the assets and fair value which is generally an expected present value cash flow technique. Management’s policy in determining whether an impairment indicator exists comprises measurable operating performance criteria as well as other qualitative measures.
Intangible assets, other than indefinite-lived intangible assets, are amortized over the estimated useful life of the asset based on the pattern in which the economic benefits are expected to be consumed or otherwise used up or, if that pattern is not readily determinable, on a straight-line basis. The useful life is the period over which the assets are expected to contribute directly or indirectly to future cash flows. Intangible assets are not written-off in the period of acquisition unless they become impaired during that period.
The Company regularly evaluates the remaining useful life of each intangible asset that is being amortized to determine whether events and circumstances warrant a revision to the remaining period of amortization. If the estimate of the intangible asset’s remaining useful life is changed, the remaining carrying amount of the intangible asset is amortized prospectively over that revised remaining useful life.
Income Taxes
The Company accounts for income taxes in accordance with ASC 740, Accounting for Income Taxes ("ASC 740"), which requires the recognition of tax benefits or expenses on temporary differences between the financial reporting and tax bases of its assets
F-
12
and liabilities by applying the enacted tax rates in effect for the year in which the differences are expected to reverse. Such net tax effects on temporary differences are reflected on the Company’s consolidated balance sheets as deferred tax assets and liabilities. Deferred tax assets are reduced by a valuation allowance when the Company believes that it is more-likely-than-not that some portion or all of the deferred tax assets will not be realized.
ASC 740-10 prescribes a two-step approach for the recognition and measurement of tax benefits associated with the positions taken or expected to be taken in a tax return that affect amounts reported in the financial statements. The Company has reviewed and will continue to review the conclusions reached regarding uncertain tax positions, which may be subject to review and adjustment at a later date based on ongoing analyses of tax laws, regulations and interpretations thereof. To the extent that the Company’s assessment of the conclusions reached regarding uncertain tax positions changes as a result of the evaluation of new information, such change in estimate will be recorded in the period in which such determination is made. The Company reports income tax-related interest and penalties relating to uncertain tax positions, if applicable, as a component of income tax expense.
Comprehensive Loss
Comprehensive loss includes net loss and all changes in equity for cumulative translation adjustments resulting from the consolidation of foreign subsidiaries’ financial statements.
Research and Development
Research and development ("R&D") activities are expensed as incurred. Primarily R&D costs consist of direct and allocated expenses incurred with the process of formulation, clinical research, and validation associated with new product development. Upfront and milestone payments made to third parties in connection with R&D collaborations are expensed as incurred up to the point of regulatory approval or when there is no alternative future use.
Intellectual Property Legal Development Expenses
The Company expenses external intellectual property legal development expenses as incurred. These costs relate to legal challenges of innovator’s patents for invalidity or non-infringement, which are customary in the generic pharmaceutical industry, and are incurred predominately during development of a product and prior to regulatory approval. Associated costs include, but are not limited to, formulation assessments, patent challenge opinions and strategy, and litigation expenses to defend the intellectual property supporting the Company's regulatory filings.
Shipping Costs
The Company records the costs of shipping product to its customers as a component of selling, general, and administrative expenses as incurred. Shipping costs were
$21 million
,
$15 million
and
$13 million
for the years ended
December 31, 2018
,
2017
and
2016
, respectively.
Reclassifications
Certain prior period balances have been reclassified to conform to the current period presentation, including combining depreciation and amortization expense into the respective cost of goods sold, selling, general and administrative and R&D expense presentation on the consolidated statements of operations, as well as combining accounts payable and accrued expenses and combining long-term debt and revolving credit facility in the balance sheet presentation.
Recently Adopted Accounting Pronouncements
In May 2017, the FASB issued Accounting Standards Update ("ASU") 2017-09,
Compensation-Stock Compensation (Topic 718): Scope of Modification Accounting
, which provides guidance about which changes to the terms or conditions of a stock-based payment award require an entity to apply modification accounting in Topic 718. The guidance will be effective for annual and interim periods beginning after December 15, 2017, with early adoption permitted. The amendments in this ASU should be applied prospectively to an award modified on or after the adoption date. The Company adopted ASU 2017-09 on January 1, 2018 and it did not have an effect on the Company’s consolidated financial statements.
In November 2016, the FASB issued ASU 2016-18,
Statement of Cash Flows (Topic 230): Restricted Cash (a consensus of the FASB Emerging Issues Task Force)
, to clarify how entities should present restricted cash and restricted cash equivalents in the statement of cash flows. The guidance requires entities to show the changes in the total of cash, cash equivalents, restricted cash and restricted cash equivalents in the statement of cash flows.
F-
13
As a result, entities will no longer present transfers between cash and cash equivalents and restricted cash and restricted cash equivalents in the statement of cash flows. The guidance should be applied retrospectively and is effective for the annual period beginning after December 15, 2018. The Company early adopted ASU 2016-18 on January 1, 2018. This guidance was applied retrospectively and, accordingly, prior period amounts have been revised.
In October 2016, the FASB issued ASU 2016-16
, Income Taxes (Topic 740): Intra-Entity Transfers of Assets Other Than Inventory
, that will require companies to account for the income tax effects of intercompany transfers of assets other than inventory (e.g., intangible assets) when the transfer occurs. The guidance is effective for annual periods beginning after December 15, 2018 and interim periods within annual periods beginning after December 15, 2019. Early adoption is permitted as of the beginning of an annual period (i.e., early adoption is permitted only in the first interim period). The Company early adopted ASU 2016-16 on January 1, 2018 and it did not have an effect on the Company's consolidated financial statements.
In August 2016, the FASB issued ASU 2016-15,
Statement of Cash Flows (Topic 230): Classification of Certain Cash Receipts and Cash Payments (a consensus of the Emerging Issues Task Force)
, to clarify how entities should classify certain cash receipts and cash payments on the statement of cash flows. The new guidance also clarifies how the predominance principle should be applied when cash receipts and cash payments have aspects of more than one class of cash flows. The guidance will be applied retrospectively and is effective for the Company for the annual period beginning after December 15, 2018. Early adoption is permitted. The Company early adopted ASU 2016-15 on January 1, 2018 and it did not have an effect on the Company’s consolidated financial statements.
In May 2014, the FASB issued ASU 2014-09,
Revenue from Contracts with Customers
. Subsequent to the issuance of Topic 606, the FASB clarified the guidance through several Accounting Standard Updates. This guidance represents a comprehensive new revenue recognition model that requires a company to recognize revenue to depict the transfer of promised goods or services to customers in an amount that reflects the consideration to which that company expects to be entitled to receive in exchange for those goods or services. This update sets forth a new five-step revenue recognition model which replaces the prior revenue recognition guidance in its entirety and is intended to eliminate numerous industry-specific pieces of revenue recognition guidance that have historically existed.
On January 1, 2018, the Company adopted Accounting Standards Codification ("ASC") 2014-09 and associated ASU's (collectively "Topic 606"), using the modified retrospective method, applied to all contracts not completed as of the date of adoption. This method requires the cumulative effect of the adoption to be recognized as an adjustment to opening retained earnings in the period of adoption.
The Company recorded a
$5 million
reduction to accumulated deficit as of January 1, 2018 due to the cumulative impact of adoption Topic 606. There is an acceleration of revenue for certain product sale arrangements which are designed to include profit share payments upon the customer’s sell-through of certain products purchased from the Company. Previously under Topic 605, the Company deferred revenue until its customers sold the product through to their end customers, at which point the Company considered the profit share payments to be earned and collection reasonably assured. Under Topic 606, an estimate of the profit share payments is included in the transaction price as variable consideration and is recognized at the time the Company transfers control of the product to its customer. This change resulted in a cumulative-effect adjustment upon adoption of the ASU as of January 1, 2018 which was not material to the financial statements. In the second quarter of 2018, the Company made a correction to the cumulative impact adjustment as of January 1, 2018 by reducing accumulated deficit by
$2 million
. The Company does not believe that this adjustment is material to its financial statements and it had no impact on any prior periods. Refer to
Note 4. Revenue Recognition
for additional disclosures required by Topic 606.
Under the modified retrospective method of adoption of Topic 606, the Company is also required to disclose the impact to revenues had the Company continued to follow its accounting policies under the previous revenue recognition guidance. For the year ended December 31, 2018 the impact of adopting ASC 606 was not material to reported revenue, therefore comparison of revenue and operating income between periods are not materially affected by the adoption of Topic 606. Refer to
Note 4. Revenue Recognition
for additional disclosures required by Topic 606.
Recently Issued Accounting Pronouncements
In August 2018, the FASB issued ASU 2018-13,
Fair Value Measurement (Topic 82): Disclosure Framework—Changes to the Disclosure Requirements for Fair Value Measurement,
which modifies the disclosure requirements on fair value measurement. The guidance is effective for annual periods beginning after December 15, 2019 and interim periods within those annual periods, and early adoption is permitted. The Company is currently evaluating the impact that the standard will have on its consolidated financial statements.
F-
14
In January 2017, the FASB issued ASU 2017-04,
Intangibles—Goodwill and Other (Topic 350): Simplifying the Test for Goodwill Impairment
that eliminates the requirement to calculate the implied fair value of goodwill (i.e., Step 2 of today’s goodwill impairment test) to measure a goodwill impairment charge. Instead, entities will record an impairment charge based on the excess of a reporting unit’s carrying amount over its fair value (i.e., measure the charge based on today’s Step 1). The standard will be applied prospectively and is effective for the Company’s annual and interim impairment tests performed in periods beginning after December 15, 2019. Early adoption is permitted for annual and interim goodwill impairment testing dates after January 1, 2017. The Company is evaluating the impact of this new guidance on its consolidated financial statements.
In June 2016, the FASB issued ASU 2016-13,
Financial Instruments—Credit Losses (Topic 326): Measurement of Credit Losses on Financial Instruments
, guidance that changes the impairment model for most financial assets including trade receivables and certain other instruments that are not measured at fair value through net income. The standard will replace today’s "incurred loss" approach with an "expected loss" model for instruments measured at amortized cost and require entities to record allowances for available-for-sale debt securities rather than reduce the carrying amount, as they do today under the other-than-temporary impairment model. It also simplifies the accounting model for purchased credit-impaired debt securities and loans. Entities will apply the standard’s provisions as a cumulative effect adjustment to retained earnings as of the beginning of the first reporting period in which the guidance is effective. The guidance is effective for the Company for the annual period beginning after December 15, 2019. The Company is evaluating the impact of this new guidance on its consolidated financial statements.
In February 2016, the FASB issued ASU 2016-02,
Leases (Topic 842)
to improve financial reporting of leasing transactions. Topic 842 requires lessees to recognize most leases on their balance sheet, makes selected changes to lessor accounting and requires disclose of additional key information about leases. In July 2018, the FASB issued clarifying guidance to the topic in ASU No. 2018-11 and No. 2018-10, “Leases (Topic 842),” which defined several practical expedients for adoption and clarified new accounting methodologies. The standard is effective for annual and interim reporting periods beginning after December 15, 2018. The Company will adopt Topic 842 on a modified retrospective basis, applying the transition requirements as of January 1, 2019 with certain practical expedients available.
As part of the Company's impact assessment, it has performed a scoping exercise and determined its lease population. A framework for the lease identification process has been developed and the Company is in the process of assessing any potential impacts on its internal controls and processes related to both the implementation and ongoing compliance of the new guidance.
While the Company is still finalizing the potential impacts of the standard, it currently expects the most significant impact will be the recognition of right of use assets and lease liabilities for operating leases. The Company estimates adoption of the standard will result in an increase of less than
5%
of total assets and liabilities in its consolidated balance sheet as of January 1, 2019. The Company does not expect the adoption will have a material impact on its consolidated statements of operations.
In January 2016, the FASB issued ASU 2016-01,
Financial Instruments—Overall (Subtopic 825-10), Recognition and Measurement of Financial Assets and Financial Liabilities
, which addresses certain aspects of recognition, measurement, presentation, and disclosure of financial instruments. The guidance is effective for annual periods and interim periods within those annual periods beginning after December 15, 2018, and early adoption is not permitted. The Company is currently evaluating the impact that the standard will have on its consolidated financial statements.
F-
15
3. Acquisitions and Divestitures
Acquisitions
Impax Acquisition
On May 4, 2018, the Company completed the Combination, as described in
Note 1. Nature of Operations and Basis of Presentation
. For the years ended
December 31, 2018
and
2017
, transaction costs associated with the Impax acquisition of
$23 million
and
$9 million
were recorded in acquisition, transaction-related and integration expenses (
no
ne for the year ended December 31, 2016).
The Impax acquisition was accounted for under the acquisition method of accounting, with Amneal as the accounting acquirer of Impax. Amneal was identified as the accounting acquirer because: (i) Amneal exchanged Amneal Common Units with the Company for the Company’s interest in Impax, (ii) Holdings held a majority interest in the Company with an effective voting interest of approximately
75%
on a fully diluted and as converted basis through its ownership of Class B Common Stock, and (iii) a majority of the directors on the Company's board of directors were designated by Holdings. As such, the cost to acquire Impax was allocated to the respective assets acquired and liabilities assumed based on their estimated fair values as of the closing date of the Combination.
The measurement of the consideration transferred by Amneal for its interest in Impax is based on the fair value of the equity interest that Amneal would have had to issue to give the Impax shareholders the same percentage equity interest in the Company, which is equal to approximately
25%
of Amneal, on May 4, 2018. However, the fair value of Impax's common stock was used to calculate the consideration for the Combination because Impax's common stock had a quoted market price and the Combination involved only the exchange of equity.
The purchase price, net of cash acquired, is calculated as follows (in thousands, except share amount and price per share):
|
Fully diluted Impax share number
(1)
|
73,288,792
|
|
||
|
Closing quoted market price of an Impax common share on May 4, 2018
|
$
|
18.30
|
|
|
|
Equity consideration - subtotal
|
$
|
1,341,185
|
|
|
|
Add: Fair value of Impax stock options as of May 4, 2018
(2)
|
22,610
|
|
||
|
Total equity consideration
|
1,363,795
|
|
||
|
Add: Extinguishment of certain Impax obligations, including accrued and unpaid interest
|
320,290
|
|
||
|
Less: Cash acquired
|
(37,907
|
)
|
||
|
Purchase price, net of cash acquired
|
$
|
1,646,178
|
|
|
|
(1)
Represents shares of Impax Common Stock issued and outstanding immediately prior to the Combination.
|
||||
|
(2)
Represents the fair value of 3.0 million fully vested Impax stock options valued using the Black-Scholes options pricing model.
|
||||
F-
16
The following is a summary of the preliminary purchase price allocation for the Impax acquisition (in thousands):
|
Preliminary Fair Values
As of December 31, 2018 |
||||
|
Trade accounts receivable, net
|
$
|
211,762
|
|
|
|
Inventories
|
183,088
|
|
||
|
Prepaid expenses and other current assets
|
91,430
|
|
||
|
Property, plant and equipment
|
87,472
|
|
||
|
Goodwill
|
399,988
|
|
||
|
Intangible assets
|
1,574,929
|
|
||
|
Other
|
55,790
|
|
||
|
Total assets acquired
|
2,604,459
|
|
||
|
Accounts payable
|
47,912
|
|
||
|
Accrued expenses and other current liabilities
|
277,176
|
|
||
|
Long-term debt
|
599,400
|
|
||
|
Other long-term liabilities
|
33,793
|
|
||
|
Total liabilities assumed
|
958,281
|
|
||
|
Net assets acquired
|
$
|
1,646,178
|
|
|
Intangible Assets
The acquired intangible assets are being amortized over their estimated useful lives as follows (in thousands):
|
Preliminary Fair Values
|
Weighted-Average Useful Life (Years)
|
|||||
|
Marketed product rights
|
$
|
1,045,617
|
|
12.9
|
||
In addition to the amortizable intangible assets noted above,
$529 million
was allocated to IPR&D, which is currently not subject to amortization.
The estimated fair value of the in-process research and development and identifiable intangible assets was determined using the "income approach," which is a valuation technique that provides an estimate of the fair value of an asset based on market participant expectations of the cash flows an asset would generate over its remaining useful life. The assumptions, including the expected projected cash flows, utilized in the preliminary purchase price allocation and in determining the purchase price were based on management's best estimates as of the closing date of the Combination on May 4, 2018.
Some of the more significant assumptions inherent in the development of those asset valuations include the estimated net cash flows for each year for each asset or product (including net revenues, cost of sales, R&D, selling and marketing costs and working capital / contributory asset charges), the appropriate discount rate to select in order to measure the risk inherent in each future cash flow stream, the assessment of each asset’s life cycle, the potential regulatory and commercial success risks, competitive trends impacting the asset and each cash flow stream, as well as other factors. No assurances can be given that the underlying assumptions used to prepare the discounted cash flow analysis will not change. For these and other reasons, actual results may vary significantly from estimated results.
F-
17
Goodwill
Of the total goodwill acquired in connection with the Impax acquisition, approximately
$359 million
has been allocated to the Company’s Specialty segment and approximately
$41 million
has been allocated to the Generics segment. Goodwill is calculated as the excess of the consideration transferred over the net assets recognized and represents the expected revenue and cost synergies of the combined company. Factors that contributed to the Company’s recognition of goodwill include the Company’s intent to expand its generic and specialty product portfolios and to acquire certain benefits from the Impax product pipelines, in addition to the anticipated synergies that the Company expects to generate from the acquisition.
Gemini Laboratories, LLC Acquisition
On May 7, 2018, the Company acquired
98.0%
of the outstanding equity interests in Gemini Laboratories, LLC ("Gemini") for total consideration of
$120 million
, net of
$4 million
cash acquired. At closing, the acquisition was funded by a
$43 million
up-front cash payment (including
$3 million
related to a preliminary working capital adjustment) from cash on hand and a
$77 million
unsecured promissory note. The note payable bears interest at
3%
annually. The note payable and related accrued interest was paid on November 7, 2018, its maturity date. Additionally, the Company made a payment of
$3 million
in July 2018 related to the final working capital adjustment. In connection with the acquisition of Gemini, the Company recorded an amount representing the non-controlling interest of Gemini of
$3 million
.
Gemini is a pharmaceutical company with a portfolio that includes licensed and owned, niche and mature branded products. Gemini was a related party of the Company; refer to
Note 21. Related Party Transactions,
for further details.
For the year ended
December 31, 2018
, transaction costs associated with the Gemini acquisition of
$0.4 million
were recorded in acquisition, transaction-related and integration expenses (
no
ne for the years ended December 31, 2017 and 2016). The Gemini acquisition was accounted for under the acquisition method of accounting.
The following is a summary of the preliminary purchase price allocation for the Gemini acquisition (in thousands):
|
Preliminary Fair Values
As of December 31, 2018 |
||||
|
Trade accounts receivable, net
|
$
|
8,158
|
|
|
|
Inventories
|
1,851
|
|
||
|
Prepaid expenses and other current assets
|
3,795
|
|
||
|
Property, plant and equipment, net
|
11
|
|
||
|
Goodwill
|
1,500
|
|
||
|
Intangible assets
|
142,740
|
|
||
|
Other
|
324
|
|
||
|
Total assets acquired
|
158,379
|
|
||
|
Accounts payable
|
1,764
|
|
||
|
Accrued expenses and other current liabilities
|
14,644
|
|
||
|
License liability
|
20,000
|
|
||
|
Total liabilities assumed
|
36,408
|
|
||
|
Net assets acquired
|
$
|
121,971
|
|
|
F-
18
The acquired intangible assets are being amortized over their estimated useful lives as follows (in thousands):
|
Preliminary Fair Values
|
Weighted-Average Useful Life
|
|||||
|
Product rights for licensed / developed technology
|
$
|
110,350
|
|
10 years
|
||
|
Product rights for developed technologies
|
5,500
|
|
9 years
|
|||
|
Product rights for out-licensed generics royalty agreement
|
390
|
|
2 years
|
|||
|
$
|
116,240
|
|
||||
In addition to the amortizable intangibles noted above,
$27 million
was allocated to IPR&D, which is currently not subject to amortization.
The goodwill recognized of
$2 million
is allocated to the Company's Specialty segment.
T
he Company makes an initial allocation of the purchase price at the date of acquisition based upon its understanding of the fair value of the acquired assets and assumed liabilities. The Company obtains this information during due diligence and through other sources. In the months after closing, as the Company obtains additional information about these assets and liabilities and learns more about the newly acquired business, it is able to refine the estimates of fair value and more accurately allocate the purchase price. Only items identified as of the acquisition date are considered for subsequent adjustment. The Company is continuing to evaluate certain pre-acquisition contingencies associated with its 2018 acquisitions. The Company will make appropriate adjustments to the purchase price allocation prior to completion of the measurement period, as required.
The Company's consolidated statements of operations for the year ended
December 31, 2018
include the results of operations of Impax and Gemini subsequent to May 4, 2018 and May 7, 2018, respectively. For the periods from their respective acquisition dates to December 31, 2018, Impax contributed net revenue of
$399 million
and an estimated pre-tax loss of
$104 million
and Gemini contributed net revenue of
$32 million
and estimated pre-tax income of
$10 million
.
Unaudited Pro Forma Information
The unaudited pro forma combined results of operations for the years ended
December 31, 2018
,
2017
and
2016
(assuming the closing of the Combination occurred on January 1, 2016) are as follows (in thousands):
|
Years Ended December 31,
|
|||||||||||
|
2018
|
2017
|
2016
|
|||||||||
|
Net revenue
|
$
|
1,839,083
|
|
$
|
1,809,441
|
|
$
|
1,842,654
|
|
||
|
Net loss
|
(163,915
|
)
|
(340,223
|
)
|
(535,087
|
)
|
|||||
|
Net loss attributable to Amneal Pharmaceuticals, Inc.
|
$
|
(30,270
|
)
|
$
|
(109,920
|
)
|
$
|
(110,638
|
)
|
||
The pro forma results have been prepared for comparative purposes only and are not necessarily indicative of the actual results of operations had the closing of the Combination taken place on January 1, 2016. Furthermore, the pro forma results do not purport to project the future results of operations of the Company.
The unaudited pro forma information reflects primarily the following non-recurring adjustments (all of which were adjusted for the applicable tax impact):
|
•
|
Adjustments to costs of goods sold related to the inventory acquired; and
|
|
•
|
Adjustments to selling, general and administrative expense related to transaction costs directly attributable to the transactions.
|
Divestitures
Australia Divestiture
On August 31, 2017, Amneal sold
100%
of the equity of its Australian business, Amneal Pharma Pty Ltd, to Arrow Pharmaceuticals Pty Ltd (“Arrow”) for cash consideration of
$10 million
which was received in October 2017. The consideration received was subject to certain working capital adjustments. The carrying value of the net assets sold was
$32 million
, including intangible
F-
19
assets of
$14 million
and goodwill of
$2 million
. As a result of the sale, Amneal recognized a loss of
$24 million
, inclusive of divestiture costs of
$2 million
and a release of foreign currency translation adjustment loss of
$0.4 million
, within the loss on sale of certain international businesses for the year ended December 31, 2017.
As part of the disposition, Amneal agreed to indemnify Arrow for certain claims for up to
18 months
from the closing date of the disposition. Additionally, Amneal will allow Arrow to use the Amneal trademark in Australia to enable Arrow to transfer the labeling and marketing authorizations from the Amneal name to the Arrow name for a period of
three
years. Amneal will supply Arrow with Linezolid for a period of
three years
and will further develop
four
other products for sale in Australia during the
three years
period. All terms of the sale were settled in 2018.
Spain/Nordics Divestitures
On September 30, 2017, Amneal sold
100%
of the equity and certain marketing authorizations, including associated dossiers, of its Amneal Nordic ApS and Amneal Pharma Spain S.L. subsidiaries to Aristo Pharma GmbH (“Aristo”) for cash consideration of
$8 million
. Amneal received
$7 million
in October 2017 and the remainder was to be paid within
60 days
of closing of the disposition based on the actual closing date net working capital of the entities sold. The carrying value of the net assets sold was
$13 million
, including intangible assets of
$1 million
and goodwill of
$2 million
. As a result of the sale, Amneal recognized a loss of
$5 million
, inclusive of a release of foreign currency translation adjustment loss of
$0.5 million
, within the loss on sale of certain international businesses for the year ended December 31, 2017.
Aristo was also required to make an additional payment within
12 months
of the closing date of the disposition based on the actual inventory, transferred as part of the transaction, that the buyer sold over this period. All terms of the sale were settled in 2018.
4. Revenue Recognition
Performance Obligations
The Company’s performance obligation is the supply of finished pharmaceutical products to its customers. The Company’s customers consist primarily of major wholesalers, retail pharmacies, managed care organizations, purchasing co-ops, hospitals, government agencies and pharmaceutical companies. The Company’s customer contracts generally consist of both a master agreement, which is signed by the Company and its customer, and a customer submitted purchase order, which is governed by the terms and conditions of the master agreement. Customers purchase product by direct channel sales from the Company or by indirect channel sales through various distribution channels.
Revenue is recognized when the Company transfers control of its products to the customer, which typically occurs at a point-in-time, upon delivery. Substantially all of the Company’s net revenues relate to products which are transferred to the customer at a point-in-time.
The Company offers standard payment terms to its customers and has elected the practical expedient to not adjust the promised amount of consideration for the effects of a significant financing, since the period between when the Company transfers the product to the customer and when the customer pays for that product is one year or less. Taxes collected from customers relating to product sales and remitted to governmental authorities are excluded from revenues. The consideration amounts due from customers as a result of product sales are subject to variable consideration, as described further below.
The Company offers standard product warranties which provide assurance that the product will function as expected and in accordance with specifications. Customers cannot purchase warranties separately and these warranties do not give rise to a separate performance obligation.
The Company permits the return of product under certain circumstances, mainly upon product expiration, instances of shipping errors or where product is damaged in transit. The Company accrues for the customer’s right to return as part of its variable consideration. See below for further details.
F-
20
Variable Consideration
The Company includes an estimate of variable consideration in its transaction price at the time of sale, when control of the product transfers to the customer. Variable consideration includes but is not limited to: chargebacks, rebates, group purchasing organization ("GPO") fees, prompt payment (cash) discounts, consideration payable to the customer, billbacks, Medicaid and other government pricing programs, price protection and shelf stock adjustments, sales returns, and profit shares.
The Company assesses whether or not an estimate of its variable consideration is constrained and has determined that the constraint does not apply, since it is probable that a significant reversal in the amount of cumulative revenue will not occur in the future when the uncertainty associated with the variable consideration is subsequently resolved. The Company’s estimates for variable consideration are adjusted as required at each reporting period for specific known developments that may result in a change in the amount of total consideration it expects to receive.
Chargebacks
In the case an indirect customer purchases product from their preferred wholesaler instead of directly from the Company, and the contract price charged to the indirect customer is lower than the wholesaler pricing, the Company pays the direct customer (wholesaler) a chargeback for the price differential. The Company estimates its chargeback accrual based on its estimates of the level of inventory of its products in the distribution channel that remain subject to chargebacks and historical chargeback rates. The estimate of the level of products in the distribution channel is based primarily on data provided by key customers.
Rebates
The Company pays fixed or volume-based rebates to its customers based on a fixed amount, fixed percentage of product sales or based on the achievement of a specified level of purchases. The Company’s rebate accruals are based on actual net sales, contractual rebate rates negotiated with customers, and expected purchase volumes / corresponding tiers based on actual sales to date and forecasted amounts.
Group Purchasing Organization Fees
The Company pays fees to GPOs for administrative services that the GPOs perform in connection with the purchases of product by the GPO participants who are the Company’s customers. The Company’s GPO fee accruals are based on actual net sales, contractual fee rates negotiated with GPOs and the mix of the products in the distribution channel that remain subject to GPO fees.
Prompt Payment (Cash) Discounts
The Company provides customers with prompt payment discounts which may result in adjustments to the price that is invoiced for the product transferred, in the case that payments are made within a defined period. The Company’s prompt payment discount accruals are based on actual net sales and contractual discount rates.
Consideration Payable to the Customer
The Company pays administrative and service fees to its customers based on a fixed percentage of the product price. These fees are not in exchange for a distinct good or service and therefore are recognized as a reduction of the transaction price. The Company accrues for these fees based on actual net sales, contractual fee rates negotiated with the customer and the mix of the products in the distribution channel that remain subject to fees.
Billbacks
In the case an indirect customer purchases product from their preferred wholesaler instead of directly from the Company, and the contract price charged to the indirect customer is higher than contractual pricing, the Company pays the indirect customer a billback for the price differential. The Company estimates its billback accrual based on its estimates of the level of inventory of its products in the distribution channel that remain subject to billbacks and historical billback rates. The estimate of the level of products in the distribution channel is based primarily on data provided by key customers.
F-
21
Medicaid and Other Government Pricing Programs
The Company complies with required rebates mandated by law under Medicaid and other government pricing programs. The Company estimates its government pricing accruals based on monthly sales, historical experience of claims submitted by the various states and jurisdictions, historical rates and estimated lag time of the rebate invoices.
Price Protection and Shelf Stock Adjustments
The Company provides customers with price protection and shelf stock adjustments which may result in an adjustment to the price charged for the product transferred, based on differences between old and new prices which may be applied to the customer’s on-hand inventory at the time of the price change. The Company accrues for these adjustments when its expected value of an adjustment is greater than zero, based on contractual pricing, actual net sales, accrual rates based on historical average rates, and estimates of the level of inventory of its products in the distribution channel that remain subject to these adjustments. The estimate of the level of products in the distribution channel is based primarily on data provided by key customers.
Sales Returns
The Company permits the return of product under certain circumstances, mainly upon product expiration, instances of shipping errors or where product is damaged in transit, and occurrences of product recalls. The Company’s product returns accrual is primarily based on estimates of future product returns based generally on actual net sales, estimates of the level of inventory of its products in the distribution channel that remain subject to returns, estimated lag time of returns and historical return rates. The estimate of the level of products in the distribution channel is based primarily on data provided by key customers.
Profit Shares
For certain product sale arrangements, the Company earns a profit share upon the customer’s sell-through of the product purchased from the Company. The Company estimates its profit shares based on actual net sales, estimates of the level of inventory of its products in the distribution channel that remain subject to profit shares, and historical rates of profit shares earned. The estimate of the level of products in the distribution channel is based primarily on data provided by key customers.
Concentration of Revenue
The Company's
three
largest customers account for approximately
83%
,
79%
and
78%
of total gross sales of products for the years ended
December 31, 2018
,
2017
and
2016
, respectively.
F-
22
5. Alliance and Collaboration
The Company has entered into several alliance, collaboration, license, distribution and similar agreements with respect to certain of its products and services with third-party pharmaceutical companies. The consolidated statements of operations include revenue recognized under agreements the Company has entered into to develop marketing and/or distribution relationships with its partners to fully leverage the technology platform and revenue recognized under development agreements which generally obligate the Company to provide research and development services over multiple periods. The Company's significant arrangements are discussed below.
Levothyroxine License and Supply Agreement; Transition Agreement
On August 16, 2018, the Company entered into a license and supply agreement with Jerome Stevens Pharmaceuticals, Inc. ("JSP") for levothyroxine sodium tablets ("Levothyroxine"). The Company will be JSP's exclusive commercial partner in the U.S. market for a
10
-year term commencing on March 22, 2019. The Company will be required to make a payment of
$50 million
to JSP within
30 days
of the Company's first commercial sale of Levothyroxine. Additionally, the agreement requires the Company to make an additional
$20 million
payment to JSP if the Food and Drug Administration ("FDA") has not given final approval to a third-party competitor's abbreviated new drug application for generic levothyroxine sodium tablets with an AB1, AB2, AB3 or AB4 designation by the first anniversary date of the Company's first sale of Levothyroxine. During January 2019, the FDA approved a third-party competitor's abbreviated new drug application for generic levothyroxine with an AB2 designation. Therefore, the Company does not believe that it will be required to make the additional $20 million payment to JSP. The agreement also provides for the Company to pay a profit share to JSP based on net profits of the Company's sales of Levothyroxine, after considering product costs. For the year ended
December 31, 2018
, the Company has made
no
payments under this agreement. The Company will not be required to make any payments to JSP prior to March 22, 2019.
On November 9, 2018, the Company entered into a transition agreement ("Transition Agreement") with Lannett Company (“Lannett”) and JSP. Under the terms of the agreement, the Company assumed the distribution and marketing of Levothyroxine from Lannett beginning December 1, 2018 through March 22, 2019, ahead of the commencement date of the license and supply agreement with JSP described above.
In accordance with the terms of the Transition Agreement, the Company agreed to make
$50 million
of non-refundable payments to Lannett, subject to certain adjustments, which will be expensed to cost of goods sold as the Company sells Levothyroxine through March 22, 2019. In December 2018, the Company recorded a
$3 million
adjustment to the
$50 million
Transition Agreement to create a net payable of approximately
$47 million
.
The Company made a $
43 million
non-refundable upfront profit-sharing payment to Lannett in December 2018. During the fourth quarter of 2018, the Company recognized
$10 million
of the
$47 million
transition contract asset to cost of goods sold. As of December 31, 2018, the Company has a remaining
$36 million
transition contract asset in prepaid expenses and other current assets and a
$4 million
transition contract liability in accounts payable and accrued expenses.
In February 2019, the Company made the remaining
$4 million
payment to fully settle the remaining non-refundable amount owed to Lannett under the Transition Agreement.
Biosimilar Licensing and Supply Agreement
On May 7, 2018, the Company entered into a licensing and supply agreement, with Mabxience S.L., for its biosimilar candidate for Avastin® (bevacizumab). The Company will be the exclusive partner in the U.S. market. The Company will pay up-front, development and regulatory milestone payments as well as commercial milestone payments on reaching pre-agreed sales targets in the market to Mabxience, up to
$72 million
. For the year ended
December 31, 2018
, the Company expensed milestone payments of
$5 million
in research and development expense.
Adello License and Commercialization Agreement
On October 1, 2017, Amneal and Adello Biologics, LLC ("Adello"), a related party, entered into a license and commercialization agreement. Adello granted Amneal an exclusive license, under its New Drug Application, to distribute and sell
two
bio-similar products in the U.S. Adello is responsible for development, regulatory filings, obtaining FDA approval, and manufacturing, and Amneal is responsible for marketing, selling and pricing activities. The term of the agreement is
10
-years from the respective product’s launch date.
F-
23
In connection with the agreement, Amneal paid an upfront amount of
$2 million
in October 2017 for execution of the agreement which was expensed in research and development expenses. The agreement also provides for potential future milestone payments to Adello of (i) up to
$21 million
relating to regulatory approval, (ii) up to
$43 million
for successful delivery of commercial launch inventory, (iii) between
$20 million
and
$50 million
relating to number of competitors at launch for one product, and (iv) between
$15 million
and
$68 million
for the achievement of cumulative net sales for both products. The milestones are subject to certain performance conditions which may or may not be achieved, including FDA filing, FDA approval, launch activities and commercial sales volume objectives. In addition, the agreement provides for Amneal to pay a profit share equal to
50%
of net profits, after considering manufacturing and marketing costs. The research and development expenses for payments made to Adello during the years ended
December 31, 2018
and
2017
were immaterial.
Distribution, License, Development and Supply Agreement with AstraZeneca UK Limited
In January 2012, Impax entered into an agreement with AstraZeneca UK Limited ("AstraZeneca") to distribute branded products under the terms of a distribution, license, development and supply Agreement (the "AZ Agreement"). The parties subsequently entered into a First Amendment to the AZ Agreement dated May 31, 2016 (as amended, the "AZ Amendment"). Under the terms of the AZ Agreement, AstraZeneca granted to Impax an exclusive license to commercialize the tablet, orally disintegrating tablet and nasal spray formulations of Zomig® (zolmitriptan) products for the treatment of migraine headaches in the United States and in certain U.S. territories, except during an initial transition period when AstraZeneca fulfilled all orders of Zomig® products on Impax’s behalf and AstraZeneca paid to Impax the gross profit on such Zomig® products. Pursuant to the AZ Amendment, under certain conditions, and depending on the nature and terms of the study agreed to with the FDA, Impax agreed to conduct, at its own expense, the juvenile toxicity study and pediatric study required by the FDA under the Pediatric Research Equity Act ("PREA") for approval of the nasal formulation of Zomig
®
for the acute treatment of migraine in pediatric patients ages six through eleven years old, as further described in the study protocol mutually agreed to by the parties (the "PREA Study"). In consideration for Impax conducting the PREA Study at its own expense, the AZ Amendment provides for the total royalty payments payable by Impax to AstraZeneca on net sales of Zomig
®
products under the AZ Agreement to be reduced by an aggregate amount of
$30 million
to be received in quarterly amounts specified in the Amendment beginning from the quarter ended
June 30, 2016
and through the quarter ended
December 31, 2020
. In the event the royalty reduction amounts exceed the royalty payments payable by Impax to AstraZeneca pursuant to the AZ Agreement in any given quarter, AstraZeneca will be required to pay Impax an amount equal to the difference between the royalty reduction amount and the royalty payment payable by Impax to AstraZeneca. Impax’s commitment to perform the PREA Study may be terminated, without penalty, under certain circumstances as set forth in the AZ Amendment. The Company recognizes the amounts received from AstraZeneca for the PREA Study as a reduction to research and development expense.
In May 2013, Impax’s exclusivity period for branded Zomig® tablets and orally disintegrating tablets expired and Impax launched authorized generic versions of those products in the United States. As discussed above, pursuant to the AZ Amendment, the total royalty payments payable by Impax to AstraZeneca on net sales of Zomig
®
products under the AZ Agreement is reduced by certain specified amounts beginning from the quarter ended
June 30, 2016
and through the quarter ended
December 31, 2020
, with such reduced royalty amounts totaling an aggregate amount of
$30 million
. The Company recorded cost of goods sold for royalties under this agreement of
$15 million
for the year ended
December 31, 2018
.
6. Restructuring and Asset-Related Charges
During the second quarter of 2018, in connection with the Combination, the Company committed to a restructuring plan to achieve cost savings. The Company expects to integrate its operations and reduce its combined cost structure through workforce reductions that eliminate duplicative positions and the consolidation of certain administrative, manufacturing and research and development facilities. In connection with this plan, the Company announced on May 10, 2018 that it intended to close its Hayward, California based operations (the "Plan").
The following table sets forth the components of the Company's restructuring and asset-related charges for the years ended
December 31, 2018
,
2017
and
2016
(in thousands):
|
Years Ended December 31,
|
|||||||||||
|
2018
|
2017
|
2016
|
|||||||||
|
Employee separation charges
(1)
|
$
|
45,118
|
|
$
|
—
|
|
$
|
—
|
|
||
|
Asset-related charges
(2)
|
11,295
|
|
—
|
|
—
|
|
|||||
|
Total restructuring and asset-related charges
|
$
|
56,413
|
|
$
|
—
|
|
$
|
—
|
|
||
F-
24
(1)
Employee separation charges include the cost of benefits provided pursuant to the Company’s severance programs for employees at the Company's Hayward, CA facility and other facilities.
(2)
Asset-related charges are primarily associated with the write-off of leasehold improvements in connection with the closing of our Hayward, CA facility.
The charges related to restructuring impacted segment earnings as follows (in thousands):
|
|
Years Ended December 31,
|
||||||||||
|
|
2018
|
2017
|
2016
|
||||||||
|
Generics
|
$
|
33,943
|
|
$
|
—
|
|
$
|
—
|
|
||
|
Specialty
|
4,076
|
|
—
|
|
—
|
|
|||||
|
Corporate
|
18,394
|
|
—
|
|
—
|
|
|||||
|
Total restructuring and asset-related charges
|
$
|
56,413
|
|
$
|
—
|
|
$
|
—
|
|
||
The following table shows the change in the employee separation-related liability associated with the Company's restructuring programs, which is included in accounts payable and accrued expenses (in thousands):
|
|
Employee Separation
|
||
|
Balance at December 31, 2017
|
$
|
—
|
|
|
Liabilities assumed in Impax acquisition
|
2,199
|
|
|
|
Charges to income
|
48,246
|
|
|
|
Change in estimated liability
|
(3,128
|
)
|
|
|
Payments
|
(25,205
|
)
|
|
|
Balance at December 31, 2018
|
$
|
22,112
|
|
7. Acquisition, Transaction-Related and Integration Expenses
The following table sets forth the components of the Company’s acquisition, transaction-related and integration expenses for the years ended
December 31, 2018
,
2017
and
2016
(in thousands).
|
|
Years Ended December 31,
|
||||||||||
|
|
2018
|
2017
|
2016
|
||||||||
|
Acquisition, transaction-related and integration expenses
(1)
|
$
|
35,319
|
|
$
|
9,403
|
|
$
|
70
|
|
||
|
Profit participation units
(2)
|
158,757
|
|
—
|
|
—
|
|
|||||
|
Transaction-related bonus
(3)
|
27,742
|
|
—
|
|
—
|
|
|||||
|
Total
|
$
|
221,818
|
|
$
|
9,403
|
|
$
|
70
|
|
||
(1)
Acquisition, transaction-related and integration expenses include professional service fees (e.g. legal, investment banking and accounting), information technology systems conversions, and contract termination/renegotiation costs.
(2)
Profit Participation Units expense relates to the accelerated vesting of certain of Amneal's profit participation units that occurred prior to the Closing of the Combination for current and former employees of Amneal for service prior to the Combination (see additional information in the paragraph below and
Note 19. Stockholders' Equity/ Members' Deficit
).
(3)
Transaction-related bonus is a cash bonus that was funded by Holdings for employees of Amneal for service prior to the closing of the Combination (see additional information in
Note 19. Stockholders' Equity/ Members' Deficit
).
F-
25
Accelerated Vesting of Profit Participation Units
Amneal’s historical capital structure included several classifications of membership and profit participation units. During the second quarter of
2018
, the Board of Managers of Amneal Pharmaceuticals LLC approved a discretionary modification to certain profit participation units concurrent with the Combination that immediately caused the vesting of all profit participation units that were previously issued to certain current or former employees for service prior to the Combination. The modification entitled the holders to
6,886,140
shares of Class A Common Stock with a fair value of
$126 million
on the date of the Combination and
$33 million
of cash. The cash and shares were distributed by Holdings with no additional shares issued by the Company. As a result of this transaction, the Company recorded a charge in acquisition, transaction-related and integration expenses and a corresponding capital contribution of
$159 million
for the year ended
December 31, 2018
.
8. Income taxes
As a result of the Combination (refer to
Note 1.
Nature of Operations and Basis of Presentation
), the Company became the sole managing member of Amneal, with Amneal being the predecessor for accounting purposes. Amneal is a limited liability company that is treated as a partnership for U.S. federal and for most applicable state and local income tax purposes. As a partnership, Amneal is not subject to U.S. federal and certain state and local income taxes. Any taxable income or loss generated by Amneal is passed through to and included in the taxable income or loss of its members, including the Company, on a pro rata basis subject to applicable tax regulations. The Company is subject to U.S. federal income taxes, in addition to state and local income taxes, with respect to its allocable share of any taxable income or loss of Amneal, as well as any stand-alone income or loss generated by the Company. Additionally, Amneal provides for income taxes in the various foreign jurisdictions in which it operates.
In connection with the Combination, the Company recorded a deferred tax asset for its outside basis difference in its investment in Amneal which was
$306 million
at May 4, 2018. Also, in connection with the Combination, the Company recorded a deferred tax asset of
$55 million
related to the net operating loss of Impax from January 1, 2018 through May 4, 2018 as well as certain federal and state credits and interest carryforwards of Impax that were attributable to the Company.
The Company records a valuation allowance against its deferred tax assets to reduce the net carrying value to an amount that it believes is more likely than not to be realized. As of
December 31, 2018
, the Company concluded, based on the weight of all available positive and negative evidence, those deferred tax assets recorded as part of the Combination are more likely than not to be realized. As such, no valuation allowance was recognized. The Company maintains a valuation allowance against certain of Amneal's foreign jurisdiction tax attributes.
In connection with the Combination, the Company entered into a tax receivable agreement ("TRA") for which it is generally required to pay to the other holders of Amneal Common Units 85% of the applicable tax savings, if any, in U.S. federal and state income tax that the Company is deemed to realize as a result of certain tax attributes of their Amneal Common Units sold to the Company (or exchanged in a taxable sale) and that are created as a result of (i) the sales of their Amneal Common Units for shares of Class A common stock and (ii) tax benefits attributable to payments made under the tax receivable agreement (including imputed interest). In connection with the exchanges which occurred as part of the PIPE Investment and the Closing Date Redemption (
Note 1. Nature of Operations and Basis of Presentation
), the Company recorded a TRA liability. At December 31, 2018, the Company has a
$193 million
TRA liability. Such amounts will be paid when such deferred tax assets are realized as a reduction to income taxes due or payable.
The components of the Company's (loss) income before income taxes for the years ended
December 31, 2018
,
2017
and
2016
were as follows (in thousands):
|
Years Ended December 31,
|
|||||||||||
|
2018
|
2017
|
2016
|
|||||||||
|
United States
|
$
|
(138,484
|
)
|
$
|
275,235
|
|
$
|
334,750
|
|
||
|
International
|
(64,238
|
)
|
(103,912
|
)
|
(119,929
|
)
|
|||||
|
Total (loss) income before income taxes
|
$
|
(202,722
|
)
|
$
|
171,323
|
|
$
|
214,821
|
|
||
The (benefit from) provision for income taxes is comprised of the following for the years ended
December 31, 2018
,
2017
and
2016
(in thousands):
F-
26
|
Years Ended December 31,
|
|||||||||||
|
2018
|
2017
|
2016
|
|||||||||
|
Current:
|
|||||||||||
|
Domestic
|
$
|
2,299
|
|
$
|
—
|
|
$
|
—
|
|
||
|
Foreign
|
5,721
|
|
1,256
|
|
5,274
|
|
|||||
|
Total current income tax
|
8,020
|
|
1,256
|
|
5,274
|
|
|||||
|
Deferred:
|
|||||||||||
|
Domestic
|
(2,967
|
)
|
—
|
|
—
|
|
|||||
|
Foreign
|
(6,472
|
)
|
742
|
|
121
|
|
|||||
|
Total deferred income tax
|
(9,439
|
)
|
742
|
|
121
|
|
|||||
|
Total (benefit from) provision for income tax
|
$
|
(1,419
|
)
|
$
|
1,998
|
|
$
|
5,395
|
|
||
Prior to the Combination, the provision was primarily due to certain limited liability company entity-level taxes and foreign taxes being recorded for Amneal prior to the Combination. Subsequent to May 4, 2018, federal income taxes were also provided related to the Company’s allocable share of income (losses) from Amneal at the prevailing U.S. federal, state, and local corporate income tax rates. No United States federal income taxes were incurred by the partnership in the years ended December 31, 2017 and 2016.
The effective tax rate for the years ended
December 31, 2018
,
2017
and
2016
are as follows:
|
Years Ended December 31,
|
||||||||
|
2018
|
2017
|
2016
|
||||||
|
Federal income tax at the statutory rate
|
21.0
|
%
|
—
|
%
|
—
|
%
|
||
|
State income tax, net of federal benefit
|
(1.1
|
)%
|
—
|
%
|
—
|
%
|
||
|
Losses for which no benefit has been recognized
|
(12.3
|
)%
|
10.6
|
%
|
8.2
|
%
|
||
|
Foreign rate differential
|
(6.3
|
)%
|
(6.5
|
)%
|
(5.4
|
)%
|
||
|
Other
|
(0.6
|
)%
|
(2.9
|
)%
|
(0.3
|
)%
|
||
|
Effective income tax rate
|
0.7
|
%
|
1.2
|
%
|
2.5
|
%
|
||
The decrease in effective income tax rate for the year ended
December 31, 2018
compared to the year ended
December 31, 2017
, is primarily due to losses attributable to the non-controlling interest.
The following table summarizes the changes in the Company's valuation allowance on deferred tax assets for the period indicated for the years ended
December 31, 2018
,
2017
and
2016
(in thousands):
|
Years Ended December 31,
|
|||||||||||
|
2018
|
2017
|
2016
|
|||||||||
|
Balance at the beginning of the period
|
$
|
41,617
|
|
$
|
42,231
|
|
$
|
22,567
|
|
||
|
(Decreases) increases due to net operating losses and temporary differences
|
(382
|
)
|
23,286
|
|
19,664
|
|
|||||
|
Divestitures
|
—
|
|
(23,900
|
)
|
—
|
|
|||||
|
Balance at the end of the period
|
$
|
41,235
|
|
$
|
41,617
|
|
$
|
42,231
|
|
||
At
December 31, 2018
, the Company has approximately
$364 million
of foreign net operating loss carry forwards. The majority of these net operating loss carry forwards will expire, if unused, between 2021 and 2024. Also at December 31, 2018, the Company had approximately
$303 million
of federal and
$104 million
of state net operating loss carry forwards. The federal net operating losses are generally allowed to be carried forward indefinitely, and the majority of the state net operating losses will expire, if unused, between 2033 and 2038.
The tax effects of temporary differences that give rise to future income tax benefits and payables as of
December 31, 2018
and
2017
were as follows (in thousands):
F-
27
|
December 31, 2018
|
December 31, 2017
|
||||||
|
Deferred tax assets:
|
|||||||
|
Partnership interest in Amneal
|
$
|
240,044
|
|
$
|
—
|
|
|
|
Projected imputed interest on TRA
|
9,838
|
|
—
|
|
|||
|
Net operating loss carryforward
|
107,942
|
|
34,889
|
|
|||
|
IRC Section 163(j) interest carryforward
|
33,789
|
|
—
|
|
|||
|
Capitalized costs
|
900
|
|
949
|
|
|||
|
Accrued expenses
|
4,298
|
|
985
|
|
|||
|
Intangible assets
|
1,553
|
|
122
|
|
|||
|
Tax credits and other
|
16,030
|
|
6,366
|
|
|||
|
Total deferred tax assets
|
414,394
|
|
43,311
|
|
|||
|
Valuation allowance
|
(41,235
|
)
|
(41,617
|
)
|
|||
|
Net deferred tax assets
|
373,159
|
|
1,694
|
|
|||
|
Deferred tax liabilities:
|
|||||||
|
Fixed assets
|
—
|
|
(3,287
|
)
|
|||
|
Intangible assets
|
(1,178
|
)
|
—
|
|
|||
|
Total deferred tax liabilities
|
(1,178
|
)
|
(3,287
|
)
|
|||
|
Net deferred tax assets (liabilities)
|
$
|
371,981
|
|
$
|
(1,593
|
)
|
|
The Company's Indian subsidiaries are primarily export-oriented and in some cases are eligible for certain limited income tax holiday benefits granted by the government of India for export activities conducted within Special Economic Zones, or SEZs, for periods of up to 15 years. Amneal’s SEZ income tax holiday benefits are currently scheduled to expire in whole or in part during the years 2028 to 2030. Indian profits ineligible for SEZ benefits are subject to corporate income tax at the rate of 34.9%. In addition, all Indian profits, including those generated within SEZs, are subject to the Minimum Alternate Tax (MAT), at the rate of 21.5%. For each of the years ended
December 31, 2018
,
2017
and
2016
, the effect of the income tax holidays granted by the Indian government reduced the overall income tax provision and increased net income by approximately
$2 million
.
The Company accounts for income tax contingencies using the benefit recognition model. The Company will recognize a benefit if a tax position is more likely than not to be sustained upon audit, based solely on the technical merits. The benefit is measured by determining the amount that is greater than 50% likely of being realized upon settlement, presuming that the tax position is examined by the appropriate taxing authority that has full knowledge of all relevant information. During the years ended
December 31, 2017
and
2016
, the Company did
no
t have an accrual for uncertain tax positions. The amount of unrecognized tax benefits at
December 31, 2018
, was
$7 million
, of which
$7 million
would impact the Company’s effective tax rate if recognized. The Company currently does not believe that the total amount of unrecognized tax benefits will increase or decrease significantly over the next 12 months. Interest expense related to income taxes is included in
(Benefit from) provision for income taxes
. Net interest expense related to unrecognized tax benefits for the year ended December 31, 2018 was
$0.2 million
. Accrued interest expense as of December 31, 2018 was
$0.6 million
. Income tax penalties are included in
(Benefit from) provision for income taxes
. Accrued tax penalties as of December 31, 2018 were immaterial.
A rollforward of unrecognized tax benefits for the years ended
December 31, 2018
,
2017
and
2016
is as follows (in thousands):
|
Years Ended December 31,
|
|||||||||||
|
2018
|
2017
|
2016
|
|||||||||
|
Unrecognized tax benefits at the beginning of the period
|
$
|
—
|
|
$
|
—
|
|
$
|
—
|
|
||
|
Gross change for current period positions
|
182
|
|
—
|
|
—
|
|
|||||
|
Gross change for prior period positions
|
2,346
|
|
—
|
|
—
|
|
|||||
|
Gross change due to Combination
|
5,208
|
|
—
|
|
—
|
|
|||||
|
Decrease due to expiration of statutes of limitations
|
(530
|
)
|
—
|
|
—
|
|
|||||
|
Decrease due to settlements and payments
|
—
|
|
—
|
|
—
|
|
|||||
|
Unrecognized tax benefits at the end of the period
|
$
|
7,206
|
|
$
|
—
|
|
$
|
—
|
|
||
F-
28
The Company and its subsidiaries file income tax returns in the U.S. federal, and various state, local and foreign jurisdictions. The Company is not currently under income tax audit in any jurisdiction, and it will file its first income tax returns for the period ended December 31, 2018. The Amneal partnership was audited for the tax year ended December 31, 2015 without any adjustments to taxable income. Income tax returns are generally subject to examination for a period of 3 years in the U.S. The statute of limitations for the 2016 and 2017 tax years will, therefore, expire no earlier than 2020. However, any adjustments to the 2016 or 2017 tax years would be pre-transaction when the Company had no ownership interest in Amneal. Under the partnership income tax regulations and audit guidelines, the Company is not responsible for any hypothetical pre-transaction income tax liabilities which pass through to the owners as of the year of any potential income tax adjustment. The IRS statute of limitations is open for the 2015, 2016 and 2017 tax years for the Company’s Impax subsidiary. If there were adjustments to the attributes of Impax, they could impact the carryforward losses at the Company, which is the successor in interest to Impax. Neither the Company nor any of its other affiliates is currently under audit for state income tax.
In India, income tax returns for fiscal years ending March 31, 2016 through March 31, 2018 are currently being reviewed by tax authorities as part of the normal procedures and Amneal is not expecting any material adjustments. There are no other income tax returns in the process of examination, administrative appeal, or litigation. Income tax returns are generally subject to examination for a period of 3 years, 5 years, and 2 years after the tax year in India, Switzerland, and United Kingdom, respectively.
Applicable foreign taxes (including withholding taxes) have not been provided on the approximately
$56 million
of undistributed earnings of foreign subsidiaries as at
December 31, 2018
. These earnings have been and currently are considered to be indefinitely reinvested. Quantification of additional taxes that may be payable on distribution is not practicable.
The Company continuously monitors government proposals to make changes to tax laws, including comprehensive tax reform in the United States and proposed legislation in certain foreign jurisdictions resulting from the adoption of the Organization for Economic Cooperation and Development policies.
For the year ended December 31, 2018, the Company recorded taxes related to global intangible low-taxed income ("GILTI") of
$0.4 million
. The Company made an accounting policy election to treat GILTI as a current-period expense at the partnership level.
On December 22, 2017, the Tax Cuts and Jobs Act was enacted in the United States, which significantly reforms U.S. tax legislation. In December 2017, the SEC staff issued Staff Accounting Bulletin ("SAB") 118, which provides a measurement period that should not extend beyond one year from the enactment date for companies to complete the accounting for the effects of the Tax Cuts and Jobs Act ("TCJA"). In accordance with SAB 118, a company must reflect the income tax effects of those aspects of the TCJA for which the accounting under Accounting Standards Codification Topic 740, "Income Taxes" ("ASC 740") is complete. To the extent that a company’s accounting for TCJA-related income tax effects is incomplete, but the company is able to determine a reasonable estimate, it must record a provisional estimate in its financial statements. If a company cannot determine a provisional estimate to be included in its financial statements, it should continue to apply ASC 740 on the basis of the provisions of the tax laws that were in effect immediately before the enactment of the TCJA.
The Company has completed its analysis of the TCJA’s income tax effects. In total, the Company recorded a non-cash charge of
$0.2 million
to income tax expense for TCJA-related impacts, comprised of provisional estimates of
$0.1 million
recorded in the first quarter of 2018 and an additional
$0.1 million
charge when the Company's analysis was completed in the fourth quarter of 2018. In accordance with SAB 118, the TCJA-related income tax effects that were initially reported as provisional estimates were refined as additional analysis was performed.
If legislative changes are enacted in other countries, any of these proposals may include increasing or decreasing existing statutory tax rates. A change in statutory tax rates in any country would result in the revaluation of Amneal’s deferred tax assets and liabilities related to that particular jurisdiction in the period in which the new tax law is enacted. During 2018, the state of New Jersey enacted comprehensive budget legislation that included various changes to the state's tax laws. This legislation did not have a material effect on the Company’s income tax provision for the fourth quarter or the full year.
F-
29
9. Earnings per Share
Basic earnings per share of Class A Common Stock and Class B-1 Common Stock is computed by dividing net loss attributable to Amneal Pharmaceuticals, Inc. by the weighted-average number of shares of Class A Common Stock and Class B-1 Common Stock outstanding during the period. Diluted earnings per share of Class A Common Stock and Class B-1 Common Stock is computed by dividing net loss attributable to Amneal Pharmaceuticals, Inc. by the weighted-average number of shares of Class A Common Stock and Class B-1 Common Stock outstanding during the period, adjusted to give effect to potentially dilutive securities.
The following table sets forth reconciliations of the numerators and denominators used to compute basic and diluted earnings per share of Class A Common Stock and Class B-1 Common Stock (in thousands, except per share amounts):
|
Years Ended December 31,
|
|||||||||||
|
2018
|
2017
|
2016
|
|||||||||
|
Numerator:
|
|||||||||||
|
Net loss attributable to Amneal Pharmaceuticals, Inc.
|
$
|
(20,920
|
)
|
$
|
—
|
|
$
|
—
|
|
||
|
Denominator:
|
|||||||||||
|
Weighted-average shares of Class A Common Stock and Class B-1 Common Stock outstanding-basic and diluted
|
127,252
|
|
|||||||||
|
Net loss per share attributable to Amneal Pharmaceuticals, Inc.'s common stockholders:
|
|||||||||||
|
Class A and Class B-1 basic and diluted
|
$(0.16)
|
||||||||||
The allocation of net loss to the holders of shares of Class A Common Stock and Class B-1 Common Stock began following the closing of the Combination on May 4, 2018. Shares of the Company's Class B Common Stock do not share in the earnings or losses of the Company and, therefore, are not participating securities. Therefore, basic and diluted earnings per share of Class B Common Stock under the two-class method has not been presented.
The following table presents potentially dilutive securities excluded from the computations of diluted earnings per share of Class A Common Stock and Class B-1 Common Stock (in thousands).
|
Years Ended December 31,
|
||||||||
|
2018
|
2017
|
2016
|
||||||
|
Stock options
(1)
|
5,815
|
|
|
—
|
|
—
|
|
|
|
Restricted stock units
(1)
|
1,331
|
|
|
—
|
|
—
|
|
|
|
Shares of Class B Common Stock
(2)
|
171,261
|
|
|
—
|
|
—
|
|
|
(1)
Excluded from the computation of diluted earnings per share of Class A Common Stock and Class B-1 Common Stock
because the effect of their inclusion would have been anti-dilutive since there was a net loss attributable to the Company for the year ended
December 31, 2018
.
(2)
Shares of Class B Common Stock are considered potentially dilutive shares of Class A Common Stock and Class B-1
Common Stock. Shares of Class B Common Stock have been excluded from the computations of diluted earnings per share of Class A Common Stock and Class B-1 Common Stock because the effect of their inclusion would have been anti-dilutive under the if-converted method.
10. Trade Accounts Receivable, Net
Trade accounts receivable, net is comprised of the following (in thousands):
|
December 31, 2018
|
December 31, 2017
|
||||||
|
Gross accounts receivable
|
$
|
1,349,588
|
|
$
|
827,302
|
|
|
|
Allowance for doubtful accounts
|
(2,340
|
)
|
(1,824
|
)
|
|||
|
Contract charge-backs and sales volume allowances
|
(829,596
|
)
|
(453,703
|
)
|
|||
|
Cash discount allowances
|
(36,157
|
)
|
(20,408
|
)
|
|||
|
Subtotal
|
(868,093
|
)
|
(475,935
|
)
|
|||
|
Trade accounts receivable, net
|
$
|
481,495
|
|
$
|
351,367
|
|
|
Receivables from customers representing 10% or more of the Company’s gross trade accounts receivable reflected
three
customers at
December 31, 2018
, equal to
30%
,
28%
, and
24%
, respectively. Receivables from customers representing 10% or more of the Company’s gross trade accounts receivable reflected three customers at
December 31, 2017
, equal to
36%
,
27%
, and
19%
, respectively.
11. Inventories
Inventories, net of reserves, are comprised of the following (in thousands):
|
|
December 31, 2018
|
December 31, 2017
|
|||||
|
Raw materials
|
$
|
181,654
|
|
$
|
140,051
|
|
|
|
Work in process
|
54,152
|
|
38,146
|
|
|||
|
Finished goods
|
221,413
|
|
105,841
|
|
|||
|
Total inventories
|
$
|
457,219
|
|
$
|
284,038
|
|
|
12. Prepaid Expenses and Other Current Assets
Prepaid expenses and other current assets are comprised of the following (in thousands):
|
December 31, 2018
|
December 31, 2017
|
||||||
|
Deposits and advances
|
$
|
2,142
|
|
$
|
1,851
|
|
|
|
Prepaid insurance
|
6,094
|
|
3,154
|
|
|||
|
Prepaid regulatory fees
|
4,924
|
|
5,926
|
|
|||
|
Levothyroxine transition contract asset
(1)
|
36,393
|
|
—
|
|
|||
|
Income tax receivable
|
29,625
|
|
—
|
|
|||
|
Other current receivables
|
16,979
|
|
15,150
|
|
|||
|
Other prepaid assets
|
32,164
|
|
16,315
|
|
|||
|
Total prepaid expenses and other current assets
|
$
|
128,321
|
|
$
|
42,396
|
|
|
(1)
For further details on the Levothyroxine transition contract asset, refer to
Note 5. Alliance and Collaboration
.
13. Property, Plant, and Equipment, Net
Property, plant, and equipment, net is comprised of the following (in thousands):
|
December 31, 2018
|
December 31, 2017
|
||||||
|
Land
|
$
|
1,572
|
|
$
|
5,275
|
|
|
|
Buildings
|
233,185
|
|
227,864
|
|
|||
|
Leasehold improvements
|
98,399
|
|
70,354
|
|
|||
|
Machinery and equipment
|
334,351
|
|
260,637
|
|
|||
|
Furniture and fixtures
|
10,779
|
|
18,415
|
|
|||
|
Vehicles
|
1,506
|
|
1,517
|
|
|||
|
Computer equipment
|
33,019
|
|
26,831
|
|
|||
|
Construction-in-progress
|
40,771
|
|
32,235
|
|
|||
|
Total property, plant, and equipment
|
753,582
|
|
643,128
|
|
|||
|
Less: Accumulated depreciation
|
(209,436
|
)
|
(156,370
|
)
|
|||
|
Property, plant, and equipment, net
|
$
|
544,146
|
|
$
|
486,758
|
|
|
Depreciation recognized by the Company is as follows (in thousands):
|
|
Years Ended December 31,
|
||||||||||
|
|
2018
|
2017
|
2016
|
||||||||
|
Depreciation
|
$
|
64,417
|
|
$
|
41,962
|
|
$
|
29,314
|
|
||
On December 21, 2018, the Company sold real estate and equipment in Hayward, California, for cash consideration, net of costs to sell, of
$25 million
. The Company recognized a gain on the sale of
$0.4 million
, which is included in Other income (expense).
F-
30
F-
31
14. Goodwill and Intangible Assets
The changes in goodwill for the years ended
December 31, 2018
and
2017
were as follows (in thousands):
|
|
December 31, 2018
|
December 31, 2017
|
|||||
|
Balance, beginning of period
|
$
|
26,444
|
|
$
|
28,441
|
|
|
|
Goodwill acquired during the period
|
401,488
|
|
—
|
|
|||
|
Goodwill divested during the period
|
—
|
|
(3,895
|
)
|
|||
|
Currency translation
|
(1,706
|
)
|
1,898
|
|
|||
|
Balance, end of period
|
$
|
426,226
|
|
$
|
26,444
|
|
|
As of
December 31, 2018
,
$360 million
and
$66 million
of goodwill was allocated to the Specialty and Generics segments, respectively. As of
December 31, 2017
, all goodwill was allocated to the Generics segment. For the year ended
December 31, 2018
goodwill acquired was associated with the Impax and Gemini acquisitions.
Intangible assets at
December 31, 2018
and
2017
is comprised of the following (in thousands):
|
December 31, 2018
|
December 31, 2017
|
||||||||||||||||||||||||
|
Weighted-Average Amortization Period (in years)
|
Cost
|
Accumulated Amortization
|
Net
|
Cost
|
Accumulated Amortization
|
Net
|
|||||||||||||||||||
|
Amortizing intangible assets:
|
|||||||||||||||||||||||||
|
Product rights
|
12.4
|
$
|
1,282,011
|
|
$
|
(88,081
|
)
|
$
|
1,193,930
|
|
$
|
49,700
|
|
$
|
(17,210
|
)
|
$
|
32,490
|
|
||||||
|
Customer relationships
|
14.4
|
7,005
|
|
(1,955
|
)
|
5,050
|
|
7,421
|
|
(1,072
|
)
|
6,349
|
|
||||||||||||
|
Other intangible assets
|
12.5
|
$
|
5,620
|
|
$
|
(1,561
|
)
|
$
|
4,059
|
|
$
|
5,775
|
|
$
|
(1,165
|
)
|
$
|
4,610
|
|
||||||
|
Total
|
|
$
|
1,294,636
|
|
$
|
(91,597
|
)
|
$
|
1,203,039
|
|
$
|
62,896
|
|
$
|
(19,447
|
)
|
$
|
43,449
|
|
||||||
|
In-process research and development
|
|
451,930
|
|
—
|
|
451,930
|
|
1,150
|
|
—
|
|
1,150
|
|
||||||||||||
|
Total intangible assets
|
$
|
1,746,566
|
|
$
|
(91,597
|
)
|
$
|
1,654,969
|
|
$
|
64,046
|
|
$
|
(19,447
|
)
|
$
|
44,599
|
|
|||||||
For the year ended
December 31, 2018
, the Company recognized a total of
$48 million
of intangible asset impairment charges, of which
$9 million
was recognized in cost of goods sold and
$39 million
was recognized in in-process research and development. The impairment charge recognized in costs of goods sold was related to products in the Generics segment and almost entirely related to
one
product. The impairment charges were primarily the result of a loss of a customer for a marketed product during the third quarter of 2018, resulting in significantly lower expected future cash flows. The in-process research and development impairment charges were related to the Generics segment and related primarily to
two
products. The impairment charges were primarily the result of a loss of forecasted market share of the
two
products during the fourth quarter of 2018.
Amortization expense related to intangible assets recognized is as follows (in thousands):
|
|
Years Ended December 31,
|
||||||||||
|
|
2018
|
2017
|
2016
|
||||||||
|
Amortization
|
$
|
72,986
|
|
$
|
3,974
|
|
$
|
3,702
|
|
||
The following table presents future amortization expense for the next five years and thereafter, excluding
$452 million
of IPR&D intangible assets (in thousands).
F-
32
|
Future Amortization
|
||||
|
2019
|
$
|
123,497
|
|
|
|
2020
|
130,154
|
|
||
|
2021
|
146,843
|
|
||
|
2022
|
149,053
|
|
||
|
2023
|
127,249
|
|
||
|
Thereafter
|
526,243
|
|
||
|
Total
|
$
|
1,203,039
|
|
|
15. Accounts Payable and Accrued Expenses
Accounts payable and accrued expenses are comprised of the following (in thousands):
|
|
December 31, 2018
|
December 31, 2017
|
|||||
|
Accounts payable
|
$
|
114,846
|
|
$
|
70,013
|
|
|
|
Accrued returns allowance
|
154,503
|
|
45,175
|
|
|||
|
Accrued compensation
|
77,066
|
|
23,954
|
|
|||
|
Accrued Medicaid and commercial rebates
|
74,202
|
|
12,911
|
|
|||
|
Accrued royalties
|
23,639
|
|
2,970
|
|
|||
|
Estimated Teva and Allergan chargebacks and rebates
(1)
|
13,277
|
|
—
|
|
|||
|
Medicaid reimbursement accrual
|
15,000
|
|
15,000
|
|
|||
|
Accrued professional fees
|
4,555
|
|
938
|
|
|||
|
Accrued other
|
37,352
|
|
23,818
|
|
|||
|
Total accounts payable and accrued expenses
|
$
|
514,440
|
|
$
|
194,779
|
|
|
(1)
In connection with Impax's August 2016 acquisition of certain assets from Teva Pharmaceuticals USA, Inc. ("Teva") and Allergan plc ("Allergan"), Impax agreed to manage the payment process for certain commercial chargebacks and rebates on behalf of Teva and Allergan related to products each of Teva and Allergan sold into the channel prior to Impax's acquisition of the products. On August 18, 2016, Impax received a payment totaling
$42 million
from Teva and Allergan, which represented their combined estimate of the amount of commercial chargebacks and rebates to be paid by Impax on their behalf to wholesalers who purchased products from Teva and Allergan prior to the closing. Pursuant to the agreed upon transition services, Teva and Allergan are obligated to reimburse Impax for additional payments related to chargebacks and rebates for products they sold into the channel prior to the closing and made on their behalf in excess of the
$42 million
. If the total payments made by Impax on behalf of Teva and Allergan are less than
$42 million
, Impax is obligated to refund the difference to Teva and/or Allergan. As of
December 31, 2018
,
$13 million
remained in accounts payable and accrued expenses.
16. Debt
The following is a summary of the Company's total indebtedness (in thousands):
|
|
December 31, 2018
|
|
December 31, 2017
|
||||
|
Senior Secured Credit Facility – Term Loan due May 2025
|
$
|
2,685,876
|
|
|
$
|
—
|
|
|
Senior Credit Facility – Term Loan
|
—
|
|
1,378,160
|
|
|||
|
Senior Credit Facility – Revolver
|
—
|
|
75,000
|
|
|||
|
Other
|
624
|
|
—
|
|
|||
|
Total debt
|
2,686,500
|
|
|
1,453,160
|
|
||
|
Less: debt issuance costs
|
(34,453
|
)
|
|
(8,715)
|
|
||
|
Total debt, net of debt issuance costs
|
2,652,047
|
|
|
1,444,445
|
|
||
|
Less: current portion of long-term debt
|
(21,449)
|
|
|
(89,171)
|
|
||
|
Total long-term debt, net
|
$
|
2,630,598
|
|
|
$
|
1,355,274
|
|
Senior Secured Credit Facility
On May 4, 2018 the Company entered into a senior credit agreement that provided a term loan ("Term Loan") with a principal amount of
$2.7 billion
and an asset backed credit facility ("ABL") under which loans and letters of credit up to a principal amount of
$500 million
are available (principal amount of up to
$25 million
is available for letters of credit) (collectively, the "Senior Secured Credit Facilities"). The Term Loan is repayable in equal quarterly installments at a rate of
1.00%
of the original principal amount annually, with the balance payable at maturity on May 4, 2025. The Term Loan bears a variable annual interest rate, which is one-month LIBOR plus
3.5%
at
December 31, 2018
. The ABL bears an annual interest rate of one-month LIBOR plus
1.5%
at
December 31, 2018
and matures on May 4, 2023. The annual interest rate for the ABL may be reduced or increased by
0.25%
based on step-downs and step-ups determined by the average historical excess availability. At
December 31, 2018
, the Company had
no
outstanding borrowings under the ABL.
The proceeds from the Term Loan were used to finance, in part, the cost of the Combination and to pay off Amneal’s debt and substantially all of Impax’s debt at the close of the Combination. In connection with the refinancing of the Amneal and Impax debt, the Company recorded a loss on extinguishment of debt of
$20 million
for the year ended
December 31, 2018
.
The proceeds of any loans made under the Senior Secured Credit Facility can be used for capital expenditures, acquisitions, working capital needs and other general purposes, subject to covenants as described below. The Company pays a commitment fee based on the average daily unused amount of the ABL at a rate based on average historical excess availability, between
0.25%
and
0.375%
per annum. At
December 31, 2018
, the ABL commitment fee rate is
0.375%
per annum.
The Company incurred costs associated with the Term Loan of
$38 million
and the ABL of
$5 million
, which have been capitalized and are being are amortized over the life of the applicable debt agreement to interest expense. The Term Loan has been recorded in the balance sheet net of issuance costs. Costs associated with the ABL have been recorded in other assets because there were no borrowings outstanding on the effective date of the ABL. For the years ended
December 31, 2018
,
2017
and
2016
, amortization of deferred financing costs related to the Term Loan, ABL and historical Amneal debt was
$6 million
,
$5 million
and
$3 million
, respectively.
The Senior Secured Credit Facilities contain a number of covenants that, among other things, create liens on Amneal's and its subsidiaries' assets. The Senior Secured Credit Facilities contain certain negative covenants that, among other things and subject to certain exceptions, restrict Amneal’s and its subsidiaries' ability to incur additional debt or guarantees, grant liens, make loans, acquisitions or other investments, dispose of assets, merge, dissolve, liquidate or consolidate, pay dividends or other payments on capital stock, make optional payments or modify certain debt instruments, modify certain organizational documents, enter into arrangements that restrict the ability to pay dividends or grant liens, or enter into or consummate transactions with affiliates. The ABL Facility also includes a financial covenant whereby Amneal must maintain a minimum fixed charge coverage ratio if certain borrowing conditions are met. The Senior Secured Credit Facilities contain customary events of default, subject to certain exceptions. Upon the occurrence of certain events of default, the obligations under the Senior Secured Credit Facilities may be accelerated and the commitments may be terminated. At
December 31, 2018
, Amneal was in compliance with all covenants.
F-
33
The Company’s Senior Secured Credit Facility requires payments of
$27 million
per year for the next five years and the balance thereafter.
Other Debt
On June 4, 2018, the Company completed a tender offer to repurchase all of Impax's
2.00%
senior notes due 2022. Pursuant to the tender offer,
$599 million
aggregate principal amount of the senior notes was repurchased.
On April 4, 2017, Amneal entered into Amendment No. 6 of its historical Senior Credit Facility. As a result of Amendment No. 6, Amneal recorded a loss on extinguishment of debt of
$3 million
due to the write-off of unamortized debt issuance costs. In addition, Amneal capitalized approximately
$3 million
of debt issuance costs.
In May 2016, Amneal entered into Amendment No. 5 of its historical Senior Credit Facility. As a result of Amendment No. 5, Amneal capitalized approximately
$7 million
of debt issuance costs.
17. Fair Value Measurements of Financial Instruments
Fair value is the exit price that would be received to sell an asset or paid to transfer a liability. Fair value is a market-based measurement that should be determined using assumptions that market participants would use in pricing an asset or liability. Valuation techniques used to measure fair value should maximize the use of observable inputs and minimize the use of unobservable inputs. To measure fair value, the Company uses the following fair value hierarchy based on three levels of inputs, of which the first two are considered observable and the last unobservable:
Level 1
– Quoted prices in active markets for identical assets or liabilities.
Level 2 –
Inputs other than Level 1 that are observable for the asset or liability, either directly or indirectly, such as quoted prices for similar assets and liabilities in active markets; quoted prices for identical or similar assets or liabilities in markets that are not active; or other inputs that are observable or can be corroborated by observable market data by correlation or other means.
Level 3
– Unobservable inputs that are supported by little or no market activity and that are significant to the fair value of the assets or liabilities. Value is determined using pricing models, discounted cash flow methodologies, or similar techniques and also includes instruments for which the determination of fair value requires significant judgment or estimation.
Assets and Liabilities Measured at Fair Value on a Recurring Basis
The Company evaluates its financial assets and liabilities subject to fair value measurements on a recurring basis to determine the appropriate level of classification for each reporting period. The following table sets forth the Company’s financial assets and liabilities that were measured at fair value on a recurring basis as of
December 31, 2018
(in thousands) (there were no material assets or liabilities that were measured at fair value on a recurring basis as of
December 31, 2017
):
|
Fair Value Measurement Based on
|
||||||||||||||||
|
Total
|
Quoted Prices in Active Markets
(Level 1)
|
Significant
Other
Observable
Inputs
(Level 2)
|
Significant Unobservable
Inputs
(Level 3)
|
|||||||||||||
|
Assets
|
||||||||||||||||
|
Deferred Compensation Plan asset
(1)
|
$
|
40,101
|
|
$
|
—
|
|
$
|
40,101
|
|
$
|
—
|
|
||||
|
Liabilities
|
||||||||||||||||
|
Deferred Compensation Plan liabilities
(1)
|
$
|
27,978
|
|
$
|
—
|
|
$
|
27,978
|
|
$
|
—
|
|
||||
(1)
The deferred compensation plan liabilities are non-current liabilities recorded at the value of the amount owed to the plan participants, with changes in value recognized as compensation expense. The calculation of the deferred compensation plan obligation is derived from observable market data by reference to hypothetical investments selected by the participants and is included in other long-term liabilities. The Company invests participant contributions in corporate-owned life insurance policies, for which the cash surrender value is included in other non-current assets.
F-
34
There were no transfers between levels in the fair value hierarchy during the year ended
December 31, 2018
.
Assets and Liabilities Not Measured at Fair Value on a Recurring Basis
The carrying amounts of cash, accounts receivable and accounts payable approximate their fair values due to the short-term maturity of these instruments.
The Company’s Term Loan falls into the Level 2 category within the fair value level hierarchy. The fair value was determined using market data for valuation. The fair value of the Term Loan at
December 31, 2018
was approximately
$2.5 billion
.
As of
December 31, 2017
, Amneal's prior term loan (which was subsequently paid off at the closing of the Combination with the proceeds of the Term Loan) had a fair value of approximately
$1.4 billion
, which was based upon market data (Level 2).
Assets and Liabilities Measured at Fair Value on a Non-Recurring Basis
There were no non-recurring fair value measurements during the years ended
December 31, 2018
and
2017
.
18. Commitments and Contingencies
Contractual Obligations
The Company leases buildings and other tangible property. Rent expense under these leases was
$18 million
,
$17 million
and
$14 million
for the years ended
December 31, 2018
,
2017
and
2016
, respectively. The table below reflects the future minimum lease payments, including reasonably assured renewals, due under these non-cancelable leases as of
December 31, 2018
(in thousands):
|
|
|
Operating Leases
|
||
|
2019
|
|
$
|
25,885
|
|
|
2020
|
|
12,071
|
|
|
|
2021
|
|
11,105
|
|
|
|
2022
|
|
10,329
|
|
|
|
2023
|
10,043
|
|
||
|
Thereafter
|
|
28,128
|
|
|
|
Total
|
|
$
|
97,561
|
|
Commitments
Commercial Manufacturing, Collaboration, License, and Distribution Agreements
The Company continues to seek to enhance its product line and develop a balanced portfolio of differentiated products through product acquisitions and in-licensing. Accordingly, the Company, in certain instances, may be contractually obligated to make potential future development, regulatory, and commercial milestone, royalty and/or profit sharing payments in conjunction with collaborative agreements or acquisitions that the Company has entered into with third parties. The Company has also licensed certain technologies or intellectual property from various third parties. The Company is generally required to make upfront payments as well as other payments upon successful completion of regulatory or sales milestones. The agreements generally permit the Company to terminate the agreement with no significant continuing obligation. The Company could be required to make significant payments pursuant to these arrangements. These payments are contingent upon the occurrence of certain future events and, given the nature of these events, it is unclear when, if ever, the Company may be required to pay such amounts. Further, the timing of any future payment is not reasonably estimable.
Contingencies
Legal Proceedings
F-
35
The Company's legal proceedings are complex, constantly evolving and subject to uncertainty. As such, the Company cannot predict the outcome or impact of the legal proceedings set forth below. And the Company is subject to legal proceedings that are not set forth below. While the Company believes it has valid claims and/or defenses to the matters described below, the nature of litigation is unpredictable and the outcome of the following proceedings could include damages, fines, penalties and injunctive or administrative remedies. For any proceedings where losses are probable and reasonably capable of estimation, the Company accrues for a potential loss. While these accruals have been deemed reasonable by the Company’s management, the assessment process relies heavily on estimates and assumptions that may ultimately prove inaccurate or incomplete. Additionally, unforeseen circumstances or events may lead the Company to subsequently change its estimates and assumptions. Unless otherwise indicated below, the Company is at this time unable to estimate the possible loss, if any, associated with such litigation.
The Company currently intends to vigorously prosecute and/or defend these proceedings as appropriate. From time to time, however, the Company may settle or otherwise resolve these matters on terms and conditions that it believes to be in its best interest. Resolution of any or all claims, legal proceedings or investigations could have a material adverse effect on the Company's results of operations and/or cash flow in any given accounting period, or on the Company's overall financial condition.
Additionally, the Company manufactures and derives a portion of its revenue from the sale of pharmaceutical products in the opioid class of drugs, and may therefore face claims arising from the regulation and/or consumption of such products.
Although the outcome and costs of the asserted and unasserted claims is difficult to predict, based on the information presently known to management, the Company does not currently expect the ultimate liability, if any, for such matters to have a material adverse effect on its business, financial condition, results of operations, or cash flows.
Medicaid Reimbursement Accrual
The Company is required to provide pricing information to state agencies that administer federal Medicaid programs. Certain state agencies have alleged that manufacturers have reported improper pricing information, which allegedly caused them to overpay reimbursement costs. Reserves are periodically established by the Company for any potential claims or settlements of overpayment. Although the Company intends to vigorously defend against any such claims, it had a reserve of
$15 million
at both
December 31, 2018
and
December 31, 2017
. The ultimate settlement of any potential liability for such claims may be higher or lower than estimated.
Patent Litigation
There is substantial litigation in the pharmaceutical, biological, and biotechnology industries with respect to the manufacture, use, and sale of new products which are the subject of conflicting patent and intellectual property claims. One or more patents often cover the brand name products for which the Company is developing generic versions and the Company typically has patent rights covering the Company’s branded products.
Under federal law, when a drug developer files an Abbreviated New Drug Application ("ANDA") for a generic drug seeking approval before expiration of a patent which has been listed with the FDA as covering the brand name product, the developer must certify its product will not infringe the listed patent(s) and/or the listed patent is invalid or unenforceable (commonly referred to as a "Paragraph IV" certification). Notices of such certification must be provided to the patent holder, who may file a suit for patent infringement within 45 days of the patent holder’s receipt of such notice. If the patent holder files suit within the 45-day period, the FDA can review and tentatively approve the ANDA, but generally is prevented from granting final marketing approval of the product until a final judgment in the action has been rendered in favor of the generic drug developer, or 30 months from the date the notice was received, whichever is sooner. The Company’s Generic segment is typically subject to patent infringement litigation brought by branded pharmaceutical manufacturers in connection with the Company’s Paragraph IV certifications seeking an order delaying the approval of the Company’s ANDA until expiration of the patent(s) at issue in the litigation. Likewise, the Company’s Specialty segment is currently involved in patent infringement litigation against generic drug manufacturers that have filed Paragraph IV certifications to market their generic drugs prior to expiration of the Company’s patents at issue in the litigation.
The uncertainties inherent in patent litigation make the outcome of such litigation difficult to predict. For the Company’s Generics segment, the potential consequences in the event of an unfavorable outcome in such litigation include delaying launch of its generic products until patent expiration. If the Company were to launch its generic product prior to successful resolution of a patent litigation, the Company could be liable for potential damages measured by the profits lost by the branded product manufacturer rather than the profits earned by the Company if it is found to infringe a valid, enforceable patent, or enhanced treble damages in cases of willful infringement. For the Company’s Specialty segment, an unfavorable outcome may significantly accelerate generic competition ahead of expiration of the patents covering the Company’s branded products. All such litigation typically involves significant expense.
F-
36
The Company is generally responsible for all of the patent litigation fees and costs associated with current and future products not covered by its alliance and collaboration agreements. The Company has agreed to share legal expenses with respect to third-party and Company products under the terms of certain of the alliance and collaboration agreements. The Company records the costs of patent litigation as expense in the period when incurred for products it has developed, as well as for products which are the subject of an alliance or collaboration agreement with a third-party.
Patent Defense Matters
Otsuka Pharmaceutical Co. Ltd. v. Amneal Pharmaceuticals LLC, et. al. (Aripiprazole)
In March 2015, Otsuka Pharmaceutical Co. Ltd. filed suit against Amneal in the U.S. District Court for the District of New Jersey alleging patent infringement based on the filing of Amneal’s ANDA for a generic alternative to Otsuka’s Abilify
®
tablet product. In 2016, the District Court granted Amneal’s motion to dismiss several of the patents in suit. The Court of Appeals for the Federal Circuit affirmed the dismissal with respect to one such patent and Otsuka did not appeal the District Court’s decision with respect to the other patents. At this time one patent remains in the suit and the District Court has not yet set a trial date with respect to that patent. Amneal, like numerous other generic manufacturers, has launched its generic version of Otsuka’s Abilify
®
"at-risk," prior to trial on the remaining patent-in-suit, and continues to sell the product.
Patent Infringement Matters
Impax Laboratories, LLC. v. Sandoz Inc.
(
Rytary
®
)
On March 31, 2017, Impax filed suit against Sandoz Inc. in the United States District Court for the District of New Jersey, alleging infringement of U.S. Patent Nos. 7,094,427; 8,377,474; 8,454,998; 8,557,283; 9,089,607; 9,089,608; 9,463,246; and 9,533,046, based on the filing of Sandoz’s ANDA relating to carbidopa and levodopa extended release capsules, generic to Rytary
®
. Sandoz answered the complaint on February 28, 2018. The parties reached a settlement agreement on or about December 12, 2018, and the case has been dismissed.
Impax Laboratories, LLC. v. Zydus Pharmaceuticals USA, Inc. and Cadila Healthcare Ltd. (Rytary
®
)
On December 21, 2017, Impax filed suit against Zydus Pharmaceuticals USA, Inc. and Cadila Healthcare Ltd. (collectively, "Zydus") in the United States District Court for the District of New Jersey, alleging infringement of U.S. Patent No. 9,089,608, based on the filing of Zydus’s ANDA relating to carbidopa and levodopa extended release capsules, generic to Rytary
®
. Zydus answered the complaint on April 27, 2018, asserting counterclaims of non-infringement and invalidity of U.S. Pat. Nos. 7,094,427; 8,377,474; 8,454,998; 8,557,283; and 9,089,607. Impax answered Zydus’s counterclaims on June 1, 2018. A case schedule has been set with trial anticipated in February 2020.
Other Litigation Related to the Company’s Business
Opana ER® FTC Antitrust Suit
On February 25, 2014, Impax received a Civil Investigative Demand (“CID”) from the Federal Trade Commission (“FTC”) concerning its investigation into the drug Opana® ER and its generic equivalents. On March 30, 2016, the FTC filed a complaint against Impax, Endo Pharmaceuticals Inc. ("Endo"), and others in the United States District Court for the Eastern District of Pennsylvania, alleging that Impax and Endo violated antitrust laws when they entered into a June 2010 co-promotion and development agreement and a June 2010 settlement agreement that resolved patent litigation in connection with the submission of Impax’s ANDA for generic original Opana® ER. In July 2016, the defendants filed a motion to dismiss the complaint, and a motion to sever the claims regarding Opana® ER from claims with respect to a separate settlement agreement that was challenged by the FTC. On October 20, 2016, the Court granted the motion to sever, formally terminating the suit against Impax, with an order that the FTC re-file no later than November 3, 2016, and dismissed the motion to dismiss as moot. On October 25, 2016, the FTC filed a notice of voluntary dismissal. On January 19, 2017, the FTC filed a Part 3 Administrative complaint against Impax with similar allegations regarding Impax’s June 2010 settlement agreement with Endo that resolved patent litigation in connection with the submission of Impax’s ANDA for generic original Opana® ER. Impax filed its answer to the Administrative Complaint on February 7, 2017. Trial concluded on November 15, 2017. On May 11, 2018, the Administrative Law Judge ruled in favor of Impax and dismissed the case in its entirety. The government has appealed this ruling to the five Federal Trade Commissioners, who are reviewing the case de novo. Briefing on the appeal concluded on August 24, 2018. Oral arguments were heard on October 11, 2018. A decision had been expected within
100 days
, but on December 28, 2018, the FTC fully stayed all consideration of the matter in light of a lapse in appropriations due to the government shutdown.
F-
37
Opana ER® Antitrust Litigation
From June 2014 to April 2015,
14
complaints styled as class actions on behalf of direct purchasers and indirect purchasers (also known as end-payors) and several separate individual complaints on behalf of certain direct purchasers (the “opt-out plaintiffs”) were filed against the manufacturer of the brand drug Opana ER® and Impax.
The direct purchaser plaintiffs comprise Value Drug Company; Meijer Inc. The end-payor plaintiffs comprise the Fraternal Order of Police, Miami Lodge 20, Insurance Trust Fund; Wisconsin Masons’ Health Care Fund; Massachusetts Bricklayers; Pennsylvania Employees Benefit Trust Fund; International Union of Operating Engineers, Local 138 Welfare Fund; Louisiana Health Service & Indemnity Company d/b/a Blue Cross and Blue Shield of Louisiana; Kim Mahaffay; and Plumbers & Pipefitters Local 178 Health & Welfare Trust Fund. The opt-out plaintiffs comprise Walgreen Co.; The Kroger Co.; Safeway, Inc.; HEB Grocery Company L.P.; Albertson’s LLC; Rite Aid Corporation; Rite Aid Hdqtrs. Corp.; and CVS Pharmacy, Inc.
On December 12, 2014, the United States Judicial Panel on Multidistrict Litigation (the "JPML") ordered the pending class actions transferred to the Northern District of Illinois for coordinated pretrial proceedings, as In Re Opana ER Antitrust Litigation (MDL No. 2580). (Actions subsequently filed in other jurisdictions also were transferred by the JPML to the Northern District of Illinois to be coordinated or consolidated with the coordinated proceedings, and the District Court likewise has consolidated the opt-out plaintiffs’ actions with the direct purchaser class actions for pretrial purposes.)
In each case, the complaints allege that Endo engaged in an anticompetitive scheme by, among other things, entering into an anticompetitive settlement agreement with Impax to delay generic competition of Opana ER® and in violation of state and federal antitrust laws. Plaintiffs seek, among other things, unspecified monetary damages and equitable relief, including disgorgement and restitution. Discovery, including expert discovery, is ongoing. No trial date has been scheduled.
The Company believes it has substantial meritorious defenses to the claims asserted with respect to the litigation related to its settlements. However, any adverse outcome could negatively affect the Company and could have a material adverse effect on the Company's results of operations, cash flows and/or overall financial condition.
Sergeants Benevolent Association Health & Welfare Fund v. Actavis, PLC, et. al.
In August 2015, a complaint styled as a class action was filed against Forest Laboratories (a subsidiary of Actavis plc) and numerous generic drug manufacturers, including Amneal, in the United States District Court for the Southern District of New York involving patent litigation settlement agreements between Forest Laboratories and the generic drug manufacturers concerning generic versions of Forest’s Namenda IR product. The complaint (as amended on February 12, 2016) asserts federal and state antitrust claims on behalf of indirect purchasers, who allege in relevant part that during the class period they indirectly purchased Namenda® IR or its generic equivalents in various states at higher prices than they would have absent the defendants’ allegedly unlawful anticompetitive conduct. Plaintiffs seek, among other things, unspecified monetary damages and equitable relief, including disgorgement and restitution. On September 13, 2016, the Court stayed the indirect purchaser plaintiffs’ claims pending factual development or resolution of claims brought in a separate, related complaint by direct purchasers (in which the Company is not a defendant). On September 10, 2018, the Court lifted the stay, referred the case to the assigned Magistrate Judge for supervision of supplemental, non-duplicative discovery in advance of mediation to be scheduled in 2019. The parties thereafter participated in supplemental discovery, as well as supplemental motion-to-dismiss briefing. On December 26, 2018, the Court granted in part and denied in part motions to dismiss the indirect purchaser plaintiffs’ claims. On January 7, 2019, Amneal, its relevant co-defendants, and the indirect purchaser plaintiffs informed the Magistrate Judge that they had agreed to mediation, which is presently scheduled to occur in April 2019.
Attorney General of the State of Connecticut Interrogatories and Subpoena Duces Tecum
On July 14, 2014, Impax received a subpoena and interrogatories (the "Subpoena") from the State of Connecticut Attorney General ("Connecticut AG") concerning its investigation into sales of Impax's generic product, digoxin. According to the Connecticut AG, the investigation is to determine whether anyone engaged in a contract, combination or conspiracy in restraint of trade or commerce which has the effect of (i) fixing, controlling or maintaining prices or (ii) allocating or dividing customers or territories relating to the sale of digoxin in violation of Connecticut state antitrust law. The Company has produced documents and information in response to the Subpoena. To the knowledge of the Company, no proceedings by the Connecticut AG have been initiated against the Company at this time. However, no assurance can be given as to the timing or outcome of this investigation.
F-
38
United States Department of Justice Investigations
On November 6, 2014, Impax disclosed that one of its sales representatives received a grand jury subpoena from the Antitrust Division of the United States Justice Department (the "Justice Department"). In connection with this same investigation, on March 13, 2015, Impax received a grand jury subpoena from the Justice Department requesting the production of information and documents regarding the sales, marketing, and pricing of certain generic prescription medications. In particular, the Justice Department’s investigation currently focuses on
four
generic medications: digoxin tablets, terbutaline sulfate tablets, prilocaine/lidocaine cream, and calcipotriene topical solution. The Company has been cooperating and intends to continue cooperating with the investigation. However, no assurance can be given as to the timing or outcome of the investigation.
On April 30, 2018, Impax received a CID from the Civil Division of the Justice Department (the "Civil Division"). The CID requests the production of information and documents regarding the pricing and sale of Impax’s pharmaceuticals and Impax’s interactions with other generic pharmaceutical manufacturers. According to the CID, the investigation concerns allegations that generic pharmaceutical manufacturers, including Impax, engaged in market allocation and price-fixing agreements, paid illegal remuneration, and caused false claims to be submitted to the Federal government. The Company has been cooperating and intends to continue cooperating with the Civil Division’s investigation. However, no assurance can be given as to the timing or outcome of the investigation.
Texas State Attorney General Civil Investigative Demand
On May 27, 2014, a CID was served on Amneal by the Office of the Attorney General for the state of Texas (the "Texas AG") relating to products distributed by Amneal under a specific Amneal labeler code. Shortly thereafter, Amneal received a second CID with respect to the same products sold by Interpharm Holding, Inc. ("Interpharm"), the assets of which had been acquired by Amneal in June 2008. Amneal completed its production of the direct and indirect sales transaction data in connection with the products at issue and provided this information to the Texas AG in November 2015. In May 2016, the Texas AG delivered
two
settlement demands to Amneal in connection with alleged overpayments made by the State of Texas for such products under its Medicaid programs. For the Amneal and Interpharm products at issue, the Texas AG’s initial demand was for an aggregate total of
$36 million
based on
$16.2 million
in alleged overpayments. After analyzing the Texas AG’s demand, Amneal raised certain questions regarding the methodology used in the Texas AG’s overpayment calculations, including the fact that the calculations treated all pharmacy claims after 2012 for the products at issue as claims for over-the-counter ("OTC") drugs, even though the products were prescription pharmaceuticals. This had the effect of increasing the alleged overpayment because the dispensing fee for OTC drugs was lower than that for prescription drugs. Therefore, the Texas AG’s calculations were derived by subtracting a lower (and incorrect) OTC dispensing fee from the higher (and correct) prescription dispensing fee. The Texas AG later acknowledged this discrepancy and is in the process of re-calculating the alleged overpayment.
In re Generic Pharmaceuticals Pricing Antitrust Litigation
Between March 2016 and January 2019, numerous complaints styled as antitrust class actions on behalf of direct purchasers and indirect purchasers (or end-payors) and several separate individual complaints on behalf of certain direct and indirect purchasers (the “opt-out plaintiffs”) have been filed against manufacturers of generic digoxin, lidocaine/prilocaine, glyburide-metformin, and metronidazole, including Impax.
The end-payor plaintiffs comprise Plaintiff International Union of Operating Engineers Local 30 Benefits Fund; Tulsa Firefighters Health and Welfare Trust; NECA-IBEW Welfare Trust Fund; Pipe Trade Services MN; Edward Carpinelli; Fraternal Order of Police, Miami Lodge 20, Insurance Trust Fund; Nina Diamond; UFCW Local 1500 Welfare Fund; Minnesota Laborers Health and Welfare Fund; The City of Providence, Rhode Island; Philadelphia Federation of Teachers Health and Welfare Fund; United Food & Commercial Workers and Employers Arizona Health and Welfare Trust; Ottis McCrary; Plumbers & Pipefitters Local 33 Health and Welfare Fund; Plumbers & Pipefitters Local 178 Health and Welfare Trust Fund; Unite Here Health; Valerie Velardi; and Louisiana Health Service Indemnity Company. The direct purchaser plaintiffs comprise KPH Healthcare Services, Inc. a/k/a Kinney Drugs, Inc.; Rochester Drug Co-Operative, Inc.; César Castillo, Inc.; Ahold USA, Inc.; and FWK Holdings, L.L.C. The opt-out plaintiffs comprise The Kroger Co.; Albertsons Companies, LLC; H.E. Butt Grocery Company L.P.; Humana Inc.; and United Healthcare Services, Inc.
On April 6, 2017, the JPML ordered the consolidation of all civil actions involving allegations of antitrust conspiracies in the generic pharmaceutical industry regarding
18
generic drugs in the Eastern District of Pennsylvania, as In re Generic Pharmaceuticals Pricing Antitrust Litigation (MDL No. 2724). Consolidated class action complaints were filed on August 15, 2017 for each of the
18
drugs; Impax is named as a defendant in the
2
complaints respecting digoxin and lidocaine-prilocaine. Impax also is a defendant in the class action complaint filed with the MDL court on June 22, 2018 by certain direct purchasers of glyburide-metformin and metronidazole.
F-
39
Each of the various complaints alleges a conspiracy to fix, maintain, stabilize, and/or raise prices, rig bids, and allocate markets or customers for the particular drug products at issue. Plaintiffs seek, among other things, unspecified monetary damages and equitable relief, including disgorgement and restitution. On October 16, 2018, the Court denied Impax and its co-defendants’ motion to dismiss the digoxin complaint. On February 15, 2019, the Court granted in part and denied in part defendants’ motions to dismiss various state antitrust, consumer protection, and unjust enrichment claims brought by two classes of indirect purchasers in the digoxin action. The Court dismissed
seven
state law claims in the end-payor plaintiffs’ complaint and
six
state law claims in the indirect reseller plaintiffs’ complaint. Motions to dismiss the glyburide-metformin and metronidazole complaint, as well as
2
of the complaints filed by certain opt-out plaintiffs, were filed February 21, 2019. Document discovery otherwise is proceeding.
The Company believes it has substantial meritorious defenses to the claims asserted with respect to the litigation related to its settlements. However, any adverse outcome could negatively affect the Company and could have a material adverse effect on the Company's results of operations, cash flows and/or overall financial condition.
Prescription Opioid Litigation
The Company and certain of its affiliates have been named as a defendant in various matters relating to the promotion and sale of prescription opioid pain relievers. The Company is aware that other individuals and states and political subdivisions are filing comparable actions against, among others, manufacturers and parties that have promoted and sold prescription opioid pain relievers, and additional suits may be filed.
The complaints, asserting claims under provisions of different state law and, in one case, Federal law, generally contend that the defendants allegedly engaged in improper marketing of opioids, and seek a variety of remedies, including restitution, civil penalties, disgorgement of profits, treble damages, attorneys’ fees and injunctive relief. None of the complaints specifies the exact amount of damages at issue. The Company and its affiliates that are defendants in the various lawsuits deny all allegations asserted in these complaints and have filed or intend to file motions to dismiss where possible. Each of the opioid-related matters described below is in its early stages. The Company intends to continue to vigorously defend these cases. In light of the inherent uncertainties of civil litigation, the Company is not in a position to predict the likelihood of an unfavorable outcome or provide an estimate of the amount or range of potential loss in the event of an unfavorable outcome in any of these matters.
On August 17, 2017, plaintiff Linda Hughes, as the mother of Nathan Hughes, decedent, filed a complaint in Missouri state court naming Amneal Pharmaceuticals of New York LLC, Impax,
five
other pharmaceutical company defendants, and
three
healthcare provider defendants. Plaintiff alleges that use of defendants’ opioid medications caused the death of her son, Nathan Hughes. The complaint alleges causes of action against Amneal and Impax for strict product liability, negligent product liability, violation of Missouri Merchandising Practices Act and fraudulent misrepresentation. The case was removed to federal court on September 18, 2017. It was transferred to the United States District Court for the Northern District of Ohio on February 2, 2018, and is part of the multidistrict litigation pending as In re National Prescription Opiate Litigation, MDL No. 2804 (the “MDL”). Plaintiff has filed a motion to remand the case to Missouri state court. That motion remains pending before the MDL court. All activity in the case is stayed by order of the MDL court.
On March 15, 2018, plaintiff Scott Ellington, purporting to represent the State of Arkansas, more than
sixty
counties and a dozen cities, filed a complaint in Arkansas state court naming Gemini Laboratories, LLC and
fifty-one
other pharmaceutical companies as defendants. Plaintiffs allege that Gemini and the other pharmaceutical company defendants improperly marketed, sold, and distributed opioid medications and failed to adequately warn about the risks of those medications. Plaintiffs allege causes of actions against Gemini and the other pharmaceutical company defendants for negligence and nuisance and alleged violations of multiple Arkansas statutes. Plaintiffs request past damages and restitution for monies allegedly spent by the State of Arkansas and the county and city plaintiffs for “extraordinary and additional services” for responding to what plaintiffs term the “Arkansas Opioid Epidemic.” Plaintiffs also seek prospective damages to allow them to “comprehensively intervene in the Arkansas Opioid Epidemic,” punitive and treble damages as provided by law, and their costs and fees. The complaint does not include any specific damage amounts. Gemini filed a general denial and, on June 28, 2018, it joined the other pharmaceutical company defendants in moving to dismiss plaintiffs’ complaint. On January 29, 2019, the Court granted without prejudice Gemini’s motion to dismiss.
On March 27, 2018, plaintiff American Resources Insurance Company, Inc. filed a complaint in the United States District Court for the Southern District of Alabama against Amneal Pharmaceuticals of New York, LLC, Amneal Pharmaceuticals, LLC, Impax, the Impax Generics Division, and
thirty-five
other pharmaceutical company defendants. Plaintiff seeks certification of a class of insurers that since January 1, 2010, allegedly have been wrongfully required to: (i) reimburse for prescription opioids that allegedly were promoted, sold, and distributed illegally and improperly by the pharmaceutical company defendants; and (ii) incur costs for treatment of overdoses of opioid medications, misuse of those medications, or addiction to them. The complaint seeks
F-
40
compensatory and punitive damages, but plaintiff’s complaint does not include any allegation of specific damage amounts. On or about May 2, 2018, the case was transferred to the MDL. All activity in the case is stayed by order of the MDL court.
On May 30, 2018, plaintiff William J. Comstock filed a complaint in Washington state court against Amneal Pharmaceuticals of New York, LLC, and
four
other pharmaceutical company defendants. Plaintiff alleges he became addicted to opioid medications manufactured and sold by the pharmaceutical company defendants, which plaintiff contends caused him to experience opioid-induced psychosis, prolonged hospitalizations, pain, and suffering. Plaintiff asserts causes of action against Amneal and the other pharmaceutical company defendants for negligence, fraudulent misrepresentation, and violations of the Washington Consumer Protection Act. On July 12, 2018, Amneal and other defendants removed the case to the United States District Court for the Eastern District of Washington. On August 17, 2018, the case was transferred to the MDL. All activity in the case is stayed by order of the MDL court.
On June 18, 2018, a Subpoena and CID issued by the Office of the Attorney General of Kentucky, Office of Consumer Protection was served on Amneal. The CID contains
eleven
requests for production of documents pertaining to opioid medications manufactured and/or sold by Amneal, or for which Amneal holds an Abbreviated New Drug Application. The Company is evaluating the CID and has been in communication with the Office of the Attorney General about the scope of the CID, the response to the CID, and the timing of the response. It is unknown if the Office of the Attorney General will pursue any claim or file a lawsuit against Amneal.
On July 9, 2018, the Muscogee (Creek) Nation filed a First Amended Complaint in its case pending in the MDL against the Company and
55
other defendants consisting of pharmaceutical companies, wholesalers, distributors, and pharmacies. Plaintiff alleges it has been damaged by the Company and the other pharmaceutical company defendants as a result of alleged improper marketing, including off-label marketing, failure to adequately warn of the risks of opioid medications, and failure to properly monitor and control diversion of opioid medications within the Nation. The case has been designated as a bellwether motion to dismiss case for the MDL, meaning it is a test case for arguments directed at the complaints filed by Indian tribes in the MDL cases. On August 31, 2018, the Company moved to dismiss the First Amended Complaint, and also joined in separate motions to dismiss filed by different defense subgroups. Plaintiff has opposed these motions. Additionally, on September 28, 2018, plaintiff filed a motion to add Amneal Pharmaceuticals LLC, and Amneal Pharmaceuticals of New York, LLC, and to dismiss the Company from the complaint. The Company opposed that motion, and plaintiff filed a reply on October 19, 2018.
On July 18, 2018, the County of Webb, Texas requested waivers of service pursuant to Fed. R. Civ. P. 4 and the MDL Court’s CMOs from Amneal and Amneal Pharmaceuticals of New York, LLC, in its case pending in the MDL. Plaintiff’s Amended Complaint, filed against Amneal and
forty-one
other defendants consisting of pharmaceutical companies, wholesalers, distributors, and pharmacy benefit managers, alleges damages as a result of Amneal’s and the pharmaceutical company defendants’ improper marketing, failure to adequately warn of the risks of opioid medications, and failure to properly monitor and control diversion of opioid medications in or affecting Webb County. All activity in the case is stayed by order of the MDL court.
On August 24, 2018, the Tucson Medical Center filed a complaint against the Company and
18
other defendants consisting of pharmaceutical companies, distributors, and unidentified John Doe defendants, in the Superior Court of the State of Arizona, Pima County. Plaintiff alleges damages as a result of Amneal’s and the pharmaceutical company defendants’ improper marketing, failure to adequately warn of the risks of opioid medications, and failure to properly monitor and control diversion of opioid medications. Plaintiff seeks economic damages related to its purchase of opioid medications and for the costs of unreimbursed healthcare it has provided as a result of the opioid epidemic over and above ordinary healthcare services. In addition, Plaintiff seeks compensatory damages, treble damages, punitive damages, awards of attorney’s fees, and abatement of the alleged public nuisance, as provided by law. On September 24, 2018, the distributor defendants removed the case to the United States District Court for the District of Arizona. Plaintiff filed a motion to remand on September 25, 2018, which the distributor defendants opposed. The Company filed a motion to dismiss on October 1, 2018. On October 8, 2018, following the Court’s denial of its remand motion, Plaintiff voluntarily dismissed its Complaint without prejudice. Plaintiff re-filed its Complaint on October 9, 2018, in the Superior Court of the State of Arizona, Pima County, along with a motion to designate the case as “complex.” The distributor defendants filed a notice of removal on October 29, 2018. Plaintiff filed an Emergency Motion to Remand on October 30, 2018. On December 19, 2018, the Court granted Plaintiff’s motion and remanded the case to the Superior Court of Pima County, Arizona. On February 13, 2019, the Company again filed a motion to dismiss the complaint.
On October 4, 2018, the City of Martinsville, Virginia, filed a complaint in Virginia state court, naming Amneal Pharmaceuticals LLC, Impax, Amneal Pharmaceuticals, Inc., Amneal Pharmaceuticals of New York, LLC, and
45
other pharmaceutical companies and other entities as defendants. Plaintiff alleges that the defendants are liable for the economic and non-economic injuries allegedly suffered by resident doctors, health care payors, and opioid-addicted individuals, as well as for the costs incurred in addressing the opioid epidemic. Plaintiff requests an unspecified amount of damages against the defendants. The case was removed to federal court on December 13, 2018, and was conditionally transferred to the MDL on December 27, 2018. Plaintiff has opposed
F-
41
the transfer to the MDL and has moved to remand the case to Virginia state court. The case presently is before the JPML. Responsive pleadings are not yet due.
In October and November 2018, the SouthEast Alaska Regional Health Consortium, the Kodiak Area Native Association, and the Norton Sound Health Corporation requested that the Company execute waivers of service pursuant to Fed. R. Civ. P. 4 and the MDL Court’s case management orders, in theirs case pending in the MDL. Plaintiffs’ complaints name the Company and
37
other entities as defendants. Plaintiffs allege damages and seek injunctive relief, compensatory and statutory damages, “as well as the means to abate the epidemic” that they allege was “created by Defendants’ wrongful and/or unlawful conduct.” All activity in these cases is stayed by order of the MDL court.
On December 3, 2018, Appalachian Regional Healthcare, Inc., filed a complaint in Kentucky state court, naming Amneal Pharmaceuticals LLC, and
32
other pharmaceutical companies and other entities as defendants. Plaintiff alleges that the defendants are liable for the economic and non-economic injuries allegedly suffered by Kentucky’s hospitals and others. Plaintiff requested an unspecified amount of damages against the defendants. The case has now been removed to federal court, and responsive pleading deadlines are suspended pending remand or transfer to the MDL.
On January 23, 2019, Indian Health Council, Inc., requested that the Company execute a waiver of service pursuant to Fed. R. Civ. P. 4 and the MDL court’s case management orders, in its case pending in the MDL. Plaintiff’s complaint names the Company and 18 other pharmaceutical companies and other entities as defendants. Plaintiff, an intertribal health organization which provides healthcare services to its consortium’s member tribes, alleges that the defendants are liable for the economic injuries it allegedly suffered as a result of its role in responding to an alleged opioid epidemic. Plaintiff requests an unspecified amount of damages against the defendants. The case has been transferred to the MDL. All activity in the case is stayed by order of the MDL court.
On February 7, 2019, Kentucky River District Health Department requested that the Company execute a waiver of service pursuant to Fed. R. Civ. P. 4 and the MDL court’s case management orders, in its case pending in the MDL. Plaintiff’s putative class action complaint names Amneal and
20
other pharmaceutical companies and other entities as defendants. Plaintiff alleges that the defendants are liable for the economic injuries it suffered, on behalf of itself and similarly situated Kentucky health departments, as a result of their role in responding to an alleged opioid epidemic. Plaintiff requests an unspecified amount of damages against the defendants. All activity in the case is stayed by order of the MDL court.
Impax Laboratories, LLC. v. Turing Pharmaceuticals AG
On May 2, 2016, Impax commenced a lawsuit against Turing Pharmaceuticals AG (presently known as Phoenixus AG) (“Turing”) by filing a complaint in the United States District Court for the Southern District of New York, alleging breaches of the contract pursuant to which Impax sold Turing the rights to the drug Daraprim
®
along with substantial inventory of that drug (the “Purchase Agreement”). Among other relief, the complaint sought money damages based on Turing’s failure to reimburse Impax for certain Medicaid rebate amounts attributable to Daraprim
®
that Impax paid to state Medicaid agencies in the first instance. Turing thereafter answered the lawsuit and filed a counterclaim alleging that Impax had breached its reporting obligations under the Purchase Agreement. Following the parties’ filing of cross-motions for summary judgment, as well as Impax’s subsequent filing of a reconsideration motion, the Court issued an order on August 21, 2018 holding that (i) Turing had breached the Purchase Agreement by failing to reimburse Impax for its payment of Medicaid rebate amounts, and (ii) Impax was only entitled to reimbursement of Medicaid rebate amounts attributable to periods after 2015, having breached its contractual reporting obligations with respect to prior periods. The parties thereafter entered into a confidential settlement agreement, dated December 13, 2018, and by stipulation dated December 14, 2018 the parties voluntarily dismissed the lawsuit with prejudice.
Securities Class Action
On April 17, 2017, Lead Plaintiff New York Hotel Trades Council & Hotel Association of New York City, Inc. Pension Fund filed an amended class action complaint in the United States District Court for the Northern District of California on behalf of itself and others similarly situated against Impax and four current or former Impax officers alleging violations of Sections 10(b) and 20(a) of the Securities Exchange Act of 1934 and Rule 10b-5. Plaintiff asserts claims regarding alleged misrepresentations about three generic drugs. Its principal claim alleges that Impax concealed that it colluded with competitor Lannett Corp. to fix the price of generic drug digoxin, and that its digoxin profits stemmed from this collusive pricing. Plaintiff also alleges that Impax concealed from the market anticipated erosion in the price of generic drug diclofenac and that Impax overstated the value of budesonide, a generic drug that it acquired from Teva. On June 1, 2017, Impax filed its motion to dismiss the amended complaint. On September 7, 2018, the Court granted Impax’s motion, dismissing plaintiffs’ claims without prejudice and with leave to amend their complaint. Plaintiff filed a second amended complaint October 26, 2018. Impax filed a motion to dismiss the second amended complainton December 6, 2018; plaintiffs’ opposition thereto was filed on January 17, 2019; and Impax’s reply in support of its motion to dismiss was filed on February 7, 2019.
F-
42
Shareholder Derivative Action
On February 22, 2017, Plaintiff Ed Lippman filed a shareholder derivative complaint in the Superior Court for the State of California in the County of Alameda on behalf of Impax against former executives, a current executive, and certain current members of the board of directors alleging breach of fiduciary duty, unjust enrichment, abuse of control, gross mismanagement, and corporate waste. This matter has been stayed pending the securities class action referenced above.
Teva v. Impax Laboratories, LLC.
On February 15, 2017, Plaintiffs Teva Pharmaceuticals USA, Inc. and Teva Pharmaceuticals Curacao N.V. ("Teva") filed a Praecipe to Issue Writ of Summons and Writ of Summons (precursor to a complaint) in the Philadelphia County Court of Common Pleas against Impax alleging that Impax breached the Strategic Alliance Agreement between the parties by not indemnifying Teva in its
two
litigations with GlaxoSmithKline LLC regarding Wellbutrin
®
XL (and therefore that Impax is liable to Teva for the amounts it paid to settle those litigations). Impax filed a Motion to Disqualify Teva’s counsel related to the matter, and on August 23, 2017, the trial court denied Impax's motion. Following the trial court’s order, Teva filed its complaint. On September 6, 2017, Impax appealed the trial court’s decision to the Pennsylvania Superior Court. On September 20, 2017, the Superior Court stayed the trial court action pending the outcome of Impax’s appeal. On November 2, 2018, the Superior Court affirmed the trial court’s decision. On November 16, 2018, Impax filed an application for reargument with the Superior Court, which was denied on December 28, 2018. On February 13, 2019, the Superior Court remitted the record to the trial court. On February 15, 2019, Impax filed its answer with new matter to Teva’s complaint. On February 19, 2019, the trial court issued a revised case management order providing that, absent any extensions or amendments thereto, discovery will close on July 1, 2019 and the case is expected to be ready for trial by February 3, 2020.
California Wage and Hour Class Action
On August 3, 2017, Plaintiff Emielou Williams filed a class action complaint in the Superior Court for the State of California in the County of Alameda on behalf of herself and others similarly situated against Impax alleging violation of California Business and Professions Code section 17200 by violating various California wage and hour laws, and seeking, among other things, declaratory judgment, restitution of allegedly unpaid wages, and disgorgement. On October 10, 2017, Impax filed a Demurrer and Motion to Strike Class Allegations. On December 12, 2017, the Court overruled Impax’s Demurrer to Plaintiff’s individual claims. However, it struck all of Plaintiff’s class allegations. On March 13, 2018, Plaintiff filed her First Amended Complaint once again including the same class allegations. The Company filed a Demurrer and Motion to Strike Class Allegations on April 12, 2018. On September 20, 2018, the Court again struck Plaintiff’s class allegations; Plaintiff has appealed this most recent order to the California State Court of Appeal.
United States Department of Justice / Drug Enforcement Administration Subpoena
On July 7, 2017, Amneal Pharmaceuticals of New York, LLC received an administrative subpoena issued by the Long Island, NY District Office of the Drug Enforcement Administration (the “DEA”) requesting information related to compliance with certain recordkeeping and reporting requirements pursuant to regulations promulgated by the DEA. The Company is cooperating with this request for information and has provided relevant information responsive to the request. The Company and the U.S. Attorney for the Eastern District of New York have entered into a tolling agreement with respect to the investigation. The material provisions of the tolling agreement provide that the investigation is ongoing, that the U.S. Attorney will not file a claim against the Company before April 25, 2019, and requests that the Company agree that the applicable statute(s) of limitations be tolled during the period from January 19, 2018 through April 25, 2019. The Company cannot predict at this time whether the U.S. Attorney will file a lawsuit or other claims against the Company with respect to the investigation.
Legal Settlement Gains
Legal settlement gains were
$22 million
and
$11 million
for the years ended December 31, 2018 and 2016, respectively, primarily related to the settlement of certain patent infringement matters with respect to Amneal's ANDA product filings. Refer to the Patent Litigation discussion above for the background on patent litigation.
Legal settlement gains for the year ended December 31, 2017 were
$29 million
. In July 2017, Amneal entered into a settlement agreement regarding one of its generic pharmaceutical products, buprenorphine and naloxone, pursuant to which Amneal received a settlement payment of
$25 million
, resulting in a net gain after legal fees of approximately
$21 million
. Amneal filed a claim against the innovator of Suboxone, a combination of active pharmaceutical ingredients buprenorphine and naloxone, alleging anti-competitive conduct resulting in lost profits during the time period in which Amneal was restricted from entering the market
F-
43
to sell its generic version of Suboxone. Additionally, during the year ended December 31, 2017, Amneal entered into a development contract settlement for
$8 million
with Kashiv Biosciences LLC, a related party. Refer to the Kashiv BioSciences LLC section of
Note 21.
Related Party Transactions
for details.
19. Stockholders' Equity/ Members' Deficit
Members' Deficit Prior to the Combination
As of
December 31, 2017
, Amneal had
189 million
units authorized, issued, and outstanding.
During 2018, the board of managers of Amneal approved a discretionary modification to the profit participation units be concurrent with the Combination that caused the vesting of all PPUs that were previously issued to certain current or former employees for service prior to the Combination. The modification entitled the holders to
6.9 million
shares of Class A Common Stock with a fair value of
$126 million
on the date of the Combination and
$33 million
of cash. In July 2018, Holdings distributed the shares it received in the Redemption to settle the PPUs with no additional shares issued by the Company. Additionally, during 2018, Holdings distributed
$28 million
of cash bonuses to employees of Amneal for service prior to the Combination. As a result of these transactions, the Company recorded charges aggregating
$187 million
to acquisition, integration and transaction-related expenses during the year ended
December 31, 2018
, and corresponding capital contributions of
$159 million
related to the vesting of the PPUs and
$28 million
related to the cash bonus in members' accumulated deficit. During the year ended
December 31, 2018
, Amneal made distributions of
$183 million
to its members.
Pursuant to the BCA, Amneal's units prior to the Combination were canceled and the Amneal Common Units were distributed as discussed in further detail in the paragraph below.
Stockholders' Equity Subsequent to the Combination
Amended Certificate of Incorporation
In connection with the closing of the Combination, on May 4, 2018, the Company amended and restated its certificate of incorporation ("Charter") to, among other things, reflect the change of its name from Atlas Holdings, Inc. to Amneal Pharmaceuticals, Inc. and provide for the authorization of (i)
900 million
shares of Class A Common Stock with a par value of
$0.01
per share; (ii)
300 million
shares of Class B Common Stock with a par value of
$0.01
per share; (iii)
18 million
shares of Class B-1 Common Stock with a par value of
$0.01
per share; and (iv)
2 million
shares of undesignated preferred stock with a par value of
$0.01
per share.
Voting Rights
Holders of Class A Common Stock and Class B Common Stock are entitled to
one
vote for each share of stock held. Except as required by law and except in connection with the election of the Class B-1 director, holders of Class B-1 Common Stock are not entitled to vote on any matter. Holders of Class A Common Stock and Class B Common Stock vote together as a single class on each matter submitted to a stockholder vote. Holders of Class A Common Stock and Class B Common Stock are not entitled to vote on any amendment to the Company's Charter that relates solely to the terms of one or more outstanding series of preferred stock if the holders of such affected series are entitled, either separately or together with the holders of one or more other such series, to vote on such terms pursuant to the Company's Charter or law.
Dividend Rights
The holders of Class A Common Stock and Class B-1 Common stock are entitled to receive dividends, if any, payable in cash, property, or securities of the Company, as may be declared by the Company's board of directors, out of funds legally available for the payment of dividends, subject to any preferential or other rights of the holders of any outstanding shares of preferred stock. The holders of Class B Common stock will not be entitled to receive any dividends.
Participation Rights
Under the Company's Charter, the holders of Class A Common Stock, Class B Common Stock and Class B-1 Common Stock have no participation rights. However, the Company's Second Amended and Restated Stockholders Agreement dated as of December 31, 2017 (the "Stockholders Agreement") provides that if the Company proposes to issue any securities, other than in certain issuances, Holdings will have the right to purchase its
pro rata
share of such securities, based on the number of shares of common stock owned by Holdings before such issuance.
F-
44
Issuance and Restrictions on Company Common Stock
Pursuant to the Third Amended and Restated Limited Liability Company Agreement of Amneal dated May 4, 2018 (the "Limited Liability Company Agreement"), Amneal will issue to the Company an additional Amneal common unit for each additional share of Class A Common Stock issued by the Company. Additionally, pursuant to the Charter, shares of Class B Common Stock will be issued to Holdings and its permitted transferees only to the extent necessary in certain circumstances to maintain a one-to-one ratio between the number of Amneal Common Units and the number of shares of Class B Common Stock held by such members. Shares of Class B Common Stock are transferable only for no consideration to the Company for automatic retirement or in accordance with the Stockholders Agreement and the Limited Liability Company Agreement.
Liquidation Rights
On the liquidation, dissolution or winding-up of the Company, whether voluntary or involuntary, the holders of Class A Common Stock and Class B-1 Common Stock are entitled to share equally in all assets of the Company available for distribution among the stockholders of the Company after payment to all creditors and subject to any preferential or other rights of the holders of any outstanding shares of preferred stock. The holders of Class B Common stock are not entitled to share in such net assets.
Redemption
The Limited Liability Company Agreement provides that holders of Amneal Common Units may, from time to time, require the Company to redeem all or a portion of their interests for newly issued shares of Class A Common Stock or Class B-1 Common Stock on a one-for-one basis. Upon receipt of a redemption request, the Company may, instead, elect to effect an exchange of Amneal Common Units directly with the holder. Additionally, the Company may elect to settle any such redemption or exchange in shares of Class A Common stock, Class B-1 Common Stock or in cash. In the event of a cash settlement, the Company would issue new shares of Class A Common Stock and use the proceeds from the sale of these newly issued shares of Class A Common Stock to fund the cash settlement, which, in effect, limits the amount of the cash payments to the redeeming member. In connection with any redemption, the Company will receive a corresponding number of Amneal Common Units, increasing the Company's total ownership interest in Amneal. Additionally, an equivalent number of shares of Class B Common Stock will be surrendered and canceled.
Preferred Stock
Under the Charter, the Company's Board of Directors has the authority to issue preferred stock and set its rights and preferences. As of
December 31, 2018
,
no
preferred stock had been issued.
Common Stock Issued
In connection with the Combination, the Company issued
73.3 million
shares of Class A Common Stock to the holders of Impax Common Stock and
225 million
shares of Class B Common Stock to Holdings. In connection with the PIPE, Holdings redeemed
46.8 million
shares of Class B Common Stock and an equal number of Amneal Common Units for
34.5 million
shares of unregistered Class A Common Stock and
12.3 million
shares of unregistered Class B-1 Common Stock. In connection with the Redemption, Holdings redeemed an additional
6.9 million
shares of Class B Common Stock and an equal number of Amneal Common Units for
6.9 million
shares of Class A Common Stock for distribution to members of Holdings to whom PPUs were previously issued. No cash was received by the Company with respect to issuances of common stock. The Combination, the PIPE Investment and the Redemption are more fully described in
Note 1. Nature of Operations and Basis of Presentation
.
Non-Controlling Interests
As discussed in
Note 2. Summary of Significant Accounting Policies
, the Company consolidates the financial statements of Amneal and its subsidiaries and records non-controlling interests for the portion of Amneal’s economic interests that is not held by the Company. Non-controlling interests are adjusted for capital transactions that impact the non-publicly held economic interests in Amneal.
Under the terms of the Limited Liability Company Agreement, Amneal is obligated to make tax distributions to its members. For the year ended
December 31, 2018
, a tax distribution of
$49 million
was recorded as a reduction of non-controlling interests. As of
December 31, 2018
, a liability of
$13 million
was included in related-party payables for the tax distribution.
During December 2018, the Company acquired the non-controlling interests in
one
of Amneal's non-public subsidiaries for approximately
$3 million
. As of
December 31, 2018
, the Company recorded a
$3 million
related party payable for this transaction which was settled in January 2019.
Redeemable Non-Controlling Interest
During July 2018, a non-controlling interest holder in one of Amneal's non-public subsidiaries notified the Company of its intent to redeem its remaining ownership interest based on the terms of an agreement. During the second quarter of 2018, the Company reclassified the redeemable non-controlling interest and in September 2018, the Company made a
$12 million
cash purchase of
F-
45
the redeemable non-controlling interest. The Company recorded charges to stockholders' accumulated deficit and non-controlling interests of
$1 million
and
$2 million
, respectively, during the year ended
December 31, 2018
, to accrete the redeemable non-controlling interest to contract value. At
December 31, 2018
, no redeemable non-controlling interest remained outstanding.
20. Stock-Based Compensation
Amneal Pharmaceuticals, Inc. 2018 Incentive Award Plan
In May 2018, the Company adopted the Amneal Pharmaceuticals, Inc. 2018 Incentive Award Plan ("2018 Plan") under which the Company may grant stock options, restricted stock units and other equity-based awards to employees and non-employee directors providing services to the Company and its subsidiaries. The stock option and restricted stock unit award grants are made in accordance with the Company’s 2018 Plan and are subject to forfeiture if the vesting conditions are not met.
The aggregate number of shares of Class A Common Stock authorized for issuance pursuant to the Company's 2018 Plan is
23
million shares. As of
December 31, 2018
, the Company had
18,292,841
shares available for issuance under the 2018 Plan.
Exchanged Impax Options
As a result of the acquisition of Impax, on May 4, 2018, each Impax stock option outstanding immediately prior to the closing of the Combination became fully vested and exchanged for a fully vested and exercisable option to purchase an equal number of shares of Class A Common Stock of the Company with the same exercise price per share as the replaced options and otherwise subject to the same terms and conditions as the replaced options. Consequently, at the Closing, the Company issued
3.0 million
fully vested stock options in exchange for the outstanding Impax options.
The Company recognizes the grant date fair value of each option and share of restricted stock unit over its vesting period. Stock options and restricted stock unit awards are granted under the Company’s 2018 Plan and generally vest over a
four
year period and, in the case of stock options, have a term of
10
years.
The following table summarizes all of the Company's stock option activity for the current year through
December 31, 2018
(there was no activity during the years ended
December 31, 2017
and
2016
):
|
Stock Options
|
Number of
Shares Under Option |
Weighted-
Average Exercise Price per Share |
Weighted-
Average Remaining Contractual Life |
Aggregate
Intrinsic Value (in millions) |
||||||||
|
Outstanding at December 31, 2017
|
—
|
|
$
|
—
|
|
|||||||
|
Conversion of Impax stock options outstanding on May 4, 2018
|
3,002,669
|
|
18.90
|
|
||||||||
|
Options granted
|
3,555,808
|
|
16.64
|
|
||||||||
|
Options exercised
|
(351,668
|
)
|
10.80
|
|
||||||||
|
Options forfeited
|
(392,228
|
)
|
23.02
|
|
||||||||
|
Outstanding at December 31, 2018
|
5,814,581
|
|
$
|
17.73
|
|
8.0
|
$
|
2.6
|
|
|||
|
Options exercisable at December 31, 2018
|
2,438,046
|
|
$
|
19.37
|
|
6.0
|
$
|
2.6
|
|
|||
The intrinsic value of options exercised during the year ended
December 31, 2018
was approximately
$3 million
.
The following table summarizes all of the Company's restricted stock unit activity for the current year through
December 31, 2018
(there was no activity during the years ended
December 31, 2017
and
2016
):
|
Restricted Stock Units
|
Number of
Restricted Stock Units |
Weighted-
Average Grant Date Fair Value |
Weighted-
Average Remaining Years |
Aggregate
Intrinsic Value (in millions) |
||||||||
|
Non-vested at December 31, 2017
|
—
|
|
$
|
—
|
|
|||||||
|
Granted
|
1,421,814
|
|
17.28
|
|
||||||||
|
Vested
|
—
|
|
—
|
|
||||||||
|
Forfeited
|
(91,190
|
)
|
19.19
|
|
||||||||
|
Non-vested at December 31, 2018
|
1,330,624
|
|
$
|
17.15
|
|
3.3
|
$
|
18.0
|
|
|||
As of
December 31, 2018
, the Company had total unrecognized stock-based compensation expense of
$41 million
related to all of its stock-based awards, which is expected to be recognized over a weighted average period of
3.3
years.
F-
46
The Company estimated the fair value of each stock option award on the grant date using the Black-Scholes option pricing model, wherein expected volatility is based on historical volatility of the publicly traded common stock of a peer group of companies. The expected term calculation is based on the "simplified" method described in SAB No. 107, Share-Based Payment, and SAB No. 110, Share-Based Payment, as the result of the simplified method provides a reasonable estimate in comparison to actual experience. The risk-free interest rate is based on the U.S. Treasury yield at the date of grant for an instrument with a maturity that is commensurate with the expected term of the stock options. The dividend yield of
zero
is based on the fact that the Company has never paid cash dividends on its common stock, and has no present intention to pay cash dividends. Options granted under each of the above plans generally vest over
four
years and have a term of
10
years. The following table presents the weighted-average assumptions used in the option pricing model for options granted under the 2018 Plan.
|
|
December 31, 2018
|
|
Volatility
|
46.5%
|
|
Risk-free interest rate
|
2.9%
|
|
Dividend yield
|
—%
|
|
Weighted-average expected life (years)
|
6.25
|
|
Weighted average grant date fair value
|
$8.14
|
The amount of stock-based compensation expense recognized by the Company for the years ended December 31, 2018, 2017 and 2016 was as follows (in thousands):
|
|
Year Ended December 31,
|
||||||||||
|
2018
|
2017
|
2016
|
|||||||||
|
Cost of goods sold
|
$
|
921
|
|
$
|
—
|
|
$
|
—
|
|
||
|
Selling, general and administrative
|
6,923
|
|
—
|
|
—
|
|
|||||
|
Research and development
|
996
|
|
—
|
|
—
|
|
|||||
|
Total
|
$
|
8,840
|
|
$
|
—
|
|
$
|
—
|
|
||
21. Related Party Transactions
The Company has various business agreements with certain third-party companies in which there is some common ownership and/or management between those entities, on the one hand, and the Company, on the other hand. The Company has no direct ownership or management in any of such related party companies. The related party relationships that generated income and/or expense and the respective reporting periods are described below.
Financing Obligation - Related Party
The Company has a non-cancelable lease agreement dated October 1, 2012, for
two
buildings located in Long Island, New York, that are used as an integrated manufacturing and office facility. Amneal was responsible for a portion of the renovation and construction costs, and is deemed, for accounting purposes, to be the owner of the building. As a result, the Company was required to record the property, plant, and equipment and a corresponding financing obligation. The financing obligation is reduced by rental payments through the end of the lease, June 30, 2043.
The remaining financing obligation was $
39 million
and
$40 million
as of
December 31, 2018
and
2017
, respectively. The current portion of the remaining financing obligation was
$0.3 million
as of both
December 31, 2018
and
2017
.
The annual payments required under the terms of the non-cancelable lease agreement over the next five years and thereafter are as follows (in thousands):
F-
47
|
|
|
Payments Due
|
||
|
2019
|
|
$
|
5,474
|
|
|
2020
|
|
5,474
|
|
|
|
2021
|
|
5,474
|
|
|
|
2022
|
|
5,474
|
|
|
|
2023
|
5,474
|
|
||
|
Thereafter
|
|
107,196
|
|
|
|
Total
|
|
$
|
134,566
|
|
Kanan, LLC
Kanan, LLC ("Kanan") is an independent real estate company which owns Amneal’s manufacturing facilities located at 65 Readington Road, Branchburg, New Jersey, 131 Chambers Brook Road, Branchburg, New Jersey and 1 New England Avenue, Piscataway, New Jersey. Amneal leases these facilities from Kanan under
two
separate triple-net lease agreements that expire in 2027 and 2031, respectively, at an annual rental cost of approximately
$2 million
combined, subject to CPI rent escalation adjustments as provided in the lease agreements. Rent expense paid to the related party for each of the years ended
December 31, 2018
,
2017
and
2016
was
$2 million
.
AE Companies, LLC
AE Companies, LLC ("AE") is an independent company which provides certain shared services and corporate type functions to a number of independent entities with respect to which, from time to time, Amneal conducts business. Amneal has ongoing professional service agreements with AE for administrative and research and development services. The total amount of income earned from these agreements for the years ended
December 31, 2017
and
2016
was
$0.8 million
and
$1 million
, respectively (
none
in 2018).
Asana Biosciences, LLC
Asana Biosciences, LLC (“Asana”) is an early stage drug discovery and R&D company focusing on several therapeutic areas, including oncology, pain and inflammation. Amneal provided research and development services to Asana under a development and manufacturing agreement. The total amount of income earned from this arrangement for the year ended
December 31, 2018
was
$0.2 million
(
no
ne in 2017 or 2016). At
December 31, 2018
, no amounts were due from the related party.
In July 2014, Amneal entered into a sublease agreement with Asana for a portion of its corporate office space in Bridgewater, NJ. The sublease was for
ten years
with annual base rent of
$0.1 million
, subject to CPI increases. The sublease terminated by mutual agreement in August 2016. Rental income from the related party sublease for the year ended December 31, 2016 was
$0.1 million
.
Industrial Real Estate Holdings NY, LLC
Industrial Real Estate Holdings NY, LLC ("IRE") is an independent real estate management entity which, among other activities, is the landlord of Amneal’s leased manufacturing facilities located at 75 and 85 Adams Avenue, Hauppauge, New York. The lease at 85 Adams Avenue expired in March 2017 while the lease for 75 Adams Avenue expires in March 2021. Rent expense paid to the related party for the years ended
December 31, 2018
,
2017
and
2016
was
$1 million
,
$1 million
and
$1 million
, respectively.
Kashiv BioSciences LLC
Kashiv BioSciences LLC ("Kashiv") is an independent contract development organization focused primarily on the development of 505(b) (2) NDA products. Amneal has various business agreements with Kashiv. In May 2013, Amneal entered into a sublease agreement with Kashiv for a portion of one of its research and development facilities. The sublease automatically renews annually if not terminated and has an annual base rent of
$2 million
. Rental income from the related party sublease for the years ended
December 31, 2018
,
2017
and
2016
was
$0.4 million
,
$2 million
and
$2 million
, respectively. On January 15, 2018, Amneal and Kashiv entered into an Assignment and Assumption of Lease Agreement. The lease was assigned to Kashiv, and Amneal was relieved of all obligations. At
December 31, 2018
and
December 31, 2017
,
$0.6 million
and
$10 million
of receivables were due, respectively.
F-
48
Amneal has also entered into various development and commercialization arrangements with Kashiv to collaborate on the development and commercialization of certain generic pharmaceutical products. Kashiv receives a percentage of net profits with respect to Amneal’s sales of these products. The total profit share paid to Kashiv for the years ended
December 31, 2018
,
2017
and
2016
was
$4 million
,
$10 million
and
$5 million
, respectively. At
December 31, 2018
and
December 31, 2017
payables of
$0.8 million
and
$0.6 million
, respectively, were due to the related party for royalty-related transactions.
In June 2017, Amneal and Kashiv entered a product acquisition and royalty stream purchase agreement. The aggregate purchase price was
$25 million
on the closing, which has been paid, plus
two
potential future
$5 million
earn outs related to the Estradiol Product. The contingent earn outs will be recorded in the period in which they are earned. The first and second
$5 million
earn outs were recognized in March 2018 and June 2018, respectively, as an increase to the cost of the Estradiol product intangible asset and will be amortized on a straight-line basis over the remaining life of the Estradiol intangible asset. The first earn out was paid in July 2018 and the second earn out was paid in September 2018.
Pursuant to a product development agreement, Amneal and Kashiv agreed to collaborate on the development and commercialization of Oxycodone HCI ER Oral Tablets. Under the agreement, this product is owned by Kashiv, with Amneal acting as the exclusive marketing partner and as Kashiv’s agent for filing the product ANDA. Under the agreement, Amneal was also responsible for assuming control of and managing all aspects of the patent litigation arising from the filing of the ANDA, including selecting counsel and settling such proceeding (subject to Kashiv’s consent). In December 2017, Amneal and Kashiv terminated the product development agreement and pursuant to the termination and settlement of the agreement, Kashiv agreed to pay Amneal
$8 million
, an amount equal to the legal costs incurred by Amneal related to the defense of the ANDA. The
$8 million
settlement was recorded within legal settlement gains for the year ended
December 31, 2017
and related party receivables as of
December 31, 2017
. The cash payment was received in February 2018.
Adello Biologics, LLC
Adello is an independent clinical stage company engaged in the development of biosimilar pharmaceutical products. Amneal and Adello are parties to a master services agreement pursuant to which, from time to time, Amneal provides human resources and product quality assurance services on behalf of Adello. The parties are also party to a license agreement for parking spaces in Piscataway, NJ. The total amount of net income received from Adello from these agreements for
December 31, 2018
was
$0.2 million
. The total amount of net expense paid to Adello from these agreements for each of the years ended
December 31, 2017
and
2016
was
$0.1 million
.
In March 2017, Amneal entered into a product development agreement with Adello. The collaboration extended the remaining development process to Adello for a complex generic product, while Amneal retained its commercial rights upon approval. Pursuant to the agreement, Adello paid Amneal
$10 million
for reimbursement of past development costs, which Amneal deferred as a liability and will pay royalties upon commercialization.
In October 2017, Amneal and Adello terminated their product development agreement pursuant to which Amneal and Adello had been collaborating to develop and commercialize Glatiramer Acetate products. Pursuant to the termination agreement, Amneal owed Adello
$11 million
for the up-front payment plus interest. This amount was recognized as a related party payable as of
December 31, 2017
and paid in January 2018.
On October 1, 2017, Amneal and Adello entered into a license and commercialization agreement pursuant to which the parties have agreed to cooperate with respect to certain development activities in connection with two biologic pharmaceutical products. In addition, under the agreement, Adello has appointed Amneal as its exclusive marketing partner for such products in the United States. In connection with the agreement, Amneal paid an upfront amount of
$2 million
in October 2017 which was recorded within research and development expenses. The agreement also provides for potential future milestone payments to Adello.
In October 2017, Amneal purchased a building from Adello in Ireland to further support its inhalation dosage form. Amneal issued a promissory note for
12.5 million
euros (approximately
$15 million
based on exchange rate as of
December 31, 2017
) which accrues interest at a rate of
2%
per annum, due on or before July 1, 2019. The promissory note was paid in full in the second quarter of 2018.
F-
49
PharmaSophia, LLC
PharmaSophia, LLC ("PharmaSophia") is a joint venture formed by Nava Pharma, LLC ("Nava") and Oakwood Laboratories, LLC for the purpose of developing certain products. Currently, PharmaSophia is actively developing two injectable products. PharmaSophia and Nava are parties to a research and development agreement pursuant to which Nava provides research and development services to PharmaSophia. Nava subcontracted this obligation to Amneal, entering into a subcontract research and development services agreement pursuant to which Amneal provides research and development services to Nava in connection with the products being developed by PharmaSophia. The total amount of income earned from these agreements for the years ended
December 31, 2018
,
2017
and
2016
was
$0.7 million
,
$0.3 million
and
$0.3 million
, respectively. At
December 31, 2018
and
December 31, 2017
receivables of
$0.1 million
and
$0.1 million
, respectively, were due from the related party.
Gemini Laboratories, LLC
Prior to the Company's acquisition of Gemini in May 2018 as described in
Note 3. Acquisitions and Divestitures
, Amneal and Gemini were parties to various agreements. Total gross profit earned from the sale of inventory to Gemini for the years ended
December 31, 2018
(through the acquisition date),
2017
and
2016
was
$0.1 million
,
$3 million
and
$16 million
, respectively. The total profit share paid by Gemini for the years ended
December 31, 2018
(through the acquisition date),
2017
and
2016
was
$5 million
,
$12 million
and
$15 million
, respectively. At
December 31, 2017
, receivables of
$6 million
were due from the related party.
As part of the Company's 2018 acquisition of Gemini, the Company had an unsecured promissory note payable of
$77 million
owed to the sellers of Gemini. On November 7, 2018, the Company paid the note payable in full and the related
$1 million
of interest incurred.
APHC Holdings, LLC (formerly, Amneal Holdings, LLC)
APHC Holdings, LLC (formerly, Amneal Holdings, LLC) was the ultimate parent of Amneal prior to the Combination. In connection with the Combination, Amneal is required to reimburse transaction-related costs incurred by APHC Holdings, LLC. As of
December 31, 2018
,
no
amounts were due to APHC Holdings, LLC.
Tax Distributions
Under the terms of the Limited Liability Company Agreement, Amneal is obligated to make tax distributions to its members, which are also holders of non-controlling interests in the Company. For further details, refer to
Note 19. Stockholders' Equity/ Members' Deficit
.
Purchase of Non-Controlling Interest
During December 2018, the Company acquired the non-controlling interest in one of Amneal's non-public subsidiaries. For further details, refer to
Note 19. Stockholders' Equity/ Members' Deficit
.
22. Employee Benefit Plans
The Company has voluntary defined contribution plans covering eligible employees in the United States which provide for a Company match. For the years ended
December 31, 2018
,
2017
and 2016, the Company made matching contributions of
$7 million
,
$3 million
and
$2 million
, respectively.
The Company also has a deferred compensation plan for certain former executives and employees of Impax, some of whom are currently employed by the Company. In January 2019, the Company announced that it will no longer accept contributions from employees or make matching contributions for the deferred compensation plan. Deferred compensation liabilities are recorded at the value of the amount owed to the plan participants, with changes in value recognized as compensation expense. The calculation of the deferred compensation plan obligation is derived by reference to hypothetical investments selected by the participants and is included in other long-term liabilities. The Company invests participant contributions in corporate-owned life insurance policies, for which the cash surrender value is included in other non-current assets. Matching contributions for the year ended
December 31, 2018
were immaterial.
F-
50
23. Segment Information
The Company has
two
reportable segments, the Generics segment and the Specialty segment. Generics develops, manufactures and commercializes complex oral solids, injectables, ophthalmics, liquids, topicals, softgels, inhalation products and transdermals across a broad range of therapeutic categories. The Company's retail and institutional portfolio contains approximately
200
product families, many of which represent difficult-to-manufacture products or products that have a high barrier-to-entry, such as oncologics, anti-infectives and supportive care products for healthcare providers.
Specialty delivers proprietary medicines to the U.S. market. The Company offers a growing portfolio in core therapeutic categories including central nervous system disorders, endocrinology, parasitic infections and other therapeutic areas. Our specialty products are marketed through skilled specialty sales and marketing teams, who call on neurologists, movement disorder specialists, endocrinologists and primary care physicians in key markets throughout the U.S.
Specialty also has a number of product candidates that are in varying stages of development.
The Company’s chief operating decision maker evaluates the financial performance of the Company’s segments based upon segment operating income (loss). Items below income (loss) from operations are not reported by segment, since they are excluded from the measure of segment profitability reviewed by the Company’s chief operating decision maker. Additionally, general and administrative expenses, certain selling expenses, certain litigation settlements, and non-operating income and expenses are included in "Corporate and Other." The Company does not report balance sheet information by segment since it is not reviewed by the Company’s chief operating decision maker.
The tables below present segment information reconciled to total Company financial results, with segment operating income or loss including gross profit less direct research and development expenses and direct selling expenses as well as any litigation settlements, to the extent specifically identified by segment (in thousands):
|
Year Ended December 31, 2018
|
Generics
|
Specialty
|
Corporate and Other
|
Total
Company |
||||||||||||
|
Net revenue
|
$
|
1,439,031
|
|
$
|
223,960
|
|
$
|
—
|
|
$
|
1,662,991
|
|
||||
|
Cost of goods sold
|
842,996
|
|
103,592
|
|
—
|
|
946,588
|
|
||||||||
|
Gross profit
|
596,035
|
|
120,368
|
|
—
|
|
716,403
|
|
||||||||
|
Selling, general and administrative
|
68,426
|
|
49,465
|
|
112,544
|
|
230,435
|
|
||||||||
|
Research and development
|
183,412
|
|
10,778
|
|
—
|
|
194,190
|
|
||||||||
|
In-process research and development impairment charges
|
39,259
|
|
—
|
|
—
|
|
39,259
|
|
||||||||
|
Acquisition, transaction-related and integration expenses
|
114,622
|
|
—
|
|
107,196
|
|
221,818
|
|
||||||||
|
Restructuring and asset-related charges
|
33,943
|
|
4,076
|
|
18,394
|
|
56,413
|
|
||||||||
|
Intellectual property legal development expenses
|
15,772
|
|
489
|
|
—
|
|
16,261
|
|
||||||||
|
Legal settlement gains
|
(22,300
|
)
|
—
|
|
—
|
|
(22,300
|
)
|
||||||||
|
Operating income (loss)
|
$
|
162,901
|
|
$
|
55,560
|
|
$
|
(238,134
|
)
|
$
|
(19,673
|
)
|
||||
|
Year Ended December 31, 2017
|
Generics
|
Specialty
|
Corporate
and Other |
Total
Company |
||||||||||||
|
Net revenue
|
$
|
1,033,654
|
|
$
|
—
|
|
$
|
—
|
|
$
|
1,033,654
|
|
||||
|
Cost of goods sold
|
507,476
|
|
—
|
|
—
|
|
507,476
|
|
||||||||
|
Gross profit
|
526,178
|
|
—
|
|
—
|
|
526,178
|
|
||||||||
|
Selling, general and administrative
|
56,050
|
|
—
|
|
52,996
|
|
109,046
|
|
||||||||
|
Research and development
|
171,420
|
|
—
|
|
—
|
|
171,420
|
|
||||||||
|
Intellectual property legal development expenses
|
20,518
|
|
—
|
|
—
|
|
20,518
|
|
||||||||
|
Legal settlement gains
|
(29,312
|
)
|
—
|
|
—
|
|
(29,312
|
)
|
||||||||
|
Acquisition and transaction-related expenses
|
—
|
|
—
|
|
9,403
|
|
9,403
|
|
||||||||
|
Operating income (loss)
|
$
|
307,502
|
|
$
|
—
|
|
$
|
(62,399
|
)
|
$
|
245,103
|
|
||||
F-
51
|
Year Ended December 31, 2016
|
Generics
|
Specialty
|
Corporate
and Other |
Total
Company |
||||||||||||
|
Net revenue
|
$
|
1,018,225
|
|
$
|
—
|
|
$
|
—
|
|
$
|
1,018,225
|
|
||||
|
Cost of goods sold
|
420,770
|
|
—
|
|
—
|
|
420,770
|
|
||||||||
|
Gross profit
|
597,455
|
|
—
|
|
—
|
|
597,455
|
|
||||||||
|
Selling, general and administrative
|
69,540
|
|
—
|
|
49,217
|
|
118,757
|
|
||||||||
|
Research and development
|
179,019
|
|
—
|
|
—
|
|
179,019
|
|
||||||||
|
Intellectual property legal development expenses
|
25,728
|
|
—
|
|
—
|
|
25,728
|
|
||||||||
|
Legal settlement gains
|
(11,000
|
)
|
—
|
|
—
|
|
(11,000
|
)
|
||||||||
|
Acquisition and transaction-related expenses
|
—
|
|
—
|
|
70
|
|
70
|
|
||||||||
|
Operating income (loss)
|
$
|
334,168
|
|
$
|
—
|
|
$
|
(49,287
|
)
|
$
|
284,881
|
|
||||
Significant Products
The Company generally consolidates net revenue by "product family," meaning that it consolidates net revenue from products containing the same active ingredient(s) irrespective of dosage strength, delivery method or packaging size. The Company's significant product families, as determined based on net revenue, and their percentage of the Company's consolidated net revenue for each of the years ended
December 31, 2018
,
2017
and
2016
are set forth below (in thousands, except for percentages):
|
Segment
|
Product Family
|
Year Ended December 31, 2018
|
||||||
|
$
|
%
|
|||||||
|
Generics
|
Yuvafem-Estradiol
|
$
|
130,920
|
|
8%
|
|||
|
Generics
|
Diclofenac Sodium Gel
|
103,131
|
|
6%
|
||||
|
Specialty
|
Rytary® family
|
95,541
|
|
6%
|
||||
|
Generics
|
Aspirin; Dipyridamole ER Capsul
|
78,541
|
|
5%
|
||||
|
Generics
|
Epinephrine Auto-Injector family (generic Adrenaclick®)
|
$
|
67,529
|
|
4%
|
|||
|
Segment
|
Product Family
|
Year Ended December 31, 2017
|
||||||
|
$
|
%
|
|||||||
|
Generics
|
Yuvafem-Estradiol
|
$
|
130,480
|
|
13%
|
|||
|
Generics
|
Diclofenac Sodium Gel
|
94,395
|
|
9%
|
||||
|
Generics
|
Aspirin; Dipyridamole ER Capsul
|
79,674
|
|
8%
|
||||
|
Generics
|
Oseltamivir
|
37,240
|
|
4%
|
||||
|
Generics
|
Ranitidine
|
$
|
31,283
|
|
3%
|
|||
|
Segment
|
Product Family
|
Year Ended December 31, 2016
|
||||||
|
$
|
%
|
|||||||
|
Generics
|
Lidocaine
|
$
|
121,832
|
|
12%
|
|||
|
Generics
|
Diclofenac Sodium Gel
|
71,672
|
|
7%
|
||||
|
Generics
|
Yuvafem-Estradiol
|
53,025
|
|
5%
|
||||
|
Generics
|
Metaxalone
|
33,698
|
|
3%
|
||||
|
Generics
|
Metformin ER
|
$
|
33,420
|
|
3%
|
|||
F-
52
24. Supplementary Financial Information (Unaudited)
Selected financial information for the quarterly periods noted is as follows (in thousands, except per share amounts):
|
|
Quarters Ended
|
|||||||||||||||
|
2018
(1) (2)
|
March 31
|
June 30
|
September 30
|
December 31
|
||||||||||||
|
|
||||||||||||||||
|
Net revenue
|
$
|
275,189
|
|
$
|
413,787
|
|
$
|
476,487
|
|
$
|
497,528
|
|
||||
|
Gross profit
|
144,595
|
|
178,295
|
|
200,105
|
|
193,408
|
|
||||||||
|
Net income (loss)
|
51,652
|
|
(250,090
|
)
|
17,465
|
|
(20,330
|
)
|
||||||||
|
Net (loss) income attributable to Amneal Pharmaceuticals, Inc.
|
—
|
|
(19,104
|
)
|
6,952
|
|
(8,768
|
)
|
||||||||
|
Net income (loss) per share attributable to Amneal Pharmaceuticals, Inc.'s common stockholders:
|
|
|
|
|
||||||||||||
|
Class A and Class B-1 basic
|
—
|
|
(0.15
|
)
|
0.05
|
|
(0.07
|
)
|
||||||||
|
Class A and Class B-1 diluted
|
$
|
—
|
|
$
|
(0.15
|
)
|
$
|
0.05
|
|
$
|
(0.07
|
)
|
||||
|
Quarters Ended
|
||||||||||||||||
|
2017
(2)
|
March 31
|
June 30
|
September 30
|
December 31
|
||||||||||||
|
|
||||||||||||||||
|
Net revenue
|
$
|
225,681
|
|
$
|
259,871
|
|
$
|
254,733
|
|
$
|
293,369
|
|
||||
|
Gross profit
|
116,016
|
|
123,733
|
|
135,013
|
|
151,416
|
|
||||||||
|
Net income
|
42,261
|
|
37,748
|
|
27,122
|
|
62,194
|
|
||||||||
|
Net income attributable to Amneal Pharmaceuticals, Inc.
|
—
|
|
—
|
|
—
|
|
—
|
|
||||||||
|
Net income per share attributable to Amneal Pharmaceuticals, Inc.'s common stockholders:
|
|
|
|
|
||||||||||||
|
Class A and Class B-1 basic
|
—
|
|
—
|
|
—
|
|
—
|
|
||||||||
|
Class A and Class B-1 diluted
|
$
|
—
|
|
$
|
—
|
|
$
|
—
|
|
$
|
—
|
|
||||
(1)
Basic and diluted net income (loss) per share are computed independently for each of the quarters presented. Therefore, the sum of quarterly basic and diluted net income (loss) per share amounts may not equal annual basic and diluted net income (loss) per share amounts.
(2)
On May 4, 2018, Impax and Amneal combined the generics and specialty pharmaceutical business of Impax with the generic drug development and manufacturing business of Amneal to create the Company as a new generics and specialty pharmaceutical company. Prior quarters have not been revised as a result of the Combination. Therefore, current year results, and balances, may not be comparable to prior years as the current year includes the impact of the Combination from May 4, 2018. For further details on the Combination, see
Note 1. Nature of Operations and Basis of Presentation
.
F-
53
EXHIBIT INDEX
|
Exhibit No.
|
Description of Document
|
|
|
Business Combination Agreement, dated as of October 17, 2017, by and among Amneal Pharmaceuticals LLC, Impax Laboratories, Inc., Atlas Holdings, Inc. and K2 Merger Sub Corporation (incorporated by reference to Exhibit 2.1 to the Company’s Registration Statement on Form S-1 filed on May 7, 2018).
|
||
|
Amendment No. 1, dated as of November 21, 2017, to the Business Combination Agreement, dated as of as of October 17, 2017, by and among Amneal Pharmaceuticals LLC, Impax Laboratories, Inc., Atlas Holdings, Inc. and K2 Merger Sub Corporation (incorporated by reference to Exhibit 2.2 to the Company’s Registration Statement on Form S-1 filed on May 7, 2018).
|
||
|
Amendment No. 2, dated as of December 16, 2017, to the Business Combination Agreement, dated as of as of October 17, 2017, as amended by Amendment No. 1 dated as of November 21, 2017 by and among Amneal Pharmaceuticals LLC, Impax Laboratories, Inc., Atlas Holdings, Inc. and K2 Merger Sub Corporation (incorporated by reference to Exhibit 2.3 to the Company’s Registration Statement on Form S-1 filed on May 7, 2018).
|
||
|
Purchase and Sale Agreement, dated as of May 7, 2018, by and between Amneal Pharmaceuticals LLC, Gemini Laboratories, LLC, the parties signatory thereto and the Sellers’ Representative (incorporated by reference to Exhibit 2.2 to the Company’s Current Report on Form 8-K filed on May 7, 2018).
|
||
|
Amended and Restated Certificate of Incorporation of Amneal Pharmaceuticals, Inc. adopted as of May 4, 2018 (incorporated by reference to Exhibit 3.1 to the Company’s Quarterly Report on Form 10-Q for the quarter ended June 30, 2018 filed on August 9, 2018).
|
||
|
Amended and Restated Bylaws of Amneal Pharmaceuticals, Inc. adopted as of May 4, 2018 (incorporated by reference to Exhibit 3.2 to the Company’s Quarterly Report on Form 10-Q for the quarter ended June 30, 2018 filed on August 9, 2018)
|
||
|
Second Supplemental Indenture dated as of May 4, 2018 to the Indenture dated as of June 30, 2015 by and between Impax Laboratories, LLC and Wilmington Trust, N.A. (incorporated by reference to Exhibit 4.1 to the Company’s Current Report on Form 8-K filed on May 7, 2018).
|
||
|
Term Loan Credit Agreement, dated as of May 4, 2018, by and among Amneal Pharmaceuticals LLC, as the borrower, JP Morgan Chase Bank, N.A., as administrative agent and collateral agent, and the lenders and other parties party thereto (incorporated by reference to Exhibit 10.1 to the Company’s Current Report on Form 8-K filed on May 7, 2018).
|
||
|
Revolving Credit Agreement, dated as of May 4, 2018, by and among Amneal Pharmaceuticals LLC, as the borrower, the other loan parties from time to time, JP Morgan Chase Bank, N.A., as administrative agent and collateral agent and the lenders and other parties party thereto (incorporated by reference to Exhibit 10.2 to the Company’s Current Report on Form 8-K filed on May 7, 2018).
|
||
|
Term Loan Guarantee and Collateral Agreement, dated as of May 4, 2018, by and among the loan parties from time to time party thereto and JPMorgan Chase Bank, N.A., as administrative agent and collateral agent (incorporated by reference to Exhibit 10.3 to the Company’s Current Report on Form 8-K filed on May 7, 2018).
|
||
|
Revolving Loan Guarantee and Collateral Agreement, dated as of May 4, 2018, by and among the loan parties from time to time party thereto and JPMorgan Chase Bank, N.A., as administrative agent and collateral agent (incorporated by reference to Exhibit 10.4 to the Company’s Current Report on Form 8-K filed on May 7, 2018).
|
||
|
Third Amended and Restated Limited Liability Company Agreement of Amneal Pharmaceuticals LLC adopted as of May 4, 2018 (incorporated by reference to Exhibit 10.5 to the Company’s Current Report on Form 8-K filed on May 7, 2018).
|
||
|
Amendment No. 1 to Third Amended and Restated Limited Liability Company Agreement of Amneal Pharmaceuticals LLC, dated as of February 14, 2019, with effect as of May 4, 2018.*
|
||
|
Tax Receivable Agreement, dated as of May 4, 2018, by and among Amneal Pharmaceuticals, Inc., Amneal Pharmaceuticals LLC and the Members of Amneal Pharmaceuticals LLC from time to time party thereto (incorporated by reference to Exhibit 10.6 to the Company’s Current Report on Form 8-K filed on May 7, 2018).
|
||
|
Form of Indemnification and Advancement Agreement for the directors and officers of the Company (incorporated by reference to Exhibit 10.7 to the Company’s Current Report on Form 8-K filed on May 7, 2018). †
|
||
|
Amneal Pharmaceuticals, Inc. 2018 Incentive Award Plan (incorporated by reference to Exhibit 10.8 to the Company’s Quarterly Report on Form 10-Q for the quarter ended June 30, 2018 filed on August 9, 2018)†
|
||
|
Form of Amneal Pharmaceuticals, Inc. 2018 Incentive Award Plan Stock Option Grant Notice and Stock Option Agreement (incorporated by reference to Exhibit 10.9 to the Company’s Current Report on Form 8-K filed on May 7, 2018). †
|
||
|
Form of Amneal Pharmaceuticals, Inc. 2018 Incentive Award Plan Restricted Stock Unit Grant Notice and Restricted Stock Unit Agreement (incorporated by reference to Exhibit 10.10 to the Company’s Current Report on Form 8-K filed on May 7, 2018). †
|
||
|
Form of Amneal Pharmaceuticals, Inc. 2018 Incentive Award Plan Performance Restricted Stock Unit Grant Notice and Performance Restricted Stock Unit Agreement.* †
|
||
|
Amneal Pharmaceuticals, Inc. Non-Employee Director Compensation Policy (incorporated by reference to Exhibit 10.11 to the Company’s Current Report on Form 8-K filed on May 7, 2018). †
|
||
|
Employment Agreement, dated May 4, 2018, by and between Amneal Pharmaceuticals, Inc. and Paul M. Bisaro (incorporated by reference to Exhibit 10.12 to the Company’s Current Report on Form 8-K filed on May 12, 2018). †
|
||
|
Employment Agreement, dated December 12, 2012, by and among Impax Laboratories, Inc. and Bryan M. Reasons (incorporated by reference to Exhibit 10.11 to the Company's Registration Statement on Form S-1 filed on May 7, 2018).†
|
||
|
Amendment to Employment Agreement, dated April 1, 2014, by and between Impax Laboratories, Inc. and Bryan M. Reasons (incorporated by reference to Exhibit 10.12 to the Company's Registration Statement on Form S-1 filed on May 7, 2018).†
|
||
|
Employment Agreement, dated January 24, 2018, by and among Amneal Pharmaceuticals LLC, Amneal Holdings, LLC and Andrew Boyer (incorporated by reference to Exhibit 10.10 to the Company's Registration Statement on Form S-1 filed on May 7, 2018).†
|
||
|
Employment Agreement, dated December 16, 2017, by and among Amneal Pharmaceuticals LLC, Atlas Holdings, Inc. and Robert A. Stewart (incorporated by reference to Exhibit 10.7 to the Company's Registration Statement on Form S-1 filed on May 7, 2018).†
|
||
|
Employment Agreement, dated January 21, 2019, by and between Amneal Pharmaceuticals LLC, Amneal Pharmaceuticals, Inc., and Todd P. Branning (incorporated by reference to Exhibit 10.1 to the Company’s Current Report on Form 8-K filed on January 24, 2019). †
|
||
|
Separation Agreement, dated February 5, 2019, by and between Sheldon Hirt and Amneal Pharmaceuticals, Inc.* †
|
||
|
Separation Agreement, dated February 28, 2019, by and between Bryan Reasons and Amneal Pharmaceuticals, Inc.* †
|
||
|
Unsecured Promissory Note, dated as of May 7, 2018, issued by Amneal Pharmaceuticals LLC to the Sellers (as defined therein) (incorporated by reference to Exhibit 10.13 to the Company’s Current Report on Form 8-K filed on May 12, 2018).
|
||
|
Amneal Pharmaceuticals LLC Severance Plan and Summary Plan Description (incorporated by reference to Exhibit 10.14 to the Company’s Current Report on Form 8-K filed on May 12, 2018). †
|
||
|
Impax Laboratories, Inc. Executive Non-Qualified Deferred Compensation Plan, amended and restated effective January 1, 2008 (incorporated by reference to Exhibit 10.13 to the Company's Registration Statement on Form S-1 filed on May 7, 2018).†
|
||
|
Amendment to Impax Laboratories, Inc. Executive Non-Qualified Deferred Compensation Plan, effective as of January 1, 2009 (incorporated by reference to Exhibit 10.14 to the Company's Registration Statement on Form S-1 filed on May 7, 2018).†
|
||
|
Subsidiaries of the registrant.
|
||
|
Consent of Independent Registered Public Accounting Firm.
|
||
|
Certification of the Chief Executive Officer Pursuant to Section 302 of the Sarbanes-Oxley Act of 2002.*
|
||
|
Certification of the Chief Financial Officer Pursuant to Section 302 of the Sarbanes-Oxley Act of 2002.*
|
||
|
Certification of the Chief Executive Officer Pursuant to 18 U.S.C. Section 1350, as Adopted Pursuant to Section 906 of the Sarbanes-Oxley Act of 2002.* **
|
||
|
Certification of the Chief Financial Officer Pursuant to 18 U.S.C. Section 1350, as Adopted Pursuant to Section 906 of the Sarbanes-Oxley Act of 2002.* **
|
||
|
101
|
The following materials from the Company’s Annual Report on Form 10-K for the year ended December 31, 2018, formatted in XBRL (eXtensible Business Reporting Language): (i) Consolidated Balance Sheets, (ii) Consolidated Statements of Operations, (iii) Consolidated Statements of Comprehensive Loss, (iv) Consolidated Statements of Changes in Stockholders’ Equity
/
Members’ Deficit, (v) Consolidated Statements of Cash Flows, and (vi) Notes to Consolidated Financial Statements.
|
|
* Filed herewith
**This certificate is being furnished solely to accompany the report pursuant to 18 U.S.C. 1350 and is not being filed for purposes of Section 18 of the Securities Exchange Act of 1934, as amended, and is not to be incorporated by reference into any filing of the Company, whether made before or after the date hereof, regardless of any general incorporation language in such filing.
†Denotes management compensatory plan or arrangement.
SIGNATURES
Pursuant to the requirements of Section 13 or 15(d) of the Securities Exchange Act of 1934, the registrant has duly caused this report to be signed on its behalf by the undersigned thereunto duly authorized.
|
Date: March 1, 2019
|
Amneal Pharmaceuticals, Inc.
|
|
|
By:
|
/s/ Todd P. Branning
|
|
|
Todd P. Branning
|
||
|
Senior Vice President and Chief Financial Officer
(Principal Financial and Accounting Officer)
|
||
Pursuant to the requirements of the Securities Exchange Act of 1934, this report has been signed below by the following persons on behalf of the registrant and in the capacities and on the dates indicated.
|
Signature
|
Title
|
Date
|
||
|
/s/ Robert A. Stewart
|
President, Chief Executive Officer and Director
|
March 1, 2019
|
||
|
Robert A. Stewart
|
(Principal Executive Officer)
|
|
||
|
|
|
|
||
|
/s/ Todd P. Branning
|
Senior Vice President and
|
March 1, 2019
|
||
|
Todd P. Branning
|
Chief Financial Officer
|
|
||
|
|
(Principal Financial and Accounting Officer)
|
|
||
|
|
|
|||
|
/s/ Paul M. Bisaro
|
Executive Chairman and Director
|
March 1, 2019
|
||
|
Paul M. Bisaro
|
|
|
||
|
|
|
|
||
|
/s/ Chirag Patel
|
Co-Chairman of the Board of Directors
|
March 1, 2019
|
||
|
Chirag Patel
|
|
|
||
|
|
|
|
||
|
/s/ Chintu Patel
|
Co-Chairman of the Board of Directors
|
March 1, 2019
|
||
|
Chintu Patel
|
|
|
||
|
|
|
|
||
|
/s/ Robert L. Burr
|
Director
|
March 1, 2019
|
||
|
Robert L. Burr
|
|
|
||
|
|
|
|
||
|
/s/ Emily Peterson Alva
|
Director
|
March 1, 2019
|
||
|
Emily Peterson Alva
|
|
|
||
|
|
|
|
||
|
/s/ J. Kevin Buchi
|
Director
|
March 1, 2019
|
||
|
J. Kevin Buchi
|
|
|
||
|
|
|
|
||
|
/s/ Jean Selden Greene
|
Director
|
March 1, 2019
|
||
|
Jean Selden Greene
|
|
|
||
|
|
|
|
||
|
/s/ Ted Nark
|
Director
|
March 1, 2019
|
||
|
Ted Nark
|
|
|
||
|
|
|
|
||
|
/s/ Gautam Patel
|
Director
|
March 1, 2019
|
||
|
Gautam Patel
|
|
|
||
|
|
|
|
||
|
/s/ Dharmendra Rama
|
Director
|
March 1, 2019
|
||
|
Dharmendra Rama
|
|
|
||
|
|
|
|
||
|
/s/ Peter R. Terreri
|
Director
|
March 1, 2019
|
||
|
Peter R. Terreri
|
|
|
||
|
|
|
|
||
|
/s/ Janet S. Vergis
|
Director
|
March 1, 2019
|
||
|
Janet S. Vergis
|
|
|
||
TABLE OF CONTENTS
Part IItem 1. BusinessNote 1. Nature Of Operations and Basis Of PresentationNote 18. Commitments and ContingenciesItem 1A. Risk FactorsNote 18. Commitments and Contingencies - Prescription Opioid LitigationNote 18. Commitments and Contingencies - Other Litigation Related To The Company's BusinessNote 18. Commitments and Contingencies,Note 18. Commitments and Contingencies - Texas State Attorney General Civil Investigative DemandNote 16. DebtItem 1B. Unresolved Staff CommentsItem 2. PropertiesItem 3. Legal ProceedingsItem 4. Mine Safety DisclosuresPart IIItem 5. Market For Registrant S Common Equity, Related Stockholder Matters and Issuer Purchases Of Equity SecuritiesItem 6. Selected Financial DataItem 7. Management S Discussion and Analysis Of Financial Condition and Results Of OperationsNote 1. Nature Of OperationsNote 3. Acquisitions and DivestituresNote 6. Restructuring and Asset-related ChargesNote 7. Acquisition, Transaction-related and Integration ExpensesNote 14. Goodwill and Intangible AssetsNote 5. Alliance and CollaborationNote 2. Summary Of Significant Accounting PoliciesNote 8. Income TaxesNote 1. Nature Of Operations and Basis Of Presentation)Item 7A. Quantitative and Qualitative Disclosures About Market RiskItem 7. Management's Discussion and Analysis Of Financial Condition and Results Of OperationsItem 8. Financial Statements and Supplementary DataItem 15. Exhibits, Financial Statement SchedulesItem 9. Changes in and Disagreements with Accountants on Accounting and Financial DisclosureItem 9A. Controls and ProceduresItem 9B. Other InformationPart IIIItem 10. Directors, Executive Officers and Corporate GovernanceItem 11. Executive CompensationItem 12. Security Ownership Of Certain Beneficial Owners and Management and Related Stockholder MattersItem 13. Certain Relationships and Related Transactions, and Director IndependenceItem 14. Principal Accounting Fees and ServicesPart IVItem 16. Form 10-k SummaryNote 4. Revenue RecognitionNote 21. Related Party Transactions,Note 19. Stockholders' Equity/ Members' Deficit