AMERICAN TOWER CORP /MA/
10-Ks and 10-Qs
|
|
|
|
|
|
|
|
|
|
|
|
|
|
|
|
|
|
|
|
|
|
|
|
|
|
|
|
|
|
|
|
|
|
|
|
|
|
|
|
|
|
|
|
|
|
|
|
|
|
|
|
|
|
|
|
UNITED STATES
SECURITIES AND EXCHANGE COMMISSION
Washington, D.C. 20549
FORM 10-K
(Mark One):
|
ý
|
Annual report pursuant to Section 13 or 15(d) of the Securities Exchange Act of 1934.
|
For the fiscal year ended
December 31, 2018
|
¨
|
Transition report pursuant to Section 13 or 15(d) of the Securities Exchange Act of 1934.
|
For the transition period from to
Commission File Number: 001-14195
American Tower Corporation
(Exact name of registrant as specified in its charter)
|
Delaware
|
|
65-0723837
|
|
(State or other jurisdiction of
Incorporation or Organization)
|
|
(I.R.S. Employer
Identification No.)
|
116 Huntington Avenue
Boston, Massachusetts 02116
(Address of principal executive offices)
Telephone Number (617) 375-7500
(Registrant’s telephone number, including area code)
Securities registered pursuant to Section 12(b) of the Act:
|
Title of each Class
|
|
Name of exchange on which registered
|
|
Common Stock, $0.01 par value
|
|
New York Stock Exchange
|
|
1.375% Senior Notes due 2025
|
New York Stock Exchange
|
|
|
1.950% Senior Notes due 2026
|
New York Stock Exchange
|
|
Securities registered pursuant to Section 12(g) of the Act:
None
Indicate by check mark if the registrant is a well known seasoned issuer, as defined in Rule 405 of the Securities Act: Yes
ý
No
¨
Indicate by check mark if the registrant is not required to file reports pursuant to Section 13 or Section 15(d) of the Act: Yes
¨
No
ý
Indicate by check mark whether the registrant (1) has filed all reports required to be filed by Section 13 or 15(d) of the Securities Exchange Act of 1934 during the preceding 12 months (or for such shorter period that the registrant was required to file such reports), and (2) has been subject to such filing requirements for the past 90 days: Yes
ý
No
¨
Indicate by check mark whether the registrant has submitted electronically every Interactive Data File required to be submitted pursuant to Rule 405 of Regulation S-T during the preceding 12 months (or for such shorter period that the registrant was required to submit such files). Yes
ý
No
¨
Indicate by check mark if disclosure of delinquent filers pursuant to Item 405 of Regulation S-K is not contained herein, and will not be contained, to the best of registrant’s knowledge, in definitive proxy or information statements incorporated by reference in Part III of the Form 10-K or any amendment to this Form 10-K.
¨
Indicate by check mark whether the registrant is a large accelerated filer, an accelerated filer, a non-accelerated filer, smaller reporting company, or an emerging growth company. See the definitions of “large accelerated filer,” “accelerated filer,” “smaller reporting company,” and “emerging growth company” in Rule 12b-2 of the Exchange Act. (Check One):
|
Large accelerated filer
|
|
x
|
|
Accelerated filer
|
|
o
|
|
Non-accelerated filer
|
|
o
|
|
Smaller reporting company
|
|
o
|
|
Emerging growth company
|
o
|
|||||
If an emerging growth company, indicate by check mark if the registrant has elected not to use the extended transition period for complying with any new or revised financial accounting standards provided pursuant to Section 13(a) of the Exchange Act.
¨
Indicate by check mark whether the registrant is a shell company (as defined in Rule 12b-2 of the Act): Yes
¨
No
ý
The aggregate market value of the voting and non-voting common stock held by non-affiliates of the registrant as of June 30,
2018
was
$63.1 billion
, based on the closing price of the registrant’s common stock as reported on the New York Stock Exchange as of the last business day of the registrant’s most recently completed second quarter.
As of
February 20,
2019
, there were
441,134,906
shares of common stock outstanding.
DOCUMENTS INCORPORATED BY REFERENCE
Portions of the definitive proxy statement (the “Definitive Proxy Statement”) to be filed with the Securities and Exchange Commission relative to the registrant’s
2019
Annual Meeting of Stockholders are incorporated by reference into Part III of this Report.
AMERICAN TOWER CORPORATION
TABLE OF CONTENTS
FORM 10-K ANNUAL REPORT
FISCAL YEAR ENDED DECEMBER 31,
2018
|
|
|
Page
|
|
PART I
|
||
|
ITEM 1.
|
||
|
ITEM 1A.
|
||
|
ITEM 1B.
|
||
|
ITEM 2.
|
||
|
ITEM 3.
|
||
|
ITEM 4.
|
||
|
PART II
|
||
|
ITEM 5.
|
||
|
ITEM 6.
|
||
|
ITEM 7.
|
||
|
ITEM 7A.
|
||
|
ITEM 8.
|
||
|
ITEM 9.
|
||
i
AMERICAN TOWER CORPORATION
TABLE OF CONTENTS—(Continued)
FORM 10-K ANNUAL REPORT
FISCAL YEAR ENDED DECEMBER 31,
2018
|
|
|
Page
|
|
ITEM 9A.
|
||
|
PART III
|
||
|
ITEM 10.
|
||
|
ITEM 11.
|
||
|
ITEM 12.
|
||
|
ITEM 13.
|
||
|
ITEM 14.
|
||
|
PART IV
|
||
|
ITEM 15.
|
||
|
ITEM 16.
|
||
SPECIAL NOTE REGARDING FORWARD-LOOKING STATEMENTS
This Annual Report on Form 10-K (this “Annual Report”) contains statements about future events and expectations, or forward-looking statements, all of which are inherently uncertain. We have based those forward-looking statements on our current expectations and projections about future results. When we use words such as “anticipates,” “intends,” “plans,” “believes,” “estimates,” “expects” or similar expressions, we are making forward-looking statements. Examples of forward-looking statements include, but are not limited to, statements we make regarding future prospects of growth in the communications site leasing industry, the level of future expenditures by companies in this industry and other trends in this industry, the effects of consolidation among companies in our industry and among our tenants and other competitive and financial pressures, changes in zoning, tax and other laws and regulations, economic, political and other events, particularly those relating to our international operations, our future capital expenditure levels, the impact of technology changes on our industry and our business, our ability to maintain or increase our market share, our plans to fund our future liquidity needs, our substantial leverage and debt service obligations, our future financing transactions, our future operating results, our ability to remain qualified for taxation as a real estate investment trust (REIT), the amount and timing of any future distributions including those we are required to make as a REIT, natural disasters and similar events and our ability to protect our rights to the land under our towers. These statements are based on our management’s beliefs and assumptions, which in turn are based on currently available information. These assumptions could prove inaccurate. These forward-looking statements may be found under the captions “Business” and “Management’s Discussion and Analysis of Financial Condition and Results of Operations,” as well as in this Annual Report generally.
ii
You should keep in mind that any forward-looking statement we make in this Annual Report or elsewhere speaks only as of the date on which we make it. New risks and uncertainties arise from time to time, and it is impossible for us to predict these events or how they may affect us. In any event, these and other important factors, including those set forth in Item 1A of this Annual Report under the caption “Risk Factors,” may cause actual results to differ materially from those indicated by our forward-looking statements. We have no duty, and do not intend, to update or revise the forward-looking statements we make in this Annual Report, except as may be required by law. In light of these risks and uncertainties, you should keep in mind that the future events or circumstances described in any forward-looking statement we make in this Annual Report or elsewhere might not occur. References in this Annual Report to “we,” “our” and the “Company” refer to American Tower Corporation and its predecessor, as applicable, individually and collectively with its subsidiaries as the context requires.
iii
PART I
|
ITEM 1. BUSINESS
|
Overview
We are one of the largest global real estate investment trusts and a leading independent owner, operator and developer of multitenant communications real estate. Our primary business is the leasing of space on communications sites to wireless service providers, radio and television broadcast companies, wireless data providers, government agencies and municipalities and tenants in a number of other industries. We refer to this business as our property operations, which accounted for
98%
of our total revenues for the year ended
December 31, 2018
. We also offer tower-related services in the United States, which we refer to as our services operations. These services include site acquisition, zoning and permitting and structural analysis, which primarily support our site leasing business, including the addition of new tenants and equipment on our sites.
American Tower Corporation was originally created as a subsidiary of American Radio Systems Corporation in 1995 and was spun off into a free-standing public company in 1998. We are a holding company and conduct our operations through our directly and indirectly owned subsidiaries and joint ventures. Our principal domestic operating subsidiaries are American Towers LLC and SpectraSite Communications, LLC. We conduct our international operations primarily through our subsidiary, American Tower International, Inc., which in turn conducts operations through its various international holding and operating subsidiaries and joint ventures.
Since inception, we have grown our communications real estate portfolio through acquisitions, long-term lease arrangements and site development. Our portfolio primarily consists of towers that we own and towers that we operate pursuant to long-term lease arrangements, as well as distributed antenna system (“DAS”) networks, which provide seamless coverage solutions in certain in-building and outdoor wireless environments. In addition to the communications sites in our portfolio, we manage rooftop and tower sites for property owners under various contractual arrangements. We also hold other telecommunications infrastructure, fiber and property interests that we lease primarily to communications service providers and third-party tower operators.
In 2018, we launched operations in Kenya through our acquisition of communications sites from Telkom Kenya Limited, acquired urban telecommunications assets, including fiber assets in Brazil, and added approximately 20,000 communications sites to our portfolio in India through two acquisitions. As of
December 31, 2018
, our communications real estate portfolio of
170,686
communications sites included
40,757
communications sites in the U.S.,
75,872
communications sites in Asia,
16,665
communications sites in Europe, Middle East and Africa (“EMEA”) and
37,392
communications sites in Latin America, as well as urban telecommunications assets in Argentina, Brazil, Mexico and South Africa.
We operate as a real estate investment trust for U.S. federal income tax purposes (“REIT”). Accordingly, we generally are not required to pay U.S. federal income taxes on income generated by our REIT operations, including the income derived from leasing space on our towers, as we receive a dividends paid deduction for distributions to stockholders that generally offsets our REIT income and gains. However, we remain obligated to pay U.S. federal income taxes on earnings from our domestic taxable REIT subsidiaries (“TRSs”). In addition, our international assets and operations, regardless of their classification for U.S. tax purposes, continue to be subject to taxation in the jurisdictions where those assets are held or those operations are conducted.
The use of TRSs enables us to continue to engage in certain businesses while complying with REIT qualification requirements. We may, from time to time, change the election of previously designated TRSs to be included as part of the REIT. As of
December 31, 2018
, our REIT-qualified businesses included our U.S. tower leasing business, our operations in Nigeria, most of our operations in Costa Rica and Mexico, a majority of our operations in Germany and a majority of our indoor DAS networks business and services segment. In January 2019, a majority of our operations in France became part of the REIT.
We report our results in five segments – U.S. property, Asia property, EMEA property, Latin America property and services.
1
Products and Services
Property Operations
Our property operations accounted for
98%
, 99% and 99% of our total revenues for the years ended
December 31, 2018
,
2017
and
2016
, respectively. Our revenue is primarily generated from tenant leases. Our tenants lease space on our communications real estate, where they install and maintain their equipment. Rental payments vary considerably depending upon numerous factors, including, but not limited to, amount, type and position of tenant equipment on the tower, remaining tower capacity and tower location. Our costs typically include ground rent (which is primarily fixed under long-term lease agreements with annual cost escalations) and power and fuel costs, some or all of which may be passed through to our tenants, as well as property taxes and repair and maintenance expenses. Our property operations have generated consistent growth in revenue and typically have low cash flow volatility due to the following characteristics:
|
•
|
Long-term tenant leases with contractual rent escalations.
In general, a tenant lease has an initial non-cancellable term of ten years with multiple renewal terms, with provisions that periodically increase the rent due under the lease, typically annually, based on a fixed escalation percentage (averaging approximately
3%
in the United States) or an inflationary index in our international markets, or a combination of both. Based upon foreign currency exchange rates and the tenant leases in place as of
December 31, 2018
, we expect to generate nearly
$35 billion
of non-cancellable tenant lease revenue over future periods, absent the impact of straight-line lease accounting.
|
|
•
|
Consistent demand for our sites.
As a result of rapidly growing usage of mobile data and other wireless services and the corresponding wireless industry capital spending trends in the markets we serve, we anticipate consistent demand for our communications sites. We believe that our global asset base positions us well to benefit from the increasing proliferation of advanced wireless devices and the increasing usage of high bandwidth applications on those devices. We have the ability to add new tenants and new equipment for existing tenants on our sites, which typically results in incremental revenue and modest incremental costs. Our site portfolio and our established tenant base provide us with a solid platform for new business opportunities, which has historically resulted in consistent and predictable organic revenue growth.
|
|
•
|
High lease renewal rates.
Our tenants tend to renew leases because suitable alternative sites may not exist or be available and repositioning a site in their network may be expensive and may adversely affect network quality. Historically, churn has averaged approximately 1% to 2% of tenant billings per year. We define churn as tenant billings lost when a tenant cancels or does not renew its lease or, in limited circumstances, when the lease rates on existing leases are reduced. We derive our churn rate for a given year by dividing our tenant billings lost on this basis by our prior-year tenant billings. As discussed in Item 7 of this Annual Report under the caption “Management’s Discussion and Analysis of Financial Condition and Results of Operations—Executive Overview,” we experienced an increase in churn in 2018 due to carrier consolidation-driven churn in India, and we expect this impact to continue in 2019.
|
|
•
|
High operating margins.
Incremental operating costs associated with adding new tenants to an existing communications site are relatively minimal. Therefore, as tenants are added, the substantial majority of incremental revenue flows through to gross margin and operating profit. In addition, in many of our international markets certain expenses, such as ground rent or power and fuel costs, are reimbursed or shared by our tenant base.
|
|
•
|
Low maintenance capital expenditures.
On average, we require relatively low amounts of annual capital expenditures to maintain our communications sites.
|
Our property business includes the operation of communications sites and managed networks, the leasing of property interests, the operation of fiber and the provision of backup power through shared generators. Our presence in a number of markets at different relative stages of wireless development provides us with significant diversification and long-term growth potential. Our property segments accounted for the following percentage of consolidated total revenue for the years ended December 31,:
|
2018
|
2017
|
2016
|
||||||
|
U.S.
|
51
|
%
|
55
|
%
|
59
|
%
|
||
|
Asia
|
21
|
%
|
17
|
%
|
14
|
%
|
||
|
EMEA
|
9
|
%
|
9
|
%
|
9
|
%
|
||
|
Latin America
|
17
|
%
|
18
|
%
|
17
|
%
|
||
Communications Sites.
Approximately 96%, 97% and 95% of revenue in our property segments was attributable to our communications sites for the years ended
December 31, 2018
,
2017
and
2016
, respectively.
2
We lease space on our communications sites to tenants providing a diverse range of communications services, including cellular voice and data, broadcasting, mobile video and a number of other applications. In addition, in many of our international markets, we receive additional pass-through revenue from our tenants to cover certain costs, including power and fuel costs and ground rent. Our top tenants by revenue for each region are as follows for the year ended
December 31, 2018
:
|
•
|
U.S.:
AT&T; Verizon Wireless; Sprint; and T-Mobile US accounted for an aggregate of 88% of U.S. property segment revenue.
|
|
•
|
Asia:
Bharti Airtel Limited (“Airtel”); Tata Teleservices Limited (“Tata Teleservices”); Idea Cellular Limited (“Idea”) and Vodafone India Limited and Vodafone Mobile Services Limited (together, “Vodafone”); and Reliance Jio accounted for an aggregate of 95% of Asia property segment revenue. As discussed in Item 7 of this Annual Report under the caption “Management’s Discussion and Analysis of Financial Condition and Results of Operations—Executive Overview,” we expect that Tata Teleservices will no longer be a top tenant in 2019.
|
|
•
|
EMEA:
MTN Group Limited and Airtel accounted for an aggregate of 59% of EMEA property segment revenue.
|
|
•
|
Latin America:
Telefónica S.A.; AT&T; and Telecom Italia accounted for an aggregate of 55% of Latin America property segment revenue.
|
Accordingly, we are subject to certain risks, as set forth in Item 1A of this Annual Report under the caption “Risk Factors—A substantial portion of our revenue is derived from a small number of tenants, and we are sensitive to changes in the creditworthiness and financial strength of our tenants.” In addition, we are subject to risks related to our international operations, as set forth under the caption “Risk Factors—Our foreign operations are subject to economic, political and other risks that could materially and adversely affect our revenues or financial position, including risks associated with fluctuations in foreign currency exchange rates.”
Managed Networks, Property Interests, Fiber and Shared Generators.
In addition to our communications sites, we also own and operate several types of managed network solutions, provide communications site management services to third parties, manage and lease property interests under carrier or other third-party communications sites, lease fiber and provide back-up power sources to tenants at our sites. The balance of our property segment revenue not attributable to our communications sites was attributable to these items.
|
•
|
Managed Networks.
We own and operate DAS networks in the United States and certain international markets. We obtain rights from property owners to install and operate in-building DAS networks, and we grant rights to wireless service providers to attach their equipment to our installations. We also offer a small portfolio of outdoor DAS networks as a complementary shared infrastructure solution for our tenants in the United States and in certain international markets. Typically, we have designed, built and operated our outdoor DAS networks in areas in which zoning restrictions or other barriers may prevent or delay deployment of more traditional wireless communications sites. We also hold lease rights and easement interests on rooftops capable of hosting communications equipment in locations where towers are generally not a viable solution based on area characteristics. In addition, we provide management services to property owners in the United States who elect to retain full rights to their property while simultaneously marketing the rooftop for wireless communications equipment installation. As the demand for advanced wireless services in urban markets evolves, we continue to evaluate a variety of infrastructure solutions, including small cells and other network architectures that may support our tenants’ networks in these areas.
|
|
•
|
Fiber.
We own and operate fiber in Argentina, Brazil, Mexico and South Africa, which we currently lease to communications and internet service providers and third-party operators to support their telecommunications infrastructure. We expect to continue to evaluate opportunities to invest in and lease these and other similar assets to providers and operators in the future for additional fourth generation (4G) and fifth generation (5G) deployments.
|
|
•
|
Property Interests
.
We own a portfolio of property interests in the United States under carrier or other third-party communications sites, which provides recurring cash flow under complementary leasing arrangements.
|
|
•
|
Shared Generators
.
We have contracts with certain of our tenants in the United States pursuant to which we provide access to shared backup power generators.
|
Services Operations
We offer tower-related services in the United States, including site acquisition, zoning and permitting and structural analysis services. Our services operations primarily support our site leasing business, including through the addition of new tenants and equipment on our sites. This segment accounted for
2%
, 1% and 1% of our total revenue for the years ended
December 31, 2018
,
2017
and
2016
, respectively.
3
Site Acquisition, Zoning and Permitting
. We engage in site acquisition services on our own behalf in connection with our tower development projects, as well as on behalf of our tenants. We typically work with our tenants’ engineers to determine the geographic areas where new communications sites will best address the tenants’ needs and meet their coverage objectives. Once a new site is identified, we acquire the rights to the land or structure on which the site will be constructed, and we manage the permitting process to ensure all necessary approvals are obtained to construct and operate the communications site.
Structural Analysis.
We offer structural analysis services to wireless carriers in connection with the installation of their communications equipment on our towers. Our team of engineers can evaluate whether a tower structure can support the additional burden of the new equipment or if an upgrade is needed, which enables our tenants to better assess potential sites before making an installation decision. Our structural analysis capabilities enable us to provide higher quality service to our existing tenants by, among other things, reducing the time required to achieve on-air readiness, while also providing opportunities to offer structural analysis services to third parties.
Strategy
Operational Strategy
As the use of wireless services on handsets, tablets and other advanced mobile devices grows and evolves, there is a corresponding increase in demand for the communications infrastructure required to deploy current and future generations of wireless communications technologies. To capture this demand, our primary operational focus is to (i) increase the occupancy of our existing communications real estate portfolio to support global connectivity, (ii) invest in and selectively grow our communications real estate portfolio, (iii) further improve upon our operational performance and efficiency, including through innovation initiatives and (iv) maintain a strong balance sheet. We believe these efforts to meet our tenants’ needs will support and enhance our ability to capitalize on the growth in demand for wireless infrastructure. In addition, we expect to explore new opportunities to enhance or extend our shared communications infrastructure businesses, including those that may make our assets incrementally more attractive to new tenants, or to existing tenants for new uses, and those that increase our operational efficiency.
|
•
|
Increase the occupancy of our existing communications real estate portfolio to support global connectivity.
We believe that our highest incremental returns will be achieved by leasing additional space on our existing communications sites. Increasing demand for wireless services in our served markets has resulted in significant capital spending by major wireless carriers and other connectivity providers. As a result, we anticipate consistent demand for our communications sites because they are attractively located and typically have capacity available for additional tenants. In the United States, incremental carrier network activity is being driven primarily by the construction and densification of 4G networks, while in our international markets, carriers are deploying a combination of second generation (2G), third generation (3G) and, more recently, 4G networks, depending on the specific market. We believe that the majority of our towers have capacity for additional tenants and that substantially all of our towers that are currently at or near full structural capacity can be upgraded or augmented to meet future tenant demand with relatively modest capital investment. Therefore, we will continue to target our sales and marketing activities to increase the utilization and return on investment of our existing communications sites.
|
|
•
|
Invest in and selectively grow our communications real estate portfolio to meet our tenants’ needs.
We seek opportunities to invest in and grow our operations through our capital expenditure program, new site construction and acquisitions. We believe we can achieve attractive risk-adjusted returns by pursuing such investments. In addition, we seek to secure property interests under our communications sites to improve operating margins as we reduce our cash operating expense related to ground leases. A significant portion of our inorganic growth has been focused on properties with lower initial tenancy because we believe that over time we can significantly increase tenancy levels, and therefore, drive strong returns on those assets.
|
|
•
|
Further improve upon our operational performance and efficiency, including through innovation initiatives.
We continue to seek opportunities to improve our operational performance throughout the organization. This includes investing in our systems and people as we strive to improve efficiency and provide superior service to our tenants. To achieve this, we intend to continue to focus on customer service initiatives, such as reducing cycle times for key functions, including lease processing and tower structural analysis. We are also focused on developing and implementing renewable power solutions across our footprint to reduce our reliance on fossil fuels and help improve the overall efficiency of the communications infrastructure and wireless industries.
|
|
•
|
Maintain a strong balance sheet.
We remain committed to disciplined financial policies, which we believe result in our ability to maintain a strong balance sheet and will support our overall strategy and focus on asset growth and operational excellence. As a result of these policies, we currently have investment grade credit ratings. We continue to focus on maintaining a robust liquidity position and, as of
December 31, 2018
, had
$4.3 billion
of available liquidity.
|
4
We believe that our investment grade credit ratings provide us consistent access to the capital markets and our liquidity provides us the ability to selectively invest in our portfolio.
Capital Allocation Strategy
The objective of our capital allocation strategy is to simultaneously increase adjusted funds from operations and our return on invested capital over the long term. To maintain our qualification for taxation as a REIT, we are required annually to distribute an amount equal to at least 90% of our REIT taxable income (determined before the deduction for distributed earnings and excluding any net capital gain) to our stockholders. After complying with our REIT distribution requirements, we plan to continue to allocate our available capital among investment alternatives that meet or exceed our return on investment criteria, while taking into account the repayment of debt consistent with our financial policies.
|
•
|
Capital expenditure program.
We expect to continue to invest in and expand our existing communications real estate portfolio through our annual capital expenditure program. This includes capital expenditures associated with site maintenance, increasing the capacity of our existing sites and projects such as new site construction, land interest acquisitions and power solutions.
|
|
•
|
Acquisitions.
We intend to pursue acquisitions of communications sites in our existing or new markets where we can meet or exceed our risk-adjusted return on investment criteria. Our risk-adjusted hurdle rates consider additional factors such as the country and counterparties involved, investment and economic climate, legal and regulatory conditions and industry risk, among others.
|
|
•
|
Return excess capital to stockholders
. If we have excess capital available after funding (i) our required distributions, (ii) capital expenditures, (iii) the repayment of debt consistent with our financial policies and (iv) anticipated future investments, including acquisition and select innovation opportunities, we will seek to return such excess capital to stockholders, including through our stock repurchase programs.
|
International Growth Strategy
We believe that, in certain international markets, we can create substantial value by either establishing a new, or expanding our existing, communications real estate leasing business. Therefore, we expect we will continue to seek international growth opportunities where we believe our risk-adjusted return objectives can be achieved. We strive to maintain a diversified approach to our international growth strategy by operating in a geographically diverse array of markets in a variety of stages of wireless network development. Our international growth strategy includes a disciplined, individualized market evaluation, in which we conduct the following analyses, among others:
|
•
|
Country analysis.
Prior to entering a new market, we conduct an extensive review of the country’s historical and projected macroeconomic fundamentals, including inflation and foreign currency exchange rate trends, demographics, capital markets, tax regime and investment alternatives, and the general business, political and legal environments, including property rights and regulatory regime.
|
|
•
|
Wireless industry analysis.
To confirm the presence of sufficient demand to support an independent tower leasing model, we analyze the competitiveness of the country’s wireless market. This includes an evaluation of the industry’s pricing environment, past and potential consolidation and the stage of its wireless network development. Characteristics that result in an attractive investment opportunity include (i) multiple competitive wireless service providers who are actively seeking to invest in deploying voice and data networks and (ii) ongoing or expected deployment of incremental spectrum from recent or anticipated auctions.
|
|
•
|
Opportunity and counterparty analysis.
Once an investment opportunity is identified within a geographic area with an attractive wireless industry, we conduct a multifaceted opportunity and counterparty analysis. This includes evaluating (i) the type of transaction, (ii) its ability to meet our risk-adjusted return criteria given the country and the counterparties involved, including the anticipated anchor tenant and (iii) how the transaction fits within our long-term strategic objectives, including future potential investment and expansion within the region.
|
Regulatory Matters
Towers, Antennas and Fiber.
Our U.S. and international tower leasing businesses are subject to national, state and local regulatory requirements with respect to the registration, siting, construction, lighting, marking and maintenance of our towers. In the United States, which accounted for
52%
of our total property segment revenue for the year ended
December 31, 2018
, the construction of new towers or modifications to existing towers may require pre-approval by the Federal Communications Commission (“FCC”) and the Federal Aviation Administration (“FAA”), depending on factors such as tower height and proximity to public airfields. Towers requiring pre-approval must be registered with the FCC and maintained in accordance
5
with FAA standards. Similar requirements regarding pre-approval of the construction and modification of towers are imposed by regulators in other countries. Non-compliance with applicable tower-related requirements may lead to monetary penalties or site deconstruction orders.
Certain of our international operations are subject to regulatory requirements with respect to licensing, registration, permitting and public listings. In India, each of our operating subsidiaries holds an Infrastructure Provider Category-I (“IP-I”) Registration Certificate issued by the Indian Ministry of Communications and Information Technology, which permits us to provide tower space to companies licensed as telecommunications service providers under the Indian Telegraph Act of 1885. As a condition to the IP-I, the Indian government has the right to take over telecommunications infrastructure in the case of emergency or war. Additionally, in 2018, ATC Telecom Infrastructure Private Limited (“ATC TIPL”) issued non-convertible debentures, which are listed on the National Stock Exchange of India. Although the debt is held by another subsidiary of ours and is eliminated in consolidation, ATC TIPL is still subject to the listing requirements of such exchange. In Ghana, our subsidiary holds a Communications Infrastructure License, issued by the National Communications Authority (“NCA”), which permits us to establish and maintain passive telecommunications infrastructure services and DAS networks for communications service providers licensed by the NCA. In Uganda, our subsidiary holds a Public Infrastructure Service License, issued by the Uganda Communications Commission (“UCC”), which permits us to establish and maintain passive telecommunications infrastructure and DAS networks for communication service providers licensed by the UCC. In Nigeria, our subsidiary holds a license for Infrastructure Sharing and Collocation Services, issued by the Nigerian Communications Authority (“NCC”), which permits us to establish and maintain passive telecommunications infrastructure for communication service providers licensed by the NCC. In Kenya, our subsidiary holds a “Network Facilities Provider License”, issued by the Communications Authority of Kenya (“CA”), which permits us to establish and maintain passive telecommunications infrastructure services.
In Chile, our subsidiary is classified as a Telecom Intermediate Service Provider. We have received a number of site specific concessions and are working with the Chilean Subsecretaria de Telecommunicaciones to receive concessions on our remaining sites in Chile. Comunicaciones y Consumos, S.A. holds a telecom license for a number of services it provides and is regulated by the Ente Nacional de Comunicaciones (ENACOM) in Argentina. In many of the markets in which we operate we are required to provide tower space to service providers on a non-discriminatory basis, subject to the negotiation of mutually agreeable terms.
Our international business operations may be subject to increased licensing fees or ownership restrictions. For example, in South Africa, the Broad-Based Black Economic Empowerment Act, 2003 (the “BBBEE Act”) has established a legislative framework for the promotion of economic empowerment of South African citizens disadvantaged by Apartheid. Accordingly, the BBBEE Act and related codes measure BBBEE Act compliance and good corporate practice by the inclusion of certain ownership, management control, employment equity and other metrics for companies that do business there. In Kenya, the CA requires all holders of a commercial license to issue at least 20% of their shares to Kenyans within three years of receiving the license unless a waiver is obtained. In addition, certain municipalities have sought to impose permit fees based upon structural or operational requirements of towers and certain regional and other governmental bodies have sought to impose levies or other forms of fees. Our foreign operations may be affected if a country’s regulatory authority restricts, revokes or modifies spectrum licenses of certain wireless service providers or implements limitations on foreign ownership.
In all countries where we operate, we are subject to zoning restrictions and restrictive covenants imposed by local authorities or community organizations. While these regulations vary, they typically require tower owners or tenants to obtain approval from local authorities or community standards organizations prior to tower construction or the addition of a new antenna to an existing tower. Local zoning authorities and community residents often oppose construction in their communities, which can delay or prevent new tower construction, new antenna installation or site upgrade projects, thereby limiting our ability to respond to tenant demand. This opposition and existing or new zoning regulations can increase costs associated with new tower construction, tower modifications or additions of new antennas to a site or site upgrades, as well as adversely affect the associated timing or cost of such projects. Further, additional regulations may be adopted that cause delays or result in additional costs to us or changes in the competitive landscape that may negatively affect our business. These factors could materially and adversely affect our operations. In the United States, the Telecommunications Act of 1996 prohibits any action by state and local authorities that would discriminate between different providers of wireless services or ban altogether the construction, modification or placement of communications sites. It also prohibits state or local restrictions based on the environmental effects of radio frequency emissions to the extent the facilities comply with FCC regulations. Further, in February 2012, the United States government adopted regulations requiring that local and state governments approve modifications or colocations that qualify as eligible facilities under the regulations.
Portions of our business are subject to additional regulations, for example, in a number of states throughout the United States, certain of our subsidiaries hold Competitive Local Exchange Carrier (CLEC) or other status, in connection with the operation of our outdoor DAS networks business. In addition, we, or our tenants, may be subject to new regulatory policies in
6
certain jurisdictions from time to time that may materially and adversely affect our business or the demand for our communications sites.
In Mexico, our subsidiaries that hold our fiber business are regulated by the Federal Institute of Telecommunications as concession holders and permit holders authorized to provide telecommunications services.
Environmental Matters.
Our U.S. and international operations are subject to various national, state and local environmental laws and regulations, including those relating to the management, use, storage, disposal, emission and remediation of, and exposure to, hazardous and non-hazardous substances, materials and wastes and the siting of our towers. We may be required to obtain permits, pay additional property taxes, comply with regulatory requirements and make certain informational filings related to hazardous substances or devices used to provide power such as batteries, generators and fuel at our sites. Violations of these types of regulations could subject us to fines or criminal sanctions.
Additionally, in the United States and in other countries where we operate, before constructing a new tower or adding an antenna to an existing site, we must review and evaluate the impact of the action to determine whether it may significantly affect the environment and whether we must disclose any significant impacts in an environmental assessment. If a tower or new antenna might have a material adverse impact on the environment, FCC or other governmental approval of the tower or antenna could be significantly delayed.
Health and Safety.
In the United States and in other countries where we operate, we are subject to various national, state and local laws regarding employee health and safety, including protection from radio frequency exposure.
Competition
Our industry is highly competitive. We compete, both for new business and for the acquisition of assets, with other public tower companies, such as Crown Castle International Corp., SBA Communications Corporation, Telesites S.A.B. de C.V. and Cellnex Telecom, S.A., wireless carrier tower consortia such as Indus Towers Limited and private tower companies, private equity sponsored firms, carrier-affiliated tower companies, independent wireless carriers, tower owners, broadcasters and owners of non-communications sites, including rooftops, utility towers, water towers and other alternative structures. We believe that site location and capacity, network density, price, quality and speed of service have been, and will continue to be, significant competitive factors affecting owners, operators and managers of communications sites.
Our services business competes with a variety of companies offering individual, or combinations of, competing services. The field of competitors includes site acquisition consultants, zoning consultants, real estate firms, right-of-way consultants, structural engineering firms, tower owners/managers, telecommunications equipment vendors who can provide turnkey site development services through multiple subcontractors and our tenants’ personnel. We believe that our tenants base their decisions for services on various criteria, including a company’s experience, local reputation, price and time for completion of a project.
For more information on demand trends in our industry, see Item 7 of this Annual Report under the caption “Management’s Discussion and Analysis of Financial Condition and Results of Operations—Executive Overview.”
Employees
As of
December 31, 2018
, we employed 5,026 full-time individuals and consider our employee relations to be satisfactory.
7
Available Information
Our internet website address is
www.americantower.com
. Information contained on our website is not incorporated by reference into this Annual Report, and you should not consider information contained on our website as part of this Annual Report. You may access, free of charge, our Annual Reports on Form 10-K, Quarterly Reports on Form 10-Q and Current Reports on Form 8-K, plus amendments to such reports as filed or furnished pursuant to Sections 13(a) or 15(d) of the Securities Exchange Act of 1934, as amended (“Exchange Act”), through the “Investor Relations” portion of our website as soon as reasonably practicable after we electronically file such material with, or furnish it to, the Securities and Exchange Commission (the “SEC”).
We have adopted a written Code of Ethics and Business Conduct Policy (the “Code of Conduct”) that applies to all of our employees and directors, including, but not limited to, our principal executive officer, principal financial officer and principal accounting officer or controller or persons performing similar functions. The Code of Conduct is available on the “Corporate Responsibility” portion of our website and our Corporate Governance Guidelines and the charters of the audit, compensation and nominating and corporate governance committees of our Board of Directors are available on the “Investor Relations” portion of our website. In the event we amend the Code of Conduct, or provide any waivers of the Code of Conduct to our directors or executive officers, we will disclose these events on our website as required by the regulations of the New York Stock Exchange (the “NYSE”) and applicable law.
In addition, paper copies of these documents may be obtained free of charge by writing us at the following address: 116 Huntington Avenue, Boston, Massachusetts 02116, Attention: Investor Relations; or by calling us at (617) 375-7500.
|
ITEM 1A.
|
RISK FACTORS
|
A significant decrease in leasing demand for our communications infrastructure would materially and adversely affect our business and operating results, and we cannot control that demand.
A significant reduction in leasing demand for our communications infrastructure could materially and adversely affect our business, results of operations or financial condition. Factors that may affect such demand include:
|
•
|
increased mergers or consolidations that reduce the number of wireless service providers or use of network sharing among governments or wireless service providers;
|
|
•
|
zoning, environmental, health, tax or other government regulations or changes in the application and enforcement thereof;
|
|
•
|
the financial condition of wireless service providers;
|
|
•
|
governmental licensing of spectrum or restriction or revocation of our tenants’ spectrum licenses;
|
|
•
|
a decrease in consumer demand for wireless services, including due to general economic conditions or disruption in the financial and credit markets;
|
|
•
|
the ability and willingness of wireless service providers to maintain or increase capital expenditures on network infrastructure;
|
|
•
|
delays or changes in the deployment of next generation wireless technologies; and
|
|
•
|
technological changes.
|
Increasing competition within our industry may materially and adversely affect our revenue.
Our industry is highly competitive and our tenants have numerous alternatives in leasing antenna space. Pricing competition from peers could materially and adversely affect our lease rates. We may not be able to renew existing tenant leases or enter into new tenant leases, or if we are able to renew or enter into new leases, they may be at rates lower than our current rates or on less favorable terms than our current terms, resulting in a material adverse impact on our results of operations and growth rate. In addition, should inflation rates exceed our fixed escalator percentages in markets where our leases include fixed escalators, our income could be adversely
affected.
If our tenants consolidate their operations, exit the telecommunications business or share site infrastructure to a significant degree, our growth, revenue and ability to generate positive cash flows could be materially and adversely affected.
Significant consolidation among our tenants could reduce demand for our communications infrastructure and may materially and adversely affect our growth and revenues. Certain combined companies have rationalized duplicative parts of their networks or modernized their networks, and these and other tenants could determine not to renew, or attempt to cancel, avoid or limit leases with us or related payments. In the event a tenant terminates its business or separately sells its spectrum,
8
we may experience increased churn as a result. Our ongoing contractual revenues and our future results may be negatively impacted if a significant number of these leases are terminated or not renewed. For example, see our discussion of carrier consolidation-driven churn in our Asia segment in Item 7 of this Annual Report, under the caption “Management’s Discussion and Analysis of Financial Condition and Results of Operations—Executive Overview.” In addition, extensive sharing of site infrastructure, roaming or resale arrangements among wireless service providers as an alternative to leasing our communications sites, without compensation to us, may cause new lease activity to slow if carriers utilize shared equipment rather than deploy new equipment, or may result in the decommissioning of equipment on certain existing sites because portions of the tenants’ networks may become redundant.
Our business is subject to government and tax regulations and changes in current or future laws or regulations could restrict our ability to operate our business as we currently do or impact our competitive landscape.
Our business and those of our tenants are subject to federal, state, local and foreign regulations. In certain jurisdictions, these regulations could be applied or enforced retroactively, which could require that we modify or dismantle existing towers at significant cost. Zoning authorities and community organizations are often opposed to the construction of communications sites in their communities, which can delay, prevent or increase the cost of new tower construction, modifications, additions of new antennas to a site or site upgrades, thereby limiting our ability to respond to tenant demands. Existing or new regulatory policies, zoning regulations or construction laws may materially and adversely affect the timing, cost or completion of construction projects associated with our communications sites or result in changes in the competitive landscape that may negatively affect our business. Noncompliance could result in the imposition of fines or an award of damages to private litigants or result in decreased revenue due to removal of towers to ensure compliance. In addition, in certain jurisdictions, we are required to pay annual license fees, which may be subject to substantial increases by the government, or new fees may be enacted and applied retroactively. Governmental licenses may also be subject to periodic renewal and additional conditions to receive or maintain such license. Furthermore, the tax laws, regulations and interpretations governing our business in jurisdictions where we operate may change at any time, potentially with retroactive effect. This includes changes in tax laws, administrative guidance or judicial interpretations thereof. In addition, some of these changes could have a more significant impact on us as a REIT relative to other REITs due to the nature of our business and our use of TRSs. These factors could materially and adversely affect our business, results of operations or financial condition.
Our foreign operations are subject to economic, political and other risks that could materially and adversely affect our revenues or financial position, including risks associated with fluctuations in foreign currency exchange rates.
Our international business operations and our expansion into new markets in the future expose us to potential adverse financial and operational problems not typically experienced in the United States. We anticipate that revenues from our international operations will continue to grow. Accordingly, our business is subject to risks associated with doing business internationally, including:
|
•
|
uncertain, inconsistent or changing laws, regulations, rulings or methodologies impacting our existing and anticipated international operations, fees or other requirements directed specifically at the ownership and operation of communications sites or our international acquisitions, any of which laws, fees or requirements may be applied retroactively or with significant delay, or failure to retain our tax status or to obtain an expected tax status for which we have applied;
|
|
•
|
expropriation or governmental regulation restricting foreign ownership or requiring reversion or divestiture;
|
|
•
|
laws or regulations that tax or otherwise restrict repatriation of earnings or other funds or otherwise limit distributions of capital;
|
|
•
|
changes in a specific country’s or region’s political or economic conditions, including inflation or currency devaluation;
|
|
•
|
changes to zoning regulations or construction laws, which could be applied retroactively to our existing communications sites;
|
|
•
|
actions restricting or revoking our tenants’ spectrum licenses or suspending or terminating business under prior licenses;
|
|
•
|
failure to comply with anti-bribery laws such as the Foreign Corrupt Practices Act or similar local anti-bribery laws, or the Office of Foreign Assets Control requirements;
|
|
•
|
failure to comply with data privacy laws and other protections of employee health and personal information;
|
|
•
|
material site issues related to security, fuel availability and reliability of electrical grids;
|
|
•
|
significant increases in, or implementation of new, license surcharges on our revenue;
|
|
•
|
loss of key personnel, including expatriates, in markets where talent is difficult or expensive to acquire; and
|
|
•
|
price-setting or other similar laws or regulations for the sharing of passive infrastructure.
|
9
We also face risks associated with changes in foreign currency exchange rates, including those arising from our operations, investments and financing transactions related to our international business. Volatility in foreign currency exchange rates can also affect our ability to plan, forecast and budget for our international operations and expansion efforts. Our revenues earned from our international operations are primarily denominated in their respective local currencies. We have not historically engaged in significant currency hedging activities relating to our non-U.S. Dollar operations, and a weakening of these foreign currencies against the U.S. Dollar would negatively impact our reported revenues, operating profits and income.
In addition, as we continue to invest in joint venture opportunities internationally, our partners may have business or economic goals that are inconsistent or conflict with ours, be in positions to take action contrary to our interests, policies or objectives, have competing interests in our, or other, markets that could create conflict of interest issues, withhold consents contrary to our requests or become unable or unwilling to fulfill their commitments, any of which could expose us to additional liabilities or costs, including requiring us to assume and fulfill the obligations of that joint venture or to execute buyouts of their interests.
A substantial portion of our revenue is derived from a small number of tenants, and we are sensitive to changes in the creditworthiness and financial strength of our tenants.
A substantial portion of our total operating revenues is derived from a small number of tenants. If any of these tenants is unwilling or unable to perform its obligations under their agreements with us, our revenues, results of operations, financial condition and liquidity could be materially and adversely affected. In the ordinary course of our business, we do occasionally experience disputes with our tenants, generally regarding the interpretation of terms in our leases. Historically, we have resolved these disputes in a manner that did not have a material adverse effect on us or our tenant relationships. However, it is possible that such disputes could lead to a termination of our leases with tenants, a material modification of the terms of those leases or a deterioration in our relationships with those tenants that leads to a failure to obtain new business from them, any of which could have a material adverse effect on our business, results of operations or financial condition. If we are forced to resolve any of these disputes through litigation, our relationship with the applicable tenant could be terminated or damaged, which could lead to decreased revenue or increased costs, resulting in a corresponding adverse effect on our business, results of operations or financial condition.
Due to the long-term nature of our tenant leases, we depend on the continued financial strength of our tenants. Many wireless service providers operate with substantial levels of debt. Sometimes our tenants, or their parent companies, face financial difficulty, file for bankruptcy or terminate operations. In our international operations, many of our tenants are subsidiaries of global telecommunications companies. These subsidiaries may not have the explicit or implied financial support of their parent entities.
In addition, many of our tenants and potential tenants rely on capital raising activities to fund their operations and capital expenditures, which may be more difficult or expensive in the event of downturns in the economy or disruptions in the financial and credit markets. If our tenants or potential tenants are unable to raise adequate capital to fund their business plans or face capital constraints, they may reduce their spending, which could materially and adversely affect demand for our communications sites and our services business. If, as a result of a prolonged economic downturn or otherwise, one or more of our tenants experiences financial difficulties or files for bankruptcy, it could result in uncollectible accounts receivable and an impairment of our deferred rent asset, tower asset, network location intangible asset, tenant-related intangible asset or goodwill. The loss of significant tenants, or the loss of all or a portion of our anticipated lease revenues from certain tenants, could have a material adverse effect on our business, results of operations or financial condition.
Our expansion initiatives involve a number of risks and uncertainties, including those related to integrating acquired or leased assets, that could adversely affect our operating results, disrupt our operations or expose us to additional risk.
As we continue to acquire communications sites in our existing markets and expand into new markets, we are subject to a number of risks and uncertainties, including not meeting our return on investment criteria and financial objectives, increased costs, assumed liabilities and the diversion of managerial attention due to acquisitions. Achieving the benefits of acquisitions depends in part on timely and efficient integration of operations, telecommunications infrastructure assets and personnel. Integration may be difficult and unpredictable for many reasons, including, among other things, portfolios without requisite permits, differing systems, cultural differences, and conflicting policies, procedures and operations. Significant acquisition-related integration costs, including certain nonrecurring charges such as costs associated with onboarding employees, acquiring permits and visiting, inspecting, engineering and upgrading tower sites, could materially and adversely affect our results of operations in the period in which such charges are recorded or our cash flow in the period in which any related costs are actually paid. Some of our acquired tower portfolios have included sites that do not meet our structural specifications, including sites that may be overburdened. In these cases, in addition to additional capital expenditures, general liability risks associated with such towers will exist until such time as those towers are upgraded or otherwise remedied. In addition, integration may
10
significantly burden management and internal resources, including through the potential loss or unavailability of key personnel. If we fail to successfully integrate the assets we acquire or fail to utilize such assets to their full capacity, we may not realize the benefits we expect from our acquired portfolios, and our business, financial condition and results of operations may be adversely affected. Our international expansion initiatives are subject to additional risks such as those described above.
As a result of acquisitions, we have a substantial amount of intangible assets and goodwill. In accordance with accounting principles generally accepted in the United States (“GAAP”), we are required to assess our goodwill and other intangible assets annually or more frequently in the event of circumstances indicating potential impairment to determine if they are impaired. If, as a result of the factors noted above, the testing performed indicates that an asset may not be recoverable, we are required to record a non-cash impairment charge for the difference between the carrying value of the goodwill or other intangible assets and the implied fair value of the goodwill or the estimated fair value of other intangible assets in the period the determination is made.
Our expansion initiatives may not be successful or we may be required to record impairment charges for our goodwill or for other intangible assets, which could have a material adverse effect on our business, results of operations or financial condition.
New technologies or changes in our or a tenant’s business model could make our tower leasing business less desirable and result in decreasing revenues and operating results.
The development and implementation of new technologies designed to enhance the efficiency of wireless networks or changes in a tenant’s business model could reduce the need for tower-based wireless services, decrease demand for tower space or reduce previously obtainable lease rates. In addition, tenants may allocate less of their budgets to leasing space on our towers, as the industry is trending towards deploying increased capital to the development and implementation of new technologies. Examples of these technologies include spectrally efficient technologies, which could relieve a portion of our tenants’ network capacity needs and, as a result, could reduce the demand for tower-based antenna space. Additionally, certain small cell complementary network technologies or satellite services could shift a portion of our tenants’ network investments away from the traditional tower-based networks, which may reduce the need for carriers to add more equipment at certain communications sites. Moreover, the emergence of alternative technologies could reduce the need for tower-based broadcast services transmission and reception. Further, a tenant may decide to cease outsourcing tower infrastructure or otherwise change its business model, which would result in a decrease in our revenue and operating results. Our failure to innovate in response to the development and implementation of these or other new technologies or changes in a tenant’s business model could have a material adverse effect on our business, results of operations or financial condition. Conversely, we may invest significant capital in technologies, innovation projects or new additions to our core business that may not provide expected returns or profitability, which could divert management attention and have a material adverse effect on our operating results.
Competition for assets could adversely affect our ability to achieve our return on investment criteria.
We may experience increased competition for the acquisition of assets or contracts to build new communications sites for tenants, which could make the acquisition of high quality assets significantly more costly or prohibitive or cause us to lose contracts to build new sites. Some of our competitors are larger and may have greater financial resources than we do, while other competitors may apply less stringent investment criteria than we do. In addition, we may not anticipate increased competition entering a particular market or competing for the same assets. Higher prices for assets or the failure to add new assets to our portfolio could make it more difficult to achieve our anticipated returns on investment or future growth, which could materially and adversely affect our business, results of operations or financial condition.
Our leverage and debt service obligations may materially and adversely affect our ability to raise additional financing to fund capital expenditures, future growth and expansion initiatives and to satisfy our distribution requirements.
Our leverage and debt service obligations could have significant negative consequences to our business, results of operations or financial condition, including:
|
•
|
requiring the dedication of a substantial portion of our cash flow from operations to service our debt, thereby reducing the amount of our cash flow available for other purposes, including capital expenditures and REIT distributions;
|
|
•
|
impairing our ability to meet one or more of the financial ratio covenants contained in our debt agreements or to generate cash sufficient to pay interest or principal due under those agreements, which could result in an acceleration of some or all of our outstanding debt and the loss of the towers securing such debt if a default remains uncured;
|
11
|
•
|
limiting our ability to obtain additional debt or equity financing, thereby placing us at a possible competitive disadvantage to less leveraged competitors and competitors that may have better access to capital resources, including with respect to acquiring assets; and
|
|
•
|
limiting our flexibility in planning for, or reacting to, changes in our business and the markets in which we compete.
|
We may need to raise additional capital through debt financing activities, asset sales or equity issuances, even if the then-prevailing market conditions are not favorable, to fund capital expenditures, future growth and expansion initiatives, required purchases of our joint venture partners’ interests and to satisfy our distribution requirements and debt service obligations. An increase in our total leverage could lead to a downgrade of our credit rating below investment grade, which could negatively impact our ability to access credit markets or preclude us from obtaining funds on investment grade terms, rates and conditions or subject us to additional loan covenants. In addition, potential changes to, or the elimination of, the London Interbank Offered Rate (“LIBOR”), may adversely affect interest expense related to borrowings under our credit facilities, certain other debt service obligations and interest rate swaps, which could potentially negatively impact our financial condition. Further, certain of our current debt instruments limit the amount of indebtedness we and our subsidiaries may incur. Additional financing, therefore, may be unavailable, more expensive or restricted by the terms of our outstanding indebtedness.
If we fail to remain qualified for taxation as a REIT, we will be subject to tax at corporate income tax rates, which may substantially reduce funds otherwise available, and even if we qualify for taxation as a REIT, we may face tax liabilities that impact earnings and available cash flow.
Commencing with the taxable year beginning January 1, 2012, we have operated as a REIT for federal income tax purposes.
Qualification for taxation as a REIT requires the application of certain highly technical and complex provisions of the Internal Revenue Code of 1986, as amended (the “Code”), which provisions may change from time to time, to our operations as well as various factual determinations concerning matters and circumstances not entirely within our control. Further, tax legislation may adversely affect our ability to remain qualified for taxation as a REIT or the benefits or desirability of remaining so qualified. There are few judicial or administrative interpretations of the relevant provisions of the Code.
If, in any taxable year, we fail to qualify for taxation as a REIT and are not entitled to relief under the Code:
|
•
|
we will not be allowed a deduction for distributions to stockholders in computing our taxable income;
|
|
•
|
we will be required to pay federal and state income tax on our taxable income at regular corporate income tax rates; and
|
|
•
|
we will be disqualified from REIT tax treatment for the four taxable years immediately following the year during which we were so disqualified.
|
We are subject to certain federal, state, local and foreign taxes on our income and assets, including taxes on any undistributed income and state, local or foreign income, franchise, property and transfer taxes. While state and local income tax regimes often parallel the U.S. federal income tax regime for REITs, many of these jurisdictions do not completely follow U.S. federal rules and some may not follow them at all. For example, some state and local jurisdictions currently or in the future may limit or eliminate a REIT’s deduction for dividends paid, which could increase our income tax expense. We are also subject to the continual examination of our income tax returns by the U.S. Internal Revenue Service and state, local and foreign tax authorities. The results of an audit and examination of previously filed tax returns and continuing assessments of our tax exposures may have an adverse effect on our provision for income taxes and cash tax liability.
Our domestic TRS assets and operations are subject, as applicable, to federal and state corporation income taxes. Our foreign operations, whether in the REIT or TRSs, are subject to foreign taxes in jurisdictions in which those assets and operations are located.
Any corporate tax liability could be substantial and would reduce the amount of cash available for other purposes. If we fail to qualify for taxation as a REIT, we may need to borrow additional funds or liquidate some investments to pay any additional tax liability. Accordingly, funds available for investment, operations and distribution would be reduced.
Furthermore, we have owned and may from time to time own direct and indirect ownership interests in subsidiary REITs. When we own interests in a subsidiary REIT, we must demonstrate that such subsidiary REIT complies with the same REIT requirements that we must satisfy, together with all other rules applicable to REITs. If the subsidiary REIT is determined to have failed to qualify for taxation as a REIT and certain relief provisions do not apply, then the subsidiary REIT would be
12
subject to federal income tax, which tax we would economically bear along with applicable penalties and interest. In addition, our ownership of shares in such subsidiary REIT would fail to be a qualifying asset for purposes of the asset tests applicable to REITs and any dividend income or gains derived by us from such subsidiary REIT may cease to be treated as income that qualifies for purposes of the 75% gross income test. These consequences could have a material adverse effect on our ability to comply with the REIT income and asset tests, and thus our ability to qualify for taxation as a REIT.
Complying with REIT requirements may limit our flexibility or cause us to forego otherwise attractive opportunities.
Our use of TRSs enables us to engage in non-REIT qualifying business activities. Under the Code, no more than 20% of the value of the assets of a REIT may be represented by securities of one or more TRSs and other non-qualifying assets. This limitation may hinder our ability to make certain attractive investments, including the purchase of non-qualifying assets, the expansion of non-real estate activities and investments in the businesses to be conducted by our TRSs, and to that extent limit our opportunities and our flexibility to change our business strategy.
Specifically, this limitation may affect our ability to make additional investments in our managed networks business or services segment as currently structured and operated, in other non-REIT qualifying operations or assets, or in international operations conducted through TRSs that we do not elect to bring into the REIT structure. Further, acquisition opportunities in the United States and international markets may be adversely affected if we need or require the target company to comply with certain REIT requirements prior to closing.
Further, as a REIT, we must distribute to our stockholders an amount equal to at least 90% of the REIT taxable income (determined before the deduction for distributed earnings and excluding any net capital gain). To meet our annual distribution requirements, we may be required to distribute amounts that may otherwise be used for our operations, including amounts that may otherwise be invested in future acquisitions, capital expenditures or repayment of debt. As no more than 25% of our gross income may consist of dividend income from our TRSs and other non-qualifying types of income, our ability to receive distributions from our TRSs may be limited, which may impact our ability to fund distributions to our stockholders or to use income of our TRSs to fund other investments.
In addition, the majority of our income and cash flows from our TRSs are generated from our international operations. In many cases, there are local withholding taxes and currency controls that may impact our ability or willingness to repatriate funds to the United States to help satisfy REIT distribution requirements.
Restrictive covenants in the agreements related to our securitization transactions, our credit facilities and our debt securities could materially and adversely affect our business by limiting flexibility, and we may be prohibited from paying dividends on our common stock, which may jeopardize our qualification for taxation as a REIT.
The agreements related to our securitization transactions include operating covenants and other restrictions customary for loans subject to rated securitizations. Among other things, the borrowers under the agreements are prohibited from incurring other indebtedness for borrowed money or further encumbering their assets. A failure to comply with the covenants in the agreements could prevent the borrowers from taking certain actions with respect to the secured assets and could prevent the borrowers from distributing any excess cash from the operation of such assets to us. If the borrowers were to default on any of the loans, the servicer on such loan could seek to foreclose upon or otherwise convert the ownership of the secured assets, in which case we could lose such assets and the cash flow associated with such assets. We enter into hedges for certain debt instruments. These hedges may have an adverse impact on our results to the extent that the counterparties do not perform as expected at the inception of each hedge.
The agreements for our credit facilities also contain restrictive covenants and leverage and other financial maintenance tests that could limit our ability to take various actions, including incurring additional debt, guaranteeing indebtedness or making distributions to stockholders, including our required REIT distributions, and engaging in various types of transactions, including mergers, acquisitions and sales of assets. Additionally, our debt agreements restrict our and our subsidiaries’ ability to incur liens securing our or their indebtedness. These covenants could have an adverse effect on our business by limiting our ability to take advantage of financing, new tower development, mergers and acquisitions or other opportunities. Further, reporting and information covenants in our credit agreements and indentures require that we provide financial and operating information within certain time periods. If we are unable to provide the required information on a timely basis, we would be in breach of these covenants. For more information regarding the covenants and requirements discussed above, please see Item 7 of this Annual Report under the caption “Management’s Discussion and Analysis of Financial Condition and Results of Operations—Liquidity and Capital Resources—Factors Affecting Sources of Liquidity” and note 8 to our consolidated financial statements included in this Annual Report.
13
Our towers, fiber networks, data centers or computer systems may be affected by natural disasters, security breaches and other unforeseen events for which our insurance may not provide adequate coverage.
Our towers and fiber networks are subject to risks associated with natural disasters, including those that may be related to climate change, such as hurricanes, ice and wind storms, tornadoes, floods, earthquakes and wildfires, as well as other unforeseen events, such as acts of terrorism. Any damage or destruction to, or inability to access, our towers or data centers may impact our ability to provide services to our tenants and lead to tenant loss, which could have a material adverse effect on our business, results of operations or financial condition.
As part of our normal business activities, we rely on information technology and other computer resources to carry out important operational, reporting and compliance activities and to maintain our business records. Our computer systems, network operation centers or power systems, or those of our cloud or Internet-based providers, could fail on their own accord and are subject to interruption or damage from power outages, computer and telecommunications failures, computer viruses, security breaches (including through cyber attack and data theft), usage errors, catastrophic events such as natural disasters and other events beyond our control. Although we and our vendors have disaster recovery programs and security measures in place, if our computer systems and our backup systems are compromised, degraded, damaged, breached or otherwise cease to function properly, we could suffer interruptions in our operations, including our ability to correctly record, process and report financial information, our tenants’ network availability may be impacted or we could unintentionally allow misappropriation of proprietary or confidential information (including information about our tenants or landlords), which could result in a loss of revenue, damage our reputation, litigation, penalties under existing or future data privacy laws and require us to incur significant costs to remediate or otherwise resolve these issues. In addition, our recent acquisitions, including acquisitions of fiber businesses, may increase our exposure to the risks described above and have material and adverse effects on our business.
While we maintain insurance coverage for natural disasters, business interruption and cybersecurity, we may not have adequate insurance to cover the associated costs of repair or reconstruction of sites or fiber for a major future event, lost revenue, including from new tenants that could have been added to our towers or fiber networks but for the event, or other costs to remediate the impact of a significant event. Further, we may be liable for damage caused by towers that collapse for any number of reasons including structural deficiencies, which could harm our reputation and require us to incur costs for which we may not have adequate insurance coverage.
Our costs could increase and our revenues could decrease due to perceived health risks from radio emissions, especially if these perceived risks are substantiated.
Public perception of possible health risks associated with cellular and other wireless communications technology could slow the growth of wireless companies, which could in turn slow our growth. In particular, negative public perception of, and regulations regarding, these perceived health risks could undermine the market acceptance of wireless communications services and increase opposition to the development and expansion of tower sites. If a scientific study, court decision or government agency ruling resulted in a finding that radio frequency emissions pose health risks to consumers, it could negatively impact our tenants and the market for wireless services, which could materially and adversely affect our business, results of operations or financial condition. We do not maintain any significant insurance with respect to these matters.
We could have liability under environmental and occupational safety and health laws.
Our operations are subject to various federal, state, local and foreign environmental and occupational safety and health laws and regulations, including those relating to the management, use, storage, disposal, emission and remediation of, and exposure to, hazardous and non-hazardous substances, materials and wastes. As the owner, lessee or operator of real property and facilities, including generators, we may be liable for substantial costs of investigation, removal or remediation of soil and groundwater contaminated by hazardous materials, and for damages and costs relating to off-site migration of hazardous materials, without regard to whether we, as the owner, lessee or operator, knew of, or were responsible for, the contamination. We may also be liable for certain costs of remediating contamination at third-party sites to which we sent waste for disposal, even if the original disposal may have complied with all legal requirements at the time. Many of these laws and regulations contain information reporting and record keeping requirements. We may not be at all times in compliance with all environmental requirements. We may be subject to potentially significant fines or penalties if we fail to comply with any of these requirements.
The requirements of the environmental and occupational safety and health laws and regulations are complex, change frequently and could become more stringent in the future. In certain jurisdictions these laws and regulations could be applied retroactively, or be broadened to cover situations or persons not currently considered. It is possible that these requirements will change or that liabilities will arise in the future in a manner that could have a material adverse effect on our business, results of operations or financial condition. While we maintain environmental and workers’ compensation insurance, we may not have adequate insurance to cover all costs, fines or penalties.
14
If we are unable to protect our rights to the land under our towers, it could adversely affect our business and operating results.
Our real property interests relating to our towers consist primarily of leasehold and sub-leasehold interests, fee interests, easements, licenses and rights-of-way. A loss of these interests at a particular tower site may interfere with our ability to operate that tower site and generate revenues. For various reasons, we may not always have the ability to access, analyze and verify all information regarding titles and other issues prior to completing an acquisition of communications sites, which can affect our rights to access and operate a site. From time to time we also experience disputes with landowners regarding the terms of easements or ground agreements for land under towers, which can affect our ability to access and operate tower sites. Further, for various reasons, landowners may not want to renew their ground agreements with us, they may lose their rights to the land, or they may transfer their land interests to third parties, including ground lease aggregators, which could affect our ability to renew ground agreements on commercially viable terms. A significant number of the communications sites in our portfolio are located on land we lease pursuant to long-term operating leases. Further, for various reasons, title to property interests in some of the foreign jurisdictions in which we operate may not be as certain as title to our property interests in the United States. Our inability to protect our rights to the land under our towers may have a material adverse effect on our business, results of operations or financial condition.
If we are unable or choose not to exercise our rights to purchase towers that are subject to lease and sublease agreements at the end of the applicable period, our cash flows derived from those towers will be eliminated.
Our communications real estate portfolio includes towers that we operate pursuant to lease and sublease agreements that include a purchase option at the end of the lease period. We may not have the required available capital to exercise our right to purchase the towers at the end of the applicable period, or we may choose, for business or other reasons, not to do so. If we do not exercise these purchase rights, and are unable to extend the lease or sublease or otherwise acquire an interest that would allow us to continue to operate these towers after the applicable period, we will lose the cash flows derived from the towers. If we decide to exercise these purchase rights, the benefits of acquiring a significant number of towers may not exceed the associated acquisition, compliance and integration costs, which could have a material adverse effect on our business, results of operations or financial condition.
|
ITEM 1B.
|
UNRESOLVED STAFF COMMENTS
|
None.
15
|
ITEM 2.
|
PROPERTIES
|
Details of each of our principal offices as of
December 31, 2018
are provided below:
|
Location
|
Function
|
Size (approximate
square feet)
|
Property Interest
|
||||
|
U.S.
|
|||||||
|
Boston, MA
|
Corporate Headquarters
|
39,800
|
|
Leased
|
|||
|
Miami, FL
|
Latin America Operations Center
|
6,300
|
|
Leased
|
|||
|
Atlanta, GA
|
Network Operations and Program Management Office Field Personnel
|
21,400
|
|
Leased
|
|||
|
Marlborough, MA
|
Information Technology Headquarters
|
24,000
|
|
Leased
|
|||
|
Woburn, MA
|
U.S. Tower Division Headquarters, Accounting, Lease Administration, Site Leasing Management, Broadcast Division and Managed Site Headquarters
|
163,200
|
|
Owned
|
|||
|
Cary, NC
|
U.S. Tower Division, Network Operations Center and Engineering Services Headquarters
|
75,500
|
|
Owned and Leased (1)
|
|||
|
Asia
|
|||||||
|
Delhi, India
|
India Headquarters
|
7,200
|
|
Leased
|
|||
|
Gurgaon, India
|
India Operations Center
|
78,800
|
|
Leased
|
|||
|
Singapore
|
Asia Finance and Administration
|
90
|
|
Leased
|
|||
|
EMEA
|
|||||||
|
Malakoff, France
|
France Headquarters
|
15,400
|
|
Leased
|
|||
|
Ratingen, Germany
|
Germany Headquarters
|
12,500
|
|
Leased (2)
|
|||
|
Accra, Ghana
|
Ghana Headquarters
|
18,500
|
|
Leased
|
|||
|
Nairobi, Kenya
|
Kenya Headquarters
|
9,800
|
|
Leased
|
|||
|
Amsterdam, Netherlands
|
American Tower International Headquarters
|
2,400
|
|
Leased
|
|||
|
Lagos, Nigeria
|
Nigeria Headquarters
|
13,400
|
|
Leased
|
|||
|
Johannesburg, South Africa
|
South Africa Headquarters
|
27,100
|
|
Leased (3)
|
|||
|
Kampala, Uganda
|
Uganda Headquarters
|
8,800
|
|
Leased
|
|||
|
Latin America
|
|||||||
|
Buenos Aires, Argentina
|
Argentina Headquarters
|
24,500
|
|
Leased
|
|||
|
Sao Paulo, Brazil
|
Brazil Headquarters
|
44,900
|
|
Leased
|
|||
|
Santiago, Chile
|
Chile Headquarters
|
6,900
|
|
Leased
|
|||
|
Bogota, Colombia
|
Colombia Headquarters
|
13,800
|
|
Leased (4)
|
|||
|
San Jose, Costa Rica
|
Costa Rica Headquarters
|
2,400
|
|
Leased
|
|||
|
Mexico City, Mexico
|
Mexico Headquarters
|
44,900
|
|
Leased
|
|||
|
Asunción, Paraguay
|
Paraguay Headquarters
|
900
|
|
Leased
|
|||
|
Lima, Peru
|
Peru Headquarters
|
3,700
|
|
Leased
|
|||
_______________
|
(1)
|
The owned Cary facility is approximately 48,300 square feet. Currently, our offices occupy approximately 44,300 square feet. We lease the remaining space to an unaffiliated tenant. In addition, we lease approximately 31,200 square feet of office space in Cary, NC for our U.S. Tower Division, Managed Networks and Innovation function.
|
|
(2)
|
We lease two office spaces that together occupy an aggregate of approximately 12,500 square feet.
|
|
(3)
|
We lease two office spaces that together occupy an aggregate of approximately 27,100 square feet.
|
|
(4)
|
We lease two office spaces that together occupy an aggregate of approximately 13,800 square feet.
|
In addition to the principal offices set forth above, we maintain offices in the geographic areas we serve through which we operate our tower leasing and services businesses. We believe that our owned and leased facilities are suitable and adequate to meet our anticipated needs.
As of
December 31, 2018
, we owned and operated a portfolio of
170,686
communications sites, including 1,701 DAS networks. See the table in Item 7 of this Annual Report, under the caption “Management’s Discussion and Analysis of Financial
16
Condition and Results of Operations—Executive Overview” for more detailed information on the geographic locations of our communications sites. In addition, we own property interests that we lease to communications service providers and third-party tower operators in the United States, which are included in our U.S. property segment.
Our interests in our communications sites consist of a variety of ownership interests, including leases created by long-term ground lease agreements, easements, licenses or rights-of-way granted by government entities.
A typical tower site consists of a compound enclosing the tower site, a tower structure and one or more equipment shelters that house a variety of transmitting, receiving and switching equipment. In addition, many of our international sites typically include backup or auxiliary power generators and batteries. The principal types of our towers are guyed, self-supporting lattice and monopole, and rooftops in our international markets.
|
•
|
A guyed tower includes a series of cables attaching separate levels of the tower to anchor foundations in the ground and can reach heights of up to 2,000 feet. A guyed tower site for a typical broadcast tower can consist of a tract of land of up to 20 acres.
|
|
•
|
A self-supporting lattice tower typically tapers from the bottom up and usually has three or four legs. A lattice tower can reach heights of up to 1,000 feet. Depending on the height of the tower, a lattice tower site for a typical wireless communications tower can consist of a tract of land of 10,000 square feet for a rural site or fewer than 2,500 square feet for a metropolitan site.
|
|
•
|
A monopole tower is a tubular structure that is used primarily to address space constraints or aesthetic concerns. Monopoles typically have heights ranging from 50 to 200 feet. A monopole tower site used in metropolitan areas for a typical wireless communications tower can consist of a tract of land of fewer than 2,500 square feet.
|
|
•
|
Rooftop towers are primarily used in metropolitan areas in our Asia, EMEA and Latin America markets, where locations for traditional tower structures are unavailable. Rooftop towers typically have heights ranging from 10 to 100 feet.
|
U.S. Property Segment Encumbered Sites
. As of
December 31, 2018
, the loan underlying the securitization transactions completed in March 2013 and March 2018 (the “2013 Securitization” and the “2018 Securitization”, respectively, and together, the “Trust Securitizations”) is secured by mortgages, deeds of trust and deeds to secure the loan on substantially all of the 5,116 broadcast and wireless communications towers and related assets owned by the borrowers (the “Trust Sites”) and the secured revenue notes issued in a private transaction completed in May 2015 (the “2015 Securitization”) are secured by mortgages, deeds of trust and deeds to secure debt on substantially all of the 3,556 communications sites owned by subsidiaries of the issuer (the “2015 Secured Sites”).
Asia Property Segment Encumbered Sites.
Certain of the outstanding indebtedness is secured by ATC TIPL’s short-term and long-term assets, including an aggregate of 75,872 sites.
EMEA Property Segment Encumbered Sites.
Our outstanding indebtedness in South Africa is secured by an aggregate of 1,899 towers.
Latin America Property Segment Encumbered Sites
. Our outstanding indebtedness in Brazil is secured by an aggregate of 760 towers and outstanding indebtedness in Colombia is secured by an aggregate of 3,563 towers.
Ground Leases.
Of the
168,985
towers in our portfolio as of
December 31, 2018
, 90% were located on land we lease. Typically, we seek to enter long-term ground leases, which have initial terms of approximately five to ten years with one or more automatic or exercisable renewal periods. As a result, 46% of the ground leases for our sites have a final expiration date of 2028 and beyond.
Tenants
. Our tenants are primarily wireless service providers, broadcasters and other companies in a variety of industries. For the year ended
December 31, 2018
, our top four tenants by total revenue were AT&T (
19%
), Verizon Wireless (
15%
), T-Mobile (
9%
) and Sprint (
8%
). Across most of our markets, our tenant leases generally have an initial non-cancellable term of at least ten years, with multiple renewal terms. As a result, approximately 49% of our current tenant leases have a renewal date of 2024 or beyond.
17
|
ITEM 3.
|
LEGAL PROCEEDINGS
|
We periodically become involved in various claims and lawsuits that are incidental to our business. In the opinion of management, after consultation with counsel, there are no matters currently pending that would, in the event of an adverse outcome, have a material impact on our consolidated financial position, results of operations or liquidity.
|
ITEM 4.
|
MINE SAFETY DISCLOSURES
|
N/A.
18
PART II
|
ITEM 5.
|
MARKET FOR REGISTRANT’S COMMON EQUITY, RELATED STOCKHOLDER MATTERS AND ISSUER PURCHASES OF EQUITY SECURITIES
|
Our common stock is listed on the NYSE under the ticker symbol AMT. As of
February 20,
2019
, we had
441,134,906
outstanding shares of common stock and
145
registered holders.
Dividends
As a REIT, we must annually distribute to our stockholders an amount equal to at least 90% of our REIT taxable income (determined before the deduction for distributed earnings and excluding any net capital gain). Generally, we have distributed and expect to continue to distribute all or substantially all of our REIT taxable income after taking into consideration our utilization of net operating losses (
“
NOLs
”
).
The amount, timing and frequency of future distributions will be at the sole discretion of our Board of Directors and will depend upon various factors, a number of which may be beyond our control, including our financial condition and operating cash flows, the amount required to maintain our qualification for taxation as a REIT and reduce any income and excise taxes that we otherwise would be required to pay, limitations on distributions in our existing and future debt and preferred equity instruments, our ability to utilize NOLs to offset our distribution requirements, limitations on our ability to fund distributions using cash generated through our TRSs and other factors that our Board of Directors may deem relevant.
Performance Graph
This performance graph is furnished and shall not be deemed ‘‘filed’’ with the SEC or subject to Section 18 of the Exchange Act, nor shall it be deemed incorporated by reference in any of our filings under the Securities Act of 1933, as amended.
The following graph compares the cumulative total stockholder return on our common stock with the cumulative total return of the S&P 500 Index, the Dow Jones U.S. Telecommunications Equipment Index and the FTSE Nareit All Equity REITs Index. The performance graph assumes that on December 31, 2013, $100 was invested in each of our common stock, the S&P 500 Index, the Dow Jones U.S. Telecommunications Equipment Index and the FTSE Nareit All Equity REITs Index. The cumulative return shown in the graph assumes reinvestment of all dividends. The performance of our common stock reflected below is not necessarily indicative of future performance.
19
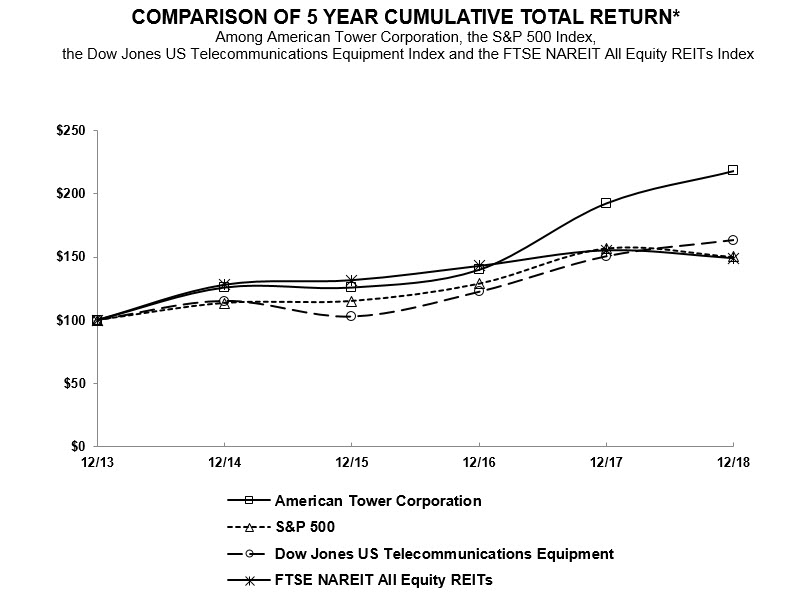
|
|
Cumulative Total Returns
|
|||||||||||||||||||||||
|
|
12/13
|
12/14
|
12/15
|
12/16
|
12/17
|
12/18
|
||||||||||||||||||
|
American Tower Corporation
|
$
|
100.00
|
|
$
|
125.76
|
|
$
|
125.76
|
|
$
|
139.86
|
|
$
|
192.57
|
|
$
|
218.22
|
|
||||||
|
S&P 500 Index
|
100.00
|
|
113.69
|
|
115.26
|
|
129.05
|
|
157.22
|
|
150.33
|
|
||||||||||||
|
Dow Jones U.S. Telecommunications Equipment Index
|
100.00
|
|
115.21
|
|
102.76
|
|
122.43
|
|
150.65
|
|
163.51
|
|
||||||||||||
|
FTSE Nareit All Equity REITs Index
|
100.00
|
|
128.03
|
|
131.64
|
|
143.00
|
|
155.41
|
|
149.12
|
|
||||||||||||
20
Issuer Purchases of Equity Securities
In March 2011, our Board of Directors approved a stock repurchase program, pursuant to which we are authorized to repurchase up to $1.5 billion of our common stock (the “2011 Buyback”). In addition to the 2011 Buyback, in December 2017, our Board of Directors approved an additional stock repurchase program, pursuant to which we are authorized to repurchase up to $2.0 billion of our common stock (the “2017 Buyback”, and together with the 2011 Buyback the “Buyback Programs”).
During the three months ended
December 31, 2018
, we repurchased a total of 301,946 shares of our common stock for an aggregate of $43.6 million, including commissions and fees, pursuant to the 2011 Buyback. We had no repurchases under the 2017 Buyback. The table below sets forth details of our repurchases under the 2011 Buyback during the three months ended
December 31, 2018
.
|
Period
|
Total Number of Shares Purchased (1)
|
Average Price Paid per Share (2)
|
Total Number of Shares Purchased as Part of Publicly Announced Plans or Programs
|
Approximate Dollar Value of Shares that May Yet be Purchased Under the Plans or Programs
|
||||||||||
|
(in millions)
|
||||||||||||||
|
October 1, 2018 - October 31, 2018
|
301,946
|
|
$
|
144.35
|
|
301,946
|
|
$
|
112.0
|
|
||||
|
November 1, 2018 - November 30, 2018
|
—
|
|
$
|
—
|
|
—
|
|
$
|
—
|
|
||||
|
December 1, 2018 - December 31, 2018
|
—
|
|
$
|
—
|
|
—
|
|
$
|
—
|
|
||||
|
Total Fourth Quarter
|
301,946
|
|
$
|
144.35
|
|
301,946
|
|
$
|
112.0
|
|
||||
_______________
|
(1)
|
Repurchases made pursuant to the 2011 Buyback. Under this program, our management is authorized to purchase shares from time to time through open market purchases or privately negotiated transactions at prevailing prices as permitted by securities laws and other legal requirements, and subject to market conditions and other factors. To facilitate repurchases, we make purchases pursuant to trading plans under Rule 10b5-1 of the Exchange Act, which allows us to repurchase shares during periods when we otherwise might be prevented from doing so under insider trading laws or because of self-imposed trading blackout periods. This program may be discontinued at any time.
|
|
(2)
|
Average price paid per share is a weighted average calculation using the aggregate price, excluding commissions and fees.
|
We have repurchased a total of
14.0 million
shares of our common stock under the 2011 Buyback for an aggregate of
$1.4 billion
, including commissions and fees. We expect to continue to manage the pacing of the remaining $2.1 billion under the Buyback Programs in response to general market conditions and other relevant factors. We expect to fund any further repurchases of our common stock through a combination of cash on hand, cash generated by operations and borrowings under our credit facilities. Purchases under the Buyback Programs are subject to our having available cash to fund repurchases.
|
ITEM 6.
|
SELECTED FINANCIAL DATA
|
The selected financial data should be read in conjunction with our “Management’s Discussion and Analysis of Financial Condition and Results of Operations,” and our audited consolidated financial statements and the related notes to those consolidated financial statements included in this Annual Report.
Year-over-year comparisons are significantly affected by our acquisitions, dispositions and construction of towers. Our transaction with Verizon Communications Inc. (“Verizon” and the transaction, the “Verizon Transaction”) and the acquisition of a controlling ownership interest in Viom Networks Limited (“Viom” and the acquisition, the “Viom Acquisition”), which closed in March 2015 and April 2016, respectively, significantly impact the comparability of reported results between periods. Our principal 2018 acquisitions are described in note 6 to our consolidated financial statements included in this Annual Report.
21
|
|
Year Ended December 31,
|
|||||||||||||||||||
|
|
2018
|
2017
|
2016
|
2015
|
2014
|
|||||||||||||||
|
|
(In millions, except share and per share data)
|
|||||||||||||||||||
|
Statements of Operations Data:
|
||||||||||||||||||||
|
Revenues:
|
||||||||||||||||||||
|
Property
|
$
|
7,314.7
|
|
$
|
6,565.9
|
|
$
|
5,713.1
|
|
$
|
4,680.4
|
|
$
|
4,006.9
|
|
|||||
|
Services
|
125.4
|
|
98.0
|
|
72.6
|
|
91.1
|
|
93.1
|
|
||||||||||
|
Total operating revenues
|
7,440.1
|
|
6,663.9
|
|
5,785.7
|
|
4,771.5
|
|
4,100.0
|
|
||||||||||
|
Operating expenses:
|
||||||||||||||||||||
|
Cost of operations (exclusive of items shown separately below)
|
||||||||||||||||||||
|
Property
|
2,128.7
|
|
2,022.0
|
|
1,762.7
|
|
1,275.4
|
|
1,056.2
|
|
||||||||||
|
Services
|
49.1
|
|
34.6
|
|
27.7
|
|
33.4
|
|
38.1
|
|
||||||||||
|
Depreciation, amortization and accretion
|
2,110.8
|
|
1,715.9
|
|
1,525.6
|
|
1,285.3
|
|
1,003.8
|
|
||||||||||
|
Selling, general, administrative and development expense
|
733.2
|
|
637.0
|
|
543.4
|
|
497.8
|
|
446.5
|
|
||||||||||
|
Other operating expenses
|
513.3
|
|
256.0
|
|
73.3
|
|
66.8
|
|
68.5
|
|
||||||||||
|
Total operating expenses
|
5,535.1
|
|
4,665.5
|
|
3,932.7
|
|
3,158.7
|
|
2,613.1
|
|
||||||||||
|
Operating income
|
1,905.0
|
|
1,998.4
|
|
1,853.0
|
|
1,612.8
|
|
1,486.9
|
|
||||||||||
|
Interest (expense) income, TV Azteca, net
|
(0.1
|
)
|
10.8
|
|
10.9
|
|
11.2
|
|
10.5
|
|
||||||||||
|
Interest income
|
54.7
|
|
35.4
|
|
25.6
|
|
16.5
|
|
14.0
|
|
||||||||||
|
Interest expense
|
(825.5
|
)
|
(749.6
|
)
|
(717.1
|
)
|
(595.9
|
)
|
(580.2
|
)
|
||||||||||
|
(Loss) gain on retirement of long-term obligations
|
(3.3
|
)
|
(70.2
|
)
|
1.2
|
|
(79.6
|
)
|
(3.5
|
)
|
||||||||||
|
Other income (expense) (1)
|
23.8
|
|
31.3
|
|
(47.7
|
)
|
(135.0
|
)
|
(62.0
|
)
|
||||||||||
|
Income from continuing operations before income taxes
|
1,154.6
|
|
1,256.1
|
|
1,125.9
|
|
830.0
|
|
865.7
|
|
||||||||||
|
Income tax benefit (provision)
|
110.1
|
|
(30.7
|
)
|
(155.5
|
)
|
(158.0
|
)
|
(62.5
|
)
|
||||||||||
|
Net income
|
1,264.7
|
|
1,225.4
|
|
970.4
|
|
672.0
|
|
803.2
|
|
||||||||||
|
Net (income) loss attributable to noncontrolling interests
|
(28.3
|
)
|
13.5
|
|
(14.0
|
)
|
13.1
|
|
21.7
|
|
||||||||||
|
Net income attributable to American Tower Corporation stockholders
|
1,236.4
|
|
1,238.9
|
|
956.4
|
|
685.1
|
|
824.9
|
|
||||||||||
|
Dividends on preferred stock
|
(9.4
|
)
|
(87.4
|
)
|
(107.1
|
)
|
(90.2
|
)
|
(23.9
|
)
|
||||||||||
|
Net income attributable to American Tower Corporation common stockholders
|
$
|
1,227.0
|
|
$
|
1,151.5
|
|
$
|
849.3
|
|
$
|
594.9
|
|
$
|
801.0
|
|
|||||
|
Net income per common share amounts:
|
||||||||||||||||||||
|
Basic net income attributable to American Tower Corporation common stockholders
|
$
|
2.79
|
|
$
|
2.69
|
|
$
|
2.00
|
|
$
|
1.42
|
|
$
|
2.02
|
|
|||||
|
Diluted net income attributable to American Tower Corporation common stockholders
|
$
|
2.77
|
|
$
|
2.67
|
|
$
|
1.98
|
|
$
|
1.41
|
|
$
|
2.00
|
|
|||||
|
Weighted average common shares outstanding (in thousands):
|
||||||||||||||||||||
|
Basic
|
439,606
|
|
428,181
|
|
425,143
|
|
418,907
|
|
395,958
|
|
||||||||||
|
Diluted
|
442,960
|
|
431,688
|
|
429,283
|
|
423,015
|
|
400,086
|
|
||||||||||
|
Distribution declared per common share
|
$
|
3.15
|
|
$
|
2.62
|
|
$
|
2.17
|
|
$
|
1.81
|
|
$
|
1.40
|
|
|||||
|
Distribution declared per preferred share, Series A
|
$
|
—
|
|
$
|
2.63
|
|
$
|
5.25
|
|
$
|
3.94
|
|
$
|
3.98
|
|
|||||
|
Distribution declared per preferred share, Series B
|
$
|
13.75
|
|
$
|
55.00
|
|
$
|
55.00
|
|
$
|
38.65
|
|
$
|
—
|
|
|||||
22
|
|
As of December 31,
|
|||||||||||||||||||
|
|
2018
|
2017
|
2016
|
2015
|
2014 (2)
|
|||||||||||||||
|
|
(In millions)
|
|||||||||||||||||||
|
Balance Sheet Data:
|
||||||||||||||||||||
|
Cash and cash equivalents (including restricted cash) (3)
|
$
|
1,304.9
|
|
$
|
954.9
|
|
$
|
936.5
|
|
$
|
462.9
|
|
$
|
473.7
|
|
|||||
|
Property and equipment, net
|
11,247.1
|
|
11,101.0
|
|
10,517.3
|
|
9,866.4
|
|
7,590.1
|
|
||||||||||
|
Total assets
|
33,010.4
|
|
33,214.3
|
|
30,879.2
|
|
26,904.3
|
|
21,263.6
|
|
||||||||||
|
Long-term obligations, including current portion
|
21,159.9
|
|
20,205.1
|
|
18,533.5
|
|
17,119.0
|
|
14,540.3
|
|
||||||||||
|
Redeemable noncontrolling interest
|
1,004.8
|
|
1,126.2
|
|
1,091.3
|
|
—
|
|
—
|
|
||||||||||
|
Total American Tower Corporation equity
|
5,336.1
|
|
6,241.5
|
|
6,763.9
|
|
6,651.7
|
|
3,953.6
|
|
||||||||||
_______________
|
(1)
|
For the years ended December 31,
2018
,
2017
,
2016
,
2015
and
2014
, amount includes foreign currency (losses) gains of
($4.5) million
, $26.4 million, ($48.9) million, ($134.7) million and ($63.2) million, respectively.
|
|
(2)
|
Balances have been revised to reflect debt issuance cost adjustments and purchase accounting measurement period adjustments for the year ended December 31, 2014.
|
|
(3)
|
As of December 31,
2018
,
2017
,
2016
,
2015
and
2014
, amount includes
$96.2 million
, $152.8 million, $149.3 million, $142.2 million and $160.2 million, respectively, of restricted funds pledged as collateral to secure obligations and cash, the use of which is otherwise limited by contractual provisions.
|
|
ITEM 7.
|
MANAGEMENT’S DISCUSSION AND ANALYSIS OF FINANCIAL CONDITION AND RESULTS OF OPERATIONS
|
The discussion and analysis of our financial condition and results of operations that follow are based upon our consolidated financial statements, which have been prepared in accordance with GAAP. The preparation of our financial statements requires us to make estimates and assumptions that affect the reported amounts of assets and liabilities, revenues and expenses and the related disclosure of contingent assets and liabilities at the date of our financial statements. Actual results may differ from these estimates and such differences could be material to the financial statements. This discussion should be read in conjunction with our consolidated financial statements included in this Annual Report and the accompanying notes, and the information set forth under the caption “Critical Accounting Policies and Estimates” below.
We report our results in five segments: U.S. property, Asia property, EMEA property, Latin America property and services. In evaluating financial performance in each business segment, management uses, among other factors, segment gross margin and segment operating profit (see note 20 to our consolidated financial statements included in this Annual Report).
Executive Overview
We are one of the largest global REITs and a leading independent owner, operator and developer of multitenant communications real estate. Our primary business is the leasing of space on communications sites to wireless service providers, radio and television broadcast companies, wireless data providers, government agencies and municipalities and tenants in a number of other industries. In addition to the communications sites in our portfolio, we manage rooftop and tower sites for property owners under various contractual arrangements. We also hold other telecommunications infrastructure, fiber and property interests that we lease primarily to communications service providers and third-party tower operators. We refer to this business as our property operations, which accounted for
98%
of our total revenues for the year ended
December 31, 2018
and includes our U.S. property segment, Asia property segment, EMEA property segment and Latin America property segment.
We also offer tower-related services in the United States, including site acquisition, zoning and permitting and structural analysis, which primarily support our site leasing business, including the addition of new tenants and equipment on our sites.
23
The following table details the number of communications sites, excluding managed sites, that we owned or operated as of December 31,
2018
:
|
Number of
Owned Towers
|
Number of
Operated
Towers (1)
|
Number of
Owned DAS Sites |
|||||||
|
Domestic:
|
|||||||||
|
United States
|
24,454
|
|
15,905
|
|
398
|
|
|||
|
Asia:
|
|||||||||
|
India
|
74,804
|
|
—
|
|
1,068
|
|
|||
|
EMEA:
|
|||||||||
|
France
|
2,186
|
|
309
|
|
9
|
|
|||
|
Germany
|
2,208
|
|
—
|
|
—
|
|
|||
|
Ghana
|
2,279
|
|
—
|
|
24
|
|
|||
|
Kenya
|
715
|
|
|
|
|
|
|||
|
Nigeria
|
4,760
|
|
—
|
|
—
|
|
|||
|
South Africa (2)
|
2,652
|
|
—
|
|
—
|
|
|||
|
Uganda
|
1,523
|
|
—
|
|
—
|
|
|||
|
EMEA total
|
16,323
|
|
309
|
|
33
|
|
|||
|
Latin America:
|
|||||||||
|
Argentina (3)
|
36
|
|
—
|
|
4
|
|
|||
|
Brazil (3)
|
16,632
|
|
2,257
|
|
91
|
|
|||
|
Chile
|
1,298
|
|
—
|
|
18
|
|
|||
|
Colombia
|
4,943
|
|
—
|
|
2
|
|
|||
|
Costa Rica
|
553
|
|
—
|
|
2
|
|
|||
|
Mexico (4)
|
9,047
|
|
186
|
|
85
|
|
|||
|
Paraguay
|
1,276
|
|
—
|
|
—
|
|
|||
|
Peru
|
690
|
|
272
|
|
—
|
|
|||
|
Latin America total
|
34,475
|
|
2,715
|
|
202
|
|
|||
_______________
|
(1)
|
Approximately 98% of the operated towers are held pursuant to long-term capital leases, including those subject to purchase options.
|
|
(2)
|
In South Africa, we also own fiber.
|
|
(3)
|
In Argentina and Brazil, we also own or operate urban telecommunications assets, fiber and the rights to utilize certain existing utility infrastructure for future telecommunications equipment installation.
|
|
(4)
|
In Mexico, we also own or operate urban telecommunications assets, including fiber, concrete poles and other infrastructure.
|
In most of our markets, our tenant leases with wireless carriers generally have an initial non-cancellable term of at least ten years, with multiple renewal terms. Accordingly, the vast majority of the revenue generated by our property operations during the year ended
December 31, 2018
was recurring revenue that we should continue to receive in future periods. Based upon foreign currency exchange rates and the tenant leases in place as of
December 31, 2018
, we expect to generate nearly
$35 billion
of non-cancellable tenant lease revenue over future periods, before the impact of straight-line lease accounting. Most of our tenant leases have provisions that periodically increase the rent due under the lease, typically based on an annual fixed escalation (averaging approximately
3%
in the United States) or an inflationary index in our international markets, or a combination of both. In addition, certain of our tenant leases provide for additional revenue primarily to cover costs, such as ground rent or power and fuel costs.
The revenues generated by our property operations may be affected by cancellations of existing tenant leases. As discussed above, most of our tenant leases with wireless carriers and broadcasters are multiyear contracts, which typically are non-cancellable; however, in some instances, a lease may be cancelled upon the payment of a termination fee.
Revenue lost from either cancellations or the non-renewal of leases or rent renegotiations, which we refer to as churn, historically has not had a material adverse effect on the revenues generated by our consolidated property operations. This was again the case during the year ended
December 31, 2018
, in which loss of tenant billings from tenant lease cancellations, non-renewal or renegotiations represented approximately 4% of our tenant billings.
24
In 2018, we experienced an increase in revenue lost from cancellations or non-renewals primarily due to carrier consolidation-driven churn in India, which we expect will continue to result in a higher impact on our revenues, including tenant billings, as compared to the historical average, in 2019. We also expect this churn will compress our gross margin and operating profit in 2019, particularly in our Asia property segment, although we expect this to be partially offset by lower expenses due to reduced tenancy on existing sites or the decommissioning of sites. In addition, we expect to periodically evaluate the carrying value of our Indian assets, which may result in the realization of additional impairment expense or other similar charges. For more information, please see the information under the caption “Management’s Discussion and Analysis of Financial Condition and Results of Operations—Critical Accounting Policies and Estimates.”
In October 2018, we entered into agreements with one of our tenants in India, Tata Teleservices and related entities (collectively, “Tata”), for a settlement and release of certain contractual lease obligations of Tata.
For the year ended December 31, 2018, carrier consolidation-driven churn in India, including churn associated with our settlement with Tata, negatively impacted our consolidated property revenue by $189.1 million, including approximately $61.0 million in pass-through revenue, and negatively impacted our gross margin and operating profit by $119.8 million.
The effects of carrier consolidation-driven churn described above were offset by the impact of the settlement with Tata, which resulted in a net positive impact to property revenue of $333.7 million as a result of the
$345.5 million
cash payment, partially offset by the impact of straight-line accounting and other amounts directly related to the settlement. The settlement also resulted in a net positive impact to operating profit of $326.9 million.
On a net basis, carrier consolidation-driven churn and our settlement with Tata positively impacted our full year 2018 consolidated property revenue by $144.6 million and our full year 2018 operating profit by $207.1 million. In 2019, we expect carrier consolidation-driven churn in India, excluding the impact of the nonrecurrence of one-time items related to the settlement with Tata in 2018, to negatively impact our consolidated property revenue by approximately $191.2 million, including approximately $22.3 million in pass-through revenue, and our operating profit by approximately $148.0 million.
We also recorded impairment charges of
$164.2 million
as a result of the settlement with Tata in October 2018 and $147.4 million as a result of one of our tenants in India, Aircel Ltd.’s (“Aircel”), filing for bankruptcy protection in February 2018.
Property Operations Revenue Growth
. Due to our diversified communications site portfolio, our tenant lease rates vary considerably depending upon numerous factors, including, but not limited to, amount, type and position of tenant equipment on the tower, remaining tower capacity and tower location. We measure the remaining tower capacity by assessing several factors, including tower height, tower type, environmental conditions, existing equipment on the tower and zoning and permitting regulations in effect in the jurisdiction where the tower is located. In many instances, tower capacity can be increased with relatively modest tower augmentation capital expenditures.
The primary factors affecting the revenue growth of our property segments are:
|
•
|
Growth in tenant billings, including:
|
|
•
|
New revenue attributable to leases in place on day one on sites acquired or constructed since the beginning of the prior-year period;
|
|
•
|
New revenue attributable to leasing additional space on our sites (“colocations”) and lease amendments; and
|
|
•
|
Contractual rent escalations on existing tenant leases, net of churn.
|
|
•
|
Revenue growth from other items, including additional tenant payments primarily to cover costs, such as ground rent or power and fuel costs included in certain tenant leases (“pass-through”), straight-line revenue and decommissioning.
|
We continue to believe that our site leasing revenue is likely to increase due to the growing use of wireless services globally and our ability to meet the corresponding incremental demand for our communications real estate. By adding new tenants and new equipment for existing tenants on our sites, we are able to increase these sites’ utilization and profitability. We believe the majority of our site leasing activity will continue to come from wireless service providers, with tenants in a number of other industries contributing incremental leasing demand. Our site portfolio and our established tenant base provide us with new business opportunities, which have historically resulted in consistent and predictable organic revenue growth as wireless carriers seek to increase the coverage and capacity of their existing networks, while also deploying next generation wireless technologies. In addition, we intend to continue to supplement our organic growth by selectively developing or acquiring new sites in our existing and new markets where we can achieve our risk-adjusted return on investment objectives.
Property Operations Organic Revenue Growth
. Consistent with our strategy to increase the utilization and return on investment from our sites, our objective is to add new tenants and new equipment for existing tenants through colocation and lease amendments. Our ability to lease additional space on our sites is primarily a function of the rate at which wireless carriers
25
and other tenants deploy capital to improve and expand their wireless networks. This rate, in turn, is influenced by the growth of wireless services, the penetration of advanced wireless devices, the level of emphasis on network quality and capacity in carrier competition, the financial performance of our tenants and their access to capital and general economic conditions. According to industry data, recent aggregate annual wireless capital spending in the United States has averaged approximately $30 billion, resulting in consistent demand for our sites.
Based on industry research and projections, we expect that a number of key industry trends will result in incremental revenue opportunities for us:
|
•
|
In less advanced wireless markets where initial voice and data networks are still being deployed, we expect these deployments to drive demand for our tower space as carriers seek to expand their footprints and increase the scope and density of their networks. We have established operations in many of these markets at the early stages of wireless development, which we believe will enable us to meaningfully participate in these deployments over the long term.
|
|
•
|
Subscribers’ use of mobile data continues to grow rapidly given increasing smartphone and other advanced device penetration, the proliferation of bandwidth-intensive applications on these devices and the continuing evolution of the mobile ecosystem. We believe carriers will be compelled to deploy additional equipment on existing networks while also rolling out more advanced wireless networks to address coverage and capacity needs resulting from this increasing mobile data usage.
|
|
•
|
The deployment of advanced mobile technology, such as 4G and 5G, across existing wireless networks will provide higher speed data services and further enable fixed broadband substitution. As a result, we expect that our tenants will continue deploying additional equipment across their existing networks.
|
|
•
|
Wireless service providers compete based on the quality of their existing networks, which is driven by capacity and coverage. To maintain or improve their network performance as overall network usage increases, our tenants continue deploying additional equipment across their existing sites while also adding new cell sites. We anticipate increasing network densification over the next several years, as existing network infrastructure is anticipated to be insufficient to account for rapidly increasing levels of wireless data usage.
|
|
•
|
Wireless service providers continue to acquire additional spectrum, and as a result are expected to add additional sites and equipment to their networks as they seek to optimize their network configuration and utilize additional spectrum.
|
|
•
|
Next generation technologies requiring wireless connectivity have the potential to provide incremental revenue opportunities for us. These technologies may include autonomous vehicle networks and a number of other internet-of-things, or IoT, applications, as well as other potential use cases for wireless services. These technologies may create new and complementary use cases for our communications real estate over time, although these use cases are currently in nascent stages.
|
As part of our international expansion initiatives, we have targeted markets in various stages of network development to diversify our international exposure and position us to benefit from a number of different wireless technology deployments over the long term. In addition, we have focused on building relationships with large multinational carriers such as Airtel, Telefónica S.A. and Vodafone Group PLC, among others. We believe that consistent carrier network investments across our international markets position us to generate meaningful organic revenue growth going forward.
In emerging markets, such as Ghana, India, Kenya, Nigeria and Uganda, wireless networks tend to be significantly less advanced than those in the United States, and initial voice networks continue to be deployed in certain underdeveloped areas. A majority of consumers in these markets still utilize basic wireless services, predominantly on feature phones, while advanced device penetration remains low. In more developed urban locations within these markets, data network deployments are underway. Carriers are focused on completing voice network build-outs while also investing in initial data networks as mobile data usage and smartphone penetration within their customer bases begin to accelerate.
In India, the ongoing transition from 2G technology to 4G technology has included a period of carrier consolidation, which we expect to continue through 2019, whereby the number of carriers operating in the marketplace has been reduced through mergers, acquisitions and select carrier exits from the marketplace. Over the long term, this consolidation process is expected to result in a more favorable structural environment for both the wireless carriers as well as communications infrastructure providers. In the shorter term, as described above, the consolidation process continues to result in elevated levels of churn within our India business, as merging carriers rationalize redundant legacy equipment installations and as select carriers exit the marketplace.
26
In markets with rapidly evolving network technology, such as South Africa and most of the countries in Latin America where we do business, initial voice networks, for the most part, have already been built out, and carriers are focused on 3G and 4G network build outs. Consumers in these regions are increasingly adopting smartphones and other advanced devices, in particular as lower cost smartphones become increasingly available. As a result, the usage of bandwidth-intensive mobile applications is growing materially. Recent spectrum auctions in these rapidly evolving markets have allowed incumbent carriers to accelerate their data network deployments and have also enabled new entrants to begin initial investments in data networks. Smartphone penetration and wireless data usage in these markets are advancing rapidly, which typically requires that carriers continue to invest in their networks to maintain and augment their quality of service.
Finally, in markets with more mature network technology, such as Germany and France, carriers are focused on deploying 4G data networks to account for rapidly increasing wireless data usage among their customer base. With higher smartphone and advanced device penetration and significantly higher per capita data usage, carrier investment in networks is focused on 4G coverage and capacity.
We believe that the network technology migration we have seen in the United States, which has led to significantly denser networks and meaningful new business commencements for us over a number of years, will be replicated in our less advanced international markets over time. As a result, we expect to be able to leverage our extensive international portfolio of approximately
129,930
communications sites and the relationships we have built with our carrier tenants to drive sustainable, long
-
term growth.
We have master lease agreements with certain of our tenants that provide for consistent, long-term revenue and reduce the likelihood of churn. Certain of those master lease agreements are holistic in nature and further build and augment strong strategic partnerships with our tenants and have significantly reduced colocation cycle times, thereby providing our tenants with the ability to rapidly and efficiently deploy equipment on our sites.
Demand for our communications sites could be negatively impacted by a number of factors, including an increase in network sharing or consolidation among our tenants, as set forth in Item 1A of this Annual Report under the caption “Risk Factors—If our tenants consolidate their operations, exit the telecommunications business or share site infrastructure to a significant degree, our growth, revenue and ability to generate positive cash flows could be materially and adversely affected.” In addition, the emergence and growth of new technologies could reduce demand for our sites, as set forth under the caption “Risk Factors—New technologies or changes in our or a tenant’s business model could make our tower leasing business less desirable and result in decreasing revenues and operating results.” Further, our tenants may be subject to new regulatory policies from time to time that materially and adversely affect the demand for our communications sites.
Property Operations New Site Revenue Growth.
During the year ended December 31,
2018
, we grew our portfolio of communications real estate through the acquisition and construction of approximately
24,465
sites globally, as well as the acquisition of certain urban telecommunications assets in Brazil. In a majority of our Asia, EMEA and Latin America markets, the revenue generated from newly acquired or constructed sites resulted in increases in both tenant and pass-through revenues (such as ground rent or power and fuel costs) and expenses. We continue to evaluate opportunities to acquire communications real estate portfolios, both domestically and internationally, to determine whether they meet our risk-adjusted hurdle rates and whether we believe we can effectively integrate them into our existing portfolio.
|
New Sites (Acquired or Constructed)
|
2018
|
2017
|
2016
|
|||||
|
U.S.
|
285
|
|
635
|
|
65
|
|
||
|
Asia
|
21,470
|
|
1,135
|
|
43,865
|
|
||
|
EMEA
|
1,055
|
|
2,755
|
|
665
|
|
||
|
Latin America
|
1,655
|
|
2,360
|
|
715
|
|
||
Property Operations Expenses.
Direct operating expenses incurred by our property segments include direct site level expenses and consist primarily of ground rent and power and fuel costs, some or all of which may be passed through to our tenants, as well as property taxes, repairs and maintenance. These segment direct operating expenses exclude all segment and corporate selling, general, administrative and development expenses, which are aggregated into one line item entitled Selling, general, administrative and development expense in our consolidated statements of operations. In general, our property segments’ selling, general, administrative and development expenses do not significantly increase as a result of adding incremental tenants to our sites and typically increase only modestly year-over-year. As a result, leasing additional space to new tenants on our sites provides significant incremental cash flow. We may, however, incur additional segment selling, general, administrative and development expenses as we increase our presence in our existing markets or expand into new markets. Our
27
profit margin growth is therefore positively impacted by the addition of new tenants to our sites but can be temporarily diluted by our development activities.
Services Segment Revenue Growth
. As we continue to focus on growing our property operations, we anticipate that our services revenue will continue to represent a small percentage of our total revenues.
Non-GAAP Financial Measures
Included in our analysis of our results of operations are discussions regarding earnings before interest, taxes, depreciation, amortization and accretion, as adjusted (“Adjusted EBITDA”), Funds From Operations, as defined by the National Association of Real Estate Investment Trusts (“Nareit FFO”) attributable to American Tower Corporation common stockholders, Consolidated Adjusted Funds From Operations (“Consolidated AFFO”) and AFFO attributable to American Tower Corporation common stockholders.
We define Adjusted EBITDA as Net income before Income (loss) from equity method investments; Income tax benefit (provision); Other income (expense); Gain (loss) on retirement of long-term obligations; Interest expense; Interest income; Other operating income (expense); Depreciation, amortization and accretion; and stock-based compensation expense.
Nareit FFO attributable to American Tower Corporation common stockholders is defined as net income before gains or losses from the sale or disposal of real estate, real estate related impairment charges, real estate related depreciation, amortization and accretion and dividends on preferred stock, and including adjustments for (i) unconsolidated affiliates and (ii) noncontrolling interests. In this section, we refer to Nareit FFO attributable to American Tower Corporation common stockholders as “Nareit FFO (common stockholders).”
We define Consolidated AFFO as Nareit FFO (common stockholders) before (i) straight-line revenue and expense; (ii) stock-based compensation expense; (iii) the deferred portion of income tax; (iv) non-real estate related depreciation, amortization and accretion; (v) amortization of deferred financing costs, capitalized interest, debt discounts and premiums and long-term deferred interest charges; (vi) other income (expense); (vii) gain (loss) on retirement of long-term obligations; (viii) other operating income (expense); and adjustments for (ix) unconsolidated affiliates and (x) noncontrolling interests, less cash payments related to capital improvements and cash payments related to corporate capital expenditures.
We define AFFO attributable to American Tower Corporation common stockholders as Consolidated AFFO, excluding the impact of noncontrolling interests on both Nareit FFO (common stockholders) and the other adjustments included in the calculation of Consolidated AFFO. In this section, we refer to AFFO attributable to American Tower Corporation common stockholders as “AFFO (common stockholders).”
Adjusted EBITDA, Nareit FFO (common stockholders), Consolidated AFFO and AFFO (common stockholders) are not intended to replace net income or any other performance measures determined in accordance with GAAP. None of Adjusted EBITDA, Nareit FFO (common stockholders), Consolidated AFFO or AFFO (common stockholders) represents cash flows from operating activities in accordance with GAAP and, therefore, these measures should not be considered indicative of cash flows from operating activities, as a measure of liquidity or a measure of funds available to fund our cash needs, including our ability to make cash distributions. Rather, Adjusted EBITDA, Nareit FFO (common stockholders), Consolidated AFFO and AFFO (common stockholders) are presented as we believe each is a useful indicator of our current operating performance. We believe that these metrics are useful to an investor in evaluating our operating performance because (1) each is a key measure used by our management team for decision making purposes and for evaluating our operating segments’ performance; (2) Adjusted EBITDA is a component underlying our credit ratings; (3) Adjusted EBITDA is widely used in the telecommunications real estate sector to measure operating performance as depreciation, amortization and accretion may vary significantly among companies depending upon accounting methods and useful lives, particularly where acquisitions and non-operating factors are involved; (4) Consolidated AFFO is widely used in the telecommunications real estate sector to adjust Nareit FFO (common stockholders) for items that may otherwise cause material fluctuations in Nareit FFO (common stockholders) growth from period to period that would not be representative of the underlying performance of property assets in those periods; (5) each provides investors with a meaningful measure for evaluating our period-to-period operating performance by eliminating items that are not operational in nature; and (6) each provides investors with a measure for comparing our results of operations to those of other companies, particularly those in our industry.
Our measurement of Adjusted EBITDA, Nareit FFO (common stockholders), Consolidated AFFO and AFFO (common stockholders) may not, however, be fully comparable to similarly titled measures used by other companies. Reconciliations of Adjusted EBITDA, Nareit FFO (common stockholders), Consolidated AFFO and AFFO (common stockholders) to net income, the most directly comparable GAAP measure, have been included below.
28
Results of Operations
Years Ended December 31,
2018
,
2017
and
2016
(in millions, except percentages)
Revenue
|
|
Year Ended December 31,
|
Percent Change 2018 vs 2017
|
Percent Change 2017 vs 2016
|
||||||||||||||
|
|
2018
|
2017
|
2016
|
||||||||||||||
|
Property
|
|||||||||||||||||
|
U.S.
|
$
|
3,822.1
|
|
$
|
3,605.7
|
|
$
|
3,370.1
|
|
6
|
%
|
7
|
%
|
||||
|
Asia
|
1,540.5
|
|
1,164.4
|
|
827.6
|
|
32
|
|
41
|
|
|||||||
|
EMEA
|
687.3
|
|
626.2
|
|
529.5
|
|
10
|
|
18
|
|
|||||||
|
Latin America
|
1,264.8
|
|
1,169.6
|
|
985.9
|
|
8
|
|
19
|
|
|||||||
|
Total property
|
7,314.7
|
|
6,565.9
|
|
5,713.1
|
|
11
|
|
15
|
|
|||||||
|
Services
|
125.4
|
|
98.0
|
|
72.6
|
|
28
|
|
35
|
|
|||||||
|
Total revenues
|
$
|
7,440.1
|
|
$
|
6,663.9
|
|
$
|
5,785.7
|
|
12
|
%
|
15
|
%
|
||||
Year ended December 31,
2018
U.S. property segment revenue growth of
$216.4 million
was attributable to:
|
•
|
Tenant billings growth of $264.0 million, which was driven by:
|
|
•
|
$188.5 million due to colocations and amendments;
|
|
•
|
$59.6 million from contractual escalations, net of churn; and
|
|
•
|
$21.0 million generated from newly acquired or constructed sites;
|
|
•
|
Partially offset by a decrease of $5.1 million from other tenant billings; and
|
|
•
|
A decrease of $47.6 million in other revenue, which includes an $81.3 million decrease due to straight-line accounting.
|
Asia property segment revenue growth of
$376.1 million
was attributable to:
|
•
|
Tenant billings growth of $31.0 million, which was driven by:
|
|
•
|
$123.7 million generated from newly acquired or constructed sites, including $117.7 million from the transactions with Vodafone (the “Vodafone Acquisition”) and Idea (the “Idea Acquisition”);
|
|
•
|
$49.5 million due to colocations and amendments; and
|
|
•
|
$0.6 million from other tenant billings;
|
|
•
|
Partially offset by a decrease of $142.8 million resulting from churn in excess of contractual escalations, including $128.1 million due to carrier consolidation-driven churn in India;
|
|
•
|
Pass-through revenue growth of $59.7 million; and
|
|
•
|
An increase of $349.3 million in other revenue, primarily due to the net impact of our settlement with Tata and a decrease in revenue reserves. The settlement with Tata contributed $333.7 million to other revenue, as a result of the approximately $345.5 million cash settlement payment, partially offset by the net impacts of straight-line accounting and other amounts directly related to the settlement.
|
Segment revenue growth was partially offset by a decrease of $63.9 million attributable to the negative impact of foreign currency translation related to fluctuations in Indian Rupees (“INR”).
EMEA property segment revenue growth of
$61.1 million
was attributable to:
|
•
|
Tenant billings growth of $47.1 million, which was driven by:
|
|
•
|
$17.3 million due to colocations and amendments;
|
|
•
|
$13.8 million from contractual escalations, net of churn;
|
|
•
|
$15.0 million generated from newly acquired or constructed sites, primarily due to the full-year impact of the 2017 acquisition of FPS Towers in France through our European joint venture (the “FPS Acquisition”) and the acquisition of communication sites in Kenya (the “Kenya Acquisition”); and
|
|
•
|
$1.0 million from other tenant billings;
|
|
•
|
An increase of $15.4 million in other revenue, primarily due to back-billing; and
|
29
|
•
|
Pass-through revenue growth of $8.2 million.
|
Segment growth was partially offset by a decrease of $9.6 million attributable to the negative impact of foreign currency translation, which included, among others, $8.6 million related to fluctuations in Nigerian Naira (“NGN”) and $7.4 million related to fluctuations in Ghanaian Cedi (“GHS”), and was partially offset by an increase of $6.0 million related to fluctuations in the Euro (“EUR”).
Latin America property segment revenue growth of
$95.2 million
was attributable to:
|
•
|
Tenant billings growth of $118.2 million, which was driven by:
|
|
•
|
$48.1 million due to colocations and amendments;
|
|
•
|
$34.0 million from contractual escalations, net of churn;
|
|
•
|
$26.1 million generated from newly acquired or constructed sites; and
|
|
•
|
$10.0 million from other tenant billings;
|
|
•
|
Pass-through revenue growth of $25.6 million; and
|
|
•
|
An increase of $49.8 million in other revenue, due in part to $62.6 million from our fiber businesses in Mexico and Brazil and a $6.0 million reduction in revenue reserves from a settlement related to the judicial reorganization of a tenant in Brazil, partially offset by the impact of straight-line accounting.
|
Segment revenue growth was partially offset by a decrease of $98.4 million attributable to the negative impact of foreign currency translation, which included, among others, $81.1 million related to fluctuations in Brazilian Reais (“BRL”), $10.2 million related to fluctuations in Argentinean Pesos (“ARS”) and $7.1 million related to fluctuations in Mexican Pesos (“MXN”).
The increase in services segment revenue of
$27.4 million
was primarily attributable to an increase in site acquisition projects.
Year ended December 31,
2017
U.S. property segment revenue growth of $235.6 million was attributable to:
|
•
|
Tenant billings growth of $206.6 million, which was driven by:
|
|
•
|
$151.2 million due to colocations and amendments;
|
|
•
|
$42.9 million from contractual escalations, net of churn;
|
|
•
|
$11.5 million generated from newly acquired or constructed sites; and
|
|
•
|
$1.0 million from other tenant billings; and
|
|
•
|
$29.0 million of other revenue growth, primarily due to a $66.4 million impact of straight-line accounting, partially offset by a $37.4 million net decrease in other revenue, primarily due to the absence of $38.8 million in decommissioning revenue recognized in the prior year.
|
Asia property segment revenue growth of
$336.8 million
was attributable to:
|
•
|
Tenant billings growth of $192.2 million, which was driven by:
|
|
•
|
$143.7 million generated from newly acquired sites, due to the Viom Acquisition;
|
|
•
|
$58.8 million due to colocations and amendments; and
|
|
•
|
$6.8 million generated from newly constructed sites;
|
|
•
|
Partially offset by,
|
|
▪
|
A decrease of $16.8 million from churn in excess of contractual escalations; and
|
|
▪
|
A decrease of $0.3 million from other tenant billings;
|
|
•
|
Pass-through revenue growth of $129.3 million, primarily due to the Viom Acquisition; and
|
|
•
|
A decrease of $20.2 million in other revenue, primarily due to an increase of $13.1 million in revenue reserves.
|
Segment revenue also increased by $35.5 million attributable to the impact of foreign currency translation related to fluctuations in INR.
EMEA property segment revenue growth of
$96.7 million
was attributable to:
|
•
|
Tenant billings growth of $99.1 million, which was driven by:
|
30
|
•
|
$62.4 million generated from newly acquired or constructed sites, primarily due to the full-year impact of the FPS Acquisition;
|
|
•
|
$17.9 million due to colocations and amendments;
|
|
•
|
$17.8 million from contractual escalations, net of churn; and
|
|
•
|
$1.0 million from other tenant billings;
|
|
•
|
Pass-through revenue growth of $35.3 million; and
|
|
•
|
$3.4 million of other revenue growth, primarily attributable to the impact of straight-line accounting.
|
Segment revenue growth was partially offset by a decrease of $41.1 million attributable to the negative impact of foreign currency translation, which included, among others, $35.0 million related to fluctuations in NGN and $14.5 million related to fluctuations in GHS, partially offset by an increase of $9.8 million related to fluctuations in South African Rand (“ZAR”).
Latin America property segment revenue growth of $183.7 million was attributable to:
|
•
|
Tenant billings growth of $92.4 million, which was driven by:
|
|
•
|
$38.9 million due to colocations and amendments;
|
|
•
|
$32.7 million from contractual escalations, net of churn;
|
|
•
|
$18.7 million generated from newly acquired or constructed sites; and
|
|
•
|
$2.1 million from other tenant billings;
|
|
•
|
Pass-through revenue growth of $22.2 million; and
|
|
•
|
$17.6 million of other revenue growth, due in part to $7.1 million from our newly acquired fiber business in Mexico and a $7.0 million reduction in revenue in the prior-year period resulting from a judicial reorganization of a tenant in Brazil, partially offset by the impact of straight-line accounting.
|
Segment revenue also increased $51.5 million attributable to the positive impact of foreign currency translation, which included, among others, $49.9 million related to fluctuations in BRL and $2.8 million related to fluctuations in Colombian Pesos (“COP”), partially offset by a decrease of $3.3 million related to fluctuations in MXN.
The increase in services segment revenue of $25.4 million was primarily attributable to an increase in site acquisition projects.
Gross Margin
|
|
Year Ended December 31,
|
Percent Change 2018 vs 2017
|
Percent Change 2017 vs 2016
|
||||||||||||||
|
|
2018
|
2017
|
2016
|
||||||||||||||
|
Property
|
|||||||||||||||||
|
U.S.
|
$
|
3,051.1
|
|
$
|
2,859.2
|
|
$
|
2,636.7
|
|
7
|
%
|
8
|
%
|
||||
|
Asia
|
829.6
|
|
515.4
|
|
361.7
|
|
61
|
|
42
|
|
|||||||
|
EMEA
|
449.2
|
|
387.9
|
|
305.8
|
|
16
|
|
27
|
|
|||||||
|
Latin America
|
858.4
|
|
794.3
|
|
658.8
|
|
8
|
|
21
|
|
|||||||
|
Total property
|
5,188.3
|
|
4,556.8
|
|
3,963.0
|
|
14
|
|
15
|
|
|||||||
|
Services
|
77.2
|
|
64.2
|
|
45.6
|
|
20
|
%
|
41
|
%
|
|||||||
Year ended December 31,
2018
|
•
|
The increase in U.S. property segment gross margin was primarily attributable to the increase in revenue described above, partially offset by an increase in direct expenses of $24.5 million.
|
|
•
|
The increase in Asia property segment gross margin was primarily attributable to the increase in revenue described above and a benefit of $36.5 million attributable to the impact of foreign currency translation on direct expenses, partially offset by an increase in direct expenses of $98.4 million, primarily due to the Vodafone Acquisition and the Idea Acquisition.
|
|
•
|
The increase in EMEA property segment gross margin was primarily attributable to the increase in revenue described above and a benefit of $9.4 million attributable to the impact of foreign currency translation on direct expenses,
|
31
partially offset by an increase in direct expenses of $9.2 million, primarily due to the FPS Acquisition and the Kenya Acquisition.
|
•
|
The increase in Latin America property segment gross margin was primarily attributable to the increase in revenue described above and a benefit of $33.3 million attributable to the impact of foreign currency translation on direct expenses, partially offset by an increase in direct expenses of $53.5 million, primarily due to our fiber businesses in Mexico and Brazil, and a reduction of $10.9 million in interest income related to TV Azteca, S.A. de C.V. (“TV Azteca”).
|
|
•
|
The increase in services segment gross margin was primarily due to an increase in revenue, as described above, partially offset by an increase in direct expenses of $14.4 million.
|
Year ended December 31,
2017
|
•
|
The increase in U.S. property segment gross margin was primarily attributable to the increase in revenue described above, partially offset by an increase in direct expenses of $13.1 million.
|
|
•
|
The increase in Asia property segment gross margin was primarily attributable to the increase in revenue described above, partially offset by an increase in direct expenses of $163.1 million, primarily due to the Viom Acquisition. Direct expenses increased by an additional $20.0 million attributable to the impact of foreign currency translation.
|
|
•
|
The increase in EMEA property segment gross margin was primarily attributable to the increase in revenue described above and a benefit of $35.1 million attributable to the impact of foreign currency translation on direct expenses, partially offset by an increase in direct expenses of $49.7 million, partially due to the FPS Acquisition.
|
|
•
|
The increase in Latin America property segment gross margin was primarily attributable to the increase in revenue described above, partially offset by an increase in direct expenses of $29.6 million, partially due to our acquisitions of urban telecommunications assets and fiber, in Mexico and Argentina. Direct expenses increased by an additional $18.6 million due to the impact of foreign currency translation.
|
|
•
|
The increase in services segment gross margin was primarily due to an increase in site acquisition projects.
|
Selling, General, Administrative and Development Expense (“SG&A”)
|
|
Year Ended December 31,
|
Percent Change 2018 vs 2017
|
Percent Change 2017 vs 2016
|
||||||||||||||
|
|
2018
|
2017
|
2016
|
||||||||||||||
|
Property
|
|||||||||||||||||
|
U.S.
|
$
|
165.2
|
|
$
|
151.4
|
|
$
|
147.6
|
|
9
|
%
|
3
|
%
|
||||
|
Asia
|
110.7
|
|
82.4
|
|
48.2
|
|
34
|
|
71
|
|
|||||||
|
EMEA
|
69.1
|
|
67.9
|
|
60.9
|
|
2
|
|
11
|
|
|||||||
|
Latin America
|
83.5
|
|
77.5
|
|
60.7
|
|
8
|
|
28
|
|
|||||||
|
Total property
|
428.5
|
|
379.2
|
|
317.4
|
|
13
|
|
19
|
|
|||||||
|
Services
|
14.4
|
|
13.7
|
|
12.5
|
|
5
|
|
10
|
|
|||||||
|
Other
|
290.3
|
|
244.1
|
|
213.5
|
|
19
|
|
14
|
|
|||||||
|
Total selling, general, administrative and development expense
|
$
|
733.2
|
|
$
|
637.0
|
|
$
|
543.4
|
|
15
|
%
|
17
|
%
|
||||
Year Ended December 31,
2018
|
•
|
The increases in each of our U.S., EMEA and Latin America property segment SG&A were primarily driven by increased personnel costs to support our business, including our acquisitions of urban telecommunications assets in our Latin America property segment.
|
32
|
•
|
The increase in our Asia property segment SG&A was primarily driven by an increase in bad debt expense of $25.1 million as a result of receivable reserves with certain tenants.
|
|
•
|
The increase in our services segment SG&A was primarily attributable to an increase in the allocation of personnel costs to our tower services group.
|
|
•
|
The increase in other SG&A was primarily attributable to an increase in stock-based compensation expense of $28.6 million, principally due to the acceleration of expense associated with amendments to existing grants, and an increase in corporate SG&A.
|
Year Ended December 31,
2017
|
•
|
The increases in each of our property segments’ SG&A were primarily driven by increased personnel costs to support our business, including additional costs as a result of the Viom Acquisition in our Asia property segment and the FPS Acquisition in our EMEA property segment. The increase in our Asia property segment SG&A was partially driven by an increase in bad debt expense of $24.6 million as a result of aged receivables with certain tenants and the increase in our EMEA property segment SG&A was partially offset by the impact of foreign currency fluctuations and a reduction in bad debt expense of $3.7 million.
|
|
•
|
The increase in our services segment SG&A was primarily attributable to an increase in personnel costs within our tower services group.
|
|
•
|
The increase in other SG&A was primarily attributable to an increase in stock-based compensation expense of $18.1 million and an increase in corporate SG&A.
|
Operating Profit
|
|
Year Ended December 31,
|
Percent Change 2018 vs 2017
|
Percent Change 2017 vs 2016
|
||||||||||||||
|
|
2018
|
2017
|
2016
|
||||||||||||||
|
Property
|
|||||||||||||||||
|
U.S.
|
$
|
2,885.9
|
|
$
|
2,707.8
|
|
$
|
2,489.1
|
|
7
|
%
|
9
|
%
|
||||
|
Asia
|
718.9
|
|
433.0
|
|
313.5
|
|
66
|
|
38
|
|
|||||||
|
EMEA
|
380.1
|
|
320.0
|
|
244.9
|
|
19
|
|
31
|
|
|||||||
|
Latin America
|
774.9
|
|
716.8
|
|
598.1
|
|
8
|
|
20
|
|
|||||||
|
Total property
|
4,759.8
|
|
4,177.6
|
|
3,645.6
|
|
14
|
|
15
|
|
|||||||
|
Services
|
62.8
|
|
50.5
|
|
33.1
|
|
24
|
%
|
53
|
%
|
|||||||
Year Ended December 31,
2018
|
•
|
The increases in operating profit for each of our property segments, as well as our services segment, were primarily attributable to an increase in our segment gross margin, partially offset by increases in our segment SG&A.
|
Year Ended December 31,
2017
|
•
|
The growth in operating profit for each of our property segments was primarily attributable to an increase in our segment gross margin, partially offset by increases in our segment SG&A.
|
|
•
|
The growth in operating profit for our services segment was primarily attributable to an increase in our segment gross margin, partially offset by an increase in our segment SG&A.
|
33
Depreciation, Amortization and Accretion
|
|
Year Ended December 31,
|
Percent Change 2018 vs 2017
|
Percent Change 2017 vs 2016
|
||||||||||||||
|
|
2018
|
2017
|
2016
|
||||||||||||||
|
Depreciation, amortization and accretion
|
$
|
2,110.8
|
|
$
|
1,715.9
|
|
$
|
1,525.6
|
|
23
|
%
|
12
|
%
|
||||
The increase in depreciation, amortization and accretion expense for the year ended December 31,
2018
was primarily attributable to
$327.5 million
of accelerated amortization of a tenant relationship intangible asset as a result of the settlement with Tata. Also contributing to the increase was the acquisition, lease or construction of new sites since the beginning of the prior-year period, which resulted in an increase in property and equipment and intangible assets subject to amortization.
The increase in depreciation, amortization and accretion expense for the year ended December 31, 2017 was primarily attributable to the acquisition, lease or construction of new sites since the beginning of the prior-year period, which resulted in an increase in property and equipment and intangible assets subject to amortization.
Other Operating Expenses
|
|
Year Ended December 31,
|
Percent Change 2018 vs 2017
|
Percent Change 2017 vs 2016
|
||||||||||||||
|
|
2018
|
2017
|
2016
|
||||||||||||||
|
Other operating expenses
|
$
|
513.3
|
|
$
|
256.0
|
|
$
|
73.3
|
|
101
|
%
|
249
|
%
|
||||
The increase in other operating expenses for the year ended December 31,
2018
was primarily attributable to an increase in impairment charges of $182.6 million and an increase of $52.8 million in losses on sales or disposals of assets. The impairment charges included $258.3 million related to tower and network intangible assets and $107.3 million related to tenant relationships in our Asia property segment due to the settlement with Tata, Aircel’s filing for bankruptcy protection and other carrier consolidation-driven churn in India. The increase was also attributable to the nonrecurrence of a $22.2 million refund of acquisition costs recorded in the prior-year period related to an acquisition in Brazil, partially offset by $10.0 million to fund our charitable foundation in the prior-year period.
The increase in other operating expenses for the year ended December 31, 2017 was primarily attributable to an increase in impairment charges of $182.9 million. These charges included $81.0 million related to tower and network intangible assets and $100.1 million related to tenant relationships in our Asia property segment, primarily due to carrier consolidation-driven churn. The increase in other operating expenses also included an increase of $7.7 million in losses on sales or disposals of assets and $10.0 million to fund our charitable foundation. These items were partially offset by aggregate purchase price refunds of $22.2 million of acquisition costs, primarily relating to an acquisition in Brazil completed in 2014.
Total Other Expense
|
|
Year Ended December 31,
|
Percent Change 2018 vs 2017
|
Percent Change 2017 vs 2016
|
||||||||||||||
|
|
2018
|
2017
|
2016
|
||||||||||||||
|
Total Other expense
|
$
|
750.4
|
|
$
|
742.3
|
|
$
|
727.1
|
|
1
|
%
|
2
|
%
|
||||
Total other expense consists primarily of interest expense and realized and unrealized foreign currency gains and losses. We record unrealized foreign currency gains or losses as a result of foreign currency fluctuations primarily associated with our intercompany notes and similar unaffiliated balances denominated in a currency other than the subsidiaries’ functional currencies.
The increase in total other expense during the year ended December 31,
2018
was primarily due to additional interest expense of $75.9 million due to a $2.0 billion increase in our average debt outstanding and foreign currency losses of
$4.5 million
in the current period, compared to foreign currency gains of $26.4 million in the prior-year period. The increase was partially offset by (i) a decrease in loss on retirement of long-term obligations of $66.9 million due to the nonrecurrence of a loss of $70.2 million recorded in the prior-year period attributable to the redemptions of the 7.25% senior unsecured notes due 2019 (the “7.25% Notes”) and the 4.500% senior unsecured notes due 2018 (the “4.500% Notes”) and the repayment of the Secured Cellular Site Revenue Notes, Series 2012-2 Class A, Series 2012-2 Class B and Series 2012-2 Class C and Secured Cellular Site Revenue Notes, Series 2010-2, Class C and Series 2010-2, Class F (collectively, the “GTP Notes”), (ii) an increase in other income of $23.4 million partially due to the write-offs of the capital lease liability and Economic Rights Agreement and related amortization in conjunction with the note extinguishment with TV Azteca (as described in note 5 to our consolidated
34
financial statements included in this Annual Report) and (iii) an additional $19.3 million in interest income, compared to the prior-year period.
The increase in total other expense during the year ended December 31, 2017 was primarily due to a loss on retirement of long-term obligations of $70.2 million attributable to the redemptions of the 7.25% Notes and the 4.500% Notes and the repayment of the GTP Notes, compared to the year ended December 31, 2016, where we recorded a gain on retirement of long-term obligations of $1.2 million attributable to the repayment of the Secured Tower Cellular Site Revenue Notes, Series 2012-1, Class A and the Secured Cellular Site Revenue Notes, Series 2010-1, Class C. The increase was also attributable to additional interest expense of $32.5 million due to a $0.9 billion increase in our average debt outstanding. These items were partially offset by foreign currency gains of $26.4 million compared to foreign currency losses of $48.9 million in the prior-year period, as well an additional $9.8 million in interest income compared to the prior-year period.
Income Tax (Benefit) Provision
|
|
Year Ended December 31,
|
Percent Change 2018 vs 2017
|
Percent Change 2017 vs 2016
|
|||||||||||||||
|
|
2018
|
2017
|
2016
|
|||||||||||||||
|
Income tax (benefit) provision
|
$
|
(110.1
|
)
|
$
|
30.7
|
|
$
|
155.5
|
|
(459
|
)%
|
(80
|
)%
|
|||||
|
Effective tax rate
|
(9.5
|
)%
|
2.4
|
%
|
13.8
|
%
|
||||||||||||
As a REIT, we may deduct earnings distributed to stockholders against the income generated by our REIT operations. In addition, we are able to offset certain income by utilizing our NOLs, subject to specified limitations. Consequently, the effective tax rate on income from continuing operations for each of the years ended December 31,
2018
,
2017
and 2016 differs from the federal statutory rate.
The change in the income tax (benefit) provision for the year ended December 31,
2018
was primarily attributable to the receipt of the payment associated with the Tata settlement, offset by the deferred tax benefit of impairment charges and accelerated amortization in India. Additionally, we restructured our international operations in certain jurisdictions resulting in a current-year benefit of $85.7 million, which was offset by the nonrecurrence of prior-year benefit from a clarification in income tax law in Ghana.
The decrease in the income tax provision for the year ended December 31, 2017 was primarily attributable to lower uncertain tax position reserve recorded in 2017 than in 2016, a decrease in foreign earnings in India due to impairments, as well as changes in tax laws in certain foreign jurisdictions.
Net Income / Adjusted EBITDA and Net Income / Nareit FFO attributable to American Tower Corporation common stockholders / Consolidated AFFO / AFFO attributable to American Tower Corporation common stockholders
|
|
Year Ended December 31,
|
Percent Change 2018 vs 2017
|
Percent Change 2017 vs 2016
|
|||||||||||||||
|
|
2018
|
2017
|
2016
|
|||||||||||||||
|
Net income
|
$
|
1,264.7
|
|
$
|
1,225.4
|
|
$
|
970.4
|
|
3
|
%
|
26
|
%
|
|||||
|
Income tax (benefit) provision
|
(110.1
|
)
|
30.7
|
|
155.5
|
|
(459
|
)
|
(80
|
)
|
||||||||
|
Other (income) expense
|
(23.8
|
)
|
(31.3
|
)
|
47.7
|
|
(24
|
)
|
(166
|
)
|
||||||||
|
Loss (gain) on retirement of long-term obligations
|
3.3
|
|
70.2
|
|
(1.2
|
)
|
(95
|
)
|
(5,950
|
)
|
||||||||
|
Interest expense
|
825.5
|
|
749.6
|
|
717.1
|
|
10
|
|
5
|
|
||||||||
|
Interest income
|
(54.7
|
)
|
(35.4
|
)
|
(25.6
|
)
|
55
|
|
38
|
|
||||||||
|
Other operating expenses
|
513.3
|
|
256.0
|
|
73.3
|
|
101
|
|
249
|
|
||||||||
|
Depreciation, amortization and accretion
|
2,110.8
|
|
1,715.9
|
|
1,525.6
|
|
23
|
|
12
|
|
||||||||
|
Stock-based compensation expense
|
137.5
|
|
108.5
|
|
89.9
|
|
27
|
|
21
|
|
||||||||
|
Adjusted EBITDA
|
$
|
4,666.5
|
|
$
|
4,089.6
|
|
$
|
3,552.7
|
|
14
|
%
|
15
|
%
|
|||||
35
|
|
Year Ended December 31,
|
Percent Change 2018 vs 2017
|
Percent Change 2017 vs 2016
|
||||||||||||||
|
|
2018
|
2017
|
2016
|
||||||||||||||
|
Net income
|
$
|
1,264.7
|
|
$
|
1,225.4
|
|
$
|
970.4
|
|
3
|
%
|
26
|
%
|
||||
|
Real estate related depreciation, amortization and accretion
|
1,915.2
|
|
1,516.9
|
|
1,358.9
|
|
26
|
|
12
|
|
|||||||
|
Losses from sale or disposal of real estate and real estate related impairment charges (1)
|
479.7
|
|
244.4
|
|
54.5
|
|
96
|
|
348
|
|
|||||||
|
Dividends on preferred stock
|
(9.4
|
)
|
(87.4
|
)
|
(107.1
|
)
|
(89
|
)
|
(18
|
)
|
|||||||
|
Dividend to noncontrolling interest
|
(13.8
|
)
|
(13.2
|
)
|
—
|
|
5
|
|
100
|
|
|||||||
|
Adjustments for unconsolidated affiliates and noncontrolling interests
|
(427.4
|
)
|
(189.1
|
)
|
(88.2
|
)
|
126
|
|
114
|
|
|||||||
|
Nareit FFO attributable to American Tower Corporation common stockholders
|
$
|
3,209.0
|
|
$
|
2,697.0
|
|
$
|
2,188.5
|
|
19
|
|
23
|
|
||||
|
Straight-line revenue
|
(87.6
|
)
|
(194.4
|
)
|
(131.7
|
)
|
(55
|
)
|
48
|
|
|||||||
|
Straight-line expense
|
57.9
|
|
62.3
|
|
67.8
|
|
(7
|
)
|
(8
|
)
|
|||||||
|
Stock-based compensation expense
|
137.5
|
|
108.5
|
|
89.9
|
|
27
|
|
21
|
|
|||||||
|
Deferred portion of income tax (2)
|
(274.0
|
)
|
(105.8
|
)
|
59.2
|
|
159
|
|
(279
|
)
|
|||||||
|
Non-real estate related depreciation, amortization and accretion
|
195.6
|
|
199.0
|
|
166.7
|
|
(2
|
)
|
19
|
|
|||||||
|
Amortization of deferred financing costs, capitalized interest, debt discounts and premiums and long-term deferred interest charges
|
19.0
|
|
26.8
|
|
23.1
|
|
(29
|
)
|
16
|
|
|||||||
|
Other (income) expense (3)
|
(23.8
|
)
|
(31.3
|
)
|
47.7
|
|
(24
|
)
|
(166
|
)
|
|||||||
|
Loss (gain) on retirement of long-term obligations
|
3.3
|
|
70.2
|
|
(1.2
|
)
|
(95
|
)
|
(5,950
|
)
|
|||||||
|
Other operating expenses (4)
|
33.6
|
|
11.6
|
|
18.8
|
|
190
|
|
(38
|
)
|
|||||||
|
Capital improvement capital expenditures
|
(149.5
|
)
|
(114.2
|
)
|
(110.2
|
)
|
31
|
|
4
|
|
|||||||
|
Corporate capital expenditures
|
(9.2
|
)
|
(17.0
|
)
|
(16.4
|
)
|
(46
|
)
|
4
|
|
|||||||
|
Adjustments for unconsolidated affiliates and noncontrolling interests
|
427.4
|
|
189.1
|
|
88.2
|
|
126
|
|
114
|
|
|||||||
|
Consolidated AFFO
|
$
|
3,539.2
|
|
$
|
2,901.8
|
|
$
|
2,490.4
|
|
22
|
%
|
17
|
%
|
||||
|
Adjustments for unconsolidated affiliates and noncontrolling interests (5)
|
(348.7
|
)
|
(147.0
|
)
|
(90.2
|
)
|
137
|
%
|
63
|
%
|
|||||||
|
AFFO attributable to American Tower Corporation common stockholders
|
$
|
3,190.5
|
|
$
|
2,754.8
|
|
|
$
|
2,400.2
|
|
16
|
%
|
15
|
%
|
|||
_______________
|
(1)
|
Included in these amounts are impairment charges of
$394.0 million
,
$211.4 million
and
$28.5 million
for the years ended
December 31, 2018
,
2017
and
2016
, respectively.
|
|
(2)
|
For the year ended December 31, 2018, amount includes a tax benefit primarily attributable to the tax effect of an increase in impairment charges and a one-time benefit for restructuring-related activity in foreign jurisdictions offset by the nonrecurrence of prior-year benefit from a clarification in income tax law in Ghana.
|
|
(3)
|
Includes losses (gains) on foreign currency exchange rate fluctuations of
$4.5 million
, ($26.4 million) and $48.9 million, respectively.
|
|
(4)
|
Primarily includes acquisition-related costs and integration costs. For the year ended December 31, 2017, amount also includes refunds for acquisition costs and a charitable contribution.
|
|
(5)
|
Includes adjustments for the impact on both Nareit FFO attributable to American Tower Corporation common stockholders as well as the other line items included in the calculation of Consolidated AFFO.
|
Year Ended December 31,
2018
The increase in net income was primarily due to an increase in our operating profit, the change in the income tax (benefit) provision and the nonrecurrence of a loss on retirement of long-term obligations of $70.2 million recorded in the prior-year period, partially offset by an increase in other operating expenses, primarily related to an increase in impairment charges of $182.6 million, and increases in depreciation, amortization and accretion expense and interest expense.
The increase in Adjusted EBITDA was primarily attributable to the increase in our gross margin and was partially offset by an increase in SG&A of $67.6 million, excluding the impact of stock-based compensation expense.
36
The growth in Consolidated AFFO and AFFO attributable to American Tower Corporation common stockholders was primarily attributable to the increase in our operating profit, a decrease in dividends on preferred stock and a decrease in the adjustment for straight-line revenue, partially offset by increases in cash paid for interest, capital improvement capital expenditures and corporate SG&A.
Year Ended December 31,
2017
The increase in net income was primarily due to an increase in our operating profit, decreases in our income tax provision and foreign currency losses included in other expense, partially offset by an increase in depreciation, amortization and accretion expense, and increases in other operating expenses, interest expense and a loss on retirement of long-term obligations of $70.2 million.
The increase in Adjusted EBITDA was primarily attributable to the increase in our gross margin and was partially offset by an increase in SG&A of $75.5 million, excluding the impact of stock-based compensation expense.
The growth in Consolidated AFFO and AFFO attributable to American Tower Corporation common stockholders was primarily attributable to the increase in our operating profit and a decrease in dividends on preferred stock, partially offset by increases in straight-line revenue, cash paid for interest and income taxes and corporate SG&A and capital improvement expenditures.
37
Liquidity and Capital Resources
Overview
During the year ended December 31,
2018
, we increased our financial flexibility and our ability to grow our business while maintaining our long-term financial policies. Our significant
2018
financing transactions included:
|
•
|
A registered public offering of an aggregate of 500.0 million EUR ($589.0 million at the date of issuance) of 1.950% senior unsecured notes due 2026 (the “1.950% Notes”).
|
|
•
|
Senior unsecured $1.5 billion term loan (the “2018 Term Loan”).
|
|
•
|
Securitization transactions, including the repayment of the $500.0 million aggregate principal amount outstanding under the Secured Tower Revenue Securities, Series 2013-1A (the “Series 2013-1A Securities”) and the issuance of $500.0 million aggregate principal amount of Secured Tower Revenue Securities, Series 2018-1, Subclass A (the “Series 2018-1A Securities”).
|
|
•
|
Amendments to our multicurrency senior unsecured revolving credit facility entered into in June 2013, as amended (the “2013 Credit Facility”), our senior unsecured revolving credit facility entered into in January 2012, as amended and restated in September 2014, as further amended (the “2014 Credit Facility”) and our unsecured term loan entered into in October 2013, as amended (the “2013 Term Loan”) to, among other things, extend each of the maturity dates by one year, increase commitments under each of the 2013 Credit Facility and the 2014 Credit Facility by $100.0 million and reduce the Applicable Margins under the 2014 Credit Facility and the 2013 Term Loan (as defined in each of the applicable loan agreements) to conform to the 2013 Credit Facility.
|
As a holding company, our cash flows are derived primarily from the operations of, and distributions from, our operating subsidiaries or funds raised through borrowings under our credit facilities and debt or equity offerings.
The following table summarizes our liquidity as of December 31,
2018
(in millions):
|
Available under the 2013 Credit Facility
|
$
|
975.0
|
|
|
Available under the 2014 Credit Facility
|
2,100.0
|
|
|
|
Letters of credit
|
(10.0
|
)
|
|
|
Total available under credit facilities, net
|
3,065.0
|
|
|
|
Cash and cash equivalents
|
1,208.7
|
|
|
|
Total liquidity
|
$
|
4,273.7
|
|
Subsequent to
December 31, 2018
, we borrowed an additional $570.0 million under the 2013 Credit Facility and $605.0 million under the 2014 Credit Facility, which were primarily used to repay indebtedness, including the 3.40% notes due 2019, and for general corporate purposes.
Summary cash flow information is set forth below for the years ended December 31, (in millions):
|
|
2018
|
2017
|
2016
|
||||||||
|
Net cash provided by (used for):
|
|||||||||||
|
Operating activities
|
$
|
3,748.3
|
|
$
|
2,925.6
|
|
$
|
2,701.7
|
|
||
|
Investing activities
|
(2,749.5
|
)
|
(2,800.9
|
)
|
(2,102.3
|
)
|
|||||
|
Financing activities
|
(607.7
|
)
|
(113.0
|
)
|
(99.3
|
)
|
|||||
|
Net effect of changes in foreign currency exchange rates on cash and cash equivalents, and restricted cash
|
(41.1
|
)
|
6.7
|
|
(26.5
|
)
|
|||||
|
Net increase in cash and cash equivalents, and restricted cash
|
$
|
350.0
|
|
$
|
18.4
|
|
$
|
473.6
|
|
||
We use our cash flows to fund our operations and investments in our business, including tower maintenance and improvements, communications site construction and managed network installations and tower and land acquisitions. Additionally, we use our cash flows to make distributions, including distributions of our REIT taxable income to maintain our qualification for taxation as a REIT under the Code. We may also repay or repurchase our existing indebtedness or equity from time to time. We typically fund our international expansion efforts primarily through a combination of cash on hand, intercompany debt and equity contributions. In the fourth quarter of 2018, two of our minority holders in India exercised their put options with respect to certain shares in our Indian subsidiary, ATC TIPL in accordance with the provisions in the
38
shareholder agreement (see note 14 to our consolidated financial statements included in this Annual Report). Accordingly, we expect to pay 29.4 billion INR (approximately
$420.0 million
) to redeem the put shares in the first half of 2019.
As of December 31,
2018
, we had total outstanding indebtedness of
$21.3 billion
, with a current portion of
$2.8 billion
. During the year ended December 31,
2018
, we generated sufficient cash flow from operations to fund our capital expenditures and debt service obligations, as well as our required distributions. We believe the cash generated by operating activities during the year ending December 31,
2019
, together with our borrowing capacity under our credit facilities, will be sufficient to fund our required distributions, capital expenditures, debt service obligations (interest and principal repayments) and signed acquisitions. As of December 31,
2018
, we had
$1.1 billion
of cash and cash equivalents held by our foreign subsidiaries, of which
$711.6 million
was held by our joint ventures. While certain subsidiaries may pay us interest or principal on intercompany debt, it has not been our practice to repatriate earnings from our foreign subsidiaries primarily due to our ongoing expansion efforts and related capital needs. However, in the event that we do repatriate any funds, we may be required to accrue and pay certain taxes.
Cash Flows from Operating Activities
For the
year ended December 31, 2018
, cash provided by operating activities increased
$822.7 million
as compared to the year ended December 31, 2017. The primary factors that impacted cash provided by operating activities as compared to the year ended December 31, 2017, include:
|
•
|
An increase in our operating profit of
$594.5 million
;
|
|
•
|
An increase of approximately
$77.6 million
in cash paid for interest;
|
|
•
|
A decrease in cash required for working capital, primarily as a result of accounts receivable collection; and
|
|
•
|
An increase of approximately
$27.4 million
in cash paid for taxes.
|
For the year ended December 31, 2017, cash provided by operating activities increased $223.9 million as compared to the year ended December 31, 2016. The primary factors that impacted cash provided by operating activities as compared to the year ended December 31, 2016, include:
|
•
|
An increase in our operating profit of $549.4 million;
|
|
•
|
An increase of approximately $67.0 million in cash paid for interest;
|
|
•
|
An increase of approximately $62.7 million in straight-line revenue; and
|
|
•
|
An increase of approximately $40.3 million in cash paid for taxes.
|
Cash Flows from Investing Activities
Our significant investing activities during the
year ended December 31, 2018
are highlighted below:
|
•
|
We spent approximately
$1.9 billion
for acquisitions, primarily related to the funding of the Idea and Vodafone acquisitions, as well as asset acquisitions in the United States, Kenya and Brazil.
|
|
•
|
We spent
$937.1 million
for capital expenditures, as follows (in millions):
|
|
Discretionary capital projects (1)
|
$
|
254.7
|
|
|
Ground lease purchases
|
162.7
|
|
|
|
Capital improvements and corporate expenditures (2)
|
158.7
|
|
|
|
Redevelopment
|
232.4
|
|
|
|
Start-up capital projects
|
128.6
|
|
|
|
Total capital expenditures (3)
|
$
|
937.1
|
|
|
(1)
|
Includes the construction of
2,441
communications sites globally.
|
|
(2)
|
Includes
$32.0 million
of capital lease payments included in Repayments of notes payable, credit facilities, senior notes, term loan and capital leases in the cash flow from financing activities in our consolidated statements of cash flows.
|
|
(3)
|
Net of purchase credits of
$8.1 million
on certain assets, which are reported in operating activities in our consolidated statements of cash flows.
|
Our significant investing transactions in 2017 included the following:
|
•
|
We spent approximately $2.0 billion for acquisitions, primarily related to the funding of the FPS Acquisition, as well as tower acquisitions in the United States, and the acquisition of urban telecommunication assets in Mexico.
|
39
|
•
|
We spent $824.2 million for capital expenditures, as follows (in millions):
|
|
Discretionary capital projects (1)
|
$
|
170.0
|
|
|
Ground lease purchases
|
131.2
|
|
|
|
Capital improvements and corporate expenditures (2)
|
131.2
|
|
|
|
Redevelopment
|
204.5
|
|
|
|
Start-up capital projects
|
187.3
|
|
|
|
Total capital expenditures
|
$
|
824.2
|
|
|
(1)
|
Includes the construction of 1,960 communications sites globally.
|
|
(2)
|
Includes $31.8 million of capital lease payments included in Repayments of notes payable, credit facilities, term loan, senior notes, secured debt and capital leases in the cash flow from financing activities in our consolidated statement of cash flows.
|
|
(3)
|
Net of purchase credits of $11.2 million on certain assets, which are reported in operating activities in our consolidated statements of cash flows.
|
We plan to continue to allocate our available capital, after satisfying our distribution requirements, among investment alternatives that meet our return on investment criteria, while maintaining our commitment to our long-term financial policies. Accordingly, we expect to continue to deploy capital through our annual capital expenditure program, including land purchases and new site construction, and through acquisitions. We also regularly review our tower portfolios as to capital expenditures required to upgrade our towers to our structural standards or address capacity, structural or permitting issues. In 2018, we conducted a review as to whether any additional capital was required for such upgrades and determined that our capital planning was appropriate.
We expect that our
2019
total capital expenditures will be between
$900.0 million
and
$1.0 billion
, as follows (in millions):
|
Discretionary capital projects (1)
|
$
|
265
|
|
to
|
$
|
305
|
|
|
Ground lease purchases
|
150
|
|
to
|
160
|
|
||
|
Capital improvements and corporate expenditures
|
160
|
|
to
|
180
|
|
||
|
Redevelopment
|
255
|
|
to
|
265
|
|
||
|
Start-up capital projects
|
70
|
|
to
|
90
|
|
||
|
Total capital expenditures
|
$
|
900
|
|
to
|
$
|
1,000
|
|
_______________
|
(1)
|
Includes the construction of approximately
2,500
to
3,500
communications sites globally.
|
Cash Flows from Financing Activities
Our significant financing activities were as follows (in millions):
|
Year ended December 31,
|
|||||||||||
|
2018
|
2017
|
2016
|
|||||||||
|
Proceeds from issuance of senior notes, net
|
$
|
584.9
|
|
$
|
2,674.0
|
|
$
|
3,236.4
|
|
||
|
(Repayments of) proceeds from credit facilities, net
|
(695.9
|
)
|
628.6
|
|
(1,277.1
|
)
|
|||||
|
Distributions paid on common and preferred stock
|
(1,342.4
|
)
|
(1,164.4
|
)
|
(993.2
|
)
|
|||||
|
Purchases of common stock
|
(232.8
|
)
|
(766.3
|
)
|
—
|
|
|||||
|
Repayments of securitized debt
|
(500.0
|
)
|
(302.5
|
)
|
(161.1
|
)
|
|||||
|
(Distributions to) contributions from noncontrolling interest holders, net (1)
|
(14.4
|
)
|
264.3
|
|
238.5
|
|
|||||
|
Repayment of senior notes
|
—
|
|
(1,300.0
|
)
|
—
|
|
|||||
|
Proceeds from (repayments of) term loan
|
1,500.0
|
|
—
|
|
(1,000.0
|
)
|
|||||
|
Proceeds from issuance of securities in securitization transaction
|
500.0
|
|
—
|
|
—
|
|
|||||
_______________
40
(1) 2017 contributions primarily relate to the funding of the FPS Acquisition.
Senior Notes
1.950%
Senior Notes Offering.
On May 22, 2018, we completed a registered public offering of
500.0 million
EUR (
$589.0 million
at the date of issuance) aggregate principal amount of the
1.950%
Notes. The net proceeds from this offering were approximately
493.2 million
EUR (approximately
$581.0 million
at the date of issuance), after deducting commissions and estimated expenses. We used the net proceeds to repay existing indebtedness under the 2013 Credit Facility.
The
1.950%
Notes will mature on May 22, 2026 and bear interest at a rate of
1.950%
per annum. Accrued and unpaid interest on the
1.950%
Notes will be payable in EUR in arrears on May 22 of each year, beginning on May 22, 2019. Interest on the
1.950%
Notes will be computed on the basis of the actual number of days in the period for which interest is being calculated and the actual number of days from and including the last date on which interest was paid on the
1.950%
Notes and commenced accruing on May 22, 2018.
We may redeem the
1.950%
Notes at any time, in whole or in part, at a redemption price equal to
100%
of the principal amount of the notes plus a make-whole premium, together with accrued interest to the redemption date. If we redeem the
1.950%
Notes on or after February 22, 2026, we will not be required to pay a make-whole premium. In addition, if we undergo a change of control and corresponding ratings decline, each as defined in the supplemental indenture, we may be required to repurchase all of the notes at a purchase price equal to
101%
of the principal amount of such notes, plus accrued and unpaid interest (including additional interest, if any), up to but not including the repurchase date. The notes rank equally with all of our other senior unsecured debt and are structurally subordinated to all existing and future indebtedness and other obligations of our subsidiaries.
The supplemental indenture contains certain covenants that restrict our ability to merge, consolidate or sell assets and our (together with our subsidiaries’) ability to incur liens. These covenants are subject to a number of exceptions, including that we and our subsidiaries may incur certain liens on assets, mortgages or other liens securing indebtedness if the aggregate amount of such liens does not exceed
3.5
x Adjusted EBITDA, as defined in the supplemental indenture.
Securitizations
Repayment of Series 2013-1A Securities
. On the March 2018 payment date, we repaid the $500.0 million aggregate principal amount outstanding under the Series 2013-1A Securities, pursuant to the terms of the agreements governing such securities. The repayment was funded with borrowings under the 2014 Credit Facility and cash on hand.
Secured Tower Revenue Securities, Series 2018-1, Subclass A and Series 2018-1, Subclass R
. On March 29, 2018, we completed the 2018 Securitization in which the American Tower Trust I (the “Trust”) issued $500.0 million aggregate principal amount of the Series 2018-1A Securities. To satisfy the applicable risk retention requirements of Regulation RR promulgated under the Exchange Act (such requirements, the “Risk Retention Rules”), the Trust issued, and one of our affiliates purchased, $26.4 million aggregate principal amount of Secured Tower Revenue Securities, Series 2018-1, Subclass R (the “Series 2018-1R Securities” and, together with the Series 2018-1A Securities, the “2018 Securities”) to retain an “eligible horizontal residual interest” (as defined in the Risk Retention Rules) in an amount equal to at least 5% of the fair value of the 2018 Securities.
The assets of the Trust consist of a nonrecourse loan (the “Loan”) made by the Trust to American Tower Asset Sub, LLC and American Tower Asset Sub II, LLC (together, the “AMT Asset Subs”). The AMT Asset Subs are jointly and severally liable under the Loan, which is secured primarily by mortgages on the AMT Asset Subs’ interests in
5,116
broadcast and wireless communications towers and related assets (the “Trust Sites”).
The 2018 Securities correspond to components of the Loan made to the AMT Asset Subs pursuant to the Second Amended and Restated Loan and Security Agreement among the Trust and the AMT Asset Subs, dated as of March 29, 2018 (the “Loan Agreement”) and were issued in two separate subclasses of the same series. The 2018 Securities represent a pass-through interest in the components of the Loan corresponding to the 2018 Securities. The Series 2018-1A Securities have an interest rate of 3.652% and the Series 2018-1R Securities have an interest rate of 4.459%. The 2018 Securities have an expected life of approximately ten years with a final repayment date in March 2048.
The AMT Asset Subs may prepay the Loan in whole or in part at any time provided it is accompanied by applicable prepayment consideration. If the prepayment occurs within 36 months of the anticipated repayment date for the component of
41
the Loan corresponding to the 2018 Securities, no prepayment consideration is due. The entire unpaid principal balance of the components of the Loan corresponding to the 2018 Securities will be due in March 2048.
The Loan is secured by (1) mortgages, deeds of trust and deeds to secure debt on substantially all of the Trust Sites and their operating cash flows, (2) a security interest in substantially all of the AMT Asset Subs’ personal property and fixtures and (3) the AMT Asset Subs’ rights under that certain management agreement among the AMT Asset Subs and SpectraSite Communications, LLC entered into in March 2013. American Tower Holding Sub, LLC (the “Guarantor”), whose only material assets are its equity interests in each of the AMT Asset Subs, and American Tower Guarantor Sub, LLC whose only material asset is its equity interests in the Guarantor, have each guaranteed repayment of the Loan and pledged their equity interests in their respective subsidiary or subsidiaries as security for such payment obligations.
The Secured Tower Revenue Securities, Series 2013-2A (the “Series 2013-2A Securities”) issued in the 2013 Securitization remain outstanding and are subject to the terms of the Second Amended and Restated Trust and Servicing Agreement entered into in connection with the 2018 Securitization. The component of the Loan corresponding to the Series 2013-2A Securities also remains outstanding and is subject to the terms of the Loan Agreement.
For more information regarding the Trust Securitizations, see “—Factors Affecting Sources of Liquidity” below.
Bank Facilities
On November 28, 2018, we entered into amendment agreements with respect to the 2013 Credit Facility, the 2014 Credit Facility and the 2013 Term Loan, which, among other things, (i) extend the maturity dates by one year to June 28, 2022, January 31, 2024 and January 31, 2024, respectively, (ii) increase the commitments under each of the 2013 Credit Facility and the 2014 Credit Facility by $100.0 million to $2.85 billion and $2.1 billion, respectively, (iii) increase the maximum Revolving Loan Commitments, after giving effect to any Incremental Commitments (each as defined in the applicable loan agreement) to $4.5 billion and $3.25 billion under the 2013 Credit Facility and the 2014 Credit Facility, respectively, (iv) amend the limitation on indebtedness of, and guaranteed by, our subsidiaries to the greater of (x) $2.5 billion and (y) 50% of Adjusted EBITDA (as defined in the applicable loan agreement) of us and our subsidiaries on a consolidated basis, (v) increase the threshold for certain defaults with respect to judgments, attachments or acceleration of indebtedness from $300.0 million to $400.0 million and (vi) add provisions regarding the establishment of an alternative rate of interest in the event that LIBOR is no longer available. In addition, the amendments to the 2014 Credit Facility and the 2013 Term Loan reduce the Applicable Margins (as defined in the applicable loan agreement) to conform to the Applicable Margins in the 2013 Credit Facility (as defined therein).
2013 Credit Facility.
We have the ability to borrow up to
$2.85 billion
under the 2013 Credit Facility, which includes a
$1.0 billion
sublimit for multicurrency borrowings, a
$200.0 million
sublimit for letters of credit and a
$50.0 million
sublimit for swingline loans. During the year ended
December 31, 2018
, we borrowed an aggregate of
$2.1 billion
and repaid an aggregate of
$2.3 billion
of revolving indebtedness. We used the borrowings to fund acquisitions, repay existing indebtedness and for general corporate purposes. We currently have
$3.8 million
of undrawn letters of credit and maintain the ability to draw down and repay amounts under the 2013 Credit Facility in the ordinary course.
2014 Credit Facility.
We have the ability to borrow up to
$2.1 billion
under the 2014 Credit Facility, which includes a
$200.0 million
sublimit for letters of credit and a
$50.0 million
sublimit for swingline loans. During the year ended
December 31, 2018
, we borrowed an aggregate of
$1.1 billion
and repaid an aggregate of
$1.5 billion
of revolving indebtedness. We used the borrowings to repay existing indebtedness, including the Series 2013-1A Securities, to fund acquisitions and for general corporate purposes.
We currently have
$6.2 million
of undrawn letters of credit and maintain the ability to draw down and repay amounts under the 2014 Credit Facility in the ordinary course.
2018 Term Loan.
On March 29, 2018, we entered into the 2018 Term Loan, the net proceeds of which were used to repay $1.1 billion of outstanding indebtedness under the 2013 Credit Facility and $445.0 million of outstanding indebtedness under the 2014 Credit Facility. The 2018 Term Loan had a maturity date of March 29, 2019. On February 14, 2019, we repaid all amounts outstanding under the 2018 Term Loan with proceeds from the 2019 Term Loan (as defined below) and cash on hand.
As of
December 31, 2018
, the key terms under the 2013 Credit Facility, the 2014 Credit Facility, the 2013 Term Loan and the 2018 Term Loan were as follows:
42
|
Bank Facility (1)
|
Outstanding Principal Balance
|
Maturity Date
|
LIBOR borrowing interest rate range (2)
|
Base rate borrowing interest rate range (2)
|
Current margin over LIBOR and the base rate, respectively
|
|||
|
2013 Credit Facility
|
$
|
1,875.0
|
|
June 28, 2022
|
(3)
|
0.875% - 1.750%
|
0.000% - 0.750%
|
1.125% and 0.125%
|
|
2014 Credit Facility
|
$
|
—
|
|
January 31, 2024
|
(3)
|
0.875% - 1.750%
|
0.000% - 0.750%
|
1.125% and 0.125%
|
|
2013 Term Loan
|
$
|
1,000.0
|
|
January 31, 2024
|
0.875% - 1.750%
|
0.000% - 0.750%
|
1.125% and 0.125%
|
|
|
2018 Term Loan
|
$
|
1,500.0
|
|
March 29, 2019
|
0.625% - 1.500%
|
0.000% - 0.500%
|
0.875% and 0.000%
|
|
_______________
(1) Currently borrowed at LIBOR.
|
(2)
|
Represents interest rate above LIBOR for LIBOR based borrowings and the interest rate above the defined base rate for base rate borrowings, in each case based on our debt ratings.
|
|
(3)
|
Subject to two optional renewal periods.
|
The 2013 Credit Facility and the 2014 Credit Facility are subject to two optional renewal periods and we must pay a quarterly commitment fee on the undrawn portion of each facility. The commitment fee for the 2013 Credit Facility and the 2014 Credit Facility ranges from 0.100% to 0.350% per annum, based upon our debt ratings, and is currently
0.125%
.
2019 Term Loan
. On February 14, 2019, we entered into a $1.3 billion unsecured term loan (the “2019 Term Loan”), the net proceeds of which were used to repay outstanding indebtedness under the 2018 Term Loan. The 2019 Term Loan matures on February 13, 2020 and has an interest rate that ranges between 0.550% and 1.375% above LIBOR for LIBOR based borrowings or up to 0.375% above the defined base rate for base rate borrowings, in each case based upon our debt ratings. The current margin over LIBOR for the 2019 Term Loan is 0.800%. Any outstanding principal and accrued but unpaid interest will be due and payable in full at maturity.
The 2013 Credit Facility, the 2014 Credit Facility, the 2013 Term Loan and the 2019 Term Loan do not require amortization of principal and may be paid prior to maturity in whole or in part at our option without penalty or premium. We have the option of choosing either a defined base rate or the LIBOR as the applicable base rate for borrowings under these bank facilities.
The loan agreements for each of the 2013 Credit Facility, the 2014 Credit Facility, the 2013 Term Loan and the 2019 Term Loan contain certain reporting, information, financial and operating covenants and other restrictions (including limitations on additional debt, guaranties, sales of assets and liens) with which we must comply. Failure to comply with the financial and operating covenants of the loan agreements could not only prevent us from being able to borrow additional funds under the revolving credit facilities, but may constitute a default, which could result in, among other things, the amounts outstanding, including all accrued interest and unpaid fees, becoming immediately due and payable.
India Indebtedness.
Amounts outstanding and key terms of the India indebtedness consisted of the following as of
December 31, 2018
(in millions, except percentages):
|
Amount Outstanding (INR)
|
Amount Outstanding (USD)
|
Interest Rate (Range)
|
Maturity Date (Range)
|
|||||||||
|
Term loans (1)
|
16,751
|
|
$
|
240.1
|
|
8.75% - 8.95%
|
January 1, 2019 - November 30, 2024
|
|||||
|
Working capital facilities
(2)
|
—
|
|
$
|
—
|
|
8.40% - 8.75%
|
March 18, 2019 - October 23, 2019
|
|||||
_______________
|
(1)
|
In January 2019, we repaid approximately
5.0 billion
INR ($
72.0 million
) of India indebtedness.
|
|
(2)
|
5.7 billion
INR (
$81.8 million
) of borrowing capacity as of December 31, 2018.
|
The India indebtedness includes several term loans, with maturities ranging from one to ten years, which are generally secured by the borrower’s short-term and long-term assets. Each of the term loans bear interest at the applicable bank’s Marginal Cost of Funds based Lending Rate (as defined in the applicable agreement), plus a spread. Interest rates on the term loans are fixed until certain reset dates. Generally, the term loans can be repaid without penalty on the reset dates; repayments at dates other than the reset dates are subject to prepayment penalties, typically of
1%
to
2%
. Scheduled repayment terms include either ratable or staggered amortization with repayments typically commencing between six and thirty-six months after the initial disbursement of funds.
The India indebtedness also includes several working capital facilities, most of which are subject to annual renewal, and which are generally secured by the borrower’s short-term and long-term assets. The working capital facilities bear interest at rates that consist of the applicable bank’s Marginal Cost of Funds based Lending Rate (as defined in the applicable agreement), plus a spread. Generally, the working capital facilities are payable on demand prior to maturity.
43
Stock Repurchase Programs.
We have two stock repurchase programs, the 2011 Buyback and the 2017 Buyback.
During the
year ended December 31, 2018
, we repurchased
1,647,489
shares of our common stock under the 2011 Buyback for an aggregate of
$232.8 million
, including commissions and fees. We had no repurchases under the 2017 Buyback.
Under each program, we are authorized to purchase shares from time to time through open market purchases, in privately negotiated transactions not to exceed market prices, and (with respect to such open market purchases) pursuant to plans adopted in accordance with Rule 10b5-1 under the Exchange Act in accordance with securities laws and other legal requirements, and subject to market conditions and other factors.
We expect to continue managing the pacing of the remaining $2.1 billion under the Buyback Programs in response to general market conditions and other relevant factors. We expect to fund further repurchases of our common stock through a combination of cash on hand, cash generated by operations and borrowings under our credit facilities. Purchases under the Buyback Programs are subject to us having available cash to fund repurchases.
Sales of Equity Securities.
We receive proceeds from sales of our equity securities pursuant to our employee stock purchase plan (the “ESPP”) and upon exercise of stock options granted under our equity incentive plans. For the
year ended December 31, 2018
, we received an aggregate of
$98.9 million
in proceeds upon exercises of stock options and sales pursuant to the ESPP.
Distributions.
As a REIT, we must annually distribute to our stockholders an amount equal to at least 90% of our REIT taxable income (determined before the deduction for distributed earnings and excluding any net capital gain). Generally, we have distributed, and expect to continue to distribute, all or substantially all of our REIT taxable income after taking into consideration our utilization of NOLs. We have distributed an aggregate of approximately
$5.7 billion
to our common stockholders, including the dividend paid in January 2019, primarily classified as ordinary income that may be treated as qualified REIT dividends under Section 199A of the Code for taxable years ending after 2017 and before 2026.
The amount, timing and frequency of future distributions will be at the sole discretion of our Board of Directors and will depend on various factors, a number of which may be beyond our control, including our financial condition and operating cash flows, the amount required to maintain our qualification for taxation as a REIT and reduce any income and excise taxes that we otherwise would be required to pay, limitations on distributions in our existing and future debt and preferred equity instruments, our ability to utilize NOLs to offset our distribution requirements, limitations on our ability to fund distributions using cash generated through our TRSs and other factors that our Board of Directors may deem relevant.
In March 2015, we issued 5.50% Mandatory Convertible Preferred Stock, Series B (the “Series B Preferred Stock”) with a dividend rate of 5.50%. Dividends were payable quarterly in arrears, subject to declaration by our Board of Directors. On February 15, 2018, we paid the final dividend of $13.75 per share, or $18.9 million, to holders of the Series B Preferred Stock of record at the close of business on February 1, 2018. On February 15, 2018, all outstanding shares of the Series B Preferred Stock converted at a rate of
8.7420
per share of Series B Preferred Stock, or
0.8742
per depositary share, each representing a 1/10th interest in a share of Series B Preferred Stock, into shares of our common stock pursuant to the provisions of the Certificate of Designations governing the Series B Preferred Stock. As a result of the conversions of the Series B Preferred Stock in 2018, we issued an aggregate of
12,020,064
shares of our common stock.
During the year ended
December 31, 2018
, we paid
$3.01
per share, or
$1.3 billion
, to common stockholders of record. In addition, we declared a distribution of $0.84 per share, or $370.5 million, paid on January 14, 2019 to our common stockholders of record at the close of business on December 27, 2018.
We accrue distributions on unvested restricted stock units, which are payable upon vesting. The amount accrued for distributions payable related to unvested restricted stock units was
$13.7 million
and
$10.1 million
as of December 31,
2018
and 2017, respectively. During the
year ended December 31, 2018
, we paid
$4.3 million
of distributions upon the vesting of restricted stock units.
For more details on the cash distributions paid to our common and preferred stockholders during the
year ended December 31, 2018
, see note 15 to our consolidated financial statements included in this Annual Report.
Contractual Obligations.
The following table summarizes our contractual obligations as of
December 31, 2018
(in millions):
44
|
Contractual Obligations
|
2019
|
2020
|
2021
|
2022
|
2023
|
Thereafter
|
Total
|
|||||||||||||||||||||
|
Long-term debt, including current portion:
|
||||||||||||||||||||||||||||
|
American Tower Corporation debt:
|
||||||||||||||||||||||||||||
|
2018 Term Loan (1)
|
$
|
1,500.0
|
|
$
|
—
|
|
$
|
—
|
|
$
|
—
|
|
$
|
—
|
|
$
|
—
|
|
1,500.0
|
|
||||||||
|
2013 Credit Facility
|
$
|
—
|
|
$
|
—
|
|
$
|
—
|
|
$
|
1,875.0
|
|
$
|
—
|
|
$
|
—
|
|
1,875.0
|
|
||||||||
|
2013 Term Loan
|
$
|
—
|
|
$
|
—
|
|
$
|
—
|
|
$
|
—
|
|
$
|
—
|
|
$
|
1,000.0
|
|
1,000.0
|
|
||||||||
|
2014 Credit Facility
|
$
|
—
|
|
$
|
—
|
|
$
|
—
|
|
$
|
—
|
|
$
|
—
|
|
$
|
—
|
|
—
|
|
||||||||
|
3.40% senior notes (2)
|
$
|
1,000.0
|
|
$
|
—
|
|
$
|
—
|
|
$
|
—
|
|
$
|
—
|
|
$
|
—
|
|
1,000.0
|
|
||||||||
|
2.800% senior notes
|
$
|
—
|
|
$
|
750.0
|
|
$
|
—
|
|
$
|
—
|
|
$
|
—
|
|
$
|
—
|
|
750.0
|
|
||||||||
|
5.050% senior notes
|
$
|
—
|
|
$
|
700.0
|
|
$
|
—
|
|
$
|
—
|
|
$
|
—
|
|
$
|
—
|
|
700.0
|
|
||||||||
|
3.300% senior notes
|
$
|
—
|
|
$
|
—
|
|
$
|
750.0
|
|
$
|
—
|
|
$
|
—
|
|
$
|
—
|
|
750.0
|
|
||||||||
|
3.450% senior notes
|
$
|
—
|
|
$
|
—
|
|
$
|
650.0
|
|
$
|
—
|
|
$
|
—
|
|
$
|
—
|
|
650.0
|
|
||||||||
|
5.900% senior notes
|
$
|
—
|
|
$
|
—
|
|
$
|
500.0
|
|
$
|
—
|
|
$
|
—
|
|
$
|
—
|
|
500.0
|
|
||||||||
|
2.250% senior notes
|
$
|
—
|
|
$
|
—
|
|
$
|
—
|
|
$
|
600.0
|
|
$
|
—
|
|
$
|
—
|
|
600.0
|
|
||||||||
|
4.70% senior notes
|
$
|
—
|
|
$
|
—
|
|
$
|
—
|
|
$
|
700.0
|
|
$
|
—
|
|
$
|
—
|
|
700.0
|
|
||||||||
|
3.50% senior notes
|
$
|
—
|
|
$
|
—
|
|
$
|
—
|
|
$
|
—
|
|
$
|
1,000.0
|
|
$
|
—
|
|
1,000.0
|
|
||||||||
|
3.000% senior notes
|
$
|
—
|
|
$
|
—
|
|
$
|
—
|
|
$
|
—
|
|
$
|
700.0
|
|
$
|
—
|
|
700.0
|
|
||||||||
|
5.00% senior notes
|
$
|
—
|
|
$
|
—
|
|
$
|
—
|
|
$
|
—
|
|
$
|
—
|
|
$
|
1,000.0
|
|
1,000.0
|
|
||||||||
|
1.375% senior notes
|
$
|
—
|
|
$
|
—
|
|
$
|
—
|
|
$
|
—
|
|
$
|
—
|
|
$
|
573.3
|
|
573.3
|
|
||||||||
|
4.000% senior notes
|
$
|
—
|
|
$
|
—
|
|
$
|
—
|
|
$
|
—
|
|
$
|
—
|
|
$
|
750.0
|
|
750.0
|
|
||||||||
|
4.400% senior notes
|
$
|
—
|
|
$
|
—
|
|
$
|
—
|
|
$
|
—
|
|
$
|
—
|
|
$
|
500.0
|
|
500.0
|
|
||||||||
|
1.950% senior notes
|
$
|
—
|
|
$
|
—
|
|
$
|
—
|
|
$
|
—
|
|
$
|
—
|
|
$
|
573.3
|
|
573.3
|
|
||||||||
|
3.375% senior notes
|
$
|
—
|
|
$
|
—
|
|
$
|
—
|
|
$
|
—
|
|
$
|
—
|
|
$
|
1,000.0
|
|
1,000.0
|
|
||||||||
|
3.125% senior notes
|
$
|
—
|
|
$
|
—
|
|
$
|
—
|
|
$
|
—
|
|
$
|
—
|
|
$
|
400.0
|
|
400.0
|
|
||||||||
|
3.55% senior notes
|
$
|
—
|
|
$
|
—
|
|
$
|
—
|
|
$
|
—
|
|
$
|
—
|
|
$
|
750.0
|
|
750.0
|
|
||||||||
|
3.600% senior notes
|
—
|
|
—
|
|
—
|
|
—
|
|
—
|
|
700.0
|
|
700.0
|
|
||||||||||||||
|
Total American Tower Corporation debt
|
2,500.0
|
|
1,450.0
|
|
1,900.0
|
|
3,175.0
|
|
1,700.0
|
|
7,246.6
|
|
17,971.6
|
|
||||||||||||||
|
American Tower subsidiary debt:
|
||||||||||||||||||||||||||||
|
Series 2013-2A securities (3)
|
—
|
|
—
|
|
—
|
|
—
|
|
1,300.0
|
|
—
|
|
1,300.0
|
|
||||||||||||||
|
Series 2018-1A securities (3)
|
—
|
|
—
|
|
—
|
|
—
|
|
—
|
|
500.0
|
|
500.0
|
|
||||||||||||||
|
Series 2015-1 notes (4)
|
—
|
|
350.0
|
|
—
|
|
—
|
|
—
|
|
—
|
|
350.0
|
|
||||||||||||||
|
Series 2015-2 notes (5)
|
—
|
|
—
|
|
—
|
|
—
|
|
—
|
|
525.0
|
|
525.0
|
|
||||||||||||||
|
India indebtedness (6)
|
101.9
|
|
30.2
|
|
30.2
|
|
30.2
|
|
30.2
|
|
17.4
|
|
240.1
|
|
||||||||||||||
|
India preference shares (7)
|
23.9
|
|
—
|
|
—
|
|
—
|
|
—
|
|
—
|
|
23.9
|
|
||||||||||||||
|
Shareholder loan (8)
|
59.9
|
|
—
|
|
—
|
|
—
|
|
—
|
|
—
|
|
59.9
|
|
||||||||||||||
|
Other subsidiary debt (9)
|
38.1
|
|
33.2
|
|
64.7
|
|
17.3
|
|
—
|
|
—
|
|
153.3
|
|
||||||||||||||
|
Total American Tower subsidiary debt
|
223.8
|
|
|
413.4
|
|
|
94.9
|
|
|
47.5
|
|
|
1,330.2
|
|
|
1,042.4
|
|
|
3,152.2
|
|
||||||||
|
Long-term obligations, excluding capital leases
|
2,723.8
|
|
|
1,863.4
|
|
1,994.9
|
|
3,222.5
|
|
3,030.2
|
|
8,289.0
|
|
21,123.8
|
|
|||||||||||||
|
Cash interest expense
|
702.0
|
|
635.0
|
|
560.0
|
|
434.3
|
|
315.8
|
|
567.7
|
|
3,214.8
|
|
||||||||||||||
|
Capital lease payments (including interest)
|
40.7
|
|
32.7
|
|
27.8
|
|
23.7
|
|
19.2
|
|
117.5
|
|
261.6
|
|
||||||||||||||
|
Total debt service obligations
|
3,466.5
|
|
2,531.1
|
|
2,582.7
|
|
3,680.5
|
|
3,365.2
|
|
8,974.2
|
|
24,600.2
|
|
||||||||||||||
|
Operating lease payments (10)
|
926.0
|
|
904.2
|
|
879.8
|
|
834.2
|
|
792.6
|
|
6,173.1
|
|
10,509.9
|
|
||||||||||||||
|
Other non-current liabilities (11)(12)
|
7.7
|
|
6.1
|
|
7.0
|
|
39.8
|
|
14.6
|
|
2,738.5
|
|
2,813.7
|
|
||||||||||||||
|
Total
|
$
|
4,400.2
|
|
$
|
3,441.4
|
|
$
|
3,469.5
|
|
$
|
4,554.5
|
|
$
|
4,172.4
|
|
$
|
17,885.8
|
|
$
|
37,923.8
|
|
|||||||
_______________
|
(1)
|
Repaid in full on February 14, 2019.
|
|
(2)
|
Repaid in full on the maturity date in February 2019 with borrowings from the 2013 Credit Facility and the 2014 Credit Facility.
|
|
(3)
|
Represents anticipated repayment date; final legal maturity is March 15, 2048.
|
|
(4)
|
Represents anticipated repayment date; final legal maturity is June 15, 2045.
|
|
(5)
|
Represents anticipated repayment date; final legal maturity is June 15, 2050.
|
|
(6)
|
Denominated in INR. Debt includes India working capital facilities, remaining debt assumed by us in connection with the Viom Acquisition and debt that has been entered into by ATC TIPL.
|
45
|
(7)
|
Mandatorily redeemable preference shares (the “Preference Shares”) classified as debt. The Preference Shares have a dividend rate of 10.25% per annum. Denominated in INR. We intend to redeem these shares on March 2, 2019.
|
|
(8)
|
Reflects balances owed to our joint venture partner in Ghana. The Ghana loan is denominated in GHS.
|
|
(9)
|
Includes our South African credit facility, which is denominated in ZAR and amortizes through December 17, 2020, our Colombian credit facility, which is denominated in COP and amortizes through April 24, 2021, our Brazil credit facility, which is denominated in BRL and matures on January 15, 2022, debt entered into by our Kenyan subsidiary in connection with an acquisition of sites in Kenya (the “Kenya Debt”), which is required to be paid either (i) in future installments subject to the satisfaction of specified conditions or (ii)
three
years from the note origination date, and U.S. subsidiary debt related to a seller-financed acquisition.
|
|
(10)
|
Includes payments under non-cancellable initial terms, as well as payments for certain renewal periods at our option, which we expect to renew because failure to do so could result in a loss of the applicable communications sites and related revenues from tenant leases.
|
|
(11)
|
Primarily represents our asset retirement obligations and excludes certain other non-current liabilities included in our consolidated balance sheet, primarily our straight-line rent liability for which cash payments are included in operating lease payments and unearned revenue that is not payable in cash.
|
|
(12)
|
Excludes $85.8 million of liabilities for unrecognized tax positions and $19.1 million of accrued income tax related interest and penalties included in our consolidated balance sheet as we are uncertain as to when and if the amounts may be settled. Settlement of such amounts could require the use of cash flows generated from operations. We expect the unrecognized tax benefits to change over the next 12 months if certain tax matters ultimately settle with the applicable taxing jurisdiction during this timeframe. However, based on the status of these items and the amount of uncertainty associated with the outcome and timing of audit settlements, we are currently unable to estimate the impact of the amount of such changes, if any, to previously recorded uncertain tax positions.
|
Off-Balance Sheet Arrangements.
We have no material off-balance sheet arrangements as defined in Item 303(a)(4)(ii) of SEC Regulation S-K.
Factors Affecting Sources of Liquidity
Our liquidity depends on our ability to generate cash flow from operating activities, borrow funds under our credit facilities and maintain compliance with the contractual agreements governing our indebtedness. We believe that the debt agreements discussed below represent our material debt agreements that contain covenants, our compliance with which would be material to an investor’s understanding of our financial results and the impact of those results on our liquidity.
Internally Generated Funds
. Because the majority of our tenant leases are multiyear contracts, a significant majority of the revenues generated by our property operations as of the end of
2018
is recurring revenue that we should continue to receive in future periods. Accordingly, a key factor affecting our ability to generate cash flow from operating activities is to maintain this recurring revenue and to convert it into operating profit by minimizing operating costs and fully achieving our operating efficiencies. In addition, our ability to increase cash flow from operating activities depends upon the demand for our communications sites and our related services and our ability to increase the utilization of our existing communications sites.
Restrictions Under Loan Agreements Relating to Our Credit Facilities.
The loan agreements for the 2013 Credit Facility, the 2014 Credit Facility, the 2013 Term Loan, the 2018 Term Loan and the 2019 Term Loan contain certain financial and operating covenants and other restrictions applicable to us and our subsidiaries that are not designated as unrestricted subsidiaries on a consolidated basis. These restrictions include limitations on additional debt, distributions and dividends, guaranties, sales of assets and liens. The loan agreements also contain covenants that establish financial tests with which we and our restricted subsidiaries must comply related to total leverage and senior secured leverage, as set forth in the table below. In the event that our debt ratings fall below investment grade, we must also maintain an interest coverage ratio of Adjusted EBITDA to Interest Expense (each as defined in the applicable loan agreement) of at least 2.50:1.00. As of
December 31, 2018
, we were in compliance with each of these covenants.
|
Compliance Tests For The 12 Months Ended
December 31, 2018
($ in billions)
|
||||||
|
Ratio (1)
|
Additional Debt Capacity Under Covenants (2)
|
Capacity for Adjusted EBITDA Decrease Under Covenants (3)
|
||||
|
Consolidated Total Leverage Ratio
|
Total Debt to Adjusted EBITDA
≤ 6.00:1.00
|
~ $7.6
|
~ $1.3
|
|||
|
Consolidated Senior Secured Leverage Ratio
|
Senior Secured Debt to Adjusted EBITDA
≤ 3.00:1.00
|
~ $11.2 (4)
|
~ $3.7 (4)
|
|||
_______________
46
(1) Each component of the ratio as defined in the applicable loan agreement.
(2) Assumes no change to Adjusted EBITDA.
(3) Assumes no change to our debt levels.
(4) Effectively, however, additional Senior Secured Debt under this ratio would be limited to the capacity under the Consolidated Total Leverage Ratio.
The loan agreements for our credit facilities also contain reporting and information covenants that require us to provide financial and operating information to the lenders within certain time periods. If we are unable to provide the required information on a timely basis, we would be in breach of these covenants.
Failure to comply with the financial maintenance tests and certain other covenants of the loan agreements for our credit facilities could not only prevent us from being able to borrow additional funds under these credit facilities, but may constitute a default under these credit facilities, which could result in, among other things, the amounts outstanding, including all accrued interest and unpaid fees, becoming immediately due and payable. If this were to occur, we may not have sufficient cash on hand to repay such indebtedness. The key factors affecting our ability to comply with the debt covenants described above are our financial performance relative to the financial maintenance tests defined in the loan agreements for these credit facilities and our ability to fund our debt service obligations. Based upon our current expectations, we believe our operating results during the next 12 months will be sufficient to comply with these covenants.
Restrictions Under Agreements Relating to the 2015 Securitization and the Trust Securitizations
. The indenture and related supplemental indentures governing the American Tower Secured Revenue Notes, Series 2015-1, Class A (the “Series 2015-1 Notes”) and the American Tower Secured Revenue Notes, Series 2015-2, Class A (the “Series 2015-2 Notes,” and, together with the Series 2015-1 Notes, the “2015 Notes”) issued by GTP Acquisition Partners I, LLC (“GTP Acquisition Partners”) in the 2015 Securitization and the loan agreement related to the Trust Securitizations include certain financial ratios and operating covenants and other restrictions customary for transactions subject to rated securitizations. Among other things, GTP Acquisition Partners and the AMT Asset Subs are prohibited from incurring other indebtedness for borrowed money or further encumbering their assets, subject to customary carve-outs for ordinary course trade payables and permitted encumbrances (as defined in the applicable agreement).
Under the agreements, amounts due will be paid from the cash flows generated by the assets securing the 2015 Notes or the Loan, as applicable, which must be deposited into certain reserve accounts, and thereafter distributed solely pursuant to the terms of the applicable agreement. On a monthly basis, after payment of all required amounts under the applicable agreement, subject to the conditions described in the table below, the excess cash flows generated from the operation of such assets are released to GTP Acquisition Partners or the AMT Asset Subs, as applicable, which can then be distributed to, and used by, us. As of
December 31, 2018
,
$80.1 million
held in such reserve accounts was classified as restricted cash.
Certain information with respect to the 2015 Securitization and the Trust Securitizations is set forth below. The debt service coverage ratio (“DSCR”) is generally calculated as the ratio of the net cash flow (as defined in the applicable agreement) to the amount of interest, servicing fees and trustee fees required to be paid over the succeeding 12 months on the principal amount of the 2015 Notes or the Loan, as applicable, that will be outstanding on the payment date following such date of determination.
47
|
Issuer or Borrower
|
Notes/Securities Issued
|
Conditions Limiting Distributions of Excess Cash
|
Excess Cash Distributed During Year Ended December 31, 2018
|
DSCR as of
December 31, 2018
|
Capacity for Decrease in Net Cash Flow Before Triggering Cash Trap DSCR (1)
|
Capacity for Decrease in Net Cash Flow Before Triggering Minimum DSCR (1)
|
||
|
Cash Trap DSCR
|
Amortization Period
|
|||||||
|
(in millions)
|
(in millions)
|
(in millions)
|
||||||
|
2015 Securitization
|
GTP Acquisition Partners
|
American Tower Secured Revenue Notes, Series 2015-1 and Series 2015-2
|
1.30x, Tested Quarterly (2)
|
(3)(4)
|
$197.3
|
8.67x
|
$196.9
|
$200.9
|
|
Trust Securitizations
|
AMT Asset Subs
|
Secured Tower Revenue Securities, Series 2013-2A, Secured Tower Revenue Securities, Series 2018-1, Subclass A and Secured Tower Revenue Securities, Series 2018-1, Subclass R
|
1.30x, Tested Quarterly (2)
|
(3)(5)
|
$612.9
|
10.65x
|
$558.4
|
$567.4
|
_______________
|
(1)
|
Based on the net cash flow of the applicable issuer or borrower as of
December 31, 2018
and the expenses payable over the next 12 months on the 2015 Notes or the Loan, as applicable.
|
|
(2)
|
Once triggered, a Cash Trap DSCR condition continues to exist until the DSCR exceeds the Cash Trap DSCR for two consecutive calendar quarters. During a Cash Trap DSCR condition, all cash flow in excess of amounts required to make debt service payments, fund required reserves, pay management fees and budgeted operating expenses and make other payments required under the applicable transaction documents, referred to as excess cash flow, will be deposited into a reserve account (the “Cash Trap Reserve Account”) instead of being released to the applicable issuer or borrower.
|
|
(3)
|
An amortization period commences if the DSCR is equal to or below 1.15x (the “Minimum DSCR”) at the end of any calendar quarter and continues to exist until the DSCR exceeds the Minimum DSCR for two consecutive calendar quarters.
|
|
(4)
|
No amortization period is triggered if the outstanding principal amount of a series has not been repaid in full on the applicable anticipated repayment date. However, in such event, additional interest will accrue on the unpaid principal balance of the applicable series, and such series will begin to amortize on a monthly basis from excess cash flow.
|
|
(5)
|
An amortization period exists if the outstanding principal amount has not been paid in full on the applicable anticipated repayment date and continues to exist until such principal has been repaid in full.
|
A failure to meet the noted DSCR tests could prevent GTP Acquisition Partners or the AMT Asset Subs from distributing excess cash flow to us, which could affect our ability to fund our capital expenditures, including tower construction and acquisitions and meet REIT distribution requirements. During an “amortization period,” all excess cash flow and any amounts in the applicable Cash Trap Reserve Account would be applied to pay principal of the 2015 Notes or the Loan, as applicable, on each monthly payment date, and so would not be available for distribution to us. Further, additional interest will begin to accrue with respect to any series of the 2015 Notes or subclass of the Loan from and after the anticipated repayment date at a per annum rate determined in accordance with the applicable agreement. With respect to the 2015 Notes, upon the occurrence and during an event of default, the applicable trustee may, in its discretion or at the direction of holders of more than 50% of the aggregate outstanding principal of any series of the 2015 Notes, declare such series of 2015 Notes immediately due and payable, in which case any excess cash flow would need to be used to pay holders of such notes. Furthermore, if GTP Acquisition Partners or the AMT Asset Subs were to default on a series of the 2015 Notes or the Loan, the applicable trustee may seek to foreclose upon or otherwise convert the ownership of all or any portion of the
3,556
communications sites that secure the 2015 Notes or the
5,116
broadcast and wireless communications towers and related assets that secure the Loan, respectively, in which case we could lose such sites and the revenue associated with those assets.
As discussed above, we use our available liquidity and seek new sources of liquidity to fund capital expenditures, future growth and expansion initiatives, satisfy our distribution requirements and repay or repurchase our debt. If we determine that it is desirable or necessary to raise additional capital, we may be unable to do so, or such additional financing may be prohibitively expensive or restricted by the terms of our outstanding indebtedness. If we are unable to raise capital when our needs arise, we may not be able to fund capital expenditures, future growth and expansion initiatives, satisfy our REIT distribution requirements and debt service obligations or refinance our existing indebtedness.
48
In addition, our liquidity depends on our ability to generate cash flow from operating activities. As set forth under Item 1A of this Annual Report under the caption “Risk Factors,” we derive a substantial portion of our revenues from a small number of tenants and, consequently, a failure by a significant tenant to perform its contractual obligations to us could adversely affect our cash flow and liquidity.
Critical Accounting Policies and Estimates
Management’s discussion and analysis of financial condition and results of operations are based upon our consolidated financial statements, which have been prepared in accordance with GAAP. The preparation of these financial statements requires us to make estimates and assumptions that affect the reported amounts of assets, liabilities, revenues and expenses, as well as related disclosures of contingent assets and liabilities. We evaluate our policies and estimates on an ongoing basis. Management bases its estimates on historical experience and various other assumptions that are believed to be reasonable under the circumstances, the results of which form the basis for making judgments about the carrying amounts of assets and liabilities that are not readily apparent from other sources. Actual results may differ from these estimates under different assumptions or conditions.
We have reviewed our policies and estimates to determine our critical accounting policies for the year ended
December 31, 2018
. We have identified the following policies as critical to an understanding of our results of operations and financial condition. This is not a comprehensive list of our accounting policies. See note 1 to our consolidated financial statements included in this Annual Report for a summary of our significant accounting policies. In many cases, the accounting treatment of a particular transaction is specifically dictated by GAAP, with no need for management’s judgment in its application. There are also areas in which management’s judgment in selecting any available alternative would not produce a materially different result.
|
•
|
Impairment of Assets—Assets Subject to Depreciation and Amortization
: We review long-lived assets for impairment at least annually or whenever events, changes in circumstances or other indicators or evidence indicate that the carrying amount of our assets may not be recoverable.
|
We review our tower portfolio and network location intangible assets for indicators of impairment at the lowest level of identifiable cash flows, typically at an individual tower basis. Possible indicators include a tower not having current tenant leases or having expenses in excess of revenues. A cash flow modeling approach is utilized to assess recoverability and incorporates, among other items, the tower location, the tower location demographics, the timing of additions of new tenants, lease rates and estimated length of tenancy and ongoing cash requirements.
We review our tenant-related intangible assets on a tenant by tenant basis for indicators of impairment, such as high levels of turnover or attrition, non-renewal of a significant number of contracts or the cancellation or termination of a relationship. We assess recoverability by determining whether the carrying amount of the tenant-related intangible assets will be recovered primarily through projected undiscounted future cash flows.
If the sum of the estimated undiscounted future cash flows of our long-lived assets is less than the carrying amount of the assets, an impairment loss may be recognized. An impairment loss would be based on the fair value of the asset, which is based on an estimate of discounted future cash flows to be provided from the asset. We record any related impairment charge in the period in which we identify such impairment.
On February 28, 2018, one of our tenants in Asia, Aircel, filed for bankruptcy protection. We performed an impairment test based on current expectations of the impact of the bankruptcy on projected cash flows for assets related to Aircel. These assets consisted primarily of towers, network location intangibles and tenant-related intangibles. As a result, an impairment of
$40.1 million
was taken on the tower and network intangible assets. We also fully impaired the tenant-related intangible asset for Aircel, which resulted in an impairment of
$107.3 million
during the year ended December 31, 2018.
In October 2017, one of our tenants in Asia, Tata Teleservices, informed the Department of Telecommunications in India of its intent to exit the wireless telecommunications business and announced plans to transfer its business to another telecommunications provider. On October 23, 2018, we entered into agreements with Tata for a settlement and release of certain contractual lease obligations effective November 1, 2018. As part of the arrangement, we received an upfront one-time INR-denominated cash payment equal to approximately
$345.5 million
for the termination of lease obligations with Tata Teleservices in India. In addition, we entered into new leasing arrangements with a number of Tata-affiliated entities. As a result of the settlement and new leasing agreements, we expect an approximately 80% reduction in revenues from Tata as compared to what had previously been generated from the terminated leases. In connection with the acceleration of the contractual arrangements, we also accelerated the amortization of our tenant-
49
related intangible asset with Tata Teleservices, which resulted in an additional amortization expense of $327.5 million in 2018. We also recorded an impairment of
$164.2 million
for tower and network location intangible assets as a result of the settlement.
Impairment of Assets—Goodwill:
We review goodwill for impairment at least annually (as of December 31) or whenever events or circumstances indicate the carrying amount of an asset may not be recoverable.
Goodwill is recorded in the applicable segment and assessed for impairment at the reporting unit level. We utilize the two step impairment test and employ a discounted cash flow analysis when testing goodwill for impairment. The key assumptions utilized in the discounted cash flow analysis include current operating performance, terminal sales growth rate, management’s expectations of future operating results and cash requirements, the current weighted average cost of capital and an expected tax rate. Under the first step of this test, we compare the fair value of the reporting unit, as calculated under an income approach using future discounted cash flows, to the carrying amount of the applicable reporting unit. If the carrying amount exceeds the fair value, we conduct the second step of this test, in which the implied fair value of the applicable reporting unit’s goodwill is compared to the carrying amount of that goodwill. If the carrying amount of goodwill exceeds its implied fair value, an impairment loss would be recognized for the amount of the excess.
During the year ended
December 31, 2018
, no potential impairment was identified as the fair value of each of our reporting units was in excess of its carrying amount. The fair value of our India reporting unit, which is based on the present value of forecasted future value cash flows (the income approach) exceeded the carrying value by approximately $311.1 million, or 8%. Key assumptions include future revenue growth rates and operating margins, capital expenditures, terminal period growth rate and the weighted-average cost of capital, which were determined considering historical data and current assumptions related to the impacts of the carrier consolidation.
For this reporting unit, we performed a sensitivity analysis on our significant assumptions and determined that a (i) 6% reduction of projected revenues, (ii) 58 basis point increase in the weighted-average cost of capital or (iii) 28% reduction in terminal sales growth rate, individually, each of which we determined to be reasonable, would impact our conclusion that the fair value of the India reporting unit exceeds its carrying value. Events that could negatively affect our India reporting unit’s financial results include increased customer attrition exceeding our forecast resulting from the ongoing carrier consolidation, carrier tenant bankruptcies and other factors set forth in Item 1A of this Annual Report under the caption “Risk Factors.”
The carrying value of goodwill in the India reporting unit was $1,045.5 million as of December 31, 2018, which represents 19% of our consolidated balance of $5,501.9 million.
|
•
|
Asset Retirement Obligations:
When required, we recognize the fair value of obligations to remove our tower assets and remediate the leased land upon which certain of our tower assets are located. Generally, the associated retirement costs are capitalized as part of the carrying amount of the related tower assets and depreciated over their estimated useful lives and the liability is accreted through the obligation’s estimated settlement date.
|
We updated our assumptions used in estimating our aggregate asset retirement obligation, which resulted in a net decrease in the estimated obligation of
$14.6 million
during the year ended
December 31, 2018
. The change in
2018
primarily resulted from changes in timing of certain settlement date and cost assumptions. Fair value estimates of liabilities for asset retirement obligations generally involve discounting of estimated future cash flows. Periodic accretion of such liabilities due to the passage of time is included in Depreciation, amortization and accretion expense in the consolidated statements of operations. The significant assumptions used in estimating our aggregate asset retirement obligation are: timing of tower removals; cost of tower removals; timing and number of land lease renewals; expected inflation rates; and credit-adjusted risk-free interest rates that approximate our incremental borrowing rate. While we feel the assumptions are appropriate, there can be no assurances that actual costs and the probability of incurring obligations will not differ from these estimates. We will continue to review these assumptions periodically and we may need to adjust them as necessary.
|
•
|
Acquisitions
: We evaluate each of our acquisitions under the accounting guidance framework to determine whether to treat an acquisition as an asset acquisition or a business combination. For those transactions treated as asset acquisitions, the purchase price is allocated to the assets acquired, with no recognition of goodwill. For those acquisitions that meet the definition of a business combination, we apply the acquisition method of accounting where assets acquired and liabilities assumed are recorded at fair value at the date of each acquisition, and the results of operations are included with our results from the dates of the respective acquisitions. Any excess of the purchase price paid over the amounts recognized for assets acquired and liabilities assumed is recorded as goodwill. We continue to
|
50
evaluate acquisitions accounted for as business combinations for a period not to exceed one year after the applicable acquisition date of each transaction to determine whether any additional adjustments are needed to the allocation of the purchase price paid for the assets acquired and liabilities assumed. The fair value of the assets acquired and liabilities assumed is typically determined by using either estimates of replacement costs or discounted cash flow valuation methods. When determining the fair value of tangible assets acquired, we must estimate the cost to replace the asset with a new asset taking into consideration such factors as age, condition and the economic useful life of the asset. When determining the fair value of intangible assets acquired, we must estimate the applicable discount rate and the timing and amount of future tenant cash flows, including rate and terms of renewal and attrition.
|
•
|
Revenue Recognition:
Our revenue from leasing arrangements, including fixed escalation clauses present in non-cancellable lease arrangements, is reported on a straight-line basis over the term of the respective leases when collectibility is probable. Escalation clauses tied to the Consumer Price Index or other inflation-based indices, and other incentives present in lease agreements with our tenants are excluded from the straight-line calculation. Total property straight-line revenues for the years ended
December 31, 2018
,
2017
and
2016
were
$87.6 million
, $194.4 million and $131.7 million, respectively. Amounts billed upfront in connection with the execution of lease agreements are initially deferred and reflected in Unearned revenue in the accompanying consolidated balance sheets and recognized as revenue over the terms of the applicable lease arrangements. Amounts billed or received for services prior to being earned are deferred and reflected in Unearned revenue in the accompanying consolidated balance sheets until the criteria for recognition have been met.
|
We derive the largest portion of our revenues, corresponding trade receivables and the related deferred rent asset from a small number of tenants in the telecommunications industry, with
51%
of our revenues derived from four tenants. In addition, we have concentrations of credit risk in certain geographic areas. We mitigate the concentrations of credit risk with respect to notes and trade receivables by actively monitoring the creditworthiness of our borrowers and tenants. In recognizing tenant revenue we assess the collectibility of both the amounts billed and the portion recognized on a straight-line basis. This assessment takes tenant credit risk and business and industry conditions into consideration to ultimately determine the collectibility of the amounts billed. To the extent the amounts, based on management’s estimates, may not be collectible, recognition is deferred until such point as the uncertainty is resolved. Any amounts that were previously recognized as revenue and subsequently determined to be uncollectible are charged to bad debt expense. Accounts receivable are reported net of allowances for doubtful accounts related to estimated losses resulting from a tenant’s inability to make required payments and allowances for amounts invoiced whose collectibility is not reasonably assured.
|
•
|
Rent Expense:
Many of the leases underlying our tower sites have fixed rent escalations, which provide for periodic increases in the amount of ground rent payable over time. In addition, certain of our tenant leases require us to exercise available renewal options pursuant to the underlying ground lease if the tenant exercises its renewal option. We calculate straight-line ground rent expense for these leases based on the fixed non-cancellable term of the underlying ground lease plus all periods, if any, for which failure to renew the lease imposes an economic penalty to us such that renewal appears to be reasonably assured.
|
Effective January 1, 2019, we will adopt the new lease accounting guidance, which requires us to recognize a Right of Use (“ROU”) lease asset and lease liability for operating and finance leases. The ROU asset will be measured as the sum of the lease liability, prepaid or accrued lease payments, any initial direct costs incurred and any other applicable amounts.
The calculation of the lease liability requires us to make certain assumptions for each lease, including lease term and discount rate implicit in each lease, which could significantly impact the gross lease obligation, the duration and the present value of the lease liability. When calculating the lease term, we will consider the renewal, cancellation and termination rights available to us and the lessor. We will determine the discount rate by calculating the incremental borrowing rate on a collateralized basis at the commencement of a lease or upon a change in the lease term.
|
•
|
Income Taxes:
Accounting for income taxes requires us to estimate the timing and impact of amounts recorded in our financial statements that may be recognized differently for tax purposes. To the extent that the timing of amounts recognized for financial reporting purposes differs from the timing of recognition for tax reporting purposes, deferred tax assets or liabilities are required to be recorded. Deferred tax assets and liabilities are measured based on the rate at which we expect these items to be reflected in our tax returns, which may differ from the current rate. We do not expect to pay federal income taxes on our REIT taxable income.
|
We periodically review our deferred tax assets, and we record a valuation allowance if, based on the available evidence, it is more likely than not that some or all of the deferred tax assets will not be realized. Management
51
assesses the available positive and negative evidence to estimate if sufficient future taxable income will be generated to use the existing deferred tax assets. Valuation allowances would be reversed as a reduction to the provision for income taxes, if related deferred tax assets are deemed realizable based on changes in facts and circumstances relevant to the assets’ recoverability.
We recognize the benefit of uncertain tax positions when, in management’s judgment, it is more likely than not that positions we have taken in our tax returns will be sustained upon examination, which are measured at the largest amount that is greater than 50% likely of being realized upon settlement. We adjust our tax liabilities when our judgment changes as a result of the evaluation of new information or information not previously available. Due to the complexity of some of these uncertainties, the ultimate resolution may result in a payment that is materially different from our current estimate of the tax liabilities. These differences will be reflected as increases or decreases to income tax expense in the period in which additional information is available or the position is ultimately settled under audit.
The December 2017 legislation commonly referred to as the Tax Cuts and Jobs Act (the “Tax Act”) significantly changed how the U.S. taxes corporations. The Tax Act contains several key provisions including, among other things, a one-time mandatory deemed repatriation of all post-1986 untaxed foreign earnings and profits, a reduction in the corporate income rate from 35% to 21% for tax years beginning after December 31, 2017 and the introduction of a new U.S. tax on certain off-shore earnings.
The SEC staff issued guidance to address the application of GAAP in situations when a registrant does not have the necessary information available, prepared or analyzed in reasonable detail to complete the accounting for certain income tax effects of the Tax Act and allows the registrant to record provisional amounts during a measurement period not to extend beyond one year from the enactment date. We recognized the provisional impacts of the Tax Act in our consolidated financial statements for the year ended December 31, 2017 and finalized these amounts in 2018 with no significant changes to preliminary amounts.
Accounting Standards Update
For a discussion of recent accounting standards updates, see note 1 to our consolidated financial statements included in this Annual Report.
52
|
ITEM 7A.
|
QUANTITATIVE AND QUALITATIVE DISCLOSURES ABOUT MARKET RISK
|
The following table provides information as of
December 31, 2018
about our market risk exposure associated with changing interest rates. For long-term debt obligations, the table presents principal cash flows by maturity date and average interest rates related to outstanding obligations. For interest rate swaps, the table presents notional principal amounts and weighted-average interest rates (in millions, except percentages). For more information, see Item 7 of this Annual Report under the caption “Management’s Discussion and Analysis of Financial Condition and Results of Operations—Liquidity and Capital Resources” and note 8 to our consolidated financial statements included in this Annual Report.
|
Long-Term Debt
|
2019
|
2020
|
2021
|
2022
|
2023
|
Thereafter
|
Total
|
Fair Value
|
||||||||||||||||||||||||
|
Fixed Rate Debt (a)
|
$
|
1,217.5
|
|
$
|
1,851.8
|
|
$
|
2,001.9
|
|
$
|
1,347.1
|
|
$
|
3,043.1
|
|
$
|
7,367.7
|
|
$
|
16,829.1
|
|
$
|
16,604.0
|
|
||||||||
|
Weighted-Average Interest Rate (a)
|
5.01
|
%
|
3.85
|
%
|
4.24
|
%
|
3.74
|
%
|
3.27
|
%
|
3.58
|
%
|
||||||||||||||||||||
|
Variable Rate Debt (b)
|
$
|
1,537.5
|
|
$
|
32.6
|
|
$
|
12.3
|
|
$
|
1,891.7
|
|
$
|
—
|
|
$
|
1,000.0
|
|
$
|
4,474.1
|
|
$
|
4,466.6
|
|
||||||||
|
Weighted-Average Interest Rate (b)(c)
|
3.54
|
%
|
8.74
|
%
|
8.14
|
%
|
3.66
|
%
|
—
|
%
|
3.66
|
%
|
||||||||||||||||||||
|
Interest Rate Swaps
|
||||||||||||||||||||||||||||||||
|
Hedged Variable-Rate Notional Amount
|
$
|
4.6
|
|
$
|
6.2
|
|
$
|
6.1
|
|
$
|
—
|
|
$
|
—
|
|
$
|
—
|
|
$
|
16.9
|
|
$
|
0.3
|
|
(d)
|
|||||||
|
Fixed Rate Debt Rate (e)
|
9.74
|
%
|
||||||||||||||||||||||||||||||
|
Hedged Fixed-Rate Notional Amount
|
$
|
—
|
|
$
|
—
|
|
$
|
—
|
|
$
|
600.0
|
|
$
|
500.0
|
|
$
|
—
|
|
$
|
1,100.0
|
|
$
|
33.5
|
|
(f)
|
|||||||
|
Variable Rate Debt Rate (g)
|
3.54
|
%
|
||||||||||||||||||||||||||||||
_______________
|
(a)
|
Fixed rate debt consisted of: Securities issued in the Trust Securitizations; the 3.40% senior notes due 2019; Securities issued in the 2015 Securitization; the 2.800% senior notes due 2020; the 5.050% senior notes due 2020; the 3.300% senior notes due 2021; the 3.450% senior notes due 2021; the 5.900% senior notes due 2021; the 2.250% senior notes due 2022 (the “2.250% Notes”); the 4.70% senior notes due 2022; the 3.50% senior notes due 2023; the 3.000% Notes; the 5.00% senior notes due 2024; the 1.375% Notes; the 4.000% senior notes due 2025; the 4.400% senior notes due 2026; the 1.950% Notes; the 3.375% senior notes due 2026; the 3.125% senior notes due 2027; the 3.55% Notes; the 3.600% Notes; the Ghana loan which matures December 31, 2019; the India indebtedness, with maturity dates ranging from January 1, 2019 to November 30, 2024; the Kenya Debt; U.S. subsidiary debt related to a seller-financed acquisition; and other debt including capital leases.
|
|
(b)
|
Variable rate debt consisted of: the 2018 Term Loan, which matures on March 29, 2019; the 2013 Term Loan, which matures on January 31, 2024; the 2013 Credit Facility, which matures on June 28, 2022; the 2014 Credit Facility, which matures on January 31, 2024; the South African credit facility, which amortizes through December 17, 2020; the Colombian credit facility, which amortizes through April 24, 2021; and the Brazil credit facility, which matures on January 15, 2022.
|
|
(c)
|
Based on rates effective as of
December 31, 2018
.
|
|
(d)
|
As of
December 31, 2018
, the interest rate swap agreement in Colombia was included in Other non-current liabilities on the consolidated balance sheet.
|
|
(e)
|
Represents the fixed rate of interest based on contractual notional amount as a percentage of the total notional amount. The interest rate consists of fixed interest of 5.74%, per the interest rate agreement, and a fixed margin of 4.00%, per the loan agreement for the Colombian credit facility.
|
|
(f)
|
As of
December 31, 2018
, the interest rate swap agreements in the U.S. were included in Other non-current liabilities on the consolidated balance sheet.
|
|
(g)
|
Represents the weighted average variable rate of interest based on contractual notional amount as a percentage of total notional amounts.
|
Interest Rate Risk
As of
December 31, 2018
, we have one interest rate swap agreement related to debt in Colombia. This swap has been designated as a cash flow hedge, has a notional amount of
$16.9 million
and has an interest rate of
5.74%
and expires in April 2021. We have three interest rate swap agreements related to the 2.250% Notes. These swaps have been designated as fair value hedges, have an aggregate notional amount of
$600.0 million
and an interest rate of one-month LIBOR plus applicable spreads and expire in January 2022. In addition, we have three interest rate swap agreements related to a portion of the 3.000% Notes. These swaps have been designated as fair value hedges, have an aggregate notional amount of
$500.0 million
and have an interest rate of one-month LIBOR plus applicable spreads and expire in June 2023.
Changes in interest rates can cause interest charges to fluctuate on our variable rate debt. Variable rate debt as of
December 31, 2018
consisted of
$1.9 billion
under the 2013 Credit Facility,
$1.0 billion
under the 2013 Term Loan,
$1.5 billion
under the 2018 Term Loan,
$600.0 million
under the interest rate swap agreements related to the 2.250% Notes,
$500.0 million
under the interest rate swap agreements related to the 3.000% Notes,
$40.6 million
under the South African credit facility,
$16.9 million
under the Colombian credit facility after giving effect to our interest rate swap agreements and
$24.7 million
under the Brazil credit facility. A 10% increase in current interest rates would result in an additional
$20.2 million
of interest expense for the
year ended December 31, 2018
.
53
Foreign Currency Risk
We are exposed to market risk from changes in foreign currency exchange rates primarily in connection with our foreign subsidiaries and joint ventures internationally. Any transaction denominated in a currency other than the U.S. Dollar is reported in U.S. Dollars at the applicable exchange rate. All assets and liabilities are translated into U.S. Dollars at exchange rates in effect at the end of the applicable fiscal reporting period and all revenues and expenses are translated at average rates for the period. The cumulative translation effect is included in equity as a component of Accumulated other comprehensive loss. We may enter into additional foreign currency financial instruments in anticipation of future transactions to minimize the impact of foreign currency fluctuations. For the year ended
December 31, 2018
,
47%
of our revenues and
57%
of our total operating expenses were denominated in foreign currencies.
As of
December 31, 2018
, we have incurred intercompany debt that is not considered to be permanently reinvested, and similar unaffiliated balances that were denominated in a currency other than the functional currency of the subsidiary in which it is recorded. As this debt had not been designated as being a long-term investment in nature, any changes in the foreign currency exchange rates will result in unrealized gains or losses, which will be included in our determination of net income. An adverse change of 10% in the underlying exchange rates of our unsettled intercompany debt and similar unaffiliated balances would result in
$110.9 million
of unrealized losses that would be included in Other expense in our consolidated statements of operations for the year ended
December 31, 2018
.
|
ITEM 8.
|
FINANCIAL STATEMENTS AND SUPPLEMENTARY DATA
|
See Item 15 (a).
|
ITEM 9.
|
CHANGES IN AND DISAGREEMENTS WITH ACCOUNTANTS ON ACCOUNTING AND FINANCIAL DISCLOSURE
|
None.
|
ITEM 9A.
|
CONTROLS AND PROCEDURES
|
Disclosure Controls and Procedures
We have established disclosure controls and procedures designed to ensure that material information relating to us, including our consolidated subsidiaries, is made known to the officers who certify our financial reports and to other members of senior management and the Board of Directors.
Our management, with the participation of our principal executive officer and principal financial officer, evaluated the effectiveness of the design and operation of our disclosure controls and procedures (as defined in Rules 13a-15(e) and 15d-15(e) under the Exchange Act) as of the end of the period covered by this Annual Report. Based on this evaluation, our principal executive officer and principal financial officer concluded that these disclosure controls and procedures were effective as of December 31,
2018
and designed to ensure that the information required to be disclosed in our reports filed or submitted under the Exchange Act is recorded, processed, summarized and reported within the requisite time periods specified in the applicable rules and forms, and that it is accumulated and communicated to our management, including our principal executive officer and principal financial officer, as appropriate, to allow timely decisions regarding required disclosure.
Management’s Annual Report on Internal Control over Financial Reporting
Our management, with the participation of our principal executive officer and principal financial officer, is responsible for establishing and maintaining adequate internal control over financial reporting as defined in Rules 13a-15(f) and 15d-15(f) under the Exchange Act. Our internal control system is designed to provide reasonable assurance to our management and Board of Directors regarding the preparation and fair presentation of published financial statements.
Our management assessed the effectiveness of our internal control over financial reporting as of December 31,
2018
.
In making its assessment of internal control over financial reporting, our management used the criteria set forth by the Committee of Sponsoring Organizations of the Treadway Commission in
Internal Control—Integrated Framework (2013)
. Based on this assessment, management concluded that, as of December 31,
2018
, our internal control over financial reporting is effective.
54
Deloitte & Touche LLP, an independent registered public accounting firm that audited our financial statements included in this Annual Report, has issued an attestation report on management’s internal control over financial reporting, which is included in this Item 9A under the caption “Report of Independent Registered Public Accounting Firm.”
Changes in Internal Control over Financial Reporting
There have been no changes in our internal control over financial reporting (as defined in Rule 13a-15(f) under the Exchange Act) during the fiscal quarter ended December 31,
2018
that have materially affected, or are reasonably likely to materially affect, our internal control over financial reporting.
55
REPORT OF INDEPENDENT REGISTERED PUBLIC ACCOUNTING FIRM
To the Stockholders and the Board of Directors of American Tower Corporation
Opinion on Internal Control over Financial Reporting
We have audited the internal control over financial reporting of American Tower Corporation and subsidiaries (the “Company”) as of December 31, 2018, based on criteria established in
Internal Control - Integrated Framework (2013)
issued by the Committee of Sponsoring Organizations of the Treadway Commission (COSO). In our opinion, the Company maintained, in all material respects, effective internal control over financial reporting as of December 31, 2018, based on criteria established in
Internal Control - Integrated Framework (2013)
issued by COSO.
We have also audited, in accordance with the standards of the Public Company Accounting Oversight Board (United States) (PCAOB), the consolidated financial statements as of and for the year ended December 31, 2018, of the Company and our report dated February 27, 2019, expressed an unqualified opinion on those financial statements.
Basis for Opinion
The Company’s management is responsible for maintaining effective internal control over financial reporting and for its assessment of the effectiveness of internal control over financial reporting, included in the accompanying Management’s Annual Report on Internal Control over Financial Reporting. Our responsibility is to express an opinion on the Company’s internal control over financial reporting based on our audit. We are a public accounting firm registered with the PCAOB and are required to be independent with respect to the Company in accordance with the U.S. federal securities laws and the applicable rules and regulations of the Securities and Exchange Commission and the PCAOB.
We conducted our audit in accordance with the standards of the PCAOB. Those standards require that we plan and perform the audit to obtain reasonable assurance about whether effective internal control over financial reporting was maintained in all material respects. Our audit included obtaining an understanding of internal control over financial reporting, assessing the risk that a material weakness exists, testing and evaluating the design and operating effectiveness of internal control based on the assessed risk, and performing such other procedures as we considered necessary in the circumstances. We believe that our audit provides a reasonable basis for our opinion.
Definition and Limitations of Internal Control over Financial Reporting
A company’s internal control over financial reporting is a process designed to provide reasonable assurance regarding the reliability of financial reporting and the preparation of financial statements for external purposes in accordance with generally accepted accounting principles. A company’s internal control over financial reporting includes those policies and procedures that (1) pertain to the maintenance of records that, in reasonable detail, accurately and fairly reflect the transactions and dispositions of the assets of the company; (2) provide reasonable assurance that transactions are recorded as necessary to permit preparation of financial statements in accordance with generally accepted accounting principles, and that receipts and expenditures of the company are being made only in accordance with authorizations of management and directors of the company; and (3) provide reasonable assurance regarding prevention or timely detection of unauthorized acquisition, use, or disposition of the company’s assets that could have a material effect on the financial statements.
Because of its inherent limitations, internal control over financial reporting may not prevent or detect misstatements. Also, projections of any evaluation of effectiveness to future periods are subject to the risk that controls may become inadequate because of changes in conditions, or that the degree of compliance with the policies or procedures may deteriorate.
/s/ Deloitte & Touche LLP
Boston, Massachusetts
February 27, 2019
56
PART III
|
ITEM 10.
|
DIRECTORS, EXECUTIVE OFFICERS AND CORPORATE GOVERNANCE
|
Our executive officers and their respective ages and positions as of
February 20,
2019
are set forth below:
|
James D. Taiclet, Jr.
|
58
|
|
Chairman, President and Chief Executive Officer
|
||
|
Thomas A. Bartlett
|
60
|
|
Executive Vice President and Chief Financial Officer
|
||
|
Edmund DiSanto
|
66
|
|
Executive Vice President, Chief Administrative Officer, General Counsel and Secretary
|
||
|
William H. Hess
|
55
|
|
Executive Vice President and Chairman, Latin America and EMEA
|
||
|
Robert J. Meyer, Jr.
|
55
|
|
Senior Vice President, Finance and Corporate Controller
|
||
|
Olivier Puech
|
51
|
|
Executive Vice President and President, Latin America and EMEA
|
||
|
Amit Sharma
|
68
|
|
Executive Vice President and President, Asia
|
||
|
Steven O. Vondran
|
48
|
|
Executive Vice President and President, U.S. Tower Division
|
||
James D. Taiclet, Jr.
is our Chairman, President and Chief Executive Officer. Mr. Taiclet was appointed President and Chief Operating Officer in September 2001, was named Chief Executive Officer in October 2003 and was selected as Chairman of the Board in February 2004. Prior to joining us, Mr. Taiclet served as President of Honeywell Aerospace Services, a unit of Honeywell International, and prior to that as Vice President, Engine Services at Pratt & Whitney, a unit of United Technologies Corporation. He was also previously a consultant at McKinsey & Company, specializing in telecommunications and aerospace strategy and operations. Mr. Taiclet began his career as a United States Air Force officer and pilot and served in the Gulf War. He holds a Master in Public Affairs degree from Princeton University, where he was awarded a Fellowship at the Woodrow Wilson School, and is a Distinguished Graduate of the United States Air Force Academy with majors in Engineering and International Relations. Mr. Taiclet is a member of the Council on Foreign Relations, the Business Roundtable, the Business Council and the Commercial Club of Boston. He is also a member of the Digital Communications Governors Community of the World Economic Forum (Davos). He also serves as a member of the Executive Board of The National Association of Real Estate Investment Trusts (Nareit), the Board of Trustees of Brigham and Women’s Health Care, Inc., the Advisory Council for the Princeton University Woodrow Wilson School of Public and International Affairs, Lockheed Martin’s Board of Directors, the US India Business Council Board and the U.S.-India Strategic Partnership Forum Board. In August 2015, Mr. Taiclet was appointed to the U.S.-India CEO Forum, and, in October 2018, he was appointed Co-Chair of the U.S.-India CEO Forum by the U.S. Department of Commerce.
Thomas A. Bartlett
is our Executive Vice President and Chief Financial Officer. Mr. Bartlett also served as our Treasurer from February 2012 to December 2013, and again from July 2017 to August 2018. Prior to joining us in April 2009, Mr. Bartlett served as Senior Vice President and Corporate Controller with Verizon Communications, Inc. from November 2005 to March 2009. In this role, he was responsible for corporate-wide accounting, tax planning and compliance, SEC financial reporting, budget reporting and analysis and capital expenditures planning functions. Mr. Bartlett previously held the roles of Senior Vice President and Treasurer, as well as Senior Vice President Investor Relations. During his twenty-five year career with Verizon Communications and its predecessor companies and affiliates, he served in numerous operations and business development roles, including as the President and Chief Executive Officer of Bell Atlantic International Wireless from 1995 through 2000, where he was responsible for wireless activities in North America, Latin America, Europe and Asia, and was also an area President in Verizon’s U.S. wireless business responsible for all operational aspects in both the Northeast and Mid-Atlantic states. Mr. Bartlett began his career at Deloitte, Haskins & Sells. Mr. Bartlett currently serves on the board of directors of Equinix, Inc. Mr. Bartlett earned an M.B.A. from Rutgers University, a Bachelor of Science in Engineering from Lehigh University and became a Certified Public Accountant.
Edmund DiSanto
is our Executive Vice President, Chief Administrative Officer, General Counsel and Secretary. Prior to joining us in April 2007, Mr. DiSanto was with Pratt & Whitney, a unit of United Technologies Corporation. Mr. DiSanto started with United Technologies in 1989, where he first served as Assistant General Counsel of its Carrier subsidiary, then corporate Executive Assistant to the Chairman and Chief Executive Officer of United Technologies. From 1997, he held various legal and business roles at its Pratt & Whitney unit, including Deputy General Counsel and most recently, Vice President, Global Service Partners, Business Development. Prior to joining United Technologies, Mr. DiSanto served in a number of legal and related positions at United Dominion Industries and New England Electric Systems. Mr. DiSanto earned a J.D. from Boston College Law School and a Bachelor of Science from Northeastern University. In 2013, Mr. DiSanto became a member of the board of directors of the Business Council for International Understanding.
57
William H. Hess
is our Executive Vice President and Chairman, Latin America and EMEA. Mr. Hess served as our Executive Vice President, International Operations and President, Latin America and EMEA from March 2009 until October 2018, at which time he was appointed to his current position. Mr. Hess joined us in March 2001 as Chief Financial Officer of American Tower International and was appointed Executive Vice President in June 2001. Mr. Hess was appointed Executive Vice President, General Counsel in September 2002, and in February 2007, Mr. Hess was appointed Executive Vice President, International Operations. Mr. Hess relinquished the position of General Counsel in April 2007 when he was named President of our Latin American operations. In March 2009, Mr. Hess also became responsible for the Europe, Middle East and Africa (EMEA) territory. Prior to joining us, Mr. Hess had been a partner in the corporate and finance practice group of the law firm of King & Spalding LLP, which he joined in 1990. Prior to attending law school, Mr. Hess practiced as a Certified Public Accountant with Arthur Young & Co. Mr. Hess received a J.D. from Vanderbilt University School of Law and is a graduate of Harding University. Mr. Hess is on the Board of Trustees of the U.S.-Africa Business Center for the U.S. Chamber of Commerce and a participant of the World Economic Forum.
Robert J. Meyer, Jr.
is our Senior Vice President, Finance and Corporate Controller. Mr. Meyer joined us in August 2008. Prior to joining us, Mr. Meyer was with Bright Horizons Family Solutions since 1998, a provider of child care, early education and work/life consulting services, where he most recently served as Chief Accounting Officer. Mr. Meyer also served as Corporate Controller and Vice President of Finance while at Bright Horizons. Prior to that, from 1997 to 1998, Mr. Meyer served as Director of Financial Planning and Analysis at First Security Services Corp. Mr. Meyer earned a Masters in Finance from Bentley University and a Bachelor of Science in Accounting from Marquette University, and is also a Certified Public Accountant.
Olivier Puech
is our Executive Vice President and President, Latin America and EMEA. Mr. Puech joined us in 2013 as our Senior Vice President and CEO of Latin America and served in that role until October 2018 when he was appointed to his current position. Prior to joining us, Mr. Puech spent 25 years as a senior executive in the telecom and internet sectors of international organizations. Most recently, he was with Nokia where he held various leadership roles including Senior Vice President Americas, Senior Vice President Asia Pacific and Vice President Latin America. Before Nokia, Mr. Puech spent 12 years at Gemalto, where he last held the position of Vice President, Sales and Marketing with responsibility for South Europe, Eastern Europe and Latin America. Mr. Puech holds a bachelor’s degree in International Business Administration from Ecole Supérieure De Commerce in Marseille, in France. He is fluent in English, French, Spanish, Italian and Portuguese.
Amit Sharma
is our Executive Vice President and President, Asia. Mr. Sharma joined us in September 2007. Prior to joining us, since 1992, Mr. Sharma worked at Motorola, where he led country teams in India and Southeast Asia, including as Country President, India and as Head of Strategy, Asia-Pacific. Mr. Sharma also served on Motorola’s Asia-Pacific Board and was a member of its senior leadership team. Mr. Sharma also worked at GE Capital, serving as Vice President, Strategy and Business Development, and prior to that, with McKinsey, New York, serving as a core member of the firm's Electronics and Marketing Practices. Mr. Sharma earned an M.B.A. in International Business from the Wharton School, University of Pennsylvania, where he was on the Dean’s List and the Director’s Honors List. Mr. Sharma also holds a Master of Science in Computer Science from the Moore School, University of Pennsylvania, and a Bachelor of Technology in Mechanical Engineering from the Indian Institute of Technology.
Steven O. Vondran
is our Executive Vice President and President, U.S. Tower Division. Mr. Vondran joined us in 2000 as a member of our legal team and served in a variety of positions until August 2004 when he was appointed Senior Vice President of our U.S. Leasing Operations, where he oversaw project management, operational finance and national sales teams. Mr. Vondran served as Senior Vice President, General Counsel for our U.S. Tower Division from July 2010 to August 2018, at which time he was appointed to his current position. Prior to joining American Tower, Mr. Vondran had been an associate at the law firm of Lewellen & Frazier LLP, served as telecommunications consultant with the firm of Young & Associates, LLC and as a Law Clerk to the Honorable John Stroud on the Arkansas Court of Appeals. In September 2018, Mr. Vondran was appointed director of CTIA - the Wireless Association, and in October 2018, he was appointed chairperson of WIA - The Wireless Infrastructure Association, formerly known as PCIA. He received his J.D. with high honors from the University of Arkansas at Little Rock School of Law and is a graduate of Hendrix College.
The information under “Election of Directors” and “Section 16(a) Beneficial Ownership Reporting Compliance” from the Definitive Proxy Statement is incorporated herein by reference. Information required by this item pursuant to Item 407(c)(3) of SEC Regulation S-K relating to our procedures by which security holders may recommend nominees to our Board of Directors, and pursuant to Item 407(d)(4) and 407(d)(5) of SEC Regulation S-K relating to our audit committee financial experts and identification of the audit committee of our Board of Directors, is contained in the Definitive Proxy Statement under “Corporate Governance” and is incorporated herein by reference.
58
Information regarding our Code of Conduct applicable to our principal executive officer, our principal financial officer, our controller and other senior financial officers appears in Item 1 of this Annual Report under the caption “Business—Available Information.”
|
ITEM 11.
|
EXECUTIVE COMPENSATION
|
The information under “Compensation and Other Information Concerning Directors and Officers” from the Definitive Proxy Statement is incorporated herein by reference.
|
ITEM 12.
|
SECURITY OWNERSHIP OF CERTAIN BENEFICIAL OWNERS AND MANAGEMENT AND RELATED STOCKHOLDER MATTERS
|
The information under “Security Ownership of Certain Beneficial Owners and Management” and “Securities Authorized for Issuance Under Equity Compensation Plans” from the Definitive Proxy Statement is incorporated herein by reference.
|
ITEM 13.
|
CERTAIN RELATIONSHIPS AND RELATED TRANSACTIONS, AND DIRECTOR INDEPENDENCE
|
Information required by this item pursuant to Item 404 of SEC Regulation S-K relating to approval of related party transactions is contained in the Definitive Proxy Statement under “Corporate Governance” and is incorporated herein by reference.
Information required by this item pursuant to Item 407(a) of SEC Regulation S-K relating to director independence is contained in the Definitive Proxy Statement under “Corporate Governance” and is incorporated herein by reference.
|
ITEM 14.
|
PRINCIPAL ACCOUNTING FEES AND SERVICES
|
The information under “Independent Auditor Fees and Other Matters” from the Definitive Proxy Statement is incorporated herein by reference.
59
PART IV
|
ITEM 15.
|
EXHIBITS, FINANCIAL STATEMENT SCHEDULES
|
(a) The following documents are filed as a part of this report:
1.
Financial Statements.
See Index to Consolidated Financial Statements, which appears on page F-1 hereof. The financial statements listed in the accompanying Index to Consolidated Financial Statements are filed herewith in response to this Item.
2.
Financial Statement Schedules.
American Tower Corporation and Subsidiaries Schedule III – Schedule of Real Estate and Accumulated Depreciation is filed herewith in response to this Item.
3.
Exhibits.
See Index to Exhibits.
INDEX TO EXHIBITS
Pursuant to the rules and regulations of the SEC, the Company has filed certain agreements as exhibits to this Annual Report on Form 10-K. These agreements may contain representations and warranties by the parties. These representations and warranties have been made solely for the benefit of the other party or parties to such agreements and (i) may have been qualified by disclosures made to such other party or parties, (ii) were made only as of the date of such agreements or such other date(s) as may be specified in such agreements and are subject to more recent developments, which may not be fully reflected in the Company’s public disclosure, (iii) may reflect the allocation of risk among the parties to such agreements and (iv) may apply materiality standards different from what may be viewed as material to investors. Accordingly, these representations and warranties may not describe the Company’s actual state of affairs at the date hereof and should not be relied upon.
The exhibits below are included, either by being filed herewith or by incorporation by reference, as part of this Annual Report on Form 10-K. Exhibits are identified according to the number assigned to them in Item 601 of SEC Regulation S-K. Documents that are incorporated by reference are identified by their Exhibit number as set forth in the filing from which they are incorporated by reference. The filings of the Registrant from which various exhibits are incorporated by reference into this Annual Report are indicated by parenthetical numbering which corresponds to the following key:
|
(1
|
)
|
Annual Report on Form 10-K (File No. 001-14195) filed on April 2, 2001;
|
|
|
(2
|
)
|
Annual Report on Form 10-K (File No. 001-14195) filed on March 15, 2006;
|
|
|
(3
|
)
|
Tender Offer Statement on Schedule TO (File No. 005-55211) filed on November 29, 2006;
|
|
|
(4
|
)
|
Definitive Proxy Statement on Schedule 14A (File No. 001-14195) filed on March 22, 2007;
|
|
|
(5
|
)
|
Quarterly Report on Form 10-Q (File No. 001-14195) filed on August 6, 2008;
|
|
|
(6
|
)
|
Current Report on Form 8-K (File No. 001-14195) filed on March 5, 2009;
|
|
|
(7
|
)
|
Quarterly Report on Form 10-Q (File No. 001-14195) filed on May 8, 2009;
|
|
|
(8
|
)
|
Annual Report on Form 10-K (File No. 001-14195) filed on March 1, 2010;
|
|
|
(9
|
)
|
Registration Statement on Form S-3ASR (File No. 333-166805) filed on May 13, 2010;
|
|
|
(10
|
)
|
Quarterly Report on Form 10-Q (File No. 001-14195) filed on November 5, 2010;
|
|
|
(11
|
)
|
Current Report on Form 8-K (File No. 001-14195) filed on August 25, 2011;
|
|
|
(12
|
)
|
Current Report on Form 8-K (File No. 001-14195) filed on October 6, 2011;
|
|
|
(13
|
)
|
Current Report on Form 8-K (File No. 001-14195) filed on January 3, 2012;
|
|
|
(14
|
)
|
Current Report on Form 8-K (File No. 001-14195) filed on March 12, 2012;
|
|
|
(15
|
)
|
Current Report on Form 8-K (File No. 001-14195) filed on January 8, 2013;
|
|
|
(16
|
)
|
Annual Report on Form 10-K (File No. 001-14195) filed on February 27, 2013;
|
|
|
(17
|
)
|
Quarterly Report on Form 10-Q (File No. 001-14195) filed on May 1, 2013;
|
|
60
|
(18
|
)
|
Registration Statement on Form S-3ASR (File No. 333-188812) filed on May 23, 2013;
|
|
|
(19
|
)
|
Quarterly Report on Form 10-Q (File No. 001-14195) filed on July 31, 2013;
|
|
|
(20
|
)
|
Current Report on Form 8-K (File No. 001-14195) filed on August 19, 2013;
|
|
|
(21
|
)
|
Quarterly Report on Form 10-Q (File No. 001-14195) filed on October 30, 2013;
|
|
|
(22
|
)
|
Current Report on Form 8-K (File No. 001-14195) filed on May 12, 2014;
|
|
|
(23
|
)
|
Current Report on Form 8-K (File No. 001-14195) filed on August 7, 2014;
|
|
|
(24
|
)
|
Quarterly Report on Form 10-Q (File No. 001-14195) filed on October 30, 2014;
|
|
|
(25
|
)
|
Current Report on Form 8-K (File No. 001-14195) filed on February 23, 2015;
|
|
|
(26
|
)
|
Annual Report on Form 10-K (File No. 001-14195) filed on February 24, 2015;
|
|
|
(27
|
)
|
Current Report on Form 8-K (File No. 001-14195) filed on March 3, 2015;
|
|
|
(28
|
)
|
Quarterly Report on Form 10-Q (File No. 001-14195) filed on April 30, 2015;
|
|
|
(29
|
)
|
Current Report on Form 8-K (File No. 001-14195) filed on May 7, 2015;
|
|
|
(30
|
)
|
Quarterly Report on Form 10-Q (File No. 001-14195) filed on July 29, 2015;
|
|
|
(31
|
)
|
Current Report on Form 8-K (File No. 001-14195) filed on January 12, 2016;
|
|
|
(32
|
)
|
Current Report on Form 8-K (File No. 001-14195) filed on February 16, 2016;
|
|
|
(33
|
)
|
Annual Report on Form 10-K (File No. 001-14195) filed on February 26, 2016;
|
|
|
(34
|
)
|
Current Report on Form 8-K (File No. 001-14195) filed on March 9, 2016;
|
|
|
(35
|
)
|
Current Report on Form 8-K (File No. 001-14195) filed on May 13, 2016;
|
|
|
(36
|
)
|
Current Report on Form 8-K (File No. 001-14195) filed on September 30, 2016;
|
|
|
(37
|
)
|
Annual Report on Form 10-K (File No. 001-14195) filed on February 27, 2017;
|
|
|
(38
|
)
|
Current Report on Form 8-K (File No. 001-14195) filed on March 14, 2017;
|
|
|
(39
|
)
|
Current Report on Form 8-K (File No. 001-14195) filed on April 6, 2017;
|
|
|
(40
|
)
|
Current Report on Form 8-K (File No. 001-14195) filed on June 30, 2017;
|
|
|
(41
|
)
|
Current Report on Form 8-K (File No. 001-14195) filed on December 8, 2017;
|
|
|
(42
|
)
|
Annual Report on Form 10-K (File No. 001-14195) filed on February 27, 2018;
|
|
|
(43
|
)
|
Quarterly Report on Form 10-Q (File No. 001-14195) filed on May 2, 2018;
|
|
|
(44
|
)
|
Current Report on Form 8-K (File No. 001-14195) filed on May 22, 2018; and
|
|
|
(45
|
)
|
Current Report on Form 8-K (File No. 001-14195) filed on July 31, 2018.
|
|
61
|
Exhibit No.
|
|
Description of Document
|
|
Exhibit File No.
|
|
2.1
|
|
|
2.1 (11)
|
|
|
3.1
|
|
|
3.1 (13)
|
|
|
3.2
|
|
|
3.2 (13)
|
|
|
3.3
|
|
|
3.1 (32)
|
|
|
4.1
|
|
|
4.3 (9)
|
|
|
4.2
|
4.12 (18)
|
|||
|
4.3
|
|
|
4 (10)
|
|
|
4.4
|
|
|
4.1 (12)
|
|
|
4.5
|
|
|
4.6 (13)
|
|
|
4.6
|
|
|
4.1 (14)
|
|
|
4.7
|
|
|
4.1 (15)
|
|
|
4.8
|
4.1 (20)
|
|||
|
4.9
|
4.1 (23)
|
|||
|
4.10
|
4.1 (29)
|
|||
|
4.11
|
4.1 (31)
|
|||
|
4.12
|
4.1 (35)
|
|||
|
4.13
|
4.1 (36)
|
|||
62
|
Exhibit No.
|
|
Description of Document
|
|
Exhibit File No.
|
|
4.14
|
4.1 (39)
|
|||
|
4.15
|
4.1 (40)
|
|||
|
4.16
|
4.1 (41)
|
|||
|
4.17
|
4.1(44)
|
|||
|
4.18
|
3.1 (22)
|
|||
|
4.19
|
3.1 (27)
|
|||
|
4.20
|
4.1 (27)
|
|||
|
4.21
|
4.2 (30)
|
|||
|
4.22
|
4.3 (30)
|
|||
|
4.23
|
4.4 (30)
|
|||
|
10.1
|
|
|
(d)(1) (3)*
|
|
|
10.2
|
|
|
10.5 (8)
|
|
|
10.3
|
|
|
Annex A (4)*
|
|
|
10.4
|
10.1 (38)
|
|||
|
10.5
|
|
|
10.6 (16)*
|
|
|
10.6
|
10.31 (16)*
|
|||
|
10.7
|
|
|
10.8 (16)*
|
|
63
|
Exhibit No.
|
|
Description of Document
|
|
Exhibit File No.
|
|
10.8
|
|
|
10.9 (16)*
|
|
|
10.9
|
10.1 (34)*
|
|||
|
10.10
|
Filed herewith as Exhibit 10.10*
|
|||
|
10.11
|
Filed herewith as Exhibit 10.11*
|
|||
|
10.12
|
10.2 (34)*
|
|||
|
10.13
|
10.1 (45)*
|
|||
|
10.14
|
Filed herewith as Exhibit 10.14*
|
|||
|
10.15
|
|
|
10.10 (2)*
|
|
|
10.16
|
|
|
10.1 (5)*
|
|
|
10.17
|
|
|
10.2 (43)
|
|
|
10.18
|
|
|
10.2 (17)
|
|
|
10.19
|
|
|
10.3 (43)
|
|
|
10.20
|
|
|
10.4 (43)
|
|
|
10.21
|
|
|
2.1 (1)
|
|
|
10.22
|
|
|
2.2 (1)
|
|
64
|
Exhibit No.
|
|
Description of Document
|
|
Exhibit File No.
|
|
10.23
|
|
|
10.2
|
|
|
10.24
|
|
|
10.7 (7)**
|
|
|
10.25
|
*
|
|||
|
10.26
|
|
|
10.4 (6)
|
|
|
10.27
|
|
|
10.35 (8)*
|
|
|
10.28
|
|
|
10.36 (8)*
|
|
|
10.29
|
10.2 (38)*
|
|||
|
10.30
|
10.5(43)*
|
|||
|
10.31
|
Filed herewith as Exhibit 10.31*
|
|||
|
10.32
|
Filed herewith as Exhibit 10.32*
|
|||
|
10.33
|
|
|
10.3 (38)*
|
|
|
10.34
|
|
|
10.1 (19)
|
|
|
10.35
|
10.7 (21)
|
|||
|
10.36
|
10.8 (21)
|
|||
|
10.37
|
10.1 (24)
|
|||
65
|
Exhibit No.
|
|
Description of Document
|
|
Exhibit File No.
|
|
10.38
|
10.2 (24)
|
|||
|
10.39
|
10.3 (24)
|
|||
|
10.40
|
10.51 (26)
|
|||
|
10.41
|
10.52 (26)
|
|||
|
10.42
|
10.53 (26)
|
|||
|
10.43
|
10.54 (26)
|
|||
|
10.44
|
10.55 (26)
|
|||
|
10.45
|
10.56 (26)
|
|||
|
10.46
|
10.43 (33)
|
|||
|
10.47
|
10.44 (33)
|
|||
|
10.48
|
10.45 (33)
|
|||
|
10.49
|
10.44 (37)
|
|||
|
10.50
|
10.45 (37)
|
|||
|
10.51
|
10.46 (37)
|
|||
66
|
Exhibit No.
|
|
Description of Document
|
|
Exhibit File No.
|
|
10.52
|
10.46(42)
|
|||
|
10.53
|
10.47(42)
|
|||
|
10.54
|
10.48(42)
|
|||
|
10.55
|
10.1(43)
|
|||
|
10.56
|
Filed herewith as Exhibit 10.56
|
|||
|
10.57
|
Filed herewith as Exhibit 10.57
|
|||
|
10.58
|
Filed herewith as Exhibit 10.58
|
|||
|
10.59
|
Filed herewith as Exhibit 10.59
|
|||
|
10.60
|
10.45 (26)
|
|||
|
10.61
|
10.8 (28)
|
|||
|
10.62
|
10.9 (28)
|
|||
|
10.63
|
10.10 (28)
|
|||
|
10.64
|
10.11 (28)
|
|||
|
10.65
|
10.52 (33)
|
|||
|
10.66
|
10.53 (33)
|
|||
|
21
|
|
|
Filed herewith as
Exhibit 21
|
|
67
|
Exhibit No.
|
|
Description of Document
|
|
Exhibit File No.
|
|
23
|
|
|
Filed herewith as
Exhibit 23
|
|
|
31.1
|
|
|
Filed herewith as
Exhibit 31.1
|
|
|
31.2
|
|
|
Filed herewith as
Exhibit 31.2
|
|
|
32
|
|
|
Filed herewith as
Exhibit 32
|
|
|
101
|
|
The following materials from American Tower Corporation’s Annual Report on Form 10-K for the year ended December 31, 2011, formatted in XBRL (Extensible Business Reporting Language):
101.INS—XBRL Instance Document
101.SCH—XBRL Taxonomy Extension Schema Document
101.CAL—XBRL Taxonomy Extension Calculation Linkbase Document
101.LAB—XBRL Taxonomy Extension Label Linkbase Document
101.PRE—XBRL Taxonomy Extension Presentation Linkbase Document
101.DEF—XTRL Taxonomy Extension Definition
|
|
Filed herewith
as Exhibit 101
|
|
*
|
Management contracts and compensatory plans and arrangements required to be filed as exhibits to this Form 10-K pursuant to Item 15(a)(3).
|
|
**
|
The exhibit has been filed separately with the Commission pursuant to an application for confidential treatment. The confidential portions of the exhibit have been omitted and are marked by an asterisk.
|
|
ITEM 16.
|
FORM 10-K SUMMARY
|
None.
68
SIGNATURES
Pursuant to the requirements of Section 13 or 15(d) of the Securities Exchange Act of 1934, the Registrant has duly caused this report to be signed on its behalf by the undersigned, thereunto duly authorized on the 27th day of February,
2019
.
|
A
MERICAN
T
OWER
C
ORPORATION
|
||||
|
|
By:
|
/
S
/
JAMES D. TAICLET, JR.
|
||
|
|
James D. Taiclet, Jr.
Chairman, President and Chief Executive Officer
|
|||
Pursuant to the requirements of the Securities Exchange Act of 1934, this report has been duly signed below by the following persons on behalf of the Registrant and in the capacities and on the dates indicated.
|
Signature
|
|
Title
|
|
Date
|
|
/
S
/
JAMES D. TAICLET, JR.
|
Chairman, President and Chief Executive Officer (Principal Executive Officer)
|
February 27, 2019
|
||
|
James D. Taiclet, Jr.
|
|
|
||
|
/
S
/
THOMAS A. BARTLETT
|
Executive Vice President and Chief Financial Officer (Principal Financial Officer)
|
February 27, 2019
|
||
|
Thomas A. Bartlett
|
|
|||
|
/
S
/
ROBERT J. MEYER, JR
|
Senior Vice President, Finance and Corporate Controller (Principal Accounting Officer)
|
February 27, 2019
|
||
|
Robert J. Meyer, Jr.
|
|
|
||
|
/
S
/
RAYMOND P. DOLAN
|
Director
|
February 27, 2019
|
||
|
Raymond P. Dolan
|
|
|
||
|
/
S
/
ROBERT D. HORMATS
|
Director
|
February 27, 2019
|
||
|
Robert D. Hormats
|
|
|
||
|
/
S
/
GUSTAVO LARA CANTU
|
Director
|
February 27, 2019
|
||
|
Gustavo Lara Cantu
|
|
|
||
|
/
S
/
GRACE D. LIEBLEIN
|
Director
|
February 27, 2019
|
||
|
Grace D. Lieblein
|
|
|
||
|
/
S
/
CRAIG MACNAB
|
Director
|
February 27, 2019
|
||
|
Craig Macnab
|
||||
|
/
S
/
JOANN A. REED
|
Director
|
February 27, 2019
|
||
|
JoAnn A. Reed
|
|
|
||
|
/
S
/
PAMELA D. A. REEVE
|
Director
|
February 27, 2019
|
||
|
Pamela D. A. Reeve
|
|
|
||
|
/
S
/
DAVID E. SHARBUTT
|
Director
|
February 27, 2019
|
||
|
David E. Sharbutt
|
|
|
||
|
/
S
/
SAMME L. THOMPSON
|
Director
|
February 27, 2019
|
||
|
Samme L. Thompson
|
|
|
||
69
AMERICAN TOWER CORPORATION AND SUBSIDIARIES
INDEX TO CONSOLIDATED FINANCIAL STATEMENTS
|
|
Page
|
|
|
|
||
|
|
||
|
|
||
|
|
||
|
|
||
|
|
||
|
|
||
F-1
REPORT OF INDEPENDENT REGISTERED PUBLIC ACCOUNTING FIRM
To the Stockholders and the Board of Directors of American Tower Corporation
Opinion on the Financial Statements
We have audited the accompanying consolidated balance sheets of American Tower Corporation and subsidiaries (the “Company”) as of December 31, 2018 and 2017, the related consolidated statements of operations, comprehensive income, equity, and cash flows for each of the three years in the period ended December 31, 2018, and the related notes and the schedule listed in the Index at Item 15 (collectively referred to as the “financial statements”). In our opinion, the financial statements present fairly, in all material respects, the financial position of the Company as of December 31, 2018 and 2017, and the results of its operations and its cash flows for each of the three years in the period ended December 31, 2018, in conformity with accounting principles generally accepted in the United States of America.
We have also audited, in accordance with the standards of the Public Company Accounting Oversight Board (United States) (PCAOB), the Company's internal control over financial reporting as of December 31, 2018, based on criteria established in
Internal Control - Integrated Framework (2013)
issued by the Committee of Sponsoring Organizations of the Treadway Commission and our report dated February 27, 2019, expressed an unqualified opinion on the Company's internal control over financial reporting.
Basis for Opinion
These financial statements are the responsibility of the Company's management. Our responsibility is to express an opinion on the Company's financial statements based on our audits. We are a public accounting firm registered with the PCAOB and are required to be independent with respect to the Company in accordance with the U.S. federal securities laws and the applicable rules and regulations of the Securities and Exchange Commission and the PCAOB.
We conducted our audits in accordance with the standards of the PCAOB. Those standards require that we plan and perform the audit to obtain reasonable assurance about whether the financial statements are free of material misstatement, whether due to error or fraud. Our audits included performing procedures to assess the risks of material misstatement of the financial statements, whether due to error or fraud, and performing procedures that respond to those risks. Such procedures included examining, on a test basis, evidence regarding the amounts and disclosures in the financial statements. Our audits also included evaluating the accounting principles used and significant estimates made by management, as well as evaluating the overall presentation of the financial statements. We believe that our audits provide a reasonable basis for our opinion.
/s/ Deloitte & Touche LLP
Boston, Massachusetts
February 27, 2019
We have served as the Company's auditor since 1997.
F-2
AMERICAN TOWER CORPORATION AND SUBSIDIARIES
CONSOLIDATED BALANCE SHEETS
(in millions, except share count and per share data)
|
December 31, 2018
|
December 31, 2017
|
|||||||
|
ASSETS
|
||||||||
|
CURRENT ASSETS:
|
||||||||
|
Cash and cash equivalents
|
$
|
1,208.7
|
|
$
|
802.1
|
|
||
|
Restricted cash
|
96.2
|
|
152.8
|
|
||||
|
Short-term investments
|
—
|
|
1.0
|
|
||||
|
Accounts receivable, net
|
459.0
|
|
513.6
|
|
||||
|
Prepaid and other current assets
|
621.2
|
|
568.6
|
|
||||
|
Total current assets
|
2,385.1
|
|
2,038.1
|
|
||||
|
PROPERTY AND EQUIPMENT, net
|
11,247.1
|
|
11,101.0
|
|
||||
|
GOODWILL
|
5,501.9
|
|
5,638.4
|
|
||||
|
OTHER INTANGIBLE ASSETS, net
|
11,174.3
|
|
11,783.3
|
|
||||
|
DEFERRED TAX ASSET
|
157.7
|
|
204.4
|
|
||||
|
DEFERRED RENT ASSET
|
1,581.7
|
|
1,499.0
|
|
||||
|
NOTES RECEIVABLE AND OTHER NON-CURRENT ASSETS
|
962.6
|
|
950.1
|
|
||||
|
TOTAL
|
$
|
33,010.4
|
|
$
|
33,214.3
|
|
||
|
LIABILITIES
|
||||||||
|
CURRENT LIABILITIES:
|
||||||||
|
Accounts payable
|
$
|
130.8
|
|
$
|
142.9
|
|
||
|
Accrued expenses
|
948.3
|
|
854.3
|
|
||||
|
Distributions payable
|
377.4
|
|
304.4
|
|
||||
|
Accrued interest
|
174.5
|
|
166.9
|
|
||||
|
Current portion of long-term obligations
|
2,754.8
|
|
774.8
|
|
||||
|
Unearned revenue
|
304.1
|
|
268.8
|
|
||||
|
Total current liabilities
|
4,689.9
|
|
2,512.1
|
|
||||
|
LONG-TERM OBLIGATIONS
|
18,405.1
|
|
19,430.3
|
|
||||
|
ASSET RETIREMENT OBLIGATIONS
|
1,210.0
|
|
1,175.3
|
|
||||
|
DEFERRED TAX LIABILITY
|
535.9
|
|
898.1
|
|
||||
|
OTHER NON-CURRENT LIABILITIES
|
1,265.1
|
|
1,244.2
|
|
||||
|
Total liabilities
|
26,106.0
|
|
25,260.0
|
|
||||
|
COMMITMENTS AND CONTINGENCIES
|
|
|
|
|
||||
|
REDEEMABLE NONCONTROLLING INTERESTS
|
1,004.8
|
|
1,126.2
|
|
||||
|
EQUITY (shares in thousands):
|
||||||||
|
Preferred stock: $.01 par value; 20,000 shares authorized;
|
||||||||
|
5.50%, Series B, 1,375 shares issued, 0 and 1,375 shares outstanding; aggregate liquidation value of $0.0 and $1.4, respectively
|
—
|
|
0.0
|
|
||||
|
Common stock: $.01 par value; 1,000,000 shares authorized; 451,617 and 437,729 shares issued; and 441,060 and 428,820 shares outstanding, respectively
|
4.5
|
|
4.4
|
|
||||
|
Additional paid-in capital
|
10,380.8
|
|
10,247.5
|
|
||||
|
Distributions in excess of earnings
|
(1,199.5
|
)
|
(1,058.1
|
)
|
||||
|
Accumulated other comprehensive loss
|
(2,642.9
|
)
|
(1,978.3
|
)
|
||||
|
Treasury stock (10,557 and 8,909 shares at cost, respectively)
|
(1,206.8
|
)
|
(974.0
|
)
|
||||
|
Total American Tower Corporation equity
|
5,336.1
|
|
6,241.5
|
|
||||
|
Noncontrolling interests
|
563.5
|
|
586.6
|
|
||||
|
Total equity
|
5,899.6
|
|
6,828.1
|
|
||||
|
TOTAL
|
$
|
33,010.4
|
|
$
|
33,214.3
|
|
||
F-3
AMERICAN TOWER CORPORATION AND SUBSIDIARIES
CONSOLIDATED STATEMENTS OF OPERATIONS
(in millions, except share and per share data)
|
|
Year Ended December 31,
|
||||||||||
|
|
2018
|
2017
|
2016
|
||||||||
|
REVENUES:
|
|||||||||||
|
Property
|
$
|
7,314.7
|
|
$
|
6,565.9
|
|
$
|
5,713.1
|
|
||
|
Services
|
125.4
|
|
98.0
|
|
72.6
|
|
|||||
|
Total operating revenues
|
7,440.1
|
|
6,663.9
|
|
5,785.7
|
|
|||||
|
OPERATING EXPENSES:
|
|||||||||||
|
Costs of operations (exclusive of items shown separately below):
|
|||||||||||
|
Property (including stock-based compensation expense of $2.4, $2.1 and $1.7, respectively)
|
2,128.7
|
|
2,022.0
|
|
1,762.7
|
|
|||||
|
Services (including stock-based compensation expense of $0.9, $0.8 and $0.7, respectively)
|
49.1
|
|
34.6
|
|
27.7
|
|
|||||
|
Depreciation, amortization and accretion
|
2,110.8
|
|
1,715.9
|
|
1,525.6
|
|
|||||
|
Selling, general, administrative and development expense (including stock-based compensation expense of $134.2, $105.6, and $87.5, respectively)
|
733.2
|
|
637.0
|
|
543.4
|
|
|||||
|
Other operating expenses
|
513.3
|
|
256.0
|
|
73.3
|
|
|||||
|
Total operating expenses
|
5,535.1
|
|
4,665.5
|
|
3,932.7
|
|
|||||
|
OPERATING INCOME
|
1,905.0
|
|
1,998.4
|
|
1,853.0
|
|
|||||
|
OTHER INCOME (EXPENSE):
|
|||||||||||
|
Interest (expense) income, TV Azteca, each net of interest expense of $1.2
|
(0.1
|
)
|
10.8
|
|
10.9
|
|
|||||
|
Interest income
|
54.7
|
|
35.4
|
|
25.6
|
|
|||||
|
Interest expense
|
(825.5
|
)
|
(749.6
|
)
|
(717.1
|
)
|
|||||
|
(Loss) gain on retirement of long-term obligations
|
(3.3
|
)
|
(70.2
|
)
|
1.2
|
|
|||||
|
Other income (expense) (including foreign currency (losses) gains of ($4.5), $26.4, and ($48.9), respectively)
|
23.8
|
|
31.3
|
|
(47.7
|
)
|
|||||
|
Total other expense
|
(750.4
|
)
|
(742.3
|
)
|
(727.1
|
)
|
|||||
|
INCOME FROM CONTINUING OPERATIONS BEFORE INCOME TAXES
|
1,154.6
|
|
1,256.1
|
|
1,125.9
|
|
|||||
|
Income tax benefit (provision)
|
110.1
|
|
(30.7
|
)
|
(155.5
|
)
|
|||||
|
NET INCOME
|
1,264.7
|
|
1,225.4
|
|
970.4
|
|
|||||
|
Net (income) loss attributable to noncontrolling interests
|
(28.3
|
)
|
13.5
|
|
(14.0
|
)
|
|||||
|
NET INCOME ATTRIBUTABLE TO AMERICAN TOWER CORPORATION STOCKHOLDERS
|
1,236.4
|
|
1,238.9
|
|
956.4
|
|
|||||
|
Dividends on preferred stock
|
(9.4
|
)
|
(87.4
|
)
|
(107.1
|
)
|
|||||
|
NET INCOME ATTRIBUTABLE TO AMERICAN TOWER CORPORATION COMMON STOCKHOLDERS
|
$
|
1,227.0
|
|
$
|
1,151.5
|
|
$
|
849.3
|
|
||
|
NET INCOME PER COMMON SHARE AMOUNTS:
|
|||||||||||
|
Basic net income attributable to American Tower Corporation common stockholders
|
$
|
2.79
|
|
$
|
2.69
|
|
$
|
2.00
|
|
||
|
Diluted net income attributable to American Tower Corporation common stockholders
|
$
|
2.77
|
|
$
|
2.67
|
|
$
|
1.98
|
|
||
|
WEIGHTED AVERAGE COMMON SHARES OUTSTANDING (in thousands):
|
|||||||||||
|
BASIC
|
439,606
|
|
428,181
|
|
425,143
|
|
|||||
|
DILUTED
|
442,960
|
|
431,688
|
|
429,283
|
|
|||||
See accompanying notes to consolidated financial statements.
F-4
AMERICAN TOWER CORPORATION AND SUBSIDIARIES
CONSOLIDATED STATEMENTS OF COMPREHENSIVE INCOME
(in millions)
|
|
Year Ended December 31,
|
|||||||||||
|
|
2018
|
2017
|
2016
|
|||||||||
|
Net income
|
$
|
1,264.7
|
|
$
|
1,225.4
|
|
$
|
970.4
|
|
|||
|
Other comprehensive (loss) income:
|
||||||||||||
|
Changes in fair value of cash flow hedges, each net of tax expense of $0
|
(0.1
|
)
|
(0.4
|
)
|
(0.4
|
)
|
||||||
|
Reclassification of unrealized losses on cash flow hedges to net income, each net of tax expense of $0
|
0.3
|
|
(0.1
|
)
|
(0.3
|
)
|
||||||
|
Adjustment to redeemable noncontrolling interest
|
78.8
|
|
—
|
|
—
|
|
||||||
|
Purchase of noncontrolling interest
|
0.5
|
|
—
|
|
—
|
|
||||||
|
Foreign currency translation adjustments, net of tax (benefit) expense of ($2.6), $1.0, and $3.8, respectively
|
(869.3
|
)
|
144.4
|
|
(202.9
|
)
|
||||||
|
Other comprehensive (loss) income
|
(789.8
|
)
|
143.9
|
|
(203.6
|
)
|
||||||
|
Comprehensive income
|
474.9
|
|
1,369.3
|
|
766.8
|
|
||||||
|
Comprehensive loss (income) attributable to non-controlling interest
|
96.9
|
|
(109.4
|
)
|
18.2
|
|
||||||
|
Comprehensive income attributable to American Tower Corporation stockholders
|
$
|
571.8
|
|
$
|
1,259.9
|
|
$
|
785.0
|
|
|||
See accompanying notes to consolidated financial statements.
F-5
AMERICAN TOWER CORPORATION AND SUBSIDIARIES
CONSOLIDATED STATEMENTS OF EQUITY
(in millions, share counts in thousands)
|
|
Preferred Stock - Series A
|
Preferred Stock - Series B
|
Common Stock
|
Treasury Stock
|
Additional
Paid-in
Capital
|
Accumulated Other
Comprehensive
Loss
|
Distributions
in Excess of
Earnings
|
Noncontrolling
Interest
|
Total
Equity
|
||||||||||||||||||||||||||||||||||||||
|
|
Issued Shares
|
Amount
|
Issued Shares
|
Amount
|
Issued
Shares
|
Amount
|
Shares
|
Amount
|
|||||||||||||||||||||||||||||||||||||||
|
BALANCE, JANUARY 1, 2016
|
6,000
|
|
$
|
0.1
|
|
1,375
|
|
$
|
0.0
|
|
426,695
|
|
$
|
4.3
|
|
(2,810
|
)
|
$
|
(207.7
|
)
|
$
|
9,690.6
|
|
$
|
(1,837.0
|
)
|
$
|
(998.5
|
)
|
$
|
61.0
|
|
$
|
6,712.8
|
|
||||||||||||
|
Stock-based compensation related activity
|
—
|
|
—
|
|
—
|
|
—
|
|
1,959
|
|
0.0
|
|
—
|
|
—
|
|
155.1
|
|
—
|
|
—
|
|
—
|
|
155.1
|
|
|||||||||||||||||||||
|
Issuance of common stock—stock purchase plan
|
—
|
|
—
|
|
—
|
|
—
|
|
88
|
|
0.0
|
|
—
|
|
—
|
|
7.5
|
|
—
|
|
—
|
|
—
|
|
7.5
|
|
|||||||||||||||||||||
|
Issuance of common stock
|
—
|
|
—
|
|
—
|
|
—
|
|
1,171
|
|
0.0
|
|
—
|
|
—
|
|
120.8
|
|
—
|
|
—
|
|
—
|
|
120.8
|
|
|||||||||||||||||||||
|
Changes in fair value of cash flow hedges, net of tax
|
—
|
|
—
|
|
—
|
|
—
|
|
—
|
|
—
|
|
—
|
|
—
|
|
—
|
|
(0.4
|
)
|
—
|
|
—
|
|
(0.4
|
)
|
|||||||||||||||||||||
|
Reclassification of unrealized gains on cash flow hedges to net income, net of tax
|
—
|
|
—
|
|
—
|
|
—
|
|
—
|
|
—
|
|
—
|
|
—
|
|
—
|
|
(0.3
|
)
|
—
|
|
—
|
|
(0.3
|
)
|
|||||||||||||||||||||
|
Foreign currency translation adjustment, net of tax
|
—
|
|
—
|
|
—
|
|
—
|
|
—
|
|
—
|
|
—
|
|
—
|
|
—
|
|
(170.7
|
)
|
—
|
|
(8.7
|
)
|
(179.4
|
)
|
|||||||||||||||||||||
|
Contributions from noncontrolling interest
|
—
|
|
—
|
|
—
|
|
—
|
|
—
|
|
—
|
|
—
|
|
—
|
|
69.5
|
|
9.1
|
|
—
|
|
160.9
|
|
239.5
|
|
|||||||||||||||||||||
|
Distributions to noncontrolling interest
|
—
|
|
—
|
|
—
|
|
—
|
|
—
|
|
—
|
|
—
|
|
—
|
|
—
|
|
—
|
|
—
|
|
(1.0
|
)
|
(1.0
|
)
|
|||||||||||||||||||||
|
Common stock distributions declared
|
—
|
|
—
|
|
—
|
|
—
|
|
—
|
|
—
|
|
—
|
|
—
|
|
—
|
|
—
|
|
(927.8
|
)
|
—
|
|
(927.8
|
)
|
|||||||||||||||||||||
|
Preferred stock dividends declared
|
—
|
|
—
|
|
—
|
|
—
|
|
—
|
|
—
|
|
—
|
|
—
|
|
—
|
|
—
|
|
(107.1
|
)
|
—
|
|
(107.1
|
)
|
|||||||||||||||||||||
|
Net income
|
—
|
|
—
|
|
—
|
|
—
|
|
—
|
|
—
|
|
—
|
|
—
|
|
—
|
|
—
|
|
956.4
|
|
0.1
|
|
956.5
|
|
|||||||||||||||||||||
|
BALANCE, DECEMBER 31, 2016
|
6,000
|
|
$
|
0.1
|
|
1,375
|
|
$
|
0.0
|
|
429,913
|
|
$
|
4.3
|
|
(2,810
|
)
|
$
|
(207.7
|
)
|
$
|
10,043.5
|
|
$
|
(1,999.3
|
)
|
$
|
(1,077.0
|
)
|
$
|
212.3
|
|
$
|
6,976.2
|
|
||||||||||||
|
Stock-based compensation related activity
|
—
|
|
—
|
|
—
|
|
—
|
|
2,121
|
|
0.0
|
|
—
|
|
—
|
|
195.0
|
|
—
|
|
—
|
|
—
|
|
195.0
|
|
|||||||||||||||||||||
|
Issuance of common stock- stock purchase plan
|
—
|
|
—
|
|
—
|
|
—
|
|
93
|
|
0.0
|
|
—
|
|
—
|
|
9.0
|
|
—
|
|
—
|
|
—
|
|
9.0
|
|
|||||||||||||||||||||
|
Conversion of preferred stock
|
(6,000
|
)
|
(0.1
|
)
|
0
|
|
0.0
|
|
5,602
|
|
0.1
|
|
—
|
|
—
|
|
0.0
|
|
—
|
|
—
|
|
—
|
|
0.0
|
|
|||||||||||||||||||||
|
Treasury stock activity
|
—
|
|
—
|
|
—
|
|
—
|
|
—
|
|
—
|
|
(6,099
|
)
|
(766.3
|
)
|
—
|
|
—
|
|
—
|
|
—
|
|
(766.3
|
)
|
|||||||||||||||||||||
|
Changes in fair value of cash flow hedges, net of tax
|
—
|
|
—
|
|
—
|
|
—
|
|
—
|
|
—
|
|
—
|
|
—
|
|
—
|
|
(0.4
|
)
|
—
|
|
—
|
|
(0.4
|
)
|
|||||||||||||||||||||
|
Reclassification of unrealized gains on cash flow hedges to net income, net of tax
|
—
|
|
—
|
|
—
|
|
—
|
|
—
|
|
—
|
|
—
|
|
—
|
|
—
|
|
(0.1
|
)
|
—
|
|
—
|
|
(0.1
|
)
|
|||||||||||||||||||||
|
Foreign currency translation adjustment, net of tax
|
—
|
|
—
|
|
—
|
|
—
|
|
—
|
|
—
|
|
—
|
|
—
|
|
—
|
|
21.5
|
|
—
|
|
54.6
|
|
76.1
|
|
|||||||||||||||||||||
|
Contributions from noncontrolling interest
|
—
|
|
—
|
|
—
|
|
—
|
|
—
|
|
—
|
|
—
|
|
—
|
|
—
|
|
—
|
|
—
|
|
314.1
|
|
314.1
|
|
|||||||||||||||||||||
|
Distributions to noncontrolling interest
|
—
|
|
—
|
|
—
|
|
—
|
|
—
|
|
—
|
|
—
|
|
—
|
|
—
|
|
—
|
|
—
|
|
(14.3
|
)
|
(14.3
|
)
|
|||||||||||||||||||||
|
Common stock distributions declared
|
—
|
|
—
|
|
—
|
|
—
|
|
—
|
|
—
|
|
—
|
|
—
|
|
—
|
|
—
|
|
(1,128.6
|
)
|
—
|
|
(1,128.6
|
)
|
|||||||||||||||||||||
|
Preferred stock dividends declared
|
—
|
|
—
|
|
—
|
|
—
|
|
—
|
|
—
|
|
—
|
|
—
|
|
—
|
|
—
|
|
(91.4
|
)
|
—
|
|
(91.4
|
)
|
|||||||||||||||||||||
|
Net income
|
—
|
|
—
|
|
—
|
|
—
|
|
—
|
|
—
|
|
—
|
|
—
|
|
—
|
|
—
|
|
1,238.9
|
|
19.9
|
|
1,258.8
|
|
|||||||||||||||||||||
|
BALANCE, DECEMBER 31, 2017
|
—
|
|
$
|
—
|
|
1,375
|
|
$
|
0.0
|
|
437,729
|
|
$
|
4.4
|
|
(8,909
|
)
|
$
|
(974.0
|
)
|
$
|
10,247.5
|
|
$
|
(1,978.3
|
)
|
$
|
(1,058.1
|
)
|
$
|
586.6
|
|
$
|
6,828.1
|
|
||||||||||||
|
Stock-based compensation related activity
|
—
|
|
—
|
|
—
|
|
—
|
|
1,782
|
|
0.0
|
|
—
|
|
—
|
|
190.4
|
|
—
|
|
—
|
|
—
|
|
190.4
|
|
|||||||||||||||||||||
|
Issuance of common stock—stock purchase plan
|
—
|
|
—
|
|
—
|
|
—
|
|
86
|
|
0.0
|
|
—
|
|
—
|
|
10.2
|
|
—
|
|
—
|
|
—
|
|
10.2
|
|
|||||||||||||||||||||
|
Conversion of preferred stock
|
—
|
|
—
|
|
(1,375
|
)
|
0.0
|
|
12,020
|
|
0.1
|
|
—
|
|
—
|
|
(0.1
|
)
|
—
|
|
—
|
|
—
|
|
0.0
|
|
|||||||||||||||||||||
|
Treasury stock activity
|
—
|
|
—
|
|
—
|
|
—
|
|
—
|
|
—
|
|
(1,648
|
)
|
(232.8
|
)
|
—
|
|
—
|
|
—
|
|
—
|
|
(232.8
|
)
|
|||||||||||||||||||||
|
Changes in fair value of cash flow hedges, net of tax
|
—
|
|
—
|
|
—
|
|
—
|
|
—
|
|
—
|
|
—
|
|
—
|
|
—
|
|
(0.1
|
)
|
—
|
|
—
|
|
(0.1
|
)
|
|||||||||||||||||||||
|
Reclassification of unrealized gains on cash flow hedges to net income, net of tax
|
—
|
|
—
|
|
—
|
|
—
|
|
—
|
|
—
|
|
—
|
|
—
|
|
—
|
|
0.3
|
|
—
|
|
—
|
|
0.3
|
|
|||||||||||||||||||||
|
Foreign currency translation adjustment, net of tax
|
—
|
|
—
|
|
—
|
|
—
|
|
—
|
|
—
|
|
—
|
|
—
|
|
—
|
|
(744.1
|
)
|
—
|
|
(33.1
|
)
|
(777.2
|
)
|
|||||||||||||||||||||
|
Adjustment to redeemable noncontrolling interest
|
—
|
|
—
|
|
—
|
|
—
|
|
—
|
|
—
|
|
—
|
|
—
|
|
(50.7
|
)
|
78.8
|
|
—
|
|
—
|
|
28.1
|
|
|||||||||||||||||||||
|
Distributions to noncontrolling interest
|
—
|
|
—
|
|
—
|
|
—
|
|
—
|
|
—
|
|
—
|
|
—
|
|
—
|
|
—
|
|
—
|
|
(15.0
|
)
|
(15.0
|
)
|
|||||||||||||||||||||
|
Purchase of noncontrolling interest
|
|
|
|
|
|
|
|
|
|
|
—
|
|
—
|
|
(16.5
|
)
|
0.5
|
|
|
(4.5
|
)
|
(20.5
|
)
|
||||||||||||||||||||||||
|
Impact of revenue recognition standard adoption
|
—
|
|
—
|
|
—
|
|
—
|
|
—
|
|
—
|
|
—
|
|
—
|
|
—
|
|
—
|
|
38.4
|
|
—
|
|
38.4
|
|
|||||||||||||||||||||
|
Common stock distributions declared
|
—
|
|
—
|
|
—
|
|
—
|
|
—
|
|
—
|
|
—
|
|
—
|
|
—
|
|
—
|
|
(1,397.3
|
)
|
—
|
|
(1,397.3
|
)
|
|||||||||||||||||||||
|
Preferred stock dividends declared
|
—
|
|
—
|
|
—
|
|
—
|
|
—
|
|
—
|
|
—
|
|
—
|
|
—
|
|
—
|
|
(18.9
|
)
|
—
|
|
(18.9
|
)
|
|||||||||||||||||||||
|
Net income
|
—
|
|
—
|
|
—
|
|
—
|
|
—
|
|
—
|
|
—
|
|
—
|
|
—
|
|
—
|
|
1,236.4
|
|
29.5
|
|
1,265.9
|
|
|||||||||||||||||||||
|
BALANCE, DECEMBER 31, 2018
|
—
|
|
$
|
—
|
|
—
|
|
$
|
—
|
|
451,617
|
|
$
|
4.5
|
|
(10,557
|
)
|
$
|
(1,206.8
|
)
|
$
|
10,380.8
|
|
$
|
(2,642.9
|
)
|
$
|
(1,199.5
|
)
|
$
|
563.5
|
|
$
|
5,899.6
|
|
||||||||||||
See accompanying notes to consolidated financial statements.
F-6
AMERICAN TOWER CORPORATION AND SUBSIDIARIES
CONSOLIDATED STATEMENTS OF CASH FLOWS
(in millions)
|
|
Year Ended December 31,
|
|||||||||||
|
|
2018
|
2017
|
2016
|
|||||||||
|
CASH FLOWS FROM OPERATING ACTIVITIES
|
||||||||||||
|
Net income
|
$
|
1,264.7
|
|
$
|
1,225.4
|
|
$
|
970.4
|
|
|||
|
Adjustments to reconcile net income to cash provided by operating activities:
|
||||||||||||
|
Depreciation, amortization and accretion
|
2,110.8
|
|
1,715.9
|
|
1,525.6
|
|
||||||
|
Stock-based compensation expense
|
137.5
|
|
108.5
|
|
89.9
|
|
||||||
|
Loss (gain) on investments, unrealized foreign currency loss and other non-cash expense
|
47.3
|
|
(18.0
|
)
|
127.4
|
|
||||||
|
Impairments, net loss on sale of long-lived assets, non-cash restructuring and merger related expenses
|
479.6
|
|
242.4
|
|
50.7
|
|
||||||
|
Loss (gain) on early retirement of long-term obligations
|
3.3
|
|
70.2
|
|
(1.2
|
)
|
||||||
|
Amortization of deferred financing costs, debt discounts and premiums and other non-cash interest
|
22.1
|
|
20.0
|
|
17.7
|
|
||||||
|
Deferred income taxes
|
(303.0
|
)
|
(86.6
|
)
|
27.0
|
|
||||||
|
Changes in assets and liabilities, net of acquisitions:
|
||||||||||||
|
Accounts receivable
|
(32.1
|
)
|
(191.1
|
)
|
11.4
|
|
||||||
|
Prepaid and other assets
|
(101.7
|
)
|
(179.9
|
)
|
(80.0
|
)
|
||||||
|
Deferred rent asset
|
(87.6
|
)
|
(194.4
|
)
|
(131.7
|
)
|
||||||
|
Accounts payable and accrued expenses
|
69.3
|
|
95.8
|
|
(42.9
|
)
|
||||||
|
Accrued interest
|
8.4
|
|
9.2
|
|
34.4
|
|
||||||
|
Unearned revenue
|
85.8
|
|
59.3
|
|
16.6
|
|
||||||
|
Deferred rent liability
|
57.9
|
|
62.3
|
|
67.8
|
|
||||||
|
Other non-current liabilities
|
(14.0
|
)
|
(13.4
|
)
|
18.6
|
|
||||||
|
Cash provided by operating activities
|
3,748.3
|
|
2,925.6
|
|
2,701.7
|
|
||||||
|
CASH FLOWS FROM INVESTING ACTIVITIES
|
||||||||||||
|
Payments for purchase of property and equipment and construction activities
|
(913.2
|
)
|
(803.6
|
)
|
(682.5
|
)
|
||||||
|
Payments for acquisitions, net of cash acquired
|
(1,881.4
|
)
|
(2,007.0
|
)
|
(1,411.3
|
)
|
||||||
|
Payment for Verizon transaction
|
—
|
|
—
|
|
(4.7
|
)
|
||||||
|
Proceeds from sales of short-term investments and other non-current assets
|
1,252.2
|
|
14.7
|
|
13.1
|
|
||||||
|
Payments for short-term investments
|
(1,154.3
|
)
|
—
|
|
(0.8
|
)
|
||||||
|
Deposits and other
|
(52.8
|
)
|
(5.0
|
)
|
(16.1
|
)
|
||||||
|
Cash used for investing activities
|
(2,749.5
|
)
|
(2,800.9
|
)
|
(2,102.3
|
)
|
||||||
|
CASH FLOWS FROM FINANCING ACTIVITIES
|
||||||||||||
|
Borrowings under credit facilities
|
3,263.3
|
|
5,359.4
|
|
2,446.8
|
|
||||||
|
Proceeds from issuance of senior notes, net
|
584.9
|
|
2,674.0
|
|
3,236.4
|
|
||||||
|
Proceeds from term loan
|
1,500.0
|
|
—
|
|
—
|
|
||||||
|
Proceeds from issuance of securities in securitization transaction
|
500.0
|
|
—
|
|
—
|
|
||||||
|
Repayments of notes payable, credit facilities, term loan, senior notes, secured debt and capital leases
|
(4,884.8
|
)
|
(6,484.4
|
)
|
(5,093.7
|
)
|
||||||
|
(Distributions to) contributions from noncontrolling interest holders, net
|
(14.4
|
)
|
264.3
|
|
238.5
|
|
||||||
|
Purchases of common stock
|
(232.8
|
)
|
(766.3
|
)
|
—
|
|
||||||
|
Proceeds from stock options and stock purchase plan
|
98.9
|
|
119.7
|
|
92.5
|
|
||||||
|
Distributions paid on common stock
|
(1,323.5
|
)
|
(1,073.0
|
)
|
(886.1
|
)
|
||||||
|
Distributions paid on preferred stock
|
(18.9
|
)
|
(91.4
|
)
|
(107.1
|
)
|
||||||
|
Payment for early retirement of long-term obligations
|
(3.3
|
)
|
(75.3
|
)
|
(0.1
|
)
|
||||||
|
Deferred financing costs and other financing activities
|
(56.6
|
)
|
(40.0
|
)
|
(26.5
|
)
|
||||||
|
Purchase of noncontrolling interest
|
(20.5
|
)
|
—
|
|
—
|
|
||||||
|
Cash used for financing activities
|
(607.7
|
)
|
(113.0
|
)
|
(99.3
|
)
|
||||||
|
Net effect of changes in foreign currency exchange rates on cash and cash equivalents, and restricted cash
|
(41.1
|
)
|
6.7
|
|
(26.5
|
)
|
||||||
|
NET INCREASE IN CASH AND CASH EQUIVALENTS, AND RESTRICTED CASH
|
350.0
|
|
18.4
|
|
473.6
|
|
||||||
|
CASH AND CASH EQUIVALENTS, AND RESTRICTED CASH, BEGINNING OF YEAR
|
954.9
|
|
936.5
|
|
462.9
|
|
||||||
|
CASH AND CASH EQUIVALENTS, AND RESTRICTED CASH, END OF YEAR
|
$
|
1,304.9
|
|
$
|
954.9
|
|
$
|
936.5
|
|
|||
See accompanying notes to consolidated financial statements.
F-7
AMERICAN TOWER CORPORATION AND SUBSIDIARIES
NOTES TO CONSOLIDATED FINANCIAL STATEMENTS
(Tabular amounts in millions, unless otherwise disclosed)
1. BUSINESS AND SUMMARY OF SIGNIFICANT ACCOUNTING POLICIES
Business
—American Tower Corporation (together with its subsidiaries, “ATC” or the “Company”) is one of the largest global real estate investment trusts and a leading independent owner, operator and developer of multitenant communications real estate. The Company’s primary business is the leasing of space on communications sites to wireless service providers, radio and television broadcast companies, wireless data providers, government agencies and municipalities and tenants in a number of other industries. The Company refers to this business as its property operations. Additionally, the Company offers tower-related services in the United States, which the Company refers to as its services operations. These services include site acquisition, zoning and permitting (“AZP”) and structural analysis, which primarily support the Company’s site leasing business, including the addition of new tenants and equipment on its sites.
The Company’s portfolio primarily consists of towers that it owns and towers that it operates pursuant to long-term lease arrangements, as well as distributed antenna system (“DAS”) networks, which provide seamless coverage solutions in certain in-building and certain outdoor wireless environments. In addition to the communications sites in its portfolio, the Company manages rooftop and tower sites for property owners under various contractual arrangements. The Company also holds other telecommunications infrastructure, fiber and property interests that it leases primarily to communications service providers and third-party tower operators.
American Tower Corporation is a holding company that conducts its operations through its directly and indirectly owned subsidiaries and joint ventures. ATC’s principal domestic operating subsidiaries are American Towers LLC and SpectraSite Communications, LLC. ATC conducts its international operations primarily through its subsidiary, American Tower International, Inc., which in turn conducts operations through its various international holding and operating subsidiaries and joint ventures.
The Company operates as a real estate investment trust for U.S. federal income tax purposes (“REIT”). Accordingly, the Company generally is not required to pay U.S. federal income taxes on income generated by its REIT operations, including the income derived from leasing space on its towers, as it receives a dividends paid deduction for distributions to stockholders that generally offsets its REIT income and gains. However, the Company remains obligated to pay U.S. federal income taxes on earnings from its domestic taxable REIT subsidiaries (“TRSs”). In addition, the Company’s international assets and operations, regardless of their classification for U.S. tax purposes, continue to be subject to taxation in the jurisdictions where those assets are held or those operations are conducted.
The use of TRSs enables the Company to continue to engage in certain businesses while complying with REIT qualification requirements. The Company may, from time to time, change the election of previously designated TRSs to be included as part of the REIT. As of
December 31, 2018
, the Company’s REIT-qualified businesses included its U.S. tower leasing business, its operations in Nigeria, most of its operations in Costa Rica and Mexico, a majority of its operations in Germany and a majority of its indoor DAS networks business and services segment. In January 2019, a majority of the Company’s operations in France became part of the REIT.
Principles of Consolidation and Basis of Presentation
—The accompanying consolidated financial statements include the accounts of the Company and those entities in which it has a controlling interest. Investments in entities that the Company does not control are accounted for using the equity or cost method, depending upon the Company’s ability to exercise significant influence over operating and financial policies. All intercompany accounts and transactions have been eliminated. As of December 31, 2018, the Company holds (i) a
51%
controlling interest, and MTN Group Limited holds a
49%
noncontrolling interest, in each of
two
joint ventures,
one
in Ghana and
one
in Uganda, (ii) a
51%
controlling interest, and PGGM holds a
49%
noncontrolling interest, in a joint venture that primarily consists of the Company’s operations in Germany and France, (iii) an approximate
81%
controlling interest, and South African investors hold an approximate
19%
noncontrolling interest, in a subsidiary of the Company in South Africa and (iv) a
63%
controlling interest in ATC Telecom Infrastructure Private Limited (“ATC TIPL”), formerly Viom Networks Limited (“Viom”), in India.
During the year ended December 31, 2018, the Company purchased approximately
6%
of the interest in a subsidiary of the Company in South Africa from one of its local partners for
$20.5 million
, which resulted in an increase in the Company’s controlling interest from approximately
75%
to approximately
81%
. The purchase is reflected in the consolidated statements of equity as a reduction of Additional paid-in capital of
$16.5 million
, a decrease in Accumulated other comprehensive loss of
$0.5 million
and a reduction in Noncontrolling interest of
$4.5 million
.
F-8
AMERICAN TOWER CORPORATION AND SUBSIDIARIES
NOTES TO CONSOLIDATED FINANCIAL STATEMENTS
(Tabular amounts in millions, unless otherwise disclosed)
Significant Accounting Policies and Use of Estimates
—The preparation of financial statements in conformity with accounting principles generally accepted in the United States (“GAAP”) requires management to make estimates and assumptions that affect the amounts reported in the consolidated financial statements and accompanying notes. Actual results may differ from those estimates, and such differences could be material to the accompanying consolidated financial statements. The significant estimates in the accompanying consolidated financial statements include impairment of long-lived assets (including goodwill), asset retirement obligations, revenue recognition, rent expense, income taxes and accounting for business combinations and acquisitions of assets. The Company considers events or transactions that occur after the balance sheet date but before the financial statements are issued as additional evidence for certain estimates or to identify matters that require additional disclosure.
Accounts Receivable and Deferred Rent Asset
—The Company derives the largest portion of its revenues, corresponding accounts receivable and the related deferred rent asset from a relatively small number of tenants in the telecommunications industry, and
51%
of its current-year revenues are derived from
four
tenants.
The Company’s deferred rent asset is associated with non-cancellable tenant leases that contain fixed escalation clauses over the terms of the applicable lease in which revenue is recognized on a straight-line basis over the lease term.
The Company mitigates its concentrations of credit risk with respect to notes and trade receivables and the related deferred rent assets by actively monitoring the creditworthiness of its borrowers and tenants. In recognizing tenant revenue, the Company assesses the collectibility of both the amounts billed and the portion recognized in advance of billing on a straight-line basis. This assessment takes tenant credit risk and business and industry conditions into consideration to ultimately determine the collectibility of the amounts billed. To the extent the amounts, based on management’s estimates, may not be collectible, recognition is deferred until such point as collectibility is determined to be reasonably assured. Any amounts that were previously recognized as revenue and subsequently determined to be uncollectible are charged to bad debt expense included in Selling, general, administrative and development expense in the accompanying consolidated statements of operations.
Accounts receivable is reported net of allowances for doubtful accounts related to estimated losses resulting from a tenant’s inability to make required payments and allowances for amounts invoiced whose collectibility is not reasonably assured. These allowances are generally estimated based on payment patterns, days past due and collection history, and incorporate changes in economic conditions that may not be reflected in historical trends, such as tenants in bankruptcy, liquidation or reorganization. Receivables are written-off against the allowances when they are determined to be uncollectible. Such determination includes analysis and consideration of the particular conditions of the account. Changes in the allowances were as follows:
|
Year Ended December 31,
|
|||||||||||
|
2018
|
2017
|
2016
|
|||||||||
|
Balance as of January 1,
|
$
|
131.0
|
|
$
|
45.9
|
|
$
|
23.1
|
|
||
|
Current year increases
|
157.8
|
|
87.2
|
|
50.0
|
|
|||||
|
Write-offs, recoveries and other (1)
|
(6.4
|
)
|
(2.1
|
)
|
(27.2
|
)
|
|||||
|
Balance as of December 31,
|
$
|
282.4
|
|
$
|
131.0
|
|
$
|
45.9
|
|
||
_______________
|
(1)
|
Recoveries includes recognition of revenue resulting from collections of previously reserved amounts.
|
Functional Currency
—The functional currency of each of the Company’s foreign operating subsidiaries is normally the respective local currency, except for Costa Rica, where the functional currency is the U.S. Dollar. All foreign currency assets and liabilities held by the subsidiaries are translated into U.S. Dollars at the exchange rate in effect at the end of the applicable fiscal reporting period and all foreign currency revenues and expenses are translated at the average monthly exchange rates. Translation adjustments are reflected in equity as a component of Accumulated other comprehensive loss (“AOCL”) in the consolidated balance sheets and included as a component of Comprehensive income in the consolidated statements of comprehensive income.
Gains and losses on foreign currency transactions are reflected in Other expense in the consolidated statements of operations. However, the effect from fluctuations in foreign currency exchange rates on intercompany debt for which repayment is not anticipated in the foreseeable future is reflected in AOCL in the consolidated balance sheets and included as a component of comprehensive income.
F-9
AMERICAN TOWER CORPORATION AND SUBSIDIARIES
NOTES TO CONSOLIDATED FINANCIAL STATEMENTS
(Tabular amounts in millions, unless otherwise disclosed)
The Company recorded the following net foreign currency losses:
|
Year Ended December 31,
|
|||||||||||
|
2018
|
2017
|
2016
|
|||||||||
|
Foreign currency losses recorded in AOCL
|
$
|
385.8
|
|
$
|
51.6
|
|
$
|
105.0
|
|
||
|
Foreign currency losses (gains) recorded in Other expense
|
4.5
|
|
(26.4
|
)
|
48.9
|
|
|||||
|
Net foreign currency losses
|
$
|
390.3
|
|
$
|
25.2
|
|
$
|
153.9
|
|
||
Adoption of Highly Inflationary Accounting in Argentina
—The Argentinean economy was deemed to be highly inflationary as of the second quarter of 2018 and, as a result, the Company adopted highly inflationary accounting as of July 1, 2018 for its subsidiary in Argentina. Under highly inflationary accounting, the functional currency of its subsidiary in Argentina is considered to be the U.S. Dollar. All monetary and non-monetary assets and liabilities were remeasured at the U.S. Dollar to Argentinean Peso exchange rate of 1 to
29.4
as of June 30, 2018. These amounts became the new basis for those assets and liabilities as of July 1, 2018. Non-monetary assets and liabilities, as well as the corresponding income statement activities such as depreciation, amortization and equity, will continue to be measured at the June 30, 2018 exchange rate. This change did not have a material impact on the Company’s financial statements as Argentina’s assets and revenue are less than
1%
of consolidated assets and revenue, respectively.
Cash and Cash Equivalents
—Cash and cash equivalents include cash on hand, demand deposits and short-term investments with original maturities of three months or less. The Company maintains its deposits at high quality financial institutions and monitors the credit ratings of those institutions.
Restricted Cash—
Restricted cash includes cash pledged as collateral to secure obligations and all cash whose use is otherwise limited by contractual provisions.
The reconciliation of cash and cash equivalents and restricted cash reported within the applicable balance sheet that sum to the total of the same such amounts shown in the statement of cash flows is as follows:
|
Year Ended December 31,
|
|||||||||||
|
2018
|
2017
|
2016
|
|||||||||
|
Cash and cash equivalents
|
$
|
1,208.7
|
|
$
|
802.1
|
|
$
|
787.2
|
|
||
|
Restricted cash
|
96.2
|
|
152.8
|
|
149.3
|
|
|||||
|
Total cash, cash equivalents and restricted cash
|
$
|
1,304.9
|
|
$
|
954.9
|
|
$
|
936.5
|
|
||
Short-Term Investments—
Short-term investments consists of highly liquid investments with original maturities in excess of three months.
Property and Equipment
—Property and equipment is recorded at cost or, in the case of acquired properties, at estimated fair value on the date acquired. Cost for self-constructed towers includes direct materials and labor, capitalized interest and certain indirect costs associated with construction of the tower, such as transportation costs, employee benefits and payroll taxes. The Company begins the capitalization of costs during the pre-construction period, which is the period during which costs are incurred to evaluate the site, and continues to capitalize costs until the tower is substantially completed and ready for occupancy by a tenant. Labor and related costs capitalized for the years ended
December 31, 2018
,
2017
and
2016
were
$55.0 million
,
$50.9 million
and
$47.7 million
, respectively. Capitalized interest costs were not material for the years ended
December 31, 2018
,
2017
and
2016
.
Expenditures for repairs and maintenance are expensed as incurred. Augmentation and improvements that extend an asset’s useful life or enhance capacity are capitalized.
Depreciation expense is recorded using the straight-line method over the assets’ estimated useful lives. Towers and related assets on leased land are depreciated over the shorter of the estimated useful life of the asset or the term of the corresponding ground lease, taking into consideration lease renewal options and residual value.
Towers or assets acquired through capital leases are recorded net at the present value of future minimum lease payments or the fair value of the leased asset at the inception of the lease. Property and equipment and assets held under capital leases are
F-10
AMERICAN TOWER CORPORATION AND SUBSIDIARIES
NOTES TO CONSOLIDATED FINANCIAL STATEMENTS
(Tabular amounts in millions, unless otherwise disclosed)
amortized over the shorter of the applicable lease term or the estimated useful life of the respective assets for periods generally not exceeding
twenty
years.
The Company reviews its tower portfolio for indicators of impairment on an individual tower basis. Impairments primarily result from a tower not having current tenant leases or from having expenses in excess of revenues. The Company reviews other long-lived assets for impairment whenever events, changes in circumstances or other evidence indicate that the carrying amount of the Company’s assets may not be recoverable. The Company records impairment charges in Other operating expenses in the consolidated statements of operations in the period in which the Company identifies such impairment.
Goodwill and Other Intangible Assets
—The Company reviews goodwill for impairment at least annually (as of December 31) or whenever events or circumstances indicate the carrying value of an asset may not be recoverable.
Goodwill is recorded in the applicable segment and assessed for impairment at the reporting unit level. The Company utilizes the two-step impairment test and employs a discounted cash flow analysis when testing goodwill for impairment. The key assumptions utilized in the discounted cash flow analysis include current operating performance, terminal sales growth rate, management’s expectations of future operating results and cash requirements, the current weighted average cost of capital and an expected tax rate. Under the first step of the test, the Company compares the fair value of the reporting unit, as calculated under an income approach using future discounted cash flows, to the carrying amount of the applicable reporting unit. If the carrying amount exceeds the fair value, the Company conducts the second step of this test, in which the implied fair value of the applicable reporting unit’s goodwill is compared to the carrying amount of that goodwill. If the carrying amount of goodwill exceeds its implied fair value, an impairment loss would be recognized for the amount of the excess.
During the years ended
December 31, 2018
,
2017
and
2016
, no potential impairment was identified under the first step of the test, as the fair value of each of the reporting units was in excess of its carrying amount.
Intangible assets that are separable from goodwill and are deemed to have a definite life are amortized over their useful lives, generally ranging from
three
to
twenty
years and are evaluated separately for impairment at least annually or whenever events or circumstances indicate that the carrying amount of an asset may not be recoverable.
The Company reviews its network location intangible assets for indicators of impairment on an individual tower basis. Impairments primarily result from a tower not having current tenant leases or from having expenses in excess of revenues. The Company monitors its tenant-related intangible assets on a tenant by tenant basis for indicators of impairment, such as high levels of turnover or attrition, non-renewal of a significant number of contracts or the cancellation or termination of a relationship. The Company assesses recoverability by determining whether the carrying amount of the related assets will be recovered primarily through projected undiscounted future cash flows. If the Company determines that the carrying amount of an asset may not be recoverable, the Company measures any impairment loss based on the projected future discounted cash flows to be provided from the asset or available market information relative to the asset’s fair value, as compared to the asset’s carrying amount. The Company records impairment charges, which are discussed in note 16, in Other operating expenses in the consolidated statements of operations in the period in which the Company identifies such impairment.
Derivative Financial Instruments
—Derivatives are recorded on the consolidated balance sheet at fair value. If a derivative is designated as a cash flow hedge, the effective portions of changes in the fair value of the derivative are recorded in AOCL, as well as a component of comprehensive income, and are recognized in the results of operations when the hedged item affects earnings. Changes in fair value of the ineffective portions of cash flow hedges are recognized in the results of operations. For derivative instruments that are designated and qualify as fair value hedges, changes in value of the derivatives are recorded in Other expense in the consolidated statements of operations in the current period, along with the offsetting gain or loss on the hedged item attributable to the hedged risk. For derivative instruments not designated as hedging instruments, changes in fair value are recognized in the results of operations in the period that the change occurs.
The primary risks managed through the use of derivative instruments is interest rate risk, exposure to changes in the fair value of debt attributable to interest rate risk and currency risk. From time to time, the Company enters into interest rate swap agreements or foreign currency contracts to manage exposure to these risks. Under these agreements, the Company is exposed to counterparty credit risk to the extent that a counterparty fails to meet the terms of a contract. The Company’s exposure is limited to the current value of the contract at the time the counterparty fails to perform. The Company assesses, both at the inception of the hedge and on an ongoing basis, whether the derivatives that are used in hedging transactions are highly effective in offsetting changes in cash flows or fair values of hedged items. The Company does not hold derivatives for trading purposes.
F-11
AMERICAN TOWER CORPORATION AND SUBSIDIARIES
NOTES TO CONSOLIDATED FINANCIAL STATEMENTS
(Tabular amounts in millions, unless otherwise disclosed)
Fair Value Measurements
—The Company determines the fair value of its financial instruments based on the fair value hierarchy, which requires an entity to maximize the use of observable inputs and minimize the use of unobservable inputs when measuring fair value.
Asset Retirement Obligations
—When required, the Company recognizes the fair value of obligations to remove its tower assets and remediate the leased land upon which certain of its tower assets are located. Generally, the associated retirement costs are capitalized as part of the carrying amount of the related tower assets and depreciated over their estimated useful lives and the liability is accreted through the obligation’s estimated settlement date. Fair value estimates of asset retirement obligations generally involve discounting of estimated future cash flows associated with takedown costs. Periodic accretion of such liabilities due to the passage of time is included in Depreciation, amortization and accretion expense in the consolidated statements of operations. Adjustments are also made to the asset retirement obligation liability to reflect changes in the estimates of timing and amount of expected cash flows, with an offsetting adjustment made to the related long-lived tangible asset. The significant assumptions used in estimating the Company’s aggregate asset retirement obligation are: timing of tower removals; cost of tower removals; timing and number of land lease renewals; expected inflation rates; and credit-adjusted, risk-free interest rates that approximate the Company’s incremental borrowing rate.
Income Taxes
—As a REIT, the Company generally is not subject to U.S. federal income taxes on income generated by its REIT operations as it receives a dividends paid deduction for distributions to stockholders that generally offsets its REIT income and gains. However, the Company remains obligated to pay U.S. federal income taxes on certain earnings and continues to be subject to taxation in its foreign jurisdictions. Accordingly, the consolidated financial statements reflect provisions for federal, state, local and foreign income taxes. The Company recognizes deferred tax assets and liabilities for the future tax consequences attributable to differences between the financial statement carrying amounts of existing assets and liabilities and their respective tax basis, as well as operating loss and tax credit carryforwards. The Company measures deferred tax assets and liabilities using enacted tax rates expected to apply to taxable income in the years in which those temporary differences and carryforwards are expected to be recovered or settled. The effect on deferred tax assets and liabilities as a result of a change in tax rates is recognized in income in the period that includes the enactment date.
The Company periodically reviews its deferred tax assets, and provides valuation allowances if, based on the available evidence, it is more likely than not that some or all of the deferred tax assets will not be realized. Management assesses the available positive and negative evidence to estimate if sufficient future taxable income will be generated to use the existing deferred tax assets. Valuation allowances would be reversed as a reduction to the provision for income taxes if related deferred tax assets are deemed realizable based on changes in facts and circumstances relevant to the assets’ recoverability.
The Company classifies uncertain tax positions as non-current income tax liabilities in Other non-current liabilities in the consolidated balance sheet, unless expected to be paid within one year. The Company reports penalties and tax-related interest expense as a component of the income tax provision and interest income from tax refunds as a component of Other expense in the consolidated statements of operations.
Other Comprehensive Income (Loss)
—Other comprehensive income (loss) refers to items excluded from net income that are recorded as an adjustment to equity, net of tax. The Company’s other comprehensive income (loss) primarily consisted of changes in fair value of effective derivative cash flow hedges, foreign currency translation adjustments and reclassification of unrealized losses on effective derivative cash flow hedges. The AOCL balance included accumulated foreign currency translation losses of
$2.6 billion
,
$2.0 billion
and
$2.0 billion
for the years ended December 31,
2018
,
2017
and
2016
, respectively.
Distributions
—As a REIT, the Company must annually distribute to its stockholders an amount equal to at least 90% of its REIT taxable income (determined before the deduction for distributed earnings and excluding any net capital gain). Generally, the Company has distributed, and expects to continue to distribute, all or substantially all of its REIT taxable income after taking into consideration its utilization of net operating losses (“NOLs”).
The amount, timing and frequency of future distributions will be at the sole discretion of the Board of Directors and will depend upon various factors, a number of which may be beyond the Company’s control, including the Company’s financial condition and operating cash flows, the amount required to maintain its qualification for taxation as a REIT and reduce any income and excise taxes that the Company otherwise would be required to pay, limitations on distributions in the Company’s existing and future debt and preferred equity instruments, the Company’s ability to utilize NOLs to offset the Company’s distribution requirements, limitations on its ability to fund distributions using cash generated through its TRSs and other factors that the Board of Directors may deem relevant.
F-12
AMERICAN TOWER CORPORATION AND SUBSIDIARIES
NOTES TO CONSOLIDATED FINANCIAL STATEMENTS
(Tabular amounts in millions, unless otherwise disclosed)
Acquisitions
—For acquisitions that meet the definition of a business combination, the Company applies the acquisition method of accounting where assets acquired and liabilities assumed are recorded at fair value at the date of each acquisition, and the results of operations are included with those of the Company from the dates of the respective acquisitions. Any excess of the purchase price paid by the Company over the amounts recognized for assets acquired and liabilities assumed is recorded as goodwill. The Company continues to evaluate acquisitions for a period not to exceed one year after the applicable acquisition date of each transaction to determine whether any additional adjustments are needed to the allocation of the purchase price paid for the assets acquired and liabilities assumed. All other acquisitions are accounted for as asset acquisitions and the purchase price is allocated to the net assets acquired with no recognition of goodwill. The purchase price is not subsequently adjusted.
The fair value of the assets acquired and liabilities assumed is typically determined by using either estimates of replacement costs or discounted cash flow valuation methods. When determining the fair value of tangible assets acquired, the Company must estimate the cost to replace the asset with a new asset taking into consideration such factors as age, condition and the economic useful life of the asset. When determining the fair value of intangible assets acquired and liabilities assumed, the Company must estimate the applicable discount rate and the timing and amount of future cash flows, including rate and terms of renewal and attrition.
Revenue
—The Company’s revenue from leasing arrangements, including fixed escalation clauses present in non-cancellable lease arrangements, is reported on a straight-line basis over the term of the respective leases when collectibility is probable. Escalation clauses tied to the Consumer Price Index or other inflation-based indices, and other incentives present in lease agreements with the Company’s tenants are excluded from the straight-line calculation. Total property straight-line revenues for the years ended December 31, 2018, 2017 and 2016 were
$87.6 million
,
$194.4 million
and
$131.7 million
, respectively. During the year ended December 31, 2018 the Company entered into agreements with one of its tenants in India, Tata Teleservices Limited (“Tata Teleservices”) and related entities (collectively, “Tata”), for a settlement and release of certain contractual lease obligations of Tata Teleservices for which the Company received a cash settlement payment of
$345.5 million
.
The new revenue recognition accounting standard, which applies to revenue not recorded under the lease standard, requires entities to recognize revenue when control of the promised goods or services is transferred to customers at an amount that reflects the consideration to which the entity expects to be entitled in exchange for those goods or services. On January 1, 2018, the Company adopted the new revenue recognition standard using the modified retrospective method applied to contracts that were not completed as of January 1, 2018. Results for reporting periods beginning January 1, 2018 are presented under the new standard, while prior-period amounts are not adjusted and continue to be reported in accordance with accounting under the previously applicable guidance.
The Company recorded a net reduction to opening Distributions in excess of earnings in its consolidated balance sheet of
$38.4 million
as of January 1, 2018 due to the cumulative impact of adopting the new revenue recognition standard. The impact is primarily related to the Company’s site inspection revenue, which is now recognized at the point in time when the inspection service is completed. For the year ended December 31, 2018, the impact of applying the new standard was an increase to revenue of
$4.9 million
.
The adoption of the new revenue recognition accounting standard did not have a material impact on the Company’s revenue recognition patterns. Most of the Company’s revenue is derived from leasing arrangements and is accounted for as lease revenue. A small portion of the Company’s revenue is either derived from non-lease performance obligations within the lease arrangements or from other agreements with its tenants. This revenue, designated non-lease revenue, is recognized when control of the promised goods or services is transferred to the tenants in an amount that reflects the consideration the Company expects to be entitled to in exchange for those goods or services.
Since most of the Company’s contracts are leases, costs to enter into lease arrangements are capitalized under the applicable lease accounting guidance. Costs incurred to obtain non-lease contracts that are capitalized primarily relate to DAS networks and are not material to the consolidated financial statements. The Company has excluded sales tax, value-added tax and similar taxes from non-lease revenue.
Non-lease revenue is disaggregated by geography in a manner consistent with the Company’s business segments, which are discussed further in note 20. A summary of non-lease revenue disaggregated by source and geography is as follows:
F-13
AMERICAN TOWER CORPORATION AND SUBSIDIARIES
NOTES TO CONSOLIDATED FINANCIAL STATEMENTS
(Tabular amounts in millions, unless otherwise disclosed)
|
Year Ended December 31, 2018
|
U.S.
|
Asia
|
EMEA
|
Latin
America
|
Total
|
|||||||||||||||
|
Power and fuel pass-through revenue
|
$
|
—
|
|
$
|
450.0
|
|
$
|
140.3
|
|
$
|
16.8
|
|
$
|
607.1
|
|
|||||
|
Other non-lease revenue
|
273.2
|
|
7.0
|
|
1.3
|
|
102.1
|
|
383.6
|
|
||||||||||
|
Total non-lease property revenue
|
$
|
273.2
|
|
$
|
457.0
|
|
$
|
141.6
|
|
$
|
118.9
|
|
$
|
990.7
|
|
|||||
|
Services revenue
|
125.4
|
|
—
|
|
—
|
|
—
|
|
125.4
|
|
||||||||||
|
Total non-lease revenue
|
$
|
398.6
|
|
$
|
457.0
|
|
$
|
141.6
|
|
$
|
118.9
|
|
$
|
1,116.1
|
|
|||||
|
Property lease revenue
|
3,548.9
|
|
1,083.5
|
|
545.7
|
|
1,145.9
|
|
6,324.0
|
|
||||||||||
|
Total revenue
|
$
|
3,947.5
|
|
$
|
1,540.5
|
|
$
|
687.3
|
|
$
|
1,264.8
|
|
$
|
7,440.1
|
|
|||||
Power and fuel pass-through revenue
—Most of the Company’s leasing arrangements outside of the U.S. require that the Company provide power to the communications site through an electrical grid connection, diesel fuel generators or other sources and permit the Company to pass through the costs of, or otherwise charge for, these services. The Company recognizes revenue received in connection with such services as power and fuel pass-through revenue. Many arrangements require that the communications site has power for a specified percentage of time. In most such cases, if delivery of power falls below the specified service level, a corresponding reduction in revenue is recorded. The Company has determined that this performance obligation is satisfied over time for the duration of the arrangement.
Other significant judgments related to this revenue stream are the (i) determination that the Company is a principal in these transactions and revenue is therefore recorded on a gross basis and (ii) service level related adjustments to revenue.
Other non-lease revenue
—Other non-lease revenue consists primarily of revenue generated from DAS networks, fiber and other property related revenue. DAS networks and fiber arrangements require that the Company provide the tenant the right to use the applicable communications infrastructure. Performance obligations are satisfied over time for the duration of the arrangements. Other property related revenue streams, which include site inspections, are not material on either an individual or consolidated basis.
Services revenue
—The Company offers tower-related services in the United States. These services include AZP and structural analysis. There is a single performance obligation related to AZP, and revenue is recognized over time based on milestones achieved, which are determined based on costs expected to be incurred. Structural analysis services may have more than one performance obligation, contingent upon the number of contracted services. Revenue is recognized at the point in time the services are completed.
Some of the Company’s contracts with tenants contain multiple performance obligations. For these arrangements, the Company allocates revenue to each performance obligation based on its relative standalone selling price, which is typically based on the price charged to tenants.
Information about receivables, contract assets and contract liabilities from contracts with tenants is as follows:
|
January 1, 2018
|
December 31, 2018
|
|||||||
|
Accounts receivable
|
$
|
222.2
|
|
$
|
260.7
|
|
||
|
Prepaids and other current assets
|
79.7
|
|
103.2
|
|
||||
|
Notes receivable and other non-current assets
|
24.2
|
|
22.2
|
|
||||
|
Unearned revenue
|
26.6
|
|
37.6
|
|
||||
|
Other non-current liabilities
|
68.5
|
|
54.9
|
|
||||
The Company records unearned revenue when payments are received from tenants in advance of the completion of the Company’s performance obligations. Long-term unearned revenue is included in Other non-current liabilities. The increase in the Unearned revenue for the year ended December 31, 2018 is due to payments received, offset by
$79.5 million
of revenue recognized during the year ended December 31, 2018, that was included in the Unearned revenue balance as of January 1, 2018. There was
$0.5 million
of revenue recognized from Other non-current liabilities during the year ended December 31, 2018.
F-14
AMERICAN TOWER CORPORATION AND SUBSIDIARIES
NOTES TO CONSOLIDATED FINANCIAL STATEMENTS
(Tabular amounts in millions, unless otherwise disclosed)
The Company records unbilled receivables, which are included in Prepaids and other current assets, when it has completed a performance obligation prior to its ability to bill under the customer arrangement. Other contract assets are included in Notes receivable and other non-current assets. The decrease in unbilled receivables attributable to revenue recognized during the year ended December 31, 2018 was
$1.0 million
. The change in contract assets attributable to revenue recognized during the year ended December 31, 2018 was
$0.4 million
.
The Company does not disclose the value of unsatisfied performance obligations for agreements (i) with an original expected length of one year or less or (ii) for which it recognizes revenue at the amount to which it has the right to invoice for services performed.
Rent Expense
—Many of the leases underlying the Company’s tower sites have fixed rent escalations, which provide for periodic increases in the amount of ground rent payable by the Company over time. In addition, certain of the Company’s tenant leases require the Company to exercise available renewal options pursuant to the underlying ground lease if the tenant exercises its renewal option. The Company calculates straight-line ground rent expense for these leases based on the fixed non-cancellable term of the underlying ground lease plus all periods, if any, for which failure to renew the lease imposes an economic penalty to the Company such that renewal appears to be reasonably assured.
Total property straight-line ground rent expense for the years ended
December 31, 2018
,
2017
and
2016
was
$57.9 million
,
$62.3 million
and
$67.8 million
, respectively. The Company records a liability for straight-line ground rent expense in Other non-current liabilities. The Company records prepaid ground rent in Prepaid and other current assets and Notes receivable and other non-current assets in the accompanying consolidated balance sheets according to the anticipated period of benefit.
Selling, General, Administrative and Development Expense
—Selling, general and administrative expense consists of overhead expenses related to the Company’s property and services operations and corporate overhead costs not specifically allocable to any of the Company’s individual business operations. Development expense consists of costs related to the Company’s acquisition efforts, costs associated with new business initiatives and project cancellation costs.
Stock-Based Compensation
—Stock-based compensation expense is measured at the accounting measurement date based on the fair value of the award and is generally recognized as an expense over the service period, which typically represents the vesting period. The Company provides for accelerated vesting and extended exercise periods of stock options and restricted stock units upon an employee’s death or permanent disability, or upon an employee’s qualified retirement, provided certain eligibility criteria are met. Accordingly, the Company recognizes compensation expense for stock options and time-based restricted stock units (“RSUs”) over the shorter of (i) the
four
-year vesting period or (ii) the period from the date of grant to the date the employee becomes eligible for such retirement benefits, which may occur upon grant. The expense recognized includes the impact of forfeitures as they occur.
The Company grants performance-based restricted stock units (“PSUs”) to its executive officers. Threshold, target and maximum parameters are established for a
three
-year performance period at the time of grant. The metrics are used to calculate the number of shares that will be issuable when the awards vest, which may range from
zero
to
200%
of the target amounts. The Company recognizes compensation expense for PSUs over the
three
-year vesting period, subject to adjustment based on the date the employee becomes eligible for retirement benefits as well as performance relative to grant parameters.
The fair value of stock options is determined using the Black-Scholes option-pricing model and the fair value of RSUs and PSUs is based on the fair value of the Company’s common stock on the date of grant. The Company recognizes all stock-based compensation expense in either Selling, general, administrative and development expense, costs of operations or as part of the costs associated with the construction of the tower assets.
In connection with the vesting of restricted stock units, the Company withholds from issuance a number of shares of common stock to satisfy certain employee tax withholding obligations arising from such vesting. The shares withheld are considered constructively retired. The Company recognizes the fair value of the shares withheld in Additional paid-in capital on the consolidated balance sheets. As of December 31, 2018, the Company has withheld from issuance an aggregate of
1.7 million
shares, including
0.3 million
shares related to the vesting of restricted stock units during the year ended December 31, 2018.
Litigation Costs
—The Company periodically becomes involved in various claims and lawsuits that are incidental to its business. The Company regularly monitors the status of pending legal actions to evaluate both the magnitude and likelihood of any potential loss. The Company accrues for these potential losses when it is probable that a liability has been incurred and the amount of loss, or possible range of loss, can be reasonably estimated. Should the ultimate losses on contingencies or litigation vary from estimates, adjustments to those liabilities may be required. The Company also incurs legal costs in connection with
F-15
AMERICAN TOWER CORPORATION AND SUBSIDIARIES
NOTES TO CONSOLIDATED FINANCIAL STATEMENTS
(Tabular amounts in millions, unless otherwise disclosed)
these matters and records estimates of these expenses, which are reflected in Selling, general, administrative and development expense in the accompanying consolidated statements of operations.
Earnings Per Common Share
—
Basic and Diluted
—Basic net income per common share represents net income attributable to American Tower Corporation common stockholders divided by the weighted average number of common shares outstanding during the period. Diluted net income per common share represents net income attributable to American Tower Corporation common stockholders divided by the weighted average number of common shares outstanding during the period and any dilutive common share equivalents, including (A) shares issuable upon (i) the vesting of RSUs, (ii) exercise of stock options, and (iii) conversion of the Company’s mandatory convertible preferred stock and (B) shares expected to be earned upon the achievement of the parameters established for PSUs, each to the extent not anti-dilutive. Dilutive common share equivalents also include the dilutive impact of the shares issuable in the Alltel transaction, which is described in note 18. The Company uses the treasury stock method to calculate the effect of its outstanding RSUs, PSUs and stock options and uses the if-converted method to calculate the effect of its outstanding mandatory convertible preferred stock.
Retirement Plan
—The Company has a 401(k) plan covering substantially all employees who meet certain age and employment requirements. For the years ended
December 31, 2018
and 2017, the Company matched
100%
of the first
5%
of a participant's contributions. For the year ended December 31,
2016
, the Company matched
75%
of the first
6%
of a participant’s contributions. For the years ended
December 31, 2018
,
2017
and
2016
, the Company contributed
$11.2 million
,
$11.0 million
and
$9.1 million
to the plan, respectively.
Accounting Standards Updates
Lease Accounting
—In February 2016, the Financial Accounting Standards Board (the “FASB”) issued guidance on the accounting for leases. The guidance amends the existing accounting standards for lease accounting, including the requirement that lessees recognize right of use assets and lease liabilities for leases with terms greater than twelve months in the statement of financial position. Under the new guidance, lessor accounting is largely unchanged.
In January 2018, the FASB issued guidance on the treatment of land easements. The guidance provides a practical expedient to not evaluate existing or expired land easements under the new lease accounting standards if those easements were not previously accounted for as leases under the existing lease guidance. The Company does not expect the adoption of this guidance to have a material impact on its financial statements or its adoption of the lease accounting guidance.
In July 2018, the FASB issued additional guidance on the accounting for leases. The guidance provides companies with another transition method by allowing entities to recognize a cumulative-effect adjustment to the opening balance of retained earnings as of the date of adoption. Under this method, previously presented years’ financial positions and results would not be adjusted. The new guidance also provides lessors with a practical expedient, by class of underlying asset, to not separate non-lease components from the associated lease component if the non-lease components would otherwise be accounted for under the new revenue recognition standard and both the timing and pattern of transfer are the same for the non-lease components and associated lease component and, if accounted for separately, the lease component would be classified as an operating lease.
In December 2018, the FASB issued additional guidance with narrow-scope improvements for lessors. The guidance permits lessors, as an accounting policy election, to exclude sales and related taxes from the evaluation of lessor costs, requires lessors to exclude from revenue and expense lessor costs paid directly to a third party by lessees and clarifies the lessors’ accounting for variable payments related to both lease and non-lease components.
The lease accounting guidance is effective for fiscal years, and for interim periods within those fiscal years, beginning after December 15, 2018.
The Company plans to adopt the standard using the modified retrospective method applied to lease arrangements that were in place on the transition date. Results for reporting periods beginning January 1, 2019 will be presented under the new standard, while prior-period amounts will not be adjusted and will continue to be reported in accordance with accounting under the previously applicable guidance.
The Company will elect certain available practical expedients that permit the adopter to not reassess certain items upon adoption, including: (i) whether any existing contracts are or contain leases, (ii) the classification of existing leases and (iii) initial directs costs for existing leases. As a result, the vast majority of the Company’s ground leases will continue to be accounted for as operating leases under the standard and have recognition patterns similar to those under prior guidance. The
F-16
AMERICAN TOWER CORPORATION AND SUBSIDIARIES
NOTES TO CONSOLIDATED FINANCIAL STATEMENTS
(Tabular amounts in millions, unless otherwise disclosed)
Company will also elect the practical expedient related to land easements, which permits carryforward accounting treatment of capitalizing long-term easements that have a specified term. The Company will elect to not separate non-lease components from the related lease components and will account for the components together as a single lease component on the transition date.
The Company estimates adoption of the standard will result in recognition of operating lease right of use assets and operating lease liabilities of approximately
$7.1 billion
and
$6.8 billion
, respectively, as of January 1, 2019. The right of use assets recorded include, among other items, amounts previously classified as prepaid rent, deferred lease acquisition costs and long-term deferred rent obligations. The Company also expects to record approximately
$24.7 million
as an adjustment to retained earnings related to right of use assets assets recorded on previously impaired sites. The Company’s capital lease assets, which are disclosed in note 3, and liabilities, which are disclosed in note 8, remain largely unchanged under the lease accounting standard. Although adoption of the standard will require the Company to provide additional disclosures in the financial statements and notes, the Company does not expect the standard will have a material impact on its results of operations or liquidity. The Company does not expect the guidance to have a material impact on its debt covenant compliance.
Other Updates
—In January 2017, the FASB issued guidance on accounting for goodwill impairments. The guidance eliminates Step 2 from the goodwill impairment test and requires, among other things, recognition of an impairment loss when the carrying value of a reporting unit exceeds its fair value. The loss recognized is limited to the total amount of goodwill allocated to that reporting unit. The guidance is effective for fiscal years, and for interim periods within those fiscal years, beginning after December 15, 2019. Early adoption is permitted for interim or annual goodwill impairment tests performed on testing dates after January 1, 2017. The Company does not expect the adoption of this guidance to have a material impact on the Company’s financial statements.
In August 2017, the FASB issued guidance on hedge and derivative accounting. The guidance simplifies accounting rules around hedge accounting and the disclosures of hedging arrangements. Among other things, the guidance eliminates the need to separately measure and report hedge ineffectiveness and generally requires the entire change in fair value of a hedging instrument to be presented in the same income statement line as the hedged item. The guidance is effective for fiscal years, and for interim periods within those fiscal years, beginning after December 15, 2018, with early adoption permitted. The Company early adopted this guidance during the fourth quarter of 2018. The adoption of this guidance did not have a material impact on the Company’s financial statements.
In February 2018, the FASB issued new guidance on the treatment of tax effects that are presented in other comprehensive income. The guidance allows a reclassification from accumulated other comprehensive income to retained earnings for stranded tax effects as a result of the December 2017 legislation commonly referred to as the Tax Cuts and Jobs Act (the “Tax Act”). The guidance is effective for fiscal years, and for interim periods within those fiscal years, beginning after December 15, 2018, with early adoption permitted. The Company does not expect the adoption of this guidance to have a material impact on the Company’s financial statements.
In August 2018, the FASB issued guidance on fair value measurements. The guidance modifies the disclosure requirements on fair value measurements and is effective for fiscal years, and interim periods within those fiscal years, beginning after December 15, 2019, with early adoption permitted. The Company early adopted this guidance during the fourth quarter of 2018. The adoption of this guidance did not have a material impact on the Company’s financial statements.
Other Disclosure Requirement Updates
In August 2018, the Securities and Exchange Commission issued a final rule that amends certain of its disclosure requirements. Among other amendments, the final rule extends to interim periods the annual disclosure requirement of presenting changes in stockholders’ equity and the amount of dividends per share for each class of shares and deletes the provisions of the rules that require the presentation of dividends per share on the face of the income statement for interim periods, moving the required disclosure to the analysis of changes in stockholders’ equity. The final rule was effective as of November 5, 2018. The adoption of these disclosure requirements did not have a material impact on the Company’s financial statements.
F-17
2. PREPAID AND OTHER CURRENT ASSETS
Prepaid and other current assets consisted of the following as of December 31,:
|
2018
|
2017
|
||||||
|
Prepaid operating ground leases
|
$
|
165.0
|
|
$
|
148.6
|
|
|
|
Unbilled receivables
|
126.1
|
|
107.9
|
|
|||
|
Prepaid income tax
|
125.1
|
|
136.5
|
|
|||
|
Value added tax and other consumption tax receivables
|
86.3
|
|
64.2
|
|
|||
|
Prepaid assets
|
40.5
|
|
39.6
|
|
|||
|
Other miscellaneous current assets
|
78.2
|
|
71.8
|
|
|||
|
Prepaids and other current assets
|
$
|
621.2
|
|
$
|
568.6
|
|
|
3. PROPERTY AND EQUIPMENT
Property and equipment (including assets held under capital leases) consisted of the following as of December 31,:
|
|
Estimated
Useful Lives (years) (1)
|
2018
|
2017
|
||||||
|
Towers
|
Up to 20
|
$
|
12,777.9
|
|
$
|
12,500.5
|
|
||
|
Equipment (2)
|
2 - 20
|
1,667.3
|
|
1,423.0
|
|
||||
|
Buildings and improvements
|
3 - 32
|
628.5
|
|
631.4
|
|
||||
|
Land and improvements (3)
|
Up to 20
|
2,285.4
|
|
2,112.9
|
|
||||
|
Construction-in-progress
|
358.1
|
|
282.1
|
|
|||||
|
Total
|
17,717.2
|
|
16,949.9
|
|
|||||
|
Less accumulated depreciation
|
(6,470.1
|
)
|
(5,848.9
|
)
|
|||||
|
Property and equipment, net
|
$
|
11,247.1
|
|
$
|
11,101.0
|
|
|||
_______________
|
(1)
|
Assets on leased land are depreciated over the shorter of the estimated useful life of the asset or the term of the corresponding ground lease taking into consideration lease renewal options and residual value.
|
|
(2)
|
Includes fiber and DAS assets.
|
|
(3)
|
Estimated useful lives apply to improvements only.
|
Depreciation expense for the years ended
December 31, 2018
,
2017
and
2016
was
$883.1 million
,
$835.5 million
and
$758.9 million
, respectively.
As of
December 31, 2018
, property and equipment included
$4,369.5 million
and
$1,016.2 million
of capital lease assets with related equipment and improvements and accumulated depreciation, respectively. As of December 31,
2017
, property and equipment included
$4,944.2 million
and
$1,370.4 million
of capital lease assets with related equipment and improvements and accumulated depreciation, respectively. As of
December 31, 2018
and
2017
, capital lease assets were primarily classified as towers and land and improvements.
4. GOODWILL AND OTHER INTANGIBLE ASSETS
The changes in the carrying value of goodwill for the Company’s business segments were as follows:
|
|
Property
|
Services
|
Total
|
|||||||||||||||||||||
|
|
U.S.
|
Asia
|
EMEA
|
Latin America
|
||||||||||||||||||||
|
Balance as of January 1, 2017
|
$
|
3,379.2
|
|
$
|
1,029.3
|
|
$
|
150.5
|
|
$
|
509.7
|
|
$
|
2.0
|
|
$
|
5,070.7
|
|
||||||
|
Additions (1)
|
—
|
|
0.4
|
|
220.9
|
|
264.8
|
|
—
|
|
486.1
|
|
||||||||||||
|
Effect of foreign currency translation
|
—
|
|
65.3
|
|
33.5
|
|
(17.2
|
)
|
—
|
|
81.6
|
|
||||||||||||
|
Balance as of January 1, 2018
|
$
|
3,379.2
|
|
$
|
1,095.0
|
|
$
|
404.9
|
|
$
|
757.3
|
|
$
|
2.0
|
|
$
|
5,638.4
|
|
||||||
|
Additions (2)
|
3.3
|
|
44.5
|
|
—
|
|
0.4
|
|
—
|
|
48.2
|
|
||||||||||||
|
Effect of foreign currency translation
|
—
|
|
(94.0
|
)
|
(23.6
|
)
|
(67.1
|
)
|
—
|
|
(184.7
|
)
|
||||||||||||
|
Balance as of December 31, 2018
|
$
|
3,382.5
|
|
$
|
1,045.5
|
|
$
|
381.3
|
|
$
|
690.6
|
|
$
|
2.0
|
|
$
|
5,501.9
|
|
||||||
_______________
|
(1)
|
Additions consist of
$485.1 million
resulting from 2017 acquisitions and
$1.0 million
from revisions to prior-year acquisitions due to measurement period adjustments.
|
|
(2)
|
Additions consist of
$47.8 million
resulting from 2018 acquisitions and
$0.4 million
from revisions to prior-year acquisitions due to measurement period adjustments.
|
F-18
AMERICAN TOWER CORPORATION AND SUBSIDIARIES
NOTES TO CONSOLIDATED FINANCIAL STATEMENTS
(Tabular amounts in millions, unless otherwise disclosed)
The Company’s other intangible assets subject to amortization consisted of the following:
|
|
|
As of December 31, 2018
|
As of December 31, 2017
|
|||||||||||||||||||||||
|
|
Estimated Useful
Lives
|
Gross
Carrying
Value
|
Accumulated
Amortization
|
Net Book
Value
|
Gross
Carrying
Value
|
Accumulated
Amortization
|
Net Book
Value
|
|||||||||||||||||||
|
|
(years)
|
|||||||||||||||||||||||||
|
Acquired network location intangibles (1)
|
Up to 20
|
|
$
|
4,780.3
|
|
$
|
(1,704.9
|
)
|
$
|
3,075.4
|
|
$
|
4,858.8
|
|
$
|
(1,525.3
|
)
|
$
|
3,333.5
|
|
||||||
|
Acquired tenant-related intangibles
|
15-20
|
|
11,156.5
|
|
(3,147.2
|
)
|
8,009.3
|
|
11,150.9
|
|
(2,754.7
|
)
|
8,396.2
|
|
||||||||||||
|
Acquired licenses and other intangibles
|
3-20
|
|
104.1
|
|
(14.5
|
)
|
89.6
|
|
58.8
|
|
(8.1
|
)
|
50.7
|
|
||||||||||||
|
Economic Rights, TV Azteca (2)
|
70
|
|
—
|
|
—
|
|
—
|
|
14.5
|
|
(11.6
|
)
|
2.9
|
|
||||||||||||
|
Total other intangible assets
|
$
|
16,040.9
|
|
$
|
(4,866.6
|
)
|
$
|
11,174.3
|
|
$
|
16,083.0
|
|
$
|
(4,299.7
|
)
|
$
|
11,783.3
|
|
||||||||
_______________
|
(1)
|
Acquired network location intangibles are amortized over the shorter of the term of the corresponding ground lease taking into consideration lease renewal options and residual value or up to
20
years, as the Company considers these intangibles to be directly related to the tower assets.
|
|
(2)
|
As discussed in note 5, in conjunction with the extinguishment of a note from TV Azteca (as defined in note 5), the Company restructured the Economic Rights Agreement (as defined in note 5) and wrote off the corresponding asset. The intangible asset related to the Commercialization Rights (as defined in note 5) agreement with TV Azteca is included in Acquired licenses and other intangibles.
|
The acquired network location intangibles represent the value to the Company of the incremental revenue growth that could potentially be obtained from leasing the excess capacity on acquired communications sites. The acquired tenant-related intangibles typically represent the value to the Company of tenant contracts and relationships in place at the time of an acquisition or similar transaction, including assumptions regarding estimated renewals.
The Company amortizes its acquired network location intangibles and tenant-related intangibles on a straight-line basis over the estimated useful lives. As of December 31,
2018
, the remaining weighted average amortization period of the Company’s intangible assets was
15
years. Amortization of intangible assets for the years ended December 31,
2018
,
2017
and
2016
was
$1,144.1 million
,
$785.9 million
and
$699.8 million
, respectively. Amortization expense increased for the year ended December 31, 2018 because the Company entered into agreements with Tata for a settlement and release of certain contractual lease obligations of Tata Teleservices. As a result, the Company recorded
$327.5 million
of accelerated amortization related to the Tata tenant relationship, which was subsequently retired.
Based on current exchange rates, the Company expects to record amortization expense as follows over the next five years:
|
Year Ending December 31,
|
|||
|
2019
|
$
|
786.0
|
|
|
2020
|
765.8
|
|
|
|
2021
|
749.6
|
|
|
|
2022
|
745.1
|
|
|
|
2023
|
740.6
|
|
|
5. NOTES RECEIVABLE AND OTHER NON-CURRENT ASSETS
Notes receivable and other non-current assets consisted of the following as of December 31,:
|
2018
|
2017
|
||||||
|
Long-term prepaid ground rent
|
$
|
607.5
|
|
$
|
552.8
|
|
|
|
Notes receivable
|
1.0
|
|
83.7
|
|
|||
|
Other miscellaneous assets
|
354.1
|
|
313.6
|
|
|||
|
Notes receivable and other non-current assets
|
$
|
962.6
|
|
$
|
950.1
|
|
|
F-19
AMERICAN TOWER CORPORATION AND SUBSIDIARIES
NOTES TO CONSOLIDATED FINANCIAL STATEMENTS
(Tabular amounts in millions, unless otherwise disclosed)
TV Azteca Note Receivable
—In 2000, the Company loaned TV Azteca, S.A. de C.V. (“TV Azteca”), the owner of a major national television network in Mexico,
$119.8 million
. The loan had an interest rate of
13.11%
, payable quarterly, which at the time of issuance was determined to be below market and therefore a corresponding discount was recorded. The term of the loan was
70 years
. The Company amortized the discount on the loan to Interest income, TV Azteca, net of interest expense on its consolidated statements of operations using the effective interest method over the term of the loan. As of December 31, 2017, the outstanding balance on the loan was
$91.8 million
, or
$82.9 million
, net of discount. On September 25, 2018, TV Azteca paid
$59.5 million
to extinguish this loan and simultaneously restructured its Economic Rights agreement, which the Company estimated had a fair value of
$24.8 million
.
TV Azteca Economic Rights and Commercialization Rights
—Simultaneous with the signing of the loan agreement in 2000, the Company also entered into a
70
-year Economic Rights Agreement with TV Azteca regarding space not used by TV Azteca on approximately
190
of its broadcast towers. In exchange for the issuance of the below market interest rate loan described above and the annual payment of
$1.5 million
to TV Azteca (under the Economic Rights Agreement), the Company had the right to market and lease the unused tower space on the broadcast towers (the “Economic Rights”). TV Azteca retained title to these towers and was responsible for their operation and maintenance. The Company was entitled to
100%
of the revenues generated from leases with tenants on the unused space and was responsible for any incremental operating expenses associated with those tenants.
The Company accounted for the annual payment of
$1.5 million
as a capital lease by initially recording an asset and a corresponding liability of
$18.6 million
. The capital lease asset also included the original discount on the note. The capital lease asset and original discount on the note aggregated
$30.2 million
at the time of the transaction and represented the cost to acquire the Economic Rights. The Economic Rights asset was recorded as an intangible asset and was being amortized over the
70
-year life of the Economic Rights Agreement.
In conjunction with the note extinguishment described above, the Company restructured the Economic Rights Agreement into a Commercialization Rights agreement. Under this agreement, the Company has the exclusive right to commercialize available space on approximately
190
TV Azteca broadcast towers for the installation, licensing and operation of equipment for wireless telecommunications service, radio and television broadcasting on the towers (the “Commercialization Rights”) until September 2038, during which time the Company is entitled to all revenues derived from the Commercialization Rights. Subsequent to 2038, the Company is required to pay quarterly to TV Azteca a market rate of
25%
of the gross revenues associated with the Commercialization Rights, and annually, TV Azteca has the right to repurchase the Commercialization Rights for the then-market price.
As a result of entering into the Commercialization Rights agreement, the obligations under the capital lease were cancelled and the remaining capital lease liability of
$14.1 million
, the deferred financing costs of
$1.5 million
, and the net carrying value of the original Economic Rights asset of
$3.0 million
were written off, which resulted in a gain of
$9.7 million
that was recorded in Other income (expense).
6. ACQUISITIONS
The Company evaluates each of its acquisitions under the accounting guidance framework to determine whether to treat an acquisition as an asset acquisition or a business combination. For those transactions treated as asset acquisitions, the purchase price is allocated to the assets or rights acquired and liabilities assumed, with no recognition of goodwill. For those transactions treated as business combinations, the estimates of the fair value of the assets or rights acquired and liabilities assumed at the date of the applicable acquisition are subject to adjustment during the measurement period (up to one year from the particular acquisition date). The primary areas of the accounting for the acquisitions that are not yet finalized relate to the fair value of certain tangible and intangible assets acquired and liabilities assumed, which may include contingent consideration, residual goodwill and any related tax impact.
F-20
AMERICAN TOWER CORPORATION AND SUBSIDIARIES
NOTES TO CONSOLIDATED FINANCIAL STATEMENTS
(Tabular amounts in millions, unless otherwise disclosed)
The fair value of these net assets acquired are based on management’s estimates and assumptions, as well as other information compiled by management, including valuations that utilize customary valuation procedures and techniques. While the Company believes that such preliminary estimates provide a reasonable basis for estimating the fair value of assets acquired and liabilities assumed, it evaluates any necessary information prior to finalization of the fair value. During the measurement period for those acquisitions accounted for as business combinations, the Company will adjust assets or liabilities if new information is obtained about facts and circumstances that existed as of the acquisition date that, if known, would have resulted in the revised estimated values of those assets or liabilities as of that date.
Impact of current year acquisitions
—The Company typically acquires communications sites from wireless carriers or other tower operators and subsequently integrates those sites into its existing portfolio of communications sites. The financial results of the Company’s acquisitions have been included in the Company’s consolidated statements of operations for the year ended
December 31, 2018
from the date of the respective acquisition. The date of acquisition, and by extension the point at which the Company begins to recognize the results of an acquisition, may depend on, among other things, the receipt of contractual consents, the commencement and extent of leasing arrangements and the timing of the transfer of title or rights to the assets, which may be accomplished in phases. Sites acquired from communications service providers may never have been operated as a business and may instead have been utilized solely by the seller as a component of its network infrastructure. An acquisition may or may not involve the transfer of business operations or employees.
For those acquisitions accounted for as business combinations, the Company recognizes acquisition and merger related expenses in the period in which they are incurred and services are received; for transactions accounted for as asset acquisitions, these costs are capitalized as part of the purchase price. Acquisition and merger related costs may include finder’s fees, advisory, legal, accounting, valuation and other professional or consulting fees and general administrative costs directly related to the transaction. Integration costs include incremental and non-recurring costs necessary to convert data, retain employees and otherwise enable the Company to operate acquired businesses or assets efficiently. The Company records acquisition and merger related expenses for business combinations, as well as integration costs for all acquisitions, in Other operating expenses in the consolidated statements of operations.
During the years ended
December 31, 2018
,
2017
and
2016
, the Company recorded the following acquisition and merger related expenses for business combinations and integration costs:
|
Year Ended December 31,
|
||||||||||||
|
2018
|
2017
|
2016
|
||||||||||
|
Acquisition and merger related expenses
|
$
|
14.1
|
|
$
|
16.3
|
|
$
|
15.9
|
|
|||
|
Integration costs
|
$
|
16.1
|
|
$
|
11.5
|
|
$
|
9.9
|
|
|||
The Company also recorded aggregate purchase price refunds of
$22.2 million
during the year ended December 31, 2017. The refunds primarily related to an acquisition in Brazil in 2014 for which the measurement period has closed.
2018 Transactions
The estimated aggregate impact of the
2018
acquisitions on the Company’s revenues and gross margin for the year ended
December 31, 2018
was approximately
$232.2 million
and
$83.0 million
, respectively. The revenues and gross margin amounts also reflect incremental revenues from the addition of new tenants to such sites subsequent to the transaction date.
Idea Acquisition—
On May 31, 2018, the Company acquired
100%
of the outstanding shares of Idea Cellular Infrastructure Services Limited (“Idea”), a telecommunications company that owns and operates approximately
9,700
communications sites in India, for total consideration of approximately
42.8 billion
Indian Rupees (“INR”) (
$635.5 million
at the date of acquisition). This acquisition was accounted for as a business combination and is subject to post-closing adjustments. During the year ended December 31, 2018, the purchase price was reduced to approximately
42.2 billion
INR (
$625.9 million
at the date of acquisition).
Vodafone Acquisition—
On March 31, 2018, the Company acquired approximately
10,200
communications sites from Vodafone India Limited and Vodafone Mobile Services Limited (together, “Vodafone”) for an aggregate total purchase price of
38.3 billion
INR (
$587.9 million
at the date of acquisition). Of the aggregate purchase price,
$1.1 million
is reflected in Accounts payable in the consolidated balance sheet as of December 31, 2018. This acquisition was accounted for as an asset acquisition.
F-21
AMERICAN TOWER CORPORATION AND SUBSIDIARIES
NOTES TO CONSOLIDATED FINANCIAL STATEMENTS
(Tabular amounts in millions, unless otherwise disclosed)
Kenya Acquisition—
On October 1, 2018, the Company acquired over
700
sites in Kenya from Telkom Kenya Limited for total consideration of
$174.1 million
, including value added tax. The Company issued a note for
$51.8 million
of the purchase price, which will be paid either in future installments subject to the satisfaction of specified conditions, or
three
years from the purchase date. This acquisition was accounted for as an asset acquisition.
Other Acquisitions—
During the year ended December 31, 2018, the Company acquired a total of
1,335
communications sites in the United States, Colombia, Mexico, Paraguay and Peru for an aggregate purchase price of
$414.5 million
. Of the aggregate purchase price,
$11.8 million
is reflected as a payable in the consolidated balance sheet as of December 31, 2018. The majority of these acquisitions were accounted for as asset acquisitions.
On November 1, 2018, the Company acquired a portfolio of fiber assets and the right to use certain telecommunications poles in Brazil from Cia Energetica de Minas Gerais SA for total consideration of approximately
576.9 million
Brazilian Reais (“BRL”) (
$155.8 million
at the date of acquisition). This acquisition is included in “Other” in the table below and was accounted for as an asset acquisition.
The following table summarizes the allocations of the purchase prices for the fiscal year 2018 acquisitions based upon their estimated fair value at the date of acquisition:
|
Asia
|
EMEA
|
|||||||||||||||||||
|
Idea
|
Vodafone (1)
|
Kenya (2)
|
Other (3)
|
|||||||||||||||||
|
Preliminary Allocation
|
Updated Allocation
|
|||||||||||||||||||
|
Current assets
|
$
|
100.7
|
|
$
|
82.9
|
|
$
|
15.1
|
|
$
|
0.1
|
|
$
|
3.6
|
|
|||||
|
Non-current assets
|
2.6
|
|
11.6
|
|
5.8
|
|
24.7
|
|
5.1
|
|
||||||||||
|
Property and equipment
|
161.2
|
|
161.2
|
|
194.6
|
|
51.2
|
|
271.5
|
|
||||||||||
|
Intangible assets (4):
|
||||||||||||||||||||
|
Tenant-related intangible assets
|
321.2
|
|
323.4
|
|
309.5
|
|
106.2
|
|
191.5
|
|
||||||||||
|
Network location intangible assets
|
82.9
|
|
83.5
|
|
88.5
|
|
25.6
|
|
91.5
|
|
||||||||||
|
Other intangible assets
|
—
|
|
—
|
|
—
|
|
—
|
|
28.7
|
|
||||||||||
|
Current liabilities
|
(52.5
|
)
|
(47.4
|
)
|
(13.1
|
)
|
—
|
|
(3.6
|
)
|
||||||||||
|
Deferred tax liability
|
(20.7
|
)
|
(17.7
|
)
|
—
|
|
(32.2
|
)
|
—
|
|
||||||||||
|
Other non-current liabilities
|
(10.5
|
)
|
(16.1
|
)
|
(12.5
|
)
|
(1.5
|
)
|
(21.3
|
)
|
||||||||||
|
Net assets acquired
|
584.9
|
|
581.4
|
|
587.9
|
|
174.1
|
|
567.0
|
|
||||||||||
|
Goodwill (5)
|
50.6
|
|
44.5
|
|
—
|
|
—
|
|
3.3
|
|
||||||||||
|
Fair value of net assets acquired
|
635.5
|
|
625.9
|
|
587.9
|
|
174.1
|
|
570.3
|
|
||||||||||
|
Debt assumed
|
—
|
|
—
|
|
—
|
|
—
|
|
—
|
|
||||||||||
|
Purchase price
|
$
|
635.5
|
|
$
|
625.9
|
|
$
|
587.9
|
|
$
|
174.1
|
|
$
|
570.3
|
|
|||||
_______________
|
(1)
|
Includes
$1.3 million
in acquisition and merger related expenses that were capitalized as part of the purchase price.
|
|
(2)
|
Includes
$1.7 million
in acquisition and merger related expenses that were capitalized as part of the purchase price.
|
|
(3)
|
Other includes
145
sites in Peru held pursuant to long-term capital leases.
|
|
(4)
|
Tenant-related intangible assets, network location intangible assets and other intangible assets are amortized on a straight-line basis over periods of up to 20 years.
|
|
(5)
|
The Company expects the majority of goodwill to be deductible for tax purposes.
|
2017 Transactions
During the year ended December 31, 2018, post-closing adjustments impacted the following acquisition completed in 2017:
Mexico Acquisition—
On November 17, 2017, the Company acquired
100%
of the outstanding shares of entities holding urban telecommunications assets in Mexico, including more than
50,000
concrete poles and approximately
2,100
route miles of fiber, for total initial consideration of
$505.8 million
, including value-added tax. During the year ended December 31, 2018, the purchase price was reduced to
$499.7 million
due to post-closing adjustments.
F-22
AMERICAN TOWER CORPORATION AND SUBSIDIARIES
NOTES TO CONSOLIDATED FINANCIAL STATEMENTS
(Tabular amounts in millions, unless otherwise disclosed)
The following table summarizes the preliminary and final allocation of the purchase price paid and the amounts of assets acquired and liabilities assumed for the acquisition based upon its estimated fair value at the date of acquisition. Balances are reflected in the accompanying consolidated balance sheet as of December 31, 2018.
|
Latin America
|
||||||||
|
Mexico
|
||||||||
|
Preliminary Allocation (1)
|
Final Allocation (2)
|
|||||||
|
Current assets
|
$
|
44.4
|
|
$
|
42.5
|
|
||
|
Non-current assets
|
—
|
|
—
|
|
||||
|
Property and equipment
|
94.0
|
|
102.2
|
|
||||
|
Intangible assets:
|
||||||||
|
Tenant-related intangible assets
|
153.3
|
|
138.0
|
|
||||
|
Network location intangible assets
|
—
|
|
—
|
|
||||
|
Other intangible assets
|
22.0
|
|
20.3
|
|
||||
|
Current liabilities
|
(28.8
|
)
|
(27.2
|
)
|
||||
|
Deferred tax liability
|
(38.8
|
)
|
(36.2
|
)
|
||||
|
Other non-current liabilities
|
(4.5
|
)
|
(4.5
|
)
|
||||
|
Net assets acquired
|
241.6
|
|
235.1
|
|
||||
|
Goodwill (3)
|
264.2
|
|
264.6
|
|
||||
|
Fair value of net assets acquired
|
505.8
|
|
499.7
|
|
||||
|
Debt assumed
|
—
|
|
—
|
|
||||
|
Purchase price
|
$
|
505.8
|
|
$
|
499.7
|
|
||
_______________
|
(1)
|
As reported for the year ended December 31, 2017.
|
|
(2)
|
The allocation of the purchase price for the Mexico acquisition was finalized during the year ended December 31, 2018.
|
|
(3)
|
Primarily results from purchase accounting adjustments, which are not deductible for tax purposes.
|
Pro Forma Consolidated Results (Unaudited)
The following table presents the unaudited pro forma financial results as if the
2018
acquisitions had occurred on January 1,
2017
and the
2017
acquisitions had occurred on January 1,
2016
. The pro forma results do not include any anticipated cost synergies, costs or other integration impacts. Accordingly, such pro forma amounts are not necessarily indicative of the results that actually would have occurred had the transactions been completed on the dates indicated, nor are they indicative of the future operating results of the Company.
|
|
Year Ended December 31,
|
|||||||
|
2018
|
2017
|
|||||||
|
Pro forma revenues
|
$
|
7,610.6
|
|
$
|
7,161.0
|
|
||
|
Pro forma net income attributable to American Tower Corporation common stockholders
|
$
|
1,218.2
|
|
$
|
1,127.6
|
|
||
|
Pro forma net income per common share amounts:
|
||||||||
|
Basic net income attributable to American Tower Corporation common stockholders
|
$
|
2.77
|
|
$
|
2.63
|
|
||
|
Diluted net income attributable to American Tower Corporation common stockholders
|
$
|
2.75
|
|
$
|
2.61
|
|
||
Acquisition-Related Contingent Consideration
The Company may be required to pay additional consideration under certain agreements for the acquisition of communications sites if specific conditions are met or events occur. In Ghana, the Company may be required to pay additional consideration upon the conversion of certain barter agreements with other wireless carriers to cash-paying lease agreements. In the United States, the Company may be required to pay additional consideration if certain pre-designated tenant leases commence during a specified period of time.
F-23
AMERICAN TOWER CORPORATION AND SUBSIDIARIES
NOTES TO CONSOLIDATED FINANCIAL STATEMENTS
(Tabular amounts in millions, unless otherwise disclosed)
A summary of the value of the Company’s acquisition-related contingent consideration obligations are as follows:
|
Year Ended December 31, 2018
|
||||||||||||||||||||
|
Maximum
potential value (1)
|
Estimated value at
December 31, 2018
|
Additions
|
Settlements
|
Change in Fair Value
|
||||||||||||||||
|
Ghana
|
0.6
|
|
0.6
|
|
—
|
|
—
|
|
0.0
|
|
||||||||||
|
South Africa
|
—
|
|
—
|
|
—
|
|
(8.6
|
)
|
(0.5
|
)
|
||||||||||
|
United States
|
0.3
|
|
0.3
|
|
—
|
|
(0.1
|
)
|
—
|
|
||||||||||
|
Total
|
$
|
0.9
|
|
$
|
0.9
|
|
$
|
—
|
|
$
|
(8.7
|
)
|
$
|
(0.5
|
)
|
|||||
_______________
|
(1)
|
The maximum potential value is based on exchange rates at
December 31, 2018
. The minimum value could be
zero
.
|
For more information regarding acquisition-related contingent consideration, see note 11.
7. ACCRUED EXPENSES
Accrued expenses consisted of the following as of December 31,:
|
2018
|
2017
|
||||||
|
Accrued property and real estate taxes
|
$
|
169.7
|
|
$
|
154.4
|
|
|
|
Amounts payable to tenants
|
93.5
|
|
60.8
|
|
|||
|
Payroll and related withholdings
|
90.4
|
|
82.2
|
|
|||
|
Accrued pass-through costs
|
71.2
|
|
59.7
|
|
|||
|
Accrued rent
|
61.4
|
|
54.0
|
|
|||
|
Accrued income tax payable
|
57.9
|
|
15.3
|
|
|||
|
Accrued construction costs
|
41.5
|
|
31.9
|
|
|||
|
Accrued pass-through taxes
|
2.2
|
|
25.3
|
|
|||
|
Other accrued expenses
|
360.5
|
|
370.7
|
|
|||
|
Accrued expenses
|
$
|
948.3
|
|
$
|
854.3
|
|
|
F-24
AMERICAN TOWER CORPORATION AND SUBSIDIARIES
NOTES TO CONSOLIDATED FINANCIAL STATEMENTS
(Tabular amounts in millions, unless otherwise disclosed)
8. LONG-TERM OBLIGATIONS
Outstanding amounts under the Company’s long-term obligations, reflecting discounts, premiums, debt issuance costs and fair value adjustments due to interest rate swaps consisted of the following as of December 31,:
|
2018
|
2017
|
Contractual Interest Rate (1)
|
Maturity Date (1)
|
|||||||||
|
2018 Term Loan (2)(3)
|
$
|
1,499.8
|
|
$
|
—
|
|
3.405
|
%
|
March 29, 2019
|
|||
|
2013 Credit Facility (2)
|
1,875.0
|
|
2,075.6
|
|
3.616
|
%
|
June 28, 2022
|
|||||
|
2013 Term Loan (2)
|
994.8
|
|
994.5
|
|
3.655
|
%
|
January 31, 2024
|
|||||
|
2014 Credit Facility (2)
|
—
|
|
495.0
|
|
3.655
|
%
|
January 31, 2024
|
|||||
|
3.40% senior notes (4)
|
1,000.0
|
|
999.8
|
|
3.400
|
%
|
February 15, 2019
|
|||||
|
2.800% senior notes
|
747.8
|
|
746.3
|
|
2.800
|
%
|
June 1, 2020
|
|||||
|
5.050% senior notes
|
698.7
|
|
698.0
|
|
5.050
|
%
|
September 1, 2020
|
|||||
|
3.300% senior notes
|
747.2
|
|
746.0
|
|
3.300
|
%
|
February 15, 2021
|
|||||
|
3.450% senior notes
|
646.3
|
|
645.1
|
|
3.450
|
%
|
September 15, 2021
|
|||||
|
5.900% senior notes
|
498.4
|
|
497.8
|
|
5.900
|
%
|
November 1, 2021
|
|||||
|
2.250% senior notes
|
572.7
|
|
572.4
|
|
2.250
|
%
|
January 15, 2022
|
|||||
|
4.70% senior notes
|
697.4
|
|
696.7
|
|
4.700
|
%
|
March 15, 2022
|
|||||
|
3.50% senior notes
|
992.6
|
|
990.9
|
|
3.500
|
%
|
January 31, 2023
|
|||||
|
3.000% senior notes
|
687.5
|
|
692.5
|
|
3.000
|
%
|
June 15, 2023
|
|||||
|
5.00% senior notes
|
1,002.1
|
|
1,002.4
|
|
5.000
|
%
|
February 15, 2024
|
|||||
|
1.375% senior notes
|
564.0
|
|
589.1
|
|
1.375
|
%
|
April 4, 2025
|
|||||
|
4.000% senior notes
|
742.1
|
|
741.0
|
|
4.000
|
%
|
June 1, 2025
|
|||||
|
4.400% senior notes
|
496.1
|
|
495.6
|
|
4.400
|
%
|
February 15, 2026
|
|||||
|
1.950% senior notes
|
566.0
|
|
—
|
|
1.950
|
%
|
May 22, 2026
|
|||||
|
3.375% senior notes
|
986.3
|
|
984.8
|
|
3.375
|
%
|
October 15, 2026
|
|||||
|
3.125% senior notes
|
397.3
|
|
397.1
|
|
3.125
|
%
|
January 15, 2027
|
|||||
|
3.55% senior notes
|
743.5
|
|
742.8
|
|
3.550
|
%
|
July 15, 2027
|
|||||
|
3.600% senior notes
|
691.9
|
|
691.1
|
|
3.600
|
%
|
January 15, 2028
|
|||||
|
Total American Tower Corporation debt
|
17,847.5
|
|
16,494.5
|
|
||||||||
|
Series 2013-1A Securities (5)
|
—
|
|
499.8
|
|
N/A
|
|
N/A
|
|||||
|
Series 2013-2A Securities (6)
|
1,293.4
|
|
1,291.8
|
|
3.070
|
%
|
March 15, 2023
|
|||||
|
Series 2018-1A Securities (6)
|
493.5
|
|
—
|
|
3.652
|
%
|
March 15, 2028
|
|||||
|
Series 2015-1 Notes (7)
|
348.8
|
|
348.0
|
|
2.350
|
%
|
June 15, 2020
|
|||||
|
Series 2015-2 Notes (8)
|
520.8
|
|
520.1
|
|
3.482
|
%
|
June 16, 2025
|
|||||
|
India indebtedness (9)
|
240.1
|
|
512.6
|
|
8.40% - 8.95%
|
|
Various
|
|||||
|
India preference shares (10)
|
23.9
|
|
26.1
|
|
10.250
|
%
|
March 2, 2020
|
|||||
|
Shareholder loans (11)
|
59.9
|
|
100.6
|
|
Various
|
|
Various
|
|||||
|
Other subsidiary debt (12)
|
152.5
|
|
246.1
|
|
Various
|
|
Various
|
|||||
|
Total American Tower subsidiary debt
|
3,132.9
|
|
3,545.1
|
|
||||||||
|
Other debt, including capital lease obligations
|
179.5
|
|
165.5
|
|
||||||||
|
Total
|
21,159.9
|
|
20,205.1
|
|
||||||||
|
Less current portion long-term obligations
|
(2,754.8
|
)
|
(774.8
|
)
|
||||||||
|
Long-term obligations
|
$
|
18,405.1
|
|
$
|
19,430.3
|
|
||||||
_______________
|
(1)
|
Represents the interest rate or maturity date as of December 31, 2018; interest rate does not reflect the impact of interest rate swap agreements.
|
|
(2)
|
Accrues interest at a variable rate. Interest rates on outstanding balances are calculated using a weighted average.
|
F-25
AMERICAN TOWER CORPORATION AND SUBSIDIARIES
NOTES TO CONSOLIDATED FINANCIAL STATEMENTS
(Tabular amounts in millions, unless otherwise disclosed)
|
(3)
|
Repaid in full subsequent to December 31, 2018. For more information see note 23.
|
|
(4)
|
Repaid in full on the maturity date in February 2019 with borrowings from the 2013 Credit Facility and the 2014 Credit Facility (each defined below).
|
|
(5)
|
Repaid in full on the March 2018 payment date.
|
|
(6)
|
Maturity date reflects the anticipated repayment date; final legal maturity is March 15, 2048.
|
|
(7)
|
Maturity date reflects the anticipated repayment date; final legal maturity is June 15, 2045.
|
|
(8)
|
Maturity date reflects the anticipated repayment date; final legal maturity is June 15, 2050.
|
|
(9)
|
Denominated in INR. Includes India working capital facilities, remaining debt assumed by the Company in connection with the Viom Acquisition (as defined in note 14) and debt that has been entered into by ATC TIPL.
|
|
(10)
|
Mandatorily redeemable preference shares (the “Preference Shares”) denominated in INR and classified as debt. The Company intends to redeem these shares on March 2, 2019.
|
|
(11)
|
Reflects balances owed to the Company’s joint venture partners in Ghana and Uganda. The Ghana loan is denominated in Ghanaian Cedi (“GHS”) and the Uganda loan is denominated in Ugandan Shillings (“UGX”). On August 30, 2018, the Company repaid the remaining
127.2 billion
UGX (
$33.8 million
) under the Uganda loan, including principal and accrued unpaid interest. As a result, no amounts were outstanding under the Uganda loan as of December 31, 2018.
|
|
(12)
|
Includes the BR Towers Debentures (as defined below) and the Brazil Credit Facility (as defined below), which are denominated in BRL and have an original amortization through October 15, 2023 and January 15, 2022, respectively, the South African Credit Facility (as defined below), which is denominated in South African Rand (“ZAR”) and amortizes through December 17, 2020, the Colombian Credit Facility (as defined below), which is denominated in Colombian Pesos (“COP”) and amortizes through April 24, 2021, the Kenya Debt (as defined below), which is denominated in U.S. Dollars (“USD”) and is payable either (i) in future installments subject to the satisfaction of specified conditions or (ii)
three
years from the note origination date, and U.S. subsidiary debt related to a seller-financed acquisition. In October 2018, the Company repaid the BR Towers Debentures in full, including any accrued and unpaid interest.
|
Current portion of long-term obligations
—The Company’s current portion of long-term obligations primarily includes (i)
$1.5 billion
under its secured term loan entered into on March 29, 2018 (the “2018 Term Loan”), (ii)
$1.0 billion
under the
3.40%
senior unsecured notes due 2019, (iii)
7.1 billion
INR (
$101.9 million
) of India indebtedness, (iv)
294.4 million
GHS (
$59.9 million
) of the shareholder loan owed to the Company’s joint venture partner in Ghana and (v)
1.67 billion
INR (
$23.9 million
) of the Preference Shares classified as debt.
American Tower Corporation Debt
Bank Facilities
—In November 2018, the Company entered into amendment agreements with respect to (A) its multicurrency senior unsecured revolving credit facility entered into in June 2013, as amended (the “2013 Credit Facility”), (B) its senior unsecured revolving credit facility entered into in January 2012, as amended and restated in September 2014, as further amended (the “2014 Credit Facility”) and (C) its unsecured term loan entered into in October 2013, as amended (the “2013 Term Loan”), to, among other things, (i) extend the maturity dates by one year, (ii) increase the commitments under each of the 2013 Credit Facility and the 2014 Credit Facility by
$100.0 million
to
$2.85 billion
and
$2.1 billion
, respectively, (iii) increase the maximum Revolving Loan Commitments, after giving effect to any Incremental Commitments (each as defined in the applicable loan agreement) to
$4.5 billion
and
$3.25 billion
under the 2013 Credit Facility and the 2014 Credit Facility, respectively, (iv) amend the limitation on indebtedness of, and guaranteed by, the Company’s subsidiaries to the greater of (x)
$2.5 billion
and (y)
50%
of Adjusted EBITDA (as defined in the applicable loan agreement) of the Company and its subsidiaries on a consolidated basis, (v) increase the threshold for certain defaults with respect to judgments, attachments or acceleration of indebtedness from
$300.0 million
to
$400.0 million
and (vi) add provisions regarding the establishment of an alternative rate of interest in the event that the London Interbank Offered Rate (“LIBOR”) is no longer available. In addition, the amendments to the 2014 Credit Facility and the 2013 Term Loan reduce the Applicable Margins (as defined in the applicable loan agreement) to conform to the Applicable Margins in the 2013 Credit Facility (as defined therein).
2013 Credit Facility—
The Company has the ability to borrow up to
$2.85 billion
under the 2013 Credit Facility, which includes a
$1.0 billion
sublimit for multicurrency borrowings, a
$200.0 million
sublimit for letters of credit and a
$50.0 million
sublimit for swingline loans. During the
year ended December 31, 2018
, the Company borrowed an aggregate of
$2.1 billion
and repaid an aggregate of
$2.3 billion
of revolving indebtedness under the 2013 Credit Facility. The Company primarily used the borrowings to fund acquisitions, repay existing indebtedness and for general corporate purposes.
2014 Credit Facility—
The Company has the ability to borrow up to
$2.1 billion
under the 2014 Credit Facility, which includes a
$200.0 million
sublimit for letters of credit and a
$50.0 million
sublimit for swingline loans. During the
year ended December 31, 2018
, the Company borrowed an aggregate of
$1.1 billion
and repaid an aggregate of
$1.5 billion
of revolving indebtedness under the 2014 Credit Facility. The Company used the borrowings to repay existing indebtedness, including the Secured Tower Revenue Securities, Series 2013-1A (the “Series 2013-1A Securities”), to fund acquisitions and for general corporate purposes.
2018 Term Loan—
On March 29, 2018, the Company entered into the 2018 Term Loan, the net proceeds of which were used to repay
$1.1 billion
of outstanding indebtedness under the 2013 Credit Facility and
$445.0 million
of outstanding indebtedness under the 2014 Credit Facility.
F-26
AMERICAN TOWER CORPORATION AND SUBSIDIARIES
NOTES TO CONSOLIDATED FINANCIAL STATEMENTS
(Tabular amounts in millions, unless otherwise disclosed)
The 2018 Term Loan matures on March 29, 2019. Any outstanding principal and accrued but unpaid interest will be due and payable in full at maturity.
The 2013 Credit Facility, the 2014 Credit Facility, the 2013 Term Loan and the 2018 Term Loan do not require amortization of principal and may be paid prior to maturity in whole or in part at the Company’s option without penalty or premium. The Company has the option of choosing either a defined base rate or LIBOR as the applicable base rate for borrowings under the 2013 Credit Facility, the 2014 Credit Facility, the 2013 Term Loan and the 2018 Term Loan.
The interest rates on the 2013 Credit Facility, 2014 Credit Facility and 2013 Term Loan range between
0.875%
to
1.750%
above LIBOR for LIBOR based borrowings or up to
0.750%
above the defined base rate for base rate borrowings, in each case based upon the Company’s debt ratings. The interest rate on the 2018 Term Loan ranges between
0.625%
to
1.500%
above LIBOR for LIBOR based borrowings or up to
0.500%
above the defined base rate for base rate borrowings, in each case based upon the Company’s debt ratings.
As of
December 31, 2018
, the key terms under the 2013 Credit Facility, the 2014 Credit Facility, the 2013 Term Loan and 2018 Term loan were as follows:
|
Outstanding Principal Balance
|
Undrawn letters of credit
|
Maturity Date
|
Current margin over LIBOR
|
Current commitment fee (1)
|
||||||||||
|
2013 Credit Facility
|
$
|
1,875.0
|
|
(2)
|
$
|
3.8
|
|
June 28, 2022
|
(3)
|
1.125
|
%
|
0.125
|
%
|
|
|
2014 Credit Facility
|
$
|
—
|
|
$
|
6.2
|
|
January 31, 2024
|
(3)
|
1.125
|
%
|
0.125
|
%
|
||
|
2013 Term Loan
|
$
|
1,000.0
|
|
(2)
|
N/A
|
|
January 31, 2024
|
1.125
|
%
|
N/A
|
|
|||
|
2018 Term Loan
|
$
|
1,500.0
|
|
(2)
|
N/A
|
|
March 29, 2019
|
0.875
|
%
|
N/A
|
|
|||
_______________
(1) Fee on undrawn portion of each credit facility.
(2) Borrowed at LIBOR.
(3) Subject to
two
optional renewal periods.
The agreements for the 2013 Credit Facility, the 2014 Credit Facility, the 2013 Term Loan and the 2018 Term Loan contain certain reporting, information, financial and operating covenants and other restrictions (including limitations on additional debt, guaranties, sales of assets and liens) with which the Company must comply. Any failure to comply with the financial and operating covenants of the loan agreements may constitute a default, which could result in, among other things, the amounts outstanding under the applicable agreement, including all accrued interest and unpaid fees, becoming immediately due and payable.
Senior Notes
1.950%
Senior Notes Offering—
On May 22, 2018, the Company completed a registered public offering of
500.0 million
Euros (“EUR”) (
$589.0 million
at the date of issuance) aggregate principal amount of
1.950%
senior unsecured notes due 2026 (the “
1.950%
Notes”). The net proceeds from this offering were approximately
493.2 million
EUR (approximately
$581.0 million
at the date of issuance), after deducting commissions and estimated expenses. The Company used the net proceeds to repay existing indebtedness under the 2013 Credit Facility.
The
1.950%
Notes will mature on May 22, 2026 and bear interest at a rate of
1.950%
per annum. Accrued and unpaid interest on the
1.950%
Notes will be payable in EUR in arrears on May 22 of each year, beginning on May 22, 2019. Interest on the
1.950%
Notes will be computed on the basis of the actual number of days in the period for which interest is being calculated and the actual number of days from and including the last date on which interest was paid on the
1.950%
Notes and commenced accruing on May 22, 2018.
F-27
AMERICAN TOWER CORPORATION AND SUBSIDIARIES
NOTES TO CONSOLIDATED FINANCIAL STATEMENTS
(Tabular amounts in millions, unless otherwise disclosed)
The following table outlines key terms related to the Company
’
s outstanding senior notes as of
December 31, 2018
:
|
Adjustments to Principal Amount (1)
|
|||||||||||||
|
Aggregate Principal Amount
|
2018
|
2017
|
Interest
payments due (2)
|
Issue Date
|
Par Call Date (3)
|
||||||||
|
3.40% Notes (4)
|
1,000.0
|
|
—
|
|
(0.2
|
)
|
February 15 and August 15
|
August 19, 2013
|
N/A
|
||||
|
2.800% Notes
|
750.0
|
|
(2.2
|
)
|
(3.7
|
)
|
June 1 and December 1
|
May 7, 2015
|
May 1, 2020
|
||||
|
5.050% Notes
|
700.0
|
|
(1.3
|
)
|
(2.0
|
)
|
March 1 and September 1
|
August 16, 2010
|
N/A
|
||||
|
3.300% Notes
|
750.0
|
|
(2.8
|
)
|
(4.0
|
)
|
February 15 and August 15
|
January 12, 2016
|
January 15, 2021
|
||||
|
3.450% Notes
|
650.0
|
|
(3.7
|
)
|
(4.9
|
)
|
March 15 and September 15
|
August 7, 2014
|
N/A
|
||||
|
5.900% Notes
|
500.0
|
|
(1.6
|
)
|
(2.2
|
)
|
May 1 and November 1
|
October 6, 2011
|
N/A
|
||||
|
2.250% Notes (5)
|
600.0
|
|
(27.3
|
)
|
(27.6
|
)
|
January 15 and July 15
|
September 30, 2016
|
N/A
|
||||
|
4.70% Notes
|
700.0
|
|
(2.6
|
)
|
(3.3
|
)
|
March 15 and September 15
|
March 12, 2012
|
N/A
|
||||
|
3.50% Notes
|
1,000.0
|
|
(7.4
|
)
|
(9.1
|
)
|
January 31 and July 31
|
January 8, 2013
|
N/A
|
||||
|
3.000% Notes (6)
|
700.0
|
|
(12.5
|
)
|
(7.5
|
)
|
June 15 and December 15
|
December 8, 2017
|
N/A
|
||||
|
5.00% Notes (4)
|
1,000.0
|
|
2.1
|
|
2.4
|
|
February 15 and August 15
|
August 19, 2013
|
N/A
|
||||
|
1.375% Notes (7)
|
573.3
|
|
(9.3
|
)
|
(11.1
|
)
|
April 4
|
April 6, 2017
|
January 4, 2025
|
||||
|
4.000% Notes
|
750.0
|
|
(7.9
|
)
|
(9.0
|
)
|
June 1 and December 1
|
May 7, 2015
|
March 1, 2025
|
||||
|
4.400% Notes
|
500.0
|
|
(3.9
|
)
|
(4.4
|
)
|
February 15 and August 15
|
January 12, 2016
|
November 15, 2025
|
||||
|
1.950% Notes (7)
|
573.3
|
|
(7.3
|
)
|
—
|
|
May 22
|
May 22, 2018
|
February 22, 2026
|
||||
|
3.375% Notes
|
1,000.0
|
|
(13.7
|
)
|
(15.2
|
)
|
April 15 and October 15
|
May 13, 2016
|
July 15, 2026
|
||||
|
3.125% Notes
|
400.0
|
|
(2.7
|
)
|
(2.9
|
)
|
January 15 and July 15
|
September 30, 2016
|
October 15, 2026
|
||||
|
3.55% Notes
|
750.0
|
|
(6.5
|
)
|
(7.2
|
)
|
January 15 and July 15
|
June 30, 2017
|
April 15, 2027
|
||||
|
3.600% Notes
|
700.0
|
|
(8.1
|
)
|
(8.9
|
)
|
January 15 and July 15
|
December 8, 2017
|
October 15, 2027
|
||||
_______________
|
(1)
|
Includes unamortized discounts, premiums and debt issuance costs and fair value adjustments due to interest rate swaps.
|
|
(2)
|
Interest payments are due semi-annually for each series of senior notes, except for the 1.375% Notes and the 1.950% Notes, for which interest payments are due annually.
|
|
(3)
|
The Company will not be required to pay a make-whole premium if redeemed on or after the par call date.
|
|
(4)
|
The original issue date for the
3.40%
Notes and the
5.00%
Notes was August 19, 2013. The issue date for the reopened
3.40%
Notes and the reopened
5.00%
Notes was January 10, 2014. The
3.40%
Notes were repaid on February 15, 2019.
|
|
(5)
|
Includes
$24.3 million
and
$23.7 million
fair value adjustment due to interest rate swaps in 2018 and 2017, respectively.
|
|
(6)
|
Includes
$7.0 million
and
$0.8 million
fair value adjustment due to interest rate swaps in 2018 and 2017, respectively.
|
|
(7)
|
Notes are denominated in EUR.
|
The Company may redeem each series of senior notes at any time, subject to the terms of the applicable supplemental indenture, in whole or in part, at a redemption price equal to
100%
of the principal amount of the notes plus a make-whole premium, together with accrued interest to the redemption date. In addition, if the Company undergoes a change of control and corresponding ratings decline, each as defined in the applicable supplemental indenture, it may be required to repurchase all of the applicable notes at a purchase price equal to
101%
of the principal amount of such notes, plus accrued and unpaid interest (including additional interest, if any), up to but not including the repurchase date. The notes rank equally with all of the Company’s other senior unsecured debt and are structurally subordinated to all existing and future indebtedness and other obligations of its subsidiaries.
Each applicable supplemental indenture for the notes contains certain covenants that restrict the Company’s ability to merge, consolidate or sell assets and its (together with its subsidiaries’) ability to incur liens. These covenants are subject to a number of exceptions, including that the Company and its subsidiaries may incur certain liens on assets, mortgages or other liens securing indebtedness if the aggregate amount of such liens does not exceed
3.5
x Adjusted EBITDA, as defined in the applicable supplemental indenture.
F-28
AMERICAN TOWER CORPORATION AND SUBSIDIARIES
NOTES TO CONSOLIDATED FINANCIAL STATEMENTS
(Tabular amounts in millions, unless otherwise disclosed)
American Tower Subsidiary Debt
The Company has several securitizations in place. Cash flows generated by the sites that secure the securitized debt are only available for payment of such debt and are not available to pay the Company’s other obligations or the claims of its creditors. However, subject to certain restrictions, the Company holds the right to the excess cash flows not needed to pay the securitized debt and other obligations arising out of the securitizations. The securitized debt is the obligation of the issuers thereof or borrowers thereunder, as applicable, and their subsidiaries, and not of the Company or its other subsidiaries.
Repayment of Series 2013-1A Securities.
On the March 2018 payment date, the Company repaid the
$500.0 million
aggregate principal amount outstanding under the Series 2013-1A Securities pursuant to the terms of the agreements governing such securities. The repayment was funded with borrowings under the 2014 Credit Facility and cash on hand.
American Tower Secured Revenue Notes, Series 2015-1, Class A and Series 2015-2, Class A
—In May 2015, GTP Acquisition Partners I, LLC (“GTP Acquisition Partners”), one of the Company’s wholly owned subsidiaries, refinanced existing debt with cash on hand and proceeds from a private issuance (the “2015 Securitization”) of
$350.0 million
of American Tower Secured Revenue Notes, Series 2015-1, Class A (the “Series 2015-1 Notes”) and
$525.0 million
of American Tower Secured Revenue Notes, Series 2015-2, Class A (the “Series 2015-2 Notes,” and together with the Series 2015-1 Notes, the “2015 Notes”).
The 2015 Notes are secured by (i) mortgages, deeds of trust and deeds to secure debt on substantially all of the
3,556
communications sites (the “2015 Secured Sites”) owned by GTP Acquisition Partners and its subsidiaries (the “GTP Entities”) and their operating cash flows, (ii) a security interest in substantially all of the personal property and fixtures of the GTP Entities, including GTP Acquisition Partners’ equity interests in its subsidiaries and (iii) the rights of the GTP Entities under a management agreement. American Tower Holding Sub II, LLC, whose only material assets are its equity interests in GTP Acquisition Partners, has guaranteed repayment of the 2015 Notes and pledged its equity interests in GTP Acquisition Partners as security for such payment obligations.
The 2015 Notes were issued by GTP Acquisition Partners pursuant to a Third Amended and Restated Indenture and related series supplements, each dated as of May 29, 2015 (collectively, the “2015 Indenture”), between the GTP Entities and The Bank of New York Mellon, as trustee. The effective weighted average life and interest rate of the 2015 Notes was
8.1 years
and
3.029%
, respectively, as of the date of issuance.
Secured Tower Revenue Securities, Series 2013-2A
,
Secured Tower Revenue Securities, Series 2018-1, Subclass A and Series 2018-1, Subclass R
—On March 29, 2018, the Company completed a securitization transaction (the “2018 Securitization”), in which the American Tower Trust I (the “Trust”) issued
$500.0 million
aggregate principal amount of Secured Tower Revenue Securities, Series 2018-1, Subclass A (the “Series 2018-1A Securities”). To satisfy the applicable risk retention requirements of Regulation RR promulgated under the Securities Exchange Act of 1934, as amended (the “Exchange Act” and, such requirements, the “Risk Retention Rules”), the Trust issued, and one of the Company’s affiliates purchased,
$26.4 million
aggregate principal amount of Secured Tower Revenue Securities, Series 2018-1, Subclass R (the “Series 2018-1R Securities” and, together with the Series 2018-1A Securities, the “2018 Securities”) to retain an “eligible horizontal residual interest” (as defined in the Risk Retention Rules) in an amount equal to at least
5%
of the fair value of the 2018 Securities.
The Secured Tower Revenue Securities, Series 2013-2A (the “Series 2013-2A Securities” and, together with the 2018 Securities the “Trust Securities”) issued in a securitization transaction in March 2013 (the “2013 Securitization” and, together with the 2018 Securitization, the “Trust Securitizations”) remain outstanding and are subject to the terms of the Second Amended and Restated Trust and Servicing Agreement entered into in connection with the 2018 Securitization.
The assets of the Trust consist of a nonrecourse loan (the “Loan”) made by the Trust to American Tower Asset Sub, LLC and American Tower Asset Sub II, LLC (together, the “AMT Asset Subs”). The AMT Asset Subs are jointly and severally liable under the Loan, which is secured primarily by mortgages on the AMT Asset Subs’ interests in
5,116
broadcast and wireless communications towers and related assets (the “Trust Sites”).
The component of the Loan corresponding to the Series 2013-2A Securities also remains outstanding and is subject to the terms of the Loan Agreement. The Loan Agreement includes terms and conditions, including with respect to secured assets, substantially consistent with the First Amended and Restated Loan and Security Agreement dated as of March 15, 2013. The 2018 Securities correspond to components of the Loan made to the AMT Asset Subs pursuant to the Second Amended and Restated Loan and Security Agreement among the Trust and the AMT Asset Subs, dated as of March 29, 2018 (the “Loan Agreement”) and were issued in two separate subclasses of the same series. The 2018 Securities represent a pass-through interest in the components of
F-29
AMERICAN TOWER CORPORATION AND SUBSIDIARIES
NOTES TO CONSOLIDATED FINANCIAL STATEMENTS
(Tabular amounts in millions, unless otherwise disclosed)
the Loan corresponding to the 2018 Securities. The Series 2018-1A Securities have an interest rate of
3.652%
and the Series 2018-1R Securities have an interest rate of
4.459%
. The 2018 Securities have an expected life of approximately ten years with a final repayment date in March 2048. Subject to certain limited exceptions described below, no payments of principal will be required to be made on the components of the Loan corresponding to the 2018 Securities prior to the monthly payment date in March 2028, which is the anticipated repayment date for such components.
The Loan is secured by (1) mortgages, deeds of trust and deeds to secure debt on substantially all of the Trust Sites and their operating cash flows, (2) a security interest in substantially all of the AMT Asset Subs’ personal property and fixtures and (3) the AMT Asset Subs’ rights under that certain management agreement among the AMT Asset Subs and SpectraSite Communications, LLC entered into in March 2013. American Tower Holding Sub, LLC (the “Guarantor”), whose only material assets are its equity interests in each of the AMT Asset Subs, and American Tower Guarantor Sub, LLC whose only material asset is its equity interests in the Guarantor, have each guaranteed repayment of the Loan and pledged their equity interests in their respective subsidiary or subsidiaries as security for such payment obligations.
Under the terms of the Loan Agreement and 2015 Indenture, amounts due will be paid from the cash flows generated by the Trust Sites or the 2015 Secured Sites, respectively, which must be deposited into certain reserve accounts, and thereafter distributed solely pursuant to the terms of the Loan Agreement or 2015 Indenture, as applicable. On a monthly basis, after payment of all required amounts under the Loan Agreement or 2015 Indenture, as applicable, including interest payments, subject to the conditions described below, the excess cash flows generated from the operation of such assets are released to the AMT Asset Subs or GTP Acquisition Partners, as applicable, which can then be distributed to, and used by, the Company.
In order to distribute any excess cash flow to the Company, the AMT Asset Subs and GTP Acquisition Partners must each maintain a specified debt service coverage ratio (the “DSCR”), which is generally calculated as the ratio of the net cash flow (as defined in the applicable agreement) to the amount of interest, servicing fees and trustee fees required to be paid over the succeeding
12
months on the principal amount of the Loan or the 2015 Notes, as applicable, that will be outstanding on the payment date following such date of determination. If the DSCR were equal to or below
1.30
x (the “Cash Trap DSCR”) for any quarter, then all cash flow in excess of amounts required to make debt service payments, fund required reserves, pay management fees and budgeted operating expenses and make other payments required under the applicable transaction documents, referred to as excess cash flow, will be deposited into a reserve account (the “Cash Trap Reserve Account”) instead of being released to the AMT Asset Subs or GTP Acquisition Partners, as applicable. The funds in the Cash Trap Reserve Account will not be released to the AMT Asset Subs or GTP Acquisition Partners, as applicable, unless the DSCR exceeds the Cash Trap DSCR for
two
consecutive calendar quarters.
Additionally, an “amortization period” commences if, as of the end of any calendar quarter, the DSCR is equal to or below
1.15
x (the “Minimum DSCR”) and will continue to exist until the DSCR exceeds the Minimum DSCR for two consecutive calendar quarters. With respect to the Trust Securities, an “amortization period” also commences if, on the anticipated repayment date the component of the Loan corresponding to the applicable subclass of the Trust Securities has not been repaid in full, provided that such amortization period shall apply with respect to such component that has not been repaid in full. If either series of the 2015 Notes have not been repaid in full on the applicable anticipated repayment date, additional interest will accrue on the unpaid principal balance of the applicable series of the 2015 Notes, and such series will begin to amortize on a monthly basis from excess cash flow. During an amortization period, all excess cash flow and any amounts in the applicable Cash Trap Reserve Account would be applied to pay the principal of the Loan or the 2015 Notes, as applicable, on each monthly payment date.
The Loan and the 2015 Notes may be prepaid in whole or in part at any time, provided such payment is accompanied by the applicable prepayment consideration. If the prepayment occurs within
12
months of the anticipated repayment date with respect to the Series 2015-1 Notes,
18
months of the anticipated repayment date with respect to the Series 2013-2A Securities or the Series 2015-2 Notes, or
36
months of the anticipated repayment date with respect to the Series 2018 Securities, no prepayment consideration is due.
The Loan Agreement and the 2015 Indenture include operating covenants and other restrictions customary for transactions subject to rated securitizations. Among other things, the AMT Asset Subs and the GTP Entities, as applicable, are prohibited from incurring other indebtedness for borrowed money or further encumbering their assets subject to customary carve-outs for ordinary course trade payables and permitted encumbrances (as defined in the Loan Agreement or the 2015 Indenture, as applicable). The organizational documents of the AMT Asset Subs and the GTP Entities contain provisions consistent with rating agency securitization criteria for special purpose entities, including the requirement that they maintain independent directors. The Loan Agreement and the 2015 Indenture also contain certain covenants that require the AMT Asset Subs or GTP Acquisition Partners, as applicable, to provide the respective trustee with regular financial reports and operating budgets, promptly notify such trustee
F-30
AMERICAN TOWER CORPORATION AND SUBSIDIARIES
NOTES TO CONSOLIDATED FINANCIAL STATEMENTS
(Tabular amounts in millions, unless otherwise disclosed)
of events of default and material breaches under the Loan Agreement and other agreements related to the Trust Sites or the 2015 Indenture and other agreements related to the 2015 Secured Sites, as applicable, and allow the applicable trustee reasonable access to the sites, including the right to conduct site investigations.
A failure to comply with the covenants in the Loan Agreement or the 2015 Indenture could prevent the AMT Asset Subs or GTP Acquisition Partners, as applicable, from distributing excess cash flow to the Company. Furthermore, if the AMT Asset Subs or GTP Acquisition Partners were to default on the Loan or a series of the 2015 Notes, the applicable trustee may seek to foreclose upon or otherwise convert the ownership of all or any portion of the Trust Sites or the 2015 Secured Sites, respectively, in which case the Company could lose the revenue associated with those assets. With respect to the 2015 Notes, upon the occurrence and during an event of default, the applicable trustee may, in its discretion or at the direction of holders of more than
50%
of the aggregate outstanding principal of any series of the 2015 Notes, declare such series of 2015 Notes immediately due and payable, in which case any excess cash flow would need to be used to pay holders of such notes.
Further, under the Loan Agreement and the 2015 Indenture, the AMT Asset Subs or GTP Acquisition Partners, respectively, are required to maintain reserve accounts, including for ground rents, real estate and personal property taxes and insurance premiums, and, under the 2015 Indenture and in certain circumstances under the Loan Agreement, to reserve a portion of advance rents from tenants on the Trust Sites. Based on the terms of the Loan Agreement and the 2015 Indenture, all rental cash receipts received for each month are reserved for the succeeding month and held in an account controlled by the applicable trustee and then released. The
$63.3 million
held in the reserve accounts with respect to the Trust Securitizations and the
$16.8 million
held in the reserve accounts with respect to the 2015 Securitization as of
December 31, 2018
are classified as Restricted cash on the Company’s accompanying consolidated balance sheets.
India Indebtedness—
Amounts outstanding and key terms of the India indebtedness consisted of the following as of
December 31, 2018
(in millions, except percentages):
|
Amount Outstanding (INR)
|
Amount Outstanding (USD)
|
Interest Rate (Range)
|
Maturity Date (Range)
|
|||||||||
|
Term loans (1)
|
16,751
|
|
$
|
240.1
|
|
8.75% - 8.95%
|
January 1, 2019 - November 30, 2024
|
|||||
|
Working capital facilities
(2)
|
—
|
|
$
|
—
|
|
8.40% - 8.75%
|
March 18, 2019 - October 23, 2019
|
|||||
_______________
|
(1)
|
In January 2019, the Company repaid approximately
5.0 billion
INR ($
72.0 million
) of India indebtedness.
|
|
(2)
|
5.7 billion
INR (
$81.8 million
) of borrowing capacity as of December 31, 2018.
|
The India indebtedness includes several term loans, with maturities ranging from
1
to
10
years, which are generally secured by the borrower’s short-term and long-term assets. Each of the term loans bear interest at the applicable bank’s Marginal Cost of Funds based Lending Rate (as defined in the applicable agreement), plus a spread. Interest rates on the term loans are fixed until certain reset dates. Generally, the term loans can be repaid without penalty on the reset dates; repayments at dates other than the reset dates are subject to prepayment penalties, typically of
1%
to
2%
. Scheduled repayment terms include either ratable or staggered amortization with repayments typically commencing between
6
and
36
months after the initial disbursement of funds.
The India indebtedness also includes several working capital facilities, most of which are subject to annual renewal, and which are generally secured by the borrower’s short-term and long-term assets. The working capital facilities bear interest at rates that consist of the applicable bank’s Marginal Cost of Funds based Lending Rate (as defined in the applicable agreement), plus a spread. Generally, the working capital facilities are payable on demand prior to maturity.
Preference Shares—
On March 2, 2017, ATC TIPL issued
166,666,666
Preference Shares and used the proceeds to redeem the preference shares previously issued by Viom. As of
December 31, 2018
, ATC TIPL had
166,666,666
Preference Shares outstanding, which are required to be redeemed in cash. Accordingly, the Company recognized debt of
1.67 billion
INR (
$23.9 million
) related to the Preference Shares outstanding on the consolidated balance sheet. The Company intends to redeem the Preference Shares on March 2, 2019.
Other Subsidiary Debt—
The Company’s other subsidiary debt includes (i) a credit facility entered into by one of the Company’s South African subsidiaries in December 2015, as amended (the “South African Credit Facility”), (ii) a long-term credit facility entered into by one of the Company’s Colombian subsidiaries in October 2014 (the “Colombian Credit Facility”), (iii) a credit facility entered into by one of the Company’s Brazilian subsidiaries in December 2014 (the “Brazil Credit Facility”) with Banco Nacional de Desenvolvimento Econômico e Social and (iv) a note entered into by one of the Company’s subsidiaries in October 2018 in connection with the acquisition of sites in Kenya (the “Kenya Debt”). In 2017, the Company’s other subsidiary debt also
F-31
AMERICAN TOWER CORPORATION AND SUBSIDIARIES
NOTES TO CONSOLIDATED FINANCIAL STATEMENTS
(Tabular amounts in millions, unless otherwise disclosed)
included publicly issued simple debentures in Brazil (the “BR Towers Debentures”) issued by a subsidiary of BR Towers and assumed by the Company in its acquisition of BR Towers. The BR Towers Debentures were repaid in 2018.
Amounts outstanding and key terms of other subsidiary debt consisted of the following as of
December 31,
(in millions, except percentages):
|
Carrying Value
(Denominated Currency) (1)
|
Carrying Value
(USD) (1)
|
Interest Rate
|
Maturity Date
|
|||||||||||||||||
|
2018
|
2017
|
2018
|
2017
|
|||||||||||||||||
|
South African Credit Facility (2)
|
577.4
|
|
866.0
|
|
$
|
40.2
|
|
$
|
69.9
|
|
9.10
|
%
|
December 17, 2020
|
|||||||
|
Colombian Credit Facility (3)
|
109,193.8
|
|
138,740.3
|
|
$
|
33.6
|
|
$
|
46.5
|
|
8.14
|
%
|
April 24, 2021
|
|||||||
|
Brazil Credit Facility (4)
|
94.7
|
|
122.4
|
|
$
|
24.4
|
|
$
|
37.0
|
|
Various
|
|
January 15, 2022
|
|||||||
|
Kenya Debt (5)
|
51.8
|
|
$
|
—
|
|
$
|
51.8
|
|
$
|
—
|
|
8.00
|
%
|
October 1, 2021
|
||||||
|
U.S. Subsidiary Debt (6)
|
2.5
|
|
—
|
|
$
|
2.5
|
|
$
|
—
|
|
—
|
%
|
January 1, 2022
|
|||||||
|
BR Towers Debentures (7)
|
—
|
|
306.8
|
|
$
|
—
|
|
$
|
92.7
|
|
N/A
|
|
N/A
|
|||||||
_______________
|
(1)
|
Includes applicable deferred financing costs.
|
|
(2)
|
Denominated in ZAR, with an original principal amount of
830.0 million
ZAR. On December 23, 2016, the borrower borrowed an additional
500.0 million
ZAR. Debt accrues interest at a variable rate. The borrower no longer maintains the ability to draw on the South African Credit Facility.
|
|
(3)
|
Denominated in COP, with an original principal amount of
200.0 billion
COP. Debt accrues interest at a variable rate. The loan agreement for the Colombian Credit Facility requires that the borrower manage exposure to variability in interest rates on certain of the amounts outstanding under the Colombian Credit Facility. The borrower no longer maintains the ability to draw on the Colombian Credit Facility.
|
|
(4)
|
Denominated in BRL, with an original principal amount of
271.0 million
BRL. Debt accrues interest at a variable rate. The borrower no longer maintains the ability to draw on the Brazil Credit Facility.
|
|
(5)
|
Denominated in USD, with an original principal amount of
$51.8 million
. The loan agreement for the Kenya Debt requires that the debt be paid either (i) in future installments subject to the satisfaction of specified conditions or (ii)
three
years from the note origination date.
|
|
(6)
|
Related to a seller-financed acquisition. Denominated in USD with an original principal amount of
$2.5 million
.
|
|
(7)
|
Denominated in BRL, with an original principal amount of
300.0 million
BRL. Debt accrued interest at a variable rate. In October 2018, the BR Towers Debentures were repaid in full.
|
Pursuant to the agreements governing the South African Credit Facility and the Colombian Credit Facility, payments of principal and interest are generally payable quarterly in arrears. Outstanding principal and accrued but unpaid interest will be due and payable in full at maturity. The South African Credit Facility may be prepaid in whole or in part without prepayment consideration. The Colombian Credit Facility may be prepaid in whole or in part at any time, subject to certain limitations and prepayment consideration.
The South African Credit Facility, the Colombian Credit Facility and the Brazil Credit Facility are secured by, among other things, liens on towers owned by the applicable borrower.
Each of the agreements governing the other subsidiary debt contains contractual covenants and other restrictions. Failure to comply with certain of the financial and operating covenants could constitute a default under the applicable debt agreement, which could result in, among other things, the amounts outstanding, including all accrued interest and unpaid fees, becoming immediately due and payable.
Shareholder Loans
—In connection with the establishment of certain of the Company’s joint ventures and related acquisitions of communications sites in Ghana and Uganda, the Company’s majority owned subsidiaries entered into shareholder loan agreements, as borrowers, with wholly owned subsidiaries of the Company and of the Company’s joint venture partners, as lenders. The portions of the loans made by the Company’s wholly owned subsidiaries are eliminated in consolidation and the portions of the loans made by each of the Company’s joint venture partner’s wholly owned subsidiaries are reported as outstanding debt of the Company. Outstanding amounts under each of the Company’s shareholder loans consisted of the following as of
December 31,
:
|
2018
|
2017
|
Contractual Interest Rate
|
Maturity Date
|
|||||||||
|
Ghana loan (1)
|
$
|
59.9
|
|
$
|
66.5
|
|
21.87
|
%
|
December 31, 2019
|
|||
|
Uganda loan (2)
|
$
|
—
|
|
34.1
|
|
N/A
|
|
N/A
|
||||
F-32
AMERICAN TOWER CORPORATION AND SUBSIDIARIES
NOTES TO CONSOLIDATED FINANCIAL STATEMENTS
(Tabular amounts in millions, unless otherwise disclosed)
_______________
|
(1)
|
Denominated in GHS. As of December 31, 2018, the aggregate principal amount outstanding under the Ghana loan was
294.4 million
GHS.
|
|
(2)
|
Denominated in UGX. On August 30, 2018, the Company repaid the remaining
127.2 billion
UGX ($
33.8 million
) under the Uganda loan, including principal and accrued unpaid interest. As a result, no amounts were outstanding under the Uganda loan as of December 31, 2018.
|
Capital Lease and Other Obligations
—The Company’s capital lease and other obligations approximated
$179.5 million
and
$165.5 million
as of December 31, 2018 and 2017, respectively. These obligations are secured by the related assets, bear interest at rates of
3.36%
to
9.25%
, and mature in periods ranging from less than
one year
to approximately
75 years
.
Maturities
—Aggregate principal maturities of long-term debt, including capital leases, for the next five years and thereafter are expected to be:
|
Year Ending December 31,
|
|||
|
2019
|
$
|
2,754.8
|
|
|
2020
|
1,884.4
|
|
|
|
2021
|
2,014.2
|
|
|
|
2022
|
3,238.8
|
|
|
|
2023
|
3,043.1
|
|
|
|
Thereafter
|
8,367.9
|
|
|
|
|
|||
|
Total cash obligations
|
21,303.2
|
|
|
|
Unamortized discounts, premiums and debt issuance costs and fair value adjustments, net
|
(143.3
|
)
|
|
|
|
|||
|
Balance as of December 31, 2018
|
$
|
21,159.9
|
|
|
|
|||
9. OTHER NON-CURRENT LIABILITIES
Other non-current liabilities consisted of the following as of December 31,:
|
2018
|
2017
|
||||||
|
Deferred rent liability
|
$
|
506.7
|
|
$
|
467.0
|
|
|
|
Unearned revenue
|
504.6
|
|
509.2
|
|
|||
|
Other miscellaneous liabilities
|
253.8
|
|
268.0
|
|
|||
|
Other non-current liabilities
|
$
|
1,265.1
|
|
$
|
1,244.2
|
|
|
10. ASSET RETIREMENT OBLIGATIONS
The changes in the carrying amount of the Company’s asset retirement obligations were as follows:
|
2018
|
2017
|
||||||
|
Beginning balance as of January 1,
|
$
|
1,175.3
|
|
$
|
965.5
|
|
|
|
Additions
|
39.6
|
|
33.4
|
|
|||
|
Accretion expense
|
83.6
|
|
94.5
|
|
|||
|
Revisions in estimates (1)
|
(81.5
|
)
|
86.6
|
|
|||
|
Settlements
|
(7.0
|
)
|
(4.7
|
)
|
|||
|
Balance as of December 31,
|
$
|
1,210.0
|
|
$
|
1,175.3
|
|
|
_______________
|
(1)
|
Revisions in estimates include a decrease to the liability of
$49.4 million
and an increase to the liability of
$13.0 million
related to foreign currency translation for the years ended December 31, 2018 and 2017, respectively.
|
As of December 31,
2018
, the estimated undiscounted future cash outlay for asset retirement obligations was
$2.7 billion
.
F-33
AMERICAN TOWER CORPORATION AND SUBSIDIARIES
NOTES TO CONSOLIDATED FINANCIAL STATEMENTS
(Tabular amounts in millions, unless otherwise disclosed)
11. FAIR VALUE MEASUREMENTS
The Company determines the fair value of its financial instruments based on the fair value hierarchy, which requires an entity to maximize the use of observable inputs and minimize the use of unobservable inputs when measuring fair value. Below are the three levels of inputs that may be used to measure fair value:
|
Level 1
|
Quoted prices in active markets for identical assets or liabilities that the Company has the ability to access at the measurement date.
|
|
|
Level 2
|
Observable inputs other than Level 1 prices, such as quoted prices for similar assets or liabilities; quoted prices in markets that are not active; or other inputs that are observable or can be corroborated by observable market data for substantially the full term of the assets or liabilities.
|
|
|
Level 3
|
Unobservable inputs that are supported by little or no market activity and that are significant to the fair value of the assets or liabilities.
|
|
Items Measured at Fair Value on a Recurring Basis
—The fair value of the Company’s financial assets and liabilities that are required to be measured on a recurring basis at fair value was as follows:
|
|
December 31, 2018
|
December 31, 2017
|
||||||||||||||||||||
|
|
Fair Value Measurements Using
|
Fair Value Measurements Using
|
||||||||||||||||||||
|
|
Level 1
|
Level 2
|
Level 3
|
Level 1
|
Level 2
|
Level 3
|
||||||||||||||||
|
Assets:
|
||||||||||||||||||||||
|
Short-term investments (1)
|
$
|
—
|
|
—
|
|
—
|
|
$
|
1.0
|
|
—
|
|
—
|
|
||||||||
|
Embedded derivative in lease agreement
|
—
|
|
—
|
|
$
|
11.5
|
|
—
|
|
—
|
|
$
|
12.4
|
|
||||||||
|
Liabilities:
|
||||||||||||||||||||||
|
Interest rate swap agreements
|
—
|
|
$
|
33.8
|
|
—
|
|
—
|
|
$
|
29.0
|
|
—
|
|
||||||||
|
Acquisition-related contingent consideration
|
—
|
|
—
|
|
$
|
0.9
|
|
—
|
|
—
|
|
$
|
10.1
|
|
||||||||
|
Fair value of debt related to interest rate swap agreements
|
$
|
(31.3
|
)
|
—
|
|
—
|
|
$
|
(24.5
|
)
|
—
|
|
—
|
|
||||||||
|
Redeemable noncontrolling interests
|
—
|
|
—
|
|
$
|
1,004.8
|
|
—
|
|
—
|
|
$
|
1,126.2
|
|
||||||||
_______________
|
(1)
|
Consists of highly liquid investments with original maturities in excess of three months.
|
Interest Rate Swap Agreements
The fair value of the Company’s interest rate swap agreements is determined using pricing models with inputs that are observable in the market or can be derived principally from, or corroborated by, observable market data. For derivative instruments that are designated and qualify as fair value hedges, changes in the value of the derivatives are recognized in the consolidated statement of operations in the current period, along with the offsetting gain or loss on the hedged item attributable to the hedged risk. For derivative instruments that are designated and qualify as cash flow hedges, the Company records the change in fair value for the effective portion of the cash flow hedges in AOCL in the consolidated balance sheets and reclassifies a portion of the value from AOCL into Interest expense on a quarterly basis as the cash flows from the hedged item affects earnings. The Company records the settlement of interest rate swap agreements in (Loss) gain on retirement of long-term obligations in the consolidated statements of operations in the period in which the settlement occurs.
The Company entered into
three
interest rate swap agreements with an aggregate notional value of
$500.0 million
related to the
3.000%
senior unsecured notes due 2021 (the “
3.000%
Notes”). These interest rate swaps, which were designated as fair value hedges at inception, were entered into to hedge against changes in fair value of the
3.000%
Notes resulting from changes in interest rates. The interest rate swap agreements require the Company to pay interest at a variable interest rate of one-month LIBOR plus applicable spreads and to receive fixed interest at a rate of
3.000%
through June 15, 2023.
F-34
AMERICAN TOWER CORPORATION AND SUBSIDIARIES
NOTES TO CONSOLIDATED FINANCIAL STATEMENTS
(Tabular amounts in millions, unless otherwise disclosed)
The Company entered into
three
interest rate swap agreements with an aggregate notional value of
$600.0 million
related to the
2.250%
senior unsecured notes due 2022 (the “
2.250%
Notes”). These interest rate swaps, which were designated as fair value hedges at inception, were entered into to hedge against changes in fair value of the
2.250%
Notes resulting from changes in interest rates. The interest rate swap agreements require the Company to pay interest at a variable interest rate of one-month LIBOR plus applicable spreads and to receive fixed interest at a rate of
2.250%
through January 15, 2022.
The fair value of the interest rate swap agreements in the U.S. at December 31, 2018 and 2017 was
$33.5 million
and
$28.5 million
, respectively, and were included in Other non-current liabilities on the consolidated balance sheets. During the year ended December 31, 2018, the Company recorded net fair value adjustments of
$1.7 million
related to interest rate swaps and the change in fair value of debt due to interest rate swaps in Other expense in the consolidated statement of operations.
One of the Company’s Colombian subsidiaries is party to an interest rate swap agreement with an aggregate notional value of
55.0 billion
COP (
$16.9 million
) with certain of the lenders under the Colombian Credit Facility. The interest rate swap agreement, which was designated as a cash flow hedge at inception, was entered into to manage exposure to variability in interest rates on debt. The interest rate swap agreement requires the payment of a fixed interest rate of
5.74%
and pays variable interest at the three-month Inter-bank Rate (IBR) through the earlier of termination of the underlying debt or April 24, 2021. The notional value is reduced in accordance with the repayment schedule under the Colombian Credit Facility. The fair value of the interest rate swap agreements in Colombia at December 31, 2018 and 2017 was
$0.3 million
and
$0.5 million
, respectively, and were included in Other non-current liabilities on the consolidated balance sheets.
Embedded Derivative in Lease Agreement
In connection with the acquisition of communications sites in Nigeria, the Company entered into a site lease agreement where a portion of the monthly rent to be received is escalated based on an index outside the lessor’s economic environment. The fair value of the portion of the lease tied to the U.S. consumer price index was
$14.6 million
at the date of acquisition and was recorded in Notes receivable and other non-current assets on the consolidated balance sheets. The fair value of the Company’s embedded derivative is determined using a discounted cash flow approach, which takes into consideration Level 3 unobservable inputs, including expected future cash flows over the period in which the associated payment is expected to be received and applies a discount factor that captures uncertainties in the future periods associated with the expected payment. During the year ended December 31, 2018, the Company recorded
$0.9 million
of fair value adjustments, which were recorded in Other expense in the consolidated statement of operations.
Acquisition-Related Contingent Consideration
Acquisition-related contingent consideration is initially measured and recorded at fair value as an element of consideration paid in connection with an acquisition with subsequent adjustments recognized in Other operating expenses in the consolidated statements of operations. The fair value of acquisition-related contingent consideration, and any subsequent changes in fair value, is determined by using a discounted probability-weighted approach, which takes into consideration Level 3 unobservable inputs, including assessments of expected future cash flows over the period in which the obligation is expected to be settled, and applies a discount factor that captures the uncertainties associated with the obligation. Changes in the unobservable inputs of Level 3 assets or liabilities could significantly impact the fair value of these assets or liabilities recorded in the accompanying consolidated balance sheets, with the adjustments being recorded in the consolidated statements of operations.
As of
December 31, 2018
, the Company estimates that the value of all potential acquisition-related contingent consideration required payments to be between
$0.0 million
and
$0.9 million
. The changes in fair value of the contingent consideration were as follows during the years ended December 31,:
|
2018
|
2017
|
||||||
|
Balance as of January 1
|
$
|
10.1
|
|
$
|
15.4
|
|
|
|
Additions
|
—
|
|
—
|
|
|||
|
Settlements
|
(8.7
|
)
|
—
|
|
|||
|
Change in fair value
|
(0.9
|
)
|
(6.3
|
)
|
|||
|
Foreign currency translation adjustment
|
0.4
|
|
1.0
|
|
|||
|
Balance as of December 31
|
$
|
0.9
|
|
$
|
10.1
|
|
|
F-35
AMERICAN TOWER CORPORATION AND SUBSIDIARIES
NOTES TO CONSOLIDATED FINANCIAL STATEMENTS
(Tabular amounts in millions, unless otherwise disclosed)
Redeemable Noncontrolling Interests
The Company records the carrying amount of the redeemable noncontrolling interests as described in note 14. The fair value of redeemable noncontrolling interests is determined using a discounted cash flow approach, which takes into consideration Level 3 unobservable inputs, including expected future cash flows and applies a discount factor that captures uncertainties in the future periods. If required, the Company adjusts the redeemable noncontrolling interests to redemption value on each balance sheet date with changes in redemption value recognized as an adjustment to net income (loss) attributable to noncontrolling interests.
The recurring Level 3 fair value measurements of the Company’s embedded derivative in lease agreement, acquisition-related contingent consideration and redeemable noncontrolling interests include the following significant unobservable inputs as of December 31, 2018:
|
Significant Unobservable Input
|
Range
|
||||
|
Embedded derivative in lease agreement
|
Discount rate
|
10.93% - 13.96%
|
|
||
|
Acquisition-related contingent consideration
|
Probability of payout
|
0.00% - 100.00%
|
|
||
|
Redeemable noncontrolling interests
|
|
Revenue growth
|
|
3.16% - 12.87%
|
|
|
Long-term growth rate
|
4.00
|
%
|
|||
Items Measured at Fair Value on a Nonrecurring Basis
Assets Held and Used
—The Company’s long-lived assets are recorded at amortized cost and, if impaired, are adjusted to fair value using Level 3 inputs.
During the year ended
December 31, 2018
, certain long-lived assets held and used with a carrying value of
$22.4 billion
were written down to their net realizable value as a result of an asset impairment charge of $
394.0 million
. During the year ended
December 31, 2017
, certain long-lived assets held and used with a carrying value of
$21.7 billion
were written down to their net realizable value as a result of an asset impairment charge of
$211.4 million
. The asset impairment charges are recorded in Other operating expenses in the accompanying consolidated statements of operations. These adjustments were determined by comparing the estimated fair value utilizing projected future discounted cash flows to be provided from the long-lived assets to the asset’s carrying value.
There were no other items measured at fair value on a nonrecurring basis during the year ended
December 31, 2018
.
Fair Value of Financial Instruments
—The Company’s financial instruments for which the carrying value reasonably approximates fair value at
December 31, 2018
and
2017
include cash and cash equivalents, restricted cash, accounts receivable and accounts payable. The Company’s estimates of fair value of its long-term obligations, including the current portion, are based primarily upon reported market values. For long-term debt not actively traded, fair value is estimated using either indicative price quotes or a discounted cash flow analysis using rates for debt with similar terms and maturities. As of
December 31, 2018
, the carrying value and fair value of long-term obligations, including the current portion, were
$21.2 billion
and
$21.1 billion
, respectively, of which
$13.4 billion
was measured using Level 1 inputs and
$7.7 billion
was measured using Level 2 inputs. As of
December 31, 2017
, the carrying value and fair value of long-term obligations, including the current portion, were
$20.2 billion
and
$20.6 billion
, respectively, of which
$13.3 billion
was measured using Level 1 inputs and
$7.3 billion
was measured using Level 2 inputs.
12. INCOME TAXES
Beginning in the taxable year ended December 31, 2012, the Company has filed, and intends to continue to file, U.S. federal income tax returns as a REIT, and its domestic TRSs filed, and intend to continue to file, separate tax returns as required. The Company also files tax returns in various states and countries. The Company’s state tax returns reflect different combinations of the Company’s subsidiaries and are dependent on the connection each subsidiary has with a particular state and form of organization. The following information pertains to the Company’s income taxes on a consolidated basis.
F-36
AMERICAN TOWER CORPORATION AND SUBSIDIARIES
NOTES TO CONSOLIDATED FINANCIAL STATEMENTS
(Tabular amounts in millions, unless otherwise disclosed)
The income tax provision from continuing operations consisted of the following for the years ended December 31,:
|
2018
|
2017
|
2016
|
|||||||||
|
Current:
|
|||||||||||
|
Federal
|
$
|
(1.4
|
)
|
$
|
(0.1
|
)
|
$
|
(26.5
|
)
|
||
|
State
|
(1.8
|
)
|
(3.8
|
)
|
(2.0
|
)
|
|||||
|
Foreign
|
(189.7
|
)
|
(113.4
|
)
|
(100.1
|
)
|
|||||
|
Deferred:
|
|||||||||||
|
Federal
|
4.0
|
|
0.2
|
|
(0.6
|
)
|
|||||
|
State
|
0.7
|
|
1.0
|
|
(0.3
|
)
|
|||||
|
Foreign
|
298.3
|
|
85.4
|
|
(26.0
|
)
|
|||||
|
Income tax benefit (provision)
|
$
|
110.1
|
|
$
|
(30.7
|
)
|
$
|
(155.5
|
)
|
||
The effective tax rate (“ETR”) on income from continuing operations for the years ended December 31, 2018, 2017 and 2016 differs from the federal statutory rate primarily due to the Company’s qualification for taxation as a REIT, as well as adjustments for state and foreign items. As a REIT, the Company may deduct earnings distributed to stockholders against the income generated by its REIT operations. In addition, the Company is able to offset certain income by utilizing its NOLs, subject to specified limitations.
The Tax Act significantly changed how the U.S. taxes corporations. The Tax Act contained several key provisions including, among other things, a reduction in the corporate income rate from
35%
to
21%
for tax years beginning after December 31, 2017. As a result of this change in tax rate, the rate at which the Company’s deferred tax assets of the Company’s TRSs decreased, resulting in additional tax expense of
$2.4 million
, which did not significantly impact the Company's effective tax rate. As of December 31, 2017, the analysis of the full impact of the Tax Act on the Company was considered provisional and subject to further analysis. As of December 31, 2018 the Company has completed its analysis and all amounts are considered final. There were no material changes to the provisional impact.
In 2015, there was an income tax law change in Ghana that disallowed unused capital allowances to be carried into 2016, which resulted in a charge to income tax expense for the year ended December 31, 2015. In 2017, the Ghana Revenue Authority issued Practice Note Number DT/2016/010 (the “Practice Note”), which clarified the Capital Allowance section of the Income Tax Act of 2015. The Practice Note allowed for unused Capital Allowance from 2015 to be treated as a deduction in 2016. As a result, the Company recorded a tax benefit of
$17.8 million
for the year ended December 31, 2017.
The change in the income tax (benefit) provision for the year ended December 31, 2018 was primarily attributable to receipt of the payment associated with the Tata settlement and the deferred benefit resulting from impairment charges and accelerated amortization taken in the same foreign jurisdiction. The net impact from restructuring was primarily due to a benefit of
$85.7 million
which resulted from the restructuring of foreign operations in certain jurisdictions.
Reconciliation between the U.S. statutory rate and the effective rate from continuing operations is as follows for the years ended December 31,:
|
2018
|
2017
|
2016
|
||||||
|
Statutory tax rate
|
21%
|
35
|
%
|
35
|
%
|
|||
|
Adjustment to reflect REIT status (1)
|
(21
|
)
|
(35
|
)
|
(35
|
)
|
||
|
Foreign taxes
|
(8
|
)
|
1
|
|
5
|
|
||
|
Foreign withholding taxes
|
4
|
|
3
|
|
4
|
|
||
|
Uncertain tax positions
|
—
|
|
—
|
|
5
|
|
||
|
Changes in tax laws
|
—
|
|
(2
|
)
|
—
|
|
||
|
Impact from restructuring
|
(6
|
)
|
—
|
|
—
|
|
||
|
Effective tax rate
|
(10
|
)%
|
2
|
%
|
14
|
%
|
||
_______________
F-37
AMERICAN TOWER CORPORATION AND SUBSIDIARIES
NOTES TO CONSOLIDATED FINANCIAL STATEMENTS
(Tabular amounts in millions, unless otherwise disclosed)
(1) As a result of the ability to utilize the dividends paid deduction to offset the Company’s REIT income and gains.
The domestic and foreign components of income from continuing operations before income taxes are as follows for the years ended December 31,:
|
2018
|
2017
|
2016
|
|||||||||
|
United States
|
$
|
1,212.7
|
|
$
|
971.2
|
|
$
|
882.6
|
|
||
|
Foreign
|
(58.1
|
)
|
284.9
|
|
243.3
|
|
|||||
|
Total
|
$
|
1,154.6
|
|
$
|
1,256.1
|
|
$
|
1,125.9
|
|
||
The components of the net deferred tax asset and liability and related valuation allowance were as follows as of December 31,:
|
2018
|
2017
|
||||||
|
Assets:
|
|||||||
|
Net operating loss carryforwards
|
$
|
264.9
|
|
$
|
287.0
|
|
|
|
Accrued asset retirement obligations
|
165.7
|
|
157.0
|
|
|||
|
Stock-based compensation
|
6.3
|
|
3.9
|
|
|||
|
Unearned revenue
|
28.3
|
|
19.3
|
|
|||
|
Unrealized loss on foreign currency
|
12.9
|
|
27.4
|
|
|||
|
Other accruals and allowances
|
78.6
|
|
50.2
|
|
|||
|
Items not currently deductible and other
|
26.2
|
|
28.0
|
|
|||
|
Liabilities:
|
|||||||
|
Depreciation and amortization
|
(757.0
|
)
|
(1,073.9
|
)
|
|||
|
Deferred rent
|
(36.9
|
)
|
(35.9
|
)
|
|||
|
Other
|
(15.3
|
)
|
(14.7
|
)
|
|||
|
Subtotal
|
(226.3
|
)
|
(551.7
|
)
|
|||
|
Valuation allowance
|
(151.9
|
)
|
(142.0
|
)
|
|||
|
Net deferred tax liabilities
|
$
|
(378.2
|
)
|
$
|
(693.7
|
)
|
|
At
December 31, 2018
and 2017, the Company has provided a valuation allowance of
$151.9 million
and
$142.0 million
, respectively, which primarily relates to foreign items. The increase in the valuation allowance for the year ending December 31, 2018 is due to uncertainty as to the timing of, and the Company’s ability to recover, net deferred tax assets in certain foreign operations in the foreseeable future, offset by fluctuations in foreign currency exchange rates. The amount of deferred tax assets considered realizable, however, could be adjusted if objective evidence in the form of cumulative losses is no longer present and additional weight may be given to subjective evidence such as the Company’s projections for growth.
A summary of the activity in the valuation allowance is as follows:
|
2018
|
2017
|
2016
|
||||||||||
|
Balance as of January 1,
|
$
|
142.0
|
|
$
|
144.4
|
|
$
|
137.0
|
|
|||
|
Additions (1)
|
15.7
|
|
11.6
|
|
14.1
|
|
||||||
|
Reversals
|
—
|
|
(9.1
|
)
|
—
|
|
||||||
|
Foreign currency translation
|
(5.8
|
)
|
(4.9
|
)
|
(6.7
|
)
|
||||||
|
Balance as of December 31,
|
$
|
151.9
|
|
$
|
142.0
|
|
$
|
144.4
|
|
|||
_______________
(1) Includes net charges to expense and allowances established through goodwill at acquisition.
The recoverability of the Company’s deferred tax assets has been assessed utilizing projections based on its current operations. Accordingly, the recoverability of the deferred tax assets is not dependent on material asset sales or other non-routine
F-38
AMERICAN TOWER CORPORATION AND SUBSIDIARIES
NOTES TO CONSOLIDATED FINANCIAL STATEMENTS
(Tabular amounts in millions, unless otherwise disclosed)
transactions. Based on its current outlook of future taxable income during the carryforward period, the Company believes that deferred tax assets, other than those for which a valuation allowance has been recorded, will be realized.
Despite a mandatory one-time inclusion in U.S. taxable income of accumulated earnings of foreign subsidiaries under the Tax Act for the year ended December 31, 2017, the Company intends to continue to reinvest foreign earnings indefinitely outside of the U.S. and does not expect to incur any significant additional taxes, including withholding taxes, related to such amounts.
At
December 31, 2018
, the Company had net federal, state and foreign operating loss carryforwards available to reduce future taxable income. If not utilized, the Company’s NOLs expire as follows:
|
Years ended December 31,
|
Federal
|
State
|
Foreign
|
||||||||
|
2019 to 2023
|
$
|
—
|
|
$
|
142.9
|
|
$
|
46.0
|
|
||
|
2024 to 2028
|
141.7
|
|
378.4
|
|
142.7
|
|
|||||
|
2029 to 2033
|
—
|
|
13.9
|
|
4.5
|
|
|||||
|
2034 to 2038
|
10.6
|
|
135.4
|
|
—
|
|
|||||
|
Indefinite carryforward
|
9.6
|
|
—
|
|
746.5
|
|
|||||
|
Total
|
$
|
161.9
|
|
$
|
670.6
|
|
$
|
939.7
|
|
||
As of
December 31, 2018
and
2017
, the total amount of unrecognized tax benefits that would impact the ETR, if recognized, is
$93.7 million
and
$105.8 million
, respectively. The amount of unrecognized tax benefits for the year ended December 31, 2018 includes additions to the Company’s existing tax positions of
$8.4 million
.
The Company expects the unrecognized tax benefits to change over the next 12 months if certain tax matters ultimately settle with the applicable taxing jurisdiction during this timeframe, or if the applicable statute of limitations lapses. The impact of the amount of such changes to previously recorded uncertain tax positions could range from
zero
to
$2.7 million
.
A reconciliation of the beginning and ending amount of unrecognized tax benefits are as follows for the years ended December 31,:
|
2018
|
2017
|
2016
|
|||||||||
|
Balance at January 1
|
$
|
116.7
|
|
$
|
107.6
|
|
$
|
28.1
|
|
||
|
Additions based on tax positions related to the current year
|
8.1
|
|
7.6
|
|
82.9
|
|
|||||
|
Additions and reductions for tax positions of prior years
|
0.3
|
|
—
|
|
—
|
|
|||||
|
Foreign currency
|
(8.1
|
)
|
1.9
|
|
(0.2
|
)
|
|||||
|
Reduction as a result of the lapse of statute of limitations
|
(2.6
|
)
|
(0.4
|
)
|
(3.2
|
)
|
|||||
|
Reduction as a result of effective settlements
|
(6.7
|
)
|
—
|
|
—
|
|
|||||
|
Balance at December 31
|
$
|
107.7
|
|
$
|
116.7
|
|
$
|
107.6
|
|
||
During the years ended
December 31, 2018
,
2017
and
2016
, the statute of limitations on certain unrecognized tax benefits lapsed and certain positions were effectively settled, which resulted in a decrease of
$9.3 million
,
$0.4 million
and
$3.2 million
, respectively, in the liability for uncertain tax benefits.
The Company recorded penalties and tax-related interest expense to the tax provision of
$8.0 million
,
$5.0 million
and
$9.2 million
for the years ended
December 31, 2018
,
2017
and
2016
, respectively. In addition, due to the expiration of the statute of limitations in certain jurisdictions and certain positions that were effectively settled, the Company reduced its liability for penalties and income tax-related interest expense related to uncertain tax positions during the years ended
December 31, 2018
,
2017
and
2016
by
$16.2 million
,
$0.6 million
and
$3.4 million
, respectively.
As of
December 31, 2018
and
2017
, the total amount of accrued income tax-related interest and penalties included in the consolidated balance sheets were
$19.1 million
and
$29.0 million
, respectively.
The Company has filed for prior taxable years, and for its taxable year ended
December 31, 2018
will file, numerous consolidated and separate income tax returns, including U.S. federal and state tax returns and foreign tax returns. The Company
F-39
AMERICAN TOWER CORPORATION AND SUBSIDIARIES
NOTES TO CONSOLIDATED FINANCIAL STATEMENTS
(Tabular amounts in millions, unless otherwise disclosed)
is subject to examination in the U.S. and various state and foreign jurisdictions for certain tax years. As a result of the Company’s ability to carryforward federal, state and foreign NOLs, the applicable tax years generally remain open to examination several years after the applicable loss carryforwards have been used or have expired. The Company regularly assesses the likelihood of additional assessments in each of the tax jurisdictions resulting from these examinations. The Company believes that adequate provisions have been made for income taxes for all periods through
December 31, 2018
.
13. STOCK-BASED COMPENSATION
Summary of Stock-Based Compensation Plans
—The Company maintains equity incentive plans that provide for the grant of stock-based awards to its directors, officers and employees. The 2007 Equity Incentive Plan, as amended (the “2007 Plan”), provides for the grant of non-qualified and incentive stock options, as well as restricted stock units, restricted stock and other stock-based awards. Exercise prices for non-qualified and incentive stock options are not less than the fair value of the underlying common stock on the date of grant. Equity awards typically vest ratably, generally over
four years
for RSUs and stock options and
three years
for PSUs. Stock options generally expire
10 years
from the date of grant. As of
December 31, 2018
, the Company had the ability to grant stock-based awards with respect to an aggregate of
7.7 million
shares of common stock under the 2007 Plan. In addition, the Company maintains an employee stock purchase plan (the “ESPP”) pursuant to which eligible employees may purchase shares of the Company’s common stock on the last day of each bi-annual offering period at a
15%
discount from the lower of the closing market value on the first or last day of such offering period. The offering periods run from June 1 through November 30 and from December 1 through May 31 of each year.
During the years ended
December 31, 2018
,
2017
and
2016
, the Company recorded and capitalized the following stock-based compensation expenses:
|
|
2018
|
2017
|
2016
|
||||||||
|
Stock-based compensation expense
|
$
|
137.5
|
|
$
|
108.5
|
|
$
|
89.9
|
|
||
|
Stock-based compensation expense capitalized as property and equipment
|
2.0
|
|
1.6
|
|
1.4
|
|
|||||
Stock Options
—The fair value of each option granted during the period was estimated on the date of grant using the Black-Scholes option pricing model based on the assumptions noted in the table below. The expected life of stock options (estimated period of time outstanding) was estimated using the vesting term and historical exercise behavior of the Company’s employees. The risk-free interest rate was based on the U.S. Treasury yield with a term that approximated the estimated life in effect at the accounting measurement date. The expected volatility of the underlying stock price was based on historical volatility for a period equal to the expected life of the stock options. The expected annual dividend yield was the Company’s best estimate of expected future dividend yield.
There were
no
options granted during the year ended December 31, 2018. Key assumptions used to apply the Black-Scholes option pricing model were as follows (percentages and years disclosed in full amounts):
|
|
|
2017
|
|
2016
|
|
Range of risk-free interest rate
|
|
1.88%-1.94%
|
|
1.00%-1.73%
|
|
Weighted average risk-free interest rate
|
|
1.89%
|
|
1.44%
|
|
Range of expected life of stock options
|
|
5.2 years
|
|
4.5 - 5.2 years
|
|
Range of expected volatility of the underlying stock price
|
|
18.95% - 19.45%
|
|
20.59% - 21.45%
|
|
Weighted average expected volatility of underlying stock price
|
|
19.05%
|
|
21.43%
|
|
Range of expected annual dividend yield
|
|
2.40%
|
|
1.85% - 2.40%
|
The weighted average grant date fair value per share during the years ended December 31,
2017
and
2016
was
$16.84
and
$14.60
, respectively. The intrinsic value of stock options exercised during the years ended
December 31, 2018
,
2017
and
2016
was
$98.8 million
,
$100.3 million
and
$77.6 million
, respectively. As of
December 31, 2018
, total unrecognized compensation expense related to unvested stock options was
$4.5 million
and is expected to be recognized over a weighted average period of approximately
one
year. The amount of cash received from the exercise of stock options was
$88.7 million
during the year ended
December 31, 2018
.
F-40
AMERICAN TOWER CORPORATION AND SUBSIDIARIES
NOTES TO CONSOLIDATED FINANCIAL STATEMENTS
(Tabular amounts in millions, unless otherwise disclosed)
The Company’s option activity for the year ended
December 31, 2018
was as follows (share and per share data disclosed in full amounts):
|
Options
|
Weighted
Average
Exercise Price Per Share
|
Weighted
Average
Remaining
Life (Years)
|
Aggregate
Intrinsic Value
|
||||||||||
|
Outstanding as of January 1, 2018
|
5,557,561
|
|
|
$81.32
|
|
||||||||
|
Granted
|
—
|
|
—
|
|
|||||||||
|
Exercised
|
(1,242,536
|
)
|
71.41
|
|
|||||||||
|
Forfeited
|
(57,555
|
)
|
94.66
|
|
|||||||||
|
Expired
|
—
|
|
—
|
|
|||||||||
|
Outstanding as of December 31, 2018
|
4,257,470
|
|
|
$84.03
|
|
5.18
|
|
$315.7
|
|
||||
|
Exercisable as of December 31, 2018
|
3,360,226
|
|
|
$81.10
|
|
4.76
|
|
$259.0
|
|
||||
|
Vested or expected to vest as of December 31, 2018
|
4,257,470
|
|
|
$84.03
|
|
5.18
|
|
$315.7
|
|
||||
The following table sets forth information regarding options outstanding at
December 31, 2018
(share and per share data disclosed in full amounts):
|
Options Outstanding
|
Options Exercisable
|
|||||||||||||||
|
Range of Exercise
Price Per Share
|
Outstanding
Number of
Options
|
Weighted
Average Exercise
Price Per Share
|
Weighted Average
Remaining Life
(Years)
|
Options
Exercisable
|
Weighted
Average Exercise
Price Per Share
|
|||||||||||
|
$28.39 - $62.00
|
594,690
|
|
$
|
56.69
|
|
2.67
|
594,690
|
|
$
|
56.69
|
|
|||||
|
$71.07 - $74.06
|
14,717
|
|
73.26
|
|
4.48
|
14,717
|
|
73.26
|
|
|||||||
|
$76.90 - $77.75
|
559,293
|
|
76.91
|
|
4.00
|
559,293
|
|
76.91
|
|
|||||||
|
$81.18 - $94.23
|
983,105
|
|
81.55
|
|
4.98
|
967,146
|
|
81.43
|
|
|||||||
|
$94.57 - $94.71
|
2,070,809
|
|
94.62
|
|
6.28
|
1,213,187
|
|
94.60
|
|
|||||||
|
$96.46 - $121.15
|
34,856
|
|
109.92
|
|
7.38
|
11,193
|
|
107.20
|
|
|||||||
|
$28.39 - $121.15
|
4,257,470
|
|
$
|
84.03
|
|
5.18
|
3,360,226
|
|
$
|
81.10
|
|
|||||
Restricted Stock Units and Performance-Based Restricted Stock Units
—The Company’s RSU and PSU activity for the year ended
December 31, 2018
was as follows (share and per share data disclosed in full amounts):
|
RSUs
|
Weighted Average Grant Date Fair Value
|
PSUs
|
Weighted Average Grant Date Fair Value
|
||||||||||
|
Outstanding as of January 1, 2018 (1)
|
1,742,725
|
|
$
|
102.60
|
|
444,031
|
|
$
|
102.81
|
|
|||
|
Granted (2)
|
686,789
|
|
144.96
|
|
300,651
|
|
116.71
|
|
|||||
|
Vested and Released (3)
|
(682,311
|
)
|
98.24
|
|
(120,171
|
)
|
100.35
|
|
|||||
|
Forfeited
|
(97,230
|
)
|
116.37
|
|
—
|
|
—
|
|
|||||
|
Outstanding as of December 31, 2018
|
1,649,973
|
|
$
|
121.23
|
|
624,511
|
|
$
|
109.97
|
|
|||
|
Expected to vest as of December 31, 2018
|
1,649,973
|
|
$
|
121.23
|
|
624,511
|
|
$
|
109.97
|
|
|||
|
Vested and deferred as of December 31, 2018 (4)
|
32,596
|
|
$
|
119.14
|
|
—
|
|
$
|
—
|
|
|||
_______________
|
(1)
|
PSUs consist of the target number of shares issuable at the end of the
three
-year performance period for the 2017 PSUs and the 2016 PSUs (each defined below), or
154,520
and
169,340
shares, respectively, and the shares issuable at the end of the
three
-year vesting period for the PSUs granted in 2015 (the “2015 PSUs”), based on achievement against the performance metrics for the first, second and third year’s performance periods, or
120,171
shares.
|
|
(2)
|
PSUs represent the shares above target that are issuable for the 2016 PSUs at the end of the
three
-year performance cycle based on exceeding the performance metric for the three-year performance period, or
169,340
shares, and the target number of shares issuable at the end of the three-year performance period for the 2018 PSUs, or
131,311
shares.
|
|
(3)
|
PSUs consist of shares vested pursuant to the 2015 PSUs. There are no additional shares to be earned related to the 2015 PSUs. RSUs exclude
32,596
shares that are vested and deferred.
|
|
(4)
|
Vested and deferred RSUs are related to deferred compensation for certain former employees.
|
The total fair value of RSUs and PSUs that vested during the year ended
December 31, 2018
was
$115.1 million
.
F-41
AMERICAN TOWER CORPORATION AND SUBSIDIARIES
NOTES TO CONSOLIDATED FINANCIAL STATEMENTS
(Tabular amounts in millions, unless otherwise disclosed)
Restricted Stock Units—
As of
December 31, 2018
, total unrecognized compensation expense related to unvested RSUs granted under the 2007 Plan was
$111.8 million
and is expected to be recognized over a weighted average period of approximately
two years
.
Performance-Based Restricted Stock Units—
During the years ended
December 31, 2018
,
2017
and 2016, the Company’s Compensation Committee granted an aggregate of
131,311
PSUs (the “2018 PSUs”),
154,520
PSUs (the “2017 PSUs”), and
169,340
PSUs (the “2016 PSUs”), respectively, to its executive officers and established the performance metrics for these awards. Threshold, target and maximum parameters were established for the metrics for a
three
-year performance period with respect to each of the 2018 PSUs, the 2017 PSUs and the 2016 PSUs and will be used to calculate the number of shares that will be issuable when each award vests, which may range from
zero
to
200%
of the target amounts. At the end of each
three
-year performance period, the number of shares that vest will depend on the degree of achievement against the pre-established performance goals. PSUs will be paid out in common stock at the end of each performance period, subject generally to the executive’s continued employment or death, disability or qualified retirement (each as defined in the applicable PSU award agreement). PSUs will accrue dividend equivalents prior to vesting, which will be paid out only in respect of shares that actually vest.
On July 26, 2018, the Company changed the vesting terms of the PSU award agreements in the event of a participant’s death, disability or qualified retirement (each as defined in the applicable award agreement) for all plan participants with the exception of its Chief Executive Officer.
During the year ended
December 31, 2018
, the Company recorded
$52.2 million
in stock-based compensation expense for equity awards in which the performance goals have been established and were probable of being achieved. This amount included
$19.1 million
of incremental compensation that was accelerated in the third quarter due to the changes in vesting terms. The remaining unrecognized compensation expense related to these awards at
December 31, 2018
, was
$8.6 million
based on the Company’s current assessment of the probability of achieving the performance goals. The weighted-average period over which the cost will be recognized is approximately
two years
.
14. REDEEMABLE NONCONTROLLING INTERESTS
Redeemable Noncontrolling Interests
—On April 21, 2016, the Company, through its wholly owned subsidiary, ATC Asia Pacific Pte. Ltd., acquired a
51%
controlling ownership interest in ATC TIPL (formerly Viom), a telecommunications infrastructure company that owns and operates wireless communications towers and indoor DAS networks in India (the “Viom Acquisition”).
In connection with the Viom Acquisition, the Company, through one of its subsidiaries, entered into a shareholders agreement (the “Shareholders Agreement”) with Viom and the following remaining Viom shareholders: Tata Sons Limited (“Tata Sons”), Tata Teleservices, IDFC Private Equity Fund III (“IDFC”), Macquarie SBI Infrastructure Investments Pte Limited and SBI Macquarie Infrastructure Trust (collectively, the “Remaining Shareholders”). During the year ended December 31, 2018, pursuant to the terms of the Shareholders Agreement, the Company merged its other wholly-owned India subsidiaries into ATC TIPL. As a result, the Company’s controlling interest in ATC TIPL increased from
51%
to
63%
, which resulted in an increase in the Company’s additional paid-in capital of
$28.1 million
. Similarly, the noncontrolling interest was reduced from
49%
to
37%
, and a corresponding adjustment to reduce the redeemable noncontrolling interest value by
$28.1 million
was recorded during the year ended December 31, 2018. In addition, the Company reclassified
$78.8 million
of previously recorded accumulated other comprehensive loss to additional paid-in capital due to the change in ownership of ATC TIPL.
The Shareholders Agreement also provides certain of the Remaining Shareholders with put options, which allow them to sell outstanding shares of ATC TIPL to the Company, and the Company with call options, which allow it to buy the noncontrolling shares of ATC TIPL. The put options, which are not under the Company’s control, cannot be separated from the noncontrolling interests. As a result, the combination of the noncontrolling interests and the redemption feature requires classification as redeemable noncontrolling interests in the consolidated balance sheet, separate from equity.
Given the provisions governing the put rights, the redeemable noncontrolling interests are recorded outside of permanent equity at their redemption value. The noncontrolling interests become redeemable after the passage of time, and therefore, the Company records the carrying amount of the noncontrolling interests at the greater of (i) the initial carrying amount, increased or decreased for the noncontrolling interests’ share of net income or loss and foreign currency translation adjustments, and (ii) the redemption value. If required, the Company will adjust the redeemable noncontrolling interests to redemption value on each balance sheet date with changes in redemption value recognized as an adjustment to Net income attributable to noncontrolling
F-42
interests. Due primarily to the impact of impairment charges on net income and, as a result, on the carrying value of the noncontrolling interests, the Company adjusted noncontrolling interests by
$86.7 million
for the year ended December 31, 2018.
The put options may be exercised, requiring the Company to purchase the Remaining Shareholders’ equity interests, on specified dates through March 31, 2021. The price of the put options will be based on the fair market value of the exercising Remaining Shareholders’ interest in the Company’s India operations at the time the option is exercised. Put options held by certain of the Remaining Shareholders are subject to a floor price of
216
INR.
In the fourth quarter of 2018, Tata Teleservices delivered to the Company notice of exercise of their put options under the Shareholders Agreement with respect to
50%
of their combined holdings with Tata Sons of ATC TIPL. Also in the fourth quarter of 2018, IDFC delivered notice to the Company of exercise of its put option under the Shareholders Agreement with respect of
100%
of its holdings of ATC TIPL. The Company expects to complete the redemption of the put shares, subject to regulatory approval, for total consideration of INR
29.4 billion
(approximately
$420.0 million
) in the first half of 2019. As a result of the redemption, the Company’s controlling interest in ATC TIPL would increase to approximately
79%
.
The changes in Redeemable noncontrolling interests for the year ended December 31, 2018, 2017 and 2016 were as follows:
|
Year Ended December 31,
|
||||||||||||
|
2018
|
2017
|
2016
|
||||||||||
|
Balance as of January 1,
|
$
|
1,126.2
|
|
$
|
1,091.3
|
|
$
|
—
|
|
|||
|
Fair value at acquisition
|
—
|
|
—
|
|
1,100.9
|
|
||||||
|
Net (loss) income attributable to noncontrolling interests
|
(87.9
|
)
|
(33.4
|
)
|
13.9
|
|
||||||
|
Adjustment to noncontrolling interest redemption value
|
86.7
|
|
—
|
|
—
|
|
||||||
|
Adjustment to noncontrolling interest due to merger
|
(28.1
|
)
|
—
|
|
—
|
|
||||||
|
Foreign currency translation adjustment attributable to noncontrolling interests
|
(92.1
|
)
|
68.3
|
|
(23.5
|
)
|
||||||
|
Balance as of December 31,
|
$
|
1,004.8
|
|
$
|
1,126.2
|
|
$
|
1,091.3
|
|
|||
15. EQUITY
Series B Preferred Stock
—In March 2015, the Company issued
1,375,000
shares of its
5.50%
Mandatory Convertible Preferred Stock, Series B, par value
$0.01
per share (the “Series B Preferred Stock”). As of December 31, 2017, the Company had
13,749,860
depositary shares, each representing a 1/10th interest in a share of its Series B Preferred Stock outstanding, after giving effect to the early conversion of
140
depositary shares at the option of the holder at a conversion rate of
0.8687
per depositary share in May 2017.
On February 15, 2018, the Company paid the final dividend of
$18.9 million
to holders of the Series B Preferred Stock at the close of business on February 1, 2018. Unless converted or redeemed earlier, each share of the Series B Preferred Stock converted automatically on February 15, 2018 at a rate of
8.7420
per share of Series B Preferred Stock, or
0.8742
per depositary share, each representing a 1/10th interest in a share of Series B Preferred Stock, into shares of the Company’s common stock pursuant to the provisions of the Certificate of Designations governing the Series B Preferred Stock. As a result of the conversions of the Series B Preferred Stock in 2018, the Company issued an aggregate of
12,020,064
shares of its common stock. The Company paid cash in lieu of fractional shares of the Company’s common stock. These payments were recorded as a reduction to Additional paid-in capital.
Dividends
—The Company may pay dividends in cash or, subject to certain limitations, in shares of common stock or any combination of cash and shares of common stock.
Sales of Equity Securities
—The Company receives proceeds from sales of its equity securities pursuant to the ESPP and upon exercise of stock options granted under its equity incentive plan. During the year ended December 31, 2018, the Company received an aggregate of
$98.9 million
in proceeds upon exercises of stock options and sales pursuant to the ESPP.
Stock Repurchase Programs
—In March 2011, the Company’s Board of Directors approved a stock repurchase program, pursuant to which the Company is authorized to repurchase up to
$1.5 billion
of its common stock (the “2011 Buyback”). In December 2017, the Board of Directors approved an additional stock repurchase program, pursuant to which the Company is
F-43
AMERICAN TOWER CORPORATION AND SUBSIDIARIES
NOTES TO CONSOLIDATED FINANCIAL STATEMENTS
(Tabular amounts in millions, unless otherwise disclosed)
authorized to repurchase up to
$2.0 billion
of its common stock (the “2017 Buyback” and, together with the 2011 Buyback, the “Buyback Programs”).
During the
year ended December 31, 2018
, the Company repurchased
1,647,489
shares of its common stock under the 2011 Buyback for an aggregate of
$232.8 million
, including commissions and fees. As of
December 31, 2018
, the Company had repurchased a total of
14,003,543
shares of its common stock under the 2011 Buyback for an aggregate of
$1.4 billion
, including commissions and fees. There were
no
repurchases under the 2017 Buyback.
Under the Buyback Programs, the Company is authorized to purchase shares from time to time through open market purchases, in privately negotiated transactions not to exceed market prices, and (with respect to such open market purchases) pursuant to plans adopted in accordance with Rule 10b5-1 under the Securities Exchange Act of 1934 in accordance with securities laws and other legal requirements, and subject to market conditions and other factors.
The Company expects to fund any further repurchases of its common stock through a combination of cash on hand, cash generated by operations and borrowings under its credit facilities. Purchases under the Buyback Programs are subject to the Company having available cash to fund repurchases.
Distributions
—During the years ended
December 31, 2018
,
2017
and
2016
, the Company declared the following cash distributions:
|
For the year ended December 31,
|
||||||||||||||||||||||||
|
2018
|
2017
|
2016
|
||||||||||||||||||||||
|
Distribution
per share |
Aggregate
Payment Amount (in millions) |
Distribution
per share |
Aggregate
Payment Amount (in millions) |
Distribution
per share |
Aggregate
Payment Amount (in millions) |
|||||||||||||||||||
|
Common Stock
|
$
|
3.15
|
|
$
|
1,389.8
|
|
$
|
2.62
|
|
$
|
1,122.5
|
|
$
|
2.17
|
|
$
|
923.7
|
|
||||||
|
Series A Preferred Stock (1)
|
$
|
—
|
|
$
|
—
|
|
$
|
2.63
|
|
$
|
15.8
|
|
$
|
5.25
|
|
$
|
31.5
|
|
||||||
|
Series B Preferred Stock
|
$
|
13.75
|
|
$
|
18.9
|
|
$
|
55.00
|
|
$
|
75.6
|
|
$
|
55.00
|
|
$
|
75.6
|
|
||||||
_______________
(1)
5.25%
Mandatory Convertible Preferred Stock, Series A, par value
$0.01
per share (the “Series A Preferred Stock”), which converted into shares of the Company’s common stock pursuant to the provisions of the Certificate of Designations governing the Series A Preferred Stock in 2017.
The following table characterizes the tax treatment of distributions declared per share of common stock and Mandatory Convertible Preferred Stock.
|
For the year ended December 31,
|
|||||||||||||||||||||
|
2018
|
2017
|
2016
|
|||||||||||||||||||
|
Per Share
|
%
|
Per Share
|
%
|
Per Share
|
%
|
||||||||||||||||
|
Common Stock
|
|||||||||||||||||||||
|
Ordinary dividend
|
$
|
3.1500
|
|
(1)
|
100.00
|
%
|
$
|
2.6200
|
|
100.00
|
%
|
$
|
2.1700
|
|
100.00
|
%
|
|||||
|
Capital gains distribution
|
—
|
|
—
|
|
—
|
|
—
|
|
—
|
|
—
|
|
|||||||||
|
Total
|
$
|
3.1500
|
|
100.00
|
%
|
$
|
2.6200
|
|
100.00
|
%
|
$
|
2.1700
|
|
100.00
|
%
|
||||||
|
Series A Preferred Stock
|
|||||||||||||||||||||
|
Ordinary dividend
|
$
|
—
|
|
—
|
%
|
$
|
3.3643
|
|
(2)
|
100.00
|
%
|
$
|
6.4578
|
|
(3)
|
100.00
|
%
|
||||
|
Capital gains distribution
|
—
|
|
—
|
|
—
|
|
—
|
|
—
|
|
—
|
|
|||||||||
|
Total
|
$
|
—
|
|
—
|
%
|
$
|
3.3643
|
|
100.00
|
%
|
$
|
6.4578
|
|
100.00
|
%
|
||||||
|
Series B Preferred Stock (4)
|
|||||||||||||||||||||
|
Ordinary dividend
|
$
|
2.1314
|
|
(5)
|
100.00
|
%
|
$
|
6.5233
|
|
(6)
|
100.00
|
%
|
$
|
5.5000
|
|
100.00
|
%
|
||||
|
Capital gains distribution
|
—
|
|
—
|
|
—
|
|
—
|
|
—
|
|
—
|
|
|||||||||
|
Total
|
$
|
2.1314
|
|
100.00
|
%
|
$
|
6.5233
|
|
100.00
|
%
|
$
|
5.5000
|
|
100.00
|
%
|
||||||
_______________
|
(1)
|
Includes dividend declared on December 4, 2018 of
$0.84
per share, which was paid on January 14, 2019 to common stockholders of record at the close of business on December 27, 2018.
|
F-44
AMERICAN TOWER CORPORATION AND SUBSIDIARIES
NOTES TO CONSOLIDATED FINANCIAL STATEMENTS
(Tabular amounts in millions, unless otherwise disclosed)
|
(2)
|
Includes a deemed distribution as a result of a conversion rate adjustment triggered on April 27, 2017.
|
|
(3)
|
Includes a deemed distribution as a result of a conversion rate adjustment triggered on June 17, 2016.
|
|
(4)
|
Represents the tax treatment on dividends per depositary share, each of which represents a 1/10th interest in a share of Series B Preferred Stock.
|
|
(5)
|
Includes a deemed distribution as a result of a conversion rate adjustment triggered on January 18, 2018.
|
|
(6)
|
Includes a deemed distribution as a result of a conversion rate adjustment triggered on April 12, 2017.
|
The Company accrues distributions on unvested restricted stock units, which are payable upon vesting. The amount accrued for distributions payable related to unvested restricted stock units was
$13.7 million
and
$10.1 million
as of December 31,
2018
and 2017, respectively. During the year ended December 31,
2018
, the Company paid
$4.3 million
of distributions payable upon the vesting of restricted stock units. To maintain its qualification for taxation as a REIT, the Company expects to continue paying distributions, the amount, timing and frequency of which will be determined and subject to adjustment by the Company’s Board of Directors.
16. OTHER OPERATING EXPENSE
Other operating expense consists primarily of impairment charges, net losses on sales or disposals of assets and other operating expense items. The Company records impairment charges to write down certain assets to their net realizable value after an indicator of impairment is identified and subsequent analysis determines that the asset is either partially recoverable or not recoverable. These assets consisted primarily of towers, which are typically assessed on an individual basis, network location intangibles, which relate directly to towers, and tenant-related intangibles, which are assessed on a tenant basis. For the years ended December 31, 2018, 2017 and 2016, impairment charges included amounts related to land easements. Net losses on sales or disposals of assets primarily relate to certain non-core towers, other assets and miscellaneous items. Other operating expenses includes acquisition-related costs and integration costs.
Other operating expenses included the following for the years ended December 31,:
|
|
2018
|
2017
|
2016
|
||||||||
|
Impairment charges
|
$
|
394.0
|
|
$
|
211.4
|
|
$
|
28.5
|
|
||
|
Net losses on sales or disposals of assets
|
85.6
|
|
32.8
|
|
25.1
|
|
|||||
|
Other operating expenses (1)
|
33.7
|
|
11.8
|
|
19.7
|
|
|||||
|
Total Other operating expenses
|
$
|
513.3
|
|
|
$
|
256.0
|
|
|
$
|
73.3
|
|
_______________
|
(1)
|
For the year ended December 31, 2017, the amount also includes refunds of acquisition costs and a charitable contribution.
|
Impairment charges included the following for the years ended December 31,:
|
|
2018
|
2017
|
2016
|
||||||||
|
Tower and network location intangible assets
|
$
|
284.9
|
|
$
|
108.7
|
|
$
|
18.0
|
|
||
|
Tenant relationships
|
107.3
|
|
100.1
|
|
—
|
|
|||||
|
Other
|
1.8
|
|
2.6
|
|
10.5
|
|
|||||
|
Total impairment charges
|
$
|
394.0
|
|
$
|
211.4
|
|
$
|
28.5
|
|
||
On February 28, 2018, one of the Company’s tenants in Asia, Aircel Ltd.’s (“Aircel”), filed for bankruptcy protection with the National Company Law Tribunal of India. The bankruptcy process is ongoing and the ultimate outcome has yet to be determined. The Company performed an impairment test based on current expectations of the impact of the bankruptcy on projected cash flows for assets related to Aircel. These assets primarily consisted of towers, network location intangibles and tenant-related intangibles. As a result, an impairment of
$40.1 million
was recorded on the tower and network location intangible assets. The Company also fully impaired the tenant relationship for Aircel, which resulted in an impairment of
$107.3 million
during the year ended December 31, 2018.
In October 2017, one of the Company’s tenants in Asia, Tata Teleservices, informed the Department of Telecommunications in India of its intent to exit the wireless telecommunications business and announced plans to transfer its business to another telecommunications provider. In October 2018, the Company entered into agreements with Tata for a settlement and release of certain contractual lease obligations of Tata. The Company performed an impairment test based on current expectations of the impact of the settlement on projected cash flows for assets related to Tata. These assets consisted primarily of towers, network
F-45
AMERICAN TOWER CORPORATION AND SUBSIDIARIES
NOTES TO CONSOLIDATED FINANCIAL STATEMENTS
(Tabular amounts in millions, unless otherwise disclosed)
location intangibles and tenant-related intangibles. As a result, an impairment of
$164.2 million
was recorded on the tower and network location intangible assets.
During the year ended December 31, 2018, the Company recorded an additional
$54.0 million
of impairments on tower and network location intangible assets related to other carrier consolidation-driven churn in India. During the year ended December 31, 2017,
$81.0 million
of impairment charges on tower and network location intangible assets and all impairment charges on tenant relationships related to carrier consolidation-driven churn in India.
17. EARNINGS PER COMMON SHARE
The following table sets forth basic and diluted net income per common share computational data for the years ended December 31, (shares in thousands, except per share data):
|
2018
|
2017
|
2016
|
|||||||||
|
Net income attributable to American Tower Corporation stockholders
|
$
|
1,236.4
|
|
$
|
1,238.9
|
|
$
|
956.4
|
|
||
|
Dividends on preferred stock
|
(9.4
|
)
|
(87.4
|
)
|
(107.1
|
)
|
|||||
|
Net income attributable to American Tower Corporation common stockholders
|
1,227.0
|
|
1,151.5
|
|
849.3
|
|
|||||
|
Basic weighted average common shares outstanding
|
439,606
|
|
428,181
|
|
425,143
|
|
|||||
|
Dilutive securities
|
3,354
|
|
3,507
|
|
4,140
|
|
|||||
|
Diluted weighted average common shares outstanding
|
442,960
|
|
431,688
|
|
429,283
|
|
|||||
|
Basic net income attributable to American Tower Corporation common stockholders per common share
|
$
|
2.79
|
|
$
|
2.69
|
|
$
|
2.00
|
|
||
|
Diluted net income attributable to American Tower Corporation common stockholders per common share
|
$
|
2.77
|
|
$
|
2.67
|
|
$
|
1.98
|
|
||
Shares Excluded From Dilutive Effect
The following shares were not included in the computation of diluted earnings per share because the effect would be anti-dilutive for the years ended December 31, (in thousands, on a weighted average basis):
|
|
2018
|
2017
|
2016
|
|||||
|
Restricted stock awards
|
—
|
|
3
|
|
6
|
|
||
|
Stock options
|
—
|
|
4
|
|
817
|
|
||
|
Preferred stock
|
1,456
|
|
14,040
|
|
17,509
|
|
||
18. COMMITMENTS AND CONTINGENCIES
Litigation
—The Company periodically becomes involved in various claims, lawsuits and proceedings that are incidental to its business. In the opinion of Company management, after consultation with counsel, there are no matters currently pending that would, in the event of an adverse outcome, materially impact the Company’s consolidated financial position, results of operations or liquidity.
Verizon Transaction
—In March 2015, the Company entered into an agreement with various operating entities of Verizon Communications Inc. (“Verizon”) that currently provides for the lease, sublease or management of approximately
11,250
wireless communications sites commencing March 27, 2015. The average term of the lease or sublease for all sites at the inception of the agreement was approximately
28 years
, assuming renewals or extensions of the underlying ground leases for the sites. The Company has the option to purchase the leased sites in tranches, subject to the applicable lease, sublease or management rights upon its scheduled expiration. Each tower is assigned to an annual tranche, ranging from 2034 to 2047, which represents the outside expiration date for the sublease rights to the towers in that tranche. The purchase price for each tranche is a fixed amount stated in the lease for such tranche plus the fair market value of certain alterations made to the related towers. The aggregate purchase option price for the towers leased and subleased is approximately
$5.0 billion
. Verizon will occupy the sites as a tenant for an initial term of
ten years
with
eight
optional successive
five
-year terms; each such term shall be governed by standard master lease agreement terms established as a part of the transaction.
AT&T Transaction
—The Company has an agreement with SBC Communications Inc., a predecessor entity to AT&T Inc. (“AT&T”), that currently provides for the lease or sublease of approximately
2,280
towers commencing between December 2000 and August 2004. Substantially all of the towers are part of the Trust Securitizations. The average term of the lease or sublease for all sites at the inception of the agreement was approximately
27 years
, assuming renewals or extensions of the underlying ground leases for the sites. The Company has the option to purchase the sites subject to the applicable lease or sublease upon its expiration. Each tower is assigned to an annual tranche, ranging from 2013 to 2032, which represents the outside expiration date for the sublease rights to that tower. The purchase price for each site is a fixed amount stated in the lease for that site plus the fair market value of certain alterations made to the related tower by AT&T. As of
December 31, 2018
, the Company has purchased an aggregate of
149
of the subleased towers upon expiration of the applicable agreement, including
61
F-46
AMERICAN TOWER CORPORATION AND SUBSIDIARIES
NOTES TO CONSOLIDATED FINANCIAL STATEMENTS
(Tabular amounts in millions, unless otherwise disclosed)
towers purchased during the year ended December 31, 2018 for an aggregate purchase price of
$22.2 million
. The aggregate purchase option price for the remaining towers leased and subleased is
$891.5 million
and will accrete at a rate of
10%
per annum through the applicable expiration of the lease or sublease of a site. For all such sites, AT&T has the right to continue to lease the reserved space through June 30, 2020 at the then-current monthly fee, which shall escalate in accordance with the standard master lease agreement for the remainder of AT&T’s tenancy. Thereafter, AT&T shall have the right to renew such lease for up to
four
successive
five
-year terms.
ALLTEL Transaction
—In December 2000, the Company entered into an agreement with ALLTEL Communications, LLC, a predecessor entity to Verizon Wireless, to acquire towers through a
15
-year sublease agreement. Pursuant to the agreement, as amended, with Verizon Wireless, the Company acquired rights to approximately
1,800
towers in tranches between April 2001 and March 2002. The Company has the option to purchase each tower at the expiration of the applicable sublease. During the year ended December 31, 2016, the Company exercised the purchase options for
1,523
towers and provided notice to the tower owner, Verizon’s assignee, of its intent to exercise the purchase options related to the
243
remaining towers. As of
December 31, 2018
, the purchase price per tower was
$42,844
payable in cash or, at the tower owner’s option, with
769
shares of the Company’s common stock per tower. The aggregate cash purchase option price for the subleased towers was
$10.4 million
as of
December 31, 2018
.
Other Contingencies
—The Company is subject to income tax and other taxes in the geographic areas where it operates, and periodically receives notifications of audits, assessments or other actions by taxing authorities. Taxing authorities may issue preliminary notices or assessments while audits are being conducted. In certain jurisdictions, taxing authorities may issue assessments with minimal examination. These notices and assessments do not represent amounts that the Company is obligated to pay and are often not reflective of the actual tax liability for which the Company will ultimately be liable. The Company evaluates the circumstances of each notification or assessment based on the information available and records a liability for any potential outcome that is probable or more likely than not unfavorable if the liability is also reasonably estimable.
On December 5, 2016, the Company received an income tax assessment of Essar Telecom Infrastructure Private Limited (“ETIPL”) from the India Income Tax Department (the “Tax Department”) for the fiscal year ending 2008 in the amount of
4.75 billion
INR (
$69.8 million
on the date of assessment) related to capital contributions. The Company challenged the assessment before the Office of Commissioner of Income Tax - Appeals, which ruled in the Company’s favor in January 2018. However, the Tax Department has appealed this ruling at a higher appellate authority. The Company estimates that there is a more likely than not probability that the Company’s position will be sustained upon appeal. Accordingly, no liability has been recorded. Additionally, the assessment was made with respect to transactions that took place in the tax year commencing in 2007, prior to the Company’s acquisition of ETIPL. Under the Company’s definitive acquisition agreement of ETIPL, the seller is obligated to indemnify and defend the Company with respect to any tax-related liability that may arise from activities prior to March 31, 2010.
Lease Obligations
—The Company leases certain land, office and tower space under operating leases that expire over various terms. Many of the leases contain renewal options with specified increases in lease payments upon exercise of the renewal option. Escalation clauses present in operating leases, excluding those tied to a consumer price index or other inflation-based indices, are recognized on a straight-line basis over the non-cancellable term of the applicable leases.
Future minimum rental payments under non-cancellable operating leases include payments for certain renewal periods at the Company’s option because failure to renew could result in a loss of the applicable communications sites and related revenues from tenant leases, thereby making it reasonably assured that the Company will renew the leases. Such payments at
December 31, 2018
are as follows:
|
Year Ending December 31,
|
|||
|
2019
|
$
|
926.0
|
|
|
2020
|
904.2
|
|
|
|
2021
|
879.8
|
|
|
|
2022
|
834.2
|
|
|
|
2023
|
792.6
|
|
|
|
Thereafter
|
6,173.1
|
|
|
|
Total
|
$
|
10,509.9
|
|
F-47
AMERICAN TOWER CORPORATION AND SUBSIDIARIES
NOTES TO CONSOLIDATED FINANCIAL STATEMENTS
(Tabular amounts in millions, unless otherwise disclosed)
Aggregate rent expense (including the effect of straight-line rent expense) under operating leases for the years ended
December 31, 2018
,
2017
and
2016
approximated
$1,128.0 million
,
$1,088.0 million
and
$986.2 million
, respectively.
Future minimum payments under capital leases in effect at
December 31, 2018
were as follows:
|
Year Ending December 31,
|
|||
|
2019
|
$
|
40.7
|
|
|
2020
|
32.7
|
|
|
|
2021
|
27.8
|
|
|
|
2022
|
23.7
|
|
|
|
2023
|
19.2
|
|
|
|
Thereafter
|
117.5
|
|
|
|
Total minimum lease payments
|
261.6
|
|
|
|
Less amounts representing interest
|
(82.1
|
)
|
|
|
Present value of capital lease obligations
|
$
|
179.5
|
|
Tenant Leases
—The Company’s lease agreements with its tenants vary depending upon the region and the industry of the tenant, and generally have initial terms of
ten years
with multiple renewal terms at the option of the tenant.
Historically, the Company has been able to successfully renew its ground leases as needed to ensure its tower revenue. Accordingly, the Company assumes that it will have access to the land underneath its tower sites when calculating future minimum rental receipts. Future minimum rental receipts expected from tenants under non-cancellable operating lease agreements in effect at
December 31, 2018
were as follows:
|
Year Ending December 31,
|
|||
|
2019
|
$
|
5,251.2
|
|
|
2020
|
5,062.2
|
|
|
|
2021
|
4,676.1
|
|
|
|
2022
|
3,754.6
|
|
|
|
2023
|
3,457.3
|
|
|
|
Thereafter
|
12,641.1
|
|
|
|
Total
|
$
|
34,842.5
|
|
Guaranties and Indemnifications
—The Company enters into agreements from time to time in the ordinary course of business pursuant to which it agrees to guarantee or indemnify third parties for certain claims. The Company has also entered into purchase and sale agreements relating to the sale or acquisition of assets containing customary indemnification provisions. The Company’s indemnification obligations under these agreements generally are limited solely to damages resulting from breaches of representations and warranties or covenants under the applicable agreements. In addition, payments under such indemnification clauses are generally conditioned on the other party making a claim that is subject to whatever defenses the Company may have and are governed by dispute resolution procedures specified in the particular agreement. Further, the Company’s obligations under these agreements may be limited in duration and amount, and in some instances, the Company may have recourse against third parties for payments made by the Company. The Company has not historically made any material payments under these agreements and, as of
December 31, 2018
, is not aware of any agreements that could result in a material payment.
F-48
AMERICAN TOWER CORPORATION AND SUBSIDIARIES
NOTES TO CONSOLIDATED FINANCIAL STATEMENTS
(Tabular amounts in millions, unless otherwise disclosed)
19. SUPPLEMENTAL CASH FLOW INFORMATION
Supplemental cash flow information and non-cash investing and financing activities are as follows for the years ended December 31,:
|
2018
|
2017
|
2016
|
|||||||||
|
Supplemental cash flow information:
|
|||||||||||
|
Cash paid for interest
|
$
|
789.7
|
|
$
|
712.1
|
|
$
|
645.1
|
|
||
|
Cash paid for income taxes (net of refunds of $25.0, $20.7 and $19.6, respectively)
|
163.9
|
|
136.5
|
|
96.2
|
|
|||||
|
Non-cash investing and financing activities:
|
|||||||||||
|
Increase (decrease) in accounts payable and accrued expenses for purchases of property and equipment and construction activities
|
8.3
|
|
34.0
|
|
(19.0
|
)
|
|||||
|
Purchases of property and equipment under capital leases
|
57.8
|
|
54.8
|
|
55.6
|
|
|||||
|
Fair value of debt assumed through acquisitions
|
—
|
|
—
|
|
786.9
|
|
|||||
|
Exercise of purchase option for property and equipment for common shares issued
|
—
|
|
—
|
|
120.8
|
|
|||||
|
Acquisition of Commercialization Rights
|
24.8
|
|
—
|
|
—
|
|
|||||
|
Conversion of third-party debt to equity
|
—
|
|
48.2
|
|
—
|
|
|||||
|
Debt financed acquisition of communication sites
|
54.2
|
|
|
—
|
|
—
|
|
||||
20. BUSINESS SEGMENTS
The Company’s primary business is leasing space on multitenant communications sites to wireless service providers, radio and television broadcast companies, wireless data providers, government agencies and municipalities and tenants in a number of other industries. This business is referred to as the Company’s property operations, which as of December 31, 2018, consisted of the following:
|
•
|
U.S.: property operations in the United States;
|
|
•
|
Asia: property operations in India;
|
|
•
|
Europe, Middle East and Africa (“EMEA”): property operations in France, Germany, Ghana, Kenya, Nigeria, South Africa and Uganda; and
|
|
•
|
Latin America: property operations in Argentina, Brazil, Chile, Colombia, Costa Rica, Mexico, Paraguay and Peru.
|
The Company’s services segment offers tower-related services in the United States, including AZP and structural analysis, which primarily support its site leasing business, including the addition of new tenants and equipment on its sites. The services segment is a strategic business unit that offers different services from, and requires different resources, skill sets and marketing strategies than, the property operating segments.
The accounting policies applied in compiling segment information below are similar to those described in note 1. Among other factors, in evaluating financial performance in each business segment, management uses segment gross margin and segment operating profit. The Company defines segment gross margin as segment revenue less segment operating expenses excluding stock-based compensation expense recorded in costs of operations; Depreciation, amortization and accretion; Selling, general, administrative and development expense; and Other operating expenses. The Company defines segment operating profit as segment gross margin less Selling, general, administrative and development expense attributable to the segment, excluding stock-based compensation expense and corporate expenses. For reporting purposes, for periods through September 30, 2018, the Latin America property segment gross margin and segment operating profit also include Interest income (expense), TV Azteca, net. These measures of segment gross margin and segment operating profit are also before Interest income, Interest expense, Gain (loss) on retirement of long-term obligations, Other income (expense), Net income (loss) attributable to noncontrolling interests and Income tax benefit (provision). The categories of expenses indicated above, such as depreciation, have been excluded from segment operating performance as they are not considered in the review of information or the evaluation of results by management. There are no significant revenues resulting from transactions between the Company’s operating segments. All intercompany transactions are eliminated to reconcile segment results and assets to the consolidated statements of operations and consolidated balance sheets.
F-49
AMERICAN TOWER CORPORATION AND SUBSIDIARIES
NOTES TO CONSOLIDATED FINANCIAL STATEMENTS
(Tabular amounts in millions, unless otherwise disclosed)
Summarized financial information concerning the Company’s reportable segments for the years ended December 31,
2018
,
2017
and
2016
is shown in the following tables. The “Other” column (i) represents amounts excluded from specific segments, such as business development operations, stock-based compensation expense and corporate expenses included in Selling, general, administrative and development expense; Other operating expenses; Interest income; Interest expense; Gain (loss) on retirement of long-term obligations; and Other income (expense), and (ii) reconciles segment operating profit to Income from continuing operations before income taxes.
|
|
Property
|
Total
Property
|
Services
|
Other
|
Total
|
|||||||||||||||||||||||||||
|
Year ended December 31, 2018
|
U.S.
|
Asia
|
EMEA
|
Latin America
|
||||||||||||||||||||||||||||
|
Segment revenues (1)
|
$
|
3,822.1
|
|
$
|
1,540.5
|
|
$
|
687.3
|
|
$
|
1,264.8
|
|
$
|
7,314.7
|
|
$
|
125.4
|
|
$
|
7,440.1
|
|
|||||||||||
|
Segment operating expenses (2)
|
771.0
|
|
710.9
|
|
238.1
|
|
406.3
|
|
2,126.3
|
|
48.2
|
|
2,174.5
|
|
||||||||||||||||||
|
Interest expense, TV Azteca, net
|
—
|
|
—
|
|
—
|
|
(0.1
|
)
|
(0.1
|
)
|
—
|
|
(0.1
|
)
|
||||||||||||||||||
|
Segment gross margin
|
3,051.1
|
|
829.6
|
|
449.2
|
|
858.4
|
|
5,188.3
|
|
77.2
|
|
5,265.5
|
|
||||||||||||||||||
|
Segment selling, general, administrative and development expense (2)
|
165.2
|
|
110.7
|
|
69.1
|
|
83.5
|
|
428.5
|
|
14.4
|
|
442.9
|
|
||||||||||||||||||
|
Segment operating profit
|
$
|
2,885.9
|
|
$
|
718.9
|
|
$
|
380.1
|
|
$
|
774.9
|
|
$
|
4,759.8
|
|
$
|
62.8
|
|
$
|
4,822.6
|
|
|||||||||||
|
Stock-based compensation expense
|
$
|
137.5
|
|
137.5
|
|
|||||||||||||||||||||||||||
|
Other selling, general, administrative and development expense
|
156.1
|
|
156.1
|
|
||||||||||||||||||||||||||||
|
Depreciation, amortization and accretion
|
2,110.8
|
|
2,110.8
|
|
||||||||||||||||||||||||||||
|
Other expense (3)
|
1,263.6
|
|
1,263.6
|
|
||||||||||||||||||||||||||||
|
Income from continuing operations before income taxes
|
$
|
1,154.6
|
|
|||||||||||||||||||||||||||||
|
Capital expenditures (4)
|
$
|
376.9
|
|
$
|
101.0
|
|
$
|
232.7
|
|
$
|
220.7
|
|
$
|
931.3
|
|
$
|
—
|
|
$
|
13.9
|
|
$
|
945.2
|
|
||||||||
_______________
|
(1)
|
Asia segment revenues include a net impact of
$333.7 million
as a result of the settlement payment received from Tata in the fourth quarter of 2018.
|
|
(2)
|
Segment operating expenses and segment selling, general, administrative and development expenses exclude stock-based compensation expense of
$3.3 million
and
$134.2 million
, respectively.
|
|
(3)
|
Primarily includes interest expense and
$394.0 million
in impairment charges.
|
|
(4)
|
Includes
$32.0 million
of capital lease payments included in Repayments of notes payable, credit facilities, term loan, senior notes, secured debt and capital leases in the cash flow from financing activities in the Company’s consolidated statement of cash flows.
|
F-50
AMERICAN TOWER CORPORATION AND SUBSIDIARIES
NOTES TO CONSOLIDATED FINANCIAL STATEMENTS
(Tabular amounts in millions, unless otherwise disclosed)
|
|
Property
|
Total
Property
|
Services
|
Other
|
Total
|
|||||||||||||||||||||||||||
|
Year ended December 31, 2017
|
U.S.
|
Asia
|
EMEA
|
Latin America
|
||||||||||||||||||||||||||||
|
Segment revenues
|
$
|
3,605.7
|
|
$
|
1,164.4
|
|
$
|
626.2
|
|
$
|
1,169.6
|
|
$
|
6,565.9
|
|
$
|
98.0
|
|
$
|
6,663.9
|
|
|||||||||||
|
Segment operating expenses (1)
|
746.5
|
|
649.0
|
|
238.3
|
|
386.1
|
|
2,019.9
|
|
33.8
|
|
2,053.7
|
|
||||||||||||||||||
|
Interest income, TV Azteca, net
|
—
|
|
—
|
|
—
|
|
10.8
|
|
10.8
|
|
—
|
|
10.8
|
|
||||||||||||||||||
|
Segment gross margin
|
2,859.2
|
|
515.4
|
|
387.9
|
|
794.3
|
|
4,556.8
|
|
64.2
|
|
4,621.0
|
|
||||||||||||||||||
|
Segment selling, general, administrative and development expense (1)
|
151.4
|
|
82.4
|
|
67.9
|
|
77.5
|
|
379.2
|
|
13.7
|
|
392.9
|
|
||||||||||||||||||
|
Segment operating profit
|
$
|
2,707.8
|
|
$
|
433.0
|
|
$
|
320.0
|
|
$
|
716.8
|
|
$
|
4,177.6
|
|
$
|
50.5
|
|
$
|
4,228.1
|
|
|||||||||||
|
Stock-based compensation expense
|
$
|
108.5
|
|
108.5
|
|
|||||||||||||||||||||||||||
|
Other selling, general, administrative and development expense
|
138.5
|
|
138.5
|
|
||||||||||||||||||||||||||||
|
Depreciation, amortization and accretion
|
1,715.9
|
|
1,715.9
|
|
||||||||||||||||||||||||||||
|
Other expense (2)
|
1,009.1
|
|
1,009.1
|
|
||||||||||||||||||||||||||||
|
Income from continuing operations before income taxes
|
$
|
1,256.1
|
|
|||||||||||||||||||||||||||||
|
Capital expenditures (3)
|
$
|
360.6
|
|
$
|
118.0
|
|
$
|
141.7
|
|
$
|
197.4
|
|
$
|
817.7
|
|
$
|
—
|
|
$
|
17.7
|
|
$
|
835.4
|
|
||||||||
_______________
|
(1)
|
Segment operating expenses and segment selling, general, administrative and development expenses exclude stock-based compensation expense of
$2.9 million
and
$105.6 million
, respectively.
|
|
(2)
|
Primarily includes interest expense.
|
|
(3)
|
Includes
$31.8 million
of capital lease payments included in Repayments of notes payable, credit facilities, term loan, senior notes, secured debt and capital leases in the cash flow from financing activities in the Company’s consolidated statement of cash flows.
|
|
|
Property
|
Total
Property
|
Services |
Other
|
Total
|
|||||||||||||||||||||||||||
|
Year ended December 31, 2016
|
U.S.
|
Asia
|
EMEA
|
Latin America
|
||||||||||||||||||||||||||||
|
Segment revenues
|
$
|
3,370.1
|
|
$
|
827.6
|
|
$
|
529.5
|
|
$
|
985.9
|
|
$
|
5,713.1
|
|
$
|
72.6
|
|
$
|
5,785.7
|
|
|||||||||||
|
Segment operating expenses (1)
|
733.4
|
|
465.9
|
|
223.7
|
|
338.0
|
|
1,761.0
|
|
27.0
|
|
1,788.0
|
|
||||||||||||||||||
|
Interest income, TV Azteca, net
|
—
|
|
—
|
|
—
|
|
10.9
|
|
10.9
|
|
—
|
|
10.9
|
|
||||||||||||||||||
|
Segment gross margin
|
2,636.7
|
|
361.7
|
|
305.8
|
|
658.8
|
|
3,963.0
|
|
45.6
|
|
4,008.6
|
|
||||||||||||||||||
|
Segment selling, general, administrative and development expense (1)
|
147.6
|
|
48.2
|
|
60.9
|
|
60.7
|
|
317.4
|
|
12.5
|
|
329.9
|
|
||||||||||||||||||
|
Segment operating profit
|
$
|
2,489.1
|
|
$
|
313.5
|
|
$
|
244.9
|
|
$
|
598.1
|
|
$
|
3,645.6
|
|
$
|
33.1
|
|
$
|
3,678.7
|
|
|||||||||||
|
Stock-based compensation expense
|
$
|
89.9
|
|
89.9
|
|
|||||||||||||||||||||||||||
|
Other selling, general, administrative and development expense
|
126.0
|
|
126.0
|
|
||||||||||||||||||||||||||||
|
Depreciation, amortization and accretion
|
1,525.6
|
|
1,525.6
|
|
||||||||||||||||||||||||||||
|
Other expense (2)
|
811.3
|
|
811.3
|
|
||||||||||||||||||||||||||||
|
Income from continuing operations before income taxes
|
$
|
1,125.9
|
|
|||||||||||||||||||||||||||||
|
Capital expenditures (3)
|
$
|
310.7
|
|
$
|
115.5
|
|
$
|
86.1
|
|
$
|
172.6
|
|
$
|
684.9
|
|
$
|
—
|
|
$
|
16.5
|
|
$
|
701.4
|
|
||||||||
_______________
|
(1)
|
Segment operating expenses and segment selling, general, administrative and development expenses exclude stock-based compensation expense of
$2.4 million
and
$87.5 million
, respectively.
|
|
(2)
|
Primarily includes interest expense.
|
|
(3)
|
Includes
$18.9 million
of capital lease payments included in Repayments of notes payable, credit facilities, term loan, senior notes, secured debt and capital leases in the cash flow from financing activities in the Company’s consolidated statement of cash flows.
|
F-51
AMERICAN TOWER CORPORATION AND SUBSIDIARIES
NOTES TO CONSOLIDATED FINANCIAL STATEMENTS
(Tabular amounts in millions, unless otherwise disclosed)
Additional information relating to the total assets of the Company’s operating segments is as follows for the years ended December 31,:
|
|
2018
|
2017
|
2016
|
||||||||
|
U.S. property
|
$
|
18,782.0
|
|
$
|
19,032.6
|
|
$
|
18,846.9
|
|
||
|
Asia property (1)
|
4,938.8
|
|
4,770.8
|
|
4,535.3
|
|
|||||
|
EMEA property (1)
|
3,367.8
|
|
3,213.6
|
|
2,062.4
|
|
|||||
|
Latin America property (1)
|
5,594.7
|
|
5,868.4
|
|
4,938.1
|
|
|||||
|
Services
|
46.3
|
|
42.3
|
|
48.3
|
|
|||||
|
Other (2)
|
280.8
|
|
286.6
|
|
448.2
|
|
|||||
|
Total assets
|
$
|
33,010.4
|
|
$
|
33,214.3
|
|
$
|
30,879.2
|
|
||
_______________
|
(1)
|
Balances are translated at the applicable period end exchange rate, which may impact comparability between periods.
|
|
(2)
|
Balances include corporate assets such as cash and cash equivalents, certain tangible and intangible assets and income tax accounts that have not been allocated to specific segments.
|
Summarized geographic information related to the Company’s operating revenues for the years ended December 31,
2018
,
2017
and
2016
and long-lived assets as of December 31,
2018
and
2017
is as follows:
|
|
2018
|
2017
|
2016
|
||||||||
|
Operating Revenues:
|
|||||||||||
|
United States
|
$
|
3,947.5
|
|
$
|
3,703.7
|
|
$
|
3,442.7
|
|
||
|
Asia (1):
|
|||||||||||
|
India
|
1,540.5
|
|
1,164.4
|
|
827.6
|
|
|||||
|
EMEA (1):
|
|||||||||||
|
France
|
72.7
|
|
59.5
|
|
—
|
|
|||||
|
Germany
|
69.1
|
|
63.1
|
|
60.2
|
|
|||||
|
Ghana
|
125.4
|
|
122.9
|
|
116.2
|
|
|||||
|
Kenya
|
7.0
|
|
—
|
|
—
|
|
|||||
|
Nigeria
|
220.7
|
|
213.9
|
|
215.4
|
|
|||||
|
South Africa
|
125.3
|
|
106.5
|
|
80.0
|
|
|||||
|
Uganda
|
67.1
|
|
60.3
|
|
57.7
|
|
|||||
|
Latin America (1):
|
|||||||||||
|
Argentina
|
16.0
|
|
15.9
|
|
1.0
|
|
|||||
|
Brazil
|
595.5
|
|
620.1
|
|
506.2
|
|
|||||
|
Chile
|
44.2
|
|
40.4
|
|
33.8
|
|
|||||
|
Colombia
|
103.8
|
|
89.3
|
|
79.7
|
|
|||||
|
Costa Rica
|
18.4
|
|
19.4
|
|
19.0
|
|
|||||
|
Mexico
|
456.5
|
|
364.3
|
|
331.2
|
|
|||||
|
Paraguay
|
10.4
|
|
2.7
|
|
—
|
|
|||||
|
Peru
|
20.0
|
|
17.5
|
|
15.0
|
|
|||||
|
Total International
|
3,492.6
|
|
2,960.2
|
|
2,343.0
|
|
|||||
|
Total operating revenues
|
$
|
7,440.1
|
|
$
|
6,663.9
|
|
$
|
5,785.7
|
|
||
_______________
|
(1)
|
Balances are translated at the applicable exchange rate, which may impact comparability between periods.
|
F-52
AMERICAN TOWER CORPORATION AND SUBSIDIARIES
NOTES TO CONSOLIDATED FINANCIAL STATEMENTS
(Tabular amounts in millions, unless otherwise disclosed)
|
|
2018
|
2017
|
|||||
|
Long-Lived Assets (1):
|
|||||||
|
United States
|
$
|
16,543.7
|
|
$
|
16,930.2
|
|
|
|
Asia (2):
|
|||||||
|
India
|
3,947.8
|
|
4,052.6
|
|
|||
|
EMEA (2):
|
|||||||
|
France
|
963.8
|
|
1,009.6
|
|
|||
|
Germany
|
388.5
|
|
428.0
|
|
|||
|
Ghana
|
159.2
|
|
171.4
|
|
|||
|
Kenya
|
190.0
|
|
—
|
|
|||
|
Nigeria
|
606.5
|
|
587.2
|
|
|||
|
South Africa
|
342.5
|
|
330.4
|
|
|||
|
Uganda
|
138.7
|
|
136.9
|
|
|||
|
Latin America (2):
|
|||||||
|
Argentina
|
81.6
|
|
117.9
|
|
|||
|
Brazil
|
2,288.1
|
|
2,557.4
|
|
|||
|
Chile
|
129.7
|
|
151.2
|
|
|||
|
Colombia
|
381.6
|
|
369.0
|
|
|||
|
Costa Rica
|
119.1
|
|
112.9
|
|
|||
|
Mexico
|
1,421.3
|
|
1,396.8
|
|
|||
|
Paraguay
|
107.4
|
|
77.5
|
|
|||
|
Peru
|
113.8
|
|
93.7
|
|
|||
|
Total International
|
11,379.6
|
|
11,592.5
|
|
|||
|
Total long-lived assets
|
$
|
27,923.3
|
|
$
|
28,522.7
|
|
|
_______________
|
(1)
|
Includes Property and equipment, net, Goodwill and Other intangible assets, net.
|
|
(2)
|
Balances are translated at the applicable period end exchange rate, which may impact comparability between periods.
|
The following tenants within the property and services segments individually accounted for
10%
or more of the Company’s consolidated operating revenues for the years ended December 31,:
|
2018
|
2017
|
2016
|
||||||
|
AT&T
|
19
|
%
|
19
|
%
|
21
|
%
|
||
|
Verizon Wireless
|
15
|
%
|
16
|
%
|
15
|
%
|
||
|
Sprint
|
8
|
%
|
9
|
%
|
11
|
%
|
||
21. RELATED PARTY TRANSACTIONS
During the years ended December 31,
2018
,
2017
and
2016
, the Company had no significant related party transactions.
F-53
AMERICAN TOWER CORPORATION AND SUBSIDIARIES
NOTES TO CONSOLIDATED FINANCIAL STATEMENTS
(Tabular amounts in millions, unless otherwise disclosed)
22. SELECTED QUARTERLY FINANCIAL DATA (UNAUDITED)
Selected quarterly financial data for the years ended
December 31, 2018
and
2017
is as follows (in millions, except per share data):
|
|
Three Months Ended
|
Year Ended
December 31,
|
|||||||||||||||||
|
|
March 31,
|
June 30,
|
September 30,
|
December 31,
|
|||||||||||||||
|
2018:
|
|||||||||||||||||||
|
Operating revenues
|
$
|
1,741.8
|
|
$
|
1,780.9
|
|
$
|
1,785.5
|
|
$
|
2,131.9
|
|
$
|
7,440.1
|
|
||||
|
Costs of operations (1)
|
519.9
|
|
560.3
|
|
556.7
|
|
540.9
|
|
2,177.8
|
|
|||||||||
|
Operating income
|
402.9
|
|
546.0
|
|
567.2
|
|
388.9
|
|
1,905.0
|
|
|||||||||
|
Net income
|
280.3
|
|
314.4
|
|
377.3
|
|
292.7
|
|
1,264.7
|
|
|||||||||
|
Net income attributable to American Tower Corporation stockholders
|
285.2
|
|
306.7
|
|
366.9
|
|
277.6
|
|
1,236.4
|
|
|||||||||
|
Dividends on preferred stock
|
(9.4
|
)
|
—
|
|
—
|
|
—
|
|
(9.4
|
)
|
|||||||||
|
Net income attributable to American Tower Corporation common stockholders
|
275.8
|
|
306.7
|
|
366.9
|
|
277.6
|
|
1,227.0
|
|
|||||||||
|
Basic net income per share attributable to American Tower Corporation common stockholders
|
0.63
|
|
0.69
|
|
0.83
|
|
0.63
|
|
2.79
|
|
|||||||||
|
Diluted net income per share attributable to American Tower Corporation common stockholders
|
0.63
|
|
0.69
|
|
0.83
|
|
0.62
|
|
2.77
|
|
|||||||||
|
|
Three Months Ended
|
Year Ended
December 31,
|
|||||||||||||||||
|
|
March 31,
|
June 30,
|
September 30,
|
December 31,
|
|||||||||||||||
|
2017:
|
|||||||||||||||||||
|
Operating revenues
|
$
|
1,616.2
|
|
$
|
1,662.5
|
|
$
|
1,680.7
|
|
$
|
1,704.5
|
|
$
|
6,663.9
|
|
||||
|
Costs of operations (1)
|
492.7
|
|
517.2
|
|
519.8
|
|
526.9
|
|
2,056.6
|
|
|||||||||
|
Operating income
|
531.4
|
|
576.9
|
|
561.1
|
|
329.0
|
|
1,998.4
|
|
|||||||||
|
Net income
|
307.4
|
|
388.5
|
|
334.7
|
|
194.8
|
|
1,225.4
|
|
|||||||||
|
Net income attributable to American Tower Corporation stockholders
|
316.1
|
|
367.0
|
|
317.3
|
|
238.5
|
|
1,238.9
|
|
|||||||||
|
Dividends on preferred stock
|
(26.8
|
)
|
(22.8
|
)
|
(18.9
|
)
|
(18.9
|
)
|
(87.4
|
)
|
|||||||||
|
Net income attributable to American Tower Corporation common stockholders
|
289.3
|
|
344.2
|
|
298.4
|
|
219.6
|
|
1,151.5
|
|
|||||||||
|
Basic net income per share attributable to American Tower Corporation common stockholders
|
0.68
|
|
0.81
|
|
0.70
|
|
0.51
|
|
2.69
|
|
|||||||||
|
Diluted net income per share attributable to American Tower Corporation common stockholders
|
0.67
|
|
0.80
|
|
0.69
|
|
0.51
|
|
2.67
|
|
|||||||||
_______________
|
(1)
|
Represents Operating expenses, exclusive of Depreciation, amortization and accretion, Selling, general, administrative and development expense, and Other operating expenses.
|
23. SUBSEQUENT EVENTS
2019 Term Loan—
On February 14, 2019, the Company entered into a
$1.3 billion
unsecured term loan (the “2019 Term Loan”), the net proceeds of which were used, together with cash on hand, to repay all outstanding indebtedness under the 2018 Term Loan. The 2019 Term Loan matures on February 13, 2020. The Company has the option of choosing either a defined base rate or LIBOR as the applicable base rate for borrowings under the 2019 Term Loan. The interest rate on the 2019 Term Loan ranges between
0.550%
and
1.375%
above LIBOR for LIBOR based borrowings or up to
0.375%
above the defined base rate for base rate borrowings, in each case based upon the Company’s debt ratings. The current margin over LIBOR for the 2019
F-54
AMERICAN TOWER CORPORATION AND SUBSIDIARIES
NOTES TO CONSOLIDATED FINANCIAL STATEMENTS
(Tabular amounts in millions, unless otherwise disclosed)
Term Loan is
0.800%
. Any outstanding principal and accrued but unpaid interest will be due and payable in full at maturity. The 2019 Term Loan does not require amortization of principal and may be paid prior to maturity in whole or in part at the Company’s option without penalty or premium.
The agreement for the 2019 Term Loan contains certain reporting, information, financial and operating covenants and other restrictions (including limitations on additional debt, guaranties, sales of assets and liens) with which the Company must comply. Any failure to comply with the financial and operating covenants of the loan agreement may constitute a default, which could result in, among other things, the amounts outstanding, including all accrued interest and unpaid fees, becoming immediately due and payable.
F-55
AMERICAN TOWER CORPORATION AND SUBSIDIARIES
SCHEDULE III—SCHEDULE OF REAL ESTATE
AND ACCUMULATED DEPRECIATION
(dollars in millions)
|
Description
|
Encumbrances
|
|
Initial cost
to company
|
Cost
capitalized
subsequent to
acquisition
|
Gross amount
carried at
close of current
period
|
|
Accumulated
depreciation at close of current period
|
Date of
construction
|
Date
acquired
|
Life on which
depreciation in
latest income
statements is
computed
|
|||||||||||||||
|
168,985
|
sites (1)
|
$
|
3,014.2
|
|
(2)
|
(3)
|
(3)
|
$
|
15,960.1
|
|
(4)
|
$
|
(5,724.7
|
)
|
Various
|
Various
|
Up to 20 years
|
||||||||
_______________
(1) No single site exceeds
5%
of the total amounts indicated in the table above.
(2) Certain assets secure debt of
$3.0 billion
.
(3) The Company has omitted this information, as it would be impracticable to compile such information on a site-by-site basis.
(4) Does not include those sites under construction.
|
2018
|
2017
|
2016
|
||||||||||
|
Gross amount at beginning
|
$
|
15,349.0
|
|
$
|
14,277.0
|
|
|
$
|
13,046.3
|
|
||
|
Additions during period:
|
||||||||||||
|
Acquisitions
|
721.4
|
|
499.7
|
|
787.2
|
|
||||||
|
Discretionary capital projects (1)
|
173.5
|
|
120.7
|
|
105.3
|
|
||||||
|
Discretionary ground lease purchases (2)
|
180.4
|
|
150.4
|
|
168.1
|
|
||||||
|
Redevelopment capital expenditures (3)
|
177.3
|
|
138.8
|
|
136.8
|
|
||||||
|
Capital improvements (4)
|
94.0
|
|
65.6
|
|
81.8
|
|
||||||
|
Start-up capital expenditures (5)
|
113.1
|
|
158.1
|
|
128.7
|
|
||||||
|
Other (6)
|
(3.0
|
)
|
106.4
|
|
139.4
|
|
||||||
|
Total additions
|
1,456.7
|
|
1,239.7
|
|
1,547.3
|
|
||||||
|
Deductions during period:
|
||||||||||||
|
Cost of real estate sold or disposed
|
(395.7
|
)
|
(246.5
|
)
|
(85.8
|
)
|
||||||
|
Other (7)
|
(449.9
|
)
|
78.8
|
|
(230.8
|
)
|
||||||
|
Total deductions:
|
(845.6
|
)
|
(167.7
|
)
|
(316.6
|
)
|
||||||
|
Balance at end
|
$
|
15,960.1
|
|
$
|
15,349.0
|
|
$
|
14,277.0
|
|
|||
|
2018
|
2017
|
2016
|
|||||||||
|
Gross amount of accumulated depreciation at beginning
|
$
|
(5,181.2
|
)
|
$
|
(4,548.1
|
)
|
$
|
(3,994.9
|
)
|
||
|
Additions during period:
|
|||||||||||
|
Depreciation
|
(751.4
|
)
|
(718.7
|
)
|
(647.9
|
)
|
|||||
|
Other
|
|
|
—
|
|
—
|
|
|||||
|
Total additions
|
(751.4
|
)
|
(718.7
|
)
|
(647.9
|
)
|
|||||
|
Deductions during period:
|
|||||||||||
|
Amount of accumulated depreciation for assets sold or disposed
|
129.3
|
|
100.7
|
|
24.9
|
|
|||||
|
Other (7)
|
78.6
|
|
(15.1
|
)
|
69.8
|
|
|||||
|
Total deductions
|
207.9
|
|
85.6
|
|
94.7
|
|
|||||
|
Balance at end
|
$
|
(5,724.7
|
)
|
$
|
(5,181.2
|
)
|
$
|
(4,548.1
|
)
|
||
_______________
|
(1)
|
Includes amounts incurred primarily for the construction of new sites.
|
|
(2)
|
Includes amounts incurred to purchase or otherwise secure the land under communications sites.
|
|
(3)
|
Includes amounts incurred to increase the capacity of existing sites, which results in new incremental tenant revenue.
|
|
(4)
|
Includes amounts incurred to enhance existing sites by adding additional functionality, capacity or general asset improvements.
|
|
(5)
|
Includes amounts incurred in connection with acquisitions or new market launches. Start-up capital expenditures includes non-recurring expenditures contemplated in acquisitions, new market launch business cases or initial deployment of new technologies or innovation solutions that lead to an increase in site-level cash flow generation.
|
|
(6)
|
Primarily includes regional improvements and other additions.
|
|
(7)
|
Primarily includes foreign currency exchange rate fluctuations and other deductions.
|
F-56
TABLE OF CONTENTS
Part IItem 1. BusinessItem 1A. Risk FactorsItem 1B. Unresolved Staff CommentsItem 2. PropertiesItem 3. Legal ProceedingsItem 4. Mine Safety DisclosuresPart IIItem 5. Market For Registrant S Common Equity, Related Stockholder Matters and Issuer Purchases Of Equity SecuritiesItem 6. Selected Financial DataItem 7. Management S Discussion and Analysis Of Financial Condition and Results Of OperationsItem 7A. Quantitative and Qualitative Disclosures About Market RiskItem 8. Financial Statements and Supplementary DataItem 9. Changes in and Disagreements with Accountants on Accounting and Financial DisclosureItem 9A. Controls and ProceduresPart IIIItem 10. Directors, Executive Officers and Corporate GovernanceItem 11. Executive CompensationItem 12. Security Ownership Of Certain Beneficial Owners and Management and Related Stockholder MattersItem 13. Certain Relationships and Related Transactions, and Director IndependenceItem 14. Principal Accounting Fees and ServicesPart IVItem 15. Exhibits, Financial Statement SchedulesItem 16. Form 10-k Summary