TD AMERITRADE HOLDING CORP
10-Ks and 10-Qs
|
|
|
|
|
|
|
|
|
|
|
|
|
|
|
|
|
|
|
|
|
|
|
|
|
|
|
|
|
UNITED STATES SECURITIES AND EXCHANGE COMMISSION
Washington, D.C. 20549
FORM
10-K
|
|
ANNUAL REPORT PURSUANT TO SECTION 13 OR 15(d) OF THE SECURITIES EXCHANGE ACT OF 1934
|
|||||||
|
For the fiscal year ended
|
|
|||||||
|
|
TRANSITION REPORT PURSUANT TO SECTION 13 OR 15(d) OF THE SECURITIES EXCHANGE ACT OF 1934
|
|||||||
|
For the transition period from to
|
||||||||
Commission file number:
1-35509
(Exact name of registrant as specified in its charter)
|
|
|
|||||||
|
(State or other jurisdiction of
incorporation or organization)
|
(I.R.S. Employer
Identification No.)
|
|||||||
(Address of principal executive offices) (Zip Code)
(
800
)
669-3900
(Registrant's telephone number, including area code)
|
Securities registered pursuant to Section 12(b) of the Act:
|
||||||||
|
Title of each class
|
Trading Symbol(s)
|
Name of each exchange on which registered
|
||||||
|
|
|
|
||||||
|
Nasdaq Global Select Market
|
||||||||
|
Securities registered pursuant to Section 12(g) of the Act:
|
||||||||
|
(Title of class)
|
||||||||
|
None
|
||||||||
Indicate by check mark if the registrant is a well-known seasoned issuer, as defined in Rule 405 of the Securities Act.
Yes
☑
No
☐
Indicate by check mark if the registrant is not required to file reports pursuant to Section 13 of Section 15(d) of the Act. Yes
☐
No
☑
Indicate by check mark whether the registrant (1) has filed all reports required to be filed by Section 13 or 15(d) of the Securities Exchange Act of 1934 during the preceding 12 months (or for such shorter period that the registrant was required to file such reports), and (2) has been subject to such filing requirements for the past 90 days.
Yes
☑
No
☐
Indicate by check mark whether the registrant has submitted electronically every Interactive Data File required to be submitted pursuant to Rule 405 of Regulation S-T (§232.405 of this chapter) during the preceding 12 months (or for such shorter period that the registrant was required to submit such files).
Yes
☑
No
☐
Indicate by check mark whether the registrant is a large accelerated filer, an accelerated filer, a non-accelerated filer, a smaller reporting company or an emerging growth company. See the definitions of "large accelerated filer," "accelerated filer," "smaller reporting company," and "emerging growth company" in Rule 12b-2 of the Exchange Act.
|
|
☑
|
Accelerated filer
|
☐
|
Smaller reporting company
|
|
|||
|
Non-accelerated filer
|
☐
|
(Do not check if a smaller reporting company)
|
Emerging growth company
|
|
||||
If an emerging growth company, indicate by check mark if the registrant has elected not to use the extended transition period for complying with any new or revised financial accounting standards provided pursuant to Section 13(a) of the Exchange Act.
☐
Indicate by check mark whether the registrant is a shell company (as defined in Rule 12b-2 of the Act). Yes
☐
No
☑
The aggregate market value of the common stock held by non-affiliates of the registrant was approximately
$
27.7
billion
computed by reference to the closing sale price of the stock on the Nasdaq Global Select Market on March 29, 2019, the last trading day of the registrant's most recently completed second fiscal quarter.
The number of shares of common stock outstanding as of November 1, 2019 was
541,646,393
shares.
DOCUMENTS INCORPORATED BY REFERENCE
Definitive Proxy Statement relating to the registrant's 2020 Annual Meeting of Stockholders to be filed hereafter (incorporated into Part III hereof).
TD AMERITRADE HOLDING CORPORATION
INDEX
|
Page No.
|
|||
|
Item 1.
|
|||
|
Item 1A.
|
|||
|
Item 1B.
|
|||
|
Item 2.
|
|||
|
Item 3.
|
|||
|
Item 4.
|
|||
|
Item 5.
|
|||
|
Item 6.
|
|||
|
Item 7.
|
|||
|
Item 7A.
|
|||
|
Item 8.
|
|||
|
Item 9.
|
|||
|
Item 9A.
|
|||
|
Item 9B.
|
|||
|
Item 10.
|
|||
|
Item 11.
|
|||
|
Item 12.
|
|||
|
Item 13.
|
|||
|
Item 14.
|
|||
|
Item 15.
|
|||
2
Unless otherwise indicated, references to "we," "us," "our," "Company," or "TD Ameritrade" mean TD Ameritrade Holding Corporation and its subsidiaries, and references to "fiscal" mean the Company's fiscal year ended September 30. References to the "parent company" mean TD Ameritrade Holding Corporation.
Item 1.
Business
Organization
The Company was established as a local investment banking firm in 1971 and began operations as a retail discount securities brokerage firm in 1975. The parent company is a Delaware corporation.
Operations
We are a leading provider of securities brokerage services and related technology-based financial services to retail clients and independent registered investment advisors ("RIAs"). We provide our services to individual retail investors and traders and to RIAs predominantly through the Internet, a national branch network and relationships with RIAs. We use our platform to offer brokerage services to retail investors and traders under a simple, low cost structure and brokerage custodial services to RIAs.
We have been an innovator in electronic brokerage services since entering the retail securities brokerage business in 1975. We believe that we were the first brokerage firm to offer the following products and services to retail clients: touch-tone trading; trading over the Internet; mobile trading; unlimited, streaming, free real-time quotes; extended trading hours; direct access to market destinations; commitment on the speed of order execution and trading of select securities 24 hours a day, five days a week. Over the years the number of brokerage accounts, RIA relationships, average daily trading volume and total assets in client accounts have substantially increased. We have also built, and continue to invest in, a proprietary trade processing platform that is both cost-efficient and highly scalable, significantly lowering our operating costs per trade. In addition, we have made significant investments in building the TD Ameritrade brand.
Strategy
We intend to capitalize on the growth and consolidation of the retail brokerage industry in the United States and leverage our low-cost infrastructure to grow our market share and profitability. Our long-term growth objective is to increase our market share of total assets in client accounts, while maintaining a leadership position in client trading, by providing a best-in-class client experience. We strive to enhance the client experience by providing asset management products and services, enhanced trading tools and capabilities and a superior, proprietary, single-platform system to support RIAs. The key elements of our strategy are as follows:
|
•
|
Focus on brokerage services.
We continue to focus on attracting retail investors and traders and RIAs to our brokerage services. This focused strategy is designed to enable us to maintain our low operating cost structure while offering our clients outstanding products and services. We primarily route orders for execution of client trades on an agency, rather than on a principal, basis, although we maintain an inventory of fixed income securities to meet client demand.
|
|
•
|
Provide a comprehensive investor solution.
We continue to expand our suite of diversified investment products and services to best serve investors' needs. We help clients make investment decisions by providing investment tools, guidance, education and objective third-party research.
|
|
•
|
Continue to be a leader in the RIA industry.
We provide RIAs with comprehensive brokerage and custody services supported by our robust integrated technology platform, customized personal service and practice management solutions.
|
|
•
|
Leverage our infrastructure to add incremental revenue.
Through our proprietary technology, we deliver a robust online experience for retail investors and traders, providing speed, reliability and quality trade execution services. The scalable capacity of our trading system allows us to process a significant number of additional transactions while incurring minimal additional fixed costs.
|
3
|
•
|
Continue to be a low-cost provider of quality services.
We achieve low operating costs per trade by creating economies of scale, utilizing our proprietary transaction-processing systems, continuing to automate processes and locating much of our operations in low-cost areas. This low fixed-cost infrastructure gives us significant financial flexibility. In addition, our bank deposit account arrangements with The Toronto-Dominion Bank ("TD") and other third-party financial institutions enable our clients to invest in an FDIC-insured deposit product without the need for us to establish the significant levels of capital that would be required to maintain our own bank charter.
|
|
•
|
Continue to differentiate our offerings through innovative technologies and service enhancements.
We have been an innovator in our industry for over 40 years. We continually strive to provide our clients with the ability to customize their investing and trading experience with our suite of products and services and ongoing new initiatives. We provide our clients greater choice by offering features and functionality to meet their specific needs.
|
|
•
|
Leverage the TD Ameritrade brand.
We believe that we have a superior brand identity and that our advertising has established TD Ameritrade as a leading brand in the retail brokerage market.
|
|
•
|
Continue to evaluate opportunities for growth through acquisitions.
When evaluating potential acquisitions, we look for transactions that will give us operational leverage, technological leverage, increased market share or other strategic opportunities.
|
Products and Services
We are committed to providing and enhancing a best-in-class client experience. Our products and services include:
|
•
|
Common and preferred stock.
Clients can purchase common and preferred stocks, American Depository Receipts and closed-end funds traded on any United States exchange or quotation system.
|
|
•
|
Exchange-Traded Funds
("
ETFs
"). Our ETF Market Center offers our clients more than 2,300 ETFs from leading providers, providing exposure to many asset classes and diverse investment strategies.
|
|
•
|
Mutual funds.
Clients can compare and select from a portfolio of over 13,000 mutual funds from leading fund families, including a broad range of no-transaction-fee funds. Clients can also easily exchange funds within the same mutual fund family.
|
|
•
|
Options.
We offer a full range of option trades, including complex and multi-leg option strategies.
|
|
•
|
Futures.
We offer futures trades, as well as options on futures, in a wide variety of commodities, stock indices and currencies.
|
|
•
|
Foreign exchange.
We offer access to trading in over 75 different currency pairs.
|
|
•
|
Fixed income.
We offer our clients access to a variety of Treasury, corporate, government agency and municipal bonds, as well as certificates of deposit.
|
|
•
|
Annuities.
We offer access to competitively priced fixed and variable annuities provided by highly-rated insurance carriers.
|
|
•
|
Education
. We offer our clients a suite of free education for beginner, intermediate and advanced investors that is designed to teach investors how to approach the selection process for investment securities and actively manage their investment portfolios.
|
|
•
|
New and secondary issue securities.
We offer primary and secondary offerings of fixed income securities, closed-end funds, common stock and preferred stock.
|
|
•
|
Margin lending.
We extend credit to clients who maintain margin accounts. Portfolio margin, which bases margin requirements on the net exposure of all positions in an account rather than just on individual positions, is also available for certain qualifying accounts with net liquidating values of at least $125,000.
|
|
•
|
Cash management services.
Through third-party banking relationships, we offer FDIC-insured deposit accounts and money market mutual funds to our clients as cash sweep alternatives. Through these relationships, we also offer free standard checking, free online bill pay and ATM services with unlimited ATM fee reimbursements at any machine nationwide.
|
4
|
•
|
U.S. Market access in Asia.
We offer clients in Singapore and Hong Kong access to U.S. markets and the ability to trade stocks, ETFs, options, futures and options on futures.
|
We provide our clients with an array of channels to access our products and services. These include the Internet, our network of retail branches, mobile trading applications, chatbot, interactive voice response and registered representatives via telephone.
Prior to October 3, 2019, we earned commissions and transaction fees on client trades in common and preferred stock, certain ETFs, exchange-traded notes, closed-end funds, options, futures, foreign exchange, mutual funds, fixed income securities and annuities. Effective October 3, 2019, we introduced: (1) $0 commissions on online exchange-listed stock, ETF (domestic and Canadian) and option trades and (2) a fee of $0.65 per contract on listed stock and ETF option trades with no additional exercise and assignment fees. Order routing revenue generated from payments and/or rebates received from market centers is a component of commissions and transaction fees. Margin lending, securities borrowed and loaned transactions and client cash generate net interest revenue. Cash management services generate bank deposit account fees. Fees earned from mutual funds, investment program fees and referrals generate investment product fee revenues. Other revenues include proxy income, solicit and tender fees and other fees charged for ancillary services provided to clients. The following table presents the percentage of net revenues contributed by each class of similar services during the last three fiscal years:
|
Percentage of Net Revenues
Fiscal Year Ended September 30,
|
|||||||||
|
Class of Service
|
2019
|
2018
|
2017
|
||||||
|
Commissions and transaction fees
|
33.3
|
%
|
36.1
|
%
|
37.6
|
%
|
|||
|
Bank deposit account fees
|
28.5
|
%
|
28.3
|
%
|
30.1
|
%
|
|||
|
Net interest revenue
|
25.5
|
%
|
23.3
|
%
|
18.8
|
%
|
|||
|
Investment product fees
|
9.7
|
%
|
10.2
|
%
|
11.5
|
%
|
|||
|
Other revenues
|
3.0
|
%
|
2.1
|
%
|
2.0
|
%
|
|||
|
Net revenues
|
100.0
|
%
|
100.0
|
%
|
100.0
|
%
|
|||
Client Service and Support
We strive to provide the best client service in the industry, as measured by speed of response time to telephone calls, turnaround time responding to client inquiries and client satisfaction with the account relationship. We are committed to delivering a meaningful investing experience to our diverse client base.
We endeavor to optimize our client service by:
|
•
|
assuring prompt response to client service calls through adequate staffing with properly trained and motivated personnel in our client service departments, a majority of whom hold the Financial Industry Regulatory Authority ("FINRA") Series 7 license; tailoring client service to the particular expectations of clients; and expanding our use of technology to provide automated responses to the most typical inquiries generated in the course of clients' trading, investing and related activities.
|
We provide client service and support through the following means:
|
•
|
Websites.
Our websites provide information on how to use our services, a variety of self-service capabilities and an in-depth education center that includes a selection of online investing courses. Clients also have access to a virtual agent, enabling them to ask questions about our products, tools and services, as well as access to live agents through chat capabilities.
|
|
•
|
Branches.
We offer a nationwide network of retail branch offices, with more than 275 retail branches located in 47 states and the District of Columbia.
|
|
•
|
Email.
Our operating standards require a response within 24 hours of receipt of the email, but we strive to respond within four hours after receiving the original message.
|
|
•
|
Telephone.
We provide a toll-free number that connects to advanced call handling systems, which provide automated processing of calls. Our systems also allow linkage between caller identification and the client
|
5
database to give the client service representative immediate access to the client's account data when the call is received. Client service representatives are available 24 hours a day, seven days a week.
|
•
|
Mobile app
. Support on the TD Ameritrade Mobile Trader App allows clients to text with a trading specialist for immediate answers to questions or share their screens for help.
|
|
•
|
TTY services for the hearing impaired
. We provide sign language and oral interpreters and/or other auxiliary aids and services free of charge for the hearing impaired.
|
Technology and Information Systems
Our technological capabilities and systems are central to our business and are critical to our goal of providing the best execution at the best value for our clients. Our operations require reliable, scalable systems that can handle complex financial transactions for our clients with speed and accuracy. We maintain sophisticated and proprietary technology that automates securities transactions. Our ability to effectively leverage and adopt new technology to improve our services is a key component of our success.
We continue to make investments in technology and information systems. We have spent a significant amount of resources to increase capacity and improve speed, reliability and security. To provide for system continuity during potential power outages, we have equipped our data centers with uninterruptible power supply units and back-up generators. We invest annually in our cybersecurity capabilities and utilize the industry standard, National Institute of Standards and Technology framework, as well as leading risk mitigation approaches to benchmark ourselves and to continually enhance client and systems protection.
Advertising and Marketing
We intend to continue to grow and increase our market share by advertising online, on television, in print, on our own websites and utilizing various forms of social media. We invest heavily in advertising programs designed to bring greater brand recognition to our services, and we intend to continue to aggressively advertise. From time to time, we may choose to increase our advertising to targeted groups of investors or increase or decrease our advertising in response to market conditions.
Advertising for retail clients is generally conducted through digital, search and social media, financial news networks and other television and cable networks. We also place print advertisements in a broad range of business publications. Advertising for institutional clients is significantly less than for retail clients and is generally conducted through highly-targeted media.
To monitor the success of our various marketing efforts, we utilize a media mix model that uses robust data to analyze the return on investment of our marketing expenses. This model also supports decisions on spending levels and helps us determine the point at which we begin to experience diminishing returns. Additionally, our advanced data and analytics capabilities enable a more targeted, personalized experience for prospective and existing clients. How we share client information is disclosed in our privacy statement.
All of our securities brokerage-related communications with the public are regulated by FINRA. All of our futures and foreign exchange brokerage-related communications with the public are regulated by the National Futures Association ("NFA").
Clearing Operations
Our subsidiary, TD Ameritrade Clearing, Inc. ("TDAC"), provides clearing and execution services for our securities brokerage business. Clearing services include the confirmation, receipt, settlement, delivery and record-keeping functions involved in processing securities transactions. TDAC:
|
•
|
maintains client accounts;
|
|
•
|
extends credit in margin accounts to clients;
|
|
•
|
engages in securities lending and borrowing;
|
|
•
|
settles securities transactions with clearinghouses such as The Depository Trust & Clearing Corporation ("DTCC") and The Options Clearing Corporation ("OCC");
|
6
|
•
|
settles commissions and transaction fees;
|
|
•
|
prepares client trade confirmations and statements;
|
|
•
|
performs designated cashiering functions (including delivery and receipt of funds and securities to and from clients);
|
|
•
|
possesses, controls and safeguards funds and securities in client accounts;
|
|
•
|
processes cash sweep transactions to and from bank deposit accounts and money market mutual funds;
|
|
•
|
transmits tax accounting information to clients and to the applicable tax authorities; and
|
|
•
|
forwards prospectuses, proxy materials and other shareholder information to clients.
|
We contract with external providers for futures clearing. We also contract with an external provider to facilitate foreign exchange trading for our clients.
Competition
We believe that the principal determinants of success in the retail brokerage market are brand recognition, size of client base and client assets, ability to attract new clients and client assets, client trading activity, efficiency of operations, technology infrastructure and advancements and access to financial resources. We also believe that the principal factors considered by clients in choosing a brokerage firm are reputation, client service quality, price, convenience, product offerings, quality of trade execution, platform capabilities, innovation and overall value. Based on our experience, focus group research and the success we have enjoyed to date, we believe that we presently compete successfully in each of these categories.
The market for brokerage services, particularly electronic brokerage services, continues to evolve and is highly competitive. We experience significant competition and expect this competitive environment to continue. We encounter direct competition from numerous other brokerage firms, many of which provide online brokerage services. These competitors include E*TRADE Financial Corporation, The Charles Schwab Corporation and Fidelity Investments. We also encounter competition from the broker-dealer affiliates of established full-commission brokerage firms, such as Merrill Lynch and Morgan Stanley, as well as from banks, mutual fund sponsors, online wealth management services (including so-called "robo-advisors") and other financial institutions and organizations, some of which provide online brokerage services.
Regulation
The securities, futures and foreign exchange industries are subject to extensive regulation under federal and state law. Our broker-dealers, TD Ameritrade, Inc. and TDAC, are required to register with the U.S. Securities and Exchange Commission ("SEC") and to be members of FINRA and the Municipal Securities Rulemaking Board ("MSRB"). Our futures commission merchant ("FCM") and forex dealer member ("FDM") subsidiary, TD Ameritrade Futures & Forex LLC ("TDAFF"), is registered with the Commodity Futures Trading Commission ("CFTC") and is a member of, and the corresponding services functions are regulated by, the NFA. Our broker-dealer subsidiaries are subject to the requirements of the Securities Exchange Act of 1934 (the "Exchange Act") relating to broker-dealers, including, among other things, minimum net capital requirements under the SEC Uniform Net Capital Rule (Rule 15c3-1), best execution requirements for client trades under SEC guidelines and FINRA rules and segregation of client funds under the SEC Customer Protection Rule (Rule 15c3-3), administered by the SEC and FINRA. TDAFF is subject to regulations under the Commodity Exchange Act, administered by the CFTC and NFA, including CFTC Regulations 1.17 and 5.7, which require the maintenance of minimum adjusted net capital, and CFTC Regulation 1.20, which requires segregation of client funds.
Net capital rules are designed to protect clients, counterparties and creditors by requiring a broker-dealer, an FCM or an FDM to have sufficient liquid resources available to satisfy its financial obligations. Net capital is a measure of a broker-dealer's, an FCM's or an FDM's readily available liquid assets, reduced by its total liabilities other than approved subordinated debt. Under the SEC Uniform Net Capital Rule, a broker-dealer may not repay any subordinated borrowings, pay cash dividends or make any unsecured advances or loans to its parent company or employees if such payment would result in a net capital amount below required levels. A broker-dealer is required to provide notice to the SEC and FINRA if its net capital is below certain required levels. Likewise, an FCM and
7
an FDM, such as TDAFF, must provide notice to the CFTC if its adjusted net capital amounts are below required levels.
Certain of our subsidiaries are also registered as investment advisors under the Investment Advisers Act of 1940. We are also subject to regulation in all 50 states, the District of Columbia and Puerto Rico, including registration requirements. TD Ameritrade Trust Company is chartered in the state of Maine as a state-regulated non-depository trust company. TD Ameritrade Singapore Pte. Ltd. is licensed by the Monetary Authority of Singapore and TD Ameritrade Hong Kong Ltd. is licensed by the Securities and Futures Commission of Hong Kong.
In its capacity as a securities clearing firm, TDAC is a member of the DTCC and the OCC, each of which is registered as a clearing agency with the SEC. As a member of these clearing agencies, TDAC is required to comply with the rules of such clearing agencies, including rules relating to possession or control of client funds and securities, margin lending and execution and settlement of transactions.
Margin lending activities are subject to limitations imposed by regulations of the Federal Reserve System and FINRA. In general, these regulations provide that, in the event of a significant decline in the value of securities collateralizing a margin account, we are required to obtain additional collateral from the borrower or liquidate security positions.
Because TD owns more than 25% of our common stock, we are considered a non-bank subsidiary of TD under the Bank Holding Company Act of 1956 (the "BHC Act"). As a result, we are subject to the supervision and regulation of the Federal Reserve. These banking regulations limit the activities and the types of businesses that we may conduct and the types of companies we may acquire. Under these regulations, the Federal Reserve could impose significant limitations on our current business and operations. TD is currently regulated as a "financial holding company" under the BHC Act, which allows TD and us to engage in a much broader set of activities than would otherwise be permitted under the BHC Act.
We are subject to a number of state, federal and foreign laws applicable to companies conducting business on the Internet that address client privacy, system security and safeguarding practices and the use of client information.
For additional, important information relating to government regulation, please review the information set forth under the heading "Risk Factors Relating to the Regulatory and Legislative Environment" in Item 1A — Risk Factors.
Risk Management
Our business activities expose us to various risks. Identifying and measuring our risks is critical to our ability to manage risk within acceptable tolerance levels in order to minimize the effect on our business, results of operations and financial condition.
Our management team is responsible for managing risk. It is overseen by our board of directors, primarily through the board's Risk Committee. We use risk management processes and have policies and procedures for identifying, measuring and managing risks, including establishing threshold levels for our most significant risks. Our risk management, compliance, internal audit, and legal departments assist in identifying and managing risks. Our management team's Enterprise Risk Committee ("ERC") is responsible for reviewing risk exposures and risk mitigation. Subcommittees of the ERC have been established to assist in identifying and managing specific areas of risk.
Our business exposes us to the following broad categories of risk:
Operational Risk —
Operational risk is the risk of loss resulting from inadequate or failed internal processes or controls, human error or misconduct, systems and technology problems or from external events. It also involves compliance with regulatory and legal requirements. Operational risk is the most prevalent form of risk in our risk profile. We manage operational risk by establishing policies and procedures to accomplish timely and efficient processing, obtaining periodic internal control attestations from management and conducting internal audit reviews to evaluate the effectiveness of internal controls.
Cybersecurity Risk
—
Cybersecurity risk is the risk of a malicious technological attack intended to impact the confidentiality, availability, or integrity of our systems and data, including, but not limited to, sensitive client data. Our technology and security teams rely on a layered system of preventive and detective technologies, practices, and
8
policies to detect, mitigate, and neutralize cybersecurity threats. In addition to the ERC, our management team's Security Executive Oversight Committee regularly assesses our cybersecurity risks and mitigation efforts. Cyber attacks can also result in financial and reputational risk.
Market Risk
— Market risk is the risk of loss resulting from adverse movements in market factors, such as asset prices, foreign exchange rates and interest rates. Our market risk related to asset prices is mitigated by us routing client trades for execution, primarily on an agency rather than on a principal basis, and our maintenance of fixed-income securities to meet client requirements. Interest rate risk is our most prevalent form of market risk. For more information about our interest rate risk and how we manage it, see Item 7A — Quantitative and Qualitative Disclosures About Market Risk.
Credit Risk
— Credit risk is the risk of loss resulting from failure of obligors to honor their payment obligations. Our exposure to credit risk mainly arises from client margin lending and leverage activities, securities lending activities and other counterparty credit risks. For more information about our credit risk and how we manage it, see Item 7A – Quantitative and Qualitative Disclosures About Market Risk.
Liquidity Risk
— Liquidity risk is the risk of loss resulting from the inability to meet current and future cash flow needs. We actively monitor our liquidity position at the holding company and at the broker-dealer and FCM/FDM subsidiary levels. For more information, see Item 7 — Management's Discussion and Analysis of Financial Condition and Results of Operations – Liquidity and Capital Resources.
Strategic Risk
— Strategic risk is the risk of loss arising from ineffective business strategies, improper implementation of business strategies, or lack of responsiveness to changes in the business and competitive environment. Our executive management is responsible for establishing an appropriate corporate strategy intended to create value for stockholders, clients and employees, with oversight by our board of directors. Our management is responsible for defining the priorities, initiatives and resources necessary to execute the strategic plan, the success of which is regularly evaluated by the board of directors.
Reputational Risk
— Reputational risk is the risk arising from possible negative perceptions, whether true or not, of the Company among our clients, counterparties, stockholders, suppliers, employees and regulators. The potential for either enhancing or damaging our reputation is inherent in almost all aspects of business activity. We manage this risk through our commitment to a set of core values that emphasize and reward high standards of ethical behavior, maintaining a culture of compliance and by being responsive to client and regulatory requirements.
Risk is inherent in our business, and therefore, despite our efforts to manage risk, there can be no assurance that we will not sustain unexpected losses. For a discussion of the factors that could materially affect our business, financial condition or future results of operations, see Item 1A — Risk Factors.
Intellectual Property Rights
Our success and ability to compete are significantly dependent on our intellectual property. We rely on copyright, trade secret, trademark, domain name, patent and contract laws to protect our intellectual property and have utilized the various methods available to us, including filing applications for patents and trademark registrations with the United States Patent and Trademark Office and entering into written licenses and other technology agreements with third parties. Our patented and patent pending technologies include stock indexing and investor education technologies, as well as innovative trading and analysis tools. Our trademarks include both our primary brand, TD Ameritrade (including the "TD" name through a trademark license agreement with TD), as well as brands for other products and services. A substantial portion of our intellectual property is protected by trade secrets. The source code and object code for our proprietary software are also protected using applicable methods of intellectual property protection and general protections afforded to confidential information. In addition, it is our policy to enter into confidentiality and intellectual property ownership agreements with our employees and confidentiality and noncompetition agreements with our independent contractors and business partners and to control access to and distribution of our intellectual property.
Employees
As of September 30,
2019
, we had 9,226 full-time equivalent employees. None of our employees is covered by a collective bargaining agreement. We believe that our relations with our employees are good.
9
Websites and Social Media Disclosure
From time to time, the Company may use its website and/or Twitter as distribution channels of material information. The Company's Code of Business Conduct and Ethics, financial data and other important information regarding the Company is accessible through and posted on the Company's website at
www.amtd.com
and its Twitter account @TDAmeritradePR. We ask that interested parties visit or subscribe to newsfeeds at
www.amtd.com/news-and-stories
to automatically receive email alerts and other information, including the most up-to-date corporate financial information, presentation announcements, transcripts and archives. The website to access the Company's Twitter account is
https://twitter.com/TDAmeritradePR
. Website links provided in this report, although correct when published, may change in the future. We make available free of charge on our website at
www.amtd.com/investor-relations/sec-filings
our annual report on Form 10-K, quarterly reports on Form 10-Q, current reports on Form 8-K and amendments to those reports, as soon as reasonably practicable after we electronically file such material with or furnish it to the SEC. Our SEC filings are also available on the SEC's website at
http://www.sec.gov
.
Item 1A.
Risk Factors
In addition to the other information set forth in this report, you should carefully consider the following factors, which could materially affect our business, financial condition, future results of operations or stock price, and many of which we cannot control. Although the risks described below are those that we believe are the most significant, these are not the only risks facing our Company. Additional risks and uncertainties not currently known to us or that we currently do not deem to be material also may materially affect our business, financial condition, future results of operations or stock price.
Risk Factors Relating to Our Business Operations
Economic, social and political conditions and other securities industry risks could adversely affect our business.
Substantially all of our revenues are derived from our securities brokerage business, which generates asset-based revenues and transaction-based revenues. Like other securities brokerage businesses, we are directly affected by economic, social and political conditions, broad trends in business and finance and changes in volume and price levels of securities transactions. Events in global financial markets in recent years resulted in substantial market volatility and increased client trading volume, but any sustained downturn in general economic conditions or U.S. equity markets could result in reduced client trading volume and order routing revenues. Severe market fluctuations or weak economic conditions could reduce our trading volume and net revenues and adversely affect our profitability.
Our exposure to interest rate risk could adversely affect our profitability.
As a fundamental part of our securities brokerage business, we invest in interest-earning assets and are obligated on interest-bearing liabilities. In addition, we earn fees on our FDIC-insured deposit account arrangements with TD Bank USA, N.A., TD Bank N.A. and with other third-party financial institutions, which are subject to interest rate risk. Continued uncertainty resulting from U.S. fiscal and political matters have impacted and may continue to impact the U.S. and global economies. The direction and level of interest rates are important factors in our profitability.
A falling interest rate environment generally results in our earning a smaller net interest spread. Conversely, a rising interest rate environment generally results in our earning a larger net interest spread.
Our most prevalent form of interest rate risk is referred to as "gap" risk. This risk occurs when the interest rates we earn on assets change at a different frequency or amount than the interest rates we pay on liabilities. For example, in a low (but rising) interest rate environment, sharp increases in short-term interest rates could result in net interest spread compression if the yield paid on interest-bearing client balances were to increase faster than our earnings on interest-earning assets. If we are unable to effectively manage our interest rate risk, changes in interest rates could have adverse effects on our profitability.
10
Inability to meet the funding needs of our securities brokerage operations for any reason would have a material adverse effect on our business.
Maintaining adequate liquidity is crucial to our securities brokerage operations, including key functions such as transaction settlement and margin lending. We are subject to cash deposit and collateral requirements with clearinghouses such as the DTCC and the OCC, which may fluctuate significantly from time to time based on the nature and size of our clients' trading activity. We satisfy our liquidity needs primarily from working capital and cash generated by client activity, as well as external financing. Our liquidity needs to support interest-earning assets are primarily met by client cash balances or financing created from our securities lending activities. A reduction of funds available from these sources may require us to seek other potentially more expensive forms of financing, such as borrowings on our revolving credit facilities.
Factors which may adversely affect our liquidity positions include subsidiaries having temporary liquidity demands due to timing differences between brokerage transaction settlements and the availability of segregated cash balances, fluctuations in cash held in client accounts, a dramatic increase in our margin lending activities, increased regulatory capital requirements, changes in regulatory guidance or interpretations, other regulatory changes or a loss of market or client confidence resulting in unanticipated withdrawals of client funds.
Reduction in our liquidity could, in itself, reduce client confidence in us, which would result in the transfer of client assets and accounts, or could cause us to fail to satisfy our liquidity requirements. Also, while our regulated subsidiaries currently satisfy regulatory capital requirements, any failure to do so would curtail their operations and their ability to pay dividends to the parent company, which would reduce our liquidity and adversely affect our ability to repay debt and return capital to stockholders. We would then need to provide additional funding to such subsidiaries.
Our liquidity could be constrained if we are unable to obtain financing on acceptable terms, or at all, due to a variety of unforeseen market disruptions. During periods of disruption in the credit and capital markets, borrowing costs may increase and potential sources of external financing may be reduced or even eliminated. In addition, a significant downgrade in our credit ratings could increase our borrowing costs and limit our access to the credit and capital markets. Inability to meet our funding needs on a timely basis would have a material adverse effect on our business.
Our exposure to credit risk with clients and counterparties could result in losses.
We extend margin credit and leverage to clients, which are collateralized by client cash and securities. We also borrow and lend securities in connection with our broker-dealer business. A significant portion of our net revenues is derived from interest on margin loans. By permitting clients to purchase securities on margin and exercise leverage with options and futures positions, we are subject to risks inherent in extending credit, especially during periods of rapidly declining markets in which the value of the collateral held by us could fall below the amount of a client's indebtedness. In addition, in accordance with regulatory guidelines, we collateralize borrowings of securities by depositing cash or securities with lenders. Sharp changes in market values of substantial amounts of securities and the failure by parties to the borrowing transactions to honor their commitments could have adverse effects on our revenues and profitability. We also engage in financial transactions with counterparties, including securities sold under agreements to repurchase, that expose us to credit losses in the event counterparties cannot meet their obligations. We have policies and procedures designed to manage credit risk, but our policies and procedures may not be fully effective.
We need to introduce new products and services and update or enhance existing products and services to remain competitive.
We compete in a technology-intensive industry characterized by rapid innovation. Our future success depends in part on our ability to introduce new products and services or update or enhance our existing products and services. In addition, the adoption of new Internet, networking or telecommunications technologies or other technological changes could require us to incur substantial expenditures to update, enhance or adapt our services or infrastructure.
There are significant technical and financial costs and risks in the development of new or enhanced products and services, including the risk that we might be unable to effectively use new technologies, adapt our services to emerging industry standards or develop, introduce and market updated, enhanced or new products and services. An
11
inability to develop new products and services, or to update or enhance existing offerings, could have adverse effects on our business and results of operations.
Our clearing operations expose us to liability for errors in clearing functions.
Our broker-dealer subsidiary, TDAC, provides clearing and execution services for our securities brokerage business. Clearing and execution services include the confirmation, receipt, settlement and delivery functions involved in securities transactions. Clearing brokers also assume direct responsibility for the possession or control of client securities and other assets and the clearing of client securities transactions. However, clearing brokers also must rely on third-party clearing organizations, such as the DTCC and the OCC, in settling client securities transactions. Clearing securities firms, such as TDAC, are subject to substantially more regulatory oversight and examination than introducing brokers that rely on others to perform clearing functions. Errors in performing clearing functions, including clerical and other errors related to the handling of funds and securities held by us on behalf of clients, could lead to regulatory fines and civil penalties as well as losses and liability in related legal proceedings brought by clients and others.
A default by a large financial institution could adversely affect financial markets and our business.
The commercial soundness of many financial institutions are closely interrelated as a result of credit, trading, clearing and other relationships among the institutions. For example, increased centralization of trading activities through clearing houses and clearing agencies has occurred and may continue to occur in the future. This is driven by market forces and legal measures and may increase our concentration of risk with respect to these entities. As a result of this connectedness, concerns about, or a default or threatened default by, one institution can lead to significant market-wide liquidity and credit problems, defaults and losses by others. Sometimes referred to as "systemic risk," this phenomenon may adversely affect financial intermediaries such as clearing houses, clearing agencies, exchanges, banks and securities firms with which we interact daily and could therefore negatively impact our business. Our membership agreements with the DTCC and OCC may require us to contribute capital to the clearing agencies if one or more other members default on their obligations.
Aggressive competition could reduce our market share, revenues and profits.
The market for electronic securities brokerage services is continually evolving and is intensely competitive. The securities brokerage industry has experienced significant consolidation, which may continue in the future, likely increasing competitive pressures in the industry. Consolidation could enable other firms to offer a broader range of products and services than we do, or offer them on better terms, such as higher interest rates paid on cash held in client accounts. We expect this intensely competitive environment to continue in the future. We face direct competition from numerous securities brokerage firms, including E*TRADE Financial Corporation, The Charles Schwab Corporation and Fidelity Investments. We also encounter competition from the broker-dealer affiliates of established full-commission brokerage firms, such as Merrill Lynch and Morgan Stanley, as well as from banks, mutual fund sponsors, online wealth management services (including so-called "robo-advisors") and other financial institutions and organizations, some of which provide online brokerage services. Some of our competitors have greater financial, technical, marketing and other resources, offer a wider range of services and financial products, and have greater name recognition and a more extensive client base than we do. Others offer a narrower range of products and services but benefit from a lower cost structure than we have. We believe that the general financial success of companies within the securities brokerage industry will continue to attract new competitors to the industry, such as software development companies, insurance companies, providers of online financial information and others. These companies may provide a more comprehensive suite of services than we do or offer services at lower prices. Increased competition could have adverse effects on our business such as reducing our market share, revenues and profits.
Our ability to compete successfully in the securities brokerage industry depends on a number of factors, such as:
|
•
|
maintaining and expanding our market position;
|
|
•
|
attracting and retaining customers;
|
|
•
|
providing easy to use and innovative financial products and services;
|
|
•
|
our reputation and the market perception of our brand and overall value;
|
12
|
•
|
maintaining competitive pricing;
|
|
•
|
competing in a concentrated competitive landscape;
|
|
•
|
optimizing our costs of doing business;
|
|
•
|
the effectiveness of our technology (including cybersecurity defenses), products and services;
|
|
•
|
deploying a secure and scalable technology and back office platform;
|
|
•
|
complying with the differences in regulatory oversight regimes;
|
|
•
|
attracting new employees and retaining our existing employees; and
|
|
•
|
general economic and industry trends, including customer demand for financial products and services.
|
Our competitive position within the industry could be adversely affected if we were unable to address these factors adequately.
Information system failures, delays and capacity constraints could harm our business.
We receive and process trade orders through a variety of electronic channels, including the Internet, mobile trading applications and our interactive voice response system. These methods of trading are heavily dependent on the integrity of the electronic systems supporting them. Our systems and operations are vulnerable to damage or interruption from natural disasters, power loss, human error, execution error, errors in models (such as those used for asset management, risk management, stress testing and compliance), employee misconduct, unauthorized trading, external fraud, cyber attacks, terrorist attacks, capacity constraints, software flaws, events impacting key vendors, phishing or other attempted unauthorized access, computer viruses, distributed denial of service ("DDOS") attacks, spurious spam attacks, ransomware, intentional acts of vandalism and similar events. It could take several hours or more to restore full functionality following any of these events. Extraordinary trading volumes could cause our computer systems to operate at an unacceptably slow speed or even fail. Extraordinary Internet traffic caused by DDOS, spam attacks or extreme market volatility could cause our website or other trading applications to be unavailable or slow to respond.
We may not be able to project accurately the rate, timing or cost of any increases in our business or to expand and upgrade our systems and infrastructure to accommodate any increases in a timely manner. While we have made significant investments in the reliability and scalability of our systems and added hardware and services to address extraordinary Internet traffic, there can be no assurance that our systems will be sufficient to handle extraordinary circumstances. Systems failures and delays could occur and could cause, among other things, unanticipated disruptions in service to our clients, substantial losses to our clients, slower system response time resulting in transactions not being processed as quickly as our clients desire, decreased levels of client service and client satisfaction and harm to our reputation. Slowness or unavailability may not impact all trading channels evenly, and some trading channels may be impacted while others are not. Social media and media reports may conflate one channel being unavailable with all channels being unavailable. Should our operations be disrupted, we might need to make significant unbudgeted investments to upgrade, repair or replace our technology infrastructure and might not be able to make such investments on a timely basis. As a result of these technological, operational and financial issues, we could suffer unexpected losses, reputational damage and/or regulatory action.
We are also dependent on the integrity and performance of securities exchanges, clearing houses and other intermediaries to which client orders are routed for execution and settlement. Systems failures and constraints and transaction errors at such intermediaries could result in delays and erroneous or unanticipated execution prices, cause substantial losses for us and our clients and subject us to claims from our clients for damages.
Further, a cybersecurity intrusion could occur and persist for an extended period of time without detection, and any investigation of a cybersecurity intrusion could require a substantial amount of time. During all this time we might not know the extent of the harm or how best to remediate it, and errors or omissions could be repeated or compounded before being discovered and remediated, all of which could aggravate the costs and consequences of the intrusion. A cybersecurity intrusion could result in misappropriation of our information or client information, destruction or obfuscation of information, inability to access or use information or impairment of the integrity of information, all of which could result in us being unable to perform our obligations to our clients, which could result in regulatory action and risk of claims for damages from clients.
13
As our business model relies heavily on our clients' use of their own personal computers, mobile devices and the Internet, our business and reputation could be harmed by security breaches of our clients and third parties. Computer viruses and other attacks on our clients' personal computer systems, home networks and mobile devices or against the third-party networks and systems of Internet and mobile service providers could create losses for our clients even without any breach in the security of our systems and could thereby harm our business and our reputation. As part of our asset protection guarantee, we may reimburse our clients for losses in their accounts caused by a breach of security of our clients' own computers (through no fault of the client). Such reimbursements may not be covered by applicable insurance and could have an adverse effect on our business, financial condition and results of operations. The occurrence of any of these events could have adverse effects on our business, financial condition and results of operations. There is no guarantee that we will be able to maintain, expand and upgrade our systems and infrastructure to meet future requirements and mitigate future risks on a timely basis or that we will be able to retain all of the skilled information technology employees that we need.
Failure to protect client data or prevent breaches of our information systems could expose us to liability or reputational damage.
We are dependent on information technology networks and systems to securely process, transmit and store electronic information and to communicate among our locations and with our clients and vendors. As the breadth and complexity of this infrastructure continue to grow, the potential risk of security breaches and cyber attacks increases. Developing and enhancing new products and services, which is necessary for us to remain competitive, may involve the use or creation of new technologies, exposes us to cybersecurity and privacy risks that cannot be completely anticipated and increases the risk of security breaches and cyber attacks. As a financial services company, we are continuously subject to cyber attacks, DDOS and ransomware attacks, malicious code and computer viruses by activists, hackers, organized crime, foreign state actors and other third parties. Such breaches could lead to shutdowns or disruptions of our systems, account takeovers and unauthorized gathering, monitoring, misuse, loss, total destruction and disclosure of data and confidential information of ours, our clients, our employees or other third parties, or otherwise materially disrupt our or our clients' or other third parties' network access or business operations. In addition, vulnerabilities of our external service providers and other third parties could pose security risks to client information. The secure transmission of confidential information over public networks is also a critical element of our operations. Despite our efforts to assure the integrity of our systems, we may not be able to anticipate or to implement effective preventive measures against all security breaches, especially because the techniques that are used change frequently or are not recognized until launched and because security attacks can originate from a wide variety of sources. Data security breaches may also result from non-technical means (such as employee misconduct).
We, along with the financial services industry in general, have experienced losses related to clients' login and password information being compromised, generally caused by attacks capturing credentials directly from clients themselves, through phishing attacks, clients' use of non-secure public computers or vulnerabilities of clients' private computers and mobile devices. In 2007, we discovered and eliminated unauthorized code from our computer systems that had allowed an unauthorized third party to retrieve client email addresses, names, addresses and phone numbers from an internal database. Following the incident, we incurred significant remediation costs. In addition, in 2013, Scottrade Financial Services, Inc., which we acquired in September 2017, experienced a database breach. We are aware of subsequent attempts by other attackers to penetrate our systems using similar techniques and similar attacks against other financial institutions. Although we have taken steps to reduce the risk of such threats, our risk and exposure to a cyber attack or related breach remains heightened due to the evolving nature of these threats, our plans to continue to implement mobile access solutions to serve our clients, our routine transmission of sensitive information to third parties, the current global economic and political environment, external extremist parties and other developing factors. If a cyber attack or similar breach were to occur, we could suffer damage to our reputation and incur significant remediation costs and losses.
In providing services to clients, we manage, utilize and store sensitive and confidential client data, including personal data. As a result, we are subject to numerous laws and regulations designed to protect this information, such as U.S. federal and state laws and foreign regulations governing the protection of personally identifiable information. These laws and regulations are increasing in complexity and number, change frequently and sometimes conflict. If any person, including any of our employees, negligently disregards or intentionally breaches our established controls with respect to client data, or otherwise mismanages or misappropriates that data, we could be subject to significant monetary damages, regulatory enforcement actions, fines and/or criminal prosecution in one or more jurisdictions.
14
Unauthorized disclosure of sensitive or confidential client data, whether through systems failure, employee negligence, fraud or misappropriation, could damage our reputation and cause us to lose clients. Similarly, unauthorized access to or through our information systems, whether by our employees or third parties, including a cyber attack by third parties who may deploy viruses, worms or other malicious software programs, could result in negative publicity, significant remediation costs, legal liability, regulatory fines, financial responsibility under our asset protection guarantee to reimburse clients for losses in their accounts resulting from unauthorized activity in their accounts (through no fault of the client) and damage to our reputation and could have adverse effects on our results of operations.
Any actual or perceived breach of the security of our technology, or media reports of perceived security vulnerabilities of our systems or the systems of our third-party service providers, could damage our reputation, expose us to the risk of litigation and liability, disrupt our operations, increase our costs with respect to investigations and remediations, reduce our revenues as a result of the theft of intellectual property, and otherwise adversely affect our business. Further, any actual or perceived security breach or cyber attack directed at other financial institutions or financial services companies, whether or not we are impacted, could lead to a general loss of customer confidence in the use of technology to conduct financial transactions, which could negatively impact us. The occurrence of any of these events could have adverse effects on our business and results of operations.
If any person, including any of our employees, negligently disregards or intentionally breaches our established controls with respect to client or employee data, or otherwise mismanages or misappropriates that data, we could be subject to significant monetary damages, regulatory enforcement actions, fines and criminal prosecutions.
Although we maintain insurance coverage that we believe is reasonable, prudent and adequate for the purpose of our business, it might be insufficient in type or amount to protect us against all losses and costs stemming from security breaches, cyber attacks and other types of unlawful activity or any resulting disruptions from such events.
We also face risk related to external fraud involving the misappropriation and use of clients' user names, passwords or other personal information to gain access to their accounts. This could occur from the compromise of clients' personal electronic devices or as a result of a data security breach at an unrelated company where clients' personal information is taken and then made available to fraudsters. This risk has grown in recent years due to the increased sophistication and activities of organized crime and other external parties, including foreign state-sponsored parties. Losses in client accounts reimbursed under our asset protection guarantee against unauthorized account activity (through no fault of the client) could have adverse effects on our business, financial condition and results of operations.
Our investment advisory services subject us to additional risks that could result in liability for client losses, fines, penalties and other adverse effects.
We provide investment advisory services to investors through our SEC-registered investment advisors, TD Ameritrade, Inc., TD Ameritrade Investment Management, LLC and TradeWise Advisors, Inc. ("TradeWise"). TD Ameritrade, Inc. offers AdvisorDirect,
®
a service that refers a client to an independent RIA on the TD Ameritrade institutional platform. TD Ameritrade Investment Management, LLC manages an investment portfolio, through its Essential, Selective or Personalized Portfolios services, based on an investor's objectives, time horizon and risk tolerance. TradeWise provides an option advisory subscription service for self-directed investors. The risks associated with these investment advisory activities include those arising from possible conflicts of interest, unsuitable investment recommendations, inadequate due diligence, inadequate disclosure and fraud. Realization of these risks could lead to liability for client losses, regulatory fines, civil penalties and harm to our reputation and business.
Mergers and acquisitions in which we might engage involve risks that could adversely affect our business.
As part of our growth strategy, we regularly consider, and from time to time engage in, discussions and negotiations regarding transactions, such as mergers, acquisitions and other business combinations within our industry. The purchase price for possible acquisitions of businesses and technologies might be paid in cash, through the issuance of common stock or other securities, borrowings or a combination of these methods.
15
Business combinations entail numerous risks, including:
|
•
|
difficulties in the integration of acquired operations, services and products, which can impact retention of client accounts;
|
|
•
|
failure to achieve expected synergies;
|
|
•
|
diversion of management's attention from other business concerns;
|
|
•
|
assumption of unknown material liabilities of acquired companies, which could become material or subject us to litigation or regulatory risks;
|
|
•
|
amortization of acquired intangible assets, which could reduce future reported earnings; and
|
|
•
|
potential loss of clients or key employees.
|
We cannot be certain that we will be able to identify, consummate and successfully integrate business combinations, and no assurance can be given with respect to the timing, likelihood or business effect of any possible transaction. For example, we could begin negotiations that we subsequently decide to suspend or terminate for a variety of reasons. Also, business combinations are typically subject to closing conditions, including regulatory approvals and the absence of a material adverse change. Therefore, if and when we enter into a business combination agreement, there can be no guarantee that the transaction will close when expected, or at all. If a material transaction does not close, our stock price could decline.
Nevertheless, opportunities arise from time to time that we choose to evaluate. Any transactions that we pursue and consummate would involve these risks and uncertainties, as well as others. The risks of a business combination could result in the failure of the anticipated benefits of that particular combination to be realized, which in turn could have adverse effects on our business, financial condition, results of operations and prospects.
At our risk, we rely on external service providers to perform certain key functions.
We rely on a number of external service providers for certain key technology, processing, service and support functions. These include the services of other broker-dealers, market makers, exchanges and clearinghouses to execute and settle client orders. We contract with external providers for futures and foreign exchange clearing. External content providers provide us with financial information, market news, charts, option and stock quotes, research reports and other fundamental data that we offer to clients. These service providers face technological, operational and security risks of their own. A significant failure by any of them, such as improper use or disclosure of our confidential client, employee or Company information, could interrupt our business, subject us to losses and harm our reputation. Also, our external service providers may rely on others, including subcontractors or cloud computing service providers, to provide services to us, subject to similar risks.
We evaluate external service providers to verify that they can support the stability of our operations and systems. There is no assurance, however, that we will not experience business interruption or loss due to an act or omission of such a service provider. Any significant failures or security breaches by or of our external service providers or their subcontractors, including any actual or perceived cyber attacks, security breaches, fraud, phishing attacks, acts of vandalism, information security breaches and computer viruses that could result in unauthorized access, misuse, loss or destruction of data, interruption in service or other similar events, could interrupt our business, cause us to incur losses, subject us to fines or litigation and harm our reputation. An interruption in or the cessation of service by any external service provider and our inability to make alternative arrangements in a timely manner could have a material impact on our ability to offer products and services, cause us to incur losses, and could lead to a general loss of customer confidence in our security measures and technology infrastructure.
There is no assurance that our external service providers or their subcontractors will be able to continue to provide these services to meet our current needs in an efficient, cost-effective manner or that they will be able to adequately expand their services to meet our needs in the future. Some external service providers have assets located outside the United States that are integral to their service to us. Their ability to continue providing these services is subject to the risks of unfavorable political, economic, legal and other developments such as social or political instability, changes in government policies or changes in laws and regulations.
An interruption in or the cessation of service by an external service provider as a result of systems failure, capacity constraint, financial constraint or other financial problem, unanticipated trading market closure or for any other
16
reason, coupled with our possible inability to make alternative arrangements in a smooth and timely manner, could have adverse effects on our business, financial condition and results of operations. In this connection, we could incur significant additional costs to implement enhanced protective measures and technology, to investigate and remediate vulnerabilities or other exposures or to make required notifications. Switching to an alternative service provider might require a transition period and result in less efficiency.
Employee misconduct, which can be difficult to detect and deter, could harm our reputation and subject us to significant legal liability.
There have been numerous highly-publicized cases of fraud and other misconduct by financial services industry employees. Our employees could engage in misconduct that adversely affects our business. The precautions that we take to detect and deter employee misconduct might not be effective. If one or more of our employees were to improperly access, use or disclose confidential information or engage in other misconduct, we could be subject to regulatory sanctions and suffer serious harm to our financial condition, reputation, client relationships and prospects of attracting additional clients.
Our risk management practices may leave us exposed to unidentified or unanticipated risk.
Our management team is responsible for managing risk, using risk management processes, policies and procedures to identify, measure and manage risks. The risk committee of our board of directors assists the board in its oversight responsibilities relating to the identification, monitoring and assessment of the key risks of the Company, including the significant policies, procedures and practices employed in risk management. Our risk management methods, however, may not identify future risk exposures and may not be completely effective in mitigating our key risks. Furthermore, our risk management methods may not properly identify and mitigate the aggregation of risks across our organization or the interdependency of our risk mitigation efforts. In addition, some of our risk management methods are based on assumptions that could prove to be inaccurate. Failure to manage risk effectively could adversely affect our business, financial condition and results of operations.
The expected phase-out of LIBOR could negatively impact our net interest income and could have other adverse effects.
Certain of the indentures and credit agreements governing our outstanding indebtedness for borrowed money reference LIBOR as the benchmark rate to determine the applicable interest rate or payment amount. We also use LIBOR in some of our financial models. If LIBOR is discontinued after 2021 as expected, there will be uncertainty or differences in the calculation of the applicable interest rate or payment amount, depending on the terms of the governing instruments, and work will be required to transition to using the new benchmark rates and to implement necessary changes to our financial models. This could result in different financial performance for previously booked transactions and may impact our existing transaction data, products, systems, operations and pricing processes. The calculation of interest rates under the replacement benchmarks could also impact our net interest income. In addition, LIBOR may perform differently during the phase-out period than in the past which could result in different interest payments on our outstanding indebtedness.
Risk Factors Relating to the Regulatory and Legislative Environment
New and changing laws, rules, regulations and guidance may have continuing negative impacts on our business and financial results.
New laws, rules, regulations and guidance, or changes in the interpretation and enforcement of existing federal, state, foreign and self-regulatory organization ("SRO") laws, rules, regulations and guidance may directly affect our business and the profitability of the Company or the operation of specific business lines. In addition, new and changing laws, rules, regulation and guidance could result in limitations on the lines of business we conduct, modifications to our business practices, more stringent capital and liquidity requirements or other costs and could limit our ability to return capital to stockholders.
The Dodd-Frank Wall Street Reform and Consumer Protection Act (the "Dodd-Frank Act"), enacted in 2010, required many federal agencies to adopt new rules and regulations applicable to the financial services industry and called for many studies regarding various industry practices. In particular, the Dodd-Frank Act gave the SEC discretion to adopt rules regarding standards of conduct for broker-dealers providing investment advice to retail customers.
17
The U.S. Department of Labor ("DOL") enacted regulations changing the definition of who is an investment advice fiduciary under the Employee Retirement Income Security Act of 1974 (ERISA) and how such advice can be provided to account holders in retirement accounts such as 401(k) plans and Individual Retirement Arrangements (IRAs). The DOL's final rule defining the term "fiduciary" and exemptions related to it in the context of ERISA and retirement accounts was vacated in June 2018 by the U.S. Court of Appeals for the Fifth Circuit. The SEC and several states then proposed heightened standard of conduct regulations, with the SEC adopting such regulations in June 2019.
The rules and interpretations adopted by the SEC in June 2019 include Regulation Best Interest and the new Form CRS Relationship Summary, which are intended to enhance the quality and transparency of retail investors' relationships with broker-dealers and investment advisers. Regulation Best Interest enhances the broker-dealer standard of conduct beyond existing suitability obligations, requiring compliance with disclosure, care, conflict of interest and compliance obligations. The regulation requires that a broker-dealer or natural person who is an associated person of the broker-dealer shall act in the best interest of the retail customer at the time it makes a recommendation of any securities transaction or investment strategy involving securities, prioritizing the interests of the customer above any interests of the broker-dealer or its associated persons. Among other things, this requires the broker-dealer to mitigate conflicts of interest arising from financial incentives in selling securities products. The compliance date for Regulation Best Interest and Form CRS is June 30, 2020.
It is unclear whether Regulation Best Interest will have any preemptive effect on similar existing or forthcoming state-level standard of conduct regulations. These regulations may have a material impact on the provision of investment services to retail investors, including imposing additional compliance, reporting and operational requirements, which could negatively affect our business. These regulations also continue to subject us to an increased risk of class actions and other litigation and regulatory risks. It is not certain what the scope of future rulemaking or interpretive guidance from the SEC and other regulatory agencies may be, how the courts and regulators might interpret these rules and what impact this will have on our compliance costs, business, operations and profitability.
The SEC has adopted National Market System (NMS) Rule 610T to conduct a transaction fee pilot (the “Pilot”) designed to generate data that will help the SEC analyze the effects of exchange transaction fee and rebate pricing models on order routing behavior, execution quality, and market quality generally. Data from the Pilot will be used to facilitate an empirical evaluation of whether the exchange transaction-based fee and rebate structure is operating effectively to further statutory goals and whether there is a need for any potential regulatory action in this area. In March 2019, the SEC issued an order issuing a stay on parts of Rule 610T and the Pilot pending a court decision regarding certain petitions filed by the New York Stock Exchange, Nasdaq and Cboe Global Markets, Inc. for review and further order of the SEC. Any changes arising from the Pilot, as well as other potential regulatory actions, may impact certain of our remuneration arrangements with respect to payment for order flow and rebate structure and may impose additional technological, operational and compliance costs on us and creates uncertainty with regard to their effects.
Our profitability could also be affected by new or modified laws that impact the business and financial communities generally, including changes to the laws governing banking, the securities market, fiduciary duties, conflicts of interest, taxation, electronic commerce, client privacy and security of client data. As existing laws are modified and new laws are implemented, we may incur significant additional costs and have to expend a significant amount of time to develop and integrate appropriate systems and procedures to ensure initial and continuing compliance with such laws. These additional costs could have adverse effects on our profitability.
Failure to comply with net capital requirements could adversely affect our business.
The SEC, FINRA, CFTC, NFA and various other regulatory agencies have stringent rules with respect to the maintenance of specific levels of net capital by securities broker-dealers, FCMs and FDMs. Net capital is a measure of a broker-dealer's, an FCM's or an FDM's readily available liquid assets, reduced by its total liabilities other than approved subordinated debt. Our broker-dealer and FCM/FDM subsidiaries are required to comply with net capital requirements. If we fail to maintain the required net capital, the SEC or the CFTC could suspend or revoke our registration, and FINRA or the NFA could expel us from membership, which could ultimately lead to our liquidation, or they could impose censures, fines or other sanctions. If the net capital rules are changed or expanded, or if there is an unusually large charge against net capital, then our operations that require capital could be limited, and we
18
may not be able to pay dividends or make stock repurchases. A large operating loss or charge against net capital could have adverse effects on our ability to maintain or expand our business.
Extensive regulation and regulatory uncertainties could harm our business.
The securities industry is subject to extensive regulation by federal, state, international government and self-regulatory agencies, and financial services companies are subject to regulations covering all aspects of the securities business. The costs and uncertainties related to complying with these regulations continue to increase. Regulations are intended to ensure the integrity of financial markets, appropriate capitalization of broker-dealers, FCMs and FDMs and the protection of clients and their assets. These regulations often serve to limit our business activities through capital, client protection and market conduct requirements, as well as restrictions on the activities that we are authorized to conduct. Federal, state and foreign regulators, and SROs, among other things, can censure, fine, issue cease-and-desist orders to, suspend or expel a regulated entity or any of its officers or employees. Despite our efforts to comply with applicable legal requirements, there are a number of risks, including in areas where applicable laws or regulations may be unclear or where regulators could revise their previous guidance, and we could fail to establish and enforce procedures to comply with applicable legal requirements and regulations, which could have adverse effects on our business.
Past turmoil in the financial markets has contributed to changes in laws and regulations, heightened scrutiny of the conduct of financial services firms and increasing penalties for violations of applicable laws and regulations. We may be adversely affected by new laws or regulations, changes in the interpretation of existing laws or regulations or more rigorous enforcement. The new laws and regulations may be complex, and we may not have the benefit of regulatory or federal interpretations to guide us in compliance. Changes in laws and regulations or new interpretations of existing laws and regulations also can have adverse effects on our methods and costs of doing business. We also may be adversely affected by other regulatory changes related to suitability of financial products, supervision, sales practices, application of fiduciary standards, best execution and market structure, which could limit the Company's business. Because TD, among other things, owns more than 25% of our common stock, we are considered a non-bank subsidiary of TD under the Bank Holding Company Act of 1956 (the "BHC Act"). As a result, under the BHC Act, we are subject to the supervision and regulation of the Federal Reserve. These banking regulations limit the activities and the types of businesses that we may conduct and the types of companies we may acquire, and under these regulations the Federal Reserve could impose significant limitations on our current business and operations. TD is currently regulated as a "financial holding company" under the BHC Act, which allows TD and us to engage in a much broader set of activities than would otherwise be permitted under the BHC Act. Any failure of TD to maintain its status as a financial holding company could result in substantial limitations on certain of our activities.
Financial services firms are subject to numerous actual or perceived conflicts of interest, as to which regulators and SROs have increased their scrutiny. Addressing conflicts of interest is a complex and difficult undertaking. Our business and reputation could be harmed if we were to fail, or appear to fail, to address conflicts appropriately.
In addition, we use the Internet as a major distribution channel to provide services to our clients. A number of regulatory agencies have adopted regulations regarding client privacy, system security and safeguarding practices and the use of client information by service providers. Additional laws and regulations relating to the Internet and safeguarding practices could be adopted in the future, including laws related to access, identity theft and regulations regarding the pricing, taxation, content and quality of products and services delivered over the Internet. Complying with these laws and regulations may be expensive and time-consuming and could limit our ability to use the Internet as a distribution channel, which would have adverse effects on our business and profitability.
While we maintain systems and procedures designed to ensure that we comply with applicable laws and regulations, violations could still occur. In addition, some legal and regulatory frameworks provide for the imposition of fines or penalties for non-compliance even though the non-compliance was inadvertent or unintentional and even though systems and procedures reasonably designed to prevent violations were in place at the time. There may be other negative consequences resulting from a finding of non-compliance, including restrictions on certain activities. Such a finding may also damage our reputation and our relationships with regulators and could restrict the ability of institutional investment managers to invest in our securities.
19
We are subject to litigation and regulatory investigations and proceedings and may not always succeed in defending against them.
As a participant in the financial services industry, we face substantial litigation and regulatory risks. We are subject to arbitration claims and lawsuits in the ordinary course of our business, as well as class actions and other significant litigation. We also are the subject of inquiries, investigations and proceedings by regulators, other government agencies and SROs. Even if and when we succeed in defending against these actions, the defense may be costly to us.
The SEC, FINRA and other SROs and state securities commissions, among other things, can censure, fine, issue cease-and-desist orders or suspend or expel a broker-dealer or any of its officers or employees. Similarly, state attorneys general can bring legal actions on behalf of the citizens of their states to assure compliance with state laws. Regulatory agencies in countries outside of the U.S. have similar authority. The ability to comply with applicable laws and rules is dependent in part on the establishment and maintenance of a reasonable compliance function. Failure to establish and enforce reasonable compliance procedures, even if unintentional, can subject us to significant losses or disciplinary or other actions.
Actions brought against us may result in settlements, awards, injunctions, fines, penalties and other results adverse to us. Predicting the outcome of such matters is inherently difficult, particularly where claims are brought on behalf of various classes of claimants or by a large number of claimants, when claimants seek substantial or unspecified damages or when investigations or legal proceedings are at an early stage. A substantial judgment, settlement, fine or penalty could be material to our operating results or cash flows for a particular period, depending on our results for that period, or could cause us significant reputational harm, which could harm our business prospects. In market downturns, the volume of legal claims and amount of damages sought in litigation and regulatory proceedings against financial services companies have historically increased.
We also are subject to litigation claims from third parties alleging infringement of their intellectual property rights. Such litigation can require the expenditure of significant resources, regardless of whether the claims have merit. If we were found to have infringed a third-party patent or other intellectual property right, then we could incur substantial liability and in some circumstances could be enjoined from using the relevant technology or providing related products and services, which could have adverse effects on our business and results of operations.
Risk Factors Relating to Owning Our Stock
TD exercises significant influence over us.
As of September 30, 2019, TD owned approximately 43% of our outstanding common stock. As a result, TD generally has the ability to significantly influence the outcome of any matter submitted to a vote of our stockholders and, as a result of its significant share ownership in TD Ameritrade, TD may have the power, subject to applicable law, to significantly influence actions that might be favorable to TD but not necessarily favorable to our other stockholders.
The stockholders agreement provides that TD may designate five of the twelve members of our board of directors, subject to adjustment based on TD's ownership positions in TD Ameritrade. As of September 30, 2019, based on its ownership positions, TD has the right to designate five members of our board of directors. Accordingly, TD is able to significantly influence the outcome of all matters that come before our board.
TD is permitted under the stockholders agreement to exercise voting rights on up to 45% of our outstanding shares of common stock until termination of the stockholders agreement (January 24, 2021). If our stock repurchases cause TD's ownership percentage to exceed 45%, TD is required to use reasonable efforts to sell or dispose of such excess stock, subject to TD's commercial judgment as to the optimal timing, amount and method of sales with a view to maximizing proceeds from such sales. TD has no absolute obligation to reduce its ownership percentage to 45% by the termination of the stockholders agreement. However, prior to and following the termination of the stockholders agreement, TD is required to vote any such excess stock on any matter in the same proportions as all the outstanding shares of stock held by holders other than TD and its affiliates are voted. In no event may TD Ameritrade repurchase shares of its common stock that would result in TD's ownership percentage exceeding 47%. There is no restriction on the number of shares TD may own following the termination of the stockholders agreement.
20
The ownership position and governance rights of TD could also discourage a third party from proposing a change of control or other strategic transaction concerning TD Ameritrade. As a result, our common stock could trade at prices that do not reflect a "takeover premium" to the same extent as do the stocks of similarly situated companies that do not have a stockholder with an ownership interest as large as TD's ownership interest.
We have extensive relationships and business transactions with TD and some of its affiliates, which if terminated or adversely modified could have a material adverse effect on our business, financial condition and results of operations.
The insured deposit account agreement between us and affiliates of TD accounts for a significant portion of our revenue. This agreement enables our clients to invest in an FDIC-insured (up to specified limits) deposit product without the need for us to establish the significant levels of capital that would be required to maintain our own bank charter. During fiscal year 2019, net revenues related to this agreement accounted for approximately 27% of our net revenues. This percentage is expected to increase in fiscal year 2020 as a result of the decrease in commissions and transaction fees on client trades. The termination or adverse modification of this agreement without replacing it on comparable terms with different counterparties, which may not be available, could have a material adverse effect on our business, financial condition and results of operations. If this agreement were terminated or adversely modified and we were permitted to establish our own bank charter for purposes of offering an FDIC-insured deposit product, we would be required to establish and maintain significant levels of capital within a bank subsidiary. We would also be subject to various other risks associated with banking, including credit risk on loans and investments, liquidity risk associated with bank balance sheet management, operational risks associated with banking systems and infrastructure and additional regulatory requirements and supervision.
When conflicts of interest arise between TD Ameritrade and TD, they might be resolved in a manner that adversely affects our business, financial condition or results of operations.
Conflicts of interest may arise between us and TD in areas relating to a variety of past, ongoing and future relationships and contracts, including corporate opportunities, potential acquisitions or financing transactions, sales or other dispositions by TD of its interests in TD Ameritrade and the exercise by TD of its influence over our management and affairs. Some of the directors on our board are also officers or directors of TD or its subsidiaries. Service as a director or officer of both TD Ameritrade and TD or its other subsidiaries could create conflicts of interest when such directors or officers are faced with decisions that could have materially different implications for us and for TD. Our amended and restated certificate of incorporation contains provisions relating to the avoidance of direct competition between us and TD. In addition, a committee of our board consisting of outside independent directors reviews and approves or ratifies transactions with TD and its affiliates. There can be no assurance that any of the foregoing potential conflicts would be resolved in a manner that does not adversely affect our business, financial condition or results of operations. In addition, the provisions of the stockholders agreement related to non-competition are subject to numerous exceptions and qualifications and may not prevent us and TD from competing with each other to some degree.
The terms of the stockholders agreement, our charter documents and Delaware law could inhibit a takeover that stockholders may consider favorable.
Provisions in the stockholders agreement between TD and the Company, our certificate of incorporation and bylaws and Delaware law will make it difficult for any party to acquire control of us in a transaction not approved by the requisite number of directors. These provisions include:
|
•
|
the presence of a classified board of directors;
|
|
•
|
the ability of the board of directors to issue and determine the terms of preferred stock;
|
|
•
|
advance notice requirements for inclusion of stockholder proposals at stockholder meetings; and
|
|
•
|
the anti-takeover provisions of Delaware law.
|
These provisions could delay, deter or prevent a change of control or change in management that might provide stockholders with a premium to the market price of their common stock.
21
The market price of our common stock has experienced, and may continue to experience, substantial volatility.
Our common stock, and the U.S. securities markets in general, have been and are subject to substantial price volatility. The price of our common stock has been known to decrease substantially and quickly. Among the factors that may affect our stock price are the following:
|
•
|
speculation in the investment community or the press about, or actual changes in, our competitive position, organizational structure, executive team, operations, financial condition, financial reporting and results, effectiveness of cost reduction initiatives, or strategic transactions;
|
|
•
|
the announcement of new products, services, acquisitions, or dispositions by us or our competitors;
|
|
•
|
the pricing structure for products and services offered to customers by us or our competitors;
|
|
•
|
our exposure to changes in prevailing interest rates;
|
|
•
|
sales of a substantial number of shares of our common stock by (i) TD or (ii) J. Joe Ricketts, our founder, and certain members of his family and trusts held for their benefit, who currently have registration rights covering approximately 234 million shares and 52 million shares, respectively, of our common stock; and
|
|
•
|
increases or decreases in revenue or earnings, changes in earnings estimates by the investment community, changes in the interest rate environment or in market expectations regarding the interest rate environment and variations between estimated financial results and actual financial results.
|
Changes in the stock market generally or as it concerns our industry, as well as geopolitical, economic, and business factors unrelated to us, may also affect our stock price.
Because the market price of our common stock can fluctuate significantly, we could become the object of securities class action litigation, which could result in substantial costs and a diversion of management's attention and resources and could have adverse effects on our business and the price of our common stock.
We are restricted by the terms of our revolving credit facilities and senior notes.
Our senior unsecured revolving credit facilities contain various covenants and restrictions that may, in certain circumstances and subject to carveouts and exceptions, which may be material, limit our ability to:
|
•
|
create liens;
|
|
•
|
incur additional indebtedness;
|
|
•
|
change the nature of our business;
|
|
•
|
merge or consolidate with another entity;
|
|
•
|
sell all or substantially all of our assets; and
|
|
•
|
conduct transactions with affiliates.
|
Under our revolving credit facilities, we are also required to maintain compliance with a maximum consolidated leverage ratio covenant (not to exceed 3.00:1.00) and a minimum consolidated interest coverage ratio covenant (not less than 4.00:1:00). TDAC is required to maintain compliance with a minimum consolidated tangible net worth covenant and our broker-dealer and FCM/FDM subsidiaries are required to maintain compliance with minimum regulatory net capital covenants.
Our senior unsecured notes contain various covenants and restrictions that may, in certain circumstances and subject to carveouts and exceptions, which may be material, limit our ability to:
|
•
|
create liens;
|
|
•
|
merge or consolidate with another entity; and
|
|
•
|
sell all or substantially all of our assets.
|
As a result of the covenants and other restrictions contained in our revolving credit facilities and our senior unsecured note indentures, we are limited in how we conduct our business. We cannot guarantee that we will be able to remain in compliance with these covenants and other restrictions or be able to obtain waivers for noncompliance in the
22
future. Failure to comply with the covenants and other restrictions contained in our debt instruments could have material adverse effects on our financial condition and business by impairing our ability to continue financing our business.
Of particular significance, we could be forced to repay immediately and in full any outstanding borrowings under our revolving credit facilities and our senior unsecured notes if we were to breach our covenants and not cure our breach, even if we could otherwise satisfy our debt service obligations. Also, if we experience a change of control, as defined in our revolving credit facilities, we could be required to repay in full all loans outstanding thereunder, plus accrued interest and fees.
Our ability to make scheduled payments on or to refinance our debt obligations depends on our financial condition, our results of operations and our ability to receive dividend payments from our subsidiaries, which are subject to business, economic and competitive conditions, regulatory requirements and other factors beyond our control. If our cash flows and capital resources were insufficient to fund our debt service obligations, then we could be forced to reduce or delay investments and capital expenditures, or to sell assets, seek additional capital or restructure or refinance our indebtedness. These alternative measures might not succeed and might not permit us to satisfy our scheduled debt service obligations. In addition, the terms of our existing or future debt instruments could restrict us from adopting some of these alternatives.
Any failure to make payments of interest and principal on our outstanding indebtedness on a timely basis would likely result in a reduction of our credit rating, which could harm our ability to obtain additional financing. In addition, any future indebtedness could be at a higher interest rate or include covenants that are more restrictive than our current covenants.
Our corporate debt level may limit our ability to obtain additional financing.
As of September 30, 2019 we had approximately $3.55 billion of long-term debt, consisting of:
|
•
|
$600 million of variable-rate Senior Notes with principal due in full on November 1, 2021;
|
|
•
|
$750 million of 2.950% Senior Notes with principal due in full on April 1, 2022;
|
|
•
|
$400 million of 3.750% Senior Notes with principal due in full on April 1, 2024;
|
|
•
|
$500 million of 3.625% Senior Notes with principal due in full on April 1, 2025;
|
|
•
|
$800 million of 3.300% Senior Notes with principal due in full on April 1, 2027; and
|
|
•
|
$500 million of 2.750% Senior Notes with principal due in full on October 1, 2029.
|
Our ability to meet our cash requirements, including our debt repayment obligations, is dependent upon our future performance, which will be subject to financial, business and other factors affecting our operations, many of which are or may be beyond our control. We cannot provide assurance that our business will generate sufficient cash flows from operations to fund our cash requirements. If we are unable to meet our cash requirements from operations, we would be required to obtain alternative financing. The degree to which we may be leveraged as a result of the indebtedness we have incurred could materially and adversely affect our ability to obtain financing for working capital, acquisitions or other purposes, could make us more vulnerable to industry downturns and competitive pressures or could limit our flexibility in planning for, or reacting to, changes and opportunities in our industry, which may place us at a competitive disadvantage. There can be no assurance that we would be able to obtain alternative financing, that any such financing would be on acceptable terms or that we would be permitted to do so under the terms of existing financing arrangements. In the absence of such financing, our ability to respond to changing business and economic conditions, make future acquisitions, react to adverse operating results, meet our debt repayment obligations or fund required capital expenditures could be materially and adversely affected.
Our business, financial position, and results of operations could be harmed by adverse rating actions by credit rating agencies.
If our counterparty credit rating or the credit ratings of our outstanding indebtedness are downgraded, or if rating agencies indicate that a downgrade may occur, then perceptions of our financial strength could be damaged and our business, financial condition and results of operations could be adversely affected. A downgrade would have the
23
effect of increasing our incremental borrowing costs and could decrease the availability of funds for borrowing. A downgrade also could adversely affect our relationships with clients.
Our future ability to pay regular dividends to holders of our common stock is subject to the discretion of our board of directors and will be limited by our ability to generate sufficient earnings and cash flows.
Payment of future dividends will be at the discretion of our board of directors and will depend upon a number of factors that the board deems relevant, including future earnings, the success of our business activities, capital and liquidity requirements, the general financial condition and future prospects of our business and general business conditions. If we are unable to generate sufficient earnings and cash flows from our business, then we may not be able to pay dividends on our common stock. Even with sufficient earnings and cash flows from our business, our board of directors might exercise its discretion by not declaring dividends, although failure to declare and pay dividends could adversely affect the price of our common stock.
In addition, our ability to pay dividends is subject to statutory and regulatory limitations. In particular, our ability to pay dividends depends on the ability of our subsidiaries to pay dividends. In this connection, some of our subsidiaries are subject to requirements of the SEC, FINRA, the CFTC, the NFA and other regulators relating to liquidity, capital standards and the use of client funds and securities, which may limit funds available for the payment of dividends to the parent company.
Future sales of equity securities could adversely affect the market price of our common stock and result in dilution.
Our certificate of incorporation authorizes our board of directors to issue additional shares of common stock and to issue shares of preferred stock, without stockholder approval. We could issue additional equity securities to raise additional capital or for other purposes. The issuance of additional equity securities could dilute the interests of the holders of our common stock (including TD, except to the extent that TD exercises its right under the stockholders agreement to maintain its proportionate share of our common stock) and could adversely affect the market price of that stock.
Item 1B.
Unresolved Staff Comments
None.
Item 2.
Properties
Our Company-owned corporate headquarters facility is located in Omaha, Nebraska and provides more than 500,000 square feet of building space. Our headquarters facility has earned Leadership in Energy and Environmental Design (LEED) Platinum Certification, the highest level of distinction awarded by the U.S. Green Building Council. We also lease approximately 80,000 square feet of building space on property adjacent to the headquarters for administrative and operational facilities. These leases expire in 2020. We own additional administrative and operational facilities located in St. Louis, Missouri and Southlake, Texas, which provide a total of approximately 600,000 square feet of building space.
We currently lease approximately 195,000 square feet of building space for an additional operation center in Jersey City, New Jersey. During fiscal year 2019, we entered into a new lease of approximately 210,000 square feet of building space in Jersey City, New Jersey. We plan to transition the existing operation center in Jersey City to the new location upon the expiration of the current lease in 2020. We lease smaller administrative and operational facilities in California, Colorado, Illinois, Maryland, Massachusetts, Michigan, Texas and Utah. We own one data center facility, located in Richardson, Texas and we lease two data center facilities located in New Jersey. We also lease more than 275 retail branch offices, located in 47 states and the District of Columbia. We believe that our facilities are suitable and adequate to meet our needs.
Item 3.
Legal Proceedings
For information regarding legal proceedings, see Note
16
—
Commitments and Contingencies
– "
Legal and Regulatory Matters
" under Item 8, Financial Statements and Supplementary Data — Notes to Consolidated Financial Statements.
24
Item 4.
Mine Safety Disclosures
Not applicable.
|
Item 5.
|
Market for Registrant's Common Equity, Related Stockholder Matters and Issuer Purchases of Equity Securities
|
Price Range of Common Stock
Our common stock trades on the Nasdaq Global Select Market under the symbol "AMTD." The closing sale price of our common stock as reported on the Nasdaq Global Select Market on November 1,
2019
was $39.21 per share. As of that date there were 576 holders of record of our common stock based on information provided by our transfer agent. The number of stockholders of record does not reflect the number of individual or institutional stockholders that beneficially own our stock because most stock is held in the name of nominees. Based on information available to us, we believe there are approximately 106,000 beneficial holders of our common stock.
Dividends
We declared and paid a $0.30 per share and a $0.21 per share quarterly cash dividend on our common stock during each quarter of fiscal years
2019
and
2018
, respectively. We recently declared a $0.31 per share quarterly cash dividend for the first quarter of fiscal
2020
. We are scheduled to pay the quarterly cash dividend on November 19,
2019
to all holders of record of our common stock as of November 5,
2019
. The payment of any future dividends will be at the discretion of our board of directors and will depend upon a number of factors that the board of directors deems relevant, including future earnings, the success of our business activities, capital requirements, the general financial condition and future prospects of our business and general business conditions.
Our ability to pay cash dividends on our common stock is also dependent on the ability of our subsidiaries to pay dividends to the parent company. Some of our subsidiaries are subject to requirements of the SEC, FINRA, the CFTC, the NFA and other regulators relating to liquidity, capital standards and the use of client funds and securities, which may limit funds available for the payment of dividends to the parent company. See Item 7, Management's Discussion and Analysis of Results of Operations and Financial Condition — "Liquidity and Capital Resources" for further information.
Securities Authorized for Issuance Under Equity Compensation Plans
Information about securities authorized for issuance under the Company's equity compensation plans is contained in Item 12 — Security Ownership of Certain Beneficial Owners and Management and Related Stockholder Matters.
25
Performance Graph
The following Company common stock performance information is not deemed to be
"
soliciting material
"
or to be
"
filed
"
with the SEC or subject to the SEC's proxy rules or to the liabilities of Section 18 of the Exchange Act and shall not be deemed to be incorporated by reference into any prior or subsequent filing by the Company under the Securities Act of 1933, as amended, or the Exchange Act.
The following graph and table set forth information comparing the cumulative total return through the end of the Company's most recent
fiscal year from a $
100 investment on September 30, 2014 in the Company's common stock, a broad-based stock index and the stocks comprising an industry peer group.
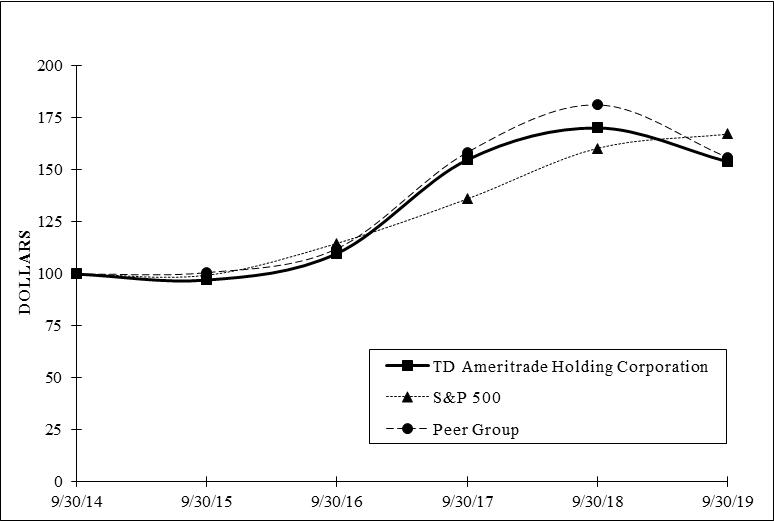
|
Period Ended
|
||||||||||||
|
Index
|
9/30/14
|
9/30/15
|
9/30/16
|
9/30/17
|
9/30/18
|
9/30/19
|
||||||
|
TD Ameritrade Holding Corporation
|
100.00
|
|
97.06
|
|
109.83
|
|
154.84
|
|
170.21
|
|
153.97
|
|
|
S&P 500
|
100.00
|
|
99.39
|
|
114.72
|
|
136.07
|
|
160.44
|
|
167.27
|
|
|
Peer Group
|
100.00
|
|
100.65
|
|
112.14
|
|
158.44
|
|
181.33
|
|
156.01
|
|
The Peer Group is comprised of the following companies that have significant retail brokerage operations:
E*TRADE Financial Corporation
The Charles Schwab Corporation
26
Purchases of Equity Securities by the Issuer and Affiliated Purchasers
ISSUER PURCHASES OF EQUITY SECURITIES
|
Period
|
Total
Number of
Shares
Purchased
|
Average Price Paid per
Share
|
Total Number
of Shares
Purchased as
Part of Publicly
Announced
Program
|
Maximum Number
of Shares that May
Yet Be Purchased
Under the Program
|
|||||||||
|
July 1, 2019 — July 31, 2019
|
1,676,765
|
|
$
|
51.14
|
|
1,636,846
|
|
5,765,029
|
|
||||
|
August 1, 2019 — August 31, 2019
|
2,827,815
|
|
$
|
51.30
|
|
2,826,865
|
|
2,938,164
|
|
||||
|
September 1, 2019 — September 30, 2019
|
1,386,392
|
|
$
|
48.01
|
|
1,383,955
|
|
31,554,209
|
|
||||
|
Total — Three months ended September 30, 2019
|
5,890,972
|
|
$
|
50.48
|
|
5,847,666
|
|
31,554,209
|
|
||||
On November 20, 2015, our board of directors authorized the repurchase of up to 30 million shares of our common stock. We disclosed this authorization on November 20, 2015 in our annual report on Form 10-K. On September 11, 2019, our board of directors authorized the repurchase of up to an additional 30 million shares of our common stock. We disclosed this authorization in our Form 8-K filed on October 21, 2019. These programs were the only stock repurchase programs in effect and no programs expired during the fourth quarter of fiscal
2019
.
During the quarter ended September 30,
2019
, 43,306 shares were repurchased primarily from employees for income tax withholding in connection with distributions of stock-based compensation.
Item 6.
Selected Financial Data
|
Fiscal Year Ended September 30,
|
||||||||||||||||||||
|
2019
|
2018*
|
2017
|
2016
|
2015
|
||||||||||||||||
|
(In millions, except per share amounts)
|
||||||||||||||||||||
|
Consolidated Statements of Income Data:
|
||||||||||||||||||||
|
Net revenues
|
$
|
6,016
|
|
$
|
5,452
|
|
$
|
3,676
|
|
$
|
3,327
|
|
$
|
3,247
|
|
|||||
|
Operating income
|
3,001
|
|
1,998
|
|
1,466
|
|
1,318
|
|
1,325
|
|
||||||||||
|
Net income
|
2,208
|
|
1,473
|
|
872
|
|
842
|
|
813
|
|
||||||||||
|
Earnings per share — basic
|
$
|
3.98
|
|
$
|
2.60
|
|
$
|
1.65
|
|
$
|
1.59
|
|
$
|
1.50
|
|
|||||
|
Earnings per share — diluted
|
$
|
3.96
|
|
$
|
2.59
|
|
$
|
1.64
|
|
$
|
1.58
|
|
$
|
1.49
|
|
|||||
|
Weighted average shares outstanding — basic
|
555
|
|
567
|
|
529
|
|
531
|
|
543
|
|
||||||||||
|
Weighted average shares outstanding — diluted
|
557
|
|
569
|
|
531
|
|
534
|
|
547
|
|
||||||||||
|
Dividends declared per share
|
$
|
1.20
|
|
$
|
0.84
|
|
$
|
0.72
|
|
$
|
0.68
|
|
$
|
0.60
|
|
|||||
|
As of September 30,
|
||||||||||||||||||||
|
2019
|
2018
|
2017*
|
2016
|
2015
|
||||||||||||||||
|
(In millions)
|
||||||||||||||||||||
|
Consolidated Balance Sheet Data:
|
||||||||||||||||||||
|
Cash and cash equivalents
|
$
|
2,852
|
|
$
|
2,690
|
|
$
|
1,472
|
|
$
|
1,855
|
|
$
|
1,978
|
|
|||||
|
Investments available-for-sale, at fair value
|
1,668
|
|
484
|
|
746
|
|
757
|
|
—
|
|
||||||||||
|
Total assets
|
43,786
|
|
37,520
|
|
38,627
|
|
28,818
|
|
26,375
|
|
||||||||||
|
Long-term debt and other borrowings
|
3,594
|
|
2,535
|
|
2,652
|
|
1,817
|
|
1,800
|
|
||||||||||
|
Stockholders' equity
|
8,700
|
|
8,003
|
|
7,247
|
|
5,051
|
|
4,903
|
|
||||||||||
* The growth in our Consolidated Balance Sheet as of September 30, 2017 and Statement of Income for the fiscal year ended 2018 was primarily due to our acquisition of Scottrade on September 18, 2017.
27
Item 7.
Management's Discussion and Analysis of Financial Condition and Results of Operations
This discussion contains forward-looking statements within the meaning of the U.S. Private Securities Litigation Reform Act of 1995. Statements that are not historical facts, including statements about our beliefs and expectations, are forward-looking statements. Forward-looking statements include statements preceded by, followed by or that include the words "may," "could," "would," "should," "believe," "expect," "anticipate," "plan," "estimate," "target," "project," "intend" and similar words or expressions. In particular, forward-looking statements contained in this discussion include our expectations regarding: the effect of client trading activity on our results of operations; the effect of changes in interest rates on our net interest spread; the amount of net revenues; the impact of reducing commissions on our online exchange-listed stock, exchange traded funds ("ETF") (domestic and Canadian) and option trades; the amounts of total operating expenses, amortization of acquired intangible assets and advertising expense; our effective income tax rate; our capital and liquidity needs and our plans to finance such needs; and our plans to return capital to stockholders through cash dividends and share repurchases.
The Company's actual results could differ materially from those anticipated in such forward-looking statements. Important factors that may cause such differences include, but are not limited to:
economic, social and political conditions and other securities industry risks; interest rate risks; liquidity risks; client and counterparty credit risks; clearing function risks; systemic risk; aggressive competition; information system risks, network security risks; investment advisory services risks; merger and acquisition risks; external service provider risks; employee misconduct risks; LIBOR phase-out risks; new laws, rules, regulations and regulatory guidance affecting our business; net capital requirements; extensive regulation and regulatory uncertainties; and litigation, investigations and proceedings involving our business.
We also are subject to other risks, uncertainties and assumptions set forth under Item 1A
—
Risk Factors of this Form 10-K, as well as the risk that our risk management practices may leave us exposed to unidentified or unanticipated risks. The forward-looking statements contained in this report speak only as of the date on which they were made. We undertake no obligation to publicly update or revise such statements, whether as a result of new information, future events or otherwise, except to the extent required by the federal securities laws.
Glossary of Terms
In discussing and analyzing our business, we utilize several metrics and other terms that are defined in the following Glossary of Terms.
Italics
indicate other defined terms that appear elsewhere in the Glossary. The term "GAAP" refers to U.S. generally accepted accounting principles.
Asset-based revenues —
Revenues consisting of (1)
bank deposit account
fees
, (2)
net interest revenue
and (3)
investment product fees
. The primary factors driving our asset-based revenues are average balances and average rates. Average balances consist primarily of average client bank deposit account balances, average
client margin balances
, average
segregated cash
balances, average
client credit balances
, average
fee-based investment balances
and average
securities borrowing
and
securities lending
balances. Average rates consist of the average interest rates and fees earned and paid on such balances.
Average client trades per day — Total trades
divided by the number of
trading days
in the period. This metric is also known as
daily average revenue trades
("
DARTs
").
Average commissions per trade
—
Total commissions and transaction fee revenues as reported on our consolidated financial statements, less
order routing revenue,
divided by
total trades
for the period.
Commissions and transaction fee
revenues primarily consist of trading commissions,
order routing revenue
and markups on riskless principal transactions in fixed-income securities.
Basis point
— When referring to interest rates, one basis point represents one one-hundredth of one percent.
Bank deposit account fees
— Revenues generated from a sweep program that is offered to eligible clients of the Company whereby clients' uninvested cash is swept to FDIC-insured (up to specified limits) money market deposit accounts at affiliated and non-affiliated third-party financial institutions participating in the program.
Beneficiary accounts — Brokerage accounts
managed by a custodian, guardian, conservator or trustee on behalf of one or more beneficiaries. Examples include accounts maintained under the Uniform Gift to Minors Act (UGMA) or Uniform Transfer to Minors Act (UTMA), guardianship, conservatorship and trust arrangements and pension or profit plan for small business accounts.
28
Brokerage accounts
—
Accounts maintained by us on behalf of clients for securities brokerage activities. The primary types of brokerage accounts are
cash accounts, margin accounts, IRA accounts
and
beneficiary accounts. Futures accounts
are sub-accounts associated with a brokerage account for clients who want to trade futures and/or options on futures.
Forex accounts
are sub-accounts associated with a brokerage account for clients who want to engage in foreign exchange trading.
Cash accounts — Brokerage accounts
that do not have
margin account
approval.
Client assets
—
The total value of cash and securities in
brokerage accounts.
Client cash and money market assets —
The sum of all client cash balances, including
client credit balances
and client cash balances swept into
bank deposit accounts
or money market mutual funds.
Client credit balances
— Client cash held in
brokerage accounts,
excluding balances generated by client short sales on which no interest is paid. Interest paid on client credit balances is a reduction of
net interest revenue.
Client credit balances are included in "payable to clients" on our consolidated financial statements.
Client margin balances
— The total amount of cash loaned to clients in
margin accounts.
Such loans are secured by client assets. Interest earned on client margin balances is a component of
net interest revenue.
Client margin balances are included in "receivable from clients, net" on our consolidated financial statements.
Commissions and transaction fees
— Revenues earned on trading commissions,
order routing revenue
and markups on riskless principal transactions in fixed-income securities. Revenues earned on trading commissions includes client trades in common and preferred stock, ETFs, exchange-traded notes, closed-end funds, options, futures, foreign exchange, mutual funds and fixed income securities.
Consolidated duration
— The weighted average remaining years until maturity of our
spread-based assets
. For purposes of this calculation, floating rate balances are treated as having a one-month duration. Consolidated duration is used in analyzing our aggregate interest rate sensitivity.
Daily average revenue trades
("
DARTs
")
—
Total trades
divided by the number of
trading days
in the period. This metric is also known as
average client trades per day.
EBITDA
—
EBITDA (earnings before interest, taxes, depreciation and amortization) is a non-GAAP financial measure. We consider EBITDA to be an important measure of our financial performance and of our ability to generate cash flows to service debt, fund capital expenditures and fund other corporate investing and financing activities. EBITDA is used as the denominator in the consolidated leverage ratio calculation for covenant purposes under our senior revolving credit facility. EBITDA eliminates the non-cash effect of tangible asset depreciation and amortization and intangible asset amortization. EBITDA should be considered in addition to, rather than as a substitute for, GAAP pre-tax income, net income and cash flows from operating activities.
Fee-based investment balances
— Client assets invested in money market mutual funds, other mutual funds and our programs such as AdvisorDirect,
®
Essential Portfolios,
Selective Portfolios and Personalized Portfolios on which we earn fee revenues. Fee revenues earned on these balances are included in "
investment product fees
" on our consolidated financial statements.
Forex accounts
— Sub-accounts maintained by us on behalf of clients for foreign exchange trading. Each forex account must be associated with a
brokerage account
. Forex accounts are not counted separately for purposes of our client account metrics.
Funded accounts
— All open client accounts with a total
liquidation value
greater than zero.
Futures accounts
— Sub-accounts maintained by us on behalf of clients for trading in futures and/or options on futures. Each futures account must be associated with a
brokerage account
. Futures accounts are not counted separately for purposes of our client account metrics.
Insured Deposit Account
— We are party to an Insured Deposit Account ("IDA") agreement with TD Bank USA, N.A. ("TD Bank USA"), TD Bank, N.A. and The Toronto-Dominion Bank ("TD"). Under the IDA agreement, TD Bank USA and TD Bank, N.A. (together, the "TD Depository Institutions") make available to our clients FDIC-insured (up to specified limits) money market deposit accounts as either designated sweep vehicles or as non-sweep deposit accounts. We provide marketing, recordkeeping and support services for the TD Depository Institutions with respect to the money market deposit accounts. In exchange for providing these services, the TD Depository
29
Institutions pay us an aggregate marketing fee based on the weighted average yield earned on the client IDA assets, less the actual interest paid to clients, a servicing fee to the TD Depository Institutions and the cost of FDIC insurance premiums. Fee revenues earned under this agreement are included in "
bank deposit account fees
" on our consolidated financial statements.
Interest-earning assets
— Consist of
client margin balances,
segregated cash
, deposits paid on
securities borrowing
and other cash and interest-earning investment balances.
Interest rate-sensitive assets
— Consist of
spread-based assets
and client cash invested in money market mutual funds.
Investment product fees
—
Revenues earned on
fee-based investment balances
. Investment product fees consists of fees earned on client assets invested in money market mutual funds, other mutual funds and through investment programs such as AdvisorDirect,
®
Essential Portfolios, Selective Portfolios and Personalized Portfolios.
Investment product fees also includes fees earned on client assets managed by independent registered investment advisors utilizing our trading and investing platforms.
IRA accounts (Individual Retirement Arrangements)
— A personal trust account for the exclusive benefit of a U.S. individual (or his or her beneficiaries) that provides tax advantages in accumulating funds to save for retirement or other qualified purposes. These accounts are subject to numerous restrictions on additions to and withdrawals from the account, as well as prohibitions against certain investments or transactions conducted within the account. We offer traditional, Roth, Savings Incentive Match Plan for Employees (SIMPLE) and Simplified Employee Pension (SEP) IRA accounts.
Liquid assets
—
Liquid assets is a non-GAAP financial measure that we consider to be an important measure of our liquidity. Liquid assets may be utilized for general corporate purposes and is defined as the sum of (1) corporate cash and cash equivalents, (2) corporate investments, less securities sold under agreements to repurchase, and (3) our regulated subsidiaries' net capital in excess of minimum operational targets established by management. Corporate cash and cash equivalents includes cash and cash equivalents from our investment advisory subsidiaries. Liquid assets represents available capital, including any capital from our regulated subsidiaries in excess of established management operational targets. We include the excess capital of our regulated subsidiaries in the calculation of liquid assets, rather than simply including regulated subsidiaries' cash and cash equivalents, because capital requirements may limit the amount of cash available for dividend from the regulated subsidiaries to the parent company. Net capital in excess of minimum operational targets established by management is generally available for dividend from the regulated subsidiaries to the parent company. Liquid assets is based on more conservative measures of net capital than regulatory requirements because we generally manage to higher levels of net capital at our regulated subsidiaries than the regulatory thresholds require. Liquid assets should be considered as a supplemental measure of liquidity, rather than as a substitute for GAAP cash and cash equivalents.
Liquidation value
— The net value of a client's account holdings as of the close of a regular trading session. Liquidation value includes client cash and the value of long security positions, less margin balances and the cost to buy back short security positions. It also includes the value of open futures, foreign exchange and options positions.
Margin accounts
—
Brokerage accounts
in which clients may borrow from us to buy securities or for any other purpose, subject to regulatory and Company-imposed limitations.
Net interest margin
("
NIM
")
—
A measure of the net yield on our average
spread-based assets
. Net interest margin is calculated for a given period by dividing the annualized sum of
bank deposit account
fees and
net interest revenue
by average
spread-based assets
.
Net interest revenue
—
Net interest revenue is interest revenues less brokerage interest expense. Interest revenues are generated by charges to clients on margin balances maintained in
margin accounts,
the investment of cash from operations and
segregated cash
and interest earned on
securities borrowing/securities lending
. Brokerage interest expense consists of amounts paid or payable to clients based on credit balances maintained in
brokerage accounts
and interest incurred on
securities borrowing/securities lending
. Brokerage interest expense does not include interest on our non-brokerage borrowings.
Net new assets
—
Consists of total client asset inflows, less total client asset outflows, excluding activity from business combinations. Client asset inflows include interest and dividend payments and exclude changes in
client
30
assets
due to market fluctuations. Net new assets are measured based on the market value of the assets as of the date of the inflows and outflows.
Net new asset growth rate (annualized)
—
Annualized
net new assets
as a percentage of
client assets
as of the beginning of the period.
Non-GAAP Net Income and Non-GAAP Diluted EPS
— Non-GAAP net income and non-GAAP diluted earnings per share ("EPS") are non-GAAP financial measures. We define non-GAAP net income as net income adjusted to remove the after-tax effect of amortization of acquired intangible assets and acquisition-related expenses. We consider non-GAAP net income and non-GAAP diluted EPS as important measures of our financial performance because they exclude certain items that may not be indicative of our core operating results and business outlook and may be useful in evaluating the operating performance of the business and facilitating a meaningful comparison of our results in the current period to those in prior and future periods. Amortization of acquired intangible assets is excluded because management does not believe it is indicative of our underlying business performance. Acquisition-related expenses are excluded as these costs are not representative of the costs of running our on-going business. Non-GAAP net income and non-GAAP diluted EPS should be considered in addition to, rather than as a substitute for, GAAP net income and GAAP diluted EPS.
Order routing revenue
— Revenues generated from payments and/or rebates received from market centers. Order routing revenue is a component of
transaction-based revenues
.
Securities borrowing
—
We borrow securities temporarily from other broker-dealers in connection with our broker-dealer business. We deposit cash as collateral for the securities borrowed, and generally earn interest revenue on the cash deposited with the counterparty. We also incur interest expense for borrowing certain securities.
Securities lending
—
We loan securities temporarily to other broker-dealers in connection with our broker-dealer business. We receive cash as collateral for the securities loaned, and generally incur interest expense on the cash deposited with us. We also earn revenue for lending certain securities.
Securities sold under agreements to repurchase (repurchase agreements)
—
We sell securities to counterparties with an agreement to repurchase the same or substantially the same securities at a stated price plus interest on a specified date. We utilize repurchase agreements to finance our short-term liquidity and capital needs. Under these financing transactions, we receive cash from counterparties and provide U.S. Treasury securities as collateral.
Segregated cash
—
Client cash and investments segregated in compliance with Rule 15c3-3 of the Securities Exchange Act of 1934 (the Customer Protection Rule) and other regulations. Interest earned on segregated cash is a component of
net interest revenue.
Spread-based assets
—
Client and brokerage-related asset balances, consisting of
bank deposit account
balances and
interest-earning assets
. Spread-based assets is used in the calculation of our
net interest margin
and our
consolidated duration
.
Total trades
—
Revenue-generating client securities trades, which are executed by our broker-dealer and FCM/FDM subsidiaries. Total trades are a significant source of our revenues. Such trades include, but are not limited to, trades in equities, options, futures, foreign exchange, mutual funds and debt instruments. Trades generate revenue from commissions, markups on riskless principal transactions in fixed income securities, transaction fees and/or
order routing revenue
.
Trading days
—
Days in which the U.S. equity markets are open for a full trading session. Reduced exchange trading sessions are treated as half trading days.
Transaction-based revenues
—
Revenues generated from client trade execution, consisting primarily of commissions, markups on riskless principal transactions in fixed income securities, transaction clearing fees and
order routing revenue
.
Financial Statement Overview
We provide securities brokerage and clearing services to our clients through our introducing and clearing broker-dealer subsidiaries. We also provide futures and foreign exchange trade execution services to our clients through our futures commission merchant ("FCM") and forex dealer member ("FDM") subsidiary. Substantially all of our net revenues are derived from our brokerage activities and clearing and execution services. Our primary focus is
31
serving retail investors and traders and independent registered investment advisors by providing services with straightforward, affordable pricing.
Our largest sources of revenues are asset-based revenues and transaction-based revenues. The primary factors driving our asset-based revenues are average balances and average rates. Average balances consist primarily of average client bank deposit account balances, average client margin balances, average segregated cash balances, average client credit balances, average fee-based investment balances and average securities borrowing and lending balances. Average rates consist of the average interest rates and fees earned and paid on such balances. The primary factors driving our transaction-based revenues are total client trades and average commissions per trade. Effective October 3, 2019, we reduced our online exchange-listed stock, exchange traded funds (ETF) (domestic and Canadian) and option trade commissions from $6.95 to $0 per trade (plus $0.65 per contract and no exercise or assignment fees on option trades). For information regarding the expected impact of these price reductions to our net revenues, see "Results of Operations" later in this section. We also receive order routing revenue, which results from arrangements we have with many market centers to receive cash payments and/or rebates in exchange for routing orders to these firms for execution. Order routing revenue is included in commissions and transaction fees on our consolidated financial statements.
Our largest operating expense generally is employee compensation and benefits. Employee compensation and benefits expense includes salaries, bonuses, stock-based compensation, group insurance, contributions to benefit programs, recruitment, severance and other related employee costs.
Clearing and execution costs include incremental third-party expenses that tend to fluctuate as a result of fluctuations in client accounts or trades. Examples of expenses included in this category are outsourced clearing services, statement and confirmation processing and postage costs and clearing expenses paid to the National Securities Clearing Corporation, option exchanges and other market centers. Communications expense includes telecommunications, other postage, news and quote costs. Occupancy and equipment costs include the costs of leasing and maintaining our office spaces, software licensing and maintenance costs and maintenance expenses on computer hardware and other equipment. Depreciation and amortization includes depreciation on property and equipment and amortization of leasehold improvements. Amortization of acquired intangible assets consists of amortization of amounts allocated to the value of intangible assets acquired in business acquisitions.
Professional services expense includes costs paid to outside firms for assistance with legal, accounting, technology, regulatory, marketing and general management issues. Advertising costs include production and placement of advertisements in various media, including online, television, print and email, as well as client promotion and development costs. Advertising expenses may fluctuate significantly from period to period. Other operating expenses include provision for bad debt losses, fraud and error losses, gains or losses on disposal of property, insurance expenses, travel expenses and other miscellaneous expenses. During fiscal year 2018, other operating expenses also included costs incurred related to the integration of Scottrade.
Interest on borrowings consists of interest expense on our long-term debt and other borrowings. Gain on business-related divestiture represents the gain realized on the sale of TD Ameritrade Trust Company's ("TDATC"), an indirect wholly-owned subsidiary of the Company, retirement plan custody and trust assets on June 28, 2019. Loss on sale of investments represents losses realized on corporate (non broker-dealer) investments.
Acquisition of Scottrade
On September 18, 2017, we completed our acquisition of the brokerage business of Scottrade. The transaction combined highly complementary franchises and added significant scale to our retail business with the addition of approximately 3.5 million funded client accounts, extended our leadership in trading, and expanded the size of our branch network.
For additional information regarding this acquisition, see Note
2
—
Business Acquisition
under Item 8. Financial Statements and Supplementary Data — Notes to Consolidated Financial Statements.
32
Critical Accounting Policies and Estimates
The preparation of our consolidated financial statements requires us to make judgments and estimates that may have a significant impact upon our financial results. Note 1, under Item 8, Financial Statements and Supplementary Data — Notes to Consolidated Financial Statements, of this Form 10-K contains a summary of our significant accounting policies, many of which require the use of estimates and assumptions. We believe that the following areas are particularly subject to management's judgments and estimates and could materially affect our results of operations and financial position.
Valuation of goodwill and acquired intangible assets
We test goodwill and our indefinite-lived acquired intangible asset for impairment on at least an annual basis, or whenever events occur or changes in circumstances indicate that the carrying values may not be recoverable. In performing the goodwill impairment tests, we utilize quoted market prices of our common stock to estimate the fair value of the Company as a whole. The estimated fair value is then allocated to our reporting unit and is compared with the carrying value of the reporting unit. No impairment charges have resulted from our goodwill impairment tests.
To determine if the indefinite-lived intangible asset is impaired, we first assess certain qualitative factors. Based on this assessment, if it is determined that more likely than not the fair value of the indefinite-lived intangible asset is less than its carrying amount, we perform a quantitative impairment test. No impairment charges have resulted from the indefinite-lived intangible asset impairment tests.
We review our finite-lived acquired intangible assets for impairment whenever events occur or changes in circumstances indicate that the carrying amount of such asset may not be recoverable. We evaluate recoverability by comparing the undiscounted cash flows associated with the asset to the asset's carrying amount. We also evaluate the remaining useful lives of intangible assets each reporting period to determine if events or trends warrant a revision to the remaining period of amortization. We have had no events or trends that have warranted a material revision to the originally estimated useful lives.
Estimates of effective income tax rates, uncertain tax positions, deferred income taxes and related valuation allowances
We estimate our income tax expense based on the various jurisdictions where we conduct business. This requires us to estimate our current income tax obligations and to assess temporary differences between the financial statement carrying amounts and tax bases of assets and liabilities. Temporary differences result in deferred income tax assets and liabilities. We must evaluate the likelihood that deferred income tax assets will be realized. To the extent we determine that realization is not "more likely than not," we establish a valuation allowance. Establishing or increasing a valuation allowance results in a corresponding increase to income tax expense in our consolidated financial statements. Conversely, to the extent circumstances indicate that a valuation allowance can be reduced or is no longer necessary, that portion of the valuation allowance is reversed, reducing income tax expense.
We must make significant judgments to calculate our provision for income taxes, our deferred income tax assets and liabilities and any valuation allowance against our deferred income tax assets. We must also exercise judgment in determining the need for, and amount of, any accruals for uncertain tax positions. Because the application of tax laws and regulations to many types of transactions is subject to varying interpretations, amounts reported in our consolidated financial statements could be significantly changed at a later date upon final determinations by taxing authorities.
Accruals for contingent liabilities
Accruals for contingent liabilities, such as legal and regulatory claims and proceedings, reflect an estimate of probable losses for each matter. In making such estimates, we consider many factors, including the progress of the matter, prior experience and the experience of others in similar matters, available defenses, insurance coverage, indemnification provisions and the advice of legal counsel and other experts. In many matters, such as those in which substantial or indeterminate damages or fines are sought, or where cases or proceedings are in the early stages, it is not possible to determine whether a loss will be incurred, or to estimate the range of that loss, until the matter
33
is close to resolution, in which case no accrual is made until that time. Because matters may be resolved over long periods of time, accruals are adjusted as more information becomes available or when an event occurs requiring a change. Significant judgment is required in making these estimates, and the actual cost of resolving a matter may ultimately differ materially from the amount accrued.
Results of Operations
Conditions in the U.S. equity markets significantly impact the volume of our clients' trading activity. There is a relationship between the volume of our clients' trading activity and our results of operations. We cannot predict future trading volumes in the U.S. equity markets. If client trading activity increases, we generally expect that it would have a positive impact on our results of operations. If client trading activity declines, we generally expect that it would have a negative impact on our results of operations.
Changes in average client balances, especially bank deposit account, margin, credit and fee-based investment balances, may significantly impact our results of operations. Changes in interest rates also significantly impact our results of operations. We seek to mitigate interest rate risk by aligning the average duration of our interest-earning assets with that of our interest-bearing liabilities. We cannot predict the direction of interest rates or the levels of client balances. If interest rates rise, we generally expect to earn a larger net interest spread. Conversely, a falling interest rate environment generally would result in us earning a smaller net interest spread.
Effective October 3, 2019, we reduced our online exchange-listed stock, ETFs (domestic and Canadian) and option trade commissions from $6.95 to $0 per trade (plus $0.65 per contract and no exercise or assignment fees on option trades). The expected impact of these price reductions on our net revenues for fiscal year 2020 is discussed later in this section.
Financial Performance Metrics
Net income, diluted earnings per share and EBITDA (earnings before interest, taxes, depreciation and amortization) are key metrics we use in evaluating our financial performance. Net income and diluted earnings per share are GAAP financial measures and EBITDA is a non-GAAP financial measure.
We consider EBITDA to be an important measure of our financial performance and of our ability to generate cash flows to service debt, fund capital expenditures and fund other corporate investing and financing activities. EBITDA is used as the denominator in the consolidated leverage ratio calculation for covenant purposes under the TD Ameritrade Holding Corporation senior revolving credit facility. EBITDA eliminates the non-cash effect of tangible asset depreciation and amortization and intangible asset amortization. EBITDA should be considered in addition to, rather than as a substitute for, GAAP pre-tax income, net income and cash flows from operating activities.
The following table sets forth net income in dollars and as a percentage of net revenues for the periods indicated, and provides reconciliations to EBITDA (dollars in millions):
|
Fiscal Year Ended September 30,
|
|||||||||||||||||||||
|
2019
|
2018
|
2017
|
|||||||||||||||||||
|
$
|
% of Net
Revenues
|
$
|
% of Net
Revenues
|
$
|
% of Net
Revenues
|
||||||||||||||||
|
Net income (GAAP)
|
$
|
2,208
|
|
36.7
|
%
|
$
|
1,473
|
|
27.0
|
%
|
$
|
872
|
|
23.7
|
%
|
||||||
|
Add:
|
|||||||||||||||||||||
|
Depreciation and amortization
|
148
|
|
2.5
|
%
|
142
|
|
2.6
|
%
|
102
|
|
2.8
|
%
|
|||||||||
|
Amortization of acquired intangible assets
|
125
|
|
2.1
|
%
|
141
|
|
2.6
|
%
|
79
|
|
2.1
|
%
|
|||||||||
|
Interest on borrowings
|
144
|
|
2.4
|
%
|
99
|
|
1.8
|
%
|
71
|
|
1.9
|
%
|
|||||||||
|
Provision for income taxes
|
721
|
|
12.0
|
%
|
414
|
|
7.6
|
%
|
522
|
|
14.2
|
%
|
|||||||||
|
EBITDA (non-GAAP)
|
$
|
3,346
|
|
55.6
|
%
|
$
|
2,269
|
|
41.6
|
%
|
$
|
1,646
|
|
44.8
|
%
|
||||||
34
Fiscal Year Ended September 30, 2019 Compared to Fiscal Year Ended September 30, 2018
Our net income increased 50% for fiscal year
2019
compared to fiscal year
2018
, primarily due to an increase in net revenues, a decrease in operating expenses and a $60 million gain on a business-related divestiture, partially offset by an increase in the effective income tax rate and interest on borrowings. The effective income tax rate was lower in the prior fiscal year primarily due to the impact from the enactment of the Tax Cuts and Jobs Act (the "Act") on December 22, 2017.
Our EBITDA increased 47% for fiscal year 2019 compared to fiscal year 2018, primarily due to an increase in net revenues, a decrease in operating expenses excluding depreciation and amortization and a $60 million gain on a business-related divestiture.
Our diluted earnings per share increased 53% to
$3.96
for fiscal year
2019
compared to
$2.59
for fiscal year
2018
, due to higher net income and a 2% decrease in the weighted average diluted shares outstanding as a result of our stock repurchase program. Details regarding our fiscal year
2020
expectations for net revenues and expenses are presented later in this discussion.
Fiscal Year Ended September 30, 2018 Compared to Fiscal Year Ended September 30, 2017
Our net income increased 69% for fiscal year 2018 compared to fiscal year 2017, primarily due to an increase in net revenues and a lower effective tax rate, primarily due to the enactment of the Act on December 22, 2017. These increases were partially offset by increases in operating expenses and interest on borrowings, and an $11 million loss on sale of investments during fiscal year 2018. Net revenues and operating expenses increased primarily due to the Scottrade acquisition.
Our EBITDA increased 38% for fiscal year 2018 compared to fiscal year 2017, primarily due to an increase in net revenues, partially offset by an increase in operating expenses excluding depreciation and amortization, and an $11 million loss on sale of investments during fiscal year 2018.
Our diluted earnings per share increased 58% to $2.59 for fiscal year 2018 compared to $1.64 for fiscal year 2017, primarily due to higher net income, partially offset by a 7% increase in the weighted average diluted shares outstanding as a result of the issuance of our common stock in connection with the Scottrade acquisition.
Operating Metrics
Our largest sources of revenues are asset-based revenues and transaction-based revenues. For fiscal year
2019
, asset-based revenues and transaction-based revenues accounted for
64%
and
33%
of our net revenues, respectively. Asset-based revenues consist of (1) bank deposit account fees, (2) net interest revenue and (3) investment product fees. The primary factors driving our asset-based revenues are average balances and average rates. Average balances consist primarily of average client bank deposit account balances, average client margin balances, average segregated cash balances, average client credit balances, average fee-based investment balances and average securities borrowing and lending balances. Average rates consist of the average interest rates and fees earned and paid on such balances. The primary factors driving our transaction-based revenues are total trades and average commissions per trade. We also consider client account and client asset metrics, although we believe they are generally of less significance to our results of operations for any particular period than our metrics for asset-based and transaction-based revenues.
35
Asset-Based Revenue Metrics
We calculate the return on our bank deposit account balances and our interest-earning assets using a measure we refer to as net interest margin. Net interest margin is calculated for a given period by dividing the annualized sum of bank deposit account fees and net interest revenue by average spread-based assets. Spread-based assets consist of average bank deposit account balances and average interest-earning assets, which include client margin balances, segregated cash, deposits paid on securities borrowing and other cash and interest-earning investment balances. The following table sets forth net interest margin and average spread-based assets (dollars in millions):
|
Fiscal Year
|
'19 vs. '18
Increase/ (Decrease) |
'18 vs. '17
Increase/ (Decrease) |
||||||||||||||||||
|
2019
|
2018
|
2017
|
||||||||||||||||||
|
Average bank deposit account balances
|
$
|
112,716
|
|
$
|
116,695
|
|
$
|
93,922
|
|
$
|
(3,979
|
)
|
$
|
22,773
|
|
|||||
|
Average interest-earning assets
|
32,242
|
|
30,849
|
|
25,316
|
|
1,393
|
|
5,533
|
|
||||||||||
|
Average spread-based balances
|
$
|
144,958
|
|
$
|
147,544
|
|
$
|
119,238
|
|
$
|
(2,586
|
)
|
$
|
28,306
|
|
|||||
|
Bank deposit account fee revenue
|
$
|
1,717
|
|
$
|
1,541
|
|
$
|
1,107
|
|
$
|
176
|
|
$
|
434
|
|
|||||
|
Net interest revenue
|
1,533
|
|
1,272
|
|
690
|
|
261
|
|
582
|
|
||||||||||
|
Spread-based revenue
|
$
|
3,250
|
|
$
|
2,813
|
|
$
|
1,797
|
|
$
|
437
|
|
$
|
1,016
|
|
|||||
|
Average yield — bank deposit account fees
|
1.50
|
%
|
1.30
|
%
|
1.16
|
%
|
0.20
|
%
|
0.14
|
%
|
||||||||||
|
Average yield — interest-earning assets
|
4.69
|
%
|
4.07
|
%
|
2.69
|
%
|
0.62
|
%
|
1.38
|
%
|
||||||||||
|
Net interest margin (NIM)
|
2.21
|
%
|
1.88
|
%
|
1.49
|
%
|
0.33
|
%
|
0.39
|
%
|
||||||||||
The following tables set forth key metrics that we use in analyzing net interest revenue, which is a component of net interest margin (dollars in millions):
|
Interest Revenue (Expense)
Fiscal Year
|
'19 vs. '18
Increase/ (Decrease) |
'18 vs. '17
Increase/ (Decrease) |
||||||||||||||||||
|
2019
|
2018
|
2017
|
||||||||||||||||||
|
Segregated cash
|
$
|
123
|
|
$
|
95
|
|
$
|
49
|
|
$
|
28
|
|
$
|
46
|
|
|||||
|
Client margin balances
|
1,075
|
|
920
|
|
482
|
|
155
|
|
438
|
|
||||||||||
|
Securities lending/borrowing, net
|
248
|
|
222
|
|
139
|
|
26
|
|
83
|
|
||||||||||
|
Other cash and interest-earning investments
|
98
|
|
42
|
|
22
|
|
56
|
|
20
|
|
||||||||||
|
Client credit balances
|
(11
|
)
|
(7
|
)
|
(2
|
)
|
(4
|
)
|
(5
|
)
|
||||||||||
|
Net interest revenue
|
$
|
1,533
|
|
$
|
1,272
|
|
$
|
690
|
|
$
|
261
|
|
$
|
582
|
|
|||||
|
Average Balance
Fiscal Year
|
'19 vs. '18
% Change |
'18 vs. '17
% Change |
||||||||||||||||
|
2019
|
2018
|
2017
|
||||||||||||||||
|
Segregated cash
|
$
|
5,511
|
|
$
|
6,832
|
|
$
|
8,282
|
|
(19
|
)%
|
(18
|
)%
|
|||||
|
Client margin balances
|
20,651
|
|
19,812
|
|
12,542
|
|
4
|
%
|
58
|
%
|
||||||||
|
Securities borrowing
|
1,125
|
|
925
|
|
1,004
|
|
22
|
%
|
(8
|
)%
|
||||||||
|
Other cash and interest-earning investments
|
4,955
|
|
3,280
|
|
3,488
|
|
51
|
%
|
(6
|
)%
|
||||||||
|
Interest-earning assets
|
$
|
32,242
|
|
$
|
30,849
|
|
$
|
25,316
|
|
5
|
%
|
22
|
%
|
|||||
|
Client credit balances
|
$
|
19,286
|
|
$
|
20,438
|
|
$
|
16,182
|
|
(6
|
)%
|
26
|
%
|
|||||
|
Securities lending
|
2,825
|
|
2,888
|
|
2,004
|
|
(2
|
)%
|
44
|
%
|
||||||||
|
Interest-bearing liabilities
|
$
|
22,111
|
|
$
|
23,326
|
|
$
|
18,186
|
|
(5
|
)%
|
28
|
%
|
|||||
36
|
Average Yield (Cost)
Fiscal Year
|
'19 vs. '18
Net Yield
Increase/
(Decrease)
|
'18 vs. '17
Net Yield
Increase/
(Decrease)
|
|||||||||||||
|
2019
|
2018
|
2017
|
|||||||||||||
|
Segregated cash
|
2.20
|
%
|
1.37
|
%
|
0.58
|
%
|
0.83
|
%
|
0.79
|
%
|
|||||
|
Client margin balances
|
5.14
|
%
|
4.58
|
%
|
3.79
|
%
|
0.56
|
%
|
0.79
|
%
|
|||||
|
Other cash and interest-earning investments
|
1.94
|
%
|
1.26
|
%
|
0.63
|
%
|
0.68
|
%
|
0.63
|
%
|
|||||
|
Client credit balances
|
(0.06
|
)%
|
(0.03
|
)%
|
(0.01
|
)%
|
(0.03
|
)%
|
(0.02
|
)%
|
|||||
|
Net interest revenue
|
4.69
|
%
|
4.07
|
%
|
2.69
|
%
|
0.62
|
%
|
1.38
|
%
|
|||||
The following table sets forth key metrics that we use in analyzing investment product fee revenues (dollars in millions):
|
Fiscal Year
|
'19 vs. '18
Increase/ (Decrease) |
'18 vs. '17
Increase/ (Decrease) |
||||||||||||||||||
|
2019
|
2018
|
2017
|
||||||||||||||||||
|
Average fee-based investment balances
|
$
|
273,728
|
|
$
|
252,503
|
|
$
|
185,123
|
|
$
|
21,225
|
|
$
|
67,380
|
|
|||||
|
Average yield—investment product fees
|
0.21
|
%
|
0.22
|
%
|
0.23
|
%
|
(0.01
|
)%
|
(0.01
|
)%
|
||||||||||
|
Investment product fee revenue
|
$
|
586
|
|
$
|
557
|
|
$
|
423
|
|
$
|
29
|
|
$
|
134
|
|
|||||
Transaction-Based Revenue Metrics
The following table sets forth several key metrics regarding client trading activity, which we utilize in measuring and evaluating performance and the results of our operations:
|
Fiscal Year
|
'19 vs. '18
% Change |
'18 vs. '17
% Change |
||||||||||||||||
|
2019
|
2018
|
2017
|
||||||||||||||||
|
Total trades (in millions)
|
215.11
|
|
202.78
|
|
127.68
|
|
6
|
%
|
59
|
%
|
||||||||
|
Average client trades per day
|
862,158
|
|
811,110
|
|
510,710
|
|
6
|
%
|
59
|
%
|
||||||||
|
Trading days
|
249.5
|
|
250.0
|
|
250.0
|
|
0
|
%
|
0
|
%
|
||||||||
|
Average commissions per trade
|
$
|
7.02
|
|
$
|
7.45
|
|
$
|
8.33
|
|
(6
|
)%
|
(11
|
)%
|
|||||
|
Order routing revenue (in millions)
|
$
|
492
|
|
$
|
458
|
|
$
|
320
|
|
7
|
%
|
43
|
%
|
|||||
Client Account and Client Asset Metrics
The following table sets forth certain metrics regarding client accounts and client assets, which we use to analyze growth and trends in our client base:
|
Fiscal Year
|
||||||||||||
|
2019
|
2018
|
2017
|
||||||||||
|
Funded accounts (beginning of year)
|
11,514,000
|
|
11,004,000
|
|
6,950,000
|
|
||||||
|
Funded accounts (end of year)
|
11,971,000
|
|
11,514,000
|
|
11,004,000
|
|
||||||
|
Percentage change during year
|
4
|
%
|
5
|
%
|
58
|
%
|
||||||
|
Client assets (beginning of year, in billions)
|
$
|
1,297.5
|
|
$
|
1,118.5
|
|
$
|
773.8
|
|
|||
|
Client assets (end of year, in billions)
|
$
|
1,327.7
|
|
$
|
1,297.5
|
|
$
|
1,118.5
|
|
|||
|
Percentage change during year
|
2
|
%
|
16
|
%
|
45
|
%
|
||||||
|
Net new assets (in billions)
|
$
|
93.1
|
|
$
|
92.3
|
|
$
|
80.1
|
|
|||
|
Net new assets growth rate
|
7
|
%
|
8
|
%
|
10
|
%
|
||||||
37
The following table summarizes certain data from our Consolidated Statements of Income for analysis purposes (dollars in millions):
|
Fiscal Year
|
'19 vs. '18
% Change |
'18 vs. '17
% Change |
||||||||||||||||
|
2019
|
2018
|
2017
|
||||||||||||||||
|
Revenues:
|
||||||||||||||||||
|
Transaction-based revenues:
|
||||||||||||||||||
|
Commissions and transaction fees
|
$
|
2,002
|
|
$
|
1,969
|
|
$
|
1,384
|
|
2
|
%
|
42
|
%
|
|||||
|
Asset-based revenues:
|
||||||||||||||||||
|
Bank deposit account fees
|
1,717
|
|
1,541
|
|
1,107
|
|
11
|
%
|
39
|
%
|
||||||||
|
Net interest revenue
|
1,533
|
|
1,272
|
|
690
|
|
21
|
%
|
84
|
%
|
||||||||
|
Investment product fees
|
586
|
|
557
|
|
423
|
|
5
|
%
|
32
|
%
|
||||||||
|
Total asset-based revenues
|
3,836
|
|
3,370
|
|
2,220
|
|
14
|
%
|
52
|
%
|
||||||||
|
Other revenues
|
178
|
|
113
|
|
72
|
|
58
|
%
|
57
|
%
|
||||||||
|
Net revenues
|
6,016
|
|
5,452
|
|
3,676
|
|
10
|
%
|
48
|
%
|
||||||||
|
Operating expenses:
|
||||||||||||||||||
|
Employee compensation and benefits
|
1,322
|
|
1,555
|
|
962
|
|
(15
|
)%
|
62
|
%
|
||||||||
|
Clearing and execution costs
|
209
|
|
189
|
|
149
|
|
11
|
%
|
27
|
%
|
||||||||
|
Communications
|
155
|
|
179
|
|
131
|
|
(13
|
)%
|
37
|
%
|
||||||||
|
Occupancy and equipment costs
|
267
|
|
302
|
|
181
|
|
(12
|
)%
|
67
|
%
|
||||||||
|
Depreciation and amortization
|
148
|
|
142
|
|
102
|
|
4
|
%
|
39
|
%
|
||||||||
|
Amortization of acquired intangible assets
|
125
|
|
141
|
|
79
|
|
(11
|
)%
|
78
|
%
|
||||||||
|
Professional services
|
294
|
|
303
|
|
260
|
|
(3
|
)%
|
17
|
%
|
||||||||
|
Advertising
|
298
|
|
293
|
|
254
|
|
2
|
%
|
15
|
%
|
||||||||
|
Other
|
197
|
|
350
|
|
92
|
|
(44
|
)%
|
280
|
%
|
||||||||
|
Total operating expenses
|
3,015
|
|
3,454
|
|
2,210
|
|
(13
|
)%
|
56
|
%
|
||||||||
|
Operating income
|
3,001
|
|
1,998
|
|
1,466
|
|
50
|
%
|
36
|
%
|
||||||||
|
Other expense (income):
|
||||||||||||||||||
|
Interest on borrowings
|
144
|
|
99
|
|
71
|
|
45
|
%
|
39
|
%
|
||||||||
|
Gain on business-related divestiture
|
(60
|
)
|
—
|
|
—
|
|
N/A
|
|
N/A
|
|
||||||||
|
Loss on sale of investments
|
—
|
|
11
|
|
—
|
|
(100
|
)%
|
N/A
|
|
||||||||
|
Other, net
|
(12
|
)
|
1
|
|
1
|
|
N/A
|
|
0
|
%
|
||||||||
|
Total other expense (income)
|
72
|
|
111
|
|
72
|
|
(35
|
)%
|
54
|
%
|
||||||||
|
Pre-tax income
|
2,929
|
|
1,887
|
|
1,394
|
|
55
|
%
|
35
|
%
|
||||||||
|
Provision for income taxes
|
721
|
|
414
|
|
522
|
|
74
|
%
|
(21
|
)%
|
||||||||
|
Net income
|
$
|
2,208
|
|
$
|
1,473
|
|
$
|
872
|
|
50
|
%
|
69
|
%
|
|||||
|
Other information:
|
||||||||||||||||||
|
Effective income tax rate
|
24.6
|
%
|
21.9
|
%
|
37.4
|
%
|
||||||||||||
|
Average debt outstanding
|
$
|
3,553
|
|
$
|
2,743
|
|
$
|
2,093
|
|
30
|
%
|
31
|
%
|
|||||
|
Effective interest rate incurred on borrowings
|
4.01
|
%
|
3.59
|
%
|
3.40
|
%
|
||||||||||||
38
Fiscal Year Ended September 30, 2019 Compared to Fiscal Year Ended September 30, 2018
Net Revenues
Net revenues increased 10% to $6.02 billion during fiscal year 2019. We expect net revenues to decrease to between $4.9 billion and $5.3 billion during fiscal year 2020, primarily due to our reduction in trade commission pricing during the first quarter of fiscal year 2020, decreases in the target range for the federal funds rate during the fourth quarter of fiscal year 2019 and further potential decreases in the interest rate environment during fiscal year 2020. Effective October 3, 2019, we reduced our online exchange-listed stock, exchange traded funds (ETF) (domestic and Canadian) and option trade commissions from $6.95 to $0 per trade (plus $0.65 per contract and no exercise or assignment fees on option trades). This reduction in trade commission pricing is expected to decrease net revenues by approximately $880 million to $960 million per fiscal year.
Commissions and transaction fees increased 2% to $2.00 billion, primarily due to increased client trading activity, partially offset by lower average commissions per trade. Average client trades per day increased 6% to 862,158 for fiscal year 2019 compared to 811,110 for fiscal year 2018. Order routing revenue increased 7% to $492 million due to higher trading volumes. Average commissions per trade decreased to $7.02 from $7.45, primarily due to a higher percentage of our clients' trades receiving reduced commission rates as a result of continued price competition in the industry and lower average contracts per trade on options and futures trades.
Asset-based revenues increased 14% to $3.84 billion for fiscal year 2019, primarily due to an increase of 33 basis points in net interest margin to 2.21%. The increase in net interest margin was primarily due to the Federal Open Market Committee increasing the target range for the federal funds rate by 100 basis points during fiscal year 2018 and by 25 basis points during the first quarter of fiscal year 2019, partially offset by a decrease of 50 basis points during the fourth quarter of fiscal year 2019. The increase in net interest margin was also due to the impact of higher average client margin balances, which earn a larger net interest spread.
Bank deposit account fees increased 11% to $1.72 billion, primarily due to an increase of 20 basis points in the average yield earned on the bank deposit account balances, partially offset by a 3% decrease in average client bank deposit account balances. The average yield earned on bank deposit account balances increased primarily due to floating-rate investment balances within the Insured Deposit Account ("IDA") portfolio benefiting from the federal funds net rate increases during fiscal years 2018 and 2019, as described above, investments being reinvested at higher rates upon maturity and the favorable impact from the removal of the FDIC surcharge in October 2018. These increases were partially offset by higher interest rates paid to clients. The decrease in average client bank deposit account balances is primarily due to clients investing in other asset classes.
Net interest revenue increased 21% to $1.53 billion, primarily due to increases in the average yields earned on client margin balances, segregated cash and other cash and interest-earning investments, a 4% increase in average client margin balances and a $26 million increase in net interest revenue from our securities borrowing/lending program. These increases were partially offset by a 19% decrease in average segregated cash balances. The increases in the average yields earned are primarily due to the federal funds net rate increases during fiscal years 2018 and 2019, as described above.
Investment product fees increased 5% to $586 million, primarily due to a net increase in average fee-based investment balances and an increase in average yields earned on certain investment products. The favorable impact from the increase in balances was partially offset by decreased balances in higher yielding investment products. The average yield earned on fee-based investment balances decreased by 1 basis point, as average balance increases were primarily in investment products which earn lower yields.
Other revenues increased 58% to $178 million, primarily due to a $49 million increase in revenue as a result of the adoption of the new revenue recognition standard (ASU 2014-09) on October 1, 2018 and increased fees from processing corporate securities reorganizations.
Operating Expenses
Total operating expenses decreased
13%
to
$3.02
billion during fiscal year
2019
, primarily due to $445 million of acquisition-related expenses incurred during the prior fiscal year. We expect total operating expenses to decrease to between $2.8 billion and $3.0 billion for fiscal year
2020
.
39
Employee compensation and benefits expense decreased
15%
to
$1.32
billion, primarily due to $235 million of severance and other employment benefits related to the Scottrade integration during the prior fiscal year, partially offset by an increase to expense of $10 million during fiscal year 2019 as a result of the adoption of the new revenue recognition standard (ASU 2014-09) on October 1, 2018. The average number of full-time equivalent employees decreased to 9,420 for fiscal year
2019
compared to 9,728 for fiscal year
2018
.
Clearing and execution costs increased
11%
to
$209
million, primarily due to an increase to expense of $21 million as a result of the adoption of the new revenue recognition standard.
Communications expense decreased
13%
to
$155
million, primarily due to decreased costs for quotes and market information and telecommunications resulting from the integration of the Scottrade business during the prior fiscal year.
Occupancy and equipment costs decreased
12%
to
$267
million, primarily due to decreased costs resulting from the integration of the Scottrade business during the prior fiscal year, including decreased expenses attributed to software maintenance, facilities expenses related to leased facilities and equipment repairs and maintenance.
Amortization of acquired intangible assets decreased
11%
to
$125
million, primarily due to certain acquired intangible assets becoming fully amortized. We expect amortization of acquired intangible assets to decrease to between $115 million to $120 million for fiscal year 2020.
Professional services expense decreased
3%
to
$294
million, primarily due to increased usage of consulting and contract services associated with the Scottrade integration during the prior fiscal year.
Advertising expense increased 2% to $298 million. We expect advertising expense to range from $250 million to $300 million for fiscal year 2020. We generally adjust our level of advertise spending in relation to stock market activity and other market conditions in an effort to maximize new client relationships and net new assets.
Other operating expenses decreased
44%
to
$197
million, primarily due to increased costs during the prior fiscal year, consisting of $172 million of costs related to the Scottrade integration, mainly comprised of contract terminations, and an increase in the provision for bad debt of $56 million related to market volatility during the prior fiscal year. These increased costs during the prior fiscal year were partially offset by increased costs during fiscal year 2019, including $28 million as a result of the adoption of the new revenue recognition standard, a $20 million net legal settlement and costs related to the closure of 80 retail branch locations.
Other Expense (Income) and Income Taxes
Interest on borrowings increased
45%
to
$144
million, primarily due to a 30% increase in average debt outstanding and an increase of 42 basis points in the average effective interest rate incurred on our borrowings. On October 30, 2018, we issued $600 million of variable-rate Senior Notes due November 1, 2021 and $400 million of 3.75% Senior Notes due April 1, 2024. We also issued $500 million of 2.75% Senior Notes due on October 1, 2029 on August 13, 2019. For more information regarding these debt issuances, see "
Long-term Debt and Other Borrowings
" later in this section.
Gain on business-related divestiture consists of a gain from the sale of TDATC's retirement plan custody and trust assets.
Other non-operating income for fiscal year 2019 primarily consists of a $14 million favorable legal settlement, partially offset by a prepayment premium on long-term debt.
Our effective income tax rate was
24.6%
for fiscal year
2019
, compared to
21.9%
for fiscal year
2018
. The effective income tax rate for fiscal year
2019
included $16 million of favorable adjustments related to state income tax matters and a $4 million income tax benefit resulting from the vesting of equity-based compensation. These items had a favorable impact on our earnings for fiscal year 2019 of approximately $0.04 per share. The effective income tax rate for the prior fiscal year included a net favorable adjustment of $71 million related to the remeasurement of the Company's deferred income tax balances as it pertains to the Act, a $5 million income tax benefit resulting from the change in accounting for income taxes related to equity-based compensation under ASU 2016-09, $12 million of favorable resolutions of state income tax matters and a $30 million favorable benefit resulting from accelerating certain deductions, including acquisition-related exit costs, to leverage higher 2017 pre-enactment tax rates. The effective income tax rate was also impacted by a $9 million unfavorable remeasurement of uncertain tax positions related to certain federal incentives. These items had a net favorable impact on the Company's earnings for fiscal
40
year 2018 of approximately $0.19 per share. We estimate our effective income tax rate to be between 24% and 26% for fiscal year 2020, excluding the effect of any adjustments related to remeasurement or resolution of uncertain tax positions and federal incentives. However, we expect to experience some volatility in our quarterly and annual effective income tax rate because current accounting rules for uncertain tax positions require that any change in measurement of a tax position taken in a prior tax year be recognized as a discrete event in the period in which the change occurs. We also anticipate the potential for increased volatility in our future quarterly effective income tax rate from the accounting for income taxes related to equity-based compensation, which requires the income tax effects of exercised or vested stock-based awards to be treated as discrete items in the period in which they occur.
Fiscal Year Ended September 30, 2018 Compared to Fiscal Year Ended September 30, 2017
Net Revenues
Commissions and transaction fees increased 42% to $1.97 billion, primarily due to the addition of approximately 3.5 million funded accounts as a result of the Scottrade acquisition on September 18, 2017, partially offset by lower average commissions per trade for fiscal year 2018 compared to fiscal year 2017. Average client trades per day increased 59% to 811,110 for fiscal year 2018 compared to 510,710 for fiscal year 2017. Order routing revenue increased 43% to $458 million due to higher trading volumes. Average commissions per trade decreased to $7.45 from $8.33, primarily due to our reduction in client pricing for online equity and option trades during the second quarter of fiscal 2017 and a higher percentage of equity trades, which earn somewhat lower average commissions per trade than option and futures trades. Effective March 6, 2017, we reduced our online equity and ETF trade commissions from $9.99 to $6.95 per trade and also lowered options pricing to $6.95 per trade (plus $0.75 per contract).
Asset-based revenues increased 52% to $3.37 billion for fiscal year 2018, primarily due to increases in average spread-based assets, net interest margin earned on spread-based assets and average market fee-based investment balances. The growth in average spread-based and market fee-based investment balances is primarily due to the Scottrade acquisition and our success in attracting net new client assets. Net interest margin increased 39 basis points to 1.88% during fiscal year 2018, primarily due to the Federal Open Market Committee increasing the target range for the federal funds rate by 75 basis points (to between 1.00% and 1.25%) during fiscal year 2017 and by 100 basis points (to between 2.00% to 2.25%) during fiscal year 2018. The increase in net interest margin was also due to the impact of higher average client margin balances, which earn a larger net interest spread.
Bank deposit account fees increased 39% to $1.54 billion, primarily due to a 24% increase in average bank deposit account balances and an increase of 14 basis points in the average yield earned on the bank deposit account assets. The growth in the average bank deposit account balances is primarily due to the Scottrade acquisition and our success in attracting net new client assets. The average yield earned on bank deposit account assets increased primarily due to floating-rate investment balances within the IDA portfolio benefiting from the federal funds rate increases during fiscal years 2017 and 2018, as described above, partially offset by higher interest rates paid to clients.
Net interest revenue increased 84% to $1.27 billion due to a 58% increase in average client margin balances, primarily due to the Scottrade acquisition, increases in the average yields earned on client margin balances, segregated cash and other cash and interest-earning investments as a result of the federal funds rate increases during fiscal years 2017 and 2018, as described above, and an $83 million increase in net interest revenue from our securities borrowing/lending program.
Investment product fees increased 32% to $557 million, primarily due to a 37% increase in average market fee-based investment balances. The increase in market fee-based investment balances is primarily due to the Scottrade acquisition and growth in our advised solutions products.
Other revenues increased 57% to $113 million, primarily due to favorable fair market value adjustments on investments held by our broker-dealer subsidiaries and increases in fees related to processing corporate securities reorganizations, proxy services and other fee revenue associated with additional accounts and transaction processing volumes resulting from the Scottrade acquisition.
41
Operating Expenses
Employee compensation and benefits expense increased 62% to $1.56 billion, primarily due to $235 million of severance and other employment benefits related to the Scottrade integration, an increase in average headcount related to the Scottrade acquisition and our strategic growth initiatives, and annual merit increases. The average number of full-time equivalent employees increased to 9,728 for fiscal year 2018 compared to 6,661 for fiscal year 2017.
Clearing and execution costs increased 27% to $189 million, primarily due to increased costs associated with additional accounts and transaction processing volumes resulting from the Scottrade acquisition.
Communications expense increased 37% to $179 million, primarily due to the Scottrade acquisition, resulting in increased costs for quotes and market information associated with additional accounts and transaction processing volumes and costs for telecommunications.
Occupancy and equipment costs increased 67% to $302 million, primarily due to additional costs associated with the Scottrade business, including increased expenses related to leased facilities, software licensing and software maintenance.
Depreciation and amortization increased 39% to $142 million, primarily due to depreciation on assets recorded in the Scottrade acquisition, placing our new Southlake, Texas operations center in service during December 2017, and technology infrastructure upgrades.
Amortization of acquired intangible assets increased 78% to $141 million, primarily due to amortization of the client relationships intangible asset recorded in the Scottrade acquisition.
Professional services expense increased 17% to $303 million, primarily due to higher usage of consulting and contract services related to operational and technology-related initiatives and in connection with the Scottrade integration, partially offset by lower costs associated with legal matters.
Advertising expense increased 15% to $293 million, primarily due to the Scottrade acquisition and due to increased advertising during professional and collegiate sporting events.
Other operating expenses increased 280% to $350 million, primarily due to $172 million of costs related to the Scottrade integration, mainly comprised of contract terminations, a net increase in the provision for bad debt of $56 million related to market volatility during fiscal year 2018 and additional expenses associated with the Scottrade business.
Other Expense and Income Taxes
Interest on borrowings increased 39% to $99 million, primarily due to a 31% increase in average debt outstanding and an increase of 19 basis points in the average effective interest rate incurred on our borrowings. On April 27, 2017, we issued $800 million of 3.300% Senior Notes due April 1, 2027 to finance a portion of the cash consideration paid in connection with the Scottrade acquisition.
Our effective income tax rate was 21.9% for fiscal year 2018, compared to 37.4% for fiscal year 2017. The effective income tax rate for fiscal year 2018 included an estimated net favorable adjustment of $71 million related to the remeasurement of the Company's deferred income tax balances as it pertains to the Act, a $5 million income tax benefit resulting from the change in accounting for income taxes related to equity-based compensation under ASU 2016-09, $12 million of favorable resolutions of state income tax matters and a $30 million favorable benefit resulting from accelerating certain deductions, including acquisition-related exit costs, to leverage higher 2017 pre-enactment tax rates. The effective income tax rate was also impacted by a $9 million unfavorable remeasurement of uncertain tax positions related to certain federal incentives. These items had a net favorable impact on our earnings for fiscal year 2018 of approximately $0.19 per share. The Act was enacted on December 22, 2017, reducing the U.S. federal corporate income tax rate from 35% to 21%.
Liquidity and Capital Resources
We have established liquidity and capital policies to support the successful execution of business strategies to meet operational needs and to satisfy applicable regulatory requirements under both normal and modeled stressed conditions. Our liquidity management policies are designed to mitigate the potential risk that we may be unable
42
to meet current and future cash flow needs. Management of our liquidity is accomplished by (1) daily monitoring of our cash flow needs at TD Ameritrade Holding Corporation (the "Parent") and its operating subsidiaries, and (2) performing periodic liquidity stress testing related to market and company-specific liquidity stress events in order to identify and plan for liquidity risk exposures.
We have historically financed our liquidity and capital needs primarily through the use of funds generated from subsidiary operations and from short-term borrowings. We have also issued common stock and long-term debt to finance mergers and acquisitions and for other corporate purposes. Our liquidity needs during fiscal year
2019
were financed primarily from our subsidiaries' earnings, cash on hand and borrowings. We plan to finance both our ordinary capital and liquidity needs in fiscal year
2020
primarily from our subsidiaries' earnings, cash on hand and borrowings.
Parent Company
The Parent conducts substantially all of its business through its operating subsidiaries, principally its broker-dealer and futures commission merchant ("FCM")/forex dealer member ("FDM") subsidiaries. Dividends from our subsidiaries are an important source of liquidity for the Parent. Some of our subsidiaries are subject to requirements of the Securities and Exchange Commission ("SEC"), the Financial Industry Regulatory Authority ("FINRA"), the Commodity Futures Trading Commission ("CFTC"), the National Futures Association ("NFA") and other regulators relating to liquidity, capital standards and the use of client funds and securities, which may limit funds available for the payment of dividends to the Parent.
During fiscal year 2019, we returned $1.67 billion, or approximately 72% of our non-GAAP net income (net income excluding amortization of intangible assets and acquisition-related expenses) to our stockholders through cash dividends and stock repurchases. During fiscal 2020, we plan to (1) return at least 90% of our non-GAAP net income to our stockholders through cash dividends and stock repurchases, (2) pay a quarterly cash dividend of at least $0.31 per share, and (3) repurchase a minimum of 15 million shares of our common stock. For more information about our dividends and stock repurchases, see "
Cash Dividends
" and "
Stock Repurchase Programs
" later in this section.
On October 30, 2018, we sold, through a public offering, $600 million aggregate principal amount of unsecured variable-rate senior notes due November 1, 2021 (the "2021 Notes") and $400 million aggregate principal amount of unsecured 3.750% senior notes due April 1, 2024 (the "2024 Notes"). We are using the net proceeds from the issuance of the 2021 Notes and the 2024 Notes for general corporate purposes and to augment liquidity. On August 13, 2019, we sold, through a public offering, $500 million aggregate principal amount of unsecured 2.750% senior notes due October 1, 2029 (the "2029 Notes"). We utilized the proceeds from the issuance of the 2029 Notes, together with cash on hand, to repay the $500 million aggregate principal amount and prepayment premium under our 5.600% senior notes (the "2019 Notes"), which were scheduled to mature on December 1, 2019. For additional details, see Note 11 Long-term Debt and Other Borrowings under Item 8, Financial Statements and Supplementary Data — Notes to Consolidated Financial Statements.
The Parent may make loans of cash or securities under committed and/or uncommitted lines of credit with each of its primary broker-dealer and FCM/FDM subsidiaries in order to provide liquidity. Liquidity could be used to fund increases in our subsidiaries' deposit requirements with clearinghouses, and to provide operating liquidity for client trading and investing activity in the normal course of business and during times of market volatility. Committed facilities of $1.25 billion and uncommitted facilities of $600 million under the Parent's intercompany credit agreements were available to its primary broker-dealer and FCM/FDM subsidiaries as of
September 30, 2019
. For more information about these credit agreements, see "
Long-term Debt and Other Borrowings
—
Intercompany Credit Agreements
" later in this section.
Broker-dealer and Futures Commission Merchant/Forex Dealer Member Subsidiaries
Our broker-dealer and FCM/FDM subsidiaries are subject to regulatory requirements that are intended to ensure their liquidity and general financial soundness. Under the SEC's Uniform Net Capital Rule (Rule 15c3-1 under the Securities Exchange Act of 1934, or the "Exchange Act"), our broker-dealer subsidiaries are required to maintain, at all times, at least the minimum level of net capital required under SEC Rule 15c3-1. For our clearing broker-dealer subsidiary, the minimum net capital level is determined by a calculation described in SEC Rule 15c3-1 that is primarily based on the broker-dealer's "aggregate debits," which primarily consist of client margin balances at
43
the clearing broker-dealer. Since our aggregate debits may fluctuate significantly, our minimum net capital requirements may also fluctuate significantly from period to period. The Parent may make cash capital contributions to our broker-dealer and FCM/FDM subsidiaries, if necessary, to meet minimum net capital requirements.
Each of our broker-dealer subsidiaries may not repay any subordinated borrowings, pay cash dividends or make any unsecured advances or loans to its parent company or employees if such payment would result in a net capital amount of less than (1) 5% of aggregate debit balances or (2) 120% of its minimum dollar requirement. TD Ameritrade Futures & Forex LLC ("TDAFF"), our FCM and FDM subsidiary, must provide notice to the CFTC if its adjusted net capital amounts to less than (1) 110% of its risk-based capital requirement under CFTC Regulation 1.17, (2) 150% of its $1.0 million minimum dollar requirement, or (3) 110% of $20.0 million plus 5% of all liabilities owed to forex clients in excess of $10.0 million. These broker-dealer, FCM and FDM net capital thresholds, which are specified in Rule 17a-11 under the Exchange Act and CFTC Regulations 1.12 and 5.6, are typically referred to as "early warning" net capital thresholds.
The following tables summarize our broker-dealer and FCM/FDM subsidiaries' net capital and adjusted net capital, respectively, as of
September 30, 2019
(dollars in millions):
|
Net Capital
|
Early Warning
Threshold
|
Net Capital in
Excess of
Early Warning
Threshold
|
||||||||||
|
TD Ameritrade Clearing, Inc.
|
$
|
3,188
|
|
$
|
1,232
|
|
$
|
1,956
|
|
|||
|
TD Ameritrade, Inc.
|
$
|
289
|
|
$
|
0.3
|
|
$
|
288
|
|
|||
|
Adjusted Net Capital
|
Early Warning
Threshold
|
Adjusted Net Capital in
Excess of
Early Warning
Threshold
|
||||||||||
|
TD Ameritrade Futures & Forex LLC
|
$
|
140
|
|
$
|
25
|
|
$
|
115
|
|
|||
Our clearing broker-dealer subsidiary, TD Ameritrade Clearing, Inc. ("TDAC"), engages in activities such as settling client securities transactions with clearinghouses, extending credit to clients through margin lending, securities lending and borrowing transactions and processing client cash sweep transactions to and from bank deposit accounts and money market mutual funds. These types of broker-dealer activities require active daily liquidity management.
Most of TDAC's assets are readily convertible to cash, consisting primarily of cash and investments segregated for the exclusive benefit of clients, receivables from clients and receivables from brokers, dealers and clearing organizations. Cash and investments segregated for the exclusive benefit of clients may be held in cash, reverse repurchase agreements (collateralized by U.S. government debt securities), U.S. Treasury securities, U.S. government agency mortgage-backed securities and other qualified securities. Receivables from clients consist of margin loans, which are demand loan obligations secured by readily marketable securities. Receivables from brokers, dealers and clearing organizations primarily arise from current open transactions, which usually settle or can be settled within a few business days.
TDAC is subject to cash deposit and collateral requirements with the Depository Trust & Clearing Corporation ("DTCC") and the Options Clearing Corporation ("OCC"), which may fluctuate significantly from time to time based on the nature and size of our clients' trading activity.
The following table sets forth TDAC's cash and investments deposited with clearing organizations for the clearing of client equity and option trades (dollars in millions):
|
September 30,
|
||||||||
|
|
2019
|
2018
|
||||||
|
TD Ameritrade Clearing, Inc.
|
$
|
703
|
|
$
|
585
|
|
||
Liquidity needs for TDAC relating to client trading and margin borrowing are met primarily through cash balances in client brokerage accounts and through lending and pledging of client margin securities. Cash balances in client brokerage accounts not used for client trading and margin borrowing activity are not generally available for other
44
liquidity purposes and must be segregated for the exclusive benefit of clients under Rule 15c3-3 of the Exchange Act.
Cash balances in client brokerage accounts are summarized in the following table (dollars in billions):
|
September 30,
|
||||||||
|
|
2019
|
2018
|
||||||
|
TD Ameritrade Clearing, Inc.
|
$
|
26.8
|
|
$
|
22.5
|
|
||
Cash and investments segregated in special reserve bank accounts for the exclusive benefit of clients under SEC Rule 15c3-3 are summarized in the following table (dollars in billions):
|
September 30,
|
||||||||
|
|
2019
|
2018
|
||||||
|
TD Ameritrade Clearing, Inc.
|
$
|
8.4
|
|
$
|
2.9
|
|
||
For general liquidity needs, TDAC currently maintains two senior unsecured committed revolving credit facilities with an aggregate principal amount of $1.45 billion. TDAC also utilizes secured uncommitted lines of credit for short-term liquidity needs. These facilities are described under "
Long-term Debt and Other Borrowings
"
later in this section.
In addition, we have established intercompany credit agreements under which the broker-dealer and FCM/FDM subsidiaries may borrow from the Parent. The Parent's intercompany credit agreements with TDAC provides for a committed revolving loan facility of $1.20 billion and an uncommitted revolving loan facility of $300 million. The intercompany credit agreements are described under "
Long-Term Debt and Other Borrowings
–
Intercompany Credit Agreements
" later in this section.
Liquid Assets
Liquid assets is a non-GAAP financial measure that we consider to be an important measure of our liquidity. We include the excess capital of our regulated subsidiaries in the calculation of liquid assets, rather than simply including the regulated subsidiaries' cash and cash equivalents, because capital requirements may limit the amount of cash available for dividend from the regulated subsidiaries to the parent company. Excess capital, as defined below, is generally available for dividend from the regulated subsidiaries to the parent company. Liquid assets should be considered as a supplemental measure of liquidity, rather than as a substitute for GAAP cash and cash equivalents.
Liquid assets may be utilized for general corporate purposes and is defined
as the sum of (1) corporate cash and cash equivalents, (2) corporate investments, less securities sold under agreements to repurchase, and (3) our regulated subsidiaries' net capital in excess of minimum operational targets established by management. Corporate cash and cash equivalents includes cash and cash equivalents from our investment advisory subsidiaries. Liquid assets is based on more conservative measures of net capital than regulatory requirements because we generally manage to higher levels of net capital at our regulated subsidiaries than the regulatory thresholds require.
The following table sets forth a reconciliation of cash and cash equivalents, which is the most directly comparable GAAP measure, to liquid assets (dollars in millions):
|
September 30,
|
Change
|
||||||||||||
|
2019
|
2018
|
||||||||||||
|
Cash and cash equivalents (GAAP)
|
$
|
2,852
|
|
$
|
2,690
|
|
$
|
162
|
|
||||
|
Less: Non-corporate cash and cash equivalents
|
(2,478
|
)
|
(2,307
|
)
|
(171
|
)
|
|||||||
|
Corporate cash and cash equivalents
|
374
|
|
383
|
|
(9
|
)
|
|||||||
|
Corporate investments
|
1,668
|
|
386
|
|
1,282
|
|
|||||||
|
Excess regulatory net capital over management targets
|
859
|
|
296
|
|
563
|
|
|||||||
|
Liquid assets (non-GAAP)
|
$
|
2,901
|
|
$
|
1,065
|
|
$
|
1,836
|
|
||||
45
The changes in liquid assets are summarized as follows (dollars in millions):
|
Liquid assets as of September 30, 2018
|
$
|
1,065
|
|
||||
|
Plus:
|
EBITDA
(1)
|
3,346
|
|
||||
|
Proceeds from issuance of long-term debt
|
1,498
|
|
|||||
|
Net decrease in cash collateral pledged to interest rate swap counterparties
|
156
|
|
|||||
|
Other changes in working capital and regulatory net capital
|
106
|
|
|||||
|
Other investing activities, net
|
20
|
|
|||||
|
Change in net capital related to daily futures client cash sweep
|
7
|
|
|||||
|
Less:
|
Purchase of treasury stock
|
(969
|
)
|
||||
|
Income taxes paid
|
(683
|
)
|
|||||
|
Payment of cash dividends
|
(667
|
)
|
|||||
|
Principal payment on long-term debt
|
(500
|
)
|
|||||
|
Purchase of property and equipment
|
(199
|
)
|
|||||
|
Interest paid
|
(154
|
)
|
|||||
|
Net payments on securities sold under agreements to repurchase
|
(96
|
)
|
|||||
|
Purchase of treasury stock for income tax withholding on stock-based compensation
|
(14
|
)
|
|||||
|
Payment of debt issuance costs
|
(12
|
)
|
|||||
|
Payment of prepayment premium on long-term debt
|
(3
|
)
|
|||||
|
Liquid assets as of September 30, 2019
|
$
|
2,901
|
|
||||
|
|
|
(1)
|
See "
Financial Performance Metrics
" earlier in this section for a description of EBITDA.
|
The following is a summary of our long-term debt and other borrowings. For additional details, see Note
11
—
Long-term Debt and Other Borrowings
under Item 8, Financial Statements and Supplementary Data — Notes to Consolidated Financial Statements.
Senior Notes
— As of September 30,
2019
, we had $3.55 billion aggregate principal amount of unsecured Senior Notes (together, the "Senior Notes"). Key information about the Senior Notes outstanding is summarized in the following table (dollars in millions):
|
Description
|
Date Issued
|
Maturity Date
|
Aggregate Principal
|
Interest Rate
|
||||
|
2021 Notes
|
October 30, 2018
|
November 1, 2021
|
$600
|
Variable
|
||||
|
2022 Notes
|
March 4, 2015
|
April 1, 2022
|
$750
|
2.950%
|
||||
|
2024 Notes
|
October 30, 2018
|
April 1, 2024
|
$400
|
3.750%
|
||||
|
2025 Notes
|
October 17, 2014
|
April 1, 2025
|
$500
|
3.625%
|
||||
|
2027 Notes
|
April 27, 2017
|
April 1, 2027
|
$800
|
3.300%
|
||||
|
2029 Notes
|
August 13, 2019
|
October 1, 2029
|
$500
|
2.750%
|
||||
Fair Value Hedging
—
We are exposed to changes in the fair value of our fixed-rate Senior Notes resulting from interest rate fluctuations. To hedge a vast majority of this exposure, we entered into fixed-for-variable interest rate swaps on each of the 2022 Notes, 2025 Notes, 2027 Notes and 2029 Notes (together, the "Hedged Senior Notes"). Each fixed-for-variable interest rate swap has a notional amount and a maturity date matching the aggregate principal amount and maturity date, respectively, for each of the respective Hedged Senior Notes. During September 2019, we paid in full the outstanding principal under the 2019 Notes and the interest rate swap on the 2019 Notes was terminated.
46
The interest rate swaps effectively change the fixed-rate interest on the Hedged Senior Notes to variable-rate interest. Under the terms of the interest rate swap agreements, we receive semi-annual fixed-rate interest payments based on the same rates applicable to the Hedged Senior Notes, and make quarterly variable-rate interest payments based on three-month LIBOR plus (1) 0.9486% for the swap on the 2022 Notes, (2) 1.1022% for the swap on the 2025 Notes, (3) 1.0340% for the swap on the 2027 Notes and (4) 1.2000% for the swap on the 2029 Notes. As of
September 30, 2019
, the weighted average effective interest rate on the aggregate principal balance of the Senior Notes was
3.27%
.
Lines of Credit
— TDAC utilizes secured uncommitted lines of credit for short-term liquidity. Under these secured uncommitted lines, TDAC borrows on either a demand or short-term basis from two unaffiliated banks and pledges client margin securities as collateral. Advances under the secured uncommitted lines are dependent on TDAC having acceptable collateral as determined by each secured uncommitted credit agreement. At September 30, 2019, the terms of the secured uncommitted credit agreements do not specify borrowing limits. The availability of TDAC's secured uncommitted lines is subject to approval by the individual banks each time an advance is requested and may be denied. There were no borrowings outstanding under the secured uncommitted lines of credit as of September 30, 2019.
Securities Sold Under Agreements to Repurchase (repurchase agreements)
—
Under repurchase agreements, we receive cash from the counterparty and provide U.S. government debt securities as collateral. Our repurchase agreements generally mature between 30 and 90 days following the transaction date and are accounted for as secured borrowings. There were no borrowings outstanding under repurchase agreements as of September 30, 2019.
TD Ameritrade Holding Corporation Senior Revolving Credit Facility
— The Parent has access to a senior unsecured committed revolving credit facility in the aggregate principal amount of $300 million (the "Parent Revolving Facility"). The maturity date of the Parent Revolving Facility is April 21, 2022. There were no borrowings outstanding under the Parent Revolving Facility as of
September 30, 2019
.
TD Ameritrade Clearing, Inc. Senior Revolving Credit Facilities
—
TDAC has access to two senior unsecured committed revolving credit facilities with an aggregate principal amount of $1.45 billion, consisting of a $600 million (the "$600 Million Revolving Facility") and an $850 million (the "$850 Million Revolving Facility") senior revolving facility. TDAC entered into the $850 Million Revolving Facility on May 16, 2019, replacing its prior $850 million senior unsecured committed revolving credit facility, which matured on the same date. The maturity dates of the $600 Million Revolving Facility and the $850 Million Revolving Facility are April 21, 2022 and May 14, 2020, respectively. There were no borrowings outstanding under the TDAC senior revolving facilities as of
September 30, 2019
.
Intercompany Credit Agreements
— The Parent has entered into credit agreements with each of its primary broker-dealer and FCM/FDM subsidiaries, under which the Parent may make loans of cash or securities under committed and/or uncommitted lines of credit. Key information about the committed and/or uncommitted lines of credit is summarized in the following table (dollars in millions):
|
Borrower Subsidiary
|
Committed Facility
|
Uncommitted Facility
(1)
|
Termination Date
|
|||
|
TD Ameritrade Clearing, Inc.
|
$1,200
|
$300
|
March 1, 2022
|
|||
|
TD Ameritrade, Inc.
|
N/A
|
$300
|
March 1, 2022
|
|||
|
TD Ameritrade Futures & Forex LLC
|
$45
|
N/A
|
August 11, 2021
|
|||
|
(1)
|
The Parent is permitted, but under no obligation, to make loans under uncommitted facilities.
|
There were no borrowings outstanding under the intercompany credit agreements as of
September 30, 2019
.
Stock Repurchase Programs
On November 20, 2015, our board of directors authorized the repurchase of up to 30 million shares of our common stock. During fiscal year 2019, we repurchased approximately 19.8 million shares at a weighted average purchase price of $50.40 per share. From the inception of this stock repurchase authorization through September 30, 2019, we have repurchased approximately 28.4 million shares at a weighted average purchase price of $48.25 per share.
47
As of
September 30, 2019
, we had approximately 1.6 million shares remaining under the November 20, 2015 stock repurchase authorization. On September 11, 2019, our board of directors authorized the repurchase of up to an additional 30 million shares of our common stock.
Cash Dividends
The following table summarizes dividends declared per quarter on our common stock for the fiscal years indicated:
|
2019
|
2018
|
2017
|
||||||||||
|
Dividends declared per quarter
|
$
|
0.30
|
|
$
|
0.21
|
|
$
|
0.18
|
|
|||
The following table summarizes the total dividends paid on our common stock for the fiscal years indicated (dollars in millions):
|
2019
|
2018
|
2017
|
||||||||||
|
Dividends paid
|
$
|
667
|
|
$
|
477
|
|
$
|
379
|
|
|||
We declared a $0.31 per share cash dividend on our common stock for the first quarter of fiscal year
2020
, which is payable on November 19, 2019 to all holders of record of our common stock as of November 5, 2019.
Off-Balance Sheet Arrangements
We enter into guarantees and other off-balance sheet arrangements in the ordinary course of business, primarily to meet the needs of our clients and to manage our asset-based revenues. For information on these arrangements, see the following sections under Item 8, Financial Statements and Supplementary Data — Notes to Consolidated Financial Statements: "
General Contingencies
" and "
Guarantees
" in Note
16
—
Commitments and Contingencies
and "
Insured Deposit Account Agreement
" in Note
23
—
Related Party Transactions
. Bank deposit account fees, generated from the IDA agreement and other sweep arrangements with non-affiliated third-party depository financial institutions, account for a significant percentage of our net revenues (29% of our net revenues for the fiscal year ended September 30,
2019
). These sweep arrangements enable our clients to invest in FDIC-insured (up to specified limits) deposit products without the need for the Company to establish the significant levels of capital that would be required to maintain our own bank charter.
48
Contractual Obligations
The following table summarizes our contractual obligations as of September 30,
2019
(dollars in millions):
|
Total
|
Payments Due by Period (Fiscal Years):
|
|||||||||||||||||||
|
Less than
1 year
|
1-3 years
|
3-5 years
|
More than
5 years
|
|||||||||||||||||
|
Contractual Obligations
|
2020
|
2021-22
|
2023-24
|
After 2024
|
||||||||||||||||
|
Long-term debt obligations
(1)
|
$
|
4,191
|
|
$
|
119
|
|
$
|
1,563
|
|
$
|
545
|
|
$
|
1,964
|
|
|||||
|
Operating lease obligations
|
476
|
|
72
|
|
119
|
|
94
|
|
191
|
|
||||||||||
|
Purchase obligations
(2)
|
197
|
|
128
|
|
47
|
|
9
|
|
13
|
|
||||||||||
|
Income taxes payable
(3)
|
222
|
|
222
|
|
—
|
|
—
|
|
—
|
|
||||||||||
|
Total
|
$
|
5,086
|
|
$
|
541
|
|
$
|
1,729
|
|
$
|
648
|
|
$
|
2,168
|
|
|||||
|
(1)
|
Represents scheduled principal payments, estimated interest payments and commitment fees pursuant to the Senior Notes, the interest rate swaps and the revolving credit facilities. Actual amounts of interest may vary depending on changes in variable interest rates associated with the interest rate swaps.
|
|
(2)
|
Purchase obligations primarily relate to agreements for goods and services such as professional services, software, employee compensation and benefits, telecommunications, market information and advertising and marketing.
|
|
(3)
|
A significant portion of our income taxes payable as of September 30,
2019
consists of liabilities for uncertain tax positions and related interest and penalties. The timing of payments, if any, on liabilities for uncertain tax positions cannot be predicted with reasonable accuracy.
|
Item 7A.
Quantitative and Qualitative Disclosures About Market Risk
Market risk generally represents the risk of loss that may result from the potential change in the value of a financial instrument as a result of fluctuations in interest rates and market prices. We have established policies, procedures and internal processes governing our management of market risks in the normal course of our business operations.
Market-related Credit Risk
Two primary sources of credit risk inherent in our business are (1) client credit risk related to margin lending and leverage and (2) counterparty credit risk related to securities lending and borrowing. We manage client margin lending and leverage risk by requiring clients to maintain margin collateral in compliance with regulatory and internal guidelines. The risks associated with margin lending and leverage increase during periods of rapid market movements, or in cases where leverage or collateral is concentrated and market movements occur. We monitor required margin levels daily and, pursuant to such guidelines, require our clients to deposit additional collateral, or to reduce positions, when necessary. We continuously monitor client accounts to detect excessive concentration, large orders or positions, patterns of day trading and other activities that may indicate increased risk to us. We manage risks associated with our securities lending and borrowing activities by requiring credit approvals for counterparties, by monitoring the market value of securities loaned and collateral values for securities borrowed on a daily basis and requiring additional cash as collateral for securities loaned or return of collateral for securities borrowed when necessary, and by participating in a risk-sharing program offered through the Options Clearing Corporation.
We are party to interest rate swaps related to our long-term debt, which are subject to counterparty credit risk. Credit risk on derivative financial instruments is managed by limiting activity to approved counterparties that meet a minimum credit rating threshold and by entering into credit support agreements, or by utilizing approved central clearing counterparties registered with the Commodity Futures Trading Commission. Our interest rate swaps require daily collateral coverage, in the form of cash or U.S. Treasury securities, for the aggregate fair value of the interest rate swaps.
49
Interest Rate Risk
As a fundamental part of our brokerage business, we invest in interest-earning assets and are obligated on interest-bearing liabilities. In addition, we earn fees on our bank deposit account arrangements and on money market mutual funds, which are subject to interest rate risk. Changes in interest rates could affect the interest earned on assets differently than interest paid on liabilities. A rising interest rate environment generally results in us earning a larger net interest spread. Conversely, a falling interest rate environment generally results in us earning a smaller net interest spread.
Our most prevalent form of interest rate risk is referred to as "gap" risk. Gap risk occurs when the interest rates we earn on assets change at a different frequency or amount than the interest rates we pay on liabilities. For example, in a low interest rate environment, sharp increases in short-term interest rates could result in net interest spread compression if the yields paid on interest-bearing client balances were to increase faster than our earnings on interest-earning assets. We seek to mitigate interest rate risk by aligning the average duration of interest-earning assets with that of interest-bearing liabilities. As of September 30,
2019
, our consolidated duration was 1.7 years. We have an Asset/Liability Committee serve as the governance body with the responsibility of managing interest rate risk, including gap risk.
We use net interest simulation modeling techniques to evaluate the effect that changes in interest rates might have on pre-tax income. Our model includes all interest-sensitive assets and liabilities of the Company and interest-sensitive assets and liabilities associated with bank deposit account arrangements. The simulations involve assumptions that are inherently uncertain and, as a result, cannot precisely predict the impact that changes in interest rates will have on pre-tax income. Actual results may differ from simulated results due to differences in timing and frequency of rate changes, changes in market conditions and changes in management strategy that lead to changes in the mix of interest-sensitive assets and liabilities.
The simulations assume that the asset and liability structure of our Consolidated Balance Sheet and client bank deposit account balances would not be changed as a result of a simulated change in interest rates. The results of the simulations based on our financial position as of September 30,
2019
indicate that a gradual 1% (100 basis points) increase in interest rates over a 12-month period would result in a range of approximately $160 million to $245 million higher pre-tax income and a gradual 1% (100 basis points) decrease in interest rates over a 12-month period would result in a range of approximately $250 million to $290 million lower pre-tax income, depending largely on the extent and timing of possible increases in payment rates on client cash balances and interest rates charged on client margin balances.
Other Market Risks
Substantially all of our revenues and financial instruments are denominated in U.S. dollars. We generally do not enter into derivative transactions, except for hedging purposes.
50
Item 8.
Financial Statements and Supplementary Data
Report of Independent Registered Public Accounting Firm
To the Shareholders and the Board of Directors of TD Ameritrade Holding Corporation
Opinion on the Financial Statements
We have audited the accompanying consolidated balance sheets of TD Ameritrade Holding Corporation (the Company) as of September 30,
2019
and
2018
, and the related consolidated statements of income, comprehensive income, stockholders' equity, and cash flows for each of the three years in the period ended September 30,
2019
, and the related notes (collectively referred to as the "consolidated financial statements"). In our opinion, the consolidated financial statements present fairly, in all material respects, the financial position of the Company at September 30,
2019
and
2018
, and the results of its operations and its cash flows for each of the three years in the period ended September 30,
2019
, in conformity with U.S. generally accepted accounting principles.
We also have audited, in accordance with the standards of the Public Company Accounting Oversight Board (United States) (PCAOB), the Company's internal control over financial reporting as of September 30,
2019
, based on criteria established in Internal Control — Integrated Framework issued by the Committee of Sponsoring Organizations of the Treadway Commission (2013 framework) and our report dated
November 15, 2019
expressed an unqualified opinion thereon.
Basis for Opinion
These financial statements are the responsibility of the Company's management. Our responsibility is to express an opinion on the Company's financial statements based on our audits. We are a public accounting firm registered with the PCAOB and are required to be independent with respect to the Company in accordance with the U.S. federal securities laws and the applicable rules and regulations of the Securities and Exchange Commission and the PCAOB.
We conducted our audits in accordance with the standards of the PCAOB. Those standards require that we plan and perform the audit to obtain reasonable assurance about whether the financial statements are free of material misstatement, whether due to error or fraud. Our audits included performing procedures to assess the risks of material misstatement of the financial statements, whether due to error or fraud, and performing procedures that respond to those risks. Such procedures included examining, on a test basis, evidence regarding the amounts and disclosures in the financial statements. Our audits also included evaluating the accounting principles used and significant estimates made by management, as well as evaluating the overall presentation of the financial statements. We believe that our audits provide a reasonable basis for our opinion.
Critical Audit Matter
The critical audit matter communicated below is a matter arising from the current period audit of the financial statements that was communicated or required to be communicated to the audit committee and that: (1) relates to accounts or disclosures that are material to the financial statements and (2) involved our especially challenging, subjective or complex judgments. The communication of the critical audit matter does not alter in any way our opinion on the consolidated financial statements, taken as a whole, and we are not, by communicating the critical audit matter below, providing a separate opinion on the critical audit matter or on the accounts or disclosures to which it relates.
51
|
Uncertain Tax Positions
|
||
|
Description of the Matter
|
The Company has uncertain tax positions as discussed in Note 12 to the consolidated financial statements. Uncertainty in a tax position may arise as tax laws are subject to interpretation. The Company uses significant judgment in (1) determining if the tax position is more likely than not to be sustained upon examination, based on the technical merits of the position and (2) measuring the amount of tax benefit that qualifies for recognition. As of September 30, 2019, the Company had unrecognized tax benefits of $193 million for uncertain tax positions.
|
|
|
Auditing management's estimate of the amount of tax benefit related to the Company's uncertain tax positions that qualified for recognition involved especially challenging auditor judgment because management's estimate required significant judgment in evaluating the technical merits of the positions, including interpretations of applicable tax laws and regulations.
|
||
|
How We Addressed the Matter in Our Audit
|
We obtained an understanding, evaluated the design, and tested the operating effectiveness of controls over the Company's accounting process for uncertain tax positions. For example, this included controls over the Company's assessment of the technical merits of tax positions and management's process to measure the benefit of those tax positions that qualified for recognition.
|
|
|
We involved our tax professionals to assess the technical merits of the Company's tax positions. Our audit procedures included, among others, assessing the positions the Company has taken on its tax returns to evaluate the completeness and accuracy of the underlying data, inspecting correspondence with the relevant tax authorities, and evaluating third-party advice obtained and used by the Company in assessing the technical merits of its tax positions. Additionally, we evaluated management's application of the applicable tax laws and regulations based on relevant case law and tax authority interpretations. For example, we evaluated the appropriateness of the jurisdictions and statutes of limitations used to determine the amount of tax benefit recognized based on where the Company conducts business and the applicable tax laws and regulations, and tested the completeness and accuracy of the data used by the Company, including the mathematical accuracy of the Company's calculations.
|
||
/s/ ERNST & YOUNG LLP
We have served as the Company's auditor since 2005.
New York, New York
November 15, 2019
52
TD AMERITRADE HOLDING CORPORATION
As of September 30,
2019
and
2018
|
2019
|
2018
|
|||||||
|
(In millions)
|
||||||||
|
ASSETS
|
||||||||
|
Cash and cash equivalents
|
$
|
|
|
$
|
|
|
||
|
Cash and investments segregated and on deposit for regulatory purposes
|
|
|
|
|
||||
|
Receivable from brokers, dealers and clearing organizations
|
|
|
|
|
||||
|
Receivable from clients, net
|
|
|
|
|
||||
|
Receivable from affiliates
|
|
|
|
|
||||
|
Other receivables, net
|
|
|
|
|
||||
|
Securities owned, at fair value
|
|
|
|
|
||||
|
Investments available-for-sale, at fair value
|
|
|
|
|
||||
|
Property and equipment at cost, net
|
|
|
|
|
||||
|
Goodwill
|
|
|
|
|
||||
|
Acquired intangible assets, net
|
|
|
|
|
||||
|
Other assets
|
|
|
|
|
||||
|
Total assets
|
$
|
|
|
$
|
|
|
||
|
LIABILITIES AND STOCKHOLDERS' EQUITY
|
||||||||
|
Liabilities:
|
||||||||
|
Payable to brokers, dealers and clearing organizations
|
$
|
|
|
$
|
|
|
||
|
Payable to clients
|
|
|
|
|
||||
|
Accounts payable and other liabilities
|
|
|
|
|
||||
|
Payable to affiliates
|
|
|
|
|
||||
|
Other borrowings
|
|
|
|
|
||||
|
Long-term debt
|
|
|
|
|
||||
|
Deferred income taxes
|
|
|
|
|
||||
|
Total liabilities
|
|
|
|
|
||||
|
Stockholders' equity:
|
||||||||
|
Preferred stock, $0.01 par value, 100 million shares authorized; none issued
|
|
|
|
|
||||
|
Common stock, $0.01 par value, one billion shares authorized; 670 million shares issued; 2019 — 544 million shares outstanding; 2018 — 563 million shares outstanding
|
|
|
|
|
||||
|
Additional paid-in capital
|
|
|
|
|
||||
|
Retained earnings
|
|
|
|
|
||||
|
Treasury stock, common, at cost: 2019 — 126 million shares;
2018 — 107 million shares
|
(
|
)
|
(
|
)
|
||||
|
Deferred compensation
|
|
|
|
|
||||
|
Accumulated other comprehensive income (loss)
|
|
|
(
|
)
|
||||
|
Total stockholders' equity
|
|
|
|
|
||||
|
Total liabilities and stockholders' equity
|
$
|
|
|
$
|
|
|
||
See notes to consolidated financial statements.
53
TD AMERITRADE HOLDING CORPORATION
CONSOLIDATED STATEMENTS OF INCOME
For the Years Ended September 30,
2019
,
2018
and
2017
|
2019
|
2018
|
2017
|
||||||||||
|
(In millions, except per share amounts)
|
||||||||||||
|
Revenues:
|
||||||||||||
|
Transaction-based revenues:
|
||||||||||||
|
Commissions and transaction fees
|
$
|
|
|
$
|
|
|
$
|
|
|
|||
|
Asset-based revenues:
|
||||||||||||
|
Bank deposit account fees
|
|
|
|
|
|
|
||||||
|
Net interest revenue
|
|
|
|
|
|
|
||||||
|
Investment product fees
|
|
|
|
|
|
|
||||||
|
Total asset-based revenues
|
|
|
|
|
|
|
||||||
|
Other revenues
|
|
|
|
|
|
|
||||||
|
Net revenues
|
|
|
|
|
|
|
||||||
|
Operating expenses:
|
||||||||||||
|
Employee compensation and benefits
|
|
|
|
|
|
|
||||||
|
Clearing and execution costs
|
|
|
|
|
|
|
||||||
|
Communications
|
|
|
|
|
|
|
||||||
|
Occupancy and equipment costs
|
|
|
|
|
|
|
||||||
|
Depreciation and amortization
|
|
|
|
|
|
|
||||||
|
Amortization of acquired intangible assets
|
|
|
|
|
|
|
||||||
|
Professional services
|
|
|
|
|
|
|
||||||
|
Advertising
|
|
|
|
|
|
|
||||||
|
Other
|
|
|
|
|
|
|
||||||
|
Total operating expenses
|
|
|
|
|
|
|
||||||
|
Operating income
|
|
|
|
|
|
|
||||||
|
Other expense (income):
|
||||||||||||
|
Interest on borrowings
|
|
|
|
|
|
|
||||||
|
Gain on business-related divestiture
|
(
|
)
|
|
|
|
|
||||||
|
Loss on sale of investments
|
|
|
|
|
|
|
||||||
|
Other, net
|
(
|
)
|
|
|
|
|
||||||
|
Total other expense (income)
|
|
|
|
|
|
|
||||||
|
Pre-tax income
|
|
|
|
|
|
|
||||||
|
Provision for income taxes
|
|
|
|
|
|
|
||||||
|
Net income
|
$
|
|
|
$
|
|
|
$
|
|
|
|||
|
Earnings per share — basic
|
$
|
|
|
$
|
|
|
$
|
|
|
|||
|
Earnings per share — diluted
|
$
|
|
|
$
|
|
|
$
|
|
|
|||
|
Weighted average shares outstanding — basic
|
|
|
|
|
|
|
||||||
|
Weighted average shares outstanding — diluted
|
|
|
|
|
|
|
||||||
See notes to consolidated financial statements.
54
TD AMERITRADE HOLDING CORPORATION
CONSOLIDATED STATEMENTS OF COMPREHENSIVE INCOME
For the Years Ended September 30,
2019
,
2018
and
2017
|
2019
|
2018
|
2017
|
||||||||||
|
(In millions)
|
||||||||||||
|
Net income
|
$
|
|
|
$
|
|
|
$
|
|
|
|||
|
Other comprehensive income (loss), before tax:
|
||||||||||||
|
Investments available-for-sale:
|
||||||||||||
|
Unrealized gain (loss)
|
|
|
(
|
)
|
(
|
)
|
||||||
|
Reclassification adjustment for realized loss included in net income
|
|
|
|
|
|
|
||||||
|
Net change in investments available-for-sale
|
|
|
(
|
)
|
(
|
)
|
||||||
|
Cash flow hedging instruments:
|
||||||||||||
|
Reclassification adjustment for portion of realized loss amortized to net income
|
|
|
|
|
|
|
||||||
|
Total other comprehensive income (loss), before tax
|
|
|
|
|
(
|
)
|
||||||
|
Income tax effect
|
(
|
)
|
(
|
)
|
|
|
||||||
|
Total other comprehensive income (loss), net of tax
|
|
|
|
|
(
|
)
|
||||||
|
Comprehensive income
|
$
|
|
|
$
|
|
|
$
|
|
|
|||
See notes to consolidated financial statements.
55
TD AMERITRADE HOLDING CORPORATION
CONSOLIDATED STATEMENTS OF STOCKHOLDERS' EQUITY
For the Years Ended September 30,
2019
,
2018
and
2017
|
Total
Common
Shares
Outstanding
|
Total
Stockholders' Equity |
Common
Stock
|
Additional
Paid-In
Capital
|
Retained
Earnings
|
Treasury
Stock
|
Deferred Compensation
|
Accumulated
Other
Comprehensive
Income (Loss)
|
||||||||||||||||||||||||
|
(In millions)
|
|||||||||||||||||||||||||||||||
|
Balance, September 30, 2016
|
|
|
$
|
|
|
$
|
|
|
$
|
|
|
$
|
|
|
$
|
(
|
)
|
$
|
|
|
$
|
(
|
)
|
||||||||
|
Net income
|
—
|
|
|
|
—
|
|
—
|
|
|
|
—
|
|
—
|
|
—
|
|
|||||||||||||||
|
Other comprehensive loss, net of tax
|
—
|
|
(
|
)
|
—
|
|
—
|
|
—
|
|
—
|
|
—
|
|
(
|
)
|
|||||||||||||||
|
Common stock dividends ($0.72 per share)
|
—
|
|
(
|
)
|
—
|
|
—
|
|
(
|
)
|
—
|
|
—
|
|
—
|
|
|||||||||||||||
|
Issuance of common stock
|
|
|
|
|
—
|
|
|
|
—
|
|
—
|
|
—
|
|
—
|
|
|||||||||||||||
|
Acquisition of Scottrade Financial Services, Inc.
|
|
|
|
|
|
|
|
|
—
|
|
—
|
|
—
|
|
—
|
|
|||||||||||||||
|
Repurchases of common stock for income tax withholding on stock-based compensation
|
(
|
)
|
(
|
)
|
—
|
|
—
|
|
—
|
|
(
|
)
|
—
|
|
—
|
|
|||||||||||||||
|
Common stock issued for stock-based compensation, including tax effects
|
|
|
|
|
—
|
|
|
|
—
|
|
|
|
—
|
|
—
|
|
|||||||||||||||
|
Deferred compensation
|
—
|
|
|
|
—
|
|
—
|
|
—
|
|
—
|
|
|
|
—
|
|
|||||||||||||||
|
Stock-based compensation
|
—
|
|
|
|
—
|
|
|
|
—
|
|
—
|
|
—
|
|
—
|
|
|||||||||||||||
|
Balance, September 30, 2017
|
|
|
|
|
|
|
|
|
|
|
(
|
)
|
|
|
(
|
)
|
|||||||||||||||
|
Net income
|
—
|
|
|
|
—
|
|
—
|
|
|
|
—
|
|
—
|
|
—
|
|
|||||||||||||||
|
Other comprehensive income, net of tax
|
—
|
|
|
|
—
|
|
—
|
|
—
|
|
—
|
|
—
|
|
|
|
|||||||||||||||
|
Common stock dividends ($0.84 per share)
|
—
|
|
(
|
)
|
—
|
|
—
|
|
(
|
)
|
—
|
|
—
|
|
—
|
|
|||||||||||||||
|
Repurchases of common stock
|
(
|
)
|
(
|
)
|
—
|
|
—
|
|
—
|
|
(
|
)
|
—
|
|
—
|
|
|||||||||||||||
|
Future treasury stock purchases under accelerated stock repurchase agreement
|
—
|
|
(
|
)
|
—
|
|
(
|
)
|
—
|
|
—
|
|
—
|
|
—
|
|
|||||||||||||||
|
Repurchases of common stock for income tax withholding on stock-based compensation
|
—
|
|
(
|
)
|
—
|
|
—
|
|
—
|
|
(
|
)
|
—
|
|
—
|
|
|||||||||||||||
|
Common stock issued for stock-based compensation, including tax effects
|
|
|
|
|
—
|
|
(
|
)
|
—
|
|
|
|
—
|
|
—
|
|
|||||||||||||||
|
Deferred compensation
|
—
|
|
|
|
—
|
|
—
|
|
—
|
|
(
|
)
|
|
|
—
|
|
|||||||||||||||
|
Stock-based compensation
|
—
|
|
|
|
—
|
|
|
|
—
|
|
—
|
|
—
|
|
—
|
|
|||||||||||||||
|
Adoption of Accounting Standards Update 2018-02
|
—
|
|
—
|
|
—
|
|
—
|
|
|
|
—
|
|
—
|
|
(
|
)
|
|||||||||||||||
|
Balance, September 30, 2018
|
|
|
$
|
|
|
$
|
|
|
$
|
|
|
$
|
|
|
$
|
(
|
)
|
$
|
|
|
$
|
(
|
)
|
||||||||
See notes to consolidated financial statements.
56
TD AMERITRADE HOLDING CORPORATION
CONSOLIDATED STATEMENTS OF STOCKHOLDERS' EQUITY — (Continued)
|
Total
Common
Shares
Outstanding
|
Total
Stockholders' Equity |
Common
Stock
|
Additional
Paid-In
Capital
|
Retained
Earnings
|
Treasury
Stock
|
Deferred Compensation
|
Accumulated
Other
Comprehensive
Income (Loss)
|
||||||||||||||||||||||||
|
(In millions)
|
|||||||||||||||||||||||||||||||
|
Balance, September 30, 2018
|
|
|
$
|
|
|
$
|
|
|
$
|
|
|
$
|
|
|
$
|
(
|
)
|
$
|
|
|
$
|
(
|
)
|
||||||||
|
Net income
|
—
|
|
|
|
—
|
|
—
|
|
|
|
—
|
|
—
|
|
—
|
|
|||||||||||||||
|
Other comprehensive income, net of tax
|
—
|
|
|
|
—
|
|
—
|
|
—
|
|
—
|
|
—
|
|
|
|
|||||||||||||||
|
Common stock dividends ($1.20 per share)
|
—
|
|
(
|
)
|
—
|
|
—
|
|
(
|
)
|
—
|
|
—
|
|
—
|
|
|||||||||||||||
|
Repurchases of common stock
|
(
|
)
|
(
|
)
|
—
|
|
|
|
—
|
|
(
|
)
|
—
|
|
—
|
|
|||||||||||||||
|
Repurchases of common stock for income tax withholding on stock-based compensation
|
—
|
|
(
|
)
|
—
|
|
—
|
|
—
|
|
(
|
)
|
—
|
|
—
|
|
|||||||||||||||
|
Common stock issued for stock-based compensation, including tax effects
|
|
|
—
|
|
—
|
|
(
|
)
|
—
|
|
|
|
—
|
|
—
|
|
|||||||||||||||
|
Deferred compensation
|
—
|
|
(
|
)
|
—
|
|
—
|
|
—
|
|
—
|
|
(
|
)
|
—
|
|
|||||||||||||||
|
Stock-based compensation
|
—
|
|
|
|
—
|
|
|
|
—
|
|
—
|
|
—
|
|
—
|
|
|||||||||||||||
|
Adoption of Accounting Standards Update 2014-09 (Note 22)
|
—
|
|
|
|
—
|
|
—
|
|
|
|
—
|
|
—
|
|
—
|
|
|||||||||||||||
|
Balance, September 30, 2019
|
|
|
$
|
|
|
$
|
|
|
$
|
|
|
$
|
|
|
$
|
(
|
)
|
$
|
|
|
$
|
|
|
||||||||
See notes to consolidated financial statements.
57
TD AMERITRADE HOLDING CORPORATION
For the Years Ended September 30,
2019
,
2018
and
2017
|
2019
|
2018
|
2017
|
||||||||||
|
|
(In millions)
|
|||||||||||
|
Cash flows from operating activities:
|
||||||||||||
|
Net income
|
$
|
|
|
$
|
|
|
$
|
|
|
|||
|
Adjustments to reconcile net income to net cash provided by (used in) operating activities:
|
||||||||||||
|
Depreciation and amortization
|
|
|
|
|
|
|
||||||
|
Amortization of acquired intangible assets
|
|
|
|
|
|
|
||||||
|
Deferred income taxes
|
|
|
(
|
)
|
(
|
)
|
||||||
|
Gain on business-related divestiture
|
(
|
)
|
|
|
|
|
||||||
|
Loss on sale of investments
|
|
|
|
|
|
|
||||||
|
Stock-based compensation
|
|
|
|
|
|
|
||||||
|
Provision for doubtful accounts on client and other receivables
|
|
|
|
|
|
|
||||||
|
Other, net
|
|
|
|
|
|
|
||||||
|
Changes in operating assets and liabilities:
|
||||||||||||
|
Investments segregated and on deposit for regulatory purposes
|
(
|
)
|
|
|
|
|
||||||
|
Receivable from brokers, dealers and clearing organizations
|
(
|
)
|
(
|
)
|
|
|
||||||
|
Receivable from clients, net
|
|
|
(
|
)
|
(
|
)
|
||||||
|
Receivable from/payable to affiliates, net
|
(
|
)
|
(
|
)
|
(
|
)
|
||||||
|
Other receivables, net
|
(
|
)
|
(
|
)
|
|
|
||||||
|
Securities owned, at fair value
|
(
|
)
|
|
|
(
|
)
|
||||||
|
Other assets
|
(
|
)
|
(
|
)
|
(
|
)
|
||||||
|
Payable to brokers, dealers and clearing organizations
|
|
|
|
|
|
|
||||||
|
Payable to clients
|
|
|
(
|
)
|
(
|
)
|
||||||
|
Accounts payable and other liabilities
|
|
|
(
|
)
|
|
|
||||||
|
Net cash provided by (used in) operating activities
|
|
|
(
|
)
|
|
|
||||||
|
Cash flows from investing activities:
|
||||||||||||
|
Purchase of property and equipment
|
(
|
)
|
(
|
)
|
(
|
)
|
||||||
|
Proceeds from sale of property and equipment
|
|
|
|
|
|
|
||||||
|
Cash received from business-related divestiture
|
|
|
|
|
|
|
||||||
|
Cash paid in business acquisition, net of cash and cash equivalents acquired
|
|
|
(
|
)
|
(
|
)
|
||||||
|
Restricted cash and restricted cash equivalents acquired in business acquisition
|
|
|
|
|
|
|
||||||
|
Purchase of short-term investments
|
(
|
)
|
(
|
)
|
(
|
)
|
||||||
|
Proceeds from sale and maturity of short-term investments
|
|
|
|
|
|
|
||||||
|
Purchase of investments available-for-sale, at fair value
|
(
|
)
|
(
|
)
|
|
|
||||||
|
Proceeds from sale of investments available-for-sale, at fair value
|
|
|
|
|
|
|
||||||
|
Other, net
|
|
|
(
|
)
|
|
|
||||||
|
Net cash provided by (used in) investing activities
|
(
|
)
|
|
|
|
|
||||||
See notes to consolidated financial statements.
58
TD AMERITRADE HOLDING CORPORATION
CONSOLIDATED STATEMENTS OF CASH FLOWS — (Continued)
|
2019
|
2018
|
2017
|
||||||||||
|
(In millions)
|
||||||||||||
|
Cash flows from financing activities:
|
||||||||||||
|
Proceeds from issuance of long-term debt
|
$
|
|
|
$
|
|
|
$
|
|
|
|||
|
Payment of debt issuance costs
|
(
|
)
|
(
|
)
|
(
|
)
|
||||||
|
Principal payments on long-term debt
|
(
|
)
|
|
|
(
|
)
|
||||||
|
Reimbursement (payment) of prepayment premium on long-term debt
|
(
|
)
|
|
|
(
|
)
|
||||||
|
Proceeds from senior revolving credit facilities
|
|
|
|
|
|
|
||||||
|
Principal payments on senior revolving credit facilities
|
(
|
)
|
(
|
)
|
|
|
||||||
|
Net proceeds from (payments on) securities sold under agreements to repurchase
|
(
|
)
|
(
|
)
|
|
|
||||||
|
Payment of cash dividends
|
(
|
)
|
(
|
)
|
(
|
)
|
||||||
|
Proceeds from issuance of common stock
|
|
|
|
|
|
|
||||||
|
Proceeds from exercise of stock options
|
|
|
|
|
|
|
||||||
|
Purchase of treasury stock
|
(
|
)
|
(
|
)
|
|
|
||||||
|
Purchase of treasury stock for income tax withholding on stock-based compensation
|
(
|
)
|
(
|
)
|
(
|
)
|
||||||
|
Payment for future treasury stock purchases under accelerated stock repurchase agreement
|
|
|
(
|
)
|
|
|
||||||
|
Net cash provided by (used in) financing activities
|
(
|
)
|
(
|
)
|
|
|
||||||
|
Net increase (decrease) in cash, cash equivalents, restricted cash and restricted cash equivalents
|
|
|
(
|
)
|
|
|
||||||
|
Cash, cash equivalents, restricted cash and restricted cash equivalents at beginning of year
|
|
|
|
|
|
|
||||||
|
Cash, cash equivalents, restricted cash and restricted cash equivalents at end of year
|
$
|
|
|
$
|
|
|
$
|
|
|
|||
|
Supplemental cash flow information:
|
||||||||||||
|
Interest paid
|
$
|
|
|
$
|
|
|
$
|
|
|
|||
|
Income taxes paid
|
$
|
|
|
$
|
|
|
$
|
|
|
|||
|
Noncash investing activities:
|
||||||||||||
|
Issuance of common stock in acquisition
|
$
|
|
|
$
|
|
|
$
|
|
|
|||
See notes to consolidated financial statements.
59
TD AMERITRADE HOLDING CORPORATION
NOTES TO CONSOLIDATED FINANCIAL STATEMENTS
For the Years Ended September 30,
2019
,
2018
and
2017
1
.
Nature of Operations and Summary of Significant Accounting Policies
Basis of Presentation
— The consolidated financial statements include the accounts of TD Ameritrade Holding Corporation (the "Parent"), a Delaware corporation, and its wholly-owned subsidiaries (collectively, the "Company"). Intercompany balances and transactions have been eliminated.
Nature of Operations
— The Company provides securities brokerage services, including trade execution, clearing services and margin lending, through its broker-dealer subsidiaries; futures and foreign exchange trade execution services through its futures commission merchant ("FCM") and forex dealer member ("FDM") subsidiary; and bundled retirement plan solutions to plan sponsors and their advisors through its state-chartered trust company subsidiary. The Company also provides cash sweep and deposit account products through third-party relationships, including relationships with affiliates. On June 28, 2019, pursuant to an Asset Purchase Agreement, TD Ameritrade Trust Company ("TDATC"), an indirect wholly-owned subsidiary of the Company, sold its retirement plan custody and trust assets. The sale of the retirement plan custody and trust assets resulted in a
$
60
million
gain, which is included in gain on business-related divestiture on the Consolidated Statements of Income.
The Company's broker-dealer subsidiaries are subject to regulation by the Securities and Exchange Commission ("SEC"), the Financial Industry Regulatory Authority ("FINRA") and the various exchanges in which they maintain membership. The Company's FCM/FDM subsidiary is subject to regulation by the Commodity Futures Trading Commission ("CFTC") and the National Futures Association ("NFA"). Dividends from the Company's broker-dealer, FCM/FDM and trust company subsidiaries are a source of liquidity for the Parent. Requirements of the SEC, FINRA and CFTC relating to liquidity, net capital standards and the use of client funds and securities may limit funds available for the payment of dividends from the broker-dealer and FCM/FDM subsidiaries to the holding company. State regulatory requirements may limit funds available for the payment of dividends from the trust company subsidiary to the holding company.
Use of Estimates
— The preparation of consolidated financial statements in conformity with U.S. generally accepted accounting principles ("GAAP") requires management to make estimates and assumptions that affect the reported amount of assets and liabilities and disclosure of contingent assets and liabilities at the date of the consolidated financial statements and the reported amounts of revenues and expenses during the reporting period. Actual results could differ from those estimates.
Cash and Cash Equivalents
— The Company considers temporary, highly-liquid investments with an original maturity of
three months
or less to be cash equivalents.
Cash and Investments Segregated and on Deposit for Regulatory Purposes
— Cash and investments segregated and on deposit for regulatory purposes consists primarily of qualified deposits in special reserve bank accounts for the exclusive benefit of clients under Rule 15c3-3 of the Securities Exchange Act of 1934 (the "Exchange Act") and other regulations. Funds can be held in cash, reverse repurchase agreements, U.S. Treasury securities, U.S. government agency mortgage-backed securities and other qualified securities. Reverse repurchase agreements (securities purchased under agreements to resell) are treated as collateralized financing transactions and are carried at amounts at which the securities will subsequently be resold, plus accrued interest. The Company's reverse repurchase agreements are collateralized by U.S. government debt securities and generally have a maturity of
seven days
. Cash and investments segregated and on deposit for regulatory purposes also includes amounts that have been segregated or secured for the benefit of futures clients according to the regulations of the CFTC governing futures commission merchants.
Securities Borrowed and Securities Loaned
— Securities borrowed and securities loaned transactions are recorded at the amount of cash collateral provided or received. Securities borrowed transactions require the Company to provide the counterparty with collateral in the form of cash. The Company receives collateral in the form of cash for securities loaned transactions. For these transactions, the fees earned or incurred by the Company are recorded as net interest revenue on the Consolidated Statements of Income. The related interest receivable from and the
60
TD AMERITRADE HOLDING CORPORATION
NOTES TO CONSOLIDATED FINANCIAL STATEMENTS — (Continued)
brokerage interest payable to broker-dealers are included in other receivables and in accounts payable and other liabilities, respectively, on the Consolidated Balance Sheets.
Receivable from/Payable to Clients
— Receivable from clients primarily consists of margin loans to securities brokerage clients, which are collateralized by client securities, and is carried at the amount receivable, net of an allowance for doubtful accounts that is primarily based on the amount of unsecured margin balances. Payable to clients primarily consists of client cash held in brokerage accounts and is carried at the amount of client cash on deposit. The Company earns interest revenue and pays interest expense on its receivable from client and payable to client balances, respectively. The interest revenue and expense are included in net interest revenue on the Consolidated Statements of Income.
Securities Owned
— Securities owned by our broker-dealer subsidiaries are recorded on a trade-date basis and carried at fair value, and the related changes in fair value are generally included in other revenues on the Consolidated Statements of Income.
Investments Available-for-sale
— Investments available-for-sale are carried at fair value and unrealized gains and losses, net of deferred income taxes, are reflected as a component of accumulated other comprehensive income (loss) on the Consolidated Balance Sheets. Realized gains and losses on investments available-for-sale are determined on the specific identification method and are reflected on the Consolidated Statements of Income.
Property and Equipment
— Property and equipment is recorded at cost, net of accumulated depreciation and amortization, except for land, which is recorded at cost. Depreciation is provided using the straight-line method over the estimated useful service lives of the assets, which range from
seven
to
40
years
for buildings and building components and
three
to
seven years
for all other depreciable property and equipment. Leasehold improvements are amortized over the lesser of the economic useful life of the improvement or the term of the lease.
Software Development
— From the date technological feasibility has been established until beta testing is complete, software development costs are capitalized and included in property and equipment. Once the product is fully functional, such costs are amortized in accordance with the Company's normal accounting policies. Software development costs that do not meet capitalization criteria are expensed as incurred.
Goodwill
— The Company has recorded goodwill for purchase business combinations to the extent the purchase price of each completed acquisition exceeded the fair value of the net identifiable assets of the acquired company. The Company tests goodwill for impairment on at least an annual basis and more frequently as events occur or changes in circumstances indicate that the carrying amount of such assets may not be recoverable. In performing the impairment tests, the Company utilizes quoted market prices of the Company's common stock to estimate the fair value of the Company as a whole. The estimated fair value is then allocated to the Company's reporting unit and is compared with the carrying value of the reporting unit.
No
impairment charges have resulted from the impairment tests.
Amortization of Acquired Intangible Assets
— Acquired intangible assets with finite lives are amortized on a straight-line basis over their estimated useful lives, ranging from
11
to
23
years. The acquired intangible asset associated with a trademark license agreement is not subject to amortization because the term of the agreement is considered to be indefinite.
Long-Lived Assets and Acquired Intangible Assets
— The Company reviews its long-lived assets and finite-lived acquired intangible assets for impairment whenever events or changes in circumstances indicate that the carrying amount of such assets may not be recoverable. If based on that review, changes in circumstances indicate that the carrying amount of such assets may not be recoverable, the Company evaluates recoverability by comparing the undiscounted cash flows associated with the asset to the asset's carrying amount. The Company also evaluates the remaining useful lives of intangible assets to determine if events or trends warrant a revision to the remaining period of amortization. Long-lived assets classified as "held for sale" are reported at the lesser of carrying amount or fair value less cost to sell. As of September 30,
2019
and 2018, the Company had
$
7
million
and
$
36
million
of assets classified as held for sale, respectively, which are included in other assets on the
Consolidated Balance Sheets.
61
TD AMERITRADE HOLDING CORPORATION
NOTES TO CONSOLIDATED FINANCIAL STATEMENTS — (Continued)
The Company tests its indefinite-lived acquired intangible asset for impairment on at least an annual basis and more frequently as events occur or changes in circumstances indicate that the carrying amount of such assets may not be recoverable. To determine if the indefinite-lived intangible asset is impaired, the Company first assesses certain qualitative factors. Based on this assessment, if it is determined that more likely than not the fair value of the indefinite-lived intangible asset is less than its carrying amount, the Company performs a quantitative impairment test.
No
impairment charges have resulted from the impairment tests.
Income Taxes
— The Company files a consolidated U.S. income tax return with its subsidiaries on a calendar year basis, combined returns for state tax purposes where required and certain of its subsidiaries file separate state income tax returns where required. Deferred tax assets and liabilities are determined based on the differences between the financial statement carrying amounts and tax bases of assets and liabilities using enacted tax rates expected to apply to taxable income in the periods in which the deferred tax asset or liability is expected to be settled or realized. Uncertain tax positions are recognized if they are more likely than not to be sustained upon examination, based on the technical merits of the position. The amount of tax benefit recognized is the largest amount of benefit that is greater than
50%
likely of being realized upon settlement. The Company recognizes interest and penalties, if any, related to income tax matters as part of the provision for income taxes on the Consolidated Statements of Income.
Capital Stock
— The authorized capital stock of the Company consists of a single class of common stock and one or more series of preferred stock as may be authorized for issuance by the Company's board of directors. Voting, dividend, conversion and liquidation rights of the preferred stock would be established by the board of directors upon issuance of such preferred stock.
Stock-Based Compensation
— The Company measures and recognizes compensation expense based on estimated grant date fair values for all stock-based payment arrangements. Stock-based compensation expense is based on awards expected to vest and therefore is reduced for estimated forfeitures. Forfeitures are estimated at the time of grant based on the Company's historical forfeiture experience and revised in subsequent periods if actual forfeitures differ from those estimates.
Deferred Compensation
— During fiscal year 2018, the Company's common stock held in a rabbi trust pursuant to a Company deferred compensation plan was recorded at the fair value of the stock at the time it was transferred to the rabbi trust and was classified as treasury stock. The corresponding deferred compensation liability was recorded as a component of stockholders' equity on the Consolidated Balance Sheet.
During the fourth quarter of fiscal year 2019, the Company amended the deferred compensation plan to allow participants to diversify their investments within the plan; as such, the corresponding deferred compensation obligation is recorded in accounts payable and other liabilities on the Consolidated Balance Sheet. To reflect changes in the fair value of the amount owed to the participants, the deferred compensation obligation is adjusted with a corresponding charge (or credit) to employee compensation and benefits expense on the Consolidated Statement of Income.
Transaction-based Revenues
— Client trades are recorded on a settlement-date basis with such trades generally settling within one to
two
business days after the trade date. Revenues and expenses related to client trades, including order routing revenue and revenues from markups on riskless principal trades in fixed-income securities, are recorded on a trade-date basis. Revenues related to client trades are recorded net of promotional allowances. Securities owned by clients, including those that collateralize margin or similar transactions, are not reflected in the accompanying consolidated financial statements.
62
TD AMERITRADE HOLDING CORPORATION
NOTES TO CONSOLIDATED FINANCIAL STATEMENTS — (Continued)
Bank Deposit Account Fees
— Revenues generated from a sweep program that is offered to eligible clients of the Company whereby clients' uninvested cash is swept to FDIC-insured (up to specified limits) money market accounts at affiliated and non-affiliated third-party financial institutions participating in the program. Bank deposit account fees includes revenues from the Insured Deposit Account ("IDA") agreement with TD Bank USA, N.A. ("TD Bank USA"), TD Bank, N.A. and The Toronto-Dominion Bank ("TD"). The IDA agreement is described further in Note
23
, Related Party Transactions.
Net Interest Revenue
— Net interest revenue primarily consists of income generated by interest charged to clients on margin balances, net interest revenue from securities borrowed and securities loaned transactions and interest earned on client cash, net of interest paid to clients on their credit balances.
Investment Product Fees
— Investment product fee revenue consists of revenues earned on client assets invested in money market mutual funds, other mutual funds and certain investment programs. Investment product fees also includes fees earned on client assets managed by independent registered investment advisors utilizing the Company's trading and investing platforms.
Advertising
— The Company expenses advertising costs the first time the advertising takes place. Client cash offers are also characterized as advertising expense, rather than as a reduction of revenue, because there is generally little or no cumulative revenue associated with an individual client earning a cash offer at the time the consideration is recognized in the Consolidated Statement of Income.
Derivatives and Hedging Activities
— The Company occasionally utilizes derivative instruments to manage risks, which may include market price, interest rate and foreign currency risks. The Company does not use derivative instruments for speculative or trading purposes. Derivatives are recorded on the Consolidated Balance Sheets as assets or liabilities at fair value. Derivative instruments properly designated to hedge exposure to changes in the fair value of assets or liabilities are accounted for as fair value hedges. Derivative instruments properly designated to hedge exposure to the variability of expected future cash flows or other forecasted transactions are accounted for as cash flow hedges. The Company formally documents the risk management objective and strategy for each hedge transaction. Derivative instruments that do not qualify for hedge accounting are carried at fair value on the Consolidated Balance Sheets with unrealized gains and losses recorded currently on the Consolidated Statements of Income. Cash flows from derivative instruments accounted for as fair value hedges or cash flow hedges are classified in the same category on the Consolidated Statements of Cash Flows as the cash flows from the items being hedged. For additional information on the Company's fair value and cash flow hedging instruments, see Note
11
, Long-term Debt and Other Borrowings.
Earnings Per Share
— Basic earnings per share ("EPS") is computed by dividing net income by the weighted average common shares outstanding for the period. Diluted EPS reflects the potential dilution that could occur if securities or other contracts to issue common stock were exercised or converted into common stock, except when such assumed exercise or conversion would have an antidilutive effect on EPS. The difference between the numerator and denominator used in the Company's computation of basic and diluted earnings per share consists of common stock equivalent shares related to stock-based compensation. There were
no
material antidilutive awards for fiscal years
2019
,
2018
and
2017
.
Recently Adopted Accounting Pronouncements
ASU 2019-07
–
In July 2019, the Financial Accounting Standards Board ("FASB") issued Accounting Standards Update ("ASU") 2019-07,
Codification Updates to SEC Sections - Amendments to SEC Paragraphs Pursuant to SEC Final Rule Releases No. 33-10532, Disclosure Update and Simplification, and Nos. 33-10231 and 33-10442, Investment Company Reporting Modernization, and Miscellaneous Updates
. The purpose of this ASU is to align guidance in various SEC sections of the FASB Accounting Standards Codification ("ASC") with the requirements of certain already effective SEC final rules. The ASU was effective during the Company's fourth quarter of fiscal year 2019. The adoption of this standard did not have a material impact on the Company's consolidated financial statements.
63
TD AMERITRADE HOLDING CORPORATION
NOTES TO CONSOLIDATED FINANCIAL STATEMENTS — (Continued)
ASU 2017-12
–
In September 2019, the Company early adopted ASU 2017-12,
Targeted Improvements to Accounting for Hedging Activities
, and standards which were issued subsequently to ASU 2017-12, for the purpose of providing codification improvements. These standards amend the guidance in ASC Topic 815,
Derivatives and Hedging.
The objectives of these ASUs are to improve the financial reporting of hedging relationships to better portray the economic results of an entity's risk management activities in its financial statements through changes to both the designation and measurement guidance for qualifying hedging relationships and to the presentation of hedge results. In addition, the amendments in these ASUs make certain targeted improvements that are intended to simplify the application of the hedge accounting guidance in current GAAP. All transition requirements and elections under these ASUs were applied to hedging relationships existing on the date of adoption. The adoption of these standards did not have a material impact on the Company's consolidated financial statements.
ASU 2016-18
–
On October 1, 2018, the Company adopted ASU 2016-18,
Restricted Cash
, using a retrospective transition method to each period presented. This ASU amends the guidance in ASC Topic 230,
Statement of Cash Flows
, and is intended to reduce the diversity in the classification and presentation of changes in restricted cash on the statement of cash flows. The amendments within this ASU require that the reconciliation of the beginning-of-period and end-of-period cash and cash equivalents amounts shown on the statement of cash flows include restricted cash and restricted cash equivalents. If restricted cash and restricted cash equivalents are presented separately from cash and cash equivalents on the balance sheet, an entity is required to reconcile the amounts presented on the statement of cash flows to the amounts on the balance sheet. An entity is also required to disclose information regarding the nature of the restrictions. Under the retrospective transition method, the Company recorded a decrease of
$
6.4
billion
and
$
0.3
billion
in cash flows from operating activities for the fiscal years ended September 30, 2018 and 2017, respectively, and an increase of
$
2.4
billion
in cash flows from investing activities for the fiscal year ended September 30, 2017, to reflect the reclassification of changes in restricted cash and restricted cash equivalents amounts from the operating and investing sections to the beginning-of-period and end-of-period cash, cash equivalents, restricted cash and restricted cash equivalents amounts within the Consolidated Statements of Cash Flows. See Note 3 for additional information regarding restricted cash and restricted cash equivalents.
ASU 2016-16 –
On October 1, 2018, the Company adopted ASU 2016-16,
Intra-Entity Transfers of Assets Other Than Inventory.
This ASU amends the guidance in ASC Topic 740,
Income Taxes
. The amendments in this ASU are intended to improve the accounting for the income tax consequences of intra-entity transfers of assets other than inventory by requiring an entity to recognize the income tax consequences when a transfer occurs, instead of when the asset is sold to a third party. The adoption of ASU 2016-16 did not have an impact on the Company's consolidated financial statements.
ASU 2014-09 –
On October 1, 2018, the Company adopted ASU 2014-09,
Revenue from Contracts with Customers
, using a modified retrospective approach, which requires the standard be applied only to the most current period presented, with the cumulative effect of initially applying the standard recognized at the date of initial application. The new revenue recognition standard is intended to clarify the principles of recognizing revenue from contracts with customers and to improve financial reporting by creating common revenue recognition guidance for U.S. GAAP and International Financial Reporting Standards. This ASU supersedes the revenue recognition requirements in ASC Topic 605,
Revenue Recognition,
and most industry-specific guidance. Entities are required to apply the following steps when recognizing revenue under ASU 2014-09: (1) identify the contract(s) with a customer; (2) identify the performance obligations in the contract; (3) determine the transaction price; (4) allocate the transaction price to the performance obligations in the contract; and (5) recognize revenue when (or as) the entity satisfies a performance obligation. This ASU also requires additional disclosures related to the nature, amount, timing and uncertainty of revenue and cash flows arising from customer contracts.
The adoption of this standard did not have a material impact on the Company's financial condition, results of operations or cash flows, as the satisfaction of performance obligations under the new guidance is materially consistent with the Company's previous revenue recognition policies. However, the adoption of this standard did impact the Company by: (1) requiring the capitalization of sales commissions paid to employees for obtaining new contracts with clients and (2) accounting for revenues from certain contracts on a gross basis when the Company is acting as a principal, as compared to the prior guidance, which allowed for these contracts to be accounted for
64
TD AMERITRADE HOLDING CORPORATION
NOTES TO CONSOLIDATED FINANCIAL STATEMENTS — (Continued)
on a net basis. For additional information on the Company's adoption of the amended guidance, see Note 22, Revenue Recognition. The new guidance does not apply to revenue associated with financial instruments, such as interest revenue, which is accounted for under other GAAP. Accordingly, net interest revenue was not impacted.
ASU 2018-13 –
In August 2018, the FASB issued ASU 2018-13,
Disclosure Framework–Changes to the Disclosure Requirements for Fair Value Measurement.
The amendments in this standard will remove, modify and add certain disclosures under ASC Topic 820,
Fair Value Measurement
, with the objective of improving disclosure effectiveness. ASU 2018-13 will be effective for the Company's fiscal year beginning October 1, 2020, with early adoption permitted. The transition requirements are dependent upon each amendment within this update and will be applied either prospectively or retrospectively. Since this update is intended to modify disclosures, the adoption of ASU 2018-13 is not expected to have a material impact on the Company's consolidated financial statements.
ASU 2017-04
–
In January 2017, the FASB issued ASU 2017-04,
Simplifying the Test for Goodwill Impairment,
which is intended to simplify the test for goodwill impairment by eliminating Step 2 from the goodwill impairment test, which measures a goodwill impairment loss by comparing the implied fair value of a reporting unit's goodwill with the carrying amount of that goodwill. Under the amendments in this ASU, an entity should perform its annual goodwill impairment test by comparing the fair value of a reporting unit with its carrying amount. An entity should recognize an impairment charge for the amount by which the carrying amount exceeds the reporting unit's fair value; however, the loss recognized should not exceed the total amount of goodwill allocated to that reporting unit. When measuring the goodwill impairment loss, income tax effects from any tax deductible goodwill on the carrying amount of the reporting unit should be considered, if applicable. An entity will still have the option to perform the qualitative assessment for a reporting unit to determine if the quantitative test is necessary. ASU 2017-04 should be applied prospectively and will be effective for the Company's fiscal year beginning October 1, 2020, with early adoption permitted. The Company does not expect this ASU to have a material impact on its consolidated financial statements.
ASU 2016-13
–
In June 2016, the FASB issued ASU 2016-13,
Measurement of Credit Losses on Financial Instruments
. The main objective of ASU 2016-13 is to provide financial statement users with more decision-useful information about an entity's expected credit losses on financial instruments and other commitments to extend credit at each reporting date. To achieve this objective, the amendments in this update replace the incurred loss impairment methodology in current GAAP with a methodology that reflects expected credit losses and requires consideration of a broader range of reasonable and supportable information to develop credit loss estimates. Subsequent to issuing ASU 2016-13, the FASB has issued additional standards for the purpose of clarifying certain aspects of ASU 2016-13, as well as providing codification improvements and targeted transition relief under the standard. The subsequently issued ASUs have the same effective date and transition requirements as ASU 2016-13. ASU 2016-13 will be effective for the Company's fiscal year beginning October 1, 2020, using a modified retrospective approach. Early adoption is permitted. The Company is currently assessing the impact this ASU will have on its consolidated financial statements.
ASU 2016-02
–
In February 2016, the FASB issued ASU 2016-02,
Leases
. This ASU supersedes the guidance in ASC Topic 840,
Leases
. Under ASU 2016-02, for lease arrangements exceeding a 12-month term, a lessee is required to recognize in the balance sheet a liability to make lease payments (the lease liability) and a right-of-use asset representing its right to use the underlying asset for the lease term. ASU 2016-02 retains a distinction between finance and operating leases; however, the principal difference between the previous guidance and the new guidance is that lease assets and liabilities arising from operating leases are recognized on the balance sheet under the new guidance. On October 1, 2019, the Company adopted the new lease accounting guidance by applying the standard at the adoption date, recognizing a cumulative-effect adjustment to the opening balance of retained earnings. As a result, restated financial information and the additional disclosures required under the new standard will not be provided for the comparative periods presented. The Company elected a package of practical expedients available under the new guidance, which allows an entity to not reassess prior conclusions related to existing contracts containing leases, lease classification and initial direct costs. Upon the adoption of the lease standard, the Company recognized a right-of-use asset and a lease liability on the Consolidated Balance Sheet related to non-cancelable
65
TD AMERITRADE HOLDING CORPORATION
NOTES TO CONSOLIDATED FINANCIAL STATEMENTS — (Continued)
operating leases for certain facilities, including corporate offices, retail branches and data centers. At the date of adoption, the Company recognized a cumulative-effect adjustment to the opening balance of retained earnings of
$
1
million
and the initial recognition and measurement of the right-of-use asset and lease liability was
$
347
million
and
$
379
million
, respectively, which were based on the present value of the Company's remaining operating lease payments. The present value was calculated utilizing secured incremental borrowing rates as of October 1, 2019. The secured incremental borrowing rates were based on the terms of the leases and the interest rate environment at the date of adoption. The adoption of this standard did not have a material impact on the Company's results of operations or cash flows.
2
.
Business Acquisition
On
September 18, 2017
, the Company completed its acquisition of Scottrade Financial Services, Inc. ("Scottrade"), pursuant to an Agreement and Plan of Merger (the "Acquisition"), among the Company, Rodger O. Riney, as Voting Trustee of the Rodger O. Riney Family Voting Trust U/A/D 12/31/2012 (the "Riney Stockholder"), and Alto Acquisition Corp., a wholly-owned subsidiary of the Company. Immediately prior to the closing of the Acquisition, pursuant to the terms and conditions set forth in a separate Agreement and Plan of Merger, TD Bank, N.A., a wholly-owned subsidiary of The Toronto-Dominion Bank ("TD"), acquired Scottrade Bank, which was a wholly-owned subsidiary of Scottrade, from Scottrade (the "Bank Merger") for approximately
$
1.37
billion
in cash (the "Bank Merger Consideration"). Immediately prior to the closing of the Acquisition, the Company also issued
11,074,197
shares of the Company's common stock to TD at a price of
$
36.12
per share, or approximately
$
400
million
, pursuant to a subscription agreement dated October 24, 2016 between the Company and TD. Immediately following the Bank Merger, the Acquisition was completed. The aggregate consideration paid by the Company for all of the outstanding capital stock of Scottrade consisted of
27,685,493
shares of the Company's common stock and
$
3.07
billion
in cash (the "Cash Consideration"). The Cash Consideration was funded with the Bank Merger Consideration paid by TD Bank, N.A. to Scottrade, the proceeds received from the Company's issuance of the
3.300
%
Senior Notes on
April 27, 2017
, cash on hand and cash proceeds from the sale of the Company's common stock to TD, as described above.
The results of operations for Scottrade are included in the Company's consolidated financial statements from the date of Acquisition. The following unaudited pro forma financial information sets forth the results of operations of the Company as if the Acquisition had occurred on October 1, 2015, the beginning of the comparable fiscal year prior to the year of Acquisition. The unaudited pro forma results include certain adjustments for acquisition-related costs, depreciation, amortization of intangible assets, interest expense on acquisition financing, and related income tax effects, and do not reflect potential revenue enhancements, cost savings or operating synergies that the Company expects to realize after the Acquisition. The unaudited pro forma financial information is based on currently available information, is presented for informational purposes only, and is not indicative of future operations or results had the Acquisition been completed as of October 1, 2015 or any other date.
The following table summarizes the unaudited pro forma financial information for the fiscal year indicated (dollars in millions):
|
2017
|
||||
|
(unaudited)
|
||||
|
Pro forma net revenues
|
$
|
|
|
|
|
Pro forma net income
|
$
|
|
|
|
|
Pro forma basic earnings per share
|
$
|
|
|
|
|
Pro forma diluted earnings per share
|
$
|
|
|
|
66
TD AMERITRADE HOLDING CORPORATION
NOTES TO CONSOLIDATED FINANCIAL STATEMENTS — (Continued)
3.
Cash, Cash Equivalents, Restricted Cash and Restricted Cash Equivalents
The Company's cash and cash equivalents is summarized in the following table (dollars in millions):
|
|
September 30,
|
|||||||
|
|
2019
|
2018
|
||||||
|
Broker-dealer subsidiaries
|
$
|
|
|
$
|
|
|
||
|
Corporate
|
|
|
|
|
||||
|
Trust company subsidiary
|
|
|
|
|
||||
|
Futures commission merchant and forex dealer member subsidiary
|
|
|
|
|
||||
|
Investment advisory subsidiaries
|
|
|
|
|
||||
|
Total
|
$
|
|
|
$
|
|
|
||
Capital requirements may limit the amount of cash available for dividend from the broker-dealer, trust company and FCM/FDM subsidiaries to the Parent.
The following table provides a reconciliation of cash, cash equivalents, restricted cash and restricted cash equivalents reported within the Consolidated Balance Sheets to the total of the same amounts shown in the Consolidated Statements of Cash Flows (dollars in millions):
|
September 30,
|
||||||||
|
2019
|
2018
|
|||||||
|
Cash and cash equivalents
|
$
|
|
|
$
|
|
|
||
|
Restricted cash and restricted cash equivalents included in cash and investments
segregated and on deposit for regulatory purposes
|
|
|
|
|
||||
|
Total cash, cash equivalents, restricted cash and restricted cash equivalents
shown in the Consolidated Statements of Cash Flows
|
$
|
|
|
$
|
|
|
||
Amounts included in restricted cash and restricted cash equivalents consist primarily of qualified deposits in special reserve bank accounts for the exclusive benefit of clients under Rule 15c3-3 of the Exchange Act and other regulations. Restricted cash equivalents consists of highly-liquid investments with an original maturity of three months or less.
4
.
Cash and Investments Segregated and on Deposit for Regulatory Purposes
Cash and investments segregated and on deposit for regulatory purposes consists of the following (dollars in millions):
|
|
September 30,
|
|||||||
|
|
2019
|
2018
|
||||||
|
U.S. government debt securities
|
$
|
|
|
$
|
|
|
||
|
Cash in demand deposit accounts
|
|
|
|
|
||||
|
U.S. government agency mortgage-backed securities
|
|
|
|
|
||||
|
Reverse repurchase agreements (collateralized by U.S. government debt securities)
|
|
|
|
|
||||
|
Cash on deposit with futures commission merchants
|
|
|
|
|
||||
|
U.S. government debt securities on deposit with futures commission merchant
|
|
|
|
|
||||
|
Total
|
$
|
|
|
$
|
|
|
||
67
TD AMERITRADE HOLDING CORPORATION
NOTES TO CONSOLIDATED FINANCIAL STATEMENTS — (Continued)
5.
Investments Available-for-Sale
The following tables present the amortized cost and fair value of available-for-sale securities (dollars in millions):
|
September 30, 2019
|
Amortized Cost
|
Gross
Unrealized
Gains
|
Gross
Unrealized
Losses
|
Fair Value
|
||||||||||||
|
Available-for-sale securities:
|
||||||||||||||||
|
U.S. Treasury securities
|
$
|
|
|
$
|
|
|
$
|
|
|
$
|
|
|
||||
|
September 30, 2018
|
Amortized Cost
|
Gross
Unrealized
Gains
|
Gross
Unrealized
Losses
|
Fair Value
|
||||||||||||
|
Available-for-sale securities:
|
||||||||||||||||
|
U.S. Treasury securities
|
$
|
|
|
$
|
|
|
$
|
(
|
)
|
$
|
|
|
||||
As of September 30, 2018, the Company had pledged
$
98
million
of available-for-sale securities as collateral for repurchase agreements.
The following table presents the contractual maturities of available-for-sale securities as of September 30, 2019 (dollars in millions):
|
Amortized Cost
|
Fair Value
|
|||||||
|
Available-for-sale U.S. Treasury securities:
|
||||||||
|
Due within one to five years
|
$
|
|
|
$
|
|
|
||
|
Due within five to ten years
|
|
|
|
|
||||
|
Due after ten years
|
|
|
|
|
||||
|
Total available-for-sale U.S. Treasury securities
|
$
|
|
|
$
|
|
|
||
68
TD AMERITRADE HOLDING CORPORATION
NOTES TO CONSOLIDATED FINANCIAL STATEMENTS — (Continued)
6.
Receivable from and Payable to Brokers, Dealers and Clearing Organizations
Amounts receivable from and payable to brokers, dealers and clearing organizations consist of the following (dollars in millions):
|
|
September 30,
|
|||||||
|
|
2019
|
2018
|
||||||
|
Receivable:
|
||||||||
|
Deposits paid for securities borrowed
|
$
|
|
|
$
|
|
|
||
|
Clearing organizations
|
|
|
|
|
||||
|
Broker-dealers
|
|
|
|
|
||||
|
Securities failed to deliver
|
|
|
|
|
||||
|
Total
|
$
|
|
|
$
|
|
|
||
|
Payable:
|
||||||||
|
Deposits received for securities loaned
|
$
|
|
|
$
|
|
|
||
|
Clearing organizations
|
|
|
|
|
||||
|
Securities failed to receive
|
|
|
|
|
||||
|
Broker-dealers
|
|
|
|
|
||||
|
Total
|
$
|
|
|
$
|
|
|
||
7.
Allowance for Doubtful Accounts on Receivables
The following table summarizes activity in the Company's allowance for doubtful accounts on client and other receivables for the fiscal years indicated (dollars in millions):
|
2019
|
2018
|
2017
|
||||||||||
|
Beginning balance
|
$
|
|
|
$
|
|
|
$
|
|
|
|||
|
Provision for doubtful accounts, net
|
|
|
|
|
|
|
||||||
|
Acquired in business acquisition
|
|
|
|
|
|
|
||||||
|
Write-off of doubtful accounts
|
(
|
)
|
(
|
)
|
(
|
)
|
||||||
|
Ending balance
|
$
|
|
|
$
|
|
|
$
|
|
|
|||
69
TD AMERITRADE HOLDING CORPORATION
NOTES TO CONSOLIDATED FINANCIAL STATEMENTS — (Continued)
8
.
Property and Equipment
Property and equipment consists of the following (dollars in millions):
|
|
September 30,
|
|||||||
|
|
2019
|
2018
|
||||||
|
Buildings and building components
|
$
|
|
|
$
|
|
|
||
|
Computer equipment
|
|
|
|
|
||||
|
Software
|
|
|
|
|
||||
|
Leasehold improvements
|
|
|
|
|
||||
|
Land
|
|
|
|
|
||||
|
Other property and equipment
|
|
|
|
|
||||
|
|
|
|
|
|||||
|
Less: Accumulated depreciation and amortization
|
(
|
)
|
(
|
)
|
||||
|
Property and equipment at cost, net
|
$
|
|
|
$
|
|
|
||
9.
Goodwill and Acquired Intangible Assets
The Company has recorded goodwill for business acquisitions to the extent the purchase price of each completed acquisition exceeded the fair value of the net identifiable tangible and intangible assets of each acquired company.
The following table summarizes changes in the carrying amount of goodwill (dollars in millions):
|
Balance as of September 30, 2017
|
$
|
|
|
|
|
Purchase accounting adjustments
(1)
|
|
|
||
|
Balance as of September 30, 2018
|
|
|
||
|
Changes during period
|
|
|
||
|
Balance as of September 30, 2019
|
$
|
|
|
|
|
(1)
|
The purchasing accounting adjustments are primarily attributable to post-closing adjustments related to the Bank Merger Consideration, property acquired and liabilities assumed in the acquisition of Scottrade. The purchase price allocation was finalized during September 2018, one-year from the anniversary of the Acquisition.
|
Acquired intangible assets consist of the following (dollars in millions):
|
|
September 30,
|
|||||||||||||||||||||||
|
|
2019
|
2018
|
||||||||||||||||||||||
|
|
Gross
Carrying
Amount
|
Accumulated
Amortization
|
Net
Carrying
Amount
|
Gross
Carrying
Amount
|
Accumulated
Amortization
|
Net
Carrying
Amount
|
||||||||||||||||||
|
Client relationships
|
$
|
|
|
$
|
(
|
)
|
$
|
|
|
$
|
|
|
$
|
(
|
)
|
$
|
|
|
||||||
|
Technology and content
|
|
|
(
|
)
|
|
|
|
|
(
|
)
|
|
|
||||||||||||
|
Trade names
|
|
|
(
|
)
|
|
|
|
|
(
|
)
|
|
|
||||||||||||
|
Trademark license
|
|
|
|
|
|
|
|
|
|
|
|
|
||||||||||||
|
$
|
|
|
$
|
(
|
)
|
$
|
|
|
$
|
|
|
$
|
(
|
)
|
$
|
|
|
|||||||
70
TD AMERITRADE HOLDING CORPORATION
NOTES TO CONSOLIDATED FINANCIAL STATEMENTS — (Continued)
Amortization expense on acquired intangible assets was
$
125
million
,
$
141
million
and
$
79
million
for fiscal years
2019
,
2018
and
2017
, respectively.
Estimated future amortization expense for acquired finite-lived intangible assets outstanding as of September 30,
2019
is as follows (dollars in millions):
|
Fiscal Year
|
Estimated
Amortization
Expense
|
|||
|
2020
|
$
|
|
|
|
|
2021
|
|
|
||
|
2022
|
|
|
||
|
2023
|
|
|
||
|
2024
|
|
|
||
|
Thereafter (to 2035)
|
|
|
||
|
Total
|
$
|
|
|
|
10.
Exit Liabilities
As of September 18, 2017, the date of Acquisition, the Company began to incur costs in connection with actions taken to attain synergies from combining the operations of the Company and Scottrade. These costs, collectively referred to as "acquisition-related exit costs," include severance and other costs associated with consolidating facilities and administrative functions. As of September 30, 2018, substantially all of the acquisition-related exit costs had been incurred.
The following table summarizes activity in the Company's exit liabilities for the fiscal years ended September 30, 2019 and 2018, which are included in accounts payable and other liabilities on the Consolidated Balance Sheets (dollars in millions):
|
Severance Pay and Other Employment Benefits
|
Contract Termination and Other Costs
|
Total
|
||||||||||
|
Balance, September 30, 2017
|
$
|
|
|
$
|
|
|
$
|
|
|
|||
|
Exit liabilities assumed - post closing adjustments
|
|
|
|
|
|
|
||||||
|
Costs incurred and charged to expense
|
|
|
(1)
|
|
|
(2)
|
|
|
||||
|
Costs paid or otherwise settled
|
(
|
)
|
(
|
)
|
(
|
)
|
||||||
|
Balance, September 30, 2018
|
|
|
|
|
|
|
||||||
|
Adjustments
|
(
|
)
|
(1)
|
(
|
)
|
(2)
|
(
|
)
|
||||
|
Costs paid or otherwise settled
|
(
|
)
|
(
|
)
|
(
|
)
|
||||||
|
Balance, September 30, 2019
|
$
|
|
|
$
|
|
|
$
|
|
|
|||
|
(1)
|
Costs incurred and adjustments made for severance pay and other employment benefits are included in employee compensation and benefits on the Consolidated Statements of Income.
|
|
(2)
|
Costs incurred and adjustments made for contract termination and other costs are primarily included in other operating expense and professional services on the Consolidated Statements of Income.
|
There were
no
material exit costs incurred which were not associated with the Scottrade acquisition during fiscal years 2019, 2018 and 2017.
71
TD AMERITRADE HOLDING CORPORATION
NOTES TO CONSOLIDATED FINANCIAL STATEMENTS — (Continued)
The following table summarizes the cumulative amount of acquisition related exit costs incurred by the Company related to the Scottrade acquisition as of September 30, 2019 (dollars in millions):
|
Severance Pay and Other Employment Benefits
|
Contract Termination and Other Costs
|
Total
|
||||||||||
|
Exit liabilities assumed in business acquisition
|
$
|
|
|
$
|
|
|
$
|
|
|
|||
|
Employee compensation and benefits
|
|
|
|
|
|
|
||||||
|
Clearing and execution costs
|
|
|
|
|
|
|
||||||
|
Communications
|
|
|
|
|
|
|
||||||
|
Occupancy and equipment costs
|
|
|
|
|
|
|
||||||
|
Professional services
|
|
|
|
|
|
|
||||||
|
Other operating expense
|
|
|
|
|
|
|
||||||
|
Other non-operating expense
|
|
|
|
|
|
|
||||||
|
Total
|
$
|
|
|
$
|
|
|
$
|
|
|
|||
72
TD AMERITRADE HOLDING CORPORATION
NOTES TO CONSOLIDATED FINANCIAL STATEMENTS — (Continued)
11
.
Long-term Debt and Other Borrowings
Long-term debt and other borrowings consist of the following (dollars in millions):
|
September 30, 2019
|
Face
Value
|
Unamortized Discounts and Debt Issuance Costs
|
Fair Value
Adjustment
(1)
|
Net Carrying
Value
|
||||||||||||
|
Senior Notes:
|
||||||||||||||||
|
Variable-rate Notes due 2021
|
$
|
|
|
$
|
(
|
)
|
$
|
|
|
$
|
|
|
||||
|
2.950% Notes due 2022
|
|
|
(
|
)
|
|
|
|
|
||||||||
|
3.750% Notes due 2024
|
|
|
(
|
)
|
|
|
|
|
||||||||
|
3.625% Notes due 2025
|
|
|
(
|
)
|
|
|
|
|
||||||||
|
3.300% Notes due 2027
|
|
|
(
|
)
|
|
|
|
|
||||||||
|
2.750% Notes due 2029
|
|
|
(
|
)
|
(
|
)
|
|
|
||||||||
|
Total long-term debt
|
$
|
|
|
$
|
(
|
)
|
$
|
|
|
$
|
|
|
||||
|
September 30, 2018
|
Face
Value
|
Unamortized Discounts and Debt Issuance Costs
|
Fair Value
Adjustment
(1)
|
Net Carrying
Value
|
||||||||||||
|
Other borrowings:
|
||||||||||||||||
|
Securities sold under agreements to repurchase
|
$
|
|
|
$
|
|
|
$
|
|
|
$
|
|
|
||||
|
Long-term debt:
|
||||||||||||||||
|
Senior Notes:
|
||||||||||||||||
|
5.600% Notes due 2019
|
|
|
(
|
)
|
|
|
|
|
||||||||
|
2.950% Notes due 2022
|
|
|
(
|
)
|
(
|
)
|
|
|
||||||||
|
3.625% Notes due 2025
|
|
|
(
|
)
|
(
|
)
|
|
|
||||||||
|
3.300% Notes due 2027
|
|
|
(
|
)
|
(
|
)
|
|
|
||||||||
|
Subtotal - Long-term debt
|
|
|
(
|
)
|
(
|
)
|
|
|
||||||||
|
Total long-term debt and other borrowings
|
$
|
|
|
$
|
(
|
)
|
$
|
(
|
)
|
$
|
|
|
||||
(1) Fair value adjustments relate to changes in the fair value of the debt while in a fair value hedging relationship. See "
Fair Value Hedging
" below.
Fiscal year maturities on long-term debt outstanding at September 30,
2019
are as follows (dollars in millions):
|
2020
|
$
|
|
|
|
|
2021
|
|
|
||
|
2022
|
|
|
||
|
2023
|
|
|
||
|
2024
|
|
|
||
|
Thereafter
|
|
|
||
|
Total
|
$
|
|
|
|
73
TD AMERITRADE HOLDING CORPORATION
NOTES TO CONSOLIDATED FINANCIAL STATEMENTS — (Continued)
Senior Notes
— As of September 30,
2019
and
2018
, the Company had
$
3.55
billion
and
$
2.55
billion
aggregate principal amount of unsecured Senior Notes (together, the "Senior Notes"), respectively. The Company's Senior Notes were each sold through a public offering. The fixed rate and variable rate Senior Notes pay interest semi-annually and quarterly, respectively, in arrears.
Key information about the Senior Notes outstanding as of September 30,
2019
is summarized in the following table (dollars in millions):
|
Description
|
Date Issued
|
Maturity Date
|
Aggregate Principal
|
Interest Rate
|
||||
|
2021 Notes
|
October 30, 2018
|
November 1, 2021
|
$
|
Variable
|
||||
|
2022 Notes
|
March 4, 2015
|
April 1, 2022
|
$
|
|
||||
|
2024 Notes
|
October 30, 2018
|
April 1, 2024
|
$
|
|
||||
|
2025 Notes
|
October 17, 2014
|
April 1, 2025
|
$
|
|
||||
|
2027 Notes
|
April 27, 2017
|
April 1, 2027
|
$
|
|
||||
|
2029 Notes
|
August 13, 2019
|
October 1, 2029
|
$
|
|
||||
During September of fiscal year 2019, the Company used the net proceeds from the issuance of the 2029 Notes, together with cash on hand, to repay the
$
500
million
aggregate outstanding principal amount and a prepayment premium under its 2019 Notes, which were scheduled to mature on December 1, 2019. The Company is using the net proceeds from the issuance of the 2021 Notes and 2024 Notes for general corporate purposes and to augment liquidity. The Company used the proceeds from the issuance of the 2027 Notes during fiscal year 2017 to finance a portion of the cash consideration paid by the Company in its acquisition of Scottrade.
Under the terms of the Senior Notes, the Company may redeem the notes prior to maturity, in whole or in part, at any time prior to specified dates, at redemption prices equal to the greater of (1)
100
%
of the principal amount of the notes being redeemed, and (2) the sum of the present values of the remaining scheduled payments of principal and interest on the notes being redeemed, discounted to the date of redemption on a semi-annual basis at the comparable U.S. Treasury rate, plus set basis points and in each case, accrued and unpaid interest to the date of redemption. The Company may redeem the Senior Notes, in whole or in part, at any time on or after the specified dates, at a redemption price equal to
100
%
of the principal amount of the notes being redeemed and in each case, accrued and unpaid interest to the date of redemption. The Senior Notes are not required to be guaranteed by any of the Company's subsidiaries.
Lines of Credit
— TD Ameritrade Clearing, Inc. ("TDAC"), a clearing broker-dealer subsidiary of the Company, utilizes secured uncommitted lines of credit for short-term liquidity. Under these secured uncommitted lines, TDAC borrows on either a demand or short-term basis from
two
unaffiliated banks and pledges client margin securities as collateral. Advances under the secured uncommitted lines are dependent on TDAC having acceptable collateral as determined by each secured uncommitted credit agreement. At September 30, 2019, the terms of the secured uncommitted credit agreements do not specify borrowing limits. The availability of TDAC's secured uncommitted lines is subject to approval by the individual banks each time an advance is requested and may be denied. There were
no
borrowings outstanding under the secured uncommitted lines of credit as of September 30,
2019
and 2018.
Securities Sold Under Agreements to Repurchase (repurchase agreements) —
Under repurchase agreements, the Company receives cash from the counterparty and provides U.S. government debt securities as collateral. The Company's repurchase agreements generally mature between 30 and 90 days following the transaction date and are accounted for as secured borrowings. There were no borrowings outstanding under repurchase agreements as of September 30, 2019. The remaining contractual maturities of the repurchase agreements with outstanding balances as of September 30,
2018
were less than 30 days. The weighted average interest rate on the balances outstanding as of September 30,
2018
was
2.35
%
. See "General Contingencies" in Note 16 for a discussion of the potential risks associated with repurchase agreements and how the Company mitigates those risks.
Fair Value Hedging
—
The Company is exposed to changes in the fair value of its fixed-rate Senior Notes resulting from interest rate fluctuations. To hedge a vast majority of this exposure, the Company has entered into fixed-for-
74
TD AMERITRADE HOLDING CORPORATION
NOTES TO CONSOLIDATED FINANCIAL STATEMENTS — (Continued)
variable interest rate swaps on each of the 2022 Notes, 2025 Notes, 2027 Notes and 2029 Notes (together, the "Hedged Senior Notes"). Each fixed-for-variable interest rate swap has a notional amount and a maturity date matching the aggregate principal amount and maturity date, respectively, for each of the respective Hedged Senior Notes. During September 2019, the Company paid in full the outstanding principal under the 2019 Notes and the interest rate swap on the 2019 Notes was terminated.
The interest rate swaps effectively change the fixed-rate interest on the Hedged Senior Notes to variable-rate interest. Under the terms of the interest rate swap agreements, the Company receives semi-annual fixed-rate interest payments based on the same rates applicable to the Hedged Senior Notes, and makes quarterly variable-rate interest payments based on
three-month LIBOR
plus (1)
0.9486
%
for the swap on the 2022 Notes, (2)
1.1022
%
for the swap on the 2025 Notes, (3)
1.0340
%
for the swap on the 2027 Notes and (4)
1.2000
%
for the swap on the 2029 Notes. As of September 30,
2019
, the weighted average effective interest rate on the aggregate principal balance of the Senior Notes was
3.27
%
.
The interest rate swaps are accounted for as fair value hedges and qualify for the shortcut method of accounting. Changes in the payment of interest resulting from the interest rate swaps are recorded in interest on borrowings on the Consolidated Statements of Income. Changes in fair value of the interest rate swaps are completely offset by changes in fair value of the related notes, resulting in no effect on net income.
The following table summarizes gains and losses resulting from changes in the fair value of interest rate swaps designated as fair value hedges and the hedged fixed-rate debt for the fiscal years indicated (dollars in millions):
|
2019
|
2018
|
2017
|
||||||||||
|
Gain (loss) on fair value of interest rate swaps
|
$
|
|
|
$
|
(
|
)
|
$
|
(
|
)
|
|||
|
Gain (loss) on fair value of hedged fixed-rate debt
|
(
|
)
|
|
|
|
|
||||||
|
Net gain (loss) recorded in interest on borrowings
|
$
|
|
|
$
|
|
|
$
|
|
|
|||
Cash Flow Hedging
–
On
January 17, 2014
, the Company entered into forward-starting interest rate swap contracts with an aggregate notional amount of
$
500
million
, to hedge against changes in the benchmark interest rate component of future interest payments resulting from an anticipated debt refinancing. The Company designated the contracts as a cash flow hedge of the future interest payments. Under cash flow hedge accounting, the swap contracts are carried at fair value until settlement and to the extent they are an effective hedge, any unrealized gains or losses are recorded in other comprehensive income (loss). Any ineffective portion of the unrealized gains or losses is immediately recorded into earnings. Upon settlement, any realized gain or loss that has been recorded in other comprehensive income (loss) is amortized into earnings over the term of the newly-issued fixed-rate debt.
On October 17, 2014, the Company sold
$
500
million
of 2025 Notes as described under "Senior Notes" above, and paid approximately
$
45
million
to settle the forward-starting interest rate swap contracts. As of September 30,
2019
, the Company expects to amortize
$
4
million
of pre-tax losses, that were reported in accumulated other comprehensive loss, into interest on borrowings on the Consolidated Statements of Income within the next 12 months.
Balance Sheet Impact of Hedging Instruments —
The following table summarizes the classification and the fair value of outstanding derivatives designated as hedging instruments on the Consolidated Balance Sheets (dollars in millions):
|
September 30,
|
||||||||
|
2019
|
2018
|
|||||||
|
Pay-variable interest rate swaps designated as fair value hedges:
|
||||||||
|
Other assets
|
$
|
|
|
$
|
|
|
||
|
Accounts payable and other liabilities
|
$
|
(
|
)
|
$
|
(
|
)
|
||
75
TD AMERITRADE HOLDING CORPORATION
NOTES TO CONSOLIDATED FINANCIAL STATEMENTS — (Continued)
The interest rate swaps are subject to counterparty credit risk. Credit risk is managed by limiting activity to approved counterparties that meet a minimum credit rating threshold, by entering into credit support agreements, or by utilizing approved central clearing counterparties registered with the CFTC. The interest rate swaps require daily collateral coverage, in the form of cash or U.S. Treasury securities, for the aggregate fair value of the interest rate swaps (including accrued interest). As of September 30,
2019
and
2018
, the pay-variable interest rate swap counterparties had pledged
$
86
million
and
$
10
million
of collateral, respectively, to the Company in the form of cash. A liability for collateral pledged to the Company in the form of cash is recorded in accounts payable and other liabilities on the Consolidated Balance Sheets. As of September 30,
2019
and
2018
, the Company had pledged
$
3
million
and
$
82
million
of collateral, respectively, to the pay-variable interest rate swap counterparties in the form of cash. An asset for collateral pledged to the swap counterparties in the form of cash is recorded in other receivables on the Consolidated Balance Sheets.
TD Ameritrade Holding Corporation Senior Revolving Credit Facility —
On
April 21, 2017
, the Parent entered into a credit agreement consisting of a senior unsecured committed revolving credit facility in the aggregate principal amount of
$
300
million
(the "Parent Revolving Facility"). The maturity date of the Parent Revolving Facility is
April 21, 2022
. The obligations under the Parent Revolving Facility are not guaranteed by any subsidiary of Parent.
The applicable interest rate under the Parent Revolving Facility is calculated as a per annum rate equal to, at the option of the Parent, (1) LIBOR plus an interest rate margin ("Parent Eurodollar loans") or (2) (i) the highest of (x) the prime rate, (y) the federal funds effective rate (or, if the federal funds effective rate is unavailable, the overnight bank funding rate) plus
0.50
%
or (z) the eurodollar rate assuming a one-month interest period plus
1.00
%
, plus (ii) an interest rate margin ("ABR loans"). The interest rate margin ranges from
0.875
%
to
1.50
%
for Parent Eurodollar loans and from
0
%
to
0.50
%
for ABR loans, determined by reference to the Company's public debt ratings. The Parent is obligated to pay a commitment fee ranging from
0.08
%
to
0.20
%
on any unused amount of the Parent Revolving Facility, determined by reference to the Company's public debt ratings. There were
no
borrowings outstanding under the Parent Revolving Facility as of September 30,
2019
and
2018
. As of September 30,
2019
, the interest rate margin would have been
1.125
%
for Parent Eurodollar loans and
0.125
%
for ABR loans, and the commitment fee was
0.125
%
, each determined by reference to the Company's public debt ratings.
The Parent Revolving Facility contains negative covenants that limit or restrict, subject to certain exceptions, the incurrence of liens, indebtedness of subsidiaries, mergers, consolidations, transactions with affiliates, change in nature of business and the sale of all or substantially all of the assets of the Company. The Parent is also required to maintain compliance with a maximum consolidated leverage ratio covenant and a minimum consolidated interest coverage ratio covenant, and the Company's broker-dealer and FCM/FDM subsidiaries are required to maintain compliance with a minimum regulatory net capital covenant. The Company was in compliance with all covenants under the Parent Revolving Facility as of September 30,
2019
.
TD Ameritrade Clearing, Inc. Senior Revolving Credit Facilities
—
TDAC has access to
two
senior unsecured committed revolving credit facilities with an aggregate principal amount of
$
1.45
billion
, consisting of a
$
600
million
(the "
$
600
Million Revolving Facility") and an
$
850
million
(the "
$
850
Million Revolving Facility") senior revolving facility (together, the "TDAC Revolving Facilities"). TDAC entered into the
$
850
Million Revolving Facility on May 16, 2019, replacing its prior
$
850
million
senior unsecured committed revolving credit facility, which matured on the same date. The maturity dates of the
$
600
Million Revolving Facility and the
$
850
Million Revolving Facility are
April 21, 2022
and May 14, 2020, respectively.
The applicable interest rate under each of the TDAC Revolving Facilities is calculated as a per annum rate equal to, at the option of TDAC, (1) LIBOR plus an interest rate margin ("TDAC Eurodollar loans") or (2) the federal funds effective rate plus an interest rate margin ("Federal Funds Rate loans"). The interest rate margin ranges from
0.75
%
to
1.25
%
for both TDAC Eurodollar loans and Federal Funds Rate loans, determined by reference to the Company's public debt ratings. TDAC is obligated to pay commitment fees ranging from
0.07
%
to
0.175
%
and from
0.06
%
to
0.125
%
on any unused amounts of the
$
600
Million Revolving Facility and the
$
850
Million Revolving Facility, respectively, each determined by reference to the Company's public debt ratings. There were
no
borrowings outstanding under the TDAC Revolving Facilities as of September 30,
2019
and
2018
. As of September 30,
2019
, the interest rate margin under the TDAC Revolving Facilities would have been
1.00
%
for both TDAC Eurodollar
76
TD AMERITRADE HOLDING CORPORATION
NOTES TO CONSOLIDATED FINANCIAL STATEMENTS — (Continued)
loans and Federal Funds Rate loans, determined by reference to the Company's public debt ratings. As of September 30,
2019
, the commitment fees under the
$
600
Million Revolving Facility and the
$
850
Million Revolving Facility were
0.10
%
and
0.08
%
, respectively, each determined by reference to the Company's public debt ratings.
The TDAC Revolving Facilities contain negative covenants that limit or restrict, subject to certain exceptions, the incurrence of liens, indebtedness of TDAC, change in nature of business, mergers, consolidations, and the sale of all or substantially all of the assets of TDAC. TDAC is also required to maintain minimum consolidated tangible net worth and is required to maintain compliance with minimum regulatory net capital requirements. TDAC was in compliance with all covenants under the TDAC Revolving Facilities as of September 30,
2019
.
Intercompany Credit Agreements
—
The Parent has entered into credit agreements with each of its primary broker-dealer and FCM/FDM subsidiaries, under which the Parent may make loans of cash or securities under committed and/or uncommitted lines of credit.
Key information about the committed and/or uncommitted lines of credit is summarized in the following table (dollars in millions):
|
Borrower Subsidiary
|
Committed Facility
|
Uncommitted Facility
(1)
|
Termination Date
|
|||
|
TD Ameritrade Clearing, Inc.
|
$
|
$
|
March 1, 2022
|
|||
|
TD Ameritrade, Inc.
|
N/A
|
$
|
March 1, 2022
|
|||
|
TD Ameritrade Futures & Forex LLC
|
$
|
N/A
|
August 11, 2021
|
|||
|
(1)
|
The Parent is permitted, but under no obligation, to make loans under uncommitted facilities.
|
Loans under both the committed and uncommitted facilities bear interest at the same rate as borrowings under the TDAC Revolving Facilities and must be repaid with interest on or before the termination date.
There were
no
borrowings outstanding under any of the intercompany credit agreements as of September 30,
2019
and
2018
.
12.
Income Taxes
The Tax Cuts and Jobs Act (the "Act") was enacted on December 22, 2017, reducing the U.S. federal corporate income tax rate from 35% to 21%. The U.S. federal statutory income tax rate for companies with a fiscal year end of September 30, 2018, was a blended rate of
24.5
%
for fiscal year 2018.
Provision for income taxes is comprised of the following for the fiscal years indicated (dollars in millions):
|
2019
|
2018
|
2017
|
||||||||||
|
Current expense:
|
||||||||||||
|
Federal
|
$
|
|
|
$
|
|
|
$
|
|
|
|||
|
State
|
|
|
|
|
|
|
||||||
|
|
|
|
|
|
|
|||||||
|
Deferred expense (benefit):
|
||||||||||||
|
Federal
|
|
|
(
|
)
|
(
|
)
|
||||||
|
State
|
|
|
|
|
|
|
||||||
|
|
|
(
|
)
|
(
|
)
|
|||||||
|
Provision for income taxes
|
$
|
|
|
$
|
|
|
$
|
|
|
|||
77
TD AMERITRADE HOLDING CORPORATION
NOTES TO CONSOLIDATED FINANCIAL STATEMENTS — (Continued)
A reconciliation of the U.S. federal statutory income tax rate to the effective tax rate applicable to pre-tax income follows for the fiscal years indicated:
|
2019
|
2018
|
2017
|
|||||||
|
Federal statutory income tax rate
|
|
%
|
|
%
|
|
%
|
|||
|
Statutory versus actual blended federal income tax rate
|
|
|
(
|
)
|
|
|
|||
|
State taxes, net of federal tax effect
|
|
|
|
|
|
|
|||
|
Federal incentives
|
|
|
|
|
(
|
)
|
|||
|
Interest recorded on unrecognized tax benefits, net
|
|
|
|
|
|
|
|||
|
Remeasurement of U.S. deferred income taxes
|
|
|
(
|
)
|
|
|
|||
|
Reversal of accruals for unrecognized tax benefits
|
(
|
)
|
(
|
)
|
(
|
)
|
|||
|
Share-based payment compensation
|
(
|
)
|
(
|
)
|
|
|
|||
|
Disallowed executive compensation
|
|
|
|
|
|
|
|||
|
Other
|
(
|
)
|
|
|
|
|
|||
|
|
%
|
|
%
|
|
%
|
||||
The Company's effective income tax rate for fiscal year
2019
was
24.6
%
, compared to
21.9
%
and
37.4
%
for fiscal years
2018
and
2017
, respectively. The provision for income taxes for the fiscal year 2019 included
$
16
million
of favorable adjustments related to state income tax matters and a
$
4
million
income tax benefit resulting from the vesting of equity-based compensation. These items had a favorable impact on the Company's earnings for fiscal year 2019 of approximately
$
0.04
per share. The provision for income taxes for fiscal year 2018 included a net favorable adjustment of
$
71
million
related to the remeasurement of the Company's deferred income tax balances as it pertains to the Act, a
$
5
million
income tax benefit resulting from the change in accounting for income taxes related to equity-based compensation under ASU 2016-09,
$
12
million
of favorable resolutions of state income tax matters and a
$
30
million
favorable benefit resulting from accelerating certain deductions, including acquisition-related exit costs, to leverage higher 2017 pre-enactment tax rates. The effective income tax rate was also impacted by a
$
9
million
unfavorable remeasurement of uncertain tax positions related to certain federal incentives. These items had a net favorable impact on the Company's earnings for fiscal year 2018 of approximately
$
0.19
per share. The provision for income taxes for fiscal year 2017 included
$
8
million
of net favorable resolutions of state income tax matters and
$
4
million
of favorable tax benefits for certain federal incentives. These items had a net favorable impact on the Company's earnings for fiscal year 2017 of approximately
$
0.02
per share.
78
TD AMERITRADE HOLDING CORPORATION
NOTES TO CONSOLIDATED FINANCIAL STATEMENTS — (Continued)
Deferred tax assets (liabilities) are comprised of the following (dollars in millions):
|
|
September 30,
|
|||||||
|
|
2019
|
2018
|
||||||
|
Deferred tax assets:
|
||||||||
|
Accrued and other liabilities
|
$
|
|
|
$
|
|
|
||
|
Stock-based compensation
|
|
|
|
|
||||
|
Allowance for doubtful accounts
|
|
|
|
|
||||
|
Operating loss carryforwards
|
|
|
|
|
||||
|
Intangible assets, state tax benefit
|
|
|
|
|
||||
|
Unrecognized loss on cash flow hedging instruments
|
|
|
|
|
||||
|
Other deferred tax assets
|
|
|
|
|
||||
|
Gross deferred tax assets
|
|
|
|
|
||||
|
Less: Valuation allowance
|
(
|
)
|
(
|
)
|
||||
|
Net deferred tax assets
|
|
|
|
|
||||
|
Deferred tax liabilities:
|
||||||||
|
Acquired intangible assets
|
(
|
)
|
(
|
)
|
||||
|
Property and equipment
|
(
|
)
|
(
|
)
|
||||
|
Unrecognized gain on cash flow hedging instruments
|
(
|
)
|
|
|
||||
|
Prepaid expenses
|
(
|
)
|
(
|
)
|
||||
|
Capitalized contract acquisition costs
|
(
|
)
|
|
|
||||
|
Unrealized gain on investments
|
(
|
)
|
(
|
)
|
||||
|
Other deferred tax liabilities
|
|
|
(
|
)
|
||||
|
Total deferred tax liabilities
|
(
|
)
|
(
|
)
|
||||
|
Net deferred tax liabilities
|
$
|
(
|
)
|
$
|
(
|
)
|
||
At September 30,
2019
, subsidiaries of the Company have approximately
$
79
million
of separate state operating loss carryforwards. These carryforwards expire between fiscal years
2021
and
2038
. Because the realization of the tax benefit from state loss carryforwards is dependent on certain subsidiaries generating sufficient state taxable income in future periods, as well as annual limitations on future utilization, the Company has provided a valuation allowance against the computed benefit in order to reflect the tax benefit expected to be realized.
A reconciliation of the activity related to unrecognized tax benefits follows for the fiscal years indicated (dollars in millions):
|
2019
|
2018
|
2017
|
||||||||||
|
Beginning balance
|
$
|
|
|
$
|
|
|
$
|
|
|
|||
|
Additions based on tax positions related to the current year
|
|
|
|
|
|
|
||||||
|
Additions for tax positions of prior years
|
|
|
|
|
|
|
||||||
|
Reductions due to lapsed statute of limitations
|
(
|
)
|
(
|
)
|
(
|
)
|
||||||
|
Reductions due to settlements with taxing authorities
|
(
|
)
|
(
|
)
|
(
|
)
|
||||||
|
Reductions for tax positions of prior years
|
(
|
)
|
(
|
)
|
(
|
)
|
||||||
|
Ending balance
|
$
|
|
|
$
|
|
|
$
|
|
|
|||
79
TD AMERITRADE HOLDING CORPORATION
NOTES TO CONSOLIDATED FINANCIAL STATEMENTS — (Continued)
The balance of unrecognized tax benefits as of September 30,
2019
was
$
193
million
(
$
160
million
net of the federal benefit on state matters), all of which, if recognized, would favorably affect the effective income tax rate in any future periods. The balance of unrecognized tax benefits as of September 30,
2018
was
$
181
million
(
$
151
million
net of the federal benefit on state matters), all of which, if recognized, would favorably affect the effective income tax rate in any future periods. The Company's income tax returns are subject to review and examination by federal, state and local taxing authorities. The Company's federal claims for refund for tax years 2012 through 2014 and the federal returns for 2015 and 2016 are being examined by the Internal Revenue Service. The federal returns for
2015
through
2018
remain open to examination under the statute of limitations. The years open to examination by state and local government authorities vary by jurisdiction, but the statute of limitations is generally
three
to
four years
from the date the tax return is filed. It is reasonably possible that the gross unrecognized tax benefits as of September 30,
2019
could decrease by up to
$
73
million
(
$
64
million
net of the federal benefit on state matters) within the next 12 months as a result of settlements of certain examinations or expiration of the statute of limitations with respect to other tax filings.
The Company recognized
$
5
million
,
$
4
million
and
$
2
million
of interest and penalties expense (net of the federal benefit) on the Consolidated Statements of Income for fiscal years 2019, 2018 and 2017, respectively, primarily due to accruals for unrecognized tax benefits. As of September 30,
2019
and
2018
, accrued interest and penalties related to unrecognized tax benefits was
$
36
million
and
$
30
million
, respectively.
13
.
Capital Requirements
The Company's broker-dealer subsidiaries are subject to the SEC Uniform Net Capital Rule (Rule 15c3-1 under the Exchange Act), administered by the SEC and FINRA, which requires the maintenance of minimum net capital, as defined. Net capital and the related net capital requirements may fluctuate on a daily basis. TDAC, the Company's clearing broker-dealer subsidiary, and TD Ameritrade, Inc., an introducing broker-dealer subsidiary of the Company, compute net capital under the alternative method as permitted by SEC Rule 15c3-1. TDAC is required to maintain minimum net capital of the greater of
$
1.5
million
, which is based on the type of business conducted by the broker-dealer, or
2
%
of aggregate debit balances arising from client transactions. TD Ameritrade, Inc.is required to maintain minimum net capital of the greater of
$
250,000
or
2
%
of aggregate debit balances arising from client transactions. In addition, under the alternative method, a broker-dealer may not repay any subordinated borrowings, pay cash dividends or make any unsecured advances or loans to its parent company or employees if such payment would result in net capital of less than (1)
5
%
of aggregate debit balances or (2)
120
%
of its minimum dollar requirement.
TD Ameritrade Futures & Forex LLC ("TDAFF"), the Company's FCM and FDM subsidiary registered with the CFTC, is subject to CFTC Regulations 1.17 and 5.7 under the Commodity Exchange Act, administered by the CFTC and the NFA. As an FCM, TDAFF is required to maintain minimum adjusted net capital under CFTC Regulation 1.17 of the greater of (1)
$
1.0
million
or (2) its futures risk-based capital requirement, equal to
8
%
of the total risk margin requirement for all futures positions carried by the FCM in client and nonclient accounts. As an FDM, TDAFF is also subject to the net capital requirements under CFTC Regulation 5.7, which requires TDAFF to maintain minimum adjusted net capital of the greater of (1) any amount required under CFTC Regulation 1.17 as described above or (2)
$
20.0
million
plus
5
%
of all foreign exchange liabilities owed to forex clients in excess of
$
10.0
million
. In addition, an FCM and FDM must provide notice to the CFTC if its adjusted net capital amounts to less than (1)
110
%
of its risk-based capital requirement under CFTC Regulation 1.17, (2)
150
%
of its
$1.0 million
minimum dollar requirement, or (3)
110
%
of
$20.0 million
plus
5%
of all foreign exchange liabilities owed to forex clients in excess of
$10.0 million
.
80
TD AMERITRADE HOLDING CORPORATION
NOTES TO CONSOLIDATED FINANCIAL STATEMENTS — (Continued)
Net capital and net capital requirements for the Company's broker-dealer subsidiaries are summarized in the following tables (dollars in millions):
|
TD Ameritrade Clearing, Inc.
|
|||||||||||||||
|
Date
|
Net
Capital
|
Required
Net Capital
(2% of
Aggregate
Debit Balances)
|
Net Capital
in Excess of
Required
Net Capital
|
Ratio of Net
Capital to
Aggregate
Debit Balances
|
|||||||||||
|
September 30, 2019
|
$
|
|
|
$
|
|
|
$
|
|
|
|
%
|
||||
|
September 30, 2018
|
$
|
|
|
$
|
|
|
$
|
|
|
|
%
|
||||
|
TD Ameritrade, Inc.
|
||||||||||||
|
Date
|
Net
Capital
|
Required
Net Capital (Minimum Dollar Requirement)
|
Net Capital
in Excess of Required Net Capital
|
|||||||||
|
September 30, 2019
|
$
|
|
|
$
|
|
|
$
|
|
|
|||
|
September 30, 2018
|
$
|
|
|
$
|
|
|
$
|
|
|
|||
|
TD Ameritrade Futures & Forex LLC
|
||||||||||||
|
Date
|
Adjusted Net
Capital
|
Required Adjusted Net Capital
($20 Million Plus 5% of All Foreign Exchange Liabilities Owed to Forex Clients in Excess of
$10 Million)
|
Adjusted Net Capital
in Excess of
Required
Adjusted Net Capital
|
|||||||||
|
September 30, 2019
|
$
|
|
|
$
|
|
|
$
|
|
|
|||
|
September 30, 2018
|
$
|
|
|
$
|
|
|
$
|
|
|
|||
The Company's non-depository trust company subsidiary, TDATC, is subject to capital requirements established by the State of Maine, which require TDATC to maintain minimum Tier 1 capital. TDATC's Tier 1 capital was
$
43
million
and
$
39
million
as of September 30,
2019
and
2018
, respectively, which exceeded the required Tier 1 capital by
$
22
million
and
$
18
million
, respectively.
14.
Stock-based Compensation
The Company has
two
stock incentive plans under which Company stock-based awards may be granted: the TD Ameritrade Holding Corporation Long-Term Incentive Plan (the "LTIP") and the 2006 Directors Incentive Plan (the "Directors Plan"). The LTIP authorizes the award of options to purchase common stock, common stock appreciation rights, restricted stock, restricted stock units, performance shares and performance units. Under the LTIP,
42,104,174
shares of the Company's common stock are reserved for issuance to eligible employees, consultants and non-employee directors. The Directors Plan authorizes the award of options to purchase common stock, common stock appreciation rights, restricted stock units and restricted stock. Under the Directors Plan,
1,830,793
shares of the Company's common stock are reserved for issuance to non-employee directors.
Stock options, except for replacement options granted in connection with business combinations, are granted by the Company with an exercise price not less than the fair market value of the Company's common stock on the grant date. Stock options generally vest over a
one
- to
four
-year period and expire
10
years after the grant date. Restricted stock units ("RSUs") are awards that entitle the holder to receive shares of Company common stock following a
81
TD AMERITRADE HOLDING CORPORATION
NOTES TO CONSOLIDATED FINANCIAL STATEMENTS — (Continued)
vesting period. RSUs granted to employees generally vest after the completion of a
three
-year period or ratably over a
three
-year period. RSUs granted to non-employee directors generally vest over a
one
-year period. Performance-based restricted stock units ("PRSUs") are a form of RSUs in which the number of shares ultimately received depends on how the Company's total shareholder return compares to the total shareholder returns of companies in a selected performance peer group. PRSUs are subject to a
three
-year cliff vesting period. At the end of the performance period, the number of shares of common stock issued can range from
80
%
to
120
%
of target, depending on the Company's ranking in the performance peer group. Shares of common stock are issued following the end of the performance period.
Stock-based compensation expense was
$
47
million
,
$
60
million
and
$
36
million
for fiscal years
2019
,
2018
and
2017
, respectively. The related income tax benefits were
$
12
million
,
$
17
million
and
$
14
million
for fiscal years
2019
,
2018
and
2017
, respectively.
The following is a summary of option activity in the Company's stock incentive plans for the fiscal year ended September 30,
2019
:
|
Number of
Options
(in thousands)
|
Weighted
Average
Exercise
Price
|
Weighted
Average
Remaining
Contractual
Term (Years)
|
Aggregate
Intrinsic
Value
(in millions)
|
||||||||||
|
Outstanding at beginning of year
|
|
|
$
|
|
|
||||||||
|
Outstanding at end of year
|
|
|
$
|
|
|
|
$
|
|
|
||||
|
Exercisable at end of year
|
|
|
$
|
|
|
|
$
|
|
|
||||
The Company measures the fair value of stock options using a Black-Scholes-Merton valuation model as of the date of the grant.
No
options were granted during fiscal years
2019
,
2018
and 2017. The total intrinsic value of options exercised during fiscal year
2017
was
$
26
million
.
No
options were exercised during fiscal years 2019 and 2018. As of September 30,
2019
, the total unrecognized compensation cost related to nonvested stock options awards was
$
0.2
million
and was expected to be recognized over a weighted-average period of
0.3
years.
The Company measures the fair value of RSUs based upon the volume-weighted average market price of the underlying common stock as of the date of grant. The grant date fair value of PRSUs was determined based upon a Monte Carlo simulation model whereby the stock prices of the Company and the selected peer group companies were simulated using correlated Geometric Brownian motion paths in order to estimate the Company's total expected shareholder return rank within the peer group index and the corresponding percent of PRSUs that are estimated to be earned per the PRSU award agreement. RSUs and PRSUs are amortized over their applicable vesting period using the straight-line method, reduced by expected forfeitures.
The following is a summary of RSU activity in the Company's stock incentive plans for the fiscal year ended September 30,
2019
:
|
Number of
Units
(in thousands)
|
Weighted
Average
Grant Date
Fair Value
|
||||||
|
Nonvested at beginning of year
|
|
|
$
|
|
|
||
|
Granted
|
|
|
$
|
|
|
||
|
Vested
|
(
|
)
|
$
|
|
|
||
|
Forfeited
|
(
|
)
|
$
|
|
|
||
|
Nonvested at end of year
|
|
|
$
|
|
|
||
The weighted-average grant-date fair value of RSUs granted during fiscal years
2019
,
2018
and
2017
was
$
48.43
,
$
50.61
and
$
40.66
, respectively. As of September 30,
2019
, there was
$
34
million
of estimated unrecognized compensation cost related to nonvested RSUs, which was expected to be recognized over a weighted average period
82
TD AMERITRADE HOLDING CORPORATION
NOTES TO CONSOLIDATED FINANCIAL STATEMENTS — (Continued)
of
1.8
years. The total fair value of RSUs that vested during fiscal years
2019
,
2018
and
2017
was
$
43
million
,
$
42
million
and
$
70
million
, respectively.
The following is a summary of PRSU activity in the Company's stock incentive plans for the fiscal year ended September 30,
2019
:
|
Number of
Units
(in thousands)
|
Weighted
Average
Grant Date
Fair Value
|
||||||
|
Nonvested at beginning of year
|
|
|
$
|
|
|
||
|
Granted
|
|
|
$
|
|
|
||
|
Nonvested at end of year
|
|
|
$
|
|
|
||
The weighted-average grant-date fair value of the PRSUs granted during the fiscal years 2019, 2018 and 2017 was
$
49.59
,
$
49.50
and
$
39.48
, respectively. As of September 30,
2019
, there was
$
8
million
of estimated unrecognized compensation cost related to nonvested PRSUs, which was expected to be recognized over a weighted average period of
1.5
years.
The fair value of PRSUs granted was estimated using a Monte Carlo simulation model with the following inputs for the fiscal years indicated:
|
2019
|
2018
|
2017
|
|||||||
|
Risk-free interest rate
|
|
%
|
|
%
|
|
%
|
|||
|
Expected dividend yield
|
|
%
|
|
%
|
|
%
|
|||
|
Expected volatility
|
|
%
|
|
%
|
|
%
|
|||
|
Expected term (years)
|
|
|
|
|
|
|
|||
The risk-free interest rate input was based on U.S. Treasury note yields with remaining terms comparable to the expected term input used in the valuation model. The expected dividend yield was selected to be
zero
as the vesting condition is based on total shareholder return, which includes changes in price, plus reinvestment of dividends paid. The expected volatility was based on historical daily price changes for a period of time that corresponds with the expected term input used in the valuation model. The expected term input was based on the contractual remaining period of time until the award vests in accordance with the PRSU award agreement.
Although the Company does not have a formal policy regarding issuance of shares for stock-based compensation, such shares are generally issued from treasury stock. The stockholders agreement entered into in connection with the acquisition of TD Waterhouse Group, Inc. requires the Company to repurchase its common stock from time to time to offset dilution resulting from stock option exercises and other stock awards subsequent to the acquisition. As of September 30,
2019
, the Company was not obligated to repurchase additional shares pursuant to the stockholders agreement. The Company cannot estimate the amount and timing of repurchases that may be required as a result of future stock issuances.
15.
Employee Benefit Plans
The Company has a 401(k) and profit-sharing plan under which annual profit-sharing contributions are determined at the discretion of the board of directors. The Company also makes matching contributions pursuant to the plan document. Profit-sharing and matching contributions expense was
$
60
million
,
$
53
million
and
$
38
million
for fiscal years
2019
,
2018
and
2017
, respectively.
83
TD AMERITRADE HOLDING CORPORATION
NOTES TO CONSOLIDATED FINANCIAL STATEMENTS — (Continued)
16
.
Commitments and Contingencies
Lease Commitments
—
The Company has various non-cancelable operating leases on facilities requiring annual payments as follows (dollars in millions):
|
Fiscal Year
|
Minimum
Lease
Payments
|
Sublease
Income
|
Net Lease
Commitments
|
|||||||||
|
2020
|
$
|
|
|
$
|
(
|
)
|
$
|
|
|
|||
|
2021
|
|
|
(
|
)
|
|
|
||||||
|
2022
|
|
|
|
|
|
|
||||||
|
2023
|
|
|
|
|
|
|
||||||
|
2024
|
|
|
|
|
|
|
||||||
|
Thereafter (to 2033)
|
|
|
|
|
|
|
||||||
|
Total
|
$
|
|
|
$
|
(
|
)
|
$
|
|
|
|||
A majority of the leases for the Company's branch offices contain provisions for renewal at the Company's option. Rental expense, net of sublease income, was approximately
$
76
million
,
$
83
million
and
$
54
million
for fiscal years
2019
,
2018
and
2017
, respectively.
Legal and Regulatory Matters
Order Routing Matters —
In 2014,
five
putative class action complaints were filed regarding TD Ameritrade, Inc.'s routing of client orders and
one
putative class action was filed regarding Scottrade, Inc.'s routing of client orders.
Five
of the
six
cases were dismissed and the United States Court of Appeals, 8
th
Circuit, affirmed the dismissals in those cases that were appealed. The
one
remaining case is
Roderick Ford
(replacing
Gerald Klein) v. TD
Ameritrade Holding Corporation, et al.
, Case No. 8:14CV396 (U.S. District Court, District of Nebraska).
In the remaining case, plaintiff alleges that, when routing client orders to various market centers, defendants did not seek best execution, and instead routed clients' orders to market venues that paid TD Ameritrade, Inc. the most money for order flow. Plaintiff alleges that defendants made misrepresentations and omissions regarding the Company's order routing practices. The complaint asserts claims of violation
s
of Section 10(b) and 20 of the Exchange Act and SEC Rule 10b-5. The complaint seeks damages, injunctive relief, and other relief. Plaintiff filed a motion for class certification, which defendants opposed. On July 12, 2018, the Magistrate Judge issued findings and a recommendation that plaintiff's motion for class certification be denied. Plaintiff filed objections to the Magistrate Judge's findings and recommendation, which defendants opposed. On September 14, 2018, the District Judge sustained plaintiff's objections, rejected the Magistrate Judge's recommendation and granted plaintiff's motion for class certification. On September 28, 2018, defendants filed a petition requesting that the U.S. Court of Appeals, 8th Circuit, grant an immediate appeal of the District Court's class certification decision. The U.S. Court of Appeals, 8th Circuit, granted defendants' petition on December 18, 2018. Briefing on the appeal is complete. The Securities Industry and Financial Markets Association and the U.S. Chamber of Commerce have filed
amicus curiae
briefs in support of the Company's appeal. The Company intends to vigorously defend against this lawsuit and is unable to predict the outcome or the timing of the ultimate resolution of the lawsuit, or the potential loss, if any, that may result.
Aequitas Securities Litigation —
An amended putative class action complaint was filed in the U.S. District Court for the District of Oregon in
Lawrence Ciuffitelli et al. v. Deloitte & Touche LLP, EisnerAmper LLP, Sidley Austin LLP, Tonkon Torp LLP, TD Ameritrade, Inc., and Integrity Bank & Trust,
Case No. 3:16CV580, on May 19, 2016. A second amended putative class action complaint was filed on September 8, 2017, in which Duff & Phelps was added as a defendant. The putative class includes all persons who purchased securities of Aequitas Commercial Finance, LLC and its affiliates on or after June 9, 2010. Other groups of plaintiffs have filed non-class action lawsuits in Oregon Circuit Court, Multnomah County, against these and other defendants. FINRA arbitrations have also been filed against TD Ameritrade, Inc. The claims in these actions include allegations that the sales of Aequitas
84
TD AMERITRADE HOLDING CORPORATION
NOTES TO CONSOLIDATED FINANCIAL STATEMENTS — (Continued)
securities were unlawful, the defendants participated and materially aided in such sales in violation of the Oregon securities laws, and material misstatements and omissions were made. While the factual allegations differ in various respects among the cases, plaintiffs' allegations include assertions that: TD Ameritrade, Inc. customers purchased more than
$
140
million
of Aequitas securities; TD Ameritrade, Inc. served as custodian for Aequitas securities; recommended and referred investors to financial advisors as part of its advisor referral program for the purpose of purchasing Aequitas securities; participated in marketing the securities; recommended the securities; provided assurances to investors about the safety of the securities; and developed a market for the securities. In the
Ciuffitelli
putative class action, plaintiffs allege that more than
1,500
investors were owed more than
$
600
million
on the Aequitas securities they purchased. On August 1, 2018, the Magistrate Judge in that case issued findings and a recommendation that defendants' motions to dismiss the pending complaint be denied with limited exceptions not applicable to the Company. TD Ameritrade, Inc. and other defendants filed objections to the Magistrate Judge's findings and recommendation, which plaintiffs opposed. On September 24, 2018, the District Judge issued an opinion and order adopting the Magistrate Judge's findings and recommendation. In May 2019, TD Ameritrade, Inc. settled all of the non-class action claims then pending for an immaterial amount paid by its insurers. Plaintiffs and defendants Tonkon Torp and Integrity Bank entered into agreements to settle the claims in the
Ciuffitelli
case on a class basis for an aggregate amount of
$
14.6
million
subject to Court approval. Following a mediation, on July 9, 2019, plaintiffs and the remaining defendants in the
Ciuffitelli
case reached an agreement to settle the claims on a class basis for
$
220
million
subject to Court approval. If the Court approves the settlement, TD Ameritrade, Inc. will contribute
$
20
million
and its insurers
$
12
million
of the aggregate settlement amount. On July 15, 2019, the Magistrate Judge issued findings and a recommendation that the District Judge preliminarily approve the class settlements. On August 7, 2019, the District Judge issued an order adopting the Magistrate Judge's findings and recommendation on preliminary approval. A settlement hearing is scheduled for November 26, 2019. Except as described above, the Company is unable to predict the outcome or the timing of the ultimate resolution of this litigation, or the potential losses, if any, that may result.
Other Legal and Regulatory Matters
— The Company is subject to a number of other lawsuits, arbitrations, claims and other legal proceedings in connection with its business. Some of these legal actions include claims for substantial or unspecified compensatory and/or punitive damages. In addition, in the normal course of business, the Company discusses matters with its regulators raised during regulatory examinations or otherwise subject to their inquiry. These matters could result in censures, fines, penalties or other sanctions.
ASC 450,
Loss Contingencies
, governs the recognition and disclosure of loss contingencies, including potential losses from legal and regulatory matters. ASC 450 categorizes loss contingencies using three terms based on the likelihood of occurrence of events that result in a loss: "probable" means that "the future event or events are likely to occur;" "remote" means that "the chance of the future event or events occurring is slight;" and "reasonably possible" means that "the chance of the future event or events occurring is more than remote but less than likely." Under ASC 450, the Company accrues for losses that are considered both probable and reasonably estimable.
The Company may incur losses in addition to the amounts accrued where the losses are greater than estimated by management, or for matters for which an unfavorable outcome is considered reasonably possible, but not probable.
The Company estimates that the aggregate range of reasonably possible losses in excess of amounts accrued is from
$
0
to
$
80
million
as of September 30,
2019
. This estimated aggregate range of reasonably possible losses is based upon currently available information for those legal and regulatory matters in which the Company is involved, taking into account the Company's best estimate of reasonably possible losses for those matters as to which an estimate can be made. For certain matters, the Company does not believe an estimate can currently be made, as some matters are in preliminary stages and some matters have no specific amounts claimed. The Company's estimate involves significant judgment, given the varying stages of the proceedings and the inherent uncertainty of predicting outcomes. The estimated range will change from time to time as the underlying matters, stages of proceedings and available information change. Actual losses may vary significantly from the current estimated range.
The Company believes, based on its current knowledge and after consultation with counsel, that the ultimate disposition of these legal and regulatory matters, individually or in the aggregate, is not likely to have a material adverse effect on the financial condition or cash flows of the Company. However, in light of the uncertainties involved in such matters, the Company is unable to predict the outcome or the timing of the ultimate resolution of
85
TD AMERITRADE HOLDING CORPORATION
NOTES TO CONSOLIDATED FINANCIAL STATEMENTS — (Continued)
these matters, or the potential losses, fines, penalties or equitable relief, if any, that may result, and it is possible that the ultimate resolution of one or more of these matters may be material to the Company's results of operations for a particular reporting period.
Income Taxes
The Company's federal and state income tax returns are subject to examination by taxing authorities. Because the application of tax laws and regulations to many types of transactions is subject to varying interpretations, amounts reported in the consolidated financial statements could be significantly changed at a later date upon final determinations by taxing authorities.
General Contingencies
In the ordinary course of business, there are various contingencies that are not reflected in the consolidated financial statements. These include the Company's broker-dealer and FCM/FDM subsidiaries' client activities involving the execution, settlement and financing of various client securities, options, futures and foreign exchange transactions. These activities may expose the Company to credit risk and losses in the event the clients are unable to fulfill their contractual obligations.
The Company extends margin credit and leverage to its clients. In margin transactions, the Company extends credit to the client, subject to various regulatory and internal margin requirements, collateralized by cash and securities in the client's account. In connection with these activities, the Company also routes client orders for execution and clears client transactions involving the sale of securities not yet purchased ("short sales"). Such margin-related transactions may expose the Company to credit risk in the event a client's assets are not sufficient to fully cover losses that the client may incur. Leverage involves securing a large potential future obligation with a lesser amount of collateral. The risks associated with margin credit and leverage increase during periods of rapid market movements, or in cases where leverage or collateral is concentrated and market movements occur. In the event the client fails to satisfy its obligations, the Company has the authority to liquidate certain positions in the client's account(s) at prevailing market prices in order to fulfill the client's obligations. However, during periods of rapid market movements, clients who utilize margin credit or leverage and who have collateralized their obligations with securities may find that the securities have a rapidly depreciating value (or increasing value with respect to short positions) and may not be sufficient to cover their obligations in the event of liquidation. The Company seeks to mitigate the risks associated with its client margin and leverage activities by requiring clients to maintain margin collateral in compliance with various regulatory and internal guidelines. The Company monitors required margin levels throughout each trading day and, pursuant to such guidelines, requires clients to deposit additional collateral, or to reduce positions, when necessary.
The Company contracts with unaffiliated FCM, FDM and broker-dealer entities to clear and execute futures, options on futures and foreign exchange transactions for its clients. This can result in concentrations of credit risk with one or more of these counterparties. This risk is partially mitigated by the counterparties' obligation to comply with rules and regulations governing FCMs, FDMs and broker-dealers in the United States. These rules generally require maintenance of net capital and segregation of client funds and securities. In addition, the Company manages this risk by requiring credit approvals for counterparties and by utilizing account funding and sweep arrangement agreements that generally specify that all client cash in excess of futures funding requirements be transferred back to the clients' securities brokerage accounts at the Company on a daily basis.
The Company loans securities temporarily to other broker-dealers in connection with its broker-dealer business. The Company receives cash as collateral for the securities loaned. Increases in securities prices may cause the market value of the securities loaned to exceed the amount of cash received as collateral. In the event the counterparty to these transactions does not return the loaned securities, the Company may be exposed to the risk of acquiring the securities at higher prevailing market prices in order to satisfy its client obligations. The Company mitigates this risk by requiring credit approvals for counterparties, by monitoring the market value of securities loaned on a daily basis and requiring additional cash as collateral when necessary, and by participating in a risk-sharing program offered through the Options Clearing Corporation ("OCC").
86
TD AMERITRADE HOLDING CORPORATION
NOTES TO CONSOLIDATED FINANCIAL STATEMENTS — (Continued)
The Company borrows securities temporarily from other broker-dealers in connection with its broker-dealer business. The Company deposits cash as collateral for the securities borrowed. Decreases in securities prices may cause the market value of the securities borrowed to fall below the amount of cash deposited as collateral. In the event the counterparty to these transactions does not return the cash deposited, the Company may be exposed to the risk of selling the securities at prevailing market prices. The Company mitigates this risk by requiring credit approvals for counterparties, by monitoring the collateral values on a daily basis and requiring collateral to be returned by the counterparties when necessary, and by participating in a risk-sharing program offered through the OCC.
The Company transacts in reverse repurchase agreements (securities purchased under agreements to resell) in connection with its broker-dealer business. The Company's policy is to take possession or control of securities with a market value in excess of the principal amount loaned, plus accrued interest, in order to collateralize resale agreements. The Company monitors the market value of the underlying securities that collateralize the related receivable on resale agreements on a daily basis and may require additional collateral when deemed appropriate.
The Company utilizes securities sold under agreements to repurchase (repurchase agreements) to finance its short-term liquidity and capital needs. Under these agreements, the Company receives cash from the counterparties and provides U.S. Treasury securities as collateral, allowing the counterparties the right to sell or repledge the collateral. These agreements expose the Company to credit losses in the event the counterparties cannot meet their obligations. The Company mitigates this risk by requiring credit approvals for counterparties, by monitoring the market value of pledged securities owned on a daily basis and requiring the counterparties to return cash or excess collateral pledged when necessary.
The Company has accepted collateral in connection with client margin loans and securities borrowed. Under applicable agreements, the Company is generally permitted to repledge securities held as collateral and use them to enter into securities lending arrangements.
The following table summarizes the fair values of client margin securities and stock borrowings that were available to the Company to utilize as collateral on various borrowings or for other purposes, and the amount of that collateral loaned or repledged by the Company (dollars in billions):
|
|
September 30,
|
|||||||
|
|
2019
|
2018
|
||||||
|
Client margin securities
|
$
|
|
|
$
|
|
|
||
|
Stock borrowings
|
|
|
|
|
||||
|
Total collateral available
|
$
|
|
|
$
|
|
|
||
|
Collateral loaned
|
$
|
|
|
$
|
|
|
||
|
Collateral repledged
|
|
|
|
|
||||
|
Total collateral loaned or repledged
|
$
|
|
|
$
|
|
|
||
The Company is subject to cash deposit and collateral requirements with clearinghouses based on its clients' trading activity.
The following table summarizes cash deposited with and securities pledged to clearinghouses by the Company (dollars in millions):
|
|
September 30,
|
|||||||||
|
Assets
|
Balance Sheet Classification
|
2019
|
2018
|
|||||||
|
Cash
|
Receivable from brokers, dealers and clearing organizations
|
$
|
|
|
$
|
|
|
|||
|
U.S. government debt securities
|
Securities owned, at fair value
|
|
|
|
|
|||||
|
Total
|
$
|
|
|
$
|
|
|
||||
The Company manages its sweep program through off-balance sheet arrangements with The Toronto Dominion Bank ("TD") and unaffiliated third-party depository financial institutions (together, the "Sweep Program Counterparties"). The sweep program is offered to eligible clients whereby the client's uninvested cash is swept into FDIC-insured (up to specified limits) money market deposit accounts at the Sweep Program Counterparties. The
87
TD AMERITRADE HOLDING CORPORATION
NOTES TO CONSOLIDATED FINANCIAL STATEMENTS — (Continued)
Company earns revenue on client cash at the Sweep Program Counterparties based on the return of floating-rate and fixed-rate notional investments. The Company designates amounts and maturity dates for the fixed-rate notional investments within the sweep program portfolios, subject to certain limitations. In the event the Company instructs the Sweep Program Counterparties to withdraw a fixed-rate notional investment prior to its maturity, the Company may be required to reimburse the Sweep Program Counterparties for any losses incurred as a result of the early withdrawal. In order to mitigate the risk of potential loss due to an early withdrawal of fixed-rate notional investments, the Company maintains a certain level of short-term floating-rate investments within the sweep program portfolios to meet client cash demands. See "
Insured Deposit Account Agreement
" in Note 23 for a description of the sweep arrangement between the Company and TD.
Guarantees
The Company is a member of and provides guarantees to securities clearinghouses and exchanges in connection with client trading activities. Under related agreements, the Company is generally required to guarantee the performance of other members. Under these agreements, if a member becomes unable to satisfy its obligations to the clearinghouse, other members would be required to meet shortfalls. The Company's liability under these arrangements is not quantifiable and could exceed the cash and securities it has posted to the clearinghouse as collateral. However, the likelihood that the Company would be required to make payments under these agreements is considered remote. Accordingly,
no
contingent liability is carried on the Consolidated Balance Sheets for these guarantees.
The Company clears its clients' futures and options on futures transactions on an omnibus account basis through unaffiliated FCMs. The Company also contracts with an external provider to facilitate foreign exchange trading for its clients. The Company has agreed to indemnify these unaffiliated FCMs and the external provider for any loss that they may incur from the client transactions introduced to them by the Company.
See "
Insured Deposit Account Agreement
" in Note
23
for a description of the guarantees included in that agreement.
17.
Fair Value Disclosures
Fair Value Measurement — Definition and Hierarchy
ASC 820-10,
Fair Value Measurement
, defines fair value as the price that would be received to sell an asset or paid to transfer a liability (an exit price) in an orderly transaction between market participants at the measurement date.
ASC 820-10 establishes a hierarchy for inputs used in measuring fair value that maximizes the use of observable inputs and minimizes the use of unobservable inputs by requiring that the most observable inputs be used when available. Observable inputs reflect the assumptions market participants would use in pricing the asset or liability, and are developed based on market data obtained from sources independent of the Company. Unobservable inputs reflect the Company's own assumptions about the assumptions other market participants would use in pricing the asset or liability, and are developed based on the best information available in the circumstances.
The fair value hierarchy prioritizes the inputs to valuation techniques used to measure fair value into three broad levels, as follows:
|
•
|
Level 1 — Quoted prices (unadjusted) in active markets for identical assets or liabilities that the Company has the ability to access. This category includes active exchange-traded funds, money market mutual funds, mutual funds and equity securities.
|
|
•
|
Level 2 — Inputs other than quoted prices included in Level 1 that are observable for the asset or liability, either directly or indirectly. Such inputs include quoted prices in markets that are not active, quoted prices for similar assets and liabilities in active and inactive markets, inputs other than quoted prices that are observable for the asset or liability and inputs that are derived principally from or corroborated by observable market data by correlation or other means. This category includes most debt securities, U.S. government agency mortgage-backed securities, which consist of Ginnie Mae Conventional Residential
|
88
TD AMERITRADE HOLDING CORPORATION
NOTES TO CONSOLIDATED FINANCIAL STATEMENTS — (Continued)
Mortgages and Ginnie Mae Home Equity Conversion Mortgages, and other interest-sensitive financial instruments.
|
•
|
Level 3 — Unobservable inputs for the asset or liability, where there is little, if any, observable market activity or data for the asset or liability.
|
The following tables present the Company's fair value hierarchy for assets and liabilities measured at fair value on a recurring basis as of September 30,
2019
and
2018
(dollars in millions):
|
September 30, 2019
|
||||||||||||||||
|
Level 1
|
Level 2
|
Level 3
|
Fair Value
|
|||||||||||||
|
Assets:
|
||||||||||||||||
|
Cash equivalents:
|
||||||||||||||||
|
Money market mutual funds
|
$
|
|
|
$
|
—
|
|
$
|
—
|
|
$
|
|
|
||||
|
Investments segregated and on deposit for regulatory purposes:
|
||||||||||||||||
|
U.S. government debt securities
|
—
|
|
|
|
—
|
|
|
|
||||||||
|
U.S. government agency mortgage-backed securities
|
—
|
|
|
|
—
|
|
|
|
||||||||
|
Subtotal - Investments segregated and on deposit for regulatory purposes
|
—
|
|
|
|
—
|
|
|
|
||||||||
|
Securities owned:
|
||||||||||||||||
|
U.S. government debt securities
|
—
|
|
|
|
—
|
|
|
|
||||||||
|
Other
|
|
|
|
|
—
|
|
|
|
||||||||
|
Subtotal - Securities owned
|
|
|
|
|
—
|
|
|
|
||||||||
|
Investments available-for-sale:
|
||||||||||||||||
|
U.S. government debt securities
|
—
|
|
|
|
—
|
|
|
|
||||||||
|
Other assets:
|
||||||||||||||||
|
Pay-variable interest rate swaps
(1)
|
—
|
|
|
|
—
|
|
|
|
||||||||
|
U.S. government debt securities
|
—
|
|
|
|
—
|
|
|
|
||||||||
|
Subtotal - Other assets
|
—
|
|
|
|
|
|
|
|
||||||||
|
Total assets at fair value
|
$
|
|
|
$
|
|
|
$
|
|
|
$
|
|
|
||||
|
Liabilities:
|
||||||||||||||||
|
Accounts payable and other liabilities:
|
||||||||||||||||
|
Pay-variable interest rate swaps
(1)
|
$
|
—
|
|
$
|
|
|
$
|
—
|
|
$
|
|
|
||||
|
(1)
|
See "
Fair Value Hedging
" in Note
11
for details.
|
89
TD AMERITRADE HOLDING CORPORATION
NOTES TO CONSOLIDATED FINANCIAL STATEMENTS — (Continued)
|
September 30, 2018
|
||||||||||||||||
|
Level 1
|
Level 2
|
Level 3
|
Fair Value
|
|||||||||||||
|
Assets:
|
||||||||||||||||
|
Cash equivalents:
|
||||||||||||||||
|
Money market mutual funds
|
$
|
|
|
$
|
—
|
|
$
|
—
|
|
$
|
|
|
||||
|
Investments segregated and on deposit for regulatory purposes:
|
||||||||||||||||
|
U.S. government debt securities
|
—
|
|
|
|
—
|
|
|
|
||||||||
|
U.S. government agency mortgage-backed securities
|
—
|
|
|
|
—
|
|
|
|
||||||||
|
Subtotal - Investments segregated and on deposit for regulatory purposes
|
—
|
|
|
|
—
|
|
|
|
||||||||
|
Securities owned:
|
||||||||||||||||
|
U.S. government debt securities
|
—
|
|
|
|
—
|
|
|
|
||||||||
|
Other
|
|
|
|
|
—
|
|
|
|
||||||||
|
Subtotal - Securities owned
|
|
|
|
|
|
|
|
|
||||||||
|
Investments available-for-sale:
|
||||||||||||||||
|
U.S. government debt securities
|
—
|
|
|
|
—
|
|
|
|
||||||||
|
Other assets:
|
||||||||||||||||
|
Pay-variable interest rate swaps
(1)
|
—
|
|
|
|
—
|
|
|
|
||||||||
|
U.S. government debt securities
|
—
|
|
|
|
—
|
|
|
|
||||||||
|
Auction rate securities
|
—
|
|
—
|
|
|
|
|
|
||||||||
|
Subtotal - Other assets
|
—
|
|
|
|
|
|
|
|
||||||||
|
Total assets at fair value
|
$
|
|
|
$
|
|
|
$
|
|
|
$
|
|
|
||||
|
Liabilities:
|
||||||||||||||||
|
Accounts payable and other liabilities:
|
||||||||||||||||
|
Pay-variable interest rate swaps
(1)
|
$
|
—
|
|
$
|
|
|
$
|
—
|
|
$
|
|
|
||||
|
(1)
|
See "
Fair Value Hedging
" in Note
11
for details.
|
There were no transfers between any levels of the fair value hierarchy during the periods covered by this report.
Valuation Techniques
In general, and where applicable, the Company uses quoted prices in active markets for identical assets or liabilities to determine fair value. This pricing methodology applies to the Company's Level 1 assets and liabilities. If quoted prices in active markets for identical assets and liabilities are not available to determine fair value, then the Company uses quoted prices for similar assets and liabilities or inputs other than the quoted prices that are observable, either directly or indirectly. This pricing methodology applies to the Company's Level 2 assets and liabilities.
Level 2 Measurements:
Debt securities
— Fair values for debt securities are based on prices obtained from an independent pricing vendor. The primary inputs to the valuation include quoted prices for similar assets in active markets, quoted prices for identical or similar assets in markets that are not active, contractual cash flows, benchmark yields and credit spreads. The Company validates the vendor pricing by periodically comparing it to pricing from another independent pricing
90
TD AMERITRADE HOLDING CORPORATION
NOTES TO CONSOLIDATED FINANCIAL STATEMENTS — (Continued)
service. The Company has not adjusted prices obtained from the independent pricing vendor for any periods presented in the consolidated financial statements because no significant pricing differences have been observed.
U.S. government agency mortgage-backed securities
— Fair values for mortgage-backed securities are based on prices obtained from an independent pricing vendor. The primary inputs to the valuation include quoted prices for similar assets in active markets and in markets that are not active, a market-derived prepayment curve, weighted average yields on the underlying collateral and spreads to benchmark indices. The Company validates the vendor pricing by periodically comparing it to pricing from two other independent sources. The Company has not adjusted prices obtained from the independent pricing vendor for any periods presented in the consolidated financial statements because no significant pricing differences have been observed.
Interest rate swaps
— These derivatives are valued by the Company using a valuation model provided by a third-party service that incorporates interest rate yield curves, which are observable for substantially the full term of the contract. The valuation model is widely accepted in the financial services industry and does not involve significant judgment because most of the inputs are observable in the marketplace. Credit risk is not an input to the valuation because in each case the Company or counterparty has possession of collateral, in the form of cash or U.S. Treasury securities, in amounts equal to or exceeding the fair value of the interest rate swaps. The Company validates the third-party service valuations by comparing them to valuation models provided by the swap counterparties.
Level 3 Measurements:
The Company has no material assets or liabilities classified as Level 3 of the fair value hierarchy.
Fair Value of Financial Instruments Not Recorded at Fair Value
Receivable from/payable to brokers, dealers and clearing organizations, receivable from/payable to clients, receivable from/payable to affiliates, other receivables, accounts payable and other liabilities and certain other borrowings
are short-term in nature and accordingly are carried at amounts that approximate fair value. These financial instruments are recorded at or near their respective transaction prices and historically have been settled or converted to cash at approximately that value (categorized as Level 2 of the fair value hierarchy).
Cash and investments segregated and on deposit for regulatory purposes
includes reverse repurchase agreements (securities purchased under agreements to resell). Reverse repurchase agreements are treated as collateralized financing transactions and are carried at amounts at which the securities will subsequently be resold, plus accrued interest. The Company's reverse repurchase agreements generally have a maturity of
seven days
and are collateralized by securities in amounts exceeding the carrying value of the resale agreements. Accordingly, the carrying value of reverse repurchase agreements approximates fair value (categorized as Level 2 of the fair value hierarchy). Cash and investments segregated and on deposit for regulatory purposes also includes cash held in demand deposit accounts and on deposit with futures commission merchants, for which the carrying values approximate the fair value (categorized as Level 1 of the fair value hierarchy). See Note
4
for a summary of cash and investments segregated and on deposit for regulatory purposes.
Securities sold under agreements to repurchase (repurchase agreements) included within other borrowings
— Under repurchase agreements the Company receives cash from the counterparties and provides U.S. Treasury securities as collateral. The obligations to repurchase securities sold are reflected as a liability on the Consolidated Balance Sheets. Repurchase agreements are treated as collateralized financing transactions and are carried at amounts at which the securities will subsequently be repurchased, plus accrued interest. The Company's repurchase agreements are short-term in nature and accordingly the carrying value is a reasonable estimate of fair value (categorized as Level 2 of the fair value hierarchy).
Long-term debt
— As of September 30,
2019
, the Company's Senior Notes had an aggregate estimated fair value, based on quoted market prices (categorized as Level 1 of the fair value hierarchy), of approximately
$
3.67
billion
, compared to the aggregate carrying value of the Senior Notes on the Consolidated Balance Sheet of
$
3.59
billion
. As of September 30,
2018
, the Company's Senior Notes had an aggregate estimated fair value, based on quoted
91
TD AMERITRADE HOLDING CORPORATION
NOTES TO CONSOLIDATED FINANCIAL STATEMENTS — (Continued)
market prices, of approximately
$
2.51
billion
, compared to the aggregate carrying value of the Senior Notes on the Consolidated Balance Sheet of
$
2.44
billion
.
18
.
Offsetting Assets and Liabilities
Substantially all of the Company's securities sold under agreements to repurchase (repurchase agreements), reverse repurchase agreements, securities borrowing and securities lending activity and derivative financial instruments are transacted under master agreements that may allow for net settlement in the ordinary course of business, as well as offsetting of all contracts with a given counterparty in the event of default by one of the parties. However, for financial statement purposes, the Company does not net balances related to these financial instruments.
The following tables present information about the potential effect of rights of setoff associated with the Company's recognized assets and liabilities as of
September 30, 2019
and
2018
(dollars in millions):
|
September 30, 2019
|
||||||||||||||||||||||||
|
Gross Amounts Not Offset
in the
Consolidated Balance Sheet
|
||||||||||||||||||||||||
|
Gross Amounts
of Recognized
Assets and
Liabilities
|
Gross Amounts
Offset in the
Consolidated
Balance Sheet
|
Net Amounts
Presented in
the Consolidated
Balance Sheet
|
Financial
Instruments
(5)
|
Collateral
Received or
Pledged
(Including
Cash)
(6)
|
Net
Amount
(7)
|
|||||||||||||||||||
|
Assets:
|
||||||||||||||||||||||||
|
Investments segregated and on deposit for regulatory purposes:
|
||||||||||||||||||||||||
|
Reverse repurchase agreements
|
$
|
|
|
$
|
|
|
$
|
|
|
$
|
|
|
$
|
(
|
)
|
$
|
|
|
||||||
|
Receivable from brokers, dealers and clearing organizations:
|
||||||||||||||||||||||||
|
Deposits paid for securities borrowed
(1)
|
|
|
|
|
|
|
(
|
)
|
(
|
)
|
|
|
||||||||||||
|
Other assets:
|
||||||||||||||||||||||||
|
Pay-variable interest rate swaps
|
|
|
|
|
|
|
(
|
)
|
|
|
|
|
||||||||||||
|
Total
|
$
|
|
|
$
|
|
|
$
|
|
|
$
|
(
|
)
|
$
|
(
|
)
|
$
|
|
|
||||||
|
Liabilities:
|
||||||||||||||||||||||||
|
Payable to brokers, dealers and clearing organizations:
|
||||||||||||||||||||||||
|
Deposits received for securities loaned
(2)(3)
|
$
|
|
|
$
|
|
|
$
|
|
|
$
|
(
|
)
|
$
|
(
|
)
|
$
|
|
|
||||||
|
Accounts payable and other liabilities:
|
||||||||||||||||||||||||
|
Pay-variable interest rate swaps
|
|
|
|
|
|
|
(
|
)
|
|
|
|
|
||||||||||||
|
Total
|
$
|
|
|
$
|
|
|
$
|
|
|
$
|
(
|
)
|
$
|
(
|
)
|
$
|
|
|
||||||
92
TD AMERITRADE HOLDING CORPORATION
NOTES TO CONSOLIDATED FINANCIAL STATEMENTS — (Continued)
|
September 30, 2018
|
||||||||||||||||||||||||
|
Gross Amounts Not Offset
in the
Consolidated Balance Sheet
|
||||||||||||||||||||||||
|
Gross Amounts
of Recognized
Assets and
Liabilities
|
Gross Amounts
Offset in the
Consolidated
Balance Sheet
|
Net Amounts
Presented in
the Consolidated
Balance Sheet
|
Financial
Instruments
(5)
|
Collateral
Received or
Pledged
(Including
Cash)
(6)
|
Net
Amount
(7)
|
|||||||||||||||||||
|
Assets:
|
||||||||||||||||||||||||
|
Investments segregated and on deposit for regulatory purposes:
|
||||||||||||||||||||||||
|
Reverse repurchase agreements
|
$
|
|
|
$
|
|
|
$
|
|
|
$
|
|
|
$
|
(
|
)
|
$
|
|
|
||||||
|
Receivable from brokers, dealers and clearing organizations:
|
||||||||||||||||||||||||
|
Deposits paid for securities borrowed
(1)
|
|
|
|
|
|
|
(
|
)
|
(
|
)
|
|
|
||||||||||||
|
Other assets:
|
||||||||||||||||||||||||
|
Pay-variable interest rate swaps
|
|
|
|
|
|
|
(
|
)
|
|
|
|
|
||||||||||||
|
Total
|
$
|
|
|
$
|
|
|
$
|
|
|
$
|
(
|
)
|
$
|
(
|
)
|
$
|
|
|
||||||
|
Liabilities:
|
||||||||||||||||||||||||
|
Payable to brokers, dealers and clearing organizations:
|
||||||||||||||||||||||||
|
Deposits received for securities loaned
(2)(3)
|
$
|
|
|
$
|
|
|
$
|
|
|
$
|
(
|
)
|
$
|
(
|
)
|
$
|
|
|
||||||
|
Securities sold under agreements to repurchase
(4)
|
|
|
|
|
|
|
(
|
)
|
|
|
|
|
||||||||||||
|
Accounts payable and other liabilities:
|
||||||||||||||||||||||||
|
Pay-variable interest rate swaps
|
|
|
|
|
|
|
(
|
)
|
|
|
|
|
||||||||||||
|
Total
|
$
|
|
|
$
|
|
|
$
|
|
|
$
|
(
|
)
|
$
|
(
|
)
|
$
|
|
|
||||||
|
(1)
|
Included in the gross amounts of deposits paid for securities borrowed is
$
|
|
(2)
|
Included in the gross amounts of deposits received for securities loaned is
$
|
93
TD AMERITRADE HOLDING CORPORATION
NOTES TO CONSOLIDATED FINANCIAL STATEMENTS — (Continued)
|
(3)
|
Substantially all of the Company's securities lending transactions have a continuous contractual term and, upon notice by either party, may be terminated within two business days.
|
|
September 30,
|
||||||||
|
2019
|
2018
|
|||||||
|
Deposits received for securities loaned:
|
||||||||
|
Equity securities
|
$
|
|
|
$
|
|
|
||
|
Exchange-traded funds
|
|
|
|
|
||||
|
Real estate investment trusts
|
|
|
|
|
||||
|
Closed-end funds
|
|
|
|
|
||||
|
Other
|
|
|
|
|
||||
|
Total
|
$
|
|
|
$
|
|
|
||
|
(4)
|
The collateral pledged includes available-for-sale U.S. government debt securities at fair value. All of the Company's repurchase agreements have a remaining contractual maturity of less than 90 days and, upon default by either party, may be terminated at the option of the non-defaulting party. See "
General Contingencies
" in Note
16
for a discussion of the potential risks associated with repurchase agreements and how the Company mitigates those risks.
|
|
(5)
|
Amounts represent recognized assets and liabilities that are subject to enforceable master agreements with rights of setoff.
|
|
(6)
|
Represents the fair value of collateral the Company had received or pledged under enforceable master agreements, limited for table presentation purposes to the net amount of the recognized assets due from or liabilities due to each counterparty. At
September 30, 2019
and
2018
, the Company had received total collateral with a fair value of
$
|
|
(7)
|
Represents the amount for which, in the case of net recognized assets, the Company had not received collateral, and in the case of net recognized liabilities, the Company had not pledged collateral.
|
94
TD AMERITRADE HOLDING CORPORATION
NOTES TO CONSOLIDATED FINANCIAL STATEMENTS — (Continued)
19.
Accumulated Other Comprehensive Income (Loss)
The following table presents the net change in fair value recorded for each component of other comprehensive income (loss) before and after income tax for the fiscal years indicated (dollars in millions):
|
2019
|
2018
|
2017
|
||||||||||||||||||||||||||||||||||
|
Before Tax
|
Tax Effect
|
Net of Tax
|
Before Tax
|
Tax Effect
|
Net of Tax
|
Before Tax
|
Tax Effect
|
Net of Tax
|
||||||||||||||||||||||||||||
|
Investments available-for-sale:
|
||||||||||||||||||||||||||||||||||||
|
Unrealized gain (loss)
|
$
|
|
|
$
|
(
|
)
|
$
|
|
|
$
|
(
|
)
|
$
|
|
|
$
|
(
|
)
|
$
|
(
|
)
|
$
|
|
|
$
|
(
|
)
|
|||||||||
|
Reclassification adjustment for realized loss included in net income
(1)
|
|
|
|
|
|
|
|
|
(
|
)
|
|
|
|
|
|
|
|
|
||||||||||||||||||
|
Net change in investments available-for-sale
|
|
|
(
|
)
|
|
|
(
|
)
|
(
|
)
|
(
|
)
|
(
|
)
|
|
|
(
|
)
|
||||||||||||||||||
|
Cash flow hedging instruments:
|
||||||||||||||||||||||||||||||||||||
|
Reclassification adjustment for portion of realized loss amortized to net income
(2)
|
|
|
(
|
)
|
|
|
|
|
(
|
)
|
|
|
|
|
(
|
)
|
|
|
||||||||||||||||||
|
Net change in cash flow hedging instruments
|
|
|
(
|
)
|
|
|
|
|
(
|
)
|
|
|
|
|
(
|
)
|
|
|
||||||||||||||||||
|
Other comprehensive income (loss)
|
$
|
|
|
$
|
(
|
)
|
$
|
|
|
$
|
|
|
$
|
(
|
)
|
$
|
|
|
$
|
(
|
)
|
$
|
|
|
$
|
(
|
)
|
|||||||||
|
(1)
|
The before tax reclassification amount and related tax effect are included in loss on sale of investments and provision for income taxes, respectively, on the Consolidated Statements of Income.
|
|
(2)
|
The before tax reclassification amounts and the related tax effects are included in interest on borrowings and provision for income taxes, respectively, on the Consolidated Statements of Income.
|
95
TD AMERITRADE HOLDING CORPORATION
NOTES TO CONSOLIDATED FINANCIAL STATEMENTS — (Continued)
The following table presents after-tax changes in each component of accumulated other comprehensive income (loss) for the fiscal years indicated (dollars in millions):
|
2019
|
2018
|
2017
|
||||||||||
|
Investments available-for-sale:
|
||||||||||||
|
Beginning balance
|
$
|
(
|
)
|
$
|
(
|
)
|
$
|
|
|
|||
|
Other comprehensive income (loss) before reclassification
|
|
|
(
|
)
|
(
|
)
|
||||||
|
Amount reclassified from accumulated other comprehensive income (loss)
|
|
|
|
|
|
|
||||||
|
Current period change
|
|
|
(
|
)
|
(
|
)
|
||||||
|
Ending balance
|
$
|
|
|
$
|
(
|
)
|
$
|
(
|
)
|
|||
|
Cash flow hedging instruments:
|
||||||||||||
|
Beginning balance
|
$
|
(
|
)
|
$
|
(
|
)
|
$
|
(
|
)
|
|||
|
Amount reclassified from accumulated other comprehensive income (loss)
|
|
|
|
|
|
|
||||||
|
Adoption of Accounting Standards Update 2018-02
|
|
|
(
|
)
|
|
|
||||||
|
Current period change
|
|
|
|
|
|
|
||||||
|
Ending balance
|
$
|
(
|
)
|
$
|
(
|
)
|
$
|
(
|
)
|
|||
|
Total accumulated other comprehensive income (loss):
|
||||||||||||
|
Beginning balance
|
$
|
(
|
)
|
$
|
(
|
)
|
$
|
(
|
)
|
|||
|
Current period change
|
|
|
(
|
)
|
(
|
)
|
||||||
|
Ending balance
|
$
|
|
|
$
|
(
|
)
|
$
|
(
|
)
|
|||
20.
Segment and Geographic Area Information
The Company primarily operates in the securities brokerage industry and has no other reportable segments. Substantially all of the Company's revenues from external clients for the fiscal years ended September 30,
2019
,
2018
and
2017
were derived from its operations in the United States.
21.
Accelerated Stock Repurchase Agreements
On March 26, 2019, the Company entered into an agreement with an investment bank counterparty to purchase
$
350
million
of its common stock under an accelerated stock repurchase transaction (the "March 2019 ASR Agreement"). Pursuant to the terms of the March 2019 ASR Agreement, the Company received an initial delivery of
5.6
million
shares of its common stock on March 28, 2019 and received an additional
1.3
million
shares upon settlement of the transaction on August 7, 2019. The Company ultimately repurchased a total of approximately
6.9
million
shares under the March 2019 ASR Agreement at a net weighted average price of
$
50.84
per share.
On November 27, 2018, the Company entered into an agreement with an investment bank counterparty to purchase
$
60
million
of its common stock under an accelerated stock repurchase transaction (the "November 2018 ASR Agreement"). Pursuant to the terms of the November 2018 ASR Agreement, the Company received an initial delivery of
0.9
million
shares of its common stock on November 30, 2018 and received an additional
0.3
million
shares upon settlement of the transaction on March 5, 2019. The Company ultimately repurchased a total of approximately
1.2
million
shares under the November 2018 ASR Agreement at a net weighted average price of
$
52.12
per share.
On September 12, 2018, the Company entered into an agreement with an investment bank counterparty to purchase
$
150
million
of its common stock under an accelerated stock repurchase transaction (the "September 2018 ASR Agreement"). Pursuant to the terms of the September 2018 ASR Agreement, the Company received an initial delivery of
2.2
million
shares of its common stock on September 13, 2018 and received an additional
0.6
million
shares upon settlement of the transaction on October 16, 2018. The Company ultimately repurchased a total of
96
TD AMERITRADE HOLDING CORPORATION
NOTES TO CONSOLIDATED FINANCIAL STATEMENTS — (Continued)
approximately
2.8
million
shares under the September 2018 ASR Agreement at a net weighted average price of
$
53.13
per share.
22.
Revenue Recognition
On October 1, 2018, the Company adopted ASU 2014-09,
Revenue from Contracts with Customers (ASC Topic 606),
and related ASUs using a modified retrospective approach for all contracts that were not completed as of October 1, 2018.
The cumulative effect of the changes made to the Company's Consolidated Balance Sheet as of October 1, 2018 for the adoption of ASU 2014-09 were as follows (dollars in millions):
|
Balance at
September 30, 2018
|
Adjustments from
Adoption of
ASU 2014-09
|
Balance at
October 1, 2018
|
||||||||||
|
Assets:
|
||||||||||||
|
Other assets
|
$
|
|
|
$
|
|
|
$
|
|
|
|||
|
Liabilities:
|
||||||||||||
|
Deferred income taxes
|
|
|
|
|
|
|
||||||
|
Stockholders' equity:
|
||||||||||||
|
Retained earnings
|
|
|
|
|
|
|
||||||
The modified retrospective transition method does not require the Company to recast the prior year financial statements; although, ASU 2014-09 requires the Company to provide additional disclosures for the amount by which each financial statement line item is affected by the adoption of the standard.
The financial statement line items affected by the adoption of ASU 2014-09 are as follows (dollars in millions, except per share amounts):
|
As of September 30, 2019
|
||||||||||||
|
Consolidated Balance Sheet
|
As Reported
|
Balances Without
Adoption of
ASU 2014-09
|
Effect of Change
Higher/(Lower)
|
|||||||||
|
Assets:
|
||||||||||||
|
Other assets
|
$
|
|
|
$
|
|
|
$
|
|
|
|||
|
Liabilities:
|
||||||||||||
|
Deferred income taxes
|
|
|
|
|
|
|
||||||
|
Stockholders' equity:
|
||||||||||||
|
Retained earnings
|
|
|
|
|
|
|
||||||
97
TD AMERITRADE HOLDING CORPORATION
NOTES TO CONSOLIDATED FINANCIAL STATEMENTS — (Continued)
|
For the Fiscal Year Ended September 30, 2019
|
||||||||||||
|
Consolidated Statement of Income
|
As Reported
|
Balances Without
Adoption of
ASU 2014-09
|
Effect of Change
Higher/(Lower)
|
|||||||||
|
Revenues:
|
||||||||||||
|
Other revenues
|
$
|
|
|
$
|
|
|
$
|
|
|
|||
|
Operating expenses:
|
||||||||||||
|
Employee compensation and benefits
|
|
|
|
|
|
|
||||||
|
Clearing and execution costs
|
|
|
|
|
|
|
||||||
|
Other
|
|
|
|
|
|
|
||||||
|
Provision for income taxes
|
|
|
|
|
(
|
)
|
||||||
|
Net income
|
|
|
|
|
(
|
)
|
||||||
|
Earnings per share — diluted
|
$
|
|
|
$
|
|
|
$
|
(
|
)
|
|||
The following table sets forth the disaggregation of the Company's revenue by major source (dollars in millions):
|
Fiscal Year
|
'19 vs. '18
%
Change
|
'18 vs. '17
%
Change
|
||||||||||||||||
|
2019
|
2018
|
2017
|
||||||||||||||||
|
Revenues:
|
||||||||||||||||||
|
Transaction-based revenues:
|
||||||||||||||||||
|
Commissions
|
$
|
|
|
$
|
|
|
$
|
|
|
(
|
)%
|
|
%
|
|||||
|
Order routing revenue
|
|
|
|
|
|
|
|
%
|
|
%
|
||||||||
|
Other
|
|
|
|
|
|
|
|
%
|
|
%
|
||||||||
|
Total transaction-based revenues
|
|
|
|
|
|
|
||||||||||||
|
Asset-based revenues:
|
||||||||||||||||||
|
Bank deposit account fees
|
|
|
|
|
|
|
|
%
|
|
%
|
||||||||
|
Net interest revenue
|
|
|
|
|
|
|
|
%
|
|
%
|
||||||||
|
Investment product fees
|
|
|
|
|
|
|
|
%
|
|
%
|
||||||||
|
Total asset-based revenues
|
|
|
|
|
|
|
||||||||||||
|
Other revenues
|
|
|
|
|
|
|
|
%
|
|
%
|
||||||||
|
Net revenues
|
$
|
|
|
$
|
|
|
$
|
|
|
|||||||||
The amount of revenue recognized by the Company is measured based on the consideration specified in contracts with its clients. The Company recognizes revenue when a performance obligation is satisfied over time as the services are performed or at a point in time depending on the nature of the services provided as further discussed below.
Transaction-Based Revenues
Transaction-based revenues primarily consists of trading commissions earned on trade execution, net of promotional allowances, and order routing revenue. The primary factors driving the Company's transaction-based revenues are total trades and average commissions per trade. Commission rates are based on rates established by the Company, which vary by type of trade. The Company reduced certain commission rates effective October 3, 2019, see Note
98
TD AMERITRADE HOLDING CORPORATION
NOTES TO CONSOLIDATED FINANCIAL STATEMENTS — (Continued)
26, Subsequent Event, for additional details. Transaction-based revenues are earned and recognized at a point in time, on a trade-date basis, as clients execute trades. These trades are generally settled and trading commissions are collected from the Company's clients within one to two business days after the trade date. Order routing revenues are generated from arrangements with market centers to receive cash payments and/or rebates in exchange for routing orders to these firms for execution and are generally collected from the market centers on a monthly basis. Securities owned by clients, including those that collateralize margin or similar transactions, are not reflected in the accompanying consolidated financial statements.
Asset-Based Revenues
Asset-based revenues consists of bank deposit account fees, net interest revenue and investment product fees. The primary factors driving the Company's asset-based revenues are average balances and average rates. Average balances consist primarily of average client bank deposit account balances, average client margin balances, average segregated cash balances, average client credit balances, average fee-based investment balances and average securities borrowing and lending balances. Average rates consist of the average interest rates and fees earned and paid on such balances.
Bank deposit account fees
Bank deposit account fees consists of revenues earned and recognized over time resulting from a sweep program that is offered to eligible clients of the Company whereby clients' uninvested cash is swept off-balance sheet to FDIC-insured (up to specified limits) accounts with Sweep Program Counterparties participating in the program. These revenues are based on the return of floating-rate and fixed-rate notional investments, less the actual interest paid to clients and other applicable fees. Bank deposit account fees are collected from the Sweep Program Counterparties on a monthly basis. See "
Insured Deposit Account Agreement
" in Note 23 for a description of the sweep arrangement between the Company and TD.
Net interest revenue
Net interest revenue, which is generated from financial instruments covered by various other areas of GAAP, is not within the scope of ASC 606 and is included in the table above to reconcile to net revenues disclosed within the Consolidated Statements of Income. Net interest revenue primarily consists of income generated by interest charged to clients on margin balances, net interest revenue from securities borrowed and securities loaned transactions and interest earned on client cash, net of interest paid to clients on their credit balances.
Investment product fees
Investment product fee revenue consists of revenues earned and recorded over time on client assets invested in money market mutual funds, other mutual funds and certain investment programs. Investment product fees also includes fees earned on client assets managed by independent registered investment advisors ("RIAs") utilizing the Company's trading and investing platforms. Investment product fees are collected from clients and RIAs on a monthly or quarterly basis. Primary revenue sources within investment product fees are described below.
The following table presents the significant components of investment product fees (dollars in millions):
|
Fiscal Year
|
'19 vs. '18
%
Change
|
'18 vs. '17
%
Change
|
||||||||||||||||
|
2019
|
2018
|
2017
|
||||||||||||||||
|
Investment product fees:
|
||||||||||||||||||
|
Mutual fund service fees
|
$
|
|
|
$
|
|
|
$
|
|
|
|
%
|
|
%
|
|||||
|
Investment program fees
|
|
|
|
|
|
|
|
%
|
|
%
|
||||||||
|
Other
|
|
|
|
|
|
|
(
|
)%
|
|
%
|
||||||||
|
Total investment product fees
|
$
|
|
|
$
|
|
|
$
|
|
|
|||||||||
99
TD AMERITRADE HOLDING CORPORATION
NOTES TO CONSOLIDATED FINANCIAL STATEMENTS — (Continued)
Mutual fund service fees includes shareholder services fees and SEC Rule 12b-1 service and distribution fees. Shareholder services fees are earned on the Company's client assets invested in money market mutual funds and other mutual funds for record-keeping and administrative services provided to these funds. The Company earns SEC Rule 12b-1 service and distribution fees for marketing and distribution services provided to these funds. The fees earned are based on contractual rates applied to the average daily net asset value of eligible shares of a respective fund held by the Company's clients. Shareholder services fees are earned over time and collected from the funds on a monthly or quarterly basis. SEC Rule 12b-1 fees are also earned over time and collected from the funds on a monthly or quarterly basis, as the variable consideration of a transaction price is no longer constrained and the value of consideration can be determined as discussed previously.
Investment program fees are earned through fees charged to clients enrolled in product offerings which are actively managed by TD Ameritrade Investment Management, LLC, a wholly-owned subsidiary of the Company. These fees are earned over time and are based on contractual rates applied to asset balances held by the Company's clients in these product offerings. Certain program fees are based on quarter-end balances and are collected from clients in advance, at the beginning of each calendar quarter. Revenues collected on a quarterly basis, less refunds for clients ceasing participation in the program, are recognized during the quarter as performance obligations are satisfied. Other program fees are based on average daily asset balances and collected from clients on a monthly basis.
The Company also earns investment program fees through referral and asset-based program fees on its client assets managed by independent RIAs utilizing the Company's platform. These fees are earned based on contractual rates applied to the client's average daily asset balances under management. Referral fees are earned over time and collected from the independent RIAs on a monthly or quarterly basis, as the variable consideration of a transaction price is no longer constrained and the value of consideration can be determined as discussed previously. Asset-based program fees are also earned over time and collected from the independent RIAs on a monthly or quarterly basis.
Other Revenues
Other revenues primarily include proxy income, solicit and tender fees and other fees charged for ancillary services provided by the Company to its clients. In addition, other revenues include fair market value adjustments and gains/losses associated with investments held by the Company's broker-dealer subsidiaries. Other revenues generated from investments is covered by various other areas of GAAP, is not within the scope of ASC 606 and is included in the table above to reconcile to net revenues disclosed within the Consolidated Statements of Income. Proxy fee income is earned and collected at a point in time when the Company distributes proxy statements to its clients on behalf of a registrant and the revenue is based on the volume of proxies distributed and the rate per unit charged to each registrant. Solicit and tender fees are earned and collected from clients at a point in time when the Company has satisfied its obligation to maintain its client accounts holding securities affected by corporate actions.
Contract Balances
The following table presents the opening and closing balances of the Company's receivables from contracts with clients that are within the scope of ASC 606 on the Consolidated Balance Sheets (dollars in millions):
|
Contract Balances
|
||||||||||||||||
|
Receivable from Clients
|
Receivable from Affiliates
|
Other Receivables
|
Total Receivables from
Contracts with Clients
|
|||||||||||||
|
Opening balance, October 1, 2018
|
$
|
|
|
$
|
|
|
$
|
|
|
$
|
|
|
||||
|
Closing balance, September 30, 2019
|
|
|
|
|
|
|
|
|
||||||||
|
Increase
|
$
|
|
|
$
|
|
|
$
|
|
|
$
|
|
|
||||
100
TD AMERITRADE HOLDING CORPORATION
NOTES TO CONSOLIDATED FINANCIAL STATEMENTS — (Continued)
The difference between the opening and closing balances of the Company's receivables from contracts with clients primarily results from the timing difference between the Company's performance and the client's payment. No other significant contract assets or liabilities exist as of September 30, 2019 and October 1, 2018.
Unsatisfied Performance Obligations
The Company does not have any unsatisfied performance obligations subject to a practical expedient election under ASC 606.
23
.
Related Party Transactions
Transactions with TD and its Affiliates
As a result of the Company's acquisition of TD Waterhouse Group, Inc. during fiscal year 2006, TD became an affiliate of the Company. TD owned approximately
43
%
of the Company's common stock as of September 30,
2019
. Pursuant to the stockholders agreement between TD and the Company, TD has the right to designate
five
of the
twelve
members of the Company's board of directors. The Company transacts business and has extensive relationships with TD and certain of its affiliates. Transactions with TD and its affiliates are discussed and summarized below.
Insured Deposit Account Agreement
Under the IDA agreement, TD Bank USA and TD Bank, N.A. (together, the "TD Depository Institutions") make available to clients of the Company FDIC-insured (up to specified limits) money market deposit accounts as either designated sweep vehicles or as non-sweep deposit accounts. The Company provides marketing, recordkeeping and support services for the TD Depository Institutions with respect to the money market deposit accounts. In exchange for providing these services, the TD Depository Institutions pay the Company an aggregate marketing fee based on the weighted average yield earned on the client IDA assets, less the actual interest paid to clients, a servicing fee to the TD Depository Institutions and the cost of FDIC insurance premiums.
The current IDA agreement became effective as of
January 1, 2013
and had an initial term expiring
July 1, 2018
. It is automatically renewable for successive
five
-year terms, provided that it may be terminated by either the Company or the TD Depository Institutions by providing written notice of non-renewal at least
two years
prior to the initial expiration date or the expiration date of any subsequent renewal period. As of July 1, 2016, notice of non-renewal was not provided by either party; therefore, the IDA agreement was automatically renewed for an additional five-year term on
July 1, 2018
.
The fee earned on the IDA agreement is calculated based on
two
primary components: (1) the yield on fixed-rate notional investments, based on prevailing fixed rates for identical balances and maturities in the interest rate swap market (generally LIBOR-based) at the time such investments were added to the IDA portfolio (including any adjustments required to adjust the variable rate leg of such swaps to a
one
-month reset frequency and the overall swap payment frequency to monthly) and (2) the yield on floating-rate investments. As of September 30,
2019
, the IDA portfolio was comprised of approximately
80
%
fixed-rate notional investments and
20
%
floating-rate investments.
The IDA agreement provides that the Company may designate amounts and maturity dates for the fixed-rate notional investments in the IDA portfolio, subject to certain limitations. For example, if the Company designates that
$
100
million
of deposits be invested in
5
-year fixed-rate investments, and on the day such investment is confirmed by the TD Depository Institutions the prevailing fixed yield for the applicable
5
-year U.S. dollar LIBOR-based swaps is
1.45
%
, then the Company will earn a gross fixed yield of
1.45
%
on that portion of the portfolio (before any deductions for interest paid to clients, the servicing fee to the TD Depository Institutions and the cost of FDIC insurance premiums). In the event that (1) the federal funds effective rate is established at
0.75
%
or greater and (2) the rate on
5
-year U.S. dollar interest rate swaps is equal to or greater than
1.50
%
for
20
consecutive business days, then the rate earned by the Company on new fixed-rate notional investments will be reduced by
20
%
of the excess of the
5
-year U.S. dollar swap rate over
1.50
%
, up to a maximum of
0.10
%
.
101
TD AMERITRADE HOLDING CORPORATION
NOTES TO CONSOLIDATED FINANCIAL STATEMENTS — (Continued)
The yield on floating-rate investments is calculated daily based on the greater of the following rates published by the Federal Reserve: (1) the interest rate paid by Federal Reserve Banks on balances held in excess of required reserve balances and contractual clearing balances under Regulation D and (2) the daily effective federal funds rate.
The interest rates paid to clients are set by the TD Depository Institutions and are not linked to any index. The servicing fee to the TD Depository Institutions under the IDA agreement is equal to 25 basis points on the aggregate average daily balance in the IDA accounts, subject to adjustment as it relates to deposits of less than or equal to
$
20
billion
kept in floating-rate investments or in fixed-rate notional investments with a maturity of up to
24
months ("short-term fixed-rate investments"). For such floating-rate and short-term fixed-rate investments, the servicing fee is equal to the difference of the interest rate earned on the investments less the FDIC premiums paid (in basis points), divided by two. The servicing fee has a floor of 3 basis points (subject to adjustment from time to time to reflect material changes to the TD Depository Institutions' leverage costs) and a maximum of 25 basis points.
In the event the marketing fee computation results in a negative amount, the Company must pay the TD Depository Institutions the negative amount. This effectively results in the Company guaranteeing the TD Depository Institutions revenue equal to the servicing fee on the IDA agreement, plus the reimbursement of FDIC insurance premiums. The marketing fee computation under the IDA agreement is affected by many variables, including the type, duration, principal balance and yield of the fixed-rate and floating-rate investments, the prevailing interest rate environment, the amount of client deposits and the yield paid on client deposits. Because a negative marketing fee computation would arise only if there were extraordinary movements in many of these variables, the maximum potential amount of future payments the Company could be required to make under this arrangement cannot be reasonably estimated. Management believes the likelihood that the marketing fee calculation would result in a negative amount is remote. Accordingly,
no
contingent liability is carried on the Consolidated Balance Sheets for the IDA agreement. In the event the Company withdraws a notional investment prior to its maturity, the Company is required to reimburse the TD Depository Institutions an amount equal to the economic replacement value of the investment, as defined in the IDA agreement. See "General Contingencies" in Note 16 for a discussion of how the Company mitigates the risk of losses due to the early withdrawal of fixed-rate notional investments.
In addition, the Company has various other services agreements and transactions with TD and its affiliates.
The following tables summarize revenues and expenses resulting from transactions with TD and its affiliates for the fiscal years indicated (dollars in millions):
|
Description
|
Statement of Income
Classification
|
Revenues from TD and its Affiliates
|
||||||||||||
|
2019
|
2018
|
2017
|
||||||||||||
|
Insured Deposit Account Agreement
|
Bank deposit account fees
|
$
|
|
|
$
|
|
|
$
|
|
|
||||
|
Order Routing Agreement
(1)
|
Other revenues
|
|
|
|
|
|
|
|||||||
|
Other
|
Various
|
|
|
|
|
|
|
|||||||
|
Total revenues
|
$
|
|
|
$
|
|
|
$
|
|
|
|||||
|
Description
|
Statement of Income
Classification
|
Expenses to TD and its Affiliates
|
||||||||||||
|
2019
|
2018
|
2017
|
||||||||||||
|
Order Routing Agreement
(1)
|
Other expense
|
$
|
|
|
$
|
|
|
$
|
|
|
||||
|
Canadian Call Center Services Agreement
(2)
|
Various
|
|
|
|
|
|
|
|||||||
|
Other
|
Various
|
|
|
|
|
|
|
|||||||
|
Total expenses
|
$
|
|
|
$
|
|
|
$
|
|
|
|||||
|
(1)
|
Prior to fiscal year 2019, the Company accounted for revenues associated with the Order Routing Agreement between the Company and an affiliate of TD on a net basis through other revenues. Following the adoption of the new revenue recognition standard (ASU 2014-09) on October 1, 2018, the Company began accounting for Order Routing Agreement revenues on a gross basis. The Company adopted the new guidance using the modified retrospective approach, which requires the standard to be applied only to the most current period
|
102
TD AMERITRADE HOLDING CORPORATION
NOTES TO CONSOLIDATED FINANCIAL STATEMENTS — (Continued)
presented; therefore, the prior periods have not been adjusted to reflect the current period presentation. See "Recently Adopted Accounting Pronouncements" in Note 1 for additional details regarding the amended guidance.
|
(2)
|
The Company notified TD of its intent to not extend or renew the Canadian Call Center Services Agreement and services under this agreement ended by September 30, 2017.
|
The following table summarizes the classification and amount of receivables from and payables to TD and its affiliates on the Consolidated Balance Sheets resulting from related party transactions (dollars in millions):
|
|
September 30,
|
|||||||
|
|
2019
|
2018
|
||||||
|
Assets:
|
||||||||
|
Receivable from affiliates
|
$
|
|
|
$
|
|
|
||
|
Liabilities:
|
||||||||
|
Payable to brokers, dealers and clearing organizations
|
$
|
|
|
$
|
|
|
||
|
Payable to affiliates
|
|
|
|
|
||||
|
Accounts payable and other liabilities
|
|
|
|
|
||||
Payables to brokers, dealers and clearing organizations primarily relate to securities lending activity and are settled in accordance with customary contractual terms. Receivables from and payables to TD affiliates resulting from client cash sweep activity are generally settled in cash the next business day. Other receivables from and payables to affiliates of TD are generally settled in cash on a monthly basis.
As of September 30, 2018, payable to affiliates on the Consolidated Balance Sheet included
$
38
million
of liabilities assumed in connection with the acquisition of Scottrade. These liabilities were settled during the first quarter of fiscal year 2019.
TD, along with other financial institutions, is participating as a lender under the Parent Revolving Facility and the TDAC Revolving Facilities. For additional information regarding the Company's revolving facilities, see Note
11
, Long-term Debt and Other Borrowings. As of September 30, 2019 and 2018, the total lending commitment received from TD under these credit facilities was
$
221
million
and
$
257
million
, respectively. During the fiscal year ended September 30, 2019, the Company paid approximately
$
1
million
of debt issuance costs to an affiliate of TD in connection with the issuance of the 2021 Notes, 2024 Notes and 2029 Notes, which is being amortized into interest expense over the terms of the respective notes.
103
TD AMERITRADE HOLDING CORPORATION
NOTES TO CONSOLIDATED FINANCIAL STATEMENTS — (Continued)
24.
Condensed Financial Information (Parent Company Only)
The following tables present the Parent company's condensed balance sheets, statements of income and statements of cash flows. Because all other comprehensive income (loss) activity occurred on the Parent company for all periods presented, the Parent company's condensed statements of comprehensive income are not presented.
PARENT COMPANY ONLY
CONDENSED BALANCE SHEETS
As of September 30,
2019
and
2018
|
2019
|
2018
|
|||||||
|
|
(In millions)
|
|||||||
|
ASSETS
|
||||||||
|
Cash and cash equivalents
|
$
|
|
|
$
|
|
|
||
|
Receivable from subsidiaries
|
|
|
|
|
||||
|
Investments available-for-sale, at fair value
|
|
|
|
|
||||
|
Investments in subsidiaries
|
|
|
|
|
||||
|
Other, net
|
|
|
|
|
||||
|
Total assets
|
$
|
|
|
$
|
|
|
||
|
LIABILITIES AND STOCKHOLDERS' EQUITY
|
||||||||
|
Liabilities:
|
||||||||
|
Accounts payable and other liabilities
|
$
|
|
|
$
|
|
|
||
|
Payable to subsidiaries and affiliates
|
|
|
|
|
||||
|
Securities sold under agreements to repurchase
|
|
|
|
|
||||
|
Long-term debt
|
|
|
|
|
||||
|
Total liabilities
|
|
|
|
|
||||
|
Stockholders' equity
|
|
|
|
|
||||
|
Total liabilities and stockholders' equity
|
$
|
|
|
$
|
|
|
||
104
TD AMERITRADE HOLDING CORPORATION
NOTES TO CONSOLIDATED FINANCIAL STATEMENTS — (Continued)
CONDENSED STATEMENTS OF INCOME
For the Years Ended September 30,
2019
,
2018
and
2017
|
2019
|
2018
|
2017
|
||||||||||
|
|
(In millions)
|
|||||||||||
|
Net revenues
|
$
|
|
|
$
|
|
|
$
|
|
|
|||
|
Operating expenses
|
|
|
|
|
|
|
||||||
|
Operating income (loss)
|
|
|
|
|
(
|
)
|
||||||
|
Other expense, net
|
|
|
|
|
|
|
||||||
|
Loss before income taxes and equity in income of subsidiaries
|
(
|
)
|
(
|
)
|
(
|
)
|
||||||
|
Provision for (benefit from) income taxes
|
(
|
)
|
|
|
(
|
)
|
||||||
|
Loss before equity in income of subsidiaries
|
(
|
)
|
(
|
)
|
(
|
)
|
||||||
|
Equity in income of subsidiaries
|
|
|
|
|
|
|
||||||
|
Net income
|
$
|
|
|
$
|
|
|
$
|
|
|
|||
105
TD AMERITRADE HOLDING CORPORATION
NOTES TO CONSOLIDATED FINANCIAL STATEMENTS — (Continued)
PARENT COMPANY ONLY
CONDENSED STATEMENTS OF CASH FLOWS
For the Years Ended September 30,
2019
,
2018
and
2017
|
2019
|
2018
|
2017
|
||||||||||
|
|
(In millions)
|
|||||||||||
|
Cash flows from operating activities:
|
||||||||||||
|
Net income
|
$
|
|
|
$
|
|
|
$
|
|
|
|||
|
Adjustments to reconcile net income to net cash flows provided by operating activities:
|
||||||||||||
|
Equity in income of subsidiaries
|
(
|
)
|
(
|
)
|
(
|
)
|
||||||
|
Deferred income taxes
|
(
|
)
|
|
|
(
|
)
|
||||||
|
Dividends from subsidiaries
|
|
|
|
|
|
|
||||||
|
Loss on sale of investments
|
|
|
|
|
|
|
||||||
|
Stock-based compensation
|
|
|
|
|
|
|
||||||
|
Other, net
|
|
|
|
|
|
|
||||||
|
Changes in operating assets and liabilities:
|
||||||||||||
|
Receivable from subsidiaries
|
(
|
)
|
(
|
)
|
|
|
||||||
|
Other assets
|
|
|
(
|
)
|
|
|
||||||
|
Accounts payable and other liabilities
|
|
|
|
|
(
|
)
|
||||||
|
Payable to subsidiaries and affiliates
|
(
|
)
|
(
|
)
|
(
|
)
|
||||||
|
Net cash provided by operating activities
|
|
|
|
|
|
|
||||||
|
Cash flows from investing activities:
|
||||||||||||
|
Investment in subsidiaries
|
(
|
)
|
(
|
)
|
(
|
)
|
||||||
|
Loans made under intercompany credit agreements
|
(
|
)
|
(
|
)
|
|
|
||||||
|
Collections on intercompany credit agreements
|
|
|
|
|
|
|
||||||
|
Cash paid in business acquisition
|
|
|
(
|
)
|
(
|
)
|
||||||
|
Proceeds from sale of investments available-for-sale, at fair value
|
|
|
|
|
|
|
||||||
|
Purchase of investments available-for-sale, at fair value
|
(
|
)
|
(
|
)
|
|
|
||||||
|
Net cash used in investing activities
|
(
|
)
|
(
|
)
|
(
|
)
|
||||||
|
Cash flows from financing activities:
|
||||||||||||
|
Proceeds from issuance of long-term debt
|
|
|
|
|
|
|
||||||
|
Payment of debt issuance costs
|
(
|
)
|
(
|
)
|
(
|
)
|
||||||
|
Principal payments on long-term debt
|
(
|
)
|
|
|
(
|
)
|
||||||
|
Reimbursement (payment) of prepayment premium on long-term debt
|
(
|
)
|
|
|
(
|
)
|
||||||
|
Net proceeds from (payments on) securities sold under agreements to repurchase
|
(
|
)
|
(
|
)
|
|
|
||||||
|
Proceeds from Parent Senior Revolving Facility
|
|
|
|
|
|
|
||||||
|
Principal payments on Parent Senior Revolving Facility
|
|
|
(
|
)
|
|
|
||||||
|
Payment of cash dividends
|
(
|
)
|
(
|
)
|
(
|
)
|
||||||
|
Proceeds from issuance of common stock
|
|
|
|
|
|
|
||||||
|
Purchase of treasury stock
|
(
|
)
|
(
|
)
|
|
|
||||||
|
Purchase of treasury stock for income tax withholding on stock-based compensation
|
(
|
)
|
(
|
)
|
(
|
)
|
||||||
|
Payment for future treasury stock under accelerated stock repurchase agreement
|
|
|
(
|
)
|
|
|
||||||
|
Other, net
|
|
|
|
|
|
|
||||||
|
Net cash provided by (used in) financing activities
|
(
|
)
|
(
|
)
|
|
|
||||||
|
Net increase (decrease) in cash and cash equivalents
|
|
|
(
|
)
|
(
|
)
|
||||||
|
Cash and cash equivalents at beginning of year
|
|
|
|
|
|
|
||||||
|
Cash and cash equivalents at end of year
|
$
|
|
|
$
|
|
|
$
|
|
|
|||
|
Supplemental cash flow information:
|
||||||||||||
|
Interest paid
|
$
|
|
|
$
|
|
|
$
|
|
|
|||
|
Income taxes paid
|
$
|
|
|
$
|
|
|
$
|
|
|
|||
|
Noncash investing activities:
|
||||||||||||
|
Issuance of common stock in acquisition
|
$
|
|
|
$
|
|
|
$
|
|
|
|||
|
Assets transferred to a subsidiary, net
|
$
|
|
|
$
|
|
|
$
|
|
|
|||
106
TD AMERITRADE HOLDING CORPORATION
NOTES TO CONSOLIDATED FINANCIAL STATEMENTS — (Continued)
25.
Quarterly Data (Unaudited)
(Dollars in millions, except per share amounts)
|
|
For the Fiscal Year Ended September 30, 2019
|
|||||||||||||||
|
|
First
Quarter
|
Second
Quarter
|
Third
Quarter |
Fourth
Quarter |
||||||||||||
|
Net revenues
|
$
|
|
|
$
|
|
|
$
|
|
|
$
|
|
|
||||
|
Operating income
|
$
|
|
|
$
|
|
|
$
|
|
|
$
|
|
|
||||
|
Net income
|
$
|
|
|
$
|
|
|
$
|
|
|
$
|
|
|
||||
|
Basic earnings per share
|
$
|
|
|
$
|
|
|
$
|
|
|
$
|
|
|
||||
|
Diluted earnings per share
|
$
|
|
|
$
|
|
|
$
|
|
|
$
|
|
|
||||
|
|
For the Fiscal Year Ended September 30, 2018
|
|||||||||||||||
|
|
First
Quarter
|
Second
Quarter
|
Third
Quarter
|
Fourth
Quarter |
||||||||||||
|
Net revenues
|
$
|
|
|
$
|
|
|
$
|
|
|
$
|
|
|
||||
|
Operating income
|
$
|
|
|
$
|
|
|
$
|
|
|
$
|
|
|
||||
|
Net income
|
$
|
|
|
$
|
|
|
$
|
|
|
$
|
|
|
||||
|
Basic earnings per share
|
$
|
|
|
$
|
|
|
$
|
|
|
$
|
|
|
||||
|
Diluted earnings per share
|
$
|
|
|
$
|
|
|
$
|
|
|
$
|
|
|
||||
Quarterly amounts may not sum to fiscal year totals due to rounding.
26.
Subsequent Event
107
Item 9.
Changes in and Disagreements with Accountants on Accounting and Financial Disclosure
None.
Item 9A.
Controls and Procedures
Management's Annual Report on Internal Control Over Financial Reporting
Management of TD Ameritrade Holding Corporation and its subsidiaries (the "Company") is responsible for establishing and maintaining adequate internal control over financial reporting. The Company's internal control over financial reporting is a process designed under the supervision of and effected by the Company's chief executive officer and chief financial officer to provide reasonable assurance regarding the reliability of financial reporting and the preparation of financial statements for external purposes in accordance with U.S. generally accepted accounting principles.
The Company's internal control over financial reporting includes those policies and procedures that (i) pertain to the maintenance of records that, in reasonable detail, accurately and fairly reflect the transactions and dispositions of the assets of the Company; (ii) provide reasonable assurance that transactions are recorded as necessary to permit preparation of financial statements in accordance with U.S. generally accepted accounting principles, and that receipts and expenditures of the Company are being made only in accordance with authorizations of management and directors of the Company; and (iii) provide reasonable assurance regarding prevention or timely detection of unauthorized acquisition, use, or disposition of the Company's assets that could have a material effect on the financial statements.
All internal control systems, no matter how well designed, have inherent limitations. Therefore, even those systems determined to be effective can provide only reasonable assurance with respect to financial statement preparation and presentation. Also, projections of any evaluation of the effectiveness of the internal control over financial reporting to future periods are subject to the risk that the controls may become inadequate because of changes in conditions, or that the degree of compliance with the policies or procedures may deteriorate.
Management conducted an assessment of the effectiveness of the Company's internal control over financial reporting as of September 30,
2019
based on framework established in
Internal Control — Integrated Framework
issued by the Committee of Sponsoring Organizations of the Treadway Commission (2013 framework). Based on this assessment, management concluded that, as of September 30,
2019
, the Company's internal control over financial reporting is effective.
The Company's internal control over financial reporting as of September 30,
2019
has been audited by Ernst & Young LLP, an independent registered public accounting firm, as stated in their accompanying report which expresses an unqualified opinion on the effectiveness of the Company's internal control over financial reporting as of September 30,
2019
. That opinion appears on the next page.
108
Report of Independent Registered Public Accounting Firm
To the Shareholders and the Board of Directors of TD Ameritrade Holding Corporation
Opinion on Internal Control Over Financial Reporting
We have audited TD Ameritrade Holding Corporation's internal control over financial reporting as of September 30,
2019
, based on criteria established in Internal Control — Integrated Framework issued by the Committee of Sponsoring Organizations of the Treadway Commission (2013 framework) (the COSO criteria). In our opinion, TD Ameritrade Holding Corporation (the Company) maintained, in all material respects, effective internal control over financial reporting as of September 30,
2019
, based on the COSO criteria.
We also have audited, in accordance with the standards of the Public Company Accounting Oversight Board (United States) (PCAOB), the consolidated balance sheets of the Company as of September 30, 2019 and 2018, and the related consolidated statements of income, comprehensive income, stockholders' equity, and cash flows for each of the three years in the period ended September 30, 2019, and the related notes and our report dated
November 15, 2019
expressed an unqualified opinion thereon.
Basis for Opinion
The Company's management is responsible for maintaining effective internal control over financial reporting and for its assessment of the effectiveness of internal control over financial reporting included in the accompanying Management's Annual Report on Internal Control Over Financial Reporting. Our responsibility is to express an opinion on the Company's internal control over financial reporting based on our audit. We are a public accounting firm registered with the PCAOB and are required to be independent with respect to the Company in accordance with the U.S. federal securities laws and the applicable rules and regulations of the Securities and Exchange Commission and the PCAOB.
We conducted our audit in accordance with the standards of the PCAOB. Those standards require that we plan and perform the audit to obtain reasonable assurance about whether effective internal control over financial reporting was maintained in all material respects.
Our audit included obtaining an understanding of internal control over financial reporting, assessing the risk that a material weakness exists, testing and evaluating the design and operating effectiveness of internal control based on the assessed risk, and performing such other procedures as we considered necessary in the circumstances. We believe that our audit provides a reasonable basis for our opinion.
Definition and Limitations of Internal Control Over Financial Reporting
A company's internal control over financial reporting is a process designed to provide reasonable assurance regarding the reliability of financial reporting and the preparation of financial statements for external purposes in accordance with generally accepted accounting principles. A company's internal control over financial reporting includes those policies and procedures that (1) pertain to the maintenance of records that, in reasonable detail, accurately and fairly reflect the transactions and dispositions of the assets of the company; (2) provide reasonable assurance that transactions are recorded as necessary to permit preparation of financial statements in accordance with generally accepted accounting principles, and that receipts and expenditures of the company are being made only in accordance with authorizations of management and directors of the company; and (3) provide reasonable assurance regarding prevention or timely detection of unauthorized acquisition, use, or disposition of the company's assets that could have a material effect on the financial statements.
Because of its inherent limitations, internal control over financial reporting may not prevent or detect misstatements. Also, projections of any evaluation of effectiveness to future periods are subject to the risk that controls may become inadequate because of changes in conditions, or that the degree of compliance with the policies or procedures may deteriorate.
/s/ ERNST & YOUNG LLP
New York, New York
November 15, 2019
109
Disclosure Controls and Procedures
Management, including the Chief Executive Officer and Chief Financial Officer, performed an evaluation of the effectiveness of the Company's disclosure controls and procedures as of September 30,
2019
. Management, including the Chief Executive Officer and Chief Financial Officer, concluded that our disclosure controls and procedures were effective as of September 30,
2019
.
Changes in Internal Control over Financial Reporting
There have been no changes in the Company's internal control over financial reporting (as that term is defined in Rules 13a-15(f) and 15d-15(f) under the Exchange Act) during the most recently completed fiscal quarter that have materially affected, or are reasonably likely to materially affect, the Company's internal control over financial reporting.
Item 9B.
Other Information
None.
Item 10.
Directors, Executive Officers and Corporate Governance
The information required to be furnished pursuant to this item is incorporated by reference from our definitive proxy statement for our
2020
annual meeting of stockholders to be filed with the SEC pursuant to Regulation 14A within 120 days after September 30,
2019
(the "Proxy Statement").
Item 11.
Executive Compensation
The information required to be furnished pursuant to this item is incorporated by reference from the Proxy Statement.
|
Item 12.
|
Security Ownership of Certain Beneficial Owners and Management and Related Stockholder Matters
|
The information required to be furnished pursuant to this item, with the exception of the equity compensation plan information presented below, is incorporated by reference from the Proxy Statement.
Securities Authorized for Issuance Under Equity Compensation Plans
The following table summarizes, as of September 30,
2019
, information about compensation plans under which equity securities of the Company are authorized for issuance:
|
Number of securities to
be issued upon exercise
of outstanding options,
warrants and rights
|
Weighted average
exercise price of
outstanding options,
warrants and rights
|
Number of securities
remaining available
for future
issuance under equity
compensation plans
(excluding
securities reflected
in column (a))
|
|||||||||
|
Plan Category
|
(a)
|
(b)
|
(c)
|
||||||||
|
Equity compensation plans approved by security holders
|
3,472,282
|
|
(1)
|
$
|
27.97
|
|
(2)
|
4,535,223
|
|
(3)
|
|
|
(1)
|
Consists of 503,247 stock options, 1,983,716 restricted stock units, 817,071 performance restricted stock units, and 168,248 deferred stock units outstanding under the Company's stock incentive plans.
|
|
(2)
|
The weighted average exercise price does not take into account awards that have no exercise price, such as restricted stock units and deferred stock units.
|
110
|
(3)
|
The TD Ameritrade Holding Corporation Long-Term Incentive Plan (the "LTIP") and the 2006 Directors Incentive Plan (the "Directors Plan") authorize the issuance of shares of common stock as well as options. As of September 30,
2019
, there were 3,749,085 shares and 786,138 shares remaining available for issuance pursuant to the LTIP and the Directors Plan, respectively.
|
Item 13.
Certain Relationships and Related Transactions, and Director Independence
The information required to be furnished pursuant to this item is incorporated by reference from the Proxy Statement.
Item 14.
Principal Accounting Fees and Services
The information required to be furnished pursuant to this item is incorporated by reference from the Proxy Statement.
Item 15.
Exhibits, Financial Statement Schedules
|
(a)
|
Documents filed as part of this Report
|
|
1.
|
Financial Statements
|
See Item 8, "Financial Statements and Supplementary Data."
|
2.
|
Financial Statement Schedules
|
Consolidated Financial Statement Schedules have been omitted because the required information is not present, or not present in amounts sufficient to require submission of the schedules, or because the required information is provided in the Consolidated Financial Statements or Notes.
|
3.
|
Exhibits
|
See Item 15(b) below.
111
|
(b)
|
Exhibits
|
|
Exhibit No.
|
Description
|
|
112
|
Exhibit No.
|
Description
|
|
113
|
Exhibit No.
|
Description
|
|
114
|
Exhibit No.
|
Description
|
|
|
101.SCH
|
XBRL Taxonomy Extension Schema
|
|
|
101.CAL
|
XBRL Taxonomy Extension Calculation
|
|
|
101.LAB
|
XBRL Taxonomy Extension Label
|
|
|
101.PRE
|
XBRL Taxonomy Extension Presentation
|
|
|
101.DEF
|
XBRL Taxonomy Extension Definition
|
|
|
^
|
Schedules have been omitted pursuant to Item 601(b)(2) of Regulation S-K. The Company agrees to furnish supplementally to the Securities and Exchange Commission a copy of any omitted schedule upon request.
|
|
*
|
Management contracts and compensatory plans and arrangements required to be filed as exhibits under Item 15(b) of this report.
|
|
†
|
Confidential treatment has been granted with respect to the omitted portions of this Exhibit, which portions have been filed separately with the Securities and Exchange Commission.
|
115
SIGNATURES
Pursuant to the requirements of Section 13 or 15(d) of the Securities Exchange Act of 1934, the registrant has duly caused this report to be signed on its behalf by the undersigned, thereunto duly authorized, on this 15
th
day of November,
2019
.
|
TD AMERITRADE HOLDING CORPORATION
|
||
|
By:
|
/s/ TIM HOCKEY
|
|
|
Tim Hockey
|
||
|
President, Chief Executive Officer and Director
(Principal Executive Officer)
|
||
|
By:
|
/s/ STEPHEN J. BOYLE
|
|
|
Stephen J. Boyle
|
||
|
Executive Vice President, Chief Financial Officer
(Principal Financial and Accounting Officer)
|
||
Pursuant to the requirements of the Securities Exchange Act of 1934, this report has been signed below by the following persons on behalf of the registrant and in the capacities indicated on this 15
th
day of November,
2019
.
|
/s/ JOSEPH H. MOGLIA
|
/s/ IRENE R. MILLER
|
|
|
Joseph H. Moglia
Chairman of the Board
|
Irene R. Miller
Director
|
|
|
/s/ BHARAT B. MASRANI
|
/s/ MARK L. MITCHELL
|
|
|
Bharat B. Masrani
Vice Chairman of the Board
|
Mark L. Mitchell
Director
|
|
|
/s/ LORENZO A. BETTINO
|
/s/ WILBUR J. PREZZANO
|
|
|
Lorenzo A. Bettino
Director
|
Wilbur J. Prezzano
Director
|
|
|
/s/ V. ANN HAILEY
|
/s/ TODD M. RICKETTS
|
|
|
V. Ann Hailey
Director
|
Todd M. Ricketts
Director
|
|
|
/s/ BRIAN M. LEVITT
|
/s/ ALLAN R. TESSLER
|
|
|
Brian M. Levitt
Director
|
Allan R. Tessler
Director
|
|
|
/s/ KAREN E. MAIDMENT
|
||
|
Karen E. Maidment
Director
|
||
116
TABLE OF CONTENTS
Part IItem 1. BusinessItem 1A. Risk FactorsItem 1B. Unresolved Staff CommentsItem 2. PropertiesItem 3. Legal ProceedingsItem 4. Mine Safety DisclosuresPart IIItem 5. Market For Registrant's Common Equity, Related Stockholder Matters and Issuer Purchases Of Equity SecuritiesItem 6. Selected Financial DataItem 7. Management's Discussion and Analysis Of Financial Condition and Results Of OperationsItem 7A. Quantitative and Qualitative Disclosures About Market RiskItem 8. Financial Statements and Supplementary DataItem 9. Changes in and Disagreements with Accountants on Accounting and Financial DisclosureItem 9A. Controls and ProceduresItem 9B. Other InformationPart IIIItem 10. Directors, Executive Officers and Corporate GovernanceItem 11. Executive CompensationItem 12. Security Ownership Of Certain Beneficial Owners and Management and Related Stockholder MattersItem 13. Certain Relationships and Related Transactions, and Director IndependenceItem 14. Principal Accounting Fees and ServicesPart IVItem 15. Exhibits, Financial Statement Schedules