AUTONATION, INC.
10-Ks and 10-Qs
|
|
|
|
|
|
|
|
|
|
|
|
|
|
|
|
|
|
|
|
|
|
|
|
|
|
|
|
|
|
|
|
|
|
|
|
|
|
|
|
|
|
|
|
|
|
|
|
|
|
|
|
|
|
|
|
UNITED STATES
SECURITIES AND EXCHANGE COMMISSION
Washington, D.C. 20549
FORM 10-K
(Mark One)
|
þ
|
ANNUAL REPORT PURSUANT TO SECTION 13 OR 15(d) OF THE SECURITIES EXCHANGE ACT OF 1934
|
For the fiscal year ended
December 31, 2016
or
|
¨
|
TRANSITION REPORT PURSUANT TO SECTION 13 OR 15(d) OF THE SECURITIES EXCHANGE ACT OF 1934
|
For the transition period from ________ to ________
Commission File Number:
1-13107
AutoNation, Inc.
(Exact name of registrant as specified in its charter)
|
Delaware
|
|
73-1105145
|
|
(State or other jurisdiction of
incorporation or organization)
|
|
(I.R.S. Employer Identification No.)
|
|
200 SW 1st Ave
Fort Lauderdale, Florida
|
|
33301
|
|
(Address of principal executive offices)
|
|
(Zip Code)
|
(954) 769-6000
(Registrant’s telephone number, including area code)
Securities registered pursuant to Section 12(b) of the Act:
|
Title of each class
|
|
Name of each exchange on which registered
|
|
Common Stock, Par Value $0.01 Per Share
|
|
New York Stock Exchange
|
Securities registered pursuant to Section 12(g) of the Act:
None
Indicate by check mark if the registrant is a well-known seasoned issuer, as defined in Rule 405 of the Securities Act. Yes
þ
No
¨
Indicate by check mark if the registrant is not required to file reports pursuant to Section 13 or Section 15(d) of the Exchange Act. Yes
¨
No
þ
Indicate by check mark whether the registrant (1) has filed all reports required to be filed by Section 13 or 15(d) of the Securities Exchange Act of 1934 during the preceding 12 months (or for such shorter period that the registrant was required to file such reports), and (2) has been subject to such filing requirements for the past 90 days. Yes
þ
No
¨
Indicate by check mark whether the registrant has submitted electronically and posted on its corporate Web site, if any, every Interactive Data File required to be submitted and posted pursuant to Rule 405 of Regulation S-T (§232.405 of this chapter) during the preceding 12 months (or for such shorter period that the new registrant was required to submit and post such files). Yes
þ
No
¨
Indicate by check mark if disclosure of delinquent filers pursuant to Item 405 of Regulation S-K is not contained herein, and will not be contained, to the best of registrant’s knowledge, in definitive proxy or information statements incorporated by reference in Part III of this Form 10-K or any amendment to this Form 10-K.
þ
Indicate by check mark whether the registrant is a large accelerated filer, an accelerated filer, a non-accelerated filer, or a smaller reporting company. See the definitions of “large accelerated filer,” “accelerated filer” and “smaller reporting company” in Rule 12b-2 of the Exchange Act. (Check one):
|
Large accelerated filer
þ
|
Accelerated filer
o
|
|
Non-accelerated filer
o
(Do not check if a smaller reporting company)
|
Smaller reporting company
o
|
Indicate by check mark whether the registrant is a shell company (as defined in Rule 12b-2 of the Exchange Act). Yes
¨
No
þ
As of
June 30, 2016
, the aggregate market value of the common stock of the registrant held by non-affiliates was approximately
$3.0 billion
based on the closing price of the common stock on the New York Stock Exchange on such date (for the purpose of this calculation, the registrant assumed that each of its directors, executive officers, and greater than 10% stockholders was an affiliate of the registrant as of
June 30, 2016
).
As of
February 6, 2017
, the registrant had
100,913,153
shares of common stock outstanding.
DOCUMENTS INCORPORATED BY REFERENCE
Portions of the registrant’s Proxy Statement relating to its
2017
Annual Meeting of Stockholders to be filed with the SEC within 120 days after the end of the fiscal year ended December 31,
2016
are incorporated herein by reference in Part III.
AUTONATION, INC.
FORM 10-K
FOR THE FISCAL YEAR ENDED
DECEMBER 31, 2016
INDEX
|
|
|
Page
|
|
Item 1.
|
||
|
Item 1A.
|
||
|
Item 1B.
|
||
|
Item 2.
|
||
|
Item 3.
|
||
|
Item 4.
|
||
|
Item 5.
|
||
|
Item 6.
|
||
|
Item 7.
|
||
|
Item 7A.
|
||
|
Item 8.
|
||
|
Item 9.
|
||
|
Item 9A.
|
||
|
Item 9B.
|
||
|
Item 10.
|
||
|
Item 11.
|
||
|
Item 12.
|
||
|
Item 13.
|
||
|
Item 14.
|
||
|
Item 15.
|
||
ITEM 1.
BUSINESS
General
AutoNation, Inc., through its subsidiaries, is the largest automotive retailer in the United States. As of
December 31, 2016
, we owned and operated
371
new vehicle franchises from
260
stores located in the United States, predominantly in major metropolitan markets in the Sunbelt region. Our stores, which we believe include some of the most recognizable and well-known in our key markets, sell
35
different new vehicle brands. The core brands of new vehicles that we sell, representing approximately
94%
of the new vehicles that we sold in
2016
, are manufactured by
Toyota (including Lexus), Ford, Honda, General Motors, FCA US, Mercedes-Benz, Nissan, BMW, and Volkswagen (including Audi and Porsche)
.
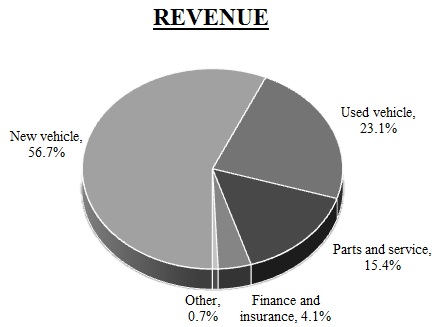
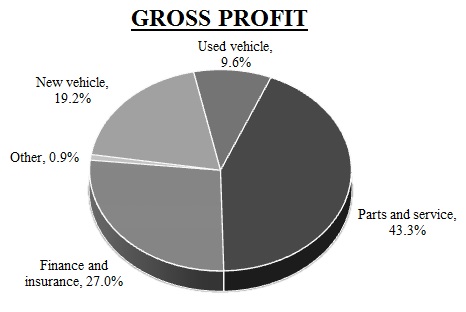
We offer a diversified range of automotive products and services, including new vehicles, used vehicles, “parts and service,” which includes automotive repair and maintenance services as well as wholesale parts and collision businesses, and automotive “finance and insurance” products, which include vehicle service and other protection products, as well as the arranging of financing for vehicle purchases through third-party finance sources.
The following charts present the contribution to total revenue and gross profit by each of new vehicle, used vehicle, parts and service, and finance and insurance sales in
2016
.
|
|
|
We were incorporated in Delaware in 1991. For convenience, the terms “AutoNation,” “Company,” and “we” are used to refer collectively to AutoNation, Inc. and its subsidiaries, unless otherwise required by the context. Our store operations are conducted by our subsidiaries. The term “digital channels” refers to our websites and mobile applications, including mobile phone and tablet applications.
Reportable Segments
As of
December 31, 2016
, we had
three
reportable segments: Domestic, Import, and Premium Luxury. These segments are comprised of retail automotive franchises that sell the following new vehicle brands:
|
Domestic
|
Import
|
Premium Luxury
|
|||||
|
Buick
|
Ford
|
Acura
|
Mitsubishi
|
Alfa Romeo
|
Lexus
|
||
|
Cadillac
|
GMC
|
Fiat
|
Nissan
|
Audi
|
Maserati
|
||
|
Chevrolet
|
Jeep
|
Honda
|
Subaru
|
Bentley
|
Mercedes-Benz
|
||
|
Chrysler
|
Lincoln
|
Hyundai
|
Toyota
|
BMW
|
MINI
|
||
|
Dodge
|
Ram
|
Genesis
|
Volkswagen
|
Jaguar
|
Porsche
|
||
|
Infiniti
|
Volvo
|
Land Rover
|
smart
|
||||
|
Mazda
|
|||||||
1
The franchises in each segment also sell used vehicles, parts and automotive repair and maintenance services, and automotive finance and insurance products. For the year ended
December 31, 2016
, Domestic revenue represented
36%
of total revenue, Import revenue represented
32%
of total revenue, and Premium Luxury revenue represented
31%
of total revenue. For additional financial information regarding our
three
reportable segments, refer to
Note 19
of the Notes to Consolidated Financial Statements set forth in Part II, Item 8 of this Form 10-K.
Except to the extent that differences among reportable segments are material to an understanding of our business taken as a whole, the description of our business in this report is presented on a consolidated basis.
Business Strategy
We seek to create long-term value for our stockholders by being the best-run, most profitable automotive retailer in the United States. We believe that the significant scale of our operations and the quality of our managerial talent allow us to achieve efficiencies in our key markets. To achieve and sustain operational excellence, we are pursuing the following strategies:
|
•
|
Create an industry-leading automotive retail customer experience in our stores and through our digital channels
.
|
We seek to deliver a consistently superior customer experience by offering a large selection of inventory, customer-friendly, transparent sales and service processes, and competitive pricing. We believe that this will benefit us by encouraging our customers to bring their vehicles to our stores for all of their vehicle service, maintenance, and collision repair needs and also by driving repeat and referral vehicle sales business.
We continue to make significant investments to build a seamless, end-to-end customer experience in our stores and through our digital channels, and to improve our ability to generate business through those channels. As part of our strategic initiatives, we are implementing “AutoNation Express,” which enables our customers to complete certain automotive retail- and service-related transactions through our digital channels and offers a more fully integrated in-store and digital customer experience while also increasing traffic to our digital channels. We have developed features such as selecting and reserving a vehicle with a guaranteed price, scheduling a test drive, calculating payments, receiving a firm purchase offer for a vehicle that a customer wants to sell, applying for financing options, arranging service appointments, and receiving updates on maintenance and repair services, all of which have been deployed to all of our markets as of December 31, 2016. Future capabilities are expected to include in-store tools to further our customers’ online experience and the ability for a customer to pay for maintenance and repair services online.
|
•
|
Continue to invest in the AutoNation retail brand to enhance our strong customer satisfaction and expand our market share.
|
In 2013, we launched the AutoNation retail brand from coast to coast, which
enables us to leverage our advertising efforts and digital channels to market our stores, new and used vehicle inventory, and parts and service business.
Since the launch of our retail brand, we have extended our branding effort to our digital strategy and to certain finance and insurance products, such as the AutoNation Vehicle Protection Plan. We are currently implementing the next phase of our comprehensive, customer-focused brand extension strategy, which includes:
|
◦
|
AutoNation USA stand-alone used vehicle sales and service centers, with 25 potential sites identified, five of which are expected to open in 2017,
|
|
◦
|
AutoNation branded parts and accessories, the launch of which began in the third quarter of 2016, and which will be expanded over the next several years,
|
|
◦
|
the expansion of AutoNation branded collision centers, which includes the unification of our collision centers under the AutoNation retail brand and plans to open or acquire at least 18 new collision centers over the next several years, and
|
|
◦
|
the expansion of AutoNation branded automotive auctions, which, as announced in October 2016, includes plans to open four additional automotive auctions by the end of 2018.
|
We expect that these initiatives will expand and strengthen the AutoNation retail brand, improve the customer experience, provide new growth opportunities, and enable us to expand our footprint in our core and other markets. In connection with our brand extension strategy, we also launched
a one price used vehicle sales model
2
during the second half of 2016. The one price model is planned to be fully implemented in all of o
ur stores by the end of the second quarter of 2017.
|
•
|
Leverage our significant scale and cost structure to improve our operating efficiency
.
|
As the largest automotive retailer in the United States, we are uniquely positioned to leverage our significant scale so that we are able to achieve competitive operating margins by centralizing and streamlining various business processes. We strive to manage our new and used vehicle inventories so that our stores’ supply and mix of vehicles are in line with seasonal sales trends and also minimize our carrying costs. Additionally, we are able to improve financial controls and lower servicing costs by maintaining many key store-level accounting and administrative activities in our Shared Services Center located in Irving, Texas. Finally, we leverage our scale to reduce costs related to purchasing certain equipment, supplies, and services through national vendor relationships.
|
•
|
Continue to build vehicle brand density in our core markets where we operate.
|
We have retail operations in 16 states with a focus on major metropolitan areas, and we seek to offer all of our core vehicle brands within all of our key markets. We will continue to actively pursue acquisitions and new store opportunities that meet our return on investment threshold, with a focus on enhancing brand representation within our existing geographic footprint as well as additional markets that can be supported by our existing management infrastructure.
Our business benefits from a well-diversified portfolio of automotive retail franchises. In
2016
, approximately
37%
of our segment income was generated by Premium Luxury franchises, approximately
32%
by Domestic franchises, and approximately
31%
by Import franchises. We believe that our business also benefits from diverse revenue streams generated by our new and used vehicle sales, parts and service business, and finance and insurance sales. Our higher-margin parts and service business has historically been less sensitive to macroeconomic conditions as compared to new and used vehicle sales.
Our capital allocation strategy is focused on maximizing stockholder returns. We invest capital in our business to maintain and upgrade our existing facilities and to build new facilities for existing franchises, as well as for other strategic and technology initiatives, including the next phase of our brand extension strategy discussed above under “Business Strategy.” We also deploy capital opportunistically to repurchase our common stock and/or debt or to complete dealership acquisitions and/or build facilities for newly awarded franchises. Our capital allocation decisions are based on factors such as the expected rate of return on our investment, the market price of our common stock versus our view of its intrinsic value, the market price of our debt, the potential impact on our capital structure, our ability to complete dealership acquisitions that meet our market and vehicle brand criteria and return on investment threshold, and limitations set forth in our debt agreements. For additional information regarding our capital allocation, refer to “Liquidity and Capital Resources – Capital Allocation” in Part II, Item 7 of this Form 10‑K.
Operations
Each of our stores acquires new vehicles for retail sale either directly from the applicable automotive manufacturer or distributor or through dealer trades with other stores of the same brand franchise. We generally acquire used vehicles from customers, primarily through trade-ins, as well as through auctions, lease terminations, and other sources, and we generally recondition used vehicles acquired for retail sale in our parts and service departments. Used vehicles that we do not sell at our stores generally are sold at wholesale prices through auctions. See also “Inventory Management” in Part II, Item 7 of this Form 10-K.
Our stores provide a wide range of vehicle maintenance, repair, and collision repair services, including manufacturer recall repairs and other warranty work that can be performed only at franchised dealerships and customer-pay service work. Our parts and service departments also recondition used vehicles acquired by our used vehicle departments and perform minor preparatory work on new vehicles acquired by our new vehicle departments. In addition to our retail business, we also have a wholesale parts operation, which sells automotive parts to both collision repair shops and independent vehicle repair providers. In the third quarter of 2016, we began the launch of AutoNation Precision Parts, a new product line that will be integrated into our parts and service operations, with the expectation of improved customer retention for retail service and our wholesale parts and collision repair businesses through the continued extension of our brand.
3
We offer a wide variety of automotive finance and insurance products to our customers. We arrange for our customers to finance vehicles through installment loans or leases with third-party lenders, including the vehicle manufacturers’ and distributors’ captive finance subsidiaries, in exchange for a commission payable to us. We do not directly finance our customers’ vehicle leases or purchases, and our exposure to loss in connection with these financing arrangements generally is limited to the commissions that we receive.
We also offer our customers various vehicle protection products, including an AutoNation-branded extended service contract (the AutoNation Vehicle Protection Plan) in our Domestic and Import stores and other extended service contracts, maintenance programs, guaranteed auto protection (known as “GAP,” this protection covers the shortfall between a customer’s loan balance and insurance payoff in the event of a casualty), “tire and wheel” protection, and theft protection products. These products are underwritten and administered by independent third parties, including the vehicle manufacturers’ and distributors’ captive finance subsidiaries. We primarily sell the products on a straight commission basis; however, we also participate in future underwriting profit for certain products pursuant to retrospective commission arrangements with the issuers of those products. See also “Critical Accounting Policies and Estimates – Chargeback Liability” in Part II, Item 7 of this Form 10-K.
As of
December 31, 2016
, we operated stores in the following states:
|
State
|
Number of
Stores
|
Number of
Franchises
|
% of Total
Revenue
(1)
|
||||
|
Florida
|
52
|
|
64
|
|
26
|
||
|
Texas
|
47
|
|
76
|
|
21
|
||
|
California
|
40
|
|
55
|
|
17
|
||
|
Colorado
|
17
|
|
27
|
|
7
|
||
|
Arizona
|
15
|
|
18
|
|
6
|
||
|
Georgia
|
23
|
|
44
|
|
5
|
||
|
Washington
|
16
|
|
23
|
|
4
|
||
|
Nevada
|
11
|
|
13
|
|
3
|
||
|
Tennessee
|
8
|
|
12
|
|
3
|
||
|
Illinois
|
7
|
|
8
|
|
3
|
||
|
Maryland
|
8
|
|
10
|
|
1
|
||
|
Ohio
|
4
|
|
4
|
|
1
|
||
|
Alabama
|
5
|
|
9
|
|
1
|
||
|
Virginia
|
2
|
|
2
|
|
1
|
||
|
Minnesota
|
1
|
|
1
|
|
1
|
||
|
New York
|
4
|
|
5
|
|
—
|
||
|
Total
|
260
|
|
371
|
|
100
|
||
|
(1)
|
Revenue by state includes non-store activities, such as collision centers and an auction operation.
|
4
The following table sets forth information regarding new vehicle revenues and retail new vehicle unit sales for the year ended, and the number of franchises owned as of,
December 31, 2016
:
|
New Vehicle
Revenues
(in millions)
|
Retail
New Vehicle
Unit Sales
|
% of Total
Retail New
Vehicle
Units Sold
|
Franchises Owned
|
|||||||||
|
Domestic:
|
||||||||||||
|
Ford, Lincoln
|
$
|
1,836.2
|
|
49,651
|
|
14.7
|
40
|
|
||||
|
Chevrolet, Buick, Cadillac, GMC
|
1,393.3
|
|
37,483
|
|
11.1
|
44
|
|
|||||
|
Chrysler, Dodge, Jeep, Ram
|
1,144.2
|
|
31,733
|
|
9.4
|
92
|
|
|||||
|
Domestic Total
|
4,373.7
|
|
118,867
|
|
35.2
|
176
|
|
|||||
|
Import:
|
||||||||||||
|
Toyota
|
1,658.7
|
|
59,502
|
|
17.6
|
19
|
|
|||||
|
Honda
|
1,065.7
|
|
41,932
|
|
12.4
|
24
|
|
|||||
|
Nissan
|
673.6
|
|
25,683
|
|
7.6
|
16
|
|
|||||
|
Other Import
|
691.3
|
|
22,888
|
|
6.8
|
43
|
|
|||||
|
Import Total
|
4,089.3
|
|
150,005
|
|
44.4
|
102
|
|
|||||
|
Premium Luxury:
|
||||||||||||
|
Mercedes-Benz
|
1,639.2
|
|
28,938
|
|
8.6
|
45
|
|
|||||
|
BMW
|
838.4
|
|
15,295
|
|
4.5
|
13
|
|
|||||
|
Lexus
|
409.5
|
|
9,255
|
|
2.7
|
3
|
|
|||||
|
Audi
|
370.1
|
|
7,489
|
|
2.2
|
9
|
|
|||||
|
Other Premium Luxury
|
535.6
|
|
7,773
|
|
2.4
|
23
|
|
|||||
|
Premium Luxury Total
|
3,792.8
|
|
68,750
|
|
20.4
|
93
|
|
|||||
|
$
|
12,255.8
|
|
337,622
|
|
100.0
|
371
|
|
|||||
Agreements with Vehicle Manufacturers
Framework Agreements
We have entered into framework and related agreements with most major vehicle manufacturers and distributors. These agreements, which are in addition to the franchise agreements described below, contain provisions relating to our management, operation, advertising and marketing, and acquisition and ownership structure of automotive stores franchised by such manufacturers. These agreements contain certain requirements pertaining to our operating performance (with respect to matters such as sales volume, sales effectiveness, and customer satisfaction), which, if we do not satisfy, adversely impact our ability to make further acquisitions of such manufacturers’ stores or could result in us being compelled to take certain actions, such as divesting a significantly underperforming store, subject to applicable state franchise laws. Additionally, these agreements set limits (nationally, regionally, and in local markets) on the number of stores that we may acquire of the particular manufacturer and contain certain restrictions on our ability to name and brand our stores. Some of these framework agreements give the manufacturer or distributor the right to acquire at fair market value, or the right to compel us to sell, the automotive stores franchised by that manufacturer or distributor under specified circumstances in the event of a change in control of our Company (generally including certain material changes in the composition of our Board of Directors during a specified time period, the acquisition of 20% or more of the voting stock of our Company by another vehicle manufacturer or distributor, or the acquisition of 50% or more of our voting stock by a person, entity, or group not affiliated with a vehicle manufacturer or distributor) or other extraordinary corporate transactions such as a merger or sale of all or substantially all of our assets. In addition, we have granted certain manufacturers the right to acquire, at fair market value, our automotive dealerships franchised by such manufacturers in specified circumstances in the event of our default under certain of our debt agreements.
Franchise Agreements
We operate each of our new vehicle stores under a franchise agreement with a vehicle manufacturer or distributor. The franchise agreements grant the franchised automotive store a non-exclusive right to sell the manufacturer’s or distributor’s
5
brand of vehicles and offer related parts and service within a specified market area. These franchise agreements grant our stores the right to use the relevant manufacturer’s or distributor’s trademarks in connection with their operations, and they also impose numerous operational requirements and restrictions relating to inventory levels, working capital levels, the sales process, marketing and branding, showroom and service facilities, signage, personnel, changes in management, and monthly financial reporting, among other things. The contractual terms of our stores’ franchise agreements provide for various durations, ranging from one year to no expiration date, and in certain cases manufacturers have undertaken to renew such franchises upon expiration so long as the store is in compliance with the terms of the agreement. We generally expect our franchise agreements to survive for the foreseeable future and, when the agreements do not have indefinite terms, anticipate routine renewals of the agreements without substantial cost or modification. Our stores’ franchise agreements provide for termination of the agreement by the manufacturer or non-renewal for a variety of causes (including performance deficiencies in such areas as sales volume, sales effectiveness, and customer satisfaction). However, in general, the states in which we operate have automotive dealership franchise laws that provide that, notwithstanding the terms of any franchise agreement, it is unlawful for a manufacturer to terminate or not renew a franchise unless “good cause” exists. It generally is difficult, outside of bankruptcy, for a manufacturer to terminate, or not renew, a franchise under these laws, which were designed to protect dealers. In addition, in our experience and historically in the automotive retail industry, dealership franchise agreements are rarely involuntarily terminated or not renewed by the manufacturer outside of bankruptcy. From time to time, certain manufacturers assert sales and customer satisfaction performance deficiencies under the terms of our framework and franchise agreements. We generally work with these manufacturers to address the asserted performance issues. For additional information, please refer to the risk factor captioned
“
We are subject to restrictions imposed by, and significant influence from, vehicle manufacturers that may adversely impact our business, financial condition, results of operations, cash flows, and prospects, including our ability to acquire additional stores
”
in Part I, Item 1A of this Form 10-K.
Regulations
We operate in a highly regulated industry. A number of state and federal laws and regulations affect our business. In every state in which we operate, we must obtain various licenses in order to operate our businesses, including dealer, sales and finance, and insurance licenses issued by state regulatory authorities. Numerous laws and regulations govern our conduct of business, including those relating to our sales, operations, finance and insurance, advertising, and employment practices. These laws and regulations include state franchise laws and regulations, consumer protection laws, privacy laws, escheatment laws, anti-money laundering laws, and other extensive laws and regulations applicable to new and used motor vehicle dealers, as well as a variety of other laws and regulations. These laws also include federal and state wage and hour, anti-discrimination, and other employment practices laws. See the risk factor “
Our operations are subject to extensive governmental laws and regulations. If we are found to be in purported violation of or subject to liabilities under any of these laws or regulations, or if new laws or regulations are enacted that adversely affect our operations, our business, operating results, and prospects could suffer
” in Part I, Item 1A of this Form 10-K.
Automotive and Other Laws and Regulations
Our operations are subject to the National Traffic and Motor Vehicle Safety Act, Federal Motor Vehicle Safety Standards promulgated by the United States Department of Transportation, and the rules and regulations of various state motor vehicle regulatory agencies. The imported automobiles we purchase are subject to United States customs duties and, in the ordinary course of our business we may, from time to time, be subject to claims for duties, penalties, liquidated damages, or other charges.
Our financing activities with customers are subject to federal truth-in-lending, consumer leasing, and equal credit opportunity laws and regulations as well as state and local motor vehicle finance laws, leasing laws, installment finance laws, usury laws, and other installment sales and leasing laws and regulations, some of which regulate finance and other fees and charges that may be imposed or received in connection with motor vehicle retail installment sales and leasing. Claims arising out of actual or alleged violations of law may be asserted against us or our stores by individuals, a class of individuals, or governmental entities and may expose us to significant damages or other penalties, including revocation or suspension of our licenses to conduct store operations and fines.
The Dodd-Frank Wall Street Reform and Consumer Protection Act (the “Dodd-Frank Act”) established the Consumer Financial Protection Bureau (the “CFPB”), an independent federal agency funded by the United States Federal Reserve with broad regulatory powers and limited oversight from the United States Congress. Although automotive dealers are
6
generally excluded, the Dodd-Frank Act could lead to additional, indirect regulation of automotive dealers, in particular, their sale and marketing of finance and insurance products, through its regulation of automotive finance companies and other financial institutions. In addition, the CFPB issued a rule, pursuant to its authority under the Dodd-Frank Act, expanding its supervisory authority with respect to certain non-bank lenders, including automotive finance companies, participating in automotive financing. The Dodd-Frank Act also provided the Federal Trade Commission (the “FTC”) with new and expanded authority regarding automotive dealers, and the FTC has implemented an enforcement initiative relating to the advertising practices of automotive dealers. See the risk factor “
Our operations are subject to extensive governmental laws and regulations. If we are found to be in purported violation of or subject to liabilities under any of these laws or regulations, or if new laws or regulations are enacted that adversely affect our operations, our business, operating results, and prospects could suffer
” in Part I, Item 1A of this Form 10-K.
Environmental, Health, and Safety Laws and Regulations
Our operations involve the use, handling, storage, and contracting for recycling and/or disposal of materials such as motor oil and filters, transmission fluids, antifreeze, refrigerants, paints, thinners, batteries, cleaning products, lubricants, degreasing agents, tires, and fuel. Consequently, our business is subject to a complex variety of federal, state, and local requirements that regulate the environment and public health and safety.
Most of our stores utilize aboveground storage tanks, and to a lesser extent underground storage tanks, primarily for petroleum-based products. Storage tanks are subject to periodic testing, containment, upgrading, and removal under the Resource Conservation and Recovery Act and its state law counterparts. Clean-up or other remedial action may be necessary in the event of leaks or other discharges from storage tanks or other sources. In addition, water quality protection programs under the federal Water Pollution Control Act (commonly known as the Clean Water Act), the Safe Drinking Water Act, and comparable state and local programs govern certain discharges from some of our operations. Similarly, certain air emissions from operations, such as auto body painting, may be subject to the federal Clean Air Act and related state and local laws. Certain health and safety standards promulgated by the Occupational Safety and Health Administration of the United States Department of Labor and related state agencies also apply.
Some of our stores are parties to proceedings under the Comprehensive Environmental Response, Compensation, and Liability Act, or CERCLA, typically in connection with materials that were sent to former recycling, treatment, and/or disposal facilities owned and operated by independent businesses. The remediation or clean-up of facilities where the release of a regulated hazardous substance occurred is required under CERCLA and other laws.
We have a proactive strategy related to environmental, health, and safety laws and regulations, which includes contracting with third-party vendors to inspect our facilities routinely in an effort to ensure compliance. We incur significant costs to comply with applicable environmental, health, and safety laws and regulations in the ordinary course of our business. We do not anticipate, however, that the costs of such compliance will have a material adverse effect on our business, results of operations, cash flows, or financial condition, although such outcome is possible given the nature of our operations and the extensive environmental, health, and safety regulatory framework. We do not have any material known environmental commitments or contingencies.
Competition
We operate in a highly competitive industry. We believe that the principal competitive factors in the automotive retail business are location, service, price, selection, and online and mobile offerings. Each of our markets includes a large number of well-capitalized competitors that have extensive automotive retail managerial experience and strong retail locations and facilities. According to industry sources, as of
December 31, 2016
, there were approximately
16,800
franchised automotive dealerships, which sell both new and used vehicles, in the United States. In addition, we estimate that there were approximately twice as many independent used vehicle dealers in the United States. We face competition from (i) several public companies that operate numerous automotive retail stores on a regional or national basis, including franchised dealers that sell new and used vehicles as well as non-franchised dealers that sell only used vehicles, (ii) private companies that operate automotive retail stores in our markets, and (iii) online and mobile sales platforms. We compete with dealers that sell the same vehicle brands that we sell, as well as dealers and certain manufacturers that sell other vehicle brands that we do not represent in a particular market. Our new vehicle store competitors have franchise agreements with the various vehicle manufacturers and, as such, generally have access to new vehicles on the same terms
7
as we have. We also compete with other dealers for qualified employees, particularly for general managers and sales and service personnel.
In general, the vehicle manufacturers have designated marketing and sales areas within which only one franchised dealer of a given vehicle brand may operate. Under most of our framework agreements with the vehicle manufacturers, our ability to acquire multiple dealers of a given vehicle brand within a particular market is limited. We are also restricted by various state franchise laws from relocating our stores or establishing new stores of a particular vehicle brand within any area that is served by another dealer of the same vehicle brand, and we generally need the manufacturer to approve the relocation or grant a new franchise in order to relocate or establish a store. However, to the extent that a market has multiple dealers of a particular vehicle brand, as most of our key markets do with respect to most vehicle brands we sell, we face significant intra-brand competition.
We also compete with independent automobile service shops and service center chains. We believe that the principal competitive factors in the parts and service business are price, location, expertise with the particular vehicle lines, and customer service. We also compete with a broad range of financial institutions in our finance and insurance business. We believe that the principal competitive factors in the finance and insurance business are product selection, convenience, price, contract terms, and the ability to finance vehicle protection and aftermarket products.
Insurance and Bonding
Our business exposes us to the risk of liabilities arising out of our operations. For example, liabilities may arise out of claims of employees, customers, or other third parties for personal injury or property damage occurring in the course of our operations. We could also be subject to fines and civil and criminal penalties in connection with alleged violations of federal and state laws or regulatory requirements.
The automotive retail business is also subject to substantial risk of property loss due to the significant concentration of property values at store locations. In our case in particular, our operations are concentrated in states and regions in which natural disasters and severe weather events (such as hail storms, hurricanes, earthquakes, fires, tornadoes, snow storms, and landslides) may subject us to substantial risk of property loss and operational disruption. Under self-insurance programs, we retain various levels of aggregate loss limits, per claim deductibles, and claims-handling expenses as part of our various insurance programs, including property and casualty, workers’ compensation, and employee medical benefits. Costs in excess of this retained risk per claim may be insured under various contracts with third-party insurance carriers. We estimate the ultimate costs of these retained insurance risks based on actuarial evaluation and historical claims experience, adjusted for current trends and changes in claims-handling procedures. The level of risk we retain may change in the future as insurance market conditions or other factors affecting the economics of our insurance purchasing change. Although we have, subject to certain limitations and exclusions, substantial insurance, we cannot assure you that we will not be exposed to uninsured or underinsured losses that could have a material adverse effect on our business, financial condition, results of operations, or cash flows.
Provisions for retained losses and deductibles are made by charges to expense based upon periodic evaluations of the estimated ultimate liabilities on reported and unreported claims. The insurance companies that underwrite our insurance require that we secure certain of our obligations for deductible reimbursements with collateral. Our collateral requirements are set by the insurance companies and, to date, have been satisfied by posting surety bonds, letters of credit, and/or cash deposits. Our collateral requirements may change from time to time based on, among other things, our claims experience.
Employees
As of
December 31, 2016
, we employed approximately
26,000
full-time and part-time employees, approximately
260
of whom were covered by collective bargaining agreements. We believe that we have good relations with our employees.
Seasonality
In a stable environment, our operations generally experience higher volumes of vehicle unit sales in the second and third quarters of each year due in part to consumer buying trends and the introduction of new vehicle models. Also, demand for vehicles and light trucks is generally lower during the winter months than in other seasons, particularly in regions of the United States where stores may be subject to adverse winter conditions. However, we typically experience higher sales of Premium Luxury vehicles, which have higher average selling prices and gross profit per vehicle retailed, in
8
the fourth quarter. Revenue and operating results may be impacted significantly from quarter to quarter by changing economic conditions, vehicle manufacturer incentive programs, and actual or threatened severe weather events.
Trademarks
We own a number of registered service marks and trademarks, including, among other marks, AutoNation® and AutoNation USA®. Pursuant to agreements with vehicle manufacturers, we have the right to use and display manufacturers’ trademarks, logos, and designs at our stores and in our advertising and promotional materials, subject to certain restrictions. We also have licenses pursuant to various agreements with third parties authorizing the use and display of the marks and/or logos of such third parties, subject to certain restrictions. The current registrations of our service marks and trademarks are effective for varying periods of time, which we may renew periodically, provided that we comply with all applicable laws.
Executive Officers of AutoNation
The following sets forth certain information regarding our executive officers as of
February 6, 2017
. Beneficial ownership includes shares that may be acquired through the exercise of outstanding stock options within 60 days of
February 6, 2017
, as well as shares of restricted stock.
|
Name
|
Age
|
Position
|
Years with
AutoNation
|
Years in
Automotive
Industry
|
Number of
Shares of
Common Stock
Beneficially Owned
|
||||||
|
Mike Jackson
|
68
|
Chairman of the Board and Chief Executive Officer
|
17
|
46
|
1,640,687
|
|
|||||
|
William R. Berman
|
50
|
President and Chief Operating Officer
|
17
|
29
|
90,040
|
|
|||||
|
Cheryl Miller
|
44
|
Executive Vice President and Chief Financial Officer
|
9
|
18
|
101,476
|
|
|||||
|
Jonathan P. Ferrando
|
51
|
Executive Vice President - General Counsel, Corporate Development and Human Resources
|
20
|
20
|
606,101
|
|
|||||
|
Marc Cannon
|
55
|
Executive Vice President - Chief Marketing Officer, Communications and Public Policy
|
19
|
30
|
59,107
|
|
|||||
|
Donna Parlapiano
|
52
|
Executive Vice President, Franchise Operations and Corporate Real Estate
|
18
|
30
|
55,376
|
|
|||||
|
Thomas M. Conophy
|
56
|
Executive Vice President and Chief Technology Officer
|
1
|
1
|
5,000
|
|
|||||
Mike Jackson
has served as our Chief Executive Officer and Director since September 1999 and as our Chairman of the Board since January 2003. He also served as our President from February 2015 through January 2017. From October 1998 until September 1999, Mr. Jackson served as Chief Executive Officer of Mercedes-Benz USA, LLC, a North American operating unit of DaimlerChrysler AG, a multinational automotive manufacturing company. From April 1997 until September 1999, Mr. Jackson also served as President of Mercedes-Benz USA. From July 1990 until March 1997, Mr. Jackson served in various capacities at Mercedes-Benz USA, including as Executive Vice President immediately prior to his appointment as President of Mercedes-Benz USA. Mr. Jackson was also the managing partner from March 1979 to July 1990 of Euro Motorcars of Bethesda, Maryland, a regional group that owned and operated eleven automotive dealership franchises, including Mercedes-Benz and other brands of automobiles. In January 2014, Mr. Jackson was appointed to the Board of Directors of the Federal Reserve Bank of Atlanta, after previously serving on the Board of Directors of the Federal Reserve Bank of Atlanta’s Miami Branch. Since 2015, he has served as the Deputy Chair of the Board of Directors of the Federal Reserve Bank of Atlanta.
9
William R. Berman
was appointed our President and Chief Operating Officer on January 31, 2017. Prior to that appointment, Mr. Berman served as Executive Vice President and Chief Operating Officer of the Company, a position he assumed in February 2015. Since 1999, Mr. Berman has served in various leadership roles within the Company, including as Senior Vice President, Sales from October 2014 until February 2015, and as President of the Company’s Western Region, with responsibility for stores located in California, Washington, Nevada, and Arizona, from October 2008 through September 2014.
Cheryl Miller
has served as our Executive Vice President and Chief Financial Officer since March 2014. Prior thereto, Ms. Miller was appointed Interim Chief Financial Officer in January 2014, and she served as Treasurer, Vice President Investor Relations, a role she assumed in April 2010. From May 2009 to March 2010, Ms. Miller served as the Company’s Vice President, Treasurer. From November 2006 until April 2009, she served as Vice President, Treasurer of JM Family Enterprises, Inc., a diversified automotive company. Ms. Miller serves as a director of Tyson Foods, Inc.
Jonathan P. Ferrando
has served as our Executive Vice President - General Counsel, Corporate Development and Human Resources since March 2011. Prior thereto, he served as our Executive Vice President, General Counsel and Secretary from March 2005 until March 2011, and as the Company’s Senior Vice President, General Counsel and Secretary from January 2000 until March 2005. In addition to his role as General Counsel, Mr. Ferrando assumed responsibility for our human resources and labor relations functions in September 2004, and he assumed responsibility for our corporate development function in March 2011. Mr. Ferrando joined our Company in July 1996 and served in various capacities within our Company, including as Senior Vice President and General Counsel of our Automotive Retail Group from March 1998 until January 2000. Prior to joining our company, Mr. Ferrando was a corporate attorney with Skadden, Arps, Slate, Meagher & Flom from 1991 until 1996.
Marc Cannon
was appointed Executive Vice President - Chief Marketing Officer, Communications and Public Policy on January 31, 2017. Prior to that appointment, Mr. Cannon served as our Chief Marketing Officer, Senior Vice President of Communications and Public Policy from February 2016 through January 2017. Mr. Cannon is responsible for overseeing the Company’s marketing, communications, community affairs, and public policy functions. From February 2007 until February 2016, Mr. Cannon served as our Senior Vice President, Corporate Communications.
Donna Parlapiano
was appointed Executive Vice President, Franchise Operations and Corporate Real Estate, on January 31, 2017. Prior to that appointment, Ms. Parlapiano served as our Senior Vice President, Franchise Operations and Corporate Real Estate, from February 2015 through January 2017. Ms. Parlapiano is responsible for our franchise operations, real estate development, construction projects, and facilities maintenance. From November 2006 until January 2015, she served as our Senior Vice President, Franchise Operations, and in February 2015, she assumed responsibility for our corporate real estate function. Prior to joining AutoNation in 1998, Ms. Parlapiano held finance, marketing, and strategic management positions with Ford Motor Company.
Thomas M. Conophy
has served as our Executive Vice President and Chief Technology Officer since October 2016. From September 2013 to August 2016, Mr. Conophy served as Executive Vice President and Chief Information Officer of Staples, Inc. From February 2006 to March 2012, he served as Executive Vice President and Chief Information Officer of Intercontinental Hotels Group.
Available Information
Our website is located at
www.autonation.com
, and our Investor Relations website is located at
investors.autonation.com
. The information on or accessible through our websites and social media channels is not incorporated by reference in this Annual Report on Form 10-K. Our Annual Report on Form 10-K, Quarterly Reports on Form 10-Q, Current Reports on Form 8-K, and amendments to reports filed or furnished pursuant to Sections 13(a) and 15(d) of the Securities Exchange Act of 1934, as amended, are available, free of charge, on our Investor Relations website as soon as reasonably practicable after we electronically file such material with, or furnish it to, the Securities and Exchange Commission (the “SEC”).
ITEM 1A.
RISK FACTORS
Our business, financial condition, results of operations, cash flows, and prospects, and the prevailing market price and performance of our common stock may be adversely affected by a number of factors, including the matters discussed below. Certain statements and information set forth in this Annual Report on Form 10-K, including without limitation
10
statements regarding our strategic initiatives and expectations for the future performance of our business and the automotive retail industry, as well as other written or oral statements made from time to time by us or by our authorized executive officers on our behalf, constitute “forward-looking statements” within the meaning of Section 27A of the Securities Act of 1933, as amended, and Section 21E of the Securities Exchange Act of 1934, as amended. All statements other than statements of historical fact, including statements that describe our objectives, plans, or goals, are, or may be deemed to be, forward-looking statements. Words such as “anticipate,” “expect,” “intend,” “goal,” “plan,” “believe,” “continue,” “may,” “will,” “could,” and variations of such words and similar expressions are intended to identify such forward-looking statements. Our forward-looking statements reflect our current expectations concerning future results and events, and they involve known and unknown risks, uncertainties, and other factors that are difficult to predict and may cause our actual results, performance, or achievements to be materially different from any future results, performance, or achievements expressed or implied by these statements. These forward-looking statements speak only as of the date of this report or when made, and we undertake no obligation to revise or update these statements to reflect subsequent events or circumstances. The risks, uncertainties, and other factors that our stockholders and prospective investors should consider include the following:
The automotive retail industry is sensitive to changing economic conditions and various other factors. Our business and results of operations are substantially dependent on new vehicle sales levels in the United States and in our particular geographic markets and the level of gross profit margins that we can achieve on our sales of new vehicles, all of which are very difficult to predict
.
We believe that many factors affect sales of new vehicles and automotive retailers’ gross profit margins in the United States and in our particular geographic markets, including the economy, fuel prices, credit availability, interest rates, consumer confidence, consumer shopping preferences and the success of third-party online and mobile sales platforms, the level of personal discretionary spending, unemployment rates, the state of housing markets, vehicle production levels and capacity, auto emission and fuel economy standards, the rate of inflation, currency exchange rates, tariffs or border adjustment taxes, manufacturer incentives (and consumers’ reaction to such offers), intense industry competition, the prospects of war, other international conflicts or terrorist attacks, severe weather events, product quality, affordability and innovation, the number of consumers whose vehicle leases are expiring, the length of consumer loans on existing vehicles, and the rise of ride-sharing applications. Changes in interest rates can significantly impact industry new vehicle sales and vehicle affordability due to the direct relationship between interest rates and monthly loan payments, a critical factor for many vehicle buyers, and the impact interest rates have on customers’ borrowing capacity and disposable income. Sales of certain new vehicles, particularly larger trucks and sport utility vehicles that historically have provided us with higher gross profit per vehicle retailed, are sensitive to fuel prices and the level of construction activity. In addition, volatility in fuel prices can cause rapid shifts in consumer preferences which are difficult to accommodate given the long lead-time of inventory acquisition. The imposition of new tariffs or border adjustment taxes could increase prices for vehicles imported into the United States and adversely impact demand for such vehicles.
Approximately
17.5 million
,
17.5 million
, and
16.5 million
new vehicles were sold in the United States in
2016
,
2015
, and
2014
, respectively. While we expect that the annual rate of U.S. new vehicle unit sales will remain above 17 million in
2017
, there can be no assurance that it will. If new vehicle production exceeds the new vehicle industry selling rate, our new vehicle gross profit per vehicle retailed could be adversely impacted by excess supply and any resulting changes in incentive, marketing, and other programs of vehicle manufacturers. See the risk factor “
Our new vehicle sales are impacted by the incentive, marketing, and other programs of vehicle manufacturers
” below. Further, our performance may differ from the performance of the automotive retail industry due to particular economic conditions and other factors in the geographic markets in which we operate. Economic conditions and the other factors described above may also materially adversely impact our sales of used vehicles, parts and automotive repair and maintenance services, and automotive finance and insurance products.
Our new vehicle sales are impacted by the incentive, marketing, and other programs of vehicle manufacturers
.
Most vehicle manufacturers from time to time establish various marketing and sales incentive programs designed to spur consumer demand for their vehicles, particularly during periods of excess supply and/or in a flat or declining new vehicle market. These programs impact our operations, particularly our sales of new vehicles. Since these programs are often not announced in advance, they can be difficult to plan for when ordering inventory. Furthermore, manufacturers may
11
modify and discontinue these marketing and incentive programs from time to time, which could have a material adverse effect on our results of operations and cash flows.
In 2016, our new vehicle unit volume and new vehicle gross profit on a per vehicle retailed basis were adversely impacted by certain manufacturers’ disruptive marketing and sales incentive programs based upon store-level growth targets established by those manufacturers (commonly referred to as “stair-step” incentive programs), which result in multi-tier pricing and adversely impact our ability to compete with other dealers. If those manufacturers continue to use such incentive programs or if other manufacturers adopt similar incentive programs, our operating results could continue to be adversely impacted.
We are dependent upon the success and continued financial viability of the vehicle manufacturers and distributors with which we hold franchises
.
The success of our stores is dependent on vehicle manufacturers in several key respects. First, we rely exclusively on the various vehicle manufacturers for our new vehicle inventory. Our ability to sell new vehicles is dependent on a vehicle manufacturer’s ability to produce and allocate to our stores an attractive, high-quality, and desirable product mix at the right time in order to satisfy customer demand. Second, manufacturers generally support their franchisees by providing direct financial assistance in various areas, including, among others, floorplan assistance and advertising assistance. Third, manufacturers provide product warranties and, in some cases, service contracts to customers. Our stores perform warranty and service contract work for vehicles under manufacturer product warranties and service contracts, and direct bill the manufacturer as opposed to invoicing the store customer. At any particular time, we have significant receivables from manufacturers for warranty and service work performed for customers. In addition, we rely on manufacturers to varying extents for original equipment manufactured replacement parts, training, product brochures and point of sale materials, and other items for our stores. Our business, results of operations, and financial condition could be materially adversely affected as a result of any event that has a material adverse effect on the vehicle manufacturers or distributors that are our primary franchisors.
The core brands of vehicles that we sell, representing approximately
94%
of the new vehicles that we sold in
2016
, are manufactured by
Toyota (including Lexus), Ford, Honda, General Motors, FCA US, Mercedes-Benz, Nissan, BMW, and Volkswagen (including Audi and Porsche)
. We are subject to a concentration of risk in the event of adverse events or financial distress, including bankruptcy, impacting one or more of these manufacturers.
Vehicle manufacturers may be adversely impacted by economic downturns or recessions, significant declines in the sales of their new vehicles, natural disasters, increases in interest rates, adverse fluctuations in currency exchange rates, declines in their credit ratings, labor strikes or similar disruptions (including within their major suppliers), supply shortages or rising raw material costs, rising employee benefit costs, vehicle recall campaigns, adverse publicity that may reduce consumer demand for their products (including due to bankruptcy), product defects, litigation, poor product mix or unappealing vehicle design, governmental laws and regulations (including fuel economy requirements), import product restrictions, the rise of ride-sharing applications, or other adverse events. These and other risks could materially adversely affect any manufacturer and impact its ability to profitably design, market, produce, or distribute new vehicles, which in turn could materially adversely affect our ability to obtain or finance our desired new vehicle inventories, our ability to take advantage of manufacturer financial assistance programs, our ability to collect in full or on a timely basis our manufacturer warranty and other receivables, and/or our ability to obtain other goods and services provided by the impacted manufacturer. In addition, vehicle recall campaigns could materially adversely affect our business, results of operations, and financial condition. The Takata airbag inflator recall, the largest and most complex safety recall in U.S. automotive history, adversely impacted our business in 2016 and may continue to adversely impact our business. See “Takata Airbag Inflator Recall” in Part II, Item 7 of this Form 10-K.
Our business could be materially adversely impacted by the bankruptcy of a major vehicle manufacturer or related lender. For example, (i) a manufacturer in bankruptcy could attempt to terminate all or certain of our franchises, in which case we may not receive adequate compensation for our franchises, (ii) consumer demand for such manufacturer’s products could be materially adversely affected, (iii) a lender in bankruptcy could attempt to terminate our floorplan financing and demand repayment of any amounts outstanding, (iv) we may be unable to arrange financing for our customers for their vehicle purchases and leases through such lender, in which case we would be required to seek financing with alternate financing sources, which may be difficult to obtain on similar terms, if at all, (v) we may be unable to collect some or all of our significant receivables that are due from such manufacturer or lender, and we may be subject to preference claims
12
relating to payments made by such manufacturer or lender prior to bankruptcy, and (vi) such manufacturer may be relieved of its indemnification obligations with respect to product liability claims. Additionally, any such bankruptcy may result in us being required to incur impairment charges with respect to the inventory, fixed assets, and intangible assets related to certain franchises, which could adversely impact our results of operations, financial condition, and our ability to remain in compliance with the financial ratios contained in our debt agreements.
If we are not able to maintain and enhance our retail brands and reputation or to attract consumers to our own digital channels, or if events occur that damage our retail brands, reputation, or sales channels, our business and financial results may be harmed. We are investing significantly in the next phase of our brand extension strategy, and if our strategic initiatives are not successful, we will have incurred significant expenses without the benefit of improved financial results.
We believe that we have built an excellent reputation as an automotive retailer in the United States. During the first half of 2013, we transitioned our Domestic and Import stores to a unified AutoNation retail brand. We believe that our continued success will depend on our ability to maintain and enhance the value of our retail brands across all of our sales channels, including in the communities in which we operate, and to attract consumers to our own digital channels.
Consumers are increasingly shopping for new and used vehicles, automotive repair and maintenance services, and other automotive products and services online and through mobile applications, including through third-party online and mobile sales platforms, with which we compete, that are designed to generate consumer sales leads that are sold to automotive dealers. If we fail to preserve the value of our retail brands, to maintain our reputation, or to attract consumers to our own digital channels, our business could be adversely impacted.
An isolated business incident at a single store could materially adversely affect our other stores, retail brands, reputation, and sales channels, particularly if such incident results in adverse publicity, governmental investigations, or litigation. In addition, the growing use of social media by consumers increases the speed and extent that information and opinions can be shared, and negative posts or comments on social media about AutoNation or any of our stores could materially damage our retail brands, reputation, and sales channels.
We have invested and will continue to invest substantial resources in marketing activities with the goals of, among other things, extending and enhancing the AutoNation retail brand, attracting consumers to our own digital channels, and reducing our use of third-party online and mobile sales platforms. We are also investing significantly in the next phase of our brand extension strategy, which includes the launch of stand-alone used vehicle sales and service centers and branded parts and accessories and the expansion of branded collision centers and automotive auctions. In connection with our brand extension strategy, we also plan to adopt a one price used vehicle sales model at all of our stores. See “Business Strategy” in Part I, Item 1 of this Form 10-K.
The roll-out of these strategic initiatives may be impacted by a number of variables, including customer adoption, market conditions, and our ability to identify, acquire, and build out suitable locations in a timely manner.
There can be no assurance that our marketing strategies will be successful or that the amount we invest in marketing activities will result in improved financial results. If our marketing initiatives are not successful, we will have incurred significant expenses without the benefit of improved financial results.
New laws, regulations, or governmental policies regarding fuel economy and greenhouse gas emission standards, or changes to existing standards, may affect vehicle manufacturers’ ability to produce cost-effective vehicles or vehicles that consumers demand, which could adversely impact our business, results of operations, financial condition, cash flow, and prospects
.
Vehicle manufacturers are subject to government-mandated fuel economy and greenhouse gas, or GHG, emission standards, which continue to change and become more stringent over time. In May 2010, the Environmental Protection Agency and the National Highway Transportation Safety Administration issued a joint final rule implementing harmonized federal standards for fuel economy and GHG emissions standards, which will substantially increase fuel economy requirements. These and other laws and regulations could materially adversely affect, particularly during periods when fuel prices are low, the ability of manufacturers to produce, and our ability to sell, vehicles in demand by consumers at affordable prices, which could materially adversely impact our business, results of operations, financial condition, cash flow, and prospects.
13
Natural disasters and adverse weather events can disrupt our business
.
Our stores are concentrated in states and regions in the United States, including primarily Florida, Texas, and California, in which actual or threatened natural disasters and severe weather events (such as hail storms, hurricanes, earthquakes, fires, tornadoes, snow storms, and landslides) may disrupt our store operations, which may adversely impact our business, results of operations, financial condition, and cash flows. In addition to business interruption, the automotive retail business is subject to substantial risk of property loss due to the significant concentration of property values at store locations. We cannot assure you that we will not be exposed to uninsured or underinsured losses that could have a material adverse effect on our business, financial condition, results of operations, or cash flows. In addition, natural disasters may adversely impact new vehicle production and the global automotive supply chain, which in turn could materially adversely impact our business, results of operations, financial conditions, and cash flows.
We are subject to restrictions imposed by, and significant influence from, vehicle manufacturers that may adversely impact our business, financial condition, results of operations, cash flows, and prospects, including our ability to acquire additional stores
.
Vehicle manufacturers and distributors with whom we hold franchises have significant influence over the operations of our stores. The terms and conditions of our framework, franchise, and related agreements and the manufacturers’ interests and objectives may, in certain circumstances, conflict with our interests and objectives. For example, manufacturers can set performance standards with respect to sales volume, sales effectiveness, and customer satisfaction, and can influence our ability to acquire additional stores, the naming and marketing of our stores, our digital channels, our selection of store management, product stocking and advertising spending levels, and the level at which we capitalize our stores. Manufacturers also impose minimum facility requirements that can require significant capital expenditures. Manufacturers may also have certain rights to restrict our ability to provide guaranties of our operating companies, pledges of the capital stock of our subsidiaries, and liens on our assets, which could adversely impact our ability to obtain financing for our business and operations on favorable terms or at desired levels. From time to time, we are precluded under agreements with certain manufacturers from acquiring additional franchises, or subject to other adverse actions, to the extent we are not meeting certain performance criteria at our existing stores (with respect to matters such as sales volume, sales effectiveness, and customer satisfaction) until our performance improves in accordance with the agreements, subject to applicable state franchise laws.
Manufacturers also have the right to establish new franchises or relocate existing franchises, subject to applicable state franchise laws. The establishment or relocation of franchises in our markets could have a material adverse effect on the financial condition, results of operations, cash flows, and prospects of our stores in the market in which the franchise action is taken.
Our framework, franchise, and related agreements also grant the manufacturer the right to terminate or compel us to sell our franchise for a variety of reasons (including uncured performance deficiencies, any unapproved change of ownership or management, or any unapproved transfer of franchise rights or impairment of financial standing or failure to meet capital requirements), subject to applicable state franchise laws. From time to time, certain major manufacturers assert sales and customer satisfaction performance deficiencies under the terms of our framework and franchise agreements. Additionally, our framework agreements contain restrictions regarding a change in control, which may be outside of our control. See “Agreements with Vehicle Manufacturers” in Part I, Item 1 of this Form 10-K. While we believe that we will be able to renew all of our franchise agreements, we cannot guarantee that all of our franchise agreements will be renewed or that the terms of the renewals will be favorable to us. We cannot assure you that our stores will be able to comply with manufacturers’ sales, customer satisfaction, performance, facility, and other requirements in the future, which may affect our ability to acquire new stores or renew our franchise agreements, or subject us to other adverse actions, including termination or compelled sale of a franchise, any of which could have a material adverse effect on our financial condition, results of operations, cash flows, and prospects. Furthermore, we rely on the protection of state franchise laws in the states in which we operate and if those laws are repealed or weakened, our framework, franchise, and related agreements may become more susceptible to termination, non-renewal, or renegotiation.
In addition, we have granted certain manufacturers the right to acquire, at fair market value, our automotive dealerships franchised by that manufacturer in specified circumstances in the event of our default under certain of our debt agreements.
14
We are subject to numerous legal and administrative proceedings, which, if the outcomes are adverse to us, could materially adversely affect our business, results of operations, financial condition, cash flows, and prospects
.
We are involved, and will continue to be involved, in numerous legal proceedings arising out of the conduct of our business, including litigation with customers, wage and hour and other employment-related lawsuits, and actions brought by governmental authorities. Some of these lawsuits purport or may be determined to be class or collective actions and seek substantial damages or injunctive relief, or both, and some may remain unresolved for several years. We do not believe that the ultimate resolution of these matters will have a material adverse effect on our business, results of operations, financial condition, cash flows, or prospects. However, the results of these matters cannot be predicted with certainty, and an unfavorable resolution of one or more of these matters could have a material adverse effect on our business, results of operations, financial condition, cash flows, and prospects.
Our operations are subject to extensive governmental laws and regulations. If we are found to be in purported violation of or subject to liabilities under any of these laws or regulations, or if new laws or regulations are enacted that adversely affect our operations, our business, operating results, and prospects could suffer
.
The automotive retail industry, including our facilities and operations, is subject to a wide range of federal, state, and local laws and regulations, such as those relating to motor vehicle sales, retail installment sales, leasing, finance and insurance, advertising, licensing, consumer protection, consumer privacy, escheatment, anti-money laundering, the environment, vehicle emissions and fuel economy, health and safety, and employment practices. With respect to motor vehicle sales, retail installment sales, leasing, finance and insurance, and advertising, we are subject to various laws and regulations, the violation of which could subject us to consumer class action or other lawsuits or governmental investigations and adverse publicity, in addition to administrative, civil, or criminal sanctions. With respect to employment practices, we are subject to various laws and regulations, including complex federal, state, and local wage and hour and anti-discrimination laws. We are also subject to lawsuits and governmental investigations alleging violations of these laws and regulations, including purported class action lawsuits, which could result in significant liability, fines, and penalties. See the risk factor “
We are subject to numerous legal and administrative proceedings, which, if the outcomes are adverse to us, could materially adversely affect our business, results of operations, financial condition, cash flows, and prospects
” above. The violation of other laws and regulations to which we are subject also can result in administrative, civil, or criminal sanctions against us, which may include a cease and desist order against the subject operations or even revocation or suspension of our license to operate the subject business, as well as significant fines and penalties. We currently devote significant resources to comply with applicable federal, state, and local regulation of health, safety, environmental, zoning, and land use regulations, and we may need to spend additional time, effort, and money to keep our operations and existing or acquired facilities in compliance therewith. In addition, we may be subject to broad liabilities arising out of contamination at our currently and formerly owned or operated facilities, at locations to which hazardous substances were transported from such facilities, and at such locations related to entities formerly affiliated with us. Although for some such liabilities we believe we are entitled to indemnification from other entities, we cannot assure you that such entities will view their obligations as we do or will be able to satisfy them. Failure to comply with applicable laws and regulations or the unfavorable resolution of one or more lawsuits or governmental investigations may have an adverse effect on our business, results of operations, financial condition, cash flows, and prospects.
The Dodd-Frank Act established the CFPB, an independent federal agency funded by the United States Federal Reserve with broad regulatory powers and limited oversight from the United States Congress. Although automotive dealers are generally excluded, the Dodd-Frank Act could lead to additional, indirect regulation of automotive dealers, in particular, their sale and marketing of finance and insurance products, through its regulation of automotive finance companies and other financial institutions. In addition, the CFPB issued a rule, pursuant to its authority under the Dodd-Frank Act, expanding its supervisory authority with respect to certain non-bank lenders, including automotive finance companies, participating in automotive financing. The Dodd-Frank Act also provided the FTC with new and expanded authority regarding automotive dealers, and the FTC has implemented an enforcement initiative relating to the advertising practices of automotive dealers. Regulation from the CFPB or other federal agencies could lead to significant changes in the manner that dealers are compensated for arranging customer financing, and while it is difficult to predict how any such changes might impact us, any adverse changes could have a material adverse impact on our finance and insurance business and results of operations.
15
A failure of our information systems or any security breach or unauthorized disclosure of confidential information could have a material adverse effect on our business
.
Our business is dependent upon the efficient operation of our information systems. We rely on our information systems to manage, among other things, our sales, inventory, and service efforts, including through our digital channels, and customer information, as well as to prepare our consolidated financial and operating data. The failure of our information systems to perform as designed or the failure to maintain and enhance or protect the integrity of these systems could disrupt our business operations, impact sales and results of operations, expose us to customer or third-party claims, or result in adverse publicity. Additionally, we collect, process, and retain sensitive and confidential customer information in the normal course of our business. Despite the security measures we have in place and any additional measures we may implement in the future, our facilities and systems, and those of our third-party service providers, could experience security breaches, computer viruses, lost or misplaced data, programming errors, human errors, acts of vandalism, or other events. For example, several well-known retailers have disclosed high-profile security breaches, involving sophisticated and highly targeted attacks on their company’s infrastructure or their customers’ data, which were not recognized or detected until after such retailers had been affected notwithstanding the preventative measures such retailers had in place. Any security breach or event resulting in the misappropriation, loss, or other unauthorized disclosure of confidential information, whether by us directly or our third-party service providers, could damage our reputation, expose us to the risks of litigation and liability, disrupt our business, or otherwise affect our results of operations.
Our debt agreements contain certain financial ratios and other restrictions on our ability to conduct our business, and our substantial indebtedness could adversely affect our financial condition and operations and prevent us from fulfilling our debt service obligations
.
The credit agreement governing our revolving credit facility, our mortgage facility, and the indentures relating to our 6.75% Senior Notes due 2018, 5.5% Senior Notes due 2020, 3.35% Senior Notes due 2021, and 4.5% Senior Notes due 2025 contain covenants that limit the discretion of our management with respect to various business matters. These covenants place restrictions on, among other things, our ability to incur additional indebtedness, to create liens or other encumbrances, and to sell or otherwise dispose of assets and to merge or consolidate with other entities. A failure by us to comply with the obligations contained in any of our debt agreements could result in an event of default, which could permit acceleration of the related debt as well as acceleration of debt under other debt agreements that contain cross-acceleration or cross-default provisions. If any debt is accelerated, our liquid assets may not be sufficient to repay in full such indebtedness and our other indebtedness. Additionally, we have granted certain manufacturers the right to acquire, at fair market value, our automotive stores franchised by those manufacturers in specified circumstances in the event of our default under our debt agreements.
Under our credit agreement, we are required to remain in compliance with a maximum leverage ratio and a maximum capitalization ratio. See “Liquidity and Capital Resources — Restrictions and Covenants” in Part II, Item 7 of this Form 10-K. If our earnings decline, we may be unable to comply with the financial ratios required by our credit agreement. In such case, we would seek an amendment or waiver of our credit agreement or consider other options, such as raising capital through an equity issuance to pay down debt, which could be dilutive to stockholders. There can be no assurance that our lenders would agree to an amendment or waiver of our credit agreement. In the event we obtain an amendment or waiver of our credit agreement, we would likely incur additional fees and higher interest expense.
As of
December 31, 2016
, we had
$2.7 billion
of total non-vehicle debt (including amounts outstanding under our mortgage facility and capital leases) and
$3.8 billion
of vehicle floorplan financing. Our substantial indebtedness could have important consequences. For example:
|
•
|
We may have difficulty satisfying our debt service obligations and, if we fail to comply with these requirements, an event of default could result;
|
|
•
|
We may be required to dedicate a substantial portion of our cash flow from operations to make required payments on indebtedness, thereby reducing the availability of cash flow for working capital, capital expenditures, acquisitions, and other general corporate activities;
|
|
•
|
Covenants relating to our indebtedness may limit our ability to obtain financing for working capital, capital expenditures, acquisitions, and other general corporate activities;
|
16
|
•
|
Covenants relating to our indebtedness may limit our flexibility in planning for, or reacting to, changes in our business and the industry in which we operate;
|
|
•
|
We may be more vulnerable to the impact of economic downturns and adverse developments in our business;
|
|
•
|
We may be placed at a competitive disadvantage against any less leveraged competitors;
|
|
•
|
Our variable interest rate debt will fluctuate with changing market conditions and, accordingly, our interest expense will increase if interest rates rise; and
|
|
•
|
Future share repurchases may be limited by the maximum leverage ratio and/or maximum capitalization ratio described above.
|
The occurrence of any one of these events could have a material adverse effect on our business, financial condition, results of operations, prospects, and ability to satisfy our debt service obligations.
We are subject to interest rate risk in connection with our vehicle floorplan payables, revolving credit facility, and commercial paper program that could have a material adverse effect on our profitability
.
Our vehicle floorplan payables and revolving credit facility are subject to variable interest rates, and the interest rate for our commercial paper notes varies based on duration and market conditions. Accordingly, our interest expense will fluctuate with changing market conditions and will increase if interest rates rise. In addition, our net new vehicle inventory carrying cost (new vehicle floorplan interest expense net of floorplan assistance that we receive from automotive manufacturers) may increase due to changes in interest rates, inventory levels, and manufacturer assistance. We cannot assure you that a significant increase in interest rates would not have a material adverse effect on our business, financial condition, results of operations, or cash flows.
Goodwill and other intangible assets comprise a significant portion of our total assets. We must test our goodwill and other intangible assets for impairment at least annually, which could result in a material, non-cash write-down of goodwill or franchise rights and could have a material adverse impact on our results of operations and shareholders’ equity
.
Goodwill and indefinite-lived intangible assets are subject to impairment assessments at least annually (or more frequently when events or changes in circumstances indicate that an impairment may have occurred) by applying a fair-value based test. Our principal intangible assets are goodwill and our rights under our franchise agreements with vehicle manufacturers. A decrease in our market capitalization or profitability increases the risk of goodwill impairment. Negative or declining cash flows or a decline in actual or planned revenues for our stores increases the risk of franchise rights impairment. An impairment loss could have a material adverse impact on our results of operations and shareholders’ equity. During 2015, we recorded non-cash impairment charges of
$15.4 million
(
$9.6 million
after-tax) associated with franchise rights recorded at our Volkswagen stores. See Note
16
of the Notes to Consolidated Financial Statements for more information.
Our largest stockholders, as a result of their ownership stakes in us, may have the ability to exert substantial influence over actions to be taken or approved by our stockholders or Board of Directors. In addition, future share repurchases and fluctuations in the levels of ownership of our largest stockholders could impact the volume of trading, liquidity, and market price of our common stock
.
Based on filings made with the SEC through
February 6, 2017
, William H. Gates III beneficially owns approximately
20%
of the outstanding shares of our common stock, through holdings by Cascade Investment, L.L.C. (“Cascade”), which is solely owned by Mr. Gates, and the Bill & Melinda Gates Foundation Trust (the “Trust”), of which he is a co-trustee. As a result, Cascade and the Trust may have the ability to exert substantial influence over actions to be taken or approved by our stockholders, including the election of directors and any transactions involving a change of control. In addition, Michael Larson, the chief investment officer for William H. Gates III and Business Manager for Cascade, serves as our lead independent director. Cascade and the Trust, therefore, may also have the ability to exert substantial influence over actions to be taken or approved by our Board.
Based on filings made with the SEC through
February 6, 2017
, ESL Investments, Inc. together with certain of its investment affiliates (collectively, “ESL”) beneficially owns approximately
16%
of the outstanding shares of our common
17
stock. As a result, ESL may also have the ability to exert substantial influence over actions to be taken or approved by our stockholders, including the election of directors and any transactions involving a change of control.
In the future, our largest stockholders may acquire or dispose of shares of our common stock and thereby increase or decrease their ownership stake in us. Based on filings made with the SEC through
February 6, 2017
, since January 1, 2016, ESL has disposed of approximately 1.9 million shares of our common stock. Significant fluctuations in the levels of ownership of our largest stockholders could impact the volume of trading, liquidity, and market price of our common stock.
In the aggregate, based on filings made with the SEC through
February 6, 2017
, ESL, Cascade, the Trust, our executive officers, and our directors beneficially own approximately
40%
of our outstanding shares. Future share repurchases by the Company, together with any future share purchases by our affiliates, will reduce our “public float” (shares owned by non-affiliate stockholders and available for trading). Such reduction in our public float could decrease the volume of trading and liquidity of our common stock, could lead to increased volatility in the market price of our common stock, or could adversely impact the market price of our common stock.
ITEM 1B.
UNRESOLVED STAFF COMMENTS
None.
ITEM 2.
PROPERTIES
We lease our current corporate headquarters facility in Fort Lauderdale, Florida, pursuant to a lease expiring on December 31, 2020. We also own or lease numerous facilities relating to our operations under each of our operating segments. These facilities are located in the following 16 states: Alabama, Arizona, California, Colorado, Florida, Georgia, Illinois, Maryland, Minnesota, Nevada, New York, Ohio, Tennessee, Texas, Virginia, and Washington. These facilities consist primarily of automobile showrooms, display lots, service facilities, collision repair centers, supply facilities, automobile storage lots, parking lots, and offices. We believe that our facilities are sufficient for our current needs and are in good condition in all material respects.
ITEM 3.
LEGAL PROCEEDINGS
We are involved and will continue to be involved in numerous legal proceedings arising out of the conduct of our business, including litigation with customers, wage and hour and other employment-related lawsuits, and actions brought by governmental authorities. Some of these lawsuits purport or may be determined to be class or collective actions and seek substantial damages or injunctive relief, or both, and some may remain unresolved for several years. We do not believe that the ultimate resolution of these matters will have a material adverse effect on our business, results of operations, financial condition, or cash flows. However, the results of these matters cannot be predicted with certainty, and an unfavorable resolution of one or more of these matters could have a material adverse effect on our business, results of operations, financial condition, cash flow, and prospects.
ITEM 4.
MINE SAFETY DISCLOSURES
Not applicable.
18
ITEM 5.
MARKET FOR REGISTRANT’S COMMON EQUITY, RELATED STOCKHOLDER MATTERS AND ISSUER PURCHASES OF EQUITY SECURITIES
Market Information, Holders, and Dividends
Our common stock is traded on the New York Stock Exchange under the symbol “AN.” The following table sets forth the high and low sales prices of our common stock for the periods indicated.
|
High
|
Low
|
||||||
|
2016
|
|||||||
|
Fourth Quarter
|
$
|
50.46
|
|
$
|
39.28
|
|
|
|
Third Quarter
|
$
|
54.15
|
|
$
|
45.19
|
|
|
|
Second Quarter
|
$
|
52.04
|
|
$
|
43.78
|
|
|
|
First Quarter
|
$
|
59.22
|
|
$
|
40.45
|
|
|
|
2015
|
|||||||
|
Fourth Quarter
|
$
|
65.51
|
|
$
|
55.95
|
|
|
|
Third Quarter
|
$
|
66.63
|
|
$
|
53.73
|
|
|
|
Second Quarter
|
$
|
67.50
|
|
$
|
61.19
|
|
|
|
First Quarter
|
$
|
65.00
|
|
$
|
55.91
|
|
|
As of
February 6, 2017
, there were 1,639 holders of record of our common stock. A substantially greater number of holders of our common stock are “street name” or beneficial holders, whose shares are held of record by banks, brokers, and other financial institutions.
We have not declared or paid any cash dividends on our common stock during our two most recent fiscal years. We do not currently anticipate paying cash dividends for the foreseeable future.
Issuer Purchases of Equity Securities
The table below sets forth information with respect to shares of common stock repurchased by AutoNation, Inc. during
2016
.
|
Period
|
Total Number
of Shares
Purchased
|
Average
Price Paid
Per Share
|
Total Number of
Shares Purchased as
Part of Publicly
Announced Plans
or Programs
(1)
|
Approximate
Dollar Value of
Shares That May
Yet Be Purchased
Under the Plans
or Programs
(in millions) (1) |
||||||||||
|
October 1, 2016 – October 31, 2016
|
240,452
|
|
$
|
47.03
|
|
239,473
|
|
$
|
313.7
|
|
||||
|
November 1, 2016 – November 30, 2016
|
357,854
|
|
$
|
42.46
|
|
357,600
|
|
$
|
298.6
|
|
||||
|
December 1, 2016 – December 31, 2016
|
—
|
|
$
|
—
|
|
—
|
|
$
|
298.6
|
|
||||
|
Total for three months ended December 31, 2016
|
598,306
|
|
597,073
|
|
||||||||||
|
Total for twelve months ended December 31, 2016
|
10,546,046
|
|
10,507,140
|
|
||||||||||
|
(1)
|
Our Board of Directors from time to time authorizes the repurchase of shares of our common stock up to a certain monetary limit. As of
December 31, 2016
,
$298.6 million
remained available under our stock repurchase limit most recently authorized by our Board of Directors. Our stock repurchase program does not have an expiration date. In
2016
, all of our shares were repurchased under our stock repurchase program, except for
38,906
shares that were surrendered to AutoNation to satisfy tax withholding obligations in connection with the vesting of restricted stock (
8,760
shares in the first quarter of
2016
,
24,125
shares in the second quarter of
2016
,
4,788
shares in the third quarter of
2016
, and
1,233
shares in the fourth quarter of
2016
).
|
19
Stock Performance Graph
The following graph and table compare the cumulative total stockholder return on our common stock from December 31,
2011
through
December 31, 2016
with the performance of: (i) the Standard & Poor’s (“S&P”) 500 Index and (ii) a self-constructed peer group consisting of other public companies in the automotive retail market, referred to as the “Public Auto Retail Peer Group.” The Public Auto Retail Peer Group consists of Asbury Automotive Group, Inc., CarMax, Inc., Group 1 Automotive, Inc., Lithia Motors, Inc., Penske Automotive Group, Inc., and Sonic Automotive, Inc., and these companies are weighted by market capitalization. We have created these comparisons using data supplied by Research Data Group, Inc. The comparisons reflected in the graph and table are not intended to forecast the future performance of our stock and may not be indicative of future performance. The graph and table assume that $100 was invested on December 31,
2011
in each of our common stock, the S&P 500 Index, and the Public Auto Retail Peer Group and that any dividends were reinvested.
Comparison of Five-Year Cumulative Return for AutoNation, Inc., the S&P 500 Index,
and the Public Auto Retail Peer Group

Copyright© 2017 S&P, a division of S&P Global. All rights reserved.
|
12/11
|
12/12
|
12/13
|
12/14
|
12/15
|
12/16
|
||||||||||||
|
AutoNation Inc.
|
100.00
|
|
107.68
|
|
134.77
|
|
163.85
|
|
161.81
|
|
131.95
|
|
|||||
|
S&P 500
|
100.00
|
|
116.00
|
|
153.58
|
|
174.60
|
|
177.01
|
|
198.18
|
|
|||||
|
Public Auto Retail Peer Group
|
100.00
|
|
132.93
|
|
180.62
|
|
235.46
|
|
204.35
|
|
231.04
|
|
|||||
20
ITEM 6.
SELECTED FINANCIAL DATA
You should read the following Selected Financial Data in conjunction with “Management’s Discussion and Analysis of Financial Condition and Results of Operations,” our Consolidated Financial Statements and Notes thereto, and other financial information included elsewhere in this Form 10-K.
|
|
As of and for the Years Ended December 31,
|
||||||||||||||||||
|
(In millions, except per share data and unit sales)
|
2016
|
2015
|
2014
|
2013
|
2012
|
||||||||||||||
|
|
|||||||||||||||||||
|
Revenue
|
$
|
21,609.0
|
|
$
|
20,862.0
|
|
$
|
19,108.8
|
|
$
|
17,517.6
|
|
$
|
15,667.5
|
|
||||
|
Income from continuing operations before income taxes
|
$
|
702.3
|
|
$
|
722.7
|
|
$
|
682.3
|
|
$
|
604.4
|
|
$
|
516.8
|
|
||||
|
Net income
|
$
|
430.5
|
|
$
|
442.6
|
|
$
|
418.7
|
|
$
|
374.9
|
|
$
|
316.4
|
|
||||
|
Basic earnings (loss) per share:
|
|||||||||||||||||||
|
Continuing operations
|
$
|
4.19
|
|
$
|
3.94
|
|
$
|
3.58
|
|
$
|
3.10
|
|
$
|
2.56
|
|
||||
|
Discontinued operations
|
$
|
(0.01
|
)
|
$
|
(0.01
|
)
|
$
|
(0.01
|
)
|
$
|
(0.01
|
)
|
$
|
(0.01
|
)
|
||||
|
Net income
|
$
|
4.18
|
|
$
|
3.93
|
|
$
|
3.57
|
|
$
|
3.09
|
|
$
|
2.56
|
|
||||
|
Weighted average common shares outstanding
|
103.1
|
|
112.7
|
|
117.3
|
|
121.3
|
|
123.8
|
|
|||||||||
|
Diluted earnings (loss) per share:
|
|||||||||||||||||||
|
Continuing operations
|
$
|
4.16
|
|
$
|
3.90
|
|
$
|
3.53
|
|
$
|
3.05
|
|
$
|
2.52
|
|
||||
|
Discontinued operations
|
$
|
(0.01
|
)
|
$
|
(0.01
|
)
|
$
|
(0.01
|
)
|
$
|
(0.01
|
)
|
$
|
(0.01
|
)
|
||||
|
Net income
|
$
|
4.15
|
|
$
|
3.89
|
|
$
|
3.52
|
|
$
|
3.04
|
|
$
|
2.52
|
|
||||
|
Weighted average common shares outstanding
|
103.8
|
|
113.9
|
|
118.9
|
|
123.3
|
|
125.8
|
|
|||||||||
|
Common shares outstanding, net of treasury stock
|
100.7
|
|
110.8
|
|
113.3
|
|
120.9
|
|
120.9
|
|
|||||||||
|
|
|||||||||||||||||||
|
Total assets
(1)
|
$
|
10,060.0
|
|
$
|
9,548.2
|
|
$
|
8,395.0
|
|
$
|
7,905.9
|
|
$
|
7,193.1
|
|
||||
|
Long-term debt, net of current maturities
(1)
|
$
|
1,611.1
|
|
$
|
1,745.3
|
|
$
|
2,098.7
|
|
$
|
1,801.6
|
|
$
|
2,056.4
|
|
||||
|
Shareholders’ equity
|
$
|
2,310.3
|
|
$
|
2,349.3
|
|
$
|
2,072.1
|
|
$
|
2,061.7
|
|
$
|
1,688.5
|
|
||||
|
Retail vehicle unit sales (continuing operations):
|
|||||||||||||||||||
|
New vehicle
|
337,622
|
|
339,080
|
|
318,008
|
|
292,922
|
|
267,784
|
|
|||||||||
|
Used vehicle
|
225,713
|
|
227,290
|
|
214,910
|
|
204,572
|
|
180,955
|
|
|||||||||
|
Total
|
563,335
|
|
566,370
|
|
532,918
|
|
497,494
|
|
448,739
|
|
|||||||||
(1)
We adopted an accounting standard update that requires debt issuance costs be presented on the balance sheet as a reduction from the carrying amount of the related debt liability. We adopted the standard retrospectively effective January 1, 2016, and have presented all debt issuance costs, with the exception of those related to our revolving credit facility, as a reduction from the carrying amount of the related debt liability for both current and prior periods. See Note 7 of the Notes to Consolidated Financial Statements for additional information.
See the Notes to Consolidated Financial Statements for additional information. See Part II, Item 5 of this Form 10-K for a discussion of our dividend policy.
21
ITEM 7.
MANAGEMENT’S DISCUSSION AND ANALYSIS OF FINANCIAL CONDITION AND RESULTS OF OPERATIONS
The following discussion should be read in conjunction with Part I, including matters set forth in the “Risk Factors” section of this Form 10-K, and our Consolidated Financial Statements and notes thereto included in Part II, Item 8 of this Form 10-K.
Except to the extent that differences among reportable segments are material to an understanding of our business taken as a whole, we present the discussion in Management’s Discussion and Analysis of Financial Condition and Results of Operations on a consolidated basis.
Overview
AutoNation, Inc., through its subsidiaries, is the largest automotive retailer in the United States. As of
December 31, 2016
, we owned and operated
371
new vehicle franchises from
260
stores located in the United States, predominantly in major metropolitan markets in the Sunbelt region. Our stores, which we believe include some of the most recognizable and well known in our key markets, sell
35
different new vehicle brands. The core brands of new vehicles that we sell, representing approximately
94%
of the new vehicles that we sold in
2016
, are manufactured by
Toyota (including Lexus), Ford, Honda, General Motors, FCA US, Mercedes-Benz, Nissan, BMW, and Volkswagen (including Audi and Porsche)
.
We offer a diversified range of automotive products and services, including new vehicles, used vehicles, “parts and service,” which includes automotive repair and maintenance services as well as wholesale parts and collision businesses, and automotive “finance and insurance” products, which include vehicle service and other protection products, as well as the arranging of financing for vehicle purchases through third-party finance sources.
As of
December 31, 2016
, we had three reportable segments: Domestic, Import, and Premium Luxury. Our Domestic segment is comprised of retail automotive franchises that sell new vehicles manufactured by General Motors, Ford, and FCA US. Our Import segment is comprised of retail automotive franchises that sell new vehicles manufactured primarily by Toyota, Honda, and Nissan. Our Premium Luxury segment is comprised of retail automotive franchises that sell new vehicles manufactured primarily by Mercedes-Benz, BMW, Lexus, and Audi. The franchises in each segment also sell used vehicles, parts and automotive repair and maintenance services, and automotive finance and insurance products.
For the year ended
December 31, 2016
, new vehicle sales accounted for approximately
57%
of our total revenue, and approximately
19%
of our total gross profit. Used vehicle sales accounted for approximately
23%
of our total revenue, and approximately
10%
of our total gross profit. Our parts and service and finance and insurance operations, while comprising approximately
20%
of total revenue, contributed approximately
70%
of our gross profit.
Market Conditions
Full-year U.S. industry new vehicle unit sales were
17.5 million
in
2016
, as compared to
17.5 million
in
2015
and
16.5 million
in
2014
. U.S. industry new vehicle unit retail sales were down 1% as compared to the prior year. We expect that full-year U.S. industry new vehicle unit sales in 2017 will remain above 17 million. However, actual sales may materially differ.
Based on industry data, vehicle leasing is at a historically-high level. To the extent that vehicle manufacturers
reduce their support for leasing programs, U.S. industry and our new vehicle unit retail sales could be adversely impacted.
Our new vehicle unit volume and new vehicle gross profit on a per vehicle retailed (“PVR”) basis were adversely impacted by certain manufacturers’ disruptive marketing and sales incentive programs, which are based upon store-level growth targets established by those manufacturers, and which result in multi-tier pricing. If those manufacturers continue to use such incentive programs or if other manufacturers adopt similar incentive programs, our operating results could continue to be adversely impacted.
The number of recent-model-year vehicles in operation is growing due to increases in the annual rate of new vehicle sales in the United States since 2009. The growth in that portion of our service base, together with our customer retention efforts, has benefited the customer-pay service and warranty components of our parts and service business, and we believe that it will continue to benefit those components for the next several years. While the number of older vehicles in operation
22
has declined in recent years and is expected to continue to decline over the next few years, we believe that overall our parts and service business will benefit from the mix shift in our service base toward newer vehicles.
Results of Operations
We had net income from continuing operations of
$431.7 million
and diluted earnings per share of
$4.16
in
2016
, as compared to net income from continuing operations of
$443.7 million
and diluted earnings per share of
$3.90
in
2015
, and net income from continuing operations of
$419.8 million
and diluted earnings per share of
$3.53
in
2014
.
Our retail new vehicle unit sales were down slightly in 2016 as compared to 2015.
The disruptive manufacturer marketing and sales incentive programs discussed above under “Market Conditions”
had a negative impact on our
new vehicle unit volume
and
gross profit PVR. New vehicle gross profit PVR compression was partially offset by continued strength in finance and insurance gross profit PVR. Used vehicle unit volume and gross profit were adversely impacted by the Takata airbag inflator recall discussed below. Our total gross profit for 2016 increased
2%
, as compared to 2015, primarily due to the acquisitions we completed in 2016 and 2015 and an increase in parts and service gross profit.
Net income from continuing operations benefited from net after-tax gains related to business/property dispositions (net of property impairments) of $30.1 million in 2016, $11.1 million in 2015, and $7.7 million in 2014, as well as net after-tax gains related to legal settlements of $8.9 million in 2016 and $2.5 million in 2014. See “Other Income, Net” below.
Strategic Initiatives
In 2013, we launched the AutoNation retail brand from coast to coast. During 2015, that branding effort was extended to AutoNation Express and the AutoNation Vehicle Protection Plan. We recently announced the next phase of our comprehensive, customer-focused brand extension strategy, which includes:
|
•
|
AutoNation USA stand-alone used vehicle sales and service centers, with 25 potential sites identified, five of which are expected to open in 2017,
|
|
•
|
AutoNation branded parts and accessories, the launch of which began in the third quarter of 2016, and which will be expanded over the next several years,
|
|
•
|
the expansion of AutoNation branded collision centers, which includes the unification of our collision centers under the AutoNation retail brand and plans to open or acquire at least 18 new collision centers over the next several years, and
|
|
•
|
the expansion of AutoNation branded automotive auctions, which, as announced in October 2016, includes plans to open four additional automotive auctions by the end of 2018.
|
We expect that these initiatives will expand and strengthen the AutoNation retail brand, improve the customer experience, provide new growth opportunities, and enable us to expand our footprint in our core and other markets. We expect that our investments in this phase of our brand extension roll-out, which may exceed $500 million in the aggregate, will continue for the next several years. The roll-out of these strategic initiatives may be impacted by a number of variables, including customer adoption, market conditions, and our ability to identify, acquire, and build out suitable locations in a timely manner. See “Risk Factors” in Part I, Item 1A of this Form 10-K.
In connection with our brand extension strategy, we also launched
a one price used vehicle sales model during the second half of 2016. The one price model is planned to be fully implemented in all of o
ur stores by the end of the second quarter of 2017.
Takata Airbag Inflator Recall
Used vehicle unit volume and gross profit in 2016 were adversely impacted by the Takata airbag inflator recall, the largest and most complex safety recall in U.S. automotive history. This recall has been disruptive to our business, as the vehicle inventory subject to this recall has been placed on a retail sales-hold by several manufacturers until parts become available to replace the defective airbag inflators. Certain manufacturers provide financial support for select vehicles that are on a retail sales-hold as a result of the recall, which serves to reduce our costs associated with those vehicles. We cannot predict when or how many replacement parts will become available, the number of additional affected vehicles that we will
23
acquire through trade-ins, or the amount of financial support we will receive from the manufacturers of such vehicles in the future, and this recall may continue to adversely impact our business.
Inventory Management
Our new and used vehicle inventories are stated at the lower of cost or market in our Consolidated Balance Sheets. We monitor our vehicle inventory levels closely based on current economic conditions and seasonal sales trends.
We have generally not experienced losses on the sale of new vehicle inventory, in part due to incentives provided by manufacturers to promote sales of new vehicles and our inventory management practices. We had
75,117
units in new vehicle inventory at
December 31, 2016
, and
80,442
units at
December 31, 2015
. See “New Vehicle Inventories” below for more information.
We recondition the majority of used vehicles acquired for retail sale in our parts and service departments and capitalize the related costs to the used vehicle inventory. Used vehicles that are not sold on a retail basis are generally liquidated at wholesale auctions. We record estimated losses on used vehicle inventory. Our used vehicle inventory balance was net of cumulative write-downs of
$5.9 million
at
December 31, 2016
, and
$4.5 million
at
December 31, 2015
.
Parts, accessories, and other inventory are carried at the lower of acquisition cost (first-in, first-out method) or market. We estimate the amount of potential obsolete inventory based upon past experience, manufacturer return policies, and industry trends. Our parts, accessories, and other inventory balance was net of cumulative write-downs of
$3.9 million
at
December 31, 2016
, and
$3.5 million
at
December 31, 2015
.
Critical Accounting Policies and Estimates
We prepare our Consolidated Financial Statements in conformity with accounting principles generally accepted in the United States, which require us to make estimates and assumptions that affect the reported amounts of assets and liabilities, the disclosure of contingent assets and liabilities at the date of the financial statements, and the reported amounts of revenue and expenses during the reporting period. We evaluate our estimates on an ongoing basis and we base our estimates on historical experience and various other assumptions we believe to be reasonable. Actual outcomes could differ materially from those estimates in a manner that could have a material effect on our Consolidated Financial Statements. Set forth below are the policies and estimates that we have identified as critical to our business operations and an understanding of our results of operations, based on the high degree of judgment or complexity in their application.
Goodwill
Goodwill for our Domestic, Import, and Premium Luxury reporting units is tested for impairment annually on April 30 or more frequently when events or changes in circumstances indicate that impairment may have occurred.
Under accounting standards, we chose to make a qualitative evaluation about the likelihood of goodwill impairment to determine whether it was necessary to calculate the fair values of our reporting units under the two-step goodwill impairment test. We completed our qualitative assessment of potential goodwill impairment as of April 30,
2016
, and we determined that it was not more likely than not that the fair values of our reporting units were less than their carrying amounts.
As of
December 31, 2016
, we have
$252.1 million
of goodwill related to the Domestic reporting unit,
$558.2 million
related to the Import reporting unit,
$697.4 million
related to the Premium Luxury reporting unit, and
$3.6 million
in “Corporate and other.”
Other Intangible Assets
Our principal identifiable intangible assets are individual store rights under franchise agreements with vehicle manufacturers, which have indefinite lives and are tested for impairment annually on April 30 or more frequently when events or changes in circumstances indicate that impairment may have occurred.
Our franchise rights, which related to 69 stores and totaled $546.4 million at April 30, 2016, are evaluated for impairment on a franchise-by-franchise basis annually. Under accounting standards, we chose to make a qualitative evaluation about the likelihood of franchise rights impairment to determine whether it was necessary to perform a
24
quantitative impairment test. We completed our qualitative assessment of franchise rights impairment as of April 30,
2016
. Based on our qualitative assessment, we determined that we should perform a quantitative test for certain franchise rights; however, no impairment charges resulted from these quantitative tests.
The quantitative impairment test for franchise rights requires the comparison of the franchise rights’ estimated fair value to carrying value by store. Fair values of rights under franchise agreements are estimated using Level 3 inputs by discounting expected future cash flows of the store. The forecasted cash flows contain inherent uncertainties, including significant estimates and assumptions related to growth rates, margins, working capital requirements, capital expenditures, and cost of capital, for which we utilize certain market participant-based assumptions, using third-party industry projections, economic projections, and other marketplace data we believe to be reasonable. If, hypothetically, the fair value of each of the franchise rights quantitatively tested had been determined to be 10% lower as of the valuation date, no impairment charge would have resulted. The effect of a hypothetical 10% decrease in fair value estimates is not intended to provide a sensitivity analysis of every potential outcome.
Long-Lived Assets
We estimate the depreciable lives of our property and equipment, including leasehold improvements, and review them for impairment when events or changes in circumstances indicate that their carrying amounts may be impaired. Such events or changes may include a significant decrease in market value, a significant change in the business climate in a particular market, a current expectation that more-likely-than-not a long-lived asset will be sold or otherwise disposed of significantly before the end of its previously estimated useful life, or a current-period operating or cash flow loss combined with historical losses or projected future losses.
When evaluating potential impairment of long-lived assets held and used, we first compare the carrying amount of the asset group to the asset group’s estimated future undiscounted cash flows. If the estimated future undiscounted cash flows are less than the carrying amount of the asset group, we then compare the carrying amount of the asset group to the asset group’s estimated fair value to determine if impairment exists. The fair value measurements for our long-lived assets held and used were based on Level 3 inputs, which considered information obtained from third-party real estate valuation sources. See Note
16
of the Notes to Consolidated Financial Statements for more information about our fair value measurements. We recognize an impairment loss if the amount of the asset group’s carrying amount exceeds the asset group’s estimated fair value. If we recognize an impairment loss, the adjusted carrying amount of the asset group becomes its new cost basis. For a depreciable long-lived asset, the new cost basis will be depreciated over the remaining useful life of that asset.
When property and equipment is identified as held for sale, we reclassify the held for sale assets to Other Current Assets and cease recording depreciation. We measure each long-lived asset or disposal group at the lower of its carrying amount or fair value less cost to sell and recognize a loss for any initial adjustment of the long-lived asset’s or disposal group’s carrying amount to fair value less cost to sell in the period the “held for sale” criteria are met. We periodically evaluate the carrying value of assets held for sale to determine if, based on market conditions, the values of these assets should be adjusted. Any subsequent change in the fair value less cost to sell (increase or decrease) of each asset held for sale is reported as an adjustment to its carrying amount, except that the adjusted carrying amount cannot exceed the carrying amount of the long-lived asset or disposal group at the time it was initially classified as held for sale. Such valuations include estimations of fair values and incremental direct costs to transact a sale. The fair value measurements for our long-lived assets held for sale were based on Level 3 inputs, which considered information obtained from third-party real estate valuation sources, or, in certain cases, pending agreements to sell the related assets.
We had assets held for sale in continuing operations of
$41.4 million
at
December 31, 2016
, and
$47.1 million
at December 31,
2015
, and assets held for sale in discontinued operations of
$15.7 million
at December 31,
2016
, and
$22.3 million
at December 31,
2015
.
The fair value measurements for our property and equipment and assets held for sale are based on Level 3 inputs, which considered information from third-party real estate valuation sources, or, in certain cases, pending agreements to sell the related assets. See Note 16 of the Notes to Consolidated Financial Statements for more information on our fair value measurement valuation process and impairment charges that were recorded during
2016
and
2015
. Our impairment loss calculations contain uncertainties because they require us to make assumptions and to apply judgment to estimate future undiscounted cash flows and asset fair values, including forecasting useful lives of the assets. Although we believe our
25
property and equipment and assets held for sale are appropriately valued, the assumptions and estimates used may change and we may be required to record impairment charges to reduce the value of these assets.
Chargeback Liability
Revenue on finance and insurance products represents commissions earned by us for the placement of: (i) loans and leases with financial institutions in connection with customer vehicle purchases financed, (ii) vehicle service contracts with third-party providers, and (iii) other vehicle protection products with third-party providers. We primarily sell these products on a straight commission basis; however, in certain cases, we also participate in the future underwriting profit on certain extended service contracts pursuant to retrospective commission arrangements with the issuers of those contracts, which is recognized as earned.
We may be charged back for commissions related to financing, vehicle service contracts, or other vehicle protection products in the event of early termination, default, or prepayment of the contracts by customers (“chargebacks”). However, our exposure to loss generally is limited to the commissions that we receive. These commissions are recorded at the time of the sale of the vehicles, net of an estimated liability for chargebacks.
We estimate our liability for chargebacks on an individual product basis using our historical chargeback experience, based primarily on cancellation data we receive from third parties that sell and administer these products. Our estimated liability for chargebacks totaled
$116.8 million
at
December 31, 2016
, and
$97.3 million
at
December 31, 2015
.
Chargebacks are influenced by the volume of vehicle sales in recent years and increases or decreases in early termination rates resulting from cancellation of vehicle service contracts and other vehicle protection products, defaults, refinancings, payoffs before maturity, and other factors. While we consider these factors in the estimation of our chargeback liability, actual events may differ from our estimates, which could result in an adjustment to our estimated liability for chargebacks. The
increase
in our liability for chargebacks is largely attributable to increases in vehicle unit volume and product penetration in recent years, product mix, and an overall increase in the cancellation rates of finance and insurance products. Our actual chargeback experience has not been materially different from our recorded estimates. A 10% change in our estimated cancellation rates would have changed our estimated liability for chargebacks at
December 31, 2016
, by approximately
$11.5 million
.
See Note
18
of the Notes to Consolidated Financial Statements for further information regarding chargeback liabilities.
Self-Insurance Liabilities
Under our self-insurance programs, we retain various levels of aggregate loss limits, per claim deductibles, and claims-handling expenses as part of our various insurance programs, including property and casualty, employee medical benefits, automobile, and workers’ compensation. Costs in excess of this retained risk per claim may be insured under various contracts with third-party insurance carriers. We review our claim and loss history on a periodic basis to assist in assessing our future liability. The ultimate costs of these retained insurance risks are estimated by management and by third-party actuarial evaluation of historical claims experience, adjusted for current trends and changes in claims-handling procedures. Our results could be adversely impacted by claims and other expenses related to our self-insurance programs if future occurrences and claims differ from these assumptions and historical trends. Self-insurance liabilities totaled
$75.9 million
at
December 31, 2016
, and
$74.8 million
at
December 31, 2015
. Our actual loss experience has not been materially different from our recorded estimates.
Revenue Recognition
Revenue consists of the sales of new and used vehicles, sales of parts and services, commissions from finance and insurance products, and sales of other products. We recognize revenue in the period in which products are sold or services are provided. We recognize vehicle and finance and insurance revenue when a sales contract has been executed, the vehicle has been delivered, and payment has been received or financing has been arranged. Rebates, holdbacks, floorplan assistance, and certain other incentives received from manufacturers are recorded as a reduction of the cost of the vehicle and recognized into income upon the sale of the vehicle or when earned under a specific manufacturer program, whichever is later. See Note 1 of the Notes to Consolidated Financial Statements for further information regarding revenue recognition.
26
Income Taxes
Estimates and judgments are used in the calculation of certain tax liabilities and in the determination of the recoverability of certain deferred tax assets. In assessing the realizability of deferred tax assets, we consider whether it is more likely than not that some portion or all of the deferred tax assets will not be realized. We regularly evaluate the recoverability of our deferred tax assets and provide valuation allowances to offset portions of deferred tax assets due to uncertainty surrounding the future realization of such deferred tax assets. Valuation allowances are based on historical taxable income, projected future taxable income, the expected timing of the reversals of existing temporary differences, and the implementation of tax-planning strategies. We adjust the valuation allowance in the period we determine it is more likely than not that deferred tax assets will or will not be realized. If a change in circumstances results in a change in our ability to realize our deferred tax assets, our tax provision would be adjusted in the period when the change in circumstances occurs.
Accounting for our income taxes also requires significant judgment in the evaluation of our uncertain tax positions and in the calculation of our provision for income taxes. Accounting standards prescribe a two-step approach to recognizing and measuring uncertain tax positions. The first step is to evaluate available evidence to determine if it appears more likely than not that an uncertain tax position will be sustained on an audit by a taxing authority, based solely on the technical merits of the tax position. The second step is to measure the tax benefit as the largest amount that is more than 50% likely of being realized upon settling the uncertain tax position.
Although we believe we have adequately provided for our uncertain tax positions, the ultimate outcome of these tax matters may differ from our expectations. We adjust our accruals in light of changing facts and circumstances, such as the completion of a tax audit, expiration of a statute of limitations, the refinement of an estimate, and interest accruals associated with uncertain tax positions until they are resolved. To the extent that the final tax outcome of these matters is different than the amounts recorded, such differences will impact the provision for income taxes in the period in which such determination is made.
Our future effective tax rates could be affected by changes in our deferred tax assets or liabilities, the valuation of our uncertain tax positions, or by changes in tax laws, regulations, accounting principles, or interpretations thereof.
27
Reported Operating Data
|
|
Years Ended December 31,
|
||||||||||||||||||||||||
|
($ in millions, except per vehicle data)
|
|
|
2016 vs. 2015
|
|
2015 vs. 2014
|
||||||||||||||||||||
|
2016
|
2015
|
Variance
Favorable /
(Unfavorable)
|
%
Variance
|
2014
|
Variance
Favorable /
(Unfavorable)
|
%
Variance
|
|||||||||||||||||||
|
Revenue:
|
|||||||||||||||||||||||||
|
New vehicle
|
$
|
12,255.8
|
|
$
|
11,995.0
|
|
$
|
260.8
|
|
2.2
|
|
$
|
10,972.2
|
|
$
|
1,022.8
|
|
9.3
|
|
||||||
|
Retail used vehicle
|
4,481.7
|
|
4,370.3
|
|
111.4
|
|
2.5
|
|
3,988.9
|
|
381.4
|
|
9.6
|
|
|||||||||||
|
Wholesale
|
513.6
|
|
398.4
|
|
115.2
|
|
28.9
|
|
396.8
|
|
1.6
|
|
0.4
|
|
|||||||||||
|
Used vehicle
|
4,995.3
|
|
4,768.7
|
|
226.6
|
|
4.8
|
|
4,385.7
|
|
383.0
|
|
8.7
|
|
|||||||||||
|
Finance and insurance, net
|
894.6
|
|
868.7
|
|
25.9
|
|
3.0
|
|
750.8
|
|
117.9
|
|
15.7
|
|
|||||||||||
|
Total variable operations
(1)
|
18,145.7
|
|
17,632.4
|
|
513.3
|
|
2.9
|
|
16,108.7
|
|
1,523.7
|
|
9.5
|
|
|||||||||||
|
Parts and service
|
3,321.4
|
|
3,082.8
|
|
238.6
|
|
7.7
|
|
2,822.5
|
|
260.3
|
|
9.2
|
|
|||||||||||
|
Other
|
141.9
|
|
146.8
|
|
(4.9
|
)
|
177.6
|
|
(30.8
|
)
|
|||||||||||||||
|
Total revenue
|
$
|
21,609.0
|
|
$
|
20,862.0
|
|
$
|
747.0
|
|
3.6
|
|
$
|
19,108.8
|
|
$
|
1,753.2
|
|
9.2
|
|
||||||
|
Gross profit:
|
|||||||||||||||||||||||||
|
New vehicle
|
$
|
635.8
|
|
$
|
673.1
|
|
$
|
(37.3
|
)
|
(5.5
|
)
|
$
|
650.1
|
|
$
|
23.0
|
|
3.5
|
|
||||||
|
Retail used vehicle
|
334.9
|
|
358.4
|
|
(23.5
|
)
|
(6.6
|
)
|
363.2
|
|
(4.8
|
)
|
(1.3
|
)
|
|||||||||||
|
Wholesale
|
(17.3
|
)
|
(4.7
|
)
|
(12.6
|
)
|
(2.6
|
)
|
(2.1
|
)
|
|||||||||||||||
|
Used vehicle
|
317.6
|
|
353.7
|
|
(36.1
|
)
|
(10.2
|
)
|
360.6
|
|
(6.9
|
)
|
(1.9
|
)
|
|||||||||||
|
Finance and insurance
|
894.6
|
|
868.7
|
|
25.9
|
|
3.0
|
|
750.8
|
|
117.9
|
|
15.7
|
|
|||||||||||
|
Total variable operations
(1)
|
1,848.0
|
|
1,895.5
|
|
(47.5
|
)
|
(2.5
|
)
|
1,761.5
|
|
134.0
|
|
7.6
|
|
|||||||||||
|
Parts and service
|
1,434.7
|
|
1,338.0
|
|
96.7
|
|
7.2
|
|
1,196.6
|
|
141.4
|
|
11.8
|
|
|||||||||||
|
Other
|
30.5
|
|
28.0
|
|
2.5
|
|
30.6
|
|
(2.6
|
)
|
|||||||||||||||
|
Total gross profit
|
3,313.2
|
|
3,261.5
|
|
51.7
|
|
1.6
|
|
2,988.7
|
|
272.8
|
|
9.1
|
|
|||||||||||
|
Selling, general, and administrative expenses
|
2,349.4
|
|
2,263.5
|
|
(85.9
|
)
|
(3.8
|
)
|
2,079.6
|
|
(183.9
|
)
|
(8.8
|
)
|
|||||||||||
|
Depreciation and amortization
|
143.4
|
|
127.4
|
|
(16.0
|
)
|
106.9
|
|
(20.5
|
)
|
|||||||||||||||
|
Franchise rights impairment
|
—
|
|
15.4
|
|
15.4
|
|
—
|
|
(15.4
|
)
|
|||||||||||||||
|
Other income, net
|
(69.1
|
)
|
(17.9
|
)
|
51.2
|
|
(18.6
|
)
|
(0.7
|
)
|
|||||||||||||||
|
Operating income
|
889.5
|
|
873.1
|
|
16.4
|
|
1.9
|
|
820.8
|
|
52.3
|
|
6.4
|
|
|||||||||||
|
Non-operating income (expense) items:
|
|||||||||||||||||||||||||
|
Floorplan interest expense
|
(76.5
|
)
|
(58.3
|
)
|
(18.2
|
)
|
(53.3
|
)
|
(5.0
|
)
|
|||||||||||||||
|
Other interest expense
|
(115.5
|
)
|
(90.9
|
)
|
(24.6
|
)
|
(86.7
|
)
|
(4.2
|
)
|
|||||||||||||||
|
Loss on debt extinguishment
|
—
|
|
—
|
|
—
|
|
(1.6
|
)
|
1.6
|
|
|||||||||||||||
|
Interest income
|
1.1
|
|
0.1
|
|
1.0
|
|
0.2
|
|
(0.1
|
)
|
|||||||||||||||
|
Other income (loss), net
|
3.7
|
|
(1.3
|
)
|
5.0
|
|
2.9
|
|
(4.2
|
)
|
|||||||||||||||
|
Income from continuing operations before income taxes
|
$
|
702.3
|
|
$
|
722.7
|
|
$
|
(20.4
|
)
|
(2.8
|
)
|
$
|
682.3
|
|
$
|
40.4
|
|
5.9
|
|
||||||
|
Retail vehicle unit sales:
|
|||||||||||||||||||||||||
|
New vehicle
|
337,622
|
|
339,080
|
|
(1,458
|
)
|
(0.4
|
)
|
318,008
|
|
21,072
|
|
6.6
|
|
|||||||||||
|
Used vehicle
|
225,713
|
|
227,290
|
|
(1,577
|
)
|
(0.7
|
)
|
214,910
|
|
12,380
|
|
5.8
|
|
|||||||||||
|
563,335
|
|
566,370
|
|
(3,035
|
)
|
(0.5
|
)
|
532,918
|
|
33,452
|
|
6.3
|
|
||||||||||||
|
Revenue per vehicle retailed:
|
|||||||||||||||||||||||||
|
New vehicle
|
$
|
36,300
|
|
$
|
35,375
|
|
$
|
925
|
|
2.6
|
|
$
|
34,503
|
|
$
|
872
|
|
2.5
|
|
||||||
|
Used vehicle
|
$
|
19,856
|
|
$
|
19,228
|
|
$
|
628
|
|
3.3
|
|
$
|
18,561
|
|
$
|
667
|
|
3.6
|
|
||||||
|
Gross profit per vehicle retailed:
|
|||||||||||||||||||||||||
|
New vehicle
|
$
|
1,883
|
|
$
|
1,985
|
|
$
|
(102
|
)
|
(5.1
|
)
|
$
|
2,044
|
|
$
|
(59
|
)
|
(2.9
|
)
|
||||||
|
Used vehicle
|
$
|
1,484
|
|
$
|
1,577
|
|
$
|
(93
|
)
|
(5.9
|
)
|
$
|
1,690
|
|
$
|
(113
|
)
|
(6.7
|
)
|
||||||
|
Finance and insurance
|
$
|
1,588
|
|
$
|
1,534
|
|
$
|
54
|
|
3.5
|
|
$
|
1,409
|
|
$
|
125
|
|
8.9
|
|
||||||
|
Total variable operations
(2)
|
$
|
3,311
|
|
$
|
3,355
|
|
$
|
(44
|
)
|
(1.3
|
)
|
$
|
3,310
|
|
$
|
45
|
|
1.4
|
|
||||||
|
(1)
Total variable operations includes new vehicle, used vehicle (retail and wholesale), and finance and insurance results.
|
|||||||||||||||||||||||||
|
(2)
Total variable operations gross profit per vehicle retailed is calculated by dividing the sum of new vehicle, retail used vehicle, and finance and insurance gross profit by total retail vehicle unit sales.
|
|||||||||||||||||||||||||
28
|
|
Years Ended December 31,
|
||||
|
|
2016 (%)
|
2015 (%)
|
2014 (%)
|
||
|
Revenue mix percentages:
|
|||||
|
New vehicle
|
56.7
|
57.5
|
57.4
|
||
|
Used vehicle
|
23.1
|
22.9
|
23.0
|
||
|
Parts and service
|
15.4
|
14.8
|
14.8
|
||
|
Finance and insurance, net
|
4.1
|
4.2
|
3.9
|
||
|
Other
|
0.7
|
0.6
|
0.9
|
||
|
Total
|
100.0
|
100.0
|
100.0
|
||
|
Gross profit mix percentages:
|
|||||
|
New vehicle
|
19.2
|
20.6
|
21.8
|
||
|
Used vehicle
|
9.6
|
10.8
|
12.1
|
||
|
Parts and service
|
43.3
|
41.0
|
40.0
|
||
|
Finance and insurance
|
27.0
|
26.6
|
25.1
|
||
|
Other
|
0.9
|
1.0
|
1.0
|
||
|
Total
|
100.0
|
100.0
|
100.0
|
||
|
Operating items as a percentage of revenue:
|
|||||
|
Gross profit:
|
|||||
|
New vehicle
|
5.2
|
5.6
|
5.9
|
||
|
Used vehicle-retail
|
7.5
|
8.2
|
9.1
|
||
|
Parts and service
|
43.2
|
43.4
|
42.4
|
||
|
Total
|
15.3
|
15.6
|
15.6
|
||
|
Selling, general, and administrative expenses
|
10.9
|
10.8
|
10.9
|
||
|
Operating income
|
4.1
|
4.2
|
4.3
|
||
|
Other operating items as a percentage of total gross profit:
|
|||||
|
Selling, general, and administrative expenses
|
70.9
|
69.4
|
69.6
|
||
|
Operating income
|
26.8
|
26.8
|
27.5
|
||
|
|
December 31,
|
|
|||
|
|
2016
|
2015
|
|
||
|
Days supply:
|
|||||
|
New vehicle (industry standard of selling days)
|
61 days
|
68 days
|
|||
|
Used vehicle (trailing calendar month days)
|
44 days
|
43 days
|
|||
29
Same Store Operating Data
We have presented below our operating results on a same store basis to reflect our internal performance. The “Same Store” amounts presented below include the results of our stores for the identical months in each period presented in the comparison, commencing with the first full month in which the store was owned by us. For example, the results for a store acquired in February
2015
would be included only in our same store comparison of
2016
to
2015
, not in our same store comparison of
2015
to
2014
. Therefore, the amounts presented in the year
2015
column that is being compared to the year
2016
column may differ from the amounts presented in the year
2015
column that is being compared to the year
2014
column.
|
|
Years Ended December 31,
|
Years Ended December 31,
|
|||||||||||||||||||||||||||
|
($ in millions, except per vehicle data)
|
2016
|
2015
|
Variance
Favorable /
(Unfavorable)
|
%
Variance
|
2015
|
2014
|
Variance
Favorable /
(Unfavorable)
|
%
Variance
|
|||||||||||||||||||||
|
Revenue:
|
|||||||||||||||||||||||||||||
|
New vehicle
|
$
|
11,288.4
|
|
$
|
11,605.0
|
|
$
|
(316.6
|
)
|
(2.7
|
)
|
$
|
11,576.5
|
|
$
|
10,885.3
|
|
$
|
691.2
|
|
6.3
|
|
|||||||
|
Retail used vehicle
|
4,123.5
|
|
4,201.1
|
|
(77.6
|
)
|
(1.8
|
)
|
4,209.2
|
|
3,957.8
|
|
251.4
|
|
6.4
|
|
|||||||||||||
|
Wholesale
|
471.5
|
|
387.4
|
|
84.1
|
|
21.7
|
|
390.7
|
|
395.0
|
|
(4.3
|
)
|
(1.1
|
)
|
|||||||||||||
|
Used vehicle
|
4,595.0
|
|
4,588.5
|
|
6.5
|
|
0.1
|
|
4,599.9
|
|
4,352.8
|
|
247.1
|
|
5.7
|
|
|||||||||||||
|
Finance and insurance, net
|
834.6
|
|
841.4
|
|
(6.8
|
)
|
(0.8
|
)
|
846.1
|
|
745.6
|
|
100.5
|
|
13.5
|
|
|||||||||||||
|
Total variable operations
(1)
|
16,718.0
|
|
17,034.9
|
|
(316.9
|
)
|
(1.9
|
)
|
17,022.5
|
|
15,983.7
|
|
1,038.8
|
|
6.5
|
|
|||||||||||||
|
Parts and service
|
3,054.2
|
|
2,966.2
|
|
88.0
|
|
3.0
|
|
2,973.3
|
|
2,793.1
|
|
180.2
|
|
6.5
|
|
|||||||||||||
|
Other
|
141.6
|
|
146.1
|
|
(4.5
|
)
|
146.7
|
|
176.3
|
|
(29.6
|
)
|
|||||||||||||||||
|
Total revenue
|
$
|
19,913.8
|
|
$
|
20,147.2
|
|
$
|
(233.4
|
)
|
(1.2
|
)
|
$
|
20,142.5
|
|
$
|
18,953.1
|
|
$
|
1,189.4
|
|
6.3
|
|
|||||||
|
Gross profit:
|
|||||||||||||||||||||||||||||
|
New vehicle
|
$
|
590.2
|
|
$
|
656.2
|
|
$
|
(66.0
|
)
|
(10.1
|
)
|
$
|
642.7
|
|
$
|
646.0
|
|
$
|
(3.3
|
)
|
(0.5
|
)
|
|||||||
|
Retail used vehicle
|
311.5
|
|
345.9
|
|
(34.4
|
)
|
(9.9
|
)
|
346.3
|
|
359.6
|
|
(13.3
|
)
|
(3.7
|
)
|
|||||||||||||
|
Wholesale
|
(15.0
|
)
|
(4.3
|
)
|
(10.7
|
)
|
(4.7
|
)
|
(2.2
|
)
|
(2.5
|
)
|
|||||||||||||||||
|
Used vehicle
|
296.5
|
|
341.6
|
|
(45.1
|
)
|
(13.2
|
)
|
341.6
|
|
357.4
|
|
(15.8
|
)
|
(4.4
|
)
|
|||||||||||||
|
Finance and insurance
|
834.6
|
|
841.4
|
|
(6.8
|
)
|
(0.8
|
)
|
846.1
|
|
745.6
|
|
100.5
|
|
13.5
|
|
|||||||||||||
|
Total variable operations
(1)
|
1,721.3
|
|
1,839.2
|
|
(117.9
|
)
|
(6.4
|
)
|
1,830.4
|
|
1,749.0
|
|
81.4
|
|
4.7
|
|
|||||||||||||
|
Parts and service
|
1,324.3
|
|
1,286.5
|
|
37.8
|
|
2.9
|
|
1,285.7
|
|
1,182.5
|
|
103.2
|
|
8.7
|
|
|||||||||||||
|
Other
|
28.0
|
|
26.7
|
|
1.3
|
|
27.1
|
|
30.2
|
|
(3.1
|
)
|
|||||||||||||||||
|
Total gross profit
|
$
|
3,073.6
|
|
$
|
3,152.4
|
|
$
|
(78.8
|
)
|
(2.5
|
)
|
$
|
3,143.2
|
|
$
|
2,961.7
|
|
$
|
181.5
|
|
6.1
|
|
|||||||
|
Retail vehicle unit sales:
|
|||||||||||||||||||||||||||||
|
New vehicle
|
310,351
|
|
326,306
|
|
(15,955
|
)
|
(4.9
|
)
|
329,431
|
|
314,683
|
|
14,748
|
|
4.7
|
|
|||||||||||||
|
Used vehicle
|
206,365
|
|
216,628
|
|
(10,263
|
)
|
(4.7
|
)
|
220,538
|
|
212,731
|
|
7,807
|
|
3.7
|
|
|||||||||||||
|
Total
|
516,716
|
|
542,934
|
|
(26,218
|
)
|
(4.8
|
)
|
549,969
|
|
527,414
|
|
22,555
|
|
4.3
|
|
|||||||||||||
|
Revenue per vehicle retailed:
|
|||||||||||||||||||||||||||||
|
New vehicle
|
$
|
36,373
|
|
$
|
35,565
|
|
$
|
808
|
|
2.3
|
|
$
|
35,141
|
|
$
|
34,591
|
|
$
|
550
|
|
1.6
|
|
|||||||
|
Used vehicle
|
$
|
19,982
|
|
$
|
19,393
|
|
$
|
589
|
|
3.0
|
|
$
|
19,086
|
|
$
|
18,605
|
|
$
|
481
|
|
2.6
|
|
|||||||
|
Gross profit per vehicle retailed:
|
|||||||||||||||||||||||||||||
|
New vehicle
|
$
|
1,902
|
|
$
|
2,011
|
|
$
|
(109
|
)
|
(5.4
|
)
|
$
|
1,951
|
|
$
|
2,053
|
|
$
|
(102
|
)
|
(5.0
|
)
|
|||||||
|
Used vehicle
|
$
|
1,509
|
|
$
|
1,597
|
|
$
|
(88
|
)
|
(5.5
|
)
|
$
|
1,570
|
|
$
|
1,690
|
|
$
|
(120
|
)
|
(7.1
|
)
|
|||||||
|
Finance and insurance
|
$
|
1,615
|
|
$
|
1,550
|
|
$
|
65
|
|
4.2
|
|
$
|
1,538
|
|
$
|
1,414
|
|
$
|
124
|
|
8.8
|
|
|||||||
|
Total variable operations
(2)
|
$
|
3,360
|
|
$
|
3,395
|
|
$
|
(35
|
)
|
(1.0
|
)
|
$
|
3,337
|
|
$
|
3,320
|
|
$
|
17
|
|
0.5
|
|
|||||||
|
(1)
Total variable operations includes new vehicle, used vehicle (retail and wholesale), and finance and insurance results.
|
|||||||||||||||||||||||||||||
|
(2)
Total variable operations gross profit per vehicle retailed is calculated by dividing the sum of new vehicle, retail used vehicle, and finance and insurance gross profit by total retail vehicle unit sales.
|
|||||||||||||||||||||||||||||
30
|
|
Years Ended December 31,
|
Years Ended December 31,
|
|||||
|
|
2016 (%)
|
2015 (%)
|
2015 (%)
|
2014 (%)
|
|||
|
Revenue mix percentages:
|
|||||||
|
New vehicle
|
56.7
|
57.6
|
57.5
|
57.4
|
|||
|
Used vehicle
|
23.1
|
22.8
|
22.8
|
23.0
|
|||
|
Parts and service
|
15.3
|
14.7
|
14.8
|
14.7
|
|||
|
Finance and insurance, net
|
4.2
|
4.2
|
4.2
|
3.9
|
|||
|
Other
|
0.7
|
0.7
|
0.7
|
1.0
|
|||
|
Total
|
100.0
|
100.0
|
100.0
|
100.0
|
|||
|
Gross profit mix percentages:
|
|||||||
|
New vehicle
|
19.2
|
20.8
|
20.4
|
21.8
|
|||
|
Used vehicle
|
9.6
|
10.8
|
10.9
|
12.1
|
|||
|
Parts and service
|
43.1
|
40.8
|
40.9
|
39.9
|
|||
|
Finance and insurance
|
27.2
|
26.7
|
26.9
|
25.2
|
|||
|
Other
|
0.9
|
0.9
|
0.9
|
1.0
|
|||
|
Total
|
100.0
|
100.0
|
100.0
|
100.0
|
|||
|
Operating items as a percentage of revenue:
|
|||||||
|
Gross profit:
|
|||||||
|
New vehicle
|
5.2
|
5.7
|
5.6
|
5.9
|
|||
|
Used vehicle-retail
|
7.6
|
8.2
|
8.2
|
9.1
|
|||
|
Parts and service
|
43.4
|
43.4
|
43.2
|
42.3
|
|||
|
Total
|
15.4
|
15.6
|
15.6
|
15.6
|
|||
31
New Vehicle
|
|
Years Ended December 31,
|
||||||||||||||||||||||||
|
($ in millions, except per vehicle data)
|
2016
|
2015
|
2016 vs. 2015
|
|
2015 vs. 2014
|
||||||||||||||||||||
|
Variance
Favorable /
(Unfavorable)
|
%
Variance
|
2014
|
Variance
Favorable /
(Unfavorable)
|
%
Variance
|
|||||||||||||||||||||
|
Reported:
|
|||||||||||||||||||||||||
|
Revenue
|
$
|
12,255.8
|
|
$
|
11,995.0
|
|
$
|
260.8
|
|
2.2
|
|
$
|
10,972.2
|
|
$
|
1,022.8
|
|
9.3
|
|
||||||
|
Gross profit
|
$
|
635.8
|
|
$
|
673.1
|
|
$
|
(37.3
|
)
|
(5.5
|
)
|
$
|
650.1
|
|
$
|
23.0
|
|
3.5
|
|
||||||
|
Retail vehicle unit sales
|
337,622
|
|
339,080
|
|
(1,458
|
)
|
(0.4
|
)
|
318,008
|
|
21,072
|
|
6.6
|
|
|||||||||||
|
Revenue per vehicle retailed
|
$
|
36,300
|
|
$
|
35,375
|
|
$
|
925
|
|
2.6
|
|
$
|
34,503
|
|
$
|
872
|
|
2.5
|
|
||||||
|
Gross profit per vehicle retailed
|
$
|
1,883
|
|
$
|
1,985
|
|
$
|
(102
|
)
|
(5.1
|
)
|
$
|
2,044
|
|
$
|
(59
|
)
|
(2.9
|
)
|
||||||
|
Gross profit as a percentage of revenue
|
5.2
|
%
|
5.6
|
%
|
5.9
|
%
|
|||||||||||||||||||
|
Days supply (industry standard of selling days)
|
61 days
|
|
68 days
|
|
|||||||||||||||||||||
|
|
Years Ended December 31,
|
||||||||||||||||||||||||||||
|
|
2016
|
2015
|
2016 vs. 2015
|
2015
|
2014
|
2015 vs. 2014
|
|||||||||||||||||||||||
|
Variance
Favorable /
(Unfavorable)
|
%
Variance
|
Variance
Favorable /
(Unfavorable)
|
%
Variance
|
||||||||||||||||||||||||||
|
Same Store:
|
|||||||||||||||||||||||||||||
|
Revenue
|
$
|
11,288.4
|
|
$
|
11,605.0
|
|
$
|
(316.6
|
)
|
(2.7
|
)
|
$
|
11,576.5
|
|
$
|
10,885.3
|
|
$
|
691.2
|
|
6.3
|
|
|||||||
|
Gross profit
|
$
|
590.2
|
|
$
|
656.2
|
|
$
|
(66.0
|
)
|
(10.1
|
)
|
$
|
642.7
|
|
$
|
646.0
|
|
$
|
(3.3
|
)
|
(0.5
|
)
|
|||||||
|
Retail vehicle unit sales
|
310,351
|
|
326,306
|
|
(15,955
|
)
|
(4.9
|
)
|
329,431
|
|
314,683
|
|
14,748
|
|
4.7
|
|
|||||||||||||
|
Revenue per vehicle retailed
|
$
|
36,373
|
|
$
|
35,565
|
|
$
|
808
|
|
2.3
|
|
$
|
35,141
|
|
$
|
34,591
|
|
$
|
550
|
|
1.6
|
|
|||||||
|
Gross profit per vehicle retailed
|
$
|
1,902
|
|
$
|
2,011
|
|
$
|
(109
|
)
|
(5.4
|
)
|
$
|
1,951
|
|
$
|
2,053
|
|
$
|
(102
|
)
|
(5.0
|
)
|
|||||||
|
Gross profit as a percentage of revenue
|
5.2
|
%
|
5.7
|
%
|
5.6
|
%
|
5.9
|
%
|
|||||||||||||||||||||
The following discussion of new vehicles is on a same store basis. The difference between reported amounts and same store amounts in the above tables of
$967.4 million
,
$390.0 million
, and
$86.9 million
in new vehicle revenue and
$45.6 million
,
$16.9 million
, and
$4.1 million
in new vehicle gross profit for
2016
,
2015
, and
2014
, respectively, is related to acquisition and divestiture activity.
2016
compared to
2015
Same store new vehicle revenue
decreased
during
2016
, as compared to
2015
as a result of a decrease in same store unit volume, partially offset by an increase in revenue PVR. The decrease in same store unit volume was primarily due to
c
ertain manufacturers’ disruptive
marketing and sales incentive programs
, which resulted in a more competitive automotive retail environment.
Same store revenue PVR during
2016
benefited from an increase in the average selling prices for vehicles in all three segments, as well as lower average fuel prices, which caused a shift in mix toward larger vehicles, such as trucks and sport utility vehicles, that have relatively higher average selling prices.
Same store gross profit PVR decreased during
2016
, as compared to
2015
, primarily due to the disruptive manufacturer
marketing and sales incentive programs described above
, which resulted in a more competitive automotive retail environment.
2015
compared to
2014
Same store new vehicle revenue increased during
2015
, as compared to
2014
, as a result of increases in same store unit volume and revenue PVR. The increase in same store unit volume was primarily due to replacement demand and improved
32
market conditions, including increased consumer borrowing and confidence. New product offerings from certain automotive manufacturers also favorably impacted same store unit volume.
Same store revenue PVR during
2015
benefited from an increase in the average selling prices for Domestic and Import vehicles, partially offset by a decrease in the average selling price for Premium Luxury vehicles. Same store revenue PVR also benefited from a shift in mix away from Import vehicles, which have relatively lower average selling prices. In addition, same store revenue PVR benefited from lower average fuel prices, which caused a shift in mix toward larger vehicles, such as trucks and sport utility vehicles, that have relatively higher average selling prices.
Same store gross profit PVR decreased during
2015
, as compared to
2014
, primarily due to decreases in gross profit PVR for vehicles at our Premium Luxury and Import stores due to increased inventory levels and changes in manufacturer incentive programs, as well as a competitive automotive retail environment. During the fourth quarter of 2015, we experienced greater compression in our new vehicle gross profit PVR due to these factors.
Net New Vehicle Inventory Carrying Benefit
The following table details net new vehicle inventory carrying benefit, consisting of new vehicle floorplan interest expense net of floorplan assistance earned (amounts received from manufacturers specifically to support store financing of new vehicle inventory). Floorplan assistance is accounted for as a component of new vehicle gross profit in accordance with generally accepted accounting principles.
|
|
Years Ended December 31,
|
||||||||||||||||||
|
($ in millions)
|
2016
|
2015
|
Variance 2016 vs. 2015
|
2014
|
Variance 2015 vs. 2014
|
||||||||||||||
|
Floorplan assistance
|
$
|
124.0
|
|
$
|
117.8
|
|
$
|
6.2
|
|
$
|
106.2
|
|
$
|
11.6
|
|
||||
|
New vehicle floorplan interest expense
|
(71.5
|
)
|
(55.3
|
)
|
(16.2
|
)
|
(50.6
|
)
|
(4.7
|
)
|
|||||||||
|
Net new vehicle inventory carrying benefit
|
$
|
52.5
|
|
$
|
62.5
|
|
$
|
(10.0
|
)
|
$
|
55.6
|
|
$
|
6.9
|
|
||||
2016
compared to
2015
The net new vehicle inventory carrying benefit
decreased
in
2016
, as compared to
2015
, primarily due to an increase in floorplan interest expense, partially offset by an increase in floorplan assistance. Floorplan interest expense increased due to higher average vehicle floorplan payable balances during the year, which was due in part to the acquisitions we completed in 2016 and 2015, and higher interest rates. Floorplan assistance increased due to an increase in the floorplan assistance rate per unit and benefited from the acquisitions we completed in 2016 and 2015.
2015
compared to
2014
The net new vehicle inventory carrying benefit increased in
2015
, as compared to
2014
, primarily due to an increase in floorplan assistance, partially offset by an increase in floorplan interest expense. Floorplan assistance increased due to higher new vehicle sales and an increase in the floorplan assistance rate per unit. Floorplan interest expense increased due to higher average vehicle floorplan payable balances during the year.
New Vehicle Inventories
Our new vehicle inventories were
$2.8 billion
or
61 days
supply at December 31,
2016
, as compared to new vehicle inventories of
$2.9 billion
or
68 days
supply at December 31,
2015
. We had
75,117
units in new vehicle inventory at December 31,
2016
, and
80,442
units at December 31,
2015
. The decrease in new vehicle inventory days supply at
December 31, 2016
, as compared to
December 31, 2015
, is primarily due to steps we have taken to align our inventory in response to the current market conditions.
33
Used Vehicle
|
|
Years Ended December 31,
|
||||||||||||||||||||||||
|
|
|
2016 vs. 2015
|
|
2015 vs. 2014
|
|||||||||||||||||||||
|
($ in millions, except per vehicle data)
|
2016
|
2015
|
Variance
Favorable /
(Unfavorable)
|
%
Variance
|
2014
|
Variance
Favorable /
(Unfavorable)
|
%
Variance
|
||||||||||||||||||
|
Reported:
|
|||||||||||||||||||||||||
|
Retail revenue
|
$
|
4,481.7
|
|
$
|
4,370.3
|
|
$
|
111.4
|
|
2.5
|
|
$
|
3,988.9
|
|
$
|
381.4
|
|
9.6
|
|
||||||
|
Wholesale revenue
|
513.6
|
|
398.4
|
|
115.2
|
|
28.9
|
|
396.8
|
|
1.6
|
|
0.4
|
|
|||||||||||
|
Total revenue
|
$
|
4,995.3
|
|
$
|
4,768.7
|
|
$
|
226.6
|
|
4.8
|
|
$
|
4,385.7
|
|
$
|
383.0
|
|
8.7
|
|
||||||
|
Retail gross profit
|
$
|
334.9
|
|
$
|
358.4
|
|
$
|
(23.5
|
)
|
(6.6
|
)
|
$
|
363.2
|
|
$
|
(4.8
|
)
|
(1.3
|
)
|
||||||
|
Wholesale loss
|
(17.3
|
)
|
(4.7
|
)
|
(12.6
|
)
|
(2.6
|
)
|
(2.1
|
)
|
|||||||||||||||
|
Total gross profit
|
$
|
317.6
|
|
$
|
353.7
|
|
$
|
(36.1
|
)
|
(10.2
|
)
|
$
|
360.6
|
|
$
|
(6.9
|
)
|
(1.9
|
)
|
||||||
|
Retail vehicle unit sales
|
225,713
|
|
227,290
|
|
(1,577
|
)
|
(0.7
|
)
|
214,910
|
|
12,380
|
|
5.8
|
|
|||||||||||
|
Revenue per vehicle retailed
|
$
|
19,856
|
|
$
|
19,228
|
|
$
|
628
|
|
3.3
|
|
$
|
18,561
|
|
$
|
667
|
|
3.6
|
|
||||||
|
Gross profit per vehicle retailed
|
$
|
1,484
|
|
$
|
1,577
|
|
$
|
(93
|
)
|
(5.9
|
)
|
$
|
1,690
|
|
$
|
(113
|
)
|
(6.7
|
)
|
||||||
|
Gross profit as a percentage of retail revenue
|
7.5
|
%
|
8.2
|
%
|
9.1
|
%
|
|||||||||||||||||||
|
Days supply (trailing calendar month days)
|
44 days
|
|
43 days
|
|
|||||||||||||||||||||
|
|
Years Ended December 31,
|
||||||||||||||||||||||||||||
|
|
2016
|
2015
|
2016 vs. 2015
|
2015
|
2014
|
2015 vs. 2014
|
|||||||||||||||||||||||
|
|
Variance
Favorable /
(Unfavorable)
|
%
Variance
|
Variance
Favorable /
(Unfavorable)
|
%
Variance
|
|||||||||||||||||||||||||
|
Same Store:
|
|||||||||||||||||||||||||||||
|
Retail revenue
|
$
|
4,123.5
|
|
$
|
4,201.1
|
|
$
|
(77.6
|
)
|
(1.8
|
)
|
$
|
4,209.2
|
|
$
|
3,957.8
|
|
$
|
251.4
|
|
6.4
|
|
|||||||
|
Wholesale revenue
|
471.5
|
|
387.4
|
|
84.1
|
|
21.7
|
|
390.7
|
|
395.0
|
|
(4.3
|
)
|
(1.1
|
)
|
|||||||||||||
|
Total revenue
|
$
|
4,595.0
|
|
$
|
4,588.5
|
|
$
|
6.5
|
|
0.1
|
|
$
|
4,599.9
|
|
$
|
4,352.8
|
|
$
|
247.1
|
|
5.7
|
|
|||||||
|
Retail gross profit
|
$
|
311.5
|
|
$
|
345.9
|
|
$
|
(34.4
|
)
|
(9.9
|
)
|
$
|
346.3
|
|
$
|
359.6
|
|
$
|
(13.3
|
)
|
(3.7
|
)
|
|||||||
|
Wholesale loss
|
(15.0
|
)
|
(4.3
|
)
|
(10.7
|
)
|
(4.7
|
)
|
(2.2
|
)
|
(2.5
|
)
|
|||||||||||||||||
|
Total gross profit
|
$
|
296.5
|
|
$
|
341.6
|
|
$
|
(45.1
|
)
|
(13.2
|
)
|
$
|
341.6
|
|
$
|
357.4
|
|
$
|
(15.8
|
)
|
(4.4
|
)
|
|||||||
|
Retail vehicle unit sales
|
206,365
|
|
216,628
|
|
(10,263
|
)
|
(4.7
|
)
|
220,538
|
|
212,731
|
|
7,807
|
|
3.7
|
|
|||||||||||||
|
Revenue per vehicle retailed
|
$
|
19,982
|
|
$
|
19,393
|
|
$
|
589
|
|
3.0
|
|
$
|
19,086
|
|
$
|
18,605
|
|
$
|
481
|
|
2.6
|
|
|||||||
|
Gross profit per vehicle retailed
|
$
|
1,509
|
|
$
|
1,597
|
|
$
|
(88
|
)
|
(5.5
|
)
|
$
|
1,570
|
|
$
|
1,690
|
|
$
|
(120
|
)
|
(7.1
|
)
|
|||||||
|
Gross profit as a percentage of retail revenue
|
7.6
|
%
|
8.2
|
%
|
8.2
|
%
|
9.1
|
%
|
|||||||||||||||||||||
The following discussion of used vehicles is on a same store basis. The difference between reported amounts and same store amounts in the above tables of
$358.2 million
,
$169.2 million
, and
$31.1 million
in retail used vehicle revenue and
$23.4 million
,
$12.5 million
, and
$3.6 million
in retail used vehicle gross profit for
2016
,
2015
, and
2014
, respectively, is related to acquisition and divestiture activity.
2016
compared to
2015
Same store retail used vehicle revenue
decreased
during
2016
, as compared to
2015
, as a result of a decrease in same store unit volume, partially offset by an increase in revenue PVR. The decrease in same store unit volume was driven by a competitive automotive retail environment, as well as a decrease in trade-in volume associated with the decrease in new vehicle sales, partially offset by an increase in sales of certified pre-owned vehicles. Same store unit volume was also
34
adversely impacted by manufacturer safety recalls, including the Takata airbag inflator recall, and the application of our previous open safety recall policy. Effective in the fourth quarter of 2016, we modified our recall policy to permit the retail sale of certain used vehicles with an open recall, where parts are not available to complete the recall and full disclosure is made to the purchaser.
Same store revenue PVR benefited from an increase in the average selling price of used vehicles for all three segments, and a shift in mix toward Premium Luxury vehicles and the increase in sales of certified pre-owned vehicles, both of which have relatively higher average selling prices.
Same store gross profit PVR
decreased
during
2016
, as compared to
2015
, primarily due to margin pressure resulting from new vehicle gross profit PVR compression during the same period combined with the application of our previous open safety recall policy.
2015
compared to
2014
Same store retail used vehicle revenue increased during
2015
, as compared to
2014
, due to increases in same store unit volume and revenue PVR. Same store unit volume was driven by an increase in sales of certified pre-owned vehicles, as well as an increase in trade-in volume associated with new vehicle sales.
Same store revenue PVR benefited from an increase in the average selling price of used vehicles at our Domestic, Import, and Premium Luxury stores, and an increase in sales of certified pre-owned vehicles, which have relatively higher average selling prices.
Same store gross profit PVR decreased during
2015
, as compared to
2014
, primarily due to compressed gross profit PVRs for certified pre-owned vehicles, particularly in our Premium Luxury segment. During the fourth quarter of 2015, we experienced greater compression in our used vehicle gross profit PVR, which was largely a result of gross profit PVR compression for new vehicles during the same period.
Used Vehicle Inventories
Used vehicle inventories were
$559.1 million
or
44 days
supply at
December 31, 2016
, compared to
$539.7 million
or
43 days
supply at
December 31, 2015
. We had
36,678
units in used vehicle inventory at
December 31, 2016
, and
36,299
units at
December 31, 2015
.
35
Parts & Service
|
|
Years Ended December 31,
|
||||||||||||||||||||||
|
|
|
2016 vs. 2015
|
|
2015 vs. 2014
|
|||||||||||||||||||
|
($ in millions)
|
2016
|
2015
|
Variance
Favorable /
(Unfavorable)
|
%
Variance
|
2014
|
Variance
Favorable /
(Unfavorable)
|
%
Variance
|
||||||||||||||||
|
Reported:
|
|||||||||||||||||||||||
|
Revenue
|
$
|
3,321.4
|
|
$
|
3,082.8
|
|
$
|
238.6
|
|
7.7
|
$
|
2,822.5
|
|
$
|
260.3
|
|
9.2
|
||||||
|
Gross profit
|
$
|
1,434.7
|
|
$
|
1,338.0
|
|
$
|
96.7
|
|
7.2
|
$
|
1,196.6
|
|
$
|
141.4
|
|
11.8
|
||||||
|
Gross profit as a percentage of revenue
|
43.2
|
%
|
43.4
|
%
|
42.4
|
%
|
|||||||||||||||||
|
|
Years Ended December 31,
|
||||||||||||||||||||||||||
|
|
|
|
2016 vs. 2015
|
|
|
2015 vs. 2014
|
|||||||||||||||||||||
|
|
2016
|
2015
|
Variance
Favorable /
(Unfavorable)
|
%
Variance
|
2015
|
2014
|
Variance
Favorable /
(Unfavorable)
|
%
Variance
|
|||||||||||||||||||
|
Same Store:
|
|||||||||||||||||||||||||||
|
Revenue
|
$
|
3,054.2
|
|
$
|
2,966.2
|
|
$
|
88.0
|
|
3.0
|
$
|
2,973.3
|
|
$
|
2,793.1
|
|
$
|
180.2
|
|
6.5
|
|||||||
|
Gross profit
|
$
|
1,324.3
|
|
$
|
1,286.5
|
|
$
|
37.8
|
|
2.9
|
$
|
1,285.7
|
|
$
|
1,182.5
|
|
$
|
103.2
|
|
8.7
|
|||||||
|
Gross profit as a percentage of revenue
|
43.4
|
%
|
43.4
|
%
|
43.2
|
%
|
42.3
|
%
|
|||||||||||||||||||
Parts and service revenue is primarily derived from vehicle repairs paid directly by customers or via reimbursement from manufacturers and others under warranty programs, as well as from wholesale parts sales and collision businesses.
The following discussion of parts and service is on a same store basis. The difference between reported amounts and same store amounts in the above tables of
$267.2 million
,
$116.6 million
, and
$29.4 million
in parts and service revenue and
$110.4 million
,
$51.5 million
, and
$14.1 million
in parts and service gross profit for
2016
,
2015
, and
2014
, respectively, is related to acquisition and divestiture activity.
2016
compared to
2015
Same store parts and service gross profit
increased
during
2016
, as compared to
2015
, primarily due to increases in gross profit associated with customer-pay service of
$28.8 million
and warranty of
$23.4 million
, partially offset by a decrease in gross profit associated with the preparation of vehicles for sale of
$8.1 million
.
Customer-pay service gross profit benefited from improved operational execution and margin performance, as well as increased volume due to the increase in units in operation in our primary service base. Warranty gross profit benefited from an increase in volume, driven by the increase in units in operation in our primary service base. Gross profit associated with the preparation of vehicles for sale was adversely impacted by the decrease in new and used vehicle unit volume.
See “Strategic Initiatives” above for a discussion of our brand extension strategy, which includes the launch of AutoNation USA stand-alone used vehicles sales and service centers, the launch of AutoNation branded parts and accessories, and the expansion of AutoNation branded collision centers.
2015
compared to
2014
Same store parts and service gross profit increased during
2015
, as compared to
2014
, primarily due to increases in gross profit associated with customer-pay service of $33.9 million, warranty of $28.1 million, the preparation of vehicles for sale of $22.6 million, and collision business of $12.5 million.
Customer-pay service gross profit benefited from improved operational execution and margin performance, as well as increased volume due to the increase in units in operation in our primary service base. Warranty gross profit also benefited from an increase in volume, driven by the increase in units in operation in our primary service base, as well as elevated
36
manufacturer recall activity. Gross profit associated with the preparation of vehicles for sale benefited from higher new and used vehicle unit volume. Gross profit associated with our collision business benefited from increased volume referred by automotive insurance providers, as well as an increase in the average repair value and improved customer retention efforts.
37
Finance and Insurance
|
|
Years Ended December 31,
|
||||||||||||||||||||||
|
($ in millions, except per vehicle data)
|
|
|
2016 vs. 2015
|
|
2015 vs. 2014
|
||||||||||||||||||
|
2016
|
2015
|
Variance
Favorable /
(Unfavorable)
|
%
Variance
|
2014
|
Variance
Favorable /
(Unfavorable)
|
%
Variance
|
|||||||||||||||||
|
Reported:
|
|||||||||||||||||||||||
|
Revenue and gross profit
|
$
|
894.6
|
|
$
|
868.7
|
|
$
|
25.9
|
|
3.0
|
$
|
750.8
|
|
$
|
117.9
|
|
15.7
|
||||||
|
Gross profit per vehicle retailed
|
$
|
1,588
|
|
$
|
1,534
|
|
$
|
54
|
|
3.5
|
$
|
1,409
|
|
$
|
125
|
|
8.9
|
||||||
|
|
Years Ended December 31,
|
|||||||||||||||||||||||||||
|
|
|
|
2016 vs. 2015
|
|
|
2015 vs. 2014
|
||||||||||||||||||||||
|
|
2016
|
2015
|
Variance
Favorable /
(Unfavorable)
|
%
Variance
|
2015
|
2014
|
Variance
Favorable /
(Unfavorable)
|
%
Variance
|
||||||||||||||||||||
|
Same Store:
|
||||||||||||||||||||||||||||
|
Revenue and gross profit
|
$
|
834.6
|
|
$
|
841.4
|
|
$
|
(6.8
|
)
|
(0.8
|
)
|
$
|
846.1
|
|
$
|
745.6
|
|
$
|
100.5
|
|
13.5
|
|||||||
|
Gross profit per vehicle retailed
|
$
|
1,615
|
|
$
|
1,550
|
|
$
|
65
|
|
4.2
|
|
$
|
1,538
|
|
$
|
1,414
|
|
$
|
124
|
|
8.8
|
|||||||
Revenue on finance and insurance products represents commissions earned by us for the placement of: (i) loans and leases with financial institutions in connection with customer vehicle purchases financed, (ii) vehicle service contracts with third-party providers, and (iii) other vehicle protection products with third-party providers. We primarily sell these products on a straight commission basis; however, in certain cases, we also participate in the future underwriting profit on certain extended service contracts pursuant to retrospective commission arrangements with the issuers of those contracts, which is recognized as earned.
The following discussion of finance and insurance is on a same store basis. The difference between reported amounts and same store amounts in finance and insurance revenue and gross profit in the above tables of
$60.0 million
,
$27.3 million
, and
$5.2 million
for
2016
,
2015
, and
2014
respectively, is related to acquisition and divestiture activity.
2016
compared to
2015
Same store finance and insurance revenue and gross profit
decreased
during
2016
, as compared to
2015
, due to the decrease in new and used vehicle unit volume, partially offset by an increase in same store finance and insurance revenue and gross profit PVR.
Same store finance and insurance revenue and gross profit PVR increased primarily due to an increase in profit on vehicle service contracts as a result of the sale in our Domestic and Import stores of the AutoNation Vehicle Protection Plan, which was rolled out during the second half of 2015. Same store finance and insurance revenue and gross profit PVR also benefited from increases in product penetration and amounts financed per transaction.
2015
compared to
2014
Same store finance and insurance revenue and gross profit increased during
2015
, as compared to
2014
, due to increases in same store finance and insurance revenue and gross profit PVR and new and used vehicle unit volume.
Same store finance and insurance revenue and gross profit PVR benefited from increases in product penetration, profit on vehicle service contracts, amounts financed per transaction, and the number of customers financing vehicles through our stores.
38
Segment Results
In the following table of financial data, revenue and segment income of our reportable segments are reconciled to consolidated revenue and consolidated operating income, respectively.
|
Years Ended December 31,
|
||||||||||||||||||||||||
|
($ in millions)
|
2016
|
2015
|
Variance
Favorable /
(Unfavorable)
|
%
Variance
|
2014
|
Variance
Favorable /
(Unfavorable)
|
%
Variance
|
|||||||||||||||||
|
Revenue:
|
||||||||||||||||||||||||
|
Domestic
|
$
|
7,810.0
|
|
$
|
7,069.8
|
|
$
|
740.2
|
|
10.5
|
|
$
|
6,359.5
|
|
$
|
710.3
|
|
11.2
|
||||||
|
Import
|
6,886.1
|
|
7,037.2
|
|
(151.1
|
)
|
(2.1
|
)
|
6,717.8
|
|
319.4
|
|
4.8
|
|||||||||||
|
Premium Luxury
|
6,665.3
|
|
6,607.8
|
|
57.5
|
|
0.9
|
|
5,889.3
|
|
718.5
|
|
12.2
|
|||||||||||
|
Total
|
21,361.4
|
|
20,714.8
|
|
646.6
|
|
3.1
|
|
18,966.6
|
|
1,748.2
|
|
9.2
|
|||||||||||
|
Corporate and other
|
247.6
|
|
147.2
|
|
100.4
|
|
68.2
|
|
142.2
|
|
5.0
|
|
3.5
|
|||||||||||
|
Total consolidated revenue
|
$
|
21,609.0
|
|
$
|
20,862.0
|
|
$
|
747.0
|
|
3.6
|
|
$
|
19,108.8
|
|
$
|
1,753.2
|
|
9.2
|
||||||
|
Segment income
(1)
:
|
||||||||||||||||||||||||
|
Domestic
|
$
|
311.1
|
|
$
|
336.9
|
|
$
|
(25.8
|
)
|
(7.7
|
)
|
$
|
285.0
|
|
$
|
51.9
|
|
18.2
|
||||||
|
Import
|
296.8
|
|
311.4
|
|
(14.6
|
)
|
(4.7
|
)
|
291.3
|
|
20.1
|
|
6.9
|
|||||||||||
|
Premium Luxury
|
350.2
|
|
376.2
|
|
(26.0
|
)
|
(6.9
|
)
|
366.1
|
|
10.1
|
|
2.8
|
|||||||||||
|
Total
|
958.1
|
|
1,024.5
|
|
(66.4
|
)
|
(6.5
|
)
|
942.4
|
|
82.1
|
|
8.7
|
|||||||||||
|
Corporate and other
|
(145.1
|
)
|
(209.7
|
)
|
64.6
|
|
(174.9
|
)
|
(34.8
|
)
|
||||||||||||||
|
Floorplan interest expense
|
76.5
|
|
58.3
|
|
(18.2
|
)
|
53.3
|
|
(5.0
|
)
|
||||||||||||||
|
Operating income
|
$
|
889.5
|
|
$
|
873.1
|
|
$
|
16.4
|
|
1.9
|
|
$
|
820.8
|
|
$
|
52.3
|
|
6.4
|
||||||
|
(1)
Segment income represents income for each of our reportable segments and is defined as operating income less floorplan interest expense.
|
||||||||||||||||||||||||
|
Retail new vehicle unit sales:
|
||||||||||||||||||||||||
|
Domestic
|
118,867
|
|
111,519
|
|
7,348
|
|
6.6
|
|
102,643
|
|
8,876
|
|
8.6
|
|||||||||||
|
Import
|
150,005
|
|
157,868
|
|
(7,863
|
)
|
(5.0
|
)
|
154,066
|
|
3,802
|
|
2.5
|
|||||||||||
|
Premium Luxury
|
68,750
|
|
69,693
|
|
(943
|
)
|
(1.4
|
)
|
61,299
|
|
8,394
|
|
13.7
|
|||||||||||
|
337,622
|
|
339,080
|
|
(1,458
|
)
|
(0.4
|
)
|
318,008
|
|
21,072
|
|
6.6
|
||||||||||||
39
Domestic
The Domestic segment operating results included the following:
|
Years Ended December 31,
|
||||||||||||||||||||||||
|
($ in millions)
|
2016
|
2015
|
Variance
Favorable /
(Unfavorable)
|
%
Variance
|
2014
|
Variance
Favorable /
(Unfavorable)
|
%
Variance
|
|||||||||||||||||
|
Revenue
|
$
|
7,810.0
|
|
$
|
7,069.8
|
|
$
|
740.2
|
|
10.5
|
|
$
|
6,359.5
|
|
$
|
710.3
|
|
11.2
|
||||||
|
Segment income
|
$
|
311.1
|
|
$
|
336.9
|
|
$
|
(25.8
|
)
|
(7.7
|
)
|
$
|
285.0
|
|
$
|
51.9
|
|
18.2
|
||||||
|
Retail new vehicle unit sales
|
118,867
|
|
111,519
|
|
7,348
|
|
6.6
|
|
102,643
|
|
8,876
|
|
8.6
|
|||||||||||
2016
compared to
2015
Domestic revenue
increased
during
2016
, as compared to
2015
, primarily due to increases in new and used vehicle unit volume and new and used vehicle revenue PVR. New and used vehicle unit volume benefited from the acquisitions we completed in 2016 and 2015. New vehicle revenue PVR benefited from lower average fuel prices, which caused a shift in mix toward larger vehicles, such as trucks and sport utility vehicles, that have relatively higher average selling prices. Used vehicle revenue PVR benefited from the increase in sales of certified pre-owned vehicles, which have relatively higher average selling prices. Domestic revenue was adversely impacted by the disruptive manufacturer
marketing and sales incentive programs described above
, which resulted in a more competitive automotive retail environment.
Domestic segment income
decreased
during
2016
, as compared to
2015
, due in part to an increase in SG&A expenses largely due to the acquisitions we completed in 2016 and 2015. Domestic segment income was also adversely impacted by a decrease in new vehicle gross profit primarily due to the disruptive manufacturer
marketing and sales incentive programs described above
, which resulted in a more competitive automotive retail environment, a decrease in used vehicle gross profit due to the competitive automotive retail environment and the application of our previous open safety recall policy, and an increase in floorplan interest expense and depreciation and amortization expense. Domestic segment income benefited from increases in parts and service gross profit and finance and insurance revenue and gross profit due to the acquisitions we completed in 2016 and 2015.
2015
compared to
2014
Domestic revenue increased during
2015
, as compared to
2014
, primarily due to increases in new and used vehicle unit volume and new and used vehicle revenue PVR. The increase in new vehicle unit volume was due in part to replacement demand and improved market conditions, including increased consumer borrowing and improved consumer confidence as compared to the prior year. New product offerings from certain automotive manufacturers also favorably impacted new vehicle unit volume. New vehicle revenue PVR benefited from lower average fuel prices, which caused a shift in mix toward larger vehicles, such as trucks and sport utility vehicles, that have relatively higher average selling prices. The increase in used vehicle unit volume was primarily due to an increase in sales of certified pre-owned vehicles, as well as an increase in trade-in volume associated with new vehicle sales. Used vehicle revenue PVR benefited from the increase in sales of certified pre-owned vehicles, which have relatively higher average selling prices.
Domestic segment income increased during
2015
, as compared to
2014
, primarily due to an increase in finance and insurance revenue and gross profit, which benefited from an increase in finance and insurance revenue and gross profit PVR and higher vehicle unit volume. Domestic segment income also benefited from an increase in parts and service gross profit. Increases in Domestic segment income were partially offset by an increase in variable expenses.
40
Import
The Import segment operating results included the following:
|
Years Ended December 31,
|
||||||||||||||||||||||||
|
($ in millions)
|
2016
|
2015
|
Variance
Favorable /
(Unfavorable)
|
%
Variance
|
2014
|
Variance
Favorable /
(Unfavorable)
|
%
Variance
|
|||||||||||||||||
|
Revenue
|
$
|
6,886.1
|
|
$
|
7,037.2
|
|
$
|
(151.1
|
)
|
(2.1
|
)
|
$
|
6,717.8
|
|
$
|
319.4
|
|
4.8
|
||||||
|
Segment income
|
$
|
296.8
|
|
$
|
311.4
|
|
$
|
(14.6
|
)
|
(4.7
|
)
|
$
|
291.3
|
|
$
|
20.1
|
|
6.9
|
||||||
|
Retail new vehicle unit sales
|
150,005
|
|
157,868
|
|
(7,863
|
)
|
(5.0
|
)
|
154,066
|
|
3,802
|
|
2.5
|
|||||||||||
2016
compared to
2015
Import revenue
decreased
during
2016
, as compared to
2015
, due to a decrease in new vehicle unit volume primarily due to the disruptive manufacturer
marketing and sales incentive programs described above
, which resulted in a more competitive automotive retail environment, and a decrease in used vehicle unit volume due to the more competitive automotive retail environment and the application of our previous open safety recall policy. Import revenue benefited from the acquisitions we completed in 2016 and 2015.
Import segment income
decreased
during
2016
, as compared to
2015
, due to a decrease in new vehicle gross profit primarily due to the disruptive manufacturer
marketing and sales incentive programs described above
, which resulted in a more competitive automotive retail environment, and a decrease in used vehicle gross profit due to the competitive automotive retail environment and the application of our previous open safety recall policy. Import segment income also was adversely impacted by a decrease in finance and insurance gross profit, partially offset by a decrease in variable expenses and an increase
i
n parts and service gross profit.
2015
compared to
2014
Import revenue increased during
2015
, as compared to
2014
, primarily due to increases in new and used vehicle unit volume and new and used vehicle revenue PVR. The increase in new vehicle unit volume was primarily due to replacement demand and improved market conditions, including increased consumer borrowing and confidence as compared to the prior year. New product offerings from certain automotive manufacturers also favorably impacted new vehicle unit volume. New vehicle revenue PVR benefited from lower average fuel prices, which caused a shift in mix toward larger vehicles, such as trucks and sport utility vehicles, that have relatively higher average selling prices. The increase in used vehicle unit volume was primarily due to an increase in trade-in volume associated with new vehicle sales, as well as an increase in sales of certified pre-owned vehicles. Used vehicle revenue PVR benefited from the increase in sales of certified pre-owned vehicles, which have relatively higher average selling prices. Import revenue also benefited from an increase in parts and service revenue.
Import segment income increased during
2015
, as compared to
2014
, primarily due to an increase
i
n parts and service gross profit and an increase in finance and insurance revenue and gross profit, which benefited from an increase in finance and insurance revenue and gross profit PVR and higher vehicle unit volume. Increases in Import segment income were partially offset by an increase in variable expenses and decreases in both new and used vehicle gross profit due to the competitive automotive retail environment.
41
Premium Luxury
The Premium Luxury segment operating results included the following:
|
Years Ended December 31,
|
||||||||||||||||||||||||
|
($ in millions)
|
2016
|
2015
|
Variance
Favorable /
(Unfavorable)
|
%
Variance
|
2014
|
Variance
Favorable /
(Unfavorable)
|
%
Variance
|
|||||||||||||||||
|
Revenue
|
$
|
6,665.3
|
|
$
|
6,607.8
|
|
$
|
57.5
|
|
0.9
|
|
$
|
5,889.3
|
|
$
|
718.5
|
|
12.2
|
||||||
|
Segment income
|
$
|
350.2
|
|
$
|
376.2
|
|
$
|
(26.0
|
)
|
(6.9
|
)
|
$
|
366.1
|
|
$
|
10.1
|
|
2.8
|
||||||
|
Retail new vehicle unit sales
|
68,750
|
|
69,693
|
|
(943
|
)
|
(1.4
|
)
|
61,299
|
|
8,394
|
|
13.7
|
|||||||||||
2016
compared to
2015
Premium Luxury revenue
increased
during
2016
, as compared to
2015
, primarily due to an increase in used vehicle and parts and service revenue due to the acquisitions we completed in 2016 and 2015, partially offset by a decrease in new vehicle revenue due to a decrease in new vehicle unit volume.
Premium Luxury segment income
decreased
during
2016
, as compared to
2015
, primarily due to an increase in SG&A expenses largely due to the acquisitions we completed in 2016 and 2015 and a decrease in new and used vehicle gross profit due to the competitive automotive retail environment and the application of our previous open safety recall policy. These decreases were partially offset by an increase in parts and service gross profit due to the acquisitions mentioned above.
2015
compared to
2014
Premium Luxury revenue increased during
2015
, as compared to
2014
, primarily due to an increase in new and used vehicle unit volume and used vehicle revenue PVR. The increase in new vehicle unit volume was due in part to replacement demand and improved market conditions, including increased consumer borrowing and confidence. New product offerings from certain automotive manufacturers also favorably impacted new vehicle unit volume. The increase in used vehicle unit volume was primarily due to an increase in sales of certified pre-owned vehicles, as well as an increase in trade-in volume associated with new vehicle sales. Used vehicle revenue PVR benefited from the increase in sales of certified pre-owned vehicles, which have relatively higher average selling prices. New and used vehicle unit volume also benefited from the acquisitions we completed during 2015.
Premium Luxury segment income increased during
2015
, as compared to
2014
, primarily due to an increase in parts and service gross profit and an increase in finance and insurance revenue and gross profit, which benefited from an increase in finance and insurance revenue and gross profit PVR and higher vehicle unit volume. Premium Luxury segment income also benefited from the acquisitions we completed during 2015. Increases in Premium Luxury segment income were partially offset by an increase in variable expenses and decreases in new and used vehicle gross profit PVR due to increased inventory levels and changes in manufacturer incentive programs, as well as a competitive automotive retail environment.
42
Selling, General, and Administrative Expenses
Our SG&A expenses consist primarily of compensation, including store and corporate salaries, commissions, and incentive-based compensation, as well as advertising (net of reimbursement-based manufacturer advertising rebates), and store and corporate overhead expenses, which include occupancy costs, legal, accounting, and professional services, and general corporate expenses. The following table presents the major components of our SG&A.
|
Years Ended December 31,
|
|||||||||||||||||||||||||
|
($ in millions)
|
2016
|
2015
|
Variance
Favorable /
(Unfavorable)
|
%
Variance
|
2014
|
Variance
Favorable /
(Unfavorable)
|
%
Variance
|
||||||||||||||||||
|
Reported:
|
|||||||||||||||||||||||||
|
Compensation
|
$
|
1,467.5
|
|
$
|
1,454.3
|
|
$
|
(13.2
|
)
|
(0.9
|
)
|
$
|
1,362.5
|
|
$
|
(91.8
|
)
|
(6.7
|
)
|
||||||
|
Advertising
|
196.7
|
|
188.5
|
|
(8.2
|
)
|
(4.4
|
)
|
164.9
|
|
(23.6
|
)
|
(14.3
|
)
|
|||||||||||
|
Store and corporate overhead
|
685.2
|
|
620.7
|
|
(64.5
|
)
|
(10.4
|
)
|
552.2
|
|
(68.5
|
)
|
(12.4
|
)
|
|||||||||||
|
Total
|
$
|
2,349.4
|
|
$
|
2,263.5
|
|
$
|
(85.9
|
)
|
(3.8
|
)
|
$
|
2,079.6
|
|
$
|
(183.9
|
)
|
(8.8
|
)
|
||||||
|
SG&A as a % of total gross profit:
|
|||||||||||||||||||||||||
|
Compensation
|
44.3
|
|
44.6
|
|
30
|
|
bps
|
45.6
|
|
100
|
|
bps
|
|||||||||||||
|
Advertising
|
5.9
|
|
5.8
|
|
(10
|
)
|
bps
|
5.5
|
|
(30
|
)
|
bps
|
|||||||||||||
|
Store and corporate overhead
|
20.7
|
|
19.0
|
|
(170
|
)
|
bps
|
18.5
|
|
(50
|
)
|
bps
|
|||||||||||||
|
Total
|
70.9
|
|
69.4
|
|
(150
|
)
|
bps
|
69.6
|
|
20
|
|
bps
|
|||||||||||||
2016
compared to
2015
SG&A expenses
increased
in
2016
, as compared to
2015
, primarily due to the acquisitions we completed in 2016. SG&A expenses in 2016 were also negatively impacted by an increase in hail-related losses of $7.5 million as compared to the prior year. These increases were partially offset by a decrease in variable expenses as a result of the decrease in unit volume. As a percentage of total gross profit, SG&A expenses
increased
to
70.9%
in
2016
from
69.4%
in
2015
, primarily due to gross profit pressure from the disruptive manufacturer marketing and sales incentive programs discussed above under “Market Conditions” and the application of our previous open safety recall policy.
2015
compared to
2014
SG&A expenses increased in
2015
, as compared to
2014
, primarily due to a volume-driven increase in variable compensation expense, an increase in store and corporate overhead expenses due in part to the acquisitions we completed in 2015, and an increase in advertising expenditures. As a percentage of total gross profit, SG&A expenses decreased slightly to
69.4%
in
2015
from
69.6%
in
2014
, primarily due to a decrease in compensation expense as a percentage of total gross profit.
Other Income, Net (included in Operating Income)
During 2016, we recognized net gains of
$61.8 million
related to the divestiture of
five
Domestic stores and
nine
Import stores, a gain of $14.4 million in connection with a legal settlement related to the Volkswagen diesel emissions litigation, and a gain of $5.5 million related to payments we received to waive certain franchise protest rights. These net gains were partially offset by non-cash property impairments of $14.0 million.
During 2015, we recognized gains related to property dispositions of $16.7 million and the divestiture of three Import stores of
$7.4 million
. These gains were partially offset by non-cash property impairments of $6.1 million.
During 2014, we recognized a gain related to the divestiture of two Import stores of $4.4 million, a gain related to a legal settlement of $4.0 million, and a net gain related to business/property dispositions of $8.1 million, primarily related to the divestiture of our customer lead distribution business.
43
Franchise Rights Impairment
During 2015, we recorded non-cash impairment charges of
$15.4 million
associated with franchise rights recorded at our Volkswagen stores. See Note
16
of the Notes to Consolidated Financial Statements for more information.
Non-Operating Income (Expenses)
Floorplan Interest Expense
Floorplan interest expense was
$76.5 million
in
2016
,
$58.3 million
in
2015
, and
$53.3 million
in
2014
. The
increase
in floorplan interest expense of
$18.2 million
in 2016, as compared to 2015, is the result of higher average vehicle floorplan balances during the year, which was due in part to the acquisitions we completed in 2016 and 2015, and higher interest rates. The increase in floorplan interest expense of
$5.0 million
in 2015, as compared to 2014, is primarily the result of higher average vehicle floorplan balances during the year.
Other Interest Expense
Other interest expense was
$115.5 million
in
2016
,
$90.9 million
in
2015
, and
$86.7 million
in
2014
. The
increase
in interest expense of
$24.6 million
in
2016
, as compared to
2015
, was driven by higher average debt balances resulting primarily from share repurchases and acquisitions. The increase in interest expense of $4.2 million in 2015, as compared to 2014, was primarily due to an increase of $8.3 million resulting from the September 2015 issuance of our 3.35% Senior Notes due 2021 and 4.5% Senior Notes due 2025. This increase was partially offset by decreases in interest expense of $3.3 million due to lower interest rates associated with our credit facility refinancing in December 2014 and our commercial paper program established in May 2015, and $0.6 million resulting from lower levels of debt outstanding during the year associated with our mortgage facility.
Loss on Debt Extinguishment
We expensed $1.6 million pre-tax in the fourth quarter of 2014 related to our credit facility refinancing transaction. This expense included $0.4 million for the write-off of previously deferred debt issuance costs.
Provision for Income Taxes
Income taxes are provided based upon our anticipated underlying annual blended federal and state income tax rates, adjusted, as necessary, for any other tax matters occurring during the period. As we operate in various states, our effective tax rate is also dependent upon our geographic revenue mix.
Our effective income tax rate was
38.5%
in
2016
. See Note
11
of the Notes to Consolidated Financial Statements for discussion of our unrecognized tax benefits. We do not expect that our unrecognized tax benefits will significantly increase or decrease during the twelve months beginning January 1,
2017
.
Our effective income tax rate was
38.6%
in
2015
and was
38.5%
in
2014
.
Discontinued Operations
Discontinued operations are related to stores that were sold or terminated prior to January 1, 2014. Results from discontinued operations, net of income taxes, were primarily related to a non-cash impairment charge and carrying costs for real estate we have not yet sold associated with stores that were closed prior to January 1, 2014.
Liquidity and Capital Resources
We manage our liquidity to ensure access to sufficient funding at acceptable costs to fund our ongoing operating requirements and future capital expenditures while continuing to meet our financial obligations. We believe that our cash and cash equivalents, funds generated through future operations, and amounts available under our revolving credit facility, commercial paper program, and secured used vehicle floorplan facilities will be sufficient to fund our working capital requirements, service our debt, pay our tax obligations and commitments and contingencies, and meet any seasonal operating requirements for the foreseeable future.
44
Available Liquidity Resources
We had the following sources of liquidity available for the years ended December 31,
2016
and
2015
:
|
(In millions)
|
December 31,
2016 |
December 31,
2015 |
||||||
|
Cash and cash equivalents
|
$
|
64.8
|
|
$
|
74.1
|
|
||
|
Revolving credit facility
(1)
|
$
|
1,058.7
|
|
(2)
|
$
|
1,463.1
|
|
|
|
Secured used floorplan facilities
(3)
|
$
|
0.3
|
|
$
|
127.1
|
|
||
|
(1)
|
As limited by the maximum consolidated leverage ratio in our credit agreement.
|
|
(2)
|
At
December 31, 2016
, we had
$44.1 million
of letters of credit outstanding. In addition, we use the revolving credit facility under our credit agreement as a liquidity backstop for borrowings under the commercial paper program. We had
$942.0 million
of commercial paper notes outstanding at
December 31, 2016
, which in effect reduced the available liquidity under our revolving credit facility to
$813.9 million
. See Note 7 of the Notes to Consolidated Financial Statements for additional information.
|
|
(3)
|
Based on the eligible used vehicle inventory that could have been pledged as collateral. See Note 3 of the Notes to Consolidated Financial Statements for additional information.
|
In the ordinary course of business, we are required to post performance and surety bonds, letters of credit, and/or cash deposits as financial guarantees of our performance relating to insurance matters. At
December 31, 2016
, surety bonds, letters of credit, and cash deposits totaled
$102.7 million
, including the
$44.1 million
of letters of credit issued under our revolving credit facility. We do not currently provide cash collateral for outstanding letters of credit.
In February 2016, we filed an automatic shelf registration statement with the SEC that enables us to offer for sale, from time to time and as the capital markets permit, an unspecified amount of common stock, preferred stock, debt securities, warrants, subscription rights, depositary shares, stock purchase contracts, units, and guarantees of debt securities.
Capital Allocation
Our capital allocation strategy is focused on maximizing stockholder returns. We invest capital in our business to maintain and upgrade our existing facilities and to build new facilities, as well as for other strategic and technology initiatives, including the next phase of our brand extension strategy discussed above under “Strategic Initiatives.” We also deploy capital opportunistically to repurchase our common stock and/or debt or to complete dealership acquisitions and/or build facilities for newly awarded franchises. Our capital allocation decisions will be based on factors such as the expected rate of return on our investment, the market price of our common stock versus our view of its intrinsic value, the market price of our debt, the potential impact on our capital structure, our ability to complete dealership acquisitions that meet our market and vehicle brand criteria and return on investment threshold, and limitations set forth in our debt agreements.
Share Repurchases
Our Board of Directors from time to time authorizes the repurchase of shares of our common stock up to a certain monetary limit. A summary of shares repurchased under our share repurchase program authorized by our Board of Directors follows:
|
(In millions, except per share data)
|
2016
|
2015
|
2014
|
||||||||
|
Shares repurchased
|
10.5
|
|
3.9
|
|
9.4
|
|
|||||
|
Aggregate purchase price
|
$
|
497.0
|
|
$
|
235.1
|
|
$
|
485.1
|
|
||
|
Average purchase price per share
|
$
|
47.30
|
|
$
|
60.49
|
|
$
|
51.59
|
|
||
As of
December 31, 2016
,
$298.6 million
remained available under our stock repurchase limit most recently authorized by our Board of Directors.
The decision to repurchase shares at any given point in time is based on such factors as the market price of our common stock versus our view of its intrinsic value, the potential impact on our capital structure (including compliance with our
45
3.75x maximum leverage ratio and other financial covenants in our debt agreements as well as our available liquidity), and the expected return on competing uses of capital such as dealership acquisitions, capital investments in our current businesses, or repurchases of our debt.
Capital Expenditures
The following table sets forth information regarding our capital expenditures over the past three years:
|
(In millions)
|
2016
|
2015
|
2014
|
||||||||
|
Purchases of property and equipment, including operating lease buy-outs
(1)
|
$
|
253.2
|
|
$
|
266.9
|
|
$
|
197.8
|
|
||
|
(1)
Includes accrued construction in progress and excludes property associated with capital leases entered into during the year.
|
|||||||||||
Acquisitions and Divestitures
The following table sets forth information regarding cash used in business acquisitions, net of cash acquired, and cash received from business divestitures, net of cash relinquished, over the past three years:
|
(In millions)
|
2016
|
2015
|
2014
|
||||||||
|
Cash used in business acquisitions, net
(1)
|
$
|
(410.4
|
)
|
$
|
(321.5
|
)
|
$
|
(205.2
|
)
|
||
|
Cash received from business divestitures, net
|
$
|
150.4
|
|
$
|
43.9
|
|
$
|
41.4
|
|
||
|
Proceeds from the sale of property and equipment
|
$
|
8.7
|
|
$
|
21.9
|
|
$
|
5.5
|
|
||
|
Proceeds from the disposal of assets held for sale
|
$
|
4.8
|
|
$
|
11.5
|
|
$
|
2.6
|
|
||
|
(1)
Excludes capital leases and deferred purchase price commitments.
|
|||||||||||
During
2016
, we purchased
20
stores located in Texas, New York, Colorado, California, and Maryland, which include
Chrysler, Dodge, Jeep, Ram, Chevrolet, Hyundai, Mercedes-Benz, Sprinter, Jaguar, Land Rover, and BMW franchises
. We also purchased a collision center in Illinois in 2016. We purchased
22
stores in
2015
and
five
stores in
2014
.
During
2016
, we divested
five
Domestic stores and
nine
Import stores. In
2015
, we divested
three
Import stores. In 2014, we divested two Import stores and our customer lead distribution business, which was reported in the “Corporate and other” category of our segment information.
We regularly review our store portfolio and may divest stores opportunistically. Since January 1, 2015, we have received
$241.2 million
of proceeds related to asset sales, including business and real estate divestitures. We have utilized those proceeds, and expect to utilize proceeds from future asset sales, to fund our capital investments and strategic initiatives or for other general corporate purposes.
Cash Dividends
We have not declared or paid any cash dividends on our common stock during our two most recent fiscal years. We do not currently anticipate paying cash dividends for the foreseeable future.
46
The following table sets forth our non-vehicle long-term debt as of December 31,
2016
and
2015
:
|
(In millions)
|
2016
|
2015
|
|||||
|
6.75% Senior Notes due 2018
|
$
|
400.0
|
|
$
|
400.0
|
|
|
|
5.5% Senior Notes due 2020
|
350.0
|
|
350.0
|
|
|||
|
3.35% Senior Notes due 2021
|
300.0
|
|
300.0
|
|
|||
|
4.5% Senior Notes due 2025
|
450.0
|
|
450.0
|
|
|||
|
Revolving credit facility due 2019
|
—
|
|
—
|
|
|||
|
Mortgage facility
(1)
|
153.2
|
|
175.7
|
|
|||
|
Capital leases and other debt
|
136.2
|
|
95.0
|
|
|||
|
1,789.4
|
|
1,770.7
|
|
||||
|
Less: unamortized debt discounts and debt issuance costs
|
(10.8
|
)
|
(13.7
|
)
|
|||
|
Less: current maturities
|
(167.5
|
)
|
(11.7
|
)
|
|||
|
Long-term debt, net of current maturities
|
$
|
1,611.1
|
|
$
|
1,745.3
|
|
|
|
(1)
|
The mortgage facility requires monthly principal and interest payments of
$1.6 million
based on a fixed amortization schedule with a balloon payment of
$143.9 million
due November 2017.
|
At
December 31, 2016
, we had
$942.0 million
of commercial paper notes outstanding with a weighted-average annual interest rate of
1.26%
and a weighted-average remaining term of
24 days
.
See Note 7 of the Notes to Consolidated Financial Statements for more information on our long-term debt and commercial paper.
Restrictions and Covenants
Our credit agreement, the indentures for our senior unsecured notes, our vehicle floorplan facilities, and our mortgage facility contain numerous customary financial and operating covenants that place significant restrictions on us, including our ability to incur additional indebtedness or prepay existing indebtedness, to create liens or other encumbrances, to sell (or otherwise dispose of) assets, and to merge or consolidate with other entities.
Under our credit agreement, we are required to remain in compliance with a maximum leverage ratio and maximum capitalization ratio. The leverage ratio is a contractually defined amount principally reflecting non-vehicle debt divided by a contractually defined measure of earnings with certain adjustments. The capitalization ratio is a contractually defined amount principally reflecting vehicle floorplan payable and non-vehicle debt divided by our total capitalization including vehicle floorplan payable. Under our credit agreement, the maximum leverage ratio is
3.75
x and the maximum capitalization ratio is
70.0%
. In calculating our leverage and capitalization ratios, we are not required to include letters of credit in the definition of debt (except to the extent of letters of credit in excess of
$150.0 million
). In addition, in calculating our capitalization ratio, we are permitted to add back to shareholders’ equity all goodwill, franchise rights, and long-lived asset impairment charges subsequent to September 30, 2014 plus
$1.53 billion
. The specific terms of these covenants can be found in our credit agreement, which we filed with our Current Report on Form 8-K on December 4, 2014.
The indentures for our senior unsecured notes contain certain limited covenants, including limitations on liens and sale and leaseback transactions. Our mortgage facility contains covenants regarding maximum cash flow leverage and minimum interest coverage.
Our failure to comply with the covenants contained in our debt agreements could result in the acceleration of all of our indebtedness. Our debt agreements have cross-default provisions that trigger a default in the event of an uncured default under other material indebtedness of AutoNation.
47
As of December 31,
2016
, we were in compliance with the requirements of the financial covenants under our debt agreements. Under the terms of our credit agreement, at December 31,
2016
, our leverage ratio and capitalization ratio were as follows:
|
|
December 31, 2016
|
||
|
|
Requirement
|
Actual
|
|
|
Leverage ratio
|
≤ 3.75x
|
2.70x
|
|
|
Capitalization ratio
|
≤ 70.0%
|
63.0%
|
|
Vehicle Floorplan Payable
The components of vehicle floorplan payable are as follows:
|
|
2016
|
2015
|
|||||
|
Vehicle floorplan payable - trade
|
$
|
2,308.8
|
|
$
|
2,565.8
|
|
|
|
Vehicle floorplan payable - non-trade
|
1,540.4
|
|
1,161.3
|
|
|||
|
Vehicle floorplan payable
|
$
|
3,849.2
|
|
$
|
3,727.1
|
|
|
See Note 3 of the Notes to Consolidated Financial Statements for more information on our vehicle floorplan payable.
Cash Flows
The following table summarizes the changes in our cash provided by (used in) operating, investing, and financing activities:
|
Years Ended December 31,
|
|||||||||||
|
(In millions)
|
2016
|
2015
|
2014
|
||||||||
|
Net cash provided by operating activities
|
$
|
516.0
|
|
$
|
507.2
|
|
$
|
485.1
|
|
||
|
Net cash used in investing activities
|
$
|
(489.7
|
)
|
$
|
(509.4
|
)
|
$
|
(376.0
|
)
|
||
|
Net cash provided by (used in) financing activities
|
$
|
(35.6
|
)
|
$
|
0.9
|
|
$
|
(102.9
|
)
|
||
Cash Flows from Operating Activities
Our primary sources of operating cash flows are collections from contracts-in-transit and customers following the sale of vehicles and finance and insurance products, collections from customers for the sale of parts and services, and proceeds from vehicle floorplan payable-trade. Our primary uses of cash from operating activities are repayments of vehicle floorplan payable-trade, purchases of parts inventory, personnel-related expenditures, and payments related to taxes and leased properties.
2016
compared to
2015
Net cash provided by operating activities increased during
2016
, as compared to
2015
, and was primarily due to a decrease in working capital requirements, partially offset by a decrease in earnings.
2015
compared to
2014
Net cash provided by operating activities increased during
2015
, as compared to
2014
, and was primarily due to a decrease in working capital requirements and an increase in earnings.
During 2014, we paid $7.2 million in connection with refinancing our indebtedness. Cash flows from operating activities in 2014 reflect $1.2 million of these cash payments that we charged to expense related to this refinancing transaction. In addition, we charged to expense $0.4 million of previously deferred debt issuance costs. Cash flows from financing activities in 2014, discussed below, reflect $6.0 million of debt issuance costs that are being amortized to interest expense over the term of our credit agreement.
48
Cash Flows from Investing Activities
Net cash flows from investing activities consist primarily of cash used in capital additions, activity from business acquisitions, business divestitures, property dispositions, and other transactions.
We will make facility and infrastructure upgrades and improvements from time to time as we identify projects that are required to maintain our current business or that we expect to provide us with acceptable rates of return.
2016
compared to
2015
Net cash used in investing activities decreased during
2016
, as compared to
2015
, primarily due to an increase in cash received from business divestitures, net of cash relinquished, partially offset by an increase in cash used in business acquisitions, net of cash acquired.
2015
compared to
2014
Net cash used in investing activities increased during
2015
, as compared to
2014
, primarily due to an increase in cash used in business acquisitions, net of cash acquired, and an increase in property and equipment purchases, partially offset by an increase in proceeds from the sale of property and equipment.
Cash Flows from Financing Activities
Net cash flows from financing activities primarily include repurchases of common stock, debt activity, changes in vehicle floorplan payable-non-trade, and proceeds from stock option exercises.
2016
compared to
2015
Under our share repurchase program authorized by our Board of Directors, during
2016
, we repurchased
10.5 million
shares of common stock for an aggregate purchase price of
$497.0 million
(average purchase price per share of
$47.30
). Additionally,
38,906
shares were surrendered to AutoNation in
2016
to satisfy tax withholding obligations in connection with the vesting of restricted stock. During
2015
, we repurchased
3.9 million
shares of our common stock for an aggregate purchase price of
$235.1 million
(average purchase price per share of
$60.49
). Additionally,
36,712
shares were surrendered to AutoNation in
2015
to satisfy tax withholding obligations in connection with the vesting of restricted stock.
During 2015, we issued $300.0 million aggregate principal amount of 3.35% Senior Notes due 2021 and $450.0 million aggregate principal amount of 4.5% Senior Notes due 2025. Cash flows from financing activities in 2015 reflect cash payments of
$6.4 million
for debt issuance costs that are being amortized to interest expense over the terms of the related debt arrangements.
Cash flows from financing activities include changes in commercial paper notes outstanding totaling net proceeds of
$342.5 million
during 2016 and
$599.5 million
during 2015.
During
2016
, we borrowed
$1.3 billion
and repaid
$1.3 billion
under our revolving credit facility. During 2015, we borrowed
$1.4 billion
and repaid
$2.5 billion
under our revolving credit facility, for net
repayments
of
$1.1 billion
.
Cash flows from financing activities include changes in vehicle floorplan payable-non-trade totaling net
proceeds
of
$153.8 million
during
2016
compared to net
repayments
of
$13.3 million
in
2015
.
During
2016
, cash flows from financing activities were also impacted by
a decrease
in proceeds from the exercise of stock options as compared to
2015
.
2015
compared to
2014
During 2014, we amended and restated our existing unsecured credit agreement and replaced our $500.0 million term loan facility and $1.2 billion revolving credit facility with a $1.8 billion revolving credit facility. The indebtedness outstanding under the prior credit agreement was paid off with proceeds from our amended credit agreement. Cash flows from financing activities in 2014 also reflect cash payments of
$6.0 million
for debt issuance costs that are being amortized to interest expense over the term of our credit agreement. During 2014, we borrowed $2.8 billion and repaid $2.0 billion under our revolving credit facilities, for net borrowings of $810.0 million.
49
Net cash flows from financing activities during
2015
, as compared to
2014
, were impacted primarily by the debt activity that occurred in 2015 as compared to 2014, described above, and a decrease in repurchases of common stock.
Contractual Payment Obligations
The following table summarizes our payment obligations under certain contracts at December 31,
2016
. The amounts presented are based upon, among other things, the terms of any relevant agreements. Future events that may occur related to the following payment obligations could cause actual payments to differ significantly from these amounts.
|
|
Payments Due by Period
|
||||||||||||||||||
|
(In millions)
|
Total
|
Less Than 1
Year
(2017)
|
1 - 3 Years
(2018 and
2019)
|
3 - 5 Years
(2020 and
2021)
|
More Than 5
Years
(2022 and
thereafter)
|
||||||||||||||
|
Vehicle floorplan payable (Note 3)
(1)
|
$
|
3,849.2
|
|
$
|
3,849.2
|
|
$
|
—
|
|
$
|
—
|
|
$
|
—
|
|
||||
|
Long-term debt, including capital leases (Note 7)
(1)(2)
|
1,789.4
|
|
167.5
|
|
454.4
|
|
656.9
|
|
510.6
|
|
|||||||||
|
Commercial paper (Note 7)
(1)
|
942.0
|
|
942.0
|
|
—
|
|
—
|
|
—
|
|
|||||||||
|
Interest payments
(3)
|
392.8
|
|
91.7
|
|
124.8
|
|
72.7
|
|
103.6
|
|
|||||||||
|
Operating lease and other commitments (Note 8)
(1)(4)
|
433.3
|
|
45.6
|
|
81.9
|
|
69.0
|
|
236.8
|
|
|||||||||
|
Unrecognized tax benefits, net (Note 11)
(1)
|
7.7
|
|
—
|
|
3.0
|
|
4.7
|
|
—
|
|
|||||||||
|
Deferred compensation obligations
(5)
|
68.2
|
|
5.0
|
|
—
|
|
—
|
|
63.2
|
|
|||||||||
|
Estimated chargeback liability (Note 18)
(1)(6)
|
116.8
|
|
67.5
|
|
43.9
|
|
5.2
|
|
0.2
|
|
|||||||||
|
Estimated self-insurance obligations (Note 6)
(1)(7)
|
75.9
|
|
27.2
|
|
26.2
|
|
11.1
|
|
11.4
|
|
|||||||||
|
Purchase obligations
(8)
|
113.7
|
|
95.8
|
|
16.8
|
|
0.3
|
|
0.8
|
|
|||||||||
|
Total
|
$
|
7,789.0
|
|
$
|
5,291.5
|
|
$
|
751.0
|
|
$
|
819.9
|
|
$
|
926.6
|
|
||||
|
(1)
|
See Notes to Consolidated Financial Statements.
|
|
(2)
|
Amounts for long-term debt obligations reflect principal payments and are not reduced for unamortized debt discounts of
$2.6 million
or debt issuance costs of
$8.2 million
.
|
|
(3)
|
Primarily represents scheduled fixed interest payments on our outstanding senior unsecured notes, mortgage facility, and capital leases. Estimates of future interest payments for vehicle floorplan payables and commercial paper are excluded due to the short-term nature of these facilities.
|
|
(4)
|
Amounts for operating lease commitments do not include certain operating expenses such as maintenance, insurance, and real estate taxes. In
2016
, these charges totaled approximately
$24 million
. Additionally, operating leases that are on a month-to-month basis are not included.
|
|
(5)
|
Due to uncertainty regarding timing of payments expected beyond one year, long-term obligations for deferred compensation arrangements have been classified in the “More Than 5 Years” column.
|
|
(6)
|
Our estimated chargeback obligations do not have scheduled maturities, however, the timing of future payments is estimated based on historical patterns.
|
|
(7)
|
Our estimated self-insurance obligations are based on management estimates and actuarial calculations. Although these obligations do not have scheduled maturities, the timing of future payments is estimated based on historical patterns.
|
|
(8)
|
Primarily represents purchase orders and contracts in connection with information technology and communication systems and real estate construction projects.
|
We expect that the amounts above will be funded through cash flows from operations or borrowings under our commercial paper program or credit agreement. In the case of payments due upon the maturity of our debt instruments, we currently expect to be able to refinance such instruments in the normal course of business.
In the ordinary course of business, we are required to post performance and surety bonds, letters of credit, and/or cash deposits as financial guarantees of our performance. At December 31,
2016
, surety bonds, letters of credit, and cash
50
deposits totaled
$102.7 million
, of which
$44.1 million
represented letters of credit. We do not currently provide cash collateral for outstanding letters of credit. We have negotiated a letter of credit sublimit as part of our revolving credit facility. The amount available to be borrowed under this revolving credit facility is reduced on a dollar-for-dollar basis by the cumulative amount of any outstanding letters of credit.
As further discussed in Note
11
of the Notes to Consolidated Financial Statements, there are various tax matters where the ultimate resolution may result in us owing additional tax payments.
Off-Balance Sheet Arrangements
As of December 31,
2016
, we did not have any significant off-balance sheet arrangements, as defined in Item 303(a)(4)(ii) of SEC Regulation S-K.
Forward-Looking Statements
Our business, financial condition, results of operations, cash flows, and prospects, and the prevailing market price and performance of our common stock may be adversely affected by a number of factors, including the matters discussed below. Certain statements and information set forth in this Annual Report on Form 10-K, including without limitation statements regarding our brand extension strategy, open safety recalls, pending or planned acquisitions, strategic initiatives, expected future investments in our business, and our expectations for the future performance of our business and the automotive retail industry, as well as other written or oral statements made from time to time by us or by our authorized executive officers on our behalf, constitute “forward-looking statements” within the meaning of Section 27A of the Securities Act of 1933, as amended, and Section 21E of the Securities Exchange Act of 1934, as amended. All statements other than statements of historical fact, including statements that describe our objectives, plans or goals are, or may be deemed to be, forward-looking statements. Words such as “anticipate,” “expect,” “intend,” “goal,” “plan,” “believe,” “continue,” “may,” “will,” “could,” and variations of such words and similar expressions are intended to identify such forward-looking statements. Our forward-looking statements reflect our current expectations concerning future results and events, and they involve known and unknown risks, uncertainties and other factors that are difficult to predict and may cause our actual results, performance, or achievements to be materially different from any future results, performance, or achievements expressed or implied by these statements. These forward-looking statements speak only as of the date of this report, and we undertake no obligation to revise or update these statements to reflect subsequent events or circumstances. The risks, uncertainties, and other factors that our stockholders and prospective investors should consider include, but are not limited to, the following:
|
•
|
The automotive retail industry is sensitive to changing economic conditions and various other factors. Our business and results of operations are substantially dependent on new vehicle sales levels in the United States and in our particular geographic markets and the level of gross profit margins that we can achieve on our sales of new vehicles, all of which are very difficult to predict
.
|
•
Our new vehicle sales are impacted by the incentive, marketing, and other programs of vehicle manufacturers
.
|
•
|
We are dependent upon the success and continued financial viability of the vehicle manufacturers and distributors with which we hold franchises
.
|
|
•
|
If we are not able to maintain and enhance our retail brands and reputation or to attract consumers to our own digital channels, or if events occur that damage our retail brands, reputation, or sales channels, our business and financial results may be harmed. We are investing significantly in the next phase of our brand extension strategy, and if our strategic initiatives are not successful, we will have incurred significant expenses without the benefit of improved financial results.
|
|
•
|
New laws, regulations, or governmental policies regarding fuel economy and greenhouse gas emission standards, or changes to existing standards, may affect vehicle manufacturers’ ability to produce cost-effective vehicles or vehicles that consumers demand, which could adversely impact our business, results of operations, financial condition, cash flow, and prospects
.
|
|
•
|
Natural disasters and adverse weather events can disrupt our business
.
|
51
|
•
|
We are subject to restrictions imposed by, and significant influence from, vehicle manufacturers that may adversely impact our business, financial condition, results of operations, cash flows, and prospects, including our ability to acquire additional stores
.
|
|
•
|
We are subject to numerous legal and administrative proceedings, which, if the outcomes are adverse to us, could materially adversely affect our business, results of operations, financial condition, cash flows, and prospects
.
|
|
•
|
Our operations are subject to extensive governmental laws and regulations. If we are found to be in purported violation of or subject to liabilities under any of these laws or regulations, or if new laws or regulations are enacted that adversely affect our operations, our business, operating results, and prospects could suffer
.
|
|
•
|
A failure of our information systems or any security breach or unauthorized disclosure of confidential information could have a material adverse effect on our business
.
|
|
•
|
Our debt agreements contain certain financial ratios and other restrictions on our ability to conduct our business, and our substantial indebtedness could adversely affect our financial condition and operations and prevent us from fulfilling our debt service obligations
.
|
|
•
|
We are subject to interest rate risk in connection with our vehicle floorplan payables, revolving credit facility, and commercial paper program that could have a material adverse effect on our profitability
.
|
|
•
|
Goodwill and other intangible assets comprise a significant portion of our total assets. We must test our goodwill and other intangible assets for impairment at least annually, which could result in a material, non-cash write-down of goodwill or franchise rights and could have a material adverse impact on our results of operations and shareholders’ equity
.
|
|
•
|
Our largest stockholders, as a result of their ownership stakes in us, may have the ability to exert substantial influence over actions to be taken or approved by our stockholders or Board of Directors. In addition, future share repurchases and fluctuations in the levels of ownership of our largest stockholders could impact the volume of trading, liquidity, and market price of our common stock
.
|
Additional Information
Investors and others should note that we announce material financial information using our company website (
www.autonation.com
), our investor relations website (
investors.autonation.com
), SEC filings, press releases, public conference calls and webcasts. Information about AutoNation, its business, and its results of operations may also be announced by posts on the following social media channels:
|
•
|
AutoNation’s Twitter feed (
www.twitter.com/autonation
)
|
|
•
|
Mike Jackson’s Twitter feed (
www.twitter.com/CEOMikeJackson
)
|
|
•
|
AutoNation’s Facebook page (
www.facebook.com/autonation
)
|
|
•
|
Mike Jackson’s Facebook page (
www.facebook.com/CEOMikeJackson
)
|
The information that we post on these social media channels could be deemed to be material information. As a result, we encourage investors, the media, and others interested in AutoNation to review the information that we post on these social media channels. These channels may be updated from time to time on AutoNation’s investor relations website. The information on or accessible through our websites and social media channels is not incorporated by reference in this Annual Report on Form 10-K.
52
ITEM 7A.
QUANTITATIVE AND QUALITATIVE DISCLOSURES ABOUT MARKET RISK
Interest Rate Risk
Our primary market risk exposure is increasing LIBOR-based interest rates. Interest rate derivatives may be used to hedge a portion of our variable rate debt, when appropriate, based on market conditions.
We had
$3.8 billion
of variable rate vehicle floorplan payable at
December 31, 2016
, and
$3.7 billion
at
December 31, 2015
. Based on these amounts, a 100 basis point change in interest rates would result in an approximate change of
$38.5 million
in
2016
and
$37.3 million
in
2015
to our annual floorplan interest expense. Our exposure to changes in interest rates with respect to total vehicle floorplan payable is partially mitigated by manufacturers’ floorplan assistance, which in some cases is based on variable interest rates.
We had
$942.0 million
of commercial paper notes outstanding at
December 31, 2016
, and
$599.5 million
at
December 31, 2015
. Based on the amounts outstanding, a 100 basis point change in interest rates would result in an approximate change to our annual interest expense of
$9.4 million
in
2016
and
$6.0 million
in
2015
.
Our fixed rate long-term debt, consisting of amounts outstanding under senior unsecured notes, mortgages, and capital lease and other debt obligations, totaled
$1.8 billion
and had a fair value of
$1.9 billion
as of
December 31, 2016
, and as of
December 31, 2015
.
53
ITEM 8.
FINANCIAL STATEMENTS AND SUPPLEMENTARY DATA
INDEX TO CONSOLIDATED FINANCIAL STATEMENTS
|
|
Page
|
54
Report of Independent Registered Public Accounting Firm
The Board of Directors and Shareholders
AutoNation, Inc.:
We have audited the accompanying consolidated balance sheets of AutoNation, Inc. and subsidiaries as of December 31,
2016
and
2015
, and the related consolidated statements of income, shareholders’ equity, and cash flows for each of the years in the three-year period ended December 31,
2016
. These consolidated financial statements are the responsibility of the Company’s management. Our responsibility is to express an opinion on these consolidated financial statements based on our audits.
We conducted our audits in accordance with the standards of the Public Company Accounting Oversight Board (United States). Those standards require that we plan and perform the audit to obtain reasonable assurance about whether the financial statements are free of material misstatement. An audit includes examining, on a test basis, evidence supporting the amounts and disclosures in the financial statements. An audit also includes assessing the accounting principles used and significant estimates made by management, as well as evaluating the overall financial statement presentation. We believe that our audits provide a reasonable basis for our opinion.
In our opinion, the consolidated financial statements referred to above present fairly, in all material respects, the financial position of AutoNation, Inc. and subsidiaries as of December 31,
2016
and
2015
, and the results of their operations and their cash flows for each of the years in the three-year period ended December 31,
2016
, in conformity with U.S. generally accepted accounting principles.
We also have audited, in accordance with the standards of the Public Company Accounting Oversight Board (United States), AutoNation, Inc.’s internal control over financial reporting as of December 31,
2016
, based on criteria established in
Internal Control – Integrated Framework (2013)
issued by the Committee of Sponsoring Organizations of the Treadway Commission (COSO), and our report dated
February 8, 2017
expressed an unqualified opinion on the effectiveness of the Company’s internal control over financial reporting.
/s/ KPMG LLP
February 8, 2017
Fort Lauderdale, Florida
Certified Public Accountants
55
Report of Independent Registered Public Accounting Firm
The Board of Directors and Shareholders
AutoNation, Inc.:
We have audited AutoNation, Inc.’s internal control over financial reporting as of December 31,
2016
, based on criteria established in
Internal Control - Integrated Framework (2013)
issued by the Committee of Sponsoring Organizations of the Treadway Commission (COSO). AutoNation, Inc.’s management is responsible for maintaining effective internal control over financial reporting and for its assessment of the effectiveness of internal control over financial reporting, included in the accompanying Management’s Annual Report on Internal Control over Financial Reporting. Our responsibility is to express an opinion on AutoNation, Inc.’s internal control over financial reporting based on our audit.
We conducted our audit in accordance with the standards of the Public Company Accounting Oversight Board (United States). Those standards require that we plan and perform the audit to obtain reasonable assurance about whether effective internal control over financial reporting was maintained in all material respects. Our audit included obtaining an understanding of internal control over financial reporting, assessing the risk that a material weakness exists, and testing and evaluating the design and operating effectiveness of internal control based on the assessed risk. Our audit also included performing such other procedures as we considered necessary in the circumstances. We believe that our audit provides a reasonable basis for our opinion.
A company’s internal control over financial reporting is a process designed to provide reasonable assurance regarding the reliability of financial reporting and the preparation of financial statements for external purposes in accordance with generally accepted accounting principles. A company’s internal control over financial reporting includes those policies and procedures that (1) pertain to the maintenance of records that, in reasonable detail, accurately and fairly reflect the transactions and dispositions of the assets of the company; (2) provide reasonable assurance that transactions are recorded as necessary to permit preparation of financial statements in accordance with generally accepted accounting principles, and that receipts and expenditures of the company are being made only in accordance with authorizations of management and directors of the company; and (3) provide reasonable assurance regarding prevention or timely detection of unauthorized acquisition, use, or disposition of the company’s assets that could have a material effect on the financial statements.
Because of its inherent limitations, internal control over financial reporting may not prevent or detect misstatements. Also, projections of any evaluation of effectiveness to future periods are subject to the risk that controls may become inadequate because of changes in conditions, or that the degree of compliance with the policies or procedures may deteriorate.
In our opinion, AutoNation, Inc. maintained, in all material respects, effective internal control over financial reporting as of December 31,
2016
, based on criteria established in
Internal Control - Integrated Framework (2013)
issued by the Committee of Sponsoring Organizations of the Treadway Commission (COSO).
AutoNation, Inc. acquired two stores and one collision center in the fourth quarter of
2016
, and management excluded from its assessment of the effectiveness of AutoNation, Inc.’s internal control over financial reporting as of December 31,
2016
, the two stores and one collision center, which had less than 0.6% of total assets and less than 0.4% of total revenue included in the consolidated financial statements of AutoNation, Inc. and subsidiaries as of and for the year ended December 31,
2016
. Our audit of internal control over financial reporting of AutoNation, Inc. also excluded an evaluation of the internal control over financial reporting of the two stores and one collision center.
We also have audited, in accordance with the standards of the Public Company Accounting Oversight Board (United States), the consolidated balance sheets of AutoNation, Inc. and subsidiaries as of December 31,
2016
and
2015
, and the related consolidated statements of income, shareholders’ equity, and cash flows for each of the years in the three-year period ended December 31,
2016
, and our report dated
February 8, 2017
expressed an unqualified opinion on those consolidated financial statements.
/s/ KPMG LLP
February 8, 2017
Fort Lauderdale, Florida
Certified Public Accountants
56
AUTONATION, INC.
CONSOLIDATED BALANCE SHEETS
As of
December 31,
(In millions, except share and per share data)
|
2016
|
2015
|
||||||
|
ASSETS
|
|||||||
|
CURRENT ASSETS:
|
|||||||
|
Cash and cash equivalents
|
$
|
64.8
|
|
$
|
74.1
|
|
|
|
Receivables, net
|
1,032.9
|
|
908.2
|
|
|||
|
Inventory
|
3,520.1
|
|
3,612.0
|
|
|||
|
Other current assets
|
97.0
|
|
115.4
|
|
|||
|
Total Current Assets
|
4,714.8
|
|
4,709.7
|
|
|||
|
PROPERTY AND EQUIPMENT, NET
|
2,843.2
|
|
2,667.4
|
|
|||
|
GOODWILL, NET
|
1,511.3
|
|
1,394.5
|
|
|||
|
OTHER INTANGIBLE ASSETS, NET
|
598.2
|
|
439.9
|
|
|||
|
OTHER ASSETS
|
392.5
|
|
336.7
|
|
|||
|
Total Assets
|
$
|
10,060.0
|
|
$
|
9,548.2
|
|
|
|
LIABILITIES AND SHAREHOLDERS’ EQUITY
|
|||||||
|
CURRENT LIABILITIES:
|
|||||||
|
Vehicle floorplan payable - trade
|
$
|
2,308.8
|
|
$
|
2,565.8
|
|
|
|
Vehicle floorplan payable - non-trade
|
1,540.4
|
|
1,161.3
|
|
|||
|
Accounts payable
|
303.7
|
|
299.9
|
|
|||
|
Commercial paper
|
942.0
|
|
599.5
|
|
|||
|
Current maturities of long-term debt
|
167.5
|
|
11.7
|
|
|||
|
Other current liabilities
|
566.8
|
|
529.2
|
|
|||
|
Total Current Liabilities
|
5,829.2
|
|
5,167.4
|
|
|||
|
LONG-TERM DEBT, NET OF CURRENT MATURITIES
|
1,611.1
|
|
1,745.3
|
|
|||
|
DEFERRED INCOME TAXES
|
91.5
|
|
78.6
|
|
|||
|
OTHER LIABILITIES
|
217.9
|
|
207.6
|
|
|||
|
COMMITMENTS AND CONTINGENCIES (Note 8)
|
|
|
|||||
|
SHAREHOLDERS’ EQUITY:
|
|||||||
|
Preferred stock, par value $0.01 per share; 5,000,000 shares authorized; none issued
|
—
|
|
—
|
|
|||
|
Common stock, par value $0.01 per share; 1,500,000,000 shares authorized; 120,562,149 shares issued at December 31, 2016, and December 31, 2015, including shares held in treasury
|
1.2
|
|
1.2
|
|
|||
|
Additional paid-in capital
|
18.2
|
|
5.2
|
|
|||
|
Retained earnings
|
3,133.3
|
|
2,702.8
|
|
|||
|
Treasury stock, at cost; 19,909,940 and 9,758,091 shares held, respectively
|
(842.4
|
)
|
(359.9
|
)
|
|||
|
Total Shareholders’ Equity
|
2,310.3
|
|
2,349.3
|
|
|||
|
Total Liabilities and Shareholders’ Equity
|
$
|
10,060.0
|
|
$
|
9,548.2
|
|
|
See accompanying Notes to Consolidated Financial Statements.
57
AUTONATION, INC.
CONSOLIDATED STATEMENTS OF INCOME
For the Years Ended
December 31,
(In millions, except per share data)
|
2016
|
2015
|
2014
|
|||||||||
|
Revenue:
|
|||||||||||
|
New vehicle
|
$
|
12,255.8
|
|
$
|
11,995.0
|
|
$
|
10,972.2
|
|
||
|
Used vehicle
|
4,995.3
|
|
4,768.7
|
|
4,385.7
|
|
|||||
|
Parts and service
|
3,321.4
|
|
3,082.8
|
|
2,822.5
|
|
|||||
|
Finance and insurance, net
|
894.6
|
|
868.7
|
|
750.8
|
|
|||||
|
Other
|
141.9
|
|
146.8
|
|
177.6
|
|
|||||
|
TOTAL REVENUE
|
21,609.0
|
|
20,862.0
|
|
19,108.8
|
|
|||||
|
Cost of Sales:
|
|||||||||||
|
New vehicle
|
11,620.0
|
|
11,321.9
|
|
10,322.1
|
|
|||||
|
Used vehicle
|
4,677.7
|
|
4,415.0
|
|
4,025.1
|
|
|||||
|
Parts and service
|
1,886.7
|
|
1,744.8
|
|
1,625.9
|
|
|||||
|
Other
|
111.4
|
|
118.8
|
|
147.0
|
|
|||||
|
TOTAL COST OF SALES (excluding depreciation shown below)
|
18,295.8
|
|
17,600.5
|
|
16,120.1
|
|
|||||
|
Gross Profit:
|
|||||||||||
|
New vehicle
|
635.8
|
|
673.1
|
|
650.1
|
|
|||||
|
Used vehicle
|
317.6
|
|
353.7
|
|
360.6
|
|
|||||
|
Parts and service
|
1,434.7
|
|
1,338.0
|
|
1,196.6
|
|
|||||
|
Finance and insurance
|
894.6
|
|
868.7
|
|
750.8
|
|
|||||
|
Other
|
30.5
|
|
28.0
|
|
30.6
|
|
|||||
|
TOTAL GROSS PROFIT
|
3,313.2
|
|
3,261.5
|
|
2,988.7
|
|
|||||
|
Selling, general, and administrative expenses
|
2,349.4
|
|
2,263.5
|
|
2,079.6
|
|
|||||
|
Depreciation and amortization
|
143.4
|
|
127.4
|
|
106.9
|
|
|||||
|
Franchise rights impairment
|
—
|
|
15.4
|
|
—
|
|
|||||
|
Other income, net
|
(69.1
|
)
|
(17.9
|
)
|
(18.6
|
)
|
|||||
|
OPERATING INCOME
|
889.5
|
|
873.1
|
|
820.8
|
|
|||||
|
Non-operating income (expense) items:
|
|||||||||||
|
Floorplan interest expense
|
(76.5
|
)
|
(58.3
|
)
|
(53.3
|
)
|
|||||
|
Other interest expense
|
(115.5
|
)
|
(90.9
|
)
|
(86.7
|
)
|
|||||
|
Loss on debt extinguishment
|
—
|
|
—
|
|
(1.6
|
)
|
|||||
|
Interest income
|
1.1
|
|
0.1
|
|
0.2
|
|
|||||
|
Other income (loss), net
|
3.7
|
|
(1.3
|
)
|
2.9
|
|
|||||
|
INCOME FROM CONTINUING OPERATIONS BEFORE INCOME TAXES
|
702.3
|
|
722.7
|
|
682.3
|
|
|||||
|
Income tax provision
|
270.6
|
|
279.0
|
|
262.5
|
|
|||||
|
NET INCOME FROM CONTINUING OPERATIONS
|
431.7
|
|
443.7
|
|
419.8
|
|
|||||
|
Loss from discontinued operations, net of income taxes
|
(1.2
|
)
|
(1.1
|
)
|
(1.1
|
)
|
|||||
|
NET INCOME
|
$
|
430.5
|
|
$
|
442.6
|
|
$
|
418.7
|
|
||
|
BASIC EARNINGS (LOSS) PER SHARE:
|
|||||||||||
|
Continuing operations
|
$
|
4.19
|
|
$
|
3.94
|
|
$
|
3.58
|
|
||
|
Discontinued operations
|
$
|
(0.01
|
)
|
$
|
(0.01
|
)
|
$
|
(0.01
|
)
|
||
|
Net income
|
$
|
4.18
|
|
$
|
3.93
|
|
$
|
3.57
|
|
||
|
Weighted average common shares outstanding
|
103.1
|
|
112.7
|
|
117.3
|
|
|||||
|
DILUTED EARNINGS (LOSS) PER SHARE:
|
|||||||||||
|
Continuing operations
|
$
|
4.16
|
|
$
|
3.90
|
|
$
|
3.53
|
|
||
|
Discontinued operations
|
$
|
(0.01
|
)
|
$
|
(0.01
|
)
|
$
|
(0.01
|
)
|
||
|
Net income
|
$
|
4.15
|
|
$
|
3.89
|
|
$
|
3.52
|
|
||
|
Weighted average common shares outstanding
|
103.8
|
|
113.9
|
|
118.9
|
|
|||||
|
COMMON SHARES OUTSTANDING, net of treasury stock, at period end
|
100.7
|
|
110.8
|
|
113.3
|
|
|||||
See accompanying Notes to Consolidated Financial Statements.
58
AUTONATION, INC.
CONSOLIDATED STATEMENTS OF SHAREHOLDERS’ EQUITY
For the Years Ended
December 31, 2016
,
2015
, and
2014
(In millions, except share data)
|
|
Common Stock
|
Additional
Paid-In
Capital
|
Retained
Earnings
|
Treasury
Stock
|
Total
|
|||||||||||||||||
|
|
Shares
|
Amount
|
||||||||||||||||||||
|
BALANCE AT DECEMBER 31, 2013
|
163,562,149
|
|
$
|
1.6
|
|
$
|
42.8
|
|
$
|
3,337.9
|
|
$
|
(1,320.6
|
)
|
$
|
2,061.7
|
|
|||||
|
Net income
|
—
|
|
—
|
|
—
|
|
418.7
|
|
—
|
|
418.7
|
|
||||||||||
|
Repurchases of common stock
|
—
|
|
—
|
|
—
|
|
—
|
|
(487.7
|
)
|
(487.7
|
)
|
||||||||||
|
Stock-based compensation expense
|
—
|
|
—
|
|
26.3
|
|
—
|
|
—
|
|
26.3
|
|
||||||||||
|
Shares awarded under stock-based compensation plans, including excess income tax benefit of $18.0
|
—
|
|
—
|
|
(7.3
|
)
|
—
|
|
60.4
|
|
53.1
|
|
||||||||||
|
BALANCE AT DECEMBER 31, 2014
|
163,562,149
|
|
$
|
1.6
|
|
$
|
61.8
|
|
$
|
3,756.6
|
|
$
|
(1,747.9
|
)
|
$
|
2,072.1
|
|
|||||
|
Net income
|
—
|
|
—
|
|
—
|
|
442.6
|
|
—
|
|
442.6
|
|
||||||||||
|
Repurchases of common stock
|
—
|
|
—
|
|
—
|
|
—
|
|
(237.3
|
)
|
(237.3
|
)
|
||||||||||
|
Treasury stock cancellation
|
(43,000,000
|
)
|
(0.4
|
)
|
(78.7
|
)
|
(1,496.4
|
)
|
1,575.5
|
|
—
|
|
||||||||||
|
Stock-based compensation expense
|
—
|
|
—
|
|
24.0
|
|
—
|
|
—
|
|
24.0
|
|
||||||||||
|
Shares awarded under stock-based compensation plans, including excess income tax benefit of $17.9
|
—
|
|
—
|
|
(1.9
|
)
|
—
|
|
49.8
|
|
47.9
|
|
||||||||||
|
BALANCE AT DECEMBER 31, 2015
|
120,562,149
|
|
$
|
1.2
|
|
$
|
5.2
|
|
$
|
2,702.8
|
|
$
|
(359.9
|
)
|
$
|
2,349.3
|
|
|||||
|
Net income
|
—
|
|
—
|
|
—
|
|
430.5
|
|
—
|
|
430.5
|
|
||||||||||
|
Repurchases of common stock
|
—
|
|
—
|
|
—
|
|
—
|
|
(499.0
|
)
|
(499.0
|
)
|
||||||||||
|
Stock-based compensation expense
|
—
|
|
—
|
|
25.1
|
|
—
|
|
—
|
|
25.1
|
|
||||||||||
|
Shares awarded under stock-based compensation plans, including excess income tax benefit of $0.6
|
—
|
|
—
|
|
(7.5
|
)
|
—
|
|
16.5
|
|
9.0
|
|
||||||||||
|
Other
|
—
|
|
—
|
|
(4.6
|
)
|
—
|
|
—
|
|
(4.6
|
)
|
||||||||||
|
BALANCE AT DECEMBER 31, 2016
|
120,562,149
|
|
$
|
1.2
|
|
$
|
18.2
|
|
$
|
3,133.3
|
|
$
|
(842.4
|
)
|
$
|
2,310.3
|
|
|||||
See accompanying Notes to Consolidated Financial Statements.
59
AUTONATION, INC.
For the Years Ended
December 31,
(In millions)
|
2016
|
2015
|
2014
|
|||||||||
|
CASH PROVIDED BY (USED IN) OPERATING ACTIVITIES:
|
|||||||||||
|
Net income
|
$
|
430.5
|
|
$
|
442.6
|
|
$
|
418.7
|
|
||
|
Adjustments to reconcile net income to net cash provided by operating activities:
|
|||||||||||
|
Loss from discontinued operations
|
1.2
|
|
1.1
|
|
1.1
|
|
|||||
|
Depreciation and amortization
|
143.4
|
|
127.4
|
|
106.9
|
|
|||||
|
Amortization of debt issuance costs and accretion of debt discounts
|
5.4
|
|
4.7
|
|
5.7
|
|
|||||
|
Stock-based compensation expense
|
25.1
|
|
24.0
|
|
26.3
|
|
|||||
|
Franchise rights impairment
|
—
|
|
15.4
|
|
—
|
|
|||||
|
Non-cash impairment charges
|
14.0
|
|
6.1
|
|
1.1
|
|
|||||
|
Write-off of deferred debt issuance costs
|
—
|
|
—
|
|
0.4
|
|
|||||
|
Net gain on asset sales and dispositions
|
(62.6
|
)
|
(23.8
|
)
|
(13.8
|
)
|
|||||
|
Deferred income tax provision
|
3.7
|
|
10.0
|
|
9.5
|
|
|||||
|
Excess tax benefit from stock-based awards
|
(0.6
|
)
|
(17.9
|
)
|
(18.0
|
)
|
|||||
|
Other
|
(10.6
|
)
|
1.3
|
|
(2.0
|
)
|
|||||
|
(Increase) decrease, net of effects from business combinations
and divestitures:
|
|||||||||||
|
Receivables
|
(99.3
|
)
|
(91.8
|
)
|
(80.3
|
)
|
|||||
|
Inventory
|
259.1
|
|
(548.8
|
)
|
(27.3
|
)
|
|||||
|
Other assets
|
(33.6
|
)
|
(8.8
|
)
|
(41.1
|
)
|
|||||
|
Increase (decrease), net of effects from business combinations
and divestitures:
|
|||||||||||
|
Vehicle floorplan payable-trade, net
|
(196.4
|
)
|
488.0
|
|
(27.2
|
)
|
|||||
|
Accounts payable
|
(5.8
|
)
|
37.7
|
|
7.5
|
|
|||||
|
Other liabilities
|
43.8
|
|
41.0
|
|
118.7
|
|
|||||
|
Net cash provided by continuing operations
|
517.3
|
|
508.2
|
|
486.2
|
|
|||||
|
Net cash used in discontinued operations
|
(1.3
|
)
|
(1.0
|
)
|
(1.1
|
)
|
|||||
|
Net cash provided by operating activities
|
516.0
|
|
507.2
|
|
485.1
|
|
|||||
|
CASH PROVIDED BY (USED IN) INVESTING ACTIVITIES:
|
|||||||||||
|
Purchases of property and equipment
|
(244.5
|
)
|
(247.6
|
)
|
(209.2
|
)
|
|||||
|
Property operating lease buy-outs
|
(5.0
|
)
|
(10.2
|
)
|
(0.4
|
)
|
|||||
|
Proceeds from the sale of property and equipment
|
8.7
|
|
21.9
|
|
5.5
|
|
|||||
|
Proceeds from the disposal of assets held for sale
|
4.8
|
|
11.5
|
|
2.6
|
|
|||||
|
Insurance recoveries on property and equipment
|
3.1
|
|
1.0
|
|
—
|
|
|||||
|
Cash used in business acquisitions, net of cash acquired
|
(410.4
|
)
|
(321.5
|
)
|
(205.2
|
)
|
|||||
|
Cash received from business divestitures, net of cash relinquished
|
150.4
|
|
43.9
|
|
41.4
|
|
|||||
|
Net change in restricted cash
|
3.3
|
|
(3.8
|
)
|
—
|
|
|||||
|
Proceeds from the sales of restricted investments
|
—
|
|
—
|
|
0.5
|
|
|||||
|
Other
|
(0.1
|
)
|
(4.6
|
)
|
(11.2
|
)
|
|||||
|
Net cash used in continuing operations
|
(489.7
|
)
|
(509.4
|
)
|
(376.0
|
)
|
|||||
|
Net cash used in discontinued operations
|
—
|
|
—
|
|
—
|
|
|||||
|
Net cash used in investing activities
|
(489.7
|
)
|
(509.4
|
)
|
(376.0
|
)
|
|||||
See accompanying Notes to Consolidated Financial Statements.
60
AUTONATION, INC.
CONSOLIDATED STATEMENTS OF CASH FLOWS
For the Years Ended
December 31,
(In millions)
(Continued)
|
2016
|
2015
|
2014
|
|||||||||
|
CASH PROVIDED BY (USED IN) FINANCING ACTIVITIES:
|
|||||||||||
|
Repurchases of common stock
|
(499.0
|
)
|
(237.3
|
)
|
(487.7
|
)
|
|||||
|
Proceeds from 3.35% Senior Notes due 2021
|
—
|
|
300.0
|
|
—
|
|
|||||
|
Proceeds from 4.5% Senior Notes due 2025
|
—
|
|
448.5
|
|
—
|
|
|||||
|
Payment of term loan facility
|
—
|
|
—
|
|
(500.0
|
)
|
|||||
|
Proceeds from revolving credit facilities
|
1,330.0
|
|
1,410.0
|
|
2,780.0
|
|
|||||
|
Payments of revolving credit facilities
|
(1,330.0
|
)
|
(2,520.0
|
)
|
(1,970.0
|
)
|
|||||
|
Net proceeds from commercial paper
|
342.5
|
|
599.5
|
|
—
|
|
|||||
|
Payment of debt issuance costs
|
—
|
|
(6.4
|
)
|
(6.0
|
)
|
|||||
|
Net proceeds from (payments of) vehicle floorplan payable - non-trade
|
153.8
|
|
(13.3
|
)
|
61.6
|
|
|||||
|
Purchase of subsidiary shares
|
(15.2
|
)
|
—
|
|
—
|
|
|||||
|
Payments of mortgage facilities
|
(22.5
|
)
|
(9.8
|
)
|
(9.2
|
)
|
|||||
|
Payments of capital lease and other debt obligations
|
(4.2
|
)
|
(18.2
|
)
|
(24.7
|
)
|
|||||
|
Proceeds from the exercise of stock options
|
8.4
|
|
30.0
|
|
35.1
|
|
|||||
|
Excess tax benefit from stock-based awards
|
0.6
|
|
17.9
|
|
18.0
|
|
|||||
|
Net cash provided by (used in) continuing operations
|
(35.6
|
)
|
0.9
|
|
(102.9
|
)
|
|||||
|
Net cash used in discontinued operations
|
—
|
|
—
|
|
—
|
|
|||||
|
Net cash provided by (used in) financing activities
|
(35.6
|
)
|
0.9
|
|
(102.9
|
)
|
|||||
|
INCREASE (DECREASE) IN CASH AND CASH EQUIVALENTS
|
(9.3
|
)
|
(1.3
|
)
|
6.2
|
|
|||||
|
CASH AND CASH EQUIVALENTS at beginning of period
|
74.1
|
|
75.4
|
|
69.2
|
|
|||||
|
CASH AND CASH EQUIVALENTS at end of period
|
$
|
64.8
|
|
$
|
74.1
|
|
$
|
75.4
|
|
||
See accompanying Notes to Consolidated Financial Statements.
61
AUTONATION, INC.
NOTES TO CONSOLIDATED FINANCIAL STATEMENTS
(All tables in millions, except per share data)
1. DESCRIPTION OF BUSINESS AND SUMMARY OF SIGNIFICANT ACCOUNTING POLICIES
Organization and Business
AutoNation, Inc., through its subsidiaries, is the largest automotive retailer in the United States. As of
December 31, 2016
, we owned and operated
371
new vehicle franchises from
260
stores located in the United States, predominantly in major metropolitan markets in the Sunbelt region. Our stores sell
35
different new vehicle brands. The core brands of new vehicles that we sell, representing approximately
94%
of the new vehicles that we sold in
2016
, are manufactured by
Toyota (including Lexus), Ford, Honda, General Motors, FCA US, Mercedes-Benz, Nissan, BMW, and Volkswagen (including Audi and Porsche)
.
We offer a diversified range of automotive products and services, including new vehicles, used vehicles, “parts and service,” which includes automotive repair and maintenance services as well as wholesale parts and collision businesses, and automotive “finance and insurance” products, which include vehicle service and other protection products, as well as the arranging of financing for vehicle purchases through third-party finance sources.
For convenience, the terms “AutoNation,” “Company,” and “we” are used to refer collectively to AutoNation, Inc. and its subsidiaries, unless otherwise required by the context. Our dealership operations are conducted by our subsidiaries.
Basis of Presentation
The accompanying Consolidated Financial Statements include the accounts of AutoNation, Inc. and its subsidiaries. All of our automotive dealership subsidiaries are indirectly wholly owned by the parent company, AutoNation, Inc. Intercompany accounts and transactions have been eliminated in the consolidation.
Use of Estimates
The preparation of financial statements in conformity with accounting principles generally accepted in the United States requires management to make estimates and assumptions that affect the reported amounts of assets and liabilities and disclosure of contingent assets and liabilities at the date of the financial statements and the reported amounts of revenue and expenses during the reporting period. In preparing these financial statements, management has made its best estimates and judgments of certain amounts included in the financial statements. We base our estimates and judgments on historical experience and other assumptions that we believe are reasonable. However, application of these accounting policies involves the exercise of judgment and use of assumptions as to future uncertainties and, as a result, actual results could differ materially from these estimates. We periodically evaluate estimates and assumptions used in the preparation of the financial statements and make changes on a prospective basis when adjustments are necessary. The significant estimates made in the accompanying Consolidated Financial Statements include certain assumptions related to goodwill, intangible assets, long-lived assets, assets held for sale, accruals for chargebacks against revenue recognized from the sale of finance and insurance products, accruals related to self-insurance programs, certain legal proceedings, estimated tax liabilities, and certain assumptions related to stock-based compensation.
Cash and Cash Equivalents
We consider all highly liquid investments with a maturity of three months or less as of the date of purchase to be cash equivalents unless the investments are legally or contractually restricted for more than three months. Under our cash management system, outstanding checks that are in excess of the cash balances at certain banks are included in Accounts Payable in the Consolidated Balance Sheets and changes in these amounts are reflected in operating cash flows in the accompanying Consolidated Statements of Cash Flows.
Inventory
Inventory consists primarily of new and used vehicles held for sale, valued at the lower of cost or market using the specific identification method. Cost includes acquisition, reconditioning, dealer installed accessories, and transportation expenses. Our new vehicle inventory costs are generally reduced by manufacturer holdbacks (percentage of either the manufacturer’s suggested retail price or invoice price of a new vehicle that the manufacturer repays to the dealer),
62
incentives, floorplan assistance, and non-reimbursement-based manufacturer advertising assistance. Parts, accessories, and other inventory are valued at the lower of acquisition cost (first-in, first-out) or market. See Note
3
of the Notes to Consolidated Financial Statements for more detailed information about our inventory.
Property and Equipment, net
Property and equipment are recorded at cost less accumulated depreciation. Expenditures for major additions and improvements are capitalized, while minor replacements, maintenance, and repairs are charged to expense as incurred. In addition, we capitalize interest on borrowings during the active construction period of capital projects. Capitalized interest is added to the cost of the assets and depreciated over the estimated useful lives of the assets. Leased property meeting certain criteria is capitalized and the present value of the related lease payments is recorded as a liability and included in current and/or long-term debt based on the lease term. When property is retired or otherwise disposed of, the cost and accumulated depreciation are removed from the accounts and any resulting gain or loss is reflected in Other Income, Net (within Operating Income) in the Consolidated Statements of Income. See Note
4
of the Notes to Consolidated Financial Statements for detailed information about our property and equipment.
Depreciation is recorded over the estimated useful lives of the assets involved using the straight-line method. Leasehold improvements and capitalized lease assets are amortized to depreciation expense over the estimated useful life of the asset or the respective lease term used in determining lease classification, whichever is shorter. The range of estimated useful lives is as follows:
|
Buildings and improvements
|
5
to
40
years
|
|
Furniture, fixtures, and equipment
|
3
to
10
years
|
We continually evaluate property and equipment, including leasehold improvements, to determine whether events or changes in circumstances have occurred that may warrant revision of the estimated useful life or whether the remaining balance should be evaluated for possible impairment. We use an estimate of the related undiscounted cash flows over the remaining life of the property and equipment in assessing whether an asset has been impaired. We measure impairment losses based upon the amount by which the carrying amount of the asset exceeds the fair value.
When property and equipment is identified as held for sale, we reclassify the held for sale assets to Other Current Assets and cease recording depreciation. Assets held for sale in both continuing operations and discontinued operations are reported in the “Corporate and other” category of our segment information.
We had assets held for sale of
$41.4 million
at December 31,
2016
, and
$47.1 million
at December 31,
2015
, included in continuing operations. We had assets held for sale of
$15.7 million
at December 31,
2016
, and
$22.3 million
at December 31,
2015
, included in discontinued operations.
See Note
16
of the Notes to Consolidated Financial Statements for information about our fair value measurement valuation process and impairment charges that were recorded during
2016
and
2015
.
Goodwill and Other Intangible Assets, net
Goodwill consists of the cost of acquired businesses in excess of the fair value of the net assets acquired. Additionally, other intangible assets are separately recognized if the benefit of the intangible asset is obtained through contractual or other legal rights, or if the intangible asset can be sold, transferred, licensed, rented, or exchanged, regardless of our intent to do so.
Our principal identifiable intangible assets are rights under franchise agreements with vehicle manufacturers. We generally expect our franchise agreements to survive for the foreseeable future and, when the agreements do not have indefinite terms, anticipate routine renewals of the agreements without substantial cost. The contractual terms of our franchise agreements provide for various durations, ranging from
one
year to no expiration date, and in certain cases, manufacturers have undertaken to renew such franchises upon expiration so long as the dealership is in compliance with
63
the terms of the agreement. However, in general, the states in which we operate have automotive dealership franchise laws that provide that, notwithstanding the terms of any franchise agreement, it is unlawful for a manufacturer to terminate or not renew a franchise unless “good cause” exists. It is generally difficult, outside of bankruptcy, for a manufacturer to terminate or not renew a franchise under these franchise laws, which were designed to protect dealers. In addition, in our experience and historically in the automotive retail industry, dealership franchise agreements are rarely involuntarily terminated or not renewed by the manufacturer outside of bankruptcy. Accordingly, we believe that our franchise agreements will contribute to cash flows for the foreseeable future and have indefinite lives. Other intangible assets are amortized using a straight-line method over their useful lives, generally ranging from
five
to
thirty
years.
We do not amortize goodwill or franchise rights assets. Goodwill and franchise rights are tested for impairment annually or more frequently when events or changes in circumstances indicate that impairment may have occurred. We completed our annual impairment tests for both goodwill and franchise rights as of
April 30
,
2016
. Based on our qualitative assessment of potential goodwill impairment, we determined that it was not more likely than not that the fair values of our reporting units were less than their carrying amounts and we recorded
no
goodwill impairment charges during
2016
. Based on our qualitative assessment of potential franchise rights impairment, we determined that we should perform a quantitative test for certain franchise rights; however,
no
impairment charges resulted from these quantitative tests during
2016
.
We completed our annual impairment tests for both goodwill and franchise rights as of
April 30
,
2015
. Based on our qualitative assessment of potential goodwill impairment, we determined that it was not more likely than not that the fair values of our reporting units were less than their carrying amounts and we recorded
no
goodwill impairment charges during
2015
. Based on our qualitative assessment of potential franchise rights impairment, we determined that we should perform a quantitative test for certain franchise rights, and
no
impairment charges resulted from the quantitative tests. As a result of the issues related to Volkswagen associated with certain of its diesel engine vehicles, during the fourth quarter of 2015, we performed a quantitative impairment test of the franchise rights recorded at our Volkswagen stores. As a result of this test, we recorded non-cash impairment charges of
$15.4 million
to reduce the carrying values of the Volkswagen franchise rights to their estimated fair values.
See Note
5
of the Notes to Consolidated Financial Statements for more information about our goodwill and other intangible assets and Note
16
of the Notes to Consolidated Financial Statements for information about our annual impairment tests of goodwill and franchise rights.
Other Current Assets
Other current assets consist of various items, including, among other items, property and equipment held for sale in continuing operations and discontinued operations and prepaid expenses.
Other Assets
Other assets consist of various items, including, among other items, service loaner and rental vehicle inventory, net, and the cash surrender value of corporate-owned life insurance held in a Rabbi Trust for deferred compensation plan participants.
Other Current Liabilities
Other current liabilities consist of various items payable within one year including, among other items, accruals for payroll and benefits, sales taxes, the current portions of finance and insurance chargeback liabilities, self-insurance liabilities, and deferred revenue, customer deposits, accrued interest payable, and accrued expenses.
Other Liabilities
Other liabilities consist of various items payable beyond one year including, among other items, the long-term portions of deferred compensation obligations, finance and insurance chargeback liabilities, self-insurance liabilities, and deferred revenue.
64
Employee Savings Plans
We offer a 401(k) plan to all of our employees and provide a matching contribution to certain employees that participate in the plan. We provided a matching contribution of
$6.8 million
in
2016
,
$6.8 million
in
2015
, and
$5.9 million
in
2014
. Employer matching contributions are subject to a
three
-year graded vesting period for employees hired subsequent to
January 1, 2011
, and are fully vested immediately upon contribution for employees hired prior to January 1, 2011.
We offer a deferred compensation plan (the “Plan”) to provide certain employees and non-employee directors with the opportunity to accumulate assets for retirement on a tax-deferred basis. Participants in the Plan are allowed to defer a portion of their compensation and are fully vested in their respective deferrals and earnings. Participants may choose from a variety of investment options, which determine their earnings credits. We provided a matching contribution to employee participants in the Plan of
$0.7 million
for
2016
,
$0.6 million
for
2015
, and
$0.6 million
for
2014
. One-third of the matching contribution is vested and credited to participants on the first business day of the subsequent calendar year, and an additional one-third vests and is credited on each of the first and second anniversaries of such date. We may also make discretionary contributions, which vest
three
years after the effective date of the discretionary contribution. Participants eligible for a matching contribution under the Plan are not eligible for a matching contribution in our 401(k) plan. The balances due to participants in the Plan were
$68.2 million
as of December 31,
2016
, and
$64.6 million
as of December 31,
2015
, and are included in Other Current Liabilities and Other Liabilities in the accompanying Consolidated Balance Sheets.
Stock-Based Compensation
In 2016, 2015, and 2014, we granted stock-based awards in the form of stock options, restricted stock, and restricted stock units (“RSUs”). Stock options granted under all plans are non-qualified. Upon exercise, shares of common stock are issued from our treasury stock. We use the Black-Scholes valuation model to determine compensation expense associated with our stock options. Restricted stock awards, which are considered nonvested share awards as defined under generally accepted accounting principles, and RSUs are issued from our treasury stock. Compensation cost for restricted stock awards and RSUs is based on the closing price of our common stock on the date of grant. Certain of our equity-based compensation plans contain provisions that provide for vesting of awards upon retirement. Accordingly, compensation cost for stock-based awards is recognized on a straight-line basis, net of estimated forfeitures, over the shorter of the stated vesting period or the period until employees become retirement-eligible. See Note
10
of the Notes to Consolidated Financial Statements for more information about our stock-based compensation arrangements.
Revenue Recognition
Revenue consists of the sales of new and used vehicles, sales of parts and automotive services, commissions from finance and insurance products, and sales of other products. We recognize revenue (which excludes sales taxes) in the period in which products are sold or services are provided. The automotive services we provide include, but are not limited to, customer-paid repairs and maintenance, as well as repairs and maintenance under manufacturer warranties and extended service contracts. We recognize vehicle and finance and insurance revenue when a sales contract has been executed, the vehicle has been delivered, and payment has been received or financing has been arranged. Revenue on finance and insurance products represents commissions earned by us for the placement of: (i) loans and leases with financial institutions in connection with customer vehicle purchases financed, (ii) vehicle service contracts with third-party providers, and (iii) other protection products with third-party providers.
We sell and receive a commission, which is recognized upon sale, on the following types of products: extended service contracts, maintenance programs, guaranteed auto protection (known as “GAP,” this protection covers the shortfall between a customer’s loan balance and insurance payoff in the event of a casualty), “tire and wheel” protection, and theft protection products. The products we offer include products that are sold and administered by independent third parties, including the vehicle manufacturers’ captive finance subsidiaries. Pursuant to our arrangements with these third-party providers, we primarily sell the products on a straight commission basis; however, we may sell the product, recognize commission, and participate in future profit pursuant to retrospective commission arrangements with the issuers of those contracts, which is recognized as earned. Certain commissions earned from the sales of finance and insurance products are
65
subject to chargeback should the contracts be terminated prior to their expirations. An estimated liability for chargebacks against revenue recognized from sales of finance and insurance products is recorded in the period in which the related revenue is recognized. Our estimated liability for chargebacks is based primarily on our historical chargeback experience, and is influenced by the volume of vehicle sales in recent years, product penetration, product mix, and increases or decreases in early termination rates resulting from cancellation of vehicle service contracts and other protection products, defaults, refinancings and payoffs before maturity, and other factors. Chargeback liabilities were
$116.8 million
at December 31,
2016
, and
$97.3 million
at December 31,
2015
. See Note
18
of the Notes to Consolidated Financial Statements for more information regarding chargeback liabilities.
Insurance
Under our self-insurance programs, we retain various levels of aggregate loss limits, per claim deductibles, and claims-handling expenses as part of our various insurance programs, including property and casualty, employee medical benefits, automobile, and workers’ compensation. Costs in excess of this retained risk per claim may be insured under various contracts with third-party insurance carriers. We review our claim and loss history on a periodic basis to assist in assessing our future liability. The ultimate costs of these retained insurance risks are estimated by management and by third-party actuarial evaluation of historical claims experience, adjusted for current trends and changes in claims-handling procedures. See Note
6
of the Notes to Consolidated Financial Statements for more information on our self-insurance liabilities.
Manufacturer Incentives and Other Rebates
We receive various incentives from manufacturers based on achieving certain objectives, such as specified sales volume targets, as well as other objectives, including maintaining standards of a particular vehicle brand, which may include but are not limited to facility image and design requirements, customer satisfaction survey results, and training standards, among others. These incentives are typically based upon units purchased or sold. These manufacturer incentives are recognized as a reduction of new vehicle cost of sales when earned, generally at the time the related vehicles are sold or upon attainment of the particular program goals, whichever is later.
We also receive manufacturer rebates and assistance for holdbacks, floorplan interest, and non-reimbursement-based advertising expenses (described below), which are reflected as a reduction in the carrying value of each vehicle purchased by us. We recognize holdbacks, floorplan interest assistance, non-reimbursement-based advertising rebates, cash incentives, and other rebates received from manufacturers that are tied to specific vehicles as a reduction to cost of sales as the related vehicles are sold.
Advertising
We generally expense the cost of advertising as incurred, net of earned manufacturer reimbursements for specific advertising costs and other discounts. Advertising expense, net of manufacturer advertising reimbursements, was
$196.7 million
in
2016
,
$188.5 million
in
2015
, and
$164.9 million
in
2014
, and is reflected as a component of Selling, General, and Administrative Expenses in the accompanying Consolidated Statements of Income.
Manufacturer advertising rebates that are reimbursements of costs associated with specific advertising expenses are earned in accordance with the respective manufacturers’ reimbursement-based advertising assistance programs, which is typically after we have incurred the corresponding advertising expenses, and are reflected as a reduction of advertising expense. Manufacturer advertising reimbursements classified as an offset to advertising expenses were
$58.5 million
in
2016
,
$56.4 million
in
2015
, and
$47.1 million
in
2014
. All other non-reimbursement-based manufacturer advertising rebates that are not associated with specific advertising expenses are recorded as a reduction of inventory and recognized as a reduction of new vehicle cost of sales in the period the related vehicle is sold.
Parts and Service Internal Profit
Our parts and service departments recondition the majority of used vehicles acquired by our used vehicle departments and perform minor preparatory work on new vehicles acquired by our new vehicle departments. The parts and service
66
departments charge the new and used vehicle departments as if they were third parties in order to account for total activity performed by that department. Revenues and costs of sales associated with the internal work performed by our parts and service departments are reflected in our parts and service results in our Consolidated Statements of Income. New and used vehicle revenues and costs of sales are reduced by the amount of the intracompany charge. As a result, the revenues and costs of sales associated with the internal work performed by our parts and service departments are eliminated in consolidation. We also maintain an allowance for internal profit on vehicles that have not been sold.
Income Taxes
We file a consolidated federal income tax return. Deferred income taxes have been provided for temporary differences between the recognition of revenue and expenses for financial and income tax reporting purposes and between the tax basis of assets and liabilities and their reported amounts in the financial statements. See Note
11
of the Notes to Consolidated Financial Statements for more detailed information related to income taxes.
Taxes Assessed by Governmental Authorities
Taxes assessed by governmental authorities that are directly imposed on revenue transactions are excluded from revenue in our Consolidated Financial Statements.
Earnings (Loss) Per Share
Basic earnings (loss) per share is computed by dividing net income (loss) by the weighted average number of common shares outstanding for the period, including outstanding unvested restricted stock awards which contain rights to non-forfeitable dividends and vested restricted stock unit awards. Diluted earnings (loss) per share is computed by dividing net income (loss) by the weighted average number of shares outstanding, noted above, adjusted for the dilutive effect of stock options. See Note
12
of the Notes to Consolidated Financial Statements for more information on the computation of earnings (loss) per share.
Recent Accounting Pronouncements
Presentation of Debt Issuance Costs
In April 2015, the Financial Accounting Standards Board (“FASB”) issued an accounting standard update to simplify the presentation of debt issuance costs. The amendments in this accounting standard update require debt issuance costs be presented on the balance sheet as a direct reduction from the carrying amount of the related debt liability. In August 2015, the FASB issued an accounting standard update that allows the presentation of debt issuance costs related to line-of-credit arrangements as an asset on the balance sheet under the simplified guidance, regardless of whether there are any outstanding borrowings on the related arrangements. The amendments in these accounting standard updates were to be applied retrospectively and were effective for interim and annual reporting periods beginning after December 15, 2015. We adopted this accounting standard update retrospectively effective January 1, 2016, and have presented all debt issuance costs, with the exception of those related to our revolving credit facility, as a reduction from the carrying amount of the related debt liability for both current and prior periods. See Note 7 of the Notes to Consolidated Financial Statements for additional information.
Revenue Recognition
In May 2014, the FASB issued an accounting standard update that amends the accounting guidance on revenue recognition. The amendments in this accounting standard update are intended to provide a more robust framework for addressing revenue issues, improve comparability of revenue recognition practices, and improve disclosure requirements. The amendments in this accounting standard update will be applied using either of the following transition methods: (i) a full retrospective approach reflecting the application of the standard in each prior reporting period with the option to elect certain practical expedients, or (ii) a modified retrospective approach with the cumulative effect of initially adopting the standard recognized at the date of adoption (which requires additional footnote disclosures). This accounting standard
67
update is effective for reporting periods beginning after December 15, 2017. Early adoption is permitted only as of reporting periods beginning after December 31, 2016. We will adopt this accounting standard update effective January 1, 2018. While we are currently evaluating the method of adoption and the impact of the provisions of this accounting standard update, we expect similar performance obligations to result under this update as compared with deliverables and separate units of accounting currently identified. As a result, we expect the timing of our revenue recognition to generally remain the same.
Accounting for Leases
In February 2016, the FASB issued an accounting standard update that amends the accounting guidance on leases. The primary change in this accounting standard update requires lessees to recognize, in the balance sheet, a liability to make lease payments and a right-of-use asset representing the right to use the underlying asset over the lease term. The amendments in this accounting standard update are to be applied using a modified retrospective approach and are effective for fiscal years beginning after December 15, 2018. We will adopt this accounting standard update effective January 1, 2019. While we are still evaluating the impact of adopting this update on our consolidated financial statements, we expect that upon adoption the right-of-use assets and lease liabilities recorded could be material to our consolidated balance sheets. However, we do not expect a material impact to our consolidated statements of income.
Improvements to Employee Share-Based Payment Accounting
In March 2016, the FASB issued an accounting standard update that amends several aspects of the accounting for share-based payment transactions, including the income tax consequences, classification of awards as either equity or liabilities, and classification within the statement of cash flows. Certain of the amendments in this accounting standard update are to be applied using a modified retrospective approach by means of a cumulative-effect adjustment to equity as of the beginning of the period in which the guidance is adopted, while other amendments can be applied prospectively or retrospectively. The amendments in this accounting standard update are effective for periods beginning after December 15, 2016. We adopted this accounting standard update effective January 1, 2017, and the cumulative-effect adjustment to equity was not material.
Classification of Certain Cash Receipts and Cash Payments
In August 2016, the FASB issued an accounting standard update that provides classification guidance on eight specific cash flow issues, for which guidance previously did not exist or was unclear. The amendments in this accounting standard update are effective for periods beginning after December 15, 2017. Early adoption is permitted for any entity in any interim or annual period. We will adopt this accounting standard update effective January 1, 2018. The provisions of this accounting standard update will not have a material impact on our consolidated statements of cash flows.
2. RECEIVABLES, NET
The components of receivables, net of allowance for doubtful accounts, at December 31 are as follows:
|
2016
|
2015
|
||||||
|
Trade receivables
|
$
|
147.6
|
|
$
|
133.6
|
|
|
|
Manufacturer receivables
|
234.9
|
|
221.4
|
|
|||
|
Other
|
48.7
|
|
38.0
|
|
|||
|
431.2
|
|
393.0
|
|
||||
|
Less: allowances for doubtful accounts
|
(5.8
|
)
|
(4.5
|
)
|
|||
|
425.4
|
|
388.5
|
|
||||
|
Contracts-in-transit and vehicle receivables
|
595.9
|
|
508.0
|
|
|||
|
Income taxes receivable (See Note 11)
|
11.6
|
|
11.7
|
|
|||
|
Receivables, net
|
$
|
1,032.9
|
|
$
|
908.2
|
|
|
68
Trade receivables represent amounts due for parts and services that have been delivered or sold, excluding amounts due from manufacturers, as well as receivables from finance organizations for commissions on the sale of financing products. Manufacturer receivables represent amounts due from manufacturers for holdbacks, rebates, incentives, floorplan assistance, and warranty claims. Contracts-in-transit and vehicle receivables primarily represent receivables from financial institutions for the portion of the vehicle sales price financed by our customers.
We evaluate our receivables for collectability based on the age of receivables and past collection experience.
3. INVENTORY AND VEHICLE FLOORPLAN PAYABLE
The components of inventory at December 31 are as follows:
|
2016
|
2015
|
||||||
|
New vehicles
|
$
|
2,761.5
|
|
$
|
2,888.1
|
|
|
|
Used vehicles
|
559.1
|
|
539.7
|
|
|||
|
Parts, accessories, and other
|
199.5
|
|
184.2
|
|
|||
|
Inventory
|
$
|
3,520.1
|
|
$
|
3,612.0
|
|
|
The components of vehicle floorplan payables at December 31 are as follows:
|
2016
|
2015
|
||||||
|
Vehicle floorplan payable - trade
|
$
|
2,308.8
|
|
$
|
2,565.8
|
|
|
|
Vehicle floorplan payable - non-trade
|
1,540.4
|
|
1,161.3
|
|
|||
|
Vehicle floorplan payable
|
$
|
3,849.2
|
|
$
|
3,727.1
|
|
|
Vehicle floorplan payable-trade reflects amounts borrowed to finance the purchase of specific new vehicle inventories with the corresponding manufacturers’ captive finance subsidiaries (“trade lenders”). Vehicle floorplan payable-non-trade represents amounts borrowed to finance the purchase of specific new and, to a lesser extent, used vehicle inventories with non-trade lenders, as well as amounts borrowed under our secured used vehicle floorplan facilities. Changes in vehicle floorplan payable-trade are reported as operating cash flows and changes in vehicle floorplan payable-non-trade are reported as financing cash flows in the accompanying Consolidated Statements of Cash Flows.
Our inventory costs are generally reduced by manufacturer holdbacks, incentives, floorplan assistance, and non-reimbursement-based manufacturer advertising rebates, while the related vehicle floorplan payables are reflective of the gross cost of the vehicle. The vehicle floorplan payables, as shown in the above table, will generally also be higher than the inventory cost due to the timing of the sale of a vehicle and payment of the related liability.
Vehicle floorplan facilities are due on demand, but in the case of new vehicle inventories, are generally paid within several business days after the related vehicles are sold. Our manufacturer agreements generally allow the manufacturer to draft against the new vehicle floorplan facilities so the lender funds the manufacturer directly for the purchase of new vehicle inventory. Vehicle floorplan facilities are primarily collateralized by vehicle inventories and related receivables.
Our new vehicle floorplan facilities utilize LIBOR-based interest rates, which averaged
2.0%
during
2016
and
1.8%
during
2015
. At
December 31, 2016
, the aggregate capacity under our floorplan credit agreements with various lenders to finance our new vehicle inventory was approximately
$4.7 billion
, of which
$3.5 billion
had been borrowed.
Our used vehicle floorplan facilities utilize LIBOR-based interest rates, which averaged
2.1%
during
2016
and
1.7%
during
2015
. At
December 31, 2016
, the aggregate capacity under our floorplan credit agreements with various lenders to finance a portion of our used vehicle inventory was
$430.0 million
, of which
$377.8 million
had been borrowed. The remaining borrowing capacity of
$52.2 million
was limited to
$0.3 million
based on the eligible used vehicle inventory that could have been pledged as collateral.
69
4. PROPERTY AND EQUIPMENT, NET
A summary of property and equipment, net, at December 31 is as follows:
|
2016
|
2015
|
||||||
|
Land
|
$
|
1,267.4
|
|
$
|
1,178.4
|
|
|
|
Buildings and improvements
|
2,009.6
|
|
1,856.6
|
|
|||
|
Furniture, fixtures, and equipment
|
659.4
|
|
642.2
|
|
|||
|
3,936.4
|
|
3,677.2
|
|
||||
|
Less: accumulated depreciation and amortization
|
(1,093.2
|
)
|
(1,009.8
|
)
|
|||
|
Property and equipment, net
|
$
|
2,843.2
|
|
$
|
2,667.4
|
|
|
We capitalized interest in connection with various construction projects to build, upgrade, or remodel our facilities of
$0.5 million
in
2016
,
$0.9 million
in
2015
, and
$1.2 million
in
2014
.
5. GOODWILL AND INTANGIBLE ASSETS, NET
Goodwill and intangible assets, net, at December 31 consisted of the following:
|
2016
|
2015
|
||||||
|
Goodwill
|
$
|
1,511.3
|
|
$
|
1,394.5
|
|
|
|
Franchise rights - indefinite-lived
|
$
|
589.4
|
|
$
|
432.4
|
|
|
|
Other intangible assets
|
16.3
|
|
14.3
|
|
|||
|
605.7
|
|
446.7
|
|
||||
|
Less: accumulated amortization
|
(7.5
|
)
|
(6.8
|
)
|
|||
|
Intangible assets, net
|
$
|
598.2
|
|
$
|
439.9
|
|
|
Goodwill
Goodwill allocated to our reporting units and changes in the carrying amount of goodwill for the years ended December 31,
2016
and
2015
were as follows:
|
Domestic
|
Import
|
Premium
Luxury
|
Corporate
and other
|
Consolidated
|
|||||||||||||||
|
Goodwill at January 1, 2015
(1)
|
$
|
175.1
|
|
$
|
551.6
|
|
$
|
588.0
|
|
$
|
—
|
|
$
|
1,314.7
|
|
||||
|
Acquisitions, dispositions, and other adjustments
|
28.0
|
|
19.3
|
|
32.5
|
|
—
|
|
79.8
|
|
|||||||||
|
Goodwill at December 31, 2015
(1)
|
203.1
|
|
570.9
|
|
620.5
|
|
—
|
|
1,394.5
|
|
|||||||||
|
Acquisitions, dispositions, and other adjustments
|
49.0
|
|
(12.7
|
)
|
76.9
|
|
3.6
|
|
116.8
|
|
|||||||||
|
Goodwill at December 31, 2016
(1)
|
$
|
252.1
|
|
$
|
558.2
|
|
$
|
697.4
|
|
$
|
3.6
|
|
$
|
1,511.3
|
|
||||
|
(1)
|
Net of accumulated impairment losses of
$1.47 billion
associated with our single reporting unit (prior to September 30, 2008, our reporting unit structure was comprised of a single reporting unit) and
$140.0 million
associated with our Domestic reporting unit, both of which were recorded during the year ended December 31, 2008.
|
70
Intangible Assets
Our principal identifiable intangible assets are individual store rights under franchise agreements with vehicle manufacturers. As of
December 31, 2016
, we had
$589.4 million
of franchise rights recorded on our Consolidated Balance Sheet, of which
$198.0 million
was related to Domestic stores,
$110.4 million
was related to Import stores, and
$281.0 million
was related to Premium Luxury stores.
See Note
16
of the Notes to Consolidated Financial Statements for more information about our annual impairment tests of goodwill and franchise rights.
6. SELF-INSURANCE
At December 31,
2016
and
2015
, current and long-term self-insurance liabilities were included in Other Current Liabilities and Other Liabilities, respectively, in the Consolidated Balance Sheets as follows:
|
2016
|
2015
|
||||||
|
Self-insurance - current portion
|
$
|
27.2
|
|
$
|
27.2
|
|
|
|
Self-insurance - long-term portion
|
48.7
|
|
47.6
|
|
|||
|
Total self-insurance liabilities
|
$
|
75.9
|
|
$
|
74.8
|
|
|
7. LONG-TERM DEBT AND COMMERCIAL PAPER
Long-term debt at December 31 consisted of the following:
|
2016
|
2015
|
||||||
|
6.75% Senior Notes due 2018
|
$
|
400.0
|
|
$
|
400.0
|
|
|
|
5.5% Senior Notes due 2020
|
350.0
|
|
350.0
|
|
|||
|
3.35% Senior Notes due 2021
|
300.0
|
|
300.0
|
|
|||
|
4.5% Senior Notes due 2025
|
450.0
|
|
450.0
|
|
|||
|
Revolving credit facility due 2019
|
—
|
|
—
|
|
|||
|
Mortgage facility
(1)
|
153.2
|
|
175.7
|
|
|||
|
Capital leases and other debt
|
136.2
|
|
95.0
|
|
|||
|
1,789.4
|
|
1,770.7
|
|
||||
|
Less: unamortized debt discounts and debt issuance costs
|
(10.8
|
)
|
(13.7
|
)
|
|||
|
Less: current maturities
|
(167.5
|
)
|
(11.7
|
)
|
|||
|
Long-term debt, net of current maturities
|
$
|
1,611.1
|
|
$
|
1,745.3
|
|
|
|
(1)
|
The mortgage facility requires monthly principal and interest payments of
$1.6 million
based on a fixed amortization schedule with a balloon payment of
$143.9 million
due November 2017.
|
As discussed in Note 1 above, the FASB issued an accounting standard update that requires debt issuance costs be presented on the balance sheet as a reduction from the carrying amount of the related debt liability. We adopted the accounting standard update retrospectively effective January 1, 2016, and have presented all debt issuance costs, with the exception of those related to our revolving credit facility, as a reduction from the carrying amount of the related debt liability for both current and prior periods. We reclassified
$10.1 million
of debt issuance costs as a direct reduction from the carrying amount of debt as of December 31, 2015.
71
At December 31,
2016
, aggregate maturities of non-vehicle long-term debt were as follows:
|
Year Ending December 31:
|
|||
|
2017
|
$
|
167.5
|
|
|
2018
|
411.4
|
|
|
|
2019
|
43.0
|
|
|
|
2020
|
353.5
|
|
|
|
2021
|
303.4
|
|
|
|
Thereafter
|
510.6
|
|
|
|
$
|
1,789.4
|
|
|
Senior Unsecured Notes and Credit Agreement
At December 31,
2016
, we had outstanding
$400.0 million
of
6.75%
Senior Notes due 2018. Interest is payable on
April 15
and
October 15
of each year. These notes will mature on
April 15, 2018
.
At December 31,
2016
, we had outstanding
$350.0 million
of
5.5%
Senior Notes due 2020. Interest is payable on February 1 and August 1 of each year. These notes will mature on
February 1, 2020
.
At December 31,
2016
, we had outstanding
$300.0 million
of
3.35%
Senior Notes due 2021. Interest is payable on
January 15
and
July 15
of each year. These notes will mature on
January 15, 2021
.
At December 31,
2016
, we had outstanding
$450.0 million
of
4.5%
Senior Notes due 2025. Interest is payable on
April 1
and
October 1
of each year. These notes will mature on
October 1, 2025
.
The interest rate payable on the 2021 Notes and 2025 Notes is subject to adjustment upon the occurrence of certain credit rating events as provided in the indentures for these senior unsecured notes.
Under our credit agreement, we have a
$1.8 billion
revolving credit facility that matures on
December 3, 2019
. The credit agreement also contains an accordion feature that allows us, subject to credit availability and certain other conditions, to increase the amount of the revolving credit facility, together with any added term loans, by up to
$500.0 million
in the aggregate. As of December 31,
2016
, we had
no
borrowings outstanding under our revolving credit facility. We have a
$200.0 million
letter of credit sublimit as part of our revolving credit facility. The amount available to be borrowed under the revolving credit facility is reduced on a dollar-for-dollar basis by the cumulative amount of any outstanding letters of credit, which was
$44.1 million
at December 31,
2016
, leaving an additional borrowing capacity under the revolving credit facility of
$1.8 billion
at December 31,
2016
. As of
December 31, 2016
, this borrowing capacity was limited under the maximum consolidated leverage ratio contained in our credit agreement to
$1.1 billion
.
Our revolving credit facility provides for a commitment fee on undrawn amounts ranging from
0.175%
to
0.25%
and interest on borrowings at LIBOR or the base rate, in each case plus an applicable margin. The applicable margin ranges from
1.25%
to
1.625%
for LIBOR borrowings and
0.25%
to
0.625%
for base rate borrowings. The interest rate charged for our revolving credit facility is affected by our leverage ratio. For instance, an increase in our leverage ratio from greater than or equal to
2.0
x but less than
3.25
x to greater than or equal to
3.25
x would result in a 12.5 basis point increase in the applicable margin.
Our senior unsecured notes and borrowings under our credit agreement are guaranteed by substantially all of our subsidiaries. Within the meaning of Regulation S-X, Rule 3-10, AutoNation, Inc. (the parent company) has no independent assets or operations, the guarantees of its subsidiaries are full and unconditional and joint and several, and any subsidiaries other than the guarantor subsidiaries are minor.
72
Other Long-Term Debt
At December 31,
2016
, we had
$153.2 million
outstanding under a mortgage facility with an automotive manufacturer’s captive finance subsidiary that matures on
November 30, 2017
. The mortgage facility utilizes a fixed interest rate of
5.864%
and is secured by
10
-year mortgages on certain of our store properties. The mortgage facility requires monthly principal and interest payments of
$1.6 million
based on a fixed amortization schedule with a balloon payment of
$143.9 million
due November 2017. We are subject to make-whole payments if the mortgage facility is prepaid prior to its maturity date. During the fourth quarter of 2016, in connection with the divestiture of a property included in the facility, we repaid
$12.1 million
of the mortgage facility and made a make-whole payment of
$0.5 million
.
At December 31,
2016
, we had capital lease and other debt obligations of
$136.2 million
, which are due at various dates through
2036
. See Note
8
of the Notes to Consolidated Financial Statements for more information related to capital lease obligations.
Commercial Paper
We have a commercial paper program pursuant to which we may issue short-term, unsecured commercial paper notes on a private placement basis up to a maximum aggregate amount outstanding at any time of
$1.0 billion
. The interest rate for the commercial paper notes varies based on duration and market conditions. The maturities of the commercial paper notes may vary, but may not exceed
397 days
from the date of issuance. The commercial paper notes are guaranteed by substantially all of our subsidiaries. Proceeds from the issuance of commercial paper notes are used to repay borrowings under the revolving credit facility, to finance acquisitions and for working capital, capital expenditures, share repurchases and/or other general corporate purposes. We plan to use the revolving credit facility under our credit agreement as a liquidity backstop for borrowings under the commercial paper program. A downgrade in our credit ratings could negatively impact our ability to issue, or the interest rates for, commercial paper notes.
At December 31,
2016
, we had
$942.0 million
of commercial paper notes outstanding with a weighted-average annual interest rate of
1.26%
and a weighted-average remaining term of
24 days
.
8. COMMITMENTS AND CONTINGENCIES
Legal Proceedings
We are involved, and will continue to be involved, in numerous legal proceedings arising out of the conduct of our business, including litigation with customers, wage and hour and other employment-related lawsuits, and actions brought by governmental authorities. Some of these lawsuits purport or may be determined to be class or collective actions and seek substantial damages or injunctive relief, or both, and some may remain unresolved for several years. We establish accruals for specific legal proceedings when it is considered probable that a loss has been incurred and the amount of the loss can be reasonably estimated. Our accruals for loss contingencies are reviewed quarterly and adjusted as additional information becomes available. We disclose the amount accrued if material or if such disclosure is necessary for our financial statements to not be misleading. If a loss is not both probable and reasonably estimable, or if an exposure to loss exists in excess of the amount accrued, we assess whether there is at least a reasonable possibility that a loss, or additional loss, may have been incurred. If there is a reasonable possibility that a loss, or additional loss, may have been incurred, we disclose the estimate of the possible loss or range of loss if it is material or a statement that such an estimate cannot be made. Our evaluation of whether a loss is reasonably possible or probable is based on our assessment and consultation with legal counsel regarding the ultimate outcome of the matter.
As of December 31,
2016
and
2015
, we have accrued for the potential impact of loss contingencies that are probable and reasonably estimable, and there was no indication of a reasonable possibility that a material loss, or additional material loss, may have been incurred. We do not believe that the ultimate resolution of any of these matters will have a material adverse effect on our results of operations, financial condition, or cash flows. However, the results of these matters cannot be predicted with certainty, and an unfavorable resolution of one or more of these matters could have a material adverse effect on our results of operations, financial condition, or cash flows.
73
Lease Commitments
We lease real property, equipment, and software under various operating leases, most of which have terms from
one
to
twenty-five
years.
Expenses under real property, equipment, and software leases were
$52.8 million
in
2016
,
$51.4 million
in
2015
, and
$49.0 million
in
2014
. The leases require payment of real estate taxes, insurance, and maintenance in addition to rent. Most of the leases contain renewal options, rent abatements, and rent escalation clauses. Lease expense is recognized on a straight-line basis over the term of the lease, including any option periods, as appropriate. The same lease term is used for lease classification, the amortization period of related leasehold improvements, and the estimation of future lease commitments.
Future minimum lease obligations under non-cancelable real property, equipment, and software leases with initial terms in excess of one year at December 31,
2016
, are as follows:
|
Noncancelable Lease Commitments
|
Capital
(1)
|
Operating
(1) (2)
|
|||||
|
2017
|
$
|
20.0
|
|
$
|
45.6
|
|
|
|
2018
|
16.2
|
|
42.7
|
|
|||
|
2019
|
32.4
|
|
39.2
|
|
|||
|
2020
|
7.0
|
|
37.8
|
|
|||
|
2021
|
6.7
|
|
31.2
|
|
|||
|
Thereafter
|
82.5
|
|
236.8
|
|
|||
|
Total minimum lease payments
|
$
|
164.8
|
|
$
|
433.3
|
|
|
|
Less: Amounts representing interest
|
(46.7
|
)
|
|||||
|
$
|
118.1
|
|
|||||
|
(1)
|
Amounts for capital and operating lease commitments do not include certain operating expenses such as maintenance, insurance, and real estate taxes. In
2016
, these charges totaled approximately
$24 million
.
|
|
(2)
|
Future minimum operating lease payments do not reflect future minimum sublease income of
$1.1 million
.
Additionally, operating leases that are on a month-to-month basis are not included.
|
Other Matters
AutoNation, acting through its subsidiaries, is the lessee under many real estate leases that provide for the use by our subsidiaries of their respective dealership premises. Pursuant to these leases, our subsidiaries generally agree to indemnify the lessor and other related parties from certain liabilities arising as a result of the use of the leased premises, including environmental liabilities, or a breach of the lease by the lessee. Additionally, from time to time, we enter into agreements with third parties in connection with the sale of assets or businesses in which we agree to indemnify the purchaser or related parties from certain liabilities or costs arising in connection with the assets or business. Also, in the ordinary course of business in connection with purchases or sales of goods and services, we enter into agreements that may contain indemnification provisions. In the event that an indemnification claim is asserted, our liability would be limited by the terms of the applicable agreement.
From time to time, primarily in connection with dispositions of automotive stores, our subsidiaries assign or sublet to the dealership purchaser the subsidiaries’ interests in any real property leases associated with such stores. In general, our subsidiaries retain responsibility for the performance of certain obligations under such leases to the extent that the assignee or sublessee does not perform, whether such performance is required prior to or following the assignment or subletting of the lease. Additionally, AutoNation and its subsidiaries generally remain subject to the terms of any guarantees made by us in connection with such leases. We generally have indemnification rights against the assignee or sublessee in the event of
74
non-performance under these leases, as well as certain defenses. We presently have no reason to believe that we or our subsidiaries will be called on to perform under any such remaining assigned leases or subleases. We estimate that lessee rental payment obligations during the remaining terms of these leases with expirations ranging from
2017
to
2034
are approximately
$24 million
at
December 31, 2016
. There can be no assurance that any performance of AutoNation or its subsidiaries required under these leases would not have a material adverse effect on our business, financial condition, and cash flows.
At
December 31, 2016
, surety bonds, letters of credit, and cash deposits totaled
$102.7 million
, of which
$44.1 million
represented letters of credit. In the ordinary course of business, we are required to post performance and surety bonds, letters of credit, and/or cash deposits as financial guarantees of our performance. We do not currently provide cash collateral for outstanding letters of credit.
In the ordinary course of business, we are subject to numerous laws and regulations, including automotive, environmental, health and safety, and other laws and regulations. We do not anticipate that the costs of such compliance will have a material adverse effect on our business, consolidated results of operations, cash flows, or financial condition, although such outcome is possible given the nature of our operations and the extensive legal and regulatory framework applicable to our business. We do not have any material known environmental commitments or contingencies.
9. SHAREHOLDERS’ EQUITY
A summary of shares repurchased under our share repurchase program authorized by our Board of Directors follows:
|
2016
|
2015
|
2014
|
|||||||||
|
Shares repurchased
|
10.5
|
|
3.9
|
|
9.4
|
|
|||||
|
Aggregate purchase price
|
$
|
497.0
|
|
$
|
235.1
|
|
$
|
485.1
|
|
||
|
Average purchase price per share
|
$
|
47.30
|
|
$
|
60.49
|
|
$
|
51.59
|
|
||
As of
December 31, 2016
,
$298.6 million
remained available under our stock repurchase limit most recently authorized by our Board of Directors.
Our Board of Directors authorized the retirement of
43.0 million
shares of our treasury stock in October 2015, which assumed the status of authorized but unissued shares. Upon the retirement of treasury stock, it is our policy to charge the excess of the cost of the treasury stock over its par value entirely to additional paid-in capital. Any amounts exceeding additional paid-in capital are charged to retained earnings. This retirement had the effect of reducing treasury stock and issued common stock, which includes treasury stock. Our common stock, additional paid-in capital, retained earnings, and treasury stock accounts were adjusted accordingly. There was no impact to shareholders’ equity or outstanding common stock.
We have
5.0 million
authorized shares of preferred stock, par value
$0.01
per share,
none
of which are issued or outstanding. The Board of Directors has the authority to issue the preferred stock in one or more series and to establish the rights, preferences, and dividends.
A summary of shares of common stock issued in connection with the exercise of stock options follows:
|
2016
|
2015
|
2014
|
|||||||||
|
Shares issued
|
0.3
|
|
1.3
|
|
1.7
|
|
|||||
|
Proceeds from the exercise of stock options
|
$
|
8.4
|
|
$
|
30.0
|
|
$
|
35.1
|
|
||
|
Average exercise price per share
|
$
|
31.21
|
|
$
|
23.33
|
|
$
|
20.50
|
|
||
75
The following table presents a summary of shares of common stock issued in connection with grants of restricted stock and shares surrendered to AutoNation to satisfy tax withholding obligations in connection with the vesting of restricted stock (in actual number of shares):
|
2016
|
2015
|
2014
|
||||||
|
Shares issued
|
143,424
|
|
159,442
|
|
154,540
|
|
||
|
Shares surrendered to AutoNation to satisfy tax withholding obligations in connection with the vesting of restricted stock
|
38,906
|
|
36,712
|
|
46,752
|
|
||
10. STOCK-BASED COMPENSATION
The AutoNation, Inc. 2008 Equity and Incentive Plan (the “2008 Plan”) provides for the grant of stock options, stock appreciation rights, restricted stock, restricted stock units, and other stock-based and cash-based awards to employees. A maximum of
12.0 million
shares may be issued under the 2008 Plan, provided that no more than
2.0 million
shares may be issued pursuant to the grant of awards, other than options or stock appreciation rights, that are settled in shares. The exercise price of all stock options granted in
2016
under the 2008 Plan, is equal to the closing price of our common stock on the date such awards were granted.
In January 2017, our Board, upon the recommendation of its Compensation Committee, discontinued the 2008 Plan and approved the AutoNation, Inc. 2017 Employee Equity and Incentive Plan (the “2017 Plan”), in each case subject to stockholder approval of the 2017 Plan at our 2017 Annual Meeting of Stockholders. The 2017 Plan provides for the grant of time-based and performance-based restricted stock units and restricted stock, stock options, stock appreciation rights, and other stock-based and cash-based awards to employees. A maximum of
5.5 million
shares may be issued under the 2017 Plan.
The AutoNation, Inc. 2014 Non-Employee Director Equity Plan (the “2014 Director Plan”) provides for the grant of stock options, restricted stock, restricted stock units, stock appreciation rights, and other stock-based awards to our non-employee directors. As of December 31, 2016, the total number of shares authorized for issuance under the 2014 Director Plan was
1.0 million
. In January 2017, our Board reduced such number to
600,000
. No director may be granted awards in any calendar year with an aggregate grant date fair market value (determined, with respect to options and stock appreciation rights, based on a Black-Scholes or other option valuation methodology approved by the Compensation Committee) in excess of
$750,000
per director.
Stock Options
In
2016
, the Compensation Committee of our Board of Directors approved the grant of
0.9 million
employee stock options. The employee stock option awards were granted on March 1, 2016 and have an exercise price equal to the closing price per share on the grant date (
$52.53
).
Stock options granted under all plans are non-qualified. Upon exercise, shares of common stock are issued from our treasury stock. Employee stock options granted in 2016 have a term of
10
years from the date of grant and vest in equal installments over
four
years on the anniversary of the grant date. Employee stock options granted in 2015 and 2014 were granted quarterly, have a term of
10
years from the first date of grant, and vest in equal installments over
four
years commencing on June 1 of the year following the grant date.
We use the Black-Scholes valuation model to determine compensation expense and amortize compensation expense on a straight-line basis, net of estimated forfeitures, over the requisite service period of the grants. Certain of our equity-based compensation plans contain provisions that provide for vesting of awards upon retirement. Accordingly, compensation cost is recognized over the shorter of the stated vesting period or the period until employees become retirement-eligible.
76
The following table summarizes the assumptions used related to the valuation of our stock options during
2016
,
2015
, and
2014
:
|
Grant Year
|
||||||||
|
2016
|
2015
|
2014
|
||||||
|
Risk-free interest rate
|
1.16% - 1.55%
|
|
0.76% - 1.86%
|
|
1.11% - 2.04%
|
|
||
|
Expected dividend yield
|
—
|
|
—
|
|
—
|
|
||
|
Expected term
|
4 - 7 years
|
|
2 - 7 years
|
|
4 - 7 years
|
|
||
|
Expected volatility
|
29% - 31%
|
|
24% - 34%
|
|
25% - 36%
|
|
||
The risk-free interest rate is based on the U.S. Treasury yield curve at the time of the grant with a remaining term equal to the expected term used for stock options granted. The expected term of stock options granted is derived from historical data and represents the period of time that stock options are expected to be outstanding. The expected volatility is based on historical volatility, implied volatility, and other factors.
The following table summarizes stock option activity during
2016
:
|
|
Stock Options
|
|||||||||||
|
|
Shares
(in millions)
|
Weighted-
Average
Exercise Price
|
Weighted-
Average
Remaining
Contractual
Term (Years)
|
Aggregate
Intrinsic Value
(in millions)
|
||||||||
|
Options outstanding at January 1
|
4.6
|
|
$
|
45.07
|
|
|||||||
|
Granted
(1)
|
0.9
|
|
$
|
52.53
|
|
|||||||
|
Exercised
|
(0.3
|
)
|
$
|
31.21
|
|
|||||||
|
Forfeited
|
—
|
|
$
|
—
|
|
|||||||
|
Expired
|
—
|
|
$
|
—
|
|
|||||||
|
Options outstanding as of December 31
|
5.2
|
|
$
|
46.99
|
|
6.54
|
$
|
31.8
|
|
|||
|
Options exercisable at December 31
|
2.9
|
|
$
|
40.33
|
|
5.27
|
$
|
31.4
|
|
|||
|
Options exercisable at December 31 and expected to vest thereafter
|
5.2
|
|
$
|
46.92
|
|
6.53
|
$
|
31.8
|
|
|||
|
Options available for future grants at December 31
|
3.3
|
|
(2)
|
|||||||||
|
(1)
|
The options granted during
2016
are related to our annual employee stock option award grant on March 1, 2016
|
|
(2)
|
Includes
2.5 million
shares available under the 2008 Plan and
0.9 million
shares available under the 2014 Director Plan. As noted above, the number of shares available under the 2014 Director Plan was reduced by
0.4 million
shares in January 2017. If our stockholders approve the 2017 Plan, under which
5.5 million
shares would be available for issuance, then
no
additional awards will be granted under the 2008 Plan, and the
2.5 million
shares available under the 2008 Plan will no longer be available for issuance.
|
The weighted average grant-date fair value of stock options granted and total intrinsic value of stock options exercised are summarized in the following table:
|
2016
|
2015
|
2014
|
|||||||||
|
Weighted average grant-date fair value of stock options granted
|
$
|
17.96
|
|
$
|
19.38
|
|
$
|
20.56
|
|
||
|
Total intrinsic value of stock options exercised (in millions)
|
$
|
5.3
|
|
$
|
51.9
|
|
$
|
56.2
|
|
||
77
Restricted Stock
In
2016
, the Compensation Committee of our Board of Directors approved the grant of
0.1 million
shares of restricted stock. Restricted stock awards are granted to restricted stock-eligible employees generally on the first trading day of March.
Restricted stock awards are considered nonvested share awards as defined under generally accepted accounting principles and are issued from our treasury stock. Restricted stock awards granted in 2016 vest in equal installments over
four
years on the anniversary date of the grant. Restricted stock awards granted in 2015 and 2014 vest in equal installments over
four
years commencing on June 1 of the year following the grant date. Compensation cost for restricted stock awards is based on the closing price of our common stock on the date of grant and is recognized on a straight-line basis, net of estimated forfeitures, over the shorter of the stated vesting period or the period until employees become retirement-eligible.
The following table summarizes information about vested and unvested restricted stock for
2016
:
|
|
Restricted Stock
|
|||||
|
|
Shares
(in actual number of shares)
|
Weighted-Average
Grant Date
Fair Value
|
||||
|
Nonvested at January 1
|
284,284
|
|
$
|
53.11
|
|
|
|
Granted
(1)
|
143,424
|
|
$
|
52.23
|
|
|
|
Vested
|
(128,640
|
)
|
$
|
49.26
|
|
|
|
Forfeited
|
(32,162
|
)
|
$
|
55.23
|
|
|
|
Nonvested at December 31
|
266,906
|
|
$
|
54.23
|
|
|
|
(1)
|
The restricted stock awards granted during
2016
are primarily related to our employee annual restricted stock award grant in March
2016
.
|
The weighted average grant-date fair value of restricted stock awards granted and total fair value of restricted stock awards vested are summarized in the following table:
|
2016
|
2015
|
2014
|
|||||||||
|
Weighted average grant-date fair value of restricted stock awards granted
|
$
|
52.23
|
|
$
|
62.54
|
|
$
|
52.87
|
|
||
|
Total fair value of restricted stock awards vested (in millions)
|
$
|
6.4
|
|
$
|
8.8
|
|
$
|
8.1
|
|
||
Restricted Stock Units
On January 4, 2016, each of our non-employee directors received a grant of
4,259
restricted stock units (“RSUs”) under the 2014 Director Plan. RSUs granted to our non-employee directors are fully vested on the grant date and are settled in shares of the Company’s common stock on the first trading day of February in the third year following the grant date, unless the non-employee director elects to defer delivery in accordance with the terms of the award and the 2014 Director Plan. Settlement of the RSUs will be accelerated in certain circumstances as provided in the terms of the award and the 2014 Director Plan, including in the event the non-employee director ceases to serve as a non-employee director of the Company. Compensation cost is recognized on the grant date and is based on the closing price of our common stock on the grant date.
The weighted average grant-date fair value and total grant-date fair value of RSUs granted (and vested) are summarized in the following table:
|
2016
|
2015
|
2014
|
|||||||||
|
Weighted average grant-date fair value of RSUs granted
|
$
|
58.69
|
|
$
|
60.04
|
|
$
|
53.57
|
|
||
|
Total fair value of RSUs granted (in millions)
|
$
|
2.3
|
|
$
|
2.7
|
|
$
|
2.1
|
|
||
78
Compensation Expense
The following table summarizes the total stock-based compensation expense recognized in Selling, General, and Administrative Expenses in the Consolidated Statements of Income and the total recognized tax benefit related thereto:
|
2016
|
2015
|
2014
|
|||||||||
|
Stock options
|
$
|
16.2
|
|
$
|
14.8
|
|
$
|
18.4
|
|
||
|
Restricted stock
|
6.6
|
|
6.5
|
|
5.8
|
|
|||||
|
RSUs
|
2.3
|
|
2.7
|
|
2.1
|
|
|||||
|
Total stock-based compensation expense
|
$
|
25.1
|
|
$
|
24.0
|
|
$
|
26.3
|
|
||
|
Tax benefit related to stock-based compensation expense
|
$
|
9.6
|
|
$
|
9.2
|
|
$
|
10.0
|
|
||
As of
December 31, 2016
, there was
$22.7 million
of total unrecognized compensation cost related to non-vested stock-based compensation arrangements, of which
$14.0 million
relates to stock options and
$8.7 million
relates to restricted stock. These amounts are expected to be recognized over a weighted average period of
1.68
years.
We realized tax benefits related to stock options exercised and vesting of restricted stock of
$4.8 million
in
2016
,
$23.3 million
in
2015
, and
$24.1 million
in
2014
.
11. INCOME TAXES
The components of the income tax provision from continuing operations for the years ended December 31 are as follows:
|
2016
|
2015
|
2014
|
|||||||||
|
Current:
|
|||||||||||
|
Federal
|
$
|
234.9
|
|
$
|
235.0
|
|
$
|
220.9
|
|
||
|
State
|
31.4
|
|
34.1
|
|
32.2
|
|
|||||
|
Federal and state deferred
|
3.7
|
|
10.3
|
|
9.5
|
|
|||||
|
Change in valuation allowance, net
|
0.3
|
|
0.1
|
|
—
|
|
|||||
|
Adjustments and settlements
|
0.3
|
|
(0.5
|
)
|
(0.1
|
)
|
|||||
|
Income tax provision
|
$
|
270.6
|
|
$
|
279.0
|
|
$
|
262.5
|
|
||
A reconciliation of the income tax provision calculated using the statutory federal income tax rate to our income tax provision from continuing operations for the years ended December 31 is as follows:
|
2016
|
%
|
2015
|
%
|
2014
|
%
|
|||||||||||||||
|
Income tax provision at statutory rate
|
$
|
245.8
|
|
35.0
|
|
$
|
253.0
|
|
35.0
|
|
$
|
238.8
|
|
35.0
|
|
|||||
|
Non-deductible expenses (income), net
|
4.6
|
|
0.7
|
|
3.5
|
|
0.5
|
|
1.3
|
|
0.2
|
|
||||||||
|
State income taxes, net of federal benefit
|
21.7
|
|
3.1
|
|
23.6
|
|
3.3
|
|
23.2
|
|
3.4
|
|
||||||||
|
272.1
|
|
38.8
|
|
280.1
|
|
38.8
|
|
263.3
|
|
38.6
|
|
|||||||||
|
Change in valuation allowance, net
|
0.3
|
|
—
|
|
0.1
|
|
—
|
|
—
|
|
—
|
|
||||||||
|
Adjustments and settlements
|
0.3
|
|
—
|
|
(0.5
|
)
|
(0.1
|
)
|
(0.1
|
)
|
—
|
|
||||||||
|
Other, net
|
(2.1
|
)
|
(0.3
|
)
|
(0.7
|
)
|
(0.1
|
)
|
(0.7
|
)
|
(0.1
|
)
|
||||||||
|
Income tax provision
|
$
|
270.6
|
|
38.5
|
|
$
|
279.0
|
|
38.6
|
|
$
|
262.5
|
|
38.5
|
|
|||||
79
Deferred income tax asset and liability components at December 31 are as follows:
|
2016
|
2015
|
||||||
|
Deferred income tax assets:
|
|||||||
|
Inventory
|
$
|
36.8
|
|
$
|
35.1
|
|
|
|
Receivable allowances
|
3.3
|
|
2.9
|
|
|||
|
Warranty, chargeback, and self-insurance liabilities
|
71.2
|
|
63.5
|
|
|||
|
Other accrued liabilities
|
33.1
|
|
32.6
|
|
|||
|
Deferred compensation
|
31.8
|
|
28.5
|
|
|||
|
Stock-based compensation
|
25.7
|
|
24.3
|
|
|||
|
Loss carryforwards—federal and state
|
5.4
|
|
13.3
|
|
|||
|
Other, net
|
17.1
|
|
6.8
|
|
|||
|
Total deferred income tax assets
|
224.4
|
|
207.0
|
|
|||
|
Valuation allowance
|
(2.5
|
)
|
(2.4
|
)
|
|||
|
Deferred income tax assets, net of valuation allowance
|
221.9
|
|
204.6
|
|
|||
|
Deferred income tax liabilities:
|
|||||||
|
Long-lived assets (intangible assets and property)
|
(293.3
|
)
|
(263.8
|
)
|
|||
|
Other, net
|
(20.1
|
)
|
(19.4
|
)
|
|||
|
Total deferred income tax liabilities
|
(313.4
|
)
|
(283.2
|
)
|
|||
|
Net deferred income tax liabilities
|
$
|
(91.5
|
)
|
$
|
(78.6
|
)
|
|
Our net deferred tax liability of
$91.5 million
as of
December 31, 2016
and
$78.6 million
as of
December 31, 2015
is classified as Deferred Income Taxes in the accompanying Consolidated Balance Sheets.
Income taxes receivable included in Receivables, net totaled
$11.6 million
at December 31,
2016
and
$11.7 million
at
December 31, 2015
.
At December 31,
2016
, we had
$80.8 million
of gross domestic state net operating loss carryforwards and capital loss carryforwards, and
$4.1 million
of state tax credits, all of which result in a deferred tax asset of
$6.0 million
and expire from
2017
through
2036
. At December 31,
2016
, we had
$2.5 million
of valuation allowance related to these loss carryforwards. In assessing the realizability of deferred tax assets, we consider whether it is more likely than not that some portion or all of the deferred tax assets will not be realized. We provide valuation allowances to offset portions of deferred tax assets due to uncertainty surrounding the future realization of such deferred tax assets. We adjust the valuation allowance in the period management determines it is more likely than not that deferred tax assets will or will not be realized.
We file income tax returns in the U.S. federal jurisdiction and various states. As a matter of course, various taxing authorities, including the IRS, regularly audit us. These audits may result in proposed assessments where the ultimate resolution may result in our owing additional taxes. Currently,
no
tax years are under examination by the IRS and tax years from
2009
to
2015
are under examination by U.S. state jurisdictions. We believe that our tax positions comply with applicable tax law and that we have adequately provided for these matters.
80
A reconciliation of the beginning and ending amount of unrecognized tax benefits is as follows:
|
2016
|
2015
|
2014
|
|||||||||
|
Balance at January 1
|
$
|
5.6
|
|
$
|
4.9
|
|
$
|
4.8
|
|
||
|
Additions based on tax positions related to the current year
|
—
|
|
—
|
|
—
|
|
|||||
|
Additions for tax positions of prior years
|
0.8
|
|
0.7
|
|
0.9
|
|
|||||
|
Reductions for tax positions of prior years
|
(0.4
|
)
|
—
|
|
(0.1
|
)
|
|||||
|
Reductions for expirations of statute of limitations
|
(0.2
|
)
|
—
|
|
(0.4
|
)
|
|||||
|
Settlements
|
—
|
|
—
|
|
(0.3
|
)
|
|||||
|
Balance at December 31
|
$
|
5.8
|
|
$
|
5.6
|
|
$
|
4.9
|
|
||
We had accumulated interest and penalties associated with these unrecognized tax benefits of
$6.1 million
at December 31,
2016
,
$5.5 million
at December 31,
2015
, and
$5.3 million
at December 31,
2014
. We additionally had a deferred tax asset of
$4.2 million
at December 31,
2016
,
$4.0 million
at December 31,
2015
, and
$3.6 million
at December 31,
2014
, related to these balances. The net of the unrecognized tax benefits, associated interest, penalties, and deferred tax asset was
$7.7 million
at December 31,
2016
,
$7.1 million
at December 31,
2015
, and
$6.6 million
at December 31,
2014
, which if resolved favorably (in whole or in part) would reduce our effective tax rate. The unrecognized tax benefits, associated interest, penalties, and deferred tax asset are included as components of Other Liabilities and Deferred Income Taxes in the Consolidated Balance Sheets.
It is our policy to account for interest and penalties associated with income tax obligations as a component of income tax expense. We recognized
$0.4 million
during
2016
,
$0.4 million
during
2015
, and
$0.3 million
during
2014
(each net of tax effect), of interest and penalties as part of the provision for income taxes in the Consolidated Statements of Income.
We do not expect that our unrecognized tax benefits will significantly increase or decrease during the twelve months beginning January 1,
2017
.
12. EARNINGS (LOSS) PER SHARE
Unvested share-based payment awards that contain non-forfeitable rights to dividends or dividend equivalents (whether paid or unpaid) are participating securities and are to be included in the computation of earnings per share (“EPS”) under the two-class method. Our restricted stock awards are considered participating securities because they contain non-forfeitable rights to dividends. As the number of shares granted under such awards is immaterial, all earnings per share amounts reflect such shares as if they were fully vested shares and the disclosures associated with the two-class method are not presented.
Basic EPS is computed by dividing net income by the weighted average number of common shares outstanding for the period, including outstanding unvested restricted stock awards and vested restricted stock unit awards. Diluted EPS is computed by dividing net income by the weighted average number of shares outstanding, noted above, adjusted for the dilutive effect of stock options.
81
The following table presents the calculation of basic and diluted EPS:
|
|
2016
|
2015
|
2014
|
||||||||
|
Net income from continuing operations
|
$
|
431.7
|
|
$
|
443.7
|
|
$
|
419.8
|
|
||
|
Loss from discontinued operations, net of income taxes
|
(1.2
|
)
|
(1.1
|
)
|
(1.1
|
)
|
|||||
|
Net income
|
$
|
430.5
|
|
$
|
442.6
|
|
$
|
418.7
|
|
||
|
Weighted average common shares outstanding used in calculating basic EPS
|
103.1
|
|
112.7
|
|
117.3
|
|
|||||
|
Effect of dilutive stock options
|
0.7
|
|
1.2
|
|
1.6
|
|
|||||
|
Weighted average common shares outstanding used in calculating diluted EPS
|
103.8
|
|
113.9
|
|
118.9
|
|
|||||
|
Basic EPS amounts:
|
|||||||||||
|
Continuing operations
|
$
|
4.19
|
|
$
|
3.94
|
|
$
|
3.58
|
|
||
|
Discontinued operations
|
$
|
(0.01
|
)
|
$
|
(0.01
|
)
|
$
|
(0.01
|
)
|
||
|
Net income
|
$
|
4.18
|
|
$
|
3.93
|
|
$
|
3.57
|
|
||
|
Diluted EPS amounts:
|
|||||||||||
|
Continuing operations
|
$
|
4.16
|
|
$
|
3.90
|
|
$
|
3.53
|
|
||
|
Discontinued operations
|
$
|
(0.01
|
)
|
$
|
(0.01
|
)
|
$
|
(0.01
|
)
|
||
|
Net income
|
$
|
4.15
|
|
$
|
3.89
|
|
$
|
3.52
|
|
||
A summary of anti-dilutive options excluded from the computation of diluted earnings per share is as follows:
|
|
2016
|
2015
|
2014
|
|||||
|
Anti-dilutive options excluded from the computation of diluted earnings per share
|
3.0
|
|
0.7
|
|
0.6
|
|
||
13. DIVESTITURES
During
2016
, we divested
five
Domestic stores and
nine
Import stores and recorded a net gain of
$61.8 million
. During
2015
, we divested
three
Import stores and recorded a gain of
$7.4 million
. During
2014
, we divested
two
Import stores and recorded a gain of
$4.4 million
. We also divested our customer lead distribution business and recorded a gain of
$8.4 million
during 2014. This business was reported in the “Corporate and other” category of our segment information.
The gains on these divestitures are included in Other Income, Net (within Operating Income) in our Consolidated Statements of Income. The financial condition and results of operations of these businesses were not material to our consolidated financial statements.
14. ACQUISITIONS
During
2016
, we purchased
20
stores located in Texas, New York, Colorado, California, and Maryland, which include
Chrysler, Dodge, Jeep, Ram, Chevrolet, Hyundai, Mercedes-Benz, Sprinter, Jaguar, Land Rover, and BMW franchises
. We also purchased a collision center in Illinois in 2016. Acquisitions are included in the Consolidated Financial Statements from the date of acquisition. The purchase price allocations for the business combinations in
2016
are preliminary and subject to final adjustment. We purchased
22
stores in
2015
and
five
stores in
2014
.
82
The following table summarizes the consideration paid and estimated fair values of the assets acquired and liabilities assumed at the acquisition dates for the stores acquired during
2016
:
|
Receivables, net
|
$
|
19.9
|
|
|
|
Inventory
|
272.4
|
|
||
|
Property and equipment
|
130.4
|
|
||
|
Goodwill
|
140.4
|
|
||
|
Franchise rights - indefinite-lived
|
169.2
|
|
||
|
Other assets
|
9.4
|
|
||
|
Accounts payable
|
(9.0
|
)
|
||
|
Vehicle floorplan payable - non-trade
|
(264.4
|
)
|
||
|
Deferred income taxes
|
(7.5
|
)
|
||
|
Other liabilities
|
(13.0
|
)
|
||
|
Aggregate purchase price
|
447.8
|
|
||
|
Capital leases and other obligations
|
(37.4
|
)
|
||
|
Cash used in business acquisitions, net of cash acquired
|
$
|
410.4
|
|
|
The goodwill was assigned to the Domestic, Import, Premium Luxury, and “Corporate and other” reporting units in the amount of
$57.9 million
,
$2.0 million
,
$76.9 million
, and
$3.6 million
, respectively. We anticipate that substantially all of the goodwill recorded in 2016 will be deductible for federal income tax purposes.
From each acquisition date of the
2016
acquisitions to December 31,
2016
, the amounts of revenue and earnings of the
20
stores and the collision center acquired included in our Consolidated Statement of Income for the year ended December 31,
2016
, were
$790.5 million
and
$21.7 million
, respectively. Our unaudited supplemental pro forma revenue and net income from continuing operations had the acquisition dates been January 1,
2015
are as follows:
|
Years Ended December 31,
|
|||||||
|
Supplemental pro forma:
|
2016
|
2015
|
|||||
|
Revenue
|
$
|
21,945.6
|
|
$
|
22,169.9
|
|
|
|
Net income from continuing operations
|
$
|
434.1
|
|
$
|
469.4
|
|
|
The unaudited supplemental pro forma revenue and net income from continuing operations are presented for information purposes only and may not necessarily reflect the future results of operations of AutoNation or what the results of operations would have been had we owned and operated these businesses as of January 1,
2015
.
15. CASH FLOW INFORMATION
We had non-cash investing and financing activities of
$47.2 million
related to capital leases and deferred purchase price commitments associated with our
2016
acquisitions. We had non-cash investing and financing activities primarily related to increases in property acquired under capital leases of
$27.3 million
during
2015
and
$11.6 million
during
2014
. We also had accrued purchases of property and equipment of
$29.1 million
at
December 31, 2016
,
$25.3 million
at
December 31, 2015
, and
$16.3 million
at
December 31, 2014
.
We made interest payments, net of amounts capitalized and including interest on vehicle inventory financing, of
$183.9 million
in
2016
,
$135.3 million
in
2015
, and
$136.4 million
in
2014
. We made income tax payments, net of income tax refunds, of
$265.5 million
in
2016
,
$278.8 million
in
2015
, and
$225.0 million
in
2014
.
83
16. FINANCIAL INSTRUMENTS AND FAIR VALUE MEASUREMENTS
The fair value of a financial instrument represents the amount at which the instrument could be exchanged in a current transaction between willing parties, other than in a forced sale or liquidation. Fair value estimates are made at a specific point in time, based on relevant market information about the financial instrument. These estimates are subjective in nature and involve uncertainties and matters of judgment, and therefore cannot be determined with precision.
Accounting standards define fair value as the price that would be received from selling an asset or paid to transfer a liability in the principal or most advantageous market for the asset or liability in an orderly transaction between market participants at the measurement date. Accounting standards establish a fair value hierarchy which requires an entity to maximize the use of observable inputs and minimize the use of unobservable inputs when measuring fair value and also establishes the following three levels of inputs that may be used to measure fair value:
|
Level 1
|
Quoted prices in active markets for identical assets or liabilities
|
|
Level 2
|
Observable inputs other than Level 1 prices such as quoted prices for similar assets or liabilities; quoted market prices in markets that are not active; or model-derived valuations or other inputs that are observable or can be corroborated by observable market data for substantially the full term of the assets or liabilities
|
|
Level 3
|
Unobservable inputs that are supported by little or no market activity and that are significant to the fair value of the assets or liabilities
|
The following methods and assumptions were used by us in estimating fair value disclosures for financial instruments:
|
•
|
Cash and cash equivalents, accounts receivable, other current assets, vehicle floorplan payable, accounts payable, other current liabilities, commercial paper, and variable rate debt:
The amounts reported in the accompanying Consolidated Balance Sheets approximate fair value due to their short-term nature or the existence of variable interest rates that approximate prevailing market rates.
|
|
•
|
Fixed rate long-term debt:
Our fixed rate long-term debt consists primarily of amounts outstanding under our senior unsecured notes and mortgages. We estimate the fair value of our senior unsecured notes using quoted prices for the identical liability (Level 1). We estimate the fair value of our mortgages using a present value technique based on our current market interest rates for similar types of financial instruments (Level 2). A summary of the aggregate carrying values and fair values of our fixed rate long-term debt is as follows:
|
|
December 31, 2016
|
December 31, 2015
|
||||||
|
Carrying value
|
$
|
1,778.6
|
|
$
|
1,757.0
|
|
|
|
Fair value
|
$
|
1,862.2
|
|
$
|
1,858.6
|
|
|
Nonfinancial assets such as goodwill, other intangible assets, and long-lived assets held and used are measured at fair value when there is an indicator of impairment and recorded at fair value only when impairment is recognized or for a business combination. The fair values less costs to sell of long-lived assets or disposal groups held for sale are assessed each reporting period they remain classified as held for sale. Subsequent changes in the held for sale long-lived asset’s or disposal group’s fair value less cost to sell (increase or decrease) are reported as an adjustment to its carrying amount, except that the adjusted carrying amount cannot exceed the carrying amount of the long-lived asset or disposal group at the time it was initially classified as held for sale.
84
The following table presents nonfinancial assets measured and recorded at fair value on a nonrecurring basis during the years ended December 31,
2016
and
2015
:
|
2016
|
2015
|
||||||||||||||
|
Description
|
Fair Value Measurements Using Significant Unobservable Inputs (Level 3)
|
Gain/(Loss)
|
Fair Value Measurements Using Significant Unobservable Inputs (Level 3)
|
Gain/(Loss)
|
|||||||||||
|
Franchise rights
|
$
|
—
|
|
$
|
—
|
|
$
|
3.1
|
|
$
|
(15.4
|
)
|
|||
|
Long-lived assets held and used
|
$
|
5.9
|
|
$
|
(1.9
|
)
|
$
|
24.9
|
|
$
|
(3.1
|
)
|
|||
|
Long-lived assets held for sale:
|
|||||||||||||||
|
Continuing operations
|
$
|
19.4
|
|
$
|
(12.1
|
)
|
$
|
17.6
|
|
$
|
(3.0
|
)
|
|||
|
Discontinued operations
|
12.7
|
|
(0.7
|
)
|
5.3
|
|
(0.8
|
)
|
|||||||
|
Total long-lived assets held for sale
|
32.1
|
|
(12.8
|
)
|
22.9
|
|
(3.8
|
)
|
|||||||
Goodwill and Other Intangible Assets
Under accounting standards, we chose to make a qualitative evaluation about the likelihood of goodwill impairment to determine whether it was necessary to calculate the fair values of our reporting units under the two-step goodwill impairment test. We completed our qualitative annual assessments of potential goodwill impairment as of
April 30
,
2016
and
2015
, and we determined that it was not more likely than not that the fair values of our reporting units were less than their carrying amounts. Accordingly,
no
impairment charges were recorded for the carrying value of goodwill during
2016
or
2015
.
Our principal identifiable intangible assets are individual store rights under franchise agreements with vehicle manufacturers, which have indefinite lives. Under accounting standards, we chose to make a qualitative evaluation about the likelihood of franchise rights impairment to determine whether it was necessary to perform a quantitative impairment test. We completed our qualitative assessment of franchise rights impairment as of
April 30
,
2016
and 2015. Based on our qualitative assessment of potential franchise rights impairment, we determined that we should perform a quantitative test for certain franchise rights, and
no
impairment charges resulted from these quantitative tests.
As a result of the issues related to Volkswagen associated with certain of its diesel engine vehicles, during the fourth quarter of 2015, we performed a quantitative impairment test of the franchise rights recorded at our Volkswagen stores. As a result of this test, we recorded non-cash impairment charges during 2015 of
$15.4 million
to reduce the carrying values of the Volkswagen franchise rights to their estimated fair values. The non-cash impairment charges are reflected as Franchise Rights Impairment in the accompanying Consolidated Statements of Income.
The quantitative impairment test for franchise rights requires the comparison of the franchise rights’ estimated fair value to carrying value by store. Fair values of rights under franchise agreements are estimated using Level 3 inputs by discounting expected future cash flows of the store. The forecasted cash flows contain inherent uncertainties, including significant estimates and assumptions related to growth rates, margins, working capital requirements, capital expenditures, and cost of capital, for which we utilize certain market participant-based assumptions, using third-party industry projections, economic projections, and other marketplace data we believe to be reasonable. The development of the assumptions used in our annual impairment tests are coordinated by our financial planning and analysis group, and the assumptions are reviewed by management.
Long-Lived Assets
The fair value measurement valuation process for our long-lived assets is established by our corporate real estate services group. Fair value measurements, which are based on Level 3 inputs, and changes in fair value measurements are
85
reviewed and assessed each quarter for properties classified as held for sale, or when an indicator of impairment exists for properties classified as held and used, by the corporate real estate services group. Our corporate real estate services group utilizes its knowledge of the automotive industry and historical experience in real estate markets and transactions in establishing the valuation process, which is generally based on a combination of the market and replacement cost approaches.
In a market approach, the corporate real estate services group uses transaction prices for comparable properties that have recently been sold. These transaction prices are adjusted for factors related to a specific property. The corporate real estate services group also evaluates changes in local real estate markets, and/or recent market interest or negotiations related to a specific property. In a replacement cost approach, the cost to replace a specific long-lived asset is considered, which is adjusted for depreciation from physical deterioration, as well as functional and economic obsolescence, if present and measurable.
To validate the fair values determined under the valuation process noted above, our corporate real estate services group also obtains independent third-party appraisals for our properties and/or third-party brokers’ opinions of value, which are generally developed using the same valuation approaches described above, and evaluates any recent negotiations or discussions with third-party real estate brokers related to a specific long-lived asset or market.
Long-lived Assets Held and Used in Continuing Operations
We recorded non-cash impairment charges of
$1.9 million
in
2016
and
$3.1 million
in 2015 related to our long-lived assets held and used in continuing operations. These non-cash impairment charges are included in Other Income, Net (within Operating Income) in our Consolidated Statements of Income and are reported in the “Corporate and other” category of our segment information.
Long-lived Assets Held for Sale in Continuing Operations
We recorded non-cash impairment charges of
$12.1 million
in
2016
and
$3.0 million
in
2015
related to our long-lived assets held for sale in continuing operations. These non-cash impairment charges are included in Other Income, Net (within Operating Income) in our Consolidated Statements of Income and are reported in the “Corporate and other” category of our segment information.
Long-lived Assets Held for Sale in Discontinued Operations
We recorded non-cash impairment charges of
$0.7 million
in
2016
and
$0.8 million
in
2015
related to long-lived assets held for sale in discontinued operations. These non-cash impairment charges are included in Loss from Discontinued Operations in our Consolidated Statements of Income.
As of
December 31, 2016
, we had assets held for sale of
$41.4 million
in continuing operations and
$15.7 million
in discontinued operations. As of
December 31, 2015
, we had assets held for sale of
$47.1 million
in continuing operations and
$22.3 million
in discontinued operations.
17. BUSINESS AND CREDIT CONCENTRATIONS
We own and operate franchised automotive stores in the United States pursuant to franchise agreements with vehicle manufacturers. In
2016
, approximately
64%
of our total revenue was generated by our stores in Florida, Texas, and California. Franchise agreements generally provide the manufacturers or distributors with considerable influence over the operations of the store. The success of any franchised automotive dealership is dependent, to a large extent, on the financial condition, management, marketing, production, and distribution capabilities of the vehicle manufacturers or distributors of which we hold franchises. We had receivables from manufacturers or distributors of
$234.9 million
at December 31,
2016
, and
$221.4 million
at December 31,
2015
. Additionally, a large portion of our Contracts-in-Transit included in Receivables, net, in the accompanying Consolidated Balance Sheets, are due from automotive manufacturers’ captive finance subsidiaries which provide financing directly to our new and used vehicle customers.
86
We purchase substantially all of our new vehicles from various manufacturers or distributors at the prevailing prices available to all franchised dealers. Additionally, we finance our new vehicle inventory primarily with automotive manufacturers’ captive finance subsidiaries. Our sales volume could be adversely impacted by the manufacturers’ or distributors’ inability to supply the stores with an adequate supply of vehicles and related financing.
We are subject to a concentration of risk in the event of financial distress of or other adverse event related to a major vehicle manufacturer or related lender or supplier. The core brands of vehicles that we sell, representing approximately
94%
of the new vehicles that we sold in
2016
, are manufactured by
Toyota (including Lexus), Ford, Honda, General Motors, FCA US, Mercedes-Benz, Nissan, BMW, and Volkswagen (including Audi and Porsche)
. Our business could be materially adversely impacted by another bankruptcy of or other adverse event related to a major vehicle manufacturer or related lender or supplier.
Concentrations of credit risk with respect to non-manufacturer trade receivables are limited due to the wide variety of customers and markets in which our products are sold as well as their dispersion across many different geographic areas in the United States. Consequently, at December 31,
2016
, we do not consider AutoNation to have any significant non-manufacturer concentrations of credit risk.
18. CHARGEBACK LIABILITY
We may be charged back for commissions related to financing, vehicle service, or protection products in the event of early termination, default, or prepayment of the contracts by customers (“chargebacks”). However, our exposure to loss generally is limited to the commissions that we receive. These commissions are recorded at the time of the sale of the vehicles, net of an estimated liability for chargebacks. The following is a rollforward of our estimated chargeback liability for each of the three years presented in our Consolidated Financial Statements:
|
2016
|
2015
|
2014
|
|||||||||
|
Balance - January 1
|
$
|
97.3
|
|
$
|
84.9
|
|
$
|
67.6
|
|
||
|
Add: Provisions
|
106.6
|
|
90.0
|
|
79.4
|
|
|||||
|
Deduct: Chargebacks
|
(87.1
|
)
|
(77.6
|
)
|
(62.1
|
)
|
|||||
|
Balance - December 31
|
$
|
116.8
|
|
$
|
97.3
|
|
$
|
84.9
|
|
||
19. SEGMENT INFORMATION
At December 31,
2016
,
2015
, and
2014
, we had
three
reportable segments: (1) Domestic, (2) Import, and (3) Premium Luxury. Our Domestic segment is comprised of retail automotive franchises that sell new vehicles manufactured by General Motors, Ford, and FCA US. Our Import segment is comprised of retail automotive franchises that sell new vehicles manufactured primarily by Toyota, Honda, and Nissan. Our Premium Luxury segment is comprised of retail automotive franchises that sell new vehicles manufactured primarily by Mercedes-Benz, BMW, Lexus, and Audi. The franchises in each segment also sell used vehicles, parts and automotive services, and automotive finance and insurance products.
“Corporate and other” is comprised of our other businesses, including collision centers and an auction operation, each of which generates revenues, as well as unallocated corporate overhead expenses and retrospective commissions for certain finance and insurance transactions that we arrange under agreements with third parties.
The reportable segments identified above are the business activities of the Company for which discrete financial information is available and for which operating results are regularly reviewed by our chief operating decision maker to allocate resources and assess performance. Our chief operating decision maker is our Chief Executive Officer.
87
In the following tables of financial data, revenue and segment income of our reportable segments are reconciled to consolidated revenue and consolidated income from continuing operations before income taxes, respectively.
|
|
Years Ended December 31,
|
||||||||||
|
|
2016
|
2015
|
2014
|
||||||||
|
Revenues:
|
|||||||||||
|
Domestic
|
$
|
7,810.0
|
|
$
|
7,069.8
|
|
$
|
6,359.5
|
|
||
|
Import
|
6,886.1
|
|
7,037.2
|
|
6,717.8
|
|
|||||
|
Premium Luxury
|
6,665.3
|
|
6,607.8
|
|
5,889.3
|
|
|||||
|
Total
|
21,361.4
|
|
20,714.8
|
|
18,966.6
|
|
|||||
|
Corporate and other
|
247.6
|
|
147.2
|
|
142.2
|
|
|||||
|
Total consolidated revenue
|
$
|
21,609.0
|
|
$
|
20,862.0
|
|
$
|
19,108.8
|
|
||
|
|
Years Ended December 31,
|
||||||||||
|
|
2016
|
2015
|
2014
|
||||||||
|
Segment income
(1)
:
|
|||||||||||
|
Domestic
|
$
|
311.1
|
|
$
|
336.9
|
|
$
|
285.0
|
|
||
|
Import
|
296.8
|
|
311.4
|
|
291.3
|
|
|||||
|
Premium Luxury
|
350.2
|
|
376.2
|
|
366.1
|
|
|||||
|
Total
|
958.1
|
|
1,024.5
|
|
942.4
|
|
|||||
|
Corporate and other
|
(145.1
|
)
|
(209.7
|
)
|
(174.9
|
)
|
|||||
|
Other interest expense
|
(115.5
|
)
|
(90.9
|
)
|
(86.7
|
)
|
|||||
|
Loss on debt extinguishment
|
—
|
|
—
|
|
(1.6
|
)
|
|||||
|
Interest income
|
1.1
|
|
0.1
|
|
0.2
|
|
|||||
|
Other income (loss), net
|
3.7
|
|
(1.3
|
)
|
2.9
|
|
|||||
|
Income from continuing operations before income taxes
|
$
|
702.3
|
|
$
|
722.7
|
|
$
|
682.3
|
|
||
|
(1)
|
Segment income represents income for each of our reportable segments and is defined as operating income less floorplan interest expense.
|
88
In the following tables of financial data, floorplan interest expense, depreciation and amortization, total assets, and capital expenditures are reconciled to the consolidated totals as follows:
|
|
Years Ended December 31,
|
||||||||||
|
|
2016
|
2015
|
2014
|
||||||||
|
Floorplan interest expense:
|
|||||||||||
|
Domestic
|
$
|
33.7
|
|
$
|
24.1
|
|
$
|
24.4
|
|
||
|
Import
|
17.4
|
|
15.0
|
|
14.5
|
|
|||||
|
Premium Luxury
|
22.7
|
|
18.0
|
|
13.1
|
|
|||||
|
Corporate and other
|
2.7
|
|
1.2
|
|
1.3
|
|
|||||
|
Total floorplan interest expense
|
$
|
76.5
|
|
$
|
58.3
|
|
$
|
53.3
|
|
||
|
|
Years Ended December 31,
|
||||||||||
|
|
2016
|
2015
|
2014
|
||||||||
|
Depreciation and amortization:
|
|||||||||||
|
Domestic
|
$
|
37.5
|
|
$
|
31.0
|
|
$
|
27.3
|
|
||
|
Import
|
35.4
|
|
32.9
|
|
31.0
|
|
|||||
|
Premium Luxury
|
40.7
|
|
35.0
|
|
28.3
|
|
|||||
|
Corporate and other
|
29.8
|
|
28.5
|
|
20.3
|
|
|||||
|
Total depreciation and amortization
|
$
|
143.4
|
|
$
|
127.4
|
|
$
|
106.9
|
|
||
|
Years Ended December 31,
|
|||||||||||
|
2016
|
2015
|
2014
|
|||||||||
|
Capital expenditures:
|
|||||||||||
|
Domestic
|
$
|
62.5
|
|
$
|
61.4
|
|
$
|
61.7
|
|
||
|
Import
|
28.0
|
|
34.0
|
|
47.0
|
|
|||||
|
Premium Luxury
|
95.6
|
|
101.9
|
|
68.3
|
|
|||||
|
Corporate and other
|
67.1
|
|
69.6
|
|
20.8
|
|
|||||
|
Total capital expenditures
|
$
|
253.2
|
|
$
|
266.9
|
|
$
|
197.8
|
|
||
|
|
Years Ended December 31,
|
||||||||||
|
|
2016
|
2015
|
2014
|
||||||||
|
Assets:
|
|||||||||||
|
Domestic
|
$
|
2,742.8
|
|
$
|
2,573.9
|
|
$
|
2,187.3
|
|
||
|
Import
|
2,065.5
|
|
2,145.2
|
|
1,997.7
|
|
|||||
|
Premium Luxury
|
2,603.4
|
|
2,554.6
|
|
2,051.0
|
|
|||||
|
Corporate and other:
|
|||||||||||
|
Goodwill
|
1,511.3
|
|
1,394.5
|
|
1,314.7
|
|
|||||
|
Franchise rights
|
589.4
|
|
432.4
|
|
348.1
|
|
|||||
|
Other Corporate and other assets
|
547.6
|
|
447.6
|
|
496.2
|
|
|||||
|
Total assets
|
$
|
10,060.0
|
|
$
|
9,548.2
|
|
$
|
8,395.0
|
|
||
89
20. MULTIEMPLOYER PENSION PLANS
Five
of our
260
stores participate in multiemployer pension plans. We contribute to these multiemployer defined benefit pension plans under the terms of collective-bargaining agreements that cover certain of our union-represented employees. The risks of participating in these multiemployer plans are different from single-employer plans in the following aspects:
|
a.
|
Assets contributed to the multiemployer plan by one employer may be used to provide benefits to employees of other participating employers.
|
|
b.
|
If a participating employer stops contributing to the plan, the unfunded obligations of the plan may be assumed by the remaining participating employers.
|
|
c.
|
If we choose to stop participating in a multiemployer plan, we may be required to pay the plan an amount based on the underfunded status of the plan, subject to certain limits, referred to as a withdrawal liability.
|
One of the multiemployer pension plans in which we participate is designated as being in “red zone” status, as defined by the Pension Protection Act (PPA) of 2006. Our participation in this plan for the year ended December 31,
2016
, is outlined in the table below. The “EIN/Pension Plan Number” column provides the Employer Identification Number (EIN) and the three-digit plan number. The most recent PPA zone status available in
2016
and
2015
is for the plan’s year end at December 31,
2015
, and December 31,
2014
, respectively. The zone status is based on information that we received from the plan and is certified by the plan’s actuary. Among other factors, plans in the red zone are generally
less than 65 percent
funded. The last column lists the expiration date of the collective-bargaining agreements to which the plan is subject. A rehabilitation plan has been implemented for this plan. There have been no significant changes that affect the comparability of
2016
,
2015
, and
2014
contributions.
|
Pension Protection Act Zone Status
|
Contributions of AutoNation
($ in millions)
(1)
|
Expiration Date of Collective-Bargaining Agreement
|
||||||||||||||||||||
|
Pension Fund
|
EIN/Pension PlanNumber
|
2016
|
2015
|
2016
|
2015
|
2014
|
Surcharge Imposed
|
|||||||||||||||
|
Automotive Industries Pension Plan
|
94-1133245 - 001
|
Red
|
Red
|
$
|
1.1
|
|
$
|
1.0
|
|
$
|
0.8
|
|
Yes
|
(2)
|
||||||||
|
Other funds
|
0.4
|
|
0.4
|
|
0.3
|
|
||||||||||||||||
|
Total contributions
|
$
|
1.5
|
|
$
|
1.4
|
|
$
|
1.1
|
|
|||||||||||||
|
(1)
|
Our stores were not listed in the Automotive Industries Pension Plan’s Form 5500 as providing more than 5% of the total contributions for the plan years ended December 31,
2015
or
2014
.
|
|
(2)
|
We are party to
two
collective-bargaining agreements that require contributions to the Automotive Industries Pension Plan.
One
expired May 31, 2011, and
one
expired June 30, 2011, and both are currently extended during collective bargaining for new agreements.
|
In the event that we cease participating in this plan, we could be assessed a withdrawal liability. We currently do not have any plans that would trigger the withdrawal liability under this multiemployer pension plan.
90
The following is an analysis of certain items in the Consolidated Statements of Income by quarter for
2016
and
2015
:
|
First
Quarter
|
Second
Quarter
|
Third
Quarter
|
Fourth
Quarter
|
||||||||||||||
|
Revenue
|
2016
|
$
|
5,119.6
|
|
$
|
5,441.4
|
|
$
|
5,567.5
|
|
$
|
5,480.5
|
|
||||
|
2015
|
$
|
4,944.2
|
|
$
|
5,224.3
|
|
$
|
5,353.7
|
|
$
|
5,339.8
|
|
|||||
|
Gross profit
|
2016
|
$
|
825.9
|
|
$
|
841.8
|
|
$
|
836.4
|
|
$
|
809.1
|
|
||||
|
2015
|
$
|
799.9
|
|
$
|
819.1
|
|
$
|
830.3
|
|
$
|
812.2
|
|
|||||
|
Operating income
(1) (2)
|
2016
|
$
|
207.4
|
|
$
|
226.5
|
|
$
|
219.0
|
|
$
|
236.6
|
|
||||
|
2015
|
$
|
214.9
|
|
$
|
222.1
|
|
$
|
235.7
|
|
$
|
200.4
|
|
|||||
|
Income from continuing operations
(1) (2)
|
2016
|
$
|
96.2
|
|
$
|
112.1
|
|
$
|
107.8
|
|
$
|
115.6
|
|
||||
|
2015
|
$
|
111.7
|
|
$
|
115.2
|
|
$
|
119.0
|
|
$
|
97.8
|
|
|||||
|
Net income
(1) (2)
|
2016
|
$
|
95.9
|
|
$
|
112.0
|
|
$
|
107.3
|
|
$
|
115.3
|
|
||||
|
2015
|
$
|
111.5
|
|
$
|
115.1
|
|
$
|
118.5
|
|
$
|
97.5
|
|
|||||
|
Basic earnings per share from continuing operations
(1) (2) (3)
|
2016
|
$
|
0.90
|
|
$
|
1.09
|
|
$
|
1.06
|
|
$
|
1.15
|
|
||||
|
2015
|
$
|
0.98
|
|
$
|
1.01
|
|
$
|
1.06
|
|
$
|
0.88
|
|
|||||
|
Diluted earnings per share from continuing operations
(1) (2) (3)
|
2016
|
$
|
0.90
|
|
$
|
1.08
|
|
$
|
1.05
|
|
$
|
1.14
|
|
||||
|
2015
|
$
|
0.97
|
|
$
|
1.00
|
|
$
|
1.05
|
|
$
|
0.87
|
|
|||||
|
(1)
|
During the fourth quarter of 2016, we recorded gains of $31.7 million ($19.6 million after-tax) related to a business divestiture and $14.4 million ($8.9 million after-tax) related to a legal settlement.
|
|
(2)
|
During the fourth quarter of 2015, we recorded
$15.4 million
(
$9.6 million
after-tax) of non-cash impairment charges related to rights under certain of our Volkswagen stores’ franchise agreements to reduce the carrying values of the Volkswagen franchise rights to their estimated fair values.
|
|
(3)
|
The sum of quarterly basic and diluted earnings per share from continuing operations may not equal full year amounts as reported in the Consolidated Statements of Income due to the effect of the calculation of weighted average common stock equivalents on a quarterly basis.
|
91
ITEM 9.
CHANGES IN AND DISAGREEMENTS WITH ACCOUNTANTS ON ACCOUNTING AND FINANCIAL DISCLOSURE
None.
ITEM 9A.
CONTROLS AND PROCEDURES
Evaluation of Disclosure Controls and Procedures
Our management, with the participation of our Chief Executive Officer and Chief Financial Officer, evaluated the effectiveness of our disclosure controls and procedures (as defined in Rules 13a-15(e) and 15d-15(e) under the Securities Exchange Act of 1934, as amended (the “Exchange Act”)) as of the end of the period covered by this Annual Report on Form 10-K. Based on that evaluation, our Chief Executive Officer and Chief Financial Officer concluded that our disclosure controls and procedures were effective as of the end of the period covered by this Annual Report on Form 10-K.
Management’s Annual Report on Internal Control Over Financial Reporting
Our management is responsible for establishing and maintaining adequate internal control over financial reporting (as defined in Rules 13a-15(f) and 15d-15(f) under the Exchange Act). Management conducted an evaluation of the effectiveness of our internal control over financial reporting based on the framework in
Internal Control — Integrated Framework
(2013)
issued by the Committee of Sponsoring Organizations of the Treadway Commission. Based on this evaluation
,
our management concluded that our internal control over financial reporting was effective as of December 31,
2016
. Our independent auditor, KPMG LLP, also concluded that we maintained effective internal control over financial reporting as set forth in its Report of Independent Registered Public Accounting Firm which is included in Part II, Item 8 of this Form 10-K.
As permitted by the Securities and Exchange Commission, management elected to exclude the two stores and one collision center that we acquired in the fourth quarter of
2016
from its assessment of internal control over financial reporting as of December 31,
2016
, as there was not an adequate amount of time between the acquisition dates and the date of management’s assessment. The total assets and total revenues of these acquired stores and collision center included in our consolidated financial statements as of and for the year ended December 31,
2016
, represented less than 0.6% of our total consolidated assets and less than 0.4% of our total consolidated revenue.
Changes in Internal Control over Financial Reporting
There was no change in our internal control over financial reporting (as defined in Rules 13a-15(f) and 15d-15(f) under the Exchange Act) identified in connection with the evaluation required by paragraph (d) of Rule 13a-15 or 15d-15 under the Exchange Act that occurred during the fourth quarter of
2016
that has materially affected, or is reasonably likely to materially affect, our internal control over financial reporting.
ITEM 9B.
OTHER INFORMATION
None.
92
ITEM 10.
DIRECTORS, EXECUTIVE OFFICERS AND CORPORATE GOVERNANCE
The information under the heading “Executive Officers of AutoNation” in Part I, Item 1 of this Form 10-K is incorporated by reference in this section.
We have adopted a Code of Business Ethics applicable to all employees. In addition, we have adopted a Code of Ethics for Senior Officers applicable to our principal executive officer, principal financial officer, principal accounting officer, and other senior officers and a Code of Ethics for Directors applicable to our directors. These codes are available on our Investor Relations website at
investors.autonation.com
. In the event that we amend or waive any of the provisions of the Code of Ethics for Senior Officers that relate to any element of the code of ethics definition enumerated in Item 406(b) of Regulation S-K, we intend to disclose the same on our Investor Relations website.
The other information required by this item is incorporated by reference to AutoNation’s Proxy Statement for its
2017
Annual Meeting of Stockholders to be filed with the SEC within 120 days after the end of the fiscal year ended December 31,
2016
.
ITEM 11.
EXECUTIVE COMPENSATION
The information required by this item is incorporated by reference to AutoNation’s Proxy Statement for its
2017
Annual Meeting of Stockholders to be filed with the SEC within 120 days after the end of the fiscal year ended December 31,
2016
.
ITEM 12.
SECURITY OWNERSHIP OF CERTAIN BENEFICIAL OWNERS AND MANAGEMENT AND RELATED STOCKHOLDER MATTERS
The information required by this item is incorporated by reference to AutoNation’s Proxy Statement for its
2017
Annual Meeting of Stockholders to be filed with the SEC within 120 days after the end of the fiscal year ended December 31,
2016
.
ITEM 13.
CERTAIN RELATIONSHIPS AND RELATED TRANSACTIONS, AND DIRECTOR INDEPENDENCE
The information required by this item is incorporated by reference to AutoNation’s Proxy Statement for its
2017
Annual Meeting of Stockholders to be filed with the SEC within 120 days after the end of the fiscal year ended December 31,
2016
.
ITEM 14.
PRINCIPAL ACCOUNTING FEES AND SERVICES
The information required by this item is incorporated by reference to AutoNation’s Proxy Statement for its
2017
Annual Meeting of Stockholders to be filed with the SEC within 120 days after the end of the fiscal year ended December 31,
2016
.
93
ITEM 15.
EXHIBITS, FINANCIAL STATEMENT SCHEDULES
|
1.
|
Financial Statements: The Consolidated Financial Statements of AutoNation are set forth in Part II, Item 8 of this Form 10-K.
|
|
2.
|
Financial Statement Schedules: Not applicable.
|
|
3.
|
Exhibits: The exhibits listed in the accompanying Exhibit Index are filed, furnished or incorporated by reference as part of this Form 10-K.
|
Certain of the agreements listed as exhibits to this Form 10-K (including the exhibits to such agreements), which have been filed to provide investors with information regarding their terms, contain various representations, warranties, and covenants of AutoNation, Inc. and the other parties thereto. They are not intended to provide factual information about any of the parties thereto or any subsidiaries of the parties thereto. The assertions embodied in those representations, warranties, and covenants were made for purposes of each of the agreements, solely for the benefit of the parties thereto. In addition, certain representations and warranties were made as of a specific date, may be subject to a contractual standard of materiality different from what a security holder might view as material, or may have been made for purposes of allocating contractual risk among the parties rather than establishing matters as facts. Investors should not view the representations, warranties, and covenants in the agreements (or any description thereof) as disclosures with respect to the actual state of facts concerning the business, operations, or condition of any of the parties to the agreements (or their subsidiaries) and should not rely on them as such. In addition, information in any such representations, warranties, or covenants may change after the dates covered by such provisions, which subsequent information may or may not be fully reflected in the public disclosures of the parties. In any event, investors should read the agreements together with the other information concerning AutoNation, Inc. contained in reports and statements that we file with the SEC.
94
SIGNATURES
Pursuant to the requirements of Section 13 or 15(d) of the Securities Exchange Act of 1934, the registrant has duly caused this report to be signed on its behalf by the undersigned, thereunto duly authorized.
|
AUTONATION, INC.
|
||
|
(Registrant)
|
||
|
By:
|
|
/s/ M
ICHAEL
J. J
ACKSON
|
|
|
Michael J. Jackson
Chairman of the Board and Chief Executive Officer
|
|
|
|
February 8, 2017
|
|
Pursuant to the requirements of the Securities Exchange Act of 1934, this report has been signed below by the following persons on behalf of the registrant and in the capacities and on the dates indicated.
|
Signature
|
Title
|
Date
|
||
|
/
S
/ M
ICHAEL
J. J
ACKSON
|
Chairman of the Board and Chief
|
February 8, 2017
|
||
|
Michael J. Jackson
|
Executive Officer (Principal Executive Officer)
|
|||
|
/
S
/ C
HERYL
M
ILLER
|
Executive Vice President and Chief
|
February 8, 2017
|
||
|
Cheryl Miller
|
Financial Officer (Principal Financial Officer)
|
|||
|
/
S
/ C
HRISTOPHER
C
ADE
|
Vice President and Chief Accounting
|
February 8, 2017
|
||
|
Christopher Cade
|
Officer (Principal Accounting Officer)
|
|||
|
/
S
/ R
ICK
L. B
URDICK
|
Director
|
February 8, 2017
|
||
|
Rick L. Burdick
|
||||
|
/s/ T
OMAGO
C
OLLINS
|
Director
|
February 8, 2017
|
||
|
Tomago Collins
|
||||
|
/
S
/ D
AVID
B. E
DELSON
|
Director
|
February 8, 2017
|
||
|
David B. Edelson
|
||||
|
/
S
/ K
AREN
C. F
RANCIS
|
Director
|
February 8, 2017
|
||
|
Karen C. Francis
|
||||
|
/
S
/ R
OBERT
R. G
RUSKY
|
Director
|
February 8, 2017
|
||
|
Robert R. Grusky
|
||||
|
/
S
/ K
AVEH
K
HOSROWSHAHI
|
Director
|
February 8, 2017
|
||
|
Kaveh Khosrowshahi
|
||||
|
/
S
/ M
ICHAEL
L
ARSON
|
Director
|
February 8, 2017
|
||
|
Michael Larson
|
||||
|
/
S
/ G. M
IKE
M
IKAN
|
Director
|
February 8, 2017
|
||
|
G. Mike Mikan
|
||||
|
/
S
/ A
LISON
H. R
OSENTHAL
|
Director
|
February 8, 2017
|
||
|
Alison H. Rosenthal
|
||||
95
|
Exhibit
Number
|
Exhibit Description
|
Incorporated by Reference
|
|||||||||
|
Form
|
File Number
|
Exhibit
|
Filing Date
|
||||||||
|
3.1
|
Third Amended and Restated Certificate of Incorporation of AutoNation, Inc.
|
10-Q
|
001-13107
|
3.1
|
|
8/13/99
|
|||||
|
3.2
|
Amended and Restated By-Laws of AutoNation, Inc.
|
8-K
|
001-13107
|
3.1
|
|
12/16/16
|
|||||
|
4.1
|
Indenture, dated April 14, 2010 (the “2010 Indenture”), among AutoNation, Inc. and Wells Fargo Bank, National Association.
|
8-K
|
001-13107
|
4.1
|
|
4/15/10
|
|||||
|
4.2
|
Supplemental Indenture to 2010 Indenture, dated April 14, 2010, relating to the Company’s 6.75% Senior Notes due 2018.
|
8-K
|
001-13107
|
4.2
|
|
4/15/10
|
|||||
|
4.3
|
Form of 6.75% Senior Notes due 2018 (included in Exhibit 4.2).
|
8-K
|
001-13107
|
4.2
|
|
4/15/10
|
|||||
|
4.4
|
Supplemental Indenture to 2010 Indenture, dated February 1, 2012, relating to the Company’s 5.5% Senior Notes due 2020.
|
8-K
|
001-13107
|
4.2
|
|
2/1/12
|
|||||
|
4.5
|
Form of 5.5% Senior Notes due 2020 (included in Exhibit 4.4).
|
8-K
|
001-13107
|
4.2
|
|
2/1/12
|
|||||
|
4.6
|
Supplemental Indenture to 2010 Indenture, dated March 7, 2012, relating to the Company’s 6.75% Senior Notes due 2018.
|
10-Q
|
001-13107
|
4.5
|
|
4/25/12
|
|||||
|
4.7
|
Supplemental Indenture to 2010 Indenture, dated March 7, 2012, relating to the Company’s 5.5% Senior Notes due 2020.
|
10-Q
|
001-13107
|
4.6
|
|
4/25/12
|
|||||
|
4.8
|
Supplemental Indenture to 2010 Indenture, dated February 6, 2014, relating to the Company’s 6.75% Senior Notes due 2018.
|
10-Q
|
001-13107
|
4.1
|
|
4/18/14
|
|||||
|
4.9
|
Supplemental Indenture to 2010 Indenture, dated February 6, 2014, relating to the Company’s 5.5% Senior Notes due 2020.
|
10-Q
|
001-13107
|
4.2
|
|
4/18/14
|
|||||
|
4.10
|
Supplemental Indenture to 2010 Indenture, dated September 21, 2015, relating to the Company’s 3.35% Senior Notes due 2021.
|
8-K
|
001-13107
|
4.2
|
|
9/21/15
|
|||||
|
4.11
|
Form of 3.35% Senior Notes due 2021 (included in Exhibit 4.10).
|
8-K
|
001-13107
|
4.2
|
|
9/21/15
|
|||||
|
4.12
|
Supplemental Indenture to 2010 Indenture, dated September 21, 2015, relating to the Company’s 4.5% Senior Notes due 2025.
|
8-K
|
001-13107
|
4.3
|
|
9/21/15
|
|||||
|
4.13
|
Form of 4.5% Senior Notes due 2025 (included in Exhibit 4.12).
|
8-K
|
001-13107
|
4.3
|
|
9/21/15
|
|||||
|
4.14
|
Supplemental Indenture to 2010 Indenture, dated February 29, 2016, relating to the Company’s 6.75% Senior Notes due 2018.
|
10-Q
|
001-13107
|
4.1
|
|
4/22/16
|
|||||
|
4.15
|
Supplemental Indenture to 2010 Indenture, dated February 29, 2016, relating to the Company’s 5.5% Senior Notes due 2020.
|
10-Q
|
001-13107
|
4.2
|
|
4/22/16
|
|||||
|
4.16
|
Supplemental Indenture to 2010 Indenture, dated February 29, 2016, relating to the Company’s 3.35% Senior Notes due 2021.
|
10-Q
|
001-13107
|
4.3
|
|
4/22/16
|
|||||
|
4.17
|
Supplemental Indenture to 2010 Indenture, dated February 29, 2016, relating to the Company’s 4.5% Senior Notes due 2025.
|
10-Q
|
001-13107
|
4.4
|
|
4/22/16
|
|||||
96
|
Exhibit
Number
|
Exhibit Description
|
Incorporated by Reference
|
|||||||||
|
Form
|
File Number
|
Exhibit
|
Filing Date
|
||||||||
|
4.18
|
Supplemental Indenture to 2010 Indenture, dated July 29, 2016, relating to the Company’s 6.75% Senior Notes due 2018.
|
10-Q
|
001-13107
|
4.1
|
|
10/28/16
|
|||||
|
4.19
|
Supplemental Indenture to 2010 Indenture, dated July 29, 2016, relating to the Company’s 5.5% Senior Notes due 2020.
|
10-Q
|
001-13107
|
4.2
|
|
10/28/16
|
|||||
|
4.20
|
Supplemental Indenture to 2010 Indenture, dated July 29, 2016, relating to the Company’s 3.35% Senior Notes due 2021.
|
10-Q
|
001-13107
|
4.3
|
|
10/28/16
|
|||||
|
4.21
|
Supplemental Indenture to 2010 Indenture, dated July 29, 2016, relating to the Company’s 4.5% Senior Notes due 2025.
|
10-Q
|
001-13107
|
4.4
|
|
10/28/16
|
|||||
|
10.1
|
AutoNation, Inc. 1995 Amended and Restated Employee Stock Option Plan, as amended and restated.
|
10-Q
|
001-13107
|
10.2
|
|
8/14/00
|
|||||
|
10.2
|
AutoNation, Inc. Amended and Restated 1995 Non-Employee Director Stock Option Plan.
|
10-K
|
001-13107
|
10.10
|
|
3/31/99
|
|||||
|
10.3
|
Amendment, dated October 24, 2006, to the AutoNation, Inc. Amended and Restated 1995 Non-Employee Director Stock Option Plan.
|
10-Q
|
001-13107
|
10.1
|
|
10/27/06
|
|||||
|
10.4
|
AutoNation, Inc. Amended and Restated 1997 Employee Stock Option Plan, as amended and restated on February 5, 2007.
|
10-K
|
001-13107
|
10.4
|
|
2/28/07
|
|||||
|
10.5
|
AutoNation, Inc. Amended and Restated 1998 Employee Stock Option Plan, as amended and restated on February 5, 2007.
|
10-K
|
001-13107
|
10.5
|
|
2/28/07
|
|||||
|
10.6
|
AutoNation, Inc. Deferred Compensation Plan, as amended and restated.
|
S-8
|
333-214308
|
99.1
|
|
10/28/16
|
|||||
|
10.7
|
Amended Employment Agreement, dated January 15, 2015, by and between AutoNation, Inc. and Michael J. Jackson.
|
8-K
|
001-13107
|
10.1
|
|
1/16/15
|
|||||
|
10.8
|
Amended Employment Agreement, dated October 23, 2014, as amended and restated on January 23, 2015, by and between AutoNation, Inc. and Michael E. Maroone.
|
8-K
|
001-13107
|
10.1
|
|
1/23/15
|
|||||
|
10.9
|
Letter Agreement, dated February 13, 2013, regarding dealership name usage.
|
10-Q
|
001-13107
|
10.1
|
|
4/19/13
|
|||||
|
10.10
|
AutoNation, Inc. 2007 Non-Employee Director Stock Option Plan.
|
10-K
|
001-13107
|
10.17
|
|
2/28/07
|
|||||
|
10.11
|
Amendment to the AutoNation, Inc. 2007 Non-Employee Director Stock Option Plan, effective as of October 26, 2010.
|
10-Q
|
001-13107
|
10.4
|
|
10/28/10
|
|||||
|
10.12
|
Amendment to the AutoNation, Inc. 2007 Non-Employee Director Stock Option Plan, effective as of February 1, 2012.
|
8-K
|
001-13107
|
10.2
|
|
2/2/12
|
|||||
|
10.13
|
AutoNation, Inc. 2014 Non-Employee Director Equity Plan.
|
10-Q
|
001-13107
|
10.6
|
|
4/18/14
|
|||||
|
10.14
|
Terms of Non-Employee Director Restricted Stock Units granted under the AutoNation, Inc. 2014 Non-Employee Director Equity Plan.
|
10-Q
|
001-13107
|
10.2
|
|
7/17/14
|
|||||
|
10.15
|
AutoNation, Inc. Senior Executive Incentive Bonus Plan.
|
8-K
|
001-13107
|
10.1
|
|
2/2/12
|
|||||
|
10.16
|
AutoNation, Inc. 2008 Employee Equity and Incentive Plan.
|
10-Q
|
001-13107
|
10.1
|
|
4/25/08
|
|||||
97
|
Exhibit
Number
|
Exhibit Description
|
Incorporated by Reference
|
|||||||||
|
Form
|
File Number
|
Exhibit
|
Filing Date
|
||||||||
|
10.17
|
Form of Stock Option Agreement for stock options granted under the AutoNation, Inc. employee stock options plans other than the 2008 Employee Equity and Incentive Plan.
|
10-K
|
001-13107
|
10.12
|
|
2/24/05
|
|||||
|
10.18
|
Form of Stock Option Agreement under the 2008 Employee Equity and Incentive Plan (for 2008 grants).
|
10-K
|
001-13107
|
10.16
|
|
2/17/09
|
|||||
|
10.19
|
Form of Restricted Stock Agreement under the 2008 Employee Equity Incentive and Incentive Plan (for 2008 grants).
|
10-K
|
001-13107
|
10.17
|
|
2/17/09
|
|||||
|
10.20
|
Form of Stock Option Agreement under the 2008 Employee Equity and Incentive Plan (for grants made in 2009-2013).
|
10-Q
|
001-13107
|
10.4
|
|
4/24/09
|
|||||
|
10.21
|
Form of Restricted Stock Agreement under the 2008 Employee Equity and Incentive Plan (for grants made in 2009-2013).
|
10-Q
|
001-13107
|
10.5
|
|
4/24/09
|
|||||
|
10.22
|
Form of Stock Option Agreement under the 2008 Employee Equity and Incentive Plan (for grants made in 2014).
|
8-K
|
001-13107
|
10.1
|
|
3/7/14
|
|||||
|
10.23
|
Form of Restricted Stock Agreement under the 2008 Employee Equity and Incentive Plan (for grants made in 2014).
|
8-K
|
001-13107
|
10.2
|
|
3/7/14
|
|||||
|
10.24
|
Form of Stock Option Agreement under the 2008 Plan for grants in 2015.
|
10-Q
|
001-13107
|
10.4
|
|
4/22/15
|
|||||
|
10.25
|
Form of Restricted Stock Agreement under the 2008 Plan for grants in 2015.
|
10-Q
|
001-13107
|
10.5
|
|
4/22/15
|
|||||
|
10.26
|
Form of Stock Option Agreement under the 2008 Plan for grants in 2016.
|
10-Q
|
001-13107
|
10.1
|
|
4/22/16
|
|||||
|
10.27
|
Form of Restricted Stock Agreement under the 2008 Plan for grants in 2016.
|
10-Q
|
001-13107
|
10.2
|
|
4/22/16
|
|||||
|
10.28
|
AutoNation, Inc. Policy Regarding Recoupment of Certain Incentive Compensation, effective as of February 6, 2015.
|
8-K
|
001-13107
|
10.1
|
|
2/6/15
|
|||||
|
10.29
|
Honda Agreement, dated January 28, 2009, between AutoNation, Inc., American Honda Motor Co., Inc. and ESL Investments, Inc.
|
8-K
|
001-13107
|
10.1
|
|
1/29/09
|
|||||
|
10.30
|
Stockholder Agreement, dated August 16, 2010, among AutoNation, Inc., Cascade Investment, L.L.C. and the Bill & Melinda Gates Foundation Trust.
|
8-K
|
001-13107
|
10.1
|
|
8/16/10
|
|||||
|
10.31
|
Amended and Restated Credit Agreement, dated December 3, 2014, by and among the Company, JPMorgan Chase Bank, N.A. as Administrative Agent, and the other parties thereto.
|
8-K
|
001-13107
|
10.1
|
|
12/4/14
|
|||||
|
10.32
|
Form of Commercial Paper Dealer Agreement between AutoNation, Inc., as Issuer, and the Dealer party thereto.
|
8-K
|
001-13107
|
10.1
|
|
5/22/15
|
|||||
|
12.1*
|
Statement Regarding Computation of Ratio of Earnings to Fixed Charges.
|
||||||||||
|
21.1*
|
Subsidiaries of AutoNation, Inc.
|
||||||||||
|
23.1*
|
Consent of KPMG LLP.
|
||||||||||
|
31.1*
|
Certification of Principal Executive Officer Pursuant to Rule 13a-14(a) of the Exchange Act.
|
||||||||||
|
31.2*
|
Certification of Principal Financial Officer Pursuant to Rule 13a-14(a) of the Exchange Act.
|
||||||||||
98
|
Exhibit
Number
|
Exhibit Description
|
Incorporated by Reference
|
|||||||||
|
Form
|
File Number
|
Exhibit
|
Filing Date
|
||||||||
|
32.1**
|
Certification of Principal Executive Officer Pursuant to Rule 13a-14(b) of the Exchange Act and 18 U.S.C. Section 1350.
|
||||||||||
|
32.2**
|
Certification of Principal Financial Officer Pursuant to Rule 13a-14(b) of the Exchange Act and 18 U.S.C. Section 1350.
|
||||||||||
|
101.INS*
|
XBRL Instance Document
|
||||||||||
|
101.SCH*
|
XBRL Taxonomy Extension Schema Document
|
||||||||||
|
101.CAL*
|
XBRL Taxonomy Extension Calculation Linkbase Document
|
||||||||||
|
101.DEF*
|
XBRL Taxonomy Extension Definition Linkbase Document
|
||||||||||
|
101.LAB*
|
XBRL Taxonomy Extension Label Linkbase Document
|
||||||||||
|
101.PRE*
|
XBRL Taxonomy Extension Presentation Linkbase Document
|
||||||||||
|
*
|
Filed herewith
|
|
**
|
Furnished herewith
|
Exhibits 10.1 through 10.28 are management contracts or compensatory plans, contracts, or arrangements.
In accordance with Item 601(b)(4)(iii)(A) of Regulation S-K, copies of certain instruments defining the rights of holders of long-term debt of the Company or its subsidiaries are not filed herewith. We hereby agree to furnish a copy of any such instrument to the Commission upon request.
99
TABLE OF CONTENTS
Part IItem 1. BusinessItem 1A. Risk FactorsItem 1B. Unresolved Staff CommentsItem 2. PropertiesItem 3. Legal ProceedingsItem 4. Mine Safety DisclosuresPart IIItem 5. Market For Registrant S Common Equity, Related Stockholder Matters and Issuer Purchases Of Equity SecuritiesItem 6. Selected Financial DataItem 7. Management S Discussion and Analysis Of Financial Condition and Results Of OperationsItem 7A. Quantitative and Qualitative Disclosures About Market RiskItem 8. Financial Statements and Supplementary DataItem 9. Changes in and Disagreements with Accountants on Accounting and Financial DisclosureItem 9A. Controls and ProceduresItem 9B. Other InformationPart IIIItem 10. Directors, Executive Officers and Corporate GovernanceItem 11. Executive CompensationItem 12. Security Ownership Of Certain Beneficial Owners and Management and Related Stockholder MattersItem 13. Certain Relationships and Related Transactions, and Director IndependenceItem 14. Principal Accounting Fees and ServicesPart IVItem 15. Exhibits, Financial Statement Schedules