ANGIODYNAMICS INC
10-Ks and 10-Qs
|
|
|
|
|
|
|
|
|
|
|
|
|
|
|
|
|
|
|
|
|
|
|
|
|
|
|
|
|
|
|
|
|
|
|
|
|
|
|
|
|
|
|
|
|
|
|
|
|
|
|
|
|
|
|
|
UNITED STATES
SECURITIES AND EXCHANGE COMMISSION
Washington, D.C. 20549
FORM 10-K
|
x
|
ANNUAL REPORT PURSUANT TO SECTION 13 OR 15(d) OF THE SECURITIES EXCHANGE ACT OF 1934
|
|
For the fiscal year ended May 31, 2017
|
|
OR
|
¨
|
TRANSITION REPORT PURSUANT TO SECTION 13 OR 15(d) OF THE SECURITIES EXCHANGE ACT OF 1934
|
|
For the transition period from to
|
|
Commission file number 0-50761
AngioDynamics, Inc.
(Exact name of registrant as specified in its charter)

|
Delaware
|
|
11-3146460
|
|
(State or other jurisdiction of
incorporation or organization)
|
|
(I.R.S. Employer
Identification No.)
|
|
14 Plaza Drive Latham, New York
|
|
12110
|
|
(Address of principal executive offices)
|
|
(Zip Code)
|
Registrant’s telephone number, including area code (518) 795-1400
Securities registered pursuant to Section 12(b) of the Act:
|
Title of each class
|
|
Name of each exchange on which registered
|
|
Common Stock, par value $.01 per share
|
|
NASDAQ Global Select Market
|
|
|
||
Securities registered pursuant to Section 12(g) of the Act:
None
(Title of Class)
Indicate by check mark if the registrant is a well-known seasoned issuer, as defined in Rule 405 of the Securities Act. Yes
¨
No
x
Indicate by check mark if the registrant is not required to file reports pursuant to Section 13 or 15(d) of the Act. Yes
¨
No
x
Indicate by check mark whether the registrant (1) has filed all reports required to be filed by Section 13 or 15(d) of the Securities Exchange Act of 1934 during the preceding 12 months (or for such shorter period that the registrant was required to file such reports), and (2) has been subject to such filing requirements for the past 90 days. Yes
x
No
¨
Indicate by check mark whether the registrant has submitted electronically and posted on its corporate website, if any, every Interactive Data File required to be submitted and posted pursuant to Rule 405 of Regulation S-T during the preceding 12 months (or for such shorter period that the registrant was required to submit and post such files). Yes
x
No
¨
Indicate by check mark if disclosure of delinquent filers pursuant to Item 405 of Regulation S-K is not contained herein, and will not be contained, to the best of registrant’s knowledge, in definitive proxy or information statements incorporated by reference in Part III of this Form 10-K or any amendment to this Form 10-K.
x
Indicate by check mark whether the registrant is a large accelerated filer, an accelerated filer, a non-accelerated filer, a smaller reporting company, or an emerging growth company. See definitions of “large accelerated filer”, “accelerated filer”, “smaller reporting company” and "emerging growth company" in Rule 12b-2 of the Exchange Act. (Check one):
|
Large accelerated filer
¨
|
|
Accelerated filer
x
|
|
|
Non-accelerated filer
¨
|
|
Smaller reporting company
¨
|
|
|
Emerging growth company
¨
|
|||
Indicate by check mark whether the registrant is a shell company (as defined in Rule 12b-2 of the Exchange Act). Yes
¨
No
x
As of November 30, 2016, the last business day of the registrant’s most recently completed second fiscal quarter, the aggregate market value of the registrant’s common stock held by non-affiliates was approximately $605,494,808 computed by reference to the last sale price of the common stock on that date as reported by The NASDAQ Global Select Market.
As of August 2, 2017, there were 36,580,575 shares of the registrant’s common stock outstanding.
DOCUMENTS INCORPORATED BY REFERENCE
The information required for Part III of this Annual Report on Form 10-K is incorporated by reference to the registrant’s Proxy Statement for its
2017
Annual Meeting of Stockholders to be filed within 120 days of the registrant's fiscal year ended
May 31, 2017
.
AngioDynamics, Inc. and Subsidiaries
INDEX
|
Page
|
||
|
Part I:
|
||
|
Item 1.
|
||
|
Item 1A.
|
||
|
Item 1B.
|
||
|
Item 2.
|
||
|
Item 3.
|
||
|
Item 4.
|
||
|
Part II:
|
||
|
Item 5.
|
||
|
Item 6.
|
||
|
Item 7.
|
||
|
Item 7A.
|
||
|
Item 8.
|
||
|
Item 9.
|
||
|
Item 9A.
|
||
|
Item 9B.
|
||
|
Part III:
|
||
|
Item 10.
|
||
|
Item 11.
|
||
|
Item 12.
|
||
|
Item 13.
|
||
|
Item 14.
|
||
|
Part IV:
|
||
|
Item 15.
|
||
1
|
Item 1.
|
Business.
|
OVERVIEW
AngioDynamics, Inc. (together with its subsidiaries, "AngioDynamics," the "Company," "we," "our" or "us") designs, manufactures and sells a wide range of medical, surgical and diagnostic devices used by professional healthcare providers for the treatment of peripheral vascular disease, vascular access and for use in oncology and surgical settings. Our devices are generally used in minimally invasive, image-guided procedures.
HISTORY
AngioDynamics was founded in Queensbury, N.Y., U.S., in 1988. Queensbury was chosen due to its location in the heart of "Catheter Valley," an area in New York's Adirondack Region named for its long history of catheter and other medical device manufacturing. Initially dedicated to the research and development of products used in interventional radiology, AngioDynamics began manufacturing and shipping product in the early 1990s. The Company soon became well established as a producer of diagnostic catheters for non-coronary angiography and thrombolytic delivery systems.
The company grew over the following years as a result of acquisitions of companies including RITA Medical Systems in January 2007, Oncobionic in May 2008, the assets of Diomed in June 2008 and FlowMedica in January 2009. These acquisitions added product lines including market-leading ablation and NanoKnife systems, vascular access products, angiographic products and accessories, dialysis products, drainage products, thrombolytic products, embolization products, venous products and targeted renal therapy products. More recently in May 2012, AngioDynamics acquired Navilyst Medical, bringing market-leading fluid management systems into our portfolio. The acquisition significantly expanded the Company's scale, doubling its share of the vascular access market while building critical mass in the peripheral vascular market.
Headquartered in Latham, N.Y., AngioDynamics is publicly traded on the NASDAQ stock exchange under the symbol ANGO.
PRODUCTS
Our product offerings fall within three Global Business Units (GBUs): Peripheral Vascular, Vascular Access and Oncology/Surgery. All products discussed below have been cleared for sale in the United States by the Food and Drug Administration (FDA). International regulatory clearances vary by product and jurisdiction.
Peripheral Vascular Products
AngioDynamics’ Peripheral Vascular product offerings support the medical areas of Venous Insufficiency, Thrombus Management, Fluid Management and Peripheral Products (Core).
Venous Insufficiency
VenaCure EVLT laser system
Our VenaCure EVLT (endovenous laser treatment) system products are used in endovascular laser procedures to treat superficial venous disease (varicose veins). Superficial venous disease is a malfunction of one or more valves in the leg veins whereby blood refluxes or does not return to the heart, thereby pooling in the legs and leading to symptoms such as pain, swelling and skin changes. VenaCure EVLT uses laser energy to stop the reflux by ablating (collapsing and destroying) the affected vein. Blood is then re-routed to other healthy veins.
2
The procedure is minimally invasive and generally takes less than an hour, allowing the patient to quickly return to normal activities with minimal post-operative pain. More than one million VenaCure EVLT procedures have been performed.
VenaCure EVLT is sold as a system that includes diode laser hardware and procedure kits which include disposable laser fiber components, an access sheath, access wires and needles. Our VenaCure EVLT 1470 nanometer wavelength laser allows physicians to more efficiently heat the vein wall using lower power settings thereby reducing the risk of collateral damage. The NeverTouch tip fiber eliminates laser tip contact with the vein wall, which in turn minimizes perforations of the vein wall that typically result in less pain and bruising as compared to traditional bare-tip fibers. The NeverTouch tip also maximizes ultrasonic visibility, making it easier for physicians to use. Procedure kits are available in a variety of lengths and configurations to accommodate varied patient anatomies.
The VenaCure EVLT system comes with a comprehensive physician training program and extensive marketing support.
Asclera (polidocanol) Injection
Asclera (polidocanol) injection is the only FDA-approved sclerosant with an indication to treat uncomplicated spider veins and uncomplicated reticular veins in the lower extremity. AngioDynamics distributes Asclera through a global agreement with the manufacturer and their distributor. In a multicenter, randomized, double-blind, placebo and comparator-controlled trial in patients with spider or reticular varicose veins, 95% of patients treated with Asclera showed good improvement or complete treatment success as rated by physicians and 87% of patients were satisfied or very satisfied with their Asclera treatment. ¹
Polidocanol can be produced through compounding, but only in certain situations and for specific medical needs. In July 2016, the FDA drafted guidance clarifying the parameters for compounding essentially copies of approved and/or commercially available drug products due to the higher risk for patients versus those that have been FDA approved.
Thrombus Management
Our Thrombus Management portfolio includes the proprietary AngioVac venous drainage cannula and circuit, as well as catheter directed thrombolytic devices and Uni-Fuse infusion catheters. AngioDynamics offers a range of options when treating thrombus and removing fresh, soft thromboli or emboli.
AngioVac
Our AngioVac venous drainage system includes a Venous Drainage Cannula and Extracorporeal Circuit. The cannula is indicated for use as a venous drainage cannula and for removal of fresh, soft thrombi or emboli during extracorporeal bypass. The cardiopulmonary bypass circuit is indicated for use in procedures requiring extracorporeal circulatory support for periods of up to six hours. AngioVac devices are for use with other manufacturers’ off-the-shelf pump, filter and reinfusion cannula, to facilitate venous drainage as part of an extracorporeal bypass procedure.
The AngioVac venous drainage cannula is a 22 French coil-reinforced cannula designed with a balloon actuated, expandable funnel shaped distal tip. The proprietary funnel shaped tip enhances venous drainage flow when the balloon is inflated, prevents clogging of the cannula with commonly encountered undesirable intravascular material, and facilitates en bloc removal of such extraneous material.
¹
Weiss, Voigts, Howell (2011) Absence of Concentration Congruity in Six Compounded Polidocanol Samples Obtained for Leg Sclerotherapy. American Society for Dermatologic Surgery, Inc., Volume 37: 1-4
3
Thrombolytic Catheters
Thrombolytic catheters are used to deliver thrombolytic agents, which are drugs that dissolve blood clots in hemodialysis access grafts, arteries, veins and surgical bypass grafts. AngioDynamics’ Uni-Fuse infusion catheter features pressure response outlets, a patented, time-tested slit technology that provides a consistent, even distribution of fluid volume along the entire length of the infusion pattern, resulting in a 12-fold advantage over standard side-hole catheters.²
We also offer the Pulse-Spray infusion system for high pressure, pulsed delivery of lytic agent to shorten treatment time, and the Speed Lyser infusion system built for dialysis grafts and fistulas.
Fluid Management
Our Fluid Management product offerings include the NAMIC
®
Fluid Management portfolio. Since 1969, the NAMIC product line has been a leader in providing clinicians high quality, dependable devices that help in the diagnosis and treatment of cardiovascular and peripheral vascular disease. The NAMIC product line includes an extensive offering of manifolds, contrast management systems, closed fluid systems, guidewires, disposable transducers and interventional accessories. These devices are utilized together and allow clinicians to aspirate or inject contrast, saline, remove waste and monitor invasive blood pressures throughout the procedure.
Peripheral Products (Core)
We offer a comprehensive portfolio for minimally invasive peripheral products. Product categories include an extensive line of angiographic catheters and diagnostic and interventional guidewires, percutaneous drainage catheters and coaxial micro-introducer kits.
Angiographic Products and Accessories
Angiographic products and accessories are used during peripheral diagnostic and interventional procedures. These products permit physicians to reach targeted locations to deliver contrast media for visualization purposes and therapeutic agents and devices, such as percutaneous transluminal angioplasty (PTA) balloons. Angiographic products consist of angiographic catheters and guidewires.
Our angiographic catheter line includes the following brands, all with radiopaque tips to assure excellent visibility under fluoroscopy:
|
•
|
Soft-Vu flush catheters are available in flush and selective varieties. Flush Catheters are used in procedures where a high flow of contrast is required for “big picture” diagnostics. Anomalies discovered through a flush angiogram may require further investigation into a vessel of interest. Soft-Vu selective catheters are used to gain access to smaller or more distal vessels and advance the catheter or wire into the diseased section.
|
|
•
|
Accu-Vu sizing catheters feature radiopaque marker bands at the distal (farthest away) portion of the catheter to provide a highly accurate measurement of the patient’s anatomy. This enables precise measurement for interventional devices (stents, filters, etc.)
|
|
•
|
AngiOptic catheters have total catheter radiopacity, ensuring tip-to-hub visibility. This catheter is also constructed with a firm tip material that enhances stability during high-flow injections, providing excellent pushability.
|
|
•
|
Mariner catheters have a hydrophilic coating that, when combined with water, reduces friction. This makes insertion potentially easier and more comfortable for the patient, and can also be used for advancing through tortuous anatomy.
|
AngioDynamics guidewires include Nit-Vu (featuring a kink-resistant NiTi alloy core facilitating smooth navigation through tortuous vasculature and accurate wire control) and PTFE Coated (fixed core and movable core) diagnostic guidewires.
AngioDynamics catheters and guidewires are available in more than 500 tip configurations and lengths.
² Yusuf SW, et al. Immediate and Early Follow-up Results of Pulse Spray Thrombolysis in Patients with Peripheral Ischaemia. British Journal of Surgery 1995; 82:338-340.
4
Drainage Products
Drainage products percutaneously drain abscesses and other fluid pockets. An abscess is a tender inflamed mass that typically must be drained by a physician. AngioDynamics offers two brands of drainage catheters for multi-purpose/general, nephrostomy and biliary drainage: Total Abscession and Exodus. Each offer features and benefits depending on case presentation and physician preferences.
Micro Access Kits
Our Micro Access sets provide interventional physicians a smaller introducer system for minimally-invasive procedures. Our Micro Access product line provides physicians with the means to choose from the wide selection of configurations, including guidewire, needle and introducer options. Two lines are available in stiff/standard, 10cm or 15cm and echogenic for visibility under ultrasound guidance: Micro Introducer Kit and Ministick Max.
Vascular Access Products
Our portfolio of Vascular Access products includes a broad offering of peripherally inserted central catheters (PICCs), midline catheters, implantable ports, dialysis catheters and related accessories and supplies. These products are used to deliver, primarily, short-term drug therapies, such as chemotherapeutic agents and antibiotics, into the central venous system. Delivery to the circulatory system allows drugs to mix with a large volume of blood as compared to intravenous drug delivery into a superficial vessel. Our Vascular Access product family also includes the proprietary BioFlo catheter.
BioFlo
®
AngioDynamics offers BioFlo, the only catheter on the market with Endexo Technology, a material more resistant to thrombus accumulation, in vitro (based on platelet count). Endexo Technology is a permanent and non-eluting polymer that is “blended” into the polyurethane from which the catheter is made. It is present throughout the catheter, including the extraluminal, intraluminal and cut catheter surface of the tip. Endexo Technology remains present for the life of the catheter. BioFlo’s long-term durability and efficacy is intended to provide clinicians a high degree of safety and confidence in providing better patient care and improved patient outcomes. BioFlo catheters are available across the Vascular Access family of products, including PICCs, midlines, ports and dialysis catheters.
PICCs
A peripherally inserted central catheter, or PICC, is a long thin catheter that is inserted into a peripheral vein, typically in the upper arm, and advanced until the catheter tip terminates in a large vein in the chest near the heart to obtain intravenous access. PICCs can typically be used for prolonged periods of time and provide an alternative to central venous catheters. Our PICC product offerings include:
|
•
|
BioFlo
®
PICC
: Our BioFlo line is the only power injectable PICC available that incorporates Endexo Technology into the manufacturing and design of the catheter. Advanced features such as large lumen diameters allow the BioFlo
®
PICC to deliver the power injection flow rates required for contrast-enhanced Computed Tomography (CT) scans compatible with up to 325 psi CT injections.
|
|
•
|
BioFlo
®
Midline:
The BioFlo Midline Catheter is an effective solution to preserving a patient’s peripheral access. It provides a cost-effective alternative to multiple IV site rotations for patients who need short-term venous access.
|
|
•
|
Xcela PICC
: The Xcela
®
PICC line is designed to provide a high degree of safety, ease and confidence in patient care. Advanced features such as large lumen diameters allow the Xcela
®
PICC to deliver the power injection flow rates required for contrast-enhanced CTs compatible with up to 325 psi CT injections.
|
|
•
|
PASV
®
Valve Technology:
The PASV
®
Valve Technology is available in both BioFlo and Xcela lines and is designed to automatically resist backflow and reduce blood reflux that could lead to catheter-related complications.
|
5
Ports
Ports are implantable devices utilized for the central venous administration of a variety of medical therapies and for blood sampling and diagnostic purposes. Central venous access facilitates a more systemic delivery of treatment agents, while mitigating certain harsh side effects of certain treatment protocols and eliminating the need for repeated access to peripheral veins. Depending upon needle gauge size and the port size, a port can be utilized for up to approximately 2,000 accesses once implanted in the body. Our ports are used primarily in systemic or regional short- and long-term cancer treatment protocols that require frequent infusions of highly concentrated or toxic medications (such as chemotherapy agents, antibiotics or analgesics) and frequent blood samplings. Our port products and accessories include:
|
•
|
BioFlo
®
Port
: Our BioFlo Port is the only port available that features a catheter with Endexo Technology. Advanced features of the BioFlo Port include multiple profile and catheter options, a large septum area for ease of access and the ability to administer contrast through a CT injection for purposes of imaging.
|
|
•
|
SmartPort
®
: The Smart Port power-injectable port with Vortex technology offers the ability for a clinician to access a vein for both the delivery of medications or fluids and for administering power-injected contrast to perform a (CT) scan. The ability to access a port for power-injected contrast studies eliminates the need for additional needle sticks in the patient’s arm and wrist veins. Once implanted, repeated access to the bloodstream can be accomplished with greater ease and less discomfort. Our Smart Port is available in mini and low-profiles to accommodate more patient anatomies.
|
|
•
|
Vortex
®
:
Our Vortex port technology line of ports is a clear-flow port technology that, we believe, revolutionized port design. With its rounded chamber, the Vortex port is designed to have no sludge-harboring corners or dead spaces. This product line consists of titanium, plastic and dual-lumen offerings.
|
|
•
|
PASV
®
Valve Technology:
The PASV
®
Valve Technology is designed to automatically resist backflow and reduce blood reflux that could lead to catheter-related complications.
|
|
•
|
LifeGuard
®
:
The LifeGuard Safety Infusion Set and The LifeGuard Vision are used to infuse our ports and complement our port and vascular access catheters. The needles’ low profile design is intended to allow clinicians to easily dress the site.
|
Dialysis Products
We market a complete line of dialysis products that provide short and long-term vascular access for dialysis patients. Dialysis, or cleaning of the blood, is necessary in conditions such as acute renal failure, chronic renal failure and end-stage renal disease (ESRD). We currently offer a variety of dialysis catheters, including:
|
•
|
BioFlo
®
DuraMax
: Our BioFlo DuraMax is the only dialysis catheter with Endexo Technology. Advanced features of the BioFlo DuraMax dialysis catheter include large inner diameter lumens designed for long term patency, a proprietary guidewire lumen to facilitate catheter exchanges and Curved Tip Technology that allows the catheter to self-center in the Superior Vena Cava (SVC).
|
|
•
|
DuraMax
®
:
The DuraMax catheter is a stepped-tip catheter designed to improve ease of use, dialysis efficiency and overall patient outcomes.
|
In addition, AngioDynamics also offers other renal therapies, including
DuraFlow™ Chronic Hemodialysis Catheter,
Schon Chronic Hemodialysis Catheter, EVENMORE Chronic Hemodialysis Catheter, EMBOSAFE™ Valved, Splitable Sheath Dilator and Perchik™ Button Suture Retention Device.
Oncology/Surgery Products
AngioDynamics offers a range of comprehensive ablation technologies, including thermal tissue ablation systems (microwave energy and radiofrequency energy), surgical resection and the NanoKnife System, an innovative alternative to thermal ablation.
6
NanoKnife
®
System
The NanoKnife
®
System is an alternative to traditional thermal ablation that has received 510(k) clearance from the Food and Drug Administration for the surgical ablation of soft tissue. The NanoKnife Ablation System utilizes low energy direct current electrical pulses to permanently open pores in target cell membranes. These permanent pores or nano-scale defects in the cell membranes result in cell death. The treated tissue is then removed by the body’s natural processes in a matter of weeks, mimicking natural cell death. Unlike other ablation technologies, NanoKnife Ablation System does not achieve tissue ablation using thermal energy.
The NanoKnife Ablation System consists of two major components: a Low Energy Direct Current, or LEDC Generator and needle-like electrode probes. Up to six (6) electrode probes can be placed into or around the targeted soft tissue. Once the probes are in place, the user enters the appropriate parameters for voltage, number of pulses, interval between pulses, and the pulse length into the generator user interface. The generator then delivers a series of short electric pulses between each electrode probe. The energy delivery is hyperechoic and can be monitored under real-time ultrasound.
Microwave Ablation
Solero Microwave Tissue Ablation (MTA) System
The Solero MTA System features the Solero Microwave (MW) Generator and the specially designed Solero MW Applicators. The solid state Solero MW Generator with a 2.45 GHz operating frequency can power up to 140 W for optimized power delivery and fast ablations. The Solero MW Applicator’s optimized ceramic tip diffuses MW energy nearly spherically, and its patented cooling channel with thermocouple provides real-time monitoring to help protect non-targeted tissue ablation. In addition, the Solero MTA System offers physicians scalability with a single applicator designed for multiple, predictable ablation volumes by varying time and wattage. Solero is a single applicator system able to complete up to a 5 cm ablation in six (6) minutes at maximum power.

The Solero MTA System and Accessories are indicated in the U.S. for the ablation of soft tissue during open procedures. The Solero MTA System is not intended for cardiac use.
Acculis Microwave Tissue Ablation (MTA) System
When configured for use with the Accu2i pMTA Applicators, the Acculis MTA System includes the Sulis VpMTA Generator, optional MTA Temperature Probes, Acculis Local Control Station (LCS) and Accu2i pMTA Applicators. Designed for physicians trained in image-guided ablation procedures, intraoperative ultrasound and/or CT guided needle placement, the system is used for thermal coagulation of soft tissue. By utilizing 2.45 GHz of microwave energy, the Acculis MTA System can complete ablations up to 5 cm in six minutes with a single applicator. Applicators are available in 14 cm, 19 cm and 29 cm lengths, offering flexibility in selecting the appropriate length for the procedure.
Radiofrequency Ablation
StarBurst Radiofrequency Ablation Devices
Radiofrequency Ablation (RFA) products use radiofrequency energy to provide a minimally invasive approach to ablating solid cancerous or benign tumors. Our StarBurst Radiofrequency Ablation Devices deliver radiofrequency energy to raise the
7
temperature of cells above 45-50°C, causing cellular death. The physician inserts the disposable needle electrode device into the targeted body tissue, typically under ultrasound, CT or Magnetic Resonance Imaging (MRI) guidance.
During the procedure, our system automatically adjusts the amount of energy delivered in order to maintain the temperature necessary to ablate the targeted tissue. For a typical 5 cm ablation using our StarBurst
®
Xli-enhanced disposable device, the ablation process takes approximately ten minutes. The RFA system consists of a radiofrequency generator and a family of disposable devices.
In addition to thermal ablation systems and NanoKnife, AngioDynamics also offers Habib 4X Surgical Resection Devices that are used in minimally invasive laparoscopic surgery (MILS) procedures in surgical specialties such as Hepato-Biliary, GI, Surgical Oncology, Transplant Surgery and Urology (Partial Nephrectomy Resections). It is clinically indicated to assist in coagulation of tissue during intraoperative and laparoscopic procedures.
RESEARCH & DEVELOPMENT
Our growth depends in large part on the continuous introduction of new and innovative products, together with ongoing enhancements to our existing products. This happens through internal product development, technology licensing and strategic alliances. We recognize the importance of, and intend to continue to make investments in, research and development (R&D).
Our R&D teams work closely with our marketing teams, sales force and regulatory and compliance teams to incorporate customer feedback into our development and design process. We believe that we have a reputation among interventional physicians as a strong partner for developing high quality products because of our tradition of close physician collaboration, dedicated market focus, responsiveness and execution capabilities for product development and commercialization.
COMPETITION
We encounter significant competition across our product lines and in each market in which our products are sold. These markets are characterized by rapid change resulting from technological advances, scientific discoveries and changing customer needs and expectations. We face competitors ranging from large manufacturers with multiple business lines to small manufacturers that offer a limited selection of products.
Our primary device competitors include: Boston Scientific Corporation; Cook Medical; C.R. Bard; Medical Components, Inc. (Medcomp); TeleFlex Medical; Smiths Medical, a subsidiary of Smiths Group plc; Medtronic; Merit Medical; Terumo Medical Corporation; Johnson and Johnson and Total Vein Systems.
We believe our products compete primarily based on their quality, clinical outcomes, ease of use, reliability, physician familiarity and cost-effectiveness. In the current environment of managed care, which is characterized by economically motivated buyers, consolidation among health care providers, increased competition and declining reimbursement rates, we have been increasingly required to compete on the basis of price. We believe that our continued competitive success will depend upon our ability to develop or acquire scientifically advanced technology, apply our technology cost-effectively across product lines and markets, attract and retain skilled personnel, obtain patent or other protection for our products, obtain required regulatory and reimbursement approvals, manufacture and successfully market our products either directly or through outside parties, and maintain sufficient inventory to meet customer demand.
SALES AND MARKETING
We sell our broad line of quality devices in the United States primarily through a direct sales force and internationally through a combination of direct sales and distributor relationships. We support our customers and sales organization with a marketing staff that includes product managers, customer service representatives and other marketing specialists.
We focus our sales and marketing efforts on interventional radiologists, interventional cardiologists, vascular surgeons, urologists and interventional and surgical oncologists.
MANUFACTURING
We manufacture certain proprietary components and products and assemble, inspect, test and package our finished products. By designing and manufacturing many of our products from raw materials, and assembling and testing our subassemblies and products, we believe that we are able to maintain better quality control, ensure compliance with applicable regulatory standards and our internal specifications, and limit outside access to our proprietary technology. We have custom-
8
designed proprietary manufacturing and processing equipment and have developed proprietary enhancements for existing production machinery.
We own or lease four primary manufacturing properties providing capabilities which include manufacturing, service, engineering and research, distribution warehouses and offices. These facilities are registered with the FDA and have been certified to ISO 13485 standards, as well as the CMD/CAS Canadian Medical Device Regulations. ISO 13485 is a quality system standard that satisfies European Union regulatory requirements, thus allowing us to market and sell our products in European Union countries. Our manufacturing facilities are subject to periodic inspections by regulatory authorities to ensure compliance with domestic and non-U.S. regulatory requirements. See “Government Regulation” section of this report for additional information. See Item 2 "Properties" for details on each manufacturing location.
In February 2017, we announced the consolidation of our global operations into two facilities located in New York State. Operations being done in the Denmead, U.K. and Manchester, Ga. manufacturing facilities will be consolidated into the Glens Falls and Queensbury, N.Y. facilities.
BACKLOG
Historically, we ship the majority of products within 24-48 hours of receiving an order, and accordingly our backlog is not significant.
INTELLECTUAL PROPERTY
Patents, trademarks and other proprietary rights are very important to our business. We also rely upon trade secrets, manufacturing know-how, technological innovations and licensing opportunities to maintain and improve our competitive position. We regularly monitor and review third-party proprietary rights, including patents and patent applications, as available, to aid in the development of our intellectual property strategy, avoid infringement of third-party proprietary rights, and identify licensing opportunities.
The company owns an extensive portfolio of patents and patent applications in the United States and in certain foreign countries. The portfolio also includes exclusive licenses to third party patents and applications.
Most of our products are sold under the AngioDynamics trade name or trademark. Additionally, products are also sold under product trademarks and/or registered product trademarks owned by AngioDynamics, Inc., or an affiliate or subsidiary. Some products contain trademarks of companies other than AngioDynamics.
See Part I. Item 3 of this report for additional details on litigation regarding proprietary technology.
LITIGATION
We operate in an industry characterized by extensive patent litigation. Patent litigation can result in significant damage awards and injunctions that could prevent the manufacture and sale of affected products or result in significant royalty payments in order to continue selling the products. While it is not possible to predict the outcome of patent litigation incidents to our business, we believe the costs associated with this type of litigation could have a material adverse impact on our consolidated results of operations, financial position, or cash flows. The medical device industry is also susceptible to significant product liability claims. These claims may be brought by individuals seeking relief on their own behalf or purporting to represent a class. In addition, product liability claims may be asserted against us in the future based on events we are not aware of at the present time. At any given time, we are involved in a number of product liability actions. For additional information, see both Part I. Item 3 of this report and Note 15 to the consolidated financial statements in this Annual Report on Form 10-K.
GOVERNMENT REGULATION
The products we manufacture and market are subject to regulation by the Food and Drug Administration (FDA) under the Federal Food, Drug, and Cosmetic Act, or FDCA, and international regulations to our specific target markets.
9
United States FDA Regulation
Before a new medical device can be introduced into the market, a manufacturer generally must obtain marketing clearance or approval from the FDA through either a 510(k) submission (a premarket notification) or a premarket approval application (PMA).
The 510(k) procedure is available only in particular circumstances. The 510(k) clearance procedure is available only if a manufacturer can establish that its device is “substantially equivalent” in intended use and in safety and effectiveness to a “predicate device,” which is a legally marketed device with 510(k) clearance in class I or II or preamendment status based upon products commercially distributed on or before May 28, 1976. After a device receives 510(k) clearance, any modification that could significantly affect its safety or effectiveness, or that would constitute a major change in its intended use, requires a new 510(k) clearance. The 510(k) clearance procedure including questions and responses may take up to 12 months. In some cases, supporting clinical data may be required. The FDA may determine that a new or modified device is not substantially equivalent to a predicate device or may require that additional information, including clinical data, be submitted before a determination is made, either of which could significantly delay the introduction of new or modified device products. If a device cannot demonstrate substantial equivalence, it may be subject to either a de novo submission or a PMA.
The PMA application procedure is more comprehensive than the 510(k) procedure and typically takes several years to complete. The PMA application must be supported by scientific evidence providing pre-clinical and clinical data relating to the safety and efficacy of the device and must include other information about the device and its components, design, manufacturing and labeling. The FDA will approve a PMA application only if a reasonable assurance that the device is safe and effective for its intended use can be provided. As part of the PMA application review, the FDA will inspect the manufacturer’s facilities for compliance with its Quality System Regulation, or QSR. As part of the PMA approval the FDA may place restrictions on the device, such as requiring additional patient follow-up for an indefinite period of time. If the FDA’s evaluation of the PMA application or the manufacturing facility is not favorable, the FDA may deny approval of the PMA application or issue a “not approvable” letter. The FDA may also require additional clinical trials, which can delay the PMA approval process by several years. After the PMA is approved, if significant changes are made to a device, its manufacturing or labeling, a PMA supplement containing additional information must be filed for prior FDA approval.
Historically, our products have been introduced into the market using the 510(k) procedure and we have never had to use the PMA procedure.
The process of FDA submissions requires extensive and expensive validations and testing. The financial outlay for this is large and requires a significant amount of time. Recent changes in both regulations and FDA perspectives have increased both time and testing requirements, which have caused significant delays and increased costs for approvals. The parameters for increased testing have and will continue to cause severe delays. The increased focus by the FDA on such issues as chemical identification of all colorants, non-acceptance of certain colorants (certain forms of carbon black) and other concerns, continue to cause problems and delays. In addition, changes to existing products call into question previously approved devices and result in additional costs for testing and material analysis.
After a product is placed on the market, the product and its manufacturer are subject to pervasive and continuing regulation by the FDA. The FDA enforces these requirements by inspection and market surveillance. Our suppliers also may be subject to FDA inspection; this has resulted in several suppliers altering price structures for medical device companies. The additional costs due to testing and potential for lawsuits due to material contamination or unforeseen chemical/allergenic reactions has led to some manufacturers actively refusing to supply to medical device companies. The financial expenditure needed to maintain compliance to the requirements of the FDA are extensive and ever increasing. Specific systems are needed to maintain compliance to baseline requirements. In addition, complex systems are needed to ensure that specific violations such as ‘off label promotion’ are avoided. The FDA has specific requirements for labeling and marketing materials. These need extensive policing and evaluation. Penalties for breach of off label promotion can result in significant fines to the company.
The devices manufactured by us also are subject to the QSR, which imposes elaborate testing, control, documentation and other quality assurance procedures. Every phase of production, including raw materials, components and subassembly, manufacturing, testing, quality control, labeling, tracing of consignees after distribution and follow-up and reporting of complaint information is governed by the FDA’s QSR. Device manufacturers are required to register their facilities and list their products with the FDA and certain state agencies. The FDA periodically inspects manufacturing facilities and, if there are alleged violations, the operator of a facility must correct them or satisfactorily demonstrate the absence of the violations or face regulatory action. Penalties for failure to maintain compliance to the QSR include warning letters and potentially consent decrees. Failure to maintain the QSR appropriately could result in the development of further warning letters. In addition, non-compliance with applicable FDA requirements can result in, among other things, fines, injunctions, civil penalties, recall or
10
seizure of products, total or partial suspension of production, failure of the FDA to grant marketing approvals, withdrawal of marketing approvals, a recommendation by the FDA to disallow us to enter into government contracts, and criminal prosecutions. The FDA also has the authority to request repair, replacement or refund of the cost of any device manufactured or distributed by us.
Other U.S. Regulatory Bodies
We and our products are also subject to a variety of state and local laws in those jurisdictions where our products are, or will be, marketed, and federal, state and local laws relating to matters such as safe working conditions, manufacturing practices, environmental protection, fire hazard control and disposal of hazardous or potentially hazardous substances. In addition, we are subject to various federal and state laws governing our relationships with the physicians and others who purchase or make referrals for our products. For instance, federal law prohibits payments of any form that are intended to induce a referral for any item payable under Medicare, Medicaid or any other federal healthcare program. Many states have similar laws. There can be no assurance that we will not be required to incur significant costs to comply with such laws and regulations now or in the future, or that such laws or regulations will not have a material adverse effect upon our ability to do business.
International Regulation
Internationally, all of our current products are considered medical devices under applicable regulatory regimes, and we anticipate that this will be true for all of our future products. Sales of medical devices are subject to regulatory requirements in many countries. The regulatory review process may vary greatly from country to country. For example, the European Union has a dedicated set of regulations regarding medical devices, specifically regulating their design, manufacturing, clinical trials, labeling and adverse event reporting. Devices that comply with those requirements are entitled to bear a Conformité Européenne, or CE Mark, indicating that the device conforms to the essential requirements of the applicable directives and can be commercially distributed in countries that are members of the European Union. Similar regulations are in place for Canada, Japan, China and most other countries.
In some cases, we rely on our international distributors to obtain regulatory approvals, complete product registrations, comply with clinical trial requirements and complete those steps that are customarily taken in the applicable jurisdictions.
International sales of medical devices manufactured in the United States that are not approved or cleared by the FDA for use in the United States, or are banned or deviate from lawful performance standards, are subject to FDA export requirements. Before exporting such products to a foreign country, we must first comply with the FDA’s regulatory procedures for exporting unapproved devices.
The process of obtaining approval to distribute medical products is costly and time-consuming in virtually all the major markets where we sell medical devices. We cannot assure that any new medical devices we develop will be approved in a timely or cost-effective manner or approved at all. There can be no assurance that new laws or regulations regarding the release or sale of medical devices will not delay or prevent sale of our current or future products.
THIRD-PARTY REIMBURSEMENT AND ANTI-FRAUD AND CORRUPT PRACTICES REGULATION
United States
The delivery of our devices is subject to regulation by the Department of Health and Human Services (HHS) and comparable state and non-U.S. agencies responsible for reimbursement and regulation of health care items and services. U.S. laws and regulations are imposed primarily in connection with the Medicare and Medicaid programs, as well as the government’s interest in regulating the quality and cost of health care. Foreign governments also impose regulations in connection with their health care reimbursement programs and the delivery of health care items and services.
U.S. federal health care laws apply when we or customers submit claims for items or services that are reimbursed under Medicare, Medicaid, or other federally-funded health care programs. The principal U.S. federal laws include: (1) the Anti-kickback Statute which prohibits offers to pay or receive remuneration of any kind for the purpose of including or rewarding referrals of items or services reimbursable by a federal health care program; (2) the False Claims Act which prohibits the submission of false or otherwise improper claims for payment to a federally-funded health care program, including claims resulting from a violation of the Anti-kickback Statute; (3) the Stark law which prohibits physicians from referring Medicare or Medicaid patients to a provider that bills these programs for the provision of certain designated health services if the physician (or a member of the physician’s immediate family) has a financial relationship with that provider; and (4) health care fraud statutes that prohibit false statements and improper claims to any third-party payer. There are often similar state false claims,
11
anti-kickback, and anti-self-referral and insurance laws that apply to state-funded Medicaid and other health care programs and private third-party payers. In addition, the U.S. Foreign Corrupt Practices Act (FCPA) can be used to prosecute companies in the U.S. for arrangements with physicians or other parties outside the U.S. if the physician or party is a government official of another country and the arrangement violates the law of that country.
International
Our success in international markets will depend largely upon the availability of reimbursement from the third-party payors through which healthcare providers are paid in those markets. Reimbursement and healthcare payment systems vary significantly by country. The main types of healthcare payment systems are government sponsored healthcare and private insurance. Reimbursement approval must be obtained individually in each country in which our products are marketed. Outside the U.S., we generally rely on our distributors to obtain reimbursement approval in the countries in which they will sell our products. There can be no assurance that reimbursement approvals will be received.
INSURANCE
Our product liability insurance coverage is limited to a maximum of $10 million per product liability claim and an annual aggregate policy limit of $10 million, subject to a self-insured retention of $500,000 per occurrence and $2 million in the aggregate. The policy covers, subject to policy conditions and exclusions, claims of bodily injury and property damage from any product sold or manufactured by us.
There is no assurance that this level of coverage is adequate. We may not be able to sustain or maintain this level of coverage and cannot assure you that adequate insurance coverage will continue to be available on commercially reasonable terms, or at all. A successful product liability claim or other claim with respect to uninsured or underinsured liabilities could have a material adverse effect on our business.
ENVIRONMENTAL, HEALTH AND SAFETY
We are subject to federal, state and local laws, rules, regulations and policies governing the use, generation, manufacture, storage, air emission, effluent discharge, handling and disposal of certain hazardous and potentially hazardous substances used in connection with our operations. Our operations are also subject to laws and regulations related to occupational health and safety. We maintain safety, training and maintenance programs as part of our ongoing efforts to ensure compliance with applicable laws and regulations.
Although we believe that we have complied with environmental, health and safety laws and regulations in all material respects and, to date, have not been required to take any action to correct any noncompliance, there can be no assurance that we will not be required to incur significant costs to comply with environmental regulations in the future.
EMPLOYEES
As of
May 31, 2017
, we had approximately 1,250 full time employees. None of our employees are represented by a labor union and we have never experienced a work stoppage.
12
Executive Officers of the Company
The following table sets forth certain information with respect to our executive officers.
|
Name
|
Age
|
Position
|
||
|
James C. Clemmer
|
53
|
President and Chief Executive Officer
|
||
|
Michael C. Greiner
|
44
|
Executive Vice President and Chief Financial Officer
|
||
|
Stephen A. Trowbridge
|
43
|
Senior Vice President and General Counsel
|
||
|
Barbara A. Kucharczyk
|
44
|
Senior Vice President Global Operations
|
||
|
Warren G. Nighan
|
48
|
Senior Vice President Quality & Regulatory Affairs
|
||
|
Heather J. Daniels-Cariveau
|
43
|
Senior Vice President Human Resources
|
||
|
Benjamin H. Davis
|
52
|
Senior Vice President Business Development
|
||
|
Chad T. Campbell
|
46
|
Senior Vice President and General Manager, Vascular Access
|
||
|
Richard A. Stark
|
52
|
Senior Vice President and General Manager, Oncology/Surgery
|
||
|
Robert A. Simpson
|
45
|
Senior Vice President and General Manager, Peripheral Vascular
|
||
James C. Clemmer
became our President and Chief Executive Officer in April 2016. Prior to joining AngioDynamics, Mr. Clemmer served as President of the $1.8 billion medical supplies segment at Covidien plc. where he directed the strategic and day-to-day operations for global business divisions that collectively manufactured 23 different product categories. In addition, he managed global manufacturing, research and development, operational excellence, business development and all other functions associated with the medical supplies business. Prior to his role at Covidien, Mr. Clemmer served as Group President at Kendall Healthcare, where he managed the US business across five divisions and built the strategic plan for the medical supplies segment before it was spun off from Tyco. Mr. Clemmer began his career at Sage Products, Inc. Mr. Clemmer currently serves on the Board of Directors for AngioDynamics and Lantheus Medical Imaging. Mr. Clemmer is a graduate of the Massachusetts College of Liberal Arts, where he served as interim president from August 2015 until March 1, 2016.
Michael C. Greiner
joined AngioDynamics as the Executive Vice President and Chief Financial Officer in August 2016. Mr. Greiner most recently served as the Chief Financial Officer at Extreme Reach. Prior to Extreme Reach, Mr. Greiner served as Senior Vice President Corporate Finance and Chief Accounting Officer at Cimpress N.V. (Vistaprint N.V.), Global Controller for GE’s Water and Processing Technologies division and in leadership roles at Bausch & Lomb and Wyeth. Mr. Greiner is also an advisor for Mirah, Inc., a measurement-based behavioral health company, and serves as the President of the Foundation for Faces of Children. Mr. Greiner received a Bachelor and Master of Science in Accounting from Fairleigh Dickinson University and Master of Business Administration from the Columbia Business School. Mr. Greiner is also a Certified Public Accountant.
Stephen A. Trowbridge
joined AngioDynamics as corporate counsel in June 2008, becoming our Vice President and General Counsel in June 2010 and Senior Vice President and General Counsel in August 2013. Mr. Trowbridge manages AngioDynamics’ legal matters, including corporate governance, mergers and acquisitions, finance, securities regulation, litigation, regulatory matters, intellectual property and compliance. Mr. Trowbridge also oversees the Company’s clinical affairs, medical affairs and healthcare economics departments. Prior to AngioDynamics, Mr. Trowbridge served as a Corporate Counsel at Philips Healthcare and Intermagnetics General Corporation. Mr. Trowbridge began his career with Cadwalader, Wickersham & Taft LLP in the firm’s Mergers and Acquisitions and Securities Group. Mr. Trowbridge received a Bachelor of Science in Science and Technology Studies from Rensselaer Polytechnic Institute, a Juris Doctor from the University of Pennsylvania Law School, and a Master of Business Administration from Duke University’s Fuqua School of Business.
Barbara A. Kucharczyk
joined AngioDynamics in June 2012 and was promoted to Senior Vice President Global Operations in June 2015. Prior to AngioDynamics, Ms. Kucharczyk served as the Focus Factory Manager for the Vascular Therapy division at Covidien (Medtronic). Before Covidien, Ms. Kucharczyk was the Plant Manager for the Forest Products Group at Hexion Specialty Chemicals, Inc. Ms. Kucharczyk received a Bachelor of Science in Chemistry from the State University of New York at Fredonia, a Bachelor of Science in Chemical Engineering from the State University of New York Center at Buffalo and a Master of Business Administration from Rensselaer Polytechnic Institute.
Warren G. Nighan
joined AngioDynamics as the Senior Vice President of Quality and Regulatory Affairs in April 2017. Before joining AngioDynamics, Mr. Nighan was as a quality and regulatory consultant to clients in FDA-regulated industries, specializing in execution and management of quality systems implementation and remediation. Previously, Mr. Nighan served as the Executive Vice President of Global Clinical, Quality Affairs and Regulatory Affairs at Haemonetics Corporation, Vice
13
President of Quality/Regulatory/Clinical/Technical Services at St. Jude Medical’s Atrial Fibrillation Division, and Corporate Vice President of Quality/Compliance at Tyco Healthcare/Covidien (Medtronic). Mr. Nighan earned a Bachelor and Master of Science in Nursing from Northeastern University’s Bouvé College of Health Sciences.
Heather J. Daniels Cariveau
joined AngioDynamics in October 2016 as the Senior Vice President of Human Resources. Prior to joining AngioDynamics, Ms. Daniels Cariveau served as a Human Resources Global Vice President at Zimmer Biomet, leading tactical and strategic HR initiatives for the Spine, Dental, Market Access/Healthcare Economics and Craniomaxillofacial/Thoracic businesses. Before Zimmer Biomet, Ms. Daniels Cariveau served in senior HR roles at GE, Datacard, Honeywell International, Inc. and Cigna Corporation. Ms. Daniels Cariveau holds a Bachelor of Arts in Broadcast Journalism and Spanish from the University of St. Thomas in St. Paul, Minn. and a Master of Arts in Human Resources and Industrial Relations from the University of Minnesota Carlson School of Management in Minneapolis, Minn.
Benjamin H. Davis
joined AngioDynamics as Senior Vice President of Business Development in March 2015. Prior to joining AngioDynamics, Mr. Davis most recently was the Vice President Business Integration at C.R. Bard, Inc. where he also served as the Divisional Head of Business Development from 2004 -2013. Before joining C.R. Bard, Inc. Mr. Davis held the position of Chief Financial Officer and Treasurer at Axya Medical Inc. He holds a Bachelor of Science in Business Administration from Bryant College and Master in Business Administration in Finance from Bentley University Graduate School of Business.
Chad T. Campbell
joined AngioDynamics in May 2016 as the Senior Vice President and General Manager for the Vascular Access Global Business Unit. In his role, Mr. Campbell oversees research and development and global commercialization of the Global Business Unit’s portfolio. Mr. Campbell joined AngioDynamics from Medtronic where he served as the Vice President of Marketing for the Patient Care and Safety business after serving as the Vice President of Marketing for the SharpSafety business at Covidien (Medtronic). During his tenure at Covidien, Mr. Campbell also held roles including Director of Marketing, Area Vice President of Sales, Region Manager, Product Manager and Account Manager. Mr. Campbell received a Bachelor of Arts from the University of Kentucky.
Richard A. Stark
joined AngioDynamics in 2007 as the Senior Vice President and General Manager for the Oncology/Surgery Global Business Unit. In his role, Mr. Stark oversees research and development and global commercialization of the Global Business Unit’s portfolio. Prior to AngioDynamics, Mr. Stark served as a district sales manager with RITA Medical, which was later acquired by AngioDynamics. Prior to RITA, Mr. Stark spent several years in field sales with Woodside Biomedical and Arrow International (Teleflex). Stark holds a Bachelor of Arts in Psychology from California State University of Chico in Chico, California.
Robert A. Simpson
joined AngioDynamics in February 2017 as the Senior Vice President and General Manager for the Peripheral Vascular Global Business Unit. In his role, Mr. Simpson oversees research and development and global commercialization of the Global Business Unit’s portfolio. Prior to AngioDynamics, Mr. Simpson served as the Vice President and General Manager of the Patient Care Global Business at Medtronic. He was responsible for leading the business strategy and operations while ensuring global execution. Prior to his role within the Patient Care business, Mr. Simpson led strategy and business development for Medtronic’s Patient Monitoring & Recovery business. Mr. Simpson also held various leadership roles in Sales and Marketing during his time at Covidien (Medtronic) and Alcon (Novartis). Mr. Simpson received a Bachelor of Science in Management Science - Finance from the State University of New York at Geneseo and has completed a comprehensive, executive leadership development program at Babson College.
AVAILABLE INFORMATION
Our corporate headquarters is located at 14 Plaza Drive, Latham, New York 12110. Our phone number is (518) 795-1400. Our website is
www.angiodynamics.com
.
We make available, free-of-charge through our website, our Annual Reports on Form 10-K, quarterly reports on Form 10-Q, current reports on Form 8-K and amendments to those reports filed or furnished pursuant to Section 13(a) of the Securities Exchange Act of 1934, as amended, as soon as reasonably practicable after we electronically file or furnish such materials to the Securities and Exchange Commission, or SEC. In addition, our website includes, among other things, charters of the various committees of our Board of Directors and our code of business conduct and ethics applicable to all employees, officers and directors. Any stockholder also may obtain copies of these documents, free of charge, by sending a request in writing to our investor relations department: AngioDynamics, 14 Plaza Drive, Latham, N.Y. 12210, Attention: Caitlin Stefanik. Information on our website or connected to our website is not incorporated by reference into this Annual Report on Form 10-K.
14
|
Item 1A.
|
Risk Factors.
|
In addition to the other information contained in this Annual Report on Form 10-K, the following risk factors should be considered carefully in evaluating the Company's business. Our financial and operating results are subject to a number of factors, many of which are not within our control. These factors include those set forth below. Our business, financial condition or results of operations could be materially and adversely affected by any of these risks. Additional risks not presently known to us or that we currently deem immaterial may also adversely affect our business, financial condition or results of operations.
RISKS RELATED TO OUR BUSINESS
Consolidation in the healthcare industry could have an adverse effect on our revenues and results of operations.
Many healthcare industry companies, including medical device companies, are consolidating to create new companies with greater market power. As the healthcare industry consolidates, competition to provide goods and services to industry participants will become more intense. These industry participants may try to use their market power to negotiate price concessions or reductions for medical devices that incorporate components produced by us. If we are forced to reduce our prices because of consolidation in the healthcare industry, our revenues would decrease and our consolidated earnings, financial condition, or cash flow would suffer.
We face intense competition in the medical device industry. We may be unable to compete effectively with respect to technological innovation and price which may have an adverse effect on our revenues, financial condition or results of operations.
The markets for our products are highly competitive, and we expect competition to continue to intensify. We may not be able to compete effectively, and we may lose market share to our competitors. Our primary device competitors include: Boston Scientific Corporation; Cook Medical; C.R. Bard; Medical Components, Inc. (Medcomp); TeleFlex Medical; Smiths Medical, a subsidiary of Smiths Group plc; Medtronic; Merit Medical; Terumo Medical Corporation; Johnson and Johnson and Total Vein Systems. Many of our competitors have substantially greater:
|
•
|
financial and other resources to devote to product acquisitions, research and development, marketing and manufacturing;
|
|
•
|
variety of products;
|
|
•
|
technical capabilities;
|
|
•
|
history of developing and introducing new products;
|
|
•
|
patent portfolios that may present an obstacle to our conduct of business;
|
|
•
|
name recognition; and
|
|
•
|
distribution networks and in-house sales forces.
|
Our competitors may succeed in developing technologies and products earlier, in obtaining patent protection or regulatory clearance earlier, or in commercializing new products or technologies more rapidly than us. Our competitors may also develop products and technologies that are superior to those we are developing or that otherwise could render our products obsolete or noncompetitive. In addition, we may face competition from providers of other medical therapies, such as pharmaceutical companies, that may offer non-surgical therapies for conditions that are currently, or in the future, may be treated using our products. Our products are generally sold at higher prices than those of our competitors. However, in the current environment of managed care, which is characterized by economically motivated buyers, consolidation among healthcare providers, increased competition and declining reimbursement rates, we are increasingly being required to compete on the basis of price. If we are not able to compete effectively, our market share and revenues may decline.
We face intense competition from other companies, and our inability to continue to effectively develop, acquire and/or market new products and technologies could have a material adverse effect on our business, results of operations and/or financial condition.
The medical device business is intensely competitive and is characterized by rapid technological change, frequent product introductions and evolving customer requirements. Our customers consider many factors when choosing among products, including features and reliability, quality, technology, clinical or economic outcomes, availability, price and services provided by the manufacturer. We face competition globally from a wide range of companies, some of which may have greater resources than us, which may enable them to adapt faster than us to customer needs or changes in customer requirements. Product introductions, alternative products or enhancements by competitors that provide better features, clinical outcomes or economic
15
value and/or offer lower pricing may make our products or proposed products obsolete or less competitive. In addition, the trend of consolidation in the medical device industry and among our customers could result in greater competition and pricing pressures.
As a result, we engage in product development and improvement programs to maintain and improve our competitive position. These development and improvement programs involve significant investment in research and development, clinical trials and regulatory approvals and may require more time than anticipated to bring such products to market. We may not, however, be successful in enhancing existing products or developing new
products or technologies that will achieve regulatory approval, be developed or manufactured in a cost effective manner, obtain appropriate intellectual property protection or receive market acceptance and we may be unable to recover all or a meaningful part of our investment in such products or technologies. Additionally, there can be no assurance that the size of the markets in which we compete will increase above existing levels or not decline, that we will be able to maintain, gain or regain market share or that we can compete effectively on the basis of price or that the number of procedures in which our products are used will increase above existing levels or not decline.
As part of our business strategy, we also pursue the acquisition of complementary businesses, technologies and products. We may not be able to identify appropriate acquisition candidates, consummate transactions or obtain agreements with favorable terms. Further, once a business is acquired, any inability to successfully integrate the business, decreases in customer loyalty or product orders, failure to retain and develop its workforce, failure to establish and maintain appropriate controls or unknown or contingent liabilities could adversely affect our ability to realize the anticipated benefits of any acquisition. The integration of an acquired business, whether or not successful, requires significant efforts which may result in additional expenses and divert the attention of our management and technical personnel from other projects. These transactions are inherently risky, and there can be no assurance that any past or future transaction will be successful. If we fail to develop and successfully manufacture and launch new products, generate satisfactory clinical results, provide sufficient economic value, enhance existing products, or identify, acquire and integrate complementary businesses, technologies and products or if we experience a decrease in market size or market share or declines in average selling price or procedural volumes, or otherwise fail to compete effectively, our business, results of operations and/or financial condition could be adversely affected.
If we do not maintain our reputation with interventional physicians, our growth will be limited and our business could be harmed.
Physicians typically influence the medical device purchasing decisions of the hospitals and other healthcare institutions in which they practice. Consequently, our reputation with interventional physicians is critical to our continued growth. We believe that we have built a positive reputation based on the quality of our products, our physician-driven product development efforts, our marketing and training efforts and our presence at medical society meetings. Any actual or perceived diminution in the quality of our products, or our failure or inability to maintain these other efforts, could damage our reputation with interventional physicians and cause our growth to be limited and our business to be harmed.
If we fail to develop or market new products and enhance existing products, we could lose market share to our competitors and our results of operations could suffer.
The market for interventional devices is characterized by rapid technological change, new product introductions, technological improvements, changes in physician requirements and evolving industry standards. To be successful, we must continue to develop and commercialize new products and to enhance versions of our existing products. Our products are technologically complex and require significant research, planning, design, development and testing before they may be marketed. This process generally takes at least 12 to 18 months from initial concept and may take up to several years. In addition, product life cycles are relatively short because medical device manufacturers continually develop smaller, more effective and less expensive versions of existing devices in response to physician demand.
Our success in developing and commercializing new and enhanced versions of our products is affected by our ability to:
|
•
|
recruit engineers;
|
|
•
|
timely and accurately identify new market trends;
|
|
•
|
accurately assess customer needs;
|
|
•
|
minimize the time and costs required to obtain regulatory clearance or approval;
|
|
•
|
adopt competitive pricing;
|
|
•
|
timely manufacture and deliver products;
|
|
•
|
accurately predict and control costs associated with the development, manufacturing and support of our products; and
|
16
|
•
|
anticipate and compete effectively with our competitors’ efforts.
|
Market acceptance of our products depends in part on our ability to demonstrate that our products are cost-effective and easier to use, as well as offer technological advantages. Additionally, we may experience design, manufacturing, marketing or other difficulties that could delay or prevent our development, introduction or marketing of new products or new versions of our existing products. As a result of such difficulties and delays, our development expenses may increase and, as a consequence, our results of operations could suffer.
Development and sales of our products are dependent on a number of factors beyond our control, and our inability to make and complete research and development investments, enhance the product development process and be innovative to solve customer needs with respect to the respective products may adversely affect our business, financial condition and results of operations.
A significant aspect of our growth strategy is the continued market development of products including NanoKnife, AngioVac, Venacure EVLT and BioFlo products.
There can be no guarantee that we will be able to develop and manufacture additional next generation or updated products on commercially favorable terms, or at all. NanoKnife and AngioVac are developing technologies and the inability of either of them to achieve clinical acceptance, as well as our inability to generate meaningful clinical data to convince providers of the clinical and economic benefits of our BioFlo platform, could severely limit our ability to drive revenue growth.
We currently have FDA 510(k) clearance to market NanoKnife products for soft tissue ablation. If we are not able to secure FDA approval to conduct investigational device exemption (IDE) trials or marketing approval for additional or more specific indications, through 510(k) clearance, pre-market approval or otherwise, our ability to market our NanoKnife products will be restricted which may have an adverse effect on our business, financial condition and results of operations.
Undetected defects may increase our costs and impair the market acceptance of our products.
Our products have occasionally contained, and may in the future contain, undetected defects. When these problems occur, we must divert the attention of our engineering personnel to address them. There is no assurance that we will not incur warranty or repair costs, be subject to liability claims for damages related to product defects, or experience manufacturing, shipping or other delays or interruptions as a result of these defects in the future. Our insurance policies may not provide sufficient protection should a claim be asserted. In addition, the occurrence of defects may result in significant customer relations problems and injury to our reputation, and may impair market acceptance of our products.
We, our competitors or other third parties, may engage in clinical trials with respect to our products. The results of these trials may be unfavorable, or perceived as unfavorable by the market, and could have a material adverse effect on our business, financial condition or results of operations.
Our products may be the subject of clinical trials conducted by us, our competitors or third parties for the purposes of obtaining regulatory clearances or to gather market data. Unfavorable or inconsistent clinical data from existing or future clinical trials conducted by us, by our competitors or by third parties, or the FDA's or the market's perception of this clinical data, may adversely impact our ability to obtain product approvals, our position in, and share of, the markets in which we participate and our business, financial condition, results of operations or future prospects.
If we are unable to convince customers that our products can improve the cost structure of their business, our revenue growth and profitability may be materially adversely impacted.
Worldwide initiatives to contain healthcare costs have led government and the private sector to enact cost containment efforts as a means of managing the growth of health care utilization. Common techniques include policies on price regulation, competitive pricing, bidding and tender mechanics, coverage and payment, comparative effectiveness of therapies, technology assessments, and managed-care arrangements. These changes are causing the marketplace to put increased emphasis on the delivery of more cost-effective medical devices and therapies. Government programs, including Medicare and Medicaid, private health care insurance, and managed-care plans have attempted to control costs by limiting the amount of reimbursement they will pay for particular procedures or treatments, tying reimbursement to outcomes, shifting to population health management, and other mechanisms designed to constrain utilization and contain costs. Simultaneously, hospitals are redefining their role in health care delivery as many assume much more risk and control of the total cost of patient care. To successfully make this transformation health systems are consolidating, purchasing or partnering with physicians, post-acute care providers, while also narrowing networks thus allowing greater control over outcomes. Today, many systems are
17
becoming ‘mini’ payer/provider organizations. These newly redesigned health systems are creating mechanisms such as value analysis and centralized purchasing functions that set pricing and in some cases limit the number of vendors that can participate in the purchasing program. Hospitals are also aligning interests with physicians through employment and other arrangements, such as gainsharing, where a hospital agrees with physicians to share any realized cost savings resulting from the physicians’ collective change in practice patterns such as standardization of devices where medically appropriate. This has created an increasing level of price sensitivity among customers for our products. Some third-party payers must also approve coverage and set reimbursement levels for new or innovative devices or therapies before they will reimburse health care providers who use the medical devices or therapies. Even though a new medical device may have been cleared for commercial distribution, we may find limited demand for the device until coverage and sufficient reimbursement levels have been obtained from governmental and private third-party payers. In addition, some private third-party payers require that certain procedures or that the use of certain products be authorized in advance as a condition of reimbursement. International examples of cost containment initiatives and health care reforms advancing clinical outcomes as the key to market access are emerging in France, Germany, the Netherlands and the UK. This new criteria can severely restrict coverage, reduce reimbursement and delay access to key markets with requirements for incremental clinical benefit and coverage with evidence development.
Cost-containment efforts of group purchasing organizations could adversely affect our selling prices, financial position and results of operations.
Many of our existing and potential customers have become members of group purchasing organizations, or GPOs, and integrated delivery network, or IDNs, in an effort to reduce costs. GPOs and IDNs negotiate pricing arrangements with healthcare product manufacturers and distributors and offer the negotiated prices to affiliated hospitals and other members. GPOs and IDNs typically award contracts on a category-by-category basis through a competitive bidding process. Bids are generally solicited from multiple manufacturers with the intention of driving down pricing. Due to the highly competitive nature of the GPO and IDN contracting processes, we may not be able to obtain market prices for our products or obtain or maintain contract positions with major GPOs and IDNs, which could adversely impact our profitability. Also, sales through a GPO or IDN can be significant to our business and if we are unable to retain contracts with our customers, or acquire additional contracts, our financial results may be negatively impacted.
We are dependent on single and limited source suppliers which subjects our business and results of operations to risks of supplier business interruptions.
We currently purchase significant amounts of several key products and product components from single and limited source suppliers and anticipate that we will do so for future products as well. Any delays in delivery of or shortages in those or other products and components could interrupt and delay manufacturing of our products and result in the cancellation of orders for our products. Any or all of these suppliers could discontinue the manufacture or supply of these products and components at any time. Due to FDA and other business considerations, we may not be able to identify and integrate alternative sources of supply in a timely fashion or at all. Any transition to alternate suppliers may result in production delays and increased costs and may limit our ability to deliver products to our customers. Furthermore, if we are unable to identify alternative sources of supply, we would have to modify our products to use substitute components, which may cause delays in shipments, increased design and manufacturing costs and increased prices for our products.
In addition, we purchase certain products as a distributor for the manufacturer of those products, including Asclera,. Operational, quality or regulatory issues of the manufacturers of the products we distribute could constrain or interrupt the availability of those products or services. Any constraint or interruption in the supply of finished products that we distribute could have a material adverse effect on our ability to sell products, our financial condition and our results of operations.
We are heavily dependent on third-party distributors to generate a substantial portion of international revenues and are at the risk of these distributors also selling for our competitors along with being financially viable to be able to effectively distribute our products and make timely payment.
Outside of the U.S we rely heavily on third party distributors, either on a
country-by-country
basis or on a multi-country, regional basis, to market, sell and distribute our products. International distributors accounted for approximately 72% revenues for the year ended
May 31, 2017
. In certain circumstances, distributors may also sell competing products to our own or products for competing diagnostic modalities and may have incentives to shift sales towards those competing products. As a result, we cannot assure you that our international distributors will increase or maintain our current levels of unit sales or increase or maintain our current unit pricing, which, in turn, could have a material adverse effect on our business, results of operations, financial condition and cash flows. In addition, there is a risk that our distributors will not be financially viable due to current economic and/or regulatory events in their respective countries.
18
Failure to secure adequate reimbursement for our products could materially impair our ability to grow revenue and drive profitability.
Our products are used in medical procedures generally covered by government or private health plans.
In general, a third-party payor only covers a medical product or procedure when the plan administrator is satisfied that the product or procedure improves health outcomes, including quality of life or functional ability, in a safe and cost-effective manner. Even if a device has received clearance or approval for marketing by the FDA, there is no assurance that third-party payors will cover the cost of the device and related procedures.
In many instances, third-party payors use price schedules that do not vary to reflect the cost of the products and equipment used in performing those procedures. In other instances, payment or reimbursement is separately available for the products and equipment used, in addition to payment or reimbursement for the procedure itself. Even if coverage is available, third-party payors may place restrictions on the circumstances where they provide coverage or may offer reimbursement that is not sufficient to cover the cost of our products.
Third-party payors who cover the cost of medical products or equipment, in addition to allowing a general charge for the procedure, often maintain lists of exclusive suppliers or approved lists of products deemed to be cost-effective. Authorization from those third-party payors is required prior to using products that are not on these lists as a condition of reimbursement. If our products are not on the approved lists, healthcare providers must determine if the additional cost and effort required in obtaining prior authorization, and the uncertainty of actually obtaining coverage, is justified by any perceived clinical benefits from using our products.
Finally, the advent of contracted fixed rates per procedure has made it difficult to receive reimbursement for disposable products, even if the use of these products improves clinical outcomes. In addition, many third-party payors are moving to managed care systems in which providers contract to provide comprehensive healthcare for a fixed cost per person. Managed care providers often attempt to control the cost of healthcare by authorizing fewer elective surgical procedures. Under current prospective payment systems, such as the diagnosis related group system and the hospital out-patient prospective payment system, both of which are used by Medicare and in many managed care systems used by private third-party payors, the cost of our products will be incorporated into the overall cost of a procedure and not be separately reimbursed. As a result, we cannot be certain that hospital administrators and physicians will purchase our products, despite the clinical benefits and opportunity for cost savings that we believe can be derived from their use. If hospitals and physicians cannot obtain adequate reimbursement for our products or the procedures in which they are used, our business, financial condition, results of operations, and cash flows could suffer a material adverse impact.
Our success in international markets will depend largely upon the availability of reimbursement from the third-party payors through which healthcare providers are paid in those markets. Reimbursement and healthcare payment systems vary significantly by country. The main types of healthcare payment systems are government sponsored healthcare and private insurance. Reimbursement approval must be obtained individually in each country in which our products are marketed. Outside the United States, we generally rely on our distributors to obtain reimbursement approval in the countries in which they will sell our products. There can be no assurance that reimbursement approvals will be received. The failure to secure reimbursement approvals in international markets could materially impact our financial position and results of operations.
If a product liability claim is brought against us or our product liability insurance coverage is inadequate, our business could be harmed.
The design, manufacture and marketing of the types of medical devices we sell entail an inherent risk of product liability. Our products are used by physicians to treat seriously ill patients. We are periodically subject to product liability claims, and patients or customers may in the future bring claims against us in a number of circumstances and for a number of reasons, including if our products were misused, if a component of our product fails, if their manufacture or design was flawed, if they produced unsatisfactory results or if the instructions for use and operating manuals and disclosure of product related risks for our products were found to be inadequate. In addition, individuals or groups seeking to represent a class may file suit against us. The outcome of litigation, particularly class action lawsuits, is difficult to assess or quantify. Plaintiffs in these types of lawsuits often seek recovery of very large or indeterminate amounts, including not only actual damages, but also punitive damages. The magnitude of the potential losses relating to these lawsuits may remain unknown for substantial periods of time.
We carry a product liability policy with a limit of $10,000,000 per product liability claim and an aggregate policy limit of $10,000,000, subject to a self-insured retention of $500,000 per occurrence and $2,000,000 in the aggregate. We believe, based on claims made against us in the past, our existing product liability insurance coverage is reasonably adequate to protect us
19
from any liabilities we might incur. However, there is no assurance that this coverage will be sufficient to satisfy any claim made against us. In addition, we may not be able to continue to maintain adequate coverage at a reasonable cost and on reasonable terms, if at all. Any product liability claim brought against us, with or without merit, could increase our product liability insurance rates or prevent us from securing any coverage in the future. Additionally, if one or more product liability claims is brought against us for uninsured liabilities or is in excess of our insurance coverage, our financial condition and results of operations could be negatively impacted. Further, such claims may require us to recall some of our products, which could result in significant costs to us and could divert management’s attention from our business.
We may be exposed to risks associated with acquisitions, including integration risks and risks associated with methods of financing and the impact of accounting treatment. Accordingly, completed acquisitions may not enhance our financial position or results of operations as they are based projections and assumptions which are uncertain and subject to change.
Part of our growth strategy is to acquire businesses and technologies that are complementary to ours. There is no assurance that acquisition opportunities will be available on acceptable terms, or at all, or that we will be able to obtain necessary financing or regulatory approvals. Any acquisitions that we do undertake would be accompanied by the risks commonly encountered in acquisitions, including the:
|
•
|
potential disruption of our business while we evaluate opportunities, complete acquisitions and develop and implement new business strategies to take advantage of these opportunities;
|
|
•
|
inability of our management to maximize our financial and strategic position by incorporating an acquired technology or business into our existing offerings;
|
|
•
|
our inability to achieve the cost savings and operating synergies anticipated in the acquisition, which would prevent us from achieving the positive earnings gains expected as a result of the acquisition;
|
|
•
|
diversion of management attention from ongoing business concerns to integration matters;
|
|
•
|
difficulty of maintaining uniform standards, controls, procedures and policies;
|
|
•
|
challenges in demonstrating to our customers that the acquisition will not result in adverse changes in customer service standards or business focus;
|
|
•
|
possible cash flow interruption or loss of revenue as a result of change of ownership transitional matters;
|
|
•
|
difficulty of assimilating the operations and personnel of acquired businesses;
|
|
•
|
potential loss of key employees of acquired businesses, and the impairment of relationships with employees and customers as a result of changes in management; and
|
|
•
|
uncertainty as to the long-term success of any acquisitions we may make including the impact on contingent liabilities.
|
There is no assurance that any completed acquisition will be accretive to our margins or profits in the short term or in the long term. If we proceed with one or more significant acquisitions in which the consideration consists of cash, a substantial portion of our available cash could be used to consummate the acquisitions. If we consummate one or more acquisitions in which the consideration consists of capital stock, our stockholders could suffer significant dilution of their interest in us. In addition, we could incur or assume significant amounts of indebtedness in connection with acquisitions. Further, acquisitions could also result in significant goodwill and/or amortization charges for acquired businesses or technologies.
Failure to attract additional capital which we may require to expand our business could curtail our growth.
We may require additional capital to expand our business. If cash generated internally is insufficient to fund capital requirements, we will require additional debt or equity financing. In addition, we may require financing to fund any significant acquisitions we may seek to make. Needed financing may not be available or, if available, may not be available on terms satisfactory to us and may result in significant stockholder dilution. Covenants in our existing financing agreements may also restrict our ability to obtain additional debt financing. If we fail to obtain sufficient additional capital in the future, we could be forced to curtail our growth strategy by reducing or delaying capital expenditures and acquisitions, selling assets, restructuring our operations or refinancing our indebtedness.
International and national economic and industry conditions constantly change, and could materially and adversely affect our business, financial condition and results of operations.
Our business, financial condition and results of operation are affected by many changing economic, industry and other conditions beyond our control. Actual or potential changes in international, national, regional and local economic, business and financial conditions, including recession, inflation and trade protection measures, may negatively affect consumer preferences, perceptions, spending patterns or demographic trends, any of which could adversely affect our business, financial condition or results of operations. Our customers may experience financial difficulties or be unable to borrow money to fund their
20
operations, which may adversely impact their ability or decision to purchase or pay for our products. Disruptions in the credit markets have previously resulted, and could again result, in volatility, decreased liquidity, widening of credit spreads, and reduced availability of financing. There can be no assurance that future financing will be available to us on acceptable terms, if at all. An inability to obtain necessary additional financing on acceptable terms may have an adverse impact on us and on our ability to execute on our business plan.
We are subject to a variety of market and financial risks due to our international operations that could adversely affect those operations or our profitability and operating results.
Although our stock is traded on the New York Stock Exchange, we are a global Company. Operations in countries outside of the U.S., which account for approximately
19%
percent of our net sales for the fiscal year ended
May 31, 2017
, are accompanied by certain financial and other risks that would not be faced by a Company operating purely within the U.S. We intend to continue to pursue growth opportunities in sales outside the U.S., especially in emerging markets, which could expose us to greater risks associated with international sales and operations. Our profitability and international operations are, and will continue to be, subject to a number of risks and potential costs, including:
|
•
|
fluctuations in currency exchange rates;
|
|
•
|
healthcare reform legislation;
|
|
•
|
multiple non-U.S. regulatory requirement that are subject to change and that could restrict our ability to manufacture and sell our products;
|
|
•
|
local product preferences and product requirements;
|
|
•
|
longer-term receivables than are typical in the U.S.;
|
|
•
|
trade protection measures and import or export licensing requirements;
|
|
•
|
less intellectual property protection in some countries outside the U.S. than exists in the U.S.;
|
|
•
|
different labor regulations and workforce instability;
|
|
•
|
political instability;
|
|
•
|
the potential payment of U.S. income taxes on earnings of certain foreign subsidiaries subject to U.S. taxation upon repatriation;
|
|
•
|
the expiration and non-renewal of foreign tax rulings;
|
|
•
|
potentially negative consequences from changes in or interpretation of tax laws; and
|
|
•
|
economic instability and inflation, recession or interest rate fluctuations.
|
There are recent legislative proposals to tax profits of U.S. affiliates which are earned abroad. While it is impossible for us to predict whether these and other proposals will be implemented, or how they will ultimately impact us, they may materially impact our results of operations if, for example, our profits earned abroad are subject to U.S. income tax, or we are otherwise disallowed deductions as a result of these profits.
On June 23, 2016, the United Kingdom (U.K.) held a referendum in which voters approved an exit from the E.U., commonly referred to as “Brexit”. As a result of the referendum, it is expected that the British government will begin negotiating the terms of the U.K.’s future relationship with the E.U. Although it is unknown what those terms will be, it is possible that there will be greater restrictions on imports and exports between the U.K. and E.U. countries and increased regulatory complexities. These changes may adversely affect our operations and financial results.
Finally, changes in currency exchange rates may reduce the reported value of our revenues outside the U.S, net of expenses, and cash flows. We cannot predict changes in currency exchange rates, the impact of exchange rate changes, nor the degree to which we will be able to manage the impact of currency exchange rate changes.
Continuing worldwide economic instability, including challenges faced by the Eurozone countries, could adversely affect our revenues, financial condition or results of operations.
Since fiscal year 2008, the global economy has been impacted by the sequential effects of an ongoing global financial crisis. There can be no assurance that there will not be further deterioration in the global economy. Our customers and vendors may experience financial difficulties or be unable to borrow money to fund their operations which may adversely impact their ability to purchase our products or to pay for our products on a timely basis, if at all. As with our customers and vendors, these economic conditions make it more difficult for us to accurately forecast and plan our future business activities. In addition, trade receivables are in many countries (including, but not limited to, Greece, Ireland, Portugal, and Spain). Repayment of these receivables is dependent upon the financial stability of the economies of those countries.
21
In light of these global economic fluctuations, we continue to monitor the creditworthiness of customers located outside the U.S. Failure to receive payment of all or a significant portion of these receivables could adversely affect our results of operations. Further, there are concerns for the overall stability and suitability of the Euro as a single currency, given the economic and political challenges facing individual Eurozone countries. Continuing deterioration in the creditworthiness of the Eurozone countries, the withdrawal of one or more member countries from the EU, or the failure of the Euro as a common European currency could adversely affect our revenues, financial condition or results of operations.
Our business could be harmed if we lose the services of our key personnel.
Our business depends upon our ability to attract and retain highly qualified personnel, including managerial, sales and technical personnel. We compete for key personnel with other companies, healthcare institutions, academic institutions, government entities and other organizations. We do not have written employment agreements with our executive officers, other than the CEO. Our ability to maintain and expand our business may be impaired if we are unable to retain our current key personnel or hire or retain other qualified personnel in the future. In addition, our sales force is highly talented and there is high competition in the sales industry which could have an adverse effect on our business if there is significant turnover.
RISKS RELATED TO OPERATIONS
If we are unable to manage our growth profitably, our business, financial results and stock price could suffer.
Our future financial results will depend in part on our ability to profitably manage our growth. Management will need to maintain existing customers and attract new customers, recruit, retain and effectively manage employees, as well as expand operations and integrate customer support and financial control systems. If integration
-
related expenses and capital expenditure requirements are greater than anticipated or if we are unable to manage our growth profitably, our financial results and the market price of our common stock may decline.
In recent years we have begun to implement our operational excellence initiatives which include a number of restructuring, realignment and cost reduction initiatives. While we have realized some efficiencies from these actions, we may not realize the benefits of these initiatives to the extent we anticipated. Further, such benefits may be realized later than expected, and the ongoing difficulties in implementing these measures may be greater than anticipated, which could cause us to incur additional costs or result in business disruptions. In addition, if these measures are not successful or sustainable, we may undertake additional realignment and cost reduction efforts, which could result in significant additional charges. Moreover, if our restructuring and realignment efforts prove ineffective, our ability to achieve our other strategic goals and business plans may be adversely affected.
We have incurred significant indebtedness which imposes operating and financial restrictions on us which, together with our debt service obligations, could significantly limit our ability to execute our business strategy and increase the risk of default under our debt obligations.
We borrowed an aggregate of approximately
$97.5 million
as of
May 31, 2017
. The interest rate on these borrowings is a floating rate which could expose us to the risk of increased interest expense in the future. The terms of our credit facilities require us to comply with certain financial maintenance covenants. In addition, the terms of our indebtedness also include certain covenants restricting or limiting our ability to take certain actions.
These covenants may adversely affect our ability to finance future operations or limit our ability to pursue certain business opportunities or take certain corporate actions. The covenants may also restrict our flexibility in planning for changes in our business and the industry and make us more vulnerable to economic downturns and adverse developments.
Our ability to meet our cash requirements, including our debt service obligations, will be dependent upon our operating performance, which will be subject to general economic and competitive conditions and to financial, business and other factors affecting our operations, many of which are or may be beyond our control. We cannot provide assurance that our business operations will generate sufficient cash flows from operations to fund these cash requirements and debt service obligations. If our operating results, cash flow or capital resources prove inadequate, we could face substantial liquidity problems and might be required to dispose of material assets or operations to meet our debt and other obligations. If we are unable to service our debt, we could be forced to reduce or delay planned expansions and capital expenditures, sell assets, restructure or refinance our debt or seek additional equity capital, and we may be unable to take any of these actions on satisfactory terms or in a timely manner. Further, any of these actions may not be sufficient to allow us to service our debt obligations or may have an adverse impact on our business. Our debt agreements limit our ability to take certain of these actions. Our failure to generate sufficient
22
operating cash flow to pay our debts or to successfully undertake any of these actions could have a material adverse effect on us.
In addition, the degree to which we are leveraged as a result of the indebtedness incurred in connection with an acquisition or otherwise could materially and adversely affect our ability to obtain additional financing for working capital, capital expenditures, acquisitions, debt service requirements or other purposes, could make us more vulnerable to general adverse economic, regulatory and industry conditions, could limit our flexibility in planning for, or reacting to, changes and opportunities in the markets in which we compete, could place us at a competitive disadvantage compared to our competitors that have less debt or could require us to dedicate a substantial portion of our cash flow to service our debt.
Despite our substantial indebtedness, we may incur more debt, which could exacerbate the risks described above.
We may be able to incur substantial additional indebtedness in the future subject to the limitations contained in the agreements governing our debt. Although these agreements restrict us from incurring additional indebtedness, these restrictions are subject to important exceptions and qualifications. For example, we are generally permitted to incur certain indebtedness, including indebtedness arising in the ordinary course of business and indebtedness relating to acquisition activities. See “Management’s Discussion and Analysis of Financial Condition and Results of Operations-Liquidity and Capital Resources” If we incur additional debt, the risks that we and they now face as a result of our higher leverage could intensify.
Our international sales and operations are subject to risks and uncertainties that vary by country and which could have a material adverse effect on our business and/or results of operations.
Sales outside the United States accounted for approximately
19%
of our net sales during our fiscal year ended
May 31, 2017
. We anticipate that sales from international operations will continue to represent a significant portion of our total sales, and we intend to continue our expansion into emerging and/or faster-growing markets outside the United States. Our sales and profitability from our international operations are subject to risks and uncertainties that can vary by country, and include those related to political and economic conditions, foreign currency exchange rate fluctuations, changes in tax laws, regulatory and reimbursement programs and policies, and the protection of intellectual property rights. These risks and uncertainties could have a material adverse effect on our business and/or results of operations.
Foreign currency exchange rate may adversely affect our business, financial condition and results of operations.
We are exposed to a variety of market risks, including the effects of changes in foreign currency exchange rates. Products manufactured in, and sold into, foreign markets represent a significant portion of our operations. When the United States dollar strengthens or weakens in relation to the foreign currencies of the countries in which we sell or manufacture our products, such as the euro, our United States dollar-reported revenue and income will fluctuate. As a result of the June 23, 2016 referendum by British voters to exit the European Union, global markets and foreign currencies have been adversely impacted and the value of the Pound Sterling has sharply declined as compared to the U.S. Dollar and other currencies. This volatility in foreign currencies is expected to continue as the U.K. negotiates and executes its exit from the European Union but it is uncertain over what time period this will occur. The effects of currency rate fluctuations and changes in the relative values of currencies may, in some instances, have a significant effect on our business, financial condition, results of operations and cash flows.
Our goodwill, intangible assets and fixed assets are subject to potential impairment.
A significant portion of our assets consists of goodwill, intangible assets and fixed assets, the carrying value of which may be reduced if we determine that those assets are impaired.
Most of our intangible and fixed assets have finite useful lives and are amortized or depreciated over their useful lives on either a straight-line basis or over the expected period of benefit or as revenues are earned from the sales of the related products. The underlying assumptions regarding the estimated useful lives of these intangible assets are reviewed annually and more often if an event or circumstance occurs making it likely that the carrying value of the assets may not be recoverable and are adjusted through accelerated amortization if necessary. Whenever events or changes in circumstances indicate that the carrying value of the assets is not recoverable we test intangible assets for impairment based on estimates of future cash flows. If an intangible asset is considered to be impaired, the amount of the impairment will equal the excess of the carrying value over the fair value of the asset.
We review our single reporting unit for potential goodwill impairment in the third fiscal quarter of each year as part of our annual goodwill impairment testing, and more often if an event or circumstance occurs making it likely that impairment exists. We conduct impairment testing based on our current business strategy in light of present industry and economic
23
conditions, as well as future expectations. The annual goodwill impairment review performed in December
2016
indicated no goodwill impairments.
If actual results differ from the assumptions and estimates used in the goodwill and intangible asset calculations, we could incur future impairment or amortization charges, which could negatively impact our results of operations.
We may be limited in our ability to utilize, or may not be able to utilize, net operating loss carryforwards to reduce our future tax liability.
IRC Section 382 and related provisions contain rules that limit for U.S. federal income tax purposes the ability of a Company that undergoes an “ownership change” to utilize its net operating loss carryforwards and certain other tax attributes existing as of the date of such ownership change. Our Federal net operating loss carryforwards as of
May 31, 2017
after considering IRC Section 382 limitations are
$161.6 million
. The expiration of the Federal net operating loss carryforwards is as follows:
$29.8 million
between 2017 and 2023 and
$131.8 million
between 2027 and 2037. Our state net operating loss carryforwards as of
May 31, 2017
after considering remaining IRC Section 382 limitations are
$32.7 million
which expire in various years from 2017 to 2037. Future ownership changes within the meaning of IRC Section 382 may also subject our tax loss carryforwards to annual limitations which would restrict our ability to use them to offset our taxable income in periods following the ownership changes.
See Note 9 to our consolidated financial statements included in our Annual Report on Form 10-K for the fiscal year ended
May 31, 2017
for a further discussion of our tax loss carryovers.
Fluctuations in our effective tax rate and changes to tax laws may adversely affect us.
As an international Company, we are subject to taxation in numerous countries, states and other jurisdictions. Our effective tax rate is derived from a combination of applicable tax rates in the various countries, states and other jurisdictions in which we operate. In preparing our financial statements, we estimate the amount of tax that will become payable in each of these jurisdictions. Our effective tax rate may, however, differ from the estimated amount due to numerous factors, including a change in the mix of our profitability from country to country and changes in tax laws. Any of these factors could cause us to experience an effective tax rate significantly different from previous periods or our current expectations, which could have an adverse effect on our business, financial condition and results of operations and cash flows.
We rely on the proper function, availability and security of information technology systems to operate our business and a cyber-attack or other breach of these systems could have a material adverse effect on our business, financial condition or results of operations.
We rely on information technology systems to process, transmit, and store electronic information in our day-to-day operations. Similar to other large multi-national companies, the size and complexity of our information technology systems makes them vulnerable to a cyber-attack, malicious intrusion, breakdown, destruction, loss of data privacy, or other significant disruption. Our information systems require an ongoing commitment of significant resources to maintain, protect, and enhance existing systems and develop new systems to keep pace with continuing changes in information processing technology, evolving systems and regulatory standards, the increasing need to protect patient and customer information, and changing customer patterns. In addition, third parties may attempt to hack into our products to obtain data relating to patients with our products or our proprietary information. Any failure by us to maintain or protect our information technology systems and data integrity, including from cyber-attacks, intrusions or other breaches, could result in the unauthorized access to patient data and personally identifiable information, theft of intellectual property or other misappropriation of assets, or otherwise compromise our confidential or proprietary information and disrupt our operations. Any of these events, in turn, may cause us to lose existing customers, have difficulty preventing, detecting, and controlling fraud, have disputes with customers, physicians, and other health care professionals, be subject to legal claims and liability, have regulatory sanctions or penalties imposed, have increases in operating expenses, incur expenses or lose revenues as a result of a data privacy breach or theft of intellectual property, or suffer other adverse consequences, any of which could have a material adverse effect on our business, financial condition or results of operations.
Any disaster at our manufacturing facilities could disrupt our ability to manufacture our products for a substantial amount of time, which could cause our revenues to decrease. This risk is more significant as we consolidate our plants in fiscal year 2018.
We conduct our manufacturing and assembly at facilities in Queensbury, New York, Glens Falls, New York, Manchester, Georgia, and Denmead, England. It would be difficult, expensive and time-consuming to transfer resources from one facility to
24
the other, replace, or repair these facilities and our manufacturing equipment if they were significantly affected by a disaster. Additionally, we might be forced to rely on third-party manufacturers or to delay production of our products. Insurance for damage to our properties and the disruption of our business from disasters may not be sufficient to cover all of our potential losses and may not continue to be available to us on acceptable terms, or at all. In addition, if one of our principal suppliers were to experience a similar disaster, uninsured loss or under-insured loss, we might not be able to obtain adequate alternative sources of supplies or products or could face significant delays and incur substantial expense in doing so. Any significant uninsured loss, prolonged or repeated disruption, or inability to operate experienced by us or any of our principal suppliers could cause significant harm to our business, financial condition and results of operations.
Once the plant consolidation is complete, manufacturing and assembly will only take place in Queensbury, New York and Glens Falls, New York. If we were significantly affected by a disaster, we no longer have an option to transfer manufacturing to another facility so we would be forced to rely on third-party manufacturers or would have to delay production of our products.
Anti-takeover provisions in our organizational documents and Delaware law may discourage or prevent a change of control, even if an acquisition would be beneficial to our stockholders, which could cause our stock price to decline and prevent attempts by our stockholders to replace or remove our current management.
Our amended and restated certificate of incorporation and our amended and restated bylaws contain provisions that may enable our management to resist a change in control. These provisions may discourage, delay or prevent a change in the ownership of our Company or a change in our management. In addition, these provisions could limit the price that investors would be willing to pay in the future for shares of our common stock. Such provisions include:
|
•
|
our board of directors is authorized, without prior stockholder approval, to create and issue “blank check” preferred stock, with rights senior to those of our common stock;
|
|
•
|
our board of directors is classified so that not all members of our board of directors are elected at one time, which may make it more difficult for a person who acquires control of a majority of our outstanding voting stock to replace our directors;
|
|
•
|
advance notice requirements for stockholders to nominate individuals to serve on our board of directors or for stockholders to submit proposals that can be acted upon at stockholder meetings;
|
|
•
|
stockholder action by written consent is prohibited; and
|
|
•
|
stockholders are not permitted to cumulatively vote for the election of directors.
|
We are also subject to the provisions of Section 203 of the Delaware General Corporation Law, which may prohibit certain business combinations with stockholders owning 15% or more of our outstanding voting stock.
These and other provisions in our amended and restated certificate of incorporation, amended and restated bylaws and Delaware law could make it more difficult for stockholders or potential acquirers to obtain control of our board of directors or initiate actions that are opposed by our then-current board of directors, including delaying or impeding a merger, tender offer or proxy contest involving our Company. Any delay or prevention of a change of control transaction or changes in our board of directors could cause the market price of our common stock to decline.
RISKS RELATED TO THE REGULATORY ENVIRONMENT
Reforms to the United States healthcare system may adversely affect our business.
A significant portion of our patient volume is derived from U.S. government healthcare programs, principally Medicare, which are highly regulated and subject to frequent and substantial changes. For example, in March 2010, the President signed one of the most significant healthcare reform measures in decades, the Healthcare Reform Act. The Healthcare Reform Act contains a number of provisions that affect coverage and reimbursement of drug products and medical imaging procedures in which our drug products are used. See “Business-Regulatory Matters-Healthcare Reform Act and Related Laws.” We cannot assure you that the Healthcare Reform Act, as currently enacted or as amended in the future, will not adversely affect our business and financial results, and we cannot predict how future federal or state legislative, judicial or administrative changes relating to healthcare reform will affect our business.
In addition, other legislative changes have been proposed and adopted since the Healthcare Reform Act was enacted. The Budget Control Act of 2011 includes provisions to reduce the federal deficit. The Budget Control Act, as amended, resulted in the imposition of 2% reductions in Medicare payments to providers, which went into effect on April 1, 2013 and will remain in effect through 2024 unless additional Congressional action is taken. Any significant spending reductions affecting Medicare,
25
Medicaid or other publicly funded or subsidized health programs that may be implemented and/or any significant taxes or fees that may be imposed on us, as part of any broader deficit reduction effort or legislative replacement to the Budget Control Act, could have an adverse impact on our results of operations.
In addition, federal spending is also subject to a statutory debt ceiling. If the federal debt reaches the statutory debt ceiling, Congress must enact legislation to suspend enforcement of, or increase, the statutory debt ceiling. If Congress fails to do so before the ceiling is reached and, as a result, is unable to satisfy its financial obligations, including under Medicare, Medicaid and other publicly funded or subsidized health programs, our results of operations could be adversely impacted.
The full impact on our business of the Healthcare Reform Act and the other new laws is uncertain. Nor is it clear whether other legislative changes will be adopted or how those changes would affect our industry generally or our ability to successfully commercialize our products or the development of new products.
Under the statutory Medicare sustainable growth rate formula, payments under the Medicare Physician Fee Schedule could have decreased significantly over the past several years without congressional intervention. In the past, when the application of the statutory formula would have resulted in lower payments, Congress has passed interim legislation to prevent the reductions. In 2014, Congress again prevented the negative update factor from going into effect until March 31, 2015. If Congress fails to intervene to prevent the negative update factor in the future through either another temporary measure or a permanent revision to the statutory formula, payments to physicians may be reduced.
Our industry is experiencing greater scrutiny and regulation by governmental authorities, which has led to certain costs and business distractions as we respond to inquiries and comply with new regulations, and may lead to greater governmental regulation in the future.
Our medical devices and our business activities are subject to rigorous regulation by the FDA and numerous other federal, state and foreign governmental authorities. These authorities and members of Congress have been increasing their scrutiny of our industry. In addition, certain states, including Massachusetts, have recently passed or are considering legislation restricting our interactions with health care providers and requiring disclosure of many payments to them. The federal government has recently introduced similar legislation, which may or may not preempt state laws. Recent Supreme Court case law has clarified that the FDA’s authority over medical devices preempts state tort laws, but legislation has been introduced at the federal level to allow state intervention, which could lead to increased and inconsistent regulation at the state level. We anticipate that the government will continue to scrutinize our industry closely, and that additional regulation by governmental authorities may increase compliance costs, exposure to litigation and other adverse effects to our operations.
We are subject to a comprehensive system of federal, state and international laws and regulations, and we could be the subject of investigations, enforcement actions or face lawsuits and monetary or equitable judgments.
We operate in many parts of the world, and our operations are affected by complex state, federal and international laws relating to healthcare, environmental protection, antitrust, anti-corruption, anti-bribery, fraud and abuse, export control, tax, employment and laws regarding privacy, personally identifiable information and protected health information, including, for example, the Food, Drug and Cosmetic Act (“FDCA”), various FDA and international regulations relating to, among other things, the development, quality assurance, manufacturing, importation, distribution, marketing and sale of, and billing for, our products, the federal Anti-Kickback Statute and Federal False Claims Act, the U.S. Foreign Corrupt Practices Act (“FCPA”), the UK Bribery Act of 2010, the federal Health Insurance Portability and Accountability Act of 1996 (“HIPAA”) and other foreign data protection and privacy laws, and laws and regulations relating to sanctions and money laundering. We are subject to periodic inspections to determine compliance with the FDA’s Quality System Regulation requirements, current medical device adverse event reporting regulations, and similar foreign rules and regulations. Despite our training and compliance programs, our internal control policies and procedures may not always protect us from negligent, reckless or criminal acts committed by our employees or agents. The failure to comply with these laws and regulatory standards, allegations of such non-compliance or the discovery of previously unknown problems with a product or manufacturer: (i) could result in FDA Form-483 notices and/or warning letters or the foreign equivalent, fines, delays or suspensions of regulatory clearances, investigations, detainment, seizures or recalls of products (with the attendant expenses), the banning of a particular device, an order to replace or refund the cost of any device previously manufactured or distributed, operating restrictions and/or civil or criminal prosecution, and/or penalties, as well as decreased sales as a result of negative publicity and product liability claims; and (ii) could disrupt our business and could have a material adverse effect on our business, results of operations, financial condition and/or liquidity.
Most of our products must receive clearance or approval from the FDA or comparable regulatory agencies abroad before they can be marketed or sold. State, federal and foreign registration regulations are both evolving and subject to varied levels of
26
interpretation and enforcement. It can be costly and time-consuming to obtain and maintain regulatory approvals to market a medical device. Approvals might not be granted on a timely basis, if at all, for new devices, new indications for use or certain modifications or enhancements to previously approved products. Even after a device receives regulatory approval it remains subject to significant regulatory and quality requirements, such as manufacturing, recordkeeping, renewal, recertification or reporting and other post market approval requirements, which may include clinical, laboratory or other studies. Product approvals by the FDA and other foreign regulators can be withdrawn due to failure to comply with regulatory standards or the occurrence of unforeseen problems following initial approval or may be re-classified to a higher regulatory classification, such as requiring a Pre-Market Approval (“PMA”) for a previously cleared 510(k) device. Regulations are also subject to change as a result of legislative, administrative or judicial action, which may further increase our costs or reduce sales. Our failure to maintain approvals, obtain approval for new products or comply with other applicable regulatory requirements could adversely affect our business, results of operations, financial condition and/or liquidity.
The healthcare industry is under continued scrutiny from state, federal and international governments with respect to industry practices in the area of sales and marketing, including provisions of the Physician Payment Sunshine Act. If our marketing, sales or other activities fail to comply with the FDA’s or other comparable foreign regulatory agencies’ regulations or guidelines, or other applicable laws, we may be subject to warnings from the FDA or investigations or enforcement actions from the FDA, Medicare, the Office of Inspector General of the U.S. Department of Health and Human Services or other government agencies or enforcement bodies. Additionally, in the European Union, a new draft Medical Device Regulation was published in 2016 imposing stricter requirements for the marketing and sale of medical devices and grants Notified Bodies increased post-market surveillance authority. The Company is monitoring the implementation of the regulation and has undertaken initial actions to move toward compliance based on the published draft of the regulation. The Company’s failure to comply with any marketing or sales regulations or any other applicable regulatory requirements could adversely affect our business, results of operations, financial condition and/or liquidity.
In the recent past, medical device manufacturers have been the subject of investigations from government agencies related to their relationships with doctors, product sales and marketing and off-label promotion of products, among other activities or practices. If an enforcement action involving the Company were to occur, it could result in penalties, fines, detainment, seizures, recalls, product bans, operating restrictions (which may include loss of a license or authorization), the exclusion of our products from reimbursement under government-funded programs and/or prohibitions on our ability to sell our products, and could have a material adverse effect on our business, results of operations, financial condition and/or liquidity. In addition, remediation of any issues identified by the FDA or other regulators could require facility upgrades, process changes, additional labeling requirements or other measures, any of which could have a material adverse effect on our business and/or results of operations. See Item 3. “Legal Proceedings” below for a description of the subpoenas and Civil Investigation Demands from a number of State Attorneys General and investigative subpoena from the Department of Defense, in each case, seeking information related to certain of the Company’s products.
In addition, lawsuits by or otherwise involving employees, customers, licensors, licensees, suppliers, vendors, business partners, distributors, shareholders or competitors with respect to how we conduct our business could be very costly and could substantially disrupt our business. Disputes from time-to-time with companies or individuals are not uncommon, and we cannot assure you that we will be able to resolve these disputes on terms favorable to us. See Item 3. “Legal Proceedings” below for a description of lawsuits against the Company. The occurrence of an adverse monetary or equitable judgment or a large expenditure in connection with a settlement of any of these matters could have a material adverse effect on our business, results of operations, financial condition and/or liquidity.
We are subject to healthcare fraud and abuse regulations that could result in significant liability, require us to change our business practices and restrict our operations in the future.
We are subject to various federal, state and local laws targeting fraud and abuse in the healthcare industry, including anti-kickback and false claims laws. Violations of these laws are punishable by criminal or civil sanctions, including substantial fines, imprisonment and exclusion from participation in healthcare programs such as Medicare and Medicaid and health programs outside the United States. These laws and regulations are wide ranging and subject to changing interpretation and application, which could restrict our sales or marketing practices. Furthermore, since many of our customers rely on reimbursement from Medicare, Medicaid and other governmental programs to cover a substantial portion of their expenditures, our exclusion from such programs as a result of a violation of these laws could have a material adverse effect on our business, results of operations, financial condition and cash flow.
27
If we or some of our suppliers fail to comply with the FDA’s Quality System Regulation, or QSR, and other applicable postmarket requirements, our manufacturing operations could be disrupted, our product sales and profitability could suffer, and we may be subject to a wide variety of FDA enforcement actions.
After a device is placed on the market, numerous regulatory requirements apply. We are subject to inspection and marketing surveillance by the FDA to determine our compliance with all regulatory requirements. Our failure to comply with applicable regulatory requirements could result in the FDA or a court instituting a wide variety of enforcement actions against us, including a public "Warning Letter"; an order to shut down some or all manufacturing operations; a recall of products; fines or civil penalties; seizure or detention of our products; refusing our requests for 510(k) clearance or a PMA of new or modified products; withdrawing 510(k) clearance or PMA approvals already granted to us; and criminal prosecution.
Our manufacturing processes and those of some of our suppliers must comply with the FDA’s Quality System Regulation, or QSR, which governs the methods used in, and the facilities and controls used for, the design, testing, manufacture, control, quality assurance, installation, servicing, labeling, packaging, storage and shipping of medical devices. The FDA enforces the QSR through unannounced inspections. If we, or one of our suppliers, fail a QSR inspection, or if a corrective action plan adopted by us or one of our suppliers is not sufficient, the FDA may bring an enforcement action, and our operations could be disrupted and our manufacturing delayed. We are also subject to the FDA’s general prohibition against promoting our products for unapproved or “off-label” uses, the FDA’s adverse event reporting requirements and the FDA’s reporting requirements for field correction or product removals. The FDA has recently placed increased emphasis on its scrutiny of compliance with the QSR and these other postmarket requirements.
If we, or one of our suppliers, violate the FDA’s requirements or fail to take adequate corrective action in response to any significant compliance issue raised by the FDA, the FDA can take various enforcement actions which could cause our product sales and profitability to suffer.
In addition, most other countries require us and our suppliers to comply with manufacturing and quality assurance standards for medical devices that are similar to those in force in the United States before marketing and selling our products in those countries. If we, or our suppliers, should fail to do so, we would lose our ability to market and sell our products in those countries.
If we cannot obtain and maintain marketing clearance or approval from governmental agencies, we will not be able to sell our products.
Our products are medical devices that are subject to extensive regulation in the United States and in the foreign countries in which they are sold. Unless an exemption applies, each medical device that we wish to market in the United States must receive either 510(k) clearance or premarket approval (PMA) from the FDA before the product can be sold. Either process can be lengthy and expensive. The FDA’s 510(k) clearance procedure, also known as “premarket notification,” is the process we have used for our current products. This process usually takes from four to twelve months from the date the premarket notification is submitted to the FDA, but may take significantly longer. Although we have obtained 510(k) clearances for our current products, our clearances may be revoked by the FDA if safety or effectiveness problems develop with the devices. The PMA process is much more costly, lengthy and uncertain. It generally takes from one to three years from the date the application is submitted to, and filed with the FDA, and may take even longer. Regulatory regimes in other countries similarly require approval or clearance prior to our marketing or selling products in those countries. We rely on our distributors to obtain regulatory clearances or approvals of our products outside of the United States. If we are unable to obtain additional clearances or approvals needed to market existing or new products in the United States or elsewhere or obtain these clearances or approvals in a timely fashion or at all, or if our existing clearances are revoked, our revenues and profitability may decline.
Modifications to our current products may require new marketing clearances or approvals or require us to cease marketing or recall the modified products until such clearances or approvals are obtained.
Any modification to an FDA-cleared medical device that could significantly affect its safety or effectiveness, or that would constitute a major change or modification in its intended use, requires a new FDA 510(k) clearance or, possibly, a premarket approval. The FDA requires every manufacturer to make its own determination as to whether a modification requires a new 510(k) clearance or premarket approval, but the FDA may review and disagree with any decision reached by the manufacturer. We have modified aspects of some of our devices since receiving regulatory clearance. We believed that some of these modifications did not require new 510(k) clearance or premarket approval and, therefore, we did not seek new 510(k) clearances or premarket approvals. In the future, we may make additional modifications to our products after they have received FDA clearance or approval and, in appropriate circumstances, determine that new clearance or approval is unnecessary. Regulations in other countries in which we market or sell, or propose to market or sell, our products may also
28
require that we make judgments about changes to our products and whether or not those changes are such that regulatory approval or clearance should be obtained. In the United States and elsewhere, regulatory authorities may disagree with our past or future decisions not to seek new clearance or approval and may require us to obtain clearance or approval for modifications to our products. If that were to occur for a previously cleared or approved product, we may be required to cease marketing or recall the modified device until we obtain the necessary clearance or approval. Under these circumstances, we may also be subject to significant regulatory fines or other penalties. If any of the foregoing were to occur, our financial condition and results of operations could be negatively impacted.
Even after receiving regulatory clearance or approval, our products may be subject to product recalls, which may harm our reputation and divert managerial and financial resources.
The FDA and similar governmental authorities in other countries have the authority to order mandatory recall of our products or order their removal from the market if there are material deficiencies or defects in design, manufacture, installation, servicing or labeling of the device, or if the governmental entity finds that our products would cause serious adverse health consequences. A government mandated voluntary recall or field action by us could occur as a result of component failures, manufacturing errors or design defects, including labeling defects. Any recall of our products may harm our reputation with customers and divert managerial and financial resources.
We may be subject to fines, penalties, injunctions or costly investigations if we are determined to be promoting the use of our products for unapproved or “off-label” uses.
If we are incorrect in our belief that our promotional materials and training methods regarding physicians are conducted in compliance with regulations of the FDA and other applicable regulations, and the FDA determines that our promotional materials or training constitutes promotion of an unapproved use, the FDA could request that we modify our training or promotional materials or subject us to regulatory enforcement actions, including the issuance of a warning letter, injunction, seizure, civil fine and criminal penalties. It is also possible that other federal, state or foreign enforcement authorities might take action if they consider promotional or training materials to constitute promotion of an unapproved use, which could result in significant fines or penalties under other statutory authorities, such as laws prohibiting false claims for reimbursement. Any of these results could have a material adverse effect on our financial position or results of operations.
In June 2014 we received a subpoena from the U.S. Department of Justice (the “DOJ”) requesting documents in relation to a criminal and civil investigation the DOJ is conducting regarding BTG International, Inc.’s LC Bead product beginning in 2003. RITA Medical Systems and AngioDynamics, Inc., after our acquisition of RITA, was the exclusive distributor of LC Beads in the United States from 2006 through December 31, 2011. We are cooperating fully with this investigation and at this time are unable to predict its scope, duration or outcome. In April 2015 we received a subpoena from the DOJ requesting documents in relation to a criminal and civil investigation the DOJ is conducting regarding purported promotion of certain of our VenaCure EVLT products for un-cleared indications. As of May 31, 2017 the Company accrued $12.5 million for these matters and in August 2017, the Company agreed in principle with the government to resolve these matters for approximately $12.5 million.
If our employees or agents violate the U.S. Foreign Corrupt Practices Act or anti-bribery laws in other jurisdictions, we may incur fines or penalties, or experience other adverse consequences.
We are subject to the U.S. Foreign Corrupt Practices Act, or FCPA, and similar anti-bribery laws in international jurisdictions, including the UK Anti-Bribery Act, which generally prohibit companies and their intermediaries from making improper payments to non-U.S. officials for the purpose of obtaining or retaining business. Because of the predominance of government-sponsored healthcare systems around the world, many of our customer relationships outside of the United States are with governmental entities and are therefore subject to such anti-bribery laws. Our sales to customers and distributors outside of the United States have been increasing and we expect them to continue to increase in the future. If our employees or agents violate the provisions of the FCPA or other anti-bribery laws, we may incur fines or penalties, we may be unable to market our products in other countries or we may experience other adverse consequences which could have a material adverse effect on our operating results or financial condition.
Laws and regulations governing the export of our products could adversely impact our business.
The U.S. Department of the Treasury’s Office of Foreign Assets Control (OFAC), and the Bureau of Industry and Security at the U.S. Department of Commerce (BIS), administer certain laws and regulations that restrict U.S. persons and, in some instances, non-U.S. persons, in conducting activities, transacting business with or making investments in certain countries, governments, entities and individuals subject to U.S. economic sanctions. Due to our international operations, we are subject to
29
such laws and regulations, which are complex, restrict our business dealings with certain countries and individuals, and are constantly changing. Further restrictions may be enacted, amended, enforced or interpreted in a manner that materially impacts our operations.
From time to time, certain of our subsidiaries have limited business dealings in countries subject to comprehensive sanctions, including Iran, Sudan, Syria, Cuba and those in the region of Crimea. Certain of our subsidiaries sell medical devices and surgical tools, and may provide related services, to distributors and other purchasing bodies in such countries. These business dealings represent an insignificant amount of our consolidated revenues and income, but expose us to a heightened risk of violating applicable sanctions regulations. Violations of these regulations are punishable by civil penalties, including fines, denial of export privileges, injunctions, asset seizures, debarment from government contracts and revocations or restrictions of licenses, as well as criminal fines and imprisonment. We have established policies and procedures designed to assist with our compliance with such laws and regulations. However, there can be no assurance that our policies and procedures will effectively prevent us from violating these regulations in every transaction in which we may engage, and such a violation could adversely affect our reputation, business, financial condition, results of operations and cash flows.
Changes in reimbursement levels by governmental or other third-party payors for procedures using our products may cause our revenues to decline.
Our products are purchased principally by hospitals or physicians which typically bill various third-party payors, such as governmental programs (e.g. Medicare, Medicaid and comparable foreign programs), private insurance plans and managed care plans, for the healthcare services provided to their patients. The ability of our customers to obtain appropriate reimbursement for products and services from third-party payors is critical to the success of medical device companies because it affects which products customers purchase and the prices they are willing to pay. Reimbursement varies by country and can significantly impact the acceptance of new technology. Implementation of healthcare reforms in the United States and in other countries may limit, reduce or eliminate reimbursement for our products and adversely affect both our pricing flexibility and the demand for our products. Even when we develop a promising new product, we may find limited demand for the product unless reimbursement approval is obtained from private and governmental third party payors.
Third-party payors have adopted, and are continuing to adopt, a number of healthcare policies intended to curb rising healthcare costs. These policies include:
|
•
|
controls on government-funded reimbursement for healthcare services and price controls on medical products and services providers;
|
|
•
|
challenges to the pricing of medical procedures or limits or prohibitions on reimbursement for specific devices and therapies through other means; and
|
|
•
|
the introduction of managed care systems in which healthcare providers contract to provide comprehensive healthcare for a fixed cost per person.
|
We are unable to predict whether federal, state or local healthcare reform legislation or regulation affecting our business may be proposed or enacted in the future, or what effect any such legislation or regulation would have on our business. Changes in healthcare systems in the United States or elsewhere in a manner that significantly reduces reimbursement for procedures using our medical devices or denies coverage for these procedures, or adverse decisions relating to our products by administrators of these systems in coverage or reimbursement issues, would have an adverse impact on the acceptance of our products and the prices which our customers are willing to pay for them.
RISKS RELATED TO INTELLECTUAL PROPERTY
If we fail to adequately protect our intellectual property rights, we may not be able to generate revenues from new or existing products and our business may suffer.
Our success depends in part on obtaining, maintaining and enforcing our patents, trademarks and other proprietary rights, and our ability to avoid infringing the proprietary rights of others. We take precautionary steps to protect our technological advantages and intellectual property. We rely upon patent, trade secret, copyright, know-how and trademark laws, as well as license agreements and contractual provisions, to establish our intellectual property rights and protect our products. However, no assurances can be made that any pending or future patent applications will result in the issuance of patents, that any current or future patents issued to, or licensed by, us will not be challenged or circumvented by our competitors, or that our patents will not be found invalid.
30
Patent positions of medical device companies, including our Company, are uncertain and involve complex and evolving legal and factual questions. The coverage sought in a patent application can be denied or significantly reduced either before or after the patent is issued. Consequently, there can be no assurance that any of our pending patent applications will result in an issued patent. There is also no assurance that any existing or future patent will provide significant protection or commercial advantage, or whether any existing or future patent will be circumvented by a more basic patent, thus requiring us to obtain a license to produce and sell the product. Generally, patent applications can be maintained in secrecy for at least 18 months after their earliest priority date. In addition, publication of discoveries in the scientific or patent literature often lags behind actual discoveries. Therefore, we cannot be certain that we were the first to invent the subject matter covered by each of our pending U.S. patent applications or that we were the first to file non-U.S. patent applications for such subject matter.
Additionally, we rely on trade secret protection for certain unpatented aspects of our proprietary technology. There can be no assurance that others will not independently develop or otherwise acquire substantially equivalent proprietary information or techniques, that others will not gain access to our proprietary technology or disclose such technology, or that we can meaningfully protect our trade secrets. We have a policy of requiring key employees and consultants to execute confidentiality agreements upon the commencement of an employment or consulting relationship with us. Our confidentiality agreements also require our employees to assign to us all rights to any inventions made or conceived during their employment with us. We also generally require our consultants to assign to us any inventions made during the course of their engagement by us. There can be no assurance, however, that these agreements will provide meaningful protection or adequate remedies for us in the event of unauthorized use, transfer or disclosure of confidential information or inventions.
If we are not able to adequately protect our intellectual property, our market share, financial condition and results of operations may suffer.
If third parties claim that our products infringe their intellectual property rights, we may be forced to expend significant financial resources and management time defending against such actions and our financial condition and our results of operations could suffer.
Third parties may claim that our products infringe their patents and other intellectual property rights. Identifying third-party patent rights can be particularly difficult because, in general, patent applications can be maintained in secrecy for at least 18 months after their earliest priority date. Some companies in the medical device industry have used intellectual property infringement litigation to gain a competitive advantage. If a competitor were to challenge our patents, licenses or other intellectual property rights, or assert that our products infringe its patent or other intellectual property rights, we could incur substantial litigation costs, be forced to make expensive changes to our product design, pay royalties or other fees to license rights in order to continue manufacturing and selling our products, or pay substantial damages. Third-party infringement claims, regardless of their outcome, would not only consume our financial resources but also divert our management’s time and effort. Such claims could also cause our customers or potential customers to purchase competitors’ products or defer or limit their purchase or use of our affected products until resolution of the claim.
RISKS RELATED TO OUR STOCK PRICE
Our future operating results are difficult to predict and may vary significantly from quarter to quarter, which may adversely affect the price of our common stock.
The ongoing introduction of new products and services that affect our overall product mix make the prediction of future operating results difficult. You should not rely on our past results as any indication of future operating results. The price of our common stock will likely fall in the event that our operating results do not meet the expectations of analysts and investors. Comparisons of our quarterly operating results are an unreliable indication of our future performance because they are likely to vary significantly based on many factors, including:
|
•
|
the level of sales of our products and services in our markets;
|
|
•
|
our ability to introduce new products or services and enhancements in a timely manner;
|
|
•
|
the demand for and acceptance of our products and services;
|
|
•
|
the success of our competition and the introduction of alternative products or services;
|
|
•
|
our ability to command favorable pricing for our products and services;
|
|
•
|
the growth of the market for our devices and services;
|
|
•
|
the expansion and rate of success of our direct sales force in the United States and internationally and our independent distributors internationally;
|
|
•
|
actions relating to ongoing FDA compliance;
|
|
•
|
the effect of intellectual property disputes;
|
31
|
•
|
the size and timing of orders from independent distributors or customers;
|
|
•
|
the attraction and retention of key personnel, particularly in sales and marketing, regulatory, manufacturing and research and development;
|
|
•
|
unanticipated delays or an inability to control costs;
|
|
•
|
general economic conditions as well as those specific to our customers and markets; and
|
|
•
|
seasonal fluctuations in revenue due to the elective nature of some procedures.
|
Our stock price may be volatile, which may cause the value of our stock to decline or subject us to a securities class action litigation.
The trading price of our common stock price may be volatile and could be subject to wide fluctuations in price in response to various factors, many of which are beyond our control, including:
|
•
|
general economic, industry and market conditions;
|
|
•
|
actions by institutional or other large stockholders;
|
|
•
|
the depth and liquidity of the market for our common stock;
|
|
•
|
volume and timing of orders for our products;
|
|
•
|
developments generally affecting medical device companies;
|
|
•
|
the announcement of new products or product enhancements by us or our competitors;
|
|
•
|
changes in earnings estimates or recommendations by securities analysts;
|
|
•
|
investor perceptions of us and our business, including changes in market valuations of medical device companies; and
|
|
•
|
our results of operations and financial performance.
|
In addition, the stock market in general, and the NASDAQ Stock Market and the market for medical devices in particular, have experienced substantial price and volume volatility that is often seemingly unrelated to the operating performance of particular companies. These broad market fluctuations may cause the trading price of our common stock to decline. In the past, securities class action litigation has often been brought against a company after a period of volatility in the market price of its common stock. We may become involved in this type of litigation in the future. Any securities litigation claims brought against us could result in substantial expense and the diversion of management’s attention from our business.
We may not attain the guidance set forth in the three-year plan that was presented to our investors in April 2017 which could have an adverse impact on our stock price.
In April 2017, guidance targets for revenue, adjusted earnings per share, adjusted EBITDAS, free cash flow, adjusted gross margin and leverage for the next three years were presented to our investors. If we do not achieve this guidance this could have an adverse effect on our stock price as investors could begin to lose confidence in the performance of the Company and its ability to forecast and execute.
|
Item 1B.
|
Unresolved Staff Comments.
|
None.
32
|
Item 2.
|
Properties.
|
During the year ended
May 31, 2017
, we operated in the following locations:
|
Location
|
Purpose
|
Approx.
Sq. Ft.
|
Property
Type
|
||||
|
Latham, NY
|
Corporate headquarters
|
55,000
|
|
Leased
|
|||
|
Glens Falls, NY
|
Manufacturing
|
189,000
|
|
Owned
|
|||
|
Queensbury, NY
|
Manufacturing and distribution
|
129,000
|
|
Owned
|
|||
|
Manchester, GA
*
|
Manufacturing and distribution
|
60,000
|
|
Leased
|
|||
|
Marlborough, MA
|
Research & Development
|
31,000
|
|
Leased
|
|||
|
Denmead, U.K.
*
|
Manufacturing
|
7,500
|
|
Leased
|
|||
|
Amsterdam, NL
|
Selling, Marketing & Administrative
|
10,100
|
|
Leased
|
|||
In addition, we lease sales offices in various other jurisdictions.
*These two locations will be closed as part of the Operational Consolidation strategy during fiscal year 2018.
33
|
Item 3.
|
Legal Proceedings.
|
C.R. Bard, Inc. v. AngioDynamics, Inc.
On January 11, 2012, C.R. Bard, Inc. (“Bard”) filed a suit in the United States District Court of Utah claiming certain of our implantable port products infringe on three U.S. patents held by Bard (the "Utah Action"). Bard is seeking unspecified damages and other relief. The Court denied Bard’s motion for pre-trial consolidation with separate actions it filed on the same day against Medical Components, Inc. and Smiths Medical ASD, Inc., but had asked for supplemental briefing on the issue of whether to conduct a common Markman hearing. Meanwhile, we filed petitions for reexamination in the US Patent and Trademark Office ("PTO") which seek to invalidate all
three
patents asserted by Bard in the litigation. Our petitions were granted and
40 of Bard's 41 patent
claims were rejected and, following further proceedings, the Patent Office issued a Final Rejection of all
40
claims subject to reexamination. Thereafter, Bard filed appeals to the PTO Board of Appeals and Interferences for all
three
reexams. The parties completed briefing on the appeals and oral argument was held on June 18, 2015. The Patent Office issued decisions in the three appeals. In one (issued on March 11, 2016 for US Patent No. 7,785,302), the rejections of
six
of the
ten
claims under reexamination were affirmed, but were reversed on
four
of the ten claims. In the second (issued on March 24, 2016 for U.S. Patent No. 7,959,615), the rejections of
eight
of the
ten
claims under reexamination were affirmed but the rejections of the other
two
of the ten claims were reversed. In the third (issued on March 29 for U.S. Patent No. 7,947.022) the rejections of all
twenty
claims under reexamination were affirmed. Bard then filed Requests for Rehearing in all
three
reexamination appeals and the Company filed Requests for Rehearing in
two
of the reexamination appeals (the ‘302 and ‘615 patent reexaminations). Each party filed comments in Opposition to the other party’s Rehearing Requests,. The PTO has since issued decisions denying all Rehearing Requests - - on February 1, 2017 for the ‘302; on February 17, 2017 for the ‘022; and on February 21, 2017 for the ‘615. In the ‘302 and ‘022, the PTO modified its characterization of one prior art reference. Bard has since filed a Notice of Appeal to the Federal Circuit Court of Appeals in all three reexams and we filed Cross-Appeals in the ‘302 and the ‘615 reexams. The parties are in the process of preparing and filing the various appellate briefs, starting with Bard’s Opening Brief which is currently due on July 31, 2017 and ending with our Reply Brief which is currently due on November 6, 2017.
The Utah Action has been stayed pending final resolution of the PTO process. We believe these claims are without merit and intend to defend them vigorously. We have not recorded an expense related to the outcome of this litigation because it is not yet possible to determine if a potential loss is probable nor reasonably estimable.
On March 10, 2015, C.R. Bard, Inc. and Bard Peripheral Vascular, Inc. (“Bard”) filed suit in the United States District Court for the District of Delaware claiming certain of our implantable port products infringe on
three
U.S. patents held by Bard (the “Delaware Action). Bard is seeking unspecified damages and other relief. The patents asserted in the Delaware Action are different than those asserted in the Utah Action. On June 1, 2015, we filed
two
motions in response to Bard’s Complaint - one sought transfer to the District of Utah where the Utah Action is currently pending, and the other sought dismissal of the entire complaint on grounds that none of the claims in the asserted patents is directed to patent eligible subject matter under Section 101 of the Patent Statute and in light of recent authority from the U. S. Supreme Court. On January 12, 2016, the court issued a decision denying both motions. We have since served an Answer and Counterclaim to which Bard has served a Reply. On March 10, 2016, the Court held a case management conference, and, on March 14, 2016, the court entered a Scheduling Order which set, inter alia, a Markman hearing for March 10, 2017, a summary judgment hearing for December 8, 2017 and trial for March 12, 2018. The parties have served various discovery requests on each other, and have been producing documents to each other; on May 27, 2016 Bard served its Infringement Contentions which identified all the port products accused of infringement; and, on June 24, 2016, we served Invalidity Contentions which detail various grounds for invalidating the three asserted patents. The parties completed briefing on the claim construction issues and the Markman hearing was held on March 10, 2017. A decision is expected on or about May 12, 2017, and the Court issued its Claim Construction Order on May 19, 2017. The Court has since amended the Scheduling Order to provide for the completion of Expert Discovery on October 30, 2017; briefing on Case-Dispositive Motions between November 17, 2017 and January 24, 2018 with oral argument set for February 22, 2018 and trial to commence May 29, 2018.
We believe these claims are without merit and intend to defend them vigorously. We have not recorded an expense related to the outcome of this litigation because it is not yet possible to determine if a potential loss is probable nor reasonably estimable.
AngioDynamics, Inc. v. C.R. Bard, Inc.
On May 30, 2017, we commenced an action in the United States District Court for the Northern District of New York entitled AngioDynamics, Inc. v. C.R. Bard, Inc. and Bard Access Systems, Inc. (“Bard”). In this action, we allege that Bard has illegally tied the sales of its tip location systems to the sales of its PICCs. We allege that this practice violates the federal antitrust laws and has had, and continues to have, an anti-competitive effect in the market for PICCs. We seek both monetary damages and injunctive relief. The Court has set an initial case management conference for August 29, 2017.
34
Governmental Investigations
In June 2014 we received a subpoena from the U.S. Department of Justice (the “DOJ”) requesting documents in relation to a criminal and civil investigation the DOJ is conducting regarding BTG International, Inc.’s LC Bead® product beginning in 2003. RITA Medical Systems and AngioDynamics, Inc., after its acquisition of RITA, was the exclusive distributor of LC Beads in the United States from 2006 through December 31, 2011. We are cooperating fully with this investigation.
In April 2015 we received a subpoena from the DOJ requesting documents in relation to a criminal and civil investigation the DOJ is conducting regarding purported promotion of certain of AngioDynamics’ VenaCure EVLT products for un-cleared indications. We are cooperating fully with this investigation.
As of May 31, 2017 the Company accrued $12.5 million for these matters and in August 2017, the Company agreed in principle with the government to resolve these matters for approximately $12.5 million.
|
Item 4.
|
Mine Safety Disclosures.
|
Not applicable.
|
Item 5.
|
Market for Registrant’s Common Equity, Related Stockholder Matters, and Issuer Purchases of Equity Securities.
|
Our common stock is traded on The Global Select Market tier of The NASDAQ Stock Market LLC (formerly the Nasdaq National Market), under the symbol “ANGO.”
The following table sets forth, for the fiscal quarters indicated, the high and low sale prices for our common stock as reported by The NASDAQ Stock Market.
|
|
Sale Price
|
||||||
|
|
High
|
Low
|
|||||
|
Year ended May 31, 2017
|
|||||||
|
Fourth Quarter
|
$
|
17.58
|
|
$
|
15.08
|
|
|
|
Third Quarter
|
$
|
17.81
|
|
$
|
15.89
|
|
|
|
Second Quarter
|
$
|
17.54
|
|
$
|
15.40
|
|
|
|
First Quarter
|
$
|
16.83
|
|
$
|
12.16
|
|
|
|
|
Sale Price
|
||||||
|
|
High
|
Low
|
|||||
|
Year ended May 31, 2016
|
|||||||
|
Fourth Quarter
|
$
|
12.72
|
|
$
|
10.76
|
|
|
|
Third Quarter
|
$
|
12.70
|
|
$
|
10.02
|
|
|
|
Second Quarter
|
$
|
14.87
|
|
$
|
11.24
|
|
|
|
First Quarter
|
$
|
16.80
|
|
$
|
14.31
|
|
|
As of August 2, 2017, there were 197 holders of record of our common stock.
Dividends
We did not declare any cash dividends on our common stock during our last three fiscal years. We do not anticipate paying any cash dividends on our common stock for the foreseeable future.
Performance Graph
The graph below matches AngioDynamics, Inc.’s cumulative 5-year total shareholder return on common stock with the cumulative total returns of the NASDAQ Composite index, the RDG SmallCap Medical Devices index, and the NASDAQ Medical Equipment index. The graph tracks the performance of a $100 investment in our common stock and in each index
35
(with the reinvestment of all dividends) from May 31, 2012 to May 31, 2017. The stock price performance included in this graph is not necessarily indicative of future stock price performance.
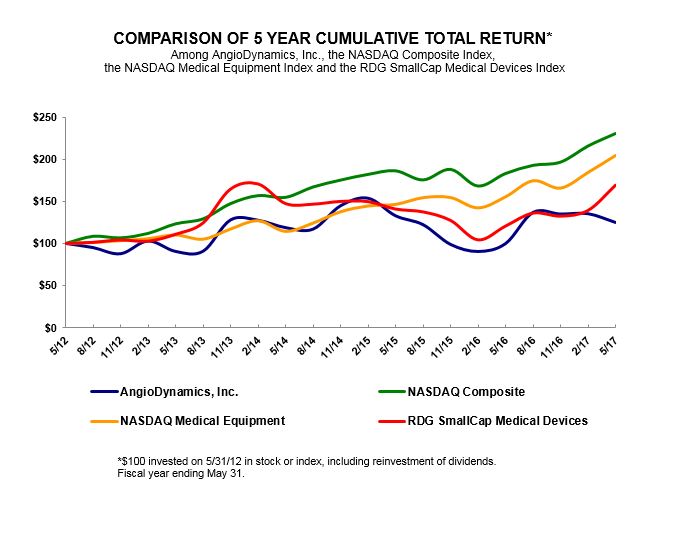
36
|
Item 6.
|
Selected Financial Data.
|
You should read the following selected financial data in conjunction with our consolidated financial statements and the related notes and “Management’s Discussion and Analysis of Financial Condition and Results of Operations” included elsewhere in this Annual Report on Form 10-K.
The consolidated statements of operations data for the fiscal years ended
May 31, 2017
,
May 31, 2016
, and
May 31, 2015
, and the consolidated balance sheet data as of
May 31, 2017
and
May 31, 2016
, are derived from the consolidated financial statements that are included elsewhere in this Annual Report on Form 10-K. The consolidated statements of operations data for the fiscal years ended
May 31, 2014
and May 31, 2013, and the consolidated balance sheet data as of
May 31, 2015
,
May 31, 2014
and May 31, 2013, are derived from our audited consolidated financial statements not included in this Annual Report on Form 10-K. Historical results are not necessarily indicative of the results of operations to be expected for future periods. See Note 14 of “Notes to Consolidated Financial Statements” for a description of the method that we used to compute our historical basic and diluted net income per share attributable to common stockholders.
|
|
Year ended May 31,
|
||||||||||||||||||
|
(in thousands, except per share information)
|
2017
|
2016
|
2015
|
2014
|
2013
|
||||||||||||||
|
|
|||||||||||||||||||
|
Net sales
|
$
|
349,643
|
|
$
|
353,890
|
|
$
|
356,534
|
|
$
|
354,425
|
|
$
|
341,916
|
|
||||
|
Gross profit (exclusive of intangible amortization)
|
176,169
|
|
174,316
|
|
175,796
|
|
180,174
|
|
168,514
|
|
|||||||||
|
Operating expenses
|
|||||||||||||||||||
|
Research and development
|
25,269
|
|
25,053
|
|
26,594
|
|
28,124
|
|
26,091
|
|
|||||||||
|
Sales and marketing
|
78,819
|
|
83,743
|
|
82,351
|
|
85,696
|
|
77,790
|
|
|||||||||
|
General and administrative
|
31,406
|
|
30,583
|
|
30,031
|
|
26,511
|
|
25,809
|
|
|||||||||
|
Amortization of intangibles
|
17,296
|
|
17,964
|
|
17,966
|
|
16,562
|
|
16,599
|
|
|||||||||
|
Change in fair value of contingent consideration
|
(15,261
|
)
|
948
|
|
(8,096
|
)
|
(1,908
|
)
|
1,583
|
|
|||||||||
|
Acquisition, restructuring and other items, net (a)
|
27,510
|
|
12,591
|
|
26,257
|
|
10,873
|
|
13,800
|
|
|||||||||
|
Medical device excise tax
|
(1,837
|
)
|
2,416
|
|
4,142
|
|
3,829
|
|
1,600
|
|
|||||||||
|
Total operating expenses
|
163,202
|
|
173,298
|
|
179,245
|
|
169,687
|
|
163,272
|
|
|||||||||
|
Operating income (loss)
|
12,967
|
|
1,018
|
|
(3,449
|
)
|
10,487
|
|
5,242
|
|
|||||||||
|
Total other (expenses), net
|
(3,120
|
)
|
(4,271
|
)
|
(4,682
|
)
|
(5,301
|
)
|
(6,579
|
)
|
|||||||||
|
Net income (loss)
|
$
|
5,008
|
|
$
|
(43,590
|
)
|
$
|
(3,388
|
)
|
$
|
2,347
|
|
$
|
(1,051
|
)
|
||||
|
Earnings (loss) per share
|
|||||||||||||||||||
|
Basic
|
$
|
0.14
|
|
$
|
(1.21
|
)
|
$
|
(0.09
|
)
|
$
|
0.07
|
|
$
|
(0.03
|
)
|
||||
|
Diluted
|
$
|
0.14
|
|
$
|
(1.21
|
)
|
$
|
(0.09
|
)
|
$
|
0.07
|
|
$
|
(0.03
|
)
|
||||
|
(a)
|
Acquisition, restructuring and one-time items include restructuring expenses or expenses incurred as part of M&A, product discontinuance, legal settlements and legal costs that are related to litigation that is not in the ordinary course of business.
|
37
|
|
As of May 31,
|
||||||||||||||||||
|
(in thousands)
|
2017
|
2016
|
2015
|
2014
|
2013
|
||||||||||||||
|
|
|||||||||||||||||||
|
Cash, cash equivalents and marketable securities
|
$
|
48,759
|
|
$
|
33,986
|
|
$
|
20,080
|
|
$
|
17,914
|
|
$
|
23,955
|
|
||||
|
Working capital
|
82,398
|
|
79,527
|
|
90,283
|
|
81,071
|
|
71,643
|
|
|||||||||
|
Total assets
|
707,961
|
|
726,194
|
|
773,058
|
|
798,576
|
|
790,561
|
|
|||||||||
|
Long-term debt, including current portion
(1)
|
96,320
|
|
120,541
|
|
137,660
|
|
142,660
|
|
142,500
|
|
|||||||||
|
Contingent consideration
(2)
|
12,761
|
|
38,275
|
|
47,384
|
|
67,231
|
|
75,049
|
|
|||||||||
|
Total long-term liabilities
|
121,418
|
|
152,239
|
|
167,444
|
|
195,750
|
|
201,317
|
|
|||||||||
|
Total stockholders’ equity
|
515,027
|
|
507,228
|
|
545,099
|
|
536,885
|
|
526,324
|
|
|||||||||
(1) See Note 1 for adoption of new accounting standard.
(2) See Note 3 for explanation on the change.
|
Item 7.
|
Management’s Discussion and Analysis of Financial Conditions and Results of Operations.
|
The following information should be read together with the audited consolidated financial statements and the notes thereto and other information included elsewhere in this annual report on Form 10-K.
Forward-Looking Statements
This Annual Report on Form 10-K, including the sections entitled “Management’s Discussion and Analysis of Financial Condition and Results of Operations”, contains forward-looking statements within the meaning of the Private Securities Litigation Reform Act of 1995. All statements regarding AngioDynamics’ expected future financial position, results of operations, cash flows, business strategy, budgets, projected costs, capital expenditures, products, competitive positions, growth opportunities, acquisitions, plans and objectives of management for future operations, as well as statements that include the words such as “expects,” “reaffirms,” “intends,” “anticipates,” “plans,” “believes,” “seeks,” “estimates,” or variations of such words and similar expressions, are forward-looking statements. These forward looking statements are not guarantees of future performance and are subject to risks and uncertainties. Investors are cautioned that actual events or results may differ from our expectations. Factors that may affect the actual results include, without limitation, our ability to develop our existing and new products, future actions by the FDA or other regulatory agencies, results of pending or future clinical trials, the results of ongoing litigation, overall economic conditions, general market conditions, market acceptance, foreign currency exchange rate fluctuations, the effects on pricing from group purchasing organizations and competition, the loss of any of our key customers or reduction in the purchase of our products by any such customers, and our ability to integrate acquired businesses as well as the risk factors listed in Part I, Item 1A of this Annual Report on Form 10-K.
Although we believe that the assumptions underlying the forward-looking statements contained herein are reasonable, any of the assumptions could be inaccurate and, therefore, there can be no assurance that the forward-looking statements included in this Annual Report on Form 10-K will prove to be accurate. In light of the significant uncertainties inherent in the forward-looking statements included herein, the inclusion of such information should not be regarded as a representation by us or any other person that our objectives and plans will be achieved. Any forward-looking statements are made pursuant to the Private Securities Litigation Reform Act of 1995 and, as such, speak only as of the date made. We disclaim any obligation to update the forward-looking statements. Investors are cautioned not to place undue reliance on these forward-looking statements which speak only as of the date stated, or if no date is stated, as of the date of this document.
EXECUTIVE OVERVIEW
Company and Market
We design, manufacture and sell a wide range of medical, surgical and diagnostic devices used by professional healthcare providers for vascular access, for the treatment of peripheral vascular disease and for use in oncology and surgical settings. Our devices are generally used in minimally invasive, image-guided procedures. Most of our products are intended to be used once and then discarded, or they may be temporarily implanted for short- or longer-term use.
Our business operations cross a variety of markets. Our financial performance is impacted by changing market dynamics, which have included an emergence of value-based purchasing by healthcare providers, consolidation of healthcare providers,
38
the increased role of the consumer in health care decision-making and an aging population, among others. In addition, our growth is impacted by changes within our sector, such as the merging of competitors to gain scale and influence; changes in the regulatory environment for medical device; and fluctuations in the global economy.
Our sales and profitability growth also depends, in part, on the introduction of new and innovative products, together with ongoing enhancements to our existing products. Expansions to our product offerings are created through internal product development, technology licensing and strategic alliances. We recognize the importance of, and intend to continue to make investments in, research and development activities and business development opportunities and feel confident that our existing capital structure and free cash flow generation will allow us to properly fund those activities.
We sell our products in the United States through a direct sales force, and outside the U.S. through a combination of a direct sales and distributor relationships. We expect our businesses to grow in both sales and profitability through geographic expansion, market penetration, new product introductions and increasing our direct presence internationally.
Strategic Initiatives to Drive Growth
Throughout the year, we introduced strategic moves designed to streamline our business, improve our overall business operations and position ourselves for growth. Those initiatives included:
|
•
|
Introduction of new corporate strategy
. As outlined in an Investor Day held in New York City in the fourth quarter, leadership introduced a strategic approach that would include portfolio management with product categories designated into “invest” and “maintain” businesses; continued efforts to improve operational performance; international expansion; and an ability to pursue growth through organic and inorganic opportunities through strong cash generation. In addition to introducing the strategy, the company also put forth projected financial metrics anticipated for the 2018, 2019 and 2020 fiscal years.
|
|
•
|
Operational Consolidation
. The Company announced a planned consolidation of operations from the Manchester, GA and Denmead, UK facilities into the Glens Falls and Queensbury, NY manufacturing facilities in the third quarter. The consolidation will result in streamlined operations, reduced costs, optimized inventory management and gross margin improvement. As part of the plan, the Company expects to incur restructuring expenses, including severance and retention, equipment transfer, set-up and purchases, regulatory expenses, lease termination expenses and other miscellaneous expenses. The plan is expected to be completed in the third quarter of fiscal year 2018.
|
|
•
|
Implementation of a new product development process.
The company introduced a robust product development process intended to improve the Company’s ability to bring new products to market.
|
|
•
|
Rationalization of underperforming or below-cost products
. This initiative eliminated more than 900 SKUs and was partnered with a price increase on products that did not have a profitable cost structure.
|
|
•
|
New members of the executive leadership team
. Following his arrival in April 2016, President and Chief Executive Officer James C. Clemmer welcomed several members to the AngioDynamics leadership team, including Executive Vice President and Chief Financial Officer Michael C. Greiner, Senior Vice President of Quality and Regulatory Affairs Warren G. Nighan, Senior Vice President and General Manager of the Vascular Access Global Business Unit Chad T. Campbell, Senior Vice President and General Manager of the Peripheral Vascular Global Business Unit Robert A. Simpson and Senior Vice President of Human Resources Heather J. Daniels Cariveau.
|
Recent Developments
In addition to the deliberate actions taken by management as listed above, several significant developments occurred over the course of the fiscal year which impacted our business, including:
The Company added two members to the Board of Directors, Eileen Auen and Jan Reed. Auen most recently served as Executive Chairman of Helios, a $1 billion healthcare services firm. Reed most recently was Senior Vice President, General Counsel and Corporate Secretary at Walgreens Boots Alliance.
The Company made the decision to discontinue its investment in the TiLo product that was acquired in August 2013 as part of the Clinical Devices acquisition. This decision resulted in the write-off of the acquired in-process research and development (IPR&D) of
$3.6 million
along with a
$3.1 million
gain from the reduction in the fair value of contingent consideration liability associated with future milestones that will no longer be met.
39
The Company revised the sales projections for the AngioVac product as a result of reviews performed by executive management across all products. The adjustments to the sales projections resulted in a
$13.4 million
gain from the reduction in the fair value of the contingent liability that is based on lower projected sales volume over the contractual earn out period.
The Company decided to terminate its agreements with EmboMedics. The termination of these agreements resulted in a write-off of the initial
$2.0 million
investment in EmboMedics (Note 2).
The Board of Directors approved a share repurchase program (the “Repurchase Program”) under which they authorized the Company the option to repurchase up to
$25.0 million
of its outstanding common stock during the
twenty-four
month period ending November 6, 2018. During the second and fourth quarter of fiscal year 2017, the Company repurchased a total of 870,000 shares of common stock in the open market at an aggregate cost of $13.6 million under the Repurchase Program.
The Company entered into a new credit agreement ("Credit Agreement") which provides for a
$100.0 million
senior secured term loan facility ("Term Loan") and a
$150.0 million
senior secured revolving credit facility ("Revolving Facility", and together with the Term Loan, "The Facilities") along with up to a
$20.0 million
sublimit for letters of credit and a
$5.0 million
limit for swing line loans. With the proceeds from the Credit Agreement, the existing credit facility that was entered into in September 2013 was paid down in full.
The Company announced to employees an Operational Consolidation strategy which included the consolidation of the Manchester, GA and Denmead, UK facilities into the Glens Falls and Queensbury, NY manufacturing facilities. As part of the plan, the Company expects to incur restructuring expenses, including severance and retention, equipment transfer, set-up and purchases, regulatory expenses, lease termination expenses and other miscellaneous expenses. The plan is expected to be completed in the third quarter of fiscal year 2018.
Following completion of the sale of common stock pursuant to the Underwriting Agreement, Avista Capital Partners’ beneficial ownership in AngioDynamics has been reduced to zero as they sold their entire position in AngioDynamics. As a result, in accordance with the terms of his appointment to AngioDynamics’ Board of Directors and the terms of the Stockholders Agreement, David Burgstahler resigned as a director on April 12, 2017.
The Company filed a lawsuit alleging that C.R. Bard has violated federal antitrust laws by illegally tying the sale of its tip location systems to its line of peripherally inserted central catheters. The Company claims that these actions by Bard are preventing competition in the marketplace and limiting patient access to superior technology.
The Company issued a voluntary recall of its Acculis probes that were sold over the past two years. As a result of this voluntary recall, the company decided to also do a voluntary market withdrawal of its Acculis capital systems and discontinue selling the product. The voluntary recall resulted in a deferral of revenue of
$2.6 million
and an increase of
$2.6 million
in inventory and hardware asset reserves. The total impact to income before taxes of the recall was
$4.5 million
. Additional costs will be incurred in fiscal year 2018 related to the market withdrawal of the Acculis capital systems.
The Company received notification in the fourth quarter of 2017 that a $1.8 million refund from the Internal Revenue Service related to prior medical device taxes paid would be received.
As of May 31, 2017 the Company accrued $12.5 million for these matters and in August 2017, the Company agreed in principle with the government to resolve these matters for approximately $12.5 million.
Management's Use of Non-GAAP Measures
Net sales “on a constant currency basis” is a non-GAAP measure. The Company analyzes net sales on a constant currency basis to better measure the comparability of results between periods. Because changes in foreign currency exchange rates have a non-operating impact on net sales, the Company believes that evaluating growth in net sales on a constant currency basis provides an additional and meaningful assessment of net sales to both management and the company’s investors. Constant currency growth rates are calculated by subtracting the current period's local currency sales at the prior period’s exchange rate from the current period’s local currency sales at the current period’s exchange rate.
Constant currency growth rates are not indicative of changes in corresponding cash flows. The limitation of these non-GAAP measures is that they do not reflect results on a standardized reporting basis. Non-GAAP measures are intended to supplement the applicable GAAP disclosures and should not be viewed as replacements of GAAP results.
40
Critical Accounting Policies and Use of Estimates
Our significant accounting policies are summarized in Note 1 to Notes to Consolidated Financial Statements included elsewhere in this Annual Report on Form 10-K. While all these significant accounting policies affect the reporting of our financial condition and results of operations, we view certain of these policies as critical. Policies determined to be critical are those policies that have the most significant impact on our financial statements and require us to use a greater degree of judgment and/or estimates. Actual results may differ from those estimates. The accounting policies identified as critical are as follows:
Revenue Recognition
We recognize revenue in accordance with generally accepted accounting principles as outlined in the SEC’s authoritative guidance on revenue recognition which requires that four criteria be met before revenue can be recognized: (i) persuasive evidence that an arrangement exists; (ii) the price is fixed or determinable; (iii) collectability is reasonably assured; and (iv) product delivery has occurred or services have been rendered. Decisions relative to criterion (iii) regarding collectability are based upon our judgments, as discussed under “Accounts Receivable” in Note 1, and should conditions change in the future and cause us to determine this criterion is not met; our results of operations may be affected. We recognize revenue, net of sales taxes assessed by any governmental authority, as products are shipped, based on F.O.B. shipping point terms when title and risk of loss passes to customers. We negotiate shipping and credit terms on a customer-by-customer basis and products are shipped at an agreed upon price. All product returns must be pre-approved by us and customers may be subject to a 20% restocking charge. To be accepted, a returned product must be unadulterated, undamaged and have at least 12 months remaining prior to its expiration date. Charges for discounts, returns, rebates and other allowances are recognized as a deduction from revenue on an accrual basis in the period in which the revenue is recorded. The accrual for product returns, discounts and other allowances is based on the Company’s history.
Income Taxes
We calculate income tax expense for each jurisdiction in which we operate. This involves estimating actual current taxes due plus assessing temporary differences arising from differing treatment for tax and accounting purposes that are recorded as deferred tax assets and liabilities. We periodically evaluate deferred tax assets, capital loss carryforwards and tax credit carryforwards to determine their recoverability based primarily on our ability to generate future taxable income and capital gains. Where it is more-likely-than-not these will not be recovered, we estimate a valuation allowance and record a corresponding additional tax expense in our statement of operations.
We file income tax returns in the U.S. federal jurisdiction and various state and foreign jurisdictions. In the normal course of business we are subject to examination by taxing authorities throughout the world. Fiscal years 2014 through 2017 remain open to examination by the various tax authorities. We analyzed filing positions in all of the Federal and state jurisdictions where we are required to file income taxes, as well as all open tax years in these jurisdictions and believe that our income tax filing positions and deductions will be sustained on audit and we do not anticipate any adjustments will result in a material adverse effect on our financial condition, results of operations or cash flows.
Acquisitions and Contingent Consideration
In a business combination, the acquisition method of accounting requires that the identifiable assets acquired and liabilities assumed be measured at their fair value, with goodwill being the excess value of consideration paid over the fair value of the net identifiable assets acquired. IP R&D is capitalized and recorded as an indefinite-lived intangible asset at the acquisition date, contingent consideration is recorded at fair value at the acquisition date, and transaction costs are expensed as incurred. When the Company acquires net assets that are not accounted for as a business combination, no goodwill is recognized.
The fair value of the liability for contingent consideration recorded on the acquisition date is based on probability weighted estimated cash flow streams, discounted back to present value using a discount rate determined in accordance with accepted valuation methods. The liability for contingent consideration is remeasured to fair value at each reporting period with changes recorded in earnings until the contingency is resolved.
Goodwill and Intangible Assets
Intangible assets other than goodwill, indefinite lived intangible assets and in process research and development ("IP R&D") are amortized over their estimated useful lives, which range between two to
eighteen
years, on either a straight-line
41
basis over the expected period of benefit or as revenues are earned from the sales of the related products. We periodically review the estimated useful lives of our intangible assets and review such assets for impairment whenever events or changes in circumstances indicate that the carrying value of the assets may not be recoverable. If an intangible asset is considered to be impaired, the amount of the impairment will equal the excess of the carrying value over the fair value of the asset.
Acquired IP R&D is not amortized until completion and development of the project, at which time the IP R&D becomes an amortizable asset with an appropriate useful life and an amortization method is determined. If the related project is not completed in a timely manner or the project is terminated or abandoned, we may have an impairment related to the IP R&D, calculated as the excess of the asset’s carrying value over its fair value.
Our policy defines IP R&D as the value assigned to those projects for which the related products have not received regulatory approval and have no alternative future use. Determining the portion of the purchase price allocated to IP R&D requires us to make significant estimates. The amount of the purchase price allocated to IP R&D is determined by estimating the future cash flows of each project or technology and discounting the net cash flows back to their present values. The discount rate used is determined at the time of measurement in accordance with accepted valuation methods. These methodologies include consideration of the risk of the project not achieving commercial feasibility.
Goodwill and other intangible assets that have indefinite useful lives are not amortized, but rather, are tested for impairment annually or more frequently if impairment indicators arise. Goodwill represents the excess of the purchase price over the fair value of the net tangible and identifiable intangible assets acquired in each business combination. Goodwill and intangible assets have been recorded at either incurred or allocated cost. Allocated costs were based on respective fair market values at the date of acquisition.
For goodwill, the impairment test requires a comparison of the estimated fair value of the reporting unit to which the goodwill is assigned to the sum of the carrying value of the assets and liabilities of that unit. The determination of reporting units also requires management judgment. We consider whether a reporting unit exists within a reportable segment based on the availability of discrete financial information that is regularly reviewed by segment management. If the sum of the carrying value of the assets and liabilities of a reporting unit exceeds the fair value of the reporting unit, the carrying value of the reporting unit’s goodwill is reduced to its implied fair value through an adjustment to the goodwill balance, resulting in an impairment charge. The Company utilizes either discounted cash flow models or other valuation models, such as comparative transactions and market multiples, to determine the fair value of our reporting unit. We must make assumptions about future cash flows, future operating plans, discount rates, comparable companies, market multiples, purchase price premiums and other factors in those models. Different assumptions and judgment determinations could yield different conclusions that would result in an impairment charge to income in the period that such change or determination was made.
Contingencies
We are involved, both as a plaintiff and a defendant, in various legal proceedings that arise in the ordinary course of business, including patent infringement and product liability, as further discussed in Note 15 to our consolidated financial statements. Accruals recorded for various contingencies including legal proceedings, self insurance and other claims, are based on judgment, the probability of losses and, where applicable, the consideration of opinions of internal and/or external legal counsel, internal and/or external technical consultants and actuarially determined estimates. When a range is established but a best estimate cannot be made, we record the minimum loss contingency amount, which could be zero. An estimate is often initially developed substantially earlier than the ultimate loss is known and is reevaluated each accounting period. As information becomes known, additional loss provision is recorded when either a best estimate can be made or the minimum loss amount is increased. When events result in an expectation of a more favorable outcome than previously expected, our best estimate is changed to a lower amount. We record receivables from third-party insurers up to the amount of the related liability when we have determined that existing insurance policies will provide reimbursement. In making this determination, we consider applicable deductibles, policy limits and the historical payment experience of the insurance carriers. Receivables are not netted against the related liabilities for financial statement presentation.
Results of Operations for the years ended
May 31, 2017
and
2016
For the fiscal year ended
May 31, 2017
, we reported net income of
$5.0 million
, or
$0.14
income per diluted share, on net sales of
$349.6 million
compared to a fiscal
2016
net loss of
$43.6 million
, or
$1.21
loss per diluted share, on net sales of
$353.9 million
.
42
Net Sales
Net sales
- Net sales are derived from the sale of our products and related freight charges, less discounts and returns.
Net sales for the year ended
May 31, 2017
and
2016
were:
|
For the year ended May 31,
|
|||||||||||||
|
(in thousands)
|
2017
|
2016
|
% Growth
|
Currency Impact (Pos) Neg
|
Constant Currency Growth Non-GAAP
|
||||||||
|
Net Sales by Product Category
|
|||||||||||||
|
Peripheral Vascular
|
$
|
208,602
|
|
$
|
205,620
|
|
1%
|
||||||
|
Vascular Access
|
96,481
|
|
99,375
|
|
(3)%
|
||||||||
|
Oncology/Surgery
|
44,560
|
|
48,895
|
|
(9)%
|
||||||||
|
Total
|
349,643
|
|
353,890
|
|
(1)%
|
0%
|
(1)%
|
||||||
|
Net Sales by Geography
|
|||||||||||||
|
United States
|
$
|
282,168
|
|
$
|
285,824
|
|
(1)%
|
0%
|
(1)%
|
||||
|
International
|
67,475
|
|
68,066
|
|
(1)%
|
2%
|
1%
|
||||||
|
Total
|
$
|
349,643
|
|
$
|
353,890
|
|
(1)%
|
0%
|
(1)%
|
||||
For year ended
May 31, 2017
, net sales
decreased
$4.2 million
to
$349.6 million
compared to the year ended
May 31, 2016
.
|
•
|
Consolidated and U.S. net sales decreased from the prior year as a result of decreased net sales from Vascular Access and Oncology Surgery. This decrease was partially offset by 1% year over year growth in our Peripheral Vascular franchise.
|
Peripheral Vascular
|
•
|
Total Peripheral Vascular sales increased
$3.0 million
primarily attributable to increased sales volume of Angiographic and Core products of $9.9 million. This increased sales volume was partially offset by a decrease of volume in Fluid Management, Venous and AngioVac of $5.6 million. The decrease in Fluid Management was attributed to a discontinuance of our inflation device and automation challenges in the European markets. Although AngioVac procedures were up year over year, AngioVac unit sales decreased by $1.4 million due to available inventory already in the market place.
|
|
•
|
US Peripheral Vascular sales increased $2.8 million and international Peripheral Vascular sales increased $0.2 million which was primarily due to increased sales volume of Angiographic catheters. This increased sales volume was offset by a decrease in volume in Fluid Management, Venous and AngioVac.
|
Vascular Access
|
•
|
Total Vascular Access sales decreased
$2.9 million
primarily in our non-BioFlo businesses. Our BioFlo product line grew by $4.8 million primarily driven by growth in Midlines.
|
|
•
|
US Vascular Access sales declined by 5% due to softness across the portfolio offset by Midline and BioFlo dialysis which continued to gain traction in the marketplace.
|
|
•
|
International Vascular Access sales increased 15% due to the market penetration of BioFlo PICCs.
|
Oncology/Surgery
|
•
|
Total Oncology/Surgery sales decreased
$4.3 million
year over year primarily due to fewer sales of capital units in Microwave and NanoKnife as well as the $2.6 million deferral of revenue related to the Acculis probe recall that was announced in the fourth quarter of fiscal year 2017.
|
43
|
•
|
U.S. Oncology/Surgery declined by 8%, driven primarily through lower capital and disposable sales in Radio Frequency and Microwave offset by NanoKnife growth. The decrease is also attributed to a $1.4 million deferral of revenue related to the Acculis probe recall that was announced in the fourth quarter of fiscal year 2017.
|
|
•
|
International Oncology/Surgery sales decreased 10% year over year as a result of lower NanoKnife capital and disposable sales and a $1.2 million deferral of revenue related to the Acculis probe recall that was announced in the fourth quarter of fiscal year 2017.
|
Gross Profit, Operating expenses, and Other income (expense)
|
For the year ended May 31,
|
|||||||||||
|
(in thousands)
|
2017
|
2016
|
% Change
|
||||||||
|
Gross profit (exclusive of intangible amortization)
|
$
|
176.2
|
|
$
|
174.3
|
|
1.1
|
%
|
|||
|
Gross profit % of sales
|
50.4
|
%
|
49.3
|
%
|
|||||||
|
Research and development
|
$
|
25.3
|
|
$
|
25.1
|
|
0.8
|
%
|
|||
|
% of sales
|
7.2
|
%
|
7.1
|
%
|
|||||||
|
Selling and marketing
|
$
|
78.8
|
|
$
|
83.7
|
|
(5.9
|
)%
|
|||
|
% of sales
|
22.5
|
%
|
23.7
|
%
|
|||||||
|
General and administrative
|
$
|
31.4
|
|
$
|
30.6
|
|
2.6
|
%
|
|||
|
% of sales
|
9.0
|
%
|
8.6
|
%
|
|||||||
Gross profit
- Gross profit consists of net sales less the cost of goods sold, which includes the costs of materials, products purchased from third parties and sold by us, manufacturing personnel, royalties, freight, business insurance, depreciation of property and equipment and other manufacturing overhead.
Gross profit increased by
$1.9 million
compared to the prior year. The increase is attributable to the following:
|
•
|
In fiscal year 2017, a net charge of $4.5 million was recorded as a result of the Acculis probe recall.
|
|
•
|
In fiscal year 2016, a $5.9 million charge related to the write-off of Celerity inventory on hand and hardware assets after the business decision to no longer pursue the Celerity Navigation project.
|
|
•
|
The remaining increase is driven by net productivity offset by price and mix of products.
|
|
•
|
The increase in gross profit as a percentage of
1.1%
is attributed to the factors noted above.
|
Research and development expenses
- Research and development (“R&D”) expenses include internal and external costs to develop new products, enhance existing products, validate new and enhanced products, manage clinical, regulatory and medical affairs.
R&D expense increased
$0.2 million
compared to the prior year. The increase is attributable to the following:
|
•
|
Increased headcount in the R&D department compared to the prior year resulted in $1.2 million in additional expense as well as expenses associated with consultants of $0.6 million and severance of $0.4 million.
|
|
•
|
These increases were partially offset by less project spend of $1.2 million, $0.6 million in samples and $0.2 million in travel and other expenses.
|
|
•
|
R&D expense as a percentage of sales remained consistent year over year.
|
Sales and marketing expenses
- Sales and marketing (“S&M”) expenses consist primarily of salaries, commissions, travel and related business expenses, attendance at medical society meetings, product promotions and marketing activities.
S&M expense decreased by
$4.9 million
compared to the prior year. The decrease is attributable to the following:
|
•
|
There was a decrease in headcount from the prior year which resulted in a $2.5 million decrease in salaries and benefits.
|
|
•
|
The decrease in headcount along with a focus on reduced travel spend resulted in a decrease in travel expenses of $1.3 million.
|
|
•
|
There was a $0.7 million decrease in trade shows and meeting expenses along with a $0.7 million decrease in samples as a result of a focus on reducing expenses.
|
|
•
|
These decreases were partially offset by severance of $0.8 million.
|
44
|
•
|
As a result of these decreases in S&M expenses, the percentage of S&M to sales decreased 1.2%.
|
General and administrative expenses
- General and administrative (“G&A”) expenses include executive management, finance, information technology, human resources, business development, legal, and the administrative and professional costs associated with those activities.
G&A expense increased by
$0.8 million
compared to the prior year. The increase is attributable to the following:
|
•
|
Increased stock based compensation expense related to the new grant for the CEO along with two new board members of $1.7 million. Along with the stock based compensation increase, bonus for fiscal year 2017 was accrued at a higher rate than the prior year which resulted in a $1.0 million increase to G&A expense.
|
|
•
|
Along with the appointment of new members in the executive leadership team, recruiting and relocation expenses resulted in an increase of $0.5 million from the prior year
|
|
•
|
There was also an increase in professional fees of $0.3 million related to audit fees and director fees partially offset by a decrease in legal fees.
|
|
•
|
These increases were partially offset by decreases in compensation benefits of $0.5 million as a result of a reduction in benefit claims, depreciation expense of $0.8 million, $0.2 million in facilities expenses including insurance, lease expenses and utilities, bad debt favorability of $0.4 million and other miscellaneous decreases in expenses of $0.4 million.
|
|
For the year ended May 31,
|
||||||||||||
|
(in thousands)
|
2017
|
2016
|
$ Change
|
|||||||||
|
Amortization of intangibles
|
$
|
17.3
|
|
$
|
18.0
|
|
$
|
(0.7
|
)
|
|||
|
Change in fair value of contingent consideration
|
$
|
(15.3
|
)
|
$
|
0.9
|
|
$
|
(16.2
|
)
|
|||
|
Acquisition, restructuring and other items, net
|
$
|
27.5
|
|
$
|
12.6
|
|
$
|
14.9
|
|
|||
|
Medical device excise tax
|
$
|
(1.8
|
)
|
$
|
2.4
|
|
$
|
(4.2
|
)
|
|||
|
Other expense
|
$
|
(3.1
|
)
|
$
|
(4.3
|
)
|
$
|
1.2
|
|
|||
Amortization of intangibles
- Represents the amount of amortization expense that was taken on intangibles assets held by the Company.
|
•
|
The decrease of $0.7 million is primarily related to intangible assets that became fully amortized.
|
Change in fair value of contingent consideration
- Represents changes in contingent consideration driven by changes to estimated future payments on earn-out liabilities created through acquisitions and amortization of present value discounts on long-term contingent consideration.
|
•
|
The decrease is due to a write-off of $13.4 million that was taken on the AngioVac product as a result of decreases in future sales projections that eliminated any payments above minimums and a write-off of $3.1 million on the TiLo product as the milestone will not be achieved. This was partially offset by normal amortization of the present value discount on the contingent liabilities.
|
Acquisition, restructuring and other items, net
- Acquisition, restructuring and other items, net represents costs associated with mergers and acquisitions, restructuring expenses, legal costs that are related to litigation that is not in the ordinary course of business, legal settlements and other one-time items.
Acquisition, restructuring and other items, net increased by
$14.9 million
compared to the prior year. The increase is attributable to the following:
|
•
|
In Q2 fiscal year 2017, the intangible assets associated with TiLo were written off for $3.6 million as a result of the decision to discontinue our investment in the TiLo product along with a $2.0 million write-off of the investment in Embomedics due to termination of the agreement. The prior year had asset impairments of $0.4 million.
|
|
•
|
There was $1.3 million of expense related to the plant consolidation which consisted mainly of severance and start-up costs to move the product lines including equipment transfer expenses, accelerated depreciation for assets that will not be transferred, validation and other start up costs. The prior year had accelerated depreciation related to the Operational Excellence program of $1.0 million along with $0.5 million in other expenses.
|
45
|
•
|
A litigation settlement accrual for $12.5 million was recorded in the fourth quarter of fiscal year 2017.
|
|
•
|
Legal expenses of $7.0 million which was a decrease of $0.5 million from the prior year.
|
|
•
|
Other miscellaneous items decreased $2.2 million from the prior year primarily attributable to a decrease in M&A expenses of $2.5 million offset by a gain in the prior year of $0.7 million related to the modification of stock based compensation awards for the former CEO.
|
Medical device excise tax
- Medical device excise tax is assessed on our U.S. product sales subject to exclusions and adjustments.
|
•
|
The Medical Device Excise Tax was suspended on January 1, 2016 therefore, fiscal year 2016 had seven months of the tax. In the current year, there is a $1.8 million refund from the Internal Revenue Service related to prior medical device taxes paid.
|
Other expenses
- Other expenses include interest expense, foreign currency impacts, bank fees, and amortization of deferred financing costs.
|
•
|
The decrease in other expenses of $1.2 million was due to lower interest expense on lower outstanding debt and lower interest rates under the Credit Agreement along with unrealized foreign currency gains from re-measurement offset by the write off of the deferred financing fees from the original credit facility.
|
Income Tax Provision (Benefit)
|
For year ended May 31,
|
||||||||
|
(in thousands)
|
2017
|
2016
|
||||||
|
Income tax expense (benefit)
|
$
|
4.8
|
|
$
|
40.3
|
|
||
|
Effective tax rate including discrete items
|
49
|
%
|
(1,240
|
)%
|
||||
Our effective tax rate was
49%
for fiscal
2017
compared with
(1,240)%
for the prior year. The current year rate reflects expense of $4.8 million primarily driven by the impact of the US valuation allowance and the deferred tax liability related to intangibles that have an indefinite reversal period and cannot be used to support the deferred tax assets. The prior year rate primarily reflects income tax expense of $40.4 million related to full valuation allowance on our US net deferred tax assets that was established during fiscal 2016 and the deferred tax liability related to intangibles that have an indefinite reversal period and cannot be used to support the deferred tax assets.
At
May 31, 2017
, we had a net deferred tax liability of $26.1 million, after a valuation allowance on our US deferred tax assets of
$48.3 million
. The increase in the valuation allowance during fiscal 2017 was
$6.1 million
.
A valuation allowance is provided if based upon the weight of available evidence, it is more likely than not that some or all of the deferred tax assets will not be realized. After careful consideration and weighing of all the available positive and negative evidence, the weight given to the three year cumulative loss and lack of a recent history of core earnings was difficult to overcome and a full valuation allowance related to the U.S. deferred tax assets was established in the period ending May 31, 2016. Management considered all available positive and negative evidence at May 31, 2017, and considering the cumulative loss in the U.S. over the three year period, determined that the valuation allowance is still required. Management will continue to reevaluate the positive and negative evidence at each reporting period and if future results as projected in the U.S. and the Company's tax planning strategies are favorable, the valuation allowance may be removed, which could have a favorable material impact on the Company's results of operations in the period in which it is recorded.
Results of Operations for the years ended
May 31, 2016
and
2015
For the fiscal year ended
May 31, 2016
, we reported net loss of
$43.6 million
, or
$1.21
loss per basic and diluted common share, on net sales of
$353.9 million
compared to a fiscal
2015
net loss of
$3.4 million
, or
$0.09
per basic and diluted common share, on net sales of
$356.5 million
.
Net Sales
Net sales
- Net sales are derived from the sale of our products and related freight charges, less discounts and returns.
Net sales for the year ended
May 31, 2016
and
2015
were:
46
|
For the year ended May 31,
|
|||||||||||||
|
(in thousands)
|
2016
|
2015
|
% Growth
|
Currency Impact (Pos) Neg
|
Constant Currency Growth Non-GAAP
|
||||||||
|
Net Sales by Product Category
|
|||||||||||||
|
Peripheral Vascular
|
$
|
205,620
|
|
$
|
196,890
|
|
4%
|
||||||
|
Vascular Access
|
99,375
|
|
107,754
|
|
(8)%
|
||||||||
|
Oncology/Surgery
|
48,895
|
|
51,890
|
|
(6)%
|
||||||||
|
Total
|
353,890
|
|
356,534
|
|
(1)%
|
3%
|
2%
|
||||||
|
Net Sales by Geography
|
|||||||||||||
|
United States
|
$
|
285,824
|
|
$
|
284,122
|
|
1%
|
—%
|
1%
|
||||
|
International
|
68,066
|
|
72,412
|
|
(6)%
|
4%
|
(2)%
|
||||||
|
Total
|
$
|
353,890
|
|
$
|
356,534
|
|
(1)%
|
1%
|
—%
|
||||
For year ended May 31, 2016, net sales decreased $2.6 million to $353.9 million compared to the year ended May 31, 2015. As shown in the table above, while consolidated net sales decreased by 1% excluding the negative impact from fluctuations in currency exchange rates, our sales were flat year over year. The decline in net sales from vascular access and oncology surgery was partially offset by 4% year over year growth in our peripheral vascular franchise. Our international sales were significantly impacted by unfavorable movement in currency exchange rates, particularly the Euro, British pound and Canadian dollar
Peripheral Vascular sales increased $8.7 million primarily attributable to increased sales of AngioVac, Core and Venus products. While Vascular Access sales decreased $8.4 million primarily in our non-BioFlo businesses, our BioFlo line of products continued to gain traction in the marketplace. Oncology/Surgery sales decreased $3.0 million primarily due to fewer capital sales across all product lines compared to prior year. This was partially offset by increases in the sales of disposables in our Microwave and NanoKnife product lines.
U.S. sales increased $1.7 million due to growth in the Peripheral Vascular products, offset by a reduction in Vascular Access and Oncology/Surgery sales. While total US Vascular Access sales declined by $6.2 million overall, we saw growth in our U.S. BioFlo product lines of 18% year over year. U.S. Oncology/Surgery declined by $1.6 million, driven primarily through lower capital sales offset by growth in disposables. International sales decreased 2% on a constant-currency basis, due to a decline in Thermal Ablation and in the Vascular Access product lines.
Gross Profit, Operating expenses, and Other income (expense)
|
For the year ended May 31,
|
|||||||||||
|
(in thousands)
|
2016
|
2015
|
% Change
|
||||||||
|
Gross profit
|
$
|
174.3
|
|
$
|
175.8
|
|
(0.9
|
)%
|
|||
|
Gross profit % of sales
|
49.3
|
%
|
49.3
|
%
|
|||||||
|
Research and development
|
$
|
25.1
|
|
$
|
26.6
|
|
(5.6
|
)%
|
|||
|
% of sales
|
7.1
|
%
|
7.5
|
%
|
|||||||
|
Selling and marketing
|
$
|
83.7
|
|
$
|
82.4
|
|
1.6
|
%
|
|||
|
% of sales
|
23.7
|
%
|
23.1
|
%
|
|||||||
|
General and administrative
|
$
|
30.6
|
|
$
|
30.0
|
|
2.0
|
%
|
|||
|
% of sales
|
8.6
|
%
|
8.4
|
%
|
|||||||
Gross profit
- Gross profit consists of net sales less the cost of goods sold, which includes the costs of materials, products purchased from third parties and sold by us, manufacturing personnel, royalties, freight, business insurance, depreciation of property and equipment and other manufacturing overhead. The $1.5 million decrease compared to 2015 is primarily attributable to a $5.9 million charge related to the write-off of Celerity inventory on hand and hardware assets after the business decision to no longer pursue the Celerity Navigation project. The prior year gross profit included a $4.8 million charge related to the voluntary Morpheus recall.
47
Research and development expenses
- Research and development (“R&D”) expenses include internal and external costs to develop new products, enhance existing products, validate new and enhanced products, manage clinical, regulatory and medical affairs. The decrease in R&D costs for the year ended May 31, 2016 is due to reductions in project spend and restructuring. As a percentage of net sales, R&D expenses were 7.1% for fiscal 2016, compared to 7.5% for fiscal 2015.
Sales and marketing expenses
- Sales and marketing (“S&M”) expenses consist primarily of salaries, commissions, travel and related business expenses, attendance at medical society meetings, product promotions and marketing activities. Increases in S&M expense for the year ended May 31, 2016 is the result of investments made in the US sales force focused around retention and improved sales performance along with an increase in credit card fees. As a percentage of net sales, S&M expenses were
23.7%
for fiscal 2016 compared to
23.1%
for fiscal 2015.
General and administrative expenses
- General and administrative (“G&A”) expenses include executive management, finance, information technology, human resources, business development, legal, and the administrative and professional costs associated with those activities. Increases in G&A expenses for the year ended May 31, 2016 are primarily the result of increased legal and audit fees.
|
For the year ended May 31,
|
||||||||||||
|
(in thousands)
|
2016
|
2015
|
$ Change
|
|||||||||
|
Amortization of intangibles
|
$
|
18.0
|
|
$
|
18.0
|
|
$
|
—
|
|
|||
|
Change in fair value of contingent consideration
|
$
|
0.9
|
|
$
|
(8.1
|
)
|
$
|
9.0
|
|
|||
|
Acquisition, restructuring and other items, net
|
$
|
12.6
|
|
$
|
26.3
|
|
$
|
(13.7
|
)
|
|||
|
Medical device excise tax
|
$
|
2.4
|
|
$
|
4.1
|
|
$
|
(1.7
|
)
|
|||
|
Other expense
|
$
|
(4.3
|
)
|
$
|
(4.7
|
)
|
$
|
0.4
|
|
|||
Amortization of intangibles
- Amortization of intangibles for the year ended May 31, 2016 remained consistent with the prior year.
Change in fair value of contingent consideration
- Represents changes in contingent consideration driven by changes to estimated future payments on earn-out liabilities created through acquisitions and amortization of present value discounts on long-term contingent consideration. The decrease from the prior year is due to a $10.5 million gain recognized as a result of reducing the estimated present value of future payments due on earn-outs in the prior year compared to $1 million in gains in 2016. These gains were partially offset in each period by amortization of the present value discount on the contingent liabilities.
Acquisition, restructuring and other items, net
- Expense for fiscal 2016 consists of $7.5 million of litigation expense, $2.5 million of M&A related expenses, $1.9 million of severance, $0.7 million of a gain related to the modification of stock based compensation awards for the former CEO and $1.0 million of accelerated depreciation associated with our operational excellence program, and other miscellaneous items. Expense for fiscal 2015 consists of $9.1 million of fixed and long-term asset impairments, $6.4 million of impairment on the NAMIC trademark, other costs associated with litigation, the recall of Morpheus, our operational excellence program, and other miscellaneous items. The impairment charges were primarily driven by a change in strategy within our fluid management product development pipeline, as we moved away from our planned design of an Automated Power Injector.
Medical device excise tax
- Medical device excise tax is assessed on our U.S. product sales subject to exclusions and adjustments. The decrease as compared to the prior year is attributable to the suspension of the medical device excise tax as of January 1, 2016.
Other expenses
- Other expenses include interest expense, foreign currency impacts, bank fees, and amortization of deferred financing costs. The increase in other expenses was primarily related to foreign currency losses.
48
Income Tax Provision (Benefit)
|
For year ended May 31,
|
||||||||
|
(in thousands)
|
2016
|
2015
|
||||||
|
Income tax expense (benefit)
|
$
|
40.3
|
|
$
|
(4.7
|
)
|
||
|
Effective tax rate including discrete items
|
(1,240
|
)%
|
58
|
%
|
||||
Our effective tax rate was (1,240)% for fiscal 2016 compared with 58% for the prior year. The current year rate reflects expense of $40.4 million related to a full valuation allowance on our US net deferred tax assets. The prior year rate reflects the benefit of $9.2 million nontaxable adjustment to the contingent liabilities related to Vortex Medical and Clinical Devices, and a seven month benefit from the R&D tax credit that expired on December 31, 2014, offset by non-deductible interest expense related to contingent payments, true-ups of our fiscal year 2014 US income tax returns and the impact of the elimination of the ASC 718 APIC pool.
At May 31, 2016, we had a net deferred tax liability of $21.7 million, after recording a valuation allowance of $42.2 million. The increase in the valuation allowance was $40.4 million.
While the net deferred tax asset at May 31, 2016 before the valuation allowance was $19.9 million, the Company was required to record a valuation allowance of $40.4 million due to deferred tax liabilities related to intangibles of $20.5 million that have an indefinite reversal period and can not be used to support the deferred tax asset.
Liquidity and Capital Resources
Our cash and cash equivalents totaled
$47.5 million
as of
May 31, 2017
, compared with
$32.3 million
as of
May 31, 2016
. Marketable securities totaled
$1.2 million
and
$1.7 million
as of
May 31, 2017
and
2016
, respectively, and consist of auction rate securities. As of
May 31, 2017
, total debt outstanding was
$97.5 million
comprised of a term loan. The net debt to Consolidated EBITDA, as defined by the Credit Agreement (Note 11), is 1.4x. The fair value of contingent consideration liability as of
May 31, 2017
was
$12.8 million
.
The table below summarizes our cash flows for the years ended
May 31, 2017
,
2016
and
2015
:
|
For the year ended May 31,
|
|||||||||||
|
(in thousands)
|
2017
|
2016
|
2015
|
||||||||
|
Cash provided by (used in):
|
|||||||||||
|
Operating activities
|
$
|
55,745
|
|
$
|
45,216
|
|
$
|
25,685
|
|
||
|
Investing activities
|
(2,551
|
)
|
(7,569
|
)
|
(12,736
|
)
|
|||||
|
Financing activities
|
(37,983
|
)
|
(23,663
|
)
|
(10,465
|
)
|
|||||
|
Effect of exchange rate changes on cash and cash equivalents
|
—
|
|
(42
|
)
|
(198
|
)
|
|||||
|
Net change in cash and cash equivalents
|
$
|
15,211
|
|
$
|
13,942
|
|
$
|
2,286
|
|
||
During the twelve months ended
May 31, 2017
and
2016
, cash flows consisted of the following:
Cash provided by operating activities
|
•
|
Net income was driven by higher gross margins, lower sales and marketing expenses as well as the medical device tax refund. Also impacting net income, were non-cash items which consisted of $15.3 million of contingent consideration gains, $2.0 million in the write-off of the Embomedics investment and $3.6 million in intangible write-offs related to TiLo. In addition, the prior year net income included a full valuation allowance on the Company's net operating losses.
|
|
•
|
With regards to working capital, the Company focused on optimizing both DSO and DPO which contributed to $15.2 million of working capital improvement. With respect to inventory, the $2.4 million reserve for Acculis inventory partially offset the inventory build related to the plant consolidation.
|
49
Cash used in investing activities
|
•
|
$3.0 million in fixed asset additions compared to fixed asset additions of $2.3 million in the prior year.
|
|
•
|
$0.5 million in proceeds from an auction rate security that was called during fiscal year 2017.
|
|
•
|
The prior year also had $2.0 million in warrant additions related to EmboMedics and $3.3 million in intangible asset additions related to the Merz Distribution Agreement.
|
Cash used in financing activities
|
•
|
Net $23.9 million in repayments on long-term debt after the proceeds from the Credit Agreement and repayment of the old credit agreement compared to $16.3 million in repayments in the prior year. The increase from the prior year is due to the fact that the revolver was paid down in full as of the third quarter of fiscal year 2017.
|
|
•
|
$1.3 million in deferred financing fees related to the new credit agreement.
|
|
•
|
$10.7 million of proceeds from stock option and ESPP activity compared to $2.4 million in the prior year. The large increase is related to the exercise of stock based awards from executive management turnover that took place over the past year.
|
|
•
|
$9.9 million payment on earn-out liabilities which is consistent with the prior year.
|
|
•
|
$13.6 million from the repurchase of common shares in fiscal 2017.
|
On November 7, 2016, the Company entered into a Credit Agreement that provides for a
$100.0 million
senior secured term loan facility and a
$150.0 million
senior secured revolving credit facility, which includes up to a
$20.0 million
sublimit for letters of credit and a
$5.0 million
sublimit for swingline loans.
We believe that our current cash and investment balances, together with cash generated from operations and access to our revolving credit facility, will provide sufficient liquidity to meet our anticipated needs for capital for at least the next 12 months. If we seek to make significant acquisitions of other businesses or technologies in the future for cash, we may require external financing.
Our contractual obligations as of
May 31, 2017
are set forth in the table below (in thousands). We have no variable interest entities or other off-balance sheet obligations.
|
|
Cash Payments Due By Period as of May 31, 2017
|
||||||||||||||||||
|
(in thousands)
|
Total
|
Less than
One Year
|
1-3 Years
|
3-5 Years
|
After 5
Years
|
||||||||||||||
|
Contractual Obligations:
|
|||||||||||||||||||
|
Long term debt and interest
|
$
|
106,469
|
|
$
|
7,372
|
|
$
|
29,935
|
|
$
|
69,162
|
|
$
|
—
|
|
||||
|
Operating leases (1)
|
9,717
|
|
2,214
|
|
4,951
|
|
2,552
|
|
—
|
|
|||||||||
|
Purchase obligations (1)
|
49,762
|
|
8,443
|
|
26,597
|
|
9,189
|
|
5,533
|
|
|||||||||
|
Acquisition-related future obligations (2)
|
13,058
|
|
9,750
|
|
3,308
|
|
—
|
|
—
|
|
|||||||||
|
Royalties
|
44,000
|
|
2,500
|
|
10,000
|
|
10,500
|
|
21,000
|
|
|||||||||
|
Other
|
834
|
|
167
|
|
500
|
|
167
|
|
—
|
|
|||||||||
|
$
|
223,840
|
|
$
|
30,446
|
|
$
|
75,291
|
|
$
|
91,570
|
|
$
|
26,533
|
|
|||||
|
(1)
|
The non-cancelable operating leases and inventory purchase obligations are not reflected on our consolidated balance sheets under accounting principles generally accepted in the United States of America.
|
|
(2)
|
Acquisition-related future obligations include scheduled minimum payments and contingent payments based upon achievement of performance measures or milestones such as sales or profitability targets, the achievement of research and development objectives or the receipt of regulatory approvals. The amount represents the undiscounted value of contingent liabilities recorded on the balance sheet. Timing of payments are as contractually scheduled, or where contingent, the Company's best estimate of payment timing.
|
Recent Accounting Pronouncements
Refer to Note 1 for Recently issued Accounting Pronouncements.
50
|
Item 7A.
|
Quantitative and Qualitative Disclosures about Market Risk.
|
FOREIGN CURRENCY EXCHANGE RATE RISK
We are exposed to market risk from changes in currency exchange rates, as well as interest rate fluctuations on our credit facility and investments that could impact our results of operations and financial position.
We transact sales in currencies other than the U.S. Dollar, particularly the Euro, British pound and Canadian dollar. Approximately 7.2% of our sales in fiscal
2017
were denominated in foreign currencies. We do not have expenses denominated in foreign currencies at the level of our sales and as a result, our profitability is exposed to currency fluctuations. When the U.S. Dollar strengthens, our sales and gross profit will be negatively impacted. In addition, we have assets and liabilities denominated in non-functional currencies which are remeasured at each reporting period, with the offset to changes presented as a component of Other (Expenses) Income. Significant non-functional balances include accounts receivable due from a sub-section of our international customers.
INTEREST RATE RISK
On November 7, 2016, we entered into the Credit Agreement which provides for a $100 million senior secured Term Loan and a $150 million Revolving Facility. Interest on both the Term Loan and Revolving Facility is based on a base rate or Eurodollar rate plus an applicable margin which increases as our total leverage ratio increases, with the base rate and Eurodollar rate having ranges of 0.50% to 1.25% and 1.50% to 2.25% respectively. In the event of default, the interest rate may be increased by 2.0%. A 50 basis point (0.50%) increase or decrease in the interest rate would result approximately in a $2.0 million increase or decrease in interest expense over the life of the agreement.
CONCENTRATION OF CREDIT RISK
Financial instruments, which potentially subject the Company to significant concentrations of credit risk, consist primarily of cash and cash equivalents, our credit facility and trade accounts receivable.
The Company maintains cash and cash equivalents at various institutions and performs periodic evaluations of the relative credit standings of these financial institutions to ensure their credit worthiness. In addition, the Credit Agreement is structured across five above investment grade banks. The Company has the ability to draw equally amongst the five banks which limits the concentration of credit risk of one institution.
Concentration of credit risk with respect to trade accounts receivable is limited due to the large number of customers that purchase products from the Company. No single customer represents more than 10% of total sales. The Company monitors the creditworthiness of its customers to which it grants credit terms in the normal course of business. Although the Company does not currently foresee a significant credit risk associated with the outstanding accounts receivable, repayment is dependent upon the financial stability of our customers.
|
Item 8.
|
Financial Statements and Supplementary Data.
|
Financial statements and supplementary data required by Part II, Item 8 are included in Part IV of this report as indexed as Item 15 (a) (1) and (2) of this report, and are incorporated by reference into this Item 8.
|
Item 9.
|
Changes in and Disagreements with Accountants on Accounting and Financial Disclosure.
|
None.
|
Item 9A.
|
Controls and Procedures.
|
Evaluation of disclosure controls and procedures
As of the end of the period covered by this report, our management, under the supervision and with the participation of our Chief Executive Officer and our Chief Financial Officer, evaluated the effectiveness of the design and operation of our disclosure controls and procedures pursuant to Rule 13a-15(b) of the Securities Exchange Act of 1934, as amended. Based on
51
that evaluation, the Chief Executive Officer and the Chief Financial Officer concluded that our disclosure controls and procedures as of the end of the period covered by this report were effective to provide reasonable assurance that the information required to be disclosed by us in reports filed under the Securities Exchange Act of 1934, as amended, is recorded, processed, summarized and reported within the time periods specified in the SEC rules and forms and is accumulated and communicated to management, including our Chief Executive Officer and Chief Financial Officer, as appropriate to allow timely decisions regarding required disclosure.
Management’s Report on Internal Control Over Financial Reporting
Our management is responsible for establishing and maintaining adequate internal control over financial reporting for our Company. Internal control over financial reporting is defined in Rules 13a-15(f) and 15d-15(f) promulgated under the Securities Exchange Act of 1934, as amended, as a process designed by, or under the supervision of, our principal executive and principal financial officers and effected by our board of directors, management and other personnel, to provide reasonable assurance regarding the reliability of financial reporting and the preparation of financial statements for external purposes in accordance with accounting principles generally accepted in the United States and includes those policies and procedures that:
|
•
|
Pertain to the maintenance of records that in reasonable detail accurately and fairly reflect the transactions and dispositions of our assets;
|
|
•
|
Provide reasonable assurance that transactions are recorded as necessary to permit preparation of financial statements in accordance with accounting principles generally accepted in the United States, and that our receipts and expenditures are being made only in accordance with authorizations of our management and members of our board of directors; and
|
|
•
|
Provide reasonable assurance regarding prevention or timely detection of unauthorized acquisition, use or disposition of our assets that could have a material effect on our financial statements.
|
Because of its inherent limitations, internal control over financial reporting may not prevent or detect misstatements. Also, projections of any evaluation of effectiveness to future periods are subject to the risk that controls may become inadequate because of changes in conditions, or that the degree of compliance with the policies or procedures may deteriorate.
Our management has assessed the effectiveness of our internal control over financial reporting as of
May 31, 2017
. In making this assessment, management used the criteria set forth by the Committee of Sponsoring Organizations of the Treadway Commission (COSO) in
Internal Control-Integrated Framework
(2013). Based on this evaluation, management concluded that our internal control over financial reporting was effective as of
May 31, 2017
.
The effectiveness of our internal control over financial reporting as of
May 31, 2017
has been audited by Deloitte & Touche LLP, an independent registered public accounting firm, as stated in their report which appears herein.
Changes in Internal Control over Financial Reporting
There was no change in our internal control over financial reporting for the fiscal quarter ended
May 31, 2017
other than items described below related to our remediation actions, that has materially affected, or is reasonably likely to materially affect, our internal control over financial reporting.
Remediation of Prior Material Weakness in Internal Control Over Financial Reporting
Management of the Company previously identified and disclosed the following material weakness that existed as of May 31, 2016.
We did not design and maintain effective internal controls over the accounting for the annual goodwill impairment test. Specifically, we did not design and maintain effective controls to review in sufficient detail the cash flow projections and significant valuation model assumptions used in the goodwill impairment test as of December 31, 2015.
During 2017, management of the Company was actively engaged in remediation efforts to address the material weakness noted above. The following actions were taken:
|
•
|
The design of the annual goodwill impairment test control was updated to ensure the sufficiency of the control procedures. Specifically, if the discounted cash flow method is required for performing the goodwill impairment test, detailed procedures over the cash flow projections and valuation model assumptions are appropriately detailed to instruct the operating effectiveness of the control.
|
52
|
•
|
Sufficient documentation was prepared, reviewed and retained over the goodwill impairment test performed as of December 31, 2016.
|
Based upon the significant actions taken and the testing and evaluation of the effectiveness of our internal control over financial reporting, management of the Company has concluded the material weakness in the Company’s controls no longer existed as of May 31, 2017.
53
Report of Independent Registered Public Accounting Firm
To the Board of Directors and Stockholders of
AngioDynamics, Inc.
Latham, New York
We have audited the internal control over financial reporting of AngioDynamics, Inc. and subsidiaries (the "Company") as of May 31, 2017, based on criteria established in
Internal Control - Integrated Framework (2013)
issued by the Committee of Sponsoring Organizations of the Treadway Commission. The Company's management is responsible for maintaining effective internal control over financial reporting and for its assessment of the effectiveness of internal control over financial reporting, included in the accompanying Management’s Report on Internal Control over Financial Reporting. Our responsibility is to express an opinion on the Company's internal control over financial reporting based on our audit.
We conducted our audit in accordance with the standards of the Public Company Accounting Oversight Board (United States). Those standards require that we plan and perform the audit to obtain reasonable assurance about whether effective internal control over financial reporting was maintained in all material respects. Our audit included obtaining an understanding of internal control over financial reporting, assessing the risk that a material weakness exists, testing and evaluating the design and operating effectiveness of internal control based on the assessed risk, and performing such other procedures as we considered necessary in the circumstances. We believe that our audit provides a reasonable basis for our opinion.
A company's internal control over financial reporting is a process designed by, or under the supervision of, the company's principal executive and principal financial officers, or persons performing similar functions, and effected by the company's board of directors, management, and other personnel to provide reasonable assurance regarding the reliability of financial reporting and the preparation of financial statements for external purposes in accordance with generally accepted accounting principles. A company's internal control over financial reporting includes those policies and procedures that (1) pertain to the maintenance of records that, in reasonable detail, accurately and fairly reflect the transactions and dispositions of the assets of the company; (2) provide reasonable assurance that transactions are recorded as necessary to permit preparation of financial statements in accordance with generally accepted accounting principles, and that receipts and expenditures of the company are being made only in accordance with authorizations of management and directors of the company; and (3) provide reasonable assurance regarding prevention or timely detection of unauthorized acquisition, use, or disposition of the company's assets that could have a material effect on the financial statements.
Because of the inherent limitations of internal control over financial reporting, including the possibility of collusion or improper management override of controls, material misstatements due to error or fraud may not be prevented or detected on a timely basis. Also, projections of any evaluation of the effectiveness of the internal control over financial reporting to future periods are subject to the risk that the controls may become inadequate because of changes in conditions, or that the degree of compliance with the policies or procedures may deteriorate.
In our opinion, the Company maintained, in all material respects, effective internal control over financial reporting as of May 31, 2017, based on the criteria established in
Internal Control - Integrated Framework (2013)
issued by the Committee of Sponsoring Organizations of the Treadway Commission.
We have also audited, in accordance with the standards of the Public Company Accounting Oversight Board (United States), the consolidated financial statements and financial statement schedule as of and for the year ended May 31, 2017 of the Company and our report dated
August 4, 2017
expressed an unqualified opinion on those consolidated financial statements and financial statement schedule.
/s/ Deloitte & Touche LLP
Boston, Massachusetts
August 4, 2017
54
|
Item 9B.
|
Other Information.
|
None.
55
Certain information required by Part III is omitted from this Annual Report on Form 10-K because we will file a definitive proxy statement within 120 days after the end of our fiscal year end pursuant to Regulation 14A (the “Proxy Statement”) for our annual meeting of Stockholders, currently scheduled for October
2017
. The information included in the Proxy Statement under the respective headings noted below is incorporated herein by reference.
|
Item 10.
|
Directors, Executive Officers and Corporate Governance.
|
Information required in this Annual Report on Form 10-K with respect to Executive Officers is contained in the discussion titled “Executive Officers of the Company” in Part I of this Annual Report on Form 10-K. The balance of the information required by Item 10 is incorporated herein by reference to our Proxy Statement under the heading “Election of Directors”.
|
Item 11.
|
Executive Compensation.
|
The information required by Item 11 is incorporated herein by reference to our Proxy Statement under the heading “Executive Compensation”.
|
Item 12.
|
Security Ownership of Certain Beneficial Owners and Management and Related Stockholder Matters.
|
The information required by this caption is incorporated herein by reference to our Proxy Statement under the heading “Ownership of Securities”.
|
Item 13.
|
Certain Relationships and Related Transactions, and Director Independence.
|
The information required by this caption is incorporated herein by reference to our Proxy Statement under the heading “Certain Relationships and Related Transactions”.
|
Item 14.
|
Principal Accounting Fees and Services.
|
The information required by this caption is incorporated herein by reference to our Proxy Statement under the headings “Audit Matters—Principal Accounting Fees and Services and—Policy on Audit Committee Pre-approval of Audit and Permissible Non-Audit Services of Independent Registered Public Accounting Firm”.
56
|
Item 15.
|
Exhibits, Financial Statement Schedules.
|
(a)(1)
Financial Statements
The following consolidated financial statements and supplementary data of Registrant and its subsidiaries required by Part II, Item 8, are included in Part IV of this report:
(2)
Financial Statement Schedules
The following consolidated financial statement schedule is included in Part IV of this report:
All other schedules are omitted because they are not applicable, or not required, or because the required information is included in the consolidated financial statements or notes thereto.
57
Report of Independent Registered Public Accounting Firm
To the Board of Directors and Stockholders of
AngioDynamics, Inc.
Latham, New York
We have audited the accompanying consolidated balance sheet of AngioDynamics, Inc. and subsidiaries (the "Company") as of May 31, 2017, and the related consolidated statement of operations, comprehensive income (loss), stockholders' equity, and cash flows for the year ended May 31, 2017. Our audit also included the financial statement schedule for the year ended May 31, 2017 listed in the Index at Item 15. These consolidated financial statements and financial statement schedule are the responsibility of the Company's management. Our responsibility is to express an opinion on these consolidated financial statements and financial statement schedule based on our audit.
We conducted our audit in accordance with the standards of the Public Company Accounting Oversight Board (United States). Those standards require that we plan and perform the audit to obtain reasonable assurance about whether the financial statements are free of material misstatement. An audit includes examining, on a test basis, evidence supporting the amounts and disclosures in the financial statements. An audit also includes assessing the accounting principles used and significant estimates made by management, as well as evaluating the overall financial statement presentation. We believe that our audit provides a reasonable basis for our opinion.
In our opinion, such consolidated financial statements present fairly, in all material respects, the financial position of AngioDynamics, Inc. and subsidiaries as of May 31, 2017, and the results of their operations and their cash flows for the year ended May 31, 2017, in conformity with accounting principles generally accepted in the United States of America. Also, in our opinion, such financial statement schedule, when considered in relation to the basic consolidated financial statements taken as a whole, present fairly, in all material respects, the information set forth therein.
We have also audited, in accordance with the standards of the Public Company Accounting Oversight Board (United States), the Company's internal control over financial reporting as of May 31, 2017, based on the criteria established in
Internal Control - Integrated Framework (2013)
issued by the Committee of Sponsoring Organizations of the Treadway Commission and our report dated
August 4, 2017
expressed an unqualified opinion on the Company's internal control over financial reporting.
/s/ Deloitte & Touche LLP
Boston, Massachusetts
August 4, 2017
58
Report of Independent Registered Public Accounting Firm
To
the Board of Directors and Stockholders of AngioDynamics, Inc.
In our opinion, the consolidated balance sheet as of May 31, 2016 and the related consolidated statements of operations, of comprehensive income (loss), of stockholders’ equity, and of cash flows for each of the two years in the period ended May 31, 2016 present fairly, in all material respects, the financial position of AngioDynamics, Inc. and its subsidiaries (the Company) as of May 31, 2016 and the results of their operations and their cash flows for each of the two years in the period ended May 31, 2016, in conformity with accounting principles generally accepted in the United States of America. In addition, in our opinion, the financial statement schedule listed in the index appearing under Item 15(a)(2) for each of the two years in the period ended May 31, 2016 presents fairly, in all material respects, the information set forth therein when read in conjunction with the related consolidated financial statements. These financial statements and financial statement schedule are the responsibility of the Company's management. Our responsibility is to express an opinion on these financial statements and financial statement schedule based on our audits. We conducted our audits of these financial statements in accordance with the standards of the Public Company Accounting Oversight Board (United States). Those standards require that we plan and perform the audit to obtain reasonable assurance about whether the financial statements are free of material misstatement. An audit includes examining, on a test basis, evidence supporting the amounts and disclosures in the financial statements, assessing the accounting principles used and significant estimates made by management, and evaluating the overall financial statement presentation. We believe that our audits provide a reasonable basis for our opinion.
/s/ PricewaterhouseCoopers LLP
Boston, Massachusetts
August 1, 2016
59
AngioDynamics, Inc. and Subsidiaries
CONSOLIDATED STATEMENTS OF OPERATIONS
(in thousands, except per share data)
|
|
Year ended May 31,
|
||||||||||
|
|
2017
|
2016
|
2015
|
||||||||
|
Net sales
|
$
|
349,643
|
|
$
|
353,890
|
|
$
|
356,534
|
|
||
|
Cost of sales (exclusive of intangible amortization)
|
173,474
|
|
179,574
|
|
180,738
|
|
|||||
|
Gross profit
|
176,169
|
|
174,316
|
|
175,796
|
|
|||||
|
Operating expenses
|
|||||||||||
|
Research and development
|
25,269
|
|
25,053
|
|
26,594
|
|
|||||
|
Sales and marketing
|
78,819
|
|
83,743
|
|
82,351
|
|
|||||
|
General and administrative
|
31,406
|
|
30,583
|
|
30,031
|
|
|||||
|
Amortization of intangibles
|
17,296
|
|
17,964
|
|
17,966
|
|
|||||
|
Change in fair value of contingent consideration
|
(15,261
|
)
|
948
|
|
(8,096
|
)
|
|||||
|
Acquisition, restructuring and other items, net
|
27,510
|
|
12,591
|
|
26,257
|
|
|||||
|
Medical device excise tax
|
(1,837
|
)
|
2,416
|
|
4,142
|
|
|||||
|
Total operating expenses
|
163,202
|
|
173,298
|
|
179,245
|
|
|||||
|
Operating income (loss)
|
12,967
|
|
1,018
|
|
(3,449
|
)
|
|||||
|
Other (expenses) income
|
|||||||||||
|
Interest expense, net
|
(2,839
|
)
|
(3,385
|
)
|
(3,193
|
)
|
|||||
|
Other expense
|
(281
|
)
|
(886
|
)
|
(1,489
|
)
|
|||||
|
Total other expenses, net
|
(3,120
|
)
|
(4,271
|
)
|
(4,682
|
)
|
|||||
|
Income (loss) before income tax expense (benefit)
|
9,847
|
|
(3,253
|
)
|
(8,131
|
)
|
|||||
|
Income tax expense (benefit)
|
4,839
|
|
40,337
|
|
(4,743
|
)
|
|||||
|
Net income (loss)
|
$
|
5,008
|
|
$
|
(43,590
|
)
|
$
|
(3,388
|
)
|
||
|
Earnings (loss) per share
|
|||||||||||
|
Basic
|
$
|
0.14
|
|
$
|
(1.21
|
)
|
$
|
(0.09
|
)
|
||
|
Diluted
|
$
|
0.14
|
|
$
|
(1.21
|
)
|
$
|
(0.09
|
)
|
||
|
Weighted average shares outstanding
|
|||||||||||
|
Basic
|
36,617
|
|
36,161
|
|
35,683
|
|
|||||
|
Diluted
|
36,959
|
|
36,161
|
|
35,683
|
|
|||||
The accompanying notes are an integral part of these consolidated financial statements.
60
AngioDynamics, Inc. and Subsidiaries
CONSOLIDATED STATEMENTS OF COMPREHENSIVE INCOME (LOSS)
(in thousands)
|
|
Year ended May 31,
|
||||||||||
|
|
2017
|
2016
|
2015
|
||||||||
|
Net income (loss)
|
$
|
5,008
|
|
$
|
(43,590
|
)
|
$
|
(3,388
|
)
|
||
|
Other comprehensive income (loss), before tax:
|
|||||||||||
|
Unrealized gain (loss) on marketable securities
|
12
|
|
(11
|
)
|
(120
|
)
|
|||||
|
Unrealized gain (loss) on interest rate swap
|
—
|
|
257
|
|
296
|
|
|||||
|
Foreign currency translation gain (loss)
|
(545
|
)
|
(112
|
)
|
(264
|
)
|
|||||
|
Other comprehensive income (loss), before tax
|
(533
|
)
|
134
|
|
(88
|
)
|
|||||
|
Income tax benefit (expense) related to items of other comprehensive income (loss)
|
—
|
|
(92
|
)
|
(64
|
)
|
|||||
|
Other comprehensive income (loss), net of tax
|
(533
|
)
|
42
|
|
(152
|
)
|
|||||
|
Total comprehensive income (loss), net of tax
|
$
|
4,475
|
|
$
|
(43,548
|
)
|
$
|
(3,540
|
)
|
||
The accompanying notes are an integral part of these consolidated financial statements.
61
AngioDynamics, Inc. and Subsidiaries
CONSOLIDATED BALANCE SHEETS
(in thousands, except share data)
|
May 31,
2017 |
May 31,
2016 |
||||||
|
Assets
|
|||||||
|
Current Assets
|
|||||||
|
Cash and cash equivalents
|
$
|
47,544
|
|
$
|
32,333
|
|
|
|
Marketable securities, at fair value
|
1,215
|
|
1,653
|
|
|||
|
Accounts receivable, net of allowances of $2,945 and $4,372, respectively
|
44,523
|
|
52,867
|
|
|||
|
Inventories
|
54,506
|
|
55,370
|
|
|||
|
Prepaid income taxes
|
336
|
|
788
|
|
|||
|
Prepaid expenses and other
|
5,790
|
|
3,243
|
|
|||
|
Total current assets
|
153,914
|
|
146,254
|
|
|||
|
Property, plant and equipment, net
|
45,234
|
|
48,284
|
|
|||
|
Other assets
|
1,886
|
|
3,827
|
|
|||
|
Intangible assets, net
|
145,675
|
|
166,577
|
|
|||
|
Goodwill
|
361,252
|
|
361,252
|
|
|||
|
Total Assets
|
$
|
707,961
|
|
$
|
726,194
|
|
|
|
Liabilities and Stockholders' Equity
|
|||||||
|
Current Liabilities
|
|||||||
|
Accounts payable
|
$
|
18,087
|
|
$
|
15,616
|
|
|
|
Accrued liabilities
|
38,804
|
|
21,942
|
|
|||
|
Current portion of long-term debt
|
5,000
|
|
16,250
|
|
|||
|
Current portion of contingent consideration
|
9,625
|
|
12,919
|
|
|||
|
Total current liabilities
|
71,516
|
|
66,727
|
|
|||
|
Long-term debt, net of current portion
|
91,320
|
|
104,291
|
|
|||
|
Deferred income taxes
|
26,112
|
|
21,684
|
|
|||
|
Contingent consideration, net of current portion
|
3,136
|
|
25,356
|
|
|||
|
Other long-term liabilities
|
850
|
|
908
|
|
|||
|
Total Liabilities
|
192,934
|
|
218,966
|
|
|||
|
Commitments and Contingencies (Note 15)
|
|
|
|||||
|
Stockholders’ Equity
|
|||||||
|
Preferred stock, par value $.01 per share, 5,000,000 shares authorized; no shares issued and outstanding
|
—
|
|
—
|
|
|||
|
Common stock, par value $.01 per share, 75,000,000 shares authorized; 37,210,091 and 36,420,403 shares issued and 36,840,091 and 36,278,098 shares outstanding at May 31, 2017 and 2016, respectively
|
367
|
|
363
|
|
|||
|
Additional paid-in capital
|
532,705
|
|
525,775
|
|
|||
|
Accumulated deficit
|
(11,007
|
)
|
(16,015
|
)
|
|||
|
Treasury stock, 370,000 and 142,305 shares, at cost at May 31, 2017 and 2016, respectively
|
(5,714
|
)
|
(2,104
|
)
|
|||
|
Accumulated other comprehensive loss
|
(1,324
|
)
|
(791
|
)
|
|||
|
Total Stockholders' Equity
|
515,027
|
|
507,228
|
|
|||
|
Total Liabilities and Stockholders' Equity
|
$
|
707,961
|
|
$
|
726,194
|
|
|
The accompanying notes are an integral part of these consolidated financial statements.
62
AngioDynamics, Inc. and Subsidiaries
CONSOLIDATED STATEMENTS OF STOCKHOLDERS’ EQUITY
Year ended
May 31, 2017
,
2016
and
2015
(in thousands, except share data)
|
Common Stock
|
Additional
paid in
capital
|
Retained
earnings (accumulated deficit)
|
Accumulated
other
comprehensive
loss
|
Treasury Stock
|
Total
|
||||||||||||||||||||||||
|
Shares
|
Amount
|
Shares
|
Amount
|
||||||||||||||||||||||||||
|
Balance at May 31, 2014
|
35,442,004
|
|
$
|
353
|
|
$
|
508,354
|
|
$
|
30,963
|
|
$
|
(681
|
)
|
(142,305
|
)
|
$
|
(2,104
|
)
|
$
|
536,885
|
|
|||||||
|
Net loss
|
(3,388
|
)
|
(3,388
|
)
|
|||||||||||||||||||||||||
|
Exercise of stock options
|
341,446
|
|
3
|
|
4,335
|
|
4,338
|
|
|||||||||||||||||||||
|
Issuance/cancellation of restricted stock units
|
141,274
|
|
2
|
|
—
|
|
2
|
|
|||||||||||||||||||||
|
Purchase of common stock under Employee Stock Purchase Plan
|
119,001
|
|
2
|
|
1,414
|
|
1,416
|
|
|||||||||||||||||||||
|
Stock-based compensation
|
5,998
|
|
5,998
|
|
|||||||||||||||||||||||||
|
Other comprehensive income (loss), net of tax
|
(152
|
)
|
(152
|
)
|
|||||||||||||||||||||||||
|
Balance at May 31, 2015
|
36,043,725
|
|
$
|
360
|
|
$
|
520,101
|
|
$
|
27,575
|
|
$
|
(833
|
)
|
(142,305
|
)
|
$
|
(2,104
|
)
|
$
|
545,099
|
|
|||||||
|
Net loss
|
(43,590
|
)
|
(43,590
|
)
|
|||||||||||||||||||||||||
|
Exercise of stock options
|
101,040
|
|
1
|
|
1,296
|
|
1,297
|
|
|||||||||||||||||||||
|
Issuance/cancellation of restricted stock units
|
137,681
|
|
1
|
|
(332
|
)
|
(331
|
)
|
|||||||||||||||||||||
|
Purchase of common stock under Employee Stock Purchase Plan
|
137,957
|
|
1
|
|
1,470
|
|
1,471
|
|
|||||||||||||||||||||
|
Stock-based compensation
|
3,240
|
|
3,240
|
|
|||||||||||||||||||||||||
|
Other comprehensive income (loss), net of tax
|
42
|
|
42
|
|
|||||||||||||||||||||||||
|
Balance at May 31, 2016
|
36,420,403
|
|
$
|
363
|
|
$
|
525,775
|
|
$
|
(16,015
|
)
|
$
|
(791
|
)
|
(142,305
|
)
|
$
|
(2,104
|
)
|
$
|
507,228
|
|
|||||||
|
Net income
|
5,008
|
|
5,008
|
|
|||||||||||||||||||||||||
|
Exercise of stock options
|
751,062
|
|
7
|
|
9,858
|
|
9,865
|
|
|||||||||||||||||||||
|
Issuance/cancellation of restricted stock units
|
158,341
|
|
1
|
|
(587
|
)
|
(586
|
)
|
|||||||||||||||||||||
|
Issuance of performance share units
|
23,405
|
|
—
|
|
—
|
|
—
|
|
|||||||||||||||||||||
|
Purchase of common stock under Employee Stock Purchase Plan
|
129,185
|
|
1
|
|
1,418
|
|
1,419
|
|
|||||||||||||||||||||
|
Stock-based compensation
|
6,183
|
|
6,183
|
|
|||||||||||||||||||||||||
|
Treasury stock retirement
|
(642,305
|
)
|
(2
|
)
|
(9,942
|
)
|
642,305
|
|
9,944
|
|
—
|
|
|||||||||||||||||
|
Common stock repurchased
|
370,000
|
|
(3
|
)
|
(870,000
|
)
|
(13,554
|
)
|
(13,557
|
)
|
|||||||||||||||||||
|
Other comprehensive income (loss), net of tax
|
(533
|
)
|
(533
|
)
|
|||||||||||||||||||||||||
|
Balance at May 31, 2017
|
37,210,091
|
|
$
|
367
|
|
$
|
532,705
|
|
$
|
(11,007
|
)
|
$
|
(1,324
|
)
|
(370,000
|
)
|
$
|
(5,714
|
)
|
$
|
515,027
|
|
|||||||
The accompanying notes are an integral part of these consolidated financial statements.
63
AngioDynamics, Inc. and Subsidiaries
(in thousands)
|
|
Year ended May 31,
|
||||||||||
|
|
2017
|
2016
|
2015
|
||||||||
|
Cash flows from operating activities:
|
|||||||||||
|
Net income (loss)
|
$
|
5,008
|
|
$
|
(43,590
|
)
|
$
|
(3,388
|
)
|
||
|
Adjustments to reconcile net income (loss) to net cash provided by operating activities:
|
|||||||||||
|
Depreciation and amortization
|
24,811
|
|
28,115
|
|
29,861
|
|
|||||
|
Deferred income tax provision
|
4,428
|
|
39,983
|
|
(5,123
|
)
|
|||||
|
Stock based compensation
|
6,183
|
|
3,240
|
|
5,998
|
|
|||||
|
Changes in accounts receivable allowances
|
(313
|
)
|
2,377
|
|
1,448
|
|
|||||
|
Write-off of other assets
|
2,685
|
|
—
|
|
—
|
|
|||||
|
Change in fair value of contingent consideration
|
(15,261
|
)
|
948
|
|
(8,096
|
)
|
|||||
|
Loss on impairment/disposal of long-term assets
|
3,930
|
|
806
|
|
9,381
|
|
|||||
|
Loss on impairment of intangible assets
|
—
|
|
384
|
|
6,400
|
|
|||||
|
Other
|
(586
|
)
|
90
|
|
181
|
|
|||||
|
Changes in operating assets and liabilities, net of effects of acquisitions:
|
|||||||||||
|
Accounts receivable
|
8,479
|
|
3,131
|
|
2,095
|
|
|||||
|
Inventories
|
687
|
|
11,976
|
|
(5,648
|
)
|
|||||
|
Prepaid expenses and other
|
(3,520
|
)
|
712
|
|
(1,170
|
)
|
|||||
|
Accounts payable, accrued liabilities and other long-term liabilities
|
19,214
|
|
(2,956
|
)
|
(6,254
|
)
|
|||||
|
Net cash provided by operating activities
|
55,745
|
|
45,216
|
|
25,685
|
|
|||||
|
Cash flows from investing activities:
|
|||||||||||
|
Additions to property, plant and equipment
|
(3,001
|
)
|
(2,326
|
)
|
(11,383
|
)
|
|||||
|
Acquisition of intangible assets
|
—
|
|
(3,268
|
)
|
(1,353
|
)
|
|||||
|
Acquisition of warrants
|
—
|
|
(2,000
|
)
|
—
|
|
|||||
|
Proceeds from sale or maturity of marketable securities
|
450
|
|
25
|
|
—
|
|
|||||
|
Net cash used in investing activities
|
(2,551
|
)
|
(7,569
|
)
|
(12,736
|
)
|
|||||
|
Cash flows from financing activities:
|
|||||||||||
|
Repayment of long-term debt
|
(140,381
|
)
|
(16,250
|
)
|
(20,000
|
)
|
|||||
|
Proceeds from issuance of and borrowings on long-term debt
|
116,471
|
|
—
|
|
15,000
|
|
|||||
|
Proceeds from exercise of stock options and ESPP
|
10,698
|
|
2,437
|
|
5,757
|
|
|||||
|
Payment of acquisition related contingent consideration
|
(9,850
|
)
|
(9,850
|
)
|
(11,222
|
)
|
|||||
|
Deferred financing costs on long-term debt
|
(1,364
|
)
|
—
|
|
—
|
|
|||||
|
Repurchase of common stock
|
(13,557
|
)
|
—
|
|
—
|
|
|||||
|
Net cash used in financing activities
|
(37,983
|
)
|
(23,663
|
)
|
(10,465
|
)
|
|||||
|
Effect of exchange rate changes on cash and cash equivalents
|
—
|
|
(42
|
)
|
(198
|
)
|
|||||
|
Increase in cash and cash equivalents
|
15,211
|
|
13,942
|
|
2,286
|
|
|||||
|
Cash and cash equivalents at beginning of year
|
32,333
|
|
18,391
|
|
16,105
|
|
|||||
|
Cash and cash equivalents at end of year
|
$
|
47,544
|
|
$
|
32,333
|
|
$
|
18,391
|
|
||
The accompanying notes are an integral part of these consolidated financial statements.
64
AngioDynamics, Inc. and Subsidiaries
CONSOLIDATED STATEMENTS OF CASH FLOWS—(Continued)
(in thousands)
|
|
Year ended May 31,
|
||||||||||
|
|
2017
|
2016
|
2015
|
||||||||
|
Supplemental disclosures of cash flow information:
|
|||||||||||
|
Supplemental disclosure of non-cash investing and financing activities:
|
|||||||||||
|
Contractual obligations for purchase of fixed assets
|
$
|
26
|
|
$
|
75
|
|
$
|
140
|
|
||
|
Contractual obligations for tax basis adjustment
|
—
|
|
—
|
|
779
|
|
|||||
|
Cash paid (received) during the year for:
|
|||||||||||
|
Interest
|
$
|
2,969
|
|
$
|
3,063
|
|
$
|
3,151
|
|
||
|
Income taxes
|
(102
|
)
|
332
|
|
699
|
|
|||||
The accompanying notes are an integral part of these consolidated financial statements.
65
AngioDynamics, Inc. and Subsidiaries
NOTES TO CONSOLIDATED FINANCIAL STATEMENTS
1. BASIS OF PRESENTATION, BUSINESS DESCRIPTION AND SUMMARY OF SIGNIFICANT ACCOUNTING POLICIES
Basis of Presentation and Description of Business
The consolidated financial statements include the accounts of AngioDynamics, Inc. and its wholly owned subsidiaries, (collectively, the “Company”). The Company designs, manufactures and sells a wide range of medical, surgical and diagnostic devices used by professional healthcare providers for vascular access, for the treatment of peripheral vascular disease and in oncology and surgical settings. The devices are generally used in minimally invasive, image-guided procedures. Most of the Company's products are intended to be used once and then discarded, or they may be temporarily implanted for short- or long-term use.
Accounting Principles
The consolidated financial statements and accompanying notes have been prepared in conformity with accounting principles generally accepted in the United States of America ("GAAP").
Principles of Consolidation
The consolidated financial statements include the accounts of AngioDynamics and it subsidiaries (all of which are wholly owned). All intercompany balances and transactions have been eliminated.
Use of Estimates
The preparation of financial statements, in conformity with accounting principles generally accepted in the United States of America, requires management to make estimates and assumptions that affect the reported amounts of assets and liabilities and disclosure of contingent assets and liabilities at the date of the consolidated financial statements. Estimates also affect reported amounts of sales and expenses during the reporting period. Actual results could differ from those estimates.
Reclassifications
Certain reclassifications have been made to conform the prior year consolidated financial statements and notes to the current year presentation. These include a reclassification of bad debt expense from Sales and Marketing to General and Administrative. The amount of the reclassification related to fiscal year 2016 is
$1.0 million
and fiscal year 2015 is
$0.9 million
. The adoption of ASC Update No. 2015-03 resulted in a reclassification of
$0.9 million
from other assets to long-term debt in the Company's consolidated balance sheet as of May 31, 2016.
Cash and Cash Equivalents
The Company considers all unrestricted highly liquid investments with an initial maturity of
less than three months
at the date of purchase to be cash equivalents. The Company maintains cash and cash equivalent balances with financial institutions in the United States in excess of amounts insured by the Federal Deposit Insurance Corporation.
Marketable Securities
Marketable securities, which include auction rate investments, are classified as “available-for-sale securities” and are reported at fair value, with unrealized gains and losses excluded from operations and reported as a component of accumulated other comprehensive income (loss), net of the related tax effects, in stockholders’ equity. Cost is determined using the specific identification method. The Company holds investments in auction rate securities in order to generate higher than typical money market rate investment returns. Auction rate securities typically are high credit quality, generally achieved with municipal bond insurance. As of
May 31, 2017
and
2016
, the Company had
$1.2 million
and
$1.7 million
, respectively, in investments in
two
auction rate securities issued by New York state and local government authorities that failed auctions. The authorities are current in their interest payments on the securities.
66
Fair Value Instruments
The carrying amount of the Company's cash and cash equivalents, accounts receivable, accounts payable and long-term debt approximates fair value due to the short-term nature or market interest rates of these items. The Company bases the fair value of short-term investments on quoted market prices or other relevant information generated by market transactions involving identical or comparable assets. The Company measures and records derivative financial instruments at fair value. See Note 3 for further discussion of financial instruments that are carried at fair value on a recurring and nonrecurring basis.
Accounts Receivable
Accounts receivable, principally trade receivables, are generally due within
30
to
90
days and are stated at amounts due from customers, net of an allowance for estimated sales returns and doubtful accounts. The Company performs ongoing credit evaluations of customers and adjusts credit limits based upon payment history and the customer’s current creditworthiness, as determined by a review of their current credit information. The Company continuously monitors aging reports, collections and payments from customers, and a provision for estimated credit losses is maintained based upon historical experience and any specific customer collection issues that have been identified. While such credit losses have historically been within expectations and the provisions established, the Company cannot guarantee that the same credit loss rates will be experienced in the future. The Company writes off accounts receivable when they are determined to be uncollectible.
Inventories
Inventories are stated at the lower of cost (using the first-in, first-out method) or market. Appropriate consideration is given to deterioration, obsolescence, expiring and other factors in evaluating net realizable value.
Property, Plant and Equipment
Property, plant and equipment are stated at cost, less accumulated depreciation. Depreciation is computed using the straight-line method over the estimated useful lives of the assets. Refer below for useful lives by category:
|
Estimated useful lives
|
||
|
Building and building improvements
|
39 years
|
|
|
Machinery and equipment
|
3 to 8 years
|
|
|
Computer software and equipment
|
3 to 10 years
|
|
The Company evaluates property, plant and equipment for impairment periodically to determine if changes in circumstances or the occurrence of events suggest the carrying value of the asset or asset group may not be recoverable. Expenditures for repairs and maintenance are charged to expense as incurred. Renewals and betterments are capitalized.
Goodwill and Intangible Assets
Intangible assets other than goodwill and acquired IP R&D are amortized over their estimated useful lives, which range between
two
and
eighteen
years, on either a straight-line basis over the expected period of benefit or as revenues are earned from the sales of the related products. The Company periodically reviews the estimated useful lives of intangible assets and review such assets for impairment whenever events or changes in circumstances indicate that the carrying value of the asset or asset group is not recoverable. The Company determines the fair value of the reporting unit based on the market valuation approach or the income approach. If an intangible asset or asset group is considered to be impaired, the amount of the impairment will equal the excess of the carrying value over the fair value of the asset.
Acquired IP R&D has an indefinite life and is not amortized until completion of the development of the project, at which time the IP R&D becomes an amortizable asset. If the related project is not completed in a timely manner or the project is terminated or abandoned, the Company may have an impairment related to the IP R&D, calculated as the excess of the asset’s carrying value over its fair value.
The Company's policy defines IP R&D as the value assigned to those projects for which the related products have not received regulatory approval and have no alternative future use. Determining the portion of the purchase price allocated to IP R&D requires us to make significant estimates. The amount of the purchase price allocated to IP R&D is determined by estimating the future cash flows of each project or technology and discounting the net cash flows back to their present values.
67
The discount rate used is determined at the time of measurement in accordance with accepted valuation methods. These methodologies include consideration of the risk of the project not achieving commercial feasibility.
Goodwill is the amount by which the cost of acquired net assets in a business combination exceeded the fair value of net identifiable assets on the date of purchase. Goodwill and other intangible assets that have indefinite useful lives are not amortized, but rather, are tested for impairment annually or more frequently if impairment indicators arise.
For goodwill, the impairment test requires a comparison of the estimated fair value of the reporting unit to which the goodwill is assigned to carrying value of the assets and liabilities of that reporting unit. The determination of reporting units also requires management judgment. The Company considers whether a reporting unit exists within a reportable segment based on the availability of discrete financial information. If carrying value of the reporting unit exceeds the fair value of the reporting unit, the carrying value of the reporting unit’s goodwill is reduced to its implied fair value through an adjustment to the goodwill balance, resulting in an impairment charge. The Company utilizes either discounted cash flow models or other valuation models, such as comparative transactions and market multiples, to determine the fair value of our reporting unit. The Company makes assumptions about future cash flows, future operating plans, discount rates, comparable companies, market multiples, purchase price premiums and other factors in those models. Different assumptions and judgment determinations could yield different conclusions that would result in an impairment charge to income in the period that such change or determination was made.
Contingent Consideration
The fair value of the liability for contingent consideration recorded on the acquisition date for a business combination is based on probability weighted estimated cash flow streams, discounted back to present value using a discount rate determined in accordance with accepted valuation methods and reflective of the risk associated with the estimated cash flow streams. The liability for contingent consideration is remeasured to fair value at each reporting period with changes recorded in earnings until the contingency is resolved.
Revenue Recognition
The Company recognizes revenue when the following four criteria has been met: (i) persuasive evidence that an arrangement exists; (ii) the price is fixed or determinable; (iii) collectability is reasonably assured; and (iv) product delivery has occurred or services have been rendered. The Company recognizes revenue, net of sales taxes assessed by any governmental authority, as products are shipped, based on shipping terms, and when title and risk of loss passes to customers. The Company negotiates shipping and credit terms on a customer-by-customer basis and products are shipped at an agreed upon price. All product returns must be pre-approved by the Company and customers may be subject to a
20%
restocking charge. To be accepted, a returned product must be unadulterated, undamaged and have at least
twelve months
remaining prior to its expiration date. Charges for discounts, returns, rebates and other allowances are recognized as a deduction from revenue on an accrual basis in the period in which the revenue is recorded. The accrual for product returns, discounts and other allowances is based on the Company’s history.
Shipping and handling costs, associated with the distribution of finished products to customers, are recorded in costs of goods sold and are recognized when the related finished product is shipped to the customer. Amounts charged to customers for shipping are recorded in net sales.
Research and Development
Research and development costs, including salaries, consulting fees, building costs, utilities and administrative expenses that are related to developing new products, enhancing existing products, validating new and enhanced products, managing clinical, regulatory and medical affairs are expensed as incurred.
68
Income Taxes
The Company calculates income tax expense for each jurisdiction in which it operates. This involves estimating actual current taxes due plus assessing temporary differences arising from differing treatment for tax and accounting purposes that are recorded as deferred tax assets and liabilities. The Company periodically evaluates deferred tax assets, capital loss carryforwards and tax credit carryforwards to determine their recoverability based primarily on the Company's ability to generate future taxable income and capital gains. Where it is more-likely-than-not these will not be recovered, the Company estimates a valuation allowance and records a corresponding additional tax expense in the consolidated statement of operations.
The Company recognizes and measures uncertain tax positions taken or expected to be taken in a tax return utilizing a two-step approach. The Company first determines if the weight of available evidence indicates that it is more likely than not that the tax position will be sustained on audit, including resolution of any related appeals or litigation processes. The second step is that the Company measures the tax benefit as the largest amount that is more likely than not to be realized upon ultimate settlement. The Company recognizes interest and penalties related to uncertain tax positions in the provision for income taxes on the consolidated statements of operations.
Warranty Costs
The Company makes periodic provisions for expected warranty costs. Historically, warranty costs have been insignificant.
Stock Based Compensation
Stock-based compensation expense reflects the fair value of stock-based awards measured at the grant date and recognized over the relevant service period. The Company estimates the fair value of each stock-based award on the measurement date using either the current market price of the stock, the Black-Scholes option valuation model, or the Monte Carlo Simulation valuation model. The Black-Scholes and Monte Carlo Simulation valuation models incorporate assumptions as to stock price volatility, the expected life of options or restricted stock units, a risk-free interest rate and dividend yield. The Company recognizes stock-based compensation expense related to options, restricted stock units and market based performance stock units on a straight-line basis over the service period of the award, which is generally
4
years for options and restricted stock units and
3
years for market based performance stock units.
Foreign Currency Translation
The functional currency of most of the Company's foreign subsidiaries is the local currency in which the subsidiary operates. For foreign operations where the local currency is considered to be the functional currency, the Company translates assets and liabilities into U.S. dollars at the exchange rate on the balance sheet date. The Company translates income and expense items at average rates of exchange prevailing during each period. The Company accumulates translation adjustments in accumulated other comprehensive loss, a component of stockholders’ equity.
For foreign operations where the U.S. dollar is considered to be the functional currency, the Company remeasures monetary assets and liabilities into U.S. dollars at the exchange rate on the balance sheet date and non-monetary assets and liabilities are remeasured into U.S. dollars at historical exchange rates. The Company translates income and expense items at average rates of exchange prevailing during each period. The Company recognizes remeasurement adjustments as a component of other expense in the consolidated statements of operations.
Transaction gains or losses that arise from exchange rate fluctuations on transactions denominated in a currency other than the functional currency are included in other expense in the statements of operations as incurred.
Derivative Financial Instruments
The Company is exposed to market risks, including changes in foreign currency and interest rates. The Company periodically enters into certain derivative financial instruments to hedge the underlying economic exposure.
Derivative instruments are presented in the consolidated financial statements at their fair value. Changes in the fair value of derivative financial instruments are either recognized periodically in income or in stockholders’ equity as a component of accumulated other comprehensive income (loss) depending on whether the derivative financial instrument qualifies for hedge accounting and, if so, whether it qualifies as a fair value or cash flow hedge. Generally, the changes in the fair value of derivatives accounted for as fair value hedges are recorded in income along with the portions of the changes in the fair value of hedged items that relate to the hedged risks. Changes in the fair value of derivatives accounted for as cash flow hedges, to the extent they are effective as hedges, are recorded in accumulated other comprehensive income (loss).
Contingencies
The Company is subject to various legal proceedings that arise in the ordinary course of business, including patent infringement and product liability matters. The Company records accruals for contingencies when it is probable the liability has been incurred and the amount can be reasonably estimated. Legal fees are expensed as incurred. Insurance recoveries related to potential claims are recognized up to the amount of the recorded liability when coverage is confirmed and the estimated recoveries are probable of payment. These recoveries are not netted against the related liabilities for financial statement presentation.
Recently Issued Accounting Pronouncements - Adopted
In April 2015, the Financial Accounting Standards Board ("FASB") issued ASC Update No. 2015-03,
Interest-Imputation of Interest (Subtopic 835-30): Simplifying the Presentation of Debt Issuance Costs
. Update No. 2015-03 requires debt issuance costs related to a recognized debt liability to be presented in the balance sheet as a direct deduction from the carrying amount of that debt liability, consistent with debt discounts. Update No. 2015-03 is effective for annual reporting periods beginning after December 15, 2015 and interim periods within those reporting periods. This was adopted in the first quarter of fiscal 2017 and the Company reclassified
$0.9 million
from other assets to long-term debt, net in the balance sheet as of May 31, 2016.
Recently Issued Accounting Pronouncements - Not Yet Applicable or Adopted
In May 2014, the FASB issued ASU No. 2014-09,
Revenue from Contracts with Customers (ASU 2014-09)
. ASU 2014-09 provides a single, comprehensive accounting model for revenues arising from contracts with customers that supersedes most of the existing revenue recognition guidance, including industry-specific guidance. Under this model, revenue is recognized at an amount that an entity expects to be entitled to upon transferring control of goods or services to a customer, as opposed to when risks and rewards transfer to a customer under existing revenue recognition guidance. ASU 2014-09 is effective for the Company beginning in its fiscal year 2019, and may be applied retrospectively to all prior periods presented or through a cumulative adjustment to the opening retained earnings balance in the year of adoption. The Company is currently in the process of evaluating the impact of ASU 2014-09 on its consolidated financial statements.
In July 2015, the FASB issued ASC Update No. 2015-11,
Inventory (Topic 330): Simplifying the Measurement of Inventory
. Update No. 2015-11 more closely aligns the measurement of inventory in U.S. GAAP with the measurement of inventory in International Financial Reporting Standards by requiring companies using the first-in, first-out and average costs methods to measure inventory using the lower of cost and net realizable value, where net realizable value is the estimated selling prices in the ordinary course of business, less reasonably predictable costs of completion, disposal, and transportation. Update No. 2015-11 is effective for annual reporting periods beginning after December 15, 2016 and interim periods within those fiscal years. Update No. 2015-11 should be applied prospectively with earlier application permitted as of the beginning of an interim or annual reporting period. The adoption of Update No. 2015-11 is not expected to have a material impact on the Company's financial position or results of operations.
In February 2016, the FASB issued ASU 2016-02,
Leases (Topic 842)
. ASU 2016-02 increases transparency and comparability among organizations by recognizing lease assets and liabilities on the balance sheet and disclosing key information about leasing arrangements. For leases with a term or twelve months or less, a lessee is permitted to make an accounting policy election by class of underlying asset not to recognize lease assets and liabilities. ASU 2016-02 is effective for fiscal years beginning after December 15, 2018 and early application is permitted. The Company is currently in the process of evaluating the impact of ASU 2016-02 on its consolidated financial statements.
In March 2016, the FASB issued ASU 2016-09,
Compensation - Stock Based Compensation (Topic 718: Improvements to Employee Share-Based Payment Accounting)
. ASU 2016-09 simplifies and improves various aspects of ASC 718 for share-based payments, including income tax items and the classification of these items on the statement of cash flows. ASU 2016-09 is effective for annual periods beginning after December 31, 2016 and early application is permitted. The Company is currently in the process of evaluating the impact of ASU 2016-09 on its consolidated financial statements.
In August 2016, the FASB issued ASU No. 2016-15,
Statement of Cash Flows (Topic 230): Classification of Certain Cash Receipts and Cash Payments (ASU 2016-15)
. ASU 2016-15 identifies how certain cash receipts and cash payments are presented and classified in the Statement of Cash Flows under Topic 230. ASU 2016-15 is effective for the Company for fiscal years beginning after December 15, 2017, and interim periods within those fiscal years. ASU 2016-15 should be applied retrospectively and early adoption is permitted, including adoption in an interim period. The Company is currently in the process of evaluating the impact of ASU 2016-15 on its consolidated financial statements.
In January 2017, the FASB issued ASU 2017-04,
Intangibles - Goodwill and Other (Topic 350)
, which simplifies the subsequent measurement of goodwill by eliminating steps from the goodwill impairment test. ASU 2017-04 should be adopted for annual or interim goodwill impairment tests in fiscal years beginning after December 15, 2019. ASU 2017-04 should be applied prospectively and early adoptions is permitted, including adoption in an interim period. The Company is currently evaluating the impact of ASU 2017-04 on its consolidated financial statements.
69
2. OTHER ASSETS
In 2015, the Company filed an 8-K stating that it executed a non-binding letter of intent to enter into a strategic relationship with privately-held EmboMedics Inc., which develops injectable and resorbable embolic microspheres.
The Company made an initial
$2.0 million
purchase of non-transferable warrants in a subsidiary of EmboMedics which become exercisable upon a change of control of EmboMedics. The Company did not have significant influence, or control of the subsidiary. This initial investment was recorded at cost and the Company reviewed for impairment at each balance sheet date.
In the second quarter of fiscal year 2017, the Company decided to terminate its agreements with EmboMedics. The termination of these agreements resulted in a write-off of the initial
$2.0 million
investment in EmboMedics which is included in acquisition, restructuring and other items, net on the consolidated statements of operations.
3. FAIR VALUE OF FINANCIAL INSTRUMENTS
On a recurring basis, the Company measures certain financial assets and financial liabilities at fair value based upon quoted market prices, where available. Where quoted market prices or other observable inputs are not available, the Company applies valuation techniques to estimate fair value. FASB ASC Topic 820,
Fair Value Measurements and Disclosures,
establishes a three-level valuation hierarchy for disclosure of fair value measurements. The categorization of financial assets and financial liabilities within the valuation hierarchy is based upon the lowest level of input that is significant to the measurement of fair value. The three levels of the hierarchy are defined as follows:
|
•
|
Level 1 - Inputs to the valuation methodology are quoted market prices for identical assets or liabilities.
|
|
•
|
Level 2 - Inputs to the valuation methodology are other observable inputs, including quoted market prices for similar assets or liabilities and market-corroborated inputs.
|
|
•
|
Level 3 - Inputs to the valuation methodology are unobservable inputs based on management’s best estimate of inputs market participants would use in pricing the asset or liability at the measurement date, including assumptions about risk.
|
The Company's financial instruments include cash and cash equivalents, accounts receivable, marketable securities, accounts payable and contingent consideration. The carrying amount of cash and cash equivalents, accounts receivable, and accounts payable approximates fair value due to their immediate or short-term maturities. The recurring fair value measurements using significant unobservable inputs (Level 3) relate to marketable securities, which are comprised of auction rate securities, and contingent consideration liabilities.
70
The following tables provide information by level for assets and liabilities that are measured at fair value on a recurring basis:
|
|
Fair Value Measurements
using inputs considered as:
|
|
|||||||||||||
|
(in thousands)
|
Level 1
|
Level 2
|
Level 3
|
Fair Value at May 31, 2017
|
|||||||||||
|
Financial Assets
|
|||||||||||||||
|
Marketable securities
|
$
|
—
|
|
$
|
—
|
|
$
|
1,215
|
|
$
|
1,215
|
|
|||
|
Total Financial Assets
|
$
|
—
|
|
$
|
—
|
|
$
|
1,215
|
|
$
|
1,215
|
|
|||
|
Financial Liabilities
|
|||||||||||||||
|
Contingent liability for acquisition earn outs
|
$
|
—
|
|
$
|
—
|
|
$
|
12,761
|
|
$
|
12,761
|
|
|||
|
Total Financial Liabilities
|
$
|
—
|
|
$
|
—
|
|
$
|
12,761
|
|
$
|
12,761
|
|
|||
|
Fair Value Measurements
using inputs considered as:
|
|
||||||||||||||
|
(in thousands)
|
Level 1
|
Level 2
|
Level 3
|
Fair Value at May 31, 2016
|
|||||||||||
|
Financial Assets
|
|||||||||||||||
|
Marketable securities
|
$
|
—
|
|
$
|
—
|
|
$
|
1,653
|
|
$
|
1,653
|
|
|||
|
Total Financial Assets
|
$
|
—
|
|
$
|
—
|
|
$
|
1,653
|
|
$
|
1,653
|
|
|||
|
Financial Liabilities
|
|||||||||||||||
|
Contingent liability for acquisition earn outs
|
$
|
—
|
|
$
|
—
|
|
$
|
38,275
|
|
$
|
38,275
|
|
|||
|
Total Financial Liabilities
|
$
|
—
|
|
$
|
—
|
|
$
|
38,275
|
|
$
|
38,275
|
|
|||
There were no transfers in and out of Level 1, 2 and 3 measurements for the years ended
May 31, 2017
and
2016
.
The table below presents the changes in fair value components of Level 3 instruments in the year ended
May 31, 2017
(in thousands of dollars):
|
|
Financial Assets
|
Financial Liabilities
|
|||||
|
(in thousands)
|
Fair Value Measurements
Using Significant Unobservable Inputs (Level 3) |
Fair Value Measurements
Using Significant Unobservable Inputs (Level 3) |
|||||
|
Balance at May 31, 2016
|
$
|
1,653
|
|
$
|
38,275
|
|
|
|
Change in fair value of contingent consideration, net (1)
|
—
|
|
(15,261
|
)
|
|||
|
Currency (gain) loss from remeasurement
|
—
|
|
(153
|
)
|
|||
|
Fair market value adjustments
|
12
|
|
—
|
|
|||
|
Sale of securities
|
(450
|
)
|
—
|
|
|||
|
Contingent consideration payments
|
—
|
|
(10,100
|
)
|
|||
|
Balance at May 31, 2017
|
$
|
1,215
|
|
$
|
12,761
|
|
|
The Company made the decision to discontinue its investment in the TiLo product that was acquired in August 2013 as part of the Clinical Devices acquisition. This decision resulted in the write-off of the acquired in-process research and development (IPR&D) of
$3.6 million
along with a
$3.1 million
gain from the reduction in the fair value of contingent consideration liability associated with future milestones that will no longer be met. The write-off of the IPR&D is included in acquisition, restructuring and other, net on the consolidated statement of operations.
The Company revised the sales projections for the AngioVac product as a result of reviews performed by executive management across all products. The adjustments to the sales projections resulted in a
$13.4 million
gain from the reduction in the fair value of the contingent liability that is based on lower projected sales volume over the contractual earn out period.
71
The Company decided to terminate its agreement with EmboMedics which resulted in a
$2.0 million
write-off of our investment in EmboMedics (Note 2).
The table below presents the changes in fair value components of Level 3 instruments in the year ended
May 31, 2016
(in thousands of dollars):
|
Financial Assets
|
Financial Liabilities
|
||||||
|
(in thousands)
|
Fair Value Measurements
Using Significant Unobservable Inputs (Level 3) |
Fair Value Measurements
Using Significant Unobservable Inputs (Level 3) |
|||||
|
Balance at May 31, 2015
|
$
|
1,689
|
|
$
|
47,384
|
|
|
|
Change in fair value of contingent consideration (1)
|
—
|
|
948
|
|
|||
|
Currency (gain) loss from remeasurement
|
—
|
|
43
|
|
|||
|
Fair market value adjustments
|
(36
|
)
|
—
|
|
|||
|
Contingent consideration payments
|
—
|
|
(10,100
|
)
|
|||
|
Balance at May 31, 2016
|
$
|
1,653
|
|
$
|
38,275
|
|
|
(1) Change in the fair value of contingent consideration is included in earnings and comprised of changes in estimated earn out payments based on projections of company performance and amortization of the present value discount.
Marketable Securities
Marketable securities consist solely of an auction rate security. Assumptions associated with the auction rate security include the interest rate benchmarks, the probability of full repayment of the principal considering the credit quality and guarantees in place, and the rate of return required by investors to own such securities given the current liquidity risk.
Contingent Liability for Acquisition Earn Outs
Certain business combinations involve the potential for the payment of future contingent consideration upon the achievement of certain product development milestones and/or various other favorable operating conditions. Payment of the additional consideration is generally contingent on the acquired company reaching certain performance milestones, including attaining specified revenue levels or achieving product development targets. Contingent consideration is recorded at the estimated fair value of the contingent milestone payments on the acquisition date. The fair value of the contingent milestone consideration is remeasured at the estimated fair value at each reporting period with the change in fair value recognized as income or expense within change in fair value of contingent consideration in the consolidated statement of operations.
Contingent consideration liabilities will be remeasured to fair value each reporting period using projected net sales, discount rates, probabilities of payment and projected payment dates. Projected contingent payment amounts are discounted back to the current period using a discounted cash flow model. Projected net sales are based on internal projections and extensive analysis of the target market and the sales potential. Increases in projected net sales and probabilities of payment may result in higher fair value measurements in the future. Increases in discount rates and the projected time to payment may result in lower fair value measurements in the future. Increases or decreases in any valuation inputs in isolation may result in a significantly lower or higher fair value measurement in the future.
The recurring Level 3 fair value measurements of the contingent consideration liabilities include the following significant unobservable inputs as of
May 31, 2017
:
|
(in thousands)
|
Fair value at
May 31, 2017
|
Valuation
Technique
|
Unobservable
Input
|
Range
|
|||||
|
Revenue based payments
|
$
|
12,761
|
|
Discounted cash flow
|
Discount rate
Probability of payment Projected fiscal year of payment |
4%
100% 2018 - 2022 |
|||
72
At
May 31, 2017
, the estimated potential amount of undiscounted future contingent consideration that the Company expects to pay as a result of all completed acquisitions is approximately
$13.1 million
, which represents the remaining contractual minimum payments.
73
4. MARKETABLE SECURITIES
As of
May 31, 2017
, marketable securities consisted of the following:
|
Amortized
cost
|
Gross
Unrealized
Gains
|
Gross
Unrealized
Losses
|
Fair
Value
|
||||||||||||
|
(in thousands)
|
|||||||||||||||
|
Available-for-sales securities
|
|||||||||||||||
|
New York State government agency obligations
|
$
|
1,350
|
|
$
|
—
|
|
$
|
(135
|
)
|
$
|
1,215
|
|
|||
|
$
|
1,350
|
|
$
|
—
|
|
$
|
(135
|
)
|
$
|
1,215
|
|
||||
As of
May 31, 2016
, marketable securities consisted of the following:
|
Amortized
cost
|
Gross
Unrealized
Gains
|
Gross
Unrealized
Losses
|
Fair
Value
|
||||||||||||
|
(in thousands)
|
|||||||||||||||
|
Available-for-sales securities
|
|||||||||||||||
|
New York State government agency obligations
|
$
|
1,800
|
|
$
|
—
|
|
$
|
(147
|
)
|
$
|
1,653
|
|
|||
|
$
|
1,800
|
|
$
|
—
|
|
$
|
(147
|
)
|
$
|
1,653
|
|
||||
The amortized cost and fair value of marketable securities as of
May 31, 2017
, by contractual maturity, are shown below. Expected maturities may differ from contractual maturities because borrowers may have the right to call or prepay obligations with or without call or prepayment penalties.
|
Amortized
cost
|
Fair
Value
|
||||||
|
(in thousands)
|
|||||||
|
As of May 31, 2017:
|
|||||||
|
Due in one year or less
|
$
|
—
|
|
$
|
—
|
|
|
|
Due after one through five years
|
—
|
|
—
|
|
|||
|
Due after five through twenty years
(1)
|
1,350
|
|
1,215
|
|
|||
|
$
|
1,350
|
|
$
|
1,215
|
|
||
(1) This auction rate security represents investments available for current operations and are classified as current in the consolidated balance sheets.
74
5. INVENTORIES
As of
May 31, 2017
and
2016
, inventories consisted of the following:
|
May 31, 2017
|
May 31, 2016
|
||||||
|
(in thousands)
|
|||||||
|
Raw materials
|
$
|
17,563
|
|
$
|
21,669
|
|
|
|
Work in process
|
12,602
|
|
10,700
|
|
|||
|
Finished goods
|
24,341
|
|
23,001
|
|
|||
|
Total
|
$
|
54,506
|
|
$
|
55,370
|
|
|
The Company periodically reviews for both obsolescence and loss of value. The Company makes assumptions about the future demand for and market value of the inventory. Based on these assumptions, the Company estimates the amount of obsolete, expiring and slow moving inventory. The total inventory reserve at
May 31, 2017
and
2016
was
$7.3 million
and
$12.6 million
, respectively. Of the
$7.3 million
,
$2.4 million
relates to the inventory reserve for Acculis inventory as a result of the recall (Note 10). Of the
$12.6 million
in the prior year,
$5.8 million
relates to the reserve of Celerity inventory on-hand at May 31, 2016.
6. PREPAID EXPENSES AND OTHER
As of
May 31, 2017
and
2016
, prepaid expenses and other consisted of the following:
|
May 31, 2017
|
May 31, 2016
|
||||||
|
(in thousands)
|
|||||||
|
Software licenses
|
$
|
582
|
|
$
|
282
|
|
|
|
License fees
|
118
|
|
108
|
|
|||
|
Trade shows
|
162
|
|
278
|
|
|||
|
Rent
|
121
|
|
127
|
|
|||
|
Other prepaid taxes
|
208
|
|
160
|
|
|||
|
Medical device excise tax receivable
|
1,837
|
|
—
|
|
|||
|
Other
|
2,762
|
|
2,288
|
|
|||
|
Total
|
$
|
5,790
|
|
$
|
3,243
|
|
|
75
7. PROPERTY, PLANT AND EQUIPMENT, NET
As of
May 31, 2017
and
2016
, property, plant and equipment are summarized as follows:
|
May 31, 2017
|
May 31, 2016
|
||||||
|
(in thousands)
|
|||||||
|
Building and building improvements
|
$
|
40,597
|
|
$
|
39,585
|
|
|
|
Machinery and equipment
|
25,434
|
|
24,078
|
|
|||
|
Computer software and equipment
|
25,668
|
|
24,691
|
|
|||
|
Construction in progress
|
1,464
|
|
1,743
|
|
|||
|
93,163
|
|
90,097
|
|
||||
|
Less accumulated depreciation and amortization
|
(49,652
|
)
|
(43,536
|
)
|
|||
|
43,511
|
|
46,561
|
|
||||
|
Land and land improvements
|
1,723
|
|
1,723
|
|
|||
|
$
|
45,234
|
|
$
|
48,284
|
|
||
Depreciation expense for fiscal
2017
,
2016
and
2015
was
$6.0 million
,
$8.2 million
and
$9.8 million
, respectively.
76
8. GOODWILL AND INTANGIBLE ASSETS
Intangible assets other than goodwill are amortized over their estimated useful lives on either a straight-line basis or proportionately to the benefit being realized. Useful lives range from
two
to
eighteen
years. The Company periodically reviews the estimated useful lives of intangible assets and review such assets or asset groups for impairment whenever events or changes in circumstances indicate that the carrying value of the assets or asset groups may not be recoverable. If an intangible asset or asset group is considered to be impaired, the amount of the impairment will equal the excess of the carrying value over the fair value of the asset.
Goodwill is not amortized, but rather, is tested for impairment annually or more frequently if impairment indicators arise. Goodwill represents the excess of the purchase price over the fair value of the net tangible and identifiable intangible assets acquired in each business combination.
The Company's annual testing for impairment of goodwill was completed as of December 31, 2016. The Company operates as a single operating segment with
one
reporting unit and consequently evaluates goodwill for impairment based on an evaluation of the fair value of the Company as a whole. The Company determines the fair value of the reporting unit based on the market valuation approach and concluded that it was not more-likely-than-not that the fair value of the Company's reporting unit was less than its carrying value.
Even though the Company determined that there was
no
goodwill impairment as of December 31, 2016, the future occurrence of a potential indicator of impairment, such as a significant adverse change in legal, regulatory, business or economic conditions or a more-likely-than-not expectation that the reporting unit or a significant portion of the reporting unit will be sold or disposed of, would require an interim assessment for the reporting unit prior to the next required annual assessment as of December 31, 2017. The Company continued to assess for potential impairment through
May 31, 2017
and noted no events that would be considered a triggering event. There were
no
adjustments to goodwill for the years ended
May 31, 2017
and
2016
.
As of
May 31, 2017
and
2016
, intangible assets consisted of the following:
|
|
May 31, 2017
|
||||||||||
|
Gross carrying
value
|
Accumulated
amortization
|
Net carrying
value
|
|||||||||
|
(in thousands)
|
|||||||||||
|
Product technologies
|
$
|
147,172
|
|
$
|
(59,696
|
)
|
$
|
87,476
|
|
||
|
Customer relationships
|
56,375
|
|
(19,194
|
)
|
37,181
|
|
|||||
|
Trademarks
|
28,400
|
|
(9,069
|
)
|
19,331
|
|
|||||
|
Licenses
|
4,487
|
|
(3,821
|
)
|
666
|
|
|||||
|
Distributor relationships
|
1,250
|
|
(229
|
)
|
1,021
|
|
|||||
|
$
|
237,684
|
|
$
|
(92,009
|
)
|
$
|
145,675
|
|
|||
|
May 31, 2016
|
|||||||||||
|
Gross carrying
value
|
Accumulated
amortization
|
Net carrying
value
|
|||||||||
|
(in thousands)
|
|||||||||||
|
Product technologies
|
$
|
148,387
|
|
$
|
(51,313
|
)
|
$
|
97,074
|
|
||
|
Customer relationships
|
88,389
|
|
(47,133
|
)
|
41,256
|
|
|||||
|
Trademarks
|
28,470
|
|
(6,242
|
)
|
22,228
|
|
|||||
|
Licenses
|
7,931
|
|
(6,716
|
)
|
1,215
|
|
|||||
|
Distributor relationships
|
2,150
|
|
(946
|
)
|
1,204
|
|
|||||
|
In process R&D
|
3,600
|
|
—
|
|
3,600
|
|
|||||
|
$
|
278,927
|
|
$
|
(112,350
|
)
|
$
|
166,577
|
|
|||
77
Amortization expense was
$17.3 million
,
$18.0 million
and
$18.0 million
for fiscal years
2017
,
2016
and
2015
, respectively.
Annual amortization of these intangible assets is expected to approximate the following amounts for each of the next five fiscal years:
|
(in thousands)
|
|||
|
2018
|
$
|
16,500
|
|
|
2019
|
16,132
|
|
|
|
2020
|
14,578
|
|
|
|
2021
|
13,627
|
|
|
|
2022
|
12,952
|
|
|
|
2023 and thereafter
|
71,886
|
|
|
|
$
|
145,675
|
|
|
9. INCOME TAXES
The components of income (loss) before income tax expense (benefit) for the years ended May 31 are as follows:
|
2017
|
2016
|
2015
|
|||||||||
|
(in thousands)
|
|||||||||||
|
Income (loss) before tax expense:
|
|
|
|
||||||||
|
US
|
$
|
8,825
|
|
$
|
(4,444
|
)
|
$
|
(8,965
|
)
|
||
|
Non-US
|
1,022
|
|
1,191
|
|
834
|
|
|||||
|
$
|
9,847
|
|
$
|
(3,253
|
)
|
$
|
(8,131
|
)
|
|||
Income tax expense (benefit) is comprised of the following:
|
2017
|
2016
|
2015
|
|||||||||
|
(in thousands)
|
|||||||||||
|
Current
|
|
|
|
||||||||
|
Federal
|
$
|
—
|
|
$
|
34
|
|
$
|
(242
|
)
|
||
|
State and local
|
141
|
|
103
|
|
205
|
|
|||||
|
Non U.S.
|
270
|
|
217
|
|
417
|
|
|||||
|
411
|
|
354
|
|
380
|
|
||||||
|
Deferred
|
4,428
|
|
39,983
|
|
(5,123
|
)
|
|||||
|
Income tax expense (benefit)
|
$
|
4,839
|
|
$
|
40,337
|
|
$
|
(4,743
|
)
|
||
In the fiscal years 2017 and 2016 income tax expense, the Company recorded tax expense of
$4.8 million
and
$40.3 million
, respectively, primarily driven by the impact of recording a deferred tax liability related to the amortization of intangibles, for tax purposes, that have an indefinite reversal period and cannot be used to support the deferred tax assets in fiscal 2017 and recording a valuation allowance of
$40.4 million
on the U.S. deferred tax assets in fiscal 2016.
In the fiscal year 2015 income tax benefit, the Company recorded a tax benefit of
$4.7 million
, primarily driven by a benefit of the
$9.2 million
nontaxable adjustment to the contingent liabilities related to Vortex Medical and Clinical Devices, and a seven month benefit from the R&D tax credit that expired on December 31, 2014, offset by non-deductible interest expense related to contingent payments, true-ups of our fiscal year 2014 US income tax returns and the impact of the elimination of the ASC 718 APIC pool.
78
Temporary differences that give rise to deferred tax assets and liabilities are summarized as follows:
|
May 31, 2017
|
May 31, 2016
|
||||||
|
(in thousands)
|
|||||||
|
Deferred tax assets
|
|
|
|||||
|
Net operating loss carryforward
|
$
|
55,975
|
|
$
|
52,593
|
|
|
|
Stock-based compensation
|
2,653
|
|
4,135
|
|
|||
|
Federal and state R&D tax credit carryforward
|
2,548
|
|
2,145
|
|
|||
|
Inventories
|
2,407
|
|
4,535
|
|
|||
|
Expenses incurred not currently deductible
|
6,522
|
|
3,018
|
|
|||
|
Accrued liabilities
|
1,289
|
|
339
|
|
|||
|
Gross deferred tax asset
|
71,394
|
|
66,765
|
|
|||
|
Deferred tax liabilities
|
|
|
|||||
|
Excess tax over book depreciation and amortization
|
49,158
|
|
46,240
|
|
|||
|
49,158
|
|
46,240
|
|
||||
|
Valuation Allowance
|
(48,348
|
)
|
(42,209
|
)
|
|||
|
Net deferred tax liability
|
$
|
(26,112
|
)
|
$
|
(21,684
|
)
|
|
The Company's Federal net operating loss carryforwards as of
May 31, 2017
after considering IRC Section 382 limitations are
$161.6 million
. The expiration of the Federal net operating loss carryforwards are as follows:
$29.8 million
between 2017 and 2023 and
$131.8 million
between 2027 and 2037.
The Company's state net operating loss carryforwards as of
May 31, 2017
after considering remaining IRC Section 382 limitations are
$32.7 million
which expire in various years from 2017 to 2037.
As a result of certain realization requirements of ASC 718, the table of deferred tax assets and liabilities shown above does not include certain deferred tax assets as of
May 31, 2017
and
2016
that arose directly from tax deductions related to equity compensation greater than compensation recognized for financial reporting. Equity will be increased by
$0.6 million
if and when such excess tax benefits are ultimately realized.
A valuation allowance is provided if based upon the weight of available evidence, it is more likely than not that some or all of the deferred tax assets will not be realized. After careful consideration and weighing of all the available positive and negative evidence, the weight given to the three year cumulative loss and lack of a recent history of core earnings was difficult to overcome and a full valuation allowance related to the U.S. deferred tax assets was established in the period ending May 31, 2016. Management considered all available positive and negative evidence at May 31, 2017, and considering the cumulative loss in the U.S. over the three year period, determined that the valuation allowance is still required. Management will continue to reevaluate the positive and negative evidence at each reporting period and if future results as projected in the U.S. and the Company's tax planning strategies are favorable, the valuation allowance may be removed, which could have a favorable material impact on the Company's results of operations in the period in which it is recorded.
The net deferred tax liability as of May 31, 2017 and 2016 relates to tax amortization of intangibles that have an indefinite reversal period for book purposes and cannot be used to support the deferred tax asset.
The Company's consolidated income tax expense has differed from the amount that would be provided by applying the U.S. Federal statutory income tax rate to the Company's income before income taxes for the following reasons:
79
|
For the year ended May 31,
|
|||||||||||
|
2017
|
2016
|
2015
|
|||||||||
|
(in thousands)
|
|||||||||||
|
Income tax expense (benefit) at statutory tax rate of 35%
|
$
|
3,447
|
|
$
|
(1,139
|
)
|
$
|
(2,845
|
)
|
||
|
Effect of graduated tax rates
|
(98
|
)
|
33
|
|
81
|
|
|||||
|
State income taxes, net of Federal tax benefit
|
(22
|
)
|
(215
|
)
|
(21
|
)
|
|||||
|
Impact of Non-US operations
|
403
|
|
(162
|
)
|
133
|
|
|||||
|
Research and development tax credit
|
(403
|
)
|
(499
|
)
|
(604
|
)
|
|||||
|
Meals and entertainment
|
266
|
|
329
|
|
—
|
|
|||||
|
Non-deductible interest on contingent payments
|
174
|
|
262
|
|
265
|
|
|||||
|
Non-taxable gain on revaluation of contingent consideration liability
|
(5,576
|
)
|
(170
|
)
|
(3,102
|
)
|
|||||
|
Tax law changes
|
—
|
|
—
|
|
(454
|
)
|
|||||
|
Change in valuation allowance
|
6,139
|
|
40,685
|
|
—
|
|
|||||
|
Effect of elimination of stock compensation APIC pool
|
1,380
|
|
739
|
|
1,253
|
|
|||||
|
IPR&D intangible write-off
|
(1,224
|
)
|
—
|
|
—
|
|
|||||
|
Other nondeductible expenses
|
219
|
|
207
|
|
498
|
|
|||||
|
Over (under) accrual of prior year Federal and State taxes
|
(3
|
)
|
356
|
|
38
|
|
|||||
|
Other
|
137
|
|
(89
|
)
|
15
|
|
|||||
|
Income tax expense (benefit)
|
$
|
4,839
|
|
$
|
40,337
|
|
$
|
(4,743
|
)
|
||
The following table provides a reconciliation of the beginning and ending amount of unrecognized tax benefits:
|
For the year ended May 31,
|
|||||||||||
|
2017
|
2016
|
2015
|
|||||||||
|
(in thousands)
|
|||||||||||
|
Unrecognized tax benefits balance at June 1
|
$
|
899
|
|
$
|
—
|
|
$
|
—
|
|
||
|
Increase in gross amounts of tax positions related to prior years
|
—
|
|
899
|
|
—
|
|
|||||
|
Unrecognized tax benefits balance at May 31
|
$
|
899
|
|
$
|
899
|
|
$
|
—
|
|
||
The table above includes unrecognized tax benefits associated with the calculation of limitations placed on the utilization of tax attributes related to an acquired company. If recognized,
$0.1 million
of the balance of unrecognized tax benefits as of
May 31, 2017
would affect the effective tax rate and the balance of
$0.8 million
would result in adjustments to other tax accounts.
The Company recognizes interest and penalties related to unrecognized tax benefits as a component of income tax expense. There are no accrued interest and penalties recognized in the consolidated balance sheet as of
May 31, 2017
and
May 31, 2016
.
The Company files income tax returns in the U.S. federal jurisdiction and various state and foreign jurisdictions. In the normal course of business the Company is subject to examination by taxing authorities throughout the world. Fiscal years 2014 through 2017 remain open to examination by the various tax authorities.
The Company does not anticipate that the amount of unrecognized tax benefits will significantly change in the next twelve months.
The accumulated undistributed earnings of the Company’s foreign operations were approximately
$5.3 million
, and are intended to remain indefinitely invested in foreign operations. Accordingly, no taxes have been provided on these earnings as of
80
May 31, 2017
. If these earnings were distributed, the Company would be subject to both foreign withholding taxes and U.S. income taxes that may not be fully offset by foreign tax credits. A reasonable estimate of the deferred tax liability on these earnings is not practicable at this time.
10. ACCRUED LIABILITIES
As of
May 31, 2017
and
2016
, accrued liabilities consist of the following:
|
May 31,
2017
|
May 31,
2016
|
||||||
|
(in thousands)
|
|||||||
|
Payroll and related expenses
|
$
|
11,383
|
|
$
|
9,414
|
|
|
|
Royalties
|
2,885
|
|
2,489
|
|
|||
|
Accrued severance
|
2,075
|
|
1,524
|
|
|||
|
Sales and franchise taxes
|
856
|
|
565
|
|
|||
|
Outside services
|
1,622
|
|
2,063
|
|
|||
|
Litigation matters (Note 15)
|
12,500
|
|
—
|
|
|||
|
Acculis recall liability
|
2,563
|
|
—
|
|
|||
|
Other
|
4,920
|
|
5,887
|
|
|||
|
Total
|
$
|
38,804
|
|
$
|
21,942
|
|
|
In the fourth quarter of fiscal year 2017, the Company issued a voluntary recall of its Acculis probes that were sold over the past
two
years. As a result of this voluntary recall, the Company decided to also do a voluntary market withdrawal of its Acculis capital systems and discontinue selling the product. The voluntary recall resulted in a deferral of revenue of
$2.6 million
and an increase of
$2.6 million
in inventory and hardware asset reserves. The total impact to income before taxes of the recall was
$4.5 million
.
On November 7, 2016, the Company entered into a Credit Agreement with the lenders party thereto, JPMorgan Chase Bank, N.A., as administrative agent, Bank of America, N.A. and Keybank National Association as co-syndication agents, and JPMorgan Chase Bank, N.A., Merrill Lynch, Pierce, Fenner & Smith Incorporated and Keybank National Association as joint bookrunners and joint lead arrangers.
The Credit Agreement provides for a
$100.0 million
senior secured term loan facility and a
$150.0 million
senior secured revolving credit facility, which includes up to a
$20.0 million
sublimit for letters of credit and a
$5.0 million
sublimit for swingline loans.
On November 7, 2016, the Company borrowed
$100.0 million
under the Term Loan and approximately
$16.5 million
under the Revolving Facility to repay the balance of
$116.5 million
under the former credit agreement. In February 2017 the revolver was paid off in full. As of
May 31, 2017
and
2016
the carrying value of long-term debt approximates its fair market value.
The proceeds of the Revolving Facility may be used for general corporate purposes of the Company and its subsidiaries. The Facilities have a
five
year maturity. Interest on both the Term Loan and Revolving Facility are based on a base rate or Eurodollar rate plus an applicable margin which increases as total leverage ratio increases, with the base rate and Eurodollar rate having ranges of
0.50%
to
1.25%
and
1.50%
to
2.25%
respectively. In case of default, the interest rate may be increased by
2.0%
. The Revolving Facility carries a commitment fee of
0.20%
to
0.35%
per annum on the unused portion. The interest rate on the Term Loan at
May 31, 2017
was
2.55%
.
The Company's obligations under the Facilities are unconditionally guaranteed, jointly and severally, by the Company's material direct and indirect domestic subsidiaries (the “Guarantors”). All obligations of the Company and the Guarantors under the Facilities are secured by first priority security interests in substantially all of the assets of the Company and the Guarantors.
81
The Credit Agreement includes customary representations, warranties and covenants, and acceleration, indemnity and events of default provisions, including, among other things, two quarterly financial covenants as follows:
•
maximum leverage ratio of consolidated total indebtedness* to consolidated EBITDA* of not greater than
3.50
to
1.00
(during certain periods following material acquisitions shall be increased to
3.75
to 1.00).
•
fixed charge coverage ratio of consolidated EBITDA minus consolidated capital expenditures to consolidated interest expense paid or payable in cash plus scheduled principal payments in respect of indebtedness under the Credit Agreement of not less than
1.25
to
1.00
.
* The definitions of consolidated total indebtedness and consolidated EBITDA are maintained in the credit agreement included as an exhibit to Form 8-k filed on November 10, 2016.
The Company was in compliance with both covenants as of
May 31, 2017
.
The Company's maturities of principal obligations under the credit agreement are as follows, as of
May 31, 2017
:
|
(in thousands)
|
|||
|
2018
|
$
|
5,000
|
|
|
2019
|
5,000
|
|
|
|
2020
|
7,500
|
|
|
|
2021
|
11,250
|
|
|
|
2022
|
68,750
|
|
|
|
Total term loan
|
97,500
|
|
|
|
Revolving facility
|
—
|
|
|
|
Total debt
|
97,500
|
|
|
|
Less: Unamortized debt issuance costs
|
(1,180
|
)
|
|
|
Total
|
96,320
|
|
|
|
Less: Current portion of long-term debt
|
(5,000
|
)
|
|
|
Total long-term debt, net of current portion
|
$
|
91,320
|
|
12. RETIREMENT PLANS
The Company has a 401(k) plan under which eligible employees can defer a portion of their compensation, part of which is matched by the Company. Matching contributions were
$4.2 million
,
$3.7 million
and
$3.7 million
in
2017
,
2016
and
2015
, respectively. There are also various immaterial foreign retirement plans.
13. STOCKHOLDERS’ EQUITY
Capitalization
On October 29, 2014, the Board of Directors approved the Amended and Restated Certificate of Incorporation (the “Amended Certificate”). Under the Amended Certificate, the authorized capital stock is
80,000,000
shares, consisting of
75,000,000
shares of common stock, par value
$.01
per share and
5,000,000
shares of preferred stock, par value
$.01
per share.
The holders of common stock are entitled to
one
vote for each share held. Subject to preferences applicable to any outstanding shares of preferred stock, the holders of common stock are entitled to receive ratably dividends, if any, as may be declared by the Board of Directors out of funds legally available for dividend payments. If the Company liquidates, dissolves, or winds up, the holders of common stock are entitled to share ratably in all assets remaining after payment of liabilities and liquidation preferences of any outstanding shares of preferred stock. Holders of common stock have no pre-emptive rights or rights to convert their common stock into any other securities. There are no redemption or sinking fund provisions applicable to
82
the common stock. The rights, preferences and privileges of the holders of common stock are subject to, and may be adversely affected by, the rights of the holders of shares of any series of preferred stock that the Company may designate in the future.
The board of directors has the authority to (i) issue the undesignated preferred stock in one or more series, (ii) determine the powers, preferences and rights and the qualifications, limitations or restrictions granted to or imposed upon any wholly un-issued series of undesignated preferred stock and (iii) fix the number of shares constituting any series and the designation of the series, without any further vote or action by the Company's stockholders.
Stock Options
2004 Stock and Incentive Award Plan
The 2004 Stock and Incentive Award Plan (the “2004 Plan”) provides for the grant of incentive options to employees and for the grant of non-statutory stock options, restricted stock, stock appreciation rights, performance units, performance shares and other incentive awards to employees, directors and other service providers. A total of
7,000,000
shares of common stock have been reserved for issuance under the 2004 Plan, of which up to
800,000
shares may be issued upon the exercise of incentive stock options. The compensation committee of the Board of Directors administers the 2004 Plan. The committee determines vesting terms and the exercise price of options granted under the 2004 Plan, but for all incentive stock options the exercise price must at least be equal to the fair market value of common stock on the date of grant. The term of an incentive stock option may not exceed
ten years
.
On October 25, 2016, the Company amended the 2004 Stock and Incentive Award Plan to increased the shares of common stock reserved for issuance by
250,000
shares.
As of
May 31, 2017
, there remained approximately
2.4 million
shares available for granting under the 2004 Plan.
The following table summarizes information about stock option activity for the fiscal year ended
May 31, 2017
.
|
|
2017
|
|||||||||||
|
Shares
|
Weighted-
average
exercise
price
|
Weighted
average
remaining
contractual
life
|
Aggregate
intrinsic
value (in
thousands)
|
|||||||||
|
Outstanding at beginning of year
|
2,281,618
|
|
$
|
14.45
|
|
|||||||
|
Granted
|
667,691
|
|
$
|
16.83
|
|
|||||||
|
Exercised
|
(826,286
|
)
|
$
|
13.45
|
|
|||||||
|
Forfeited
|
(342,924
|
)
|
$
|
16.03
|
|
|||||||
|
Expired
|
(112,656
|
)
|
$
|
19.08
|
|
|||||||
|
Outstanding at end of year
|
1,667,443
|
|
$
|
15.01
|
|
4.66
|
$
|
1,513
|
|
|||
|
Options exercisable at year-end
|
659,463
|
|
$
|
14.26
|
|
2.88
|
$
|
913
|
|
|||
|
Options expected to vest in future periods
|
884,906
|
|
$
|
15.50
|
|
5.83
|
$
|
527
|
|
|||
Stock options are granted at exercise prices equal to the quoted market price of common stock at the date of the grant. Options vest
25%
per year over
four years
for employees and
100%
after
one year
for consultants. Grants to directors vest
33.33%
per year over
three years
. Stock options granted prior to May 1, 2007 expire on the tenth anniversary of the grant date. Stock options granted on or after May 1, 2007, expire on the seventh anniversary of the grant date.
The Company measures the fair value of each stock option grant at the date of grant using a Black-Scholes option pricing model. The weighted average grant-date fair value of options granted during the years ended
May 31, 2017
,
2016
and
2015
was
$4.70
,
$4.16
, and
$4.74
, respectively. The following assumptions were used in arriving at the fair value of options granted during
2017
,
2016
and
2015
, respectively: risk-free interest rates of
1.30%
,
1.48%
and
1.54%
; expected volatility of
31%
,
31%
, and
31%
; and expected lives of
4.80 years
,
4.81 years
, and
4.76 years
. The Company does not declare dividends therefore a dividend yield of zero was used for the years ended
May 31, 2017
,
2016
and
2015
. Risk-free interest rates reflect the yield on
83
zero-coupon U.S. Treasury bonds whose maturity period equals the expected term of the option. Expected volatilities are based on the historical volatility of the Company's stock. The expected option lives are based on historical experience of employee exercise behavior.
The total intrinsic value of options exercised during the years ended
May 31, 2017
,
2016
and
2015
was
$2.8 million
,
$0.1 million
, and
$1.6 million
, respectively. As of
May 31, 2017
, there was
$3.7 million
of total unrecognized compensation cost related to non-vested options, which is expected to be recognized over a weighted average period of
3 years
.
Cash received from option exercises during 2017, 2016 and 2015 was
$9.9 million
,
$1.3 million
and
$4.3 million
, respectively. The tax benefit realized from stock options exercised during the years ended May 31,
2016
and
2015
were
$0.1 million
and
$0.5 million
, respectively. Due to the valuation allowance there was
no
tax benefit realized from stock option exercises during the year ended
May 31, 2017
.
Performance Share and Restricted Stock Unit Awards
The Company grants restricted stock units to certain employees under the 2004 Plan which give the recipients the right to receive shares of Company stock upon vesting. The restricted stock unit awards vest in equal annual installments over the term of the grants. Unvested restricted stock unit awards will be forfeited if the recipient ceases to be employed by the Company.
The following table summarizes information about restricted stock unit activity for the year ended
May 31, 2017
.
|
Weighted Average
Grant-Date Fair Value
|
||||||
|
Non-vested at beginning of year
|
549,777
|
|
$
|
14.62
|
|
|
|
Granted
|
255,032
|
|
$
|
16.54
|
|
|
|
Vested
|
(182,320
|
)
|
$
|
16.10
|
|
|
|
Canceled
|
(183,192
|
)
|
$
|
15.95
|
|
|
|
Non-vested at end of year
|
439,297
|
|
$
|
15.55
|
|
|
The fair value of each restricted stock unit is the market price of Company stock on the date of grant. The weighted average grant date fair value of restricted stock units granted during the years ended
May 31, 2017
,
2016
and
2015
was
$16.54
,
$15.21
and
$14.75
, respectively. The total intrinsic value of restricted stock units (meaning the fair value of the units on the date of vest) vesting during the years ended
May 31, 2017
,
2016
and
2015
was
$2.9 million
,
$2.5 million
, and
$2.4 million
, respectively. As of
May 31, 2017
, there was
$4.9 million
of total unrecognized compensation cost related to non-vested restricted stock awards, which is expected to be recognized over a weighted average period of
3 years
.
The Company grants performance share awards to certain employees under the 2004 Plan which gives the recipients the right to receive shares of Company stock if certain criteria is met. The performance criteria is established by the compensation committee for vesting of the performance share awards and may include factors such as the achievement of relative total shareholder return ("TSR"), certain sales, operating income and earnings per share (“EPS”) goals. Performance share awards are subject to additional conditions, including the recipient’s continued employment with the Company.
The following table summarizes information about performance unit award activity for the year ended
May 31, 2017
.
|
Performance Unit Awards
|
Weighted Average
Grant-Date Fair Value
|
|||||
|
Non-vested at beginning of year
|
435,892
|
|
$
|
19.16
|
|
|
|
Granted
|
93,400
|
|
$
|
22.61
|
|
|
|
Vested
|
(37,184
|
)
|
$
|
14.48
|
|
|
|
Canceled
|
(130,944
|
)
|
$
|
21.54
|
|
|
|
Non-vested at end of year
|
361,164
|
|
$
|
18.54
|
|
|
84
During fiscal years 2017, 2016 and 2015, we granted performance unit awards that include a three-year market condition. Vesting of the performance unit awards is based on the Company's level of attainment of specified total shareholder return ("TSR") targets relative to the percentage appreciation of a specified index of companies for the respective three-year periods. It is also subject to the continued employment of the grantees. In order to estimate the fair value of such awards, we used a Monte Carlo Simulation valuation model on the date of the grant. For the years ended
May 31, 2017
,
2016
and
2015
, the weighted average grant date fair market value for new grants was
$22.61
,
$18.07
and
$19.83
, respectively. Compensation cost is recognized over the performance period which is typically
three
years. As of
May 31, 2017
,
0.4 million
performance share units with a weighted average remaining contractual term of
3
years and
$4.2 million
of unrecognized compensation cost were outstanding.
Compensation Expense
The following tables represents the break out of share-based compensation included in the Company's consolidated statement of operations.
|
For the year ended May 31,
|
||||||||||||
|
(in thousands)
|
2017
|
2016
|
2015
|
|||||||||
|
Cost of sales
|
$
|
299
|
|
$
|
172
|
|
$
|
143
|
|
|||
|
Research and development
|
314
|
|
349
|
|
229
|
|
||||||
|
Sales and marketing
|
1,762
|
|
1,489
|
|
1,685
|
|
||||||
|
General and administrative
|
4,026
|
|
2,291
|
|
3,941
|
|
||||||
|
Acquisition, restructuring and other items, net
|
(218
|
)
|
(1,061
|
)
|
—
|
|
||||||
|
$
|
6,183
|
|
$
|
3,240
|
|
$
|
5,998
|
|
||||
The income tax benefit on the compensation expense recognized for all share-based compensation arrangements was
$2.2 million
,
$1.0 million
and
$2.0 million
for the years ended
May 31, 2017
,
2016
and
2015
, respectively. The income tax benefit for 2017 and 2016 are negated by the full valuation allowance established as of May 31, 2016.
Employee Stock Purchase Plan
The Employee Stock Purchase Plan (the “Stock Purchase Plan”) provides a means by which employees (the “participants”) are given an opportunity to purchase the Company's common stock through payroll deductions. A total of
2,500,000
shares of common stock have been reserved for issuance under the Stock Purchase Plan. Shares are offered through
two
purchase periods, each with duration of approximately
6 months
, commencing on the first business day of the first and third fiscal quarters. An employee is eligible to participate in an offering period if, on the first day of an offering period, he or she has been employed in a full-time capacity for at least
six months
, with a customary working schedule of
20 or more hours per week and more than five months in a calendar year
. Employees who own stock possessing
5%
or more of the total combined voting power or value of all classes of stock are not eligible to participate in the Stock Purchase Plan. The purchase price of the shares of common stock acquired on each purchase date will be the lower of (i)
85%
of the fair market value of a share of common stock on the first day of the offering period or (ii)
85%
of the fair market value of a share of common stock on the last day of the purchase period, subject to adjustments made by the Board of Directors. The Stock Purchase Plan is intended to qualify as an “employee stock purchase plan” within the meaning of Section 423 of the Internal Revenue Code. During the year ended May 31, 2015, an additional
800,000
shares of the Company's common stock have been reserved for issuance under the Stock Purchase Plan. During the year ended May 31, 2017, an additional
500,000
shares of the Company's common stock have been reserved for issuance under the Stock Purchase Plan.
The Company uses the Black-Scholes option-pricing model to calculate the purchase date fair value of the shares issued under the Stock Purchase Plan and recognize expense related to shares purchased ratably over the offering period. During the years ended
May 31, 2017
,
2016
and
2015
,
129,185
,
137,957
and
119,001
shares, respectively, were issued at an average price of
$11.00
,
$10.67
and
$11.89
, respectively, under the Stock Purchase Plan. As of
May 31, 2017
,
1.3
million shares remained available for future purchases under the Stock Purchase Plan.
85
Share Repurchases
On November 6, 2016, the Board of Directors approved the Repurchase Program under which they authorized the Company the option to repurchase up to
$25.0 million
of its outstanding common stock during the
twenty-four
month period ending November 6, 2018. During the second quarter of fiscal year 2017, the Company repurchased
500,000
shares of common stock in the open market at an aggregate cost of
$7.8 million
under the Repurchase Program. During the fourth quarter of fiscal year 2017, the Company repurchased
370,000
shares of common stock in the open market at an aggregate cost of
$5.7 million
under the Repurchase Program. As of
May 31, 2017
,
$11.4 million
remained available for repurchase under the Repurchase Program.
In February 2017, the Company retired
642,305
shares of treasury stock. These retired shares are now included in the Company’s pool of authorized but unissued shares. The retired stock had a carrying value of approximately
$9.9 million
and
$0.01
was the par value that was deducted from common stock and the remaining
$9.9 million
was deducted from additional paid-in capital.
14. EARNINGS PER SHARE
Basic earnings per share are based on the weighted average number of common shares outstanding. In addition, diluted earnings per share include the dilutive effect of potential common stock consisting of stock options, restricted stock units and performance stock units, provided that the inclusion of such securities is not anti-dilutive. In periods with a net loss, stock options and restricted stock units are not included in the computation of basic loss per share as the impact would be anti-dilutive.
The following table reconciles basic to diluted weighted average shares outstanding for the years ended
May 31, 2017
,
2016
and
2015
:
|
For the year ended May 31,
|
||||||||
|
2017
|
2016
|
2015
|
||||||
|
Basic
|
36,616,859
|
|
36,161,383
|
|
35,683,139
|
|
||
|
Effect of dilutive securities
|
342,391
|
|
—
|
|
—
|
|
||
|
Diluted
|
36,959,250
|
|
36,161,383
|
|
35,683,139
|
|
||
|
Securities excluded as their inclusion would be anti-dilutive
|
1,058,790
|
|
3,277,037
|
|
2,862,414
|
|
||
15. COMMITMENTS AND CONTINGENCIES
Leases
The Company is committed under non-cancelable operating leases for facilities and equipment. During fiscal
2017
,
2016
and
2015
, aggregate rental costs under all operating leases were approximately
$2.5 million
,
$2.5 million
and
$3.4 million
, respectively. Future annual payments under non-cancelable operating leases in the aggregate, of which one includes an escalation clause, with initial remaining terms of more than one year at
May 31, 2017
, are summarized as follows (in thousands):
86
|
(in thousands)
|
|||
|
2018
|
$
|
2,214
|
|
|
2019
|
2,066
|
|
|
|
2020
|
1,860
|
|
|
|
2021
|
1,025
|
|
|
|
2022 and thereafter
|
2,552
|
|
|
|
$
|
9,717
|
|
|
Other Commitments and Contingencies
The following table summarizes the Company's other future commitments and contingencies as of May 31, 2017.
|
(in thousands)
|
Total
|
2018
|
2019
|
2020
|
2021
|
2022 and thereafter
|
|||||||||||||||||
|
Purchase obligations (1)
|
$
|
49,762
|
|
$
|
8,443
|
|
$
|
8,726
|
|
$
|
9,162
|
|
$
|
8,709
|
|
$
|
14,722
|
|
|||||
|
Royalties
|
44,000
|
|
2,500
|
|
3,000
|
|
3,500
|
|
3,500
|
|
31,500
|
|
|||||||||||
|
Other
|
834
|
|
167
|
|
167
|
|
167
|
|
167
|
|
166
|
|
|||||||||||
|
$
|
94,596
|
|
$
|
11,110
|
|
$
|
11,893
|
|
$
|
12,829
|
|
$
|
12,376
|
|
$
|
46,388
|
|
||||||
|
(1)
|
The non-cancelable inventory purchase obligations are not reflected on our consolidated balance sheets under accounting principles generally accepted in the United States of America.
|
Legal Proceedings
The Company is involved in various legal proceedings, including commercial, intellectual property, product liability, and regulatory matters of a nature considered normal for its business. The Company accrues for amounts related to these matters if it is probable that a liability has been incurred, and an amount can be reasonably estimated. The Company discloses such matters when there is at least a reasonable possibility that a material loss may have been incurred. However, the Company cannot predict the outcome of any litigation or the potential for future litigation.
C.R. Bard, Inc. v. AngioDynamics, Inc.
On January 11, 2012, C.R. Bard, Inc. (“Bard”) filed a suit in the United States District Court of Utah claiming certain of our implantable port products infringe on
three
U.S. patents held by Bard (the "Utah Action"). Bard is seeking unspecified damages and other relief. The Court denied Bard’s motion for pre-trial consolidation with separate actions it filed on the same day against Medical Components, Inc. and Smiths Medical ASD, Inc., but had asked for supplemental briefing on the issue of whether to conduct a common Markman hearing. Meanwhile, we filed petitions for reexamination in the US Patent and Trademark Office ("PTO") which seek to invalidate all
three
patents asserted by Bard in the litigation. Our petitions were granted and
40 of Bard's 41 patent
claims were rejected and, following further proceedings, the Patent Office issued a Final Rejection of all
40
claims subject to reexamination. Thereafter, Bard filed appeals to the PTO Board of Appeals and Interferences for all
three
reexams. The parties completed briefing on the appeals and oral argument was held on June 18, 2015. The Patent Office issued decisions in the three appeals. In one (issued on March 11, 2016 for US Patent No. 7,785,302), the rejections of
six
of the
ten
claims under reexamination were affirmed, but were reversed on
four
of the ten claims. In the second (issued on March 24, 2016 for U.S. Patent No. 7,959,615), the rejections of
eight
of the
ten
claims under reexamination were affirmed but the rejections of the other
two
of the ten claims were reversed. In the third (issued on March 29 for U.S. Patent No. 7,947.022) the rejections of all
twenty
claims under reexamination were affirmed. Bard has since filed Requests for Rehearing in all
three
reexamination appeals and the Company filed Requests for Rehearing in
two
of the reexamination appeals (the ‘302 and ‘615 patent reexaminations). Each party has filed comments in Opposition to the other party’s Rehearing Requests,. The PTO has since issued decisions denying all Rehearing Requests - - on February 1, 2017 for the ‘302; on February 17, 2017 for the ‘022; and on February 21, 2017 for the ‘615. In the ‘302 and ‘022, the PTO modified its characterization of one prior art reference. Bard has since filed a Notice of Appeal to the Federal Circuit Court of Appeals in all three reexams and we filed Cross-Appeals in the ‘302 and the ‘615 reexams. The parties are in the process of preparing and filing the various appellate briefs, starting with Bard’s Opening Brief which is currently due on July 31, 2017 and ending with our Reply Brief which is currently due on November 6, 2017.
The Utah Action has been stayed pending final resolution of the PTO process. We believe
87
these claims are without merit and intend to defend them vigorously. We have not recorded an expense related to the outcome of this litigation because it is not yet possible to determine if a potential loss is probable nor reasonably estimable.
On March 10, 2015, C.R. Bard, Inc. and Bard Peripheral Vascular, Inc. (“Bard”) filed suit in the United States District Court for the District of Delaware claiming certain of our implantable port products infringe on
three
U.S. patents held by Bard (the “Delaware Action). Bard is seeking unspecified damages and other relief. The patents asserted in the Delaware Action are different than those asserted in the Utah Action. On June 1, 2015, we filed
two
motions in response to Bard’s Complaint - one sought transfer to the District of Utah where the Utah Action is currently pending, and the other sought dismissal of the entire complaint on grounds that none of the claims in the asserted patents is directed to patent eligible subject matter under Section 101 of the Patent Statute and in light of recent authority from the U. S. Supreme Court. On January 12, 2016, the court issued a decision denying both motions. We have since served an Answer and Counterclaim to which Bard has served a Reply. On March 10, 2016, the Court held a case management conference, and, on March 14, 2016, the court entered a Scheduling Order which set, inter alia, a Markman hearing for March 10, 2017, a summary judgment hearing for December 8, 2017 and trial for March 12, 2018. The parties have served various discovery requests on each other, and have been producing documents to each other; on May 27, 2016 Bard served its Infringement Contentions which identified all the port products accused of infringement; and, on June 24, 2016, we served Invalidity Contentions which detail various grounds for invalidating the three asserted patents. The parties completed briefing on the claim construction issues and the Markman hearing was held on March 10, 2017 and the Court issued its Claim Construction Order on May 19, 2017. The Court has since amended the Scheduling Order to provide for the completion of Expert Discovery on October 30, 2017; briefing on Case-Dispositive Motions between November 17, 2017 and January 24, 2018 with oral argument set for February 22, 2018 and trial to commence May 29, 2018. We believe these claims are without merit and intend to defend them vigorously. We have not recorded an expense related to the outcome of this litigation because it is not yet possible to determine if a potential loss is probable nor reasonably estimable.
AngioDynamics, Inc. v. C.R. Bard, Inc.
On May 30, 2017, we commenced an action in the United States District Court for the Northern District of New York entitled AngioDynamics, Inc. v. C.R. Bard, Inc. and Bard Access Systems, Inc. (“Bard”). In this action, we allege that Bard has illegally tied the sales of its tip location systems to the sales of its PICCs. We allege that this practice violates the federal antitrust laws and has had, and continues to have, an anti-competitive effect in the market for PICCs. We seek both monetary damages and injunctive relief. The Court has set an initial case management conference for August 29, 2017.
Governmental Investigations
In June 2014 we received a subpoena from the U.S. Department of Justice (the “DOJ”) requesting documents in relation to a criminal and civil investigation the DOJ is conducting regarding BTG International, Inc.’s LC Bead® product beginning in 2003. RITA Medical Systems and AngioDynamics, Inc., after its acquisition of RITA, was the exclusive distributor of LC Beads in the United States from 2006 through December 31, 2011. We are cooperating fully with this investigation.
In April 2015 we received a subpoena from the DOJ requesting documents in relation to a criminal and civil investigation the DOJ is conducting regarding purported promotion of certain of AngioDynamics’ VenaCure EVLT products for un-cleared indications. We are cooperating fully with this investigation.
As of May 31, 2017 the Company accrued
$12.5 million
for these matters and in August 2017, the Company agreed in principle with the government to resolve these matters for approximately
$12.5 million
.
16. SEGMENTS AND GEOGRAPHIC INFORMATION
Segment information
The Company considers its business to be a single segment entity related to the development, manufacture and sale on a global basis of medical devices for vascular access, surgery, peripheral vascular disease and oncology. The Company's chief operating decision maker (CEO) evaluates the various global product portfolios on a net sales basis. Executives reporting in to the CEO include those responsible for operations and supply chain management, research and development, sales, franchise
88
marketing and certain corporate functions. The CEO evaluates profitability, investment and cash flow metrics on a consolidated worldwide basis due to shared infrastructure and resources.
Total sales by product category are summarized below (in thousands):
|
|
For the year ended May 31,
|
||||||||||
|
(in thousands)
|
2017
|
2016
|
2015
|
||||||||
|
Net sales by Product Category
|
|||||||||||
|
Peripheral Vascular
|
$
|
208,602
|
|
$
|
205,620
|
|
$
|
196,890
|
|
||
|
Vascular Access
|
96,481
|
|
99,375
|
|
107,754
|
|
|||||
|
Oncology/Surgery
|
44,560
|
|
48,895
|
|
51,890
|
|
|||||
|
Total
|
$
|
349,643
|
|
$
|
353,890
|
|
$
|
356,534
|
|
||
Geographic information
Total sales for geographic areas are summarized below (in thousands):
|
|
For the year ended May 31,
|
||||||||||
|
(in thousands)
|
2017
|
2016
|
2015
|
||||||||
|
Net sales by Geography
|
|||||||||||
|
United States
|
$
|
282,168
|
|
$
|
285,824
|
|
$
|
284,122
|
|
||
|
International
|
67,475
|
|
68,066
|
|
72,412
|
|
|||||
|
Total
|
$
|
349,643
|
|
$
|
353,890
|
|
$
|
356,534
|
|
||
For fiscal years
2017
,
2016
and
2015
, International sales as a percentage of total net sales were
19%
,
19%
and
20%
, respectively. Sales to any
one
country outside the U.S., as determined by shipment destination, did not comprise a material portion of net sales in any of the last three fiscal years. In addition, no one customer represents more than 10% of consolidated net sales.
99%
of long-lived assets are located within the United States.
17. ACQUISITION, RESTRUCTURING AND OTHER ITEMS, NET
For the years ended
May 31, 2017
,
2016
and
2015
acquisition, restructuring and other items, net consisted of:
|
For the year ended May 31,
|
|||||||||||
|
(in thousands)
|
2017
|
2016
|
2015
|
||||||||
|
Legal
|
$
|
19,480
|
|
$
|
7,487
|
|
$
|
4,959
|
|
||
|
Intangible and other asset impairment
|
5,604
|
|
352
|
|
15,504
|
|
|||||
|
Restructuring
|
1,348
|
|
1,462
|
|
1,997
|
|
|||||
|
Other
|
1,078
|
|
3,290
|
|
3,797
|
|
|||||
|
Total
|
$
|
27,510
|
|
$
|
12,591
|
|
$
|
26,257
|
|
||
Of the
$19.5
million in legal for fiscal year 2017,
$12.5 million
relates to a reserve for DOJ litigation settlement (see Note 15) and the remaining legal expenses relates to DOJ matters.
Restructuring
The Company evaluates its performance and looks for opportunities to improve the overall operations of the Company on an ongoing basis. As a result of this evaluation, certain restructuring initiatives are taken to enhance the Company’s overall operations.
89
Operational Consolidation
On February 1, 2017, the Company announced to employees an operational consolidation plan (the “plan”) to consolidate manufacturing facilities in Manchester, GA and Denmead, UK into the Glens Falls and Queensbury, NY facilities. This plan will streamline and optimize the manufacturing functions into one centralized location increasing the utilization of the Glens Falls and Queensbury facilities, optimizing inventory and reducing cost of goods sold through savings in overhead expenses and direct labor. The restructuring activities associated with the plan are expected to be completed in the third quarter of fiscal year 2018.
The following table provides a summary of estimated costs associated with the plan:
|
Total estimated amount expected to be incurred (in millions)
|
||
|
Termination benefits
|
$1.75 to $2.25
|
|
|
Plant consolidation
(1)
|
$2.25 to $2.50
|
|
|
Regulatory filings
|
$0.75 to $1.00
|
|
|
Contract cancellations
|
$0.75 to $1.00
|
|
|
Other
|
$0.75 to $1.00
|
|
|
$6.25 to $7.75
|
||
(1) Equipment transfer, validation and other start-up costs to prepare the facilities for the new product lines.
The Company recorded restructuring charges related to the plan during the year ended
May 31, 2017
of
$1.3 million
. There were
no
costs associated with this plan in the prior year. Termination benefits are only earned if an employee stays until their termination date; therefore, the expenses related to termination benefits are being recorded ratably over the service period.
The following table presents a rollforward of the restructuring reserve for the year ended
May 31, 2017
:
|
Contract
|
||||||||||||||||||||||||
|
Termination
|
Plant
|
Regulatory
|
Cancellation
|
Other
|
||||||||||||||||||||
|
Benefits
|
Consolidation
|
Filings
|
Costs
|
Costs
|
Total
|
|||||||||||||||||||
|
(in thousands)
|
||||||||||||||||||||||||
|
Balance at May 31, 2016
|
$
|
—
|
|
$
|
—
|
|
$
|
—
|
|
$
|
—
|
|
$
|
—
|
|
$
|
—
|
|
||||||
|
Charges
|
851
|
|
494
|
|
—
|
|
—
|
|
3
|
|
1,348
|
|
||||||||||||
|
Non-cash adjustments
|
—
|
|
(108
|
)
|
—
|
|
—
|
|
—
|
|
(108
|
)
|
||||||||||||
|
Cash payments
|
—
|
|
(275
|
)
|
—
|
|
—
|
|
(3
|
)
|
(278
|
)
|
||||||||||||
|
Balance at May 31, 2017
|
$
|
851
|
|
$
|
111
|
|
$
|
—
|
|
$
|
—
|
|
$
|
—
|
|
$
|
962
|
|
||||||
The Company’s restructuring liability of
$1.0 million
is mainly comprised of accruals for termination benefits which are expected to be paid in the next twelve months and are included in accrued expenses on the consolidated balance sheet.
90
18. ACCUMULATED OTHER COMPREHESIVE INCOME (LOSS)
Changes in each component of accumulated other comprehensive income (loss), net of tax, are as follows for fiscal
2017
and
2016
:
|
(in thousands)
|
Foreign currency translation gain (loss)
|
Unrealized gain (loss) on marketable securities
|
Unrealized gain (loss) on interest rate swap
|
Total
|
||||||||||||
|
Balance at May 31, 2015
|
$
|
(648
|
)
|
$
|
(23
|
)
|
$
|
(162
|
)
|
$
|
(833
|
)
|
||||
|
Other comprehensive income (loss) before reclassifications, net of tax
|
(112
|
)
|
(8
|
)
|
162
|
|
42
|
|
||||||||
|
Amounts reclassified from accumulated other comprehensive income
|
—
|
|
—
|
|
—
|
|
—
|
|
||||||||
|
Net other comprehensive income (loss)
|
$
|
(112
|
)
|
$
|
(8
|
)
|
$
|
162
|
|
$
|
42
|
|
||||
|
Balance at May 31, 2016
|
$
|
(760
|
)
|
$
|
(31
|
)
|
$
|
—
|
|
$
|
(791
|
)
|
||||
|
Other comprehensive income (loss) before reclassifications, net of tax
|
(545
|
)
|
12
|
|
—
|
|
(533
|
)
|
||||||||
|
Amounts reclassified from accumulated other comprehensive income
|
—
|
|
—
|
|
—
|
|
—
|
|
||||||||
|
Net other comprehensive income (loss)
|
$
|
(545
|
)
|
$
|
12
|
|
$
|
—
|
|
$
|
(533
|
)
|
||||
|
Balance at May 31, 2017
|
$
|
(1,305
|
)
|
$
|
(19
|
)
|
$
|
—
|
|
$
|
(1,324
|
)
|
||||
19. QUARTERLY INFORMATION (unaudited)
Quarterly results of operations during the fiscal years ended May 31,
2017
and
2016
are as follows:
|
|
2017
|
||||||||||||||
|
|
First
quarter
|
Second
quarter
|
Third
quarter
|
Fourth
quarter
|
|||||||||||
|
(in thousands, except per share data)
|
|||||||||||||||
|
Net sales
|
$
|
88,098
|
|
$
|
89,029
|
|
$
|
85,602
|
|
$
|
86,914
|
|
|||
|
Gross profit
|
45,032
|
|
45,010
|
|
43,792
|
|
42,335
|
|
|||||||
|
Net income (loss)
(1)
|
1,300
|
|
13,734
|
|
2,887
|
|
(12,913
|
)
|
|||||||
|
Earnings (loss) per common share
|
|||||||||||||||
|
Basic
|
0.04
|
|
0.37
|
|
0.08
|
|
(0.35
|
)
|
|||||||
|
Diluted
|
0.04
|
|
0.37
|
|
0.08
|
|
(0.35
|
)
|
|||||||
(1) Included within net income (loss) during the fourth quarter of fiscal 2017 is the
$12.5 million
charge for a litigation reserve (Note 15) and
$4.5 million
impact relating to the Acculis recall (Note 10).
|
|
2016
|
||||||||||||||
|
|
First
quarter
|
Second
quarter
|
Third
quarter
|
Fourth
quarter
|
|||||||||||
|
(in thousands, except per share data)
|
|||||||||||||||
|
Net sales
|
$
|
83,753
|
|
$
|
89,284
|
|
$
|
87,434
|
|
$
|
93,419
|
|
|||
|
Gross profit
|
43,371
|
|
45,884
|
|
43,534
|
|
41,527
|
|
|||||||
|
Net income (loss)
(1)
|
(775
|
)
|
(334
|
)
|
594
|
|
(43,075
|
)
|
|||||||
|
Earnings (loss) per common share
|
|||||||||||||||
|
Basic
|
(0.02
|
)
|
(0.01
|
)
|
0.02
|
|
(1.19
|
)
|
|||||||
|
Diluted
|
(0.02
|
)
|
(0.01
|
)
|
0.02
|
|
(1.19
|
)
|
|||||||
91
(1) Included within net income (loss) during the fourth quarter of fiscal year 2016 is the
$40.4 million
valuation allowance that was recorded (Note 9).
The data in the schedules above has been intentionally rounded to the nearest thousand and therefore the quarterly amounts may not sum to the full year amounts.
92
AngioDynamics, Inc. and Subsidiaries
|
SCHEDULE II -VALUATION AND QUALIFYING ACCOUNTS
|
|||||||||||||||
|
(in thousands)
|
|||||||||||||||
|
Column A
|
Column B
|
Column C
|
Column D
|
Column E
|
|||||||||||
|
Description
|
Balance at
Beginning
of Year
|
Additions -
Charged to
costs and
expenses
|
Deductions
|
Balance at
End of Period
|
|||||||||||
|
Year Ended May 31, 2015
|
|||||||||||||||
|
Allowance for deferred tax asset
|
$
|
1,531
|
|
$
|
467
|
|
$
|
(207
|
)
|
$
|
1,791
|
|
|||
|
Allowance for sales returns and doubtful accounts
|
$
|
1,736
|
|
$
|
1,846
|
|
$
|
(539
|
)
|
$
|
3,043
|
|
|||
|
Year Ended May 31, 2016
|
|||||||||||||||
|
Allowance for deferred tax asset
|
$
|
1,791
|
|
$
|
40,685
|
|
$
|
(267
|
)
|
$
|
42,209
|
|
|||
|
Allowance for sales returns and doubtful accounts
|
$
|
3,043
|
|
$
|
3,748
|
|
$
|
(2,419
|
)
|
$
|
4,372
|
|
|||
|
Year Ended May 31, 2017
|
|||||||||||||||
|
Allowance for deferred tax asset
|
$
|
42,209
|
|
$
|
6,139
|
|
$
|
—
|
|
$
|
48,348
|
|
|||
|
Allowance for sales returns and doubtful accounts
|
$
|
4,372
|
|
$
|
(291
|
)
|
$
|
(1,136
|
)
|
$
|
2,945
|
|
|||
93
SIGNATURES
Pursuant to the requirements of Section 13 or 15(d) of the Securities Exchange Act of 1934, the registrant has duly caused this report to be signed on its behalf by the undersigned, thereunto duly authorized.
|
|
ANGIODYNAMICS, INC.
|
||||
|
Date:
|
|
August 4, 2017
|
By:
|
|
/
S
/ H
OWARD
W. D
ONNELLY
|
|
|
|
Howard W. Donnelly,
Chairman of the Board, Director
|
|||
Pursuant to the requirements of the Securities Exchange Act of 1934, this report has been signed below by the following persons on behalf of the registrant and in the capacities and on the dates indicated.
|
Date:
|
|
August 4, 2017
|
/
S
/ H
OWARD
W. D
ONNELLY
|
|
|
|
|
Howard W. Donnelly,
|
|
|
|
|
Chairman of the Board, Director
|
|
Date:
|
|
August 4, 2017
|
/
S
/ JAMES C. CLEMMER
|
|
|
|
|
James C. Clemmer,
|
|
|
|
|
President, Chief Executive Officer
(Principal Executive Officer)
|
|
Date:
|
|
August 4, 2017
|
/
S
/ MICHAEL C. GREINER
|
|
|
|
|
Michael C. Greiner
|
|
|
|
|
Executive Vice President, Chief Financial Officer, (Principal Financial and Principal Accounting Officer)
|
|
Date:
|
|
August 4, 2017
|
/
S
/ W
ESLEY
E. J
OHNSON
, J
R
.
|
|
|
|
|
Wesley E. Johnson, Jr.,
|
|
|
|
|
Director
|
|
Date:
|
|
August 4, 2017
|
/
S
/ J
EFFREY
G. G
OLD
|
|
|
|
|
Jeffrey G. Gold,
|
|
|
|
|
Director
|
|
Date:
|
|
August 4, 2017
|
/
S
/ D
ENNIS
S. M
ETENY
|
|
|
|
|
Dennis S. Meteny,
|
|
|
|
|
Director
|
|
Date:
|
|
August 4, 2017
|
/
S
/ S
TEVEN R.
L
A
P
ORTE
|
|
|
|
|
Steven R. LaPorte,
|
|
|
|
|
Director
|
|
Date:
|
|
August 4, 2017
|
/
S
/ K
EVIN
J. G
OULD
|
|
|
|
|
Kevin J. Gould,
|
|
|
|
|
Director
|
|
Date:
|
|
August 4, 2017
|
/
S
/ JAN REED
|
|
|
|
|
Jan Reed,
|
|
|
|
|
Director
|
|
Date:
|
|
August 4, 2017
|
/
S
/ EILEEN AUEN
|
|
|
|
|
Eileen Auen,
|
|
|
|
|
Director
|
94
EXHIBITS
|
(b)
|
Exhibits
|
|
2.1
|
Stockholders Agreement, dated as of May 22, 2012, among AngioDynamics, Inc. and the stockholders set forth on the signature pages thereto (incorporated by reference to Exhibit 2.2 of the Company’s current report on Form 8-K filed with the Commission on May 25, 2012).
|
|
2.2
|
Stock Purchase Agreement, dated as of October 8, 2012, by and among AngioDynamics, Inc., Vortex Medical, Inc. (“Vortex”), the stockholders of Vortex set forth on the signature pages thereto, the option holders of Vortex set forth on the signature pages thereto and CHTP Management Services, Inc., as sellers’ representative (incorporated by reference to Exhibit 2.1 of the Company’s current report on Form 8-K, filed with the Commission on October 12, 2012).
|
|
3.1.1
|
Amended and Restated Certificate of Incorporation (incorporated by reference to Exhibit 3.1 of the Company’s quarterly report on Form 10-Q, filed with the Commission on October 7, 2005).
|
|
3.1.2
|
Certificate of Amendment to the Amended and Restated Certificate of Incorporation of AngioDynamics, Inc. (incorporated by reference to Exhibit 3.1.2 of the Company's Annual Report on Form 10-K, filed with the Commission on August 10, 2015).
|
|
3.2
|
Second Amended and Restated By-Laws, effective October 16, 2015 (incorporated by reference to Exhibit 10.1 of the Company’s current report on Form 8-K, filed with the Commission on October 21, 2015).
|
|
10.1
|
Credit Agreement, dated as of November 7, 2016, by and among AngioDynamics, Inc., the lenders party thereto, JPMorgan Chase Bank, N.A., as administrative agent, Bank of America, N.A. and Keybank National Association as co-syndication agents, and JPMorgan Chase Bank, N.A., Merrill Lynch, Pierce, Fenner & Smith Incorporated and Keybank National Association as joint bookrunners and joint lead arrangers (incorporated by reference to Exhibit 10.1 to the Company’s current report on Form 8-K, filed with the Commission on November 10, 2016).
|
|
10.1.1
|
AngioDynamics, Inc. 1997 Stock Option Plan, as amended by the Board and Shareholders on February 27, 2004 (incorporated by reference to Exhibit 10.2 of the Company’s registration statement on Form S-1, filed on March 5, 2004).
|
|
10.1.2
|
AngioDynamics, Inc. 2004 Stock and Incentive Award Plan (as amended) (incorporated by reference to the Company’s Definitive Proxy Statement on Schedule 14A filed with the Commission on September 15, 2016).
|
|
10.1.3
|
AngioDynamics 2013 Total Shareholder Return Performance Unit Agreement Program (incorporated by reference to Exhibit 10.2 of the Company's current report on Form 8-K filed with the Commission on November 5, 2013).
|
|
10.1.4
|
AngioDynamics 2014 Total Shareholder Return Performance Unit Agreement Program (incorporated by reference to Exhibit 10.1.4 of the Company's Annual Report on Form 10-K filed with the Commission on January 12, 2015).
|
|
10.1.5
|
AngioDynamics 2015 Total Shareholder Return Performance Unit Agreement Program (incorporated by reference to Exhibit 10.1.5 of the Company’s Annual Report on Form 10-K filed with the Commission on August 10, 2015).
|
|
10.1.6
|
AngioDynamics 2016 Total Shareholder Return Performance Unit Agreement Program (incorporated by reference to Exhibit 10.1.6 of the Company’s Annual Report on Form 10-K filed with the Commission on August 1, 2016).
|
|
10.2
|
AngioDynamics, Inc. Employee Stock Purchase Plan (as amended) (incorporated by reference to the Company’s Definitive Proxy Statement on Schedule 14A filed with the Commission on September 15, 2016).
|
|
10.3
|
Form of Non-Statutory Stock Option Agreement pursuant to the AngioDynamics, Inc. Stock and Incentive Award Plan (incorporated by reference to Exhibit 10.1 of the Company’s quarterly report on Form 10-Q, filed with the Commission on October 12, 2004).
|
|
10.4.1
|
Form of 2013 Performance Share Award Agreement pursuant to the AngioDynamics, Inc. 2004 Stock and Incentive Award Plan (incorporated by reference to Exhibit 10.2 of the Company’s current report on Form 8-K, filed with the Commission on May 12, 2005).
|
|
10.4.2
|
Form of 2014 Performance Share Award Agreement pursuant to the AngioDynamics, Inc. 2004 Stock and Incentive Award Plan (incorporated by reference to Exhibit 10.4.2 of the Company's Annual Report on Form 10-K filed with the Commission on January 12, 2015).
|
|
10.4.3
|
Form of 2015 Performance Share Award Agreement pursuant to the AngioDyanmics, Inc. 2004 Stock and Incentive Award Plan (incorporated by reference to Exhibit 10.4.3 of the Company’s Annual Report on Form 10-K filed with the Commission on August 10, 2015).
|
95
|
10.4.4
|
Form of 2016 Performance Share Award Agreement pursuant to the AngioDyanmics, Inc. 2004 Stock and Incentive Award Plan (incorporated by reference to Exhibit 10.4.3 of the Company’s Annual Report on Form 10-K filed with the Commission on August 1, 2016).
|
|
10.5
|
Form of Restricted Stock Award Agreement pursuant to the AngioDynamics, Inc. 2004 Stock and Incentive Award Plan (incorporated by reference to the Company’s current report on Form 8-K, filed with the Commission on May 12, 2005).
|
|
10.6
|
Rita Medical Systems, Inc. 1994 Incentive Stock Plan (incorporated by reference to Exhibit 10.2 of Rita Medical Systems registration statement on Form S-1, filed with the Commission on May 3, 2000)
|
|
10.7
|
Horizon Medical Products, Inc. 1998 Stock Incentive Plan (incorporated by reference to Exhibit 10.11 of Horizon Medical Products’ registration statement on Form S-1, filed with the Commission on February 13, 1998.
|
|
10.8
|
Rita Medical Systems, Inc. 2000 Stock Plan (incorporated by reference to Exhibit 10.3 of Rita Medical Systems registration statement on Form S-1/A, filed with the Commission on June 14, 2000).
|
|
10.9
|
Rita Medical Systems, Inc. 2000 Directors’ Stock Plan, as amended on June 8, 2005 (incorporated by reference to Exhibit 99.2 of Rita Medical System’s registration statement on Form S-8, filed with the Commission on July 8, 2005).
|
|
10.10
|
Rita Medical Systems, Inc. 2005 Stock and Incentive Plan (incorporated by reference to Exhibit 99.1 of Rita Medical System’s registration statement on Form S-8, filed with the Commission on July 8, 2005).
|
|
10.11
|
Form of Indemnification Agreement of AngioDynamics, Inc. (incorporated by reference to Exhibit 10.1 of the Company’s current report on Form 8-K, filed with the Commission on May 12, 2006).
|
|
10.11.1
|
Employment Agreement, dated April 1, 2016, between AngioDynamics, Inc. and James C. Clemmer (incorporated by reference to Exhibit 10.1 of the Company’s current report on Form 8-K, filed with the Commission on April 6, 2016).
|
|
10.11.2
|
Employment Agreement, dated August 18, 2016, between AngioDynamics, Inc. and Michael C. Greiner (incorporated by reference to Exhibit 10.1 of the Company’s current report on Form 8-K, filed with the Commission on July 25, 2016).
|
|
10.12
|
Change in Control Agreement, dated April 1, 2016, between AngioDynamics, Inc. and James C. Clemmer (incorporated by reference to Exhibit 10.2 of the Company’s current report on Form 8-K, filed with the Commission on April 6, 2016).
|
|
10.12.1
|
Form of Severance Agreement of AngioDynamics, Inc. (incorporated by reference to Exhibit 10.1 of the Company’s current report on form 8-K, filed with the Commission on October 31, 2007).
|
|
10.13
|
Form of Change in Control Agreement (incorporated by reference to Exhibit 10.13 of the Company's Annual Report on Form 10-K filed with the Commission on January 12, 2015).
|
|
10.13.1
|
Change in Control Agreement, dated August 18, 2016, between AngioDynamics, Inc. and Michael C. Greiner (incorporated by reference to Exhibit 10.3 of the Company’s quarterly report on Form 10-Q, filed with the Commission on October 5, 2016).
|
|
10.14
|
Performance Share Award Agreement, with a grant date of April 4, 2016, between AngioDynamics, Inc. and James C. Clemmer (incorporated by reference to Exhibit 10.3 of the Company’s current report on Form 8-K, filed with the Commission on April 6, 2016).
|
|
10.15
|
AngioDynamics, Inc. Total Shareholder Return Performance Share Award Program - Performance Period Ending July 2019 (incorporated by reference to Exhibit 10.4 of the Company’s current report on Form 8-K, filed with the Commission on April 6, 2016).
|
|
10.16
|
Stock Option Award Agreement, with a grant date of April 4, 2016, between AngioDynamics, Inc. and James C. Clemmer (incorporated by reference to Exhibit 10.5 of the Company’s current report on Form 8-K, filed with the Commission on April 6, 2016).
|
|
10.17
|
Restricted Stock Unit Award Agreement, with a grant date of April 4, 2016, between AngioDynamics, Inc. and James C. Clemmer (incorporated by reference to Exhibit 10.6 of the Company’s current report on Form 8-K, filed with the Commission on April 6, 2016).
|
|
10.18
|
Separation Agreement and General Release, dated April 22, 2016, between AngioDynamics, Inc. and Joseph M. DeVivo (incorporated by reference to Exhibit 10.1 of the Company’s current report on Form 8-K, filed with the Commission on April 27, 2016).
|
|
10.19
|
AngioDynamics, Inc. Fiscal Year 2012 Senior Executive Equity Incentive Program (incorporated by reference to Exhibit 10.30 of the Company’s Annual Report on Form 10-K, filed with the commission on August 12, 2011).
|
96
|
14
|
Code of Ethics (incorporated by reference to Exhibit 14 of the Company’s current report on Form 8-K, filed with the Commission on May 12, 2006).
|
|
21
|
Subsidiaries
|
|
23
|
Consent of Deloitte & Touche LLP, an independent registered public accounting firm.
|
|
23.1
|
Consent of PricewaterhouseCoopers LLP, an independent registered public accounting firm.
|
|
31.1
|
Certification by the Chief Executive Officer Pursuant to Section 302 of the Sarbanes-Oxley Act of 2002.
|
|
31.2
|
Certification by the Chief Financial Officer Pursuant to Section 302 of the Sarbanes-Oxley Act of 2002.
|
|
32.1
|
Certification by the Chief Executive Officer Pursuant to 18 U.S.C. Section 1350, as Adopted Pursuant to Section 906 of the Sarbanes-Oxley Act of 2002.
|
|
32.2
|
Certification by the Chief Financial Officer Pursuant to 18 U.S.C. Section 1350, as Adopted Pursuant to Section 906 of the Sarbanes-Oxley Act of 2002.
|
|
101.INS
|
XBRL Instance Document
|
|
101.SCH
|
XBRL Schema Document
|
|
101.CAL
|
XBRL Calculation Linkbase Documents
|
|
101.DEF
|
XBRL Taxonomy Extension Definition Linkbase Document
|
|
101.LAB
|
XBRL Labels Linkbase Documents
|
|
101.PRE
|
XBRL Presentation Linkbase Documents
|
97
TABLE OF CONTENTS
Part IItem 1. BusinessItem 1A. Risk FactorsItem 1B. Unresolved Staff CommentsItem 2. PropertiesItem 3. Legal ProceedingsItem 4. Mine Safety DisclosuresPart IIItem 5. Market For Registrant S Common Equity, Related Stockholder Matters, and Issuer Purchases Of Equity SecuritiesItem 6. Selected Financial DataItem 7. Management S Discussion and Analysis Of Financial Conditions and Results Of OperationsItem 7A. Quantitative and Qualitative Disclosures About Market RiskItem 8. Financial Statements and Supplementary DataItem 9. Changes in and Disagreements with Accountants on Accounting and Financial DisclosureItem 9A. Controls and ProceduresItem 9B. Other InformationPart IIIItem 10. Directors, Executive Officers and Corporate GovernanceItem 11. Executive CompensationItem 12. Security Ownership Of Certain Beneficial Owners and Management and Related Stockholder MattersItem 13. Certain Relationships and Related Transactions, and Director IndependenceItem 14. Principal Accounting Fees and ServicesPart IVItem 15. Exhibits, Financial Statement Schedules