ANIXA BIOSCIENCES INC
10-Ks and 10-Qs
|
|
|
|
|
|
|
|
|
|
|
|
|
|
|
|
|
|
|
|
|
|
|
|
|
|
|
|
|
|
|
|
|
|
|
|
|
|
|
|
|
|
|
|
|
|
|
|
|
|
|
|
|
|
UNITED
STATES
SECURITIES
AND EXCHANGE COMMISSION
WASHINGTON,
D.C. 20549
|
||
|
FORM
10-K
|
||
|
x
ANNUAL
REPORT PURSUANT TO SECTION 13 OR 15(d) OF THE SECURITIES EXCHANGE ACT OF
1934 For the fiscal year ended October 31, 2009
|
||
|
or
|
||
|
o
TRANSITION
REPORT PURSUANT TO SECTION 13 OR 15(d) OF THE SECURITIES EXCHANGE ACT OF
1934
For
the transition period from ___________ to ___________
|
||
|
Commission
file number: 0-11254
|
||
|
COPYTELE,
INC.
|
||
|
(Exact
Name of Registrant as Specified in its Charter)
|
||
|
Delaware
|
11-2622630
|
|
|
(State
or Other Jurisdiction of Incorporation or Organization)
|
(I.R.S.
Employer Identification No.)
|
|
|
900
Walt Whitman Road
Melville,
NY 11747
(631)
549-5900
|
||
|
(Address,
Including Zip Code, and Telephone Number, Including Area Code, of
Registrant’s Principal Executive Offices)
|
||
|
Securities
registered pursuant to Section 12(b) of the Act:
None
|
||
|
Securities
registered pursuant to Section 12(g) of the Act:
Common
Stock, $.01 par value
|
||
|
Indicate
by check mark if the registrant is a well-known seasoned issuer, as
defined in Rule 405 of the Securities Act. Yes
[_] No [x]
|
||
|
Indicate
by check mark if the registrant is not required to file reports pursuant
to Section 13 or Section 15(d) of the Act. Yes [_] No
[x]
|
||
|
Indicate
by check mark whether the registrant: (1) has filed all reports required
to be filed by Section 13 or 15(d) of the Securities Exchange Act of 1934
during the preceding 12 months (or for such shorter period that the
registrant was required to file such reports), and (2) has been subject to
such filing requirements for the past 90
days. Yes [x] No [_]
|
||
|
Indicate
by check mark whether the registrant has submitted electronically and
posted on its corporate Website, if any, every Interactive Data File
required to be submitted and posted pursuant to Rule 405 of Regulation S-T
(§232.405 of this chapter) during the preceding 12 months (or for such
shorter period that the registrant was required to submit and post such
files). Yes [_] No [_]
|
||
|
Indicate
by check mark if disclosure of delinquent filers pursuant to Item 405 of
Regulation S-K (§229.405 of this chapter) is not contained herein, and
will not be contained, to the best of registrant’s knowledge, in
definitive proxy or information statements incorporated by reference in
Part III of this Form 10-K or any amendment to this Form
10-K. [ ]
|
||
|
Indicate
by check mark whether the registrant is a large accelerated filer, an
accelerated filer, a non-accelerated filer, or a smaller reporting
company. See the definitions of “large accelerated filer,” “accelerated
filer” and “smaller reporting company” in Rule 12b-2 of the Exchange
Act.
|
||
| Large accelerated filer [__] | Accelerated filer [__] |
| Non-accelerated filer [x] (Do not check if a smaller reporting company) | Smaller reporting company [__] |
|
Indicate
by check mark whether the registrant is a shell company (as defined in
Rule 12b-2 of the Act). Yes [_] No
[x]
|
||
|
Aggregate
market value of the voting stock (which consists solely of shares of
Common Stock) held by non-affiliates of the registrant as of April 30,
2009 (the last business day of the registrant’s most recently completed
second fiscal quarter), computed by reference to the closing sale price of
the registrant’s Common Stock on the Over-the-Counter Bulletin Board on
such date ($0.29 ): $33,998,452
|
||
|
On
January 25, 2010, the registrant had outstanding 146,040,511 shares of
Common Stock, par value $.01 per share, which is the registrant’s only
class of common stock.
|
|
DOCUMENTS
INCORPORATED BY REFERENCE:
NONE
|
Forward-Looking
Statements
Information
included in this Annual Report on Form 10-K may contain forward-looking
statements within the meaning of the Private Securities Litigation Reform Act of
1995. Forward-looking statements are not statements of historical
facts, but rather reflect our current expectations concerning future events and
results. We generally use the words “believes,” “expects,” “intends,”
“plans,” “anticipates,” “likely,” “will” and similar expressions to identify
forward-looking statements. Such forward-looking statements,
including those concerning our expectations, involve risks, uncertainties and
other factors, some of which are beyond our control, which may cause our actual
results, performance or achievements, or industry results, to be materially
different from any future results, performance or achievements expressed or
implied by such forward-looking statements. These risks,
uncertainties and factors include, but are not limited to, those factors set
forth in this Annual Report on Form 10-K under “Item 1A. – Risk Factors”
below. Except as required by applicable law, including the securities
laws of the United States, we undertake no obligation to publicly update or
revise any forward-looking statements, whether as a result of new information,
future events or otherwise. You are cautioned not to unduly rely on
such forward-looking statements when evaluating the information presented in
this Annual Report on Form 10-K.
Overview
As used
herein, “we,” “us,” “our,” the “Company” or “CopyTele” means CopyTele, Inc.
unless otherwise indicated. Our principal operations include the
development, production and marketing of thin, flat, low-voltage phosphor
display technology, the development of thin, flat, low-power passive display
technology and the development, production and marketing of multi-functional
encryption products that provide information security for domestic and
international users over virtually every communications media.
We have
pioneered the basic development of an innovative new type of flat panel display
technology, which is brighter, has higher contrast and consumes less power than
our prior display technology. This new proprietary display is a color
phosphor based display having a unique lower voltage electron emission system to
excite the color phosphors. As with our prior display technology, the
new technology emits light to display color images, such as movies from DVD
players. In addition, we are also developing another version of our
new type low voltage and low power display having a different matrix
configuration and phosphor excitation system. These new type of
displays are expected to be lower in cost than our prior displays.
1
In
November 2007, we entered into a Technology License Agreement (as amended, the
“License Agreement”) with Videocon Industries Limited, an Indian company
(“Videocon”). Under the License Agreement, we provide Videocon with a
non-transferable, worldwide license of our technology for thin, flat, low
voltage phosphor displays (the “Licensed Technology”), for Videocon (or a
Videocon Group company) to produce and market products, including TVs,
incorporating displays utilizing the Licensed Technology. Under the
License Agreement, we expect to receive a license fee of $11 million from
Videocon, payable in installments over a 27 month period, which commenced in May
2008, and an agreed upon royalty from Videocon based on display sales by
Videocon. In April 2008, the government of India approved the License
Agreement. As of October 31, 2009, we have received aggregate license
fee payments of $2,600,000.
Videocon
is the flagship company of the Videocon Group, one of India’s leading business
houses. Videocon Group is a fully integrated consumer electronics and
home appliances enterprise with backward integration in plasma panel, CRT glass,
color picture tubes and other key components for the consumer electronics, home
appliances and components industries. Videocon Group also operates in
the oil & gas sector. The Videocon Group has sales and service networks
throughout India and operates facilities in Europe and elsewhere in the
world.
We are
working with Videocon to implement our technology into production display
modules. The display modules consist of our low voltage phosphor
displays, the attached associated driver circuits, and controller
circuits. Under the License Agreement, Videocon, with our assistance,
is to provide the design and process engineering required to produce such
display modules and also provide all tooling and fixtures required for the
production process. Videocon has a group of qualified and experienced
personnel assigned to this program. As part of our assistance to
Videocon to produce such display modules, we are providing technical support to
Videocon’s technical team. We are also cooperating with Videocon to
jointly implement our technology prior to production to produce prototypes of
such modules. Videocon is utilizing its display processing technology
and facilities to continue to produce various configurations of our display
matrix to optimize its performance. The matrix is the main component
of our display, since it contains the structure to accommodate our electron
emission technology and the color phosphors that are used to illuminate our
display. Improvements to the technology are to be jointly owned by
CopyTele and Videocon.
Under the
License Agreement we continue to have the right to produce and market products
utilizing the Licensed Technology. We also continue to have the right
to utilize Volga Svet Ltd., a Russian corporation (“Volga”), with whom we have
been working with for more than twelve years, and an Asian company, with whom we
have been working with for more than six years, to produce and market, products
utilizing the Licensed Technology. Additional licenses of the
Licensed Technology to third parties require the joint agreement of CopyTele and
Videocon.
In
connection with the License Agreement, Videocon and CopyTele have each appointed
one senior advisor to the other’s board of directors to advise with respect to
strategic planning and technology in the display field.
2
At the
same time as we entered into the License Agreement, we entered into a share
subscription agreement with Mars Overseas (“Mars Overseas”), an affiliate of
Videocon, to purchase 20,000,000 unregistered shares of our common stock (the
“Share Subscription Agreement”), and CopyTele International Ltd. (“CopyTele
International”), our subsidiary, entered into a GDR Purchase Agreement to
purchase 1,495,845 global depository receipts (“GDRs”) of
Videocon. Both transactions were completed in our first fiscal
quarter of fiscal year 2008. See Note 1 to the Consolidated Financial
Statements.
Our
display technology includes a proprietary mixture of specially coated carbon
nanotubes and nano materials in combination with our proprietary low voltage
color phosphors. The specially coated carbon nanotubes, which are
supplied to us by a U.S. company, and nano materials, require a low voltage for
electron emission and are extremely small – approximately 10,000 times thinner
than the width of a human hair. The 5.5 inch (diagonal) display we
developed has 960 x 234 pixels and utilizes a new memory-based active matrix
thin film technology with each pixel phosphor activated by electrons emitted by
a proprietary carbon nanotube network located extremely close from the
pixels. The matrix also has a high pixel field factor to obtain high
contrast and low power consumption. As a result, each pixel phosphor brightness
is controlled using less than 40 volts. The carbon nanotubes and
proprietary color phosphors are precisely placed and separated utilizing our
proprietary nanotube and phosphor deposition technology. We have
developed a process of maintaining uniform carbon nanotube deposition
independent of phosphor deposition. We have also developed a method
of enhancing nanotube electron emission to increase the brightness of this type
of display.
We
believe our displays could potentially have a cost similar to a CRT and thus
cost less than current LCD or PDP displays partly because our display does not
contain a backlight, or color filter or polarizer, which represents a
substantial portion of the cost of an LCD.
In August
2009, we entered into a development agreement with a U.S. company to provide
engineering and implementation support for the development of our patented
extremely low power passive monochrome or color display for use in portable
devices. This company has experience in the field involving portions
of our display technology. Our proprietary extremely low power
display that we are developing, in conjunction with this U.S. company,
incorporates a new micro-matrix substrate. The display is designed to
have bi-stability capability, and uses low power when an image is being
created. Once an image is created, power consumption is
negligible. The display is expected to have both monochrome and or
color capability, and operate over wide temperature and environmental
conditions. The display utilizes a single substrate so that it can be
extremely thin, rugged and low weight. This display can be made in
any size, is expected to be low cost, and is especially suitable for portable
devices, such as, cell phones, I-phones, e-books, and other potential portable
devices. We have jointly formulated display designs and have
completed simulation analyses to optimize the display
configuration.
3
With the
arrival of the rapidly expanding digital book and news media applications, in
August 2009, we entered into an Engagement Agreement with ZQX Advisors, LLC
(“ZQX”) to assist us in seeking business opportunities and licenses for our
electrophoretic display technology (E-Paper
®
). ZQX
has an experienced business and legal team to assist us in this
area. Concurrently with entering into the Engagement
Agreement, we acquired a 19.5% ownership interest in ZQX in exchange for 800,000
unregistered shares of our common stock and warrants to purchase an additional
500,000 unregistered shares of our common stock, of which warrants to purchase
250,000 shares are exercisable at $0.37 per share and warrants to purchase
250,000 shares are exercisable at $0.555 per share. The warrants
expire in August 2019.
In
September 2009, we entered into a Technology License Agreement with Volga to
produce and market our thin, flat, low voltage phosphor displays in
Russia. We have been working with Volga for the past 12 years to
assist us with our low voltage phosphor displays. As part of our Technology
License Agreement with Volga, we expect to receive revenues from Volga, as it is
required to purchase the matrix substrate, carbon nanotubes, and associated
display electronics from us.
In
addition, in September 2009, we entered into a separate agreement with Volga
whereby we have obtained a 19.9% ownership interest in Volga in exchange for
150,000 unregistered shares of our common stock.
We
continue to pursue opportunities to market our voice, fax and data encryption
solutions in commercial and government markets. Our full array of hardware and
software products provide security over landline and wireless telephone systems
and networks.
Our
government and international markets are being supported by The Boeing Company
(“Boeing”) as well as their large distributors of Thuraya satellite telephones
and communication services. The Thuraya satellite network provides
blanket coverage to more than 110 countries in Europe, North, Central Africa and
large parts of Southern Africa, the Middle East, Central and South Asia and has
grown as a communications provider due to its geographic coverage, quality of
service and cost effective usage.
We have
developed a full lineup of specialized products for the Thuraya satellite
network that we are continuing to promote. Boeing distributes 13 of
our products, including our DCS-1400D (docker voice encryption device), USS-900T
(satellite fax encryption device), USS-900TL (landline to satellite fax
encryption device), USS-900WF (satellite and cellular fax encryption device),
USS-900WFL (landline to satellite and cellular fax encryption device) and
USS-900TC (satellite fax encryption to computer) products, which were
specifically designed for the Thuraya satellite network.
Our
products are being used by government agencies, military, as well as domestic
and international non-governmental organizations in the Middle East, Europe, Far
East and Africa. Our products are now being evaluated for use by Middle Eastern
and Far Eastern governments.
4
Asia
Pacific Satellite Industries (“APSI”) has manufactured new Thuraya handsets and
docking units that allow satellite communications both outdoors and
indoors. We have created devices allowing customers to easily set up
and engage in secure communications over the Thuraya satellite network
compatible with landline telephone systems. APSI’s FDU-3500 docking
unit for its SO-2510 phone allows for outdoor and indoor operation of the
satellite phone on the Thuraya satellite network. Our PA-3500 and
PA-3500T products allow compatibility between our DCS-1200, DCS-1400 and
USS-900T encryption devices and the APSI FDU-3500 docking unit and SO-2510
phone.
Our
products provide secure communications with many different satellite phones,
including the Thuraya 7100/7101/SO-2510 handheld terminal (“HHT”), Globalstar
GSP-1600 HHT, Telit SAT-550/600 HHT, Globalstar GSP-2800/2900 fixed phone,
Iridium 9500/9505/9505A HHT, Inmarsat M4 and Mini “M” HHT units from Thrane
& Thrane and Nera. Through the use of our products, encrypted
satellite communications are available for many Thuraya docking units, including
Teknobil’s Next Thuraya Docker, Thuraya’s Fixed Docking Adapter, APSI’s FDU-2500
and FDU-3500 Fixed Docking Units, and Sattrans’s SAT-OFFICE Fixed Docking Unit
and SAT-VDA Hands-Free Car Kit.
We have
designed and developed a breathe of products that provide flexible security
performance, whether using any of the many satellite phones or docking units on
the market while having the ability of using the same device or compatible
device on cellular or landline phones. We are continuing our
consultations with specialists of the Inmarsat BGAN system and the new Iridium
USB satellite phone developing compliant encryption solutions that offer new
opportunity and an increased customer base. We continue to seek
opportunities to market our products for securing landline and wireless voice
and fax communications. Our specific Thuraya products are being
evaluated for use by a Middle Eastern government. Also, a Far Eastern
government is in the process of determining the system requirements necessary to
encrypt voice communications utilizing our USS-900, DCS-1200 and DCS-1400
products.
We were
incorporated on November 5, 1982 under the laws of the State of
Delaware. Our principal executive offices are located at 900 Walt
Whitman Road, Melville, New York 11747, our telephone number is 631-549-5900,
and our Internet website address is www.copytele.com. We make
available free of charge on or through our Internet website our annual report on
Form 10-K, quarterly reports on Form 10-Q, current reports on Form 8-K, proxy
statements on Schedule 14A, and amendments to those reports filed or furnished
pursuant to Section 13(a) or 15(d) of the Securities Exchange Act of 1934 as
soon as reasonably practicable after we electronically file such materials with,
or furnish them to, the Securities and Exchange Commission (the
“SEC”).
5
New Technologies Under
Development
Display
Technology
We are
continuing to pursue our efforts to develop new technologies for our color
nanotube and E-Paper
®
displays. We are continuing to develop another version of our new
type low voltage and low power nanotube display having a different matrix
configuration and phosphor excitation system. This new type of
display is covered under the license provided to Videocon and is expected to be
lower in cost to produce than our prior displays.
Encryption
Technology
We are
continually engaged in the development of additional capabilities for our
current product lines as well as the development of new products to meet current
and anticipated customer applications. We are further developing encryption
products and pursuing commercial security opportunities created by the Health
Insurance Portability and Accountability Act (“HIPAA”), the Sarbanes-Oxley Act,
the Gramm-Leach-Bliley Act and other corporate governance
requirements.
Other
products under development include the following:
|
·
|
A
voice encryption device for integration into the APSI SO-2510 handset that
takes advantage of the Thuraya voice network. This application
simplifies the customer’s security configuration while reducing the
utilization costs.
|
|
·
|
Advancing
our compatibility with Universal Serial Bus (USB) connected cellular and
satellite phones with our DCS-1400 device. The additional
services will expand our wireless compatibility domestically and
abroad.
|
|
·
|
A
software based voice encryption solution that is capable of running on new
“smart phone” cellular/Voice Over Internet Protocol (VoIP)
devices.
|
Production
Flat Panel Video Display
Products
Under our
License Agreement with Videocon, Videocon (or a Videocon Group company) is to
produce products incorporating displays utilizing our technology. We
are working with Videocon to implement our display technology for Videocon to
produce the displays. We are also producing color displays, with the
assistance of Volga and the Asian company, which incorporate the new type of
matrix and phosphor excitation system described above.
6
Encryption
Products
Our
hardware encryption products consist of a printed circuit board populated with
electronic components and connectors enclosed in a plastic case. We
design all the hardware, software, packaging and operating manuals for our
products. The four main electronic components – the Citadel™ CCX
encryption chip or hardware key generator chip; a digital signal processor; a
vocoder; and modems – are contained on a printed circuit board. We
are currently using several U.S.-based electronics-production contractors to
procure the printed circuit boards and mount the associated electronics
components on the circuit board. We currently use approximately a
dozen primary component and printed circuit-board suppliers and one production
assembly contractor. Given normal lead times, we anticipate having a
readily available supply of all electronic components that we require for
assembling our encryption products.
Our
production contractors produce and visually inspect the completed circuit
boards. We perform final assembly, including installation of the
software, by enclosing the completed printed circuit boards into the product and
performing functionality testing of all units at our premises at Melville, New
York prior to shipment to our customers. We test our finished
products using internally developed product assurance testing
procedures. We currently produce our line of products in quantities
to meet marketing requirements.
Marketing and
Sales
Flat Panel Video Display
Products
Under our
License Agreement with Videocon, Videocon (or a Videocon Group company) is to
market the products it produces that incorporate displays utilizing our
technology. We are cooperating with Videocon to implement our display
technology for Videocon to produce such products, including TV’s.
Encryption
Products
During
the past year we have continued to direct our marketing efforts to participate
in the security opportunities created by the U.S. Department of Homeland
Security, the Defense Department, and the enactment of laws such as HIPAA, the
Sarbanes-Oxley Act, and Gramm-Leach-Bliley Act, which mandate that government
and private sector firms provide higher levels of information privacy and
security. We are working on applications involving our encryption
technology that offer simple, straight-forward compliance measures for these
laws.
Our
distributors market our line of encryption products to domestic and
international commercial and government customers. These products
include voice, fax and data devices on a non-exclusive basis. We are
also supported by international Thuraya service providers to distribute our
encryption equipment abroad. The launch of the third Thuraya
Geo-mobile satellite in January 2008 allowed Thuraya to embark on major
expansion plans to provide their mobile satellite services in the Asia-Pacific
region, potentially opening new markets for CopyTele security solutions that are
designed for the Thuraya network.
7
In
addition, we presently use a network of distributors in the security field and
original equipment manufacturers which market our encryption products on a
non-exclusive basis. These distributors, along with our internal
marketing group, have sold and marketed our encryption products to multinational
corporations, U.S. and foreign governments and local and federal law enforcement
agencies.
We
continue to provide training and technical support to our customers and to our
distributors and dealers.
Customers
During
fiscal year 2009, we recognized approximately $913,000 in net revenue from
Videocon, representing approximately 95% of net revenue in our Display
Technology Segment and approximately 87% of our total net
revenue. During fiscal year 2008, we recognized approximately
$1,687,000 in net revenue in our Display Technology Segment from Videocon
(constituting all of the revenue in such segment), representing approximately
82% of our total net revenue. During fiscal year 2007, we recognized
$240,000 in net revenue from Digital Info Security Co. Inc. (“DISC”),
representing approximately 49% of our total net revenue, and approximately
$143,000 in net revenue from Delta Bridge, Inc., representing approximately
29% of total net revenue. All net revenue during fiscal year 2007 was
in our Encryption Products and Services Segment.
Competition
The
market for encryption products and flat panel displays worldwide is highly
competitive and subject to technological changes. Although successful
product and systems development is not necessarily dependent on substantial
financial resources, most of our competitors are larger than us and possess
financial, research, service support, marketing, manufacturing and other
resources significantly greater than ours.
There are
several other companies that sell hardware and/or software encryption products
and there are many large companies that sell flat panel displays. We
believe, however, that the technology contained in our encryption products and
our flat panel displays have features that distinguish them from the products
being sold by our competitors. The encryption security and flat panel
display markets are likely to be characterized by rapid advances in technology
and the continuing introduction of new products that could render our products
obsolete or non-competitive. We can give no assurances that we will
be able to compete successfully in the market for our encryption products and
our flat panel displays.
Patents
We have
received patents from the United States and certain foreign patent offices,
expiring at various dates between 2010 and 2027. We have also filed
or are planning to file patent applications for our video and E-Paper® displays,
and encryption technologies.
8
We can
give no assurances that patents will be issued for any of our pending
applications. In addition, we can give no assurances that any patents
held or obtained will sufficiently protect us against our
competitors. We are not aware that any of our encryption products are
infringing upon the patents of others. We cannot provide any
assurances, however, that other products developed by us, if any, will not
infringe upon the patents of others, or that we will not have to obtain licenses
under the patents of others, although we are not aware of any such infringement
at this time.
We
believe that the foregoing patents are significant to our future
operations.
Research and
Development
Research
and development expenses were approximately $4,116,000, $4,127,000, and
$3,404,000 for the fiscal years ended October 31, 2009, 2008 and 2007,
respectively. See “Management’s Discussion and Analysis of Financial
Condition and Results of Operations” below and our Consolidated Financial
Statements.
Employees and
Consultants
We had 20
employees and 14 consultants as of October 31, 2009. Eighteen of
these individuals, including our Chairman of the Board and Chief Executive
Officer, are engaged in research and development. Their backgrounds
include expertise in physics, chemistry, optics and electronics. Six
individuals are engaged in marketing and the remaining individuals are engaged
in administrative and financial functions for us. None of our
employees is represented by a labor organization or union.
Financial Information About
Segments and Geographical Areas
See our
Consolidated Financial Statements.
Our
business involves a high degree of risk and uncertainty, including the following
risks and uncertainties:
|
·
|
We
have experienced significant net losses and negative cash flows from
operations and they may continue.
|
We have
had net losses and negative cash flows from operations in each year since our
inception, and we may continue to incur substantial losses and experience
substantial negative cash flows from operations. We have incurred
substantial costs and expenses in developing our encryption and flat panel
display technologies and in our efforts to produce commercially marketable
products incorporating our technology. We have had limited sales of
products to support our operations from inception through October 31,
2009. We have set forth below our net losses, research and
development expenses and net cash used in operations for the three fiscal years
ended October 31, 2009, 2008 and 2007:
9
|
Fiscal Years Ended October
31,
|
||||||||||||
|
2009
|
2008
|
2007
|
||||||||||
|
Net
loss
|
$ | 16,489,015 | $ | 5,821,604 | $ | 5,458,218 | ||||||
|
Research
and development expenses
|
4,116,200 | 4,127,393 | 3,403,943 | |||||||||
|
Net
cash used in operations
|
2,501,566 | 901,868 | 2,396,859 | |||||||||
|
·
|
We
may need additional funding in the future which may not be available on
acceptable terms and, if available, may result in dilution to our
stockholders.
|
We
anticipate that, if cash generated from operations is insufficient to satisfy
our requirements, we will require additional funding to continue our research
and development activities and market our products. We believe that
our existing cash, cash equivalents, investments in U.S. government securities
and accounts receivable, together with cash flows from expected sales of our
encryption products and revenue relating to our thin, flat, low-voltage phosphor
display technology, including license fees and royalties from Videocon, and
other potential sources of cash flows, will be sufficient to enable us to
continue our marketing, production, and research and development
activities. However, our projections of future cash needs and cash
flows may differ from actual results. If current cash and cash that
may be generated from operations are insufficient to satisfy our liquidity
requirements, we may seek to sell debt or equity securities or to obtain a line
of credit. The sale of additional equity securities or convertible
debt could result in dilution to our stockholders. It is also
management’s intention to continue to compensate employees by issuing stock or
stock options. We currently have no arrangements with respect to
additional financing. We can give no assurances that we will generate
sufficient revenues in the future (through sales, license fees and royalties, or
otherwise) to satisfy our liquidity requirements or sustain future operations,
that our production capabilities will be adequate, that other products will not
be produced by other companies that will render our products obsolete, or that
other sources of funding would be available, if needed, on favorable terms or at
all. If we cannot obtain such funding if needed, we would need to
curtail or cease some or all of our operations.
|
·
|
We
may not generate sufficient revenue to support our operations in the
future or to generate profits.
|
Our
principal operations include the development, production and marketing of thin,
flat, low-voltage phosphor display technology, the development of thin, flat,
low-power passive display technology and the development, production and
marketing of multi-functional encryption products that provide information
security for domestic and international users over virtually every
communications media. In May 2008, we began receiving license fees
related to our display technology from Videocon pursuant to the License
Agreement. The License Agreement provides for payment of additional
license fees over the next fiscal year as well as the payment of certain
royalties based on sales of products containing our display
technology. However, we can give no assurances that thereafter we
will receive any license or similar fees relating to our display technology or
that we will receive any royalty payments from Videocon. In addition,
our arrangements with Videocon involve counterparty risk. Our
encryption products are only in their initial stages of commercial
production. Our investments in research and development are
considerable. Our ability to generate sufficient revenues to support
our operations in the future or to generate profits will depend upon numerous
factors, many of which are beyond our control, including, but not limited
to:
10
|
·
|
Our
and Videocon’s ability to implement our technology for Videocon to produce
and market products containing our
displays.
|
|
·
|
The
capability of Volga, with whom we have been working for twelve years, to
produce color and monochrome displays and supply them to
us.
|
|
·
|
Our
ability to successfully market our line of encryption
products.
|
|
·
|
Our
production capabilities and those of our suppliers as required for the
production of our encryption
products.
|
|
·
|
Long-term
performance of our products.
|
|
·
|
The
capability of our dealers and distributors to adequately service our
encryption products.
|
|
·
|
Our
ability to maintain an acceptable pricing level to end-users for both our
encryption and display products.
|
|
·
|
The
ability of suppliers to meet our and Videocon’s requirements and
schedule.
|
|
·
|
Our
ability to successfully develop other new products under development,
including our thin, flat, low-power passive display
technology.
|
|
·
|
Rapidly
changing consumer preferences.
|
|
·
|
The
possible development of competitive products that could render our
products obsolete or unmarketable.
|
|
·
|
Our
future negotiations with Volga with respect to payments and other
arrangements with Volga.
|
|
·
|
Our
ability to successfully implement and commercialize our E-Paper
®
display technology.
|
Because
our revenue is subject to fluctuation, we may be unable to reduce operating
expenses quickly enough to offset any unexpected revenue
shortfall. If we have a shortfall in revenue in relation to expenses,
our operating results would suffer. Our operating results for any
particular fiscal year may not be indicative of future operating
results. You should not rely on year-to-year comparisons of results
of operations as an indication of our future performance.
|
·
|
Our
arrangements with Videocon involve market
risks.
|
At the
same time as we entered into the License Agreement, we entered into the Share
Subscription Agreement with Mars Overseas, to purchase 20,000,000 unregistered
shares of our common stock (the “CopyTele Shares”), and a subsidiary of ours,
CopyTele International, entered into a GDR Purchase Agreement to purchase
1,495,845 GDRs of Videocon (the “Videocon GDRs”). The Videocon GDRs
are listed on the Luxembourg Stock Exchange. The value of the
Videocon GDRs owned by us depends upon, among other things, the value of
Videocon’s securities in its home market of India, as well as exchange rates
between the U.S. dollar and Indian rupee (the currency in which Videocon’s
securities are traded in its home market). The value of the Videocon GDRs
declined substantially in fiscal year 2008 and while it has partially recovered
in fiscal year 2009, we recorded an other than temporary
impairment. We can give no assurances that the value of the Videocon
GDRs will not decline in the future and future write downs may
occur.
11
In
addition, for the purpose of effecting a lock up of the Videocon GDRs and
CopyTele Shares (collectively, the “Securities”) for a period of seven years,
and therefore restricting both parties from selling or transferring the
Securities during such period, CopyTele International and Mars Overseas entered
into two Loan and Pledge Agreements. The Videocon GDRs are to be held
as security for a loan in principal the amount of $5,000,000 from Mars Overseas
to CopyTele International, and the CopyTele Shares are similarly held as
security for a loan in the principal amount of $5,000,000 from CopyTele
International to Mars Overseas. The loans are for a term of
seven years and do not bear interest. The loan agreements also
provide for customary events of default which may result in forfeiture of the
Securities by the defaulting party. We can give no assurances that
the respective parties receiving such loans will not default on such
loans.
|
·
|
Our
arrangements with Volga involve liquidity and market
risks.
|
At the
same time as we entered into the Technology License Agreement with Volga, we
acquired a 19.9% ownership interest in Volga in exchange for 150,000
unregistered shares of our common stock. The Volga shares are not
publicly traded and there is no assurance that we will be able to sell the
shares at an acceptable price, if at all.
|
·
|
We
are dependent upon a few key employees and the loss of their services
could adversely affect us.
|
Our
future success is dependent on our ability to hire, retain and motivate highly
qualified personnel. In particular, our success depends on the
continued efforts of our Chief Executive Officer, Denis A. Krusos, who is
engaged in the management and operations of our business, including all aspects
of the development, production and marketing of our encryption products and flat
panel display technology. In addition, Mr. Krusos, as well as our
other skilled management and technical personnel, are important to our future
business and financial arrangements. We do not have an employment
agreement with, nor do we maintain “key person” life insurance on, Mr.
Krusos. The loss of the services of any such persons could have a
material adverse effect on our business and operating results.
12
|
·
|
The
very competitive markets for our encryption products and flat panel
display technology could have a harmful effect on our business and
operating results.
|
The
markets for our encryption products and flat panel display technology worldwide
are highly competitive and subject to rapid technological
changes. Most of our competitors are larger than us and possess
financial, research, service support, marketing, manufacturing and other
resources significantly greater than ours. Competitive pressures may
have a harmful effect on our business and operating results.
|
·
|
Our
common stock is subject to the SEC’s penny stock rules which may make our
shares more difficult to sell.
|
Our
common stock fits the definition of a penny stock and therefore is subject to
the rules adopted by the SEC regulating broker-dealer practices in connection
with transactions in penny stocks. These SEC rules may have the
effect of reducing trading activity in our common stock making it more difficult
for investors to sell their shares. The SEC rules require a broker or
dealer proposing to effect a transaction in a penny stock to deliver the
customer a risk disclosure document that provides certain information prescribed
by the SEC, including, but not limited to, the nature and level of risks in the
penny stock market. The broker or dealer must also disclose the
aggregate amount of any compensation received or receivable by him in connection
with such transaction prior to consummating the transaction. In
addition, the SEC rules also require a broker or dealer to make a special
written determination that the penny stock is a suitable investment for the
purchaser and receive the purchaser’s written agreement to the transaction
before completion of the transaction. The existence of these SEC
rules may result in a lower trading volume of our common stock and lower trading
prices.
|
·
|
We
have not paid, nor do we anticipate paying, any cash dividends in the
future.
|
We have
never paid cash dividends and do not anticipate paying any cash dividends in the
foreseeable future. Payment of dividends on our common stock is
within the discretion of our Board of Directors and will depend upon our future
earnings, capital requirements, financial condition and other relevant
factors. We have no plan to declare any cash dividends in the
foreseeable future. It is anticipated that earnings, if any, which
may be generated from future operations will be used to finance our continued
operations.
None.
We lease
approximately 12,000 square feet of office and laboratory research facilities at
900 Walt Whitman Road, Melville, New York (our principal offices) from an
unrelated party pursuant to a lease that expires November 30,
2011. It is our intent to renew this lease upon
expiration. Our base rent is approximately $288,000 per annum with a
3% annual increase and an escalation clause for increases in certain operating
costs. See Note 8 to our Consolidated Financial
Statements.
13
We
believe that the facilities described above are adequate for our current
requirements.
We are
not a party to any material pending legal proceedings. We are party
to claims, and complaints that arise in the ordinary course of business.
We believe that any liability that may ultimately result from the resolution of
these matters will not, individually or in the aggregate, have a material
adverse effect on our financial position or results of operations.
At our
Annual Meeting of Stockholders, held on October 29, 2009, three directors were
elected and the selection of KPMG LLP, independent registered public
accountants, as our independent auditors for fiscal year ending October 31, 2009
was ratified. The following is a tabulation of the voting with
respect to the foregoing matters:
(a) Election
of Directors:
|
Nominee
|
For
|
Withheld
|
|
Denis
A. Krusos
|
122,204,111
|
3,414,021
|
|
Henry
P. Herms
|
112,988,877
|
3,629,255
|
|
George
P. Larounis
|
123,874,325
|
1,743,007
|
(b) Ratification
of selection of KPMG LLP as independent auditors for fiscal year ending October
31, 2009:
|
For
|
Against
|
Abstain
|
|
125,321,316
|
237,658
|
59,160
|
14
|
|
|
Item
5.
|
Market for the
Registrant’s Common Equity, Related Stockholder Matters and Issuer
Purchases of Equity
Securities.
|
Market
Information
Our
common stock trades on the Over-the-Counter Bulletin Board (the “OTCBB”) under
the symbol “COPY”. The high and low sales prices as reported by the
OTCBB for each quarterly fiscal period during our fiscal years ended October 31,
2009 and 2008 have been as follows:
|
Fiscal
Period
|
High
|
Low
|
|
1st
quarter 2009
2nd
quarter 2009
3rd
quarter 2009
4th
quarter 2009
|
$0.50
0.38
0.42
1.10
|
$0.25
0.19
0.28
0.34
|
|
1st
quarter 2008
2nd
quarter 2008
3rd
quarter 2008
4th
quarter 2008
|
$1.94
1.39
1.15
0.98
|
$0.80
0.69
0.65
0.34
|
Holders
As of
January 25, 2010, the approximate number of record holders of our common stock
was 1,241 and the closing price of our common stock was $0.48 per
share.
Securities Authorized for
Issuance Under Equity Compensation Plans
See “Item
12. Security Ownership of Certain Beneficial Owners and Management and Related
Stockholder Matters.”
Dividend
Policy
No cash
dividends have been paid on our common stock since our inception. We
have no present intention to pay any cash dividends in the foreseeable
future.
Recent Sales of Unregistered
Securities
As more
fully set forth in “Item 1. Business” above, on August 20, 2009, we issued to
ZQX 800,000 unregistered shares of our common stock together with warrants to
purchase an additional 500,000 unregistered shares of our common stock in
exchange for a 19.5% ownership interest in ZQX. Warrants to purchase
250,000 shares are exercisable at $0.37 per share and warrants to purchase the
remaining 250,000 shares are exercisable at $0.555 per share. The warrants are
exercisable at any time after August 19, 2010 and expire in August
2019.
15
As more
fully set forth in “Item 1. Business” above, on September 9, 2009, we issued to
Volga 150,000 unregistered shares of our common stock in exchange for a 19.9%
ownership interest in Volga.
The
securities issuances referred to above (i) were not subject to any underwriting
discounts or commissions, (ii) were issued only to “accredited investors” as
such term is defined in Rule 501 of Regulation D and (iii) were exempt from
registration pursuant to Section 3(b) and 4(2) of the Securities Act of 1933, as
amended.
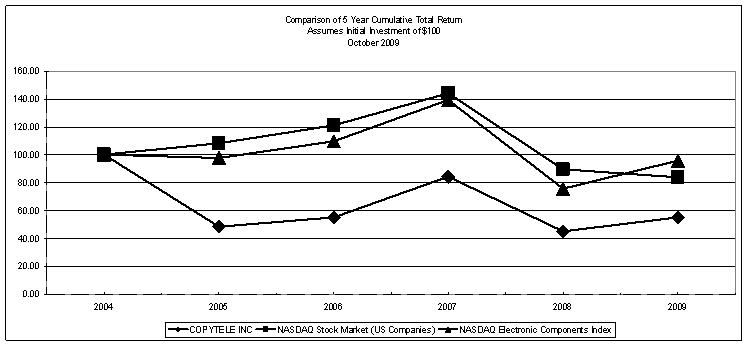
Stockholder Return
Performance Graph
Set forth
below is a graph showing the five-year cumulative total return for: (i) our
Common Stock; (ii) The Nasdaq Stock Market U.S. Index, a broad market index
covering shares of common stock of domestic companies that are listed on Nasdaq;
and (iii) The Nasdaq Electronic Components Stock Index, a group of
companies that are engaged in the manufacture of electronic components and
related accessories with a Standard Industrial Classification Code of 367 and
listed on NASDAQ.
16
|
Fiscal
Year Ended October 31
|
|||||||||||||||||||||||||
|
2004
|
2005
|
2006
|
2007
|
2008
|
2009
|
||||||||||||||||||||
|
COPYTELE
INC
|
Cum
$
|
100.00 | 48.60 | 55.14 | 84.11 | 44.85 | 55.13 | ||||||||||||||||||
|
NASDAQ
Stock Market (US Companies)
|
Cum
$
|
100.00 | 108.28 | 121.32 | 144.29 | 89.37 | 83.71 | ||||||||||||||||||
|
NASDAQ
Electronic Components Index
|
Cum
$
|
100.00 | 97.80 | 109.52 | 139.21 | 75.89 | 95.78 | ||||||||||||||||||
The
comparison of total return on investment for each fiscal year ended October 31
assumes that $100 was invested on November 1, 2004 in each of CopyTele, The
Nasdaq Electronic Components Index and The Nasdaq Stock Market U.S. Index with
investment weighted on the basis of market capitalization and all dividends
reinvested.
Issuer Purchases of Equity
Securities
None.
The
following selected financial data has been derived from our audited Consolidated
Financial Statements and should be read in conjunction with those statements,
and the notes related thereto, which are included in this Annual Report on Form
10-K.
|
As
of and for the fiscal years ended October 31,
|
||||||||||||||||||||
|
2009
|
2008
|
2007
|
2006
|
2005
|
||||||||||||||||
|
Net
Revenue
|
$ | 1,055,797 | $ | 2,063,123 | $ | 486,852 | $ | 508,651 | $ | 439,785 | ||||||||||
|
Cost
of encryption products sold
|
27,861 | 95,594 | 73,953 | 104,672 | 112,321 | |||||||||||||||
|
Provision
for excess inventory
|
19,627 | - | - | - | 586,662 | |||||||||||||||
|
Cost
of encryption services
|
- | - | 86,407 | 51,774 | 20,645 | |||||||||||||||
|
Cost
of display engineering services
|
18,200 | - | - | - | - | |||||||||||||||
|
Research
and Development Expenses
|
4,116,200 | 4,127,393 | 3,403,943 | 4,614,300 | 2,266,911 | |||||||||||||||
|
Selling,
General and Administrative Expenses
|
4,194,227 | 3,829,654 | 2,414,916 | 3,365,521 | 1,919,010 | |||||||||||||||
|
Impairment
in value of available for sale securities
|
9,218,972 | - | - | - | - | |||||||||||||||
|
Dividend
Income
|
29,468 | 130,886 | - | - | - | |||||||||||||||
|
Interest
Income
|
20,807 | 37,028 | 34,149 | 26,715 | 14,507 | |||||||||||||||
|
Net
Loss
|
(16,489,015 | ) | (5,821,604 | ) | (5,458,218 | ) | (7,600,901 | ) | (4,451,257 | ) | ||||||||||
|
Net
Loss Per Share of Common Stock – Basic and
Diluted
|
$ | (.12 | ) | $ | (.05 | ) | $ | (.05 | ) | $ | (.08 | ) | $ | (.05 | ) | |||||
|
Total
Assets
|
9,848,446 | 7,497,869 | 1,870,159 | 1,863,629 | 1,466,253 | |||||||||||||||
|
Long
Term Obligations
|
- | - | - | - | - | |||||||||||||||
|
Shareholders’
Equity
|
4,452,272 | 1,730,277 | 1,191,350 | 1,281,841 | 1,118,023 | |||||||||||||||
|
Cash
Dividends Per Share of Common Stock
|
- | - | - | - | - | |||||||||||||||
17
|
Item
7.
|
Management’s
Discussion and Analysis of Financial
Condition and Results
of Operations.
|
Forward-Looking
Statements
Information
included in this Annual Report on Form 10-K may contain forward-looking
statements within the meaning of the Private Securities Litigation Reform Act of
1995. Forward-looking statements are not statements of historical
facts, but rather reflect our current expectations concerning future events and
results. We generally use the words “believes,” “expects,” “intends,”
“plans,” “anticipates,” “likely,” “will” and similar expressions to identify
forward-looking statements. Such forward-looking statements,
including those concerning our expectations, involve risks, uncertainties and
other factors, some of which are beyond our control, which may cause our actual
results, performance or achievements, or industry results, to be materially
different from any future results, performance or achievements expressed or
implied by such forward-looking statements. These risks,
uncertainties and factors include, but are not limited to, those factors set
forth in this Annual Report on Form 10-K under “Item 1A. – Risk Factors”
above. Except as required by applicable law, including the securities
laws of the United States, we undertake no obligation to publicly update or
revise any forward-looking statements, whether as a result of new information,
future events or otherwise. You are cautioned not to unduly rely on
such forward-looking statements when evaluating the information presented in
this Annual Report on Form 10-K.
General
Our
principal operations include the development, production and marketing of thin,
flat, low-voltage phosphor display technology, the development of thin, flat,
low-power passive display technology and the development, production and
marketing of multi-functional encryption products that provide information
security for domestic and international users over virtually every
communications media.
We have
developed an innovative new type of flat panel display technology, which is
brighter, has higher contrast and consumes less power than our prior display
technology. This new proprietary display is a color phosphor based
display having a unique lower voltage electron emission system to excite the
color phosphors. As with our prior display technology, the new
technology emits light to display color images, such as movies from DVD
players. In addition, we are also developing another version of our
new type low voltage and low power display having a different matrix
configuration and phosphor excitation system. These new type of
displays are expected to be lower in cost than our prior displays.
In November 2007, we entered into a Technology License
Agreement (as amended, the “License Agreement”) with Videocon Industries
Limited, an Indian company (“Videocon”). Under the License Agreement,
we provide Videocon with a non-transferable, worldwide license of our technology
for thin, flat, low voltage phosphor displays (the “Licensed Technology”), for
Videocon (or a Videocon Group company) to produce and market products, including
TVs, incorporating displays utilizing the Licensed Technology. Under
the License Agreement, we expect to receive a license fee of $11 million from
Videocon, payable in installments over a 27 month period, which commenced in May
2008, and an agreed upon royalty from Videocon based on display sales by
Videocon.
In April 2008, the government of India approved the
License Agreement.
18
Videocon
is the flagship company of the Videocon Group, one of India’s leading business
houses. Videocon Group is a fully integrated consumer electronics and
home appliances enterprise with backward integration in plasma panel, CRT glass,
color picture tubes and other key components for the consumer electronics, home
appliances and components industries. Videocon Group also operates in
the oil & gas sector. The Videocon Group has sales and service networks
throughout India and operates facilities in Europe and elsewhere in the
world.
We are
working with Videocon to implement our technology into production display
modules. The display modules consist of our low-voltage phosphor
displays, the attached associated driver circuits, and controller
circuits. Under the License Agreement, Videocon, with our assistance,
is to provide the design and process engineering required to produce such
display modules and also provide all tooling and fixtures required for the
production process. Videocon has a group of qualified and experienced
personnel assigned to this program. As part of our assistance to
Videocon to produce such display modules, we are providing technical support to
Videocon’s technical team. We are also cooperating with Videocon to
jointly implement our technology prior to production to produce prototypes of
such modules. Videocon is utilizing its display processing technology
and facilities to continue to produce various configurations of our display
matrix to optimize its performance. The matrix is the main component
of our display, since it contains the structure to accommodate our electron
emission technology and the color phosphors that are used to illuminate our
display. Improvements to the technology are to be jointly owned by
CopyTele and Videocon.
Under the
License Agreement we continue to have the right to produce and market products
utilizing the Licensed Technology. We also continue to have the right
to utilize Volga Svet Ltd., a Russian corporation (“Volga”), with whom we have
been working with for more than twelve years, and an Asian company, with whom we
have been working with for more than six years, to produce and market, products
utilizing the Licensed Technology. Additional licenses of the
Licensed Technology to third parties require the joint agreement of CopyTele and
Videocon.
In
connection with the License Agreement, Videocon and CopyTele have each appointed
one senior advisor to the other’s board of directors to advise with respect to
strategic planning and technology in the display field.
At the
same time as we entered into the License Agreement, we entered into a share
subscription agreement with Mars Overseas (“Mars Overseas”), an affiliate of
Videocon, to purchase 20,000,000 unregistered shares of our common stock (the
“Share Subscription Agreement”), and CopyTele International Ltd. (“CopyTele
International”), our subsidiary, entered into a GDR Purchase Agreement to
purchase 1,495,845 global depository receipts (“GDRs”) of
Videocon. Both transactions were completed in our first fiscal
quarter of fiscal year 2008. See Note 1 to the Consolidated Financial
Statements.
19
Our
display technology includes a proprietary mixture of specially coated carbon
nanotubes and nano materials in combination with our proprietary low voltage
color phosphors. The specially coated carbon nanotubes, which are
supplied to us by a U.S. company, and nano materials, require a low voltage for
electron emission and are extremely small – approximately 10,000 times thinner
than the width of a human hair. The 5.5 inch (diagonal) display we
developed has 960 x 234 pixels and utilizes a new memory-based active matrix
thin film technology with each pixel phosphor activated by electrons emitted by
a proprietary carbon nanotube network located extremely close from the
pixels. The matrix also has a high pixel field factor to obtain high
contrast and low power consumption. As a result, each pixel phosphor brightness
is controlled using less than 40 volts. The carbon nanotubes and
proprietary color phosphors are precisely placed and separated utilizing our
proprietary nanotube and phosphor deposition technology. We have
developed a process of maintaining uniform carbon nanotube deposition
independent of phosphor deposition. We have also developed a method
of enhancing nanotube electron emission to increase the brightness of this type
of display.
We
believe our displays could potentially have a cost similar to a CRT and thus
cost less than current LCD or PDP displays partly because our display does not
contain a backlight, or color filter or polarizer, which represents a
substantial portion of the cost of an LCD.
In August
2009, we entered into a development agreement with a U.S. company to provide
engineering and implementation support for the development of our patented
extremely low power passive monochrome or color display for use in portable
devices. This company has experience in the field involving portions
of our display technology. Our proprietary extremely low power
display that we are developing, in conjunction with the U.S. company,
incorporates a new micro-matrix substrate. The display is designed to
have bi-stability capability, and uses low power when an image is being
created. Once an image is created, power consumption is
negligible. The display is expected to have both monochrome and or
color capability, and operate over wide temperature and environmental
conditions. The display utilizes a single substrate so that it can be
extremely thin, rugged and low weight. This display can be made any
size, is expected to be low cost, and is especially suitable for portable
devices, such as, cell phones, I-phones, and e-books, and other potential
portable devices. We have jointly formulated display designs and have
completed simulation analyses to optimize the display
configuration.
With the
arrival of the rapidly expanding digital book and news media applications, in
August 2009, we entered into an Engagement Agreement with ZQX Advisors, LLC
(“ZQX”) to assist us in seeking business opportunities and licenses for our
electrophoretic display technology (E-Paper
®
). ZQX
has an experienced business and legal team to assist us in this
area. Concurrently with entering into the Engagement
Agreement, we acquired a 19.5% ownership interest in ZQX in exchange for 800,000
unregistered shares of our common stock and warrants to purchase an additional
500,000 unregistered shares of our common stock, of which warrants to purchase
250,000 shares are exercisable at $0.37 per share and warrants to purchase
250,000 shares are exercisable at $0.555 per share. The warrants
expire in August 2019.
20
In
September 2009, we entered into a Technology License Agreement with Volga to
produce and market our thin, flat, low voltage phosphor displays in
Russia. We have been working with Volga for the past 12 years to
assist us with our low voltage phosphor displays. As part of our Technology
License Agreement with Volga, we anticipate receiving revenues from Volga, as it
is required to purchase the matrix substrate, carbon nanotubes, and associated
display electronics from us.
In
addition, in September 2009, we entered into a separate agreement with Volga
whereby we have obtained a 19.9% ownership interest in Volga in exchange for
150,000 unregistered shares of our common stock.
We
continue to pursue opportunities to market our voice, fax and data encryption
solutions in commercial and government markets. Our full array of
hardware and software products provide security over landline and wireless
telephone systems and networks.
Our
operations and the achievement of our objectives in marketing, production, and
research and development are dependent upon an adequate cash
flow. Accordingly, in monitoring our financial position and results
of operations, particular attention is given to cash and accounts receivable
balances and cash flows from operations. Since our initial public
offering, our cash flows have been primarily generated through the sales of
common stock in private placements and upon exercise of stock
options. Since 1999 we have also generated cash flows from sales of
our encryption products and services. We are continuing to direct our
encryption marketing efforts to opportunities in both the commercial and
government security markets and have recently uncovered new opportunities to
market products to Middle Eastern and Far Eastern governments to secure voice
and fax communications. In addition, in fiscal year 2008, we entered
into the License Agreement with Videocon and in May 2008, we began
receiving from Videocon license fees related to our display
technology.
In
reviewing Management’s Discussion and Analysis of Financial Condition and
Results of Operations, you should refer to our Consolidated Financial Statements
and the notes related thereto.
Critical Accounting
Policies
Our
consolidated financial statements are prepared in conformity with accounting
principles generally accepted in the United States of America. As
such, we are required to make certain estimates, judgments and assumptions that
management believes are reasonable based upon the information
available. These estimates and assumptions affect the reported
amounts of assets and liabilities and the disclosure of contingent assets and
liabilities at the dates of the consolidated financial statements and the
reported amounts of revenue and expenses during the reporting
periods.
21
We
believe the following critical accounting polices affect the more significant
judgments and estimates used in the preparation of our consolidated financial
statements.
Revenue
Recognition
Revenues
from sales are recorded when all four of the following criteria are met: (i)
persuasive evidence of an arrangement exists; (ii) delivery has occurred and
title has transferred or services have been rendered; (iii) our price to the
buyer is fixed or determinable; and (iv) collectibility is reasonably
assured.
We have
assessed the revenue guidance of Accounting Standards Codification (“ACS”)
605-25 “Multiple-Element Arrangements” (“ASC 605-25”) to determine whether
multiple deliverables in our arrangement with Videocon represent
separate units of accounting. Under the License Agreement, CopyTele
is required to: (a) disclose to Videocon the Licensed Technology and
provide reasonable training by Videocon personnel; (b) jointly cooperate with
Videocon to produce prototypes prior to production; and (c) assist Videocon in
preparing for production. CopyTele has determined that these
performance obligations do not have value to Videocon on a standalone
basis, as defined in ASC 605-25, and accordingly they do not represent separate
units of accounting.
We have
established objective and reasonable evidence of fair value for the royalty to
be earned during the production period based on analysis of the pricing for
similar agreements. Accordingly, we have determined that the license
fee of $11 million to be paid during the pre-production period and royalties on
product sales reflects the established fair value for these
deliverables. We expect to recognize the $11 million license fee over
the estimated period that we expect to provide cooperation and assistance during
the pre-production period, limiting the revenue recognized on a cumulative basis
to the aggregate license fee payments received from Videocon. We will
assess at each reporting period the progress and assistance provided and will
continue to evaluate the period during which this fee will be
recognized. On this basis, we have recognized license fee revenue
during the fiscal years ended October 31, 2009 and 2008
of approximately $913,000 and $1,687,000,
respectively. License fee payments received from Videocon which are
in excess of the amounts recognized as revenue ($-0- as of October 31, 2009, and
approximately $313,000 as of October 31, 2008) are recorded as deferred revenue
on the accompanying consolidated balance sheet.
Investment
Securities
We
classify our investment securities in one of two categories: available-for-sale
or held-to-maturity. Available-for-sale securities are recorded at
fair value. Unrealized gains and losses, net of the related tax
effect, on available-for-sale securities are excluded from earnings and are
reported as a component of accumulated other comprehensive income (loss) until
realized. Realized gains and losses from the sale of
available-for-sale securities are determined on a specific identification
basis. Held-to-maturity securities, which are investment securities
that we have the intent and ability to hold to maturity, are carried at
amortized cost. The amortization of premiums and accretion of
discounts are recorded on the level yield (interest) method, over the period
from the date of purchase to maturity. When sales do occur, gains and
losses are recognized at the time of sale and the determination of cost of
securities sold is based upon the specific identification
method. Dividend and interest income are recognized when
earned.
22
We
monitor the value of our investments for indicators of impairment, including
changes in market conditions and the operating results of the underlying
investment that may result in the inability to recover the carrying value of the
investment. During the fourth quarter of fiscal year 2009, we
determined that there was an other than temporary impairment in both our
Videocon and DISC investments. See Note 4 to the Consolidated
Financial Statements for further discussion. We will record an
additional impairment charge if and when we believe any such investment has
experienced an additional decline that is other than temporary.
Accounts
Receivable
Accounts
receivable are stated at amounts due from customers, net of an allowance for
doubtful accounts. Management reviews our accounts receivable for
potential doubtful accounts and maintains an allowance for estimated
uncollectible amounts. Accounts receivable are written off when we
determine that they become uncollectible.
Inventories
Inventories
are stated at the lower of cost, including material, labor and overhead,
determined on a first-in, first-out basis, or market, which represents our best
estimate of market value. We regularly review inventory quantities on
hand, particularly finished goods, and record a provision for excess and
obsolete inventory based primarily on forecasts of future product
demand. To date, sales of our products have been
limited. Accordingly, we can give no assurance that we will not be
required to reduce the selling price of our inventory below our current carrying
value.
Stock-Based
Compensation
We
account for stock options granted to employees and directors using the
accounting guidance included in ASC 718 “Stock Compensation” (“ASC
718”). We recognize compensation expense for stock option awards on a
straight-line basis over the requisite service period of the
grant. We recorded stock-based compensation expense, related to stock
options granted to employees and non-employee directors, of approximately
$2,418,000, $2,614,000 and $1,081,000 during fiscal years ended October 31,
2009, 2008 and 2007, respectively, in accordance with ASC 718. We
account for stock options granted to consultants using the accounting guidance
under ASC 505-50 “Equity-Based Payments to Non-Employees”. See
Note 2 to the Consolidated Financial Statements for additional
information.
23
Determining
the appropriate fair value model and calculating the fair value of stock-based
awards requires judgment, including estimating stock price volatility,
forfeiture rates and expected life. If factors change and we employ
different assumptions in the application of ASC 718 in future periods, the
compensation expense that we record under ASC 718 may differ significantly from
what we have recorded in the current period.
Results of
Operations
Fiscal Year Ended October
31, 2009 Compared to Fiscal Year Ended October 31, 2008
Net
Revenue
Net
revenue decreased by approximately $1,007,000 in fiscal year 2009, to
approximately $1,056,000, as compared to approximately $2,063,000 in fiscal year
2008. Revenue from display technology license fees related to the
License Agreement with Videocon decreased by approximately $773,000 in fiscal
year 2009, to approximately $913,000 based on our modification to the Videocon
contract payment terms, as compared to approximately $1,687,000 in fiscal year
2008. Revenue in fiscal year 2009 included revenue from display
technology engineering services of $52,000, as compared to none in fiscal year
2008. The revenue from display technology engineering services
resulted from engineering services billed to Volga. Revenue from
sales of encryption products decreased by approximately $286,000 in fiscal year
2009, to approximately $90,000, as compared to approximately $376,000 in fiscal
year 2008. The decrease in sales from encryption products was due to
a decrease in unit shipments. Our encryption revenue has been limited
and is sensitive to individual large transactions.
Cost
of Encryption Products Sold
The cost
of encryption products sold decreased by approximately $49,000 in fiscal year
2009, to approximately $47,000, as compared to approximately $96,000 in fiscal
year 2008. The cost of encryption products sold in
fiscal year 2009 includes a provision for excess inventory of
approximately $20,000. The cost of encryption products shipped in
fiscal year 2009 decreased to approximately $27,000, as compared to
approximately $96,000 in fiscal year 2008, due to a decrease in unit shipments
of encryption products.
Cost
of Display Engineering Services
The cost
of display engineering services increased to approximately $18,000 in fiscal
year 2009, as compared to none in the comparable prior year period, as there was
no revenue from display engineering services in the prior year
period.
24
Research
and Development Expenses
Research
and development expenses decreased by approximately $11,000 in fiscal year 2009,
to approximately $4,116,000, from approximately $4,127,000 in fiscal year
2008. The decrease in research and development expenses was
principally due to a decrease in employee stock option compensation expense of
approximately $261,000, which primarily resulted from a decrease in the weighed
average fair value at grant dates, a decrease in patent-related expenses of
approximately $86,000, a decrease in consultant stock option expense of
approximately $45,000, offset by an increase in outside research and development
expense of approximately $266,000, which primarily resulted from engineering
services performed by Videocon related to another version of our display
technology, and an increase in employee compensation and related costs, other
than stock option expense, of approximately $108,000.
Selling,
General and Administrative Expenses
Selling,
general and administrative expenses increased by approximately $364,000 to
approximately $4,194,000 in fiscal year 2009, from approximately $3,830,000 in
fiscal year 2008. The increase in selling, general and administrative
expenses was principally due to an increase in consulting services of
approximately $321,000, the increase in consulting fees was primarily related to
ZQX, an increase in legal and accounting fees of approximately $99,000, an
increase in employee stock option compensation expense of approximately $65,000,
an increase in employee compensation and related costs, other than stock option
expense, of approximately $142,000, and a loss on the sale of DISC stock of
approximately $34,000, offset by a decrease in consultant stock option expense
of approximately $159,000, a decrease in the provision for doubtful accounts of
$120,000, from $223,000 in fiscal year 2008 to $103,000 in fiscal year 2009, and
a decrease in travel expense of approximately $43,000.
Dividend
Income
Dividend
income, which was received in connection with the Videocon GDRs we acquired in
December 2007, decreased by approximately $102,000 to approximately $29,000 in
fiscal year 2009, compared to approximately $131,000 in fiscal year
2008. The decrease in dividend income was due to a reduction by
Videocon of dividends paid.
Interest
Income
Interest
income was approximately $21,000 in fiscal year 2009, compared to approximately
$37,000 in fiscal year 2008. The decrease in interest income was
primarily the result of a reduction in short term interest rates.
25
Fiscal Year Ended October
31, 2008 Compared to Fiscal Year Ended October 31, 2007
Net
Revenue
Net revenue increased by approximately $1,576,000 in
fiscal
year
2008, to approximately
$2,063,000, as compared to approximately $487,000 in fiscal
year
2007. Revenue recognized during fiscal
year
2008 included display technology
license fees related to the License Agreement with Videocon of approximately
$1,687,000 compared to none in fiscal
year
2007. Revenue from sales of encryption products increased by
approximately $129,000 in fiscal
year
2008,
to approximately $376,000, as compared to approximately $247,000 in fiscal
year
2007. The increase in
revenue from encryption products sold was primarily due to an increase in unit
shipments. Revenue from encryption services decreased from $240,000
in fiscal
year
2007 to none in fiscal
year
2008. The revenue from
encryption services in the prior year period resulted from engineering services
billed to DISC. Our encryption revenue has been limited and is
sensitive to individual large transactions.
Cost
of Encryption Products Sold
The cost
of encryption products sold increased by approximately $22,000 in fiscal year
2008, to approximately $96,000, as compared to approximately $74,000 in fiscal
year 2007. The increase in cost of encryption products sold was
primarily due to an increase in unit shipments of encryption products as well as
a reduction of cost of products sold in fiscal year 2008 of approximately
$19,000 resulting from the sale during fiscal year 2008 of inventory for which a
provision for excess inventory of that amount was recorded in prior
periods.
Cost
of Encryption Services
The cost
of encryption services decreased from $86,000 in fiscal year 2007 to none in
fiscal year 2008 as there was no revenue from encryption services.
Research
and Development Expenses
Research and development expenses increased by
approximately $723,000 in fiscal
year
2008,
to approximately $4,127,000, from approximately $3,404,000 in fiscal
year
2007. The increase in
research and development expenses was principally due to an increase in employee
stock option compensation expense of approximately $878,000, offset by a
decrease in outside research and development expense of approximately $55,000, a
decrease in patent-related expenses of approximately $41,000, a decrease in
employee compensation and related costs, other than stock option expense, of
approximately $34,000, and a decrease in outside engineering services of
approximately $32,000.
26
Selling,
General and Administrative Expenses
Selling, general and administrative expenses increased
by approximately $1,415,000 to approximately $3,830,000 in fiscal
year
2008, from approximately $2,415,000 in
fiscal
year
2007. The increase
in selling, general and administrative expenses was principally due to an
increase in employee stock option compensation expense of approximately
$655,000, an increase in consultant stock option compensation expense of
approximately $172,000, an increase in the provision for doubtful accounts of
$223,000 of which $120,000 related to an accounts receivable from DISC, an
increase in employee compensation and related costs, other than stock option
expense, of approximately $90,000, an increase in legal and accounting fees of
approximately $86,000, an increase in shareholder relations expense of
approximately $72,000, an increase in travel expense of approximately $49,000,
and an increase in consulting expense, other than consultant stock option
compensation expense, of approximately $41,000.
Dividend
Income
Dividend income, which was received in connection with
the Videocon GDRs we acquired in December 2007, was approximately $131,000 in
fiscal
year
2008. We received no
dividend income in fiscal
year
2007.
Interest
Income
Interest income was approximately $37,000 in fiscal
year
2008, compared to approximately
$34,000 in fiscal
year
2007. The
interest income earned on the additional funds available for investment on the
current period was offset by a reduction in prevailing interest
rates.
Liquidity and Capital
Resources
Since our
inception, we have met our liquidity and capital expenditure needs primarily
through the proceeds from sales of common stock in our initial public offering,
in private placements, upon exercise of warrants issued in connection with the
private placements and our initial public offering, and upon the exercise of
stock options. In addition, commencing in the fourth quarter of
fiscal year 1999, we have generated limited cash flows from sales of our
encryption products and in May 2008 began receiving license fees related to our
display technology from Videocon pursuant to the License Agreement.
During
fiscal year 2009, our cash used in operating activities was approximately
$2,502,000. This resulted from payments to suppliers, employees and
consultants of approximately $3,047,000, which was offset by cash of
approximately $142,000 received from collections of accounts receivable related
to sales of products and services, cash received from display technology
licensing fees of $350,000, approximately $29,000 of dividend income received
and approximately $25,000 of interest income received. Our cash
provided by investing activities during fiscal year 2009 was approximately
$1,502,000, which resulted from purchases of short-term investments consisting
of certificates of deposit and U.S. government securities of approximately
$2,899,000 and purchases of approximately $2,000 of equipment, offset by
approximately $4,343,000 received upon maturities of short-term investments
consisting of certificates of deposit and U.S. government securities and
approximately $60,000 received upon the sale of DISC common
stock. Our cash provided by financing activities during fiscal year
2009 was approximately $1,972,000, which resulted from cash received upon the
exercise of stock options. As a result, our cash, cash equivalents,
and investments in certificates of deposit and U.S. government securities at
October 31, 2009 decreased to approximately $2,201,000 from approximately
$2,671,000 at the end of fiscal year 2008.
27
Net
accounts receivable decreased by $102,000, from $103,000 at the end of fiscal
year 2008 to $750 at October 31, 2009. The decrease is primarily the
result of a provision for doubtful accounts in fiscal year 2009 of $103,000 and
a decrease in sales of encryption products. Inventories decreased by
approximately $45,000 from approximately $178,000 at October 31, 2008 to
approximately $133,000 at October 31, 2009. The decrease in inventory
was primarily a result of a provision for excess inventory of approximately
$20,000 recorded in fiscal year 2009 and the timing of shipments and production
schedules. Investment in U.S. government securities, noncurrent,
decreased from approximately $750,000 at October 31, 2008 to zero at October 31,
2009, as a result of the maturity of this investment. Investment in
Videocon is recorded at fair value and increased to approximately $7,105,000 at
October 31, 2009 from approximately $3,620,000 at the end of fiscal year 2008,
as a result of an increase in the underlying price of Videocon’s equity shares
which are traded on the stock exchanges in India. Investment in DISC
is recorded at fair value and decreased by $644,000 as a result of a reduction
in the price of DISC common shares, which are traded on the over the counter
market (and quoted on the Pink Sheets), and our sale of 2,770,000 shares of the
12,200,000 shares of DISC common stock we held at October 31,
2008. Investment in Volga increased to approximately $128,000 at
October 31, 2009 from zero at October 31, 2008, as a result of the investment in
Volga during fiscal year 2009. Accounts payable and accrued
liabilities decreased by approximately $58,000 from approximately $454,000 at
the end of fiscal year 2008 to approximately $396,000 at October 31, 2009, as a
result the timing of payments. Deferred revenue decreased to zero at
October 31, 2009 from approximately $313,000 at October 31, 2008, as a result of
such amount being recognized as a technology license fee during fiscal year
2009. Loan payable, which is due in December 2014, remained at
$5,000,000 at October 31, 2009 and 2008. Loan receivable, which is
classified as a contra-equity in the accompanying consolidated balance sheet and
is due in December 2014,
remained at $5,000,000 at
October 31, 2009 and 2008.
As a result of these changes,
working capital at October 31, 2009 increased to approximately $2,000,000 from
approximately $1,489,000 at October 31, 2008.
Our
working capital includes inventory of approximately $133,000 and $178,000 at
October 31, 2009 and 2008, respectively. Management has recorded our
inventory at the lower of cost or our current best estimate of net realizable
value. To date, sales of our products have been
limited. Accordingly, we can give no assurances that we will not be
required to reduce the selling price of our inventory below our current carrying
value.
28
During
the quarter ended April 30, 2009, we modified the payment terms from Videocon
and we agreed to reimburse Videocon $250,000 for engineering services related to
another version of our display technology. The license fee revenue
recognized during the three months ended April 30, 2009 of $250,000 represented
an offset against amounts due to Videocon for the aforementioned
engineering services, in lieu of a cash payment. In addition, in June
2009, we received a license fee payment from Videocon of $250,000, which was due
during the quarter ended April 30, 2009 pursuant to the modified payment terms,
which was recognized as license fee revenue during the three months ended July
31, 2009. In August 2009, we received an additional license fee payment
from Videocon of $100,000, which was due during the quarter ended July 31, 2009
pursuant to the modified payment terms, which was recognized as revenue during
the three months ended October 31, 2009. We further modified the
payment terms from Videocon during the first quarter of fiscal year 2010 for
amounts that were due during that quarter. The modifications were
made to allow Videocon’s payments to be more closely aligned with the progress
being made towards the optimization of the display performance. While
we have modified the timing of license fee payments to be received from
Videocon, the total license fee of $11 million remains payable over the 27 month
period, which commenced in May 2008. Videocon’s obligations with
respect to the pre-production phase, and our assistance,
under the License Agreement remain unaffected.
Total
employee compensation expense during fiscal years 2009, 2008 and 2007 was
approximately $5,219,000, $5,164,000 and $3,661,000,
respectively. During fiscal years 2009, 2008 and 2007, a significant
portion of employee compensation consisted of the issuance of stock and stock
options to employees in lieu of cash compensation. We recorded
compensation expense for fiscal years ended October 31, 2009, 2008 and 2007 of
approximately $2,099,000, $1,877,000 and $1,735,000, respectively, for shares of
common stock issued to employees. We recorded approximately
$2,418,000, $2,614,000 and $1,081,000 of stock-based compensation expense,
related to stock options granted to employees and directors, during fiscal years
ended October 31, 2009, 2008 and 2007, respectively. It is
management’s intention to continue to compensate employees by issuing stock or
stock options.
In
addition, during fiscal years 2009, 2008 and 2007, we issued shares of common
stock to consultants for services rendered. We recorded consulting
expense for fiscal years ended October 31, 2009, 2008 and 2007 of approximately
$48,000, $95,000 and $182,000, respectively, for shares of common stock issued
to consultants. In addition, during fiscal years 2009, 2008 and 2007,
we recorded approximately $13,000, $217,000 and $-0-, respectively, of
consulting expense for stock options granted to consultants. It is
management’s intention to also continue to compensate consultants by issuing
stock or stock options to the extent that our consultants do not require cash
payments.
29
During
fiscal year 2009, in exchange for a 19.5% ownership interest in ZQX we issued
800,000 unregistered shares of common stock together with warrants to purchase
an additional 500,000 unregistered shares of common stock to ZQX, of which (a)
warrants to purchase 250,000 shares of common stock are exercisable at $0.37 per
share, and (b) warrants to purchase the remaining 250,000 shares are exercisable
at $0.555 per share. The warrants are exercisable at any time after
August 19, 2010 and expire on August 19, 2019. In addition, we issued
150,000 unregistered shares of common stock during fiscal year 2009 to Volga in
exchange for a 19.9% ownership interest in Volga. During fiscal year
2008, we issued 20,000,000 unregistered shares of our common stock to Mars
Overseas an affiliate of Videocon for an aggregate purchase price of $16,200,000
and we purchased 1,495,845 Videocon GDRs for an aggregate purchase price of
$16,200,000. In April 2009, we received a dividend of approximately
$29,000 on the Videocon GDRs we hold. While the Videocon GDRs are
held as security for the loan payable to Mars Overseas, the agreement governing
such loan provides that any dividends, distributions, rights or other proceeds
or benefits with respect to the Videocon GDRs shall be promptly transferred to
us free and clear of any encumbrances under the agreements.
We
believe that our existing cash, cash equivalents, and investments in U.S.
government securities, together with cash flows from expected sales of our
encryption products and revenue relating to our thin, flat, low-voltage phosphor
display technology, including license fees and royalties from Videocon, and
other potential sources of cash flows, will be sufficient to enable us to
continue our marketing, production, and research and development activities for
at least 12 months. However, our projections of future cash needs and
cash flows may differ from actual results. If current cash and cash
that may be generated from operations are insufficient to satisfy our liquidity
requirements, we may seek to sell debt or equity securities or to obtain a line
of credit. The sale of additional equity securities or convertible
debt could result in dilution to our stockholders. It is also
management’s intention to continue to compensate employees and consultants by
issuing stock or stock options. We currently have no arrangements
with respect to additional financing. We can give no assurances that
we will generate sufficient revenues in the future (through sales, license fees
and royalties, or otherwise) to satisfy our liquidity requirements or sustain
future operations, that our production capabilities will be adequate, that other
products will not be produced by other companies that will render our products
obsolete, or that other sources of funding would be available, if needed, on
favorable terms or at all. If we cannot obtain such funding if
needed, we would need to curtail or cease some or all of our
operations.
We are seeking to improve our liquidity through
increased sales or license of products and technology. In an effort
to generate sales, we have marketed our encryption products directly to U.S. and
international distributors, dealers and original equipment manufacturers that
market our encryption products and to end-users. In fiscal
year
2008, we entered into the License
Agreement with Videocon. During fiscal
year
2009, we have recognized revenue from sales of
encryption products of approximately $90,000, revenue from display engineering
services of $52,000 and display technology license fees of approximately
$913,000.
30
Contractual
Obligations
The
following table presents our expected cash requirements for contractual
obligations outstanding as of October 31, 2009:
|
Payments Due by Period
|
||||||||||||||||||||
|
Contractual
Obligations
|
Less
than
1
year
|
1-3
years
|
4-5
years
|
After
5
years
|
Total
|
|||||||||||||||
|
Consulting
Agreement
|
$ | 128,000 | - | - | - | $ | 128,000 | |||||||||||||
|
Noncancelable
Operating Leases
|
$ | 296,000 | $ | 330,000 | - | - | $ | 626,000 | ||||||||||||
|
Total
Contractual
Cash
Obligations
|
$ | 424,000 | $ | 330,000 | - | - | $ | 754,000 | ||||||||||||
Off-Balance Sheet
Arrangements
We have
no variable interest entities or other off-balance sheet obligation
arrangements.
Effect of Recent Accounting
Pronouncements
In
December 2007, the Financial Accounting Standards Board (“FASB”) issued updated
guidance for accounting for business combinations, which is included in ASC 805
“Business Combinations” (“ASC 805”). The updated guidance better
represents the economic value of a business combination
transaction. The changes to be effected with the new guidance
include, but are not limited to: (1) acquisition costs will be recognized
separately from the acquisition; (2) known contractual contingencies at the
time of the acquisition will be considered part of the liabilities acquired
measured at their fair value and all other contingencies will be part of the
liabilities acquired measured at their fair value only if it is more likely than
not that they meet the definition of a liability; (3) contingent
consideration based on the outcome of future events will be recognized and
measured at the time of the acquisition; (4) business combinations achieved
in stages (step acquisitions) will need to recognize the identifiable assets and
liabilities, as well as noncontrolling interests, in the acquiree, at the full
amounts of their fair values; and (5) a bargain purchase (defined as a
business combination in which the total acquisition-date fair value of the
identifiable net assets acquired exceeds the fair value of the consideration
transferred plus any noncontrolling interest in the acquiree) will require that
excess to be recognized as a gain attributable to the acquirer. In
April 2009, the FASB amended the guidance related to contingencies in a business
combinations, which is included in ASC 805-20 “Identifiable Assets and
Liabilities, and Any Noncontrolling Interest”. The amendment changes
the provisions in ASC 805 for the initial recognition and measurement,
subsequent measurement and accounting, and disclosures for assets and
liabilities arising from contingencies in business combinations. It
further eliminates the distinction between contractual and non-contractual
contingencies, including the initial recognition and measurement criteria in the
updated business combinations guidance and instead carries forward most of the
provisions of the previous business combinations guidance for acquired
contingencies. ASC 805 is effective for fiscal years and interim
periods within those fiscal years beginning on or after December 15,
2008. The adoption of ASC 805 is not expected to have a material
effect on our accompanying consolidated financial statements.
31
Effective
May 1, 2009, we adopted the FASB guidance on interim disclosures about fair
value of financial instruments. The updated guidance requires
entities to include disclosures regarding the fair value of financial
instruments and methods and significant assumptions used to estimate the fair
value in their interim financial statements. There were no changes to
the required annual disclosures. The fair value guidance regarding
the interim disclosures about fair value of financial instruments and the fair
value option for financial assets and liabilities is included in ASC 825
“Financial Instruments”. See Note 2, “Summary of Significant
Accounting Policies - Fair Value Measurements,” for the required annual
disclosures. Additionally, effective November 1, 2008, we adopted the FASB
guidance regarding the fair value option for financial assets and liabilities,
which permits entities to measure eligible financial instruments at fair
value. As we did not elect the fair value option for its financial
instruments (other than those already measured at fair value in accordance with
ASC 820 (as defined in Note 2, “Summary of Significant Accounting Policies -
Fair Value Measurements”), the adoption of this guidance did not have an impact
on our accompanying consolidated financial statements.
Effective
May 1, 2009, we adopted the new FASB guidance on recognition and
presentation of other-than-temporary impairments. The guidance amends
the requirements for recognizing other-than-temporarily impaired debt securities
and revises the existing impairment model for such securities by modifying the
current intent and ability indicator in determining whether a debt security is
other-than-temporary impaired. This guidance is included in ASC 320
“Investments” (“ASC 320”). It also modifies the presentation of
other-than-temporary impairment losses and increases the frequency of and
expands required disclosures about other-than-temporary impairment for debt and
equity securities. The adoption of this guidance did not have a
material effect on our accompanying consolidated financial
statements.
Effective July 31, 2009, we adopted the new FASB
guidance on subsequent events, which is included in ASC 855 “Subsequent
Events”. The objective of this guidance is to establish general
standards of accounting for and disclosure of events that occur after the
balance sheet date but before financial statements are issued. This
statement introduces the concept of financial statements being available to be
issued. It requires the disclosure of the date through which an
entity has evaluated subsequent events and the basis for that
date.
The adoption of this guidance did not have a material
effect on our accompanying consolidated financial statements.
32
As of
October 31, 2009, we had invested a portion of our cash on hand in short-term,
fixed rate and highly liquid instruments that have historically been reinvested
when they mature throughout the year. Although our existing
short-term instruments are not considered at risk with respect to changes in
interest rates or markets for these instruments, our rate of return on these
securities could be affected at the time of reinvestment, if any.
At
October 31, 2009, our investment in Videocon GDRs is recorded at fair value of
approximately $7,105,000 including a write-down of approximately $9,095,000 as a
result of an other than temporary impairment, and has exposure to additional
price risk. The fair value of the Videocon GDRs is based on the
underlying price of Videocon’s equity shares which are traded on stock exchanges
in India with prices quoted in rupees. Accordingly, the fair value of
the Videocon GDRs is subject to price risk and foreign exchange
risk. The potential loss in fair value resulting from a hypothetical
10% adverse change in prices of Videocon equity shares quoted by Indian stock
exchanges and in foreign currency exchange rates, as of October 31, 2009 amounts
to approximately $711,000.
Our
investment in DISC common stock at October 31, 2009 is recorded at fair value of
approximately $198,000 including a write-down of approximately $124,000 as a
result of an other than temporary impairment, and has exposure to price
risk. DISC’s common stock is not registered under the Securities
Exchange Act of 1934, but is traded in the over the counter market and quoted on
the Pink Sheets. Accordingly, the fair value of DISC’s common stock
is subject to price risk. The potential loss in fair value resulting
from a hypothetical 10% adverse change in price of this investment, as of
October 31, 2009 amounts to approximately $20,000.
See
accompanying “Index to Consolidated Financial Statements.”
|
Item
9.
|
Changes in and
Disagreements With Accountants on Accounting and Financial
Disclosure.
|
None.
Not
Applicable.
Disclosure Controls and
Procedures
33
We
maintain disclosure controls and procedures, as such term is defined in Rules
13a-15(e) and 15d-15(e) under the Securities Exchange Act of 1934, as amended
(the “Exchange Act”). Under the supervision and with the participation of our
management, including our Chairman of the Board and Chief Executive Officer and
our Chief Financial Officer and Vice President - Finance, we evaluated the
effectiveness of the design and operation of our disclosure controls and
procedures pursuant to Rule 13a-15 and 15d-15 of the Exchange
Act. Based upon that evaluation, our Chairman of the Board and Chief
Executive Officer and the Chief Financial Officer and Vice President - Finance
concluded that our disclosure controls and procedures were effective as of the
end of fiscal year 2009.
Management’s Report on
Internal Control Over Financial Reporting
Our
management is responsible for establishing and maintaining adequate internal
control over financial reporting as such term is defined in Rules 13a-15(f) and
15d-15(f) of the Exchange Act. Our management, including the
principal executive officer and principal financial officer, does not expect
that our internal controls over financial reporting will prevent all errors and
all fraud. A control system, no matter how well designed and
operated, cannot provide full assurance that the objectives of the control
system are met, and no evaluation of controls can provide absolute assurance
that all control issues and instances of fraud, if any, within a company have
been detected. Our internal control over financial reporting is
designed to provide reasonable assurance regarding the reliability of financial
reporting and the preparation of financial statements for external purposes in
accordance with generally accepted accounting principles.
Under the
supervision and with the participation of our management, including the
principal executive officer and principal financial officer, we conducted an
evaluation as to the effectiveness of our internal control over financial
reporting as of October 31, 2009. In making this assessment our
management used the criteria for effective internal control set forth by the
Committee of Sponsoring Organizations of the Treadway Commission in
Internal Control – Integrated
Framework
. Based on this assessment, our management concluded
that our internal control over financial reporting was effective as of October
31, 2009.
This
Annual Report on Form 10-K does not include an attestation report of the
Company’s registered public accounting firm regarding internal control over
financial reporting. Management’s report was not subject to attestation by
the Company’s registered public accounting firm pursuant to temporary rules of
the Securities and Exchange Commission that permit the Company to provide only
management’s report in this Annual Report.
Changes in Internal Control
Over Financial Reporting
There
were no changes in our internal control over financial reporting during the
fourth quarter of fiscal year 2009 that has materially affected, or is
reasonably likely to materially affect, the Company’s internal control over
financial reporting.
34
|
Item
9B.
|
Other
Information.
|
None.
35
(a)
Our Directors and Executive
Officers
The
following table sets forth certain information with respect to all of our
directors and executive officers:
|
Name
|
Position
with the Company and
Principal
Occupation
|
Age
|
Director
and/or
Executive
Officer
Since
|
||||||
|
Denis
A. Krusos
|
Director,
Chairman of the Board and Chief Executive
Officer
|
82 | 1982 | ||||||
|
Henry
P. Herms
|
Director,
Chief Financial Officer and Vice President – Finance
|
64 | 2000 | ||||||
|
George
P. Larounis
|
Director
|
81 | 1997 | ||||||
(b) Business Experience of our Directors and Executive Officers
Mr.
Krusos has served as one of our Directors and as our Chairman of the Board and
Chief Executive Officer since November 1982. He holds an M.S.E.E.
degree from Newark College of Engineering, a B.E.E. degree from City College of
New York and a J.D. degree from St. John’s University.
Mr. Herms
has served as our Chief Financial Officer and Vice President - Finance since
November 2000 and as one of our Directors since August 2001. Mr.
Herms was also our Chief Financial Officer from 1982 to 1987. He is
also a former audit manager and CPA with the firm of Arthur Andersen
LLP. He holds a B.B.A. degree from Adelphi University.
Mr.
Larounis has served as one of our Directors since September 1997, prior to which
he served as a consultant to us. Mr. Larounis is currently
retired. From 1960 to 1993, he held numerous positions as a senior
international executive of The Bendix Corporation and Allied Signal Inc., which
is now known as Honeywell International, Inc. He has also served on
the Boards of Directors of numerous affiliates of Allied Signal in Europe, Asia
and Australia. He holds a B.E.E. degree from the University of
Michigan and a J.D. degree from New York University.
(c)
Our
Significant Employees
We have
no significant employees other than our executive management team.
36
(d)
Family
Relationships
There
are no family relationships between or among the directors, executive officers
or persons nominated or chosen by the Company to become directors or executive
officers.
(e)
Involvement
of Certain Legal Proceedings
To
the best of our knowledge, during the past five years, none of the following
occurred with respect to a present or former director or executive officer of
the Company: (1) any bankruptcy petition filed by or against any business of
which such person was a general partner or executive officer either at the time
of the bankruptcy or within two years prior to that time; (2) any conviction in
a criminal proceeding or being subject to a pending criminal proceeding
(excluding traffic violations and other minor offenses); (3) being subject to
any order, judgment or decree, not subsequently reversed, suspended or vacated,
of any court of competent jurisdiction, permanently or temporarily enjoining,
barring, suspending or otherwise limiting his or her involvement in any type of
business, securities or banking activities; and (4) being found by a court of
competent jurisdiction (in a civil action), the SEC or the Commodities Futures
Trading Commission to have violated a federal or state securities or commodities
law, and the judgment has not been reversed, suspended or vacated.
Section 16(a) Beneficial
Ownership Reporting Compliance
Section
16(a) of the Securities Exchange Act of 1934, as amended (the “Exchange Act”),
requires our directors, executive officers and ten percent stockholders to file
initial reports of ownership and reports of changes in ownership of our common
stock with the Securities and Exchange Commission (“SEC”). Directors,
executive officers and ten percent stockholders are also required to furnish us
with copies of all Section 16(a) forms that they file. Based upon a
review of these filings, we believe that all required Section 16(a) reports were
made on a timely basis during fiscal year 2009.
Code of
Ethics
In July
2005, our Board of Directors adopted a formal code of ethics
that applies to our
principal executive officer, principal financial officer, principal accounting
officer or controller or persons performing similar functions. We
will provide to any person without charge, upon request, a copy of such code of
ethics. Requests may be made in writing at CopyTele, Inc., 900 Walt
Whitman Road, Melville, New York 11747, Attn: Secretary, or by telephone at
631-549-5900.
Nomination
Procedures
There
were no changes to the procedures by which security holders may recommend
nominations to our Board of Directors during our fiscal year 2009.
37
Audit Committee and Audit
Committee Financial Expert
The
Securities and Exchange Commission has adopted rules implementing Section 407 of
the Sarbanes-Oxley Act of 2002 requiring public companies to disclose
information about “audit committee financial experts.” We do not have
a standing Audit Committee. The functions of the Audit Committee have
been assumed by our full Board of Directors. Our Board of Directors
has not concluded that Mr. Larounis, the sole non-management director, meets the
definition of “audit committee financial expert.” The Securities and
Exchange Commission’s rules do not require us to have an audit committee
financial expert, and our Board of Directors has determined that it possesses
sufficient financial expertise to effectively discharge its
obligations.
Compensation Discussion and
Analysis
The
following provides an overview and analysis of our executive compensation
programs and policies:
Compensation Program
Philosophy and Objectives
Our
vision includes developing, producing and marketing our thin, flat, low-voltage
phosphor display technology, developing our thin, flat, low-power passive
display technology and developing, producing and marketing our multi-functional
encryption products that provide information security for domestic and
international users over virtually every communication
media. Competition for talented executives in the display and
encryption industry is intense. Our ability to attract and retain
executives with the requisite skills and experience to grow our business and
achieve our business strategies is crucial to our ability to realize this
vision. Accordingly, we have designed our executive compensation
program to meet the following objectives:
|
·
|
Attract,
motivate and retain highly qualified
executives;
|
|
·
|
Align
management interests with those of shareholders;
and
|
|
·
|
Reward
and encourage superior performance.
|
To attain
these objectives, our executive compensation program contains both short-term
and long-term incentives rewarding individual and Company performance that
generates returns for our shareholders.
Role of the Board of
Directors
The Board
of Directors is primarily responsible for overseeing our compensation and
employee benefit plans and practices. In determining the compensation
of our senior management, the Board of Directors decisions are influenced by
each individual’s experience level and scope of responsibility, and the overall
performance of the Company and the individual.
38
The Board
of Directors
takes into
account each person’s performance in helping the Company achieve certain goals,
including the following: (i) development of its flat panel technology, (ii)
making business arrangements for licensing its technology, (iii) development of
encryption products and (iv) making business arrangements to license and market
its encryption products. The Board of Directors evaluates the
performance of our Chief Executive Officer, Mr. Denis A. Krusos,
directly. Mr. Krusos is not present during the Board of Directors
deliberations as to his compensation. With respect to senior
management other than Mr. Krusos, the Board of Directors relies upon the
recommendation of Mr. Krusos, as the person in the best position to judge the
respective performances of such individuals.
Because
the market for talented executives is extremely competitive, the Board of
Directors also considers, from time to time, the form and amount of compensation
paid to executives of other companies, compiled from publicly available
information. While the Board of Directors can engage compensation
consultants to assist with this task, it did not engage any such consultants in
fiscal year 2009. The Board of Directors does not target a specific
benchmark for compensation from the other companies whose compensation it
reviews, but rather uses the information in light of the other
factors.
Elements of Executive
Compensation
Our
executive compensation consists primarily of two elements: base salary and stock
options under our stock equity incentive plans, which provides long-term equity
incentives.
Base
Salary-
We
determine base salaries for our executives based on, among other things, job
responsibilities, their tenure with and individual contribution to the Company,
and their prior relevant background and experience. We also take into
account competitive market data, but do not target base salary at any particular
level in comparison to the market. Our Board of Directors reviews
base salaries annually. To maintain flexibility, we do not target
base salary at any particular percent of total compensation.
Stock
Options-
The Board
of Directors believes it is important to provide our senior management with
stock-based incentive compensation that increases in value in direct correlation
with improvement in the performance of our common stock. This aligns
management’s interests with those of our stockholders and supports the creation
of long-term shareholder value. The fundamental philosophy is to link
the amount of compensation for an executive to his or her contribution to the
Company’s success in achieving financial and other objectives. In
general, we grant stock options under stock equity incentive plans to directors,
officers, and other employees upon commencement of their employment with us and
periodically thereafter. We generally grant stock options at
regularly scheduled Board meetings.
39
As with
other elements of compensation, the Board of Directors considers a combination
of factors, such as job responsibility, individual contribution and market
competition, in establishing the amount of compensation provided by options to
each individual executive. Equity incentives are not set at any
particular percentage of total compensation.
The
option awards are granted at an exercise price equal to the closing price of
common stock on the grant date (the date the grant is
approved.) Options for directors and officers generally vest on the
date of grant or after a 6 or 12 month period following the grant date, provided
the directors or officers remain employed on the vesting date, so that such
compensation is at risk of forfeiture based on the directors or officers’
continued service with us. The stock equity incentive plans also
provide for the award of restricted stock, although such awards have not been
used in any material respect. No restricted stock was awarded during
fiscal year 2009.
Other
Benefits-
We
provide our executives with customary, board-based benefits that are provided to
all employees, including medical insurance, life, and disability
insurance. We also provide our executives with certain perquisites
which are not a significant element of executive compensation.
Policy on Ownership of Stock
and Options
We do not
have any policy regarding levels of equity ownership (stock or options) by our
executive officers or directors.
Policy on Deductibility of
Compensation
Section
162(m) of the Internal Revenue Code limits the deductibility of compensation in
excess of $1 million paid to certain executive officers named in the proxy
statement, unless certain requirements are met. To maintain
flexibility in compensating executive officers in a manner designed to aid in
retention and promote varying corporate performance objectives, the Board of
Directors has not adopted a policy of meeting the Section 162(m)
requirements.
Compensation Committee
Interlocks and Insider Participation
As
disclosed above, the Board of Directors is primarily responsible for overseeing
our compensation and employee benefit plans and practices. We do not
have a compensation committee or other Board committee that performs equivalent
functions.
Board of Directors Report on
Executive Compensation
We have
reviewed and discussed the above “Compensation Discussion and Analysis” with
management. Based upon this review and discussion, we have
recommended that the “Compensation Discussion and Analysis” be included in this
Annual Report on Form 10-K.
40
|
Denis A
Krusos
Henry P. Herms
George P. Larounis
|
Executive
Compensation
The
following table sets forth certain information for fiscal year ended October 31,
2009, with respect to compensation awarded to, earned by or paid to our Chief
Executive Officer and our Chief Financial Officer (the “Named Executive
Officers”). No other Named Executive Officer received total
compensation in excess of $100,000 during fiscal year 2009.
|
SUMMARY
COMPENSATION TABLE
|
|||||||||||||||||
|
Name
and
Principal
Position
|
Year
|
Salary
($)
|
Option
Awards
($)
(1)
|
All
Other
Compensation
($)
(2)
|
Total
Compensation
($)
|
||||||||||||
|
Denis
A. Krusos,
|
2009
|
$ | 250,000 | $ | 748,500 | $ | 39,815 | $ | 1,038,315 | ||||||||
| Chairman of the Board, | 2008 | $ | 250,000 | $ | 967,000 | $ | 33,929 | $ | 1,250,929 | ||||||||
| Chief Executive Officer and Director | 2007 | $ | 250,000 | $ | 422,170 | $ | 28,532 | $ | 700,702 | ||||||||
|
Henry
P. Herms
|
2009
|
$ | 125,000 | $ | 74,850 | $ | 18,779 | $ | 218,629 | ||||||||
|
Chief
Financial Officer, Vice President-
|
2008 | $ | 125,000 | $ | 72,525 | $ | 21,777 | $ | 219,302 | ||||||||
| Finance and Directo | 2007 | $ | 100,000 | $ | 30,155 | $ | 14,300 | $ | 144,455 | ||||||||
|
(1)
|
Amounts
in the Option Awards column represent the dollar amounts recognized for
financial statement reporting purposes for the fiscal years ended October
31, 2009, 2008 and 2007 for each Named Executive Officer in accordance
with ASC 718. A discussion of assumptions used in
valuation of option awards may be found in Note 2 to our Consolidated
Financial Statements for the fiscal year ended October 31, 2009, included
elsewhere in this Annual Report on Form
10-K.
|
|
(2)
|
Amounts
in the All Other Compensation column reflect, for each Named Executive
Officer, the sum of the incremental cost to us of all perquisites and
personal benefits, which consisted solely of auto allowance and related
expenses for fiscal years ended October 31, 2009, 2008 and
2007.
|
41
The
following table sets forth certain information with respect to unexercised stock
options held by the Named Executive Officers outstanding on October 31,
2009:
|
OUTSTANDING
EQUITY AWARDS AT FISCAL YEAR-END TABLE
|
||||
|
Option
Awards (1)
|
||||
|
Name
|
Number
of Securities
Underlying
Unexercised
Options
(#)
Exercisable
|
Number
of Securities
Underlying
Unexercised
Options
(#)
Un
-Exercisable
|
Option
Exercise
Price
($)
|
Option
Expiration
Date
|
|
Denis
A. Krusos
|
250,000
250,000
150,000
500,000
500,000
250,000
1,000,000
1,500,000
1,000,000
1,000,000
700,000
1,000,000
1,000,000
|
$1.063
$0.688
$0.400
$0.250
$0.430
$0.810
$1.040
$0.650
$0.520
$0.830
$0.700
$1.170
$0.920
|
10/26/2010
1/1/2011
9/19/2011
5/5/2013
2/22/2014
5/10/2014
10/25/2014
2/17/2015
10/30/2015
5/31/2016
11/20/2016
11/11/2017
10/7/2019
|
|
|
Henry
P. Herms
|
100,000
50,000
50,000
70,000
100,000
100,000
50,000
50,000
75,000
100,000
|
$0.938
$0.688
$0.810
$1.040
$0.650
$0.520
$0.830
$0.700
$1.170
$0.920
|
11/19/2010
1/1/2011
5/10/2014
10/25/2014
2/17/2015
10/30/2015
5/31/2016
11/20/2016
11/11/2017
10/7/2019
|
|
42
The
following table sets forth certain information with respect to grants of stock
options to the Named Executive Officers during fiscal year 2009:
|
GRANTS
OF PLAN BASED AWARDS TABLE
|
||||
|
Name
|
Grant
Date
|
All
Other Option
Awards:
Number of
Securities
Underlying
Options
(#)
|
Exercise
Price of Option Awards
($/Sh)
|
Grant
Date
Fair
Value
($)
|
|
Denis
A. Krusos
|
10/08/09
|
1,000,000
|
$0.92
|
$748,500
|
|
Henry
P. Herms
|
10/08/09
|
100,000
|
$0.92
|
$74,850
|
The
following table summarizes the exercise of stock options during fiscal year 2009
by Named Executive Officers:
|
OPTION
EXERCISES AND STOCK VESTED TABLE
|
||
|
Name
|
Option
Awards
|
|
|
Number
of Shares Acquired
on
Exercise
(#)
|
Value
Realized
on
Exercise
($)
(1)
|
|
|
Denis
A. Krusos
|
100,000
|
$52,000
|
|
Henry
P. Herms
|
100,000
|
$52,000
|
|
(1)
|
The
value realized on exercise is calculated based on the difference between
the exercise price of the options and the market price of the stock at the
time of exercise.
|
Director’s
Compensation
There is
no present arrangement for cash compensation of directors for services in that
capacity. Under the 2003 Share Incentive Plan (as defined in Note 7
to our Consolidated Financial Statements), each non-employee director is
entitled to receive nonqualified stock options to purchase 60,000 shares of
common stock each year that such director is elected to the Board of
Directors. Mr. Larounis received such an award upon his election to
our Board of Directors at our 2009 Annual Meeting of Shareholders and in October
2009, he received an additional award of stock options for his services as a
director.
Our
employee directors, Denis A. Krusos and Henry P. Herms did not receive any
additional compensation for services provided as a director during fiscal year
2009. The following table sets forth compensation of George P.
Larounis, our sole non-employee director for fiscal year 2009:
43
|
DIRECTORS
COMPENSATION
|
||
|
Name
|
Option
Awards
($)
(1)
|
All
Other
Compensation
($)
|
|
George
P. Larounis
|
$60,564
|
-
|
|
(1)
|
Amounts
in the Option Awards column represent the dollar amounts recognized for
financial statement reporting purposes for fiscal year 2009 for Mr.
Larounis in accordance with ASC 718. A discussion of
assumptions used in valuation of option awards may be found in Note 2 to
our Consolidated Financial Statements for fiscal year ended October 31,
2009, included elsewhere in this Annual Report on Form 10-K. At
October 31, 2009, Mr. Larounis held unexercised stock options to purchase
780,000 shares of our common stock. The grant date fair value
of awards to Mr. Larounis in fiscal year 2009, calculated in accordance
ASC 718 was $60,564.
|
|
Item
12.
|
Security Ownership of
Certain Beneficial Owners and Management and Related Stockholder
Matters.
|
The
following table sets forth certain information with respect to our common stock
beneficially owned as of January 25, 2010 by (a) each person who is known by us
to be the beneficial owner of more than 5% of our outstanding common stock, (b)
each of our directors and executive officers, and (c) all directors and
executive officers as a group:
|
Name
and Address of Beneficial Owner
|
Amount
and Nature of Beneficial Ownership(1)(2)
|
Percent
of Class
|
|
Mars
Overseas Limited (3)
P.O.
Box 309, GI Ugland House
South
Church Street, George Town
Grand
Cayman, Cayman Islands
|
20,000,000
|
13.70%
|
|
Denis
A. Krusos
900
Walt Whitman Road
Melville,
NY 11747
|
10,519,880
|
6.78%
|
|
Henry
P. Herms
900
Walt Whitman Road
Melville,
NY 11747
|
755,575
|
*
|
|
George
P. Larounis
900
Walt Whitman Road
Melville,
NY 11747
|
760,000
|
*
|
|
All
Directors and Executive Officers as a Group (3 persons)
|
12,035,455
|
7.69%
|
44
* Less
than 1%.
|
|
(1)
|
A
beneficial owner of a security includes any person who directly or
indirectly has or shares voting power and/or investment power with respect
to such security or has the right to obtain such voting power and/or
investment power within sixty (60) days. Except as otherwise
noted, each designated beneficial owner in this report has sole voting
power and investment power with respect to the shares of our common stock
beneficially owned by such person.
|
|
(2)
|
Includes
9,100,000 shares, 745,000 shares, 720,000 shares and 10,565,000 shares
which Denis A. Krusos, Henry P. Herms, George P. Larounis, and all
directors and executive officers as a group, respectively, have the right
to acquire within 60 days upon exercise of options granted pursuant to the
1993 Stock Option Plan, 2000 Share Incentive Plan and the 2003 Share
Incentive Plan (as defined in Note 7 to our Consolidated Financial
Statements).
|
|
(3)
|
Based
on the information provided in a Schedule 13G for such entity filed with
the Securities and Exchange Commission on November 9,
2007.
|
Equity Compensation Plan
Information
The
following is information as of October 31, 2009 about shares of our common stock
that may be issued upon the exercise of options, warrants and rights under all
equity compensation plans in effect as of that date, including our 1993 Stock
Option Plan, our 2000 Share Incentive Plan and our 2003 Share Incentive
Plan. See Note 7 to Consolidated Financial Statements for more
information on these plans.
|
Plan
category
|
Number
of
securities
to be
issued
upon
exercise
of
outstanding
options,
warrants
and
rights
|
Weighted
average
exercise
price of
outstanding
options,
warrants
and
rights
|
Number
of securities
remaining
available for
future
issuance under
equity
compensation
plans
(excluding
securities
reflected in
column
(a))
|
||||||
|
(a)
|
(b)
|
(c)
|
|||||||
|
Equity
compensation plans approved by security holders
|
2,258,466
|
$0.91
|
21,508
|
||||||
|
Equity
compensation plans not approved by security holders
|
18,252,045
|
$0.80
|
5,483,086
|
||||||
|
Total
|
20,510,511
|
$0.81
|
5,504,594
|
||||||
45
|
Item
13.
|
Certain Relationships
and Related Transactions, and Director
Independence
.
|
Transactions with Related
Persons
Except as
otherwise indicated herein, there have been no related party transactions, or
any other transactions or relationships required to be disclosed pursuant to
Item 404 of Regulation S-K.
Related Person Transaction
Approval Policy
Our Board
of Directors review and approve all transactions between us and a related
person, to the extent required by applicable rules and
regulations. Generally, management would present to the Board of
Directors for approval at the next regularly scheduled Board meeting any related
person transactions proposed to be entered into by us.
Director
Independence
Our Board
of Directors oversees the activities of our management in the handling of the
business and affairs of our company.
None of our
directors are
“independent” under the rules adopted by the Nasdaq Stock
Market and other stock exchanges.
The
following table describes fees for professional audit services rendered and
billed by KPMG LLP from August 2009 through October 31, 2009, our present
independent registered public accounting firm and principal accountant, for the
audit of our annual financial statements for the year ended October 31, 2009 and
Grant Thornton LLP during the period from November 1, 2007 through
August 2009, for the audit of our annual financial statements and for other
services for the year ended October 31, 2008 and for review of our
quarterly financial statements for the three month periods ended January 31,
2009 and April 30, 2009.
|
Type of Fee
|
2009
|
2008
|
||||||
|
Audit
Fees (1)
|
$ | 517,743 | $ | 432,151 | ||||
|
Audit
Related Fees (2)
|
- | 11,644 | ||||||
|
Tax
Fees (3)
|
- | 1,000 | ||||||
|
All
Other Fees
|
- | - | ||||||
|
Total
|
$ | 517,743 | $ | 444,795 | ||||
|
(1)
|
Audit
fees for fiscal year 2009 represent billed fees for professional services
rendered by KPMG LLP and Grant Thornton LLP of $50,000 and $467,743,
respectively.
|
|
|
|
(2)
|
Audit
related fees consist of fees related to an SEC comment
letter.
|
|
(3)
|
Tax
fees consist of tax consulting
services.
|
46
Procedures For Board of
Directors Pre-Approval of Audit and Permissible Non-Audit Services of
Independent Auditor
Our Board
of Directors is responsible for reviewing and approving, in advance, any audit
and any permissible non-audit engagement or relationship between us and our
independent registered public accounting firm. KPMG’s engagement to
conduct our audit was approved by our Board of Directors on August 11,
2009. We did not enter into any non-audit engagement or relationship
with KPMG during fiscal year 2009. Grant Thornton’s engagement to
conduct our audit was approved by the Board of Directors on July 18,
2008. We did not enter into any non-audit engagement or relationship
with Grant Thornton LLP during fiscal year 2008.
47
|
Item
15.
|
Exhibits, Financial
Statement Schedules
|
(a)(1)(2)
Financial Statement
Schedules
|
|
See
accompanying “Index to Consolidated Financial
Statements.”
|
(a)(3)
Executive Compensation Plans
and Arrangements
CopyTele,
Inc. 1993 Stock Option Plan (filed as Annex A to our Proxy Statement dated June
10, 1993).
Amendment
No. 1 to CopyTele, Inc. 1993 Stock Option Plan (filed as Exhibit 4(d) to our
Form S-8 dated September 6, 1995).
Amendment
No. 2 to CopyTele, Inc. 1993 Stock Option Plan (filed as Exhibit 10.32 to our
Quarterly Report on Form 10-Q for the fiscal quarter ended April 30,
1996).
CopyTele,
Inc. 2000 Share Incentive Plan (filed as Annex A of our Proxy Statement dated
June 12, 2000).
Amendment
No. 1 to CopyTele, Inc. 2000 Share Incentive Plan (filed as Exhibit 10.1 to our
Quarterly Report on Form 10-Q for the fiscal quarter ended July 31,
2001).
Amendment
No. 2 to CopyTele, Inc. 2000 Share Incentive Plan (filed as Exhibit 4(e) to our
Form S-8 dated September 18, 2002).
CopyTele,
Inc. 2003 Share Incentive Plan (filed as Exhibit 4 to our Form S-8 dated May 5,
2003).
Amendment
No. 1 to the CopyTele, Inc. 2003 Share Incentive Plan (filed as Exhibit 4(e) to
our Form S-8 dated November 9, 2004).
Amendment
No. 2 to the CopyTele, Inc. 2003 Share Incentive Plan (filed as Exhibit 10.1 to
our Quarterly Report on Form 10-Q for the fiscal quarter ended January 31,
2006).
Amendment
No. 3 to the CopyTele, Inc. 2003 Share Incentive Plan (filed as Exhibit 10.2 to
our Quarterly Report on Form 10-Q for the fiscal quarter ended January 31,
2006).
48
Form of
Stock Option Agreement under CopyTele, Inc. 2003 Share Incentive Plan (filed as
Exhibit 10.1 to our Quarterly Report on Form 10-Q for the fiscal quarter ended
July 31, 2004).
Form of
Stock Award Agreement under CopyTele, Inc. 2003 Share Incentive Plan (filed as
Exhibit 10.2 to our Quarterly Report on Form 10-Q for the fiscal quarter ended
July 31, 2004).
(b)
Exhibits
|
|
3.1
|
Certificate
of Incorporation, as amended. (Incorporated by reference to
Form 10-Q for the fiscal quarter ended July 31, 1992 and to Form 10-Q for
the fiscal quarter ended July 31,
1997.)
|
|
|
3.2
|
Amended
and Restated By-laws. (Incorporated by reference to Exhibit 3.2
to our Form 8-K dated August 4,
2008.)
|
|
|
4.1
|
Common
Stock Purchase Warrant issued to ZQX Advisors, LLC on August 20, 2009
(filed herewith)
|
|
|
4.2
|
Common
Stock Purchase Warrant issued to ZQX Advisors, LLC on August 20, 2009
(filed herewith)
|
|
|
10.1
|
CopyTele,
Inc. 1993 Stock Option Plan, adopted on April 28, 1993 and approved by
shareholders on July 14, 1993. (Incorporated by reference to
Proxy Statement dated June 10,
1993.)
|
|
|
10.2
|
Amendment
No. 1 to the CopyTele, Inc. 1993 Stock Option Plan, adopted on May 3, 1995
and approved by shareholders on July 19, 1995. (Incorporated by
reference to Form S-8 (Registration No. 33-62381) dated September 6,
1995.)
|
|
|
10.3
|
Amendment
No. 2 to the CopyTele, Inc. 1993 Stock Option Plan, adopted on May 10,
1996 and approved by shareholders on July 24,
1996. (Incorporated by reference to Form 10-Q for the fiscal
quarter ended April 30, 1996.)
|
|
|
10.4
|
Agreement
dated March 3, 1999 between Harris Corporation and CopyTele,
Inc. (Incorporated by reference to Form 10-Q for the fiscal
quarter ended January 31, 1999.)
|
|
|
10.5
|
Agreement
dated July 28, 1999, among CopyTele, Inc., Harris Corporation and RF
Communications. (Incorporated by reference to Form 8-K dated
July 28, 1999.)
|
|
|
10.6
|
CopyTele,
Inc. 2000 Share Incentive Plan. (Incorporated by reference to
Annex A of our Proxy Statement dated June 12,
2000.)
|
49
|
|
10.7
|
Amendment
No. 1 to the CopyTele, Inc. 2000 Share Incentive Plan, adopted on July 6,
2001 and approved by shareholders on August 16,
2001. (Incorporated by reference to Form 10-Q for the fiscal
quarter ended July 31, 2001.)
|
|
|
10.8
|
Amendment
No. 2 to the CopyTele, Inc. 2000 Share Incentive Plan, adopted on July 16,
2002 and approved by shareholders on September 12,
2002. (Incorporated by reference to Exhibit 4(e) to our Form
S-8 (Registration No. 333-99717) dated September 18,
2002.)
|
|
|
10.9
|
Amendment,
dated May 10, 2001, to the Joint Cooperation Agreement between CopyTele,
Inc. and Volga Svet Ltd. (Incorporated by reference to Exhibit
10.14 to our Form 10-K for the fiscal year ended October 31,
2001.)
|
|
|
10.10
|
Letter
Agreement between CopyTele, Inc. and Volga Svet Ltd., dated as of February
1, 2002. (Incorporated by reference to Exhibit 10.15 to our
Form 10-K for the fiscal year ended October 31,
2001.)
|
|
|
10.11
|
CopyTele,
Inc. 2003 Share Incentive Plan. (Incorporated by reference to Exhibit 4 to
our Form S-8 dated May 5, 2003).
|
|
|
10.12
|
Amendment
No. 1 to the CopyTele, Inc. 2003 Share Incentive Plan. (Incorporated by
reference to Exhibit 4(e) to our Form S-8 dated November 9,
2004.)
|
|
|
10.13
|
Amendment
No. 2 to the CopyTele, Inc. 2003 Share Incentive Plan. (Incorporated by
reference to Exhibit 10.1 to our Quarterly Report on Form 10-Q for the
fiscal quarter ended January 31,
2005).
|
|
|
10.14
|
Amendment
No. 3 to the CopyTele, Inc. 2003 Share Incentive Plan. (Incorporated by
reference to Exhibit 10.2 to our Quarterly Report on Form 10-Q for the
fiscal quarter ended January 31,
2005).
|
|
|
10.15
|
Form
of Stock Option Agreement under CopyTele, Inc. 2003 Share Incentive Plan.
(Incorporated by reference to Exhibit 10.1 to our Quarterly Report on Form
10-Q for the fiscal quarter ended July 31,
2004).
|
|
|
10.16
|
Form
of Stock Award Agreement under CopyTele, Inc. 2003 Share Incentive Plan.
(Incorporated by reference to Exhibit 10.2 to our Quarterly Report on Form
10-Q for the fiscal quarter ended July 31,
2004).
|
50
|
|
10.17
|
Long
Term Agreement dated May 23, 2007, between The Boeing Company and
CopyTele, Inc. (Incorporated by reference to Exhibit 10.1 to our Form 8-K
dated May 23, 2007.)
|
|
|
10.18
|
Amended
and Restated Technology License Agreement, dated May 16, 2008, between
CopyTele, Inc. and Videocon Industries Limited. (Incorporated by reference
to Exhibit 10.1 to our Quarterly Report on Form 10-Q for the fiscal
quarter ended July 31, 2008.)
|
|
|
10.19
|
Loan
and Pledge Agreement, dated November 2, 2007, between Mars Overseas
Limited and CopyTele International Ltd. (Incorporated by reference to
Exhibit 10.5 to our Quarterly Report on Form 10-Q for the fiscal quarter
ended January 31, 2008.)
|
|
|
10.20
|
Loan
and Pledge Agreement, dated November 2, 2007, between CopyTele
International Ltd. and Mars Overseas Limited. (Incorporated by reference
to Exhibit 10.6 to our Quarterly Report on Form 10-Q for the fiscal
quarter ended January 31, 2008.)
|
|
|
21
|
Subsidiaries
of CopyTele, Inc. (Incorporated by reference to Exhibit 21 to
our Annual Report on Form 10-K for the fiscal year ended October 31,
2009.)
|
|
|
23.1
|
Consent
of KPMG LLP. (Filed
herewith.)
|
|
|
23.2
|
Consent
of Grant Thornton LLP. (Filed
herewith.)
|
|
|
31.1
|
Certification
of Chief Executive Officer, pursuant to Section 302 of the Sarbanes-Oxley
Act of 2002, dated January 29, 2010. (Filed
herewith.)
|
|
|
31.2
|
Certification
of Chief Financial Officer, pursuant to Section 302 of the Sarbanes-Oxley
Act of 2002, dated January 29, 2010. (Filed
herewith.)
|
|
|
32.1
|
Statement
of Chief Executive Officer, pursuant to Section 1350 of Title 18 of the
United States Code, dated January 29, 2010. (Filed
herewith.)
|
|
|
32.2
|
Statement
of Chief Financial Officer, pursuant to Section 1350 of Title 18 of the
United States Code, dated January 29, 2010. (Filed
herewith.)
|
51
SIGNATURES
Pursuant
to the requirements of Section 13 or 15(d) of the Securities Exchange Act of
1934, the registrant has duly caused this report to be signed on its behalf by
the undersigned, thereunto duly authorized.
| COPYTELE, INC. | |||
|
|
By:
|
/s/ Denis A. Krusos | |
|
Denis
A. Krusos
|
|||
|
Chairman
of the Board and
|
|||
| January 29, 2010 | Chief Executive Officer | ||
Pursuant
to the requirements of the Securities Exchange Act of 1934, this report has been
signed below by the following persons on behalf of the registrant and in the
capacities and on the date indicated.
|
|
By:
|
/s/ Denis A. Krusos | |
| Denis A. Krusos | |||
| Chairman of the Board, | |||
| Chief Executive Officer | |||
| and Director (Principal Executive | |||
| January 29, 2010 | Officer) |
|
|
By:
|
/s/ Henry P. Herms | |
| Henry P. Herms | |||
| Vice President - Finance, | |||
| Chief Financial Officer and | |||
| Director (Principal Financial | |||
| January 29, 2010 | and Accounting Officer) |
|
|
By:
|
/s/ George P. Larounis | |
| George P. Larounis | |||
| January 29, 2010 |
Director
|
||
52
COPYTELE, INC.
AND SUBSIDIARIES
INDEX TO CONSOLIDATED
FINANCIAL STATEMENTS
OCTOBER
31, 2009
|
Page
|
|
|
F-1
– F2
|
|
|
F-3
|
|
|
F-4
|
|
|
F-5
– F-6
|
|
|
F-7
|
|
|
F-8 – F-30
|
|
|
S-1
|
Additional
information required by schedules called for under Regulation S-X is either not
applicable or is included in the financial statements or notes
thereto.
The Board
of Directors and Shareholders
CopyTele,
Inc. and Subsidiaries
We have
audited the accompanying consolidated balance sheet of CopyTele, Inc. and
subsidiaries as of October 31, 2009 and the related consolidated statements
of operations, shareholders’ equity and cash flows for the year then ended. In
connection with our audit of the consolidated financial statements we have also
audited the consolidated financial statement schedule listed in Item 15 (a) (1)
(2). These consolidated financial statements and the consolidated
financial statement schedule are the responsibility of the Company’s management.
Our responsibility is to express an opinion on these consolidated financial
statements and the consolidated financial statement schedule based on our
audit.
We
conducted our audit in accordance with the standards of the Public Company
Accounting Oversight Board (United States). Those standards require that we plan
and perform the audit to obtain reasonable assurance about whether the financial
statements are free of material misstatement. An audit also includes examining,
on a test basis, evidence supporting the amounts and disclosures in the
financial statements, assessing the accounting principles used and significant
estimates made by management, as well as evaluating the overall financial
statement presentation. We believe that our audit provides a reasonable basis
for our opinion.
In our
opinion, the consolidated financial statements referred to above present fairly,
in all material respects, the financial position of CopyTele, Inc. and
subsidiaries as of October 31, 2009, and the results of their operations
and their cash flows for the year then ended in conformity with
U.S. generally accepted accounting principles. Also in our
opinion, the related financial statement schedule, when considered in relation
to the basic consolidated financial statements taken as a whole, presents
fairly, in all material respects, the information set forth
therein.
/s/
KPMG LLP
Melville,
NY
January 29,
2010
F-1
REPORT OF INDEPENDENT REGISTERED
PUBLIC ACCOUNTING FIRM
Board of
Directors and Shareholders
CopyTele,
Inc. and Subsidiaries
We have
audited the accompanying consolidated balance sheet of CopyTele, Inc. and
Subsidiaries (the “Company”) as of October 31, 2008, and the related
consolidated statements of operations, shareholders’ equity, and cash flows for
each of the two years in the period ended October 31, 2008. Our
audits of the basic financial statements included the financial statement
schedule listed in the index appearing under
Item 15
(a)(2)
. These financial statements and financial statement
schedule are the responsibility of the Company's management.
Our responsibility is
to express an opinion on these financial statements and financial statement
schedule based on our audits.
We
conducted our audits in accordance with the standards of the Public Company
Accounting Oversight Board (United States). Those standards require that we plan
and perform the audit to obtain reasonable assurance about whether the
consolidated financial statements are free of material misstatement. An audit
includes examining, on a test basis, evidence supporting the amounts and
disclosures in the consolidated financial statements. An audit also includes
assessing the accounting principles used and significant estimates made by
management, as well as evaluating the overall financial statement presentation.
We believe that our audits provide a reasonable basis for our
opinion.
In our
opinion, the consolidated financial statements referred to above present fairly,
in all material respects, the financial position of CopyTele, Inc. and
Subsidiaries as of October 31, 2008, and the results of their operations
and their cash flows for each of the two years in the period ended October 31,
2008, in conformity with accounting principles generally accepted in the United
States of America. Also in our opinion, the related financial statement
schedule, when considered in relation to the basic financial statements taken as
a whole, presents fairly, in all material respects, the information set forth
therein.
/s/ GRANT
THORNTON LLP
Melville,
New York
January
14, 2009
F-2
CONSOLIDATED
BALANCE SHEETS
|
October
31,
2009
|
October
31,
2008
|
|||||||
|
ASSETS
|
||||||||
|
Current
assets:
|
||||||||
|
Cash
and cash equivalents
|
$ | 1,451,241 | $ | 478,599 | ||||
|
Short–term
investments in certificates of deposit and U.S. government
securities
|
749,942 | 1,442,484 | ||||||
|
Accounts
receivable, net of allowance for doubtful accounts
of $206,000
and $223,000,
respectively
|
750 | 103,000 | ||||||
|
Inventories
|
132,688 | 178,144 | ||||||
|
Prepaid
expenses and other current assets
|
61,869 | 54,348 | ||||||
|
Total
current assets
|
2,396,490 | 2,256,575 | ||||||
|
Investment
in U.S. government securities, at amortized cost
|
- | 749,711 | ||||||
|
Investment
in Videocon Industries Limited global depository receipts,
|
||||||||
|
at
market value
|
7,105,264 | 3,619,945 | ||||||
|
Investment
in Volga-Svet, Ltd., at cost
|
127,500 | - | ||||||
|
Investment
in Digital Info Security Co. Inc. common stock, at market
value
|
198,030 | 841,800 | ||||||
|
Property
and equipment, net of accumulated depreciation and amortization
of $2,161,956 and $2,151,344 respectively
|
21,162 | 29,838 | ||||||
|
Total
assets
|
$ | 9,848,446 | $ | 7,497,869 | ||||
|
LIABILITIES AND SHAREHOLDERS’ EQUITY
|
||||||||
|
Current
liabilities:
|
||||||||
|
Accounts
payable
|
$ | 326,243 | $ | 384,896 | ||||
|
Accrued
liabilities
|
69,931 | 69,364 | ||||||
|
Deferred
revenue, non-refundable license fee
|
- | 313,332 | ||||||
|
Total
current liabilities
|
396,174 | 767,592 | ||||||
|
Loan
payable to related party
|
5,000,000 | 5,000,000 | ||||||
|
Shareholders’
equity:
|
||||||||
|
Preferred
stock, par value $100 per share; 500,000 shares authorized; no
shares
issued
or outstanding
|
- | - | ||||||
|
Common
stock, par value $.01 per share; 240,000,000 shares
authorized;
144,562,516
and 132,497,881 shares issued and outstanding,
respectively
|
1,445,625 | 1,324,979 | ||||||
|
Additional
paid-in capital
|
116,284,003 | 109,348,894 | ||||||
|
Loan
receivable from related party
|
(5,000,000 | ) | (5,000,000 | ) | ||||
|
Accumulated
deficit
|
(108,277,356 | ) | (91,788,341 | ) | ||||
|
Accumulated
other comprehensive loss
|
- | (12,155,255 | ) | |||||
|
Total
shareholders’ equity
|
4,452,272 | 1,730,277 | ||||||
|
Total
liabilities and shareholders’ equity
|
$ | 9,848,446 | $ | 7,497,869 | ||||
The
accompanying notes are an integral part of these statements.
F-3
CONSOLIDATED
STATEMENTS OF OPERATIONS
|
For
the years ended October 31,
|
||||||||||||
|
2009
|
2008
|
2007
|
||||||||||
|
Net
revenue
|
||||||||||||
|
Revenue
from sales of encryption products, net
|
$ | 90,465 | $ | 376,455 | $ | 246,852 | ||||||
|
Revenue
from encryption services, net
|
- | - | 240,000 | |||||||||
|
Revenue
from display engineering services, net
|
52,000 | - | - | |||||||||
|
Display
technology license fee
|
913,332 | 1,686,668 | - | |||||||||
|
Total
net revenue
|
1,055,797 | 2,063,123 | 486,852 | |||||||||
|
Cost
of revenue and operating expenses
|
||||||||||||
|
Cost
of encryption products sold
|
47,488 | 95,594 | 73,953 | |||||||||
|
Cost
of encryption services
|
- | - | 86,407 | |||||||||
|
Cost
of display engineering services
|
18,200 | - | - | |||||||||
|
Research
and development expenses
|
4,116,200 | 4,127,393 | 3,403,943 | |||||||||
|
Selling,
general and administrative expenses
|
4,194,227 | 3,829,654 | 2,414,916 | |||||||||
|
Total
cost of revenue and operating expenses
|
8,376,115 | 8,052,641 | 5,979,219 | |||||||||
|
Loss
from operations
|
(7,320,318 | ) | (5,989,518 | ) | (5,492,367 | ) | ||||||
|
Impairment
in value of available for sale securities (Note 4)
|
(9,218,972 | ) | - | - | ||||||||
|
Dividend
income
|
29,468 | 130,886 | - | |||||||||
|
Interest
income
|
20,807 | 37,028 | 34,149 | |||||||||
|
Loss
before income taxes
|
(16,489,015 | ) | (5,821,604 | ) | (5,458,218 | ) | ||||||
|
Provision
for income taxes
|
- | - | - | |||||||||
|
Net
loss
|
$ | (16,489,015 | ) | $ | (5,821,604 | ) | $ | (5,458,218 | ) | |||
|
Net
loss per share:
|
||||||||||||
|
Basic
and diluted
|
$ | (.12 | ) | $ | (.05 | ) | $ | (.05 | ) | |||
|
Weighted
average common shares outstanding:
|
||||||||||||
|
Basic
and diluted
|
138,746,477 | 129,490,238 | 103,487,032 | |||||||||
The
accompanying notes are an integral part of these statements.
F-4
CONSOLIDATED
STATEMENT OF SHAREHOLDERS’ EQUITY
FOR THE YEARS ENDED OCTOBER
31, 2009, 2008 AND 2007
|
Loan
|
Accumulated
|
|||||||||||||||||||||||||||
|
Additional
|
Receivable
|
Other
|
Total
|
|||||||||||||||||||||||||
|
Common
Stock
|
Paid-in
|
From
|
Accumulated
|
Comprehensive
|
Shareholders’
|
|||||||||||||||||||||||
|
Shares
|
Par
Value
|
Capital
|
Related
Party
|
Deficit
|
Loss
|
Equity
|
||||||||||||||||||||||
|
Balance,
October 31, 2006
|
99,260,395 | $ | 992,604 | $ | 80,797,756 | $ | - | $ | (80,508,519 | ) | $ | - | $ | 1,281,841 | ||||||||||||||
|
Stock
option compensation to employees
|
- | - | 1,080,882 | - | - | - | 1,080,882 | |||||||||||||||||||||
|
Common
stock issued upon exercise of stock options
under
stock option plans
|
4,582,230 | 45,822 | 2,113,977 | - | - | - | 2,159,799 | |||||||||||||||||||||
|
Common
stock issued to employees pursuant to stock
incentive plans
|
2,528,365 | 25,284 | 1,709,657 | - | - | - | 1,734,941 | |||||||||||||||||||||
|
Common
stock issued to consultants pursuant to stock
incentive plans
|
240,325 | 2,403 | 179,702 | - | - | - | 182,105 | |||||||||||||||||||||
|
Unregistered
common stock issued to Digital Info
Security
Co., Inc.
|
300,000 | 3,000 | 207,000 | - | - | - | 210,000 | |||||||||||||||||||||
|
Net
loss
|
- | - | - | - | (5,458,218 | ) | - | (5,458,218 | ) | |||||||||||||||||||
|
Balance,
October 31, 2007
|
106,911,315 | 1,069,113 | 86,088,974 | - | (85,966,737 | ) | - | 1,191,350 | ||||||||||||||||||||
|
Stock
option compensation to employees
|
- | - | 2,613,731 | - | - | - | 2,613,731 | |||||||||||||||||||||
|
Stock
option compensation to consultants
|
- | - | 216,896 | - | - | - | 216,896 | |||||||||||||||||||||
|
Common
stock issued upon exercise of stock options
under
stock option plans
|
3,354,200 | 33,542 | 2,478,763 | - | - | - | 2,512,305 | |||||||||||||||||||||
|
Common
stock issued to employees pursuant to stock
incentive plans
|
2,142,400 | 21,424 | 1,856,067 | - | - | - | 1,877,491 | |||||||||||||||||||||
|
Common
stock issued to consultants pursuant to stock
incentive plans
|
89,966 | 900 | 94,463 | - | - | - | 95,363 | |||||||||||||||||||||
|
Unregistered
common stock issued to Videocon
Industries
Limited
|
20,000,000 | 200,000 | 16,000,000 | (5,000,000 | ) | - | - | 11,200,000 | ||||||||||||||||||||
|
Unrealized
loss on investment in Videocon Industries
Limited
global depository receipts
|
- | - | - | - | - | (12,580,055 | ) | (12,580,055 | ) | |||||||||||||||||||
|
Unrealized
gain on investment in Digital Info Security
Co., Inc
|
- | - | - | - | - | 424,800 | 424,800 | |||||||||||||||||||||
|
Net
loss
|
- | - | - | - | (5,821,604 | ) | - | (5,821,604 | ) | |||||||||||||||||||
|
Balance,
October 31, 2008
|
132,497,881 | $ | 1,324,979 | $ | 109,348,894 | $ | (5,000,000 | ) | $ | (91,788,341 | ) | $ | (12,155,255 | ) | $ | 1,730,277 | ||||||||||||
|
Continued
|
||||||||||||||||||||||||||||
The
accompanying notes are an integral part of this statement.
F-5
COPYTELE, INC.
AND SUBSIDIARIES
CONSOLIDATED
STATEMENT OF SHAREHOLDERS’ EQUITY
FOR THE YEARS ENDED OCTOBER
31, 2009, 2008 AND 2007
Continued
|
Loan
|
Accumulated
|
|||||||||||||||||||||||||||
|
Additional
|
Receivable
|
Other
|
Total
|
|||||||||||||||||||||||||
|
Common
Stock
|
Paid-in
|
From
|
Accumulated
|
Comprehensive
|
Shareholders’
|
|||||||||||||||||||||||
|
Shares
|
Par
Value
|
Capital
|
Related
Party
|
Deficit
|
Loss
|
Equity
|
||||||||||||||||||||||
|
Balance,
October 31, 2008
|
132,497,881 | $ | 1,324,979 | $ | 109,348,894 | $ | (5,000,000 | ) | $ | (91,788,341 | ) | $ | (12,155,255 | ) | $ | 1,730,277 | ||||||||||||
|
Stock
option compensation to employees
|
- | - | 2,418,061 | - | - | - | 2,418,061 | |||||||||||||||||||||
|
Stock
option compensation to consultants
|
- | - | 13,225 | - | - | - | 13,225 | |||||||||||||||||||||
|
Common
stock issued upon exercise of stock options
under
stock option plans
|
5,160,000 | 51,600 | 1,920,600 | - | - | - | 1,972,200 | |||||||||||||||||||||
|
Common
stock issued to employees pursuant to stock
incentive plans
|
5,800,545 | 58,005 | 2,041,370 | - | - | - | 2,099,375 | |||||||||||||||||||||
|
Common
stock issued to consultants pursuant to stock
incentive plans
|
154,090 | 1,541 | 46,932 | - | - | - | 48,473 | |||||||||||||||||||||
|
Unrealized
loss on available for sale securities
reclassified
to net loss, net (Note 4)
|
- | - | - | - | - | 12,155,255 | 12,155,255 | |||||||||||||||||||||
|
Unregistered
common stock and warrants issued to
ZQX
Advisors, LLC
|
800,000 | 8,000 | 368,921 | - | - | - | 376,921 | |||||||||||||||||||||
|
Unregistered
common stock issued to Volga-Svet, Ltd
|
150,000 | 1,500 | 126,000 | - | - | - | 127,500 | |||||||||||||||||||||
|
Net
loss
|
- | - | - | - | (16,489,015 | ) | - | (16,489,015 | ) | |||||||||||||||||||
|
Balance,
October 31, 2009
|
144,562,516 | $ | 1,445,625 | $ | 116,284,003 | $ | (5,000,000 | ) | $ | (108,277,356 | ) | $ | - | $ | 4,452,272 | |||||||||||||
The
accompanying notes are an integral part of this statement.
F-6
CONSOLIDATED
STATEMENTS OF CASH FLOWS
|
For
the years ended October 31,
|
||||||||||||
|
2009
|
2008
|
2007
|
||||||||||
|
Cash
flows from operating activities:
|
||||||||||||
|
Payments to suppliers, employees
and consultants
|
$ | (3,047,348 | ) | $ | (3,236,351 | ) | $ | (2,808,025 | ) | |||
|
Cash received from products and
services
|
141,715 | 170,445 | 377,017 | |||||||||
|
Cash
received from display technology license fee
|
350,000 | 2,000,000 | - | |||||||||
|
Dividend
received
|
29,468 | 130,886 | - | |||||||||
|
Interest received
|
24,599 | 33,152 | 34,149 | |||||||||
|
Net cash used in operating
activities
|
(2,501,566 | ) | (901,868 | ) | (2,396,859 | ) | ||||||
|
Cash
flows from investing activities:
|
||||||||||||
|
Disbursements
to acquire Videocon Industries Limited global depository
receipts
|
- | (16,200,000 | ) | - | ||||||||
|
Disbursements
to acquire short-term investments (certificates of deposit
and
U.S. government securities)
|
(2,899,423 | ) | (2,880,166 | ) | (825,000 | ) | ||||||
|
Proceeds
from maturities of short-term investments (certificates of
deposit
and
U.S. government securities)
|
4,342,959 | 1,841,000 | 463,000 | |||||||||
|
Proceeds
from sale of Digital Info Security Co., Inc. common stock
|
60,408 | - | - | |||||||||
|
Disbursements
to acquire long-term investments (U.S. government
securities)
|
- | (999,525 | ) | - | ||||||||
|
Proceeds
from sales of long-term investments (U.S. government
securities)
|
- | 251,565 | - | |||||||||
|
Payments
for purchases of property and equipment
|
(1,936 | ) | (13,853 | ) | (13,459 | ) | ||||||
|
Net cash provided by (used in)
investing activities
|
1,502,008 | ( 18,000,979 | ) | (375,459 | ) | |||||||
|
Cash
flows from financing activities:
|
||||||||||||
|
Proceeds
from sale of common stock to Videocon Industries Limited
|
- | 16,200,000 | - | |||||||||
|
Issuance
of loan receivable from related party
|
- | (5,000,000 | ) | - | ||||||||
|
Proceeds
from issuance of loan payable to related party
|
- | 5,000,000 | - | |||||||||
|
Proceeds from exercise of stock
options
|
1,972,200 | 2,512,305 | 2,159,799 | |||||||||
|
Net cash provided by financing
activities
|
1,972,200 | 18,712,305 | 2,159,799 | |||||||||
|
Net
increase (decrease) in cash and cash equivalents
|
972,642 | (190,542 | ) | (612,519 | ) | |||||||
|
Cash
and cash equivalents at beginning of year
|
478,599 | 669,141 | 1,281,660 | |||||||||
|
Cash
and cash equivalents at end of year
|
$ | 1,451,241 | $ | 478,599 | $ | 669,141 | ||||||
|
Reconciliation
of net loss to net cash used in operating activities:
|
||||||||||||
|
Net loss
|
$ | ( 16,489,015 | ) | $ | ( 5,821,604 | ) | $ | (5,458,218 | ) | |||
|
Stock option compensation to
employees
|
2,418,061 | 2,613,731 | 1,080,882 | |||||||||
|
Stock option compensation to
consultants
|
13,225 | 216,896 | - | |||||||||
|
Stock awards granted to employees
pursuant to stock incentive plans
|
2,099,375 | 1,877,491 | 1,734,941 | |||||||||
|
Stock awards granted to
consultants pursuant to stock incentive plans
|
48,473 | 95,363 | 182,105 | |||||||||
|
Unregistered
common stock and warrants issued to ZQX Advisors, LLC
|
376,921 | - | ||||||||||
|
Provision for doubtful
accounts
|
103,000 | 223,000 | - | |||||||||
|
Provision
for (recovery of) slow-moving inventory reserve
|
9,473 | (19,379 | ) | - | ||||||||
|
Depreciation
and amortization
|
10,612 | 10,669 | 9,889 | |||||||||
|
Amortized
discount on investments (U.S. government securities)
|
(1,283 | ) | (3,403 | ) | - | |||||||
|
Loss
on sale of Digital Info Security Co., Inc. common stock
|
34,326 | - | - | |||||||||
|
Impairment
in value of available for sale securities
|
9,218,972 | - | - | |||||||||
|
Gain
on sale of investments (U.S. government securities)
|
- | (1,667 | ) | - | ||||||||
|
Change
in operating assets and liabilities:
|
||||||||||||
|
Accounts
receivable, net of allowance for doubtful accounts
|
(750 | ) | (206,000 | ) | (109,835 | ) | ||||||
|
Inventories
|
35,983 | 33,158 | 68,900 | |||||||||
|
Prepaid
expenses and other current assets
|
(7,521 | ) | (8,906 | ) | (2,544 | ) | ||||||
|
Accounts
payable and accrued liabilities
|
(58,086 | ) | (224,549 | ) | 97,021 | |||||||
|
Deferred
revenue
|
(313,332 | ) | 313,332 | - | ||||||||
|
Net cash used in operating
activities
|
$ | (2,501,566 | ) | $ | ( 901,868 | ) | $ | (2,396,859 | ) | |||
|
Supplement
disclosure of non-cash investing and financing activities:
|
||||||||||||
|
Unregistered
common stock issued in connection with investment in
Digital
Info Security Co., Inc.
|
$ | - | $ | - | $ | 210,000 | ||||||
|
Unregistered
common stock issued in connection with investment in
Volga-Svet,
Ltd.
|
$ | 127,500 | $ | - | $ | - | ||||||
|
Unregistered
common stock and warrants issued in connection with
investment
in ZQX Advisors, LLC
|
$ | 91,304 | $ | - | $ | - | ||||||
The
accompanying notes are an integral part of these statements.
F-7
1.
BUSINESS AND FUNDING
Description of
Business
Our
principal operations include the development, production and marketing of thin,
flat, low-voltage phosphor display technology, the development of thin, flat,
low-power passive display technology and the development, production and
marketing of multi-functional encryption products that provide information
security for domestic and international users over virtually every
communications media.
Funding and Management’s
Plans
Since our
inception, we have met our liquidity and capital expenditure needs primarily
through the proceeds from sales of common stock in our initial public offering,
in private placements, upon exercise of warrants issued in connection with the
private placements and our initial public offering, and upon the exercise of
stock options. In addition, commencing in the fourth quarter of
fiscal 1999, we have generated limited cash flows from sales of our encryption
products and in May 2008 began receiving license fees related to our display
technology from Videocon Industries Limited, an Indian company (“Videocon”)
pursuant to the License Agreement (as defined below).
During
fiscal 2009, our cash used in operating activities was approximately
$2,502,000. This resulted from payments to suppliers, employees and
consultants of approximately $3,047,000, which was offset by cash of
approximately $142,000 received from collections of accounts receivable related
to sales of products and services, cash received from display technology
licensing fees of $350,000, approximately $29,000 of dividend income received
and approximately $25,000 of interest income received. Our cash
provided by investing activities during fiscal 2009 was approximately
$1,502,000, which resulted from purchases of short-term investments consisting
of certificates of deposit and U.S. government securities of approximately
$2,899,000 and purchases of approximately $2,000 of equipment, offset by
approximately $4,343,000 received upon maturities of short-term investments
consisting of certificates of deposit and U.S. government securities and
approximately $60,000 received upon the sale of Digital Info Security Co. Inc.
common stock. Our cash provided by financing activities during fiscal
2009 was approximately $1,972,000, which resulted from cash received upon the
exercise of stock options. As a result, our cash, cash equivalents,
and investments in certificates of deposit and U.S. government securities at
October 31, 2009 decreased to approximately $2,201,000 from approximately
$2,671,000 at the end of fiscal 2008.
Total
employee compensation expense during fiscal 2009, 2008 and 2007 was
approximately $5,219,000, $5,164,000 and $3,661,000,
respectively. During fiscal 2009, 2008 and 2007, a significant
portion of employee compensation consisted of the issuance of stock and stock
options to employees in lieu of cash compensation. We recorded
compensation expense for the fiscal years ended October 31, 2009, 2008 and 2007
of approximately $2,099,000, $1,877,000 and $1,735,000, respectively, for shares
of common stock issued to employees. We recorded approximately
$2,418,000, $2,614,000 and $1,081,000 of stock-based compensation expense,
related to stock options granted to employees and directors, during the years
ended October 31, 2009, 2008 and 2007, respectively.
We
believe that our existing cash, cash equivalents and investments in U.S.
government securities, together with cash flows from expected sales of our
encryption products and revenue relating to our thin, flat, low-voltage phosphor
display technology, including license fees and royalties from Videocon, and
other potential sources of cash flows, will be sufficient to enable us to
continue our marketing, production, and research and development
activities. However, our projections of future cash needs and cash
flows may differ from actual results. If current cash, cash
equivalents, investments and cash that may be generated from operations are
insufficient to satisfy our liquidity requirements, we may seek to sell debt or
equity securities or to obtain a line of credit. The sale of
additional equity securities or convertible debt could result in dilution to our
shareholders. We currently have no arrangements with respect to
additional financing. There can be no assurance that we will generate
sufficient revenues in the future (through sales, license fees and royalties, or
otherwise) to satisfy our liquidity requirements or sustain future operations,
that our production capabilities will be adequate, that other products will not
be produced by other companies that will render our products obsolete, or that
other sources of funding would be available, if needed, on favorable terms or at
all. If we cannot obtain such funds if needed, we would need to
curtail or cease some or all of our operations.
F-8
COPYTELE, INC.
AND SUBSIDIARIES
NOTES TO
CONSOLIDATED FINANCIAL STATEMENTS
Related Party Transactions
with Videocon Industries Limited
In
November 2007, we entered into a Technology License Agreement (as amended in May
2008, the “License Agreement”) with Videocon Industries Limited, an Indian
company (“Videocon”). Under the License Agreement, we provide
Videocon with a non-transferable, worldwide license of our technology for thin,
flat, low voltage phosphor displays (the “Licensed Technology”), for Videocon
(or a Videocon Group company) to produce and market products, including TVs,
incorporating displays utilizing the Licensed Technology. Under the
License Agreement, we expect to receive a license fee of $11 million from
Videocon, payable in installments over a 27 month period commencing in May 2008,
and an agreed upon royalty from Videocon based on display sales by
Videocon. In April 2008, the Indian Government approved the License
Agreement.
In May
2008, we received the first installment of the license fee of
$2,000,000. During the quarter ended April 30, 2009, we modified the
payment terms from Videocon and we agreed to reimburse Videocon $250,000 for
engineering services related to another version of our display technology, which
amount was offset against amounts due to Videocon in lieu of a cash
payment. In addition, in June 2009, we received a license fee payment
from Videocon of $250,000, which was due during the quarter ended April 30, 2009
pursuant to the modified payment terms. In August 2009, we received
an additional license fee payment from Videocon of $100,000, which was due
during the quarter ended July 31, 2009 pursuant to the modified payment
terms. As of October 31, 2009, we have received aggregate license fee
payments of $2,600,000. We further modified the payment terms from
Videocon during the first quarter of fiscal 2010 for amounts that were due
during that quarter. The modifications were made to allow
Videocon’s payments to be more closely aligned with the progress being made
towards the optimization of the display performance. While we have
modified the timing of license fee payments to be received from Videocon, the
total license fee of $11 million remains payable over the 27 month period, which
commenced in May 2008. Videocon’s obligations with respect to the
pre-production phase, and CopyTele’s assistance, under the License Agreement
remain unaffected.
Under the
License Agreement, Videocon, with our assistance, is to provide the design and
process engineering required to produce such display modules, and also is to
provide all tooling and fixtures required for the production
process. As part of our assistance to Videocon to produce such
display modules, we have been exchanging information with Videocon employees so
that they may understand the CopyTele technology. We are currently
cooperating with Videocon to jointly implement the CopyTele technology prior to
production, to produce prototypes of such modules. Videocon is utilizing its
display processing technology and facilities to continue to produce various
configurations of our display matrix to optimize its performance. The matrix is
the main component of our display, since it contains the structure to
accommodate our electron emission technology and the color phosphors that are
used to illuminate our display. We are also working with Videocon to
incorporate two other versions of our display
technology. Improvements to the technology, when and if available,
are to be jointly owned by CopyTele and Videocon.
Significant improvements
, as defined in the
License Agreement, may result in additional compensation
to CopyTele.
CopyTele has determined that any improvements which
are not significant in nature are inconsequential.
F-9
COPYTELE, INC.
AND SUBSIDIARIES
NOTES TO
CONSOLIDATED FINANCIAL STATEMENTS
The
arrangement with Videocon also provides for
an advisor to
Board of Directors. The purpose
of the advisor to the Board of Directors is to provide knowledge to the Board of
the display market and to apprise the Board of developments in this
market. CopyTele believes this to be inconsequential to the operation
of the License Agreement.
Under the
License Agreement we continue to have the right to produce and market products
utilizing our technology. We also continue to have the right to
utilize Volga Svet Ltd., a Russian display company that we have been working
with for more than twelve years (“Volga”), and an Asian company that CopyTele
has been working with for more than six years, to produce and market, products
utilizing the Licensed Technology. Additional licenses of the
Licensed Technology to third parties require the joint agreement of CopyTele and
Videocon.
In
November 2007, we also entered into a Share Subscription Agreement (the
“Subscription Agreement”) with Mars Overseas Limited, an affiliate of Videocon
(“Mars Overseas”). Under the Subscription Agreement, Mars Overseas
purchased 20,000,000 shares of our common stock (the “CopyTele Shares”) from us
for an aggregate purchase price of $16,200,000, which was determined by
management to approximate fair market value. The purchase of the
CopyTele Shares pursuant to the Subscription Agreement closed in November
2007.
Also in
November 2007, our wholly-owned British Virgin Islands subsidiary, CopyTele
International Ltd. (“CopyTele International”), entered into a GDR Purchase
Agreement (the “Purchase Agreement”) with Global EPC Ventures Limited
(“Global”), for CopyTele International to purchase from Global
1,495,845 global depository receipts of Videocon (
the “Videocon GDRs”), acquired by Global
on the open market for an
aggregate purchase price of $16,200,000, which was determined by management to
approximate fair market value. Videocon’s global depository receipts
are listed on the Luxembourg Stock Exchange. The purchase of the
Videocon GDRs pursuant to the Purchase Agreement closed in December
2007.
For the
purpose of effecting a lock up of the Videocon GDRs and CopyTele Shares
(collectively, the “Securities”) for a period of seven years, and therefore
restricting both parties from selling or transferring the Securities during such
period, CopyTele International and Mars Overseas entered into two Loan and
Pledge Agreements in November 2007. The Videocon GDRs are to be held
as security for a loan in principal amount of $5,000,000 from Mars Overseas to
CopyTele International, and the CopyTele Shares are similarly held as security
for a loan in principal amount of $5,000,000 from CopyTele International to Mars
Overseas. The loans are for a term of seven years and do not
bear interest. Prepayment of each loan requires payment of a premium
by the borrower and, in any event, the lien on the Securities securing the
prepaid loan will not be released until the seventh anniversary of the closing
of the loans and the prepaid amount would be held in escrow until such
date. The loan agreements required the parties to enter into an
escrow agreement under which the parties deposited the Securities with an escrow
agent for the term of the loans. The loan agreements also provide for
customary events of default which may result in forfeiture of the Securities by
the defaulting party. The loan and escrow agreements also provide for
the transfer to the respective parties, free and clear of any encumbrances under
the agreements, any dividends, distributions, rights or other proceeds or
benefits received by the escrow agent in respect of the
Securities. The closing of the loans took place in December
2007. The loan receivable from Mars Overseas is classified as a
contra-equity under Shareholders’ Equity in the accompanying consolidated
balance sheet,
because
the loan
receivable is secured by the CopyTele Shares and the Subscription Agreement and
Loan and Pledge Agreement were entered into concurrently.
F-10
COPYTELE, INC.
AND SUBSIDIARIES
NOTES TO
CONSOLIDATED FINANCIAL STATEMENTS
2.
SUMMARY OF SIGNIFICANT ACCOUNTING POLICIES
Basis of
Presentation
The
consolidated financial statements include the accounts of CopyTele, Inc. and its
wholly owned subsidiaries, CopyTele International and CopyTele Marketing Inc.
(“CopyTele Marketing”). CopyTele International and CopyTele
Marketing were incorporated in the British Virgin Islands on July 12,
2007 and September 5, 2007, respectively. CopyTele International was
formed for the purpose of holding an investment in global depository receipts of
Videocon. As of October 31, 2009, CopyTele Marketing is
inactive. All intercompany transactions have been eliminated in
consolidation.
Effective
October 31, 2009, we adopted Accounting Standards Codification (“ACS”) 105
“GAAP” (“ASC 105”) issued by the Financial Accounting Standards Board (“FASB”)
that establishes the ASC as the source of authoritative accounting principles to
be applied in the preparation of financial statements in conformity with
GAAP. Upon adoption, all existing accounting standards were
superseded and all other accounting literature not included in the ASC is now
considered non-authoritative. The adoption of ASC 105 had no impact
on our financial position or operating results as it only amends the referencing
to existing accounting standards (other than the Securities and Exchange
Commission (“SEC”) guidance).
Fair Value
Measurements
On
November 1, 2008, we adopted the FASB guidance for measurements and disclosures
of assets and liabilities that are recognized or disclosed at fair value on a
recurring basis (at least annually). Further FASB guidance delayed
the effective date of the fair value guidance for non-financial assets and
liabilities. We will adopt the fair value guidance for our
non-financial assets and liabilities in fiscal 2010. This fair value
guidance adopted is included in ASC 820 “Fair Value Measurements and
Disclosures” (“ASC 820”). ASC 820 defines fair value, establishes a
framework for measuring fair value under generally accepted accounting
principles, and expands disclosures about fair value measurements. In
accordance with ASC 820, we have categorized our financial assets, based on the
priority of the inputs to the valuation technique, into a three-level fair value
hierarchy as set forth below. We do not have any financial
liabilities that are required to be measured at fair value on a recurring
basis. If the inputs used to measure the financial instruments fall
within different levels of the hierarchy, the categorization is based on the
lowest level input that is significant to the fair value measurement of the
instrument.
Financial
assets recorded in the accompanying consolidated balance sheets are categorized
based on the inputs to the valuation techniques as follows:
Level 1 -
Financial assets whose values are based on unadjusted quoted prices for
identical assets or liabilities in an active market which we have the ability to
access at the measurement date (examples include active exchange-traded equity
securities and most U.S. Government and agency securities).
F-11
COPYTELE, INC.
AND SUBSIDIARIES
NOTES TO
CONSOLIDATED FINANCIAL STATEMENTS
Level 2 -
Financial assets whose values are based on quoted market prices in markets where
trading occurs infrequently or whose values are based on quoted prices of
instruments with similar attributes in active markets. We do not
currently have any Level 2 financial assets.
Level 3 –
Financial assets whose values are based on prices or valuation techniques that
require inputs that are both unobservable and significant to the overall fair
value measurement. These inputs reflect management’s own assumptions
about the assumptions a market participant would use in pricing the
asset. We do not currently have any Level 3 financial
assets.
As of
October 31, 2009, our Level 1 financial assets consist of the
following:
|
Fair
Value
as
of
October 31,
2009
|
||||
|
Money
market funds – Cash and cash equivalents
|
$ | 698,834 | ||
|
U.S.
government securities – Cash and cash equivalents
|
699,909 | |||
|
U.S.
government securities – Short-term investments
|
749,942 | |||
|
Videocon
Industries Limited global depository receipts
|
7,105,264 | |||
|
Digital
Info Security Co. Inc. common stock
|
198,030 | |||
The
adoption of this new guidance did not have a material effect on our consolidated
financial statements.
Revenue
Recognition
Revenues
from sales are recorded when all four of the following criteria are met: (i)
persuasive evidence of an arrangement exists; (ii) delivery has occurred and
title has transferred or services have been rendered; (iii) our price to the
buyer is fixed or determinable; and (iv) collectibility is reasonably
assured.
We have
assessed the revenue guidance of ASC 605-25 “Multiple-Element Arrangements” to
determine whether multiple deliverables in
our
arrangement
with Videocon
represent separate units of
accounting. Under the
License
Agreement,
CopyTele is required to: (a) disclose to Videocon the
Licensed
Technology and provide reasonable
training of Videocon personnel; (b) jointly cooperate with Videocon to produce
prototypes prior to production; and (c) assist Videocon in preparing for
production. CopyTele has determined that these performance
obligations do not have value to
Videocon
on a standalone basis, as defined in such accounting guidance, and accordingly
they do not represent separate units of accounting.
We have
established objective and reasonable
evidence of fair value for the royalty to be earned during the production period
based on analysis of the pricing for similar agreements.
Accordingly, we have
determined that the license
fee of $11 million to be paid during the pre-production period and royalties on
product sales reflects the established fair value for these
deliverables.
We
will recognize
the $11 million license fee over the estimated period that
we expect
to provide cooperation and assistance
during the pre-production period, limiting the revenue recognized on a
cumulative basis to the aggregate license fee payments received from
Videocon.
We
will assess at each
reporting period the progress and assistance provided and will continue to
evaluate the period during which this fee will be recognized.
On this basis, we
have recognized license fee
revenue during the years ended October 31, 2009 and 2008
of approximately $913,000 and $1,687,000,
respectively. License fee payments received from Videocon which are
in excess of the amounts recognized as revenue ($-0- as of
October 31, 2009, and approximately $313,000 as of October
31, 2008) are recorded as deferred revenue on the accompanying
consolidated
balance sheet.
F-12
COPYTELE, INC.
AND SUBSIDIARIES
NOTES TO
CONSOLIDATED FINANCIAL STATEMENTS
During
the quarter ended April 30, 2009, we modified the payment terms from Videocon
and we agreed to reimburse Videocon $250,000 for engineering services related to
another version of our display technology. The license fee revenue
recognized during the three months ended April 30, 2009 of $250,000 represented
an offset against amounts due to Videocon for the aforementioned
engineering services, in lieu of a cash payment. In addition, in June
2009, we received a license fee payment from Videocon of $250,000, which was due
during the quarter ended April 30, 2009 pursuant to the modified payment terms,
which was recognized as license fee revenue during the three months ended July
31, 2009. In August 2009, we received an additional license fee payment
from Videocon of $100,000, which was due during the quarter ended July 31, 2009
pursuant to the modified payment terms, which was recognized as revenue during
the three months ended October 31, 2009. We further modified the
payment terms from Videocon during the first quarter of fiscal 2010 for amounts
that were due during that quarter. The modifications
were made to allow Videocon’s payments to be more closely aligned
with the progress being made towards the optimization of the display
performance. While we have modified the timing of license fee
payments to be received from Videocon, the total license fee of $11 million
remains payable over the 27 month period, which commenced in May
2008. Videocon’s obligations with respect to the pre-production
phase, and CopyTele’s assistance, under the License Agreement remain
unaffected.
Warranty
Policy
We
warrant that our products are free from defects in material and workmanship for
a period of one year from the date of initial purchase. The warranty
does not cover any losses or damage that occur as a result of improper
installation, misuse or neglect. Management has recorded a nominal
amount of warranty liability as of October 31, 2009 and 2008, based upon
historical experience and management’s best estimate of future warranty
claims.
Statements of Cash
Flows
Cash and
cash equivalents consist of highly liquid instruments that are readily
convertible into cash and have original maturities of less than three
months. During the years ended October 31, 2009, 2008 and 2007, we
did not pay any cash for interest expense or U.S. federal or state income tax
purposes.
Short-term investments and
investments in U.S. government securities
Short-term investments represent
certificates of deposit and U.S. government securities with maturities of less
than twelve months. Noncurrent investments in U.S. government
securities represent securities with maturities of more than twelve
months. Each of the investments are carried at amortized cost as
management has the intention and ability to hold these to maturity.
Fair Value of Financial
Instruments
In the
opinion of management, the carrying value of all financial instruments,
consisting primarily of cash and cash equivalents, short-term investments,
accounts and other receivables and accounts payable, reflected in the
accompanying balance sheets, approximates fair value as of October 31, 2009 and
2008, due to their short term nature. Noncurrent investments in U.S. Government
securities approximates fair value as of October 31, 2008, based on current
market prices.
F-13
COPYTELE, INC.
AND SUBSIDIARIES
NOTES TO
CONSOLIDATED FINANCIAL STATEMENTS
Accounts
Receivable
Accounts
receivable are stated at amounts due from customers net of an allowance for
doubtful accounts. Management reviews our accounts receivable for
potential doubtful accounts and maintains an allowance for estimated
uncollectible amounts. Accounts receivable are written off when we
determine that they become uncollectible.
Inventories
Inventories
are stated at the lower of cost, including material, labor and overhead,
determined on a first-in, first-out basis, or market, which represents our best
estimate of market value. We regularly review inventory quantities on
hand, particularly finished goods, and record a provision for excess and
obsolete inventory based primarily on forecasts of future product
demand. To date, sales of our products have been
limited.
Property and Equipment
Property
and equipment, consisting primarily of engineering equipment, is stated at cost
less accumulated depreciation. Depreciation is calculated on a
straight-line basis over the estimated useful lives of the related assets,
primarily five years. Minor replacements and maintenance and repair
items are charged to expense as incurred. Upon disposal or retirement
of assets, the cost and related accumulated depreciation are removed from our
consolidated balance sheet. Depreciation expense for the years ended
October 31, 2009, 2008 and 2007 was approximately $11,000, $11,000 and $10,000,
respectively.
Investment
Securities
We
classify our investment securities in one of two categories: available-for-sale
or held-to-maturity. Available-for-sale securities are recorded at
fair value. Unrealized gains and losses, net of the related tax
effect, on available-for-sale securities are excluded from earnings and are
reported as a component of accumulated other comprehensive income (loss) until
realized. Realized gains and losses from the sale of
available-for-sale securities are determined on a specific identification
basis. Held-to-maturity securities, which are investment securities
that the company has the intent and ability to hold to maturity, are carried at
amortized cost. The amortization of premiums and accretion of
discounts are recorded on the level yield (interest) method, over the period
from the date of purchase to maturity. When sales do occur, gains and
losses are recognized at the time of sale and the determination of cost of
securities sold is based upon the specific identification
method. Dividend and interest income are recognized when
earned.
We
monitor the value of our investments for indicators of impairment, including
changes in market conditions and the operating results of the underlying
investment that may result in the inability to recover the carrying value of the
investment. During the fourth quarter of fiscal 2009, we determined
that there was an other than temporary impairment in both our Videocon and
Digital Info Security Co. Inc. (“DISC”) investments. See Note 4 for
further discussion. We will record an additional impairment charge if
and when we believe any such investment has experienced an additional decline
that is other than temporary.
F-14
COPYTELE, INC.
AND SUBSIDIARIES
NOTES TO
CONSOLIDATED FINANCIAL STATEMENTS
Operating
Leases
The
Company recognizes rent expense from operating leases with periods of free and
scheduled rent increases on a straight-line basis over the applicable lease
term. The Company considers lease renewals in the useful life of its
leasehold improvements when such renewals are reasonably
assured.
Long-Lived
Assets
The
Company reviews long-lived assets for impairment whenever events or changes in
circumstances indicate that the carrying amount may not be recoverable.
When such events or changes in circumstances occur, a recoverability test is
performed comparing projected undiscounted cash flows from the use and eventual
disposition of an asset or asset group to its carrying value. If the
projected undiscounted cash flows are less than the carrying value, an
impairment would be recorded for the excess of the carrying value over the fair
value, which is determined by discounting future cash flows.
Research
and Development Expenses
Research
and development expenses are expensed in the year incurred.
Advertising
Expense
Advertising
expense is included in the accompanying statements of operations in selling,
general and administrative expenses in the year incurred. Advertising
expense for the years ended October 31, 2009, 2008 and 2007, was approximately
$5,000, $3,000, and $2,000, respectively.
Income
Taxes
We
recognize deferred tax assets and liabilities for the estimated future tax
effects of events that have been recognized in our financial statements or tax
returns. Under this method, deferred tax assets and liabilities are determined
based on the difference between the financial statement and tax bases of assets
and liabilities using enacted tax rates in effect in the years in which the
differences are expected to reverse. A valuation allowance is
established, when necessary, to reduce deferred tax assets to the amount
expected to be realized.
Stock-Based
Compensation
We
maintain stock equity incentive plans under which we may grant non-qualified
stock options, incentive stock options, stock appreciation rights, stock awards,
performance and performance-based awards, or stock units to employees,
non-employee directors and consultants.
Stock Option Compensation
Expense
We
account for stock options granted to employees and directors using the
accounting guidance included in ASC 718 “Stock Compensation” (“ASC
718”). We recognize compensation expense for stock option awards on a
straight-line basis over the requisite service period of the
grant. We recorded stock-based compensation expense, related to stock
options granted to employees and non-employee directors, of approximately
$2,418,000, $2,614,000 and $1,081,000 during the years ended October
31, 2009, 2008 and 2007, respectively, in accordance with ASC
718. Such compensation expense is included in the accompanying
statements of operations in either research and development expenses or selling,
general and administrative expenses, as applicable based on the functions
performed by such employees and directors. Such stock-based
compensation expense increased both basic and diluted net loss per share for the
years ended October 31, 2009, 2008 and 2007 by $0.02, $0.02 and $0.01,
respectively.
F-15
COPYTELE, INC.
AND SUBSIDIARIES
NOTES TO
CONSOLIDATED FINANCIAL STATEMENTS
Included
in the stock-based compensation cost related to stock options granted to
employees and directors recorded during the years ended October 31, 2009, 2008
and 2007 was approximately $34,000, $-0- and $26,000, respectively, of expense
related to the amortization of compensation cost for stock options granted in
prior periods but not yet vested. As of October 31, 2009, there was
approximately $24,000 of unrecognized compensation cost related to non-vested
share-based compensation arrangements for stock options granted to employees and
directors.
We
account for stock options granted to consultants using the accounting guidance
under ASC 505-50 “Equity-Based Payments to Non-Employees”. We
recognized consulting expense for options granted to non-employee consultants,
during the years ended October 31, 2009, 2008 and 2007, of approximately
$13,000, $217,000 and $-0-, respectively. Such consulting expense is
included in the accompanying consolidated statements of operations in either
research and development expenses or selling, general and administrative
expenses, as applicable based on the functions performed by such
consultants. As of October 31, 2009, there was no such unrecognized
consulting expense related to non-vested share-based compensation arrangements
for stock options granted to consultants which is expected to be amortized
during fiscal 2010.
Fair Value
Determination
In
accordance with ASC 718, we estimate the fair value of stock options granted to
employees, non-employee directors and consultants on the date of grant using the
Black-Scholes pricing model. We separate the individuals we grant
stock options to into three relatively homogenous groups, based on exercise and
post-vesting employment termination behaviors. To determine the
weighted average fair value of stock options on the date of grant, we take a
weighted average of the assumptions used for each of these groups. Stock options
we granted during the years ended October 31, 2009 and October 31, 2008
consisted of awards of stock options with 10-year terms which vested either
immediately or over future periods of from three months to three
years. All of the stock options we granted during the year ended
October 31, 2007, consisted of awards of stock options with either 5-year terms,
which vested over one year, or 10-year terms, which vested
immediately.
The
per-share weighted-average grant date fair value of stock options granted during
fiscal 2009, 2008 and 2007 was $0.33, $0.53 and $0.37,
respectively. The total intrinsic value of stock options exercised
during fiscal 2009, 2008 and 2007 was approximately $176,000, $797,000 and
$950,000, respectively.
We
estimated the fair value of stock option awards using the following
assumptions:
|
For
the Year Ended October 31,
|
|||||
|
2009
|
2008
|
2007
|
|||
|
Weighted
average expected term (in years)
|
2.8
|
3.4
|
3.0
|
||
|
Weighted
average volatility
|
105%
|
90%
|
92%
|
||
|
Average
risk-free interest rate
|
1.19%
|
3.07%
|
4.64%
|
||
|
Average
dividend yield
|
0
|
0
|
0
|
||
F-16
COPYTELE, INC.
AND SUBSIDIARIES
NOTES TO
CONSOLIDATED FINANCIAL STATEMENTS
The
expected term of stock options represents the weighted average period the stock
options are expected to remain outstanding. Because we consider our
options to be “plain vanilla”, we estimated the expected term using a modified
version of the simplified method of calculation, as prescribed by Staff
Accounting Bulletin No. 107, “Share-Based Payment” (“SAB 107”). This
modified calculation uses the actual life for options that have been settled,
and a uniform distribution assumption for the options still
outstanding. Under SAB 107, options are considered to be “plain
vanilla” if they have the following basic characteristics: granted
“at-the-money”; exercisability is conditioned upon service through the vesting
date; termination of service prior to vesting results in forfeiture; limited
exercise period following termination of service; and options are
non-transferable and non-hedgeable. In December 2007, the Securities
and Exchange Commission (“SEC”) staff issued Staff Accounting Bulletin No. 110,
“Share-Based Payment” (“SAB 110”). SAB 110 permits the use of the
simplified method in SAB 107 for employee option grants after December 31, 2007
for companies whose historical data about their employees’ exercise behavior
does not provide a reasonable basis for estimating the expected term of the
options. We have adopted SAB 110 and continued to use the simplified
method to estimate the expected term for options granted after December 2007, as
adequate historical experience is not available to provide a reasonable
estimate. We intend to continue applying the simplified method until
enough historical experience is readily available to provide a reasonable
estimate of the expected term for employee option grants.
We
estimated the expected volatility of our shares of common stock based upon the
historical volatility of our share price over a period of time equal to the
expected life of the options.
We
estimated the risk-free interest rate based on the implied yield available on
the applicable grant date of a U.S. Treasury note with a term equal to the
expected term of the underlying grants.
We made
the dividend yield assumption based on our history of not paying dividends and
our expectation not to pay dividends in the future.
Under ASC
718, the amount of stock-based compensation expense recognized is based on the
portion of the awards that are ultimately expected to
vest. Accordingly, we reduce the fair value of the stock
option awards for expected forfeitures, which are forfeitures of the unvested
portion of surrendered options. We estimated expected forfeitures
based on our historical experience.
We will
reconsider use of the Black-Scholes pricing model if additional information
becomes available in the future that indicates another model would be more
appropriate, or if grants issued in future periods have characteristics that
cannot be reasonably estimated using this model. If factors change and we employ
different assumptions in the application of ASC 718 in future periods, the
compensation expense that we record under ASC 718 may differ significantly from
what we have recorded in the current period.
Net Loss Per Share
of Common Stock
In
accordance with ASC 260, “Earnings Per Share”, basic net loss per common share
(“Basic EPS”) is computed by dividing net loss by the weighted average number of
common shares outstanding. Diluted net loss per common share (“Diluted EPS”) is
computed by dividing net loss by the weighted average number of common shares
and dilutive common share equivalents and convertible securities then
outstanding. Diluted EPS for all years presented is the same as Basic
EPS, as the inclusion of the effect of common share equivalents then outstanding
would be anti-dilutive. For this reason, excluded from the
calculation of Diluted EPS for the years ended October 31, 2009, 2008 and 2007,
were options to purchase 20,510,511 shares, 19,768,511 shares and
19,272,711 shares, respectively, and for the year ended October 31, 2009,
warrants to purchase 500,000 shares.
F-17
COPYTELE, INC.
AND SUBSIDIARIES
NOTES TO
CONSOLIDATED FINANCIAL STATEMENTS
Use of
Estimates
The
preparation of financial statements in conformity with accounting principles
generally accepted in the United States of America requires management to make
estimates and assumptions that affect the reported amounts of assets and
liabilities and disclosure of contingent assets and liabilities at the date of
the financial statements and the reported amounts of revenues and expenses
during the reporting period
. Estimates and assumptions
are used for, but not limited to, determining the allowance for doubtful
accounts, inventory obsolescence, depreciation lives, asset impairment
evaluations, tax assets and liabilities, license fee revenue, stock-based
compensation and other contingencies.
Actual results could
differ from those estimates.
Effect of Recently Issued
Pronouncements
In
December 2007, the FASB issued updated guidance for accounting for business
combinations, which is included in ASC 805 “Business Combinations” (“ASC
805”). The updated guidance better represents the economic value of a
business combination transaction. The changes to be effected with the
new guidance include, but are not limited to: (1) acquisition costs will be
recognized separately from the acquisition; (2) known contractual
contingencies at the time of the acquisition will be considered part of the
liabilities acquired measured at their fair value and all other contingencies
will be part of the liabilities acquired measured at their fair value only if it
is more likely than not that they meet the definition of a liability;
(3) contingent consideration based on the outcome of future events will be
recognized and measured at the time of the acquisition; (4) business
combinations achieved in stages (step acquisitions) will need to recognize the
identifiable assets and liabilities, as well as noncontrolling interests, in the
acquiree, at the full amounts of their fair values; and (5) a bargain
purchase (defined as a business combination in which the total acquisition-date
fair value of the identifiable net assets acquired exceeds the fair value of the
consideration transferred plus any noncontrolling interest in the acquiree) will
require that excess to be recognized as a gain attributable to the
acquirer. In April 2009, the FASB amended the guidance related to
contingencies in a business combinations, which is included in ASC 805-20
“Identifiable Assets and Liabilities, and Any Noncontrolling
Interest”. The amendment changes the provisions in ASC 805 for the
initial recognition and measurement, subsequent measurement and accounting, and
disclosures for assets and liabilities arising from contingencies in business
combinations. It further eliminates the distinction between
contractual and non-contractual contingencies, including the initial recognition
and measurement criteria in the updated business combinations guidance and
instead carries forward most of the provisions of the previous business
combinations guidance for acquired contingencies. ASC 805 is
effective for fiscal years and interim periods within those fiscal years
beginning on or after December 15, 2008. The adoption of ASC 805 on
November 1, 2009 is not expected to have a material effect on our consolidated
financial statements.
Effective
May 1, 2009, we adopted the FASB guidance on interim disclosures about fair
value of financial instruments. The updated guidance requires
entities to include disclosures regarding the fair value of financial
instruments and methods and significant assumptions used to estimate the fair
value in their interim financial statements. There were no changes to
the required annual disclosures. The fair value guidance regarding
the interim disclosures about fair value of financial instruments and the fair
value option for financial assets and liabilities is included in ASC 825
“Financial Instruments.” See Note 2, “Summary of Significant
Accounting Policies - Fair Value Measurements,” for the required annual
disclosures. Additionally, effective November 1, 2008, we adopted the FASB
guidance regarding the fair value option for financial assets and liabilities,
which permits entities to measure eligible financial instruments at fair
value. As we did not elect the fair value option for its financial
instruments (other than those already measured at fair value in accordance with
ASC 820), the adoption of this guidance did not have an impact on its
accompanying consolidated financial statements.
F-18
COPYTELE, INC.
AND SUBSIDIARIES
NOTES TO
CONSOLIDATED FINANCIAL STATEMENTS
Effective
May 1, 2009, we adopted the new FASB guidance on recognition and
presentation of other-than-temporary impairments. The guidance amends
the requirements for recognizing other-than-temporarily impaired debt securities
and revises the existing impairment model for such securities by modifying the
current intent and ability indicator in determining whether a debt security is
other-than-temporary impaired. This guidance is included in ASC 320
“Investments” (“ASC 320”). It also modifies the presentation of
other-than-temporary impairment losses and increases the frequency of and
expands required disclosures about other-than-temporary impairment for debt and
equity securities. The adoption of this guidance did not have a
material effect on our consolidated financial statements.
Effective
July 31, 2009, we adopted the new FASB guidance on subsequent events, which
is included in ASC 855 “Subsequent Events.” The objective of this
guidance is to establish general standards of accounting for and disclosure of
events that occur after the balance sheet date but before financial statements
are issued. This statement introduces the concept of financial
statements being available to be issued. It requires the disclosure
of the date through which an entity has evaluated subsequent events and the
basis for that date. The adoption of this guidance did not have a
material effect on our consolidated financial statements.
3.
CONCENTRATION OF CREDIT
RISK
Financial
instruments that potentially subject us to concentrations of credit risk consist
principally of accounts receivable from sales in the ordinary course of
business. Management reviews our accounts receivable and other
receivables for potential doubtful accounts and maintains an allowance for
estimated uncollectible amounts. Generally, no collateral is received
from customers for our accounts receivable. Our policy is to
write-off uncollectable amounts at the time it is determined that collection
will not occur. During fiscal 2009, one customer in the Display
Technology Segment represented 87% of total net revenue. During
fiscal 2008, one customer in the Display Technology Segment represented 82% of
total net revenue. During fiscal 2007, two customers in the
Encryption Products and Services Segment represented 49% and 29%, respectively,
of total net revenue. At October 31, 2008, one customer in the
Encryption Products and Services Segment represented 100% of net accounts
receivable.
4.
INVESTMENTS
Short-term investments and
investments in U.S. Government Securities
At
October 31, 2009 and 2008, we had marketable securities that were classified as
“held–to-maturity securities” and were carried at amortized
costs. Held-to-maturity securities consist of the
following:
F-19
COPYTELE, INC.
AND SUBSIDIARIES
NOTES TO
CONSOLIDATED FINANCIAL STATEMENTS
|
October
31,
2009
|
October
31,
2008
|
|||||||
|
Current:
|
||||||||
|
U.S.
Government securities
|
$ | 749,942 | $ | 999,484 | ||||
|
Certificates
of deposit
|
- | 443,000 | ||||||
|
Total
current held-to-maturity securities
|
$ | 749,942 | $ | 1,442,484 | ||||
|
Noncurrent:
|
||||||||
|
U.S.
Government securities
|
$ | - | $ | 749,711 | ||||
|
Total
noncurrent held-to-maturity securities
|
$ | - | $ | 749,711 | ||||
|
Total
held-to-maturity securities
|
$ | 749,942 | $ | 2,192,195 | ||||
At
October 31, 2009, the length of time until maturity of current held-to-maturity
securities was less than twelve months. At October 31, 2009 and
October 31, 2008, the estimated fair value of each investment approximated its
amortized cost, and, therefore, there were no significant unrecognized holding
gains or losses.
Investment in
Videocon
Our
investment in Videocon is classified as an "available-for-sale security" and
reported at fair value, with unrealized gains and losses excluded from
operations and reported as component of accumulated other comprehensive loss,
net of related tax effects, in shareholders’ equity. Cost is
determined using the specific identification method. The fair value
of the Videocon GDRs is based on the price on the Luxembourg Stock Exchange,
which price is based on the underlying price of Videocon’s equity
shares which are traded on stock exchanges in India with prices quoted in
rupees.
ASC 320
and SEC guidance on other than temporary impairments of certain investments in
equity securities requires an evaluation to determine if the decline in fair
value of an investment is either temporary or other than
temporary. Unless evidence exists to support a realizable value equal
to or greater than the cost of the investment, a write-down accounted for as a
realized loss should be recorded.
We
assess at each reporting period our investment in Videocon to determine if a
decline that is other than temporary has occurred. In evaluating our
investment in Videocon at October 31, 2009, although we noted that the fair
value had increased by approximately $3,485,000 during fiscal 2009 from
approximately $3,620,000 at October 31, 2008 to approximately $7,105,000 at
October 31, 2009, we determined that based on both the duration and the
continuing magnitude of the market price decline compared to cost and the
uncertainty of its recovery, a write-down of the investment of approximately
$9,095,000 should be recorded as of October 31, 2009.
The cost,
unrealized loss, realized loss and fair value of our investment in
Videocon as of October 31, 2009 and 2008, are as follows:
|
October
31,
2009
|
October
31,
2008
|
|||||||
|
Cost
|
$ | 16,200,000 | $ | 16,200,000 | ||||
|
Unrealized
loss
|
- | (12,580,055 | ) | |||||
|
Other
than temporary impairment
|
(9,094,736 | ) | - | |||||
|
Fair
Value
|
$ | 7,105,264 | $ | 3,619,945 | ||||
F-20
COPYTELE, INC.
AND SUBSIDIARIES
NOTES TO
CONSOLIDATED FINANCIAL STATEMENTS
Investment in Digital
Security Co. Inc.
Our
investment in Digital Security Co. Inc. (“DISC”) is classified as an
“available-for-sale security” and reported at fair value, with unrealized gains
and losses excluded from operations and reported as a component of accumulated
other comprehensive loss, net of the related tax effects, in shareholders’
equity. Cost is determined using the specific identification
method. We assess at each reporting period our investment in DISC to
determine if a decline that is other than temporary has occurred. In
evaluating our investment in DISC at October 31, 2009 we determined that, due to
the decline in market value and the uncertainty of its recoverability, an other
than temporary impairment of the investment of approximately $124,000 should be
recorded as of October 31, 2009. During the year ended October 31,
2009 we received proceeds on the sale of DISC common stock of approximately
$60,000, and recorded losses on such sales of approximately
$34,000.
The cost,
unrealized loss, realized gain and fair value of our investment in
DISC as of October 31, 2009 and 2008, are as follows:
|
October
31,
2009
|
October
31,
2008
|
|||||||
|
Cost
|
$ | 322,266 | $ | 417,000 | ||||
|
Unrealized
gain
|
- | 424,800 | ||||||
|
Other
than temporary impairment
|
(124,236 | ) | - | |||||
|
Fair
Value
|
$ | 198,030 | $ | 841,800 | ||||
Net
revenue for the year ended October 31, 2007 included billings to DISC for
engineering services of $240,000. We had no net revenue relating to
DISC for the years ended October 31, 2009 and October 31, 2008.
Investment in Volga-Svet,
Ltd
In
September 2009, we entered into a Technology License Agreement with Volga, a
privately held Russia corporation, to produce and market our thin, flat, low
voltage phosphor displays in Russia. We have been working with Volga
for the past twelve years to assist us with our low voltage phosphor
displays. As part of our Technology License Agreement with Volga, it
is required to purchase from us the matrix substrate, carbon nanotubes, and
associated display electronics. In addition, in September 2009, we
acquired a 19.9% ownership interest in Volga in exchange for 150,000
unregistered shares of our common stock. As we do not believe that we
can exercise significant influence over Volga, our investment in Volga is
recorded at cost of $127,500, based on the closing price of our common stock at
the time of the acquisition. As of October 31, 2009, we have not
identified any events or changes in circumstances that may have a significant
adverse effect on the fair value of the investment.
Investment in ZQX Advisors,
LLC
In August
2009, we entered into an Engagement Agreement with ZQX Advisors, LLC (“ZQX”) to
assist us in seeking business opportunities and licenses for our electrophoretic
display technology. Concurrently with entering into the Engagement
Agreement, we acquired a 19.5% ownership interest in ZQX and they agreed to
attempt to locate business opportunities and licenses for our
technology. In exchange for the 19.5% ownership interest and related
services, we issued 800,000 unregistered shares of common stock as well as
warrants to purchase an additional 500,000 unregistered shares of common stock,
half of which are exercisable at $0.37 per share and the other half at $0.555
per share to ZQX. The warrants are exercisable at any time after August
19, 2010 and expire on August 19, 2019. The total fair value of the common
stock and warrants was approximately $468,000. We recognized
approximately $377,000 of this amount as consulting expense in the accompanying
consolidated financial statements since the two other owners of ZQX did not
contribute any assets to ZQX but instead have agreed to seek business
opportunities and licenses for our electrophoretic display technology. In
addition, we have classified our remaining ownership interest of $91,000 in ZQX
as a reduction of additional paid-in capital within Shareholders’ Equity since
this investment in ZQX consists entirely of our equity securities.
F-21
COPYTELE, INC.
AND SUBSIDIARIES
NOTES TO
CONSOLIDATED FINANCIAL STATEMENTS
5.
INVENTORIES
Inventories
consist of the following as of:
|
October
31,
|
||||||||
|
2009
|
2008
|
|||||||
|
Component
parts
|
$ | 45,969 | $ | 67,853 | ||||
|
Work-in-process
|
- | 5,079 | ||||||
|
Finished
products
|
86,719 | 105,212 | ||||||
| $ | 132,688 | $ | 178,144 | |||||
6.
ACCRUED
LIABILITIES
Accrued
liabilities consist of the following as of:
|
October
31,
|
||||||||
|
2009
|
2008
|
|||||||
|
Accrued
professional fees
|
$ | 20,000 | $ | 18,451 | ||||
|
Accrued
payroll and related expenses
|
35,695 | 35,545 | ||||||
|
Accrued
other
|
14,236 | 15,368 | ||||||
| $ | 69,931 | $ | 69,364 | |||||
7.
SHAREHOLDERS’
EQUITY
Common Stock
Issuances
We
account for stock grants to employees and consultants based on their grant date
fair value. During the years ended October 31, 2009, 2008 and 2007,
we issued 5,800,545 shares, 2,142,400 shares and 2,528,365 shares, respectively,
of common stock to certain employees for services rendered, principally in lieu
of cash compensation, pursuant to the CopyTele, Inc. 2003 Share Incentive Plan
(the “2003 Share Plan”). We recorded compensation expense for the
years ended October 31, 2009, 2008 and 2007 of approximately $2,099,000,
$1,877,000 and $1,735,000, respectively, for shares of common stock issued to
employees. In addition during fiscal 2009, 2008 and 2007, we issued
154,090 shares, 89,966 shares and 240,325 shares, respectively, of common stock
to consultants for services rendered pursuant to the 2003 Share
Plan. We recorded consulting expense for the years ended October 31,
2009, 2008 and 2007 of approximately $48,000, $95,000 and $182,000,
respectively, for shares of common stock issued to consultants.
In August
2009, we issued to ZQX 800,000 shares of unregistered common stock together with
warrants to purchase a total of 500,000 shares of common stock, of which (a)
warrants to purchase 250,000 of the shares of common stock are exercisable at a
price of $0.37 per share, and (b) warrants to purchase the remaining 250,000 of
the shares are exercisable at a price of $0.555 per share. The
warrants are exercisable at any time after August 19, 2010 and expire on August
19, 2019. In addition, in September 2009, we issued 150,000 shares,
of unregistered common stock to Volga in exchange for a 19.9% interest in
Volga. During the year ended October 31, 2008, we issued 20,000,000
shares of unregistered common stock to Mars Overseas in exchange for
cash. During the year ended October 31, 2007, we issued 300,000
shares, of unregistered common stock to acquire Digital Info Security Co., Inc.
common stock.
F-22
COPYTELE, INC.
AND SUBSIDIARIES
NOTES TO
CONSOLIDATED FINANCIAL STATEMENTS
Preferred Stock
On May
29, 1986, our shareholders authorized 500,000 shares of preferred stock with a
par value of $100 per share. The shares of preferred stock may be
issued in series at the direction of the Board of Directors, and the relative
rights, preferences and limitations of such shares will all be determined by the
Board of Directors. As of October 31, 2009 and 2008, there was no
preferred stock issued and outstanding.
Stock Option Plans
As of
October 31, 2009, we have three stock option plans: the CopyTele, Inc. 1993
Stock Option Plan (the “1993 Plan”), the CopyTele 2000 Share Incentive Plan (the
“2000 Share Plan”) and the 2003 Share Plan, which were adopted by our Board of
Directors on April 28, 1993, May 8, 2000 and April 21, 2003,
respectively.
On
July 14, 1993, our shareholders approved the 1993 Plan. The 1993 Plan
was amended as of May 3, 1995 and May 10, 1996 to, among other things, increase
the number of shares available for issuance thereunder from 6,000,000 shares to
20,000,000 shares, after giving consideration to stock splits. The
1993 Plan provided for the granting of incentive stock options and stock
appreciation rights to key employees, and non-qualified stock options and stock
appreciation rights to key employees and consultants of the
Company.
The 1993
Plan was administered by the Stock Option Committee, which determined the option
price, term and provisions of each option. However, the purchase
price of shares issuable upon the exercise of incentive stock options could not
be less than the fair market value of such shares at the date of grant and
incentive stock options are not exercisable for more than 10
years. Upon approval of the 2000 Share Plan by our shareholders in
July 2000, the 1993 Plan was terminated with respect to the grant of future
options. Since June 2004, the 1993 Plan has been administered by the
Board of Directors.
F-23
COPYTELE, INC.
AND SUBSIDIARIES
NOTES TO
CONSOLIDATED FINANCIAL STATEMENTS
Information
regarding the 1993 Plan for the three years ended October 31, 2009 is as
follows:
|
Shares
|
Weighted
Average
Exercise
Price
Per Share
|
Aggregate
Intrinsic
Value
|
||||||
|
Options
Outstanding at October 31, 2006
|
4,167,000 | $ 3.13 | ||||||
|
Expired
|
(1,553,000 | ) | $ 4.46 | |||||
|
Options
Outstanding at October 31, 2007
|
2,614,000 | $ 2.33 | ||||||
|
Expired
|
(1,830,000 | ) | $ 2.86 | |||||
|
Exercised
|
(5,000 | ) | $ 1.31 | |||||
|
Options
Outstanding at October 31, 2008
|
779,000 | $ 1.10 | ||||||
|
Expired
|
(50,000 | ) | $ 1.31 | |||||
|
Cancelled
|
(43,000 | ) | $ 1.31 | |||||
|
Options
Outstanding and Exercisable at October 31, 2009
|
686,000 | $ 1.07 |
$-0-
|
|||||
The
following table summarizes information about stock options outstanding under the
1993 Plan as of October 31, 2009:
| Options Outstanding and Exercisable | |||
|
Range
of
Exercise
Prices
|
Number
Outstanding
|
Weighted
Average
Remaining
Contractual
Life
|
Weighted
Average
Exercise
Price
|
|
$0.84
to $1.00
|
575,000
|
0.04
|
$0.99
|
|
$1.13
to $1.56
|
111,000
|
0.54
|
$1.49
|
The
exercise price with respect to all of the options granted under the 1993 Plan,
since its inception, was equal to the fair market value of the underlying common
stock at the grant date.
On July
25, 2000, our shareholders approved the 2000 Share Plan. The maximum
number of shares of common stock that may be granted was 5,000,000
shares. On July 6, 2001 and July 16, 2002, the 2000 Share Plan was
amended by our Board of Directors to increase the maximum number of shares of
common stock that may be granted to 10,000,000 shares and 15,000,000 shares,
respectively. These amendments were approved by our shareholders on
August 16, 2001 and September 12, 2002, respectively. The 2000 Share
Plan provides for the grant of incentive stock options, nonqualified stock
options, stock appreciation rights, stock awards, performance awards and stock
units to key employees and consultants of the Company.
The 2000
Share Plan was administered by the Stock Option Committee through June 2004 and
since that date has been administered by the Board of Directors, which
determines the option price, term and provisions of each option; however, the
purchase price of shares issuable upon the exercise of incentive stock options
will not be less than the fair market value of such shares at the date of grant
and incentive stock options will not be exercisable for more than 10
years.
F-24
COPYTELE, INC.
AND SUBSIDIARIES
NOTES TO
CONSOLIDATED FINANCIAL STATEMENTS
Information
regarding the 2000 Share Plan for the three years ended October 31, 2009 is as
follows:
|
Shares
|
Weighted
Average
Exercise
Price
Per Share
|
Aggregate
Intrinsic
Value
|
||||||
|
Options
Outstanding at October 31, 2006
|
2,268,466 | $ 0.80 | ||||||
|
Exercised
|
(86,000 | ) | $ 0.39 | |||||
|
Options
Outstanding at October 31, 2007
|
2,182,466 | $ 0.82 | ||||||
|
Exercised
|
(410,000 | ) | $ 0.95 | |||||
|
Options
Outstanding at October 31, 2008
|
1,772,466 | $ 0.79 | ||||||
|
Exercised
|
(200,000 | ) | $ 0.40 | |||||
|
Options
Outstanding and Exercisable at
October
31, 2009
|
1,572,466 | $ 0.84 |
$46,550
|
|||||
The
following table summarizes information about stock options outstanding under the
2000 Share Plan as of October 31, 2009:
|
Options
Outstanding & Exercisable
|
|||
|
Range
of
Exercise
Prices
|
Number
Outstanding
|
Weighted
Average
Remaining
Contractual
Life
|
Weighted
Average
Exercise
Price
|
|
$0.40
|
245,000
|
1.88
|
$0.40
|
|
$0.69
|
505,466
|
1.17
|
$0.69
|
|
$0.94
- $1.09
|
822,000
|
0.92
|
$1.06
|
The
exercise price with respect to all of the options granted under the 2000 Share
Plan since its inception, was equal to the fair market value of the underlying
common stock at the grant date. As of October 31, 2009, 21,508 shares
were available for future grants under the 2000 Share Plan.
The 2003
Share Plan provides for the grant of nonqualified stock options, stock
appreciation rights, stock awards, performance awards and stock units to key
employees and consultants of the Company. The maximum number of
shares of common stock available for issuance under the 2003 Share Plan
initially was 15,000,000 shares. On October 8, 2004, February 9,
2006, August 22, 2007 and December 3, 2008, the 2003 Plan was amended
by our Board of Directors to increase the maximum number of shares of common
stock that may be granted to 30,000,000 shares, 45,000,000 shares, 55,000,000
shares and 70,000,000 shares, respectively. Current and future
non-employee directors are automatically granted nonqualified stock options to
purchase 60,000 shares of common stock upon their initial election to the Board
of Directors and at the time of each subsequent annual meeting of our
shareholders at which they are elected to the Board of Directors. The
2003 Share Plan was administered by the Stock Option Committee through June 2004
and since that date has been administered by the Board of Directors, which
determines the option price, term and provisions of each option.
F-25
COPYTELE, INC.
AND SUBSIDIARIES
NOTES TO
CONSOLIDATED FINANCIAL STATEMENTS
Information
regarding the 2003 Share Plan for the three years ended October 31, 2009 is as
follows:
|
Shares
|
Current
Weighted
Average
Exercise
Price
Per Share
|
Aggregate
Intrinsic
Value
|
||||||
|
Options
Outstanding at October 31, 2006
|
16,092,475 | $ 0.68 | ||||||
|
Granted
|
2,880,000 | $ 0.66 | ||||||
|
Exercised
|
(4,496,230 | ) | $ 0.47 | |||||
|
Options
Outstanding at October 31, 2007
|
14,476,245 | $ 0.74 | ||||||
|
Expired
|
(60,000 | ) | $ 0.84 | |||||
|
Granted
|
5,740,000 | $ 0.88 | ||||||
|
Exercised
|
(2,939,200 | ) | $ 0.72 | |||||
|
Options
Outstanding at October 31, 2008
|
17,217,045 | $ 0.79 | ||||||
|
Expired
|
(60,000 | ) | $ 1.07 | |||||
|
Granted
|
7,255,000 | $ 0.54 | ||||||
|
Exercised
|
(4,960,000 | ) | $ 0.38 |
|
||||
|
Forfeited
|
(1,200,000 | ) | $ 0.91 | |||||
|
Options
Outstanding at October 31, 2009
|
18,252,045 | $ 0.80 |
$396,450
|
|||||
|
Options
Exercisable at October 31, 2009
|
18,142,045 | $ 0.80 |
$396,450
|
|||||
The
following table summarizes information about stock options outstanding under the
2003 Share Plan as of October 31, 2009:
| Options Outstanding | Options Exercisable | |||||||||||||||||||||||||
|
Range
of
Exercise
Prices
|
Number
Outstanding
|
Weighted
Average
Remaining
Contractual
Life
|
Weighted
Average
Exercise
Price
|
Number
Exercisable
|
Weighted
Average
Remaining
Contractual
Life
|
Weighted
Average
Exercise
Price
|
||||||||||||||||||||
| $ 0.25 - $0.65 | 5,225,970 | 5.33 | $ 0.54 | 5,165,970 | 5.33 | $ 0.54 | ||||||||||||||||||||
| $ 0.70 - $0.84 | 5,231,075 | 6.87 | $ 0.79 | 5,181,075 | 6.86 | $ 0.79 | ||||||||||||||||||||
| $ 0.86 - $1.46 | 7,795,000 | 7.25 | $ 0.97 | 7,795,000 | 7.25 | $ 0.97 | ||||||||||||||||||||
The
exercise price with respect to all of the options granted under the 2003 Share
Plan since its inception, was equal to the fair market value of the underlying
common stock at the grant date. As of October 31, 2009, 5,483,086
shares were available for future grants under the 2003 Share Plan.
8.
COMMITMENTS AND
CONTINGENCIES
Leases
We lease
space at our principal location for office and laboratory research
facilities. The current lease is for approximately 12,000 square feet
and expires on November 30, 2011. The lease contains base rentals of
approximately $288,000 per annum with a 3% annual increase and an
escalation clause for increases in certain operating costs. As of
October 31, 2009, our noncancelable operating lease commitments are
approximately $296,000, $305,000 and $25,000 for the years ended October 31,
2010, 2011 and 2012, respectively.
F-26
COPYTELE, INC.
AND SUBSIDIARIES
NOTES TO
CONSOLIDATED FINANCIAL STATEMENTS
Rent
expense for the years ended October 31, 2009, 2008 and 2007, was
approximately $288,000, $278,000 and $269,000,
respectively.
Litigation
Matters
We are
not a party to any material pending legal proceedings. We are party
to claims, and complaints that arise in the ordinary course of business.
We believe that any liability that may ultimately result from the resolution of
these matters will not, individually or in the aggregate, have a material
adverse effect on our financial position or results of operations.
Consulting
Agreement
As of October 31, 2009, we have
commitments of $127,500 under a consulting agreement with Volga, payable during
the first quarter of fiscal 2010.
9.
EMPLOYEE PENSION PLAN
We
adopted a qualified noncontributory defined contribution pension plan, effective
November 1, 1983, covering all of our present
employees. Contributions, which are made to a trust and have been
funded on a current basis, are based upon specified percentages of compensation,
as defined in the plan. During fiscal 2001, we amended the plan to
suspend benefit accruals as of November 1, 2000. Accordingly, we did
not incur any pension expense for the fiscal years ended October 31, 2009, 2008
and 2007.
10.
INCOME
TAXES
Income
tax provision (benefit) consists of the following:
|
Year
Ended October 31,
|
||||||||||||
|
2009
|
2008
|
2007
|
||||||||||
|
Federal:
|
||||||||||||
|
Current
|
$ | - | $ | - | $ | - | ||||||
|
Deferred
|
(417,000 | ) | 1,953,000 | (1,505,000 | ) | |||||||
|
State:
|
||||||||||||
|
Current
|
- | - | - | |||||||||
|
Deferred
|
3,000 | 1,392,000 | 4,393,000 | |||||||||
|
Adjustment
to valuation allowance related
to
net deferred tax assets
|
414,000 | (3,345,000 | ) | (2,888,000 | ) | |||||||
| $ | - | $ | - | $ | - | |||||||
F-27
COPYTELE, INC.
AND SUBSIDIARIES
NOTES TO
CONSOLIDATED FINANCIAL STATEMENTS
The tax
effects of temporary differences that give rise to significant portions of the
deferred tax asset, net, at October 31, 2009 and 2008, are as
follows:
|
2009
|
2008
|
|||||||
|
Long-term
deferred tax assets:
|
||||||||
|
Federal
and state NOL and tax credit carryforwards
|
$ | 32,640,000 | $ | 32,734,000 | ||||
|
Unrealized
gain on available for sale securities
|
- | (145,000 | ) | |||||
|
Deferred
Compensation
|
2,167,000 | 1,710,000 | ||||||
|
Other
|
303,000 | 252,000 | ||||||
|
Subtotal
|
35,110,000 | 34,551,000 | ||||||
|
Less:
valuation allowance
|
(35,110,000 | ) | (34,551,000 | ) | ||||
|
Deferred tax asset,
net
|
$ | - | $ | - | ||||
As of
October 31, 2009, we had tax net operating loss and tax credit carryforwards of
approximately $90,428,000 and $1,734,000, respectively, available, within
statutory limits (expiring at various dates between 2010 and 2029), to offset
any future regular Federal corporate taxable income and taxes
payable. If the tax benefits relating to deductions of option
holders’ income are ultimately realized, those benefits will be credited
directly to additional paid-in capital. Certain changes in stock
ownership can result in a limitation on the amount of net operating loss and tax
credit carryovers that can be utilized each year.
We had
tax net operating loss and tax credit carryforwards of approximately $90,392,000
and $107,000, respectively, as of October 31, 2009, available, within statutory
limits, to offset future New York State corporate taxable income and taxes
payable, if any, under certain computations of such taxes. The tax
net operating loss carryforwards expire at various dates between 2010 and 2029
and the tax credit carryforwards expire between 2010 and 2024.
We have
provided a valuation allowance against our deferred tax asset due to our current
and historical pre-tax losses and the uncertainty regarding their
realizability. The primary differences from the Federal statutory
rate of 34% and the effective rate of 0% is attributable to certain permanent
differences and a change in the valuation allowance. The following is
a reconciliation of income taxes at the Federal statutory tax rate to income tax
expense (benefit):
|
Year
Ended October 31,
|
|||||||||||||||||||||
|
2009
|
2008
|
2007
|
|||||||||||||||||||
|
Income
tax benefit at U.S.
Federal
statutory income
tax
rate
|
$ | (5,606,000 | ) | (34 | %) | $ | (2,012,000 | ) | (34 | %) | $ | (1,854,000 | ) | (34 | %) | ||||||
|
State
income taxes
|
(4,000 | ) | (.02 | %) | (4 ,000 | ) | (.07 | %) | (88,000 | ) | (1.62 | %) | |||||||||
|
Permanent
differences
|
392,000 | 2.38 | % | 304,000 | 5.14 | % | (228,000 | ) | (4.19 | %) | |||||||||||
|
Credits
|
(90,000 | ) | (.54 | %) | (119,000 | ) | (2.02 | %) | (117,000 | ) | (2.15 | %) | |||||||||
|
Expiring
net operating
losses and
credits
|
1,803,000 | 10.93 | % | 3,798,000 | 64.19 | % | 728,000 | 13.35 | % | ||||||||||||
|
Change
in New York State
tax
rate
|
- | - | 1,378,000 | 23.29 | % | 4,447,000 | 81.56 | % | |||||||||||||
|
Foreign
rate difference on
impairment
|
3,091,000 | 18.75 | % | - | - | - | - | ||||||||||||||
|
Change
in valuation
allowance
|
414,000 | 2.50 | % | (3,345,000 | ) | (56.53 | %) | (2,888,000 | ) | (52.95 | %) | ||||||||||
|
Income
tax provision
|
$ | - | 0 | % | $ | - | 0 | % | $ | - | 0 | % | |||||||||
F-28
COPYTELE, INC.
AND SUBSIDIARIES
NOTES TO
CONSOLIDATED FINANCIAL STATEMENTS
During
the three years ended October 31, 2009, we incurred no Federal and no State
income taxes. We account for interest and penalties related to income
tax matters in selling, general and administrative expenses.
We
previously reported a $4,140,000 unrealized loss on available for sale
securities as a long-term deferred tax asset offset by a valuation allowance
resulting in a net deferred tax asset of $0 reported in our consolidated balance
sheet at October 31, 2008. In the current year, it was determined
that the tax effect of the unrealized loss on available for sale securities
should have been $0, since the investment in Videocon was held by CopyTele
International, our wholly-owned British Virgin Islands subsidiary, and the tax
rate applied should have been 0% as compared to the Federal statutory rate of
34% which was used. Accordingly, we have removed the tax effect and the
offsetting valuation allowance related to the unrealized loss on available for
sale securities at October 31, 2008. We believe that the adjustment is
immaterial as it had no impact on our consolidated balance sheet as of October
31, 2008 or the related consolidated statements of operations, shareholders’
equity and cash flows for the year ended October 31, 2008.
On
November 1, 2007, we adopted the FASB guidance for accounting for uncertainties
in income taxes recognized in an enterprise’s financial
statements. This accounting guidance is included in ACS 740 “Income
Taxes”. There were no unrecognized tax benefits as of the date of our
adoption of this guidance and as of October 31, 2009. The adoption of
this guidance did not have a material effect on our consolidated financial
statements.
11.
SEGMENT
INFORMATION
We follow
the accounting guidance of ASC 280 “Segment Reporting” (“ASC 280”)
. Reportable operating segments are determined based on management’s
approach. The management approach, as defined by ASC 280, is based on
the way that the chief operating decision-maker organizes the segments within an
enterprise for making operating decisions and assessing
performance. While our results of operations are primarily reviewed
on a consolidated basis, the chief operating decision-maker also manages the
enterprise in two segments: (i) Display Technology and (ii) Encryption Products
and Services. The following represents selected financial information
for our segments for the years ended October 31, 2009, 2008 and
2007:
F-29
COPYTELE, INC.
AND SUBSIDIARIES
NOTES TO
CONSOLIDATED FINANCIAL STATEMENTS
|
Segment
Data
|
Display
Technology
|
Encryption
Products
and
Services
|
Total
|
|||||||||
|
Year
Ended October 31, 2009:
|
||||||||||||
|
Net
revenue
|
$ | 965,332 | $ | 90,465 | $ | 1,055,797 | ||||||
|
Impairment
in value of available
for
sale securities
|
(9,094,736 | ) | (124,236 | ) | (9,218,972 | ) | ||||||
|
Net
loss
|
(12,386,178 | ) | (4,102,837 | ) | (16,489,015 | ) | ||||||
|
Stock
option compensation to
employees
and consultants
|
1,053,654 | 1,377,632 | 2,431,286 | |||||||||
|
Stock
awards granted to
employees
and consultants
pursuant
to stock incentive
plans
|
856,278 | 1,291,570 | 2,147,848 | |||||||||
|
Total
assets
|
8,163,754 | 1,684,692 | 9,848,446 | |||||||||
|
Investment
in Videocon
|
7,105,264 | - | 7,105,264 | |||||||||
|
Investment
in DISC
|
- | 198,030 | 198,030 | |||||||||
|
Investment
in Volga-Svet
|
127,500 | - | 127,500 | |||||||||
|
Additions
to property and
equipment
|
789 | 1,174 | 1,936 | |||||||||
|
Year
Ended October 31, 2008:
|
||||||||||||
|
Net
revenue
|
$ | 1,686,668 | $ | 376,455 | $ | 2,063,123 | ||||||
|
Net
loss
|
(2,424,638 | ) | (3,396,966 | ) | (5,821,604 | ) | ||||||
|
Stock
option compensation to
employees
and consultants
|
1,479,494 | 1,351,133 | 2,830,627 | |||||||||
|
Stock
awards granted to
employees
and consultants
pursuant
to stock incentive
plans
|
891,013 | 1,081,841 | 1,972,854 | |||||||||
|
Total
assets
|
4,926,222 | 2,571,647 | 7,497,869 | |||||||||
|
Investment
in Videocon
|
3,619,945 | - | 3,619,945 | |||||||||
|
Investment
in DISC
|
- | 841,800 | 841,800 | |||||||||
|
Additions
to property and
equipment
|
6,568 | 7,285 | 13,853 | |||||||||
|
Year
Ended October 31, 2007:
|
||||||||||||
|
Net
revenue
|
$ | - | $ | 486,852 | $ | 486,852 | ||||||
|
Net
loss
|
(2,932,179 | ) | (2,526,039 | ) | (5,458,218 | ) | ||||||
|
Stock
option compensation to
employees
and consultants
|
499,688 | 581,194 | 1,080,882 | |||||||||
|
Stock
awards granted to
employees
and consultants
pursuant
to stock incentive
plans
|
800,119 | 1,116,927 | 1,917,046 | |||||||||
|
Total
assets
|
547,409 | 1,322,750 | 1,870,159 | |||||||||
|
Investment
in DISC
|
- | 417,000 | 417,000 | |||||||||
|
Additions
to property and
equipment
|
6,456 | 7,003 | 13,459 | |||||||||
F-30
COPYTELE, INC.
AND SUBSIDIARIES
NOTES TO
CONSOLIDATED FINANCIAL STATEMENTS
Geographic Information
We
generate revenue both domestically (United States) and
internationally. International revenue is based on the country in
which our customer (distributor) is located. For the years ended
October 31, 2009, 2008 and 2007, and as of each respective year-end, revenue and
accounts receivable by geographic area are as follows:
|
Geographic
Data
|
2009
|
2008
|
2007
|
|||||||||
|
Net
revenue:
|
||||||||||||
|
United
States
|
$ | 73,925 | $ | 121,030 | $ | 447,940 | ||||||
|
Singapore
|
- | 206,000 | - | |||||||||
|
Russia
|
52,720 | - | - | |||||||||
|
Other
International
|
15,820 | 49,425 | 38,912 | |||||||||
|
India
|
913,332 | 1,686,668 | - | |||||||||
| $ | 1,055,797 | $ | 2,063,123 | $ | 486,852 | |||||||
|
Accounts
receivable, net:
|
||||||||||||
|
United States
|
$ | 750 | $ | - | $ | 120,000 | ||||||
|
International
|
- | 103,000 | - | |||||||||
| $ | 750 | $ | 103,000 | $ | 120,000 | |||||||
12.
QUARTERLY RESULTS
(UNAUDITED)
The
following table sets forth unaudited financial data for each of our last eight
fiscal quarters:
|
First
Quarter
|
Second
Quarter
|
Third
Quarter
|
Fourth
Quarter
|
|||||||||||||
|
Year
Ended October 31, 2009:
|
||||||||||||||||
|
Statement of Operations
Data:
|
||||||||||||||||
|
Net
revenue
|
$ | 374,122 | $ | 262,750 | $ | 299,765 | $ | 119,160 | ||||||||
|
Cost and operating
expenses
|
1,756,114 | 1,640,979 | 1,490,066 | 3,488,956 | ||||||||||||
|
Impairment
in value of available for
sale
securities
|
- | - | - | (9,218,972 | ) | |||||||||||
|
Net loss
|
(1,374,710 | ) | (1,344,151 | ) | (1,185,764 | ) | (12,584,390 | ) | ||||||||
|
Net loss per share of common
stock-
basic
and diluted
|
$ | (0.01 | ) | $ | (0.01 | ) | $ | (0.01 | ) | $ | (0.09 | ) | ||||
|
Year
Ended October 31, 2008:
|
||||||||||||||||
|
Statement of Operations
Data:
|
||||||||||||||||
|
Net
revenue
|
$ | 52,225 | $ | 165,355 | $ | 882,130 | $ | 963,413 | ||||||||
|
Cost and operating
expenses
|
2,744,757 | 2,143,467 | 1,623,512 | 1,540,905 | ||||||||||||
|
Net loss
|
(2,685,325 | ) | (1,841,351 | ) | (729,166 | ) | (565,762 | ) | ||||||||
|
Net loss per share of common
stock-
basic
and diluted
|
$ | (0.02 | ) | $ | (0.01 | ) | $ | (0.01 | ) | $ | (0.00 | ) | ||||
F-31
VALUATION
AND QUALIFYING ACCOUNTS
FOR THE
FISCAL YEARS ENDED OCTOBER 31, 2009, 2008 AND 2007
|
Column
A
|
Column
B
|
Column
C
|
Column
D
|
Column
E
|
||||||||||||
|
Additions
|
||||||||||||||||
|
Description
|
Balance
at
beginning
of period
|
Charged
to costs
and
expenses
|
Deductions
(1)
|
Balance
at
end
of period
|
||||||||||||
|
2009
|
||||||||||||||||
|
Allowance
for doubtful accounts
|
$ | 223,000 | $ | 103,000 | $ | (120,000 | ) | $ | 206,000 | |||||||
|
Reserve
against other receivables
|
$ | - | $ | - | $ | - | $ | - | ||||||||
|
2008
|
||||||||||||||||
|
Allowance
for doubtful accounts
|
$ | - | $ | 223,000 | $ | - | $ | 223,000 | ||||||||
|
Reserve
against other receivables
|
$ | 171,798 | $ | 6,000 | $ | ( 177,798 | ) | $ | - | |||||||
|
2007
|
||||||||||||||||
|
Allowance
for doubtful accounts
|
$ | - | $ | - | $ | - | $ | - | ||||||||
|
Reserve
against other receivables
|
$ | 171,798 | $ | - | $ | - | $ | 171,798 | ||||||||
|
(1)
|
Represents
write-offs to reserved balances or reductions in allowances previously
provided.
|
This
schedule should be read in conjunction with the accompanying financial
state
S-1
Exhibit
Index
|
|
3.1
|
Certificate
of Incorporation, as amended. (Incorporated by reference to
Form 10-Q for the fiscal quarter ended July 31, 1992 and to Form 10-Q for
the fiscal quarter ended July 31,
1997.)
|
|
|
3.2
|
Amended
and Restated By-laws. (Incorporated by reference to Exhibit 3.2
to our Form 8-K dated August 4,
2008.)
|
|
|
4.1
|
Common
Stock Purchase Warrant issued to ZQX Advisors, LLC on August 20, 2009
(filed herewith)
|
|
|
4.2
|
Common
Stock Purchase Warrant issued to ZQX Advisors, LLC on August 20, 2009
(field herewith)
|
|
|
10.1
|
CopyTele,
Inc. 1993 Stock Option Plan, adopted on April 28, 1993 and approved by
shareholders on July 14, 1993. (Incorporated by reference to
Proxy Statement dated June 10,
1993.)
|
|
|
10.2
|
Amendment
No. 1 to the CopyTele, Inc. 1993 Stock Option Plan, adopted on May 3, 1995
and approved by shareholders on July 19, 1995. (Incorporated by
reference to Form S-8 (Registration No. 33-62381) dated September 6,
1995.)
|
|
|
10.3
|
Amendment
No. 2 to the CopyTele, Inc. 1993 Stock Option Plan, adopted on May 10,
1996 and approved by shareholders on July 24,
1996. (Incorporated by reference to Form 10-Q for the fiscal
quarter ended April 30, 1996.)
|
|
|
10.4
|
Agreement
dated March 3, 1999 between Harris Corporation and CopyTele,
Inc. (Incorporated by reference to Form 10-Q for the fiscal
quarter ended January 31, 1999.)
|
|
|
10.5
|
Agreement
dated July 28, 1999, among CopyTele, Inc., Harris Corporation and RF
Communications. (Incorporated by reference to Form 8-K dated
July 28, 1999.)
|
|
|
10.6
|
CopyTele,
Inc. 2000 Share Incentive Plan. (Incorporated by reference to
Annex A of our Proxy Statement dated June 12,
2000.)
|
|
|
10.7
|
Amendment
No. 1 to the CopyTele, Inc. 2000 Share Incentive Plan, adopted on July 6,
2001 and approved by shareholders on August 16,
2001. (Incorporated by reference to Form 10-Q for the fiscal
quarter ended July 31, 2001.)
|
|
|
10.8
|
Amendment
No. 2 to the CopyTele, Inc. 2000 Share Incentive Plan, adopted on July 16,
2002 and approved by shareholders on September 12,
2002. (Incorporated by reference to Exhibit 4(e) to our Form
S-8 (Registration No. 333-99717) dated September 18,
2002.)
|
|
|
10.9
|
Amendment,
dated May 10, 2001, to the Joint Cooperation Agreement between CopyTele,
Inc. and Volga Svet Ltd. (Incorporated by reference to Exhibit
10.14 to our Form 10-K for the fiscal year ended October 31,
2001.)
|
|
|
10.10
|
Letter
Agreement between CopyTele, Inc. and Volga Svet Ltd., dated as of February
1, 2002. (Incorporated by reference to Exhibit 10.15 to our
Form 10-K for the fiscal year ended October 31,
2001.)
|
|
|
10.11
|
CopyTele,
Inc. 2003 Share Incentive Plan. (Incorporated by reference to Exhibit 4 to
our Form S-8 dated May 5, 2003).
|
|
|
10.12
|
Amendment
No. 1 to the CopyTele, Inc. 2003 Share Incentive Plan. (Incorporated by
reference to Exhibit 4(e) to our Form S-8 dated November 9,
2004.)
|
|
|
10.13
|
Amendment
No. 2 to the CopyTele, Inc. 2003 Share Incentive Plan. (Incorporated by
reference to Exhibit 10.1 to our Quarterly Report on Form 10-Q for the
fiscal quarter ended January 31,
2005).
|
|
|
10.14
|
Amendment
No. 3 to the CopyTele, Inc. 2003 Share Incentive Plan. (Incorporated by
reference to Exhibit 10.2 to our Quarterly Report on Form 10-Q for the
fiscal quarter ended January 31,
2005).
|
|
|
10.15
|
Form
of Stock Option Agreement under CopyTele, Inc. 2003 Share Incentive Plan.
(Incorporated by reference to Exhibit 10.1 to our Quarterly Report on Form
10-Q for the fiscal quarter ended July 31,
2004).
|
|
|
10.16
|
Form
of Stock Award Agreement under CopyTele, Inc. 2003 Share Incentive Plan.
(Incorporated by reference to Exhibit 10.2 to our Quarterly Report on Form
10-Q for the fiscal quarter ended July 31,
2004).
|
|
|
10.17
|
Long
Term Agreement dated May 23, 2007, between The Boeing Company and
CopyTele, Inc. (Incorporated by reference to Exhibit 10.1 to our Form 8-K
dated May 23, 2007.)
|
|
|
10.18
|
Amended
and Restated Technology License Agreement, dated May 16, 2008, between
CopyTele, Inc. and Videocon Industries Limited. (Incorporated by reference
to Exhibit 10.1 to our Quarterly Report on Form 10-Q for the fiscal
quarter ended July 31, 2008.)
|
|
|
10.19
|
Loan
and Pledge Agreement, dated November 2, 2007, Between Mars Overseas
Limited and CopyTele International Ltd. (Incorporated by reference to
Exhibit 10.5 to our Quarterly Report on Form 10-Q for the fiscal quarter
ended January 31, 2008.)
|
|
|
10.20
|
Loan
and Pledge Agreement, dated November 2, 2007, Between CopyTele
International Ltd. and Mars Overseas Limited. (Incorporated by reference
to Exhibit 10.6 to our Quarterly Report on Form 10-Q for the fiscal
quarter ended January 31, 2008.)
|
|
|
21
|
Subsidiaries
of CopyTele, Inc. (Incorporated by reference to Exhibit 21 to
our Annual Report on Form 10-K for the fiscal year ended October 31,
2009.)
|
|
|
23.1
|
Consent
of KPMG LLP. (Filed
herewith.)
|
|
|
23.2
|
Consent
of Grant Thornton LLP. (Filed
herewith.)
|
|
|
31.1
|
Certification
of Chief Executive Officer, pursuant to Section 302 of the Sarbanes-Oxley
Act of 2002, dated January 29, 2010. (Filed
herewith.)
|
|
|
31.2
|
Certification
of Chief Financial Officer, pursuant to Section 302 of the Sarbanes-Oxley
Act of 2002, dated January 29, 2010. (Filed
herewith.)
|
|
|
32.1
|
Statement
of Chief Executive Officer, pursuant to Section 1350 of Title 18 of the
United States Code, dated January 29, 2010. (Filed
herewith.)
|
|
|
32.2
|
Statement
of Chief Financial Officer, pursuant to Section 1350 of Title 18 of the
United States Code, dated January 29, 2010. (Filed
herewith.)
|
TABLE OF CONTENTS
Part IItem 1. BusinessItem 1A. Risk FactorsItem 1B. Unresolved Staff CommentsItem 2. PropertiesItem 3. Legal ProceedingsItem 4. Submission Of Matters To A Vote Of Security HoldersPart IIItem 5. Market For The Registrant S Common Equity, Related Stockholder Matters and Issuer Purchases Of Equity SecuritiesItem 6. Selected Financial DataItem 7. Management S Discussion and Analysis Of Financial Condition and Results Of OperationsItem 7A. Quantitative and Qualitative Disclosures About Market RiskItem 8. Financial Statements and Supplementary DataItem 9. Changes in and Disagreements with Accountants on Accounting and Financial DisclosureItem 9A. Controls and ProceduresItem 9a(t). Controls and ProceduresItem 9B. Other InformationPart IIIItem 10. Directors, Executive Officers and Corporate GovernanceItem 11. Executive CompensationItem 12. Security Ownership Of Certain Beneficial Owners and Management and Related Stockholder MattersItem 13. Certain Relationships and Related Transactions, and Director IndependenceItem 14. Principal Accountant Audit Fees and ServicesPart IVItem 15. Exhibits, Financial Statement SchedulesItem 15 (a)(2)