ANTHEM, INC.
10-Ks and 10-Qs
|
|
|
|
|
|
|
|
|
|
|
|
|
|
|
|
|
|
|
|
|
|
|
|
|
|
|
|
|
|
|
|
|
|
|
|
|
|
|
|
|
|
|
|
|
|
|
|
|
|
|
|
|
|
|
|
|
|
|
UNITED STATES
SECURITIES AND EXCHANGE COMMISSION
Washington, D.C. 20549
FORM 10-K
(Mark One)
|
x
|
ANNUAL REPORT PURSUANT TO SECTION 13 OR 15(d) OF THE
SECURITIES EXCHANGE ACT OF 1934
|
For the fiscal year ended
December 31, 2014
OR
|
o
|
TRANSITION REPORT PURSUANT TO SECTION 13 OR 15(d) OF THE
SECURITIES EXCHANGE ACT OF 1934
|
For the transition period from to
Commission file number: 001-16751
ANTHEM, INC.
(Exact name of registrant as specified in its charter)
|
INDIANA
|
|
35-2145715
|
|
(State or other jurisdiction of
incorporation or organization)
|
|
(I.R.S. Employer Identification Number)
|
|
120 MONUMENT CIRCLE
INDIANAPOLIS, INDIANA
(Address of principal executive offices)
|
|
46204
(Zip Code)
|
Registrant’s telephone number, including area code:
(317) 488-6000
Securities registered pursuant to Section 12(b) of the Act:
|
Title of each class
|
|
Name of each exchange on which registered
|
|
Common Stock, Par Value $0.01
|
|
New York Stock Exchange
|
Securities registered pursuant to Section 12(g) of the Act: NONE
Indicate by check mark if the Registrant is a well-known seasoned issuer, as defined in Rule 405 of the Securities Act. Yes
x
No
¨
Indicate by check mark if the Registrant is not required to file reports pursuant to Section 13 or Section 15(d) of the Act. Yes
¨
No
x
Indicate by check mark whether the Registrant (1) has filed all reports required to be filed by Section 13 or 15(d) of the Securities Exchange Act of 1934 during the preceding 12 months (or for such shorter period that the registrant was required to file such reports), and (2) has been subject to such filing requirements for the past 90 days. Yes
x
No
¨
Indicate by check mark whether the registrant has submitted electronically and posted on its corporate Web site, if any, every Interactive Data File required to be submitted and posted pursuant to Rule 405 of Regulation S-T (§232.405 of this chapter) during the preceding 12 months (or for such shorter period that the registrant was required to submit and post such files). Yes
x
No
¨
Indicate by check mark if disclosure of delinquent filers pursuant to Item 405 of Regulation S-K (§229.405 of this chapter) is not contained herein, and will not be contained, to the best of registrant’s knowledge, in definitive proxy or information statements incorporated by reference in Part III of this Form 10-K or any amendment to this Form 10-K.
x
Indicate by check mark whether the registrant is a large accelerated filer, an accelerated filer, a non-accelerated filer or a smaller reporting company. See the definitions of “large accelerated filer”, “accelerated filer”, and “smaller reporting company” in Rule 12b-2 of the Exchange Act. (Check one):
Large accelerated filer
x
Accelerated filer
¨
Non-accelerated filer
¨
(Do not check if a smaller reporting company Smaller reporting company
¨
Indicate by check mark whether the registrant is a shell company (as defined in Rule 12b-2 of the Exchange Act). Yes
¨
No
x
The aggregate market value of the voting and non-voting common equity held by non-affiliates of the registrant (assuming solely for the purposes of this calculation that all Directors and executive officers of the registrant are “affiliates”) as of June 30, 2014 was approximately $
29,462,836,859
.
As of February 5, 2015,
266,787,463
shares of the Registrant’s Common Stock were outstanding.
DOCUMENTS INCORPORATED BY REFERENCE
Part III of this Annual Report on Form 10-K incorporates by reference information from the registrant’s Definitive Proxy Statement for the Annual Meeting of Shareholders to be held May 13, 2015.
Anthem, Inc.
Annual Report on Form 10-K
For the Year Ended
December 31, 2014
Table of Contents
|
ITEM 1.
|
||
|
ITEM 1A.
|
||
|
ITEM 1B.
|
||
|
ITEM 2.
|
||
|
ITEM 3.
|
||
|
ITEM 4.
|
||
|
ITEM 5.
|
||
|
ITEM 6.
|
||
|
ITEM 7.
|
||
|
ITEM 7A.
|
||
|
ITEM 8.
|
||
|
ITEM 9.
|
||
|
ITEM 9A.
|
||
|
ITEM 9B.
|
||
|
ITEM 10.
|
||
|
ITEM 11.
|
||
|
ITEM 12.
|
||
|
ITEM 13.
|
||
|
ITEM 14.
|
||
|
ITEM 15.
|
||
-
1
-
This Annual Report on Form 10-K, including Management’s Discussion and Analysis of Financial Condition and Results of Operations, contains forward-looking statements, within the meaning of the Private Securities Litigation Reform Act of 1995, that reflect our views about future events and financial performance. When used in this report, the words “may,” “will,” “should,” “anticipate,” “estimate,” “expect,” “plan,” “believe,” “feel,” “predict,” “project,” “potential,” “intend” and similar expressions are intended to identify forward-looking statements, which are generally not historical in nature. Forward-looking statements include, but are not limited to, financial projections and estimates and their underlying assumptions; statements regarding plans, objectives and expectations with respect to future operations, products and services; and statements regarding future performance. Forward-looking statements are subject to known and unknown risks and uncertainties, many of which are difficult to predict and generally beyond our control, that could cause actual results to differ materially from those expressed in, or implied or projected by, the forward-looking information and statements. You are cautioned not to place undue reliance on these forward-looking statements that speak only as of the date hereof. You are also urged to carefully review and consider the various disclosures made by us, which attempt to advise interested parties of the factors that affect our business, including “Risk Factors” set forth in Part I, Item 1A hereof and our reports filed with the U.S. Securities and Exchange Commission, or SEC, from time to time. Except to the extent otherwise required by federal securities laws, we do not undertake any obligation to republish revised forward-looking statements to reflect events or circumstances after the date hereof or to reflect the occurrence of unanticipated events.
On November 5, 2014, the shareholders of the Company approved a proposal to amend our articles of incorporation to change our name to Anthem, Inc. from WellPoint, Inc. The name change was effective December 2, 2014. References in this Annual Report on Form 10-K to the terms “we,” “our,” “us,” “Anthem” or the “Company” refer to Anthem, Inc., an Indiana corporation, and, unless the context otherwise requires, its direct and indirect subsidiaries.
-
2
-
PART I
ITEM 1. BUSINESS.
General
We are one of the largest health benefits companies in terms of medical membership in the United States, serving
37.5 million
medical members through our affiliated health plans as of
December 31, 2014
.
We are an independent licensee of the Blue Cross and Blue Shield Association, or BCBSA, an association of independent health benefit plans. We serve our members as the Blue Cross licensee for California and as the Blue Cross and Blue Shield, or BCBS, licensee for Colorado, Connecticut, Georgia, Indiana, Kentucky, Maine, Missouri (excluding
30
counties in the Kansas City area), Nevada, New Hampshire, New York (as BCBS in
10
New York City metropolitan and surrounding counties, and as Blue Cross or BCBS in selected upstate counties only), Ohio, Virginia (excluding the Northern Virginia suburbs of Washington, D.C.) and Wisconsin. In a majority of these service areas we do business as Anthem Blue Cross, Anthem Blue Cross and Blue Shield, Blue Cross and Blue Shield of Georgia, and Empire Blue Cross Blue Shield, or Empire Blue Cross (in our New York service areas). We also conduct business through arrangements with other BCBS licensees in the states of South Carolina and Texas. We conduct business through our AMERIGROUP Corporation, or Amerigroup, subsidiary, in Florida, Georgia, Kansas, Louisiana, Maryland, Nevada, New Jersey, New Mexico, New York, Tennessee, Texas and Washington. We also serve customers throughout the country as HealthLink, UniCare (including a non-risk arrangement with the state of Massachusetts), and in certain Arizona, California, Nevada, New York and Virginia markets through our CareMore Health Group, Inc., or CareMore, subsidiary. We are licensed to conduct insurance operations in all
50
states through our subsidiaries.
In February 2015, we reported that we were the target of a sophisticated external cyber attack. The attackers gained unauthorized access to certain of our information technology systems and obtained personal information related to many of our current and former members and employees. We are in the process of determining the extent of this cyber attack and are supporting federal law enforcement efforts to identify the responsible parties. For additional information about the cyber attack, see Note 13, “Commitments and Contingencies -
Data Breach
,” to our audited consolidated financial statements included in Part II, Item 8 of this Annual Report on Form 10-K.
On February 17, 2015, we completed our acquisition of Simply Healthcare Holdings, Inc., or Simply Healthcare, a leading managed care company for people enrolled in Medicaid and Medicare programs in the state of Florida. This acquisition, which was originally announced on December 22, 2014, aligns with our strategy for continued growth in our Government Business segment. As a result, we will, through our affiliated Medicaid and Medicare plans, serve more than half a million members in the state of Florida.
We have a vision of becoming America's valued health partner. Together we are transforming health care with trusted and caring solutions and as a result, we focus on delivering quality products and services that give members access to the care they need. With an unyielding commitment to meeting the needs of our diverse customers, we are guided by the following values:
•
Accountable
•
Caring
•
Easy to do business with
•
Innovative
•
Trustworthy
We offer a broad spectrum of network-based managed care plans to large and small employer, individual, Medicaid and Medicare markets. Our managed care plans include: preferred provider organizations, or PPOs; health maintenance organizations, or HMOs; point-of-service, or POS, plans; traditional indemnity plans and other hybrid plans, including consumer-driven health plans, or CDHPs; and hospital only and limited benefit products. In addition, we provide a broad array of managed care services to self-funded customers, including claims processing, underwriting, stop loss insurance, actuarial services, provider network access, medical cost management, disease management, wellness programs and other administrative services. We provide an array of specialty and other insurance products and services such as dental, vision, life
-
3
-
and disability insurance benefits, radiology benefit management and analytics-driven personal health care. We also provide services to the federal government in connection with the Federal Employee Program, or FEP. We also sold contact lenses, eyeglasses and other ocular products through our 1-800 CONTACTS, Inc., or 1-800 CONTACTS, business which was divested on January 31, 2014.
The increased focus on health care costs by employers, the government and consumers has continued to drive the growth of alternatives to traditional indemnity health insurance. HMO, PPO and hybrid plans, such as POS plans and CDHPs, are among the various forms of managed care products that have been developed. Through these types of products, insurers attempt to contain the cost of health care by negotiating contracts with hospitals, physicians and other providers to deliver high quality health care to members at favorable rates. These products usually feature medical management and other quality and cost optimization measures such as pre-admission review and approval for certain non-emergency services, pre-authorization of outpatient surgical procedures, network credentialing to determine that network doctors and hospitals have the required certifications and expertise, and various levels of care management programs to help members better understand and navigate the health care system. In addition, providers may have incentives to achieve certain quality measures, may share medical cost risk or may have other incentives to deliver quality medical services in a cost-effective manner. Also, certain plans offer members incentives for healthy behaviors, such as smoking cessation and weight management. Members are charged periodic, prepaid premiums and generally pay co-payments, coinsurance and/or deductibles when they receive services. While the distinctions between the various types of plans have lessened over recent years, PPO, POS and CDHP products generally provide reduced benefits for out-of-network services, while traditional HMO products generally provide little to no reimbursement for non-emergency out-of-network utilization, but often offer more generous benefit coverage. An HMO plan may also require members to select one of the network primary care physicians to coordinate their care and approve any specialist or other services.
Economic factors and greater consumer and employer sophistication and accountability have resulted in an increased demand for choice in both product/benefit designs and provider network configurations. As a result we continue to offer our broad access PPO networks with multiple benefit designs, but are also focused on leveraging our emerging provider collaboration initiatives with our Accountable Care Organization, or ACO, partnerships to develop both narrow and tiered network offerings. This array of network and product configurations allows both the employer and the employee to design and select the combination of benefit designs (e.g., traditional PPOs, high deductibles, HRAs, HSAs, gatekeeper based products, tiered copays) and networks (e.g., broad, narrow, tiered, closed and open) that optimize choice, quality and price at the consumer, employer and market level. We believe we are well-positioned in each of our states to respond to these market preferences.
For our fully-insured products, we charge a premium and assume all of the health care risk. Under self-funded and partially-insured products, we charge a fee for services, and the employer or plan sponsor reimburses us for all or most of the health care costs. In addition, we charge a premium to provide administrative services to Large Group employers that maintain self-funded health plans and we underwrite stop loss insurance for self-funded plans.
Our medical membership includes seven different customer types:
•
Local Group
•
Individual
•
National Accounts
•
BlueCard
®
•
Medicare
•
Medicaid
•
FEP
BCBS-branded business generally refers to members in our service areas licensed by the BCBSA. Non-BCBS-branded business refers to members in our non-BCBS-branded Amerigroup and CareMore plans, as well as HealthLink and UniCare members. In addition to the above medical membership, we also serve customers who purchase one or more of our other products or services that are often ancillary to our health business.
-
4
-
Our products are generally developed and marketed with an emphasis on the differing needs of our customers. In particular, our product development and marketing efforts take into account the differing characteristics between the various customers served by us, as well as the unique needs of educational and public entities, labor groups, federal employee health and benefit programs, national employers and state-run programs servicing low-income, high-risk and under-served markets. Each business unit is responsible for product design, pricing, enrolling, underwriting and servicing customers in specific customer types. Overall, we seek to establish pricing and product designs to provide value for our customers while achieving an appropriate level of profitability for each of our customer categories balanced with the competitive objective to grow market share. We believe that one of the keys to our success has been our focus on these distinct customer types, which better enables us to develop benefit plans and services that meet our customers’ unique needs.
We market our products through direct marketing activities and an extensive network of independent agents, brokers and retail partnerships for Individual and Medicare customers, and for certain Local Group customers with a smaller employee base. Products for National Accounts and Local Group customers with a larger employee base are generally sold through independent brokers or consultants retained by the customer and working with industry specialists from our in-house sales force.
In the Individual and Small Group markets, we offer on-exchange products through state or federally facilitated marketplaces, referred to as public exchanges; and off-exchange products. Federal premium subsidies are available only for certain members who purchase certain public exchange products.
Each of the BCBS member companies, of which there were 37 independent primary licensees as of
December 31, 2014
, works cooperatively in a number of ways that create significant market advantages, especially when competing for very large multi-state employer groups. As a result of this cooperation, each BCBS member company is able to take advantage of other BCBS licensees’ substantial provider networks and discounts when any BCBS member works or travels outside of the state in which their policy is written. This program is referred to as BlueCard® and is a source of revenue when we provide member services in the states where we are the BCBS licensee to individuals who are customers of BCBS plans not affiliated with us. This program also provides a national provider network for our members when they travel to other states.
For additional information describing each of our customer types, detailed marketing efforts and changes in medical membership over the last three years, see Part II, Item 7 “Management’s Discussion and Analysis of Financial Condition and Results of Operations” included in this Annual Report on Form 10-K.
Our results of operations depend in large part on accurately predicting health care costs and our ability to manage future health care costs through adequate product pricing, medical management, product design and negotiation of favorable provider contracts.
The aging of the population and other demographic characteristics and advances in medical technology continue to contribute to rising health care costs. Our managed care plans and products are designed to encourage providers and members to participate in quality, cost-effective health benefit programs by using the full range of our innovative medical management services, quality initiatives and financial incentives. Our significant market share and high business retention rates enable us to realize the long-term benefits of investing in preventive and early detection programs. Our ability to provide cost-effective health benefits products and services is enhanced through a disciplined approach to internal cost containment, prudent management of our risk exposure and successful integration of acquired businesses. In addition, our ability to manage selling, general and administrative costs continues to be a driver of our overall profitability.
Our future results of operations will also be impacted by certain external forces and resulting changes in our business model and strategy. In 2010, the Patient Protection and Affordable Care Act, or ACA, as well as the Health Care and Education Reconciliation Act of 2010, or collectively, Health Care Reform, became law, causing significant changes to the U.S. health care system. Since then, significant regulations have been enacted by the U.S. Department of Health and Human Services, or HHS, the Department of Labor and the Department of the Treasury.
The legislation and regulations are far-reaching and are intended to expand access to health insurance coverage over time by increasing the eligibility thresholds for most state Medicaid programs and providing certain other individuals and small businesses with tax credits to subsidize a portion of the cost of health insurance coverage.
As a result of the complexity of the law, its impact on health care in the United States and the continuing modification and interpretation of Health Care Reform rules, we continue to analyze and refine our estimates of the ultimate impact of Health Care Reform on our business, cash flows, financial condition and results of operations. Health Care Reform provides growth opportunities for health insurers, but also introduces new risks and
-
5
-
uncertainties, and required changes in the way products are designed, underwritten, priced, distributed and administered.
For additional discussion, see “Regulation,” herein and Part I, Item 1A “Risk Factors” in this Annual Report on Form 10-K.
In addition to the external forces discussed in the preceding
paragraph,
our results of operations are impacted by levels and mix of membership. In recent history, we experienced membership declines due to unfavorable economic conditions driving increased unemployment. In addition, we believe the self-insured portion of our group membership base will continue to increase as a percentage of total group membership.
These membership trends could have a material adverse effect on our future results of operations.
See Part I, Item 1A “Risk Factors” and Part II, Item 7 “Management’s Discussion and Analysis of Financial Condition and Results of Operations” included in this Annual Report on Form 10-K.
Private exchanges have recently gained significant visibility in the marketplace based on the promise of helping employers reduce costs, increase consumer engagement and manage the complexities created by the ACA and other market forces. While private exchanges have been a distribution channel in the Medicare and Individual markets for some time, the heightened level of activity and investment among the consulting and broker communities and other health insurance carriers has generated an increasing level of interest among employers in the Commercial market. To date, adoption levels have been lower than analyst predictions, but expectations for significant longer term growth remain. While the ultimate volume, pace of growth and winning business models remain highly uncertain, we believe private exchanges will provide opportunities for growth and will serve a significant role in our future strategy.
Our approach to the private exchange market has been broad-based and we believe we are well positioned to adapt with the market as it evolves. In 2011, we jointly acquired Bloom Health with Health Care Service Corporation and Blue Cross Blue Shield of Michigan, and today it offers this advanced consumer experience platform to employers as Anthem Health Marketplace. We also currently participate in four large national consultant-led exchanges, several regional broker-led exchanges and various individual, commercial and Medicare exchanges. Although overall private exchange activity has been limited, we have experienced positive membership gains among early adopters, reinforcing the strength of our market position and the value we deliver to employers and consumers. We will continue to assess this highly dynamic market, build out internal capabilities and enhance partnerships to ensure we are best positioned to capitalize on future growth.
We continue to believe health care is local and that we have the strong local presence required to understand and meet local customer needs. We believe we are well-positioned to deliver what customers want: innovative, choice-based and affordable products; distinctive service; simplified transactions; and better access to information for quality care. Our local presence, combined with our national expertise, has created opportunities for collaborative programs that reward physicians and hospitals for clinical quality and excellence. We feel that our commitment to health improvement and care management provides added value to customers and health care professionals. We believe that an essential ingredient for practical and sustainable improvements in health care is raising health care quality while managing costs for total cost affordability. We have identified initiatives that we believe will deliver better health care while reducing costs. These include driving innovation in paying and partnering with providers to compel improved cost, quality and health along with finding new, effective ways to manage risk and engage the member as a consumer. In addition, we seek to achieve efficiencies from our national scale while optimizing service performance for our customers. Finally, we seek to continue to rationalize our portfolio of businesses and products, and align our investments to capitalize on new opportunities to drive growth in both our existing and new markets in the future.
We continue to enhance interactions with customers, providers, brokers, agents, employees and other stakeholders through web-enabled technology and improving internal operations. Our approach includes not only sales and distribution of health benefits products on the Internet, but also implementation of advanced capabilities that improve services benefiting customers, agents, brokers, and providers while optimizing administrative costs. These enhancements can also help improve the quality, coordination and safety of health care through increased communications between patients and their physicians.
We intend to continue pursuing our vision of becoming America's valued health partner by transforming health care with trusted and caring solutions and by delivering quality products and services that give members access to the care they need. At the same time, we will focus on earnings per share, or EPS, growth through organic membership gains, improvements in our operating cost structure, strategic acquisitions and the efficient use of capital.
-
6
-
Significant Transactions
While Health Care Reform has caused significant changes to the U.S. health care system in recent years, the more significant transactions that have occurred over the last five years that have impacted or will impact our capital structure or that have or will influence how we conduct our business operations include:
|
•
|
Acquisition of Simply Healthcare (2015);
|
|
•
|
Use of Capital—Board of Directors declaration of dividends on common stock (2011 through 2014) and a 42.9% increase in the quarterly dividend to $0.6250 per share (2015); authorization for repurchases of our common stock (2014 and prior); and debt repurchases and new debt issuance (2014 and prior);
|
•
Acquisition of Amerigroup and the related debt issuance (2012);
•
Acquisition of 1-800 CONTACTS (2012) and subsequent divestiture (2014); and
|
•
|
Acquisition of CareMore (2011).
|
For additional information regarding certain of these transactions, see Note 3, “Business Acquisitions and Divestitures,” Note 12, “Debt,” and Note 14, “Capital Stock,” to our audited consolidated financial statements included in Part II, Item 8 of this Annual Report on Form 10-K.
Competition
The managed care industry is highly competitive, both nationally and in our local markets. Competition continues to be intense due to aggressive marketing, business consolidations, a proliferation of new products, the impact of Health Care Reform, and increased quality awareness and price sensitivity among customers.
Managed care industry participants compete for customers mainly on the following factors:
|
•
|
quality of service;
|
|
•
|
price;
|
|
•
|
access to provider networks;
|
|
•
|
access to care management and wellness programs, including health information;
|
|
•
|
innovation, breadth and flexibility of products and benefits;
|
|
•
|
reputation (including National Committee on Quality Assurance, or NCQA, accreditation status);
|
|
•
|
brand recognition; and
|
|
•
|
financial stability.
|
Over the last few years, a health plan’s ability to interact with employers, members and other third parties (including health care professionals) via the Internet has become a more important competitive factor, and we have made significant investments in technology to enhance our electronic interaction with providers, employers, members and third parties.
We believe our exclusive right to market products under the most recognized brand in the industry, BCBS, in our most significant markets provides us with an advantage over our competition. Our provider networks in our markets enable us to achieve efficiencies and distinctive service levels enabling us to offer a broad range of health benefits to our customers on a more cost-effective basis than many of our competitors. We strive to distinguish our products through provider access, service, care management, product value and brand recognition.
Pricing in our Commercial and Specialty Business segment
(defined below),
including our Individual and Small Group lines of business, remains competitive, but rational, and we strive to price our health care benefit products consistent with anticipated underlying medical trends. We believe our pricing strategy, based on predictive modeling, proprietary research and data-driven processes, as well as our overall investments for Health Care Reform, have positioned us to benefit from the potential growth opportunities available in fully-insured commercial products as a result of Health Care Reform.
While the ultimate level of public exchange enrollment cannot be predicted, we have experienced a greater number of policy
-
7
-
applications for new members through the public exchanges than expected, including geographical regions with lower price competition. The public exchanges may increase the risk that our products will be selected by individuals who have a higher risk profile or utilization rate than the pool of participants we anticipated when we established the pricing for these public exchange products. However, the risk characteristics of new applicants in 2014 tracked closely to the risk levels utilized in the development of our pricing assumptions. Although it is not yet clear whether our products sold on the public exchanges will be more or less profitable products, we believe that our pricing strategy, brand name and network quality will provide a strong foundation for commercial risk membership growth opportunities in the future.
To build our provider networks, we compete with other health benefits plans for the best contracts with hospitals, physicians and other providers. We believe that physicians and other providers primarily consider member volume, reimbursement rates, timeliness of reimbursement and administrative service capabilities along with the reduction of non-value added administrative tasks when deciding whether to contract with a health benefits plan.
At the sales and distribution level, we compete for qualified agents and brokers to recommend and distribute our products. Strong competition exists among insurance companies and health benefits plans for agents and brokers with demonstrated ability to secure new business and maintain existing accounts. We believe that the quality and price of our products, support services, reputation and prior relationships, along with a reasonable commission structure are the factors agents and brokers consider in choosing whether to market our products. We believe that we have good relationships with our agents and brokers, and that our products, support services and commission structure compare favorably to those of our competitors in all of our markets. Typically, we are the largest competitor in each of our Blue-branded markets and, thus, are a closely watched target by other insurance competitors.
Reportable Segments
We currently manage our operations through three reportable segments: Commercial and Specialty Business, Government Business and Other. We regularly evaluate the appropriateness of our reportable segments, particularly in light of organizational changes, merger and acquisition activity and changing laws and regulations. Therefore, these reportable segments may change in the future.
Our Commercial and Specialty Business and Government Business segments both offer a diversified mix of managed care products, including PPOs, HMOs, traditional indemnity benefits and POS plans, as well as a variety of hybrid benefit plans including CDHPs, hospital only and limited benefit products.
Our Commercial and Specialty Business segment includes our Local Group, National Accounts, Individual and Specialty businesses. Business units in the Commercial and Specialty Business segment offer fully-insured health products; provide a broad array of managed care services to self-funded customers including claims processing, underwriting, stop loss insurance, actuarial services, provider network access, medical cost management, disease management, wellness programs and other administrative services; and provide an array of specialty and other insurance products and services such as dental, vision, life and disability insurance benefits, radiology benefit management and analytics-driven personal health care guidance.
Our Government Business segment includes Medicare and Medicaid businesses, National Government Services, or NGS, and services provided to the federal government in connection with
FEP. Medicare business includes services such as Medicare Advantage, Medicare Part D, and Medicare Supplement. Medicaid business includes our managed care alternatives through publicly funded health care programs, including Medicaid
;
Temporary Assistance for Needy Family
programs, or TANF;
programs for seniors and people with disabilities
, or SPD;
programs for long-term services and support
, or LTSS;
Children’s Health Insurance Programs
, or CHIP;
and ACA-related
Medicaid expansion programs. NGS acts as a Medicare contractor in several regions across the nation.
Our Other segment includes other businesses that do not meet the quantitative thresholds for an operating segment as defined by
Financial Accounting Standards Board, or FASB,
guidance, as well as corporate expenses not allocated to the other reportable segments.
Through our participation in various federal government programs, we generated approximately
21.0%
,
20.3%
and
23.7%
of our total consolidated revenues from agencies of the U.S. government for the years ended
December 31, 2014
,
2013
-
8
-
and
2012
, respectively. These revenues are contained in the Government Business segment. An immaterial amount of our total consolidated revenues are derived from activities outside of the U.S.
For additional information regarding the operating results of our segments, see Part II, Item 7 “Management’s Discussion and Analysis of Financial Condition and Results of Operations” and Note 19, “Segment Information,” to our audited consolidated financial statements included in Part II, Item 8 of this Annual Report on Form 10-K.
Products and Services
A general description of our products and services is provided below:
Preferred Provider Organization:
PPO products offer the member an option to select any health care provider, with benefits reimbursed by us at a higher level when care is received from a participating network provider. Coverage is subject to co-payments or deductibles and coinsurance, with member cost sharing usually limited by out-of-pocket maximums.
Consumer-Driven Health Plans:
CDHPs provide consumers with increased financial responsibility, choice and control regarding how their health care dollars are spent. Generally, CDHPs combine a high-deductible PPO plan with an employer-funded and/or employee-funded personal care account, which may result in tax benefits to the employee. Some or all of the dollars remaining in the personal care account at year-end can be rolled over to the next year for future health care needs.
Traditional Indemnity:
Indemnity products offer the member an option to select any health care provider for covered services. Coverage is subject to deductibles and coinsurance, with member cost sharing usually limited by out-of-pocket maximums.
Health Maintenance Organization:
HMO products include comprehensive managed care benefits, generally through a participating network of physicians, hospitals and other providers. A member in one of our HMOs must typically select a primary care physician, or PCP, from our network. PCPs generally are family practitioners, internists or pediatricians who provide necessary preventive and primary medical care, and are generally responsible for coordinating other necessary health care services. We offer HMO plans with varying levels of co-payments, which result in different levels of premium rates.
Point-of-Service:
POS products blend the characteristics of HMO, PPO and indemnity plans. Members can have comprehensive HMO-style benefits through participating network providers with minimum out-of-pocket expenses (co-payments) and also can go directly, without a referral, to any provider they choose, subject to, among other things, certain deductibles and coinsurance. Member cost sharing is limited by out-of-pocket maximums.
ACA Public Exchange and Off-Exchange Products:
The ACA required the modification of existing products and development of new products to meet the requirements of the legislation, subject to certain transitional relief. Individual and Small Group products cover essential health benefits as defined in the ACA along with many other requirements and cost sharing features. Individual and Small Group products offered on and off the public exchanges meet the definition of the “metal” product requirements (bronze, silver, gold and platinum) and each metal product must satisfy a specific actuarial value. Health insurers participating on the public exchanges must offer at least one silver and one gold product.
In our Individual markets we offer bronze, silver and gold products, both on and off the public exchanges, in the states of California, Colorado, Connecticut, Georgia, Indiana, Kentucky, Maine, Missouri, Nevada, New Hampshire, New York, Ohio, Virginia and Wisconsin. Additionally, we offer platinum products, both on and off the public exchanges, in the states of California and New York.
In our Small Group markets, we offer bronze, silver and gold products, both on and off the public exchanges, in the states of Colorado, Connecticut, Georgia, Indiana, Kentucky, Maine, Missouri, New Hampshire, Ohio and Virginia and we offer bronze, silver and gold products, off the public exchanges, in the states of California, New York and Wisconsin. Additionally, we offer platinum products, off the public exchanges, in the states of California, Colorado, Connecticut, Georgia, Maine, New Hampshire, Missouri and Virginia.
Administrative Services:
In addition to fully-insured products, we provide administrative services to Large Group employers that maintain self-funded health plans. These administrative services include underwriting, actuarial services, medical cost management, disease management, wellness programs, claims processing and other administrative services for self-funded employers. Self-funded health plans are also able to use our provider networks and to realize savings through our
-
9
-
negotiated provider arrangements, while allowing employers the ability to design certain health benefit plans in accordance with their own requirements and objectives. We also underwrite stop loss insurance for self-funded plans.
BlueCard
®
:
BlueCard
®
host members are generally members who reside in or travel to a state in which an Anthem subsidiary is the Blue Cross and/or Blue Shield licensee and who are covered under an employer sponsored health plan serviced by a non-Anthem controlled BCBS licensee, which is the “home” plan. We perform certain administrative functions for BlueCard
®
host members, for which we receive administrative fees from the BlueCard
®
members’ home plans. Other administrative functions, including maintenance of enrollment information and customer service, are performed by the home plan.
Medicare Plans:
We offer a wide variety of plans, products and options to individuals age 65 and older such as Medicare supplement plans, Medicare Advantage (including private fee-for-service plans and special needs plans), Medicare Part D Prescription Drug Plans, or Medicare Part D, and Medicare-Medicaid Plans, or MMPs. Medicare supplement plans typically pay the difference between health care costs incurred by a beneficiary and amounts paid by Medicare. Medicare Advantage plans provide Medicare beneficiaries with a managed care alternative to traditional Medicare and often include a Medicare Part D benefit. In addition, our Medicare Advantage special needs plans provide tailored benefits to Medicare beneficiaries who have chronic diseases and also cover certain dual eligible customers, who are low-income seniors and persons under age 65 with disabilities who are enrolled in MMPs. Medicare Part D offers a prescription drug plan to Medicare and MMP beneficiaries. MMPs are managed care products serving members who are dually eligible for Medicaid and Medicare. We offer these plans to customers through our health benefit subsidiaries throughout the country, including Amerigroup and CareMore.
Individual Plans:
We offer a full range of health insurance plans with a variety of options and deductibles for individuals under age 65 who are not covered by employer-sponsored coverage. Some of our products target certain demographic populations such as uninsured younger individuals between the ages of 19 and 29, families, those transitioning between jobs or early retirees. Individual policies are generally sold through independent agents and brokers, retail partnerships, our in-house sales force or via the Internet. Individual business is sold on a fully-insured basis. We offer public exchange products and off-exchange products. Federal premium subsidies are available only for certain public exchange products. Individual customers are generally more sensitive to product pricing and, to a lesser extent, the configuration of the network, and the efficiency of administration.
Medicaid Plans and Other State-Sponsored Programs:
We have contracts to serve members enrolled in publicly funded health care programs, including Medicaid, TANF, SPD, LTSS, CHIP, and ACA-related Medicaid expansion programs. The Medicaid program makes federal matching funds available to all states for the delivery of health care benefits for low income and/or high medical risk individuals. These programs are managed by the individual states based on broad federal guidelines. TANF is a state and federally funded program designed for the population consisting primarily of low-income children and their guardians. SPD is a federal income supplement program designed for Supplemental Security Income recipients, however, states can broaden eligibility criteria. This population consists of low-income seniors and people with disabilities. LTSS is a state and federally funded program that offers states a broad and flexible set of program design options and refers to the delivery of long-term services and support for our members who receive home and community- or institution-based services for long-term care. CHIP is a state and federally funded program that provides health care coverage to children not otherwise covered by Medicaid or other insurance programs. Our Medicaid plans also cover certain dual eligible customers, as previously described above, who also receive Medicare benefits. We provide Medicaid and other State-Sponsored services in California, Florida, Georgia, Indiana, Kansas, Kentucky, Louisiana, Maryland, Massachusetts, Nevada, New Jersey, New York, South Carolina, Tennessee, Texas, Virginia, Washington, West Virginia and Wisconsin.
Pharmacy Products:
We market and sell an integrated prescription drug product to both fully-insured and self-funded customers through our health benefit subsidiaries throughout the country. This comprehensive product includes features such as drug formularies, a pharmacy network and maintenance of a prescription drug database and mail order capabilities. Since December 1, 2009, we have delegated certain functions and administrative services related to our integrated prescription drug products to Express Scripts, Inc., or Express Scripts, under a ten year contract, excluding some Amerigroup subsidiaries and certain self-insured members, which have exclusive agreements with different pharmacy benefit management, or PBM, service providers. It is expected that those Amerigroup subsidiaries will complete their transition to the Express Scripts agreement during 2015. Express Scripts manages the network of pharmacy providers, operates mail order pharmacies and
-
10
-
processes prescription drug claims on our behalf, while we sell and support the product for clients, make formulary decisions and set drug benefit design strategy and provide front line member support.
Life Insurance:
We offer an array of competitive individual and group life insurance benefit products to both Large Group and Small Group customers in conjunction with our health plans. The life products include term life and accidental death and dismemberment.
Disability:
We offer short-term and long-term disability products, usually in conjunction with our health plans.
Radiology Benefit Management:
We offer outpatient diagnostic imaging management services to health plans. These services include utilization management for advanced diagnostic imaging procedures, network development and optimization, patient safety, claims adjudication and provider payment.
Personal Health Care Guidance:
We offer leading evidence-based and analytics-driven personal health care guidance. These services help improve the quality, coordination and safety of health care, enhance communications between patients and their physicians, and reduce medical costs.
Dental:
Our dental plans include networks in certain states in which we operate. Many of the dental benefits are provided to customers enrolled in our health plans and are offered on both a fully-insured and self-funded basis. Our members also have access to additional dental providers through our participation in the National Dental GRID, a national dental network developed by and for BCBS plans. The National Dental GRID includes dentists in all 50 states and provides multi-state customers with a national solution providing in-network discounts across the country. Additionally, we offer managed dental services to other health care plans to assist those plans in providing dental benefits to their customers.
Vision Services and Products:
Our vision plans include networks within the states in which we operate. Many of the vision benefits are provided to customers enrolled in our health plans and are offered on both a fully-insured and self-funded basis. In addition to vision plans, we sold contact lenses, eyeglasses and other ocular products through our 1-800 CONTACTS subsidiary which we divested on January 31, 2014.
Medicare Administrative Operations:
Through our subsidiary, NGS, we serve as a fiscal intermediary, carrier and Medicare administrative contractor providing administrative services for the Medicare program, which generally provides coverage for persons who are 65 or older and for persons who are disabled or with end-stage renal disease. Part A of the Medicare program provides coverage for services provided by hospitals, skilled nursing facilities and other health care facilities. Part B of the Medicare program provides coverage for services provided by physicians, physical and occupational therapists and other professional providers, as well as certain durable medical equipment and medical supplies.
Networks and Provider Relations
Our relationships with physicians, hospitals and professionals that render health care services to our members are guided by local, regional and national standards for network development, reimbursement and contract methodologies. While following industry standards, we are simultaneously seeking to lead transformation efforts within our health care system, moving from our current fragmented model premised on episodic intervention to one based on proactive, coordinated care built around the needs of the patient. A key element of this transformation involves a transition from traditional fee-for-service payment models to models where providers are paid based on the value, both in quality and affordability, of the care they deliver.
We establish “market-based” hospital reimbursement payments that we believe are fair, but aggressive, and among the most competitive in the market. We also seek to ensure that physicians in our network are paid in a timely manner at appropriate rates. In many instances, we deploy multi-year contracting strategies, including case rates or fixed rates, to limit our exposure to medical cost inflation and to increase cost predictability. We maintain both broad and narrow provider networks to ensure member choice, based on both price and access needs, while implementing programs designed to improve the quality of care our members receive. Increasingly, we are supplementing our broad based networks with smaller or more cost-effective networks that are designed to be attractive to a more price-sensitive customer segment, such as public exchange customers.
Our reimbursement strategies vary across markets and depend on the degree of consolidation and integration of physician groups and hospitals. Fee-for-service is currently our predominant reimbursement methodology for physicians, but
-
11
-
as noted above, we are transitioning providers to value-based payment contracts. More traditional physician fee schedules are developed at the state level based on an assessment of several factors and conditions, including the Centers for Medicare & Medicaid Services, or CMS, resource-based relative value system, or RBRVS, medical practice cost inflation and physician supply. We utilize CMS RBRVS fee schedules as a reference point for fee schedule development and analysis. The RBRVS structure was developed, maintained, and updated by CMS and is used by the Medicare program and other major payers. In addition, we have implemented and continue to expand physician incentive contracting, or “pay for performance”, which ties physician payment levels to performance on clinical measures.
While we generally do not delegate full financial responsibility to our physician providers in the form of capitation-based reimbursement, there are certain markets where the market dynamics result in this being a useful method to lower costs and reduce underwriting risk, thus we do utilize this payment method in those markets.
Our hospital contracts provide for a variety of reimbursement arrangements depending on local market dynamics and current hospital utilization efficiency. Most hospitals are reimbursed a fixed amount per day or reimbursed a per-case amount, per admission, for inpatient covered services. A small percentage of hospitals, primarily rural, sole community hospitals, are reimbursed on a discount from approved charge basis for covered services. Our “per-case” reimbursement methods utilize many of the same attributes contained in Medicare’s Diagnosis Related Groups, or DRG, methodology. Hospital outpatient services are reimbursed by fixed case rates, fee schedules or percent of approved charges. Our hospital contracts recognize unique hospital attributes, such as academic medical centers or community hospitals, and the volume of care performed for our members. To improve predictability of expected costs, we frequently use a multi-year contracting approach with providers. In addition, the majority of our hospital contracts include a “pay for performance” component where reimbursement levels are linked to improved clinical performance, patient safety and medical error reduction.
Although fee-for-service combined with pay for performance remains our predominant payment model today, our provider engagement and contracting strategies are moving away from “unit price” or volume-based payment models to payment models that align compensation with the value delivered as measured by health care, quality and cost. We launched the most significant of these efforts, our Enhanced Personal Health Care program, in the fourth quarter of 2012. This program augments traditional fee-for-service with shared savings opportunities for providers when actual health care costs are below projected costs, and providers meet specific quality measures. The quality measures are based on nationally accepted, credible standards (e.g. NCQA, the American Diabetes Association and the American Academy of Pediatrics) and span preventive, acute and chronic care. We understand, however, that payment incentives alone are insufficient to create the large-scale, system-wide transformation required to achieve meaningful impacts on cost, quality and member experience. Accordingly, we invested in care delivery transformation and population health management support structures to help providers succeed under value-based payment models. This support includes our web-based population health management technology and teams of dedicated expert consultants who work alongside providers, sharing best practices, and helping them leverage our data to the benefit of their patients. In some of these arrangements, participating physician practices receive a per-member, per-month clinical coordination fee to compensate them for important care management activities that occur outside of the patient visit, (e.g. purchasing an electronic health record or hiring care management nurses) all of which have been shown to reduce healthcare costs and improve care outcomes. Since the launch of Enhanced Personal Health Care, we now have arrangements with provider organizations covering nearly 40% of our primary care physicians and have rolled this program out in each of the fourteen states where we operate as a licensee of the BCBSA.
Medical Management Programs
Our medical management programs include a broad array of activities that facilitate improvements in the quality of care provided to our members and promote cost-effective medical care. These medical management activities and programs are administered and directed by physicians and trained nurses. The goals of our medical management strategies are to ensure that the care delivered to our members is supported by appropriate medical and scientific evidence, is received on a timely basis and occurs in the most appropriate location.
Precertification:
A traditional medical management program involves assessment of the appropriateness of certain hospitalizations and other medical services prior to the service being rendered. For example, precertification is used to determine whether a set of hospital and medical services is being appropriately applied to the member’s clinical condition, in accordance with criteria for medical necessity as that term is defined in the member’s benefits contract. All of our health plans have implemented precertification programs for common high-tech radiology studies, including cardiac diagnostic
-
12
-
testing, addressing an area of historically significant cost trends. Through our AIM Specialty Health, or AIM, subsidiary we promote appropriate, safe and affordable member care in imaging as well as oncology, sleep management and specialty pharmacy benefits. These expanded specialty benefit management solutions leverage clinical expertise and technology to engage our provider communities and members in more effective and efficient use of outpatient services.
Care Coordination:
Another traditional medical management strategy we use is care coordination, which is based on nationally recognized criteria developed by third-party medical specialists. With inpatient care coordination, the requirements and intensity of services during a patient’s hospital stay are reviewed, at times by an onsite skilled nurse professional in collaboration with the hospital’s medical and nursing staff, in order to coordinate care and determine the most effective transition of care from the hospital setting. In addition, guidance for many continued stay cases is reviewed with physician medical directors to ensure appropriate utilization of medical services. We also coordinate care for outpatient services to help ensure that patients with chronic conditions who receive care from multiple physicians are able to manage the exchange of information between physicians and coordinate office visits to their physicians.
Case Management:
We have implemented a medical management strategy focused on identifying the small percentage of the membership that will require a high level of intervention to manage their health care needs. The registered nurses and medical directors focus on members likely to be readmitted to the hospital and help them coordinate their care through pharmacy compliance, post-hospital care, follow-up visits to see their physician and support in their home.
Formulary management:
We have developed formularies, which are selections of drugs based on clinical quality and effectiveness. A pharmacy and therapeutics committee of physicians uses scientific and clinical evidence to ensure that our members have access to the appropriate drug therapies.
Medical policy:
A medical policy group, comprised of physician leaders from various areas of the country, working in cooperation with academic medical centers, practicing community physicians and medical specialty organizations such as the American College of Radiology and national organizations such as the Centers for Disease Control and Prevention and the American Cancer Society, determines our national policy for the application of new medical technologies and treatments.
Quality programs:
We are actively engaged with our hospital and physician networks to enable them to improve medical and surgical care and achieve better outcomes for our members. We endorse, encourage and incentivize hospitals and physicians to support national initiatives to improve the quality of clinical care and patient outcomes and to reduce medication errors and hospital infections. We have demonstrated our leadership in developing hospital quality programs.
External review procedures:
We work with outside experts through a process of external review to provide our members scientifically and clinically, evidence-based medical care. When we receive member concerns, we have formal appeals procedures that ultimately allow coverage disputes related to medical necessity decisions under the benefits contract to be settled by independent expert physicians.
Service management:
In HMO and POS networks, primary care physicians serve as the overall coordinators of members’ health care needs by providing an array of preventive health services and overseeing referrals to specialists for appropriate medical care. In PPO networks, patients have access to network physicians without a primary care physician serving as the coordinator of care.
Estimate Your Cost & Anthem Care Comparison:
These health care provider comparison tools disclose typical cost estimates and quality data for common services at contracted providers, with cost estimates accounting for facility, professional and ancillary services. The cost estimates bundle related services typically performed at the time of the procedure, not just for the procedure itself. Users can review cost data for over 350 procedures in 49 states. The Estimate Your Cost tool also includes member out-of-pocket cost estimates based on a member’s own benefit coverage, deductible, and out of pocket maximum. We also offer information on overall facility ratings and patient experience using trusted third party data. We continue to work on enhancing and evolving our tools to assist members in making informed and value-based health care decisions. In addition, we collaborate with an external independent vendor to support employers wanting to purchase a transparency and consumer engagement web solution with certain additional functionality.
Personal Health Care Guidance:
These services help improve the quality, coordination and safety of health care, enhance communications between patients and their physicians, and reduce medical costs. Examples of services include
-
13
-
member and physician messaging, providing access to evidence-based medical guidelines, physician quality profiling, and other consulting services.
Anthem Health Guide:
Anthem Health Guide integrates customer service with clinical and wellness coaching to provide easier navigation of health care services for our members. Members are supported by a team of nurses, coaches, educators, and social workers using voice, click-to-chat, secure email and mobile technology. Our Smart Engagement Platform supports this integrated team using our smart engagement triggers for speech recognition, preventative and clinical gaps in care and highlighting when we have members who are identified for current health care support. This caring team of professionals also supports our members with our shared decision making support portfolio.
Care Management Programs
We continue to expand our
360º Health
suite of integrated care management programs and tools.
360º Health
offers the following programs, among others, that have been proven to increase quality and reduce medical costs for our members:
ConditionCare
and
FutureMoms
are care management and maternity management programs that serve as adjuncts to physician care. Skilled nurse professionals with added support from our team of dietitians, social workers, pharmacists, health educators and other health professionals help participants understand their condition, their doctor’s orders and how to become a better self-manager of their condition. We also offer members infertility consultation through our SpecialOffers@Anthem program, a comprehensive and integrated assembly of discounted health and wellness products and services from a variety of the nation's leading retailers.
24/7 NurseLine
offers access to qualified, registered nurses anytime. This allows our members to make informed decisions about the appropriate level of care and avoid unnecessary worry. This program also includes a referral process to the nearest urgent care facility, a robust audiotape library, accessible by phone, with more than 400 health and wellness topics, as well as on-line health education topics designed to educate members about symptoms and treatment of many common health concerns.
ComplexCare
is an advanced care management program that reaches out to participants with multiple health care issues who are at risk for frequent and high levels of medical care in order to offer support and assistance in managing their health care needs.
ComplexCare
identifies candidates through claims analysis using predictive modeling techniques, the use of health risk assessment data, utilization management reports and referrals from a physician or one of our other programs, such as the
24/7 NurseLine
.
MyHealth Advantage
utilizes integrated information systems and sophisticated data analytics to help our members improve their compliance with evidence-based care guidelines, providing personal care notes that alert members to potential gaps in care, enable more prudent health care choices, and assist in the realization of member out-of-pocket cost savings. Key opportunities are also shared with physicians through Availity
®
at the time of membership eligibility verification. Availity
®
is an electronic data interchange system that allows for the exchange of health information among providers over a secure network.
MyHealth Coach
provides our members with a professional guide who helps them navigate the health care system and make better decisions about their well-being.
MyHealth Coach
proactively reaches out to people who are at risk for serious health issues or have complex health care needs. Our health coaches help participants understand and manage chronic conditions, handle any health and wellness related services they need and make smart lifestyle choices.
HealthyLifestyles
helps employees transform unhealthy habits into positive ones by focusing on behaviors that can have a positive effect on their health and their employer’s financial well-being.
HealthyLifestyles
programs include smoking cessation, weight management, stress management, physical activity and diet and nutrition.
MyHealth@Anthem
is our secure web-based solution, complementing other programs by reinforcing telephonic coaching and mail campaigns. The website engages participants in regularly assessing their health status, gives them feedback about their progress, and tracks important health measures such as blood pressure, weight and blood glucose levels.
Behavioral Health Case Management
provides oversight of the delivery of mental health and substance abuse services as an integrated component of the health plan. The program assists providers and members with referrals, transitional care, episodic emergency care and other needs.
-
14
-
Employee Assistance Programs
provide many resources that allow members to balance work and personal life by providing quick and easy access to confidential resources to help meet the challenges of daily life. Examples of services available in person as well as via telephone or internet are counseling for child care, health and wellness, financial issues, legal issues, adoption and daily living.
Health Care Quality Initiatives
Increasingly, the health care industry is able to define quality health care based on preventive health measurements, outcomes of care and optimal care management for chronic disease. A key to our success has been our ability to work with our network physicians and hospitals to improve the quality and outcomes of the health care services provided to our members. Our ability to promote quality medical care has been recognized by the NCQA, the largest and most respected national accreditation program for managed care health plans.
Several quality health care measures, including the Healthcare Effectiveness Data and Information Set, or HEDIS
®
, have been incorporated into the NCQA’s accreditation processes. HEDIS
®
measures range from preventive services, such as screening mammography and pediatric immunization, to elements of care, including decreasing the complications of diabetes and improving treatment for patients with heart disease. For health plans, NCQA’s highest accreditation status of Excellent is granted only to those plans that demonstrate levels of service and clinical quality that meet or exceed NCQA’s rigorous requirements for consumer protection and quality improvement. Plans earning this accreditation level must also achieve HEDIS
®
results that are in the highest range of national or regional performance. Details for each of our plans’ accreditation levels can be found at www.ncqa.org.
We have created an innovative program called the State Health Index, or SHI, to quantify and track our success in improving the health of our communities. SHI presents a comprehensive picture of a community’s health in the 24 states served by our affiliated health plans. It is compiled from public data and includes 14 health indicators in four domains: Maternity Care, Preventive Care, Lifestyle, and Morbidity/Mortality. The metrics are utilized to identify opportunities for health improvement and leverage our strengths to build partnerships with community coalitions, patient advocacy organizations, and local and state public health departments. We analyze states' performance measures and prioritize measures for focused improvement. Together with Anthem Foundation, Inc. and state leadership, we create or enhance programs to improve the health of the entire population in these states - not just for our members.
Our wholly-owned health outcomes research subsidiary, HealthCore, Inc., or HealthCore, generates consistent and actionable evidence to support decision making while helping to guide fresh initiatives for a range of stakeholders in the healthcare industry. By leveraging a rich array of medical and pharmacy utilization data queried from administrative claims, patients surveys, medical charts and laboratory diagnostics, among other health records, HealthCore’s multi-disciplinary research teams uncover a broad spectrum of safety, effectiveness, pharmacoepidemiology, and health economics evidence. HealthCore’s real world evidence and comparative effectiveness research, among others, have played roles in the product planning and development campaigns of biotechnology and pharmaceutical companies, and today it lists most of the leading biologics and drug manufacturers as clients or alliance partners. Its health plan research has led to better insights into evidence-based treatment approaches, the development of value-based initiatives to drive access and adherence to treatment, and the crafting of incentives to modify patient and provider behavior. One of HealthCore’s predominant initiatives is its governmental and academic collaborations that include cooperation with some of the country’s top universities and federal agencies, including the Food and Drug Administration and the Centers of Disease Control of the National Institutes of Health, and it is an active contributor to the safety surveillance Sentinel program. As a notable contributor to the health outcomes evidence base, HealthCore’s research findings are broadly disseminated during presentations at national and international medical meetings and are published in a variety of respected peer-reviewed medical and health services journals.
Our AIM subsidiary supports quality by implementing clinical appropriateness and patient safety solutions for advanced imaging procedures, cardiology, sleep medicine, specialty pharmaceuticals and oncology, including drugs covered under medical benefit and radiation therapy. These programs, based on widely accepted clinical guidelines, promote the most appropriate use of diagnostic and therapeutic services to improve the quality of overall health care delivered to our members and members of other health plans that are covered under AIM’s programs. To provide additional impact to its clinical appropriateness program, AIM has also implemented a provider assessment program, OptiNet
®
, which promotes more informed selection of diagnostic imaging and testing facilities by providing cost and facility information to physician offices at the point that a procedure is ordered. We have also leveraged AIM’s provider network assessment information to
-
15
-
proactively engage and educate our members about imaging providers and sleep testing choices based on site capabilities and cost differences. This program is another example of how we facilitate improvements in the quality of care provided to our members and promote cost effective medical care. In addition, AIM radiology, cardiology, sleep medicine, radiation therapy, network assessment and member engagement solutions have been evaluated as quality improvement expenses under the National Association of Insurance Commissioners, or NAIC, medical loss ratio, or MLR, regulations. Fees for these programs can be included in calculations of a health plan’s MLR.
Our wholly-owned analytics-driven subsidiary, Resolution Health, Inc., or RHI, delivers programs to improve the safety, quality and coordination of health care for our members. RHI uses evidence-based proprietary rules and algorithms based on established clinical guidelines and standards of independent accreditation organizations, medical specialty societies, and government agencies such as the National Quality Forum, or NQF, and NCQA. RHI analyzes claims and other data to identify actions that can improve health outcomes at the individual member level. When appropriate, RHI delivers personalized confidential messages ("Personalized Health Insights") to members, providers and care managers. RHI’s Personalized Health Insights support total population health management and the results of RHI analyses are used across our enterprise to support HEDIS and other clinical quality measures.
Pricing and Underwriting of Our Products
We price our products based on our assessment of current health care claim costs and emerging health care cost trends, combined with charges for administrative expenses, risk and profit, including charges for ACA taxes and fees. We continually review our product designs and pricing guidelines on a national and regional basis so that our products remain competitive and consistent with our profitability goals and strategies.
In applying our pricing to each employer group and customer, we maintain consistent, competitive, disciplined underwriting standards. We employ our proprietary accumulated actuarial data in determining underwriting and pricing parameters. Where allowed by law and regulation, we underwrite large groups based on each group’s aggregate claim experience. Also, we employ credit underwriting procedures with respect to our self-funded products.
In most circumstances, our pricing and underwriting decisions follow a prospective rating process in which a fixed premium is determined at the beginning of the contract period. For fully-insured business, any deviation, favorable or unfavorable, from the medical costs assumed in determining the premium is our responsibility. Some of our larger groups employ retrospective rating reviews, where positive experience is partially refunded to the group, and negative experience is charged against a rate stabilization fund established from the group’s favorable experience, or charged against future favorable experience.
BCBSA Licenses
We are a party to license agreements with the BCBSA that entitle us to the exclusive, and in certain areas, non-exclusive use of the Blue Cross and Blue Shield names and marks in assigned geographic territories. BCBSA is a national trade association of Blue Cross and Blue Shield licensees, the primary function of which is to promote and preserve the integrity of the BCBS names and marks, as well as provide certain coordination among the member companies. Each BCBSA licensee is an independent legal organization and is not responsible for obligations of other BCBSA member organizations. We have no right to market products and services using the BCBS names and marks outside of the states in which we are licensed to sell BCBS products. We are required to pay an annual license fee to the BCBSA based on enrollment and also to comply with various operational, governance and financial standards set forth in the licenses.
We believe that we and our licensed affiliates are currently in compliance with these standards. The standards under the license agreements may be modified in certain instances by the BCBSA. See Part I, Item 1A “Risk Factors” in this Annual Report on Form 10-K for additional details of our licensing requirements and the impact if we were not to comply with these license agreements.
-
16
-
Regulation
General
Our operations are subject to comprehensive and detailed state, federal and international regulation throughout the jurisdictions in which we do business. As discussed below, the regulatory aspects of the U.S. health care system have been and will continue to be significantly affected by Health Care Reform. Supervisory agencies, including state health, insurance and corporation departments, have broad authority to:
|
•
|
grant, suspend and revoke licenses to transact business;
|
|
•
|
regulate many aspects of our products and services;
|
|
•
|
monitor our solvency and reserve adequacy;
|
|
•
|
scrutinize our investment activities on the basis of quality, diversification and other quantitative criteria; and
|
|
•
|
impose monetary and criminal sanctions for non-compliance with regulatory requirements.
|
To carry out these tasks, these regulators periodically examine our operations and accounts.
Regulation of Insurance Company and HMO Business Activity
The governments of the states in which we conduct business, as well as the federal government, have adopted laws and regulations that govern our business activities in various ways. Further, Health Care Reform has resulted in increased federal regulation that significantly impacts our business. These laws and regulations, which vary significantly from state to state and on the federal level, restrict how we conduct our businesses and result in additional burdens and costs to us. Areas of governmental regulation include but are not limited to:
|
•
|
medical loss ratios;
|
|
•
|
tax deductibility of certain compensation and Health Care Reform related fees;
|
|
•
|
licensure;
|
|
•
|
premium rates;
|
|
•
|
benefits;
|
|
•
|
eligibility requirements;
|
|
•
|
guaranteed availability and renewability;
|
|
•
|
service areas;
|
|
•
|
market conduct;
|
|
•
|
sales and marketing activities, including use and compensation of brokers and other distribution channels;
|
|
•
|
quality assurance procedures;
|
|
•
|
plan design and disclosures, including mandated benefits;
|
|
•
|
underwriting, marketing, pricing and rating restrictions for insurance products;
|
|
•
|
utilization review activities;
|
|
•
|
prompt payment of claims;
|
|
•
|
member rights and responsibilities;
|
|
•
|
collection, access or use of protected health information;
|
|
•
|
data reporting, including financial data and standards for electronic transactions;
|
|
•
|
payment of dividends;
|
|
•
|
provider rates of payment;
|
-
17
-
|
•
|
surcharges on provider payments;
|
|
•
|
provider contract forms;
|
|
•
|
provider access standards;
|
|
•
|
premium taxes, assessments for the uninsured and/or underinsured, insolvency guaranty payments, federal taxes, public exchange fees and premium stabilization programs;
|
|
•
|
member and provider complaints and appeals;
|
|
•
|
financial condition (including reserves and minimum capital or risk based capital requirements and investments);
|
|
•
|
reimbursement or payment levels for government funded business; and
|
|
•
|
corporate governance and financial reporting.
|
These state and federal laws and regulations are subject to amendments and changing interpretations in each jurisdiction.
States generally require health insurers and HMOs to obtain a certificate of authority prior to commencing operations. If we were to establish a health insurance company or an HMO in any jurisdiction where we do not presently operate, we generally would have to obtain such a certificate. The time necessary to obtain such a certificate varies from jurisdiction to jurisdiction. Each health insurer and HMO must file periodic financial and operating reports with the states in which it does business. In addition, health insurers and HMOs are subject to state examination and periodic license renewal. The health benefits business also may be adversely impacted by court and regulatory decisions that expand the interpretations of existing statutes and regulations. It is uncertain whether we can recoup, through higher premiums or other measures, the increased costs of mandated benefits or other increased costs caused by potential legislation, regulation or court rulings. See Part I, Item 1A “Risk Factors” in this Annual Report on Form 10-K.
Patient Protection and Affordable Care Act
The ACA has created significant changes and will continue to create significant changes for health insurance markets for the next several years. Specifically, many of the near-term changes were effective for certain groups and individuals on their first renewal on or after September 2010, including a prohibition on lifetime limits, certain annual limits, member cost-sharing on specified preventive benefits, pre-existing condition exclusions for children, increased restrictions on rescinding coverage and extension of coverage of dependents to the age of 26. Certain requirements for insurers were also effective in 2011, including changes to Medicare Advantage payments and the minimum MLR provision that requires insurers to pay rebates to customers when insurers do not meet or exceed the specified MLR thresholds. Most of the provisions of the ACA with more significant effects on the health insurance marketplace, both state and federal, went into effect on January 1, 2014, including a requirement that insurers guarantee the issuance of coverage to all individuals regardless of health status, strict rules on how health insurance is rated, the assessment of new taxes and fees (including annual fees on health insurance companies), the creation of public exchanges for Individuals and Small Groups, the availability of premium subsidies for certain Individual products, and substantial expansions in eligibility for Medicaid.
Despite significant preparation for the advent of the public exchanges, there have been many technical difficulties in their implementation, which entail uncertainties associated with mix and volume of business. In November 2013, CMS notified the various state Insurance Commissioners that, under a transitional policy, health insurance coverage in the Individual or Small Group markets that is renewed for a policy year starting between January 1, 2014 and October 1, 2014 that would otherwise have been deemed non-compliant with certain market reforms under Health Care Reform will not be considered by CMS to be out of compliance with respect to such market reforms, provided certain conditions are met. CMS further encouraged state agencies responsible for enforcing the specified market reforms to adopt the same transitional policy with respect to this coverage. Some states have adopted the transitional policy, some have declined to adopt it and yet others have not taken a position.
Additionally, in March 2014 a second round of transition relief was issued by CMS, providing that health insurance coverage in the Individual or Small Group markets that is renewed for a policy year beginning on or before October 1, 2016, that would otherwise have been deemed non-compliant with certain market reforms under Health Care Reform, will not be considered by CMS to be out of compliance with respect to such market reforms, provided certain conditions are met. Again, some states have adopted this transitional policy, some have not and others have not taken a position.
-
18
-
Due to the impact of the transitional policies, insurers in the ACA compliant Individual market, including Anthem, may be adversely selected by individuals who will have a higher acuity level than the anticipated pool of participants in the public exchange markets. In addition, the risk adjustment, reinsurance, and risk corridor premium stabilization programs of Health Care Reform, or Health Care Reform Premium Stabilization Programs, established to apportion risk amongst insurers, may not be effective in appropriately mitigating the financial risks related to our public exchange products. These factors, along with the limited information about the individuals who have access to these newly established public exchanges that was available when we established premiums, may have a material adverse effect on our results of operations if premiums are not adequate or do not appropriately reflect the acuity of these individuals. Any variation from our expectations regarding acuity, enrollment levels, adverse selection, or other assumptions utilized in setting adequate premium rates could have a material adverse effect on our results of operations, financial position, and cash flows.
In addition, there have been other material changes and delays in the implementation of the ACA that could have a material adverse effect on our results of operations, financial position, and cash flows. These include:
|
•
|
Delay in the effective date of the employer mandate from 2014 to 2015;
|
|
•
|
Delay of the commencement of the 2015 open enrollment period from October 15 to November 15, 2014 through February 15, 2015; and
|
|
•
|
Other unanticipated regulatory changes and delays.
|
These delays and changes may have a material and significant impact on anticipated enrollment in public exchange and off-exchange products, thus affecting the risk pools and premium rates. The technical difficulties in implementing the public exchanges have impacted the sharing of enrollment information between the federal government and health insurers. Finally, implementation of the ACA brings with it significant oversight responsibilities by health insurers that may result in increased governmental audits, increased assertions of False Claims Act violations, and an increased risk of other litigation.
The ACA continues to require additional guidance and specificity to be provided by HHS, the Department of Labor, CMS and the Department of the Treasury. These regulatory agencies continue to consider recommendations from external groups, such as the NAIC. Many provisions have final rules available for review while some proposed regulations have been released for comment or have yet to be released and others are in-process. Of particular note is the yet to be issued regulation pertaining to administrative simplification to create uniformity in implementing electronic standards. We continue to carefully evaluate each rule as it is issued; and, therefore, it continues to be too early to fully understand the impacts of the legislation on our overall business. Some of the more significant considerations of the ACA are described below:
|
•
|
MLR regulations were issued by HHS in December 2011; however, significant changes could still occur to the MLR requirements through additional regulatory guidance and/or modification of the regulation. The minimum MLR thresholds by line of business, as defined by HHS, are as follows:
|
|
Line of Business
|
%
|
|
|
Large Group
|
85
|
|
|
Small Group
|
80
|
|
|
Individual
|
80
|
|
New York state regulations require us to meet a more restrictive MLR threshold of 82% for both Small Group and Individual lines of business. The minimum MLR thresholds disclosed above are based on definitions of an MLR calculation provided by HHS, or specific states, as applicable, and differ from our calculation of “benefit expense ratio” based on premium revenue and benefit expense as reported in accordance with U.S. generally accepted accounting principles, or GAAP. Furthermore, the definitions of the lines of business differ under the various state and federal regulations and may not correspond to our lines of business. Definitions under the MLR regulation also impact insurers differently depending upon their organizational structure or tax status, which could result in a competitive advantage to some insurance providers that may not be available to us, resulting in an uneven playing field in the industry. Significant changes to the MLR requirements may occur through additional regulatory action by HHS.
-
19
-
Health Care Reform also imposed a separate minimum MLR threshold of 85% for Medicare Advantage plans beginning in 2014. Medicare Advantage plans that do not meet this threshold will have to pay a minimum MLR rebate. If a plan’s MLR is below 85% for three consecutive years beginning with 2014, enrollment will be restricted. A Medicare Advantage plan contract will be terminated if the plan's MLR is below 85% for five consecutive years.
Approximately 67.0% and 32.2% of our premium revenue and medical membership, respectively, were subject to the minimum MLR regulations as of and for the year ended
December 31, 2014
. Approximately 63.1% and 27.3% of our premium revenue and medical membership, respectively, were subject to the minimum MLR regulations as of and for the year ended
December 31, 2013
.
|
•
|
The ACA required states to establish public exchanges by January 1, 2014 through which qualified individuals and qualified small employers may access coverage. If a state failed to establish a public exchange, the federal government established a public exchange in that state. To date sixteen states plus the District of Columbia have elected to operate state-based public exchanges. The remaining states have either a federal partnership public exchange (six states) or a federally operated public exchange (twenty-eight states). In the states in which we offer products on public exchanges, six states have passed legislation or executive orders establishing state-based public exchanges (California, Colorado, Connecticut, Kentucky, Nevada and New York).
|
|
•
|
The ACA required the modification of existing products and development of new products to meet the requirements of the legislation, subject to certain transitional relief. Individual and Small Group products must cover essential health benefits as defined in the ACA along with many other requirements and cost sharing features. Individual and Small Group products must meet the definition of the “metal” product requirements (bronze, silver, gold and platinum). Each metal product must satisfy a specific actuarial value. Health insurers participating on public exchanges must offer at least one silver and one gold product. Additionally, effective January 1, 2014, health insurers were required to cancel or discontinue the sale of existing non-ACA-compliant Individual and Small Group products, subject to the conditions of the November 2013 and March 2014 CMS transitional policies discussed above.
|
|
•
|
Regulations became effective in September 2011 that require filings for premium rate increases for Small Group and Individual products above specified thresholds, generally 10%, to be reviewed. The regulations provide for state insurance regulators to conduct the reviews, except for cases where a state does not have an “effective” rate review program or in federal enforcement states, in which cases HHS will conduct the reviews for any rate increase filed.
|
|
•
|
The Health Care Reform Premium Stabilization Programs introduce new requirements to the MLR calculation, beginning with the 2014 benefit year for the Individual and Small Group markets. The risk adjustment program is a permanent program that transfers dollars from insurers who enroll individuals with lower relative health risk to insurers who enroll individuals with higher relative health risk. Risk adjustment payments/receipts will be determined separately for each state and for Individual and Small Group. The second premium stabilization program is the transitional reinsurance program, a temporary program that runs from 2014 through 2016. The transitional reinsurance program is intended to help stabilize premiums by reimbursing issuers of ACA-compliant non-grandfathered Individual market plans for eligible claims between a defined attachment point and ceiling, at a coinsurance rate defined by HHS. The program will be funded through assessments per covered enrollee upon the commercial health insurance market and sponsors of self-funded health benefit plans of approximately $12.0 billion, $8.0 billion and $5.0 billion in 2014, 2015 and 2016, respectively. The final premium stabilization program is the temporary risk corridor program, also a three year program through 2016, that protects insurers from inaccurate pricing of Individual and Small Group qualified health plans and substantially similar off-exchange products. Beginning in 2014, MLR rebate calculations are adjusted to reflect the impact of the Health Care Reform Premium Stabilization Programs.
|
|
•
|
Through December 31, 2013 and depending on the laws in each state, health insurers were allowed to consider factors such as health status, gender and age in determining the appropriate premium for products in the Individual and Small Group markets. Some states have adopted rules that limit the variation between the highest and lowest premium for the identical insurance policy. The differential in pricing is commonly referred to as “rating bands”. The process of using these rating bands allowed health insurers to appropriately price for products and to spread the risk more broadly across all policyholders. Except for policies issued under the CMS transitional policies, beginning in 2014, the ACA precludes health insurers from using health status and gender in the determination of the appropriate insurance premium. In addition, rating bands for age cannot vary by more than 3 to 1 and the rating
|
-
20
-
bands for tobacco use cannot vary by more than 1.5 to 1. The ongoing use of the 3 to 1 rating bands may have a significant impact on the majority of Individual and Small Group customers and could lead to adverse selection in the market as well as increased variability in projecting future premiums for those customer markets.
|
•
|
In 2014 significant new taxes and fees became effective for health insurers, some of which may or may not be passed through to customers. The most significant of the taxes and fees is the
annual Health Insurance Provider Fee, or HIP Fee,
on health insurers that write certain types of health insurance on U.S. risks. The annual HIP Fee is allocated to health insurers based on the ratio of the amount of an insurer's net premium revenues written during the preceding calendar year to an adjusted amount of health insurance for all U.S. health risk for those certain lines of business written during the preceding calendar year. The HIP Fee is non-deductible for federal income tax purposes. The total amount to be collected from allocations to health insurers in 2014 was
$8.0 billion
, and our portion of the HIP Fee for 2014 was
$893.3 million
. The final calculation and payment of the HIP Fee occurred in the third quarter of 2014
and was recognized as a general and administrative expense. The annual HIP Fee to be allocated to all health insurers increases to
$11.3 billion
for 2015 and 2016,
$13.9 billion
for 2017 and
$14.3 billion
for 2018. For 2019 and beyond, the annual HIP Fee will increase from the amount for the preceding year by the rate of premium growth for the preceding year.
|
|
•
|
Medicare Advantage reimbursement rates will not increase as much as they would otherwise due to a new payment formula promulgated by the ACA that is expected to significantly reduce reimbursements in the future. We also expect further and ongoing regulatory guidance on a number of issues related to Medicare, evolving methodology for ratings and quality bonus payments, and potential action on an audit methodology to review data submitted under “risk adjuster” programs.
|
In June 2012, the U.S. Supreme Court issued a decision affirming that the majority of the provisions of the ACA were constitutional. However, the provision of the ACA related to the mandatory expansion of state Medicaid programs was declared unconstitutional. One case pertaining to the constitutionality of the contraceptive mandate was decided by the U.S. Supreme Court during the past year, in which the Supreme Court held that closely-held for-profit businesses are entitled to object to the contraceptive mandate. Another pending case pertains to challenges to the premium tax subsidies and whether the subsidies are available for eligible residents in all states or only those residents in states which have established state-based public exchanges.
Dodd-Frank Wall Street Reform and Consumer Protection Act
The Dodd-Frank Wall Street Reform and Consumer Protection Act, or the Dodd-Frank Act became law in 2010. The Dodd-Frank Act represents a far-reaching overhaul of the framework for the U.S. financial services industry. Even though we are primarily a health benefits company, our business has been impacted by the Dodd-Frank Act. Many of its provisions require the adoption of rules for implementation, including those that govern which non-bank financial companies may become subject to the oversight of the Federal Reserve. These non-bank financial companies are defined as those that could pose a threat to the economy’s financial stability either due to the potential of material financial distress at the company or due to the company’s ongoing activities. While we are not currently considered a non-bank financial company for purposes of Federal Reserve oversight, future regulations or interpretations could change that result. Further, our investments in derivative instruments became subject to rules regarding the reporting and clearing of transactions and new margin requirements.
In addition, the Dodd-Frank Act creates a Federal Insurance Office, with limited powers that include information-gathering and subpoena authority. Although the Federal Insurance Office does not have authority over health insurance, it may have authority over other parts of our business, such as life insurance.
HIPAA and Gramm-Leach-Bliley Act
The federal Health Insurance Portability and Accountability Act of 1996, or HIPAA, imposes obligations for issuers of health insurance coverage and health benefit plan sponsors. This law requires guaranteed renewability of health care coverage for most group health plans and certain individuals. Also, the law limited exclusions based on preexisting medical conditions.
The administrative simplification provisions of HIPAA imposed a number of requirements on covered entities (including insurers, HMOs, group health plans, providers and clearinghouses). These requirements include uniform standards of common electronic health care transactions; privacy and security regulations; and unique identifier rules for employers,
-
21
-
health plans and providers. Additional federal privacy and security requirements, including breach notification, improved enforcement and additional limitations on use and disclosure of protected health information were passed through the Health Information Technology for Economic and Clinical Health, or HITECH, Act provisions of the American Recovery and Reinvestment Act of 2009 and corresponding implementing regulations. CMS posted the Interim Final Rule with Comment, or IFC, adopting operating rules for two electronic transactions: eligibility for a health plan and health care claims status. Based on the comments received on the IFC, CMS has decided not to change any of the policies established in the rule. Thus, the interim final rule became the final rule. The rule had a January 1, 2013 compliance date and we believe we have effectively complied with the requirements of the rule.
The federal Gramm-Leach-Bliley Act generally places restrictions on the disclosure of non-public information to non-affiliated third parties, and requires financial institutions, including insurers, to provide customers with notice regarding how their non-public personal information is used, including an opportunity to “opt out” of certain disclosures. State departments of insurance and certain federal agencies adopted implementing regulations as required by federal law. In addition, a number of states have adopted data security laws and/or regulations, regulating data security and/or requiring security breach notification, which may apply to us in certain circumstances.
Employee Retirement Income Security Act of 1974
The provision of services to certain employee welfare benefit plans is subject to the Employee Retirement Income Security Act of 1974, as amended, or ERISA, a complex set of laws and regulations subject to interpretation and enforcement by the Internal Revenue Service and the Department of Labor. ERISA regulates certain aspects of the relationships between us, the employers that maintain employee welfare benefit plans subject to ERISA and participants in such plans. Some of our administrative services and other activities may also be subject to regulation under ERISA. In addition, certain states require licensure or registration of companies providing third party claims administration services for benefit plans. We provide a variety of products and services to employee welfare benefit plans that are covered by ERISA. Plans subject to ERISA can also be subject to state laws and the question of whether and to what extent ERISA preempts a state law has been, and will continue to be, interpreted by many courts.
HMO and Insurance Holding Company Laws, including Risk-Based Capital Requirements
We are regulated as an insurance holding company and are subject to the insurance holding company acts of the states in which our insurance company and HMO subsidiaries are domiciled. These acts contain certain reporting requirements as well as restrictions on transactions between an insurer or HMO and its affiliates. These holding company laws and regulations generally require insurance companies and HMOs within an insurance holding company system to register with the insurance department of each state where they are domiciled and to file with those states’ insurance departments certain reports describing capital structure, ownership, financial condition, certain intercompany transactions and general business operations. In addition, various notice and reporting requirements generally apply to transactions between insurance companies and HMOs and their affiliates within an insurance holding company system, depending on the size and nature of the transactions. Some insurance holding company laws and regulations require prior regulatory approval or, in certain circumstances, prior notice of certain material intercompany transfers of assets as well as certain transactions between insurance companies, HMOs, their parent holding companies and affiliates. Among other provisions, state insurance and HMO laws may restrict the ability of our regulated subsidiaries to pay dividends.
Additionally, the holding company acts of the states in which our subsidiaries are domiciled restrict the ability of any person to obtain control of an insurance company or HMO without prior regulatory approval. Under those statutes, without such approval (or an exemption), no person may acquire any voting security of an insurance holding company, which controls an insurance company or HMO, or merge with such a holding company, if as a result of such transaction such person would “control” the insurance holding company. “Control” is generally defined as the direct or indirect power to direct or cause the direction of the management and policies of a person and is presumed to exist if a person directly or indirectly owns or controls 10% or more of the voting securities of another person.
The states of domicile of our regulated subsidiaries have statutory risk-based capital, or RBC, requirements for health and other insurance companies and HMOs based on the RBC Model Act. These RBC requirements are intended to assess the capital adequacy of life and health insurers and HMOs, taking into account the risk characteristics of a company’s investments and products. In general, under these laws, an insurance company or HMO must submit a report of its RBC level to the insurance department or insurance commissioner of its state of domicile for each calendar year. The law requires
-
22
-
increasing degrees of regulatory oversight and intervention as a company’s RBC declines. As of
December 31, 2014
, the RBC levels of our insurance and HMO subsidiaries exceeded all RBC thresholds.
Guaranty Fund Assessments
Under insolvency or guaranty association laws in most states, insurance companies can be assessed for amounts paid by guaranty funds for policyholder losses incurred when an insurance company becomes insolvent. Most state insolvency or guaranty association laws currently provide for assessments based upon the amount of premiums received on insurance underwritten within such state (with a minimum amount payable even if no premium is received). Under many of these guaranty association laws, assessments against insurance companies that issue policies of accident or sickness insurance are made retrospectively. Some states permit insurers to recover assessments paid through full or partial premium tax offsets or through future policyholder assessments.
States’ adoption of the revised NAIC Model Guaranty Fund Act will tend to decrease our liability for insolvent insurers. The revised act reduces the premium base on which assessments are calculated, by omitting Medicare Parts C and D premium from the assessment base.
While the amount and timing of any future assessments cannot be predicted with certainty, we believe that future guaranty association assessments for insurer insolvencies will not have a material adverse effect on our liquidity and capital resources with the exception of potential exposure related to the Penn Treaty Network America Insurance Company and its subsidiary American Network Insurance Company insolvency as discussed in Note 13, “Commitments and Contingencies”, to our audited consolidated financial statements included in Part II, Item 8 of this Annual Report on Form 10-K.
Employees
At
December 31, 2014
, we had approximately 51,500 employees. Our employees are an important asset, and we seek to develop them to their full potential. We believe that our relationship with our employees is good.
Available Information
We are a large accelerated filer (as defined in Rule 12b-2 of the Securities Exchange Act of 1934, as amended, or Exchange Act) and are required, pursuant to Item 101 of Regulation S-K, to provide certain information regarding our website and the availability of certain documents filed with or furnished to the U.S. Securities and Exchange Commission, or SEC. Our Internet website is
www.antheminc.com
. We have included our Internet website address throughout this Annual Report on Form 10-K as textual reference only. The information contained on our Internet website is not incorporated into this Annual Report on Form 10-K. We make available, free of charge, by mail or through our Internet website, our Annual Report on Form 10-K, Quarterly Reports on Form 10-Q, Current Reports on Form 8-K, and amendments to those reports filed or furnished pursuant to Section 13(a) or 15(d) of the Exchange Act as soon as reasonably practicable after we electronically file such material with or furnish it to the SEC. We also include on our Internet website our Corporate Governance Guidelines, our Standards of Ethical Business Conduct and the charter of each standing committee of our Board of Directors. In addition, we intend to disclose on our Internet website any amendments to, or waivers from, our Standards of Ethical Business Conduct that are required to be publicly disclosed pursuant to rules of the SEC and the New York Stock Exchange, or NYSE. Anthem, Inc. is an Indiana corporation incorporated on July 17, 2001.
ITEM 1A. RISK FACTORS.
The following factors, among others, could cause actual results to differ materially from those contained in forward-looking statements made in this Annual Report on Form 10-K and presented elsewhere by management from time to time. Such factors, among others, may have a material adverse effect on our business, financial condition, and results of operations and you should carefully consider them. It is not possible to predict or identify all such factors. Consequently, you should not consider any such list to be a complete statement of all our potential risks or uncertainties. Because of these and other factors, past performance should not be considered an indication of future performance.
-
23
-
Federal Health Care Reform together with the changes in federal and state regulations that have been, and continue to be, enacted to implement it, could adversely affect our business, cash flows, financial condition and results of operations.
The passage of Health Care Reform during 2010 and subsequent regulations represent significant changes to the U.S. health care system.
The legislation and regulations are far-reaching and are intended to expand access to health insurance coverage over time by increasing the eligibility thresholds for most state Medicaid programs and providing certain other individuals and small businesses with tax credits to subsidize a portion of the cost of health insurance coverage.
The legislation includes a requirement that most individuals obtain health insurance coverage beginning in 2014. In addition, the new laws impose significant fees, assessments and taxes on us and other health insurers, health plans and other industry participants. Health Care Reform imposes an annual industry-wide health insurer fee which was $8.0 billion beginning in 2014 and growing to $14.3 billion by 2018 and increasing annually thereafter. This health insurance fee is not deductible for income tax purposes and will be allocated pro rata among us and other industry participants based on net premiums written. Health Care Reform also imposes industry-wide reinsurance assessments of $12.0 billion in 2014, and $8.0 billion and $5.0 billion in 2015 and 2016, respectively. Insurance companies will pay the fees based upon insured members whereas self-insured entities will pay them directly to HHS. As we are one of the nation's largest health benefits companies, we expect our share of the Health Care Reform fees, assessments and taxes will continue to be significant. There is some uncertainty whether we will be able to include all or a portion of these fees, assessments and taxes in our premium rates.
Health Care Reform also imposes new regulations on the health insurance sector, including, but not limited to, guaranteed coverage and expanded benefit requirements; prohibitions on some annual and all lifetime limits on amounts paid on behalf of or to our members; increased restrictions on rescinding coverage; establishment of minimum
MLR
and customer rebate requirements;
creation of a federal rate review process; a requirement to cover preventive services on a first dollar basis; the establishment of public exchanges and essential benefit packages and greater limitations on how we price certain of our products. The legislation also reduces the reimbursement levels for our health plans participating in the Medicare Advantage program over time. There are also limitations on the amount of executive compensation that is deductible for income tax purposes.
The legislation also contains risk adjustment provisions applicable to the Individual and Small Group markets that took effect in 2014. These risk adjustment provisions effectively transfer funds from health plans with relatively lower risk enrollees to plans with relatively higher risk enrollees to help protect against adverse selection. Effectively adapting to these risk adjustment provisions has required us to modify our operational and strategic initiatives to focus on and manage different populations of potential members than we have in the past. If we are not able to successfully design and implement operational and strategic initiatives to adapt to these changes in certain of our markets, our financial condition and results of operations may be adversely affected.
Some of the provisions of Health Care Reform became effective immediately upon enactment, while most of the other provisions became effective in January 2014, with the remaining provisions to be phased in over the next several years. These changes could impact us through potential disruption to the employer-based market, potential cost shifting in the health care delivery system to insurance companies and limitations on the ability to increase premiums to meet costs. We have dedicated, and will continue to dedicate, material resources and incurred, and will continue to incur, material expenses to implement and comply with Health Care Reform at both the state and federal levels, including implementing and complying with future regulations that provide guidance on and clarification of significant portions of the legislation. The Health Care Reform law and regulations are likely to have significant effects on our future operations, which, in turn, could impact the value of our business model and results of operations, including potential impairments of our goodwill and other intangible assets. Difficulties and delays with regard to implementation of provisions of Health Care Reform in 2013 and 2014, including with regard to the functionality of the public exchanges and the lack of full cooperation and coordination between federal and state authorities as to implementation of Health Care Reform, have increased uncertainties and made our planning relating to Health Care Reform more difficult and unpredictable, which increases the risk that we will experience unanticipated adverse consequences arising out of Health Care Reform.
Finally, federal and state regulatory agencies may further restrict our ability to obtain new product approvals, implement changes in premium rates or impose additional restrictions, under new or existing laws that could adversely affect our business, cash flows, financial condition and results of operations.
-
24
-
Changes in the regulation of our business by state and federal regulators may adversely affect our business, cash flows, financial condition and results of operations.
Our insurance, managed health care and HMO subsidiaries are subject to extensive regulation and supervision by the insurance, managed health care or HMO regulatory authorities of each state in which they are licensed or authorized to do business, as well as to regulation by federal and local agencies. We cannot assure that future regulatory action by state insurance or HMO authorities or federal regulatory authorities will not have a material adverse effect on the profitability or marketability of our health benefits or managed care products or on our business, financial condition and results of operations. In addition, because of our participation in government-sponsored programs such as Medicare and Medicaid, a number of our subsidiaries are also subject to regulation by CMS and state Medicaid agencies, and to changes in government regulations or policy with respect to, among other things, reimbursement levels, eligibility requirements and additional governmental participation which could also adversely affect our business, financial condition and results of operations. In addition, we cannot ensure that application of the federal and/or state tax regulatory regime that currently applies to us will not, or future tax regulation by either federal and/or state governmental authorities concerning us could not, have a material adverse effect on our business, operations or financial condition.
State legislatures will continue to focus on health care delivery and financing issues. Most states are very focused on how to manage and reduce their budgets and are exploring ways to mitigate costs. As such, some states have acted to reduce or limit increases to premium payments. Others have enacted, or are contemplating enacting, significant reform of their health insurance markets to include provisions affecting both public programs and privately-financed health insurance arrangements. In addition, California has enacted legislation to establish minimum benefit expense ratio thresholds and continues to consider legislative proposals to require prior regulatory approval of premium rate increases. If enacted into law, these state proposals could have a material adverse impact on our business, cash flows, operations or financial condition.
The U.S. Supreme Court has determined that significant portions of the ACA, including the provisions regarding public exchanges, are constitutional. As a result, some states have developed their own public exchanges, while other states are relying on HHS to operate the public exchange in their states or are implementing partnership exchanges with the federal government. These multiple public exchange options have led to increased uncertainties and made our planning for these public exchanges more difficult. The Supreme Court decision also permitted states to opt out of the elements of Health Care Reform that require expansion of Medicaid coverage in January 2014 without losing their current federal Medicaid funding. A number of states in which we offer Medicaid products, including Florida, Georgia, Kansas, Louisiana, South Carolina, Tennessee, Texas, Virginia and Wisconsin, have indicated their current decision to opt out of Medicaid expansion, at least for the present time. If states allow certain programs to expire or choose to opt out of Medicaid expansion, we could experience reduced Medicaid enrollment and reduced growth opportunities.
The U.S Supreme Court is now considering a case that challenges the premium tax subsidies and whether the subsidies are available for eligible residents in all states or only those residents in states which have established state-based public exchanges. In January 2014, the D.C District Court upheld the subsidies for both state-based and federal public exchanges and in November 2014, the U.S. Supreme Court issued a writ of certiorari and is expected to decide the case during its current term, which ends in June 2015. If the decision alters the availability of the subsidies, it may have a material adverse effect on our enrollment, cash flows and results of operations.
Additionally, from time to time, Congress has considered, or may consider in the future, various forms of managed care reform legislation which, if adopted, could fundamentally alter the treatment of coverage decisions under ERISA. There have been legislative attempts to limit ERISA’s preemptive effect on state laws and litigants’ ability to seek damages beyond the benefits offered under their plans. If adopted, such limitations could increase our liability exposure, could permit greater state regulation of our operations, and could expand the scope of damages, including punitive damages, litigants could be awarded. While we cannot predict if any of these initiatives will ultimately become effective or, if enacted, what their terms will be, their enactment could increase our costs, expose us to expanded liability or require us to revise the ways in which we conduct business.
-
25
-
Our inability to contain health care costs, implement increases in premium rates on a timely basis, maintain adequate reserves for policy benefits or maintain our current provider agreements may adversely affect our business and profitability.
Our profitability depends in large part on accurately predicting health care costs and on our ability to manage future health care costs through underwriting criteria, medical management, product design and negotiation of favorable provider contracts. Last minute changes in the implementation of Health Care Reform at the end of 2013 and in the spring of 2014, in particular those relating to difficulties with the functionality of the public exchanges, may erode the Individual and Small Group pools so that our assumptions underlying the pricing and design of our public exchange products prove to be inaccurate in a way that materially adversely affects the expected profitability of those products. Government-imposed limitations on Medicare and Medicaid reimbursement have also caused the private sector to bear a greater share of increasing health care costs. Changes in health care practices, demographic characteristics, inflation, new technologies, the cost of prescription drugs, clusters of high cost cases, changes in the regulatory environment and numerous other factors affecting the cost of health care may adversely affect our ability to predict and manage health care costs, as well as our business, financial condition and results of operations. Relatively small differences between predicted and actual health care costs as a percentage of premium revenues can result in significant changes in our results of operations, particularly with respect to our products sold through the public exchanges, as we and our competitors have limited experience with pricing such products or the utilization rates for medical or other covered services by members who purchase our products through such exchanges. The public exchanges may increase the risk that our products will be selected by individuals who have a higher risk profile or utilization rate than the pool of participants we anticipated when we established the pricing for these public exchange products. Therefore, health care benefit costs in excess of our cost projections reflected in our public exchange product pricing cannot be recovered in the current premium period through higher premiums; however, in certain circumstances, Federal risk adjustment mechanisms, including risk adjustment payments, risk corridors and reinsurance, could help offset health care benefit costs in excess of our projections. If it is determined that our assumptions regarding cost trends, utilization, enrollment, adverse selection, acuity and other assumptions utilized in setting our premium rates are significantly different than actual results, even with these risk adjustment mechanisms, our income statement and financial position could be adversely affected.
In addition to the challenge of managing health care costs, we face pressure to contain premium rates. Our customers may renegotiate their contracts to seek to contain their costs or may move to a competitor to obtain more favorable premiums. Further, federal and state regulatory agencies may restrict our ability to implement changes in premium rates. For example, the ACA includes an annual rate review requirement to prohibit unreasonable rate increases, and our plans may be excluded from participating in the public exchanges if they are deemed to have a history of “unreasonable” rate increases. Fiscal concerns regarding the continued viability of programs such as Medicare and Medicaid may cause decreasing reimbursement rates, delays in premium payments or a lack of sufficient increase in reimbursement rates for government-sponsored programs in which we participate. A limitation on our ability to increase or maintain our premium or reimbursement levels or a significant loss of membership resulting from our need to increase or maintain premium or reimbursement levels could adversely affect our business, cash flows, financial condition and results of operations.
The reserves that we establish for health insurance policy benefits and other contractual rights and benefits are based upon assumptions concerning a number of factors, including trends in health care costs, expenses, general economic conditions and other factors. To the extent the actual claims experience is less favorable than estimated based on our underlying assumptions, our incurred losses would increase and future earnings could be adversely affected.
Our profitability is dependent in part upon our ability to contract on favorable terms with hospitals, physicians and other health care providers. The failure to maintain or to secure cost-effective health care provider contracts may result in a loss of membership or higher medical costs, which could adversely affect our business. In addition, ACO practice management companies, which aggregate physician practices for administrative efficiency and marketing leverage, and other organizational structures that physicians, hospitals and other care providers choose may change the way that these providers interact with us and may change the competitive landscape. Such organizations or groups of physicians may compete directly with us, which may impact our relationship with these providers or affect the way that we price our products and estimate our costs and may require us to incur costs to change our operations, and our results of operations, financial position and cash flow could be adversely affected. Further, our inability to contract with providers, or if providers attempt to use their market position to negotiate more favorable contracts or place us at a competitive disadvantage, or the inability of providers to provide adequate care, could adversely affect our business. In addition, we do not have contracts with all providers that
-
26
-
render services to our members and, as a result, do not have a pre-established agreement about the amount of compensation those out-of-network providers will accept for the services they render, which can result in significant litigation or arbitration proceedings.
A significant reduction in the enrollment in our health benefits programs could have an adverse effect on our business and profitability.
A significant reduction in the number of enrollees in our health benefits programs could adversely affect our business, financial condition and results of operations. Factors that could contribute to a reduction in enrollment include: reductions in workforce by existing customers; general economic downturn that results in business failures and high unemployment rates; employers no longer offering certain health care coverage as an employee benefit or electing to offer this coverage on a voluntary, employee-funded basis; state and federal regulatory changes; failure to obtain new customers or retain existing customers; premium increases and benefit changes; our exit from a specific market; negative publicity and news coverage; participation on public exchanges and related underwriting changes; and failure to attain or maintain nationally recognized accreditations.
There are various risks associated with participating in Medicaid and Medicare programs, including dependence upon government funding and the timing of payments, compliance with government contracts and increased regulatory oversight.
We contract with various state and federal agencies, including CMS, to provide managed health care services, including Medicare Advantage plans, Medicare Supplement plans, Medicare approved prescription drug plans, Medicaid, TANF, SPD, LTSS, CHIP and ACA-related Medicaid expansion programs. We also provide various administrative services for several other entities offering medical and/or prescription drug plans to their Medicare eligible members through our affiliated companies and we offer employer group waiver plans which provide medical and/or prescription drug coverage to retirees. We are also participating in Medicare and Medicaid dual eligible programs in several states. These programs in our Government Business segment have been the subject of recent regulatory reform initiatives, including Health Care Reform, which are still in the process of being implemented. It is difficult to predict the future impact of Health Care Reform on our Government Business segment due to Health Care Reform’s complexity, gradual and delayed implementation, and possible amendment. Changes in Health Care Reform have required us to make investments in new products, services and technologies, which investments may not be realized due to possible delays and amendments that continue to occur. Health Care Reform, other regulatory reform initiatives or additional changes in existing laws or regulations, or their interpretations, could have a material adverse effect on our business, cash flow, financial condition and results of operations.
Revenues from the Medicare and Medicaid programs are dependent, in whole or in part, upon annual funding from the federal government and/or applicable state governments. The base premium rate paid by each state or federal agency differs depending upon a combination of various factors such as defined upper payment limits, a member’s health status, age, gender, county or region, benefit mix, member eligibility category and risk scores. Future levels of Medicare and Medicaid rates may be affected by continued government efforts to contain costs and may be further affected by state and federal budgetary constraints. If the federal government or any state in which we operate were to decrease rates paid to us, or pay us less than the amount necessary to keep pace with our cost trends, it could have a material adverse effect on our business, financial condition and results of operations. Further, certain of our contracts with the states are subject to cancellation in the event of the unavailability of state funds. In addition, the various states’ new Medicare and Medicaid dual eligible programs are still subject to uncertainty surrounding payment rates and other requirements, which could affect where we seek to participate in these new programs. An unexpected reduction, inadequate government funding or significantly delayed payments for these programs may adversely affect our revenues, cash flow and financial results.
A portion of our premium revenue comes from CMS through our Medicare Advantage and Medicare Part D contracts. As a consequence, our Medicare Advantage and Medicare Part D plans are dependent on federal government funding levels. The premium rates paid to Medicare plans are established based on benchmarks which are now tied to a percentage of Medicare fee for service, although the rates differ depending on a combination of factors, including upper payment limits established by CMS, a member’s health profile and status, age, gender, county or region, benefit mix, member eligibility categories and risk scores. Beginning in 2014, Medicare Advantage and Medicare Part D plans became subject to MLR rules. Continuing government efforts to contain health care related expenditures, including prescription drug cost, and other federal budgetary constraints that result in changes in the Medicare program, including changes with respect to funding, could lead to
-
27
-
reductions in the amount of reimbursement, or other changes that could have a material adverse effect on our business, cash flow, financial condition and results of operations. Risks associated with the Medicare Advantage and Medicare Part D plans include potential uncollectability of receivables resulting from processing and/or verifying enrollment, inadequacy of underwriting assumptions, inability to receive and process correct information (including inability due to systems issues by the federal government, the applicable state government or us), uncollectability of premiums from members, increased medical or pharmaceutical costs, overpayments identified as a result of ongoing auditing and monitoring activities, and the limited enrollment periods in this business. While we believe we have adequately reviewed our assumptions and estimates regarding these complex and wide-ranging programs under Medicare Parts C and D, including those related to collectability of receivables and establishment of liabilities, the actual results may be materially different than our assumptions and estimates and could have a material adverse effect on our business, financial condition and results of operations. There is also the possibility that Medicare Advantage Special Needs plans will not be re-authorized by Congress. Without Congressional action, these plans will expire on December 31, 2016. If the Special Needs plans are not re-authorized, there could be a loss of revenue and it would become more difficult to coordinate Medicare benefits with other coverage.
Our contracts with the various state governmental agencies and CMS contain certain provisions regarding data submission, provider network maintenance, quality measures, claims payment, continuity of care, call center performance and other requirements specific to state and federal program regulations. If we fail to comply with these requirements, we may be subject to fines, penalties, liquidated damages and retrospective adjustments in payments made to our health plans, that could impact our profitability. Additionally, we could be required to file a corrective plan of action with additional penalties for noncompliance, including a negative impact on future membership enrollment levels. Further, certain of our CMS and state Medicaid contracts are subject to a competitive procurement process, and if our existing contracts are not renewed or if we are not awarded new contracts as a result of this competitive procurement process, this could have a material adverse effect on our business, cash flows, financial condition and results of operations.
In addition to the contractual requirements affecting our participation in Medicaid and Medicare programs, we are also subject to various state and federal health care laws and regulations, including those directed at preventing fraud and abuse in government funded programs. Failure to comply with these laws and regulations could result in investigations or litigation, with the imposition of fines, restrictions or exclusions from program participation or the imposition of corporate integrity agreements or other agreements with a federal or state governmental agency that could adversely impact our business, cash flows, financial condition and results of operations.
Further, CMS has been conducting audits of our Medicare Advantage health plans to validate the diagnostic data and patient claims that are submitted to CMS. These audits may result in retrospective adjustments in payments made to our health plans. In addition, if we fail to report and correct errors discovered through our own auditing procedures or during a CMS audit or otherwise fail to comply with the applicable laws and regulations, we could be subject to fines, civil penalties or other sanctions which could have a material adverse effect on our ability to participate in these programs, and on our financial condition, cash flows and results of operations. The ACA also established recovery audit programs for Medicare Parts C and D. The Medicare Part D Recovery Audit Contractor, or RAC, has been auditing Medicare Part D claims and recouping overpayments since 2012. A Medicare Part C RAC has not yet been named but CMS expects to award a Medicare Part C RAC contract in the near future, which could increase the amount of audits and subsequent recoupments by the federal government.
The ACA also authorized state Medicaid programs to implement RAC programs similar to Medicare RAC programs and a number of states have done so. This could increase the amount of audits and subsequent recoupment by the federal and state governments, which could adversely affect our financial condition and results of operations.
In addition, there are an increasing number of investigations regarding compliance with various provisions of the ACA. These investigations are being conducted by both CMS and state regulators. As a result, we could be subject to multiple investigations of the same issue. These investigations, and possible resulting enforcement actions, could result in penalties and the imposition of corrective action plans and/or changes to industry practices, which could adversely affect our ability to market our products.
-
28
-
Regional concentrations of our business may subject us to economic downturns in those regions.
Most of our revenues are generated in the states of California, Colorado, Connecticut, Georgia, Indiana, Kentucky, Maine, Maryland, Missouri, Nevada, New Hampshire, New York, Ohio, Tennessee, Texas, Virginia and Wisconsin. Due to this concentration of business in these states, we are exposed to potential losses resulting from the risk of state specific or regional economic downturns impacting these states. If such negative economic conditions do not improve, we may experience a reduction in existing and new business, which could have a material adverse effect on our business, cash flows, financial condition and results of operations.
The health benefits industry is subject to negative publicity, which could adversely affect our business and profitability.
The health benefits industry is subject to negative publicity, which can arise from, among other things, the ongoing debate over Health Care Reform. Negative publicity may result in increased regulation and legislative review of industry practices, which may further increase our costs of doing business and adversely affect our profitability by: adversely affecting our ability to market our products and services; requiring us to change our products and services; or increasing the regulatory burdens under which we operate.
In addition, as long as we use the Blue Cross and Blue Shield names and marks in marketing our health benefits products and services, any negative publicity concerning the BCBSA or other BCBSA licensees may adversely affect us and the sale of our health benefits products and services. Any such negative publicity could adversely affect our business, cash flows, financial condition and results of operations.
We face competition in many of our markets and customers and brokers have flexibility in moving between competitors.
As a health benefits company, we operate in a highly competitive environment and in an industry that is currently subject to significant changes from legislative reform, business consolidations, new strategic alliances, aggressive marketing practices by other health benefits organizations and market pressures brought about by an informed and organized customer base, particularly among large employers. For example, we began to compete for sales on public exchanges in 2014, which has required, and will continue to require, us to develop or acquire the tools (including social media tools) necessary to interact with the exchanges and with consumers using the exchanges, increase our focus on individual customers and improve our consumer-focused sales and marketing, customer interfaces and product offerings. These factors have produced and will likely continue to produce significant pressures on the profitability of health benefits companies.
We also will have to respond to pricing and other actions taken by existing competitors and potentially disruptive new entrants. Due to the price transparency provided by public exchanges, in the market for individual health insurance we face competitive pressures from existing and new competitors. These risks may be enhanced if employers shift to defined contribution health care benefits plans and make greater utilization of private insurance exchanges or encourage their employees to purchase health insurance on the public exchanges. We can provide no assurance that we will be able to compete successfully on these public exchanges or that we will be able to benefit from any opportunities presented by such exchanges. If we are not competitive on these public exchanges or are unsuccessful in reducing our cost structure, our future growth and profitability may be adversely impacted.
We are currently dependent on the non-exclusive services of independent agents and brokers in the marketing of our health care products, particularly with respect to individuals, seniors and small employer group customers. We face intense competition for the services and allegiance of these independent agents and brokers, who may also market the products of our competitors. Our relationship with our brokers and independent agents could be adversely impacted by changes in our business practices to address Health Care Reform legislation, including potential reductions in commissions and consulting fees paid to agents and brokers. We cannot ensure that we will be able to compete successfully against current and future competitors or that competitive pressures faced by us will not materially and adversely affect our business, cash flows, financial condition and results of operations.
-
29
-
We face intense competition to attract and retain employees. Further, managing key executive succession and retention is critical to our success.
We are dependent on retaining existing employees, attracting additional qualified employees to meet current and future needs and achieving productivity gains from our investment in technology. We face intense competition for qualified employees, and there can be no assurance that we will be able to attract and retain such employees or that such competition among potential employers will not result in increasing salaries. An inability to retain existing employees or attract additional employees could have a material adverse effect on our business, cash flows, financial condition and results of operations.
We would be adversely affected if we fail to adequately plan for succession of our President and Chief Executive Officer and other senior management and retention of key executives. While we have succession plans in place for members of our senior management, and continue to review and update those plans, and we have employment arrangements with certain key executives, these plans and arrangements do not guarantee that the services of our senior executives will continue to be available to us or that we will be able to attract and retain suitable successors.
A change in our health care product mix may impact our profitability.
Our health care products that involve greater potential risk generally tend to be more profitable than administrative services products and those health care products where the employer groups assume the underwriting risks. Individuals and small employer groups are more likely to purchase our higher-risk health care products because such purchasers are generally unable or unwilling to bear greater liability for health care expenditures. Typically, government-sponsored programs also involve our higher-risk health care products. It is not yet clear whether our products sold on the public exchanges will be more or less profitable products. A shift of enrollees from more profitable products to less profitable products could have a material adverse effect on our financial condition and results of operations.
As a holding company, we are dependent on dividends from our subsidiaries. These dividends are necessary to pay our outstanding indebtedness. Our regulated subsidiaries are subject to state regulations, including restrictions on the payment of dividends, maintenance of minimum levels of capital and restrictions on investment portfolios.
We are a holding company whose assets include all of the outstanding shares of common stock (or other ownership interest) of our subsidiaries including our intermediate holding companies and regulated insurance and HMO subsidiaries. Our subsidiaries are separate legal entities. As a holding company, we depend on dividends from our subsidiaries. Furthermore, our subsidiaries are not obligated to make funds available to us, and creditors of our subsidiaries will have a superior claim to certain of our subsidiaries’ assets. Among other restrictions, state insurance and HMO laws may restrict the ability of our regulated subsidiaries to pay dividends. In some states we have made special undertakings that may limit the ability of our regulated subsidiaries to pay dividends. In addition, our subsidiaries’ ability to make any payments to us will also depend on their earnings, the terms of their indebtedness, business and tax considerations and other legal restrictions. Our ability to repurchase shares or pay dividends in the future to our shareholders and meet our obligations, including paying operating expenses and debt service on our outstanding and future indebtedness, will depend upon the receipt of dividends from our subsidiaries. An inability of our subsidiaries to pay dividends in the future in an amount sufficient for us to meet our financial obligations may materially adversely affect our business, cash flows, financial condition and results of operations.
Most of our regulated subsidiaries are subject to RBC standards, imposed by their states of domicile. These laws are based on the RBC Model Act adopted by the NAIC and require our regulated subsidiaries to report their results of risk-based capital calculations to the departments of insurance and the NAIC. Failure to maintain the minimum RBC standards could subject our regulated subsidiaries to corrective action, including state supervision or liquidation. Our regulated subsidiaries are currently in compliance with the risk-based capital or other similar requirements imposed by their respective states of domicile. As discussed in more detail below, we are a party to license agreements with the BCBSA which contain certain requirements and restrictions regarding our operations, including minimum capital and liquidity requirements, which could restrict the ability of our regulated subsidiaries to pay dividends.
Our regulated subsidiaries are subject to state laws and regulations that require diversification of our investment portfolios and limit the amount of investments in certain riskier investment categories, such as below-investment-grade fixed maturity securities, mortgage loans, real estate and equity investments, which could generate higher returns on our investments. Failure to comply with these laws and regulations might cause investments exceeding regulatory limitations to
-
30
-
be treated as non-admitted assets for purposes of measuring statutory surplus and risk-based capital, and, in some instances, require the sale of those investments.
We have substantial indebtedness outstanding and may incur additional indebtedness in the future. Such indebtedness could also adversely affect our ability to pursue desirable business opportunities.
Our debt service obligations require us to use a portion of our cash flow to pay interest and principal on debt instead of for other corporate purposes, including funding future expansion. If our cash flow and capital resources are insufficient to service our debt obligations, we may be forced to seek extraordinary dividends from our subsidiaries, sell assets, seek additional equity or debt capital or restructure our debt. However, these measures might be unsuccessful or inadequate in permitting us to meet scheduled debt service obligations.
We may also incur future debt obligations that might subject us to restrictive covenants that could affect our financial and operational flexibility. Our breach or failure to comply with any of these covenants could result in a default under our credit agreement. If we default under our credit agreement, the lenders could cease to make further extensions of credit or cause all of our outstanding debt obligations under our credit agreement to become immediately due and payable, together with accrued and unpaid interest. If the indebtedness under our notes or our credit agreement is accelerated, we may be unable to repay or finance the amounts due. Indebtedness could also limit our ability to pursue desirable business opportunities, and may affect our ability to maintain an investment grade rating for our indebtedness.
A downgrade in our credit ratings could have an adverse effect on our business, financial condition and results of operations.
Claims-paying ability and financial strength ratings by nationally recognized statistical rating organizations are an important factor in establishing the competitive position of insurance companies and health benefits companies. Each of the credit rating agencies reviews its ratings periodically and there can be no assurance that our current credit ratings will be maintained in the future. We believe our strong credit ratings are an important factor in marketing our products to customers, since credit ratings information is broadly disseminated and generally used throughout the industry. If our credit ratings are downgraded or placed under review, with possible negative implications, such actions could adversely affect our business, financial condition and results of operations. These credit ratings reflect each credit rating agency’s opinion of our financial strength, operating performance and ability to meet our obligations to policyholders and creditors, and are not evaluations directed toward the protection of investors in our common stock.
We face risks related to litigation.
We are, or may in the future, be a party to a variety of legal actions that may affect any business, such as employment and employment discrimination-related suits and administrative charges before government agencies, employee benefit claims, breach of contract actions, tort claims and intellectual property-related litigation. In addition, because of the nature of our business, we are subject to a variety of legal actions relating to our business operations, including the design, administration and offering of our products and services. These could include claims relating to the denial of health care benefits; the rescission of health insurance policies; development or application of medical policy; medical malpractice actions; product liability claims; allegations of anti-competitive and unfair business activities; provider disputes over compensation; provider tiering programs; termination of provider contracts; the recovery of overpayments from providers; self-funded business; disputes over co-payment calculations; reimbursement of out-of-network claims; the failure to disclose certain business or corporate governance practices; the failure to comply with various state or federal laws, including but not limited to, ERISA and the Mental Health Parity Act; and customer audits and contract performance, including government contracts. These actions or proceedings could have a material adverse effect on our business, cash flows, financial condition and results of operations.
In addition, we are also involved in, or may in the future be party to, pending or threatened litigation of the character incidental to the business transacted, arising out of our operations or our 2001 demutualization, including, but not limited to, breaches of security and violations of privacy requirements (including as a result of the cyber attack reported by us in February 2015, as more fully described under Note 13, “Commitments and Contingencies -
Data Breach,
” to our audited consolidated financial statements included in Part II, Item 8 of this Annual Report on Form 10-K), shareholder actions, compliance with federal and state laws and regulations (including
qui tam
or “whistleblower” actions), or sales and
-
31
-
acquisitions of businesses or assets. We are from time to time involved as a party in various governmental investigations, audits, reviews and administrative proceedings, including challenges to the award of government contracts by disappointed bidders. These investigations, audits and reviews include routine and special investigations by various state insurance departments, state attorneys general and the U.S. Attorney General. Such investigations could result in the imposition of civil or criminal fines, penalties and other sanctions. Liabilities that may result from these actions could have a material adverse effect on our cash flows, results of operations or financial position.
Recent court decisions and legislative activity may increase our exposure for any of these types of claims. In some cases, substantial non-economic (including injunctive relief), treble or punitive damages may be sought. We currently have insurance coverage for some of these potential liabilities. Other potential liabilities may not be covered by insurance, insurers may dispute coverage or the amount of insurance may not be enough to cover the damages awarded. In addition, certain types of damages may not be covered by insurance, and insurance coverage for all or certain forms of liability may become unavailable or prohibitively expensive in the future. Any adverse judgment against us resulting in such damage awards could have an adverse effect on our cash flows, results of operations and financial condition.
Further, litigation brought against the federal and some state governments over Health Care Reform could have a material adverse effect on our business, cash flows, financial condition and results of operations as changes to Health Care Reform resulting from this litigation create uncertainty over the applicability and enforceability of portions of the law and the various regulations, which impacts our strategy and could negatively impact our future growth opportunities.
Our future obligations for state guaranty association assessments could increase in the event that Health Care Reform and its implementation result in increased insolvencies of health plans.
Under insolvency or guaranty association laws in most states, insurance companies can be assessed for amounts paid by guaranty funds for policyholder losses incurred when an insurance company becomes insolvent. Most state insolvency or guaranty association laws provide for assessments based upon the amount of premiums received on insurance underwritten within such state. While in the past, health insurance company insolvencies have been infrequent, the changes to the U.S. health care system and markets and related uncertainties from implementation of Health Care Reform may result in increased insolvencies of health insurance companies covered by these state insolvency or guaranty association laws. In that event, we may experience increased guaranty association assessments for health insurer insolvencies, the amount and timing of which cannot be predicted with certainty.
There are various risks associated with providing health care services.
The direct provision of health care services by our CareMore subsidiary involves risks of additional litigation arising from medical malpractice actions based on our treatment decisions or brought against us or our physician associates for alleged malpractice or professional liability claims arising out of the delivery of health care and related services. In addition, liability may arise from maintaining health care premises that serve the public. If we fail to maintain adequate insurance coverage for these liabilities, or if such insurance is not available, the resulting costs could adversely affect our cash flows, financial condition or results of operations.
Additionally, many states in which we operate our CareMore subsidiary limit the practice of medicine to licensed individuals or professional organizations comprised of licensed individuals. Business corporations generally may not exercise control over the medical decisions of physicians (“corporate practice of medicine”) and we are not licensed to practice medicine. Rules and regulations relating to the practice of medicine, fee-splitting between physicians and referral sources, and similar issues vary from state to state. Further, certain federal and state laws, including those covering our Medicare and Medicaid plans, prohibit the offer, payment, solicitation, or receipt of any form of remuneration to induce, or in return for, the referral of patient care opportunities, including, but not limited to, Medicare patients (“anti-kickback rules”), and also generally prohibit physicians from making referrals to any entity providing certain designated health services if the referring physician or related person has an ownership or financial interest in the entity (“self-referral rules”).
We believe that our health care service operations comply with applicable rules and regulations regarding the corporate practice of medicine, fee-splitting, anti-kickback, self-referral and similar issues. However, any enforcement actions by governmental officials alleging non-compliance with these rules and regulations could adversely affect our business, cash flows, financial condition or results of operations.
-
32
-
We are a party to license agreements with the BCBSA that entitle us to the exclusive and in certain areas non-exclusive use of the Blue Cross and Blue Shield names and marks in our geographic territories. The termination of these license agreements or changes in the terms and conditions of these license agreements could adversely affect our business, financial condition and results of operations.
We use the Blue Cross and Blue Shield names and marks as identifiers for our products and services under licenses from the BCBSA. Our license agreements with the BCBSA contain certain requirements and restrictions regarding our operations and our use of the Blue Cross and Blue Shield names and marks, including: minimum capital and liquidity requirements imposed by the BCBSA; enrollment and customer service performance requirements; participation in programs that provide portability of membership between plans; disclosures to the BCBSA relating to enrollment and financial conditions; disclosures as to the structure of the Blue Cross and Blue Shield system in contracts with third parties and in public statements; plan governance requirements; a requirement that at least 80% (or, in the case of Blue Cross of California, substantially all) of a licensee’s annual combined local net revenue, as defined by the BCBSA, attributable to health care plans and related services within its service areas must be sold, marketed, administered or underwritten under the Blue Cross and Blue Shield names and marks; a requirement that at least 66 2/3% of a licensee’s annual combined national net revenue, as defined by the BCBSA, attributable to health care plans and related services must be sold, marketed, administered or underwritten under the Blue Cross and Blue Shield names and marks; a requirement that neither a plan nor any of its licensed affiliates may permit an entity other than a plan or a licensed affiliate to obtain control of the plan or the licensed affiliate or to acquire a substantial portion of its assets related to licensable services; a requirement that we divide our Board of Directors into three classes serving staggered three-year terms; a requirement that we guarantee certain contractual and financial obligations of our licensed affiliates; and a requirement that we indemnify the BCBSA against any claims asserted against it resulting from the contractual and financial obligations of any subsidiary that serves as a fiscal intermediary providing administrative services for Medicare Parts A and B. Failure to comply with the foregoing requirements could result in a termination of the license agreements.
The standards under the license agreements may be modified in certain instances by the BCBSA. For example, from time to time there have been proposals considered by the BCBSA to modify the terms of the license agreements to restrict various potential business activities of licensees. These proposals have included, among other things, a limitation on the ability of a licensee to make its provider networks available to insurance carriers or other entities not holding a Blue Cross or Blue Shield license. To the extent that such amendments to the license agreements are adopted in the future, they could have a material adverse effect on our future expansion plans or results of operations. Further, BCBS licensees have certain requirements to perform administrative services for members of other BCBS licensees. If we or another BCBS licensee is not in compliance with all legal requirements or are unable to perform administrative services as required, this could have an adverse effect on our members and our ability to maintain our licenses, which could have a material adverse effect on our business, cash flows, financial condition and results of operations.
Upon the occurrence of an event causing termination of the license agreements, we would no longer have the right to use the Blue Cross and Blue Shield names and marks or to sell Blue Cross and Blue Shield health insurance products and services in one or more of our service areas. Furthermore, the BCBSA would be free to issue a license to use the Blue Cross and Blue Shield names and marks in these service areas to another entity. Our existing Blue Cross and Blue Shield members would be provided with instructions for obtaining alternative products and services licensed by the BCBSA. Events that could cause the termination of a license agreement with the BCBSA include failure to comply with minimum capital requirements imposed by the BCBSA, failure to comply with governance requirements such as maintaining a classified board structure, a change of control or violation of the BCBSA ownership limitations on our capital stock, impending financial insolvency and the appointment of a trustee or receiver or the commencement of any action against a licensee seeking its dissolution. We believe that the Blue Cross and Blue Shield names and marks are valuable identifiers of our products and services in the marketplace.
Upon termination of a license agreement, the BCBSA would have the right to impose a “Re-establishment Fee” upon us, which would be used in part to fund the establishment of a replacement Blue Cross and/or Blue Shield licensee in the vacated service area. The fee is set at $98.33 per licensed enrollee. As of
December 31, 2014
we reported 28.6 million Blue Cross and/or Blue Shield enrollees. If the Re-establishment Fee was applied to our total Blue Cross and/or Blue Shield enrollees, we would be assessed approximately $2.8 billion by the BCBSA. Accordingly, termination of the license agreements would have a material adverse effect on our business, financial condition and results of operations.
-
33
-
Large-scale medical emergencies may have a material adverse effect on our business, cash flows, financial condition and results of operations.
Large-scale medical emergencies can take many forms and can cause widespread illness and death. For example, federal and state law enforcement officials have issued warnings about potential terrorist activity involving biological and other weapons. In addition, natural disasters such as hurricanes and the potential for a wide-spread pandemic of influenza coupled with the lack of availability of appropriate preventative medicines can have a significant impact on the health of the population of wide-spread areas. If the United States were to experience widespread bioterrorism or other attacks, large-scale natural disasters in our concentrated coverage areas or a large-scale pandemic or epidemic, our covered medical expenses could rise and we could experience a material adverse effect on our business, cash flows, financial condition and results of operations or, in the event of extreme circumstances, our viability could be threatened.
We have built a significant portion of our current business through mergers and acquisitions, joint ventures and strategic alliances and we expect to pursue such opportunities in the future.
The following are some of the risks associated with mergers and acquisitions, joint ventures and strategic alliances (collectively, “business combinations”) that could have a material adverse effect on our business, financial condition and results of operations:
|
•
|
some of the acquired businesses may not achieve anticipated revenues, earnings or cash flow, business opportunities, synergies, growth prospects and other anticipated benefits;
|
|
•
|
the goodwill or other intangible assets established as a result of our business combinations may be incorrectly valued or become non-recoverable;
|
|
•
|
we may assume liabilities that were not disclosed to us or which were under-estimated;
|
|
•
|
we may experience difficulties in integrating acquired businesses, be unable to integrate acquired businesses successfully or as quickly as expected, and be unable to realize anticipated economic, operational and other benefits in a timely manner, which could result in substantial costs and delays or other operational, technical or financial problems;
|
|
•
|
business combinations could disrupt our ongoing business, distract management, result in the loss of key employees, divert resources, result in tax costs or inefficiencies and make it difficult to maintain our current business standards, controls, information technology systems, policies and procedures;
|
|
•
|
we may finance future business combinations by issuing common stock for some or all of the purchase price, which could dilute the ownership interests of our shareholders;
|
|
•
|
we may also incur additional debt related to future business combinations; and
|
|
•
|
we would be competing with other firms, some of which may have greater financial and other resources, to acquire attractive companies.
|
The value of our intangible assets may become impaired.
Due largely to our past mergers, acquisitions and divestitures, goodwill and other intangible assets represent a substantial portion of our assets. If we make additional acquisitions it is likely that we will record additional intangible assets on our consolidated balance sheets.
In accordance with applicable accounting standards, we periodically evaluate our goodwill and other intangible assets to determine whether all or a portion of their carrying values may no longer be recoverable, in which case a charge to income may be necessary. This impairment testing requires us to make assumptions and judgments regarding the estimated fair value of our reporting units, including goodwill and other intangible assets (with indefinite lives). In addition, certain other intangible assets with indefinite lives, such as trademarks, are also tested separately. Estimated fair values developed based on our assumptions and judgments might be significantly different if other reasonable assumptions and estimates were to be used. If estimated fair values are less than the carrying values of goodwill and other intangible assets with indefinite lives in future impairment tests, or if significant impairment indicators are noted relative to other intangible assets subject to amortization, we may be required to record impairment losses against future income.
-
34
-
Any future evaluations requiring an impairment of our goodwill and other intangible assets could materially affect our results of operations and shareholders’ equity in the period in which the impairment occurs. A material decrease in shareholders’ equity could, in turn, negatively impact our debt ratings or potentially impact our compliance with existing debt covenants.
In addition, the estimated value of our reporting units may be impacted as a result of business decisions we make associated with the implementation of the various Health Care Reform regulations. Such decisions, which could unfavorably affect our ability to support the carrying value of certain goodwill and other intangible assets, could result in impairment charges in future periods.
Adverse securities and credit market conditions may significantly affect our ability to meet liquidity needs.
The securities and credit markets have in the past experienced higher than normal volatility, although current market conditions are more stable. In some cases, the markets have exerted downward pressure on availability of liquidity and credit capacity for certain issuers. We need liquidity to pay our operating expenses, make payments on our indebtedness and pay capital expenditures. The principal sources of our cash receipts are premiums, administrative fees, investment income, other revenue, proceeds from the sale or maturity of our investment securities, proceeds from borrowings and proceeds from the issuance of common stock under our employee stock plans.
Our access to additional financing will depend on a variety of factors such as market conditions, the general availability of credit, the volume of trading activities, the overall availability of credit to our industry, our credit ratings and credit capacity, as well as the possibility that customers or lenders could develop a negative perception of our long- or short-term financial prospects. Similarly, our access to funds may be impaired if regulatory authorities or rating agencies take negative actions against us. If one or a combination of these factors were to occur, our internal sources of liquidity may prove to be insufficient, and in such case, we may not be able to successfully obtain additional financing on favorable terms. One of our sources of liquidity is our $2,500.0 million commercial paper program. Should commercial paper issuance be unavailable, we have the ability to use a combination of cash on hand and/or our $2,000.0 million senior revolving credit facility to redeem any outstanding commercial paper upon maturity. Additionally, we believe the lenders participating in our senior credit facility would be willing and able to provide financing in accordance with their legal obligations. We did not have any borrowings outstanding under our commercial paper program at
December 31, 2014
.
The value of our investments is influenced by varying economic and market conditions, and a decrease in value may result in a loss charged to income.
The market values of our investments vary from time to time depending on economic and market conditions. For various reasons, we may sell certain of our investments at prices that are less than the carrying value of the investments. In addition, in periods of declining interest rates, bond calls and mortgage loan prepayments generally increase, resulting in the reinvestment of these funds at the then lower market rates. In periods of rising interest rates, the market values of our fixed maturity securities will generally decrease, which could result in material unrealized or realized losses on investments in future periods. In addition, defaults by issuers, primarily from investments in corporate and municipal bonds, who fail to pay or perform their obligations, could reduce net investment income, which would adversely affect our profitability. We cannot assure you that our investment portfolios will produce positive returns in future periods.
In accordance with FASB guidance for debt and equity investments, we classify fixed maturity and equity securities in our investment portfolio as “available-for-sale” or “trading” and report those securities at fair value. Current and long-term available-for-sale investment securities represented a significant percentage of our total consolidated assets at
December 31, 2014
. Also, in accordance with applicable FASB accounting guidance, we review our investment securities to determine if declines in fair value below cost are other-than-temporary. This review is subjective and requires a high degree of judgment. We conduct this review on a quarterly basis analyzing both quantitative and qualitative factors. Such factors considered include the length of time and the extent to which market value has been less than cost, financial condition and near term prospects of the issuer, recommendations of investment advisors and forecasts of economic, market or industry trends.
Changes in the economic environment, including periods of increased volatility of the securities markets, can increase the difficulty of assessing investment impairment and the same influences tend to increase the risk of potential impairment of these assets. We believe we have adequately reviewed our investment securities for impairment and we believe that we have
-
35
-
appropriately estimated the fair values of our investment securities. However, over time, the economic and market environment may provide additional insight, which could change our judgment regarding the fair value of certain securities and/or impairment. Given the sometimes rapidly changing market conditions and the significant judgments involved, there is continuing risk that further declines in fair value may occur and material other-than-temporary impairments may be charged to income in future periods, resulting in realized losses.
We may not be able to realize the value of our deferred tax assets.
In accordance with applicable accounting standards, we separately recognize deferred tax assets and deferred tax liabilities. Such deferred tax assets and deferred tax liabilities represent the tax effect of temporary differences between financial reporting and tax reporting measured at tax rates enacted at the time the deferred tax asset or liability is recorded.
At each financial reporting date, we evaluate our deferred tax assets to determine the likely realization of the benefit of the temporary differences. Our evaluation includes a review of the types of temporary differences that created the deferred tax asset; the amount of taxes paid on both capital gains and ordinary income in prior periods and available for a carry-back claim; the forecasted future taxable income, and therefore, the likely future deduction of the deferred tax item; and any other significant issues that might impact the realization of the deferred tax asset. If it is “more likely than not” that all or a portion of the deferred tax asset may not be realized, we establish a valuation allowance. Significant judgment is required in determining an appropriate valuation allowance.
Any future increase in the valuation allowance would result in additional income tax expense and a decrease in shareholders’ equity, which could materially affect our financial position and results of operations in the period in which the increase occurs. A material decrease in shareholders’ equity could, in turn, negatively impact our debt ratings or potentially impact our compliance with existing debt covenants.
An unauthorized disclosure of sensitive or confidential member or employee information, including by cyber attack or other security breach, could cause a loss of data, give rise to remediation or other expenses, expose us to liability under federal and state laws, and subject us to litigation and investigations, which could have an adverse effect on our business, cash flows, financial condition and results of operations.
As part of our normal operations, we collect, process and retain sensitive and confidential member and employee information. We are subject to various federal, state and international laws and rules regarding the use and disclosure of sensitive or confidential member and provider information, including HIPAA, the HITECH Act, the Gramm-Leach-Bliley Act, and numerous state laws governing personal information. Despite the security measures we have in place to help ensure compliance with applicable laws and rules, our facilities and systems, and those of our third party service providers, are vulnerable to cyber attacks, security breaches, acts of vandalism, computer viruses, misplaced or lost data, programming and/or human errors or other similar events.
In February 2015, we reported the discovery that certain of our information technology systems had been the target of an external cyber attack, as more fully described under Note 13, “Commitments and Contingencies -
Data Breach,
” to our audited consolidated financial statements included in Part II, Item 8 of this Annual Report on Form 10-K. We are in the process of determining the extent of this cyber attack; however, at this time we believe that personal information of many of our current and former members and employees was obtained in the cyber attack. We have incurred expenses to investigate and remediate this matter and expect to continue to incur expenses of this nature in the foreseeable future. Although we are unable to quantify the ultimate magnitude of such expenses at this time, they may be significant. In addition, we are currently responding to a number of governmental inquiries and are subject to purported class action lawsuits and other claims relating to the cyber attack, and in the future we may be subject to additional litigation and governmental investigations. These investigations and claims could divert the attention of management from the operation of our business, result in reputational damage and have a material adverse impact on our business, cash flows, financial condition and results of operations. While we have contingency plans and insurance coverage for potential liabilities of this nature, these may not be sufficient to cover all claims and liabilities.
In addition, we cannot ensure that we will be able to identify, prevent or contain the effects of additional cyber attacks or other cybersecurity risks in the future that bypass our security measures or disrupt our information technology systems or business. As a result, cybersecurity and the continued development and enhancement of our controls, processes and practices
-
36
-
designed to protect our systems, computers, software, data and networks from attack, damage and unauthorized access, remain a priority for us. Noncompliance with any privacy or security laws and regulations, or any security breach, cyber attack or cybersecurity breach, and any incident involving the misappropriation, loss or other unauthorized disclosure of, or access to, sensitive or confidential member information, whether by us or by one of our vendors, could require us to expend significant resources to continue to modify or enhance our protective measures and to remediate any damage. In addition, this could result in interruptions to our operations and damage our reputation, and could also result in regulatory enforcement actions, material fines and penalties, litigation or other actions which could have a material adverse effect on our business, cash flows, financial condition and results of operations.
The failure to effectively maintain and upgrade our information systems could adversely affect our business.
Our business depends significantly on effective information systems, and we have many different information systems for our various businesses. As a result of our merger and acquisition activities, we have acquired additional systems. Our information systems require an ongoing commitment of significant resources to maintain and enhance existing systems and develop new systems in order to keep pace with continuing changes in information processing technology, emerging cybersecurity risks and threats, evolving industry and regulatory standards including the minimum MLR rebates, public exchanges and other aspects of Health Care Reform, compliance with legal requirements (such as a new set of standardized diagnostic codes, known as ICD-10), private insurance exchanges and changing customer preferences. In addition, we may from time to time obtain significant portions of our systems-related or other services or facilities from independent third parties, which may make our operations vulnerable to such third parties’ failure to perform adequately.
Our failure to maintain effective and efficient information systems, or our failure to efficiently and effectively consolidate our information systems to eliminate redundant or obsolete applications, could have a material adverse effect on our business, financial condition and results of operations. If the information we rely upon to run our business were found to be inaccurate or unreliable or if we fail to maintain our information systems and data integrity effectively, we could have a decrease in membership, have problems in determining medical cost estimates and establishing appropriate pricing and reserves, have disputes with customers and providers, have regulatory problems, sanctions or penalties imposed, have increases in operating expenses or suffer other adverse consequences. In addition, federal regulations require that we begin using ICD-10 by October 2015, which has required and will continue to require significant information technology investment. If we fail to adequately implement ICD-10 or comply with the operating rules, we may incur losses with respect to the resources invested and have other material adverse effects on our business and results of operations. Also, as we convert or migrate members to our more efficient and effective systems, the risk of disruption in our customer service is increased during the migration or conversion process and such disruption could have a material adverse effect on our business, cash flow, financial condition and results of operations.
We continue to implement initiatives for more effective and efficient information technology systems by modernizing interactions with customers, brokers, agents, providers, employees and other stakeholders through web-enabling technology and redesigning internal operations. We cannot assure you that we will be able to fully implement all desired products or systems in a timely and effective manner. The failure to implement and maintain the most advanced technological capabilities could result in competitive and cost disadvantages to us as compared to our competitors.
We are dependent on the success of our relationships with third parties for various services and functions, including pharmacy benefit management services.
We contract with various third parties to perform certain functions and services and provide us with certain information technology systems. Certain of these third parties provide us with significant portions of our requirements, and we could become overly dependent on key vendors, which could cause us to lose core competencies. A termination of our agreements with, or disruption in the performance of, one or more of these service providers could result in service disruptions or unavailability, reduced service quality and effectiveness, increased or duplicative costs, an inability to meet our obligations to our customers or require us to seek alternative service providers on less favorable contract terms, any of which could adversely affect our business, reputation, cash flows, financial condition and operating results.
In particular, we are a party to an agreement with Express Scripts
whereby Express Scripts is the exclusive provider of
PBM
services to our plans, excluding some Amerigroup subsidiaries and certain self-insured members, which have exclusive agreements with different PBM service providers. It is expected that those Amerigroup subsidiaries will complete their
-
37
-
transition to the Express Scripts agreement during 2015.
The Express Scripts PBM services include, but are not limited to,
pharmacy network management, home delivery, pharmacy customer service, claims processing, rebate management, drug utilization and specialty pharmaceutical management services. Accordingly, the agreement contains certain financial and operational requirements obligating both Express Scripts and us.
The failure of either party to meet the respective requirements could potentially serve as a basis for early termination of the contract. If this relationship was terminated for any reason, we may not be able to find alternative partners in a timely manner or on acceptable financial terms. As a result, we may not be able to meet the full demands of our customers, which could have a material adverse effect on our business, reputation and results of operations. In addition, our failure to meet certain minimum script volume requirements results in financial penalties that could have a material adverse effect on our results of operations.
Indiana law, other applicable laws, our articles of incorporation and bylaws, and provisions of our BCBSA license agreements may prevent or discourage takeovers and business combinations that our shareholders might consider in their best interest.
Indiana law and our articles of incorporation and bylaws may delay, defer, prevent or render more difficult a takeover attempt that our shareholders might consider in their best interests. For instance, they may prevent our shareholders from receiving the benefit from any premium to the market price of our common stock offered by a bidder in a takeover context. Even in the absence of a takeover attempt, the existence of these provisions may adversely affect the prevailing market price of our common stock if they are viewed as discouraging takeover attempts in the future.
We are regulated as an insurance holding company and subject to the insurance holding company acts of the states in which our insurance company subsidiaries are domiciled, as well as similar provisions included in the health statutes and regulations of certain states where these subsidiaries are regulated as managed care companies or HMOs. The insurance holding company acts and regulations and these similar health provisions restrict the ability of any person to obtain control of an insurance company or HMO without prior regulatory approval. Under those statutes and regulations, without such approval (or an exemption), no person may acquire any voting security of a domestic insurance company or HMO, or an insurance holding company which controls an insurance company or HMO, or merge with such a holding company, if as a result of such transaction such person would “control” the insurance holding company, insurance company or HMO. “Control” is generally defined as the direct or indirect power to direct or cause the direction of the management and policies of a person and is presumed to exist if a person directly or indirectly owns or controls 10% or more of the voting securities of another person. Further, the Indiana business corporation law contains business combination provisions that, in general, prohibit for five years any business combination with a beneficial owner of 10% or more of our common stock unless the holder’s acquisition of the stock was approved in advance by our Board of Directors.
Our articles of incorporation restrict the beneficial ownership of our capital stock in excess of specific ownership limits. The ownership limits restrict beneficial ownership of our voting capital stock to less than 10% for institutional investors and less than 5% for non-institutional investors, both as defined in our articles of incorporation. Additionally, no person may beneficially own shares of our common stock representing a 20% or more ownership interest in us. These restrictions are intended to ensure our compliance with the terms of our licenses with the BCBSA. Our articles of incorporation prohibit ownership of our capital stock beyond these ownership limits without prior approval of a majority of our continuing directors (as defined in our articles of incorporation). In addition, as discussed above in the risk factor describing our license agreements with the BCBSA, such license agreements are subject to termination upon a change of control and re-establishment fees would be imposed upon termination of the license agreements.
Certain other provisions included in our articles of incorporation and bylaws may also have anti-takeover effects and may delay, defer or prevent a takeover attempt that our shareholders might consider in their best interests. In particular, our articles of incorporation and bylaws: divide our Board of Directors into three classes serving staggered three-year terms (which is required by our license agreement with the BCBSA); permit our Board of Directors to determine the terms of and issue one or more series of preferred stock without further action by shareholders; restrict the maximum number of directors; limit the ability of shareholders to remove directors; impose restrictions on shareholders’ ability to fill vacancies on our Board of Directors; prohibit shareholders from calling special meetings of shareholders; impose advance notice requirements for shareholder proposals and nominations of directors to be considered at meetings of shareholders; and prohibit shareholders from amending our bylaws.
-
38
-
We also face other risks that could adversely affect our business, financial condition or results of operations, which include:
|
•
|
any requirement to restate financial results in the event of inappropriate application of accounting principles;
|
|
•
|
a significant failure of our internal control over financial reporting;
|
|
•
|
failure of our prevention and control systems related to employee compliance with internal policies, including data security;
|
|
•
|
provider fraud that is not prevented or detected and impacts our medical costs or those of self-insured customers;
|
|
•
|
failure to protect our proprietary information; and
|
|
•
|
failure of our corporate governance policies or procedures.
|
ITEM 1B. UNRESOLVED SEC STAFF COMMENTS.
None.
ITEM 2. PROPERTIES.
Our principal executive offices are located at 120 Monument Circle, Indianapolis, Indiana. In addition to this location, we have other principal operating facilities located in each of the fourteen states where we operate as licensees of the BCBSA, in each of the nine additional states where Amerigroup conducts business and in the additional state of Arizona where CareMore maintains a branch office. A majority of these locations are leased properties. Our facilities support our various business segments. We believe that our properties are adequate and suitable for our business as presently conducted as well as for the foreseeable future.
ITEM 3. LEGAL PROCEEDINGS.
For information regarding our legal proceedings, see the “
Litigation,
” “
Data Breach
” and “
Other Contingencies
” sections of Note 13, “Commitments and Contingencies” to our audited consolidated financial statements included in Part II, Item 8 of this Annual Report on Form 10-K.
ITEM 4. MINE SAFETY DISCLOSURES.
Not Applicable.
-
39
-
PART II
ITEM 5. MARKET FOR REGISTRANT’S COMMON EQUITY, RELATED STOCKHOLDER MATTERS AND ISSUER PURCHASES OF EQUITY SECURITIES.
Market Prices
Our common stock, par value $0.01 per share, is listed on the NYSE under the symbol “ANTM.” On February 5, 2015, the closing price on the NYSE was $137.23. As of February 5, 2015, there were 74,717 shareholders of record of our common stock. The following table presents high and low sales prices for our common stock on the NYSE for the periods indicated.
|
High
|
Low
|
||||||
|
2014
|
|||||||
|
First Quarter
|
$
|
102.56
|
|
$
|
81.84
|
|
|
|
Second Quarter
|
110.03
|
|
90.75
|
|
|||
|
Third Quarter
|
124.58
|
|
106.52
|
|
|||
|
Fourth Quarter
|
129.96
|
|
108.92
|
|
|||
|
2013
|
|||||||
|
First Quarter
|
$
|
66.62
|
|
$
|
58.75
|
|
|
|
Second Quarter
|
82.33
|
|
65.82
|
|
|||
|
Third Quarter
|
90.00
|
|
80.75
|
|
|||
|
Fourth Quarter
|
94.36
|
|
83.13
|
|
|||
Dividends
The quarterly cash dividend declared by our Board of Directors was $0.4375, $0.3750 and $0.2875 per share in
2014
,
2013
and
2012
, respectively. On
January 27, 2015
, our Board of Directors declared a quarterly cash dividend to shareholders of
$0.6250
per share.
We regularly review the appropriate use of capital, including common stock repurchases, repurchases of debt securities and dividends to shareholders. The declaration and payment of any dividends or repurchases of our common stock or debt securities is at the discretion of our Board of Directors and depends upon our financial condition, results of operations, future liquidity needs, regulatory and capital requirements and other factors deemed relevant by our Board of Directors. Further, our ability to pay dividends to our shareholders, if authorized by our Board of Directors, is significantly dependent upon the receipt of dividends from our subsidiaries, including Anthem Insurance Companies, Inc., Anthem Southeast, Inc., Anthem Holding Corp., WellPoint Holding Corp., WellPoint Acquisition, LLC, WellPoint Insurance Services, Inc., ATH Holding Company, LLC and SellCore, Inc. The payment of dividends by our insurance subsidiaries without prior approval of the insurance department of each subsidiary’s domiciliary jurisdiction is limited by formula. Dividends in excess of these amounts are subject to prior approval by the respective insurance departments.
Securities Authorized for Issuance under Equity Compensation Plans
The information required by this Item concerning securities authorized for issuance under our equity compensation plans is set forth in or incorporated by reference into Part III, Item 12 “Security Ownership of Certain Beneficial Owners and Management and Related Stockholder Matters” in this Annual Report on Form 10-K.
-
40
-
Issuer Purchases of Equity Securities
The following table presents information related to our repurchases of common stock for the periods indicated:
|
Period
|
Total Number
of Shares
Purchased
1
|
Average
Price Paid
per Share
|
Total Number
of Shares
Purchased as
Part of
Publicly
Announced
Programs
2
|
Approximate
Dollar Value
of Shares that
May Yet Be
Purchased
Under the
Programs
|
|||||||||||
|
(In millions, except share and per share data)
|
|||||||||||||||
|
October 1, 2014 to October 31, 2014
|
1,514,534
|
|
$
|
117.30
|
|
1,506,731
|
|
$
|
5,858.1
|
|
|||||
|
November 1, 2014 to November 30, 2014
|
507,812
|
|
125.99
|
|
507,196
|
|
5,794.2
|
|
|||||||
|
December 1, 2014 to December 31, 2014
|
871,233
|
|
125.43
|
|
817,392
|
|
5,691.7
|
|
|||||||
|
2,893,579
|
|
2,831,319
|
|
||||||||||||
|
1
|
Total number of shares purchased includes 62,260 shares delivered to or withheld by us in connection with employee payroll tax withholding upon exercise or vesting of stock awards. Stock grants to employees and directors and stock issued for stock option plans and stock purchase plans in the consolidated statements of shareholders’ equity are shown net of these shares purchased.
|
|
2
|
Represents the number of shares repurchased through the common stock repurchase program authorized by our Board of Directors, which the Board evaluates periodically. During the year ended
December 31, 2014
, we repurchased 30,439,237 shares at a cost of
$2,998.8
under the program, including the cost of options to purchase shares. The Board of Directors has authorized our common stock repurchase program since 2003. The Board's most recent authorized increase to the program was $5,000.0 on October 2, 2014. Between January 1, 2015 and
February 5, 2015
, we repurchased
1.8
shares at a cost of
$229.9
, bringing our current availability to
$5,461.8
at
February 5, 2015
. No duration has been placed on our common stock repurchase program and we reserve the right to discontinue the program at any time.
|
-
41
-
Performance Graph
The following Performance Graph and related information compares the cumulative total return to shareholders of our common stock for the period from December 31,
2009
through
December 31, 2014
, with the cumulative total return over such period of (i) the Standard & Poor’s 500 Stock Index (the “S&P 500 Index”) and (ii) the Standard & Poor’s Managed Health Care Index (the “S&P Managed Health Care Index”). The graph assumes an investment of $100 on December 31,
2009
in each of our common stock, the S&P 500 Index and the S&P Managed Health Care Index (and the reinvestment of all dividends).
The comparisons shown in the graph below are based on historical data and we caution that the stock price performance shown in the graph below is not indicative of, and is not intended to forecast, the potential future performance of our common stock. Information used in the graph was obtained from S&P Capital IQ, a source believed to be reliable, but we are not responsible for any errors or omissions in such information. The following graph and related information shall not be deemed “soliciting materials” or to be “filed” with the SEC, nor shall such information be incorporated by reference into any future filing under the Securities Act of 1933, as amended, or the Exchange Act, except to the extent that we specifically incorporate it by reference into such filing.
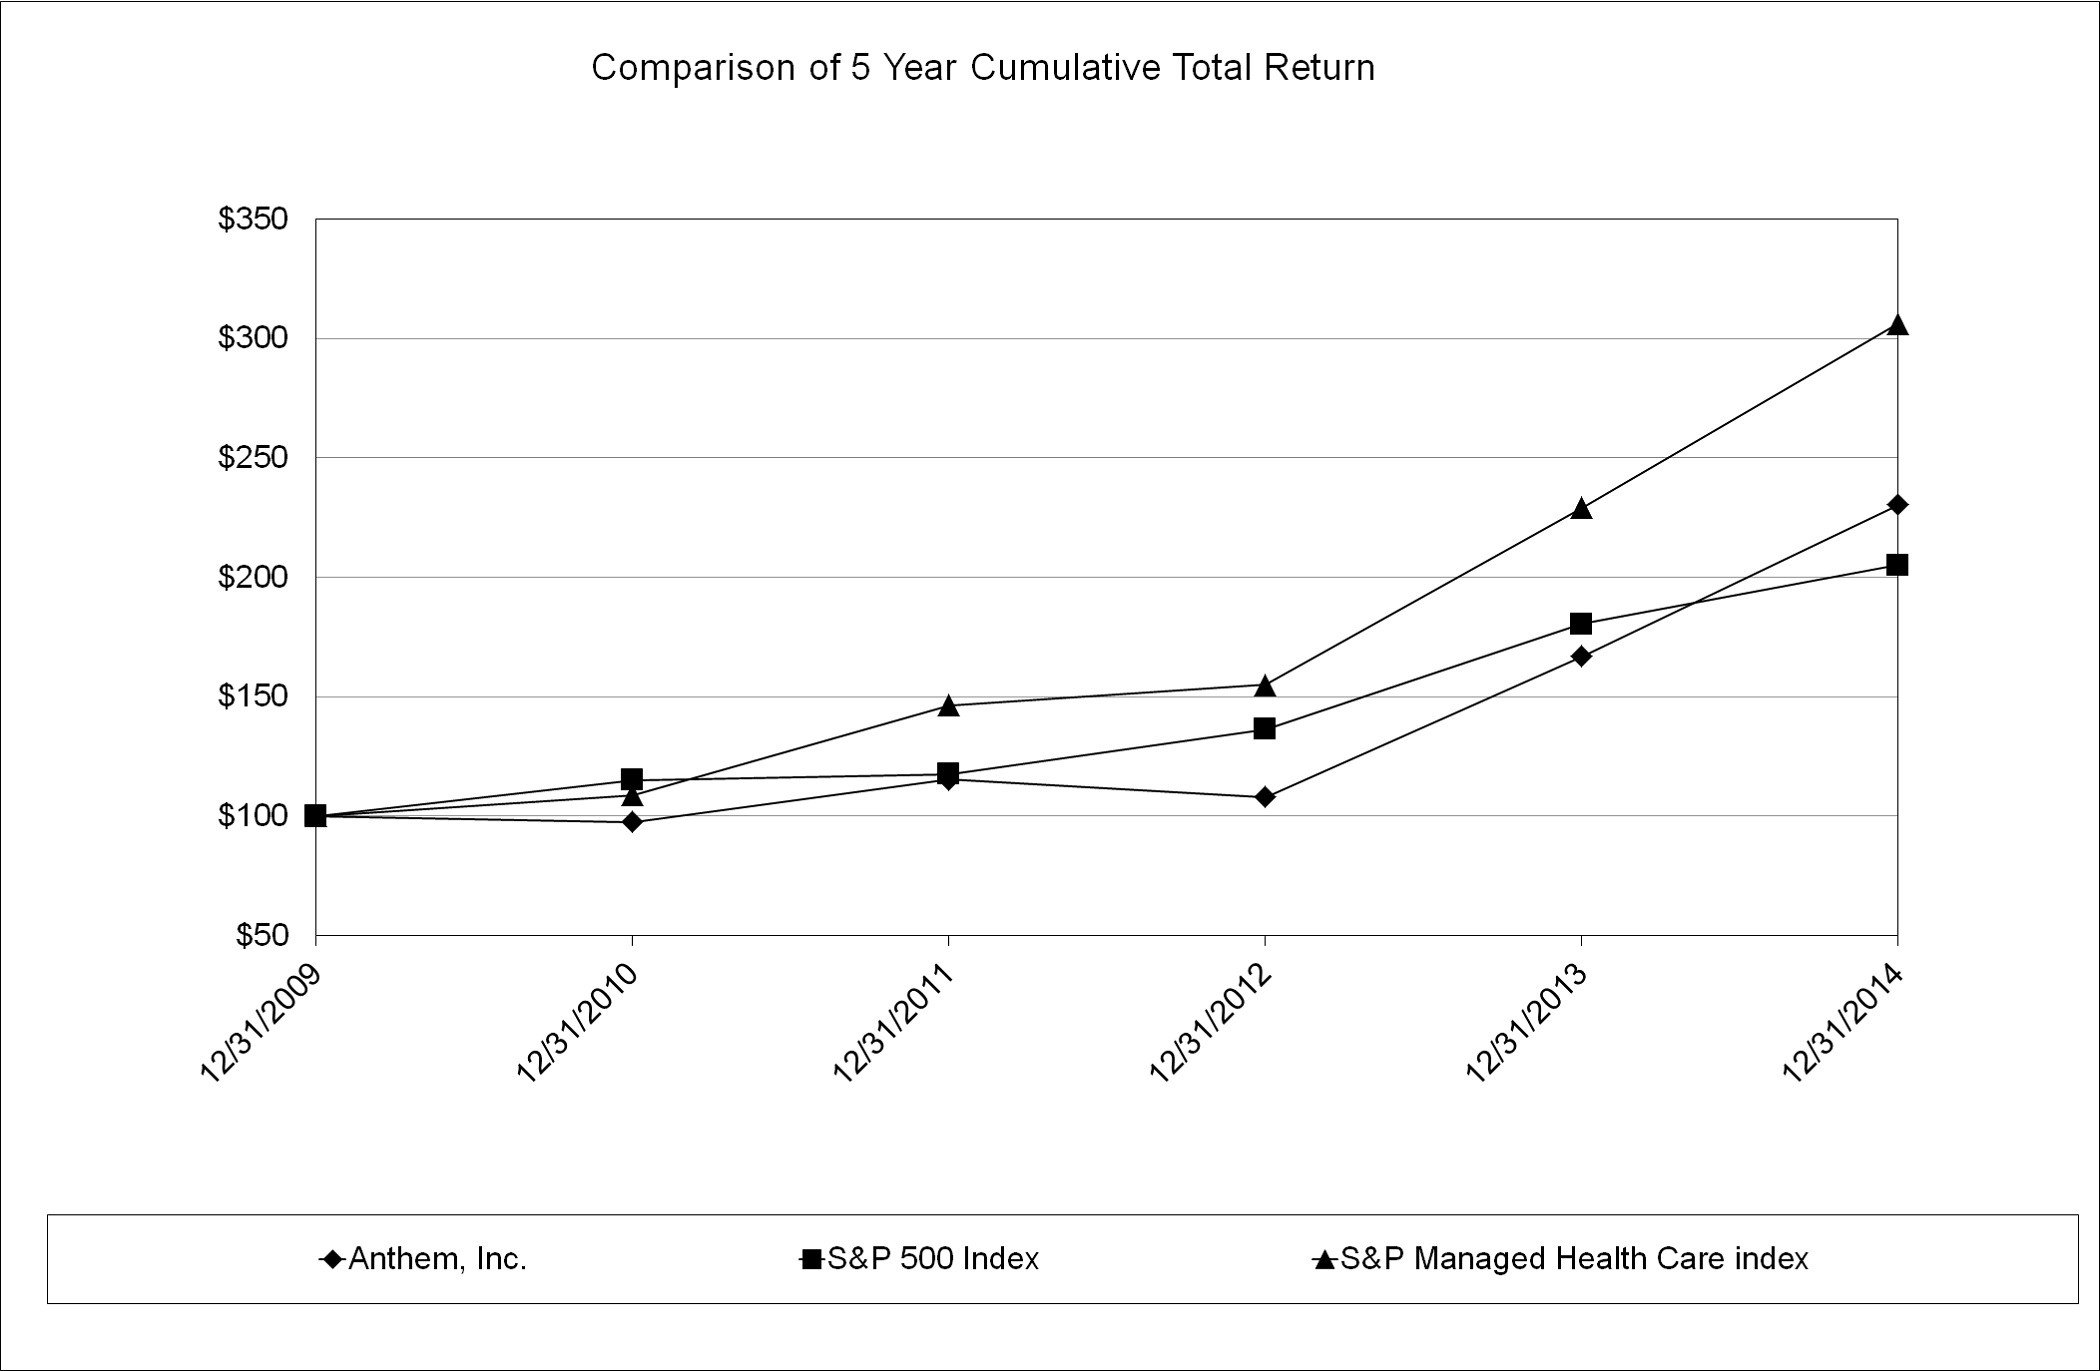
|
|
December 31,
|
|||||||||||||||||||||||
|
|
2009
|
2010
|
2011
|
2012
|
2013
|
2014
|
||||||||||||||||||
|
Anthem, Inc.
|
$
|
100
|
|
$
|
98
|
|
$
|
115
|
|
$
|
108
|
|
$
|
167
|
|
$
|
230
|
|
||||||
|
S&P 500 Index
|
100
|
|
115
|
|
117
|
|
136
|
|
180
|
|
205
|
|
||||||||||||
|
S&P Managed Health Care Index
|
100
|
|
109
|
|
146
|
|
155
|
|
229
|
|
306
|
|
||||||||||||
Based upon an initial investment of $100 on December 31,
2009
with dividends reinvested.
-
42
-
ITEM 6. SELECTED FINANCIAL DATA.
The table below provides selected consolidated financial data of Anthem. The information has been derived from our consolidated financial statements for each of the years in the five year period ended
December 31, 2014
. You should read this selected consolidated financial data in conjunction with the audited consolidated financial statements and notes as of and for the year ended
December 31, 2014
included in Part II, Item 8 “Financial Statements and Supplementary Data”, and Part II, Item 7 “Management’s Discussion and Analysis of Financial Condition and Results of Operations” included in this Annual Report on Form 10-K.
|
|
As of and for the Years Ended December 31
|
|||||||||||||||||||
|
|
2014
1
|
2013
1
|
2012
1,2
|
2011
2
|
2010
|
|||||||||||||||
|
(in millions, except where indicated and except per share data)
|
|
|
|
|
|
|||||||||||||||
|
Income Statement Data
|
||||||||||||||||||||
|
Total operating revenue
3
|
$
|
73,021.7
|
|
$
|
70,191.4
|
|
$
|
60,514.0
|
|
$
|
59,865.2
|
|
$
|
57,740.5
|
|
|||||
|
Total revenues
|
73,874.1
|
|
71,023.5
|
|
61,497.2
|
|
60,710.7
|
|
58,698.5
|
|
||||||||||
|
Income from continuing operations
|
2,560.1
|
|
2,634.3
|
|
2,651.0
|
|
2,646.7
|
|
2,887.1
|
|
||||||||||
|
Net income
|
2,569.7
|
|
2,489.7
|
|
2,655.5
|
|
2,646.7
|
|
2,887.1
|
|
||||||||||
|
Per Share Data
|
|
|
||||||||||||||||||
|
Basic net income per share - continuing operations
|
$
|
9.28
|
|
$
|
8.83
|
|
$
|
8.25
|
|
$
|
7.35
|
|
$
|
7.03
|
|
|||||
|
Diluted net income per share - continuing operations
|
8.96
|
|
8.67
|
|
8.17
|
|
7.25
|
|
6.94
|
|
||||||||||
|
Dividends per share
|
1.75
|
|
1.50
|
|
1.15
|
|
1.00
|
|
—
|
|
||||||||||
|
Other Data (unaudited)
|
|
|
||||||||||||||||||
|
Benefit expense ratio
4
|
83.1
|
%
|
85.1
|
%
|
85.3
|
%
|
85.1
|
%
|
83.2
|
%
|
||||||||||
|
Selling, general and administrative expense ratio
5
|
16.1
|
%
|
14.2
|
%
|
14.3
|
%
|
14.1
|
%
|
15.1
|
%
|
||||||||||
|
Income from continuing operations before income taxes as a percentage of total revenues
|
5.9
|
%
|
5.4
|
%
|
6.3
|
%
|
6.5
|
%
|
7.4
|
%
|
||||||||||
|
Net income as a percentage of total revenues
|
3.5
|
%
|
3.5
|
%
|
4.3
|
%
|
4.4
|
%
|
4.9
|
%
|
||||||||||
|
Medical membership (
in thousands
)
|
37,499
|
|
35,653
|
|
36,130
|
|
34,251
|
|
33,323
|
|
||||||||||
|
Balance Sheet Data
|
|
|
||||||||||||||||||
|
Cash and investments
|
$
|
23,777.7
|
|
$
|
22,395.9
|
|
$
|
22,464.6
|
|
$
|
20,696.5
|
|
$
|
20,311.8
|
|
|||||
|
Total assets
|
62,065.0
|
|
59,574.5
|
|
58,955.4
|
|
52,163.2
|
|
50,242.5
|
|
||||||||||
|
Long-term debt, less current portion
|
14,127.2
|
|
13,573.6
|
|
14,170.8
|
|
8,465.7
|
|
8,147.8
|
|
||||||||||
|
Total liabilities
|
37,813.7
|
|
34,809.3
|
|
35,152.7
|
|
28,875.0
|
|
26,429.9
|
|
||||||||||
|
Total shareholders’ equity
|
24,251.3
|
|
24,765.2
|
|
23,802.7
|
|
23,288.2
|
|
23,812.6
|
|
||||||||||
|
1
|
The operating results of 1-800 CONTACTS, Inc. are reported as discontinued operations at December 31, 2014, 2013 and 2012 as a result of the divestiture completed on January 31, 2014. Included in net income for the year ended December 31, 2014 is income from discontinued operations, net of tax, of $9.6. Included in net income for the year ended December 31, 2013 is a loss from discontinued operations, net of tax, of $144.6. Included in net income for the year ended December 31, 2012 is income from discontinued operations, net of tax, of $4.5.
|
|
2
|
The net assets of and results of operations for AMERIGROUP Corporation are included from its acquisition date of December 24, 2012. The net assets of and results of operations for CareMore Health Group, Inc. are included from its acquisition date of August 22, 2011.
|
|
3
|
Operating revenue is obtained by adding premiums, administrative fees and other revenue.
|
|
4
|
The benefit expense ratio represents benefit expenses as a percentage of premium revenue.
|
|
5
|
The selling, general and administrative expense ratio represents selling, general and administrative expenses as a percentage of total operating revenue.
|
-
43
-
ITEM 7. MANAGEMENT’S DISCUSSION AND ANALYSIS OF FINANCIAL CONDITION AND RESULTS OF OPERATIONS.
(In Millions, Except Per Share Data or As Otherwise Stated Herein)
On November 5, 2014, the shareholders of the Company approved a proposal to amend our articles of incorporation to change our name to Anthem, Inc. from WellPoint, Inc. The name change was effective December 2, 2014. References in this Annual Report on Form 10-K to the terms “we,” “our,” “us,” “Anthem” or the “Company” refer to Anthem, Inc., an Indiana corporation, and, unless the context otherwise requires, its direct and indirect subsidiaries.
This Management's Discussion and Analysis, or MD&A, should be read in conjunction with our audited consolidated financial statements included in Part II, Item 8 of this Annual Report on Form 10-K.
Overview
We currently manage our operations through three reportable segments: Commercial and Specialty Business, Government Business and Other. We regularly evaluate the appropriateness of our reportable segments, particularly in light of organizational changes, merger and acquisition activity and changing laws and regulations. Therefore, these reportable segments may change in the future.
Our Commercial and Specialty Business segment includes our Local Group, National Accounts, Individual and Specialty businesses. Business units in the Commercial and Specialty Business segment offer fully-insured health products; provide a broad array of managed care services to self-funded customers including claims processing, underwriting, stop loss insurance, actuarial services, provider network access, medical cost management, disease management, wellness programs and other administrative services; and provide an array of specialty and other insurance products and services such as dental, vision, life and disability insurance benefits, radiology benefit management and analytics-driven personal health care guidance.
Our Government Business segment includes Medicare and Medicaid businesses, National Government Services, or NGS, and services provided to the federal government in connection with
the Federal Employee Program, or
FEP. Medicare business includes services such as Medicare Advantage, Medicare Part D, and Medicare Supplement. Medicaid business includes our managed care alternatives through publicly funded health care programs, including Medicaid
;
Temporary Assistance for Needy Family
, or TANF, programs;
programs for seniors and people with disabilities
, or SPD;
programs for long-term services and support
, or LTSS;
Children’s Health Insurance Programs
, or CHIP, and
Medicaid expansion programs. NGS acts as a Medicare contractor in several regions across the nation.
Our Other segment includes other businesses that do not meet the quantitative thresholds for an operating segment as defined by
Financial Accounting Standards Board, or FASB,
guidance, as well as corporate expenses not allocated to the other reportable segments.
Our operating revenue consists of premiums, administrative fees and other revenue. Premium revenue comes from fully-insured contracts where we indemnify our policyholders against costs for covered health and life benefits. Administrative fees come from contracts where our customers are self-insured, or where the fee is based on either processing of transactions or a percent of network discount savings realized. Additionally, we earn administrative fee revenues from our Medicare processing business and from other health-related businesses including disease management programs. Other revenue includes miscellaneous income other than premium revenue and administrative fees.
Our benefit expense primarily includes costs of care for health services consumed by our members, such as outpatient care, inpatient hospital care, professional services (primarily physician care) and pharmacy benefit costs. All four components are affected both by unit costs and utilization rates. Unit costs include the cost of outpatient medical procedures per visit, inpatient hospital care per admission, physician fees per office visit and prescription drug prices. Utilization rates represent the volume of consumption of health services and typically vary with the age and health status of our members and their social and lifestyle choices, along with clinical protocols and medical practice patterns in each of our markets. A portion of benefit expense recognized in each reporting period consists of actuarial estimates of claims incurred but not yet paid by us. Any changes in these estimates are recorded in the period the need for such an adjustment arises. While we offer a diversified mix of managed care products and services through our managed care plans, our aggregate cost of care can fluctuate based on a change in the overall mix of these products and services. Our managed care plans include: preferred provider organizations,
-
44
-
or PPOs; health maintenance organizations, or HMOs; point-of-service plans, or POS plans; traditional indemnity plans and other hybrid plans, including consumer-driven health plans, or CDHPs; and hospital only and limited benefit products.
We classify certain claims-related costs as benefit expense to reflect costs incurred for our members’ traditional medical care, as well as those expenses which improve our members’ health and medical outcomes. These claims-related costs may be comprised of expenses incurred for: (i) medical management, including case and utilization management; (ii) health and wellness, including disease management services for such conditions as diabetes, high-risk pregnancies, congestive heart failure and asthma management and wellness initiatives like weight-loss programs and smoking cessation treatments; and (iii) clinical health policy. These types of claims-related costs are designed to ultimately lower our members’ cost of care.
Our selling expense consists of external broker commission expenses, and generally varies with premium or membership volume. Our general and administrative expense consists of fixed and variable costs. Examples of fixed costs are depreciation, amortization and certain facilities expenses. Certain variable costs, such as premium taxes, vary directly with premium volume. Other variable costs, such as salaries and benefits, do not vary directly with changes in premium, but are more aligned with changes in membership. The acquisition or loss of a significant block of business would likely impact staffing levels, and thus associated compensation expense. Other variable costs include professional and consulting expenses and advertising. Other factors can impact our administrative cost structure, including systems efficiencies, inflation and changes in productivity.
Our results of operations depend in large part on our ability to accurately predict and effectively manage health care costs through effective contracting with providers of care to our members and our medical management and health and wellness programs. Several economic factors related to health care costs, such as regulatory mandates of coverage as well as direct-to-consumer advertising by providers and pharmaceutical companies, have a direct impact on the volume of care consumed by our members. The potential effect of escalating health care costs, any changes in our ability to negotiate competitive rates with our providers and any regulatory or market driven restrictions on our ability to obtain adequate premium rates to offset overall inflation in health care costs, including increases in unit costs and utilization resulting from the aging of the population and other demographics, as well as advances in medical technology, may impose further risks to our ability to profitably underwrite our business, and may have a material impact on our results of operations.
Our future results of operations will also be impacted by certain external forces and resulting changes in our business model and strategy. In 2010, the Patient Protection and Affordable Care Act, or ACA, as well as the Health Care and Education Reconciliation Act of 2010, or collectively, Health Care Reform, became law, causing significant changes to the U.S. health care system. Since then, significant regulations have been enacted by the U.S. Department of Health and Human Services, or HHS, the Department of Labor and the Department of the Treasury.
The legislation and regulations are far-reaching and are intended to expand access to health insurance coverage over time by increasing the eligibility thresholds for most state Medicaid programs and providing certain other individuals and small businesses with tax credits to subsidize a portion of the cost of health insurance coverage.
As a result of the complexity of the law, its impact on health care in the United States and the continuing modification and interpretation of Health Care Reform rules, we continue to analyze and refine our estimates of the ultimate impact of Health Care Reform on our business, cash flows, financial condition and results of operations. Health Care Reform provides growth opportunities for health insurers, but also introduces new risks and uncertainties, and required changes in the way products are designed, underwritten, priced, distributed and administered.
For additional discussion, see Part I, Item 1 “Business - Regulation,” and Part I, Item 1A “Risk Factors” in this Annual Report on Form 10-K.
Pricing in our Commercial and Specialty Business segment
,
including our Individual and Small Group lines of business, remains competitive, but rational, and we strive to price our health care benefit products consistent with anticipated underlying medical trends. We believe our pricing strategy, based on predictive modeling, proprietary research and data-driven processes, as well as our overall investments for Health Care Reform, have positioned us to benefit from the potential growth opportunities available in fully-insured commercial products as a result of Health Care Reform.
In the Individual and Small Group markets, we offer on-exchange products through state or federally facilitated marketplaces, referred to as public exchanges; and off-exchange products. Federal premium subsidies are available only for certain members who purchase certain public exchange products.
While the ultimate level of public exchange enrollment cannot be predicted, we have experienced a greater number of policy applications for new members through the public exchanges than expected, including geographical regions with lower price competition. The public exchanges may increase the risk that our products will be selected by individuals who have a higher risk profile or utilization rate than the pool of participants we anticipated when we
-
45
-
established the pricing for these public exchange products. However, the risk characteristics of new applicants in 2014 tracked closely to the risk levels utilized in the development of our pricing assumptions. Although it is not yet clear whether our products sold on the public exchanges will be more or less profitable products, we believe that our pricing strategy, brand name and network quality will provide a strong foundation for commercial risk membership growth opportunities in the future.
In our Individual markets we offer bronze, silver and gold products, both on and off the public exchanges, in the states of California, Colorado, Connecticut, Georgia, Indiana, Kentucky, Maine, Missouri, Nevada, New Hampshire, New York, Ohio, Virginia and Wisconsin. Additionally, we offer platinum products, both on and off the public exchanges, in the states of California and New York.
In our Small Group markets, we offer bronze, silver and gold products, both on and off the public exchanges, in the states of Colorado, Connecticut, Georgia, Indiana, Kentucky, Maine, Missouri, New Hampshire, Ohio and Virginia and we offer bronze, silver and gold products, off the public exchanges, in the states of California, New York and Wisconsin. Additionally, we offer platinum products, off the public exchanges, in the states of California, Colorado, Connecticut, Georgia, Maine, New Hampshire, Missouri and Virginia.
Private exchanges have recently gained significant visibility in the marketplace based on the promise of helping employers reduce costs, increase consumer engagement and manage the complexities created by the ACA and other market forces. While private exchanges have been a distribution channel in the Medicare and Individual markets for some time, the heightened level of activity and investment among the consulting and broker communities and other health insurance carriers has generated an increasing level of interest among employers in the Commercial market. To date, adoption levels have been lower than analyst predictions, but expectations for significant longer term growth remain. While the ultimate volume, pace of growth and winning business models remain highly uncertain, we believe private exchanges will provide opportunities for growth and will serve a significant role in our future strategy.
Health Care Reform also imposes new regulations on the health insurance sector, including, but not limited to, guaranteed coverage and expanded benefit requirements; prohibitions on some annual and all lifetime limits on amounts paid on behalf of or to our members; increased restrictions on rescinding coverage; establishment of minimum
medical loss ratio, or MLR,
and customer rebate requirements;
establishment of a mandatory annual Health Insurance Provider Fee, or HIP Fee;
creation of a federal rate review process; a requirement to cover preventive services on a first dollar basis; the establishment of public exchanges and essential benefit packages and greater limitations on how we price certain of our products. The legislation also reduces the reimbursement levels for our health plans participating in the Medicare Advantage program over time. There are also limitations on the amount of executive compensation that is deductible for income tax purposes.
As a result of Health Care Reform, HHS issued MLR regulations that require us to meet minimum MLR thresholds for Large Group, Small Group and Individual lines of business. For purposes of determining MLR rebates, HHS has defined the types of costs that should be included in the MLR rebate calculation. However, certain components of the MLR calculation as defined by HHS cannot be classified consistently under U.S. generally accepted accounting principles, or GAAP. While considered benefit expense or a reduction of premium revenue by HHS, certain of these costs are classified as other types of expense, such as income tax expense or selling, general and administrative expense, in our GAAP basis financial statements. Accordingly, the benefit expense ratio determined using our consolidated GAAP operating results is not comparable to the MLR calculated under HHS regulations.
Health Care Reform also imposed a separate minimum MLR threshold of 85% for Medicare Advantage plans beginning in 2014. Medicare Advantage plans that do not meet this threshold will have to pay a minimum MLR rebate. If a plan’s MLR is below 85% for three consecutive years beginning with 2014, enrollment will be restricted. A Medicare Advantage plan contract will be terminated if the plan's MLR is below 85% for five consecutive years.
Beginning in 2014, Health Care Reform imposes an annual HIP Fee
on health insurers that write certain types of health insurance on U.S. risks. The annual HIP Fee is allocated to health insurers based on the ratio of the amount of an insurer's net premium revenues written during the preceding calendar year to an adjusted amount of health insurance for all U.S. health risk for those certain lines of business written during the preceding calendar year. The HIP Fee is non-deductible for federal income tax purposes. The total amount to be collected from allocations to health insurers in 2014 was
$8,000.0
, and our portion of the HIP Fee for 2014 was
$893.3
. The final calculation and payment of the HIP Fee occurred in the third quarter of 2014
and was recognized as a general and administrative expense. The annual HIP Fee to be allocated to all health insurers
-
46
-
increases to
$11,300.0
for 2015 and 2016,
$13,900.0
for 2017 and
$14,300.0
for 2018. For 2019 and beyond, the annual HIP Fee will increase from the amount for the preceding year by the rate of premium growth for the preceding year.
These and other provisions of Health Care Reform are likely to have significant effects on our future operations, which, in turn, could impact the value of our business model and results of operations, including potential impairments of our goodwill and other intangible assets. We will continue to evaluate the impact of Health Care Reform as key aspects go into effect and additional guidance is made available. For additional discussion regarding Health Care Reform, see Part I, Item 1 “Business—Regulation” and Part I, Item 1A “Risk Factors” in this Annual Report on Form 10-K.
Finally, federal and state regulatory agencies may further restrict our ability to obtain new product approvals, implement changes in premium rates or impose additional restrictions, under new or existing laws that could adversely affect our business, cash flows, financial condition and results of operations.
We are also subject to regulations that may result in assessments under state insurance guarantee association laws.
The National Organization of Life & Health Insurance Guaranty Associations, or NOLHGA, is a voluntary organization consisting of the state life and health insurance guaranty associations located throughout the U.S. Such associations, working together with NOLHGA, provide a safety net for their state’s policyholders, ensuring that they continue to receive coverage, subject to state maximum limits, even if their insurer is declared insolvent. We are aware that the Pennsylvania Insurance Commissioner, or Insurance Commissioner, has placed Penn Treaty Network America Insurance Company and its subsidiary American Network Insurance Company, or collectively Penn Treaty, in rehabilitation, an intermediate action before insolvency. The state court denied the Insurance Commissioner’s petition for the liquidation of Penn Treaty and ordered the Insurance Commissioner to file an updated plan of rehabilitation. An initial plan was filed on April 30, 2013. The Insurance Commissioner filed an amended plan on August 8, 2014 and a second amended plan on October 8, 2014. The state court set a schedule for a notice and comment period and ordered a hearing on the second amended plan, with public comments due by February 13, 2015. The Insurance Commissioner has filed a Notice of Appeal asking the Pennsylvania Supreme Court to reverse the order denying the liquidation petition. The Supreme Court held oral argument on the appeal in September 2014. In the event rehabilitation of Penn Treaty is unsuccessful and Penn Treaty is declared insolvent and placed in liquidation, we and other insurers may be required to pay a portion of their policyholder claims through state guaranty association assessments in future periods. Given the uncertainty around whether Penn Treaty will ultimately be declared insolvent and, if so, the amount of the insolvency, the amount and timing of any associated future guaranty fund assessments, and the availability and amount of any potential premium tax and other offsets, we currently cannot estimate our net exposure, if any, to this potential insolvency. We will continue to monitor the situation and may record a liability and expense in future reporting periods, which could be material to our cash flows and results of operations.
In addition to the external forces discussed in the preceding
paragraphs,
our results of operations are impacted by levels and mix of membership. In recent history, we experienced membership declines due to unfavorable economic conditions driving increased unemployment. In addition, we believe the self-insured portion of our group membership base will continue to increase as a percentage of total group membership.
Further, our mix of membership may include more individuals with a higher acuity level obtaining coverage through our products available on the public exchanges, which may not be appropriately adjusted for in our premium rates.
These membership trends could have a material adverse effect on our future results of operations.
In February 2015, we reported that we were the target of a sophisticated external cyber attack. The attackers gained unauthorized access to certain of our information technology systems and obtained personal information related to many of our current and former members and employees. We are in the process of determining the extent of this cyber attack and are supporting federal law enforcement efforts to identify the responsible parties. For additional information about the cyber attack, see Note 13, “Commitments and Contingencies -
Data Breach
,” to our audited consolidated financial statements included in Part II, Item 8 of this Annual Report on Form 10-K.
Also see Part I, Item 1A “Risk Factors” in this Annual Report on Form 10-K, for a discussion of the factors identified above and other risk factors that could cause actual results to differ materially from those contained in forward-looking statements made in this Annual Report on Form 10-K and presented elsewhere by management from time to time.
-
47
-
Executive Summary
We are one of the largest health benefits companies in terms of medical membership in the United States, serving
37.5
medical members through our affiliated health plans as of
December 31, 2014
.
We are an independent licensee of the Blue Cross and Blue Shield Association, or BCBSA, an association of independent health benefit plans. We serve our members as the Blue Cross licensee for California and as the Blue Cross and Blue Shield, or BCBS, licensee for Colorado, Connecticut, Georgia, Indiana, Kentucky, Maine, Missouri (excluding
30
counties in the Kansas City area), Nevada, New Hampshire, New York (as BCBS in
10
New York City metropolitan and surrounding counties, and as Blue Cross or BCBS in selected upstate counties only), Ohio, Virginia (excluding the Northern Virginia suburbs of Washington, D.C.) and Wisconsin. In a majority of these service areas we do business as Anthem Blue Cross, Anthem Blue Cross and Blue Shield, Blue Cross and Blue Shield of Georgia, and Empire Blue Cross Blue Shield, or Empire Blue Cross (in our New York service areas). We also conduct business through arrangements with other BCBS licensees in the states of South Carolina and Texas. We conduct business through our AMERIGROUP Corporation, or Amerigroup, subsidiary, in Florida, Georgia, Kansas, Louisiana, Maryland, Nevada, New Jersey, New Mexico, New York, Tennessee, Texas and Washington. We also serve customers throughout the country as HealthLink, UniCare (including a non-risk arrangement with the state of Massachusetts), and in certain Arizona, California, Nevada, New York and Virginia markets through our CareMore Health Group, Inc., or CareMore, subsidiary. We are licensed to conduct insurance operations in all
50
states through our subsidiaries.
On February 17, 2015, we completed our acquisition of Simply Healthcare Holdings, Inc., or Simply Healthcare, a leading managed care company for people enrolled in Medicaid and Medicare programs in the state of Florida. This acquisition, which was originally announced on December 22, 2014, aligns with our strategy for continued growth in our Government Business segment. As a result, we will, through our affiliated Medicaid and Medicare plans, serve more than half a million members in the state of Florida.
In preparation for the recent and ongoing changes to the U.S. health care system and to focus on our core growth opportunities across our Commercial and Specialty Business and Government Business segments, we entered into a definitive agreement in December 2013 to sell our 1-800 CONTACTS, Inc., or 1-800 CONTACTS, business to the private equity firm Thomas H. Lee Partners, L.P. Concurrently, we entered into an asset purchase agreement with Luxottica Group to sell our glasses.com related assets. The divestitures were completed on January 31, 2014. The operating results for 1-800 CONTACTS are reported as discontinued operations within the consolidated statements of income included in Part II, Item 8 of this Annual Report on Form 10-K. These results were previously reported in the Commercial and Specialty Business segment. Additionally, the assets and liabilities of 1-800-CONTACTS are reported as held for sale for the year ended December 31, 2013 in the consolidated balance sheets included in Part II, Item 8 of this Annual Report on Form 10-K. Unless otherwise specified, all financial information disclosed in this MD&A is from continuing operations, other than net income, diluted earnings per share and cash flows. In accordance with FASB guidance, we have elected to not separately disclose net cash provided by or used in operating, investing, and financing activities and the net effect of those cash flows on cash and cash equivalents for discontinued operations during the periods presented. For additional information regarding these transactions, see Note 3, “Business Acquisitions and Divestitures," to our audited consolidated financial statements included in Part II, Item 8 of this Annual Report on Form 10-K.
Operating revenue for the year ended
December 31, 2014
was
$73,021.7
,
an increase
of
$2,830.3
, or
4.0%
, from the year ended
December 31, 2013
. The increase in operating revenue was primarily a result of higher premium revenue in our Government Business segment, and, to a lesser extent, increased administrative fees in our Commercial and Specialty Business segment. These increases were partially offset by lower premium revenue in our Commercial and Specialty Business segment.
Net income for the year ended
December 31, 2014
was
$2,569.7
,
an increase
of
$80.0
, or
3.2%
, from the year ended
December 31, 2013
. The
increase
in net income was primarily due to higher operating results in both our Government Business segment and our Commercial and Specialty Business segment. In addition, net income for the year ended December 31, 2013 was impacted by a loss from discontinued operations recorded in relation to the sale of our 1-800 CONTACTS business. The increase in net income for the year ended
December 31, 2014
was further attributable to a decrease in realized losses on the early extinguishment of debt, a decrease in amortization of intangible assets and an increase in net earnings from investment activities. These increases were partially offset by an increase in income tax expense primarily due to the non-tax deductible portion of new fees associated with Health Care Reform that became effective January 1, 2014.
-
48
-
Our diluted earnings per share, or EPS, for the year ended
December 31, 2014
was
$8.99
,
an increase
of
$0.79
, or
9.6%
, from the year ended
December 31, 2013
. Our diluted EPS from continuing operations for the year ended
December 31, 2014
was
$8.96
, an increase of
$0.29
, or
3.3%
, from the year ended
December 31, 2013
. Our diluted shares for the year ended
December 31, 2014
were
285.9
,
a decrease
of
17.9
, or
5.9%
, compared to the year ended
December 31, 2013
. The
increase
in diluted EPS resulted primarily from the lower number of shares outstanding in
2014
due to share buyback activity under our share repurchase program and the increase in net income.
Operating cash flow for the year ended
December 31, 2014
was
$3,369.3
, or
1.3
times net income. Operating cash flow for the year ended
December 31, 2013
was
$3,052.3
, or
1.2
times net income. The
increase
in operating cash flow from
2013
of
$317.0
was primarily attributable to an increase in premium receipts primarily as a result of rate increases across our businesses designed to cover overall cost trends and new fees associated with Health Care Reform and an increase in administrative fee receipts primarily as a result of growth in membership. The increase in cash provided by operating activities was offset, in part, by payments for new fees associated with Health Care Reform, including the HIP Fee and assessments related to the Health Care Reform reinsurance premium stabilization program. The increase was further offset by an increase in claims payments primarily as a result of membership growth, an increase in personnel service costs and an increase in income taxes paid.
Our results of operations discussed throughout this MD&A are determined in accordance with GAAP. We also calculate operating gain, which is a non-GAAP measure, to further aid investors in understanding and analyzing our core operating results and comparing them among periods. Operating gain is calculated as total operating revenue less benefit expense, and selling, general and administrative expense. We use this measure as a basis for evaluating segment performance, allocating resources, setting incentive compensation targets and forecasting future operating periods. This information is not intended to be considered in isolation or as a substitute for income before income tax expense, net income or EPS prepared in accordance with GAAP, and may not be comparable to similarly titled measures reported by other companies. For additional details on operating gain, see our “Reportable Segments Results of Operations” discussion included in this MD&A. For a reconciliation of reportable segment operating gain to income from continuing operations before income tax expense, see Note 19, "Segment Information," to our audited consolidated financial statements included in Part II, Item 8 of this Annual Report on Form 10-K.
We intend to expand through a combination of organic growth, strategic acquisitions and efficient use of capital in both existing and new markets. Our growth strategy is designed to enable us to take advantage of additional economies of scale as well as providing us access to new and evolving technologies and products. In addition, we believe geographic and product diversity reduces our exposure to local or regional regulatory, economic and competitive pressures and provides us with increased opportunities for growth. While we have achieved strong growth as a result of strategic mergers and acquisitions, we have also achieved organic growth in our existing markets over time by delivering excellent service, offering competitively priced products, providing access to high quality provider networks and effectively capitalizing on the brand strength of the Blue Cross and Blue Shield names and marks.
Significant Transactions
While Health Care Reform has caused significant changes to the U.S. health care system in recent years, the more significant transactions that have occurred over the last three years that have impacted or will impact our capital structure or that have or will influence how we conduct our business operations include:
|
•
|
Acquisition of Simply Healthcare (2015);
|
|
•
|
Use of Capital—Board of Directors declaration of dividends on common stock (2014 and prior) and a 42.9% increase in the quarterly dividend to $0.6250 per share (2015); authorization for repurchases of our common stock (2014 and prior); and debt repurchases and new debt issuance (2014 and prior);
|
|
•
|
Acquisition of Amerigroup and the related debt issuance (2012); and
|
|
•
|
Acquisition of 1-800 CONTACTS (2012) and subsequent divestiture (2014).
|
For additional information regarding these transactions, see Note 3, “Business Acquisitions and Divestitures,” Note 12, "Debt" and Note 14, “Capital Stock,” to our audited consolidated financial statements included in Part II, Item 8 of this Annual Report on Form 10-K.
-
49
-
Membership
Our medical membership includes seven different customer types: Local Group, Individual, National Accounts, BlueCard
®
, Medicare, Medicaid and FEP. BCBS-branded business generally refers to members in our service areas licensed by the BCBSA. Non-BCBS-branded business refers to Amerigroup and CareMore members as well as Healthlink and UniCare members predominantly outside of our BCBSA service areas.
|
•
|
Local Group consists of those employer customers with less than 5% of eligible employees located outside of the headquarter state, as well as customers with more than 5% of eligible employees located outside of the headquarter state with up to 5,000 eligible employees. In addition, Local Group includes UniCare members and, effective January 1, 2014, the Employer Group Medicare Advantage members related to Local Group are reported as part of Local Group membership. These are retired members of Local Group accounts who have selected a Medicare Advantage product and were previously reported with our Medicare membership within our Government Business Segment. The Employer Group Medicare Advantage members represent less than 1.0% of Local Group membership. Local Group accounts are generally sold through brokers or consultants working with industry specialists from our in-house sales force and are offered both on and off the public exchanges. Local Group insurance premiums may be based on claims incurred by the group or sold on a self-insured basis. The customer’s buying decision is typically based upon the size and breadth of our networks, customer service, the quality of our medical management services, the administrative cost included in our quoted price, our financial stability, reputation and our ability to effectively service large complex accounts. Local Group accounted for
40.4%
,
41.3%
and
40.6%
of our medical members at December 31,
2014
,
2013
and
2012
, respectively.
|
|
•
|
Individual consists of individual customers under age 65 and their covered dependents. Individual policies are generally sold through independent agents and brokers, retail partnerships, our in-house sales force or via the Internet. Individual business is sold on a fully-insured basis. We offer on-exchange products through public exchanges and off-exchange products. Federal premium subsidies are available only for certain public exchange Individual products. Individual customers are generally more sensitive to product pricing and, to a lesser extent, the configuration of the network, and the efficiency of administration. Account turnover is generally higher with Individual as compared to Local Group. Individual business accounted for
4.8%
,
4.9%
and
5.1%
of our medical members at December 31,
2014
,
2013
and
2012
, respectively.
|
|
•
|
National Accounts generally consist of multi-state employer groups primarily headquartered in an Anthem service area with at least 5% of the eligible employees located outside of the headquarter state and with more than 5,000 eligible employees. Some exceptions are allowed based on broker relationships. Service area is defined as the geographic area in which we are licensed to sell BCBS products. National Accounts are generally sold through independent brokers or consultants retained by the customer working with our in-house sales force. We have an advantage when competing for very large National Accounts due to the size and breadth of our networks and our ability to access the national provider networks of BCBS companies at their competitive local market rates. Additionally, effective January 1, 2014, the Employer Group Medicare Advantage members related to National Accounts groups are reported as part of National Accounts membership. These are retired members of a National Accounts group who have selected a Medicare Advantage product and were previously reported with our Medicare membership within our Government Business segment. The Employer Group Medicare Advantage members represent less than 1.0% of National Accounts membership. National Accounts represented
19.1%
,
19.0%
and
19.4%
of our medical members at December 31,
2014
,
2013
and
2012
, respectively.
|
|
•
|
BlueCard
®
host customers represent enrollees of Blue Cross and/or Blue Shield plans not owned by Anthem who receive health care services in our BCBSA licensed markets. BlueCard
®
membership consists of estimated host members using the national BlueCard
®
program. Host members are generally members who reside in or travel to a state in which an Anthem subsidiary is the Blue Cross and/or Blue Shield licensee and who are covered under an employer-sponsored health plan issued by a non-Anthem controlled BCBSA licensee (i.e., the “home plan”). We perform certain administrative functions for BlueCard
®
members, for which we receive administrative fees from the BlueCard
®
members’ home plans. Other administrative functions, including maintenance of enrollment information and customer service, are performed by the home plan. Host members are computed using, among other things, the average number of BlueCard
®
claims received per month. BlueCard
®
host membership accounted for
14.1%
,
14.2%
and
13.9%
of our medical members at December 31,
2014
,
2013
and
2012
, respectively.
|
-
50
-
|
•
|
Medicare customers are Medicare-eligible individual members age 65 and over who have enrolled in Medicare Advantage, a managed care alternative for the Medicare program, who have purchased Medicare Supplement benefit coverage, some disabled under age 65, or all ages with End Stage Renal Disease. Medicare Supplement policies are sold to Medicare recipients as supplements to the benefits they receive from the Medicare program. Rates are filed with and in some cases approved by state insurance departments. Most of the premium for Medicare Advantage is paid directly by the federal government on behalf of the participant who may also be charged a small premium. Medicare Supplement and Medicare Advantage products are marketed in the same manner, primarily through independent agents and brokers. Medicare business accounted for
3.7%
,
4.0%
and
4.3%
of our medical members at December 31,
2014
,
2013
and
2012
, respectively.
|
|
•
|
Medicaid membership represents eligible members who receive health care benefits through publicly funded health care programs, including Medicaid, TANF, SPD, LTSS, CHIP and Medicaid expansion programs. Total Medicaid program business accounted for
13.8%
,
12.3%
and
12.5%
of our medical members at December 31,
2014
,
2013
and
2012
, respectively.
|
|
•
|
FEP members consist of United States government employees and their dependents within our geographic markets through our participation in the national contract between the BCBSA and the U.S. Office of Personnel Management. FEP business accounted for
4.1%
,
4.3%
and
4.2%
of our medical members at December 31,
2014
,
2013
and
2012
, respectively.
|
In addition to reporting our medical membership by customer type, we report by funding arrangement according to the level of risk that we assume in the product contract. Our two principal funding arrangement categories are fully-insured and self-funded. Fully-insured products are products in which we indemnify our policyholders against costs for health benefits. Self-funded products are offered to customers, generally larger employers, who elect to retain most or all of the financial risk associated with their employees’ health care costs. Some self-funded customers choose to purchase stop-loss coverage to limit their retained risk.
-
51
-
The following table presents our medical membership by customer type, funding arrangement and reportable segment as of December 31,
2014
,
2013
and
2012
. Also included below is other membership by product. The medical membership and other membership presented are unaudited and in certain instances include estimates of the number of members represented by each contract at the end of the period.
|
|
December 31
|
2014 vs. 2013
|
2013 vs. 2012
|
||||||||||||||||||
|
(In thousands)
|
2014
|
2013
|
2012
|
Change
|
% Change
|
Change
|
% Change
|
||||||||||||||
|
Medical Membership
|
|||||||||||||||||||||
|
Customer Type
|
|||||||||||||||||||||
|
Local Group
|
15,137
|
|
14,725
|
|
14,681
|
|
412
|
|
2.8
|
%
|
44
|
|
0.3
|
%
|
|||||||
|
Individual
|
1,793
|
|
1,755
|
|
1,855
|
|
38
|
|
2.2
|
%
|
(100
|
)
|
(5.4
|
)%
|
|||||||
|
National:
|
|||||||||||||||||||||
|
National Accounts
|
7,155
|
|
6,777
|
|
7,000
|
|
378
|
|
5.6
|
%
|
(223
|
)
|
(3.2
|
)%
|
|||||||
|
BlueCard
®
|
5,279
|
|
5,050
|
|
5,016
|
|
229
|
|
4.5
|
%
|
34
|
|
0.7
|
%
|
|||||||
|
Total National
|
12,434
|
|
11,827
|
|
12,016
|
|
607
|
|
5.1
|
%
|
(189
|
)
|
(1.6
|
)%
|
|||||||
|
Medicare
|
1,404
|
|
1,441
|
|
1,538
|
|
(37
|
)
|
(2.6
|
)%
|
(97
|
)
|
(6.3
|
)%
|
|||||||
|
Medicaid
|
5,193
|
|
4,378
|
|
4,520
|
|
815
|
|
18.6
|
%
|
(142
|
)
|
(3.1
|
)%
|
|||||||
|
FEP
|
1,538
|
|
1,527
|
|
1,520
|
|
11
|
|
0.7
|
%
|
7
|
|
0.5
|
%
|
|||||||
|
Total Medical Membership by Customer Type
|
37,499
|
|
35,653
|
|
36,130
|
|
1,846
|
|
5.2
|
%
|
(477
|
)
|
(1.3
|
)%
|
|||||||
|
Funding Arrangement
|
|||||||||||||||||||||
|
Self-Funded
|
22,800
|
|
20,294
|
|
20,176
|
|
2,506
|
|
12.3
|
%
|
118
|
|
0.6
|
%
|
|||||||
|
Fully-Insured
|
14,699
|
|
15,359
|
|
15,954
|
|
(660
|
)
|
(4.3
|
)%
|
(595
|
)
|
(3.7
|
)%
|
|||||||
|
Total Medical Membership by Funding Arrangement
|
37,499
|
|
35,653
|
|
36,130
|
|
1,846
|
|
5.2
|
%
|
(477
|
)
|
(1.3
|
)%
|
|||||||
|
Reportable Segment
|
|||||||||||||||||||||
|
Commercial and Specialty Business
|
29,364
|
|
28,307
|
|
28,552
|
|
1,057
|
|
3.7
|
%
|
(245
|
)
|
(0.9
|
)%
|
|||||||
|
Government Business
|
8,135
|
|
7,346
|
|
7,578
|
|
789
|
|
10.7
|
%
|
(232
|
)
|
(3.1
|
)%
|
|||||||
|
Total Medical Membership by Reportable Segment
|
37,499
|
|
35,653
|
|
36,130
|
|
1,846
|
|
5.2
|
%
|
(477
|
)
|
(1.3
|
)%
|
|||||||
|
Other Membership
|
|||||||||||||||||||||
|
Life and Disability Members
|
4,762
|
|
4,819
|
|
4,838
|
|
(57
|
)
|
(1.2
|
)%
|
(19
|
)
|
(0.4
|
)%
|
|||||||
|
Dental Members
|
4,995
|
|
4,895
|
|
4,863
|
|
100
|
|
2.0
|
%
|
32
|
|
0.7
|
%
|
|||||||
|
Dental Administration Members
|
4,918
|
|
4,886
|
|
4,103
|
|
32
|
|
0.7
|
%
|
783
|
|
19.1
|
%
|
|||||||
|
Vision Members
|
5,096
|
|
4,743
|
|
4,519
|
|
353
|
|
7.4
|
%
|
224
|
|
5.0
|
%
|
|||||||
|
Medicare Advantage Part D Members
|
690
|
|
628
|
|
734
|
|
62
|
|
9.9
|
%
|
(106
|
)
|
(14.4
|
)%
|
|||||||
|
Medicare Part D Standalone Members
|
467
|
|
474
|
|
574
|
|
(7
|
)
|
(1.5
|
)%
|
(100
|
)
|
(17.4
|
)%
|
|||||||
December 31, 2014
Compared to
December 31, 2013
Medical Membership (in thousands)
During the year ended
December 31, 2014
, total medical membership
increased
1,846
, or
5.2%
, primarily due to increases in our Medicaid, Local Group, National Accounts and BlueCard
®
membership.
Self-funded medical membership
increased
2,506
, or
12.3%
, primarily due to increases in our Local Group self-funded accounts including the New York State contract conversion from a fully-insured contract to a self-funded administrative services only, or ASO, contract and the acquisition of a large state ASO contract, which both occurred in the first quarter of 2014. The increase was further attributable to growth in our National Accounts and BlueCard
®
membership.
-
52
-
Fully-insured membership
decreased
660
, or
4.3%
, primarily due to the New York State contract conversion and Local Group membership losses as a result of affordability challenges affecting healthcare consumers. The decrease was partially offset by growth in our Medicaid business.
Local Group membership
increased
412
, or
2.8%
, primarily due to the acquisition of a large ASO state contract. This increase was partially offset by fully-insured membership declines resulting from affordability challenges affecting healthcare consumers.
Individual membership
increased
38
, or
2.2%
, primarily due to public exchange sales in the majority of our markets, partially offset by off-exchange lapses.
National Accounts membership
increased
378
, or
5.6%
, primarily due to new sales and in-group change partially offset by lapses.
BlueCard
®
membership
increased
229
, or
4.5%
, primarily due to favorable membership activity at other BCBSA plans whose members reside in or travel to our licensed areas.
Medicare membership
decreased
37
, or
2.6%
, primarily due to our product repositioning strategy toward HMO product offerings and select service area reductions.
Medicaid membership
increased
815
, or
18.6%
, primarily due to market expansions and commencement of operations in new markets.
FEP membership
increased
11
, or
0.7%
, primarily due to favorable open enrollment.
Other Membership (in thousands)
Our Other products are often ancillary to our health business and can therefore be impacted by corresponding changes in our medical membership.
Life and disability membership
decreased
57
, or
1.2%
, primarily due to higher lapses and in-group change in our Local Group and Individual businesses.
Dental membership
increased
100
, or
2.0%
, primarily due to new sales and growth in our Local Group and National Accounts businesses.
Dental administration membership
increased
32
, or
0.7%
, primarily due to membership expansion under current contracts.
Vision membership
increased
353
, or
7.4%
, primarily due to strong sales and in-group change in our Local Group and National Accounts businesses.
Medicare Advantage Part D membership
increased
62
, or
9.9%
, primarily due to the addition of a new state contract, partially offset by decreases in various markets due to our product repositioning strategy toward HMO product offerings and select service area reductions.
Medicare Part D standalone membership
decreased
7
, or
1.5%
, primarily due to competitive pressure in certain markets.
December 31, 2013
Compared to
December 31, 2012
Medical Membership (in thousands)
During the year ended
December 31, 2013
, total medical membership
decreased
477
, or
1.3%
, primarily due to decreases in our National Accounts, Medicaid, Medicare and Individual membership.
Self-funded medical membership
increased
118
, or
0.6%
, primarily due to increases in our Local Group self-funded accounts, partially offset by lapses in our National Accounts and BlueCard
®
business.
-
53
-
Fully-insured membership
decreased
595
, or
3.7%
, primarily due to membership losses in certain Local Group and Individual markets, as well as membership losses in our Medicaid and Medicare business, described below.
Local Group membership
increased
44
, or
0.3%
, primarily due to new sales in several markets, partially offset by insured membership losses from strategic product portfolio changes in certain states, competitive pressure in certain markets and, we believe, affordability challenges affecting healthcare consumers in general.
Individual membership
decreased
100
, or
5.4%
, primarily due to a heightened competitive environment in certain markets.
National Accounts membership
decreased
223
, or
3.2%
, primarily due to lapses in our self-funded business.
BlueCard
®
membership
increased
34
, or
0.7%
, primarily due to favorable membership activity at other BCBSA plans whose members reside in or travel to our licensed areas.
Medicare membership
decreased
97
, or
6.3%
, primarily due to our product repositioning strategy toward HMO product offerings.
Medicaid membership
decreased
142
, or
3.1%
, primarily due to membership losses in our California and New York plans and termination of the Ohio contract on June 30, 2013, partially offset by an increase in membership in various other states.
FEP membership
increased
7
, or
0.5%
, primarily due to favorable in-group change.
Other Membership (in thousands)
Our Other products are often ancillary to our health business and can therefore be impacted by corresponding changes in our medical membership.
Life and disability membership
decreased
19
, or
0.4%
, primarily due to the overall declines in our Commercial and Specialty Business medical membership. Life and disability products are generally offered as part of Commercial and Specialty Business medical membership sales.
Dental membership
increased
32
, or
0.7%
, primarily due to growth from the launch of new product offerings, partially offset by declines in our Commercial and Specialty Business membership.
Dental administration membership
increased
783
, or
19.1%
, primarily due to the acquisition of a large managed dental contract pursuant to which we provide dental administrative services.
Vision membership
increased
224
, or
5.0%
, primarily due to strong sales and in-group change in our Local Group business.
Medicare Advantage Part D membership
decreased
106
, or
14.4%
, primarily due to our product repositioning strategy toward HMO product offerings.
Medicare Part D standalone membership
decreased
100
, or
17.4%
, primarily due to competitive pressure in certain markets.
Cost of Care
The following discussion summarizes our aggregate underlying cost of care trends for the year ended
December 31, 2014
for our Local Group fully-insured business only.
Our cost of care trends are calculated by comparing the year-over-year change in average per member per month claim costs, excluding member co-payments and deductibles. While our cost of care trend varies by geographic location, based on underlying medical cost trends, we estimate that our aggregate cost of care trend was approximately 6.5% for the full year of
2014
. We anticipate that medical cost trends will increase by approximately 50 basis points in
2015
.
-
54
-
Provider rate increases were a primary driver of medical cost trends in 2014, consistent with 2013, and we continually negotiate with hospitals and physicians to manage these cost trends. We remain committed to optimizing our reimbursement rates and strategies to help address the cost pressures faced by employers and consumers. Unit cost increases were also a driver of pharmacy cost. In recent years many large volume brand drugs have launched generic alternatives, which have helped to mitigate pharmacy cost trend, but in 2014 we experienced a return to more normal historical average trends. New high cost Hepatitis C drug therapies also have put upward pressure on pharmacy trend.
Medical utilization, including pharmacy utilization, has been lower than in previous years and was not a primary driver of increased costs for the year ended
December 31, 2014
.
In response to cost trends, we continue to pursue contracting and plan design changes, promote and implement performance-based contracts that reward clinical outcomes and quality, and expand our disease management and advanced care management programs. We are taking a leadership role in the area of payment reform as evidenced by our Enhanced Personal Health Care program. By establishing the primary care doctor as central to the coordination of a patient’s health care needs, the initiative builds on the success of current patient-centered medical home programs in helping to improve patient care while lowering costs.
A number of clinical management initiatives are in place to help mitigate inpatient trend. Focused review efforts continue in key areas, including targeting outlier facilities for length of stay and readmission, and high risk maternity and neonatal intensive care unit cases, among others. Additionally, we continue to refine our programs related to readmission management, focused behavioral health readmission reduction and post-discharge follow-up care.
Outpatient costs are a collection of different types of expenses, such as outpatient facilities, labs, x-rays, emergency room, occupational and physical therapy and many others. Two key examples developed to mitigate outpatient costs are as follows:
|
•
|
Cancer Care Quality Program:
This program, developed in collaboration with our subsidiary, AIM Specialty Health, or AIM, identifies certain cancer treatment pathways selected based upon current medical evidence, peer-reviewed published literature, consensus guidelines and our clinical policies to support oncologists in identifying cancer treatment therapies that are highly effective and provide greater value.
|
|
•
|
Expanded Cost and Quality Surgery Program:
This program, developed in collaboration with AIM, proactively contacts members who have elected to have an endoscopy, colonoscopy, or knee or shoulder arthroscopy to inform them about alternative sites of care, with the goal of offering information about providers who may be more cost effective.
|
-
55
-
Consolidated Results of Operations
Our consolidated summarized results of operations for the years ended
December 31, 2014
,
2013
and
2012
are discussed in the following section.
|
|
|
Change
|
||||||||||||||||||||||||
|
|
Years Ended December 31
|
2014 vs. 2013
|
2013 vs. 2012
|
|||||||||||||||||||||||
|
|
2014
|
2013
|
2012
|
$
|
%
|
$
|
%
|
|||||||||||||||||||
|
Total operating revenue
|
$
|
73,021.7
|
|
$
|
70,191.4
|
|
$
|
60,514.0
|
|
$
|
2,830.3
|
|
4.0
|
%
|
$
|
9,677.4
|
|
16.0
|
%
|
|||||||
|
Net investment income
|
724.4
|
|
659.1
|
|
686.1
|
|
65.3
|
|
9.9
|
%
|
(27.0
|
)
|
(3.9
|
)%
|
||||||||||||
|
Net realized gains on investments
|
177.0
|
|
271.9
|
|
334.9
|
|
(94.9
|
)
|
(34.9
|
)%
|
(63.0
|
)
|
(18.8
|
)%
|
||||||||||||
|
Other-than-temporary impairment losses on investments
|
(49.0
|
)
|
(98.9
|
)
|
(37.8
|
)
|
49.9
|
|
50.5
|
%
|
(61.1
|
)
|
(161.6
|
)%
|
||||||||||||
|
Total revenues
|
73,874.1
|
|
71,023.5
|
|
61,497.2
|
|
2,850.6
|
|
4.0
|
%
|
9,526.3
|
|
15.5
|
%
|
||||||||||||
|
Benefit expense
|
56,854.9
|
|
56,237.1
|
|
48,213.6
|
|
617.8
|
|
1.1
|
%
|
8,023.5
|
|
16.6
|
%
|
||||||||||||
|
Selling, general and administrative expense
|
11,748.4
|
|
9,952.9
|
|
8,680.5
|
|
1,795.5
|
|
18.0
|
%
|
1,272.4
|
|
14.7
|
%
|
||||||||||||
|
Other expense
1
|
902.7
|
|
993.3
|
|
744.8
|
|
(90.6
|
)
|
(9.1
|
)%
|
248.5
|
|
33.4
|
%
|
||||||||||||
|
Total expenses
|
69,506.0
|
|
67,183.3
|
|
57,638.9
|
|
2,322.7
|
|
3.5
|
%
|
9,544.4
|
|
16.6
|
%
|
||||||||||||
|
Income from continuing operations before income tax expense
|
4,368.1
|
|
3,840.2
|
|
3,858.3
|
|
527.9
|
|
13.7
|
%
|
(18.1
|
)
|
(0.5
|
)%
|
||||||||||||
|
Income tax expense
|
1,808.0
|
|
1,205.9
|
|
1,207.3
|
|
602.1
|
|
49.9
|
%
|
(1.4
|
)
|
(0.1
|
)%
|
||||||||||||
|
Income from continuing operations
|
2,560.1
|
|
2,634.3
|
|
2,651.0
|
|
(74.2
|
)
|
(2.8
|
)%
|
(16.7
|
)
|
(0.6
|
)%
|
||||||||||||
|
Income (loss) from discontinued operations, net of tax
2
|
9.6
|
|
(144.6
|
)
|
4.5
|
|
154.2
|
|
NM
3
|
|
(149.1
|
)
|
NM
3
|
|
||||||||||||
|
Net income
|
$
|
2,569.7
|
|
$
|
2,489.7
|
|
$
|
2,655.5
|
|
$
|
80.0
|
|
3.2
|
%
|
$
|
(165.8
|
)
|
(6.2
|
)%
|
|||||||
|
Average diluted shares outstanding
|
285.9
|
|
303.8
|
|
324.8
|
|
(17.9
|
)
|
(5.9
|
)%
|
(21.0
|
)
|
(6.5
|
)%
|
||||||||||||
|
Diluted net income (loss) per share:
|
||||||||||||||||||||||||||
|
Diluted - continuing operations
|
$
|
8.96
|
|
$
|
8.67
|
|
$
|
8.17
|
|
$
|
0.29
|
|
3.3
|
%
|
$
|
0.50
|
|
6.1
|
%
|
|||||||
|
Diluted - discontinued operations
2
|
0.03
|
|
(0.47
|
)
|
0.01
|
|
0.50
|
|
NM
3
|
|
(0.48
|
)
|
NM
3
|
|
||||||||||||
|
Diluted net income per share
|
$
|
8.99
|
|
$
|
8.20
|
|
$
|
8.18
|
|
$
|
0.79
|
|
9.6
|
%
|
$
|
0.02
|
|
0.2
|
%
|
|||||||
|
Benefit expense ratio
4
|
83.1
|
%
|
85.1
|
%
|
85.3
|
%
|
(200)bp
5
|
|
(20)bp
5
|
|
||||||||||||||||
|
Selling, general and administrative expense ratio
6
|
16.1
|
%
|
14.2
|
%
|
14.3
|
%
|
190bp
5
|
|
(10)bp
5
|
|
||||||||||||||||
|
Income from continuing operations before income taxes as a percentage of total revenue
|
5.9
|
%
|
5.4
|
%
|
6.3
|
%
|
50bp
5
|
|
(90)bp
5
|
|
||||||||||||||||
|
Net income as a percentage of total revenue
|
3.5
|
%
|
3.5
|
%
|
4.3
|
%
|
0bp
5
|
|
(80)bp
5
|
|
||||||||||||||||
Certain of the following definitions are also applicable to all other results of operations tables in this discussion:
|
1
|
Includes interest expense, amortization of other intangible assets and loss on extinguishment of debt.
|
|
2
|
The operating results of 1-800 CONTACTS are reported as discontinued operations as a result of the sale of the business completed on January 31, 2014.
|
|
3
|
Calculation not meaningful.
|
|
4
|
Benefit expense ratio represents benefit expense as a percentage of premium revenue. Premiums for the years ended
December 31, 2014
,
2013
and
2012
were
$68,389.8
,
$66,119.1
and
$56,496.7
, respectively. Premiums are included in total operating revenue presented above.
|
|
5
|
bp = basis point; one hundred basis points = 1%.
|
|
6
|
Selling, general and administrative expense ratio represents selling, general and administrative expense as a percentage of total operating revenue.
|
-
56
-
Year Ended
December 31, 2014
Compared to the Year Ended
December 31, 2013
Total operating revenue
increased
$2,830.3
, or
4.0%
, to
$73,021.7
in
2014
, resulting primarily from higher premiums and, to a lesser extent, increased administrative fees. Higher premiums were mainly due to rate increases across our businesses designed to cover overall cost trends and new fees associated with Health Care Reform, including HIP Fees reimbursed by Medicaid state plans. The increase in premiums was further attributable to membership increases in our Medicaid and Individual businesses. The increase in premiums was offset, in part, by fully-insured membership declines in our Local Group business as a result of the New York State contract conversion and affordability challenges affecting healthcare consumers. The increase was further offset by higher experience rated refunds in our Medicaid business, and lower premiums in our Medicare Advantage business primarily due to membership declines and a refinement of estimates associated with Medicare risk score revenue for prior years. The increase in administrative fees primarily resulted from membership growth in our Local Group business, including the New York State contract conversion and the acquisition of a large state ASO contract, which both occurred in the first quarter of 2014. The increase in administrative fees was further attributable to growth in our National Accounts business.
Net investment income
increased
$65.3
, or
9.9%
, to
$724.4
in
2014
, primarily due to higher income from alternative investments and higher investment yields.
Net realized gains on investments
decreased
$94.9
, or
34.9%
, to
$177.0
in
2014
, primarily due to a decrease in net realized gains on sales of equity securities, partially offset by an increase in net realized gains on sales of fixed maturity securities.
Other-than-temporary impairment losses on investments
decreased
$49.9
, or
50.5%
, to
$49.0
in
2014
, primarily due to a decrease in impairment losses on certain joint venture investments and fixed maturity securities.
Benefit expense
increased
$617.8
, or
1.1%
, to
$56,854.9
in
2014
, primarily due to benefit cost trends across our businesses and membership growth in our Medicaid and Individual businesses. The increase in benefit expense was further a result of higher pharmacy costs primarily attributable to new high cost Hepatitis C drug therapies. These increases were partially offset by the fully-insured membership declines in our Local Group and Medicare Advantage businesses, as described above. In addition, the increase in benefit expense was offset, in part, by our estimate of reinsurance recoveries relating to the Health Care Reform reinsurance premium stabilization program of $753.4 for 2014.
Our benefit expense ratio
decreased
200
basis points to
83.1%
in
2014
, primarily due to rate increases across our businesses designed to cover overall cost trends and new fees associated with Health Care Reform, including additional premiums collected to help cover the non-tax deductible impact of the HIP Fee. The decrease was further attributable to better than expected medical cost trends in our Medicaid business. These improvements were partially offset by higher pharmacy costs primarily attributable to new high cost Hepatitis C drug therapies.
Selling, general and administrative expense
increased
$1,795.5
, or
18.0%
, to
$11,748.4
in
2014
. Our selling, general and administrative expense ratio
increased
190
basis points to
16.1%
in
2014
. The increases in the expense and ratio were both primarily due to new fees related to Health Care Reform that were effective January 1, 2014, including $893.3 for the HIP Fee and $447.7 of assessments related to the Health Care Reform reinsurance premium stabilization program.
Other expenses
decreased
$90.6
, or
9.1%
, to
$902.7
in
2014
, primarily due to lower losses recognized on debt extinguishment associated with the early redemption and repurchase of outstanding senior unsecured notes. During the years ended December 31, 2014 and 2013, we recognized losses on extinguishment of debt of $
81.1
and $
145.3
, respectively. The decrease in other expense was further attributable to reduced amortization of certain other intangible assets acquired in prior years. For additional information related to our borrowings, see "Liquidity and Capital Resources -
Future Sources and Uses of Liquidity,
" below.
Income tax expense
increased
$602.1
, or
49.9%
, to
$1,808.0
in
2014
. The effective tax rates in
2014
and
2013
were
41.4%
and
31.4%
, respectively. The increase in income tax expense was primarily due to the non-tax deductible HIP Fee effective for 2014 and increased income before income taxes. The 2013 expense and effective tax rate were lower because they include benefits resulting from a favorable tax election made subsequent to the Amerigroup acquisition and from inclusion of Amerigroup in our state apportionment factors calculation, which produces a lower state tax expense. The increase in the effective tax rate for 2014 was primarily due to the non-tax deductible HIP fee.
-
57
-
Our net income as a percentage of total revenue was
3.5%
in
2014
and
2013
as a result of all factors discussed above.
Year Ended
December 31, 2013
Compared to the Year Ended
December 31, 2012
Total operating revenue
increased
$9,677.4
, or
16.0%
to
$70,191.4
in
2013
, resulting primarily from higher premiums and, to a lesser extent, increased administrative fees. The higher premiums were mainly due to increases in our Medicaid business primarily as a result of our acquisition of Amerigroup in December 2012. Rate increases in our Local Group, FEP, Individual and National businesses designed to cover overall cost trends as well as premium rate and membership increases in our Specialty businesses and increased administrative fees resulting from pricing increases for self-funded members in our Commercial businesses also contributed to the increased operating revenue. These increases were partially offset by fully-insured membership declines in our Local Group business due to strategic portfolio changes in certain states, competitive pressure in certain markets and, we believe, affordability challenges affecting healthcare consumers in general. Additionally, lower revenues in our Medicare Advantage and Medicare Part D businesses, primarily due to membership declines as a result of our product repositioning strategy toward HMO product offerings, partially offset the increased operating revenues.
Net investment income
decreased
$27.0
, or
3.9%
, to
$659.1
in
2013
, primarily due to lower investment yields.
Net realized gains on investments
decreased
$63.0
, or
18.8%
, to
$271.9
in
2013
, primarily due to lower net realized gains on sales of fixed maturity securities partially offset by an increase in net realized gains on sales of equity securities, a realized gain on the partial divestiture of an equity method investment and an increase in net realized gains on sales and settlements of derivative financial instruments.
Other-than-temporary impairment losses on investments
increased
$61.1
, or
161.6%
, to
$98.9
in
2013
, primarily due to the impairment of certain joint venture investments and fixed maturity securities.
Benefit expense
increased
$8,023.5
, or
16.6%
, to
$56,237.1
in
2013
, primarily from our acquisition of Amerigroup and increased benefit costs in our Local Group, Individual and FEP businesses. These increases were partially offset by the fully-insured membership declines in our Local Group and Medicare Advantage businesses as described above.
Our benefit expense ratio
decreased
20
basis points to
85.1%
in
2013
, due, in part, to our product repositioning strategy in certain Medicare Advantage plans toward HMO product offerings with lower benefit costs. The decrease was further attributable to the favorable impact of declines in membership in our Local Group business in products with higher benefit costs and lower than expected medical cost trends. These improvements were partially offset by the acquisition of Amerigroup, which carries higher average benefit expense ratios than our consolidated average as well as higher than expected medical cost trends in our Individual business.
Selling, general and administrative expense
increased
$1,272.4
, or
14.7%
, to
$9,952.9
in
2013
, primarily due to the inclusion of selling, general and administrative expense related to our Amerigroup subsidiary in 2013. The increase was further attributable to costs incurred in preparation for the implementation of Health Care Reform effective in 2014 as well as increases in incentive compensation as a result of our operating performance.
Our selling, general and administrative expense ratio
decreased
10
basis points to
14.2%
in
2013
, primarily due to the effect of the increase in operating revenue from Amerigroup partially offset by the increased selling general and administrative expense discussed in the preceding paragraph.
Other expense
increased
$248.5
, or
33.4%
, to
$993.3
in
2013
, primarily due to losses recognized on debt extinguishment associated with our early redemption and repurchases of $1,100.0 aggregate principal amount of outstanding senior unsecured notes. The increase in other expense was further attributable to increased interest expense resulting from higher outstanding debt balances associated with our acquisition of Amerigroup and the issuance on July 30, 2013 of $650.0 of 2.300% notes due 2018 and $600.0 of 5.100% notes due 2044 to fund, in part, the early redemption and repurchases discussed above. For additional information related to our borrowings, see "Liquidity and Capital Resources -
Future Sources and Uses of Liquidity,
" below.
Income tax expense
decreased
$1.4
, or
0.1%
, to
$1,205.9
in
2013
. The effective tax rates in
2013
and
2012
were
31.4%
and
31.3%
, respectively. The effective tax rate in 2013 included benefits resulting from a favorable tax election made subsequent to the Amerigroup acquisition and inclusion of Amerigroup in our state apportionment factors calculation, which
-
58
-
produced a lower effective state tax rate. The effective tax rate in 2012 included benefits resulting from settlement with the IRS of items related to not-for-profit conversions and corporate reorganizations prior to 2012, as well as issues related to certain of our acquired companies incurred prior to our acquisition of those companies. These favorable items in the 2012 effective tax rate were partially offset by increases due to the impact of non-tax deductible litigation settlement expenses and an increase in our state deferred tax asset valuation allowance attributable to uncertainty associated with certain state net operating loss carryforwards.
In December 2013, we entered into a definitive agreement to sell our 1-800 CONTACTS business and an asset purchase agreement to sell our glasses.com related assets (collectively, 1-800 CONTACTS). The operating results for 1-800 CONTACTS are reported as discontinued operations. For the year ended December 31, 2013, we recorded a loss from discontinued operations, net of tax, of $144.6 compared to income from discontinued operations, net of tax, of $4.5 for the year ended December 31, 2012. Included in the loss from discontinued operations for the year ended December 31, 2013, is a loss on disposal of held for sale assets, net of tax, of $164.5. The loss on disposal was calculated as the difference between the fair value, as determined by the sales agreements less costs to sell, and the carrying value of the held for sale assets at December 31, 2013. The divestitures were completed on January 31, 2014 and did not result in any material difference to the loss on disposal recognized during the year ended December 31, 2013.
Our net income as a percentage of total revenue
decreased
80
basis points to
3.5%
in
2013
as compared to
2012
as a result of all factors discussed above.
Reportable Segments Results of Operations
We use operating gain to evaluate the performance of our reportable segments, which are Commercial and Specialty Business; Government Business; and Other. Operating gain, which is a non-GAAP measure, is calculated as total operating revenue less benefit expense and selling, general and administrative expense. It does not include net investment income, net realized gains/losses on investments, other-than-temporary impairment losses recognized in income, interest expense, amortization of other intangible assets, loss on extinguishment of debt or income taxes, as these items are managed in a corporate shared service environment and are not the responsibility of operating segment management. Effective January 1, 2014, our Employer Group Medicare Advantage members are being reported within Local Group and National Accounts in our Commercial and Specialty Business segment and prior period segment amounts have been reclassified to conform to the new presentation. These members were previously reported with our Medicare membership within our Government Business segment. The Employer Group Medicare Advantage members are retired members who have selected a Medicare Advantage product through our Local Group and National Accounts.
The discussion of segment results for the years ended
December 31, 2014
,
2013
and
2012
presented below are based on operating gain, as described above, and operating margin, which is calculated as operating gain divided by operating revenue. Our definitions of operating gain and operating margin may not be comparable to similarly titled measures reported by other companies. For additional information, including a reconciliation of non-GAAP financial measures, see Note 19, “Segment Information,” to our audited consolidated financial statements included in Part II, Item 8 of this Annual Report on Form 10-K.
-
59
-
Our Commercial and Specialty Business, Government Business, and Other segments’ summarized results of operations for the years ended
December 31, 2014
,
2013
and
2012
are as follows:
|
|
|
|
|
Change
|
|||||||||||||||||||||||
|
|
Years Ended December 31
|
2014 vs. 2013
|
2013 vs. 2012
|
||||||||||||||||||||||||
|
|
2014
|
2013
|
2012
|
$
|
%
|
$
|
%
|
||||||||||||||||||||
|
Commercial and Specialty Business
|
|||||||||||||||||||||||||||
|
Operating revenue
|
$
|
39,199.6
|
|
$
|
39,404.2
|
|
$
|
39,639.9
|
|
$
|
(204.6
|
)
|
(0.5
|
)%
|
$
|
(235.7
|
)
|
(0.6
|
)%
|
||||||||
|
Operating gain
|
$
|
3,260.9
|
|
$
|
3,176.4
|
|
$
|
3,396.3
|
|
$
|
84.5
|
|
2.7
|
%
|
$
|
(219.9
|
)
|
(6.5
|
)%
|
||||||||
|
Operating margin
|
8.3
|
%
|
8.1
|
%
|
8.6
|
%
|
20
|
bp
|
(50
|
)bp
|
|||||||||||||||||
|
Government Business
|
|||||||||||||||||||||||||||
|
Operating revenue
|
$
|
33,796.4
|
|
$
|
30,752.6
|
|
$
|
20,838.9
|
|
$
|
3,043.8
|
|
9.9
|
%
|
$
|
9,913.7
|
|
47.6
|
%
|
||||||||
|
Operating gain
|
$
|
1,191.9
|
|
$
|
844.0
|
|
$
|
285.4
|
|
$
|
347.9
|
|
41.2
|
%
|
$
|
558.6
|
|
195.7
|
%
|
||||||||
|
Operating margin
|
3.5
|
%
|
2.7
|
%
|
1.4
|
%
|
80
|
bp
|
130
|
bp
|
|||||||||||||||||
|
Other
|
|||||||||||||||||||||||||||
|
Operating revenue
1
|
$
|
25.7
|
|
$
|
34.6
|
|
$
|
35.2
|
|
$
|
(8.9
|
)
|
(25.7
|
)%
|
$
|
(0.6
|
)
|
(1.7
|
)%
|
||||||||
|
Operating loss
2
|
$
|
(34.4
|
)
|
$
|
(19.0
|
)
|
$
|
(61.8
|
)
|
$
|
(15.4
|
)
|
81.1
|
%
|
$
|
42.8
|
|
(69.3
|
)%
|
||||||||
|
1
|
Fluctuations not material.
|
|
2
|
Fluctuations primarily a result of changes in unallocated corporate expenses.
|
Year Ended
December 31, 2014
Compared to the Year Ended
December 31, 2013
Commercial and Specialty Business
Operating revenue
decreased
$204.6
, or
0.5%
, to
$39,199.6
in
2014
, primarily due to fully-insured membership declines in our Local Group business resulting from the impact of the New York State contract conversion and affordability challenges affecting healthcare consumers. These decreases were partially offset by premium rate increases in our Local Group and Individual businesses designed to cover overall cost trends and new fees associated with Health Care Reform, and membership growth in our Individual business. The decrease in operating revenue was further offset by increased administrative fees primarily resulting from membership growth in our Local Group business, including the acquisition of a large state ASO contract in the first quarter of 2014. The increase in administrative fees was further attributable to growth in our National Accounts business.
Operating gain
increased
$84.5
, or
2.7%
, to
$3,260.9
in
2014
, primarily as a result of improved performance in our Individual business reflecting our public exchange strategy implemented during the year, along with membership growth in self-funded products. The increase in operating gain was further attributable to additional premiums collected to help cover the non-tax deductible impact of the HIP Fee. These increases were partially offset by insured membership declines in our Local Group business, continued costs incurred associated with Health Care Reform market changes and higher pharmacy costs primarily attributable to new high cost Hepatitis C drug therapies.
The operating margin in
2014
was
8.3%
, a
20
basis point
increase over
2013
, primarily due to the factors discussed in the preceding two paragraphs.
Government Business
Operating revenue
increased
$3,043.8
, or
9.9%
, to
$33,796.4
in
2014
, primarily due to increased premiums in our Medicaid and FEP businesses as a result of premium rate increases designed to cover overall cost trends and new fees associated with Health Care Reform. The increase in operating revenue was further attributable to membership growth in our Medicaid business and additional premiums collected to help cover the non-tax deductible impact of the HIP Fee. These increases were partially offset by higher experience rated refunds in our Medicaid business, lower premiums in our Medicare
-
60
-
businesses, primarily due to membership declines in our Medicare Advantage business, and a refinement of estimates associated with Medicare risk score revenue for prior years.
Operating gain
increased
$347.9
, or
41.2%
, to
$1,191.9
in
2014
, primarily due to better than expected medical cost trends and membership growth in our Medicaid business. These increases were partially offset by higher pharmacy costs primarily attributable to new high cost Hepatitis C drug therapies, and a refinement of estimates associated with Medicare risk score revenue for prior years.
The operating margin in
2014
was
3.5%
, a
80
basis point
increase over
2013
, primarily due to the factors discussed in the preceding two paragraphs.
Year Ended
December 31, 2013
Compared to the Year Ended
December 31, 2012
Commercial and Specialty Business
Operating revenue
decreased
$235.7
, or
0.6%
, to
$39,404.2
in
2013
, primarily due to fully-insured membership declines in our Local Group business resulting from strategic product portfolio changes in certain states, competitive pressure in certain markets and, we believe, affordability challenges affecting healthcare consumers in general. This decrease was partially offset by premium rate increases in our Local Group, Individual and National businesses designed to cover overall cost trends, premium rate and membership increases in our Specialty businesses, primarily related to our dental and vision products, as well as increased administrative fees resulting from pricing increases for self-funded members in our Commercial businesses.
Operating gain
decreased
$219.9
, or
6.5%
, to
$3,176.4
in
2013
, primarily as a result of higher selling, general and administrative expenses driven by costs incurred in preparation for the implementation of Health Care Reform provisions that become effective in 2014 as well as increases in allocated incentive compensation as a result of consolidated operating performance. The decrease was further attributable to increased benefit costs in our Individual business. These decreases were partially offset by improved results in our Local Group business resulting from lower than anticipated medical cost trends.
The operating margin in
2013
was
8.1%
, a
50
basis point
decrease from
2012
, primarily due to the factors discussed in the preceding two paragraphs.
Government Business
Operating revenue
increased
$9,913.7
, or
47.6%
, to
$30,752.6
in
2013
, primarily due to the acquisition of Amerigroup, growth in our FEP business due to premium rate increases designed to cover overall cost trends, and increases in membership in our CareMore and FEP businesses. These increases were partially offset by membership declines in our non-CareMore Medicare Advantage and Medicare Part D businesses related to our product repositioning strategy toward HMO product offerings.
Operating gain
increased
$558.6
, or
195.7%
, to
$844.0
in
2013
, primarily due to the acquisition of Amerigroup and improved operating results in the majority of our other government lines of business.
The operating margin in
2013
was
2.7%
, a
130
basis point
increase over
2012
, primarily due to the factors discussed in the preceding two paragraphs.
Critical Accounting Policies and Estimates
We prepare our consolidated financial statements in conformity with GAAP. Application of GAAP requires management to make estimates and assumptions that affect the amounts reported in our consolidated financial statements and accompanying notes and within this MD&A. We consider our most important accounting policies that require significant estimates and management judgment to be those policies with respect to liabilities for medical claims payable, income taxes, goodwill and other intangible assets, investments and retirement benefits, which are discussed below. Our other significant accounting policies are summarized in Note 2, “Basis of Presentation and Significant Accounting Policies,” to our audited consolidated financial statements included in Part II, Item 8 of this Annual Report on Form 10-K.
-
61
-
We continually evaluate the accounting policies and estimates used to prepare the consolidated financial statements. In general, our estimates are based on historical experience, evaluation of current trends, information from third party professionals and various other assumptions that we believe to be reasonable under the known facts and circumstances.
Medical Claims Payable
The most subjective accounting estimate in our consolidated financial statements is our liability for medical claims payable. At
December 31, 2014
, this liability was
$6,861.2
and represented
18.1%
of our total consolidated liabilities. We record this liability and the corresponding benefit expense for incurred but not paid claims, including the estimated costs of processing such claims. Incurred but not paid claims include (1) an estimate for claims that are incurred but not reported, as well as claims reported to us but not yet processed through our systems, which approximated 95.8%, or $6,572.4, of our total medical claims liability as of
December 31, 2014
; and (2) claims reported to us and processed through our systems but not yet paid, which approximated 4.2%, or $288.8, of the total medical claims payable as of
December 31, 2014
. The level of claims payable processed through our systems but not yet paid may fluctuate from one period end to the next, from approximately 1% to 5% of our total medical claims liability, due to timing of when claim payments are made.
Liabilities for both claims incurred but not reported and reported but not yet processed through our systems are determined in aggregate, employing actuarial methods that are commonly used by health insurance actuaries and meet Actuarial Standards of Practice. Actuarial Standards of Practice require that the claim liabilities be appropriate under moderately adverse circumstances. We determine the amount of the liability for incurred but not paid claims by following a detailed actuarial process that entails using both historical claim payment patterns as well as emerging medical cost trends to project our best estimate of claim liabilities. Under this process, historical paid claims data is formatted into “claim triangles,” which compare claim incurred dates to the dates of claim payments. This information is analyzed to create “completion factors” that represent the average percentage of total incurred claims that have been paid through a given date after being incurred. Completion factors are applied to claims paid through the period end date to estimate the ultimate claim expense incurred for the period. Actuarial estimates of incurred but not paid claim liabilities are then determined by subtracting the actual paid claims from the estimate of the ultimate incurred claims.
For the most recent incurred months (typically the most recent two months), the percentage of claims paid for claims incurred in those months is generally low. This makes the completion factor methodology less reliable for such months. Therefore, incurred claims for recent months are not projected from historical completion and payment patterns; rather they are projected by estimating the claims expense for those months based on recent claims expense levels and health care trend levels, or “trend factors.”
Because the reserve methodology is based upon historical information, it must be adjusted for known or suspected operational and environmental changes. These adjustments are made by our actuaries based on their knowledge and their estimate of emerging impacts to benefit costs and payment speed. Circumstances to be considered in developing our best estimate of reserves include changes in utilization levels, unit costs, mix of business, benefit plan designs, provider reimbursement levels, processing system conversions and changes, claim inventory levels, claim processing patterns, claim submission patterns and operational changes resulting from business combinations. A comparison of prior period liabilities to re-estimated claim liabilities based on subsequent claims development is also considered in making the liability determination. In our comparison of prior year, the methods and assumptions are not changed as reserves are recalculated; rather the availability of additional paid claims information drives our changes in the re-estimate of the unpaid claim liability. To the extent appropriate, changes in such development are recorded as a change to current period benefit expense.
We regularly review and set assumptions regarding cost trends and utilization when initially establishing claim liabilities. We continually monitor and adjust the claims liability and benefit expense based on subsequent paid claims activity. If it is determined that our assumptions regarding cost trends and utilization are significantly different than actual results, our income statement and financial position could be impacted in future periods. Adjustments of prior year estimates may result in additional benefit expense or a reduction of benefit expense in the period an adjustment is made. Further, due to the considerable variability of health care costs, adjustments to claim liabilities occur each period and are sometimes significant as compared to the net income recorded in that period. Prior period development is recognized immediately upon the actuary’s judgment that a portion of the prior period liability is no longer needed or that an additional liability should have been accrued. That determination is made when sufficient information is available to ascertain that the re-estimate of the liability is reasonable.
-
62
-
While there are many factors that are used as a part of the estimation of our medical claims payable liability, the two key assumptions having the most significant impact on our incurred but not paid claims liability as of
December 31, 2014
were the completion and trend factors. As discussed above, these two key assumptions can be influenced by other operational variables including system changes, provider submission patterns and business combinations.
There is variation in the reasonable choice of completion factors by duration for durations of three months through twelve months where the completion factors have the most significant impact. As previously discussed, completion factors tend to be less reliable for the most recent months and therefore are not specifically utilized for months one and two. In our analysis for the claim liabilities at
December 31, 2014
, the variability in months three to five was estimated to be between 40 and 90 basis points, while months six through twelve have much lower variability ranging from 0 to 30 basis points.
The difference in completion factor assumptions, assuming moderately adverse experience, results in variability of 2%, or approximately $155.0, in the
December 31, 2014
incurred but not paid claims liability, depending on the completion factors chosen. It is important to note that the completion factor methodology inherently assumes that historical completion rates will be reflective of the current period. However, it is possible that the actual completion rates for the current period will develop differently from historical patterns and therefore could fall outside the possible variations described herein.
The other major assumption used in the establishment of the
December 31, 2014
incurred but not paid claim liability was the trend factors. In our analysis for the period ended
December 31, 2014
, there was a 330 basis point differential in the high and low trend factors assuming moderately adverse experience. This range of trend factors would imply variability of 4%, or approximately $303.0, in the incurred but not paid claims liability, depending upon the trend factors used. Because historical trend factors are often not representative of current claim trends, the trend experience for the most recent six to nine months, plus knowledge of recent events likely affecting current trends, have been taken into consideration in establishing the incurred but not paid claims liability at
December 31, 2014
.
See Note 11, “Medical Claims Payable,” to our audited consolidated financial statements included in Part II, Item 8 of this Annual Report on Form 10-K, for a reconciliation of the beginning and ending balance for medical claims payable for the years ended
December 31, 2014
,
2013
and
2012
. Components of the total incurred claims for each year include amounts accrued for current year estimated claims expense as well as adjustments to prior year estimated accruals. In Note 11, “Medical Claims Payable,” the line labeled “Net incurred medical claims: Prior years redundancies” accounts for those adjustments made to prior year estimates. The impact of any reduction of “Net incurred medical claims: Prior years redundancies” may be offset as we establish the estimate of “Net incurred medical claims: Current year.” Our reserving practice is to consistently recognize the actuarial best estimate of our ultimate liability for our claims. When we recognize a release of the redundancy, we disclose the amount that is not in the ordinary course of business, if material.
The ratio of current year medical claims paid as a percent of current year net medical claims incurred was
89.4%
for
2014
,
89.3%
for
2013
and
89.1%
for
2012
. The increase in these ratios reflects acceleration in processing claims that occurred over the course of the past three years.
We calculate the percentage of prior years’ redundancies in the current year as a percent of prior years' net incurred claims payable less prior years’ redundancies in the current year in order to demonstrate the development of the prior years’ reserves. This metric was
9.7%
for the year ended
December 31, 2014
,
10.8%
for the year ended
December 31, 2013
and
10.4%
for the year ended
December 31, 2012
. The year ended December 31, 2014 metric reflects a slightly higher level of accuracy compared to the targeted prior year reserve for adverse deviation and a resultant lower level of prior years' redundancies than the years ended December 31, 2013 and 2012.
We calculate the percentage of prior years’ redundancies in the current period as a percent of prior years’ net incurred medical claims to indicate the percentage of redundancy included in the preceding year calculation of current year net incurred medical claims. We believe this calculation supports the reasonableness of our prior year estimate of incurred medical claims and the consistency in our methodology. For the year ended
December 31, 2014
, this metric was
1.0%
, which was calculated using the redundancy of
$541.9
. This metric was
1.3%
for
2013
and
1.1%
for
2012
.
-
63
-
The following table shows the variance between total net incurred medical claims as reported in Note 11, “Medical Claims Payable,” to our audited consolidated financial statements included in Part II, Item 8 of this Annual Report on Form 10-K, for each of
2013
and
2012
and the incurred claims for such years had it been determined retrospectively (computed as the difference between “net incurred medical claims – current year” for the year shown and “net incurred medical claims – prior years redundancies” for the immediately following year):
|
|
Years Ended December 31
|
||||||
|
|
2013
|
2012
|
|||||
|
Total net incurred medical claims, as reported
|
$
|
55,295.2
|
|
$
|
47,566.5
|
|
|
|
Retrospective basis, as described above
|
55,352.4
|
|
47,481.0
|
|
|||
|
Variance
|
$
|
(57.2
|
)
|
$
|
85.5
|
|
|
|
Variance to total net incurred medical claims, as reported
|
(0.1
|
)%
|
0.2
|
%
|
|||
Given that our business is primarily short tailed (which means that medical claims are generally paid within twelve months of the member receiving service from the provider), the variance to total net incurred medical claims, as reported above, is used to assess the reasonableness of our estimate of ultimate incurred medical claims for a given calendar year with the benefit of one year of experience. We expect that substantially all of the development of the
2014
estimate of medical claims payable will be known during 2015.
The
2013
variance to total net incurred medical claims, as reported of
(0.1)%
was
smaller
in absolute value than the
2012
percentage of
0.2%
. The lower 2013 variance was driven by a more consistent level of prior year redundancies in 2014 and 2013 associated with 2013 and 2012 claim payments, respectively. Prior year redundancies in
2012
associated with
2011
claim payments were slightly lower by comparison, thus creating a higher 2012 variance.
Income Taxes
We account for income taxes in accordance with FASB guidance, which requires, among other things, the separate recognition of deferred tax assets and deferred tax liabilities. Such deferred tax assets and deferred tax liabilities represent the tax effect of temporary differences between financial reporting and tax reporting measured at tax rates enacted at the time the deferred tax asset or liability is recorded. A valuation allowance must be established for deferred tax assets if it is “more likely than not” that all or a portion may be unrealized. Our judgment is required in determining an appropriate valuation allowance.
At each financial reporting date, we assess the adequacy of the valuation allowance by evaluating each of our deferred tax assets based on the following:
|
•
|
the types of temporary differences that created the deferred tax asset;
|
|
•
|
the amount of taxes paid in prior periods and available for a carry-back claim;
|
|
•
|
the forecasted future taxable income, and therefore, likely future deduction of the deferred tax item; and
|
|
•
|
any significant other issues impacting the likely realization of the benefit of the temporary differences.
|
We, like other companies, frequently face challenges from tax authorities regarding the amount of taxes due. These challenges include questions regarding the timing and amount of deductions that we have taken on our tax returns. In evaluating any additional tax liability associated with various positions taken in our tax return filings, we record additional liabilities for potential adverse tax outcomes. Based on our evaluation of our tax positions, we believe we have appropriately accrued for uncertain tax benefits, as required by the guidance. To the extent we prevail in matters we have accrued for, our future effective tax rate would be reduced and net income would increase. If we are required to pay more than accrued, our future effective tax rate would increase and net income would decrease. Our effective tax rate and net income in any given future period could be materially impacted.
In the ordinary course of business, we are regularly audited by federal and other tax authorities, and from time to time, these audits result in proposed assessments. We believe our tax positions comply with applicable tax law and we intend to defend our positions vigorously through the federal, state and local appeals processes. We believe we have adequately
-
64
-
provided for any reasonable foreseeable outcome related to these matters. Accordingly, although their ultimate resolution may require additional tax payments, we do not anticipate any material impact on our results of operations from these matters.
For additional information, see Note 7, “Income Taxes,” to our audited consolidated financial statements included in Part II, Item 8 of this Annual Report on Form 10-K.
Goodwill and Other Intangible Assets
Our consolidated goodwill at
December 31, 2014
was
$17,082.0
and other intangible assets were
$7,958.1
. The sum of goodwill and other intangible assets represented
40.3%
of our total consolidated assets and
103.3%
of our consolidated shareholders’ equity at
December 31, 2014
.
We follow FASB guidance for business combinations and goodwill and other intangible assets, which specifies the types of acquired intangible assets that are required to be recognized and reported separately from goodwill. Under the guidance, goodwill and other intangible assets (with indefinite lives) are not amortized but are tested for impairment at least annually. Furthermore, goodwill and other intangible assets are allocated to reporting units for purposes of the annual impairment test. Our impairment tests require us to make assumptions and judgments regarding the estimated fair value of our reporting units, which include goodwill and other intangible assets. In addition, certain other intangible assets with indefinite lives, such as trademarks, are also tested separately.
We complete our annual impairment tests of existing goodwill and other intangible assets with indefinite lives during the fourth quarter of each year. These tests involve the use of estimates related to the fair value of goodwill at the reporting unit level and other intangible assets with indefinite lives, and require a significant degree of management judgment and the use of subjective assumptions. Certain interim impairment tests are also performed when potential impairment indicators exist or changes in our business or other triggering events occur.
Fair value is estimated using the income and market approaches for goodwill at the reporting unit level and the income approach for our indefinite lived intangible assets. Use of the income and market approaches for our goodwill impairment test reflects our view that both valuation methodologies provide a reasonable estimate of fair value. The income approach is developed using assumptions about future revenue, expenses and net income derived from our internal planning process. These estimated future cash flows are then discounted. Our assumed discount rate is based on our industry’s weighted-average cost of capital. Market valuations are based on observed multiples of certain measures including membership, revenue and EBITDA (earnings before interest, taxes, depreciation and amortization) and include market comparisons to publicly traded companies in our industry.
We did not incur any impairment losses as a result of our
2014
annual impairment tests as the estimated fair values of our reporting units were substantially in excess of the carrying values as of
December 31, 2014
. Additionally, we do not believe that the estimated fair values of our reporting units are at risk of becoming impaired in the next twelve months. However, as a result of certain provisions of Health Care Reform, along with current economic conditions, we have experienced lower operating margins in certain lines of business. Those margins could become further compressed if results from implementation of Health Care Reform are significantly different than anticipated. As a result, the estimated fair values of certain of our reporting units with goodwill could fall below their carrying values in future periods and if that were to occur, we would be required to record impairment losses at that time.
While we believe we have appropriately allocated the purchase price of our acquisitions, this allocation requires many assumptions to be made regarding the fair value of assets and liabilities acquired. In addition, estimated fair values developed based on our assumptions and judgments might be significantly different if other reasonable assumptions and estimates were to be used. If estimated fair values are less than the carrying values of goodwill and other intangibles with indefinite lives in future annual impairment tests, or if significant impairment indicators are noted relative to other intangible assets subject to amortization, we may be required to record impairment losses against future income.
For additional information, see Note 3, "Business Acquisitions and Divestitures" and Note 9, “Goodwill and Other Intangible Assets,” to our audited consolidated financial statements included in Part II, Item 8 of this Annual Report on Form 10-K.
-
65
-
Investments
Current and long-term available-for-sale investment securities were
$19,909.9
at
December 31, 2014
and represented
32.1%
of our total consolidated assets at
December 31, 2014
. We classify fixed maturity and equity securities in our investment portfolio as “available-for-sale” or “trading” and report those securities at fair value. Certain fixed maturity securities are available to support current operations and, accordingly, we classify such investments as current assets without regard to their contractual maturity. Investments used to satisfy contractual, regulatory or other requirements are classified as long-term, without regard to contractual maturity.
We review investment securities to determine if declines in fair value below cost are other-than-temporary. This review is subjective and requires a high degree of judgment. We conduct this review on a quarterly basis, using both qualitative and quantitative factors, to determine whether a decline in value is other-than-temporary. Such factors considered include the length of time and the extent to which a security’s market value has been less than its cost, the reasons for the decline in value (i.e., credit event compared to liquidity, general credit spread widening, currency exchange rate or interest rate factors), financial condition and near term prospects of the issuer, including the credit ratings and changes in the credit ratings of the issuer, recommendations of investment advisors, and forecasts of economic, market or industry trends. In addition, for equity securities, we determine whether we have the intent and ability to hold the security for a period of time to allow for a recovery of its fair value above its carrying amount. If any declines of equity securities are determined to be other-than-temporary, we charge the losses to income when that determination is made.
Certain FASB
other-than-temporary impairment, or OTTI, guidance applies to fixed maturity securities and provides guidance on the recognition, presentation of, and disclosures for OTTIs. If a fixed maturity security is in an unrealized loss position and we have the intent to sell the fixed maturity security, or it is more likely than not that we will have to sell the fixed maturity security before recovery of its amortized cost basis, the decline in value is deemed to be other-than-temporary and is presented within the Other-than-temporary impairment losses recognized in income line item on our consolidated statements of income. For impaired fixed maturity securities that we do not intend to sell or it is more likely than not that we will not have to sell such securities, but we expect that we will not fully recover the amortized cost basis, the credit component of the OTTI is presented within the Other-than-temporary impairment losses recognized in income line item on our consolidated statements of income and the non-credit component of the OTTI is recognized in other comprehensive income. Furthermore, unrealized losses entirely caused by non-credit related factors related to fixed maturity securities for which we expect to fully recover the amortized cost basis continue to be recognized in accumulated other comprehensive income
.
The credit component of an OTTI is determined by comparing the net present value of projected future cash flows with the amortized cost basis of the fixed maturity security. The net present value is calculated by discounting our best estimate of projected future cash flows at the effective interest rate implicit in the fixed maturity security at the date of acquisition. For mortgage-backed and asset-backed securities, cash flow estimates are based on assumptions regarding the underlying collateral including prepayment speeds, vintage, type of underlying asset, geographic concentrations, default rates, recoveries and changes in value. For all other debt securities, cash flow estimates are driven by assumptions regarding probability of default, including changes in credit ratings, and estimates regarding timing and amount of recoveries associated with a default.
We have a committee of accounting and investment associates and management that is responsible for managing the impairment review process. The current economic environment and volatility of securities markets increase the difficulty of assessing investment impairment and the same influences tend to increase the risk of potential impairment of these assets.
We believe we have adequately reviewed our investment securities for impairment and that our investment securities are carried at fair value. However, over time, the economic and market environment may provide additional insight regarding the fair value of certain securities, which could change our judgment regarding impairment. This could result in other-than-temporary impairment losses on investments being charged against future income. Given the current market conditions and the significant judgments involved, there is continuing risk that further declines in fair value may occur and additional, material other-than-temporary impairment losses on investments may be recorded in future periods.
In addition to available-for-sale investment securities, we held additional long-term investments of
$1,695.9
, or
2.7%
of total consolidated assets, at
December 31, 2014
. These long-term investments consisted primarily of certain other equity
-
66
-
investments, cash surrender value of corporate-owned life insurance policies and real estate. Due to their less liquid nature, these investments are classified as long-term.
Through our investing activities, we are exposed to financial market risks, including those resulting from changes in interest rates and changes in equity market valuations. We manage the market risks through our investment policy, which establishes credit quality limits and limits on investments in individual issuers. Ineffective management of these risks could have an impact on our future earnings and financial position. Our investment portfolio includes fixed maturity securities with a fair value of
$17,971.8
at
December 31, 2014
. The weighted-average credit rating of these securities was “A” as of
December 31, 2014
. Included in this balance are investments in fixed maturity securities of states, municipalities and political subdivisions and mortgage-backed securities of $1,403.7 and $7.4, respectively, that are guaranteed by third parties. With the exception of twelve securities with a fair value of $7.7, these securities are all investment-grade and carry a weighted-average credit rating of “AA” as of
December 31, 2014
. The securities are guaranteed by a number of different guarantors and we do not have any significant exposure to any single guarantor (neither indirect through the guarantees, nor direct through investment in the guarantor). Further, due to the high underlying credit rating of the issuers, the weighted-average credit rating of these securities without a guarantee was “A” as of
December 31, 2014
for the securities for which such information is available.
Fair values of available-for-sale fixed maturity and equity securities are based on quoted market prices, where available. These fair values are obtained primarily from third party pricing services, which generally use Level I or Level II inputs for the determination of fair value in accordance with FASB guidance for fair value measurements and disclosures. We have controls in place to review the pricing services’ qualifications and procedures used to determine fair values. In addition, we periodically review the pricing services’ pricing methodologies, data sources and pricing inputs to ensure the fair values obtained are reasonable.
We obtain only one quoted price for each security from the pricing services, which are derived through recently reported trades for identical or similar securities making adjustments through the reporting date based upon available market observable information. For securities not actively traded, the pricing services may use quoted market prices of comparable instruments or discounted cash flow analyses, incorporating inputs that are currently observable in the markets for similar securities. Inputs that are often used in the valuation methodologies include, but are not limited to, broker quotes, benchmark yields, credit spreads, default rates and prepayment speeds. As we are responsible for the determination of fair value, we perform monthly analysis on the prices received from the pricing services to determine whether the prices are reasonable estimates of fair value. Our analysis includes a review of month-to-month price fluctuations. If unusual fluctuations are noted in this review, we may obtain additional information from other pricing services to validate the quoted price. There were no adjustments to quoted market prices obtained from the pricing services during the years ended
December 31, 2014
and
2013
.
In certain circumstances, it may not be possible to derive pricing model inputs from observable market activity, and therefore, such inputs are estimated internally. Such securities are designated Level III in accordance with FASB guidance. Securities designated Level III at
December 31, 2014
totaled
$202.8
and represented less than 1% of our total assets measured at fair value on a recurring basis. Our Level III securities primarily consisted of certain corporate securities, equity securities and structured securities for which observable inputs were not always available and the fair values of these securities were estimated using internal estimates for inputs including, but not limited to, prepayment speeds, credit spreads, default rates and benchmark yields.
For additional information, see Part II, Item 7A “Quantitative and Qualitative Disclosures about Market Risk”, and Part II, Item 8, Note 2, “Basis of Presentation and Significant Accounting Policies,” Note 4, “Investments,” and Note 6, “Fair Value,” to our audited consolidated financial statements included in this Annual Report on Form 10-K.
Retirement Benefits
Pension Benefits
We sponsor defined benefit pension plans for some of our employees. These plans are accounted for in accordance with FASB guidance for retirement benefits, which requires that amounts recognized in financial statements be determined on an actuarial basis. As permitted by the guidance, we calculate the value of plan assets as described below. Further, the difference between our expected rate of return and the actual performance of plan assets, as well as certain changes in pension liabilities, are amortized over future periods.
-
67
-
An important factor in determining our pension expense is the assumption for expected long-term return on plan assets. As of our
December 31, 2014
measurement date, we selected a weighted-average long-term rate of return on plan assets of
7.62%
. We use a total portfolio return analysis in the development of our assumption. Factors such as past market performance, the long-term relationship between fixed maturity and equity securities, interest rates, inflation and asset allocations are considered in the assumption. The assumption includes an estimate of the additional return expected from active management of the investment portfolio. Peer data and an average of historical returns are also reviewed for appropriateness of the selected assumption. We believe our assumption of future returns is reasonable. However, if we lower our expected long-term return on plan assets, future contributions to the pension plan and pension expense would likely increase.
This assumed long-term rate of return on assets is applied to a calculated value of plan assets, which recognizes changes in the fair value of plan assets in a systematic manner over three years, producing the expected return on plan assets that is included in the determination of pension expense. We apply a corridor approach to amortize unrecognized actuarial gains or losses. Under this approach, only accumulated net actuarial gains or losses in excess of 10% of the greater of the projected benefit obligation or the fair value of plan assets are amortized over the average remaining service or lifetime of the workforce as a component of pension expense. The net deferral of past asset gains or losses affects the calculated value of plan assets and, ultimately, future pension expense.
The discount rate reflects the current rate at which the pension liabilities could be effectively settled at the end of the year based on our most recent measurement date. At the
December 31, 2014
measurement date, the selected weighted-average discount rate was
3.66%
, compared to 4.39% at the
December 31, 2013
measurement date. We developed this rate using a yield curve approach. Using yields available on high-quality fixed maturity securities with various maturity dates, the yield curve approach provides a “customized” rate, which is meant to match the expected cash flows of our specific benefit plans. The net effect of changes in the discount rate, as well as the net effect of other changes in actuarial assumptions and experience, have been deferred and amortized as a component of pension expense in accordance with FASB guidance.
In managing the plan assets, our objective is to be a responsible fiduciary while minimizing financial risk.
Plan assets include a diversified mix of investment grade fixed maturity securities, equity securities and alternative investments across a range of sectors and levels of capitalization to maximize the long-term return for a prudent level of risk.
In addition to producing a reasonable return, the investment strategy seeks to minimize the volatility in our expense and cash flow.
Other Postretirement Benefits
We provide most associates with certain medical, vision and dental benefits upon retirement. We use various actuarial assumptions, including a discount rate and the expected trend in health care costs, to estimate the costs and benefit obligations for our retiree benefits.
At our
December 31, 2014
measurement date, the selected discount rate for all plans was
3.74%
, compared to a discount rate of
4.48%
at the
December 31, 2013
measurement date. We developed this rate using a yield curve approach as described above.
The assumed health care cost trend rates used to measure the expected cost of pre-Medicare (those who are not currently eligible for Medicare benefits) other benefits at our
December 31, 2014
measurement date was
8.00%
for
2015
with a gradual decline to
4.50%
by the year
2025
. The assumed health care cost trend rates used to measure the expected cost of post-Medicare (those who are currently eligible for Medicare benefits) other benefits at our
December 31, 2014
measurement date was
6.00%
for
2015
with a gradual decline to
4.50%
by the year
2021
. These estimated trend rates are subject to change in the future. The health care cost trend rate assumption has a significant effect on the amounts reported. For example, an increase in the assumed health care cost trend rate of one percentage point would increase the postretirement benefit obligation as of
December 31, 2014
by
$56.7
and would increase service and interest costs by
$2.0
. Conversely, a decrease in the assumed health care cost trend rate of one percentage point would decrease the postretirement benefit obligation by
$47.6
as of
December 31, 2014
and would decrease service and interest costs by
$1.8
.
For additional information regarding our retirement benefits, see Note 10, “Retirement Benefits,” to our audited consolidated financial statements included in Part II, Item 8 of this Annual Report on Form 10-K.
-
68
-
New Accounting Pronouncements
For information regarding new accounting pronouncements that were issued or became effective during the year ended December 31, 2014 that had, or are expected to have a material impact on our financial position, results of operations or financial statement disclosures, see the “
Recently Adopted Accounting Guidance
” and "
Recent Accounting Guidance Not Yet Adopted
" sections of Note 2, “Basis of Presentation and Significant Accounting Policies” to our audited consolidated financial statements included in Part II, Item 8 of this Annual Report on Form 10-K.
Liquidity and Capital Resources
Introduction
Our cash receipts result primarily from premiums, administrative fees, investment income, other revenue, proceeds from the sale or maturity of our investment securities, proceeds from borrowings, and proceeds from the issuance of common stock under our employee stock plans. Cash disbursements result mainly from claims payments, administrative expenses, taxes, purchases of investment securities, interest expense, payments on borrowings, acquisitions, capital expenditures, repurchases of our debt securities and common stock and the payment of cash dividends. Cash outflows fluctuate with the amount and timing of settlement of these transactions. Any future decline in our profitability would likely have an unfavorable impact on our liquidity.
We manage our cash, investments and capital structure so we are able to meet the short and long-term obligations of our business while maintaining financial flexibility and liquidity. We forecast, analyze and monitor our cash flows to enable investment and financing within the overall constraints of our financial strategy.
A substantial portion of the assets held by our regulated subsidiaries are in the form of cash and cash equivalents and investments. After considering expected cash flows from operating activities, we generally invest cash that exceeds our near term obligations in longer term marketable fixed maturity securities to improve our overall investment income returns. Our investment strategy is to make investments consistent with insurance statutes and other regulatory requirements, while preserving our asset base. Our investments are generally available-for-sale to meet liquidity and other needs. Our subsidiaries pay out excess capital annually in the form of dividends to their respective parent companies for general corporate use, as permitted by applicable regulations.
The availability of financing in the form of debt or equity is influenced by many factors including our profitability, operating cash flows, debt levels, debt ratings, contractual restrictions, regulatory requirements and market conditions. The securities and credit markets have in the past experienced higher than normal volatility, although current market conditions are more stable. During recent years, the federal government and various governmental agencies have taken a number of steps to restore liquidity in the financial markets and to help relieve the credit crisis and strengthen the regulation of the financial services market. In addition, governments around the world have developed their own plans to provide liquidity and security in the credit markets and to ensure adequate capital in certain financial institutions.
We have a $2,500.0 commercial paper program. Should commercial paper issuance be unavailable, we have the ability to use a combination of cash on hand and/or our $2,000.0 senior revolving credit facility to redeem any outstanding commercial paper upon maturity. Additionally, we believe the lenders participating in our credit facility would be willing and able to provide financing in accordance with their legal obligations. In addition to the $2,000.0 senior revolving credit facility, we estimate that we will receive approximately
$2,100.0
of dividends from our subsidiaries during
2015
, which also provides further operating and financial flexibility.
-
69
-
The table below outlines the cash flows provided by or used in operating, investing and financing activities for the years ended
December 31, 2014
,
2013
and
2012
:
|
|
Years Ended December 31
|
||||||||||
|
|
2014
|
2013
|
2012
|
||||||||
|
Cash flows provided by (used in):
|
|||||||||||
|
Operating activities
|
$
|
3,369.3
|
|
$
|
3,052.3
|
|
$
|
2,744.6
|
|
||
|
Investing activities
|
(974.9
|
)
|
(2,234.4
|
)
|
(4,551.6
|
)
|
|||||
|
Financing activities
|
(1,822.5
|
)
|
(1,717.8
|
)
|
2,088.9
|
|
|||||
|
Effect of foreign exchange rates on cash and cash equivalents
|
(7.1
|
)
|
2.2
|
|
1.1
|
|
|||||
|
Increase (decrease) in cash and cash equivalents
|
$
|
564.8
|
|
$
|
(897.7
|
)
|
$
|
283.0
|
|
||
Liquidity—Year Ended
December 31, 2014
Compared to Year Ended
December 31, 2013
During the year ended
December 31, 2014
, net cash flow
provided by
operating activities was
$3,369.3
, compared to
$3,052.3
for the year ended
December 31, 2013
,
an increase
of
$317.0
. This
increase
was primarily attributable to an increase in premium receipts as a result of rate increases across our businesses designed to cover overall cost trends and new fees associated with Health Care Reform and an increase in administrative fee receipts primarily as a result of growth in membership. The increase in cash provided by operating activities was offset, in part, by payments for new fees associated with Health Care Reform, including the HIP Fee and assessments related to the Health Care Reform reinsurance premium stabilization program. The increase was further offset by an increase in claims payments primarily as a result of membership growth, an increase in personnel service costs and an increase in income taxes paid.
Net cash flow
used in
investing activities was
$974.9
during the year ended
December 31, 2014
, compared to
$2,234.4
for the year ended
December 31, 2013
. The
decrease
in cash flow
used in
investing activities of
$1,259.5
primarily resulted from cash provided by the sale of our 1-800 CONTACTS business and glasses.com related assets on January 31, 2014 and a decrease in net purchases of investments, partially offset by changes in securities lending collateral.
Net cash flow
used in
financing activities was
$1,822.5
during the year ended
December 31, 2014
, compared to
$1,717.8
for the year ended
December 31, 2013
. The
increase
in cash flow
used in
financing activities of
$104.7
primarily resulted from an increase in common stock repurchases, a decrease in proceeds from the issuance of common stock under our employee stock plans and an increase in net repayments of commercial paper borrowings. These increases in net cash used in financing activities were partially offset by changes in short- and long-term borrowings as a result of net proceeds received from long-term borrowings during 2014 compared to net repayments of short- and long-term borrowings during 2013. In addition, the increase in net cash flow used in financing activities was partially offset by changes in bank overdrafts and changes in securities lending payable.
Liquidity— Year Ended
December 31, 2013
Compared to Year Ended
December 31, 2012
During the year ended
December 31, 2013
, net cash flow
provided by
operating activities was
$3,052.3
, compared to
$2,744.6
for the year ended
December 31, 2012
,
an increase
of
$307.7
. This
increase
was driven primarily by an increase in net income adjusted for non-cash items, primarily due to the loss on disposal of discontinued operations, changes in amortization expense and realized losses on extinguishment of debt. The increase was further attributable to an increase in net cash flow provided by Amerigroup as 2012 included post-acquisition change-in-control payments and transaction costs that did not recur in 2013. Additionally, the increase was due to a net increase in the collection of income tax refunds in 2013.
Net cash flow
used in
investing activities was
$2,234.4
during the year ended
December 31, 2013
, compared to
$4,551.6
for the year ended
December 31, 2012
. The
decrease
in cash flow
used in
investing activities of
$2,317.2
primarily resulted from a decrease in cash used for the purchase of subsidiaries, as net cash used in investing activities for 2012 included the acquisitions of Amerigroup and 1-800 CONTACTS, while there were no purchases of subsidiaries in 2013. This decrease was partially offset by the net change in investment activity and changes in securities lending collateral.
Net cash flow
used in
financing activities was
$1,717.8
during the year ended
December 31, 2013
, compared to net cash flow
provided by
financing activities of
$2,088.9
for the year ended
December 31, 2012
. The change in cash flow from
-
70
-
financing activities of
$3,806.7
primarily resulted from an increase in long-term borrowings in 2012 primarily used to fund the acquisition of Amerigroup compared to an increase in net repayments of long-term borrowings in 2013. The change in cash flow from financing activity was further attributable to a decrease in common stock repurchases, changes in securities lending payable, and an increase in proceeds from the issuance of common stock under our employee stock plans.
Financial Condition
We maintained a strong financial condition and liquidity position, with consolidated cash, cash equivalents and investments, including long-term investments, of
$23,777.7
at
December 31, 2014
. Since
December 31, 2013
, total cash, cash equivalents and investments, including long-term investments,
increased
by
$1,381.8
primarily due to to cash generated from operations, net proceeds received from long-term borrowings, proceeds from the sale of our 1-800-CONTACTS business, changes in securities lending payable and proceeds from issuance of common stock under employee stock plans. These increases were partially offset by common stock repurchases, purchases of property and equipment, changes in securities lending collateral, cash dividends paid to shareholders and net repayments of commercial paper borrowings.
Many of our subsidiaries are subject to various government regulations that restrict the timing and amount of dividends and other distributions that may be paid to their respective parent companies. Certain accounting practices prescribed by insurance regulatory authorities, or statutory accounting practices, differ from GAAP. Changes that occur in statutory accounting practices, if any, could impact our subsidiaries' future dividend capacity. In addition, we have agreed to certain undertakings to regulatory authorities, including the requirement to maintain certain capital levels in certain of our subsidiaries.
At
December 31, 2014
, we held $2,699.9 of cash, cash equivalents and investments at the parent company, which are available for general corporate use, including investment in our businesses, acquisitions, potential future common stock repurchases and dividends to shareholders, repurchases of debt securities and debt and interest payments.
We calculate our consolidated debt-to-capital ratio, a non-GAAP measure, which we believe assists investors and rating agencies in measuring our overall leverage and additional borrowing capacity. In addition, our bank covenants include a maximum debt-to-capital ratio that we cannot and did not exceed. Our debt-to-capital ratio is calculated as the sum of debt divided by the sum of debt plus shareholders’ equity. Our debt-to-capital ratio may not be comparable to similarly titled measures reported by other companies. Our consolidated debt-to-capital ratio was
38.5%
and
36.9%
as of
December 31, 2014
and
2013
, respectively.
Our senior debt is rated “A-” by Standard & Poor’s, “BBB+” by Fitch, Inc., “Baa2” by Moody’s Investor Service, Inc. and “bbb+” by AM Best Company, Inc. We intend to maintain our senior debt investment grade ratings. A significant downgrade in our debt ratings could adversely affect our borrowing capacity and costs.
Future Sources and Uses of Liquidity
On February 17, 2015, we completed our acquisition of Simply Healthcare using a combination of cash and commercial paper borrowings.
We have a shelf registration statement on file with the Securities and Exchange Commission to register an unlimited amount of any combination of debt or equity securities in one or more offerings. Specific information regarding terms and securities being offered will be provided at the time of an offering. Proceeds from future offerings are expected to be used for general corporate purposes, including, but not limited to, the repayment of debt, investments in or extensions of credit to our subsidiaries and the financing of possible acquisitions or business expansion.
We have a senior credit facility, or the facility, with certain lenders for general corporate purposes. The facility, as amended, provides credit up to $2,000.0 and matures on September 29, 2016. The interest rate on the facility is based on either (i) the LIBOR rate plus a predetermined percentage rate based on our credit rating at the date of utilization, or (ii) a base rate as defined in the facility agreement plus a predetermined percentage rate based on our credit rating at the date of utilization. Our ability to borrow under the facility is subject to compliance with certain covenants. There were no amounts outstanding under the facility as of
December 31, 2014
.
-
71
-
We have an authorized commercial paper program of up to $2,500.0, the proceeds of which may be used for general corporate purposes. We did not have any borrowings outstanding under our commercial paper program at
December 31, 2014
. At December 31,
2013
, we had
$379.2
outstanding under our commercial paper program. Commercial paper borrowings have been classified as long-term debt at December 31,
2013
as our general practice and intent is to replace short-term commercial paper outstanding at expiration with additional short-term commercial paper for an uninterrupted period extending for more than one year and we have the ability to redeem our commercial paper with borrowings under the senior credit facility described above. We resumed borrowing under our commercial paper program in the first quarter of 2015.
We are a member, through certain subsidiaries, of the Federal Home Loan Bank of Indianapolis, the Federal Home Loan Bank of Cincinnati and the Federal Home Loan Bank of Atlanta, collectively, the FHLBs, and as a member we have the ability to obtain short-term cash advances subject to certain minimum collateral requirements. At
December 31, 2014
and
2013
,
$400.0
was outstanding under our short-term FHLBs borrowings.
On September 15, 2014, we redeemed the $500.0 outstanding principal balance of our 5.000% senior unsecured notes due 2014, plus applicable premium for early redemption and accrued and unpaid interest to the redemption date, for cash totaling $512.3. We recognized a loss on extinguishment of debt of $2.3 for the redemption of these notes.
On September 11, 2014, we redeemed the $1,097.9 outstanding principal balance of our 5.250% senior unsecured notes due 2016, plus applicable premium for early redemption and accrued and unpaid interest to the redemption date, for cash totaling $1,178.2. We recognized a loss on extinguishment of debt of $67.6 for the redemption of these notes.
Additionally, during the year ended December 31, 2014, we repurchased $52.0 of outstanding principal amount of certain other senior unsecured notes, plus applicable premium for early redemption plus accrued and unpaid interest, for cash totaling $61.0. We recognized a loss on extinguishment of debt of $11.2 for the year ended December 31, 2014 for the repurchase of these notes.
On August 12, 2014, we issued $850.0 of 2.250% notes due 2019, $800.0 of 3.500% notes due 2024, $800.0 of 4.650% notes due 2044, and $250.0 of 4.850% notes due 2054 under our shelf registration statement. We used the proceeds from this offering in part to fund the purchase price of the 5.000% and 5.250% senior unsecured notes discussed above, and the remaining net proceeds are being used for general corporate purposes. Interest on the notes is payable semi-annually in arrears on February 15 and August 15 of each year, commencing on February 15, 2015. The notes have a call feature that allows us to repurchase the notes at any time at our option and a put feature that allows a note holder to require us to repurchase the notes upon the occurrence of both a change in control event and a downgrade of the notes below an investment grade rating.
On September 5, 2013, we redeemed the $400.0 outstanding principal balance of our 6.000% senior unsecured notes due 2014, plus applicable premium for early redemption and accrued and unpaid interest to the redemption date, for cash totaling $411.0. We recognized a loss on extinguishment of debt of $10.0 for the redemption of these notes.
On July 30, 2013, we initiated a cash tender offer and consent solicitation to purchase up to $300.0 aggregate principal amount of our outstanding 5.875% notes due 2017 and 7.000% notes due 2019 (the “First Tranche Offer”) and to purchase up to $300.0 aggregate principal amount of our outstanding 5.950% notes due 2034, 5.850% notes due 2036, 6.375% notes due 2037 and 5.800% notes due 2040 (the “Second Tranche Offer”), collectively, the “Tender Offers”. The Tender Offers were each subject to increase up to an additional $100.0 at our election. On August 12, 2013, we increased the Second Tranche Offer to $400.0 and on August 13, 2013 we repurchased $300.0 of the First Tranche Offer notes and $400.0 of the Second Tranche Offer notes for cash totaling $837.7. Holders who tendered their notes prior to the early tender date received the principal amounts, applicable premium for early redemption and accrued and unpaid interest to the early tender offer settlement date. We recognized a loss on extinguishment of debt of $135.3 for the repurchase of these notes.
On July 30, 2013, we issued $650.0 of 2.300% notes due 2018 and $600.0 of 5.100% notes due 2044 under our shelf registration statement. We used the proceeds from this offering in part to fund the purchase price of the 6.000% senior unsecured notes and the Tender Offers discussed above, and the balance for general corporate purposes. Interest on the notes is payable semi-annually in arrears on January 15 and July 15 of each year, commencing on January 15, 2014. The notes have a call feature that allows us to repurchase the notes at any time at our option and a put feature that allows a note holder to require us to repurchase the notes upon the occurrence of both a change in control event and a downgrade of the notes below an investment grade rating.
-
72
-
On January 25, 2013, we redeemed the outstanding principal balance of $475.0 of 7.500% senior unsecured notes due 2019, plus applicable premium for early redemption, for cash totaling $555.6. The weighted-average redemption price of the notes was approximately 117% of the principal amount outstanding.
While we generally issue senior unsecured notes for long-term borrowing purposes, on October 9, 2012, we issued $1,500.0 of senior convertible debentures, or the Debentures. The Debentures are governed by an indenture, or the Indenture, dated as of October 9, 2012 between us and The Bank of New York Mellon Trust Company, N.A., as trustee. The Debentures bear interest at a rate of 2.750% per year, payable semi-annually in arrears in cash on April 15 and October 15 of each year, and mature on October 15, 2042, unless earlier redeemed, repurchased or converted into shares of common stock at the applicable conversion rate. We used approximately $371.0 of the net proceeds from the issuance to repurchase shares of our common stock concurrently with the offering of the Debentures, and the balance was used for general corporate purposes, including but not limited to additional purchases of shares of our common stock pursuant to our share repurchase program and the repayment of debt. For additional information related to our borrowing activities and the Debentures, including the circumstances under which holders may convert the Debentures into common stock, see Note 12, “Debt” to our audited consolidated financial statements included in Part II, Item 8 of this Annual Report on Form 10-K.
As discussed in “Financial Condition” above, many of our subsidiaries are subject to various government regulations that restrict the timing and amount of dividends and other distributions that may be paid. Based upon these requirements, we are currently estimating approximately
$2,100.0
of dividends to be paid to the parent company during
2015
. During
2014
, we received $3,234.5 of dividends from our subsidiaries.
We regularly review the appropriate use of capital, including common stock repurchases, repurchases of debt securities and dividends to shareholders. The declaration and payment of any dividends or repurchases of our common stock or debt securities is at the discretion of our Board of Directors and depends upon our financial condition, results of operations, future liquidity needs, regulatory and capital requirements and other factors deemed relevant by our Board of Directors.
A summary of the cash dividend activity for the year ended
December 31, 2014
is as follows:
|
Declaration Date
|
Record Date
|
Payment Date
|
Cash
Dividend
per Share
|
Total
|
||||||||
|
January 28, 2014
|
March 10, 2014
|
March 25, 2014
|
$
|
0.4375
|
|
$
|
123.4
|
|
||||
|
April 29, 2014
|
June 10, 2014
|
June 25, 2014
|
0.4375
|
|
120.5
|
|
||||||
|
July 29, 2014
|
September 10, 2014
|
September 25, 2014
|
0.4375
|
|
119.2
|
|
||||||
|
October 28, 2014
|
December 5, 2014
|
December 22, 2014
|
0.4375
|
|
117.6
|
|
||||||
On
January 27, 2015
, our Board of Directors declared a quarterly cash dividend of
$0.6250
per share on the outstanding shares of our common stock. This quarterly dividend is payable on
March 25, 2015
to shareholders of record as of
March 10, 2015
.
A summary of common stock repurchases for the period January 1,
2015
through February 5,
2015
(subsequent to
December 31, 2014
) and for the year ended
December 31, 2014
is as follows:
|
January 1, 2015
Through
February 5, 2015
|
Year Ended
December 31,
2014
|
||||||
|
Shares repurchased
|
1.8
|
|
30.4
|
|
|||
|
Average price per share
|
$
|
131.16
|
|
$
|
98.52
|
|
|
|
Aggregate cost
|
$
|
229.9
|
|
$
|
2,998.8
|
|
|
|
Authorization remaining at the end of each period
|
$
|
5,461.8
|
|
$
|
5,691.7
|
|
|
-
73
-
Under the common stock repurchase program authorized by our Board of Directors, on February 4, 2014, we entered into an accelerated share repurchase agreement with a counterparty. The agreement provided for the repurchase of a number of shares, equal to $600.0, as determined by the volume weighted-average price of our shares during the term of the agreement. In March 2014, we repurchased 6.6 shares under the agreement. The shares repurchased under the agreement are included in the amount disclosed above as shares repurchased during the year ended December 31, 2014.
On October 2, 2014, the Board of Directors authorized a $5,000.0 increase to the common stock repurchase program. Repurchases may be made from time to time at prevailing market prices, subject to certain restrictions on volume, pricing and timing. The repurchases are effected from time to time in the open market, through negotiated transactions, including accelerated share repurchase agreements, and through plans designed to comply with Rule 10b5-1 under the Securities Exchange Act of 1934, as amended. We expect to utilize the unused authorization remaining at
December 31, 2014
over a multi-year period, subject to market and industry conditions. Our stock repurchase program is discretionary as we are under no obligation to repurchase shares. We repurchase shares under the program when we believe it is a prudent use of capital.
Our current retirement benefits funding strategy is to fund an amount at least equal to the minimum required funding as determined under ERISA with consideration of maximum tax deductible amounts. We may elect to make discretionary contributions up to the maximum amount deductible for income tax purposes. For the year ended
December 31, 2014
, no material contributions were necessary to meet ERISA required funding levels. However, during the year ended
December 31, 2014
, we made tax deductible discretionary contributions to the pension benefit plans of
$3.6
.
Contractual Obligations and Commitments
Our estimated contractual obligations and commitments as of
December 31, 2014
are as follows:
|
|
|
Payments Due by Period
|
||||||||||||||||||
|
Total
|
Less than
1 Year
|
1-3 Years
|
3-5 Years
|
More than
5 Years
|
||||||||||||||||
|
Debt
1
|
$
|
25,235.8
|
|
$
|
1,231.7
|
|
$
|
2,104.2
|
|
$
|
3,622.8
|
|
$
|
18,277.1
|
|
|||||
|
Operating lease commitments
|
896.1
|
|
148.7
|
|
257.1
|
|
215.4
|
|
274.9
|
|
||||||||||
|
Projected other postretirement benefits
|
478.3
|
|
63.3
|
|
128.7
|
|
132.0
|
|
154.3
|
|
||||||||||
|
Purchase obligations:
|
||||||||||||||||||||
|
IBM outsourcing agreements
2
|
475.3
|
|
103.3
|
|
194.1
|
|
177.9
|
|
—
|
|
||||||||||
|
Other purchase obligations
3
|
2,763.5
|
|
1,703.8
|
|
915.3
|
|
138.2
|
|
6.2
|
|
||||||||||
|
Other long-term liabilities
4
|
1,036.4
|
|
—
|
|
469.7
|
|
384.7
|
|
182.0
|
|
||||||||||
|
Investment commitments
|
555.1
|
|
213.0
|
|
188.8
|
|
125.4
|
|
27.9
|
|
||||||||||
|
Total contractual obligations and commitments
|
$
|
31,440.5
|
|
$
|
3,463.8
|
|
$
|
4,257.9
|
|
$
|
4,796.4
|
|
$
|
18,922.4
|
|
|||||
|
1
|
Includes estimated interest expense.
|
|
2
|
Relates to agreements with International Business Machines Corporation, or IBM, to provide information technology infrastructure services. For further information, see Note 13, “Commitments and Contingencies,” to the audited consolidated financial statements included in Part II, Item 8 of this Annual Report on Form 10-K.
|
|
3
|
Includes obligations related to non-IBM information technology service agreements and telecommunication contracts.
|
|
4
|
Estimated future payments for funded pension benefits have been excluded from this table as we had no funding requirements under ERISA at
December 31, 2014
as a result of the value of the assets in the plans. In addition, amounts include other obligations resulting from third-party service contracts.
|
The above table does not contain
$129.9
of gross liabilities for uncertain tax positions and interest for which we cannot reasonably estimate the timing of the resolutions with the respective taxing authorities. For further information, see Note 7, “Income Taxes,” to the audited consolidated financial statements included in Part II, Item 8 of this Annual Report on Form 10-K.
In addition to the contractual obligations and commitments discussed above, we have a variety of other contractual agreements related to acquiring materials and services used in our operations. However, we do not believe these other agreements contain material noncancelable commitments.
-
74
-
We believe that funds from future operating cash flows, cash and investments and funds available under our senior credit facility or from public or private financing sources will be sufficient for future operations and commitments, and for capital acquisitions and other strategic transactions.
Off-Balance Sheet Arrangements
We do not have any off-balance sheet arrangements that will require funding in future periods.
Risk-Based Capital
Our regulated subsidiaries’ states of domicile have statutory risk-based capital, or RBC, requirements for health and other insurance companies and health maintenance organizations largely based on the National Association of Insurance Commissioners, or NAIC, RBC Model Act. These RBC requirements are intended to measure capital adequacy, taking into account the risk characteristics of an insurer’s investments and products. The NAIC sets forth the formula for calculating the RBC requirements, which are designed to take into account asset risks, insurance risks, interest rate risks and other relevant risks with respect to an individual insurance company’s business. In general, under the RBC Model Act, an insurance company must submit a report of its RBC level to the state insurance department or insurance commissioner, as appropriate, at the end of each calendar year. Our regulated subsidiaries' respective RBC levels as of
December 31, 2014
, which was the most recent date for which reporting was required, were in excess of all mandatory RBC thresholds. In addition to exceeding the RBC requirements, we are in compliance with the liquidity and capital requirements for a licensee of the BCBSA and with the tangible net worth requirements applicable to certain of our California subsidiaries.
For additional information, see Note 21, “Statutory Information," to our audited consolidated financial statements included in Part II, Item 8 of this Annual Report on Form 10-K.
Safe Harbor Statement under the Private Securities Litigation Reform Act of 1995
This document contains certain forward-looking information about us that is intended to be covered by the safe harbor for “forward-looking statements” provided by the Private Securities Litigation Reform Act of 1995. Forward-looking statements are statements that are not generally historical facts. Words such as “expect(s),” “feel(s),” “believe(s),” “will,” “may,” “anticipate(s),” “intend,” “estimate,” “project” and similar expressions are intended to identify forward-looking statements, which generally are not historical in nature. These statements include, but are not limited to, financial projections and estimates and their underlying assumptions; statements regarding plans, objectives and expectations with respect to future operations, products and services; and statements regarding future performance. Such statements are subject to certain risks and uncertainties, many of which are difficult to predict and generally beyond our control, that could cause actual results to differ materially from those expressed in, or implied or projected by, the forward-looking information and statements. These risks and uncertainties include: those discussed and identified in our public filings with the U.S. Securities and Exchange Commission, or SEC; increased government participation in, or regulation or taxation of health benefits and managed care operations, including, but not limited to, the impact of the Patient Protection and Affordable Care Act and the Health Care and Education Reconciliation Act of 2010, or Health Care Reform; trends in health care costs and utilization rates; our ability to secure sufficient premium rates including regulatory approval for and implementation of such rates; our participation in the federal and state health insurance exchanges under Health Care Reform, which have experienced technical difficulties in implementation and which entail uncertainties associated with the mix and volume of business, particularly in our Individual and Small Group markets, that could negatively impact the adequacy of our premium rates and which may not be sufficiently offset by the risk apportionment provisions of Health Care Reform; our ability to contract with providers consistent with past practice; competitor pricing below market trends of increasing costs; reduced enrollment, as well as a negative change in our health care product mix; risks and uncertainties regarding Medicare and Medicaid programs, including those related to non-compliance with the complex regulations imposed thereon and funding risks with respect to revenue received from participation therein; a downgrade in our financial strength ratings; litigation and investigations targeted at our industry and our ability to resolve litigation and investigations within estimates; medical malpractice or professional liability claims or other risks related to health care services provided by our subsidiaries; our ability to repurchase shares of our common stock and pay dividends on our common stock due to the adequacy of our cash flow and earnings and other considerations; non-compliance by any party with the Express Scripts, Inc. pharmacy benefit management services agreement, which could result in financial penalties, our inability to meet customer demands, and sanctions imposed by governmental entities, including the Centers for Medicare and Medicaid Services; events that result in negative publicity for us or the health benefits industry;
-
75
-
failure to effectively maintain and modernize our information systems and e-business organization and to maintain good relationships with third party vendors for information system resources; events that may negatively affect our licenses with the Blue Cross and Blue Shield Association; possible impairment of the value of our intangible assets if future results do not adequately support goodwill and other intangible assets; intense competition to attract and retain employees; unauthorized disclosure of member or employee sensitive or confidential information, including the impact and outcome of investigations, inquiries, claims and litigation related to the cyber attack we reported in February 2015; changes in the economic and market conditions, as well as regulations that may negatively affect our investment portfolios and liquidity; possible restrictions in the payment of dividends by our subsidiaries and increases in required minimum levels of capital and the potential negative effect from our substantial amount of outstanding indebtedness; general risks associated with mergers and acquisitions; various laws and provisions in our governing documents that may prevent or discourage takeovers and business combinations; future public health epidemics and catastrophes; and general economic downturns. Readers are cautioned not to place undue reliance on these forward-looking statements that speak only as of the date hereof. Except to the extent otherwise required by federal securities law, we do not undertake any obligation to republish revised forward-looking statements to reflect events or circumstances after the date hereof or to reflect the occurrence of unanticipated events. Readers are also urged to carefully review and consider the various disclosures in our SEC reports.
-
76
-
ITEM 7A. QUANTITATIVE AND QUALITATIVE DISCLOSURES ABOUT MARKET RISK.
(In Millions, Except Per Share Data or As Otherwise Stated Herein)
As a result of our investing and borrowing activities, we are exposed to financial market risks, including those resulting from changes in interest rates and changes in equity market valuations. Potential impacts discussed below are based upon sensitivity analyses performed on our financial position as of
December 31, 2014
. Actual results could vary from these estimates. Our primary objectives with our investment portfolio are to provide safety and preservation of capital, sufficient liquidity to meet cash flow requirements, the integration of investment strategy with the business operations and an attainment of a competitive after-tax total return.
Investments
Our investment portfolio is exposed to three primary sources of risk: credit quality risk, interest rate risk and market valuation risk.
The primary risks associated with our fixed maturity securities are credit quality risk and interest rate risk. Credit quality risk is defined as the risk of a credit event, such as a ratings downgrade or default, to an individual fixed maturity security and the potential loss attributable to that event. Credit quality risk is managed through our investment policy, which establishes credit quality limitations on the overall portfolio as well as diversification and percentage limits on securities of individual issuers. The result is a well-diversified portfolio of fixed maturity securities, with an average credit rating of approximately “A.” Interest rate risk is defined as the potential for economic losses on fixed maturity securities due to a change in market interest rates. Our fixed maturity portfolio is invested primarily in U.S. government securities, corporate bonds, asset-backed bonds, mortgage-related securities and municipal bonds, all of which have exposure to changes in the level of market interest rates. Interest rate risk is managed by maintaining asset duration within a band based upon our liabilities, operating performance and liquidity needs. Additionally, we have the capability of holding any security to maturity, which would allow us to realize full par value.
Our available-for-sale investment portfolio includes corporate securities which account for
41.9%
of the total portfolio at
December 31, 2014
and are subject to credit/default risk. In a declining economic environment, corporate yields will usually increase prompted by concern over the ability of corporations to make interest payments, thus causing a decrease in the price of corporate securities, and the decline in value of the corporate fixed maturity portfolio. We manage this risk through fundamental credit analysis, diversification of issuers and industries and an average credit rating of our corporate fixed maturity portfolio of approximately “BBB.”
Our equity portfolio is comprised of large capitalization and small capitalization domestic equities, foreign equities and index mutual funds. Our equity portfolio is subject to the volatility inherent in the stock market, driven by concerns over economic conditions, earnings and sales growth, inflation, and consumer confidence. These systemic risks cannot be managed through diversification alone. However, more routine risks, such as stock/industry specific risks, are managed by investing in a diversified equity portfolio.
As of
December 31, 2014
,
90.3%
of our available-for-sale investments were fixed maturity securities. Market risk is addressed by actively managing the duration, allocation and diversification of our investment portfolio. We have evaluated the impact on the fixed maturity portfolio’s fair value considering an immediate 100 basis point change in interest rates. A 100 basis point increase in interest rates would result in an approximate $777.5 decrease in fair value, whereas a 100 basis point decrease in interest rates would result in an approximate $607.8 increase in fair value. While we classify our fixed maturity securities as “available-for-sale” for accounting purposes, we believe our cash flows and duration of our portfolio should allow us to hold securities to maturity, thereby avoiding the recognition of losses should interest rates rise significantly.
As of
December 31, 2014
,
9.7%
of our available-for-sale investments were equity securities. An immediate 10% decrease in each equity investment’s value, arising from market movement, would result in a fair value decrease of
$193.8
. Alternatively, an immediate 10% increase in each equity investment’s value, attributable to the same factor, would result in a fair value increase of
$193.8
.
-
77
-
For additional information regarding our investments, see Part II, Item 8, Note 4, “Investments”, to our audited consolidated financial statements and “Critical Accounting Policies and Estimates - Investments” within Part II, Item 7 “Management’s Discussion and Analysis of Financial Condition and Results of Operations” included in this Annual Report on Form 10-K.
Long-Term Debt
Our total long-term debt at
December 31, 2014
was
$14,752.2
and includes senior unsecured notes, convertible debentures and subordinated surplus notes by one of our insurance subsidiaries. This debt is subject to interest rate risk as these instruments have fixed interest rates and the fair value is affected by changes in market interest rates. The senior unsecured notes had combined carrying and estimated fair value of
$13,752.9
and $14,764.6, respectively, at
December 31, 2014
. The carrying value and estimated fair value of the convertible debentures were
$974.4
and
$2,581.9
, respectively, at
December 31, 2014
. The carrying value and estimated fair value of the surplus notes were
$24.9
and $30.2, respectively, at
December 31, 2014
.
Should interest rates increase or decrease in the future, the estimated fair value of our fixed rate debt would decrease or increase accordingly. For additional information regarding our long-term debt, see Note 6, "Fair Value" and Note 12, “Debt” to our audited consolidated financial statements included in Part II, Item 8 of this Annual Report on Form 10-K.
Derivatives
We have exposure to economic losses due to interest rate risk arising from changes in the level or volatility of interest rates. We attempt to mitigate our exposure to interest rate risk through the use of derivative financial instruments. These strategies include the use of interest rate swaps and forward contracts, which are used to lock-in interest rates or to hedge (on an economic basis) interest rate risks associated with variable rate debt. We have used these types of instruments as designated hedges against specific liabilities.
Changes in interest rates will affect the estimated fair value of these derivatives. As of
December 31, 2014
, we recorded a net liability of $5.2, the estimated fair value of the swaps at that date. We have evaluated the impact on the interest rate swaps' fair value considering an immediate 100 basis point change in interest rates. A 100 basis point increase in interest rates would result in an approximate $43.7 decrease in fair value, whereas a 100 basis point decrease in interest rates would result in an approximate $43.7 increase in fair value.
We also utilize put and call options on the S&P 500 index to hedge, on an economic basis, the exposure of our equity security portfolio to fluctuations in the equity markets. While the impact of fluctuations in the equity markets on these derivatives are largely offset by changes in the fair values of our equity security portfolio, the change in fair value of the derivatives is recognized immediately in our income statement, whereas the change in fair value of our equity securities is recognized in accumulated other comprehensive income. Accordingly, a decrease in the S&P 500 index of 10% would result in an approximate increase of $27.9 in the fair value of these derivatives. An increase in the S&P 500 index of 10% would result in an approximate decrease of $17.4 in the fair value of these derivatives.
For additional information regarding our derivatives, see Note 5, “Derivative Financial Instruments” to our audited consolidated financial statements included in Part II, Item 8 of this Annual Report on Form 10-K. Also for accounting related to securities in our equity portfolio, see “Critical Accounting Policies and Estimates – Investments” within Part II, Item 7 “Management Discussion and Analysis of Financial Condition and Results of Operations” included in this Annual Report on Form 10-K.
-
78
-
ITEM 8. FINANCIAL STATEMENTS AND SUPPLEMENTARY DATA.
ANTHEM, INC.
CONSOLIDATED FINANCIAL STATEMENTS
Years ended
December 31, 2014
,
2013
and
2012
Contents
|
Report of Independent Registered Public Accounting Firm
|
|
|
Audited Consolidated Financial Statements:
|
|
|
Consolidated Balance Sheets
|
|
|
Consolidated Statements of Income
|
|
|
Consolidated Statements of Comprehensive Income
|
|
|
Consolidated Statements of Cash Flows
|
|
|
Consolidated Statements of Shareholders’ Equity
|
|
|
Notes to Consolidated Financial Statements
|
|
-
79
-
Report of Independent Registered
Public Accounting Firm
The Board of Directors and Shareholders of Anthem, Inc.
We have audited the accompanying consolidated balance sheets of Anthem, Inc. (the “Company”) as of December 31,
2014
and
2013
, and the related consolidated statements of income, comprehensive income, shareholders’ equity, and cash flows for each of the three years in the period ended December 31,
2014
. Our audits also included the financial statement schedule listed in the Index at Item 15(a). These financial statements and schedule are the responsibility of the Company’s management. Our responsibility is to express an opinion on these financial statements and schedule based on our audits.
We conducted our audits in accordance with the standards of the Public Company Accounting Oversight Board (United States). Those standards require that we plan and perform the audit to obtain reasonable assurance about whether the financial statements are free of material misstatement. An audit includes examining, on a test basis, evidence supporting the amounts and disclosures in the financial statements. An audit also includes assessing the accounting principles used and significant estimates made by management, as well as evaluating the overall financial statement presentation. We believe that our audits provide a reasonable basis for our opinion.
In our opinion, the financial statements referred to above present fairly, in all material respects, the consolidated financial position of Anthem, Inc. at December 31,
2014
and
2013
, and the consolidated results of its operations and its cash flows for each of the three years in the period ended December 31,
2014
, in conformity with U.S. generally accepted accounting principles. Also, in our opinion, the related financial statement schedule, when considered in relation to the basic financial statements taken as a whole, presents fairly in all material respects the information set forth therein.
We also have audited, in accordance with the standards of the Public Company Accounting Oversight Board (United States), Anthem, Inc.’s internal control over financial reporting as of December 31,
2014
, based on criteria established in Internal Control—Integrated Framework issued by the Committee of Sponsoring Organizations of the Treadway Commission (2013 framework) and our report dated
February 24, 2015
expressed an unqualified opinion thereon.
/s/ E
RNST
& Y
OUNG
LLP
Indianapolis, Indiana
February 24, 2015
-
80
-
Anthem, Inc.
Consolidated Balance Sheets
|
December 31,
2014 |
December 31,
2013 |
||||||
|
(In millions, except share data)
|
|
|
|||||
|
Assets
|
|||||||
|
Current assets:
|
|||||||
|
Cash and cash equivalents
|
$
|
2,151.7
|
|
$
|
1,582.1
|
|
|
|
Investments available-for-sale, at fair value:
|
|||||||
|
Fixed maturity securities (amortized cost of $17,120.4 and $16,826.7)
|
17,467.4
|
|
17,038.2
|
|
|||
|
Equity securities (cost of $1,303.7 and $1,168.5)
|
1,906.6
|
|
1,735.5
|
|
|||
|
Other invested assets, current
|
20.2
|
|
16.3
|
|
|||
|
Accrued investment income
|
161.4
|
|
168.8
|
|
|||
|
Premium and self-funded receivables
|
4,825.5
|
|
3,968.7
|
|
|||
|
Other receivables
|
2,117.0
|
|
1,063.3
|
|
|||
|
Income taxes receivable
|
308.9
|
|
235.7
|
|
|||
|
Securities lending collateral
|
1,515.2
|
|
969.8
|
|
|||
|
Deferred tax assets, net
|
280.4
|
|
383.0
|
|
|||
|
Other current assets
|
1,474.6
|
|
1,677.5
|
|
|||
|
Assets held for sale
|
—
|
|
906.9
|
|
|||
|
Total current assets
|
32,228.9
|
|
29,745.8
|
|
|||
|
Long-term investments available-for-sale, at fair value:
|
|||||||
|
Fixed maturity securities (amortized cost of $500.7 and $455.9)
|
504.4
|
|
449.9
|
|
|||
|
Equity securities (cost of $27.0 and $27.4)
|
31.5
|
|
31.3
|
|
|||
|
Other invested assets, long-term
|
1,695.9
|
|
1,542.6
|
|
|||
|
Property and equipment, net
|
1,944.3
|
|
1,801.5
|
|
|||
|
Goodwill
|
17,082.0
|
|
16,917.2
|
|
|||
|
Other intangible assets
|
7,958.1
|
|
8,441.0
|
|
|||
|
Other noncurrent assets
|
619.9
|
|
645.2
|
|
|||
|
Total assets
|
$
|
62,065.0
|
|
$
|
59,574.5
|
|
|
|
Liabilities and shareholders’ equity
|
|||||||
|
Liabilities
|
|||||||
|
Current liabilities:
|
|||||||
|
Policy liabilities:
|
|||||||
|
Medical claims payable
|
$
|
6,861.2
|
|
$
|
6,127.2
|
|
|
|
Reserves for future policy benefits
|
68.1
|
|
63.1
|
|
|||
|
Other policyholder liabilities
|
2,626.5
|
|
2,073.2
|
|
|||
|
Total policy liabilities
|
9,555.8
|
|
8,263.5
|
|
|||
|
Unearned income
|
1,078.1
|
|
822.7
|
|
|||
|
Accounts payable and accrued expenses
|
3,651.8
|
|
3,426.3
|
|
|||
|
Security trades pending payable
|
66.2
|
|
95.2
|
|
|||
|
Securities lending payable
|
1,515.3
|
|
969.7
|
|
|||
|
Short-term borrowings
|
400.0
|
|
400.0
|
|
|||
|
Current portion of long-term debt
|
625.0
|
|
518.0
|
|
|||
|
Other current liabilities
|
1,861.2
|
|
1,674.7
|
|
|||
|
Liabilities held for sale
|
—
|
|
181.4
|
|
|||
|
Total current liabilities
|
18,753.4
|
|
16,351.5
|
|
|||
|
Long-term debt, less current portion
|
14,127.2
|
|
13,573.6
|
|
|||
|
Reserves for future policy benefits, noncurrent
|
671.3
|
|
723.0
|
|
|||
|
Deferred tax liabilities, net
|
3,226.0
|
|
3,325.2
|
|
|||
|
Other noncurrent liabilities
|
1,035.8
|
|
836.0
|
|
|||
|
Total liabilities
|
37,813.7
|
|
34,809.3
|
|
|||
|
Commitments and contingencies—Note 13
|
|
|
|||||
|
Shareholders’ equity
|
|||||||
|
Preferred stock, without par value, shares authorized - 100,000,000; shares issued and outstanding - none
|
—
|
|
—
|
|
|||
|
Common stock, par value $0.01, shares authorized - 900,000,000; shares issued and outstanding - 268,109,932 and 293,273,830
|
2.7
|
|
2.9
|
|
|||
|
Additional paid-in capital
|
10,062.3
|
|
10,765.2
|
|
|||
|
Retained earnings
|
14,014.4
|
|
13,813.9
|
|
|||
|
Accumulated other comprehensive income
|
171.9
|
|
183.2
|
|
|||
|
Total shareholders’ equity
|
24,251.3
|
|
24,765.2
|
|
|||
|
Total liabilities and shareholders’ equity
|
$
|
62,065.0
|
|
$
|
59,574.5
|
|
|
See accompanying notes.
-
81
-
Anthem, Inc.
Consolidated Statements of Income
|
|
Years Ended December 31
|
||||||||||
|
|
2014
|
2013
|
2012
|
||||||||
|
(In millions, except per share data)
|
|
|
|
||||||||
|
Revenues
|
|||||||||||
|
Premiums
|
$
|
68,389.8
|
|
$
|
66,119.1
|
|
$
|
56,496.7
|
|
||
|
Administrative fees
|
4,590.6
|
|
4,031.9
|
|
3,934.1
|
|
|||||
|
Other revenue
|
41.3
|
|
40.4
|
|
83.2
|
|
|||||
|
Total operating revenue
|
73,021.7
|
|
70,191.4
|
|
60,514.0
|
|
|||||
|
Net investment income
|
724.4
|
|
659.1
|
|
686.1
|
|
|||||
|
Net realized gains on investments
|
177.0
|
|
271.9
|
|
334.9
|
|
|||||
|
Other-than-temporary impairment losses on investments:
|
|||||||||||
|
Total other-than-temporary impairment losses on investments
|
(56.2
|
)
|
(100.6
|
)
|
(41.2
|
)
|
|||||
|
Portion of other-than-temporary impairment losses recognized in other comprehensive income
|
7.2
|
|
1.7
|
|
3.4
|
|
|||||
|
Other-than-temporary impairment losses recognized in income
|
(49.0
|
)
|
(98.9
|
)
|
(37.8
|
)
|
|||||
|
Total revenues
|
73,874.1
|
|
71,023.5
|
|
61,497.2
|
|
|||||
|
Expenses
|
|||||||||||
|
Benefit expense
|
56,854.9
|
|
56,237.1
|
|
48,213.6
|
|
|||||
|
Selling, general and administrative expense:
|
|||||||||||
|
Selling expense
|
1,490.1
|
|
1,526.9
|
|
1,586.9
|
|
|||||
|
General and administrative expense
|
10,258.3
|
|
8,426.0
|
|
7,093.6
|
|
|||||
|
Total selling, general and administrative expense
|
11,748.4
|
|
9,952.9
|
|
8,680.5
|
|
|||||
|
Interest expense
|
600.7
|
|
602.7
|
|
511.8
|
|
|||||
|
Amortization of other intangible assets
|
220.9
|
|
245.3
|
|
233.0
|
|
|||||
|
Loss on extinguishment of debt
|
81.1
|
|
145.3
|
|
—
|
|
|||||
|
Total expenses
|
69,506.0
|
|
67,183.3
|
|
57,638.9
|
|
|||||
|
Income from continuing operations before income tax expense
|
4,368.1
|
|
3,840.2
|
|
3,858.3
|
|
|||||
|
Income tax expense
|
1,808.0
|
|
1,205.9
|
|
1,207.3
|
|
|||||
|
Income from continuing operations
|
2,560.1
|
|
2,634.3
|
|
2,651.0
|
|
|||||
|
Income (loss) from discontinued operations, net of tax
|
9.6
|
|
(144.6
|
)
|
4.5
|
|
|||||
|
Net income
|
$
|
2,569.7
|
|
$
|
2,489.7
|
|
$
|
2,655.5
|
|
||
|
Basic net income (loss) per share:
|
|||||||||||
|
Basic - continuing operations
|
$
|
9.28
|
|
$
|
8.83
|
|
$
|
8.25
|
|
||
|
Basic - discontinued operations
|
0.03
|
|
(0.49
|
)
|
0.01
|
|
|||||
|
Basic net income per share
|
$
|
9.31
|
|
$
|
8.34
|
|
$
|
8.26
|
|
||
|
Diluted net income (loss) per share:
|
|||||||||||
|
Diluted - continuing operations
|
$
|
8.96
|
|
$
|
8.67
|
|
$
|
8.17
|
|
||
|
Diluted - discontinued operations
|
0.03
|
|
(0.47
|
)
|
0.01
|
|
|||||
|
Diluted net income per share
|
$
|
8.99
|
|
$
|
8.20
|
|
$
|
8.18
|
|
||
|
Dividends per share
|
$
|
1.75
|
|
$
|
1.50
|
|
$
|
1.15
|
|
||
See accompanying notes.
-
82
-
Anthem, Inc.
Consolidated Statements of Comprehensive Income
|
|
Years Ended December 31
|
|||||||||||
|
|
2014
|
2013
|
2012
|
|||||||||
|
(In millions)
|
||||||||||||
|
Net income
|
$
|
2,569.7
|
|
$
|
2,489.7
|
|
$
|
2,655.5
|
|
|||
|
Other comprehensive (loss) income, net of tax:
|
||||||||||||
|
Change in net unrealized gains/losses on investments
|
118.6
|
|
(294.7
|
)
|
189.9
|
|
||||||
|
Change in non-credit component of other-than-temporary impairment losses on investments
|
(3.9
|
)
|
1.7
|
|
4.5
|
|
||||||
|
Change in net unrealized gains/losses on cash flow hedges
|
(3.6
|
)
|
3.0
|
|
0.1
|
|
||||||
|
Change in net periodic pension and postretirement costs
|
(118.1
|
)
|
172.7
|
|
(10.9
|
)
|
||||||
|
Foreign currency translation adjustments
|
(4.3
|
)
|
1.4
|
|
0.6
|
|
||||||
|
Other comprehensive (loss) income
|
(11.3
|
)
|
(115.9
|
)
|
184.2
|
|
||||||
|
Total comprehensive income
|
$
|
2,558.4
|
|
$
|
2,373.8
|
|
$
|
2,839.7
|
|
|||
See accompanying notes.
-
83
-
Anthem, Inc.
Consolidated Statements of Cash Flows
|
|
Years Ended December 31
|
||||||||||
|
|
2014
|
2013
|
2012
|
||||||||
|
(In millions)
|
|||||||||||
|
Operating activities
|
|||||||||||
|
Net income
|
$
|
2,569.7
|
|
$
|
2,489.7
|
|
$
|
2,655.5
|
|
||
|
Adjustments to reconcile net income to net cash provided by operating activities:
|
|||||||||||
|
Net realized gains on investments
|
(177.0
|
)
|
(271.9
|
)
|
(334.9
|
)
|
|||||
|
Other-than-temporary impairment losses recognized in income
|
49.0
|
|
98.9
|
|
37.8
|
|
|||||
|
Loss on extinguishment of debt
|
81.1
|
|
145.3
|
|
—
|
|
|||||
|
(Gain) loss on disposal from discontinued operations
|
(3.2
|
)
|
221.8
|
|
—
|
|
|||||
|
(Gain) loss on disposal of assets
|
(1.7
|
)
|
3.9
|
|
4.7
|
|
|||||
|
Deferred income taxes
|
30.7
|
|
59.1
|
|
127.5
|
|
|||||
|
Amortization, net of accretion
|
744.5
|
|
800.9
|
|
633.6
|
|
|||||
|
Depreciation expense
|
106.5
|
|
107.9
|
|
107.1
|
|
|||||
|
Impairment of property and equipment
|
7.9
|
|
47.7
|
|
66.8
|
|
|||||
|
Share-based compensation
|
168.9
|
|
146.0
|
|
146.5
|
|
|||||
|
Excess tax benefits from share-based compensation
|
(46.4
|
)
|
(30.1
|
)
|
(28.8
|
)
|
|||||
|
Changes in operating assets and liabilities:
|
|||||||||||
|
Receivables, net
|
(1,899.7
|
)
|
(418.3
|
)
|
189.9
|
|
|||||
|
Other invested assets
|
(21.7
|
)
|
(15.1
|
)
|
(38.9
|
)
|
|||||
|
Other assets
|
405.5
|
|
(33.6
|
)
|
79.2
|
|
|||||
|
Policy liabilities
|
1,240.6
|
|
(345.8
|
)
|
(53.7
|
)
|
|||||
|
Unearned income
|
255.1
|
|
(73.8
|
)
|
(193.7
|
)
|
|||||
|
Accounts payable and accrued expenses
|
(14.4
|
)
|
303.6
|
|
(406.5
|
)
|
|||||
|
Other liabilities
|
(7.9
|
)
|
(154.6
|
)
|
(132.8
|
)
|
|||||
|
Income taxes
|
(34.0
|
)
|
9.3
|
|
(73.9
|
)
|
|||||
|
Other, net
|
(84.2
|
)
|
(38.6
|
)
|
(40.8
|
)
|
|||||
|
Net cash provided by operating activities
|
3,369.3
|
|
3,052.3
|
|
2,744.6
|
|
|||||
|
Investing activities
|
|||||||||||
|
Purchases of fixed maturity securities
|
(9,613.4
|
)
|
(13,704.5
|
)
|
(15,040.4
|
)
|
|||||
|
Proceeds from fixed maturity securities:
|
|||||||||||
|
Sales
|
8,066.0
|
|
10,977.9
|
|
13,675.9
|
|
|||||
|
Maturities, calls and redemptions
|
1,318.7
|
|
1,836.8
|
|
1,781.5
|
|
|||||
|
Purchases of equity securities
|
(912.0
|
)
|
(820.3
|
)
|
(232.8
|
)
|
|||||
|
Proceeds from sales of equity securities
|
746.5
|
|
721.0
|
|
422.7
|
|
|||||
|
Purchases of other invested assets
|
(205.7
|
)
|
(251.5
|
)
|
(303.7
|
)
|
|||||
|
Proceeds from sales of other invested assets
|
124.7
|
|
127.1
|
|
35.5
|
|
|||||
|
Settlement of non-hedging derivatives
|
(67.4
|
)
|
(109.8
|
)
|
(59.8
|
)
|
|||||
|
Changes in securities lending collateral
|
(545.6
|
)
|
(405.1
|
)
|
307.9
|
|
|||||
|
Purchases of subsidiaries, net of cash acquired
|
—
|
|
—
|
|
(4,597.0
|
)
|
|||||
|
Proceeds from sale of subsidiary, net of cash sold
|
740.0
|
|
—
|
|
—
|
|
|||||
|
Purchases of property and equipment
|
(714.6
|
)
|
(646.5
|
)
|
(544.9
|
)
|
|||||
|
Proceeds from sales of property and equipment
|
88.0
|
|
39.2
|
|
0.4
|
|
|||||
|
Other, net
|
(0.1
|
)
|
1.3
|
|
3.1
|
|
|||||
|
Net cash used in investing activities
|
(974.9
|
)
|
(2,234.4
|
)
|
(4,551.6
|
)
|
|||||
|
Financing activities
|
|||||||||||
|
Net repayments of commercial paper borrowings
|
(379.2
|
)
|
(191.7
|
)
|
(229.0
|
)
|
|||||
|
Proceeds from long-term borrowings
|
2,700.0
|
|
1,250.0
|
|
6,468.9
|
|
|||||
|
Repayments of long-term borrowings
|
(1,730.1
|
)
|
(1,801.9
|
)
|
(1,251.3
|
)
|
|||||
|
Proceeds from short-term borrowings
|
2,050.0
|
|
1,100.0
|
|
642.0
|
|
|||||
|
Repayments of short-term borrowings
|
(2,050.0
|
)
|
(950.0
|
)
|
(492.0
|
)
|
|||||
|
Changes in securities lending payable
|
545.6
|
|
405.0
|
|
(307.8
|
)
|
|||||
|
Changes in bank overdrafts
|
173.0
|
|
9.9
|
|
(17.6
|
)
|
|||||
|
Premiums paid on equity options
|
—
|
|
(25.8
|
)
|
—
|
|
|||||
|
Repurchase and retirement of common stock
|
(2,998.8
|
)
|
(1,620.1
|
)
|
(2,496.8
|
)
|
|||||
|
Cash dividends
|
(480.7
|
)
|
(448.0
|
)
|
(367.1
|
)
|
|||||
|
Proceeds from issuance of common stock under employee stock plans
|
301.3
|
|
524.7
|
|
110.8
|
|
|||||
|
Excess tax benefits from share-based compensation
|
46.4
|
|
30.1
|
|
28.8
|
|
|||||
|
Net cash (used in) provided by financing activities
|
(1,822.5
|
)
|
(1,717.8
|
)
|
2,088.9
|
|
|||||
|
Effect of foreign exchange rates on cash and cash equivalents
|
(7.1
|
)
|
2.2
|
|
1.1
|
|
|||||
|
Change in cash and cash equivalents
|
564.8
|
|
(897.7
|
)
|
283.0
|
|
|||||
|
Cash and cash equivalents at beginning of year
|
1,586.9
|
|
2,484.6
|
|
2,201.6
|
|
|||||
|
Cash and cash equivalents at end of year
|
2,151.7
|
|
1,586.9
|
|
2,484.6
|
|
|||||
|
Less cash and cash equivalents of discontinued operations at end of year
|
—
|
|
(4.8
|
)
|
(9.3
|
)
|
|||||
|
Cash and cash equivalents of continuing operations at end of year
|
$
|
2,151.7
|
|
$
|
1,582.1
|
|
$
|
2,475.3
|
|
||
See accompanying notes.
-
84
-
Anthem, Inc.
Consolidated Statements of Shareholders’ Equity
|
|
Common Stock
|
Additional
Paid-in
Capital
|
Accumulated
Other
Comprehensive
Income |
Total
Shareholders’
Equity |
||||||||||||||||||
|
|
Number
of Shares
|
Par
Value
|
Retained
Earnings
|
|||||||||||||||||||
|
(In millions)
|
||||||||||||||||||||||
|
January 1, 2012
|
339.4
|
|
$
|
3.4
|
|
$
|
11,679.2
|
|
$
|
11,490.7
|
|
$
|
114.9
|
|
$
|
23,288.2
|
|
|||||
|
Net income
|
—
|
|
—
|
|
—
|
|
2,655.5
|
|
—
|
|
2,655.5
|
|
||||||||||
|
Other comprehensive income
|
—
|
|
—
|
|
—
|
|
—
|
|
184.2
|
|
184.2
|
|
||||||||||
|
Repurchase and retirement of common stock
|
(39.7
|
)
|
(0.4
|
)
|
(1,368.5
|
)
|
(1,127.9
|
)
|
—
|
|
(2,496.8
|
)
|
||||||||||
|
Dividends and dividend equivalents
|
—
|
|
—
|
|
—
|
|
(371.2
|
)
|
—
|
|
(371.2
|
)
|
||||||||||
|
Issuance of convertible debentures
|
—
|
|
—
|
|
331.5
|
|
—
|
|
—
|
|
331.5
|
|
||||||||||
|
Conversion of stock awards in connection with AMERIGROUP Corporation acquisition
|
—
|
|
—
|
|
19.7
|
|
—
|
|
—
|
|
19.7
|
|
||||||||||
|
Issuance of common stock under employee stock plans, net of related tax benefits
|
5.0
|
|
—
|
|
191.6
|
|
—
|
|
—
|
|
191.6
|
|
||||||||||
|
December 31, 2012
|
304.7
|
|
$
|
3.0
|
|
$
|
10,853.5
|
|
$
|
12,647.1
|
|
$
|
299.1
|
|
$
|
23,802.7
|
|
|||||
|
Net income
|
—
|
|
—
|
|
—
|
|
2,489.7
|
|
—
|
|
2,489.7
|
|
||||||||||
|
Other comprehensive loss
|
—
|
|
—
|
|
—
|
|
—
|
|
(115.9
|
)
|
(115.9
|
)
|
||||||||||
|
Premiums paid on equity options
|
—
|
|
—
|
|
(7.9
|
)
|
—
|
|
—
|
|
(7.9
|
)
|
||||||||||
|
Repurchase and retirement of common stock
|
(20.7
|
)
|
(0.1
|
)
|
(749.5
|
)
|
(870.5
|
)
|
—
|
|
(1,620.1
|
)
|
||||||||||
|
Convertible debentures tax adjustment
|
—
|
|
—
|
|
(3.3
|
)
|
—
|
|
—
|
|
(3.3
|
)
|
||||||||||
|
Dividends and dividend equivalents
|
—
|
|
—
|
|
—
|
|
(452.4
|
)
|
—
|
|
(452.4
|
)
|
||||||||||
|
Issuance of common stock under employee stock plans, net of related tax benefits
|
9.3
|
|
—
|
|
672.4
|
|
—
|
|
—
|
|
672.4
|
|
||||||||||
|
December 31, 2013
|
293.3
|
|
$
|
2.9
|
|
$
|
10,765.2
|
|
$
|
13,813.9
|
|
$
|
183.2
|
|
$
|
24,765.2
|
|
|||||
|
Net income
|
—
|
|
—
|
|
—
|
|
2,569.7
|
|
—
|
|
2,569.7
|
|
||||||||||
|
Other comprehensive loss
|
—
|
|
—
|
|
—
|
|
—
|
|
(11.3
|
)
|
(11.3
|
)
|
||||||||||
|
Settlement of equity options
|
—
|
|
—
|
|
(31.4
|
)
|
—
|
|
—
|
|
(31.4
|
)
|
||||||||||
|
Repurchase and retirement of common stock
|
(30.4
|
)
|
(0.2
|
)
|
(1,115.5
|
)
|
(1,883.1
|
)
|
—
|
|
(2,998.8
|
)
|
||||||||||
|
Dividends and dividend equivalents
|
—
|
|
—
|
|
—
|
|
(486.1
|
)
|
—
|
|
(486.1
|
)
|
||||||||||
|
Issuance of common stock under employee stock plans, net of related tax benefits
|
5.2
|
|
—
|
|
444.0
|
|
—
|
|
—
|
|
444.0
|
|
||||||||||
|
December 31, 2014
|
268.1
|
|
$
|
2.7
|
|
$
|
10,062.3
|
|
$
|
14,014.4
|
|
$
|
171.9
|
|
$
|
24,251.3
|
|
|||||
See accompanying notes.
-
85
-
Anthem, Inc.
Notes to Consolidated Financial Statements
December 31, 2014
(In Millions, Except Per Share Data or As Otherwise Stated Herein)
1. Organization
On November 5, 2014, the shareholders of the Company approved a proposal to amend our articles of incorporation to change our name to Anthem, Inc. from WellPoint, Inc. The name change was effective December 2, 2014. References to the terms “we”, “our”, “us”, “Anthem” or the “Company” used throughout these Notes to Consolidated Financial Statements refer to Anthem, Inc., an Indiana corporation, and unless the context otherwise requires, its direct and indirect subsidiaries.
We are one of the largest health benefits companies in terms of medical membership in the United States, serving
37.5
medical members through our affiliated health plans as of
December 31, 2014
.
We offer a broad spectrum of network-based managed care plans to large and small employer, individual, Medicaid and Medicare markets. Our managed care plans include: preferred provider organizations, or PPOs; health maintenance organizations, or HMOs; point-of-service, or POS, plans; traditional indemnity plans and other hybrid plans, including consumer-driven health plans, or CDHPs; and hospital only and limited benefit products. In addition, we provide a broad array of managed care services to self-funded customers, including claims processing, underwriting, stop loss insurance, actuarial services, provider network access, medical cost management, disease management, wellness programs and other administrative services. We provide an array of specialty and other insurance products and services such as dental, vision, life and disability insurance benefits, radiology benefit management and analytics-driven personal health care. We also provide services to the federal government in connection with the Federal Employee Program, or FEP. We also sold contact lenses, eyeglasses and other ocular products through our 1-800 CONTACTS, Inc., or 1-800 CONTACTS, business which was divested on January 31, 2014.
We are an independent licensee of the Blue Cross and Blue Shield Association, or BCBSA, an association of independent health benefit plans. We serve our members as the Blue Cross licensee for California and as the Blue Cross and Blue Shield, or BCBS, licensee for Colorado, Connecticut, Georgia, Indiana, Kentucky, Maine, Missouri (excluding
30
counties in the Kansas City area), Nevada, New Hampshire, New York (as BCBS in
10
New York City metropolitan and surrounding counties, and as Blue Cross or BCBS in selected upstate counties only), Ohio, Virginia (excluding the Northern Virginia suburbs of Washington, D.C.) and Wisconsin. In a majority of these service areas we do business as Anthem Blue Cross, Anthem Blue Cross and Blue Shield, Blue Cross and Blue Shield of Georgia, and Empire Blue Cross Blue Shield, or Empire Blue Cross (in our New York service areas). We also conduct business through arrangements with other BCBS licensees in the states of South Carolina and Texas. We conduct business through our AMERIGROUP Corporation, or Amerigroup, subsidiary, in Florida, Georgia, Kansas, Louisiana, Maryland, Nevada, New Jersey, New Mexico, New York, Tennessee, Texas and Washington. We also serve customers throughout the country as HealthLink, UniCare (including a non-risk arrangement with the state of Massachusetts), and in certain Arizona, California, Nevada, New York and Virginia markets through our CareMore Health Group, Inc., or CareMore, subsidiary. We are licensed to conduct insurance operations in all
50
states through our subsidiaries.
2. Basis of Presentation and Significant Accounting Policies
Basis of Presentation:
The accompanying consolidated financial statements include the accounts of Anthem and its subsidiaries and have been prepared in conformity with U.S. generally accepted accounting principles, or GAAP. All significant intercompany accounts and transactions have been eliminated in consolidation.
Certain of our subsidiaries operate outside of the United States and have functional currencies other than the U.S. dollar, or USD. We translate the assets and liabilities of those subsidiaries to USD using the exchange rate in effect at the end of the period. We translate the revenues and expenses of those subsidiaries to USD using the average exchange rates in effect during the period. The net effect of these translation adjustments is included in “Foreign currency translation adjustments” in our consolidated statements of shareholders’ equity.
-
86
-
Anthem, Inc.
Notes to Consolidated Financial Statements (continued)
Reclassifications:
Certain prior year amounts have been reclassified to conform to the current year presentation. In addition, certain other immaterial reclassifications have been made in the current year.
Use of Estimates:
The preparation of consolidated financial statements in conformity with GAAP requires us to make estimates and assumptions that affect the amounts reported in our consolidated financial statements and accompanying notes. Actual results could differ from those estimates.
Cash Equivalents:
All highly liquid investments with maturities of three months or less when purchased are classified as cash equivalents.
Investments:
Certain Financial Accounting Standards Board, or FASB,
other-than-temporary impairment, or OTTI, guidance applies to fixed maturity securities and provides guidance on the recognition, presentation of, and disclosures for OTTIs. If a fixed maturity security is in an unrealized loss position and we have the intent to sell the fixed maturity security, or it is more likely than not that we will have to sell the fixed maturity security before recovery of its amortized cost basis, the decline in value is deemed to be other-than-temporary and is presented within the Other-than-temporary impairment losses recognized in income line item on our consolidated statements of income. For impaired fixed maturity securities that we do not intend to sell or it is more likely than not that we will not have to sell such securities, but we expect that we will not fully recover the amortized cost basis, the credit component of the OTTI is presented within the Other-than-temporary impairment losses recognized in income line item on our consolidated statements of income and the non-credit component of the OTTI is recognized in other comprehensive income. Furthermore, unrealized losses entirely caused by non-credit related factors related to fixed maturity securities for which we expect to fully recover the amortized cost basis continue to be recognized in accumulated other comprehensive income
, or AOCI.
The credit component of an OTTI is determined by comparing the net present value of projected future cash flows with the amortized cost basis of the fixed maturity security. The net present value is calculated by discounting our best estimate of projected future cash flows at the effective interest rate implicit in the fixed maturity security at the date of acquisition. For mortgage-backed and asset-backed securities, cash flow estimates are based on assumptions regarding the underlying collateral including prepayment speeds, vintage, type of underlying asset, geographic concentrations, default rates, recoveries and changes in value. For all other debt securities, cash flow estimates are driven by assumptions regarding probability of default, including changes in credit ratings, and estimates regarding timing and amount of recoveries associated with a default.
The unrealized gains or losses on our current and long-term equity securities classified as available-for-sale are included in accumulated other comprehensive income as a separate component of shareholders’ equity, unless the decline in value is deemed to be other-than-temporary and we do not have the intent and ability to hold such equity securities until their full cost can be recovered, in which case such equity securities are written down to fair value and the loss is charged to other-than-temporary impairment losses recognized in income.
We maintain various rabbi trusts to account for the assets and liabilities under certain deferred compensation plans. Under these plans, the participants can defer certain types of compensation and elect to receive a return on the deferred amounts based on the changes in fair value of various investment options, primarily a variety of mutual funds. We have corporate-owned life insurance policies on certain participants in the deferred compensation plans. The cash surrender value of the corporate-owned life insurance policies is reported in other invested assets, long-term, in the consolidated balance sheets. The remaining rabbi trust assets are generally invested according to the participant's investment election, and are classified as trading, which are reported in other invested assets, current, in the consolidated balance sheets.
We use the equity method of accounting for investments in companies in which our ownership interest enables us to influence the operating or financial decisions of the investee company. Our proportionate share of equity in net income of these unconsolidated affiliates is reported with net investment income.
For asset-backed securities included in fixed maturity securities, we recognize income using an effective yield based on anticipated prepayments and the estimated economic life of the securities. When estimates of prepayments change, the effective yield is recalculated to reflect actual payments to date and anticipated future payments. The net investment in the securities is adjusted to the amount that would have existed had the new effective yield been applied since the acquisition of the securities. Such adjustments are reported with net investment income.
-
87
-
Anthem, Inc.
Notes to Consolidated Financial Statements (continued)
Investment income is recorded when earned. All securities sold resulting in investment gains and losses are recorded on the trade date. Realized gains and losses are determined on the basis of the cost or amortized cost of the specific securities sold.
We participate in securities lending programs whereby marketable securities in our investment portfolio are transferred to independent brokers or dealers based on, among other things, their creditworthiness in exchange for cash and securities collateral initially equal to at least
102%
of the market value of the securities on loan and is thereafter maintained at a minimum of
100%
of the market value of the securities loaned (calculated as the ratio of the market value of collateral to the market value of the securities on loan). Accordingly, the market value of the securities on loan to each borrower is monitored daily and the borrower is required to deliver additional collateral if the market value of the securities on loan exceeds the market value of collateral delivered. The fair value of the collateral received at the time of the transactions amounted to
$1,515.3
and
$969.7
at
December 31, 2014
and
2013
, respectively. The value of the collateral represented
103%
and
102%
of the market value of the securities on loan at
December 31, 2014
and
2013
, respectively. Under FASB guidance related to accounting for transfers and servicing of financial assets and extinguishments of liabilities, we recognize the collateral as an asset, which is reported as “securities lending collateral” on our consolidated balance sheets and we record a corresponding liability for the obligation to return the collateral to the borrower, which is reported as “securities lending payable.” The securities on loan are reported in the applicable investment category on the consolidated balance sheets. Unrealized gains or losses on securities lending collateral are included in accumulated other comprehensive income as a separate component of shareholders’ equity.
Premium and Self-Funded Receivables:
Premium and self-funded receivables include the uncollected amounts from fully-insured and self-funded groups, and are reported net of an allowance for doubtful accounts of
$213.6
and
$223.6
at
December 31, 2014
and
2013
, respectively. The allowance for doubtful accounts is based on historical collection trends and our judgment regarding the ability to collect specific accounts.
Other Receivables:
Other receivables include pharmacy rebates, provider advances, claims recoveries, reinsurance, government programs, proceeds due from brokers on investment trades and other miscellaneous amounts due to us. These receivables are reported net of an allowance for doubtful accounts of
$142.2
and
$115.0
at
December 31, 2014
and
2013
, respectively, which is based on historical collection trends and our judgment regarding the ability to collect specific amounts.
Income Taxes:
We file a consolidated income tax return. Deferred income tax assets and liabilities are recognized for temporary differences between the financial statement and tax return bases of assets and liabilities based on enacted tax rates and laws. The deferred tax benefits of the deferred tax assets are recognized to the extent realization of such benefits is more likely than not. Deferred income tax expense or benefit generally represents the net change in deferred income tax assets and liabilities during the year, excluding the impact from amounts initially recorded for business combinations, if any. Current income tax expense represents the tax consequences of revenues and expenses currently taxable or deductible on various income tax returns for the year reported.
We account for income tax contingencies in accordance with FASB guidance that contains a model to address uncertainty in tax positions and clarifies the accounting for income taxes by prescribing a minimum recognition threshold, which all income tax positions must achieve before being recognized in the financial statements.
Property and Equipment:
Property and equipment is recorded at cost, net of accumulated depreciation. Depreciation is computed principally by the straight-line method over estimated useful lives ranging from
fifteen
to
thirty-nine years
for buildings and improvements,
three
to
seven years
for data processing equipment, furniture and other equipment, and
three
to
five years
for computer software. Leasehold improvements are depreciated over the term of the related lease. Certain costs related to the development or purchase of internal-use software are capitalized and amortized.
Goodwill and Other Intangible Assets:
FASB guidance requires business combinations to be accounted for using the acquisition method of accounting and it also specifies the types of acquired intangible assets that are required to be recognized and reported separately from goodwill. Goodwill represents the excess of cost of acquisition over the fair value of net assets acquired. Other intangible assets represent the values assigned to subscriber bases, provider and hospital networks, Blue Cross and Blue Shield and other trademarks, licenses, non-compete and other agreements. Goodwill and other intangible assets are allocated to reportable segments based on the relative fair value of the components of the businesses acquired.
-
88
-
Anthem, Inc.
Notes to Consolidated Financial Statements (continued)
Goodwill and other intangible assets with indefinite lives are not amortized but are tested for impairment at least annually. We complete our annual impairment tests of existing goodwill and other intangible assets with indefinite lives during the fourth quarter of each year. Certain interim impairment tests are also performed when potential impairment indicators exist or changes in our business or other triggering events occur. Goodwill and other intangible assets are allocated to reporting units for purposes of the annual goodwill impairment test. In addition, certain other intangible assets with indefinite lives, such as trademarks, are also tested separately.
FASB guidance allows for qualitative assessments of whether it is more likely than not that the fair value of a reporting unit is less than its carrying amount for purposes of a goodwill impairment analysis and whether it is more likely than not that an indefinite-lived intangible asset is impaired for purposes of an indefinite-lived intangible asset impairment analysis. Quantitative analysis must be performed if qualitative analyses are not conclusive. Entities also have the option to bypass the assessment of qualitative factors and proceed directly to performing quantitative analyses. We begin our annual tests with quantitative analyses. Our impairment tests require us to make assumptions and judgments regarding the estimated fair value of our reporting units, including goodwill and other intangible assets with indefinite lives. Estimated fair values developed based on our assumptions and judgments might be significantly different if other reasonable assumptions and estimates were to be used.
Fair value for purposes of the goodwill impairment test is calculated using a blend of a projected income and market valuation approach. The projected income approach is developed using assumptions about future revenue, expenses and net income derived from our internal planning process. Our assumed discount rate is based on our industry’s weighted-average cost of capital and reflects volatility associated with the cost of equity capital. Market valuations are based on observed multiples of certain measures including membership, revenue, EBITDA (earnings before interest, taxes, depreciation and amortization) and net income as well as market capitalization analyses of Anthem and other comparable companies. A goodwill impairment loss is recognized to the extent that the carrying amount exceeds the asset’s fair value. This determination is made at the reporting unit level and consists of two steps. First, the fair value of a reporting unit is determined and compared to its carrying amount. Second, if the carrying amount of a reporting unit exceeds its fair value, an impairment loss is recognized for any excess of the carrying amount of the reporting unit’s goodwill over the implied fair value of that goodwill. The implied fair value of goodwill is determined by allocating the fair value of the reporting unit in a manner similar to a purchase price allocation on a business acquisition, at the impairment test date.
The fair value of indefinite-lived intangible assets is estimated and compared to the carrying value. We estimate the fair value of indefinite-lived intangible assets using a projected income approach. We recognize an impairment loss when the estimated fair value of indefinite-lived intangible assets is less than the carrying value. If significant impairment indicators are noted relative to other intangible assets subject to amortization, we may be required to record impairment losses against future income.
Derivative Financial Instruments:
We primarily invest in the following types of derivative financial instruments: interest rate swaps, forward contracts, put and call options, credit default swaps, embedded derivatives, warrants and swaptions. Derivatives embedded within non-derivative instruments, such as options embedded in convertible fixed maturity securities, are bifurcated from the host instrument when the embedded derivative is not clearly and closely related to the host instrument. Our use of derivatives is limited by statutes and regulations promulgated by the various regulatory bodies to which we are subject, and by our own derivative policy. Our derivative use is generally limited to hedging purposes, on an economic basis, and we generally do not use derivative instruments for speculative purposes.
We have exposure to economic losses due to interest rate risk arising from changes in the level or volatility of interest rates. We attempt to mitigate our exposure to interest rate risk through active portfolio management, including rebalancing our existing portfolios of assets and liabilities, as well as changing the characteristics of investments to be purchased or sold in the future. In addition, derivative financial instruments are used to modify the interest rate exposure of certain liabilities or forecasted transactions. These strategies include the use of interest rate swaps and forward contracts, which are used to lock-in interest rates or to hedge, on an economic basis, interest rate risks associated with variable rate debt. We have used these types of instruments as designated hedges against specific liabilities.
All investments in derivatives are recorded as assets or liabilities at fair value. If certain correlation, hedge effectiveness and risk reduction criteria are met, a derivative may be specifically designated as a hedge of exposure to changes in fair value or cash flow. The accounting for changes in the fair value of a derivative depends on the intended use of the derivative and
-
89
-
Anthem, Inc.
Notes to Consolidated Financial Statements (continued)
the nature of any hedge designation thereon. Amounts excluded from the assessment of hedge effectiveness, if any, as well as the ineffective portion of the gain or loss, are reported in results of operations immediately. If the derivative is not designated as a hedge, the gain or loss resulting from the change in the fair value of the derivative is recognized in results of operations in the period of change. Cash flows associated with the settlement of non-designated derivatives are shown on a net basis in investing activity in our consolidated statements of cash flow.
From time to time, we may also purchase derivatives to hedge, on an economic basis, our exposure to foreign currency exchange fluctuations associated with the operations of certain of our subsidiaries. We generally use futures or forward contracts for these transactions. We generally do not designate these contracts as hedges and, accordingly, the changes in fair value of these derivatives are recognized in income immediately.
Credit exposure associated with non-performance by the counterparties to derivative instruments is generally limited to the uncollateralized fair value of the asset related to instruments recognized in the consolidated balance sheets. We attempt to mitigate the risk of non-performance by selecting counterparties with high credit ratings and monitoring their creditworthiness and by diversifying derivatives among multiple counterparties. At
December 31, 2014
, we believe there were no material concentrations of credit risk with any individual counterparty.
We generally enter into master netting agreements, which reduce credit risk by permitting net settlement of transactions with the same counterparty. Certain of our derivative agreements also contain credit support provisions that require us or the counterparty to post collateral if there are declines in the derivative fair value or our credit rating. The derivative assets and derivative liabilities are reported at their fair values net of collateral and netting by counterparty. At
December 31, 2014
we had posted collateral of
$127.8
and received collateral of
$105.0
related to our derivative financial instruments.
Retirement Benefits:
We recognize the funded status of pension and other postretirement benefit plans on the consolidated balance sheets based on fiscal-year-end measurements of plan assets and benefit obligations. Prepaid pension benefits represent prepaid costs related to defined benefit pension plans and are reported with other noncurrent assets. Postretirement benefits represent outstanding obligations for retiree medical, life, vision and dental benefits. Liabilities for pension and other postretirement benefits are reported with current and noncurrent liabilities based on the amount by which the actuarial present value of benefits payable in the next twelve months included in the benefit obligation exceeds the fair value of plan assets.
We determine the expected return on plan assets using the calculated value of plan assets, which recognizes changes in the fair value of plan assets in a systematic manner over three years. We apply a corridor approach to amortize unrecognized actuarial gains or losses. Under this approach, only accumulated net actuarial gains or losses in excess of 10% of the greater of the projected benefit obligation or the fair value of plan assets are amortized over the average remaining service or lifetime of the workforce as a component of net periodic benefit cost.
Medical Claims Payable:
Liabilities for medical claims payable include estimated provisions for incurred but not paid claims on an undiscounted basis, as well as estimated provisions for expenses related to the processing of claims. Incurred but not paid claims include (1) an estimate for claims that are incurred but not reported, as well as claims reported to us but not yet processed through our systems; and (2) claims reported to us and processed through our systems but not yet paid.
Liabilities for both claims incurred but not reported and reported but not yet processed through our systems are determined in aggregate by employing actuarial methods that are commonly used by health insurance actuaries and meet Actuarial Standards of Practice. Actuarial Standards of Practice require that the claim liabilities be appropriate under moderately adverse circumstances. We determine the amount of the liability for incurred but not paid claims by following a detailed actuarial process that entails using both historical claim payment patterns as well as emerging medical cost trends to project our best estimate of claim liabilities.
We regularly review and set assumptions regarding cost trends and utilization when initially establishing claim liabilities. We continually monitor and adjust the claims liability and benefit expense based on subsequent paid claims activity. If our assumptions regarding cost trends and utilization are significantly different than actual results, our income statement and financial position could be impacted in future periods.
Premium deficiencies are recognized when it is probable that expected claims and administrative expenses will exceed future premiums on existing medical insurance contracts without consideration of investment income. Determination of
-
90
-
Anthem, Inc.
Notes to Consolidated Financial Statements (continued)
premium deficiencies for longer duration life and disability contracts includes consideration of investment income. For purposes of premium deficiencies, contracts are deemed to be either short or long duration and are grouped in a manner consistent with our method of acquiring, servicing and measuring the profitability of such contracts. Once established, premium deficiencies are released commensurate with actual claims experience over the remaining life of the contract. No premium deficiencies were established at
December 31, 2014
or
2013
.
Reserves for Future Policy Benefits:
Reserves for future policy benefits include liabilities for life and long-term disability insurance policy benefits based upon interest, mortality and morbidity assumptions from published actuarial tables, modified based upon our experience. Future policy benefits also include liabilities for insurance policies for which some of the premiums received in earlier years are intended to pay anticipated benefits to be incurred in future years. Future policy benefits are continually monitored and reviewed, and when reserves are adjusted, differences are reflected in benefit expense.
The current portion of reserves for future policy benefits relates to the portion of such reserves that we expect to pay within
one year
. We believe that our liabilities for future policy benefits, along with future premiums received are adequate to satisfy our ultimate benefit liability; however, these estimates are inherently subject to a number of variable circumstances. Consequently, the actual results could differ materially from the amounts recorded in our consolidated financial statements.
Other Policyholder Liabilities:
Other policyholder liabilities include rate stabilization reserves associated with retrospectively rated insurance contracts and certain case-specific reserves. Other policyholder liabilities also includes liabilities for premium refunds based upon the minimum medical loss ratio, or MLR, the relative health risk of members, or other contractual or regulatory requirements. Rate stabilization reserves represent accumulated premiums that exceed what customers owe us based on actual claim experience. The timing of payment of these retrospectively rated refunds is based on the contractual terms with the customers and can vary from period to period based on the specific contractual requirements.
We are required to meet certain minimum MLR thresholds prescribed by the Patient Protection and Affordable Care Act, or ACA, and related Health Care and Education Reconciliation Act of 2010, or collectively, Health Care Reform. If we do not meet or exceed the minimum MLR thresholds specified by Health Care Reform, we are required to pay rebates to certain customers. Minimum MLR rebates are calculated by applicable line of business (Large Group, Small Group and Individual) and legal entity in accordance with regulations issued by the Department of Health and Human Services, or HHS. Such calculations are made using estimated calendar year medical loss expense and premiums, as defined by HHS.
We follow HHS guidelines for determining the types of expenses that may be included in our minimum MLR rebate calculations, which differ from benefit expense and premiums as reported in our consolidated financial statements prepared in conformity with GAAP. Certain amounts reported as expense in our GAAP basis consolidated financial statements may be reported as a reduction of premiums in accordance with HHS regulations. In addition, profit amounts included in our payments to third party administrative service providers are recorded as benefit expense in our consolidated GAAP financial statements while HHS does not allow for the inclusion of these expenses within the medical loss expense for purposes of calculating minimum MLR.
Revenue Recognition:
Premiums for fully-insured contracts are recognized as revenue over the period insurance coverage is provided, and, if applicable, net of amounts recognized for minimum MLR rebates and the Health Care Reform risk adjustment, reinsurance and risk corridor premium stabilization programs. Premiums related to the unexpired contractual coverage periods are reflected in the accompanying consolidated balance sheets as unearned income. Premiums include revenue from retrospectively rated contracts where revenue is based on the estimated ultimate loss experience of the contract. Premium revenue includes an adjustment for retrospectively rated refunds based on an estimate of incurred claims. Premium rates for certain lines of business are subject to approval by the Department of Insurance of each respective state.
Administrative fees include revenue from certain group contracts that provide for the group to be at risk for all, or with supplemental insurance arrangements, a portion of their claims experience. We charge these self-funded groups an administrative fee, which is based on the number of members in a group or the group’s claim experience. In addition, administrative fees include amounts received for the administration of Medicare or certain other government programs. Under our self-funded arrangements, revenue is recognized as administrative services are performed. All benefit payments under these programs are excluded from benefit expense.
Share-Based Compensation:
Our current compensation philosophy provides for share-based compensation, including stock options, restricted stock awards and an employee stock purchase plan. Stock options are granted for a fixed number of
-
91
-
Anthem, Inc.
Notes to Consolidated Financial Statements (continued)
shares with an exercise price at least equal to the fair value of the shares at the date of the grant. Restricted stock awards are issued at the fair value of the stock on the grant date. Effective January 1, 2014, the employee stock purchase plan allows for a purchase price per share which is
95%
of the fair value of a share of common stock on the last trading day of the plan quarter. The employee stock purchase plan discount is not recognized as compensation expense based on GAAP guidance. All other share-based payments to employees are recognized as compensation expense in the income statement based on their fair values. Additionally, excess tax benefits, which result from actual tax benefits exceeding deferred tax benefits previously recognized based on grant date fair value, are recognized as additional paid-in-capital and are reclassified from operating cash flows to financing cash flows in the consolidated statements of cash flows. Our share-based employee compensation plans and assumptions are described in Note 14, “Capital Stock.”
Advertising and Marketing Costs
:
We use print, broadcast and other advertising to promote our products and to develop our corporate image. We market our products through direct marketing activities and an extensive network of independent agents, brokers and retail partnerships for Individual and Medicare customers, and for certain Local Group customers with a smaller employee base. Products for National Accounts and Local Group customers with a larger employee base are generally sold through independent brokers or consultants retained by the customer and working with industry specialists from our in-house sales force. In the Individual and Small Group markets we offer products through state or federally facilitated marketplaces, or public exchanges, and off-exchange products. Federal premium subsidies are available only for certain public exchange products. The cost of advertising and marketing for product promotion is expensed as incurred while advertising and marketing costs associated with corporate image is expensed when first aired. Total advertising and marketing expense was
$337.0
,
$350.9
and
$285.4
for the years ended
December 31, 2014
,
2013
and
2012
, respectively.
Earnings per Share:
Earnings per share amounts, on a basic and diluted basis, have been calculated based upon the weighted-average common shares outstanding for the period.
Basic earnings per share excludes dilution and is computed by dividing income available to common shareholders by the weighted-average number of common shares outstanding for the period. Diluted earnings per share includes the dilutive effect of stock options, restricted stock and convertible debentures, using the treasury stock method. The treasury stock method assumes exercise of stock options and vesting of restricted stock, with the assumed proceeds used to purchase common stock at the average market price for the period. The difference between the number of shares assumed issued and number of shares assumed purchased represents the dilutive shares.
Recently Adopted Accounting Guidance:
In November 2014, the FASB issued Accounting Standards Update, or ASU, No. 2014-17,
Business Combinations (Topic 805): Pushdown Accounting (a consensus of the FASB Emerging Issues Task Force)
. This ASU provides an acquired entity, or any subsidiaries of the acquired entity, with the option to apply pushdown accounting in its separate financial statements upon occurrence of an event in which an acquirer obtains control of the acquired entity. The election to apply pushdown accounting can be made either in the period in which the change-in-control event occurs, or in a subsequent period. An election to apply pushdown accounting in a reporting period after the reporting period in which the change-in-control event occurred would be considered a change in accounting principle. If pushdown accounting is applied to an individual change-in-control event, that election is irrevocable. The adoption of the provisions of this ASU upon its effective date of November 18, 2014 did not have a material impact on our consolidated financial position, results of operations, cash flows or financial statement disclosures.
Effective January 1, 2014, we adopted the provisions of ASU No. 2011-06, Other Expenses (Topic 720):
Fees Paid to the Federal Government by Health Insurers (a consensus of the FASB Emerging Issues Task Force)
, or ASU 2011-06. Health Care Reform imposes a mandatory
annual Health Insurance Provider Fee, or HIP Fee,
on health insurers that write certain types of health insurance on U.S. risks. The annual HIP Fee is allocated to health insurers based on the ratio of the amount of an insurer's net premium revenues written during the preceding calendar year to an adjusted amount of health insurance for all U.S. health risk for those certain lines of business written during the preceding calendar year. The HIP Fee is non-deductible for federal income tax purposes. The total amount to be collected from allocations to health insurers in 2014 was
$8,000.0
, and our portion of the HIP Fee for 2014 was
$893.3
. The final calculation and payment of the HIP Fee occurred in the third quarter of 2014
. ASU 2011-06 addresses how the HIP Fee should be recognized and classified in the financial statements of health insurers. In accordance with ASU 2011-06, we recorded our estimated liability for the HIP Fee in full at the beginning of the year with a corresponding deferred asset that was amortized to expense on a straight-line basis throughout the year.
-
92
-
Anthem, Inc.
Notes to Consolidated Financial Statements (continued)
Recent Accounting Guidance Not Yet Adopted:
In May 2014, the FASB issued Accounting Standards Update, or ASU, No. 2014-09,
Revenue from Contracts with Customers (Topic 606)
, or ASU 2014-09. Upon the effective date, ASU 2014-09 will supersede almost all existing revenue recognition guidance under GAAP, with certain exceptions, including an exception for revenue accounted for in accordance with the provisions of Accounting Standards Codification Topic 944,
Financial Services - Insurance
, or Topic 944. ASU 2014-09 will require a company to recognize revenue when it transfers promised goods or services to customers in an amount that reflects the consideration to which the company expects to be entitled in exchange for those goods or services. ASU 2014-09 is effective for interim and annual reporting periods beginning after December 15, 2016 and early adoption is not permitted. An entity has the option to apply the provisions of ASU 2014-09 either retrospectively to each prior reporting period presented or retrospectively with the cumulative effect of initially applying the new guidance recognized at the date of initial application. We are currently evaluating the effects the adoption of ASU 2014-09 will have on our financial statements and related disclosures for revenue transactions outside the scope of Topic 944.
In April 2014, the FASB issued ASU No. 2014-08,
Presentation of Financial Statements (Topic 205) and Property, Plant and Equipment (Topic 360): Reporting Discontinued Operations and Disclosures of Disposals of Components of an Entity
, or ASU 2014-08. ASU 2014-08 changes the criteria for determining which disposals can be presented as discontinued operations and modifies related disclosure requirements. Under the new guidance, a discontinued operation is defined as a disposal of a component of an entity or a group of components of an entity that is disposed of or is classified as held for sale and represents a strategic shift that has (or will have) a major effect on an entity’s operations and financial results. ASU 2014-08 is effective prospectively to new disposals and new classifications of disposal groups as held for sale in interim and annual periods beginning on or after December 15, 2014, with early adoption permitted. The adoption of ASU 2014-08 is not expected to have a material impact on our consolidated financial position, results of operations or cash flows.
There were no other new accounting pronouncements that were issued or became effective during the year ended
December 31, 2014
that had, or are expected to have, a material impact on our financial position, results of operations, cash flows or financial statement disclosures.
3. Business Acquisitions and Divestitures
Amerigroup
In
December 2012
, we completed our acquisition of Amerigroup, one of the nation’s leading managed care companies focused on meeting the health care needs of financially vulnerable Americans. This acquisition furthers our goal of creating better health care quality at more affordable prices for our customers. Amerigroup also advances our capabilities in effectively and efficiently serving the growing Medicaid population, including the expanding dual eligible population, seniors, persons with disabilities and long-term services and support markets.
We paid
$92.00
per share in cash to acquire all of the outstanding shares of Amerigroup for total cash consideration of
$4,755.8
. In addition,
0.5
shares of Amerigroup restricted stock converted to
0.7
shares of Anthem restricted stock, valued at
$17.1
, and
0.1
shares underlying Amerigroup stock options converted to
0.2
shares underlying Anthem stock options, valued at
$2.6
. We also incurred
$24.0
of transaction costs, which were recorded to general and administrative expense during the year ended December 31, 2012.
In accordance with FASB accounting guidance for business combinations, the consideration transferred was allocated to the fair value of Amerigroup’s assets acquired and liabilities assumed, including identifiable intangible assets. In 2013, we finalized our purchase accounting and made a measurement period adjustment to the fair value of certain assets acquired and liabilities assumed at the date of acquisition. The effect of these adjustments on the preliminary purchase price allocation recorded at December 31, 2012 was an increase to goodwill of
$28.9
, an increase in other intangible assets of
$20.0
, a decrease in current liabilities of
$1.6
, and an increase in noncurrent liabilities of
$50.5
. The below table and the accompanying consolidated balance sheets reflect the impact of these adjustments.
The excess of the consideration transferred over the estimated fair value of net assets acquired resulted in non-tax-deductible goodwill of
$3,062.0
, all of which was allocated to our Government Business segment. Goodwill recognized from the acquisition of Amerigroup primarily relates to the future economic benefits arising from expected synergies and is consistent with our stated intentions to strengthen our position and expand operations in the government sector to serve Medicaid and Medicare enrollees.
-
93
-
Anthem, Inc.
Notes to Consolidated Financial Statements (continued)
The following table summarizes the estimated fair values of Amerigroup assets acquired and liabilities assumed as of the date of acquisition:
|
Current assets
|
$
|
2,716.5
|
|
|
Goodwill
|
3,062.0
|
|
|
|
Other intangible assets
|
975.0
|
|
|
|
Other noncurrent assets
|
406.1
|
|
|
|
Total assets acquired
|
7,159.6
|
|
|
|
Current liabilities
|
1,416.6
|
|
|
|
Noncurrent liabilities
|
967.5
|
|
|
|
Total liabilities assumed
|
2,384.1
|
|
|
|
Net assets acquired
|
$
|
4,775.5
|
|
Of the
$975.0
of total other intangible assets acquired,
$65.0
represents finite-lived customer relationships with an amortization period of
three years
,
$30.0
represents provider and hospital networks with an amortization period of
twenty years
and
$880.0
represents indefinite-lived state Medicaid licenses and trade names.
The results of operations of Amerigroup for the period following
December 24, 2012
are included in our consolidated financial statements within our Government Business segment and represented
$219.0
of our operating revenue and an offset to net income of
$6.1
for the year ended December 31, 2012. The pro-forma effects of this acquisition for periods prior to acquisition were not considered material to our consolidated results of operations.
1-800 CONTACTS
In
December 2013
, we entered into a definitive agreement to sell our 1-800 CONTACTS business to the private equity firm Thomas H. Lee Partners, L.P. Additionally, we entered into an asset purchase agreement with Luxottica Group to sell our glasses.com related assets (collectively, 1-800 CONTACTS). The operating results for 1-800 CONTACTS are reported as discontinued operations in the accompanying consolidated statements of income. These results were previously reported in the Commercial and Specialty Business segment. Additionally, the assets and liabilities of 1-800 CONTACTS are reported as held for sale in the accompanying consolidated balance sheets as of December 31, 2013.
The sales were completed on January 31, 2014 and did not result in any material difference to the loss on disposal from discontinued operations recorded during the year ended December 31, 2013. Prior to the sales, 2014 income from discontinued operations, net of tax, was
$9.6
. Summarized financial information for the 1-800 CONTACTS discontinued operations for the years ended December 31, 2013 and 2012 is as follows:
|
2013
|
2012
|
||||||||
|
Revenues
|
$
|
434.7
|
|
$
|
214.5
|
|
|||
|
Income from discontinued operations before tax
|
$
|
17.3
|
|
$
|
7.2
|
|
|||
|
Income tax (benefit) expense
|
(2.6
|
)
|
2.7
|
|
|||||
|
Income from discontinued operations
|
19.9
|
|
4.5
|
|
|||||
|
Loss on disposal from discontinued operations, net of tax
|
(164.5
|
)
|
—
|
|
|||||
|
(Loss) income from discontinued operations, net of tax
|
$
|
(144.6
|
)
|
$
|
4.5
|
|
|||
In connection with the sale of 1-800 CONTACTS, we recognized a loss on disposal of
$221.8
, net of an income tax benefit of
$57.3
for the year ended December 31, 2013. The loss on disposal was calculated as the difference between the fair value, as determined by the sales agreements less costs to sell, and the carrying value of the held for sale assets at December 31, 2013.
-
94
-
Anthem, Inc.
Notes to Consolidated Financial Statements (continued)
The assets and liabilities of 1-800 CONTACTS are reported as held for sale in the accompanying consolidated balance sheets at December 31, 2013 and consist of the following:
|
Assets
|
||||||
|
Cash and cash equivalents
|
$
|
4.8
|
|
|||
|
Property and equipment
|
27.6
|
|
||||
|
Goodwill
|
409.9
|
|
||||
|
Other intangibles
|
415.4
|
|
||||
|
Other assets
|
49.2
|
|
||||
|
Total assets
|
$
|
906.9
|
|
|||
|
Liabilities
|
||||||
|
Accounts payable and other accrued expenses
|
$
|
34.2
|
|
|||
|
Deferred income taxes
|
142.5
|
|
||||
|
Other liabilities
|
4.7
|
|
||||
|
Total liabilities
|
$
|
181.4
|
|
|||
Acquisition of Simply Healthcare Holdings, Inc.
On February 17, 2015, we completed our acquisition of Simply Healthcare Holdings, Inc., a leading managed care company for people enrolled in Medicaid and Medicare programs in the state of Florida. This acquisition, which was originally announced on December 22, 2014, aligns with our strategy for continued growth in our Government Business segment. As a result, we will, through our affiliated Medicaid and Medicare plans, serve more than
half a million
members in the state of Florida.
-
95
-
Anthem, Inc.
Notes to Consolidated Financial Statements (continued)
4. Investments
A summary of current and long-term investments, available-for-sale, at
December 31, 2014
and
2013
is as follows:
|
|
Non-Credit
Component of Other-Than- Temporary Impairments Recognized in AOCI |
||||||||||||||||||||||
|
Cost or
Amortized Cost |
Gross
Unrealized Gains |
Gross Unrealized Losses
|
Estimated
Fair Value |
||||||||||||||||||||
|
|
Less than
12 Months |
12 Months
or Greater |
|||||||||||||||||||||
|
December 31, 2014
|
|||||||||||||||||||||||
|
Fixed maturity securities:
|
|||||||||||||||||||||||
|
United States Government securities
|
$
|
315.7
|
|
$
|
4.6
|
|
$
|
(0.3
|
)
|
$
|
—
|
|
$
|
320.0
|
|
$
|
—
|
|
|||||
|
Government sponsored securities
|
94.6
|
|
0.8
|
|
—
|
|
(0.4
|
)
|
95.0
|
|
—
|
|
|||||||||||
|
States, municipalities and political subdivisions, tax-exempt
|
5,451.4
|
|
287.0
|
|
(1.8
|
)
|
(3.0
|
)
|
5,733.6
|
|
—
|
|
|||||||||||
|
Corporate securities
|
8,335.9
|
|
162.9
|
|
(123.1
|
)
|
(43.2
|
)
|
8,332.5
|
|
(6.8
|
)
|
|||||||||||
|
Options embedded in convertible securities
|
98.7
|
|
—
|
|
—
|
|
—
|
|
98.7
|
|
—
|
|
|||||||||||
|
Residential mortgage-backed securities
|
2,099.7
|
|
68.9
|
|
(1.0
|
)
|
(8.6
|
)
|
2,159.0
|
|
—
|
|
|||||||||||
|
Commercial mortgage-backed securities
|
504.8
|
|
6.1
|
|
(0.6
|
)
|
(0.4
|
)
|
509.9
|
|
—
|
|
|||||||||||
|
Other debt securities
|
720.3
|
|
6.1
|
|
(1.7
|
)
|
(1.6
|
)
|
723.1
|
|
—
|
|
|||||||||||
|
Total fixed maturity securities
|
17,621.1
|
|
536.4
|
|
(128.5
|
)
|
(57.2
|
)
|
17,971.8
|
|
$
|
(6.8
|
)
|
||||||||||
|
Equity securities
|
1,330.7
|
|
618.5
|
|
(11.1
|
)
|
—
|
|
1,938.1
|
|
|||||||||||||
|
Total investments, available-for-sale
|
$
|
18,951.8
|
|
$
|
1,154.9
|
|
$
|
(139.6
|
)
|
$
|
(57.2
|
)
|
$
|
19,909.9
|
|
||||||||
|
December 31, 2013
|
|||||||||||||||||||||||
|
Fixed maturity securities:
|
|||||||||||||||||||||||
|
United States Government securities
|
$
|
300.8
|
|
$
|
2.5
|
|
$
|
(3.4
|
)
|
$
|
—
|
|
$
|
299.9
|
|
$
|
—
|
|
|||||
|
Government sponsored securities
|
174.4
|
|
0.4
|
|
(1.3
|
)
|
—
|
|
173.5
|
|
—
|
|
|||||||||||
|
States, municipalities and political subdivisions, tax-exempt
|
5,899.5
|
|
202.9
|
|
(90.1
|
)
|
(9.6
|
)
|
6,002.7
|
|
(0.6
|
)
|
|||||||||||
|
Corporate securities
|
7,614.1
|
|
205.2
|
|
(95.2
|
)
|
(15.5
|
)
|
7,708.6
|
|
(0.1
|
)
|
|||||||||||
|
Options embedded in convertible securities
|
89.2
|
|
—
|
|
—
|
|
—
|
|
89.2
|
|
—
|
|
|||||||||||
|
Residential mortgage-backed securities
|
2,269.4
|
|
48.0
|
|
(41.4
|
)
|
(7.1
|
)
|
2,268.9
|
|
—
|
|
|||||||||||
|
Commercial mortgage-backed securities
|
479.0
|
|
10.5
|
|
(2.6
|
)
|
(0.3
|
)
|
486.6
|
|
—
|
|
|||||||||||
|
Other debt securities
|
456.2
|
|
5.8
|
|
(2.5
|
)
|
(0.8
|
)
|
458.7
|
|
(0.1
|
)
|
|||||||||||
|
Total fixed maturity securities
|
17,282.6
|
|
475.3
|
|
(236.5
|
)
|
(33.3
|
)
|
17,488.1
|
|
$
|
(0.8
|
)
|
||||||||||
|
Equity securities
|
1,195.9
|
|
578.9
|
|
(8.0
|
)
|
—
|
|
1,766.8
|
|
|||||||||||||
|
Total investments, available-for-sale
|
$
|
18,478.5
|
|
$
|
1,054.2
|
|
$
|
(244.5
|
)
|
$
|
(33.3
|
)
|
$
|
19,254.9
|
|
||||||||
At
December 31, 2014
, we owned
$2,668.9
of mortgage-backed securities and
$633.8
of asset-backed securities out of a total available-for-sale investment portfolio of
$19,909.9
. These securities included sub-prime and Alt-A securities with fair values of
$37.5
and
$81.0
, respectively. These sub-prime and Alt-A securities had accumulated net unrealized gains of
$1.5
and
$5.3
, respectively. The average credit rating of the sub-prime and Alt-A securities was “CCC” and “CC”, respectively.
-
96
-
Anthem, Inc.
Notes to Consolidated Financial Statements (continued)
The following tables summarize for available-for-sale fixed maturity securities and available-for-sale equity securities in an unrealized loss position at
December 31, 2014
and
2013
, the aggregate fair value and gross unrealized loss by length of time those securities have been continuously in an unrealized loss position.
|
|
Less than 12 Months
|
12 Months or Greater
|
|||||||||||||||||||
|
|
Number of
Securities
|
Estimated
Fair Value
|
Gross
Unrealized
Loss
|
Number of
Securities
|
Estimated
Fair Value
|
Gross
Unrealized
Loss
|
|||||||||||||||
|
(Securities are whole amounts)
|
|
|
|
|
|
|
|||||||||||||||
|
December 31, 2014
|
|||||||||||||||||||||
|
Fixed maturity securities:
|
|||||||||||||||||||||
|
United States Government securities
|
17
|
|
$
|
145.3
|
|
$
|
(0.3
|
)
|
2
|
|
$
|
0.9
|
|
$
|
—
|
|
|||||
|
Government sponsored securities
|
2
|
|
0.3
|
|
—
|
|
16
|
|
29.3
|
|
(0.4
|
)
|
|||||||||
|
States, municipalities and political subdivisions, tax-exempt
|
136
|
|
315.6
|
|
(1.8
|
)
|
80
|
|
174.3
|
|
(3.0
|
)
|
|||||||||
|
Corporate securities
|
1,802
|
|
3,213.3
|
|
(123.1
|
)
|
314
|
|
514.6
|
|
(43.2
|
)
|
|||||||||
|
Residential mortgage-backed securities
|
78
|
|
155.0
|
|
(1.0
|
)
|
186
|
|
398.3
|
|
(8.6
|
)
|
|||||||||
|
Commercial mortgage-backed securities
|
43
|
|
156.2
|
|
(0.6
|
)
|
10
|
|
33.2
|
|
(0.4
|
)
|
|||||||||
|
Other debt securities
|
79
|
|
270.6
|
|
(1.7
|
)
|
21
|
|
65.0
|
|
(1.6
|
)
|
|||||||||
|
Total fixed maturity securities
|
2,157
|
|
4,256.3
|
|
(128.5
|
)
|
629
|
|
1,215.6
|
|
(57.2
|
)
|
|||||||||
|
Equity securities
|
407
|
|
125.4
|
|
(11.1
|
)
|
—
|
|
—
|
|
—
|
|
|||||||||
|
Total fixed maturity and equity securities
|
2,564
|
|
$
|
4,381.7
|
|
$
|
(139.6
|
)
|
629
|
|
$
|
1,215.6
|
|
$
|
(57.2
|
)
|
|||||
|
December 31, 2013
|
|||||||||||||||||||||
|
Fixed maturity securities:
|
|||||||||||||||||||||
|
United States Government securities
|
27
|
|
$
|
179.2
|
|
$
|
(3.4
|
)
|
—
|
|
$
|
—
|
|
$
|
—
|
|
|||||
|
Government sponsored securities
|
22
|
|
73.4
|
|
(1.3
|
)
|
—
|
|
—
|
|
—
|
|
|||||||||
|
States, municipalities and political subdivisions, tax-exempt
|
806
|
|
2,070.9
|
|
(90.1
|
)
|
42
|
|
82.4
|
|
(9.6
|
)
|
|||||||||
|
Corporate securities
|
1,448
|
|
2,586.6
|
|
(95.2
|
)
|
107
|
|
81.3
|
|
(15.5
|
)
|
|||||||||
|
Residential mortgage-backed securities
|
605
|
|
1,243.0
|
|
(41.4
|
)
|
80
|
|
116.2
|
|
(7.1
|
)
|
|||||||||
|
Commercial mortgage-backed securities
|
52
|
|
177.7
|
|
(2.6
|
)
|
4
|
|
5.6
|
|
(0.3
|
)
|
|||||||||
|
Other debt securities
|
65
|
|
185.3
|
|
(2.5
|
)
|
17
|
|
16.2
|
|
(0.8
|
)
|
|||||||||
|
Total fixed maturity securities
|
3,025
|
|
6,516.1
|
|
(236.5
|
)
|
250
|
|
301.7
|
|
(33.3
|
)
|
|||||||||
|
Equity securities
|
426
|
|
120.8
|
|
(8.0
|
)
|
—
|
|
—
|
|
—
|
|
|||||||||
|
Total fixed maturity and equity securities
|
3,451
|
|
$
|
6,636.9
|
|
$
|
(244.5
|
)
|
250
|
|
$
|
301.7
|
|
$
|
(33.3
|
)
|
|||||
-
97
-
Anthem, Inc.
Notes to Consolidated Financial Statements (continued)
The amortized cost and fair value of available-for-sale fixed maturity securities at
December 31, 2014
, by contractual maturity, are shown below. Expected maturities may differ from contractual maturities because the issuers of the securities may have the right to prepay obligations.
|
Amortized
Cost
|
Estimated
Fair Value
|
||||||
|
Due in one year or less
|
$
|
507.3
|
|
$
|
510.8
|
|
|
|
Due after one year through five years
|
4,649.6
|
|
4,702.9
|
|
|||
|
Due after five years through ten years
|
5,227.9
|
|
5,360.8
|
|
|||
|
Due after ten years
|
4,631.8
|
|
4,728.4
|
|
|||
|
Mortgage-backed securities
|
2,604.5
|
|
2,668.9
|
|
|||
|
Total available-for-sale fixed maturity securities
|
$
|
17,621.1
|
|
$
|
17,971.8
|
|
|
The major categories of net investment income for the years ended December 31 are as follows:
|
|
2014
|
|
2013
|
|
2012
|
||||||
|
Fixed maturity securities
|
$
|
644.1
|
|
|
$
|
638.9
|
|
|
$
|
671.2
|
|
|
Equity securities
|
57.7
|
|
|
45.9
|
|
|
38.4
|
|
|||
|
Cash and cash equivalents
|
0.8
|
|
|
1.0
|
|
|
2.5
|
|
|||
|
Other
|
66.3
|
|
|
19.8
|
|
|
16.2
|
|
|||
|
Investment income
|
768.9
|
|
|
705.6
|
|
|
728.3
|
|
|||
|
Investment expense
|
(44.5
|
)
|
|
(46.5
|
)
|
|
(42.2
|
)
|
|||
|
Net investment income
|
$
|
724.4
|
|
|
$
|
659.1
|
|
|
$
|
686.1
|
|
-
98
-
Anthem, Inc.
Notes to Consolidated Financial Statements (continued)
Net realized investment gains/losses and net change in unrealized appreciation/depreciation in investments for the years ended December 31 are as follows:
|
2014
|
2013
|
2012
|
|||||||||
|
Net realized gains (losses) on investments:
|
|||||||||||
|
Fixed maturity securities:
|
|||||||||||
|
Gross realized gains from sales
|
$
|
198.2
|
|
$
|
225.9
|
|
$
|
401.0
|
|
||
|
Gross realized losses from sales
|
(50.6
|
)
|
(125.7
|
)
|
(54.8
|
)
|
|||||
|
Net realized gains from sales of fixed maturity securities
|
147.6
|
|
100.2
|
|
346.2
|
|
|||||
|
Equity securities:
|
|||||||||||
|
Gross realized gains from sales
|
106.5
|
|
224.1
|
|
82.0
|
|
|||||
|
Gross realized losses from sales
|
(90.2
|
)
|
(100.5
|
)
|
(93.8
|
)
|
|||||
|
Net realized gains (losses) from sales of equity securities
|
16.3
|
|
123.6
|
|
(11.8
|
)
|
|||||
|
Other realized gains on investments
|
13.1
|
|
48.1
|
|
0.5
|
|
|||||
|
Net realized gains on investments
|
177.0
|
|
271.9
|
|
334.9
|
|
|||||
|
Other-than-temporary impairment losses recognized in income:
|
|||||||||||
|
Fixed maturity securities
|
(22.3
|
)
|
(42.5
|
)
|
(11.8
|
)
|
|||||
|
Equity securities
|
(13.5
|
)
|
(13.9
|
)
|
(17.5
|
)
|
|||||
|
Other invested assets, long-term
|
(13.2
|
)
|
(42.5
|
)
|
(8.5
|
)
|
|||||
|
Other-than-temporary impairment losses recognized in income
|
(49.0
|
)
|
(98.9
|
)
|
(37.8
|
)
|
|||||
|
Change in net unrealized gains (losses) on investments:
|
|||||||||||
|
Fixed maturity securities
|
145.2
|
|
(679.8
|
)
|
199.8
|
|
|||||
|
Equity securities
|
36.5
|
|
225.4
|
|
94.7
|
|
|||||
|
Total change in net unrealized gains (losses) on investments
|
181.7
|
|
(454.4
|
)
|
294.5
|
|
|||||
|
Deferred income tax (expense) benefit
|
(63.1
|
)
|
159.7
|
|
(104.6
|
)
|
|||||
|
Net change in net unrealized gains (losses) on investments
|
118.6
|
|
(294.7
|
)
|
189.9
|
|
|||||
|
Net realized gains on investments, other-than-temporary impairment losses recognized in income and net change in net unrealized gains (losses) on investments
|
$
|
246.6
|
|
$
|
(121.7
|
)
|
$
|
487.0
|
|
||
A primary objective in the management of our fixed maturity and equity portfolios is to maximize total return relative to underlying liabilities and respective liquidity needs. In achieving this goal, assets may be sold to take advantage of market conditions or other investment opportunities as well as tax considerations. Sales will generally produce realized gains and losses. In the ordinary course of business, we may sell securities at a loss for a number of reasons, including, but not limited to: (i) changes in the investment environment; (ii) expectations that the fair value could deteriorate further; (iii) desire to reduce exposure to an issuer or an industry; (iv) changes in credit quality; or (v) changes in expected cash flow.
Proceeds from fixed maturity securities, equity securities and other invested assets and the related gross realized gains and gross realized losses for the years ended December 31 are as follows:
|
2014
|
2013
|
2012
|
|||||||||
|
Proceeds
|
$
|
10,255.9
|
|
$
|
13,662.8
|
|
$
|
15,915.6
|
|
||
|
Gross realized gains
|
317.8
|
|
498.1
|
|
483.5
|
|
|||||
|
Gross realized losses
|
(140.8
|
)
|
(226.2
|
)
|
(148.6
|
)
|
|||||
-
99
-
Anthem, Inc.
Notes to Consolidated Financial Statements (continued)
A significant judgment in the valuation of investments is the determination of when an other-than-temporary decline in value has occurred. We follow a consistent and systematic process for recognizing impairments on securities that sustain other-than-temporary declines in value. We have established a committee responsible for the impairment review process. The decision to impair a security incorporates both quantitative criteria and qualitative information. The impairment review process considers a number of factors including, but not limited to: (i) the length of time and the extent to which the fair value has been less than book value, (ii) the financial condition and near term prospects of the issuer, (iii) our intent and ability to retain impaired equity security investments for a period of time sufficient to allow for any anticipated recovery in fair value, (iv) our intent to sell or the likelihood that we will need to sell a fixed maturity security before recovery of its amortized cost basis, (v) whether the debtor is current on interest and principal payments, (vi) the reasons for the decline in value (i.e., credit event compared to liquidity, general credit spread widening, currency exchange rate or interest rate factors) and (vii) general market conditions and industry or sector specific factors. For securities that are deemed to be other-than-temporarily impaired, the security is adjusted to fair value and the resulting losses are recognized in the consolidated statements of income. The new cost basis of the impaired securities is not increased for future recoveries in fair value.
Other-than-temporary impairments recorded in
2014
,
2013
and
2012
were primarily the result of the continued credit deterioration on specific issuers in the bond markets and the fair values of certain equity securities remaining below cost for an extended period of time. There were no individually significant OTTI losses on investments by issuer during
2014
,
2013
or
2012
.
Investment securities are exposed to various risks, such as interest rate, market and credit. Due to the level of risk associated with certain investment securities and the level of uncertainty related to changes in the value of investment securities, it is possible that changes in these risk factors in the near term could have an adverse material impact on our results of operations or shareholders’ equity.
The changes in the amount of the credit component of OTTI losses on fixed maturity securities recognized in income, for which a portion of the OTTI losses was recognized in other comprehensive income, was not material for the years ended
December 31, 2014
,
2013
or
2012
.
At
December 31, 2014
and
2013
, no investments exceeded 10% of shareholders’ equity.
At
December 31, 2014
, the carrying value of fixed maturity investments that did not produce income during
2014
was
$9.2
. At
December 31, 2013
, we did not hold any fixed maturity investments that did not produce income during
2013
.
As of
December 31, 2014
we had committed approximately
$555.0
to future capital calls from various third-party investments in exchange for an ownership interest in the related entities.
At
December 31, 2014
and
2013
, securities with carrying values of approximately
$504.4
and
$449.9
, respectively, were deposited by our insurance subsidiaries under requirements of regulatory authorities.
-
100
-
Anthem, Inc.
Notes to Consolidated Financial Statements (continued)
5. Derivative Financial Instruments
A summary of the aggregate contractual or notional amounts and estimated fair values related to derivative financial instruments at
December 31, 2014
and
2013
is as follows:
|
|
Contractual/
Notional
Amount
|
Balance Sheet Location
|
Estimated Fair
Value
|
||||||||||
|
Asset
|
(Liability)
|
||||||||||||
|
December 31, 2014
|
|||||||||||||
|
Hedging instruments
|
|||||||||||||
|
Interest rate swaps
|
$
|
1,185.0
|
|
Other assets/other liabilities
|
$
|
2.6
|
|
$
|
(7.8
|
)
|
|||
|
Non-hedging instruments
|
|||||||||||||
|
Derivatives embedded in convertible fixed maturity securities
|
287.0
|
|
Fixed maturity securities
|
98.7
|
|
—
|
|
||||||
|
Interest rate swaps
|
97.9
|
|
Equity securities
|
—
|
|
(9.4
|
)
|
||||||
|
Options
|
12,208.5
|
|
Other assets/other liabilities
|
428.0
|
|
(458.4
|
)
|
||||||
|
Futures
|
—
|
|
Equity securities
|
0.5
|
|
(1.5
|
)
|
||||||
|
Subtotal non-hedging
|
12,593.4
|
|
Subtotal non-hedging
|
527.2
|
|
(469.3
|
)
|
||||||
|
Total derivatives
|
$
|
13,778.4
|
|
Total derivatives
|
529.8
|
|
(477.1
|
)
|
|||||
|
Amounts netted
|
(216.7
|
)
|
216.7
|
|
|||||||||
|
Net derivatives
|
$
|
313.1
|
|
$
|
(260.4
|
)
|
|||||||
|
December 31, 2013
|
|||||||||||||
|
Hedging instruments
|
|||||||||||||
|
Interest rate swaps
|
$
|
1,660.0
|
|
Other assets/other liabilities
|
$
|
30.9
|
|
$
|
(20.7
|
)
|
|||
|
Non-hedging instruments
|
|||||||||||||
|
Derivatives embedded in convertible fixed maturity securities
|
295.0
|
|
Fixed maturity securities
|
89.2
|
|
—
|
|
||||||
|
Credit default and interest rate swaps
|
72.6
|
|
Equity securities
|
1.8
|
|
(2.5
|
)
|
||||||
|
Options
|
14,912.4
|
|
Equity securities/other assets
|
776.5
|
|
(787.7
|
)
|
||||||
|
Futures
|
—
|
|
Equity securities
|
3.5
|
|
(1.6
|
)
|
||||||
|
Subtotal non-hedging
|
15,280.0
|
|
Subtotal non-hedging
|
871.0
|
|
(791.8
|
)
|
||||||
|
Total derivatives
|
$
|
16,940.0
|
|
Total derivatives
|
901.9
|
|
(812.5
|
)
|
|||||
|
Amounts netted
|
(791.8
|
)
|
791.8
|
|
|||||||||
|
Net derivatives
|
$
|
110.1
|
|
$
|
(20.7
|
)
|
|||||||
-
101
-
Anthem, Inc.
Notes to Consolidated Financial Statements (continued)
Fair Value Hedges
We have entered into various interest rate swap contracts to convert a portion of our interest rate exposure on our long-term debt from fixed rates to floating rates. The floating rates payable on all of our fair value hedges are benchmarked to LIBOR. A summary of our outstanding fair value hedges at
December 31, 2014
and
2013
is as follows:
|
Type of Fair Value Hedges
|
Year
Entered
Into
|
Outstanding Notional Amount
|
Interest Rate
Received
|
Expiration Date
|
||||||||||||
|
2014
|
2013
|
|||||||||||||||
|
Interest rate swap
|
2014
|
$
|
150.0
|
|
$
|
—
|
|
4.350
|
%
|
August 15, 2020
|
|
|||||
|
Interest rate swap
|
2013
|
10.0
|
|
10.0
|
|
4.350
|
August 15, 2020
|
|
||||||||
|
Interest rate swap
|
2012
|
200.0
|
|
200.0
|
|
4.350
|
August 15, 2020
|
|
||||||||
|
Interest rate swap
|
2012
|
625.0
|
|
625.0
|
|
1.875
|
January 15, 2018
|
|
||||||||
|
Interest rate swap
|
2012
|
200.0
|
|
200.0
|
|
2.375
|
February 15, 2017
|
|
||||||||
|
Interest rate swap
|
2011
|
—
|
|
200.0
|
|
5.250
|
—
|
|
||||||||
|
Interest rate swap
|
2010
|
—
|
|
25.0
|
|
5.250
|
—
|
|
||||||||
|
Interest rate swap
|
2006
|
—
|
|
200.0
|
|
5.000
|
—
|
|
||||||||
|
Interest rate swap
|
2005
|
—
|
|
200.0
|
|
5.000
|
—
|
|
||||||||
|
Total notional amount outstanding
|
$
|
1,185.0
|
|
$
|
1,660.0
|
|
||||||||||
A summary of the effect of fair value hedges on our income statement for the years ended
December 31, 2014
,
2013
and
2012
is as follows:
|
Type of Fair Value Hedges
|
Income Statement
Location of Hedge
Gain
|
Hedge
Gain
Recognized
|
Hedged Item
|
Income Statement
Location of
Hedged Item
Loss
|
Hedged Item
Loss
Recognized
|
|||||||||
|
Year ended December 31, 2014
|
||||||||||||||
|
Interest rate swaps
|
Interest expense
|
$
|
25.5
|
|
Fixed rate debt
|
Interest expense
|
$
|
(25.5
|
)
|
|||||
|
Year ended December 31, 2013
|
||||||||||||||
|
Interest rate swaps
|
Interest expense
|
$
|
31.5
|
|
Fixed rate debt
|
Interest expense
|
$
|
(31.5
|
)
|
|||||
|
Year ended December 31, 2012
|
||||||||||||||
|
Interest rate swaps
|
Interest expense
|
$
|
38.2
|
|
Fixed rate debt
|
Interest expense
|
$
|
(38.2
|
)
|
|||||
Cash Flow Hedges
We have historically entered into forward starting pay fixed interest rate swaps, with the objective of eliminating the variability of cash flows in the interest payments on various debt issuances. These swaps have all terminated and no amounts were outstanding at
December 31, 2014
or
2013
. The unrecognized loss for all terminated cash flow hedges included in accumulated other comprehensive income was
$35.9
and
$32.3
at
December 31, 2014
and
2013
. As of
December 31, 2014
, the total amount of amortization over the next twelve months for all cash flow hedges will increase interest expense by approximately
$5.5
.
-
102
-
Anthem, Inc.
Notes to Consolidated Financial Statements (continued)
A summary of the effect of cash flow hedges on our financial statements for the years ended
December 31, 2014
,
2013
and
2012
is as follows:
|
Effective Portion
|
||||||||||||||||
|
Pretax Hedge
Loss Recognized in Other Comprehensive (Loss) Income |
Income Statement
Location of Loss Reclassification from Accumulated Other Comprehensive Income |
Hedge Loss
Reclassified from Accumulated Other Comprehensive Income |
Ineffective Portion
|
|||||||||||||
|
Type of Cash Flow Hedge
|
Income
Statement
Location of
Loss
Recognized
|
Hedge Loss
Recognized
|
||||||||||||||
|
Year ended December 31, 2014
|
||||||||||||||||
|
Forward starting pay fixed swaps
|
$
|
—
|
|
Interest expense
|
$
|
(5.0
|
)
|
None
|
$
|
—
|
|
|||||
|
Year ended December 31, 2013
|
||||||||||||||||
|
Forward starting pay fixed swaps
|
$
|
—
|
|
Interest expense
|
$
|
(4.6
|
)
|
None
|
$
|
—
|
|
|||||
|
Year ended December 31, 2012
|
||||||||||||||||
|
Forward starting pay fixed swaps
|
$
|
(4.0
|
)
|
Interest expense
|
$
|
(4.2
|
)
|
Interest expense
|
$
|
(0.1
|
)
|
|||||
We test for cash flow hedge effectiveness at hedge inception and re-assess at the end of each reporting period. No amounts were excluded from the assessment of hedge effectiveness.
-
103
-
Anthem, Inc.
Notes to Consolidated Financial Statements (continued)
Non-Hedging Derivatives
A summary of the effect of non-hedging derivatives on our income statement for the years ended
December 31, 2014
,
2013
and
2012
is as follows:
|
Type of Non-hedging Derivatives
|
Income Statement Location of
Gain (Loss) Recognized
|
Derivative
Gain (Loss)
Recognized
|
||||
|
Year ended December 31, 2014
|
||||||
|
Derivatives embedded in convertible fixed maturity securities
|
Net realized gains on investments
|
$
|
11.6
|
|
||
|
Interest rate swaps
|
Net realized gains on investments
|
(11.6
|
)
|
|||
|
Options
|
Net realized gains on investments
|
(54.6
|
)
|
|||
|
Futures
|
Net realized gains on investments
|
(10.0
|
)
|
|||
|
Swaptions
|
Net realized gains on investments
|
1.3
|
|
|||
|
Total
|
$
|
(63.3
|
)
|
|||
|
Year ended December 31, 2013
|
||||||
|
Derivatives embedded in convertible fixed maturity securities
|
Net realized gains on investments
|
$
|
31.5
|
|
||
|
Interest rate swaps
|
Net realized gains on investments
|
2.2
|
|
|||
|
Options
|
Net realized gains on investments
|
(111.7
|
)
|
|||
|
Futures
|
Net realized gains on investments
|
22.3
|
|
|||
|
Swaptions
|
Net realized gains on investments
|
3.0
|
|
|||
|
Total
|
$
|
(52.7
|
)
|
|||
|
Year ended December 31, 2012
|
||||||
|
Derivatives embedded in convertible fixed maturity securities
|
Net realized gains on investments
|
$
|
(2.4
|
)
|
||
|
Credit default and interest rate swaps
|
Net realized gains on investments
|
(3.9
|
)
|
|||
|
Options
|
Net realized gains on investments
|
(66.0
|
)
|
|||
|
Futures
|
Net realized gains on investments
|
(6.7
|
)
|
|||
|
Total
|
$
|
(79.0
|
)
|
|||
6. Fair Value
Assets and liabilities recorded at fair value in the consolidated balance sheets are categorized based upon the level of judgment associated with the inputs used to measure their fair value. Level inputs, as defined by FASB guidance for fair value measurements and disclosures, are as follows:
|
Level Input:
|
|
Input Definition:
|
|
Level I
|
|
Inputs are unadjusted, quoted prices for identical assets or liabilities in active markets at the measurement date.
|
|
Level II
|
|
Inputs other than quoted prices included in Level I that are observable for the asset or liability through corroboration with market data at the measurement date.
|
|
Level III
|
|
Unobservable inputs that reflect management’s best estimate of what market participants would use in pricing the asset or liability at the measurement date.
|
The following methods, assumptions and inputs were used to determine the fair value of each class of the following assets and liabilities recorded at fair value in the consolidated balance sheets:
Cash equivalents:
Cash equivalents primarily consist of highly rated money market funds with maturities of three months or less, and are purchased daily at par value with specified yield rates. Due to the high ratings and short-term nature of the funds, we designate all cash equivalents as Level I.
-
104
-
Anthem, Inc.
Notes to Consolidated Financial Statements (continued)
Fixed maturity securities, available-for-sale:
Fair values of available-for-sale fixed maturity securities are based on quoted market prices, where available. These fair values are obtained primarily from third party pricing services, which generally use Level I or Level II inputs for the determination of fair value to facilitate fair value measurements and disclosures. United States Government securities represent Level I securities, while Level II securities primarily include corporate securities, securities from states, municipalities and political subdivisions and mortgage-backed securities. For securities not actively traded, the pricing services may use quoted market prices of comparable instruments or discounted cash flow analyses, incorporating inputs that are currently observable in the markets for similar securities. We have controls in place to review the pricing services’ qualifications and procedures used to determine fair values. In addition, we periodically review the pricing services’ pricing methodologies, data sources and pricing inputs to ensure the fair values obtained are reasonable. Inputs that are often used in the valuation methodologies include, but are not limited to, broker quotes, benchmark yields, credit spreads, default rates and prepayment speeds. We also have certain fixed maturity securities, primarily corporate debt securities, that are designated Level III securities. For these securities, the valuation methodologies may incorporate broker quotes or discounted cash flow analyses using assumptions for inputs such as expected cash flows, benchmark yields, credit spreads, default rates and prepayment speeds that are not observable in the markets.
Equity securities, available-for-sale:
Fair values of equity securities are generally designated as Level I and are based on quoted market prices. For certain equity securities, quoted market prices for the identical security are not always available and the fair value is estimated by reference to similar securities for which quoted prices are available. These securities are designated Level II. We also have certain equity securities, including private equity securities, for which the fair value is estimated based on each security’s current condition and future cash flow projections. Such securities are designated Level III. The fair values of these private equity securities are generally based on either broker quotes or discounted cash flow projections using assumptions for inputs such as the weighted-average cost of capital, long-term revenue growth rates and earnings before interest, taxes, depreciation and amortization, or EBITDA, and/or revenue multiples that are not observable in the markets.
Other invested assets, current:
Other invested assets, current include securities held in rabbi trusts that are classified as trading. Fair values are based on quoted market prices.
Securities lending collateral:
Fair values of securities lending collateral are based on quoted market prices, where available. These fair values are obtained primarily from third party pricing services, which generally use Level I or Level II inputs for the determination of fair value, to facilitate fair value measurements and disclosures.
Derivatives:
Fair values are based on the quoted market prices by the financial institution that is the counterparty to the derivative transaction. We independently verify prices provided by the counterparties using valuation models that incorporate market observable inputs for similar derivative transactions.
In addition, the following methods and assumptions were used to determine the fair value of each class of pension benefit plan assets and other benefit plan assets not defined above (see Note 10, “Retirement Benefits,” for fair values of benefit plan assets):
Mutual funds
: Fair values are based on quoted market prices, which represent the net asset value, or NAV, of shares held.
Common and collective trusts
: Fair values of common/collective trusts that replicate traded money market funds are based on cost, which approximates fair value. Fair values of common/collective trusts that invest in securities are valued at the NAV of the shares held, where the trust applies fair value measurements to the underlying investments to determine the NAV.
Partnership interests
: Fair values are estimated based on the plan’s proportionate share of the undistributed partners’ capital as reported in audited financial statements of the partnership.
Contract with insurance company
: Fair value of the contract in the insurance company general investment account is determined by the insurance company based on the fair value of the underlying investments of the account.
Investment in DOL 103-12 trust:
Fair value is based on the plan’s proportionate share of the fair value of investments held by the trust, qualified as a Department of Labor Regulation 2520.103-12 entity, or DOL 103-12 trust, as reported in
-
105
-
Anthem, Inc.
Notes to Consolidated Financial Statements (continued)
audited financial statements of the trust, where the trustee applies fair value measurements to the underlying investments of the trust.
Life insurance contracts:
Fair value is based on the cash surrender value of the policies as reported by the insurer.
-
106
-
Anthem, Inc.
Notes to Consolidated Financial Statements (continued)
A summary of fair value measurements by level for assets and liabilities measured at fair value on a recurring basis at
December 31, 2014
and
2013
is as follows:
|
Level I
|
Level II
|
Level III
|
Total
|
||||||||||||
|
December 31, 2014
|
|||||||||||||||
|
Assets:
|
|||||||||||||||
|
Cash equivalents
|
$
|
573.2
|
|
$
|
—
|
|
$
|
—
|
|
$
|
573.2
|
|
|||
|
Investments available-for-sale:
|
|
|
|
||||||||||||
|
Fixed maturity securities:
|
|
|
|
||||||||||||
|
United States Government securities
|
320.0
|
|
—
|
|
—
|
|
320.0
|
|
|||||||
|
Government sponsored securities
|
—
|
|
95.0
|
|
—
|
|
95.0
|
|
|||||||
|
States, municipalities and political subdivisions, tax-exempt
|
—
|
|
5,733.6
|
|
—
|
|
5,733.6
|
|
|||||||
|
Corporate securities
|
7.1
|
|
8,180.8
|
|
144.6
|
|
8,332.5
|
|
|||||||
|
Options embedded in convertible securities
|
—
|
|
98.7
|
|
—
|
|
98.7
|
|
|||||||
|
Residential mortgage-backed securities
|
—
|
|
2,159.0
|
|
—
|
|
2,159.0
|
|
|||||||
|
Commercial mortgage-backed securities
|
—
|
|
506.6
|
|
3.3
|
|
509.9
|
|
|||||||
|
Other debt securities
|
89.2
|
|
627.3
|
|
6.6
|
|
723.1
|
|
|||||||
|
Total fixed maturity securities
|
416.3
|
|
17,401.0
|
|
154.5
|
|
17,971.8
|
|
|||||||
|
Equity securities
|
1,696.9
|
|
192.9
|
|
48.3
|
|
1,938.1
|
|
|||||||
|
Other invested assets, current
|
20.2
|
|
—
|
|
—
|
|
20.2
|
|
|||||||
|
Securities lending collateral
|
808.3
|
|
706.9
|
|
—
|
|
1,515.2
|
|
|||||||
|
Derivatives excluding embedded options (reported with other assets)
|
—
|
|
224.8
|
|
—
|
|
224.8
|
|
|||||||
|
Total assets
|
$
|
3,514.9
|
|
$
|
18,525.6
|
|
$
|
202.8
|
|
$
|
22,243.3
|
|
|||
|
Liabilities:
|
|||||||||||||||
|
Derivatives excluding embedded options (reported with other liabilities)
|
$
|
—
|
|
|
$
|
(260.4
|
)
|
|
$
|
—
|
|
|
$
|
(260.4
|
)
|
|
Total liabilities
|
$
|
—
|
|
$
|
(260.4
|
)
|
$
|
—
|
|
$
|
(260.4
|
)
|
|||
|
December 31, 2013
|
|||||||||||||||
|
Assets:
|
|||||||||||||||
|
Cash equivalents
|
$
|
632.3
|
|
$
|
—
|
|
$
|
—
|
|
$
|
632.3
|
|
|||
|
Investments available-for-sale:
|
|||||||||||||||
|
Fixed maturity securities:
|
|||||||||||||||
|
United States Government securities
|
299.9
|
|
—
|
|
—
|
|
299.9
|
|
|||||||
|
Government sponsored securities
|
—
|
|
173.5
|
|
—
|
|
173.5
|
|
|||||||
|
States, municipalities and political subdivisions, tax-exempt
|
—
|
|
6,002.7
|
|
—
|
|
6,002.7
|
|
|||||||
|
Corporate securities
|
—
|
|
7,593.4
|
|
115.2
|
|
7,708.6
|
|
|||||||
|
Options embedded in convertible securities
|
—
|
|
89.2
|
|
—
|
|
89.2
|
|
|||||||
|
Residential mortgage-backed securities
|
—
|
|
2,268.9
|
|
—
|
|
2,268.9
|
|
|||||||
|
Commercial mortgage-backed securities
|
—
|
|
480.1
|
|
6.5
|
|
486.6
|
|
|||||||
|
Other debt securities
|
35.6
|
|
408.3
|
|
14.8
|
|
458.7
|
|
|||||||
|
Total fixed maturity securities
|
335.5
|
|
17,016.1
|
|
136.5
|
|
17,488.1
|
|
|||||||
|
Equity securities
|
1,475.7
|
|
249.7
|
|
41.4
|
|
1,766.8
|
|
|||||||
|
Other invested assets, current
|
16.3
|
|
—
|
|
—
|
|
16.3
|
|
|||||||
|
Securities lending collateral
|
408.5
|
|
561.3
|
|
—
|
|
969.8
|
|
|||||||
|
Derivatives excluding embedded options (reported with other assets)
|
—
|
|
58.4
|
|
—
|
|
58.4
|
|
|||||||
|
Total assets
|
$
|
2,868.3
|
|
$
|
17,885.5
|
|
$
|
177.9
|
|
$
|
20,931.7
|
|
|||
|
Liabilities:
|
|||||||||||||||
|
Derivatives excluding embedded options (reported with other liabilities)
|
$
|
—
|
|
$
|
(20.7
|
)
|
$
|
—
|
|
$
|
(20.7
|
)
|
|||
|
Total liabilities
|
$
|
—
|
|
$
|
(20.7
|
)
|
$
|
—
|
|
$
|
(20.7
|
)
|
|||
-
107
-
Anthem, Inc.
Notes to Consolidated Financial Statements (continued)
A reconciliation of the beginning and ending balances of assets measured at fair value on a recurring basis using Level III inputs for the years ended
December 31, 2014
,
2013
and
2012
is as follows:
|
Corporate
Securities
|
Residential
Mortgage-
backed
Securities
|
Commercial
Mortgage-
backed
Securities
|
Other Debt
Securities
|
Equity
Securities
|
Total
|
||||||||||||||||||
|
Year ended December 31, 2014
|
|||||||||||||||||||||||
|
Beginning balance at January 1, 2014
|
$
|
115.2
|
|
$
|
—
|
|
$
|
6.5
|
|
$
|
14.8
|
|
$
|
41.4
|
|
$
|
177.9
|
|
|||||
|
Total (losses) gains:
|
|||||||||||||||||||||||
|
Recognized in net income
|
(4.4
|
)
|
—
|
|
—
|
|
—
|
|
(0.7
|
)
|
(5.1
|
)
|
|||||||||||
|
Recognized in accumulated other comprehensive income
|
8.5
|
|
—
|
|
—
|
|
0.4
|
|
2.8
|
|
11.7
|
|
|||||||||||
|
Purchases
|
68.9
|
|
—
|
|
3.6
|
|
6.5
|
|
15.9
|
|
94.9
|
|
|||||||||||
|
Sales
|
(48.0
|
)
|
—
|
|
—
|
|
(3.6
|
)
|
(10.6
|
)
|
(62.2
|
)
|
|||||||||||
|
Settlements
|
(11.0
|
)
|
—
|
|
(3.7
|
)
|
(0.4
|
)
|
—
|
|
(15.1
|
)
|
|||||||||||
|
Transfers into Level III
|
24.8
|
|
—
|
|
—
|
|
—
|
|
—
|
|
24.8
|
|
|||||||||||
|
Transfers out of Level III
|
(9.4
|
)
|
—
|
|
(3.1
|
)
|
(11.1
|
)
|
(0.5
|
)
|
(24.1
|
)
|
|||||||||||
|
Ending balance at December 31, 2014
|
$
|
144.6
|
|
$
|
—
|
|
$
|
3.3
|
|
$
|
6.6
|
|
$
|
48.3
|
|
$
|
202.8
|
|
|||||
|
Change in unrealized losses included in net income related to assets still held for the year ended December 31, 2014
|
$
|
(11.1
|
)
|
$
|
—
|
|
$
|
—
|
|
$
|
—
|
|
$
|
(0.7
|
)
|
$
|
(11.8
|
)
|
|||||
|
Year ended December 31, 2013
|
|||||||||||||||||||||||
|
Beginning balance at January 1, 2013
|
$
|
121.1
|
|
$
|
4.3
|
|
$
|
—
|
|
$
|
3.9
|
|
$
|
26.2
|
|
$
|
155.5
|
|
|||||
|
Total (losses) gains:
|
|||||||||||||||||||||||
|
Recognized in net income
|
(30.3
|
)
|
—
|
|
—
|
|
(0.1
|
)
|
(4.8
|
)
|
(35.2
|
)
|
|||||||||||
|
Recognized in accumulated other comprehensive income
|
(3.5
|
)
|
—
|
|
—
|
|
0.6
|
|
9.5
|
|
6.6
|
|
|||||||||||
|
Purchases
|
51.9
|
|
—
|
|
—
|
|
1.6
|
|
17.6
|
|
71.1
|
|
|||||||||||
|
Sales
|
(4.8
|
)
|
—
|
|
—
|
|
—
|
|
(7.1
|
)
|
(11.9
|
)
|
|||||||||||
|
Settlements
|
(15.5
|
)
|
(1.9
|
)
|
(6.1
|
)
|
(0.7
|
)
|
—
|
|
(24.2
|
)
|
|||||||||||
|
Transfers into Level III
|
3.0
|
|
13.1
|
|
12.6
|
|
9.8
|
|
—
|
|
38.5
|
|
|||||||||||
|
Transfers out of Level III
|
(6.7
|
)
|
(15.5
|
)
|
—
|
|
(0.3
|
)
|
—
|
|
(22.5
|
)
|
|||||||||||
|
Ending balance at December 31, 2013
|
$
|
115.2
|
|
$
|
—
|
|
$
|
6.5
|
|
$
|
14.8
|
|
$
|
41.4
|
|
$
|
177.9
|
|
|||||
|
Change in unrealized losses included in net income related to assets still held for the year ended December 31, 2013
|
$
|
(30.8
|
)
|
$
|
—
|
|
$
|
—
|
|
$
|
(0.1
|
)
|
$
|
(6.5
|
)
|
$
|
(37.4
|
)
|
|||||
|
Year Ended December 31, 2012
|
|||||||||||||||||||||||
|
Beginning balance at January 1, 2012
|
$
|
195.1
|
|
$
|
—
|
|
$
|
6.3
|
|
$
|
59.0
|
|
$
|
24.4
|
|
$
|
284.8
|
|
|||||
|
Total gains (losses):
|
|||||||||||||||||||||||
|
Recognized in net income
|
15.2
|
|
—
|
|
—
|
|
0.1
|
|
(0.9
|
)
|
14.4
|
|
|||||||||||
|
Recognized in accumulated other comprehensive income
|
(19.7
|
)
|
—
|
|
0.1
|
|
0.7
|
|
(14.2
|
)
|
(33.1
|
)
|
|||||||||||
|
Purchases
|
77.8
|
|
3.0
|
|
3.4
|
|
—
|
|
4.9
|
|
89.1
|
|
|||||||||||
|
Business combinations
|
2.6
|
|
—
|
|
—
|
|
—
|
|
—
|
|
2.6
|
|
|||||||||||
|
Sales
|
(29.8
|
)
|
—
|
|
—
|
|
(16.6
|
)
|
(0.5
|
)
|
(46.9
|
)
|
|||||||||||
|
Settlements
|
(67.8
|
)
|
(0.1
|
)
|
(0.1
|
)
|
(1.3
|
)
|
—
|
|
(69.3
|
)
|
|||||||||||
|
Transfers into Level III
|
2.9
|
|
|
1.4
|
|
|
1.9
|
|
|
12.0
|
|
|
12.5
|
|
30.7
|
|
|||||||
|
Transfers out of Level III
|
(55.2
|
)
|
—
|
|
(11.6
|
)
|
(50.0
|
)
|
—
|
|
(116.8
|
)
|
|||||||||||
|
Ending balance at December 31, 2012
|
$
|
121.1
|
|
$
|
4.3
|
|
$
|
—
|
|
$
|
3.9
|
|
$
|
26.2
|
|
$
|
155.5
|
|
|||||
|
Change in unrealized losses included in net income related to assets still held for the year ended December 31, 2012
|
$
|
—
|
|
$
|
—
|
|
$
|
—
|
|
$
|
—
|
|
$
|
(0.7
|
)
|
$
|
(0.7
|
)
|
|||||
Transfers between levels, if any, are recorded as of the beginning of the reporting period. There were no material transfers into or out of Level III during the years ended December 31, 2014 or 2013 and no material transfers into Level III
-
108
-
Anthem, Inc.
Notes to Consolidated Financial Statements (continued)
during the year ended December 31, 2012. During the year ended December 31, 2012, the transfers out of Level III of corporate securities were for certain sub-prime securities transferred from Level III to Level II as a result of inputs that were previously unobservable becoming observable due to increased volume and level of trading in active markets. In addition, the transfers out of Level III of other debt securities were for certain inverse floating rate securities transferred from Level III to Level II as a result of those securities’ impending maturity and settlement and recent trading activity of similar securities in observable markets.
During the years ended
December 31, 2014
,
2013
or
2012
, there were no material transfers from Level I to Level II or from Level II to Level I.
Certain assets and liabilities are measured at fair value on a nonrecurring basis; that is, the instruments are not measured at fair value on an ongoing basis but are subject to fair value adjustments only in certain circumstances. There were no material assets or liabilities measured at fair value on a nonrecurring basis during the years ended
December 31, 2014
or
2013
.
Our valuation policy is determined by members of our treasury and accounting departments. Whenever possible, our policy is to obtain quoted market prices in active markets to estimate fair values for recognition and disclosure purposes. Where quoted market prices in active markets are not available, fair values are estimated using discounted cash flow analyses, broker quotes or other valuation techniques. These techniques are significantly affected by our assumptions, including discount rates and estimates of future cash flows. Potential taxes and other transaction costs are not considered in estimating fair values. Our valuation policy is generally to obtain only one quoted price for each security from third party pricing services, which are derived through recently reported trades for identical or similar securities making adjustments through the reporting date based upon available market observable information. When broker quotes are used, we generally obtain only one broker quote per security. As we are responsible for the determination of fair value, we perform monthly analysis on the prices received from the pricing services to determine whether the prices are reasonable estimates of fair value. This analysis is performed by our internal treasury personnel who are familiar with our investment portfolios, the pricing services engaged and the valuation techniques and inputs used. Our analysis includes a review of month-to-month price fluctuations. If unusual fluctuations are noted in this review, we may obtain additional information from other pricing services to validate the quoted price. There were no adjustments to quoted market prices obtained from the pricing services during the years ended
December 31, 2014
,
2013
or
2012
.
In addition to the preceding disclosures on assets recorded at fair value in the consolidated balance sheets, FASB guidance also requires the disclosure of fair values for certain other financial instruments for which it is practicable to estimate fair value, whether or not such values are recognized in the consolidated balance sheets.
Non-financial instruments such as real estate, property and equipment, other current assets, deferred income taxes, intangible assets and certain financial instruments, such as policy liabilities, are excluded from the fair value disclosures. Therefore, the fair value amounts cannot be aggregated to determine our underlying economic value.
The carrying amounts reported in the consolidated balance sheets for cash, accrued investment income, premium and self-funded receivables, other receivables, income taxes receivable, unearned income, accounts payable and accrued expenses, security trades pending payable, securities lending payable and certain other current liabilities approximate fair value because of the short term nature of these items. These assets and liabilities are not listed in the table below.
The following methods and assumptions were used to estimate the fair value of each class of financial instrument:
Other invested assets, long-term
: Other invested assets, long-term include primarily our investments in limited partnerships, joint ventures and other non-controlled corporations, as well as the cash surrender value of corporate-owned life insurance policies. Investments in limited partnerships, joint ventures and other non-controlled corporations are carried at our share in the entities’ undistributed earnings, which approximates fair value. The carrying value of corporate-owned life insurance policies represents the cash surrender value as reported by the respective insurer, which approximates fair value.
Short-term borrowings
: The fair value of our short-term borrowings is based on quoted market prices for the same or similar debt, or, if no quoted market prices were available, on the current market interest rates estimated to be available to us for debt of similar terms and remaining maturities.
-
109
-
Anthem, Inc.
Notes to Consolidated Financial Statements (continued)
Long-term debt - commercial paper
: The carrying amount for commercial paper approximates fair value as the underlying instruments have variable interest rates at market value.
Long-term debt - notes
: The fair values of our notes are based on quoted market prices in active markets for the same or similar debt, or, if no quoted market prices are available, on the current market observable rates estimated to be available to us for debt of similar terms and remaining maturities.
Long-term debt—convertible debentures
: The fair value of our convertible debentures is based on the quoted market price in the active private market in which the convertible debentures trade.
A summary of the carrying value and fair value by level of financial instruments not recorded at fair value on our consolidated balance sheets at
December 31, 2014
and
2013
are as follows:
|
|
Carrying
Value
|
Fair Value
|
|||||||||||||||||
|
|
Level I
|
Level II
|
Level III
|
Total
|
|||||||||||||||
|
December 31, 2014
|
|||||||||||||||||||
|
Assets:
|
|||||||||||||||||||
|
Other invested assets, long-term
|
$
|
1,695.9
|
|
$
|
—
|
|
$
|
—
|
|
$
|
1,695.9
|
|
$
|
1,695.9
|
|
||||
|
Liabilities:
|
|||||||||||||||||||
|
Debt:
|
|||||||||||||||||||
|
Short-term borrowings
|
400.0
|
|
—
|
|
400.0
|
|
—
|
|
400.0
|
|
|||||||||
|
Notes
|
13,777.8
|
|
—
|
|
14,794.8
|
|
—
|
|
14,794.8
|
|
|||||||||
|
Convertible debentures
|
974.4
|
|
—
|
|
2,581.9
|
|
—
|
|
2,581.9
|
|
|||||||||
|
December 31, 2013
|
|||||||||||||||||||
|
Assets:
|
|||||||||||||||||||
|
Other invested assets, long-term
|
$
|
1,542.6
|
|
$
|
—
|
|
$
|
—
|
|
$
|
1,542.6
|
|
$
|
1,542.6
|
|
||||
|
Liabilities:
|
|||||||||||||||||||
|
Debt:
|
|||||||||||||||||||
|
Short-term borrowings
|
400.0
|
|
—
|
|
400.0
|
|
—
|
|
400.0
|
|
|||||||||
|
Commercial paper
|
379.2
|
|
—
|
|
379.2
|
|
—
|
|
379.2
|
|
|||||||||
|
Notes
|
12,746.4
|
|
—
|
|
13,014.3
|
|
—
|
|
13,014.3
|
|
|||||||||
|
Convertible debentures
|
966.0
|
|
—
|
|
2,030.6
|
|
—
|
|
2,030.6
|
|
|||||||||
-
110
-
Anthem, Inc.
Notes to Consolidated Financial Statements (continued)
7. Income Taxes
The components of deferred income taxes at December 31 are as follows:
|
2014
|
2013
|
||||||
|
Deferred tax assets relating to:
|
|||||||
|
Retirement benefits
|
$
|
357.7
|
|
$
|
287.8
|
|
|
|
Accrued expenses
|
329.9
|
|
342.8
|
|
|||
|
Insurance reserves
|
209.7
|
|
213.1
|
|
|||
|
Net operating loss carryforwards
|
14.8
|
|
17.2
|
|
|||
|
Bad debt reserves
|
132.9
|
|
124.8
|
|
|||
|
State income tax
|
40.6
|
|
32.9
|
|
|||
|
Deferred compensation
|
46.6
|
|
52.0
|
|
|||
|
Investment basis difference
|
88.2
|
|
166.3
|
|
|||
|
Other
|
34.2
|
|
84.0
|
|
|||
|
Total deferred tax assets
|
1,254.6
|
|
1,320.9
|
|
|||
|
Valuation allowance
|
(2.6
|
)
|
(24.1
|
)
|
|||
|
Total deferred tax assets, net of valuation allowance
|
1,252.0
|
|
1,296.8
|
|
|||
|
Deferred tax liabilities relating to:
|
|||||||
|
Unrealized gains on securities
|
331.4
|
|
266.5
|
|
|||
|
Acquisition related:
|
|||||||
|
Trademarks and other non-amortizable intangible assets
|
2,200.5
|
|
2,200.5
|
|
|||
|
Subscriber base, provider and hospital networks
|
301.1
|
|
370.9
|
|
|||
|
Internally developed software and other amortization differences
|
654.9
|
|
703.9
|
|
|||
|
Retirement benefits
|
241.1
|
|
231.5
|
|
|||
|
Debt discount
|
184.0
|
|
186.9
|
|
|||
|
State deferred tax
|
49.1
|
|
55.3
|
|
|||
|
Depreciation and amortization
|
29.6
|
|
33.1
|
|
|||
|
Other
|
205.9
|
|
190.4
|
|
|||
|
Total deferred tax liabilities
|
4,197.6
|
|
4,239.0
|
|
|||
|
Net deferred tax liability
|
$
|
(2,945.6
|
)
|
$
|
(2,942.2
|
)
|
|
|
Deferred tax asset-current
|
$
|
280.4
|
|
$
|
383.0
|
|
|
|
Deferred tax liability-noncurrent
|
(3,226.0
|
)
|
(3,325.2
|
)
|
|||
|
Net deferred tax liability
|
$
|
(2,945.6
|
)
|
$
|
(2,942.2
|
)
|
|
Changes in the valuation allowance during 2014 included a decrease of
$9.8
related to reduction in statutory state income tax rates, a decrease of
$16.2
related to utilization of state net operating losses, and an increase of
$4.5
related to the sale of 1-800 CONTACTS, for a net decrease of
$21.5
.
Changes in the valuation allowance during 2013 included an increase of
$12.1
impacting tax expense related to additional state operating losses and a reduction of
$6.1
impacting goodwill related to acquisition goodwill adjustments for a net increase of
$6.0
.
-
111
-
Anthem, Inc.
Notes to Consolidated Financial Statements (continued)
Significant components of the provision for income taxes for the years ended December 31 consist of the following:
|
2014
|
2013
|
2012
|
|||||||||
|
Current tax expense (benefit):
|
|||||||||||
|
Federal
|
$
|
1,629.4
|
|
$
|
1,226.4
|
|
$
|
1,060.2
|
|
||
|
State and local
|
65.8
|
|
(42.6
|
)
|
95.7
|
|
|||||
|
Total current tax expense
|
1,695.2
|
|
1,183.8
|
|
1,155.9
|
|
|||||
|
Deferred tax expense
|
112.8
|
|
22.1
|
|
51.4
|
|
|||||
|
Total income tax expense
|
$
|
1,808.0
|
|
$
|
1,205.9
|
|
$
|
1,207.3
|
|
||
State and local current tax expense is reported gross of federal benefit, and includes amounts related to true up of prior years’ tax, audit settlements, uncertain tax positions and state tax credits. Such items are included in multiple lines in the following rate reconciliation table on a net of federal tax basis.
A reconciliation of income tax expense recorded in the consolidated statements of income and amounts computed at the statutory federal income tax rate for the years ended December 31 is as follows:
|
|
2014
|
2013
|
2012
|
|||||||||||||||||
|
|
Amount
|
Percent
|
Amount
|
Percent
|
Amount
|
Percent
|
||||||||||||||
|
Amount at statutory rate
|
$
|
1,528.8
|
|
35.0
|
%
|
$
|
1,344.1
|
|
35.0
|
%
|
$
|
1,350.4
|
|
35.0
|
%
|
|||||
|
State and local income taxes net of federal tax benefit
|
49.0
|
|
1.1
|
|
24.4
|
|
0.6
|
|
25.5
|
|
0.6
|
|
||||||||
|
Tax exempt interest and dividends received deduction
|
(65.9
|
)
|
(1.5
|
)
|
(64.9
|
)
|
(1.7
|
)
|
(59.3
|
)
|
(1.5
|
)
|
||||||||
|
Health Insurance Provider fee
|
312.6
|
|
7.2
|
|
—
|
|
—
|
|
—
|
|
—
|
|
||||||||
|
Audit settlements
|
—
|
|
—
|
|
—
|
|
—
|
|
(200.5
|
)
|
(5.2
|
)
|
||||||||
|
Other, net
|
(16.5
|
)
|
(0.4
|
)
|
(97.7
|
)
|
(2.5
|
)
|
91.2
|
|
2.4
|
|
||||||||
|
Total income tax expense
|
$
|
1,808.0
|
|
41.4
|
%
|
$
|
1,205.9
|
|
31.4
|
%
|
$
|
1,207.3
|
|
31.3
|
%
|
|||||
During the year ended December 31, 2014, we recognized income tax expense of
$312.6
, or
$1.09
per diluted share, as a result of the non-tax deductibility of the Health Insurance Provider fee payments.
During the year ended December 31, 2013, we recognized income tax benefits of
$65.0
, or $
0.21
per diluted share, resulting from a favorable tax election made subsequent to the Amerigroup acquisition. This benefit is included in Other, net above.
During the year ended December 31, 2012, we recognized income tax benefits of
$200.5
, or
$0.62
per diluted share, for settlement of certain of our open tax issues with the Internal Revenue Service, or IRS, following approval by the Joint Committee on Taxation. This included amounts related to not-for-profit conversion and corporate reorganizations in prior years, as well as amounts associated with issues related to certain of our acquired companies. This income tax benefit includes the release of gross unrecognized tax benefits from uncertain tax positions, release of a valuation allowance and recognition of interest income. This income tax benefit, and resulting decrease in the effective tax rate, was partially offset due to the non-tax deductibility of litigation settlement expenses associated with the settlement of a class action lawsuit in June 2012 and an increase in our state deferred tax asset valuation allowance attributable to the uncertainty associated with some of our state net operating loss carryforwards.
-
112
-
Anthem, Inc.
Notes to Consolidated Financial Statements (continued)
The change in the carrying amount of gross unrecognized tax benefits from uncertain tax positions for the years ended December 31 is as follows:
|
2014
|
2013
|
||||||
|
Balance at January 1
|
$
|
103.2
|
|
$
|
143.5
|
|
|
|
Additions for tax positions related to:
|
|||||||
|
Current year
|
10.9
|
|
5.0
|
|
|||
|
Prior years
|
31.3
|
|
—
|
|
|||
|
Reductions related to:
|
|||||||
|
Tax positions of prior years
|
(24.5
|
)
|
(45.3
|
)
|
|||
|
Settlements with taxing authorities
|
(5.1
|
)
|
—
|
|
|||
|
Balance at December 31
|
$
|
115.8
|
|
$
|
103.2
|
|
|
The table above excludes interest, net of related tax benefits, which is treated as income tax expense (benefit) under our accounting policy. The interest is included in the amounts described in the following paragraph.
As of
December 31, 2014
,
$68.3
of unrecognized tax benefits would impact our effective tax rate in future periods, if recognized. Also included in the table above is
$10.9
that would be recognized as an adjustment to additional paid-in capital and
$8.7
that would be recognized as an adjustment to goodwill, neither of which would affect our effective tax rate. The
December 31, 2014
balance also includes
$0.3
of tax positions for which ultimate deductibility is highly certain but for which there is uncertainty about the timing of such deductibility. Excluding the impact of interest and penalties, the disallowance of the shorter deductibility period would not affect our effective tax rate, but would accelerate the payment of cash to the taxing authority to an earlier period.
For the years ended
December 31, 2014
,
2013
and
2012
, we recognized approximately
$(4.2)
,
$2.6
and
$(9.0)
in interest, respectively. We had accrued approximately
$14.1
and
$18.3
for the payment of interest at
December 31, 2014
and
2013
, respectively.
As of
December 31, 2014
, as further described below, certain tax years remain open to examination by the IRS and various state and local authorities. In addition, we continue to discuss certain industry issues with the IRS. As a result of these examinations and discussions, we have recorded amounts for uncertain tax positions. It is anticipated that the amount of unrecognized tax benefits will change in the next twelve months due to possible settlements of audits and changes in temporary items. However, the ultimate resolution of these items is dependent on the completion of negotiations with various taxing authorities. While it is difficult to determine when other tax settlements will actually occur, it is reasonably possible that one could occur in the next twelve months and our unrecognized tax benefits could change within a range of approximately
$9.4
to
$(92.0)
.
We are a member of the IRS Compliance Assurance Process, or CAP. The objective of CAP is to reduce taxpayer burden and uncertainty while assuring the IRS of the accuracy of tax returns prior to filing, thereby reducing or eliminating the need for post-filing examinations.
As of
December 31, 2014
, the examinations of our 2014 and 2013 tax years continue to be in process. During 2014, the Joint Committee on Taxation approved our 2010 settlement. Also during 2014, a hearing with IRS Appeals was held and settlement was reached on our 2011 and 2012 tax years.
In certain states, we pay premium taxes in lieu of state income taxes. Premium taxes are reported with general and administrative expense.
At
December 31, 2014
, we had unused federal tax net operating loss carryforwards of approximately
$35.1
to offset future taxable income. The loss carryforwards expire in the years
2017
through
2024
. During
2014
,
2013
and
2012
federal income taxes paid totaled
$1,659.0
,
$1,172.0
and
$1,188.2
, respectively.
-
113
-
Anthem, Inc.
Notes to Consolidated Financial Statements (continued)
8. Property and Equipment
A summary of property and equipment at December 31 is as follows:
|
2014
|
2013
|
||||||
|
Land and improvements
|
$
|
25.8
|
|
$
|
35.4
|
|
|
|
Building and components
|
279.9
|
|
384.0
|
|
|||
|
Data processing equipment, furniture and other equipment
|
940.3
|
|
861.5
|
|
|||
|
Computer software, purchased and internally developed
|
2,162.4
|
|
1,879.0
|
|
|||
|
Leasehold improvements
|
356.4
|
|
325.1
|
|
|||
|
Property and equipment, gross
|
3,764.8
|
|
3,485.0
|
|
|||
|
Accumulated depreciation and amortization
|
(1,820.5
|
)
|
(1,683.5
|
)
|
|||
|
Property and equipment, net
|
$
|
1,944.3
|
|
$
|
1,801.5
|
|
|
Depreciation expense for
2014
,
2013
and
2012
was
$106.5
,
$105.3
and
$102.9
, respectively. Amortization expense on computer software and leasehold improvements for
2014
,
2013
and
2012
was
$367.8
,
$351.8
and
$260.6
, respectively, which includes amortization expense on computer software, both purchased and internally developed, for
2014
,
2013
and
2012
of
$329.2
,
$313.6
and
$239.5
, respectively. Capitalized costs related to the internal development of software of
$1,844.2
and
$1,561.0
at
December 31, 2014
and
2013
, respectively, are reported with computer software.
During the years ended December 31,
2014
,
2013
and
2012
, we recognized
$7.9
,
$47.7
and
$66.8
, respectively, of impairments related to computer software (primarily internally developed) due to project cancellation or asset replacement, some of which resulted from a change in strategic focus needed to effectively manage business operations in a post-Health Care Reform environment.
9. Goodwill and Other Intangible Assets
No goodwill is allocated to our Other segment. A summary of the change in the carrying amount of goodwill for our Commercial and Specialty Business segment and Government Business segment (see Note 19, “Segment Information”) for
2014
and
2013
is as follows:
|
Commercial
and Specialty
Business
|
Government
Business
|
Total
|
|||||||||
|
Balance as of January 1, 2013
|
$
|
11,555.3
|
|
$
|
5,334.5
|
|
$
|
16,889.8
|
|
||
|
Measurement period adjustments
|
(1.3
|
)
|
28.7
|
|
27.4
|
|
|||||
|
Balance as of December 31, 2013
|
$
|
11,554.0
|
|
$
|
5,363.2
|
|
$
|
16,917.2
|
|
||
|
Measurement period adjustments
|
(1.6
|
)
|
(0.2
|
)
|
(1.8
|
)
|
|||||
|
Other adjustments
|
266.5
|
|
(99.9
|
)
|
166.6
|
|
|||||
|
Balance as of December 31, 2014
|
$
|
11,818.9
|
|
$
|
5,263.1
|
|
$
|
17,082.0
|
|
||
|
Accumulated impairment as of December 31, 2014
|
$
|
(41.0
|
)
|
$
|
—
|
|
$
|
(41.0
|
)
|
||
Measurement period adjustments incurred during
2014
included a reduction of
$1.8
related to the tax benefit on the exercise of stock options issued as part of various acquisitions. Other adjustments incurred during 2014 included transfers between business segments and reclassification to goodwill of the indefinite-lived provider network intangible asset, net of deferred taxes, presented in the other intangible asset table below. Measurement period adjustments incurred during
2013
included a reduction of
$1.5
related to the tax benefit on the exercise of stock options issued as part of various acquisitions and an increase of
$28.9
related to other measurement period adjustments.
As required by FASB guidance, we completed annual impairment tests of existing goodwill and other intangible assets with indefinite lives during
2014
,
2013
and
2012
. We perform these annual impairment tests during the fourth quarter. FASB guidance also requires interim impairment testing to be performed when potential impairment indicators exist. These tests
-
114
-
Anthem, Inc.
Notes to Consolidated Financial Statements (continued)
involve the use of estimates related to the fair value of goodwill and intangible assets with indefinite lives and require a significant degree of management judgment and the use of subjective assumptions. The fair values were estimated using the income and market value valuation methods, incorporating Level III internal estimates for inputs, including, but not limited to, revenue projections, income projections, cash flows and discount rates.
We did not incur any impairment losses in
2014
,
2013
or
2012
as the estimated fair values of our reporting units were substantially in excess of their carrying values.
The components of other intangible assets as of December 31 are as follows:
|
|
2014
|
2013
|
|||||||||||||||||||||
|
Gross
Carrying
Amount
|
Accumulated
Amortization
|
Net
Carrying
Amount
|
Gross
Carrying
Amount
|
Accumulated
Amortization |
Net
Carrying
Amount
|
||||||||||||||||||
|
Intangible assets with finite lives:
|
|||||||||||||||||||||||
|
Customer relationships
|
$
|
3,318.4
|
|
$
|
(2,473.4
|
)
|
$
|
845.0
|
|
$
|
3,308.9
|
|
$
|
(2,264.2
|
)
|
$
|
1,044.7
|
|
|||||
|
Provider and hospital relationships
|
140.9
|
|
(51.4
|
)
|
89.5
|
|
140.5
|
|
(44.7
|
)
|
95.8
|
|
|||||||||||
|
Other
|
61.6
|
|
(33.3
|
)
|
28.3
|
|
61.7
|
|
(28.3
|
)
|
33.4
|
|
|||||||||||
|
Total
|
3,520.9
|
|
(2,558.1
|
)
|
962.8
|
|
3,511.1
|
|
(2,337.2
|
)
|
1,173.9
|
|
|||||||||||
|
Intangible assets with indefinite lives:
|
|||||||||||||||||||||||
|
Blue Cross and Blue Shield and other trademarks
|
6,298.7
|
|
—
|
|
6,298.7
|
|
6,298.7
|
|
—
|
|
6,298.7
|
|
|||||||||||
|
Provider network
|
—
|
|
—
|
|
—
|
|
271.8
|
|
—
|
|
271.8
|
|
|||||||||||
|
State Medicaid licenses
|
696.6
|
|
—
|
|
696.6
|
|
696.6
|
|
—
|
|
696.6
|
|
|||||||||||
|
Total
|
6,995.3
|
|
—
|
|
6,995.3
|
|
7,267.1
|
|
—
|
|
7,267.1
|
|
|||||||||||
|
Other intangible assets
|
$
|
10,516.2
|
|
$
|
(2,558.1
|
)
|
$
|
7,958.1
|
|
$
|
10,778.2
|
|
$
|
(2,337.2
|
)
|
$
|
8,441.0
|
|
|||||
As of
December 31, 2014
, the estimated amortization expense for each of the five succeeding years is as follows: 2015,
$184.2
; 2016,
$153.5
; 2017,
$133.5
; 2018,
$113.8
; and 2019,
$94.1
.
10. Retirement Benefits
We sponsor various non-contributory employee defined benefit plans through certain subsidiaries.
The Anthem Cash Balance Plan A and the Anthem Cash Balance Plan B are cash balance pension plans covering certain eligible employees of the affiliated companies that participate in these plans. Effective January 1, 2006, benefits were curtailed, with the result that most participants stopped accruing benefits but continue to earn interest on benefits accrued prior to the curtailment. Certain participants subject to collective bargaining and certain other participants who met grandfathering rules continue to accrue benefits. Participants that do not receive credits and/or benefit accruals are included in the Anthem Cash Balance Plan A, while current employees who are still receiving credits and/or benefits participate in the Anthem Cash Balance Plan B. Several pension plans acquired through various corporate mergers and acquisitions have been merged into these plans in prior years.
The UGS Pension Plan is a defined benefit pension plan with a cash balance component. The UGS Pension Plan covers eligible employees of the affiliated companies that participate in the UGS Pension Plan. Effective January 1, 2004, benefits were curtailed, with the result that most participants stopped accruing benefits but continue to earn interest on benefits previously accrued. Certain employees subject to collective bargaining and certain other employees who met grandfathering rules continue to accrue benefits.
The Employees’ Retirement Plan of Blue Cross of California, or the BCC Plan, is a defined benefit pension plan that covers eligible employees of Blue Cross of California who are covered by a collective bargaining agreement. Effective January 1, 2007, benefits were curtailed under the BCC Plan with the result that no Blue Cross of California employees hired or rehired after December 31, 2006 are eligible to participate in the BCC Plan.
All of the plans’ assets consist primarily of common stocks, fixed maturity securities, investment funds and short-term investments. The funding policies for all plans are to contribute amounts at least sufficient to meet the minimum funding
-
115
-
Anthem, Inc.
Notes to Consolidated Financial Statements (continued)
requirements set forth in the Employee Retirement Income Security Act of 1974, as amended, or ERISA, including amendment by the Pension Protection Act of 2006, and in accordance with income tax regulations, plus such additional amounts as are necessary to provide assets sufficient to meet the benefits to be paid to plan participants.
We use a December 31 measurement date for determining benefit obligations and fair value of plan assets.
The following tables disclose consolidated “pension benefits,” which include the defined benefit pension plans described above, and consolidated “other benefits,” which include postretirement health and welfare benefits including medical, vision and dental benefits offered to certain employees. Calculations were computed using assumptions at the December 31 measurement dates.
The reconciliation of the benefit obligation is as follows:
|
|
Pension Benefits
|
Other Benefits
|
|||||||||||||
|
|
2014
|
2013
|
2014
|
2013
|
|||||||||||
|
Benefit obligation at beginning of year
|
$
|
1,764.7
|
|
$
|
1,948.5
|
|
$
|
607.5
|
|
$
|
623.0
|
|
|||
|
Service cost
|
13.0
|
|
14.2
|
|
3.2
|
|
6.7
|
|
|||||||
|
Interest cost
|
74.1
|
|
67.8
|
|
26.3
|
|
22.4
|
|
|||||||
|
Actuarial loss (gain)
|
185.4
|
|
(129.9
|
)
|
45.3
|
|
4.8
|
|
|||||||
|
Benefits paid
|
(122.8
|
)
|
(135.9
|
)
|
(35.7
|
)
|
(49.4
|
)
|
|||||||
|
Benefit obligation at end of year
|
$
|
1,914.4
|
|
$
|
1,764.7
|
|
$
|
646.6
|
|
$
|
607.5
|
|
|||
The changes in the fair value of plan assets are as follows:
|
|
Pension Benefits
|
Other Benefits
|
|||||||||||||
|
|
2014
|
2013
|
2014
|
2013
|
|||||||||||
|
Fair value of plan assets at beginning of year
|
$
|
1,944.0
|
|
$
|
1,817.9
|
|
$
|
349.8
|
|
$
|
320.3
|
|
|||
|
Actual return on plan assets
|
160.2
|
|
223.4
|
|
17.7
|
|
37.0
|
|
|||||||
|
Employer contributions
|
3.6
|
|
38.6
|
|
16.1
|
|
31.3
|
|
|||||||
|
Benefits paid
|
(122.8
|
)
|
(135.9
|
)
|
(35.7
|
)
|
(38.8
|
)
|
|||||||
|
Fair value of plan assets at end of year
|
$
|
1,985.0
|
|
$
|
1,944.0
|
|
$
|
347.9
|
|
$
|
349.8
|
|
|||
The net amount included in the consolidated balance sheets is as follows:
|
|
Pension Benefits
|
Other Benefits
|
|||||||||||||
|
|
2014
|
2013
|
2014
|
2013
|
|||||||||||
|
Noncurrent assets
|
$
|
146.3
|
|
$
|
240.8
|
|
$
|
—
|
|
$
|
—
|
|
|||
|
Current liabilities
|
(4.3
|
)
|
(3.5
|
)
|
—
|
|
—
|
|
|||||||
|
Noncurrent liabilities
|
(71.4
|
)
|
(58.0
|
)
|
(298.7
|
)
|
(257.7
|
)
|
|||||||
|
Net amount at December 31
|
$
|
70.6
|
|
$
|
179.3
|
|
$
|
(298.7
|
)
|
$
|
(257.7
|
)
|
|||
The net amounts included in accumulated other comprehensive loss (income) that have not been recognized as components of net periodic benefit costs are as follows:
|
|
Pension Benefits
|
Other Benefits
|
|||||||||||||
|
|
2014
|
2013
|
2014
|
2013
|
|||||||||||
|
Net actuarial loss
|
$
|
563.7
|
|
$
|
427.2
|
|
$
|
211.2
|
|
$
|
169.6
|
|
|||
|
Prior service credit
|
(2.2
|
)
|
(3.0
|
)
|
(88.0
|
)
|
(102.4
|
)
|
|||||||
|
Net amount before tax at December 31
|
$
|
561.5
|
|
$
|
424.2
|
|
$
|
123.2
|
|
$
|
67.2
|
|
|||
-
116
-
Anthem, Inc.
Notes to Consolidated Financial Statements (continued)
The estimated net actuarial loss and prior service credit for the defined benefit pension plans that will be reclassified from accumulated other comprehensive loss into net periodic benefit costs over the next year are
$23.8
and
$0.8
, respectively. The estimated net actuarial loss and prior service credit for postretirement benefit plans that will be reclassified from accumulated other comprehensive loss into net periodic benefit costs over the next year are
$15.3
and
$14.4
, respectively.
The accumulated benefit obligation for the defined benefit pension plans was
$1,908.1
and
$1,758.2
at
December 31, 2014
and
2013
, respectively.
As of
December 31, 2014
, certain pension plans had accumulated benefit obligations in excess of plan assets. For those same plans, the projected benefit obligation was also in excess of plan assets. Such plans had a combined projected benefit obligation, accumulated benefit obligation and fair value of plan assets of
$111.9
,
$109.4
and
$36.9
, respectively.
The weighted-average assumptions used in calculating the benefit obligations for all plans are as follows:
|
|
Pension Benefits
|
Other Benefits
|
|||||||||
|
|
2014
|
2013
|
2014
|
2013
|
|||||||
|
Discount rate
|
3.66
|
%
|
4.39
|
%
|
3.74
|
%
|
4.48
|
%
|
|||
|
Rate of compensation increase
|
3.00
|
%
|
3.00
|
%
|
3.00
|
%
|
3.00
|
%
|
|||
|
Expected rate of return on plan assets
|
7.62
|
%
|
7.66
|
%
|
7.00
|
%
|
7.00
|
%
|
|||
The components of net periodic (credit) benefit cost included in the consolidated statements of income are as follows:
|
2014
|
2013
|
2012
|
|||||||||
|
Pension Benefits
|
|||||||||||
|
Service cost
|
$
|
13.0
|
|
$
|
14.2
|
|
$
|
16.4
|
|
||
|
Interest cost
|
74.1
|
|
67.8
|
|
76.4
|
|
|||||
|
Expected return on assets
|
(137.5
|
)
|
(133.1
|
)
|
(134.7
|
)
|
|||||
|
Recognized actuarial loss
|
21.0
|
|
28.3
|
|
30.5
|
|
|||||
|
Amortization of prior service credit
|
(0.8
|
)
|
(0.8
|
)
|
(0.8
|
)
|
|||||
|
Settlement loss
|
5.2
|
|
11.0
|
|
13.8
|
|
|||||
|
Net periodic (credit) benefit cost
|
$
|
(25.0
|
)
|
$
|
(12.6
|
)
|
$
|
1.6
|
|
||
|
Other Benefits
|
|||||||||||
|
Service cost
|
$
|
3.2
|
|
$
|
6.7
|
|
$
|
6.8
|
|
||
|
Interest cost
|
26.3
|
|
22.4
|
|
27.5
|
|
|||||
|
Expected return on assets
|
(23.4
|
)
|
(22.1
|
)
|
(21.0
|
)
|
|||||
|
Recognized actuarial loss
|
9.4
|
|
11.2
|
|
14.1
|
|
|||||
|
Amortization of prior service credit
|
(14.4
|
)
|
(13.3
|
)
|
(13.3
|
)
|
|||||
|
Net periodic benefit cost
|
$
|
1.1
|
|
$
|
4.9
|
|
$
|
14.1
|
|
||
During the years ended
December 31, 2014
,
2013
and
2012
we incurred total settlement losses of
$5.2
,
$11.0
and
$13.8
, respectively, as lump-sum payments exceeded the service cost and interest cost components of net periodic benefit cost for certain of our plans.
-
117
-
Anthem, Inc.
Notes to Consolidated Financial Statements (continued)
The weighted-average assumptions used in calculating the net periodic benefit cost for all plans are as follows:
|
2014
|
2013
|
2012
|
||||||
|
Pension Benefits
|
||||||||
|
Discount rate
|
4.39
|
%
|
3.60
|
%
|
4.29
|
%
|
||
|
Rate of compensation increase
|
3.00
|
%
|
3.50
|
%
|
3.50
|
%
|
||
|
Expected rate of return on plan assets
|
7.66
|
%
|
7.91
|
%
|
8.00
|
%
|
||
|
Other Benefits
|
||||||||
|
Discount rate
|
4.48
|
%
|
3.71
|
%
|
4.36
|
%
|
||
|
Rate of compensation increase
|
3.00
|
%
|
3.50
|
%
|
3.50
|
%
|
||
|
Expected rate of return on plan assets
|
7.00
|
%
|
7.00
|
%
|
7.00
|
%
|
||
The assumed health care cost trend rates used to measure the expected cost of pre-Medicare (those who are not currently eligible for Medicare benefits) other benefits at our
December 31, 2014
measurement date was
8.00%
for
2015
with a gradual decline to
4.50%
by the year
2025
. The assumed health care cost trend rates used to measure the expected cost of post-Medicare (those who are currently eligible for Medicare benefits) other benefits at our
December 31, 2014
measurement date was
6.00%
for
2015
with a gradual decline to
4.50%
by the year
2021
. These estimated trend rates are subject to change in the future. The health care cost trend rate assumption has a significant effect on the amounts reported. For example, an increase in the assumed health care cost trend rate of one percentage point would increase the postretirement benefit obligation as of
December 31, 2014
by
$56.7
and would increase service and interest costs by
$2.0
. Conversely, a decrease in the assumed health care cost trend rate of one percentage point would decrease the postretirement benefit obligation by
$47.6
as of
December 31, 2014
and would decrease service and interest costs by
$1.8
.
Plan assets include a diversified mix of investment grade fixed maturity securities, equity securities and alternative investments across a range of sectors and levels of capitalization to maximize the long-term return for a prudent level of risk.
The weighted-average target allocation for pension benefit plan assets is
45%
equity securities,
46%
fixed maturity securities, and
9%
to all other types of investments. Equity securities primarily include a mix of domestic securities, foreign securities and mutual funds invested in equities. Fixed maturity securities primarily include treasury securities, corporate bonds, and asset-backed investments issued by corporations and the U.S. government. Other types of investments include partnership interests, collective trusts that replicate money market funds and insurance contracts designed specifically for employee benefit plans. As of
December 31, 2014
, there were no significant concentrations of investments in the pension benefit assets or other benefit assets. No plan assets were invested in Anthem common stock.
Pension benefit assets and other benefit assets recorded at fair value are categorized based upon the level of judgment associated with the inputs used to measure their fair value.
-
118
-
Anthem, Inc.
Notes to Consolidated Financial Statements (continued)
The fair values of our pension benefit assets and other benefit assets by asset category and level inputs at
December 31, 2014
, excluding cash, investment income receivable and amounts due to/from brokers, resulting in a net liability of
$0.2
, are as follows (see Note 6, “Fair Value,” for additional information regarding the definition of level inputs):
|
Level I
|
Level II
|
Level III
|
Total
|
||||||||||||
|
December 31, 2014
|
|||||||||||||||
|
Pension Benefit Assets:
|
|||||||||||||||
|
Equity securities:
|
|||||||||||||||
|
U.S. securities
|
$
|
591.2
|
|
$
|
4.5
|
|
$
|
—
|
|
$
|
595.7
|
|
|||
|
Foreign securities
|
246.2
|
|
—
|
|
—
|
|
246.2
|
|
|||||||
|
Mutual funds
|
36.8
|
|
—
|
|
—
|
|
36.8
|
|
|||||||
|
Fixed maturity securities:
|
|||||||||||||||
|
Government securities
|
206.5
|
|
11.5
|
|
—
|
|
218.0
|
|
|||||||
|
Corporate securities
|
—
|
|
373.6
|
|
—
|
|
373.6
|
|
|||||||
|
Asset-backed securities
|
—
|
|
170.0
|
|
—
|
|
170.0
|
|
|||||||
|
Other types of investments:
|
|||||||||||||||
|
Common and collective trusts
|
—
|
|
37.1
|
|
—
|
|
37.1
|
|
|||||||
|
Partnership interests
|
—
|
|
—
|
|
120.7
|
|
120.7
|
|
|||||||
|
Insurance company contracts
|
—
|
|
—
|
|
187.7
|
|
187.7
|
|
|||||||
|
Treasury futures contracts
|
(0.9
|
)
|
—
|
|
—
|
|
(0.9
|
)
|
|||||||
|
Total pension benefit assets
|
$
|
1,079.8
|
|
$
|
596.7
|
|
$
|
308.4
|
|
$
|
1,984.9
|
|
|||
|
Other Benefit Assets:
|
|||||||||||||||
|
Equity securities:
|
|||||||||||||||
|
U.S. securities
|
$
|
22.0
|
|
$
|
0.3
|
|
$
|
—
|
|
$
|
22.3
|
|
|||
|
Foreign securities
|
9.5
|
|
—
|
|
—
|
|
9.5
|
|
|||||||
|
Mutual funds
|
33.6
|
|
—
|
|
—
|
|
33.6
|
|
|||||||
|
Fixed maturity securities:
|
|||||||||||||||
|
Government securities
|
6.2
|
|
—
|
|
—
|
|
6.2
|
|
|||||||
|
Corporate securities
|
—
|
|
10.0
|
|
—
|
|
10.0
|
|
|||||||
|
Asset-backed securities
|
—
|
|
10.5
|
|
—
|
|
10.5
|
|
|||||||
|
Other types of investments:
|
|||||||||||||||
|
Common and collective trusts
|
—
|
|
1.4
|
|
—
|
|
1.4
|
|
|||||||
|
Partnership interests
|
—
|
|
—
|
|
1.5
|
|
1.5
|
|
|||||||
|
Life insurance contracts
|
—
|
|
—
|
|
238.4
|
|
238.4
|
|
|||||||
|
Investment in DOL 103-12 trust
|
—
|
|
14.8
|
|
—
|
|
14.8
|
|
|||||||
|
Total other benefit assets
|
$
|
71.3
|
|
$
|
37.0
|
|
$
|
239.9
|
|
$
|
348.2
|
|
|||
-
119
-
Anthem, Inc.
Notes to Consolidated Financial Statements (continued)
The fair values of our pension benefit assets and other benefit assets by asset category and level inputs at
December 31, 2013
, excluding cash, investment income receivable and amounts due to/from brokers, resulting in a net asset of
$3.9
, are as follows (see Note 6, “Fair Value,” for additional information regarding the definition of level inputs):
|
Level I
|
Level II
|
Level III
|
Total
|
||||||||||||
|
December 31, 2013
|
|||||||||||||||
|
Pension Benefit Assets:
|
|||||||||||||||
|
Equity securities:
|
|||||||||||||||
|
U.S. securities
|
$
|
613.8
|
|
$
|
—
|
|
$
|
—
|
|
$
|
613.8
|
|
|||
|
Foreign securities
|
296.8
|
|
—
|
|
—
|
|
296.8
|
|
|||||||
|
Mutual funds
|
37.4
|
|
—
|
|
—
|
|
37.4
|
|
|||||||
|
Fixed maturity securities:
|
|||||||||||||||
|
Government securities
|
177.9
|
|
11.5
|
|
—
|
|
189.4
|
|
|||||||
|
Corporate securities
|
—
|
|
272.1
|
|
—
|
|
272.1
|
|
|||||||
|
Asset-backed securities
|
—
|
|
127.0
|
|
—
|
|
127.0
|
|
|||||||
|
Other types of investments:
|
|||||||||||||||
|
Common and collective trusts
|
—
|
|
46.6
|
|
—
|
|
46.6
|
|
|||||||
|
Partnership interests
|
—
|
|
—
|
|
159.1
|
|
159.1
|
|
|||||||
|
Insurance company contracts
|
—
|
|
—
|
|
197.4
|
|
197.4
|
|
|||||||
|
Treasury futures contracts
|
0.7
|
|
—
|
|
—
|
|
0.7
|
|
|||||||
|
Total pension benefit assets
|
$
|
1,126.6
|
|
$
|
457.2
|
|
$
|
356.5
|
|
$
|
1,940.3
|
|
|||
|
Other Benefit Assets:
|
|||||||||||||||
|
Equity securities:
|
|||||||||||||||
|
U.S. securities
|
$
|
39.0
|
|
$
|
—
|
|
$
|
—
|
|
$
|
39.0
|
|
|||
|
Foreign securities
|
18.6
|
|
—
|
|
—
|
|
18.6
|
|
|||||||
|
Mutual funds
|
4.7
|
|
—
|
|
—
|
|
4.7
|
|
|||||||
|
Fixed maturity securities:
|
|||||||||||||||
|
Government securities
|
14.3
|
|
—
|
|
—
|
|
14.3
|
|
|||||||
|
Corporate securities
|
4.3
|
|
9.9
|
|
—
|
|
14.2
|
|
|||||||
|
Asset-backed securities
|
—
|
|
11.2
|
|
—
|
|
11.2
|
|
|||||||
|
Other types of investments:
|
|||||||||||||||
|
Common and collective trusts
|
—
|
|
2.2
|
|
—
|
|
2.2
|
|
|||||||
|
Partnership interests
|
—
|
|
—
|
|
1.2
|
|
1.2
|
|
|||||||
|
Life insurance contracts
|
—
|
|
—
|
|
230.0
|
|
230.0
|
|
|||||||
|
Investment in DOL 103-12 trust
|
—
|
|
14.2
|
|
—
|
|
14.2
|
|
|||||||
|
Total other benefit assets
|
$
|
80.9
|
|
$
|
37.5
|
|
$
|
231.2
|
|
$
|
349.6
|
|
|||
-
120
-
Anthem, Inc.
Notes to Consolidated Financial Statements (continued)
A reconciliation of the beginning and ending balances of plan assets measured at fair value using Level III inputs for the years ended
December 31, 2014
,
2013
and
2012
is as follows:
|
U.S. Equity
Securities
|
Partnership
Interests
|
Insurance
Company
Contracts
|
Life
Insurance
Contracts
|
Total
|
|||||||||||||||
|
Year ended December 31, 2014
|
|||||||||||||||||||
|
Beginning balance at January 1, 2014
|
$
|
—
|
|
$
|
160.3
|
|
$
|
197.4
|
|
$
|
230.0
|
|
$
|
587.7
|
|
||||
|
Actual return on plan assets:
|
|||||||||||||||||||
|
Relating to assets still held at the reporting date
|
—
|
|
(5.4
|
)
|
1.4
|
|
8.4
|
|
4.4
|
|
|||||||||
|
Purchases
|
—
|
|
8.4
|
|
11.6
|
|
—
|
|
20.0
|
|
|||||||||
|
Sales
|
—
|
|
(41.1
|
)
|
(22.7
|
)
|
—
|
|
(63.8
|
)
|
|||||||||
|
Ending balance at December 31, 2014
|
$
|
—
|
|
$
|
122.2
|
|
$
|
187.7
|
|
$
|
238.4
|
|
$
|
548.3
|
|
||||
|
Year ended December 31, 2013
|
|||||||||||||||||||
|
Beginning balance at January 1, 2013
|
$
|
—
|
|
$
|
177.7
|
|
$
|
202.5
|
|
$
|
203.7
|
|
$
|
583.9
|
|
||||
|
Actual return on plan assets:
|
|||||||||||||||||||
|
Relating to assets still held at the reporting date
|
—
|
|
2.2
|
|
(5.6
|
)
|
26.3
|
|
22.9
|
|
|||||||||
|
Purchases
|
—
|
|
15.6
|
|
9.5
|
|
—
|
|
25.1
|
|
|||||||||
|
Sales
|
—
|
|
(35.2
|
)
|
(9.0
|
)
|
—
|
|
(44.2
|
)
|
|||||||||
|
Ending balance at December 31, 2013
|
$
|
—
|
|
$
|
160.3
|
|
$
|
197.4
|
|
$
|
230.0
|
|
$
|
587.7
|
|
||||
|
Year ended December 31, 2012
|
|||||||||||||||||||
|
Beginning balance at January 1, 2012
|
$
|
317.6
|
|
$
|
166.1
|
|
$
|
195.5
|
|
$
|
95.7
|
|
$
|
774.9
|
|
||||
|
Actual return on plan assets:
|
|||||||||||||||||||
|
Relating to assets still held at the reporting date
|
—
|
|
4.5
|
|
5.5
|
|
13.2
|
|
23.2
|
|
|||||||||
|
Purchases
|
—
|
|
14.1
|
|
8.8
|
|
94.8
|
|
117.7
|
|
|||||||||
|
Sales
|
(317.6
|
)
|
(7.0
|
)
|
(7.3
|
)
|
—
|
|
(331.9
|
)
|
|||||||||
|
Ending balance at December 31, 2012
|
$
|
—
|
|
$
|
177.7
|
|
$
|
202.5
|
|
$
|
203.7
|
|
$
|
583.9
|
|
||||
There were no transfers between Levels I, II and III during the years ended
December 31, 2014
,
2013
and
2012
. The significant decline in plan assets measured using Level III inputs as of December 31, 2012 was primarily due to the sale of an equity partnership.
Our current funding strategy is to fund an amount at least equal to the minimum required funding as determined under ERISA with consideration of maximum tax deductible amounts. We may elect to make discretionary contributions up to the maximum amount deductible for income tax purposes. For the years ended
December 31, 2014
,
2013
and
2012
, no material contributions were necessary to meet ERISA required funding levels. However, during the years ended
December 31, 2014
,
2013
and
2012
, we made tax deductible discretionary contributions to the pension benefit plans of
$3.6
,
$38.6
and
$34.5
, respectively. Employer contributions to other benefit plans represent discretionary contributions and do not include payments to retirees for current benefits.
-
121
-
Anthem, Inc.
Notes to Consolidated Financial Statements (continued)
Our estimated future payments for pension benefits and postretirement benefits, which reflect expected future service, as appropriate, are as follows:
|
Pension
Benefits
|
Other
Benefits
|
||||||
|
2015
|
$
|
148.8
|
|
$
|
40.8
|
|
|
|
2016
|
152.6
|
|
41.4
|
|
|||
|
2017
|
146.7
|
|
42.4
|
|
|||
|
2018
|
143.4
|
|
43.3
|
|
|||
|
2019
|
142.8
|
|
43.8
|
|
|||
|
2020 – 2024
|
619.3
|
|
213.5
|
|
|||
In addition to the defined benefit plans, we maintain the Anthem 401(k) Plan and CareMore 401(k) Pension Plan which are qualified defined contribution plans covering substantially all employees. Voluntary employee contributions are matched by us subject to certain limitations. Contributions made by us totaled
$111.1
,
$102.5
and
$91.0
during
2014
,
2013
and
2012
, respectively.
11.
Medical Claims Payable
A reconciliation of the beginning and ending balances for medical claims payable for the years ended December 31 is as follows:
|
|
Years Ended December 31
|
||||||||||
|
|
2014
|
2013
|
2012
|
||||||||
|
Gross medical claims payable, beginning of year
|
$
|
6,127.2
|
|
$
|
6,174.5
|
|
$
|
5,489.0
|
|
||
|
Ceded medical claims payable, beginning of year
|
(23.4
|
)
|
(27.2
|
)
|
(16.4
|
)
|
|||||
|
Net medical claims payable, beginning of year
|
6,103.8
|
|
6,147.3
|
|
5,472.6
|
|
|||||
|
Business combinations and purchase adjustments
|
—
|
|
—
|
|
804.4
|
|
|||||
|
Net incurred medical claims:
|
|||||||||||
|
Current year
|
56,305.8
|
|
55,894.3
|
|
48,080.1
|
|
|||||
|
Prior years redundancies
|
(541.9
|
)
|
(599.1
|
)
|
(513.6
|
)
|
|||||
|
Total net incurred medical claims
|
55,763.9
|
|
55,295.2
|
|
47,566.5
|
|
|||||
|
Net payments attributable to:
|
|||||||||||
|
Current year medical claims
|
50,353.9
|
|
49,887.2
|
|
42,832.4
|
|
|||||
|
Prior years medical claims
|
5,420.0
|
|
5,451.5
|
|
4,863.8
|
|
|||||
|
Total net payments
|
55,773.9
|
|
55,338.7
|
|
47,696.2
|
|
|||||
|
Net medical claims payable, end of year
|
6,093.8
|
|
6,103.8
|
|
6,147.3
|
|
|||||
|
Ceded medical claims payable, end of year
|
767.4
|
|
23.4
|
|
27.2
|
|
|||||
|
Gross medical claims payable, end of year
|
$
|
6,861.2
|
|
$
|
6,127.2
|
|
$
|
6,174.5
|
|
||
Amounts incurred related to prior years vary from previously estimated liabilities as the claims are ultimately settled. Liabilities at any period end are continually reviewed and re-estimated as information regarding actual claims payments, or runout, becomes known. This information is compared to the originally
established year end liability. Negative amounts reported for incurred medical claims related to prior years result from claims being settled for amounts less than originally estimated. The prior year redundancy of
$541.9
shown above for the year ended
December 31, 2014
represents an estimate based on paid claim activity from
January 1, 2014
to
December 31, 2014
. Medical claim liabilities are usually described as having a “short tail,” which means that they are generally paid within twelve months of the member receiving service from the provider. Accordingly, the majority of the
$541.9
redundancy relates to claims incurred in calendar year
2013
.
-
122
-
Anthem, Inc.
Notes to Consolidated Financial Statements (continued)
The following table provides a summary of the two key assumptions having the most significant impact on our incurred but not paid liability estimates for the years ended
December 31, 2014
,
2013
and
2012
, which are the completion and trend factors. These two key assumptions can be influenced by utilization levels, unit costs, mix of business, benefit plan designs, provider reimbursement levels, processing system conversions and changes, claim inventory levels, claim processing patterns, claim submission patterns and operational changes resulting from business combinations.
|
|
Favorable Developments
by Changes in Key Assumptions
|
||||||||||
|
|
2014
|
2013
|
2012
|
||||||||
|
Assumed trend factors
|
$
|
(399.5
|
)
|
$
|
(428.4
|
)
|
$
|
(394.4
|
)
|
||
|
Assumed completion factors
|
(142.4
|
)
|
(170.7
|
)
|
(119.2
|
)
|
|||||
|
Total
|
$
|
(541.9
|
)
|
$
|
(599.1
|
)
|
$
|
(513.6
|
)
|
||
The favorable development recognized in
2014
and
2013
resulted primarily from trend factors in late
2013
and late
2012
, respectively, developing more favorably than originally expected as well as a smaller but significant contribution from completion factor development. The favorable development recognized in
2012
was driven by trend factors in late
2011
developing more favorably than originally expected.
12. Debt
Short-term Borrowings
We are a member, through certain subsidiaries, of the Federal Home Loan Bank of Indianapolis, the Federal Home Loan Bank of Cincinnati and the Federal Home Loan Bank of Atlanta, collectively, the FHLBs, and as a member we have the ability to obtain short-term cash advances subject to certain minimum collateral requirements. At
December 31, 2014
and
2013
,
$400.0
was outstanding under our short-term FHLBs borrowings. These outstanding short-term FHLBs borrowings at
December 31, 2014
and
2013
had fixed interest rates of
0.195%
and
0.170%
, respectively.
-
123
-
Anthem, Inc.
Notes to Consolidated Financial Statements (continued)
Long-term Debt
The carrying value of long-term debt at December 31 consists of the following:
|
2014
|
2013
|
||||||
|
Senior unsecured notes:
|
|||||||
|
5.000%, due 2014
|
$
|
—
|
|
$
|
518.0
|
|
|
|
1.250%, due 2015
|
625.0
|
|
624.9
|
|
|||
|
5.250%, due 2016
|
—
|
|
1,109.6
|
|
|||
|
2.375%, due 2017
|
400.1
|
|
399.6
|
|
|||
|
5.875%, due 2017
|
527.7
|
|
545.1
|
|
|||
|
1.875%, due 2018
|
619.0
|
|
614.5
|
|
|||
|
2.300%, due 2018
|
648.0
|
|
647.5
|
|
|||
|
2.250%, due 2019
|
848.2
|
|
—
|
|
|||
|
7.000%, due 2019
|
440.0
|
|
452.9
|
|
|||
|
4.350%, due 2020
|
698.6
|
|
688.9
|
|
|||
|
3.700%, due 2021
|
699.4
|
|
699.4
|
|
|||
|
3.125%, due 2022
|
846.7
|
|
846.3
|
|
|||
|
3.300%, due 2023
|
997.2
|
|
996.9
|
|
|||
|
3.500%, due 2024
|
796.1
|
|
—
|
|
|||
|
5.950%, due 2034
|
447.3
|
|
447.3
|
|
|||
|
5.850%, due 2036
|
772.0
|
|
775.6
|
|
|||
|
6.375%, due 2037
|
644.1
|
|
651.4
|
|
|||
|
5.800%, due 2040
|
208.3
|
|
216.2
|
|
|||
|
4.625%, due 2042
|
893.9
|
|
893.9
|
|
|||
|
4.650%, due 2043
|
994.4
|
|
994.4
|
|
|||
|
4.650%, due 2044
|
798.3
|
|
—
|
|
|||
|
5.100%, due 2044
|
599.2
|
|
599.1
|
|
|||
|
4.850%, due 2054
|
249.4
|
|
—
|
|
|||
|
Senior convertible debentures:
|
|||||||
|
2.750%, due 2042
|
974.4
|
|
966.0
|
|
|||
|
Surplus notes:
|
|||||||
|
9.000%, due 2027
|
24.9
|
|
24.9
|
|
|||
|
Variable rate debt:
|
|||||||
|
Commercial paper program
|
—
|
|
379.2
|
|
|||
|
Total long-term debt
|
14,752.2
|
|
14,091.6
|
|
|||
|
Current portion of long-term debt
|
(625.0
|
)
|
(518.0
|
)
|
|||
|
Long-term debt, less current portion
|
$
|
14,127.2
|
|
$
|
13,573.6
|
|
|
All long-term debt shown above is a direct obligation of Anthem, Inc., except for the surplus notes.
On September 15, 2014, we redeemed the
$500.0
outstanding principal balance of our
5.000%
senior unsecured notes due 2014, plus applicable premium for early redemption and accrued and unpaid interest to the redemption date, for cash totaling
$512.3
. We recognized a loss on extinguishment of debt of
$2.3
for the redemption of these notes.
-
124
-
Anthem, Inc.
Notes to Consolidated Financial Statements (continued)
On September 11, 2014, we redeemed the
$1,097.9
outstanding principal balance of our
5.250%
senior unsecured notes due 2016, plus applicable premium for early redemption and accrued and unpaid interest to the redemption date, for cash totaling
$1,178.2
. We recognized a loss on extinguishment of debt of
$67.6
for the redemption of these notes.
Additionally, during the year ended December 31, 2014, we repurchased
$52.0
of outstanding principal amount of certain other senior unsecured notes, plus applicable premium for early redemption plus accrued and unpaid interest, for cash totaling
$61.0
. We recognized a loss on extinguishment of debt of
$11.2
for the repurchase of these notes.
On August 12, 2014, we issued
$850.0
of
2.250%
notes due 2019,
$800.0
of
3.500%
notes due 2024,
$800.0
of
4.650%
notes due 2044, and
$250.0
of
4.850%
notes due 2054 under our shelf registration statement. We used the proceeds from this offering in part to fund the purchase price of the 5.000% and 5.250% senior unsecured notes discussed above, and the remaining net proceeds are being used for general corporate purposes. Interest on the notes is payable semi-annually in arrears on February 15 and August 15 of each year, commencing on February 15, 2015. The notes have a call feature that allows us to repurchase the notes at any time at our option and a put feature that allows a note holder to require us to repurchase the notes upon the occurrence of both a change in control event and a downgrade of the notes below an investment grade rating.
On September 5, 2013, we redeemed the
$400.0
outstanding principal balance of our
6.000%
senior unsecured notes due 2014, plus applicable premium for early redemption and accrued and unpaid interest to the redemption date, for cash totaling
$411.0
. We recognized a loss on extinguishment of debt of
$10.0
for the redemption of these notes.
On July 30, 2013, we initiated a cash tender offer and consent solicitation to purchase up to
$300.0
aggregate principal amount of our outstanding
5.875%
notes due 2017 and
7.000%
notes due 2019 (the “First Tranche Offer”) and to purchase up to
$300.0
aggregate principal amount of our outstanding
5.950%
notes due 2034,
5.850%
notes due 2036,
6.375%
notes due 2037 and
5.800%
notes due 2040 (the “Second Tranche Offer”), collectively, the “Tender Offers”. The Tender Offers were each subject to increase up to an additional
$100.0
at our election. On
August 12, 2013
, we increased the Second Tranche Offer to
$400.0
and on
August 13, 2013
we repurchased
$300.0
of the First Tranche Offer notes and
400.0
of the Second Tranche Offer notes for cash totaling
$837.7
. Holders who tendered their notes prior to the early tender date received the principal amounts, applicable premium for early redemption and accrued and unpaid interest to the early tender offer settlement date. We recognized a loss on extinguishment of debt of
$135.3
for the repurchase of these notes.
On July 30, 2013, we issued
$650.0
of
2.300%
notes due 2018 and
$600.0
of
5.100%
notes due 2044 under our shelf registration statement. We used the proceeds from this offering in part to fund the purchase price of the 6.000% senior unsecured notes and the Tender Offers, discussed above, and the balance for general corporate purposes. Interest on the notes is payable semi-annually in arrears on January 15 and July 15 of each year, commencing on January 15, 2014. The notes have a call feature that allows us to repurchase the notes at any time at our option and a put feature that allows a note holder to require us to repurchase the notes upon the occurrence of both a change in control event and a downgrade of the notes below an investment grade rating.
On January 25, 2013, we redeemed the outstanding principal balance of
$475.0
of
7.500%
senior unsecured notes due 2019, plus applicable premium for early redemption, for cash totaling
$555.6
. The weighted-average redemption price of the notes was approximately
117%
of the principal amount outstanding.
Surplus notes are unsecured obligations of Anthem Insurance Companies, Inc., or Anthem Insurance, a wholly owned subsidiary, and are subordinate in right of payment to all of Anthem Insurance’s existing and future indebtedness. Any payment of interest or principal on the surplus notes may be made only with the prior approval of the Indiana Department of Insurance, or IDOI, and only out of capital and surplus funds of Anthem Insurance that the IDOI determines to be available for the payment under Indiana insurance laws.
We have a senior credit facility, or the facility, with certain lenders for general corporate purposes. The facility, as amended, provides credit up to
$2,000.0
and matures on
September 29, 2016
. The interest rate on the facility is based on either, (i) the LIBOR rate plus a predetermined percentage rate based on our credit rating at the date of utilization, or (ii) a base rate as defined in the facility agreement plus a predetermined percentage rate based on our credit rating at the date of utilization. Our ability to borrow under the facility is subject to compliance with certain covenants. There were no amounts outstanding under the facility at
December 31, 2014
or
2013
.
-
125
-
Anthem, Inc.
Notes to Consolidated Financial Statements (continued)
We have an authorized commercial paper program of up to
$2,500.0
, the proceeds of which may be used for general corporate purposes. We did not have any borrowings outstanding under our commercial paper program at December 31, 2014. At
December 31, 2013
, we had
$379.2
outstanding under our commercial paper program with a weighted-average interest rate of
0.420%
. Commercial paper borrowings have been classified as long-term debt at
December 31, 2013
as our general practice and intent is to replace short-term commercial paper outstanding at expiration with additional short-term commercial paper for an uninterrupted period extending for more than one year and we have the ability to redeem our commercial paper with borrowings under the senior credit facility described above. We resumed borrowing under our commercial paper program in the first quarter of 2015.
Convertible Debentures
On October 9, 2012, we issued
$1,500.0
of senior convertible debentures, or the Debentures. The Debentures are governed by an indenture, or the Indenture, dated as of October 9, 2012 between us and The Bank of New York Mellon Trust Company, N.A., as trustee. The Debentures bear interest at a rate of
2.750%
per year, payable semi-annually in arrears in cash on April 15 and October 15 of each year, and mature on October 15, 2042, unless earlier redeemed, repurchased or converted into shares of common stock at the applicable conversion rate. The Debentures also have a contingent interest feature that will require us to pay additional interest based on certain thresholds and for certain events, as defined in the Indenture, beginning on October 15, 2022.
Holders may convert their Debentures at their option prior to the close of business on the business day immediately preceding April 15, 2042, only under the following circumstances: (1) during any fiscal quarter commencing after the fiscal quarter ended December 31, 2012, if the last reported sale price of our common stock for at least
20
trading days during a period of
30
consecutive trading days ending on the last trading day of the preceding fiscal quarter is greater than or equal to
130%
of the applicable conversion price on each applicable trading day; (2) during the
five
business day period after any
10
consecutive trading day period, or the measurement period, in which the trading price per
$1,000
(whole dollars) principal amount of Debentures for each trading day of that measurement period was less than
98%
of the product of the last reported sale price of our common stock and the applicable conversion rate on each such day; (3) if we call any or all of the Debentures for redemption, at any time prior to the close of business on the third scheduled trading day prior to the redemption date; or (4) upon the occurrence of specified corporate events, as defined in the Indenture. On and after
April 15, 2042
and until the close of business on the third scheduled trading day immediately preceding the Debentures’ maturity date of
October 15, 2042
, holders may convert their Debentures into common stock at any time irrespective of the preceding circumstances. The Debentures are redeemable at our option at any time on or after
October 20, 2022
, upon the occurrence of certain events, as defined in the Indenture.
Upon conversion of the Debentures, we will deliver cash up to the aggregate principal amount of the Debentures converted. With respect to any conversion obligation in excess of the aggregate principal amount of the Debentures converted, we have the option to settle the excess with cash, shares of our common stock or a combination of cash and shares of common stock based on a daily conversion value, determined in accordance with the Indenture. The initial conversion rate for the Debentures will be
13.2319
shares of our common stock per
$1,000
(whole dollars) of principal amount of Debentures, which represents a
25%
conversion premium based on the closing price of
$60.46
per share of our common stock on October 2, 2012 (the date the Debentures’ terms were finalized) and is equivalent to an initial conversion price of
$75.575
per share of our common stock. As of
December 31, 2014
, our common stock was last traded at a price of
$125.67
per share. If the Debentures had been converted or matured at
December 31, 2014
, we would be obligated to pay the principal of the Debentures plus an amount in cash or shares equal to
$1,019.3
. The Debentures and underlying shares of our common stock have not been and will not be registered under the Securities Act of 1933, as amended, or the Securities Act, or any state securities laws and may not be offered or sold in the United States absent registration or an applicable exemption from registration requirements. The Debentures were offered and sold to qualified institutional buyers pursuant to Rule 144A under the Securities Act, the restrictions for which expired in October 2013. We used approximately
$371.0
of the net proceeds from the issuance to repurchase shares of our common stock concurrently with the offering of the Debentures, and the remaining balance was used for general corporate purposes, including but not limited to additional purchases of shares of our common stock pursuant to our share repurchase program and the repayment of short-term and/or long-term debt.
We have accounted for the Debentures in accordance with the cash conversion guidance in FASB guidance for debt with conversion and other options. As a result, the value of the embedded conversion option has been bifurcated from its debt host
-
126
-
Anthem, Inc.
Notes to Consolidated Financial Statements (continued)
and recorded as a component of “additional paid-in capital” (net of deferred taxes and equity issuance costs) in our consolidated balance sheet.
The following table summarizes at
December 31, 2014
the related balances, conversion rate and conversion price of the Debentures:
|
Outstanding principal amount
|
$
|
1,500.0
|
|
|
Unamortized debt discount
|
$
|
525.6
|
|
|
Net debt carrying amount
|
$
|
974.4
|
|
|
Equity component carrying amount
|
$
|
543.6
|
|
|
Conversion rate (shares of common stock per $1,000 of principal amount)
|
13.3645
|
|
|
|
Effective conversion price (per $1,000 of principal amount)
|
$
|
74.8244
|
|
The remaining amortization period of the unamortized debt discount as of
December 31, 2014
is approximately
28 years
. The unamortized discount will be amortized into interest expense using the effective interest method based on an effective interest rate of
5.130%
, which represents the market interest rate for a comparable debt instrument that does not have a conversion feature. During the year ended
December 31, 2014
, we recognized
$49.6
of interest expense related to the Debentures, of which
$41.2
represented interest expense recognized at the stated interest rate of
2.750%
and
$8.4
represented interest expense resulting from amortization of the debt discount.
Total interest paid during
2014
,
2013
and
2012
was $
575.9
,
$597.2
, and
$479.1
, respectively.
We were in compliance with all applicable covenants under all of our outstanding debt agreements at
December 31, 2014
.
Future maturities of all long-term debt outstanding at
December 31, 2014
are as follows: 2015,
$625.0
; 2016,
$0.0
; 2017,
$927.8
; 2018,
$1,267.0
; 2019,
$1,288.2
and thereafter,
$10,644.2
.
13. Commitments and Contingencies
Litigation
In the ordinary course of business, we are defendants in, or parties to, a number of pending or threatened legal actions or proceedings. To the extent a plaintiff or plaintiffs in the following cases have specified in their complaint or in other court filings the amount of damages being sought, we have noted those alleged damages in the descriptions below. With respect to the cases described below, we contest liability and/or the amount of damages in each matter and believe we have meritorious defenses.
We are defending a certified class action filed as a result of the 2001 demutualization of Anthem Insurance. The lawsuit names Anthem Insurance as well as Anthem, Inc. and is captioned
Ronald Gold, et al. v. Anthem, Inc. et al.
Anthem Insurance’s 2001 Plan of Conversion, or the Plan, provided for the conversion of Anthem Insurance from a mutual insurance company into a stock insurance company pursuant to Indiana law. Under the Plan, Anthem Insurance distributed the fair value of the company at the time of conversion to its Eligible Statutory Members, or ESMs, in the form of cash or Anthem common stock in exchange for their membership interests in the mutual company. Plaintiffs in
Gold
allege that Anthem Insurance distributed value to the wrong ESMs. Cross motions for summary judgment were granted in part and denied in part on July 26, 2006 with regard to the issue of sovereign immunity asserted by co-defendant, the state of Connecticut, or the State. The trial court also denied our motion for summary judgment as to plaintiffs’ claims on January 10, 2005. The State appealed the denial of its motion to the Connecticut Supreme Court. We filed a cross-appeal on the sovereign immunity issue. On May 11, 2010, the Supreme Court reversed the judgment of the trial court denying the State’s motion to dismiss the plaintiff’s claims under sovereign immunity and dismissed our cross-appeal. The case was remanded to the trial court for further proceedings. Plaintiffs’ motion for class certification was granted on December 15, 2011. We and the plaintiffs filed renewed cross-motions for summary judgment on January 24, 2013. On August 19, 2013, the trial court denied plaintiffs' motion for summary judgment. The trial court deferred a final ruling on our motion for summary judgment. On March 6, 2014, the trial court denied our motion for summary judgment finding that an issue of material fact
-
127
-
Anthem, Inc.
Notes to Consolidated Financial Statements (continued)
existed. A trial on liability commenced on October 14, 2014 and concluded on October 16, 2014. The matter was taken under advisement by the trial court, which has requested post-trial briefing. We expect the trial court to issue its decision on liability sometime in 2015. We intend to vigorously defend the
Gold
lawsuit; however, its ultimate outcome cannot be presently determined.
We are currently a defendant in
eleven
putative class actions relating to out-of-network, or OON, reimbursement that were consolidated into a single multi-district lawsuit called
In re WellPoint, Inc. (n/k/a Anthem, Inc.) Out-of-Network “UCR” Rates Litigation
that is pending in the United States District Court for the Central District of California. The lawsuits were filed in 2009. The plaintiffs include current and former members on behalf of a putative class of members who received OON services for which the defendants paid less than billed charges, the American Medical Association, four state medical associations, OON physicians, OON non-physician providers, the American Podiatric Medical Association, California Chiropractic Association and the California Psychological Association on behalf of putative classes of OON physicians and all OON non-physician health care providers. The plaintiffs have filed several amended complaints alleging that the defendants violated the Racketeer Influenced and Corrupt Organizations Act, or RICO, the Sherman Antitrust Act, ERISA, federal regulations, and state law by using an OON reimbursement database called Ingenix and by using non-Ingenix OON reimbursement methodologies. We have filed motions to dismiss in response to each of those amended complaints. Our motions to dismiss have been granted in part and denied in part by the court. The most recent pleading filed by the plaintiffs is a Fourth Amended Complaint to which we filed a motion to dismiss most, but not all, of the claims. In July 2013 the court issued an order granting in part and denying in part our motion. The court held that the state and federal anti-trust claims along with the RICO claims should be dismissed in their entirety with prejudice. The court further found that the ERISA claims, to the extent they involved non-Ingenix methodologies, along with those that involved our alleged non-disclosures should be dismissed with prejudice. The court also dismissed most of the plaintiffs’ state law claims with prejudice. The only claims that remain after the court’s decision are an ERISA benefits claim relating to claims priced based on Ingenix, a breach of contract claim on behalf of one subscriber plaintiff, a breach of implied covenant claim on behalf of one subscriber plaintiff, and one subscriber plaintiff’s claim under the California Unfair Competition Law. The plaintiffs filed a motion for reconsideration of the motion to dismiss order, which the court granted in part and denied in part. The court ruled that the plaintiffs adequately allege that one Georgia provider plaintiff is deemed to have exhausted administrative remedies regarding non-Ingenix methodologies based on the facts alleged regarding that plaintiff so those claims are back in the case. Fact discovery is complete. The plaintiffs filed a motion for class certification in November 2013 seeking the following classes: (1) a subscriber ERISA class as to OON claims processed using the Ingenix database as the pricing methodology; (2) a physician provider class as to OON claims processed using Ingenix; (3) a non-physician provider class as to OON claims processed using Ingenix; (4) a provider ERISA class as to OON claims processed using non-Ingenix pricing methodologies; (5) a California subscriber breach of contract/unfair competition class; and (6) a subscriber breach of implied covenant class for all Anthem states except California. Following expert discovery and briefing, oral argument was held on the motion. In late 2014, the court denied the plaintiffs' motion for class certification in its entirety. The California subscriber plaintiffs are seeking leave to file a renewed motion for class certification with more narrowly defined proposed classes. We will oppose their request. Earlier in the case, in 2009, we filed a motion in the United States District Court for the Southern District of Florida, or the Florida Court, to enjoin the claims brought by the physician plaintiffs and certain medical association plaintiffs based on prior litigation releases, which was granted in 2011. The Florida Court ordered those plaintiffs to dismiss their claims that are barred by the release. The plaintiffs then filed a petition for declaratory judgment asking the court to find that these claims are not barred by the releases from the prior litigation. We filed a motion to dismiss the declaratory judgment action, which was granted. The plaintiffs appealed the dismissal of the declaratory judgment to the United States Court of Appeals for the Eleventh Circuit, but the dismissal was upheld. The enjoined physicians and some the medical associations did not dismiss their barred claims. The Florida Court found those enjoined plaintiffs in contempt and sanctioned them in July 2012. Those plaintiffs appealed the Florida Court’s sanctions order to the United States Court of Appeals for the Eleventh Circuit. The Eleventh Circuit upheld the Florida court’s enforcement of the injunction as it relates to the plaintiffs’ RICO and antitrust claims, but vacated it as it relates to certain ERISA claims. The plaintiffs filed a petition for rehearing en banc as to the antitrust claims only, which was denied. The plaintiffs then filed a petition for writ of certiorari with the U.S. Supreme Court. The American Medical Association filed an amicus brief in support of the petition. We filed a response in opposition to the petition and the plaintiffs filed a reply. The petition is now full briefed and we are awaiting a ruling from the U.S Supreme Court. We intend to vigorously defend these suits; however, their ultimate outcome cannot be presently determined.
-
128
-
Anthem, Inc.
Notes to Consolidated Financial Statements (continued)
We are a defendant in multiple lawsuits that were initially filed in 2012 against the BCBSA as well as Blue Cross and/or Blue Shield licensees across the country. The cases were consolidated into a single multi-district lawsuit called
In re Blue Cross Blue Shield Antitrust Litigation
that is pending in the United States District Court for the Northern District of Alabama. Generally, the suits allege that the BCBSA and the Blue plans have engaged in a conspiracy to horizontally allocate geographic markets through license agreements and other arrangements in violation of the Sherman Antitrust Act and related state laws. The cases were brought by two putative nationwide classes of plaintiffs, health plan subscribers and providers. Subscriber and provider plaintiffs each filed consolidated amended complaints on July 1, 2013. The consolidated amended subscriber complaint was also brought on behalf of putative state classes of health plan subscribers in Alabama, Arkansas, California, Florida, Hawaii, Illinois, Louisiana, Michigan, Mississippi, Missouri, New Hampshire, North Carolina, Pennsylvania, Rhode Island, South Carolina, Tennessee, and Texas. Defendants filed motions to dismiss in September 2013, which were argued in April 2014. In June 2014, the court denied the majority of the motions, ruling that plaintiffs had alleged sufficient facts at this stage of the litigation to avoid dismissal of their claims. Following the subsequent filing of amended complaints by each of the subscriber and provider plaintiffs, we filed our answer and asserted our affirmative defenses in December 2014. Discovery has commenced. We intend to vigorously defend these suits; however, their ultimate outcome cannot be presently determined.
Where available information indicates that it is probable that a loss has been incurred as of the date of the consolidated financial statements and we can reasonably estimate the amount of that loss, we accrue the estimated loss by a charge to income. In many proceedings, however, it is difficult to determine whether any loss is probable or reasonably possible. In addition, even where loss is possible or an exposure to loss exists in excess of the liability already accrued with respect to a previously identified loss contingency, it is not always possible to reasonably estimate the amount of the possible loss or range of loss.
With respect to many of the proceedings to which we are a party, we cannot provide an estimate of the possible losses, or the range of possible losses in excess of the amount, if any, accrued, for various reasons, including but not limited to some or all of the following: (i) there are novel or unsettled legal issues presented, (ii) the proceedings are in early stages, (iii) there is uncertainty as to the likelihood of a class being certified or decertified or the ultimate size and scope of the class, (iv) there is uncertainty as to the outcome of pending appeals or motions, (v) there are significant factual issues to be resolved, and/or (vi) in many cases, the plaintiffs have not specified damages in their complaint or in court filings. For those legal proceedings where a loss is probable, or reasonably possible, and for which it is possible to reasonably estimate the amount of the possible loss or range of losses, we currently believe that the range of possible losses, in excess of established reserves, for all of those proceedings is from
$0
to approximately
$250.0
at
December 31, 2014
. This estimated aggregate range of reasonably possible losses is based upon currently available information taking into account our best estimate of such losses for which such an estimate can be made.
Data Breach
In February 2015, we reported that we were the target of a sophisticated external cyber attack. The attackers gained unauthorized access to certain of our information technology systems and obtained personal information related to many of our current and former members and employees, such as names, birthdays, health care identification/social security numbers, street addresses, email addresses and employment information, including income data. To date, there is no evidence that credit card or medical information, such as claims, test results or diagnostic codes, were targeted, accessed or obtained, although no assurance can be given that we will not identify additional information that was accessed or obtained.
Currently, we are in the process of determining the extent of this cyber attack and supporting federal law enforcement efforts to identify the responsible parties. Upon discovery of the cyber attack, we took immediate action to remediate the security vulnerability and retained a cybersecurity firm to evaluate our systems and identify solutions based on the evolving landscape. We will provide credit monitoring and identity protection services to those who have been affected by this cyber attack. While the cyber attack did not have an impact on our business, cash flows, financial condition and results of operations for the year ended December 31, 2014, we have incurred expenses subsequent to the cyber attack to investigate and remediate this matter and expect to continue to incur expenses of this nature in the foreseeable future. Although we are unable to quantify the ultimate magnitude of such expenses at this time, they may be significant. We will recognize these expenses in the periods in which they are incurred.
-
129
-
Anthem, Inc.
Notes to Consolidated Financial Statements (continued)
Actions have been filed in courts in many states and other claims have been or may be asserted against us on behalf of current or former members, current or former employees, shareholders or others seeking damages or other related relief, allegedly arising out of the cyber attack. State and federal agencies, including state insurance regulators, state attorneys general, and the Federal Bureau of Investigations, are investigating events related to the cyber attack, including how it occurred, its consequences and our responses. Although we are cooperating in these investigations, we may be subject to fines or other obligations, which may have an adverse effect on how we operate our business and our results of operations.
We have contingency plans and insurance coverage for potential liabilities of this nature, however, the coverage may not be sufficient to cover all claims and liabilities. While a loss from these matters is reasonably possible, we cannot reasonably estimate a range of possible losses because our investigation into the matter is ongoing, the proceedings remain in the early stages, alleged damages have not been specified, there is uncertainty as to the likelihood of a class or classes being certified or the ultimate size of any class if certified, and there are significant factual and legal issues to be resolved.
Other Contingencies
From time to time, we and certain of our subsidiaries are parties to various legal proceedings, many of which involve claims for coverage encountered in the ordinary course of business. We, like HMOs and health insurers generally, exclude certain health care and other services from coverage under our HMO, PPO and other plans. We are, in the ordinary course of business, subject to the claims of our enrollees arising out of decisions to restrict or deny reimbursement for uncovered services. The loss of even one such claim, if it results in a significant punitive damage award, could have a material adverse effect on us. In addition, the risk of potential liability under punitive damage theories may increase significantly the difficulty of obtaining reasonable settlements of coverage claims.
In addition to the lawsuits described above, we are also involved in other pending and threatened litigation of the character incidental to our business, and are from time to time involved as a party in various governmental investigations, audits, reviews and administrative proceedings. These investigations, audits, reviews and administrative proceedings include routine and special inquiries by state insurance departments, state attorneys general, the U.S. Attorney General and subcommittees of the U.S. Congress. Such investigations, audits, reviews and administrative proceedings could result in the imposition of civil or criminal fines, penalties, other sanctions and additional rules, regulations or other restrictions on our business operations. Any liability that may result from any one of these actions, or in the aggregate, could have a material adverse effect on our consolidated financial position or results of operations.
The National Organization of Life & Health Insurance Guaranty Associations, or NOLHGA, is a voluntary organization consisting of the state life and health insurance guaranty associations located throughout the U.S. Such associations, working together with NOLHGA, provide a safety net for their state’s policyholders, ensuring that they continue to receive coverage, subject to state maximum limits, even if their insurer is declared insolvent. We are aware that the Pennsylvania Insurance Commissioner, or Insurance Commissioner, has placed Penn Treaty Network America Insurance Company and its subsidiary American Network Insurance Company, or collectively Penn Treaty, in rehabilitation, an intermediate action before insolvency. The state court denied the Insurance Commissioner’s petition for the liquidation of Penn Treaty and ordered the Insurance Commissioner to file an updated plan of rehabilitation. An initial plan was filed on April 30, 2013. The Insurance Commissioner filed an amended plan on August 8, 2014 and a second amended plan on October 8, 2014. The state court set a schedule for a notice and comment period and ordered a hearing on the second amended plan, with public comments due by February 13, 2015. The Insurance Commissioner has filed a Notice of Appeal asking the Pennsylvania Supreme Court to reverse the order denying the liquidation petition. The Supreme Court held oral argument on the appeal in September 2014. In the event rehabilitation of Penn Treaty is unsuccessful and Penn Treaty is declared insolvent and placed in liquidation, we and other insurers may be required to pay a portion of their policyholder claims through state guaranty association assessments in future periods. Given the uncertainty around whether Penn Treaty will ultimately be declared insolvent and, if so, the amount of the insolvency, the amount and timing of any associated future guaranty fund assessments, and the availability and amount of any potential premium tax and other offsets, we currently cannot estimate our net exposure, if any, to this potential insolvency. We will continue to monitor the situation and may record a liability and expense in future reporting periods, which could be material to our cash flows and results of operations.
-
130
-
Anthem, Inc.
Notes to Consolidated Financial Statements (continued)
Contractual Obligations and Commitments
We are a party to an agreement with Express Scripts, Inc., or Express Scripts,
whereby Express Scripts is the exclusive provider of
pharmacy benefit management, or PBM,
services to our plans, excluding some Amerigroup subsidiaries and certain self-insured members, which have exclusive agreements with different PBM service providers. It is expected that those Amerigroup subsidiaries will complete their transition to the Express Scripts agreement during 2015.
The initial term of this agreement expires on December 31, 2019. Under this agreement, Express Scripts is the exclusive provider of certain specified PBM services, such as
pharmacy network management, home delivery, pharmacy customer service, claims processing, rebate management, drug utilization and specialty pharmaceutical management services. Accordingly, the agreement contains certain financial and operational requirements obligating both Express Scripts and us.
Express Scripts’ primary obligations relate to the performance of such services and meeting certain pricing guarantees and performance standards. Our primary obligations relate to oversight, provision of data, payment for services and certain minimum volume requirements. The failure by either party to meet the respective requirements could potentially serve as a basis for financial penalties or early termination of the contract. We believe we have appropriately recognized all rights and obligations under this contract at
December 31, 2014
.
During
December 2014
, we entered into a new agreement with International Business Machines Corporation to provide information technology infrastructure services. This new agreement supersedes certain prior agreements and also includes provisions for additional services. Our remaining commitment under this agreement at
December 31, 2014
was
$475.3
through
March 31, 2020
. We have the ability to terminate this agreement upon the occurrence of certain events, subject to early termination fees.
On March 31, 2009
, we entered into an agreement with Affiliated Computer Services, Inc. to provide certain print and mailroom services that were previously performed in-house. Our remaining commitment under this agreement at
December 31, 2014
was
$78.6
through
March 31, 2016
. We have the ability to terminate this agreement upon the occurrence of certain events, subject to early termination fees.
Vulnerability from Concentrations
Financial instruments that potentially subject us to concentrations of credit risk consist primarily of cash equivalents, investment securities, premium receivables and instruments held through hedging activities. All investment securities are managed by professional investment managers within policies authorized by our Board of Directors. Such policies limit the amounts that may be invested in any one issuer and prescribe certain investee company criteria. Concentrations of credit risk with respect to premium receivables are limited due to the large number of employer groups that constitute our customer base in the states in which we conduct business. As of
December 31, 2014
, there were no significant concentrations of financial instruments in a single investee, industry or geographic location.
14. Capital Stock
Stock Incentive Plan
s
Our Board of Directors has adopted the Anthem Incentive Compensation Plan, or Incentive Compensation Plan, which has been approved by our shareholders. The term of the Incentive Compensation Plan is such that no awards may be granted on or after May 20, 2019. The Incentive Compensation Plan gives authority to the Compensation Committee of the Board of Directors to make incentive awards to our non-employee directors, employees and consultants, consisting of stock options, stock, restricted stock, restricted stock units, cash-based awards, stock appreciation rights, performance shares and performance units. The Incentive Compensation Plan, as amended and restated, limits the number of available shares for issuance to
60.1
shares, subject to adjustment as set forth in the Incentive Compensation Plan.
Stock options are granted for a fixed number of shares with an exercise price at least equal to the fair value of the shares at the grant date. Stock options vest over
three
years in equal semi-annual installments and generally have a term of
seven
years from the grant date.
Certain option grants contain provisions whereby the employee continues to vest in the award subsequent to termination due to retirement. Our attribution method for newly granted awards considers all vesting and other provisions, including retirement eligibility, in determining the requisite service period over which the fair value of the awards will be recognized.
-
131
-
Anthem, Inc.
Notes to Consolidated Financial Statements (continued)
Restricted stock awards are issued at the fair value of the stock on the grant date and may also include one or more performance measures that must be met for the restricted stock award to vest. The restrictions lapse in three equal annual installments.
For the years ended
December 31, 2014
,
2013
and
2012
, we recognized share-based compensation expense of
$168.9
,
$146.0
and
$146.5
, respectively, as well as related tax benefits of
$60.7
,
$52.6
and
$52.0
, respectively.
A summary of stock option activity for the year ended
December 31, 2014
is as follows:
|
Number of
Shares
|
Weighted-Average
Option Price per
Share
|
Weighted-Average
Remaining
Contractual Life
(Years)
|
Aggregate
Intrinsic
Value
|
|||||||||
|
Outstanding at January 1, 2014
|
10.0
|
|
$
|
65.38
|
|
|||||||
|
Granted
|
1.8
|
|
90.32
|
|
||||||||
|
Exercised
|
(4.2
|
)
|
67.26
|
|
||||||||
|
Forfeited or expired
|
(0.3
|
)
|
69.30
|
|
||||||||
|
Outstanding at December 31, 2014
|
7.3
|
|
70.30
|
|
3.54
|
$
|
402.0
|
|
||||
|
Exercisable at December 31, 2014
|
4.8
|
|
65.94
|
|
2.46
|
$
|
286.8
|
|
||||
The intrinsic value of options exercised during the years ended
December 31, 2014
,
2013
and
2012
amounted to
$156.7
,
$176.0
and
$65.4
, respectively. We recognized tax benefits of
$53.2
,
$56.8
and
$22.9
in
2014
,
2013
and
2012
, respectively, from option exercises and disqualifying dispositions. During the years ended
December 31, 2014
,
2013
and
2012
we received cash of
$283.6
,
$524.7
and
$110.8
, respectively, from exercises of stock options.
The total fair value of restricted stock awards that vested during the years ended
December 31, 2014
,
2013
and
2012
was
$174.0
,
$46.7
and
$222.3
, respectively.
A summary of the status of nonvested restricted stock activity, including restricted stock units, for the year ended
December 31, 2014
is as follows:
|
Restricted
Stock Shares
and Units
|
Weighted-Average
Grant Date
Fair Value
per Share
|
|||||
|
Nonvested at January 1, 2014
|
4.2
|
|
$
|
63.83
|
|
|
|
Granted
|
1.7
|
|
90.53
|
|
||
|
Vested
|
(1.9
|
)
|
64.10
|
|
||
|
Forfeited
|
(0.4
|
)
|
68.71
|
|
||
|
Nonvested at December 31, 2014
|
3.6
|
|
75.63
|
|
||
During the year ended
December 31, 2014
, we granted approximately
0.7
restricted stock units under the Incentive Compensation Plan that were contingent upon us achieving specified operating gain targets for
2014
. We expect to issue approximately
1.0
restricted stock units under this performance plan as certain performance targets were exceeded. These restricted stock units have been included in the activity shown above.
As of
December 31, 2014
, the total remaining unrecognized compensation expense related to nonvested stock options and restricted stock amounted to
$14.0
and
$76.9
, respectively, which will be amortized over the weighted-average remaining requisite service periods of
11 months
and
10 months
, respectively.
As of
December 31, 2014
, there were approximately
21.2
shares of common stock available for future grants under the Incentive Compensation Plan.
-
132
-
Anthem, Inc.
Notes to Consolidated Financial Statements (continued)
Fair Value
We use a binomial lattice valuation model to estimate the fair value of all stock options granted. Expected volatility assumptions used in the binomial lattice model are based on an analysis of implied volatilities of publicly traded options on our stock and historical volatility of our stock price. The risk-free interest rate is derived from the U.S. Treasury strip rates at the time of the grant. The expected term of the options was derived from the outputs of the binomial lattice model, which incorporates post-vesting forfeiture assumptions based on an analysis of historical data. The dividend yield was based on our estimate of future dividend yields. Similar groups of employees that have dissimilar exercise behavior are considered separately for valuation purposes. We utilize the “multiple-grant” approach for recognizing compensation expense associated with each separately vesting portion of the share-based award.
The following weighted-average assumptions were used to estimate the fair values of options granted during the years ended December 31:
|
2014
|
2013
|
2012
|
||||||
|
Risk-free interest rate
|
2.16
|
%
|
1.25
|
%
|
1.41
|
%
|
||
|
Volatility factor
|
35.00
|
%
|
35.00
|
%
|
34.00
|
%
|
||
|
Dividend yield (annual)
|
2.00
|
%
|
2.40
|
%
|
1.60
|
%
|
||
|
Weighted-average expected life (years)
|
3.75
|
|
4.00
|
|
4.10
|
|
||
The following weighted-average fair values were determined for the years ending December 31:
|
2014
|
2013
|
2012
|
|||||||||
|
Options granted during the year
|
$
|
22.41
|
|
$
|
14.64
|
|
$
|
16.50
|
|
||
|
Restricted stock and stock awards granted during the year
|
90.53
|
|
63.06
|
|
65.91
|
|
|||||
The binomial lattice option-pricing model requires the input of highly subjective assumptions including the expected stock price volatility. Because our stock option grants have characteristics significantly different from those of traded options, and because changes in the subjective input assumptions can materially affect the fair value estimate, in our opinion, existing models do not necessarily provide a reliable single measure of the fair value of our stock option grants.
Employee Stock Purchase Plan
We have registered
14.0
shares of common stock for the Employee Stock Purchase Plan, or the Stock Purchase Plan, which is intended to provide a means to encourage and assist employees in acquiring a stock ownership interest in Anthem. The Stock Purchase Plan was suspended during 2012 and 2013 and no shares were issued during those years. Effective January 1, 2014, the Stock Purchase Plan was reinstated. Pursuant to terms of the Stock Purchase Plan, an employee is permitted to purchase no more than
$25,000
(actual dollars) worth of stock in any calendar year, based on the fair value of the stock at the end of each plan quarter. Employees become participants by electing payroll deductions from
1%
to
15%
of gross compensation. Once purchased, the stock is accumulated in the employee's investment account. The Stock Purchase Plan allows participants to purchase shares of our common stock at a price per share of
95%
of the fair value of a share of common stock on the last trading day of the plan quarter. The employee stock purchase plan discount is not recognized as compensation expense based on GAAP guidance. There were
0.2
shares issued during the year ended
December 31, 2014
. As of
December 31, 2014
,
5.9
shares were available for issuance under the Stock Purchase Plan.
Use of Capital and Stock Repurchase Program
We regularly review the appropriate use of capital, including common stock and debt security repurchases and dividends to shareholders. The declaration and payment of any dividends or repurchases of our common stock or debt are at the discretion of our Board of Directors and depend upon our financial condition, results of operations, future liquidity needs, regulatory and capital requirements and other factors deemed relevant by our Board of Directors. Historically our common stock repurchase program, discussed below, has been our primary use of capital. Beginning in 2011, our Board of Directors established a quarterly dividend to shareholders.
-
133
-
Anthem, Inc.
Notes to Consolidated Financial Statements (continued)
A summary of the cash dividend activity for the years ended
December 31, 2014
and
2013
is as follows:
|
Declaration Date
|
Record Date
|
Payment Date
|
Cash Dividend per
Share
|
Total
|
||||||||
|
Year ended December 31, 2014
|
||||||||||||
|
January 28, 2014
|
March 10, 2014
|
March 25, 2014
|
$
|
0.4375
|
|
$
|
123.4
|
|
||||
|
April 29, 2014
|
June 10, 2014
|
June 25, 2014
|
0.4375
|
|
120.5
|
|
||||||
|
July 29, 2014
|
|
September 10, 2014
|
|
September 25, 2014
|
0.4375
|
|
119.2
|
|
||||
|
October 28, 2014
|
December 5, 2014
|
December 22, 2014
|
0.4375
|
|
117.6
|
|
||||||
|
Year ended December 31, 2013
|
||||||||||||
|
February 20, 2013
|
March 8, 2013
|
March 25, 2013
|
$
|
0.3750
|
|
$
|
113.4
|
|
||||
|
May 15, 2013
|
June 10, 2013
|
June 25, 2013
|
0.3750
|
|
112.7
|
|
||||||
|
July 23, 2013
|
September 10, 2013
|
September 25, 2013
|
0.3750
|
|
111.4
|
|
||||||
|
October 22, 2013
|
December 9, 2013
|
December 23, 2013
|
0.3750
|
|
110.5
|
|
||||||
On
January 27, 2015
, the Board of Directors declared a quarterly cash dividend to shareholders of
$0.6250
per share on the outstanding shares of our common stock. This quarterly dividend will be paid on
March 25, 2015
to the shareholders of record as of
March 10, 2015
.
Under our Board of Directors’ authorization, we maintain a common stock repurchase program. On October 2, 2014, the Board of Directors authorized a
$5,000.0
increase to the common stock repurchase program. Repurchases may be made from time to time at prevailing market prices, subject to certain restrictions on volume, pricing and timing. The repurchases are effected from time to time in the open market, through negotiated transactions, including accelerated share repurchase agreements, and through plans designed to comply with Rule 10b5-1 under the Securities Exchange Act of 1934, as amended. Our stock repurchase program is discretionary as we are under no obligation to repurchase shares. We repurchase shares under the program when we believe it is a prudent use of capital. The excess cost of the repurchased shares over par value is charged on a pro rata basis to additional paid-in capital and retained earnings.
A summary of common stock repurchases for the period January 1, 2015 through February 5, 2015 (subsequent to
December 31, 2014
) and for the years ended
December 31, 2014
and
2013
is as follows:
|
January 1, 2015
through February 5, 2015 |
Years Ended December 31
|
||||||||||
|
|
2014
|
2013
|
|||||||||
|
Shares repurchased
|
1.8
|
|
30.4
|
|
20.7
|
|
|||||
|
Average price per share
|
$
|
131.16
|
|
$
|
98.52
|
|
$
|
78.08
|
|
||
|
Aggregate cost
|
$
|
229.9
|
|
$
|
2,998.8
|
|
$
|
1,620.1
|
|
||
|
Authorization remaining at the end of each period
|
$
|
5,461.8
|
|
$
|
5,691.7
|
|
$
|
3,691.0
|
|
||
During 2013, we purchased call options on
3.0
shares of our common stock. The call options allow us to repurchase shares at a predetermined strike price up through the expiration dates. The purpose of the call options is to reduce share price volatility on potential future common stock repurchases. The aggregate premium paid was
$25.8
, of which
$7.9
was recorded as a reduction of shareholders' equity and the remaining
$17.9
was recorded as a derivative asset based on FASB guidance. The aggregate premium is reported in financing activities in our consolidated statements of cash flow. The call options had strike prices ranging from
$77.50
to
$83.10
per share. The aggregate fair value of the call options reported as a derivative asset was
$27.5
at December 31, 2013. The call options were exercised on various dates throughout January and February 2014.
Under the common stock repurchase program authorized by our Board of Directors, on February 4, 2014, we entered into an accelerated share repurchase agreement with a counterparty. The agreement provided for the repurchase of a number
-
134
-
Anthem, Inc.
Notes to Consolidated Financial Statements (continued)
of our shares, equal to
$600.0
, as determined by the dollar volume weighted-average share price during the term of the agreement. In March 2014, we repurchased
6.6
shares under the agreement.
For additional information regarding the use of capital for debt security repurchases, see Note 12, "Debt."
15. Accumulated Other Comprehensive Income
A reconciliation of the components of accumulated other comprehensive income at December 31 is as follows:
|
2014
|
2013
|
||||||
|
Investments:
|
|||||||
|
Gross unrealized gains
|
$
|
1,154.9
|
|
$
|
1,054.2
|
|
|
|
Gross unrealized losses
|
(196.8
|
)
|
(277.8
|
)
|
|||
|
Net pretax unrealized gains
|
958.1
|
|
776.4
|
|
|||
|
Deferred tax liability
|
(330.5
|
)
|
(267.4
|
)
|
|||
|
Net unrealized gains on investments
|
627.6
|
|
509.0
|
|
|||
|
Non-credit components of OTTI on investments:
|
|||||||
|
Gross unrealized losses
|
(6.8
|
)
|
(0.8
|
)
|
|||
|
Deferred tax asset
|
2.4
|
|
0.3
|
|
|||
|
Net unrealized non-credit component of OTTI on investments
|
(4.4
|
)
|
(0.5
|
)
|
|||
|
Cash flow hedges:
|
|||||||
|
Gross unrealized losses
|
(55.2
|
)
|
(49.7
|
)
|
|||
|
Deferred tax asset
|
19.3
|
|
17.4
|
|
|||
|
Net unrealized losses on cash flow hedges
|
(35.9
|
)
|
(32.3
|
)
|
|||
|
Defined benefit pension plans:
|
|||||||
|
Deferred net actuarial loss
|
(563.7
|
)
|
(427.2
|
)
|
|||
|
Deferred prior service credits
|
2.2
|
|
3.0
|
|
|||
|
Deferred tax asset
|
223.2
|
|
169.9
|
|
|||
|
Net unrecognized periodic benefit costs for defined benefit pension plans
|
(338.3
|
)
|
(254.3
|
)
|
|||
|
Postretirement benefit plans:
|
|||||||
|
Deferred net actuarial loss
|
(211.2
|
)
|
(169.6
|
)
|
|||
|
Deferred prior service credits
|
88.0
|
|
102.4
|
|
|||
|
Deferred tax asset
|
48.9
|
|
27.0
|
|
|||
|
Net unrecognized periodic benefit costs for postretirement benefit plans
|
(74.3
|
)
|
(40.2
|
)
|
|||
|
Foreign currency translation adjustments:
|
|||||||
|
Gross unrealized (losses) gains
|
(4.3
|
)
|
2.2
|
|
|||
|
Deferred tax asset (liability)
|
1.5
|
|
(0.7
|
)
|
|||
|
Net unrealized (losses) gains on foreign currency translation adjustments
|
(2.8
|
)
|
1.5
|
|
|||
|
Accumulated other comprehensive income
|
$
|
171.9
|
|
$
|
183.2
|
|
|
-
135
-
Anthem, Inc.
Notes to Consolidated Financial Statements (continued)
Other comprehensive income (loss) reclassification adjustments for the years ended December 31 are as follows:
|
2014
|
2013
|
2012
|
|||||||||
|
Investments:
|
|||||||||||
|
Net holding gain (loss) on investment securities arising during the period, net of tax (expense) benefit of ($18.3), $223.6 and $5.4, respectively
|
$
|
35.4
|
|
$
|
(407.2
|
)
|
$
|
(3.2
|
)
|
||
|
Reclassification adjustment for net realized gain on investment securities, net of tax expense of ($44.8), ($60.6) and ($104.0), respectively
|
83.2
|
|
112.5
|
|
193.1
|
|
|||||
|
Total reclassification adjustment on investments
|
118.6
|
|
(294.7
|
)
|
189.9
|
|
|||||
|
Non-credit component of OTTI on investments:
|
|||||||||||
|
Non-credit component of OTTI on investments, net of tax benefit (expense) of $2.1, ($0.9) and ($2.4), respectively
|
(3.9
|
)
|
1.7
|
|
4.5
|
|
|||||
|
Cash flow hedges:
|
|||||||||||
|
Holding (loss) gain, net of tax benefit (expense) of $1.9, ($1.6) and ($0.1), respectively
|
(3.6
|
)
|
3.0
|
|
0.1
|
|
|||||
|
Other:
|
|||||||||||
|
Net change in unrecognized periodic benefit costs for defined benefit pension and postretirement benefit plans, net of tax benefit (expense) of $75.2, ($106.8) and ($7.1), respectively
|
(118.1
|
)
|
172.7
|
|
(10.9
|
)
|
|||||
|
Foreign currency translation adjustment, net of tax benefit (expense) of $2.2, ($0.6) and ($0.3), respectively
|
(4.3
|
)
|
1.4
|
|
0.6
|
|
|||||
|
Net (loss) gain recognized in other comprehensive (loss) income, net of tax benefit (expense) of $18.3, $53.1 and ($108.5), respectively
|
$
|
(11.3
|
)
|
$
|
(115.9
|
)
|
$
|
184.2
|
|
||
16. Reinsurance
We reinsure certain risks with other companies and assume risk from other companies. We remain primarily liable to policyholders under ceded insurance contracts and are contingently liable for amounts recoverable from reinsurers in the event that such reinsurers do not meet their contractual obligations. We evaluate the financial condition of our reinsurers and monitor concentrations of credit risk arising from similar geographic regions, activities, or economic characteristics of the reinsurers to minimize our exposure to significant losses from reinsurer insolvencies. In conjunction with the Health Care Reform temporary reinsurance premium stabilization program, we recognize assessments upon our fully-insured non-grandfathered individual market plans that are eligible for reinsurance recoveries as ceded premiums and estimated reinsurance recoveries as a reduction to benefit expense. Assessments upon all other lines of business not eligible for reinsurance recoveries are recognized in general and administrative expense.
A summary of direct, assumed and ceded premiums written and earned for the years ended December 31 is as follows:
|
|
2014
|
2013
|
2012
|
||||||||||||||||||||
|
Written
|
Earned
|
Written
|
Earned
|
Written
|
Earned
|
||||||||||||||||||
|
Direct
|
$
|
68,628.6
|
|
$
|
68,304.3
|
|
$
|
65,939.1
|
|
$
|
66,038.9
|
|
$
|
56,443.6
|
|
$
|
56,373.6
|
|
|||||
|
Assumed
|
192.3
|
|
194.0
|
|
174.3
|
|
174.0
|
|
197.0
|
|
196.4
|
|
|||||||||||
|
Ceded
|
(108.5
|
)
|
(108.5
|
)
|
(92.6
|
)
|
(93.8
|
)
|
(73.2
|
)
|
(73.3
|
)
|
|||||||||||
|
Net premiums
|
$
|
68,712.4
|
|
$
|
68,389.8
|
|
$
|
66,020.8
|
|
$
|
66,119.1
|
|
$
|
56,567.4
|
|
$
|
56,496.7
|
|
|||||
|
Percentage—assumed to net premiums
|
0.3
|
%
|
0.3
|
%
|
0.3
|
%
|
0.3
|
%
|
0.3
|
%
|
0.3
|
%
|
|||||||||||
-
136
-
Anthem, Inc.
Notes to Consolidated Financial Statements (continued)
A summary of net premiums written and earned by segment (see Note 19, “Segment Information”) for the years ended December 31 is as follows:
|
|
2014
|
2013
|
2012
|
||||||||||||||||||||
|
Written
|
Earned
|
Written
|
Earned
|
Written
|
Earned
|
||||||||||||||||||
|
Reportable segments:
|
|||||||||||||||||||||||
|
Commercial and Specialty Business
|
$
|
35,084.7
|
|
$
|
35,045.2
|
|
$
|
35,733.9
|
|
$
|
35,772.0
|
|
$
|
35,358.1
|
|
$
|
36,036.7
|
|
|||||
|
Government Business
|
33,627.7
|
|
33,344.6
|
|
30,286.9
|
|
30,347.1
|
|
21,209.3
|
|
20,460.0
|
|
|||||||||||
|
Other
|
—
|
|
—
|
|
—
|
|
—
|
|
—
|
|
—
|
|
|||||||||||
|
Net premiums
|
$
|
68,712.4
|
|
$
|
68,389.8
|
|
$
|
66,020.8
|
|
$
|
66,119.1
|
|
$
|
56,567.4
|
|
$
|
56,496.7
|
|
|||||
The effect of reinsurance on benefit expense for the years ended December 31 is as follows:
|
2014
|
2013
|
2012
|
|||||||||
|
Direct
|
$
|
57,496.6
|
|
$
|
56,185.2
|
|
$
|
48,135.1
|
|
||
|
Assumed
|
182.4
|
|
155.6
|
|
173.0
|
|
|||||
|
Ceded
|
(824.1
|
)
|
(103.7
|
)
|
(94.5
|
)
|
|||||
|
Net benefit expense
|
$
|
56,854.9
|
|
$
|
56,237.1
|
|
$
|
48,213.6
|
|
||
The effect of reinsurance on certain assets and liabilities at December 31 is as follows:
|
2014
|
2013
|
||||||
|
Policy liabilities, assumed
|
$
|
57.4
|
|
$
|
55.4
|
|
|
|
Unearned income, assumed
|
0.4
|
|
0.4
|
|
|||
|
Premiums payable, ceded
|
7.7
|
|
17.1
|
|
|||
|
Premiums receivable, assumed
|
5.4
|
|
14.1
|
|
|||
17. Leases
We lease office space and certain computer and related equipment using noncancelable operating leases. At
December 31, 2014
, future lease payments for operating leases with initial or remaining noncancelable terms of one year or more consist of the following:
|
2015
|
$
|
148.7
|
|
|
2016
|
132.1
|
|
|
|
2017
|
125.0
|
|
|
|
2018
|
115.8
|
|
|
|
2019
|
99.6
|
|
|
|
Thereafter
|
274.9
|
|
|
|
Total minimum payments required
|
$
|
896.1
|
|
We have certain lease agreements that contain contingent payment provisions. Under these provisions, we pay contingent amounts in addition to base rent, primarily based upon annual changes in the consumer price index. The schedule above contains estimated amounts for potential future increases in lease payments based on the contingent payment provisions.
Lease expense for
2014
,
2013
and
2012
was
$192.5
,
$185.9
and
$153.3
, respectively.
-
137
-
Anthem, Inc.
Notes to Consolidated Financial Statements (continued)
18. Earnings per Share
The denominator for basic and diluted earnings per share at December 31 is as follows:
|
2014
|
2013
|
2012
|
||||||
|
Denominator for basic earnings per share—weighted-average shares
|
275.9
|
|
298.5
|
|
321.5
|
|
||
|
Effect of dilutive securities—employee stock options, non-vested restricted stock awards and convertible debentures
|
10.0
|
|
5.3
|
|
3.3
|
|
||
|
Denominator for diluted earnings per share
|
285.9
|
|
303.8
|
|
324.8
|
|
||
During the years ended
December 31, 2014
,
2013
and
2012
, weighted-average shares related to certain stock options of
0.5
,
4.2
and
12.6
, respectively, were excluded from the denominator for diluted earnings per share because the stock options were anti-dilutive.
19. Segment Information
On May 20, 2013, we announced certain organizational and executive leadership changes to align with how our Chief Executive Officer is managing our operations. Beginning with the three months ended June 30, 2013, our organizational structure is comprised of
three
reportable segments: Commercial and Specialty Business; Government Business; and Other.
Our Commercial and Specialty Business segment includes our Local Group, National Accounts, Individual and Specialty businesses. Business units in the Commercial and Specialty Business segment offer fully-insured health products; provide a broad array of managed care services to self-funded customers including claims processing, underwriting, stop loss insurance, actuarial services, provider network access, medical cost management, disease management, wellness programs and other administrative services; and provide an array of specialty and other insurance products and services such as dental, vision, life and disability insurance benefits, radiology benefit management and analytics-driven personal health care guidance.
Our Government Business segment includes Medicare and Medicaid businesses, National Government Services, or NGS, and services provided to the federal government in connection with
FEP. Medicare business includes services such as Medicare Advantage, Medicare Part D, and Medicare Supplement. Medicaid business includes our managed care alternatives through publicly funded health care programs, including Medicaid
,
Temporary Assistance for Needy Family
programs,
programs for seniors and people with disabilities
,
programs for long-term services and support
,
Children’s Health Insurance Programs
and ACA-related
Medicaid expansion programs. NGS acts as a Medicare contractor in several regions across the nation.
Our Other segment includes other businesses that do not meet the quantitative thresholds for an operating segment as defined by
FASB
guidance, as well as corporate expenses not allocated to the other reportable segments.
We define operating revenues, a non-GAAP measure, to include premium income, administrative fees and other revenues. Operating revenues are derived from premiums and fees received primarily from the sale and administration of health benefit products. Operating gain, a non-GAAP measure, is calculated as total operating revenue less benefit expense and selling, general and administrative expense.
Through our participation in various federal government programs, we generated approximately
21.0%
,
20.3%
and
23.7%
of our total consolidated revenues from agencies of the U.S. government for the years ended
December 31, 2014
,
2013
, and
2012
, respectively. These revenues are contained in the Government Business segment.
The accounting policies of the segments are consistent with those described in the summary of significant accounting policies in Note 2, “Basis of Presentation and Significant Accounting Policies,” except that certain shared administrative expenses for each segment are recognized on a pro rata allocated basis, which in aggregate approximates the consolidated expense. Any difference between the allocated expenses and actual consolidated expense is included in other expenses not allocated to reportable segments. Intersegment sales and expenses are recorded at cost and eliminated in the consolidated financial statements. We evaluate performance of the reportable segments based on operating gain or loss as defined above. We evaluate investment income, net realized gains on investments, OTTI losses recognized in income, interest expense, amortization expense, loss on extinguishment of debt and income taxes, and asset and liability details on a consolidated basis
-
138
-
Anthem, Inc.
Notes to Consolidated Financial Statements (continued)
as these items are managed in a corporate shared service environment and are not the responsibility of segment operating management.
Financial data by reportable segment for the years ended December 31 is as follows:
|
Commercial and Specialty Business
|
Government Business
|
Other
|
Total
|
||||||||||||
|
Year ended December 31, 2014
|
|||||||||||||||
|
Operating revenue
|
$
|
39,199.6
|
|
$
|
33,796.4
|
|
$
|
25.7
|
|
$
|
73,021.7
|
|
|||
|
Operating gain (loss)
|
3,260.9
|
|
1,191.9
|
|
(34.4
|
)
|
4,418.4
|
|
|||||||
|
Depreciation and amortization of property and equipment
|
—
|
|
—
|
|
474.3
|
|
474.3
|
|
|||||||
|
Year ended December 31, 2013
|
|||||||||||||||
|
Operating revenue
|
$
|
39,404.2
|
|
$
|
30,752.6
|
|
$
|
34.6
|
|
$
|
70,191.4
|
|
|||
|
Operating gain (loss)
|
3,176.4
|
|
844.0
|
|
(19.0
|
)
|
4,001.4
|
|
|||||||
|
Depreciation and amortization of property and equipment
|
—
|
|
—
|
|
457.1
|
|
457.1
|
|
|||||||
|
Year ended December 31, 2012
|
|||||||||||||||
|
Operating revenue
|
$
|
39,639.9
|
|
$
|
20,838.9
|
|
$
|
35.2
|
|
$
|
60,514.0
|
|
|||
|
Operating gain (loss)
|
3,396.3
|
|
285.4
|
|
(61.8
|
)
|
3,619.9
|
|
|||||||
|
Depreciation and amortization of property and equipment
|
—
|
|
—
|
|
363.5
|
|
363.5
|
|
|||||||
The major product revenues for each of the reportable segments for the years ended December 31 are as follows:
|
2014
|
2013
|
2012
|
|||||||||
|
Commercial and Specialty Business
|
|||||||||||
|
Managed care products
|
$
|
33,755.6
|
|
$
|
34,516.9
|
|
$
|
34,875.4
|
|
||
|
Managed care services
|
3,997.8
|
|
3,474.0
|
|
3,446.9
|
|
|||||
|
Dental/Vision products and services
|
1,037.3
|
|
952.5
|
|
903.9
|
|
|||||
|
Other
|
408.9
|
|
460.8
|
|
413.7
|
|
|||||
|
Total Commercial and Specialty Business
|
39,199.6
|
|
39,404.2
|
|
39,639.9
|
|
|||||
|
Government Business
|
|||||||||||
|
Managed care products
|
33,344.6
|
|
30,347.1
|
|
20,460.0
|
|
|||||
|
Managed care services
|
451.8
|
|
405.5
|
|
378.9
|
|
|||||
|
Total Government Business
|
33,796.4
|
|
30,752.6
|
|
20,838.9
|
|
|||||
|
Other
|
|||||||||||
|
Other
|
25.7
|
|
34.6
|
|
35.2
|
|
|||||
|
Total product revenues
|
$
|
73,021.7
|
|
$
|
70,191.4
|
|
$
|
60,514.0
|
|
||
The classification between managed care products and managed care services in the above table primarily distinguishes between the level of risk assumed. Managed care products represent insurance products where we bear the insurance risk, whereas managed care services represent product offerings where we provide claims adjudication and other administrative services to the customer, but the customer principally bears the insurance risk.
Asset and equity details by reportable segment have not been disclosed, as we do not internally report such information.
-
139
-
Anthem, Inc.
Notes to Consolidated Financial Statements (continued)
A reconciliation of reportable segment operating revenues to the amounts of total revenues included in the consolidated statements of income for the years ended December 31 is as follows:
|
2014
|
2013
|
2012
|
|||||||||
|
Reportable segments operating revenues
|
$
|
73,021.7
|
|
$
|
70,191.4
|
|
$
|
60,514.0
|
|
||
|
Net investment income
|
724.4
|
|
659.1
|
|
686.1
|
|
|||||
|
Net realized gains on investments
|
177.0
|
|
271.9
|
|
334.9
|
|
|||||
|
Other-than-temporary impairment losses recognized in income
|
(49.0
|
)
|
(98.9
|
)
|
(37.8
|
)
|
|||||
|
Total revenues
|
$
|
73,874.1
|
|
$
|
71,023.5
|
|
$
|
61,497.2
|
|
||
A reconciliation of reportable segment operating gain to income from continuing operations before income taxes included in the consolidated statements of income for the years ended December 31 is as follows:
|
2014
|
2013
|
2012
|
|||||||||
|
Reportable segments operating gain
|
$
|
4,418.4
|
|
$
|
4,001.4
|
|
$
|
3,619.9
|
|
||
|
Net investment income
|
724.4
|
|
659.1
|
|
686.1
|
|
|||||
|
Net realized gains on investments
|
177.0
|
|
271.9
|
|
334.9
|
|
|||||
|
Other-than-temporary impairment losses recognized in income
|
(49.0
|
)
|
(98.9
|
)
|
(37.8
|
)
|
|||||
|
Interest expense
|
(600.7
|
)
|
(602.7
|
)
|
(511.8
|
)
|
|||||
|
Amortization of other intangible assets
|
(220.9
|
)
|
(245.3
|
)
|
(233.0
|
)
|
|||||
|
Loss on extinguishment of debt
|
(81.1
|
)
|
(145.3
|
)
|
—
|
|
|||||
|
Income from continuing operations before income tax expense
|
$
|
4,368.1
|
|
$
|
3,840.2
|
|
$
|
3,858.3
|
|
||
20. Related Party Transactions
Anthem Foundation, Inc., or the Foundation, is an Indiana non-profit organization exempt from federal taxation under Section 501(c)(3) of the Internal Revenue Code. The Foundation was formed to conduct, support and assist charitable, health-related, educational, and other community-based programs and projects. The officers and directors of the Foundation are also our officers. These officers and directors receive no compensation from the Foundation for the management services performed for the Foundation but may be reimbursed by the Foundation for any cash expenditures incurred on behalf of the Foundation. During the years ended
December 31, 2014
,
2013
and
2012
, we received
$0.8
,
$0.7
and
$0.6
, respectively, from the Foundation for administrative services provided by our associates. We contributed
$10.0
to the Foundation during the year ended December 31, 2013. We did not make any contributions to the Foundation during the years ended December 31, 2014 and 2012. The Foundation is not a subsidiary of ours and the financial results of the Foundation are not consolidated with our financial statements. We have no current legal obligations for future commitments to the Foundation.
21. Statutory Information
The majority of our insurance and HMO subsidiaries report their accounts in conformity with accounting practices prescribed or permitted by state insurance regulatory authorities, or statutory, which vary in certain respects from GAAP. However, certain of our insurance and HMO subsidiaries, including BCC, Blue Cross of California Partnership Plan, Inc., Golden West Health Plan, Inc. and CareMore Health Plan are regulated by the California Department of Managed Health Care, or DMHC, and report their accounts in conformity with GAAP (these entities are collectively referred to as the “DMHC regulated entities”). Typical differences of GAAP reporting as compared to statutory reporting are the inclusion of unrealized gains or losses relating to fixed maturity securities in shareholders’ equity, recognition of all assets including those that are non-admitted for statutory purposes and recognition of all deferred tax assets without regard to statutory limits. The National Association of Insurance Commissioners, or NAIC, developed a codified version of the statutory accounting principles, designed to foster more consistency among the states for accounting guidelines and reporting. Prescribed statutory accounting practices are set forth in a variety of publications of the NAIC as well as state laws, regulations and general administrative rules.
-
140
-
Anthem, Inc.
Notes to Consolidated Financial Statements (continued)
Our ability to pay dividends and credit obligations is significantly dependent on receipt of dividends from our subsidiaries. The payment of dividends to us by our insurance and HMO subsidiaries without prior approval of the insurance departments of each subsidiary’s domiciliary jurisdiction is limited by formula. Dividends in excess of these amounts are subject to prior approval by the respective state insurance departments or the DMHC.
Our statutory basis insurance and HMO subsidiaries are subject to risk-based capital requirements. Risk-based capital is a method developed by the NAIC to determine the minimum amount of statutory capital appropriate for an insurance company or HMO to support its overall business operations in consideration of its size and risk profile. The formula for determining the amount of risk-based capital specifies various factors, weighted based on the perceived degree of risk, which are applied to certain financial balances and financial activity. Below minimum risk-based capital requirements are classified within certain levels, each of which requires specified corrective action. Additionally, the DMHC regulated entities are subject to capital and solvency requirements as prescribed by the DMHC. As of
December 31, 2014
and
2013
, all of our regulated subsidiaries exceeded the minimum risk-based capital requirements and/or capital and solvency requirements of their applicable governmental regulator. The statutory risk-based capital necessary to satisfy regulatory requirements of our statutory basis insurance and HMO subsidiaries was approximately
$3,400.0
as of
December 31, 2014
and
2013
. The tangible net equity required for the DMHC regulated entities was approximately
$520.0
and
$450.0
as of
December 31, 2014
and
2013
, respectively.
Statutory-basis capital and surplus of our insurance and HMO subsidiaries and capital and surplus of our other regulated subsidiaries, excluding the DMHC regulated entities, was
$9,727.2
and
$9,992.7
at
December 31, 2014
and
2013
, respectively. Statutory-basis net income of our insurance and HMO subsidiaries and net income of our other regulated subsidiaries, excluding the DMHC regulated entities, was
$2,403.8
,
$2,635.8
and
$2,800.0
for
2014
,
2013
and
2012
, respectively. GAAP equity of the DMHC regulated entities was
$1,696.1
and
$1,449.2
at
December 31, 2014
and
2013
, respectively. GAAP net income of the DMHC regulated entities was
$453.6
,
$487.7
and
$469.7
for the years ended
December 31, 2014
,
2013
and
2012
, respectively.
-
141
-
Anthem, Inc.
Notes to Consolidated Financial Statements (continued)
22. Selected Quarterly Financial Data (Unaudited)
Selected quarterly financial data is as follows:
|
|
For the Quarter Ended
|
||||||||||||||
|
|
March 31
|
June 30
|
September 30
|
December 31
|
|||||||||||
|
2014
|
|||||||||||||||
|
Total revenues
|
$
|
17,859.4
|
|
$
|
18,473.4
|
|
$
|
18,557.0
|
|
$
|
18,984.3
|
|
|||
|
Income from continuing operations before income taxes
|
1,130.1
|
|
1,263.7
|
|
1,087.2
|
|
887.1
|
|
|||||||
|
Income from continuing operations
|
691.4
|
|
731.1
|
|
630.9
|
|
506.7
|
|
|||||||
|
Income from discontinued operations
|
9.6
|
|
—
|
|
—
|
|
—
|
|
|||||||
|
Net income
|
701.0
|
|
731.1
|
|
630.9
|
|
506.7
|
|
|||||||
|
|
|
|
|
|
|
|
|
||||||||
|
Basic net income per share - continuing operations
|
$
|
2.43
|
|
$
|
2.64
|
|
$
|
2.31
|
|
$
|
1.88
|
|
|||
|
Basic net income per share - discontinued operations
|
0.03
|
|
—
|
|
—
|
|
—
|
|
|||||||
|
Basic net income per share
|
2.46
|
|
2.64
|
|
2.31
|
|
1.88
|
|
|||||||
|
|
|
|
|
|
|
|
|
||||||||
|
Diluted net income per share - continuing operations
|
$
|
2.37
|
|
$
|
2.56
|
|
$
|
2.22
|
|
$
|
1.80
|
|
|||
|
Diluted net income per share - discontinued operations
|
0.03
|
|
—
|
|
—
|
|
—
|
|
|||||||
|
Diluted net income per share
|
2.40
|
|
2.56
|
|
2.22
|
|
1.80
|
|
|||||||
|
2013
|
|||||||||||||||
|
Total revenues
|
$
|
17,576.0
|
|
$
|
17,690.3
|
|
$
|
17,855.5
|
|
$
|
17,901.7
|
|
|||
|
Income from continuing operations before income taxes
|
1,282.5
|
|
1,208.1
|
|
879.7
|
|
469.9
|
|
|||||||
|
Income from continuing operations
|
872.3
|
|
799.3
|
|
653.8
|
|
308.9
|
|
|||||||
|
Income (loss) from discontinued operations
|
12.9
|
|
0.8
|
|
2.4
|
|
(160.7
|
)
|
|||||||
|
Net income
|
885.2
|
|
800.1
|
|
656.2
|
|
148.2
|
|
|||||||
|
Basic net income per share - continuing operations
|
$
|
2.88
|
|
$
|
2.67
|
|
$
|
2.20
|
|
$
|
1.05
|
|
|||
|
Basic net income (loss) per share - discontinued operations
|
0.04
|
|
—
|
|
0.01
|
|
(0.55
|
)
|
|||||||
|
Basic net income per share
|
2.92
|
|
2.67
|
|
2.21
|
|
0.50
|
|
|||||||
|
Diluted net income per share - continuing operations
|
$
|
2.85
|
|
$
|
2.64
|
|
$
|
2.15
|
|
$
|
1.02
|
|
|||
|
Diluted net income (loss) per share - discontinued operations
|
0.04
|
|
—
|
|
0.01
|
|
(0.53
|
)
|
|||||||
|
Diluted net income per share
|
2.89
|
|
2.64
|
|
2.16
|
|
0.49
|
|
|||||||
ITEM 9. CHANGES IN AND DISAGREEMENTS WITH ACCOUNTANTS ON ACCOUNTING AND FINANCIAL DISCLOSURE.
There have been no changes in or disagreements with our independent registered public accounting firm on accounting or financial disclosures.
ITEM 9A. CONTROLS AND PROCEDURES.
Evaluation of Disclosure Controls and Procedures
We carried out an evaluation as of
December 31, 2014
, under the supervision and with the participation of our management, including our Chief Executive Officer and Chief Financial Officer, of the effectiveness of the design and operation of our disclosure controls and procedures as defined in Rule 13a-15(e) of the Securities Exchange Act of 1934, as amended, or the Exchange Act. Based upon that evaluation, the Chief Executive Officer and Chief Financial Officer concluded that our disclosure controls and procedures are effective in timely alerting them to material information relating to
-
142
-
us (including our consolidated subsidiaries) required to be disclosed in our reports under the Exchange Act. In addition, based on that evaluation, the Chief Executive Officer and Chief Financial Officer concluded that our disclosure controls and procedures were effective in ensuring that information required to be disclosed by us in the reports that we file or submit under the Exchange Act is accumulated and communicated to our management, including the Chief Executive Officer and Chief Financial Officer, as appropriate to allow timely decisions regarding required disclosures.
Management’s Report on Internal Control Over Financial Reporting
Management, under the supervision and with the participation of the principal executive officer and principal financial officer, of Anthem, Inc., or the Company, is responsible for establishing and maintaining effective internal control over financial reporting, or Internal Control, as such term is defined in the Exchange Act. The Company’s Internal Control is designed to provide reasonable assurance regarding the reliability of the Company’s financial reporting and the preparation of financial statements for external reporting purposes in accordance with U.S. generally accepted accounting principles, or GAAP. The Company’s Internal Control includes those policies and procedures that (i) pertain to the maintenance of records that in reasonable detail accurately and fairly reflect the transactions and dispositions of the assets of the Company; (ii) provide reasonable assurance that transactions are recorded as necessary to permit preparation of financial statements in accordance with GAAP, and that receipts and expenditures of the Company are being made only in accordance with authorizations of management and directors of the Company; and (iii) provide reasonable assurance regarding prevention or timely detection of unauthorized acquisition, use or disposition of the Company’s assets that could have a material effect on the financial statements.
Because of inherent limitations in any Internal Control, no matter how well designed, misstatements due to error or fraud may occur and not be detected. Accordingly, even effective Internal Control can provide only reasonable assurance regarding the reliability of financial reporting and the preparation of financial statements for external purposes in accordance with GAAP.
Management, under the supervision and with the participation of the principal executive officer and principal financial officer, assessed the effectiveness of the Company’s Internal Control as of
December 31, 2014
. Management’s assessment was based on criteria established in Internal Control—Integrated Framework (2013) issued by the Committee of Sponsoring Organizations of the Treadway Commission.
Based on management’s assessment, management has concluded that the Company’s Internal Control was effective as of
December 31, 2014
to provide reasonable assurance regarding the reliability of financial reporting and the preparation of financial statements for external reporting purposes in accordance with GAAP.
Ernst & Young LLP, the Company’s independent registered public accounting firm, has audited the consolidated financial statements of the Company for the year ended
December 31, 2014
, and has also issued an audit report dated
February 24, 2015
, on the effectiveness of the Company’s internal control over financial reporting as of
December 31, 2014
, which is included in this Annual Report on Form 10-K.
|
/
S
/ J
OSEPH
R. S
WEDISH
|
|
/
S
/ W
AYNE
S. D
EVEYDT
|
|
President and Chief Executive Officer
|
|
Executive Vice President and Chief Financial Officer
|
Changes in Internal Control over Financial Reporting
There have been no changes in our internal control over financial reporting that occurred during the three months ended
December 31, 2014
that have materially affected, or are reasonably likely to materially affect, our internal control over financial reporting.
-
143
-
Report of Independent Registered Public Accounting Firm
The Board of Directors and Shareholders of Anthem, Inc.
We have audited Anthem, Inc.’s internal control over financial reporting as of
December 31, 2014
, based on criteria established in Internal Control–Integrated Framework issued by the Committee of Sponsoring Organizations of the Treadway Commission (2013 framework) (the COSO criteria). Anthem, Inc.’s management is responsible for maintaining effective internal control over financial reporting, and for its assessment of the effectiveness of internal control over financial reporting included in the accompanying Management’s Report on Internal Control Over Financial Reporting. Our responsibility is to express an opinion on the company’s internal control over financial reporting based on our audit.
We conducted our audit in accordance with the standards of the Public Company Accounting Oversight Board (United States). Those standards require that we plan and perform the audit to obtain reasonable assurance about whether effective internal control over financial reporting was maintained in all material respects. Our audit included obtaining an understanding of internal control over financial reporting, assessing the risk that a material weakness exists, testing and evaluating the design and operating effectiveness of internal control based on the assessed risk, and performing such other procedures as we considered necessary in the circumstances. We believe that our audit provides a reasonable basis for our opinion.
A company’s internal control over financial reporting is a process designed to provide reasonable assurance regarding the reliability of financial reporting and the preparation of financial statements for external purposes in accordance with generally accepted accounting principles. A company’s internal control over financial reporting includes those policies and procedures that (1) pertain to the maintenance of records that, in reasonable detail, accurately and fairly reflect the transactions and dispositions of the assets of the company; (2) provide reasonable assurance that transactions are recorded as necessary to permit preparation of financial statements in accordance with generally accepted accounting principles, and that receipts and expenditures of the company are being made only in accordance with authorizations of management and directors of the company; and (3) provide reasonable assurance regarding prevention or timely detection of unauthorized acquisition, use, or disposition of the company’s assets that could have a material effect on the financial statements.
Because of its inherent limitations, internal control over financial reporting may not prevent or detect misstatements. Also, projections of any evaluation of effectiveness to future periods are subject to the risk that controls may become inadequate because of changes in conditions, or that the degree of compliance with the policies or procedures may deteriorate.
In our opinion, Anthem, Inc. maintained, in all material respects, effective internal control over financial reporting as of
December 31, 2014
, based on the COSO criteria.
We also have audited, in accordance with the standards of the Public Company Accounting Oversight Board (United States), the consolidated balance sheets of Anthem, Inc. as of
December 31, 2014
and
2013
, and the related consolidated statements of income, comprehensive income, shareholders’ equity, and cash flows for each of the three years in the period ended
December 31, 2014
of Anthem, Inc. and our report dated
February 24, 2015
expressed an unqualified opinion thereon.
/s/ E
RNST
& Y
OUNG
LLP
Indianapolis, Indiana
February 24, 2015
-
144
-
ITEM 9B. OTHER INFORMATION.
None.
PART III
ITEM 10. DIRECTORS, EXECUTIVE OFFICERS AND CORPORATE GOVERNANCE.
The information required by this Item concerning our Executive Officers, Directors and nominees for Director, Audit Committee members and financial expert(s) and concerning disclosure of delinquent filers under Section 16(a) of the Exchange Act and our Standards of Business Conduct is incorporated herein by reference from our definitive Proxy Statement for our
2015
Annual Meeting of Shareholders, which will be filed with the SEC pursuant to Regulation 14A within 120 days after the end of our last fiscal year.
ITEM 11. EXECUTIVE COMPENSATION.
The information required by this Item concerning remuneration of our Executive Officers and Directors, material transactions involving such Executive Officers and Directors and Compensation Committee interlocks, as well as the Compensation Committee Report, are incorporated herein by reference from our definitive Proxy Statement for our
2015
Annual Meeting of Shareholders, which will be filed with the SEC pursuant to Regulation 14A within 120 days after the end of our last fiscal year.
ITEM 12. SECURITY OWNERSHIP OF CERTAIN BENEFICIAL OWNERS AND MANAGEMENT AND RELATED STOCKHOLDER MATTERS.
The information required by this Item concerning the stock ownership of management and five percent beneficial owners and securities authorized for issuance under equity compensation plans is incorporated herein by reference from our definitive Proxy Statement for our
2015
Annual Meeting of Shareholders, which will be filed with the SEC pursuant to Regulation 14A within 120 days after the end of our last fiscal year.
ITEM 13. CERTAIN RELATIONSHIPS AND RELATED TRANSACTIONS, AND DIRECTOR INDEPENDENCE.
The information required by this Item concerning certain relationships and related person transactions and director independence is incorporated herein by reference from our definitive Proxy Statement for our
2015
Annual Meeting of Shareholders, which will be filed with the SEC pursuant to Regulation 14A within 120 days after the end of our last fiscal year.
ITEM 14. PRINCIPAL ACCOUNTANT FEES AND SERVICES.
The information required by this Item concerning principal accounting fees and services is incorporated herein by reference from our definitive Proxy Statement for our
2015
Annual Meeting of Shareholders, which will be filed with the SEC pursuant to Regulation 14A within 120 days after the end of our last fiscal year.
-
145
-
PART IV
ITEM 15. EXHIBITS AND FINANCIAL STATEMENT SCHEDULES.
(a) 1. Financial Statements:
The following consolidated financial statements of the Company are set forth in Part II, Item 8
Report of Independent Registered Public Accounting Firm
Consolidated Balance Sheets as of
December 31, 2014
and
2013
Consolidated Statements of Income for the years ended
December 31, 2014
,
2013
, and
2012
Consolidated Statements of Comprehensive Income for the years ended
December 31, 2014
,
2013
, and
2012
Consolidated Statements of Shareholders’ Equity for the years ended
December 31, 2014
,
2013
and
2012
Consolidated Statements of Cash Flows for the years ended
December 31, 2014
,
2013
and
2012
Notes to Consolidated Financial Statements
2. Financial Statement Schedule:
The following financial statement schedule of the Company is included in Item 15(c):
Schedule II—Condensed Financial Information of Registrant (Parent Company Only).
All other schedules for which provision is made in the applicable accounting regulations of the SEC are not required under the related instructions, are inapplicable, or the required information is included in the consolidated financial statements, and therefore, have been omitted.
3. Exhibits:
A list of exhibits required to be filed as part of this report is set forth in the Index to Exhibits, which immediately precedes such exhibits, and is incorporated herein by reference.
(b) Exhibits
The response to this portion of Item 15 is submitted as a separate section of this report.
(c) Financial Statement Schedule
Schedule II—Condensed Financial Information of Registrant (Parent Company Only).
-
146
-
Schedule II—Condensed Financial Information of Registrant
Anthem, Inc. (Parent Company Only)
Balance Sheets
|
(In millions, except share data)
|
December 31,
2014
|
December 31,
2013
|
|||||
|
Assets
|
|||||||
|
Current assets:
|
|||||||
|
Cash and cash equivalents
|
$
|
739.8
|
|
$
|
1,174.5
|
|
|
|
Investments available-for-sale, at fair value:
|
|
||||||
|
Fixed maturity securities (amortized cost of $1,798.8 and $897.4)
|
1,753.4
|
|
900.4
|
|
|||
|
Equity securities (cost of $148.7 and $52.6)
|
206.7
|
|
89.6
|
|
|||
|
Other invested assets, current
|
5.7
|
|
1.9
|
|
|||
|
Other receivables
|
44.6
|
|
35.6
|
|
|||
|
Income taxes receivable
|
227.9
|
|
154.4
|
|
|||
|
Net due from subsidiaries
|
327.3
|
|
893.4
|
|
|||
|
Securities lending collateral
|
224.8
|
|
46.2
|
|
|||
|
Deferred tax assets, net
|
22.0
|
|
11.8
|
|
|||
|
Other current assets
|
233.2
|
|
183.1
|
|
|||
|
Total current assets
|
3,785.4
|
|
3,490.9
|
|
|||
|
Long-term investments available-for-sale, at fair value:
|
|||||||
|
Equity securities (cost of $6.6 and $6.7)
|
6.6
|
|
6.7
|
|
|||
|
Other invested assets, long-term
|
654.5
|
|
615.7
|
|
|||
|
Property and equipment, net
|
134.0
|
|
148.3
|
|
|||
|
Deferred tax assets, net
|
—
|
|
2.9
|
|
|||
|
Investments in subsidiaries
|
35,647.2
|
|
35,516.2
|
|
|||
|
Other noncurrent assets
|
220.6
|
|
152.3
|
|
|||
|
Total assets
|
$
|
40,448.3
|
|
$
|
39,933.0
|
|
|
|
Liabilities and shareholders’ equity
|
|||||||
|
Liabilities
|
|||||||
|
Current liabilities:
|
|||||||
|
Accounts payable and accrued expenses
|
$
|
599.9
|
|
$
|
592.1
|
|
|
|
Security trades pending payable
|
14.0
|
|
28.9
|
|
|||
|
Securities lending payable
|
224.8
|
|
46.2
|
|
|||
|
Current portion of long-term debt
|
625.0
|
|
518.0
|
|
|||
|
Other current liabilities
|
280.1
|
|
213.4
|
|
|||
|
Total current liabilities
|
1,743.8
|
|
1,398.6
|
|
|||
|
Long-term debt, less current portion
|
14,102.3
|
|
13,548.6
|
|
|||
|
Deferred tax liabilities, net
|
37.2
|
|
—
|
|
|||
|
Other noncurrent liabilities
|
313.7
|
|
220.6
|
|
|||
|
Total liabilities
|
16,197.0
|
|
15,167.8
|
|
|||
|
Commitments and contingencies—Note 5
|
|
|
|
|
|||
|
Shareholders’ equity
|
|||||||
|
Preferred stock, without par value, shares authorized - 100,000,000; shares issued and outstanding - none
|
—
|
|
—
|
|
|||
|
Common stock, par value $0.01, shares authorized - 900,000,000; shares issued and outstanding - 268,109,932 and 293,273,830
|
2.7
|
|
2.9
|
|
|||
|
Additional paid-in capital
|
10,062.3
|
|
10,765.2
|
|
|||
|
Retained earnings
|
14,014.4
|
|
13,813.9
|
|
|||
|
Accumulated other comprehensive income
|
171.9
|
|
183.2
|
|
|||
|
Total shareholders’ equity
|
24,251.3
|
|
24,765.2
|
|
|||
|
Total liabilities and shareholders’ equity
|
$
|
40,448.3
|
|
$
|
39,933.0
|
|
|
See accompanying notes.
-
147
-
Anthem, Inc. (Parent Company Only)
Statements of Income
|
Years ended December 31
|
|||||||||||
|
(In millions)
|
2014
|
2013
|
2012
|
||||||||
|
Revenues
|
|||||||||||
|
Net investment income
|
$
|
87.4
|
|
$
|
61.2
|
|
$
|
95.3
|
|
||
|
Net realized losses on investments
|
(27.1
|
)
|
(83.2
|
)
|
(28.5
|
)
|
|||||
|
Other-than-temporary impairment losses on investments:
|
|
||||||||||
|
Total other-than-temporary impairment losses on investments
|
(35.5
|
)
|
(51.6
|
)
|
(15.3
|
)
|
|||||
|
Portion of other-than-temporary impairment losses recognized in other comprehensive income
|
7.0
|
|
0.2
|
|
1.3
|
|
|||||
|
Other-than-temporary impairment losses recognized in income
|
(28.5
|
)
|
(51.4
|
)
|
(14.0
|
)
|
|||||
|
Other revenue
|
4.8
|
|
4.4
|
|
3.5
|
|
|||||
|
Total revenues (losses)
|
36.6
|
|
(69.0
|
)
|
56.3
|
|
|||||
|
Expenses
|
|||||||||||
|
General and administrative expense
|
20.3
|
|
196.6
|
|
211.9
|
|
|||||
|
Interest expense
|
597.8
|
|
598.4
|
|
507.0
|
|
|||||
|
Loss on extinguishment of debt
|
81.1
|
|
145.3
|
|
—
|
|
|||||
|
Total expenses
|
699.2
|
|
940.3
|
|
718.9
|
|
|||||
|
Loss before income tax credits and equity in net income of subsidiaries
|
(662.6
|
)
|
(1,009.3
|
)
|
(662.6
|
)
|
|||||
|
Income tax credits
|
(255.4
|
)
|
(369.7
|
)
|
(172.1
|
)
|
|||||
|
Equity in net income of subsidiaries
|
2,976.9
|
|
3,129.3
|
|
3,146.0
|
|
|||||
|
Net income
|
$
|
2,569.7
|
|
$
|
2,489.7
|
|
$
|
2,655.5
|
|
||
See accompanying notes.
-
148
-
Anthem, Inc. (Parent Company Only)
Statements of Comprehensive Income
|
(in millions)
|
Years ended December 31
|
||||||||||
|
|
2014
|
2013
|
2012
|
||||||||
|
Net income
|
$
|
2,569.7
|
|
$
|
2,489.7
|
|
$
|
2,655.5
|
|
||
|
Other comprehensive (loss) income, net of tax:
|
|
||||||||||
|
Change in net unrealized gains/losses on investments
|
118.6
|
|
(294.7
|
)
|
189.9
|
|
|||||
|
Change in non-credit component of other-than-temporary impairment losses on investments
|
(3.9
|
)
|
1.7
|
|
4.5
|
|
|||||
|
Change in net unrealized gains/losses on cash flow hedges
|
(3.6
|
)
|
3.0
|
|
0.1
|
|
|||||
|
Change in net periodic pension and postretirement costs
|
(118.1
|
)
|
172.7
|
|
(10.9
|
)
|
|||||
|
Foreign currency translation adjustments
|
(4.3
|
)
|
1.4
|
|
0.6
|
|
|||||
|
Other comprehensive (loss) income
|
(11.3
|
)
|
(115.9
|
)
|
184.2
|
|
|||||
|
Total comprehensive income
|
$
|
2,558.4
|
|
$
|
2,373.8
|
|
$
|
2,839.7
|
|
||
See accompanying notes.
-
149
-
Anthem, Inc. (Parent Company Only)
Statements of Cash Flows
|
(In millions)
|
Years ended December 31
|
||||||||||
|
|
2014
|
2013
|
2012
|
||||||||
|
Operating activities
|
|||||||||||
|
Net income
|
$
|
2,569.7
|
|
$
|
2,489.7
|
|
$
|
2,655.5
|
|
||
|
Adjustments to reconcile net income to net cash provided by operating activities:
|
|
||||||||||
|
Distributed (undistributed) earnings of subsidiaries
|
244.3
|
|
(78.5
|
)
|
(432.0
|
)
|
|||||
|
Net realized losses on investments
|
27.1
|
|
83.2
|
|
28.5
|
|
|||||
|
Other-than-temporary impairment losses recognized in income
|
28.5
|
|
51.4
|
|
14.0
|
|
|||||
|
Loss on extinguishment of debt
|
81.1
|
|
145.3
|
|
—
|
|
|||||
|
Loss on disposal of assets
|
3.9
|
|
3.6
|
|
—
|
|
|||||
|
Deferred income taxes
|
52.7
|
|
(4.5
|
)
|
49.2
|
|
|||||
|
Amortization, net of accretion
|
17.5
|
|
25.2
|
|
23.2
|
|
|||||
|
Depreciation expense
|
67.4
|
|
45.7
|
|
13.1
|
|
|||||
|
Share-based compensation
|
168.9
|
|
146.0
|
|
146.5
|
|
|||||
|
Excess tax benefits from share-based compensation
|
(46.4
|
)
|
(30.1
|
)
|
(28.8
|
)
|
|||||
|
Changes in operating assets and liabilities, net of effect of business combinations:
|
|
||||||||||
|
Receivables, net
|
(16.6
|
)
|
3.5
|
|
9.6
|
|
|||||
|
Other invested assets, current
|
(3.8
|
)
|
(0.3
|
)
|
0.2
|
|
|||||
|
Other assets
|
55.6
|
|
42.3
|
|
(31.7
|
)
|
|||||
|
Amounts due from/to subsidiaries
|
566.1
|
|
(983.1
|
)
|
754.7
|
|
|||||
|
Accounts payable and accrued expenses
|
(111.4
|
)
|
111.8
|
|
(34.5
|
)
|
|||||
|
Other liabilities
|
(113.8
|
)
|
(18.6
|
)
|
8.9
|
|
|||||
|
Income taxes
|
(36.0
|
)
|
83.9
|
|
(204.0
|
)
|
|||||
|
Net cash provided by operating activities
|
3,554.8
|
|
2,116.5
|
|
2,972.4
|
|
|||||
|
Investing activities
|
|||||||||||
|
Purchases of investments
|
(1,819.3
|
)
|
(1,964.3
|
)
|
(5,383.2
|
)
|
|||||
|
Proceeds from sales, maturities, calls and redemptions of investments
|
820.7
|
|
2,443.3
|
|
5,554.5
|
|
|||||
|
Settlement of non-hedging derivatives
|
(67.4
|
)
|
(109.8
|
)
|
(59.8
|
)
|
|||||
|
Capitalization of subsidiaries
|
(321.8
|
)
|
(121.2
|
)
|
(6,085.1
|
)
|
|||||
|
Changes in securities lending collateral
|
(178.8
|
)
|
(17.0
|
)
|
73.8
|
|
|||||
|
Purchases of property and equipment, net of sales
|
(57.0
|
)
|
(87.4
|
)
|
(117.1
|
)
|
|||||
|
Other, net
|
(38.0
|
)
|
(18.9
|
)
|
(114.4
|
)
|
|||||
|
Net cash (used in) provided by investing activities
|
(1,661.6
|
)
|
124.7
|
|
(6,131.3
|
)
|
|||||
|
Financing activities
|
|||||||||||
|
Net repayments of commercial paper borrowings
|
(379.2
|
)
|
(191.7
|
)
|
(229.0
|
)
|
|||||
|
Proceeds from long-term borrowings
|
2,700.0
|
|
1,250.0
|
|
6,468.9
|
|
|||||
|
Repayments of long-term borrowings
|
(1,730.1
|
)
|
(1,245.0
|
)
|
(800.0
|
)
|
|||||
|
Changes in securities lending payable
|
178.6
|
|
17.1
|
|
(72.7
|
)
|
|||||
|
Changes in bank overdrafts
|
55.5
|
|
71.8
|
|
30.5
|
|
|||||
|
Premiums paid on equity options
|
—
|
|
(25.8
|
)
|
—
|
|
|||||
|
Repurchase and retirement of common stock
|
(2,998.8
|
)
|
(1,620.1
|
)
|
(2,496.8
|
)
|
|||||
|
Cash dividends
|
(501.6
|
)
|
(465.9
|
)
|
(380.9
|
)
|
|||||
|
Proceeds from issuance of common stock under employee stock plans
|
301.3
|
|
524.7
|
|
110.8
|
|
|||||
|
Excess tax benefits from share-based compensation
|
46.4
|
|
30.1
|
|
28.8
|
|
|||||
|
Net cash (used in) provided by financing activities
|
(2,327.9
|
)
|
(1,654.8
|
)
|
2,659.6
|
|
|||||
|
Change in cash and cash equivalents
|
(434.7
|
)
|
586.4
|
|
(499.3
|
)
|
|||||
|
Cash and cash equivalents at beginning of year
|
1,174.5
|
|
588.1
|
|
1,087.4
|
|
|||||
|
Cash and cash equivalents at end of year
|
$
|
739.8
|
|
$
|
1,174.5
|
|
$
|
588.1
|
|
||
See accompanying notes.
-
150
-
Anthem, Inc.
(Parent Company Only)
Notes to Condensed Financial Statements
December 31, 2014
(In Millions, Except Per Share Data)
1. Basis of Presentation and Significant Accounting Policies
In the parent company only financial statements of Anthem, Inc., or Anthem, Anthem’s investment in subsidiaries is stated at cost plus equity in undistributed earnings of the subsidiaries. Anthem’s share of net income of its unconsolidated subsidiaries is included in income using the equity method of accounting.
Certain amounts presented in the parent company only financial statements are eliminated in the consolidated financial statements of Anthem.
Anthem’s parent company only financial statements should be read in conjunction with Anthem’s audited consolidated financial statements and the accompanying notes included in this Annual Report on Form 10-K.
2. Subsidiary Transactions
Dividends from Subsidiaries
Anthem received cash dividends from subsidiaries of
$3,234.5
,
$3,046.5
and
$2,935.1
during
2014
,
2013
and
2012
, respectively.
Dividends to Subsidiaries
Certain subsidiaries of Anthem own shares of Anthem common stock. Anthem paid cash dividends to subsidiaries related to these shares of common stock in the amount of
$20.9
,
$17.9
and
$13.8
during
2014
,
2013
and
2012
, respectively.
Investments in Subsidiaries
Capital contributions to subsidiaries were
$321.8
,
$121.2
and
$6,085.1
during
2014
,
2013
and
2012
, respectively.
Amounts Due to and From Subsidiaries
At
December 31, 2014
and
2013
, Anthem reported
$327.3
and
$893.4
due from subsidiaries, respectively. The amounts due to or from subsidiaries primarily include amounts for allocated administrative expenses or cash held overnight at the parent level resulting from daily cash management activities. These items are routinely settled, and as such, are classified as current assets or liabilities.
3. Derivative Financial Instruments
The information regarding derivative financial instruments contained in Note 5, “Derivative Financial Instruments,” of the Notes to Consolidated Financial Statements of Anthem and its subsidiaries is incorporated herein by reference.
4. Long-Term Debt
The information regarding long-term debt contained in Note 12, “Debt,” of the Notes to Consolidated Financial Statements of Anthem and its subsidiaries is incorporated herein by reference.
5. Commitments and Contingencies
The information regarding commitments and contingencies contained in Note 13, “Commitments and Contingencies,” of the Notes to Consolidated Financial Statements of Anthem and its subsidiaries is incorporated herein by reference.
-
151
-
6. Capital Stock
The information regarding capital stock contained in Note 14, “Capital Stock,” of the Notes to Consolidated Financial Statements of Anthem and its subsidiaries is incorporated herein by reference.
-
152
-
SIGNATURES
Pursuant to the requirements of Section 13 or 15(d) of the Securities Exchange Act of 1934, the registrant has duly caused this report to be signed on its behalf by the undersigned, thereunto duly authorized.
|
ANTHEM, I
NC
.
|
|
|
By:
|
/s/ JOSEPH R. SWEDISH
|
|
Joseph R. Swedish
President and Chief Executive Officer
|
|
Dated:
February 24, 2015
Pursuant to the requirements of the Securities Exchange Act of 1934, this report has been signed below by the following persons on behalf of the registrant and in the capacities and on the dates indicated.
|
Signature
|
|
Title
|
Date
|
|
/s/ JOSEPH R. SWEDISH
|
|
President and Chief Executive Officer, Director (Principal Executive Officer)
|
February 24, 2015
|
|
Joseph R. Swedish
|
|||
|
/s/ WAYNE S. DEVEYDT
|
|
Executive Vice President and Chief Financial Officer (Principal Financial Officer)
|
February 24, 2015
|
|
Wayne S. DeVeydt
|
|||
|
/s/ JOHN E. GALLINA
|
|
Senior Vice President and Chief Accounting Officer (Principal Accounting Officer)
|
February 24, 2015
|
|
John E. Gallina
|
|||
|
/s/ GEORGE A. SCHAEFER, JR.
|
Chair of the Board
|
February 24, 2015
|
|
|
George A. Schaefer, Jr.
|
|||
|
/s/ R. KERRY CLARK
|
|
Director
|
February 24, 2015
|
|
R. Kerry Clark
|
|||
|
/s/ ROBERT L. DIXON, JR.
|
|
Director
|
February 24, 2015
|
|
Robert L. Dixon, Jr.
|
|||
|
/s/ LEWIS HAY III
|
|
Director
|
February 24, 2015
|
|
Lewis Hay III
|
|||
|
/s/ JULIE A. HILL
|
|
Director
|
February 24, 2015
|
|
Julie A. Hill
|
|||
|
/s/ RAMIRO G. PERU
|
|
Director
|
February 24, 2015
|
|
Ramiro G. Peru
|
|||
|
/s/ WILLIAM J. RYAN
|
|
Director
|
February 24, 2015
|
|
William J. Ryan
|
|||
|
/s/ JOHN H. SHORT
|
|
Director
|
February 24, 2015
|
|
John H. Short
|
|||
|
/s/ ELIZABETH E. TALLETT
|
|
Director
|
February 24, 2015
|
|
Elizabeth E. Tallett
|
|||
-
153
-
INDEX TO EXHIBITS
|
Exhibit
Number
|
Exhibit
|
|||
|
2.1
|
|
Stock and Interest Purchase Agreement dated April 9, 2009, by and between the Company and Express Scripts, Inc., incorporated by reference to Exhibit 2.1 of the Company’s Current Report on Form 8-K filed on April 13, 2009, SEC File No. 001-16751.
|
||
|
2.2
|
|
Agreement and Plan of Merger, dated as of July 9, 2012 by and among WellPoint, Inc. (now known as "Anthem, Inc."), WellPoint Merger Sub, Inc. and AMERIGROUP Corporation, incorporated by reference to Exhibit 2.1 to the Company’s Current Report on Form 8-K filed on July 10, 2012.
|
||
|
(a)
|
Amendment No. 1 to Agreement and Plan of Merger, dated as of October 2, 2012, by and among WellPoint, Inc. (now known as "Anthem, Inc."), WellPoint Merger Sub, Inc. and AMERIGROUP Corporation, incorporated by reference to Exhibit 2.1(a) to the Company’s Quarterly Report on Form 10-Q for the quarter ended September 30, 2012.
|
|||
|
3.1
|
|
Amended and Restated Articles of Incorporation of the Company, as amended effective December 2, 2014, incorporated by reference to Exhibit 3.1 to the Company’s Current Report on Form 8-K filed on December 2, 2014.
|
||
|
3.2
|
|
By-laws of the Company, as amended effective December 2, 2014, incorporated by reference to Exhibit 3.2 to the Company's Current Report on Form 8-K filed on December 2, 2014.
|
||
|
4.1
|
|
Amended and Restated Articles of Incorporation of the Company, as amended effective December 2, 2014 (included in Exhibit 3.1).
|
||
|
4.2
|
|
By-laws of the Company, as amended effective December 2, 2014 (Included in Exhibit 3.2).
|
||
|
4.3
|
|
Indenture, dated as of December 9, 2004, between the Company and The Bank of New York Trust Company, N.A., as trustee, incorporated by reference to Exhibit 4.1 to the Company’s Current Report on Form 8-K filed on December 15, 2004, SEC File No. 001-16751.
|
||
|
(a)
|
Form of the Company’s 5.950% Notes due 2034 (included in Exhibit 4.3).
|
|||
|
4.4
|
|
Indenture, dated as of January 10, 2006, between the Company and The Bank of New York Mellon Trust Company, N.A. (formerly known as The Bank of New York Trust Company, N.A.), as trustee, incorporated by reference to Exhibit 4.1 to the Company’s Current Report on Form 8-K filed on January 11, 2006, SEC File No. 001-16751.
|
||
|
(a)
|
Form of 5.85% Notes due 2036, incorporated by reference to Exhibit 4.4 to the Company’s Current Report on Form 8-K filed on January 11, 2006, SEC File No. 001-16751.
|
|||
|
(b)
|
Form of 5.875% Notes due 2017, incorporated by reference to Exhibit 4.2 to the Company’s Current Report on Form 8-K filed on June 8, 2007, SEC File No. 001-16751.
|
|||
|
(c)
|
Form of 6.375% Notes due 2037, incorporated by reference to Exhibit 4.3 to the Company’s Current Report on Form 8-K filed on June 8, 2007, SEC File No. 001-16751.
|
|||
|
(d)
|
Form of 7.000% Notes due 2019, incorporated by reference to Exhibit 4.3 to the Company’s Current Report on Form 8-K filed on February 5, 2009, SEC File No. 001-16751.
|
|||
|
(e)
|
Form of 4.350% Notes due 2020, incorporated by reference to Exhibit 4.2 to the Company’s Current Report on Form 8-K filed on August 12, 2010.
|
|||
|
(f)
|
Form of 5.800% Notes due 2040, incorporated by reference to Exhibit 4.3 to the Company’s Current Report on Form 8-K filed on August 12, 2010.
|
|||
|
(g)
|
Form of 2.375% Notes due 2017, incorporated by reference to Exhibit 4.2 to the Company’s Current Report on Form 8-K filed on August 15, 2011.
|
|||
|
(h)
|
Form of 3.700% Notes due 2021, incorporated by reference to Exhibit 4.3 to the Company’s Current Report on Form 8-K filed on August 15, 2011.
|
|||
-
154
-
|
Exhibit
Number
|
Exhibit
|
|||
|
(i)
|
Form of 3.125% Notes due 2022, incorporated by reference to Exhibit 4.2 to the Company’s Current Report on Form 8-K filed on May 7, 2012.
|
|||
|
(j)
|
Form of 4.625% Notes due 2042, incorporated by reference to Exhibit 4.3 to the Company’s Current Report on Form 8-K filed on May 7, 2012.
|
|||
|
(k)
|
Form of 1.250% Notes due 2015, incorporated by reference to Exhibit 4.2 to the Company’s Current Report on Form 8-K filed on September 10, 2012.
|
|||
|
(l)
|
Form of 1.875% Notes due 2018, incorporated by reference to Exhibit 4.3 to the Company’s Current Report on Form 8-K filed on September 10, 2012.
|
|||
|
(m)
|
Form of 3.300% Notes due 2023, incorporated by reference to Exhibit 4.4 to the Company’s Current Report on Form 8-K filed on September 10, 2012.
|
|||
|
(n)
|
Form of 4.650% Notes due 2043, incorporated by reference to Exhibit 4.5 to the Company’s Current Report on Form 8-K filed on September 10, 2012.
|
|||
|
(o)
|
Form of 2.300% Notes due 2018, incorporated by reference to Exhibit 4.2 to the Company’s Current Report on Form 8-K filed on July 31, 2013.
|
|||
|
(p)
|
Form of 5.100% Notes due 2044, incorporated by reference to Exhibit 4.3 to the Company’s Current Report on Form 8-K filed on July 31, 2013.
|
|||
|
(q)
|
Form of 2.250% Notes due 2019, incorporated by reference to Exhibit 4.2 to the Company’s Current Report on Form 8-K filed on August 12, 2014.
|
|||
|
(r)
|
Form of 3.500% Notes due 2024, incorporated by reference to Exhibit 4.3 to the Company’s Current Report on Form 8-K filed on August 12, 2014.
|
|||
|
(s)
|
Form of 4.650% Notes due 2044, incorporated by reference to Exhibit 4.4 to the Company’s Current Report on Form 8-K filed on August 12, 2014.
|
|||
|
(t)
|
Form of 4.850% Notes due 2054, incorporated by reference to Exhibit 4.5 to the Company’s Current Report on Form 8-K filed on August 12, 2014.
|
|||
|
4.5
|
|
|
Indenture dated as of October 9, 2012 between the Company and The Bank of New York Mellon Trust Company, N.A. as trustee, incorporated by reference to Exhibit 4.1 to the Company’s Current Report on Form 8-K filed on October 9, 2012.
|
|
|
(a)
|
Form of the 2.750% Senior Convertible Debentures due 2042 (included in Exhibit 4.5).
|
|||
|
4.6
|
|
|
Upon the request of the Securities and Exchange Commission, the Company will furnish copies of any other instruments defining the rights of holders of long-term debt of the Company or its subsidiaries.
|
|
|
10.1
|
|
*
|
Anthem 2001 Stock Incentive Plan, amended and restated as of January 1, 2003, incorporated by reference to Exhibit 10.1(iii) to the Company’s Quarterly Report on Form 10-Q for the quarter ended June 30, 2003, SEC File No. 001-16751.
|
|
|
(a)
|
Form of Stock Incentive Plan General Stock Option Grant Agreement as of March 1, 2006, incorporated by reference to Exhibit 10.1(b) to the Company’s Quarterly Report on Form 10-Q for the quarter ended March 31, 2006, SEC File No. 001-16751.
|
|||
|
10.2
|
|
*
|
Anthem Incentive Compensation Plan, as amended and restated effective December 2, 2014, incorporated by reference to Exhibit 10.2 to the Company’s Current Report on Form 8-K filed on December 2, 2014.
|
|
|
(a)
|
Form of Incentive Compensation Plan Nonqualified Stock Option Award Agreement under the 2006 Incentive Compensation Plan, incorporated by reference to Exhibit 10.2(j) to the Company’s Quarterly Report on Form 10-Q for the quarter ended March 31, 2007, SEC File No. 001-16751.
|
|||
|
(b)
|
Form of Incentive Compensation Plan Nonqualified Stock Option Award Agreement for 2008 under the 2006 Incentive Compensation Plan, incorporated by reference to Exhibit 10.2(k) to the Company’s Annual Report on Form 10-K for the year ended December 31, 2007, SEC File No. 001-16751.
|
|||
-
155
-
|
Exhibit
Number
|
Exhibit
|
|||
|
(c)
|
Form of Incentive Compensation Plan Nonqualified Stock Option Award Agreement for 2009 under the 2006 Incentive Compensation Plan, incorporated by reference to Exhibit 10.2(m) to the Company’s Annual Report on Form 10-K for the year ended December 31, 2008, SEC File No. 001-16751.
|
|||
|
(d)
|
Form of Incentive Compensation Plan Nonqualified Stock Option Award Agreement, incorporated by reference to Exhibit 10.2(o) to the Company’s Quarterly Report on Form 10-Q for the quarter ended March 31, 2010.
|
|||
|
(e)
|
Form of Incentive Compensation Plan Performance Share Award Agreement, Grant A for 2012, incorporated by reference to Exhibit 10.2(p) to the Company’s Quarterly Report on Form 10-Q for the quarter ended March 31, 2012.
|
|||
|
(f)
|
Form of Incentive Compensation Plan Performance Share Award Agreement, Grant B for 2012, incorporated by reference to Exhibit 10.2(q) to the Company’s Quarterly Report on Form 10-Q for the quarter ended March 31, 2012.
|
|||
|
(g)
|
Form of Incentive Compensation Plan Restricted Stock Unit Award Agreement, incorporated by reference to Exhibit 10.2(t) to the Company’s Current Report on Form 8-K filed on September 14, 2012.
|
|||
|
(h)
|
Form of Incentive Compensation Plan Nonqualified Stock Option Award Agreement for 2013, incorporated by reference to Exhibit 10.2(s) to the Company's Quarterly Report on Form 10-Q for the quarter ended March 31, 2013.
|
|||
|
(i)
|
Form of Incentive Compensation Plan Restricted Stock Unit Award Agreement for 2013, incorporated by reference to Exhibit 10.2(t) to the Company's Quarterly Report on Form 10-Q for the quarter ended March 31, 2013.
|
|||
|
(j)
|
Form of Incentive Compensation Plan Performance Share Award Agreement for 2013, incorporated by reference to Exhibit 10.2(u) to the Company's Quarterly Report on Form 10-Q for the quarter ended March 31, 2013.
|
|||
|
(k)
|
Form of Incentive Compensation Plan Nonqualified Stock Option Award Agreement for 2014, incorporated by reference to Exhibit 10.2(p) to the Company's Quarterly Report on Form 10-Q for the quarter ended March 31, 2014.
|
|||
|
(l)
|
Form of Incentive Compensation Plan Restricted Stock Unit Award Agreement for 2014, incorporated by reference to Exhibit 10.2(q) to the Company's Quarterly Report on Form 10-Q for the quarter ended March 31, 2014.
|
|||
|
(m)
|
Form of Incentive Compensation Plan Performance Share Award Agreement for 2014, incorporated by reference to Exhibit 10.2(r) to the Company's Quarterly Report on Form 10-Q for the quarter ended March 31, 2014.
|
|||
|
10.3
|
|
*
|
Anthem, Inc. Comprehensive Nonqualified Deferred Compensation Plan, as amended and restated effective December 2, 2014.
|
|
|
10.4
|
|
*
|
Anthem, Inc. Executive Agreement Plan, amended and restated effective December 2, 2014.
|
|
|
10.5
|
|
*
|
WellPoint, Inc. Executive Salary Continuation Plan effective January 1, 2006, incorporated by reference to Exhibit 10.59 to the Company’s Quarterly Report on Form 10-Q for the quarter ended June 30, 2006, SEC File No. 001-016751.
|
|
|
10.6
|
|
*
|
WellPoint Directed Executive Compensation Plan amended effective January 1, 2014, incorporated by reference to Exhibit 10.6 to the Company’s Quarterly Report on Form 10-Q for the quarter ended September 30, 2013.
|
|
|
10.7
|
|
*
|
WellPoint, Inc. Board of Directors Compensation Program, as amended effective May 14, 2014, incorporated by reference to Exhibit 10.7 to the Company’s Quarterly Report on Form 10-Q for the quarter ended June 30, 2014.
|
|
|
10.8
|
|
*
|
Anthem Board of Directors’ Deferred Compensation Plan, as amended and restated effective December 2, 2014.
|
|
-
156
-
|
Exhibit
Number
|
Exhibit
|
|||
|
10.9
|
|
*
|
Amerigroup Corporation 2009 Equity Incentive Plan effective May 7, 2009, incorporated by reference to Exhibit 99.1 to the Company’s Registration Statement on Form S-8 filed on December 26, 2012 (Registration No. 333-185675).
|
|
|
10.10
|
|
*
|
Employment Agreement between Anthem Insurance Companies, Inc. and Samuel R. Nussbaum, M.D., dated as of January 2, 2001 (with respect to Section 5(b) only), incorporated by reference to Exhibit 10.5 to the Company’s Registration Statement on Form S-1 (Registration No. 333-67714).
|
|
|
(a)
|
Amendment dated September 30, 2011 to Employment Agreement between Anthem Insurance Companies, Inc. and Samuel R. Nussbaum, M.D., dated as of January 2, 2001, incorporated by reference to Exhibit 10.12 to the Company’s Quarterly Report on Form 10-Q for the quarter ended September 30, 2011.
|
|||
|
10.11
|
|
*
|
(a)
|
Form of Employment Agreement between the Company and each of the following: Ken R. Goulet and Samuel R. Nussbaum, M.D., incorporated by reference to Exhibit 10.43 to the Company’s Annual Report on Form 10-K for the year ended December 31, 2005, SEC File No. 001-16751.
|
|
(b)
|
Form of Employment Agreement between the Company and Wayne S. DeVeydt, incorporated by reference to Exhibit A to Exhibit 10.7 to the Company’s Current Report on Form 8-K filed on November 2, 2006, SEC File No. 001-16751.
|
|||
|
(c)
|
Form of Employment Agreement between the Company and each of the following: Jose D. Tomas, Gloria McCarthy, Peter D. Haytaian, Martin Silverstein, M.D. and Thomas C. Zielinski incorporated by reference to Exhibit A to Exhibit 10.41 to the Company’s Quarterly Report on Form 10-Q for the quarter ended September 30, 2007, SEC File No. 001-16751.
|
|||
|
(d)
|
Form of Employment Agreement between the Company and Joseph R. Swedish, incorporated by reference to Exhibit A to Exhibit 10.1 to the Company’s Current Report on Form 8-K filed on February 12, 2013.
|
|||
|
10.12
|
|
*
|
Employment Agreement between the Company and Richard C. Zoretic dated as of July 9, 2012 and effective December 24, 2012, incorporated by reference to Exhibit 10.16 to the Company’s Annual Report on Form 10-K for the year ended December 31, 2012, filed on February 22, 2013.
|
|
|
(a)
|
First Amendment to Employment Agreement between the Company and Richard C. Zoretic dated as of October 26, 2012 and effective December 24, 2012, incorporated by reference to Exhibit 10.16(a) to the Company’s Annual Report on Form 10-K for the year ended December 31, 2012, filed on February 22, 2013.
|
|||
|
(b)
|
Second Amendment to Employment Agreement between the Company and Richard C. Zoretic dated as of April 23, 2013, incorporated by reference to Exhibit 10.16(b) to the Company's Current Report on Form 8-K filed on April 23, 2013.
|
|||
|
10.13
|
|
Blue Cross License Agreement by and between Blue Cross Blue Shield Association and the Company, including revisions, if any, adopted by the Member Plans through November 21, 2014.
|
||
|
10.14
|
|
Blue Shield License Agreement by and between Blue Cross Blue Shield Association and the Company, including revisions, if any, adopted by the Member Plans through November 21, 2014.
|
||
|
10.15
|
|
Undertakings to California Department of Managed Health Care, dated October 15, 2012, delivered by Blue Cross of California, incorporated by reference to Exhibit 10.19 to the Company's Annual Report on Form 10-K for the year ended December 31, 2012.
|
||
|
10.16
|
|
*
|
Offer Letter, by and between WellPoint, Inc. and Joseph R. Swedish, dated as of February 6, 2013, incorporated by reference to Exhibit 10.1 to the Company's Current Report on Form 8-K filed on February 12, 2013.
|
|
|
21
|
|
Subsidiaries of the Company.
|
||
|
23
|
|
Consent of Independent Registered Public Accounting Firm.
|
||
|
31.1
|
|
Certification of Chief Executive Officer pursuant to Rule 13a-14(a) and Rule 15d-14(a) of the Exchange Act Rules, as adopted pursuant to Section 302 of the Sarbanes-Oxley Act of 2002.
|
||
-
157
-
|
Exhibit
Number
|
Exhibit
|
|||
|
31.2
|
|
Certification of Chief Financial Officer pursuant to Rule 13a-14(a) and Rule 15d-14(a) of the Exchange Act Rules, as adopted pursuant to Section 302 of the Sarbanes-Oxley Act of 2002.
|
||
|
32.1
|
|
Certification of Chief Executive Officer pursuant to 18 U.S.C. Section 1350, as adopted pursuant to Section 906 of the Sarbanes-Oxley Act of 2002.
|
||
|
32.2
|
|
Certification of Chief Financial Officer pursuant to 18 U.S.C. Section 1350, as adopted pursuant to Section 906 of the Sarbanes-Oxley Act of 2002.
|
||
|
101
|
|
The following materials from Anthem, Inc.’s Annual Report on Form 10-K for the year ended December 31, 2014, formatted in XBRL (Extensible Business Reporting Language): (i) the Consolidated Balance Sheets; (ii) the Consolidated Statements of Income; (iii) the Consolidated Statements of Comprehensive Income; (iv) the Consolidated Statements of Cash Flows; (v) the Consolidated Statements of Shareholders’ Equity; (vi) the Notes to Consolidated Financial Statements and (vii) Financial Statement Schedule II.
|
||
|
*
|
Indicates management contracts or compensatory plans or arrangements.
|
|||
-
158
-
TABLE OF CONTENTS
Part IItem 1. BusinessItem 1A. Risk FactorsItem 1B. Unresolved Sec Staff CommentsItem 2. PropertiesItem 3. Legal ProceedingsItem 4. Mine Safety DisclosuresPart IIItem 5. Market For Registrant S Common Equity, Related Stockholder Matters and Issuer Purchases Of Equity SecuritiesPart OfItem 6. Selected Financial DataItem 7. Management S Discussion and Analysis Of Financial Condition and Results Of OperationsItem 7A. Quantitative and Qualitative Disclosures About Market RiskItem 8. Financial Statements and Supplementary DataItem 9. Changes in and Disagreements with Accountants on Accounting and Financial DisclosureItem 9A. Controls and ProceduresItem 9B. Other InformationPart IIIItem 10. Directors, Executive Officers and Corporate GovernanceItem 11. Executive CompensationItem 12. Security Ownership Of Certain Beneficial Owners and Management and Related Stockholder MattersItem 13. Certain Relationships and Related Transactions, and Director IndependenceItem 14. Principal Accountant Fees and ServicesPart IVItem 15. Exhibits and Financial Statement Schedules